Attached files
| file | filename |
|---|---|
| EX-32.1 - EXHIBIT 32.1 - MARINE PRODUCTS CORP | tv486681_ex32-1.htm |
| EX-31.2 - EXHIBIT 31.2 - MARINE PRODUCTS CORP | tv486681_ex31-2.htm |
| EX-31.1 - EXHIBIT 31.1 - MARINE PRODUCTS CORP | tv486681_ex31-1.htm |
| EX-24 - EXHIBIT 24 - MARINE PRODUCTS CORP | tv486681_ex24.htm |
| EX-23 - EXHIBIT 23 - MARINE PRODUCTS CORP | tv486681_ex23.htm |
| EX-10.16 - EXHIBIT 10.16 - MARINE PRODUCTS CORP | tv486681_ex10-16.htm |
UNITED STATES
SECURITIES AND EXCHANGE COMMISSION
Washington, D.C. 20549
FORM 10-K
| (Mark One) | |
| x | Annual report pursuant to Section 13 or 15(d) of the Securities Exchange Act of 1934 |
| ¨ | Transition report pursuant to Section 13 or 15(d) of the Securities Exchange Act of 1934 |
FOR THE FISCAL YEAR ENDED DECEMBER 31,
2017
Commission File No. 1-16263
MARINE PRODUCTS CORPORATION
| Delaware | 58-2572419 |
| (State of Incorporation) | (I.R.S. Employer Identification No.) |
2801 BUFORD HIGHWAY NE, SUITE 520
ATLANTA, GEORGIA 30329
(404) 321-7910
Securities registered pursuant to Section 12(b) of the Act:
| Title of each class | Name of each exchange on which registered |
| COMMON STOCK, $0.10 PAR VALUE | NEW YORK STOCK EXCHANGE |
Securities registered pursuant to section 12(g) of the Act: NONE
Indicate by check mark if the registrant is a well-known seasoned issuer, as defined in Rule 405 of the Securities Act. ¨ Yes x No
Indicate by check mark if the registrant is not required to file reports pursuant to Section 13 or Section 15(d) of the Act. ¨ Yes x No
Indicate by check mark whether the registrant (1) has filed all reports required to be filed by Section 13 or 15(d) of the Securities Exchange Act of 1934 during the preceding 12 months (or for such shorter period that the registrant was required to file such reports), and (2) has been subject to such filing requirements for the past 90 days. x Yes ¨ No
Indicate by check mark whether the registrant has submitted electronically and posted on its corporate Web site, if any, every Interactive Data File required to be submitted and posted pursuant to Rule 405 of Regulation S-T (§232.405 of this chapter) during the preceding 12 months (or for such shorter period that the registrant was required to submit and post such files). x Yes ¨ No
Indicate by check mark if disclosure of delinquent filers pursuant to Item 405 of Regulation S-K is not contained herein, and will not be contained, to the best of registrant’s knowledge, in definitive proxy or information statements incorporated by reference in Part III of this Form 10-K or any amendment to this Form 10-K. x
Indicate by check mark whether the registrant is a large accelerated filer, an accelerated filer, a non-accelerated filer, or a smaller reporting company. See definitions of “large accelerated filer,” “accelerated filer,” and “smaller reporting company” in Rule 12b-2 of the Exchange Act. (Check one):
Large accelerated filer ¨ Accelerated filer x Non-accelerated filer ¨ Smaller reporting company ¨
Emerging growth company ¨
If an emerging growth company, indicate by check mark if the registrant has elected not to use the extended transition period for complying with any new or revised financial accounting standards provided pursuant to section 13(a) of the Exchange Act.¨
Indicate by check mark whether the registrant is a shell company (as defined in Rule 12b-2 of the Exchange Act). Yes o No x
The aggregate market value of Marine Products Corporation common stock held by non-affiliates on June 30, 2017, the last business day of the registrant’s most recent second fiscal quarter, was $125,805,415 based on the closing price on the New York Stock Exchange on June 30, 2017 of $15.61 per share.
Marine Products Corporation had 34,631,246 shares of common stock outstanding as of February 16, 2018.
Documents Incorporated by Reference
Portions of the Proxy Statement for the 2018 Annual Meeting of Stockholders of Marine Products Corporation are incorporated by reference into Part III, Items 10 through 14 of this report.
PART I
References in this document to “we,” “our,” “us,” “Marine Products,” or “the Company” mean Marine Products Corporation (“MPC”) and its subsidiaries, Chaparral Boats, Inc. (“Chaparral”) and Robalo Acquisition Company LLC (“Robalo”), collectively or individually, except where the context indicates otherwise.
Forward-Looking Statements
Certain statements made in this report that are not historical facts are “forward-looking statements” under the Private Securities Litigation Reform Act of 1995. Such forward-looking statements may include, without limitation, the Company’s belief that there are several alternative suppliers of fiberglass that could provide adequate quality and quantities of this raw material at acceptable prices; the Company’s plans to continue purchasing sterndrive engines through the ABA; the Company’s belief that the level of dealer inventories of its new boat models are appropriate; the Company’s belief that it is well positioned to take advantage of industry conditions; the Company’s belief that its newer boat models will expand its customer base and leverage its strong dealer network and reputation for quality and styling; the Company’s belief that its corporate infrastructure, marketing and sales capabilities, financial strength and nationwide presence enables it to compete effectively against its competitors; the Company’s belief that it will not incur any material capital expenditures to comply with existing environmental or safety regulations; the Company’s expectation that higher costs of materials could negatively affect its profit margins; the Company’s belief that the ultimate outcome of any litigation will not have a material effect on its results of operations; the Company’s plan to continue to pay cash dividends subject to the earnings and financial condition of the Company and other relevant factors; the Company’s belief that recreational boating retail demand in many segments of the industry is improving; our belief that a potential impediment to improving boat sales, is the increase in market interest rates; the Company’s belief that retail boat sales will continue to improve due to improving consumer confidence and a growing U.S. economy; the Company’s belief that the recreational boating industry promotional program has incrementally benefited the industry and Marine Products; the Company’s plans to continue to emphasize the value-priced Chaparral and Robalo models as well as the Surf Series, and new larger SSX models; the Company’s belief that the Chaparral H2O outboard boats will expand our customer base and leverage our strong dealer network and reputation for quality and styling; the Company’s plans to continue to develop and additional new products for subsequent model years; the Company’s belief that the annual effective tax rate will be in the low 20 percent range; the Company’s belief that it will generate continued positive financial results; the Company’s belief that its liquidity, capitalization and cash expected to be generated from operations, will provide sufficient capital to meet the Company’s requirements for at least the next twelve months; the Company’s expectations about capital expenditures during 2018; the Company’s expectation about contributions to its pension plan in 2018; the Company’s estimate of the amount and timing of future contractual obligations; the Company’s judgments and estimates with respect to its critical accounting policies; the Company’s expectation about the impact of new accounting pronouncements on the Company’s consolidated financial statements; and the Company’s expectation regarding market risk of its investment portfolio.
The words “may,” “should,” “will,” “expect,” “believe,” “anticipate,” “intend,” “plan,” “seek,” “project,” “estimate,” and similar expressions used in this document that do not relate to historical facts are intended to identify forward-looking statements. Such statements are based on certain assumptions and analyses made by our management in light of its experience and its perception of historical trends, current conditions, expected future developments and other factors it believes to be appropriate. We caution you that such statements are only predictions and not guarantees of future performance and that actual results, developments and business decisions may differ from those envisioned by the forward-looking statements. Risk factors that could cause such future events not to occur as expected include the following: economic conditions, lack of credit availability and possible decreases in the level of consumer confidence impacting discretionary spending, business interruptions due to adverse weather conditions, increased interest rates, unanticipated changes in consumer demand and preferences, deterioration in the quality of Marine Products’ network of independent boat dealers or availability of financing of their inventory, our ability to insulate financial results against increasing commodity prices, the impact of rising gasoline prices and a weak housing market on consumer demand for our products and competition from other boat manufacturers and dealers. We caution you that such statements are only predictions and not guarantees of future performance and that actual results, developments and business decisions may differ from those envisioned by the forward-looking statements. See “Risk Factors” on page 11 for a discussion of factors that may cause actual results to differ from our projections.
| 2 |
Item 1. Business
Marine Products manufactures fiberglass motorized boats distributed and marketed through its independent dealer network. Marine Products’ product offerings include Chaparral sterndrive, outboard and jet pleasure boats and Robalo outboard sport fishing boats.
Organization and Overview
Marine Products is a Delaware corporation incorporated on August 31, 2000, in connection with a spin-off from RPC, Inc. (NYSE: RES) (“RPC”). Effective February 28, 2001, RPC accomplished the spin-off by contributing 100 percent of the issued and outstanding stock of Chaparral to Marine Products, a newly formed wholly owned subsidiary of RPC, and then distributing the common stock of Marine Products to RPC stockholders.
Marine Products designs, manufactures and sells recreational fiberglass powerboats in the sportboat, deckboat, cruiser, jet boat and sport fishing markets. The Company sells its products to a network of 161 domestic and 92 international independent authorized dealers. Marine Products’ mission is to enhance its customers’ boating experience by providing them with high quality, innovative powerboats. The Company intends to remain a leading manufacturer of recreational powerboats for sale to a broad range of consumers worldwide.
The Company manufactures Chaparral sterndrive pleasure boats including H2O Sport and Fish & Ski boats, SSi and SSX Sportboats, Sunesta Sportdecks, and Signature Cruisers, as well as SunCoast Sportdeck outboards, Vortex jet boats and the Surf Series, a line of Chaparral models first introduced for the 2017 model year. The most recent available industry statistics [source: Statistical Surveys, Inc. report dated September 30, 2017] indicate that Chaparral is the largest manufacturer of sterndrive boats in lengths from 18 to 33 feet in the United States.
Chaparral was founded in 1965 in Ft. Lauderdale, Florida. Chaparral’s first boat was a 15-foot tri-hull design with a retail price of less than $1,000. Over time Chaparral grew by offering exceptional quality and consumer value. In 1976, Chaparral moved to Nashville, Georgia, where a manufacturing facility of a former boat manufacturing company was available for purchase. This provided Chaparral an opportunity to obtain additional manufacturing space and access to a trained workforce. With 53 years of boatbuilding experience, Chaparral continues to expand the range of its offerings through insightful product design and quality manufacturing processes in order to reach an increasingly discerning recreational boating market.
The Company also manufactures Robalo outboard fishing boats. Robalo was founded in 1969 and its first boat was a 19-foot center console salt-water fishing boat, among the first of this type of boat to have an “unsinkable” hull. The Company believes that Robalo is the fourth largest manufacturer of outboard boats in lengths from 16 to 30 feet in the United States.
| 3 |
Products
Marine Products distinguishes itself by offering a wide range of products to the family recreational and cruiser markets through its Chaparral brand and to the sport fishing market through its Robalo brand.
The following table provides a brief description of our product lines and their particular market focus:
| Product Line |
Number of Models |
Overall Length |
Approximate Retail Price Range |
Description | ||||
| Chaparral – Vortex Jet Boat | 8 | 20′-24′ | $35,000 - $81,000 | Fiberglass pleasure boats marketed as jet-powered boats with traditional bowrider styling. Features include enhanced maneuverability at low speeds and high seating capacity. National fixed retail price including a trailer. Also marketed as a high-performance wakeboard boat with optional surf package. Marketed to younger families and wakeboard enthusiasts. | ||||
| Chaparral – H2O Sport Series |
6 | 19′-21′ | $30,000 - $62,000 | Fiberglass multipurpose sterndrive and outboard runabouts. Sport and Ski & Fish series offer an affordable, entry-level product with a national fixed retail price including a standard engine and single axle trailer. A Surf Series model is available, and all are marketed to both experienced and value-conscious buyers. | ||||
| Chaparral – SunCoast Outboard Deck Boat | 4 | 19′-25′ | $30,000 - $102,000 | Fiberglass multipurpose bowrider with outboard power and an open bow providing high seating capacity. Large deckboat-style boat, suitable for large inland bodies of water or coastal saltwater use. Marketed with a national fixed retail price to boaters carrying large numbers of passengers. | ||||
| Chaparral - SSi Wide Tech™ |
1 | 24′ | $76,000 - $136,000 | Fiberglass sterndrive pleasure boat featuring Surf Series design. Marketed as high value runabout for family groups desiring a larger sportboat. Wide Tech™ features handling of a runabout, style of a sportboat and open concept layout. | ||||
| Chaparral - SSX Sport Boat |
7 | 22′-33′ | $63,000 - $400,000 | Fiberglass sterndrive bowrider that combines features of sportboats and deckboats and various models with Surf Series options. Marketed as high value runabouts for family groups. | ||||
| Chaparral – Sunesta Sport Deck |
3 | 22′-26′ | $68,000 - $172,000 | Fiberglass sterndrive multipurpose deckboat-style bowriders with high-performance hull designs and flexible seating configurations. Options include updated graphics, swimming and galley features, and Surf Series. | ||||
| Chaparral - Signature Cruiser |
3 | 27′-33′ | $115,000 - $400,000 | Fiberglass, accommodation-focused sterndrive cruisers. Marketed to experienced boat owners through trade magazines and boat show exhibitions. | ||||
| Robalo – Center Console | 9 | 16′-30′ | $20,000 - $212,000 | Fiberglass outboard sport fishing boats for large freshwater lakes or saltwater use. Marketed to experienced fishermen and families desiring extra seating. Smaller models to include a trailer marketed with a national fixed retail price. | ||||
| Robalo – Cayman Bay Boat | 4 | 20′-24′ | $31,000 - $116,000 | Fiberglass outboard sport fishing boats for large freshwater lakes or coastal saltwater use. Marketed to experienced fishermen. All models marketed with a trailer at a national fixed retail price. | ||||
| Robalo – Dual Console | 4 | 20′-31′ | $38,000 - $250,000 | Multi-purpose fiberglass outboard-powered sport fishing boats for large freshwater lakes or saltwater use. Marketed to experienced fishermen and families looking for both fishing and cruising features. | ||||
|
Robalo – Walkaround
|
1 | 30′ | $189,000 - $242,000 | Multi-purpose fiberglass outboard sport fishing boats for large freshwater lakes or saltwater use. Marketed to experienced fishermen and families who want fishing features as well as overnight accommodations. |
| 4 |
Manufacturing
Marine Products’ manufacturing facilities are located in Nashville, Georgia. Marine Products utilizes five different plants to, among other things, manufacture interiors, design new models, create fiberglass hulls and decks, and assemble various end products. Quality control is conducted throughout the manufacturing process. When fully assembled and inspected, the boats are loaded onto either Company-owned trailers or third-party marine transport trailers for delivery to dealers. The manufacturing process begins with the design of a product to meet dealer and customer needs. Plugs are constructed in the research and development phase from designs. Plugs are used to create a mold from which prototype boats can be built. Adjustments are made to the plug design until acceptable parameters are met. The final plug is used to create the necessary number of production molds. Molds are used to produce the fiberglass hulls and decks. Fiberglass components are made by applying the outside finish or gel coat to the mold, then numerous layers of fiberglass and resin are applied during the lamination process over the gel coat. After curing, the hull and deck are removed from the molds and are trimmed and prepared for final assembly, which includes the installation of electrical and plumbing systems, engines, upholstery, accessories and graphics.
Product Warranty
For our Chaparral and Robalo products, Marine Products provides a lifetime limited structural hull warranty, a five-year limited structural deck warranty, and a transferable one-year limited warranty to the original owner. Warranties for additional items are provided for periods of one to five years and are not transferrable. Additionally, as it relates to the first subsequent owner, a five-year transferrable hull warranty and the remainder of the original one-year limited warranty on certain components are available. The five-year transferable hull warranty terminates five years after the date of the original retail purchase. Claim costs related to components are generally absorbed by the original component manufacturer.
The manufacturers of the engines, generators, and navigation electronics included on our boats provide and administer their own warranties for various lengths of time.
Suppliers
Marine Products’ three most significant cost components used in manufacturing its boats, are engines, resins and fiberglass. For each of these, there is currently an adequate supply available in the market. Marine Products has not experienced any significant shortages in any of these products. Temporary shortages, when they do occur, usually involve manufacturers of these products adjusting model mixes, introducing new product lines or limiting production in response to an industry-wide reduction in boat demand. Marine Products obtains most of its fiberglass from a leading supplier. Marine Products believes that there are several alternative suppliers if this supplier fails to provide adequate quality or quantities at acceptable prices.
Marine Products does not manufacture the engines installed in its boats. Engines are generally specified by the dealers at the time of ordering, usually on the basis of anticipated customer preferences or actual customer orders. Sterndrive engines are purchased through the American Boatbuilders Association (“ABA”), which has entered into engine supply arrangements with Mercury Marine and Volvo Penta, the two currently existing suppliers of sterndrive engines. These arrangements contain incentives and discount provisions, which may reduce the cost of the engines purchased, if specified purchase volumes are met during specified periods of time. Although no minimum purchases are required, Marine Products expects to continue purchasing sterndrive engines through the ABA on a voluntary basis in order to receive volume-based purchase discounts. Marine Products does not have a long-term supply contract with the ABA. Marine Products has an outboard engine supply contract with Yamaha and a jet engine supply contract with BRP US Inc. These engine supply arrangements were not negotiated through the ABA. In the event of a sudden and extended interruption in the supply of engines from any of these suppliers, our sales and profitability could be negatively impacted. See “Risk Factors” below.
Marine Products uses other raw materials in its manufacturing processes. Among these are resins made from hydrocarbon feedstocks, copper and steel. The costs of these commodities have fluctuated significantly over the past several years in response to changes in global economic conditions. During the fourth quarter of 2017 and the first quarter of 2018 the costs of several of these materials have begun to increase. See “Inflation” below.
| 5 |
Sales and Distribution
Domestic sales are generated through our independent dealer network of approximately 48 Chaparral dealers, 36 Robalo dealers and 77 dealers that sell both brands located in markets throughout the United States. Marine Products also has 92 international dealers. During 2017 the financial strength of our dealer network continued to improve primarily due to better retail sales volumes and increased availability of floorplan financing. Most of our dealers also inventory and sell boat brands manufactured by other companies, including some that compete directly with our brands. The territories served by any dealer are not exclusive to the dealer; however, Marine Products uses discretion in establishing relationships with new dealers in an effort to protect the mutual interests of the existing dealers and the Company. Marine Products’ six independent field sales representatives call upon existing dealers and develop new dealer relationships. The field sales representatives are directed by a National Sales Coordinator, who is responsible for developing the dealer distribution network for the Company’s products. The marketing of boats to retail customers is primarily the responsibility of the dealer. Marine Products supports dealer marketing efforts by supplementing local advertising, sales and marketing follow up in boating magazines, and participation in selected regional, national, and international boat show exhibitions. No single dealer accounted for more than 10 percent of net sales during 2017, 2016 or 2015.
Marine Products continues to seek new dealers in many areas throughout the U.S., Canada, Europe, South America, Asia, Russia and the Middle East. In general, Marine Products requires full payment prior to shipping a boat overseas. Consequently, there is no credit risk associated with these international sales or risk related to foreign currency fluctuation. The Company’s international sales are affected by trends in consumer discretionary spending and the value of the U.S. dollar on global currency markets, among other things. The volume of sales to international dealers as a percentage of total net sales decreased in 2017 compared to 2016 primarily due to the strength of the U.S. dollar. International net sales as a percentage of total net sales were 6.3 percent in 2017, 8.8 percent in 2016, and 10.8 percent in 2015.
Marine Products’ sales orders are indicators of strong interest from its dealers. Historically, dealers have in most cases taken delivery of all their orders. The Company attempts to ensure that its dealers do not accept an excessive amount of inventory by monitoring their inventory levels. Knowledge of inventory levels at the individual dealers facilitates production scheduling with shorter lead times in order to maintain flexibility in the event that adjustments need to be made to dealer shipments. In the past, Marine Products has been able to resell any boat for which an order has been cancelled.
Approximately 74 percent of Marine Products’ domestic shipments are made pursuant to “floor plan financing” programs in which Marine Products’ subsidiaries participate on behalf of their dealers with major third-party financing institutions. The remaining dealers finance their boat inventory with smaller regional financial institutions in local markets or pay cash. Under these established arrangements with qualified lending institutions, a dealer establishes a line of credit with one or more of these lenders for the purchase of boat inventory for sales to retail customers in their showroom or during boat show exhibitions. In general, when a dealer purchases and takes delivery of a boat pursuant to a floor plan financing arrangement, it draws against its line of credit and the lender pays the invoice cost of the boat directly to Marine Products generally within ten business days. When the dealer in turn sells the boat to a retail customer, the dealer repays the lender, thereby restoring its available credit line. Each dealer’s floor plan credit facilities are secured by the dealer’s inventory, letters of credit, and perhaps other personal and real property. Until recently, most dealers maintained financing arrangements with more than one lender, although that is less common at the present time, given that there are fewer lenders. In connection with a dealer’s floor plan financing arrangements with a qualified lending institution, Marine Products or its subsidiaries have agreed to repurchase inventory which the lender repossesses from a dealer and returns to Marine Products in a “new and unused” condition subject to normal wear and tear, as defined. The contractual agreements that Marine Products or its subsidiaries have with these qualified lenders contain the Company’s assumption of specified percentages of the debt obligation on repossessed boats, up to certain contractually determined dollar limits negotiated with the lender.
The Company currently has an agreement with one of the floor plan lenders whereby the contractual repurchase amount is limited to a maximum of 16 percent of the average net receivables financed by the floor plan lender for dealers during the prior 12 month period, which was $12.2 million as of December 31, 2017. The Company has contractual repurchase agreements with additional lenders with an aggregate maximum repurchase obligation of approximately $6.6 million, with various expiration and cancellation terms of less than one year. Accordingly, the aggregate repurchase obligation with all financing institutions was approximately $18.8 million as of December 31, 2017. In the event that a dealer defaults on a credit line, the qualified lender may then invoke the manufacturers’ repurchase obligation with respect to that dealer. In that event, all repurchase agreements of all manufacturers supplying a defaulting dealer are generally invoked regardless of the boat or boats with respect to which the dealer has defaulted. Unlike Marine Products’ obligation to repurchase boats repossessed by qualified lenders, Marine Products is under no obligation to repurchase boats directly from dealers. Marine Products does not sponsor financing programs to the retail consumer; any consumer financing promotions for a prospective boat purchaser would be the responsibility of the dealer.
| 6 |
Marine Products’ dealer sales incentive programs are generally designed to promote early replenishment of the stock in dealer inventories depleted throughout the prime spring and summer selling seasons, and to promote the sales of older models in dealer inventory and particular models during specified periods. These programs help to stabilize Marine Products’ manufacturing between the peak and off-peak periods, and promote sales of certain models. For the 2018 model year (which commenced July 1, 2017), Marine Products offered its dealers several sales incentive programs based on dollar volumes and timing of dealer purchases. Program incentives offered include sales discounts, retail sales incentives and payment of floor plan financing interest charged by qualified floor plan lenders to dealers generally through April 30, 2018. After the interest payment programs end, interest costs revert to the dealer at rates set by the lender. A dealer makes periodic curtailment payments (principal payments) on outstanding obligations against its dealer inventory as set forth in the floor plan financing agreements between the dealer and its particular lender.
We believe that dealer inventories of our boat models as of December 31, 2017 are appropriate relative to the current level of retail customer demand; approximately 57 percent of dealer inventories were current model year units at December 31, 2017 compared to 60 percent at December 31, 2016. The sales order backlog as of December 31, 2017 was approximately 1,722 boats with estimated net sales of approximately $72.9 million. This represents an approximate 14.4 week backlog based on recent production levels. As of December 31, 2016, the sales order backlog was approximately 1,585 boats with estimated net sales of $60.7 million, representing an approximate 13.1 week backlog. The Company will continue to monitor the number of boats in dealer inventories and adjust its production levels as it deems necessary to manage dealer inventory levels. The Company typically does not manufacture a significant number of boats for its own inventory. The Company occasionally manufactures boats for its own inventory because the number of boats required for immediate shipment is not always the most efficient number of boats to produce in a given production schedule.
Research and Development
Essentially the same technologies and processes are used to produce fiberglass boats by all boat manufacturers. The most common method to build fiberglass boats is with open-face molding. This is usually a labor-intensive, manual process whereby employees hand spray and apply fiberglass and resin in layers on open molds to create boat hulls, decks and other smaller fiberglass components. A single open-face mold is typically capable of producing approximately three hulls per week.
Marine Products has been a leading innovator in the recreational boating industry. One of the Company’s most innovative designs is the full-length “Extended V-Plane” running surface on its Chaparral boat models. Typically, sterndrive boats have a several foot gap on the bottom rear of the hull where the engine enters the water. With the Extended V-Plane, the running surface extends the full length to the rear of the boat. The benefit of this innovation is more deck space, better planing performance and a more comfortable ride. Although the basic hull designs are similar, the Company has historically introduced a variety of new models each year and periodically replaces, updates or discontinues existing models.
Another hull design is the Hydro LiftTM used on the Robalo boat models. This variable dead rise hull design provides a smooth ride in rough water conditions. It increases the maximum speed obtainable by a given engine horsepower and weight of the boat. Robalo’s current models utilize the Hydro LiftTM design and we plan to continue to provide this design on Robalo models.
A bow design known as the Wide TechTM was first used on the Chaparral Sunesta Wide TechTM and Xtreme models for the 2008 model year, and is currently being used on Chaparral’s SSi Wide TechTM Sportboats, Sunesta Sportdecks, and two Signature Cruisers. The Wide TechTM bow design allows the models to have the Extended V-Plane hull, with the features and benefits that this hull design offers. In addition, the Wide TechTM bow design provides a larger seating area, as well as additional storage space, in the front of the boat. Furthermore, it allows the models to have a non-skid walkway on the bow, which makes entering and leaving the boat easier than in other boat models. This bow design may be incorporated on other Chaparral boat models in subsequent model years.
In support of its new product development efforts, Marine Products incurred research and development costs of $960 thousand in 2017, $858 thousand in 2016, and $663 thousand in 2015.
Industry Overview
The recreational marine market in the United States is a mature market, with 2016 (latest data available to us) retail expenditures of approximately $36 billion spent on new and used boats, motors and engines, trailers, accessories and other associated costs as estimated by the National Marine Manufacturers Association (“NMMA”). Pleasure boats compete with all other leisure activities for consumers’ limited free time.
There are currently approximately 16 million boats owned in the United States, including outboard, inboard, sterndrive, jet drive, sailboats and personal watercraft. Marine Products competes in the sterndrive boating category with five lines of Chaparral boats, in the jet drive category with its Chaparral Vortex jet boats and in the outboard category with its Robalo sport fishing boats, Chaparral SunCoast deck boats and a new Chaparral H2O outboard model. Approximately 39 percent of the Company’s unit sales in 2017 were sterndrive boats compared to 42 percent in 2016.
| 7 |
Industry sales of new sterndrive boats in the United States during 2017 totaled 10,847 (source: Info-Link Technologies, Inc.) and accounted for approximately 15 percent of the total new fiberglass powerboats sold between 18 and 33 feet in hull length. Sales of sterndrive boats had an estimated total retail value of $869 million, or an average retail price per boat of approximately $80,000. Management believes that the five largest states for boat sales at the present time are Florida, Minnesota, Michigan, California and Wisconsin. Marine Products has dealers in each of these states.
The U.S. domestic recreational boating industry includes sales in the segments of new and used boats, motors and engines, trailers, and other boat accessories. The new fiberglass boat market segment with hull lengths of 18 to 33 feet, the primary market segment in which Marine Products competes, represented $4.5 billion in retail sales during 2017. The table below reflects the estimated annual sales within this segment by category for 2017 and 2016 (source: Info-Link Technologies, Inc.):
| 2017 | 2016 | |||||||||||||||
| Boats | Sales ($ B) | Boats | Sales ($ B) | |||||||||||||
| Sterndrive Boats | 10,847 | $ | 0.9 | 11,648 | $ | 0.9 | ||||||||||
| Outboard Boats | 49,041 | 2.5 | 45,543 | 2.1 | ||||||||||||
| Inboard Boats | 9,887 | 1.0 | 9,261 | 0.9 | ||||||||||||
| Jet Boats | 2,819 | 0.1 | 2,480 | 0.1 | ||||||||||||
| TOTAL | 72,594 | $ | 4.5 | 68,932 | $ | 4.0 | ||||||||||
Chaparral’s products are categorized as sterndrive boats, jet boats and outboard boats and Robalo’s products are categorized as outboard boats. Although industry-wide sterndrive boat unit sales have been declining, the rate of decline in recent years has slowed. The Company introduced its first three jet boat models in 2014 and has been pleased with their reception by dealers and customers. Based on available market share data, Chaparral’s share of the jet boat market during the latest reported period ended September 30, 2017 was approximately 13.1 percent.
The recreational boat manufacturing market remains highly fragmented with the exception of Brunswick Corporation, which has acquired and currently operates a number of recreational boat brands. We estimate that the boat manufacturing industry includes fewer than 20 sterndrive manufacturers and fewer than 75 outboard boat manufacturers with significant unit production, with the majority representing small, privately held companies with varying degrees of professional management and manufacturing skill. According to estimates provided by Statistical Surveys, Inc., during the latest reported period ended September 30, 2017 (latest information available), the top five sterndrive manufacturers, which includes Chaparral, have a combined market share of approximately 59 percent; compared to 57 percent in the same period one year ago. Chaparral’s market share in sterndrive units during this period was approximately 16.7 percent, which represents an increase of approximately 2.0 percentage points compared to 14.7 percent during the nine months ended September 30, 2016. The Company believes that this increase in market share is primarily due to the success of our value priced Chaparral H20 models, our larger SSX models and the new Surf Series.
Several factors influence sales trends in the recreational boating industry, including general economic growth, consumer confidence, household incomes, the availability and cost of financing for our dealers and customers, weather, fuel prices, tax laws, demographics and consumers’ leisure time. Also, the value of residential and vacation real estate in coastal and recreational areas influences recreational boat sales. The most recent NMMA surveys indicate that many past boating participants do not currently participate in boating because of high costs and a lack of leisure time. The increases in the cost of certain components, operating costs, and the impact of environmental regulation have increased the cost of boats and boat ownership in recent years, and these trends may continue. Competition from other leisure and recreational activities for available leisure time can also affect sales of recreational boats.
Management believes Marine Products is well positioned to take advantage of the following conditions, which continue to characterize the industry:
| · | labor-intensive manufacturing processes that remain largely unautomated; |
| · | increasingly strict environmental standards derived from governmental regulations and customer sensitivities; |
| · | a lack of focus on coordinated customer service and support by dealers and manufacturers; |
| · | a lack of financial strength among retail boat dealers and many manufacturers; and |
| · | a high degree of fragmentation and competition among the large number of sterndrive and outboard recreational boat manufacturers. |
| 8 |
Business Strategies
Recreational boating is a mature industry. According to Info-Link Technologies, Inc., sales of new boats of all types increased at a compounded annual rate of approximately 7.9 percent between 2013 and 2017. During this period, Marine Products experienced a compounded annual growth rate of approximately 10.4 percent in the number of boats sold. The Company has historically grown its boat sales and net sales primarily through increasing market share and by expanding its number of models and product lines. During 2017 the Company’s strategy was to support our dealers’ need to maintain a higher level of inventories than in previous years, given relatively stable retail demand and an improved dealer financing environment. At the end of 2017, the Company’s dealer inventories were approximately 8.2 percent higher than they were at the end of 2016, and our unit order backlog remained strong. We believe that higher inventories and the current unit order backlog are appropriate relative to expected retail demand during the 2018 retail selling season. Chaparral has grown its sterndrive market share in the 18 to 33 feet length category from 5.9 percent in fiscal 1996 to 16.7 percent during the latest reported period ended September 30, 2017 (the most recent information available to us from Statistical Surveys, Inc.).
During 2017, we continued to emphasize the value-priced Chaparral and Robalo models, as well as the Surf Series, and new larger SSX models. In addition, we are experiencing a favorable consumer reception to our Chaparral H2O outboard boats. We believe that these boat models will expand our customer base, and leverage our strong dealer network and reputation for quality and styling. These models were partially responsible for increases in our net sales, gross profit, operating profit, and net income.
These models align with Marine Products’ overall operating strategy, which emphasizes innovative designs and manufacturing processes, and the production of a high quality product, while also seeking to lower manufacturing costs through increased efficiencies in our facilities. In the current environment, this strategy also includes the production of lower-priced, entry level models which appeal to a value-conscious consumer who wants an updated, high quality product. In addition, we seek opportunities to leverage our buying power through economies of scale. Management believes its membership in the ABA positions Marine Products as a significant third-party customer of major suppliers of sterndrive engines. Marine Products’ Chaparral subsidiary is a founding member of the ABA, which collectively represents 14 independent boat manufacturers that have formed a buying group to pool their purchasing power in order to achieve improved pricing on engines, fiberglass, resin and many other components. Marine Products intends to continue seeking the most advantageous purchasing arrangements from its suppliers.
Our marketing strategy seeks to increase market share by enabling Marine Products to expand its presence by building dedicated sales, marketing and distribution systems. Marine Products has a distribution network of 253 independent dealers located throughout the United States and in several international markets. Our strategy is to increase selectively the quantity of our dealers, and to improve the quality and effectiveness of our entire dealer network. Marine Products seeks to capitalize on its strong dealer network by educating its dealers on the sales and servicing of our products and helping them provide more comprehensive customer service, with the goal of increasing customer satisfaction, customer retention and future sales. Marine Products provides promotional and incentive programs to help its dealers increase product sales and customer satisfaction. During 2017 we continued to expand our nationally advertised fixed retail pricing to include more of our models. We believe the nationally advertised fixed retail pricing gives the consumer confidence that that they are getting the best possible price resulting in higher customer satisfaction, and also encourages consistent pricing across our dealer network.
A component of Marine Products’ overall strategy is to consider making strategic acquisitions in order to complement existing product lines, expand its geographic presence in the marketplace and strengthen its capabilities depending upon availability, price and complementary product lines. We constantly review potential acquisition targets and intend to continue doing so in the future.
Competition
The recreational boat industry is highly fragmented, resulting in intense competition for customers, dealers and boat show exhibition space. There is significant competition both within markets we currently serve and in new markets that we may enter. Marine Products’ brands compete with several large national or regional manufacturers that have substantial financial, marketing and other resources. However, we believe that our corporate infrastructure and marketing and sales capabilities, in addition to our financial strength, and our nationwide presence, enable us to compete effectively against these companies. In each of our markets, Marine Products competes on the basis of responsiveness to customer needs, the quality and range of models offered, and the competitive pricing of those models. Additionally, Marine Products faces general competition from all other recreational businesses seeking to attract consumers’ leisure time and discretionary spending dollars.
According to Statistical Surveys, Inc., the following is a list of the top ten (largest to smallest) sterndrive boat manufacturers in the United States based on unit sales in 2017. According to Statistical Surveys, Inc., the companies set forth below represent approximately 86 percent of all United States retail sterndrive boat registrations with hull lengths of 18 to 33 feet for the 12 month period ended September 30, 2017.
| 9 |
| 1. | Chaparral |
| 2. | Cobalt* |
| 3. | Sea Ray** |
| 4. | Regal |
| 5. | Bayliner** |
| 6. | Crownline |
| 7. | Four Winns*** |
| 8. | Monterey |
| 9. | Tahoe |
| 10. | Glastron *** |
The outboard engine powered market encompasses a wide variety of boats, accounting for approximately 67.6 percent of traditional powerboat unit sales during 2017. Robalo was the fourth largest manufacturer of outboard boats in lengths from 16 to 30 feet during the 12 month period ended September 30, 2017 and its share of the market during this period was approximately five percent. Primary competitors for Robalo during 2017 included Carolina Skiff, Sea Hunt Boats, Key West, Nautic Star, Mako, Boston Whaler**, Bayliner, Sportsman and Hurricane.
The jet engine powered market accounted for approximately 3.9 percent of traditional powerboat unit sales during 2017. Chaparral was the second largest jet boat manufacturer in the 20 to 24 foot range during the 12 month period ended September 30, 2017, and its share of the market during this period was approximately 13.1 percent. The largest manufacturer of jet boats in the 20 to 24 foot range was Yamaha. Other competitors include Scarab and Glastron.
| * | Division or subsidiary of Malibu Boats, Inc. |
| ** | Division or subsidiary of Brunswick Corporation |
| *** | Division or subsidiary of Beneteau Group |
Environmental and Regulatory Matters
Certain materials used in boat manufacturing, including the resins used to make the decks and hulls, are toxic, flammable, corrosive, or reactive and are classified by the federal and state governments as “hazardous materials.” Control of these substances is regulated by the Environmental Protection Agency (“EPA”) and state pollution control agencies, which require reports and inspect facilities to monitor compliance with their regulations. The Occupational Safety and Health Administration (“OSHA”) standards limit the amount of emissions to which an employee may be exposed without the need for respiratory protection or upgraded plant ventilation. Marine Products’ manufacturing facilities are regularly inspected by OSHA and by state and local inspection agencies and departments. Marine Products believes that its facilities comply in all material aspects with these regulations. Although capital expenditures related to compliance with environmental laws are expected to increase during the coming years, we do not currently anticipate that any material expenditure will be required to continue to comply with existing environmental or safety regulations in connection with our existing manufacturing facilities.
Recreational powerboats sold in the United States must be manufactured to meet the standards of certification required by the United States Coast Guard. In addition, boats manufactured for sale in the European Community must be certified to meet the European Community’s imported manufactured products standards. These certifications specify standards for the design and construction of powerboats. All boats sold by Marine Products meet these standards. In addition, safety of recreational boats is subject to federal regulation under the Boat Safety Act of 1971. The Boat Safety Act requires boat manufacturers to recall products for replacement of parts or components that have demonstrated defects affecting safety. Marine Products has from time to time instituted recalls for defective component parts produced by other manufacturers. None of the recalls has had a material adverse effect on Marine Products.
The EPA has adopted regulations stipulating that many marine propulsion engines meet an air emission standard that requires fitting a catalytic converter to the engine. These regulations also require, among other things, that the engine manufacturer provide a warranty that the engine meets EPA emission standards. The engines used in Marine Products’ Chaparral and Robalo product lines are subject to these regulations. These regulations are similar to regulations adopted by the California Air Resources Board in 2007, but apply to all U.S. states and territories. This regulation has increased the cost to manufacture the majority of the Company’s boat products. The additional cost of complying with these EPA regulations may reduce Marine Products’ profitability, because the Company may have to absorb the increased cost. It may also reduce Marine Products’ net sales, because the increased cost of owning a boat may force consumers to buy a smaller or less expensive boat or forego a boat purchase, and because increased product cost will reduce the amount of inventory that Marine Products’ dealers can carry, thus reducing retail consumers’ choices.
| 10 |
Employees
As of December 31, 2017, Marine Products had approximately 891 employees (an increase from approximately 823 at December 31, 2016), of whom four were management, 50 were administrative and six were sales.
None of Marine Products’ employees are party to a collective bargaining agreement. Marine Products’ entire workforce is currently employed in the United States and Marine Products believes that its relations with its employees are good.
Proprietary Matters
Marine Products owns a number of trademarks, trade names and patents that it believes are important to its business. Except for the Chaparral and Robalo trademarks, however, Marine Products is not dependent upon any single trademark or trade name or group of trademarks or trade names. The Chaparral and Robalo trademarks are currently registered in the United States. The current duration for such registration ranges from seven to 15 years but each registration may be renewed an unlimited number of times.
Several of Chaparral’s and Robalo’s designs are protected under the U.S. Copyright Office’s Vessel Hull Design Protection Act. This law grants an owner of an original vessel hull design certain exclusive rights. Protection is offered for hull designs that are made available to the public for purchase provided that the application is made within two years. As of December 31, 2017, there were 22 Chaparral hull designs and four Robalo hull designs registered under the Vessel Hull Design Protection Act.
During 2008 Chaparral was granted a design patent on its Wide TechTM hull design by the U.S. Patent and Trademark Office. The patent has a term of 14 years and protects the Wide TechTM hull currently used on the Sunesta Wide TechTM and Xtreme, SSi Wide TechTM and two of its Signature Cruisers from being used by other pleasure boat manufacturers. Marine Products believes that this patent is important to its business.
Seasonality
Marine Products’ quarterly operating results are affected by weather and general economic conditions. Quarterly operating results for the second quarter have historically recorded the highest sales volume for the year because this corresponds with the highest retail sales volume period. The results for any quarter are not necessarily indicative of results to be expected in any future period.
Inflation
The market prices of certain materials used in manufacturing the Company’s products, especially resins that are made with hydrocarbon feedstocks, copper and steel, have at certain periods been volatile. During 2017, the costs of several of these raw materials have increased slightly. In addition, the cost of certain components used in the manufacturing of the Company’s products has increased due to high demand and limited supplier capacity. As a result, it is possible the Company will incur higher materials purchase costs in 2018. These higher prices of materials would increase the costs of manufacturing the Company’s products, and could negatively affect our profit margins, due to the competitive nature of the selling environment for recreational boats. Furthermore, the costs of these raw materials remain volatile, and may decrease in the future.
New boat buyers typically finance their purchases. Higher inflation typically results in higher interest rates that could translate into an increased cost of boat ownership. During the first quarter of 2018, there were indications that inflation in the general economy was beginning to increase, and general market interest rates have increased as well. If these trends continue during 2018, prospective buyers may choose to forego or delay their purchases or buy a less expensive boat in the event that interest rates rise or credit is not available to finance their boat purchases.
Availability of Filings
Marine Products makes available free of charge on its website, www.marineproductscorp.com, the annual report on Form 10-K, quarterly reports on Form 10-Q, current reports on Form 8-K, and all amendments to those reports on the same day as they are filed with the Securities and Exchange Commission.
Item 1A. Risk Factors
Economic Conditions, Availability of Credit and Consumer Confidence Levels Affect Marine Products’ Sales Because Marine Products’ Products are Purchased with Discretionary Income
| 11 |
During an economic recession or when an economic recession is perceived as a threat, Marine Products will be adversely affected as consumers have less discretionary income or are more apt to save their discretionary income rather than spend it. During times of global political or economic uncertainty, Marine Products will be negatively affected to the extent consumers forego or delay large discretionary purchases pending the resolution of those uncertainties. Historical volatility in the prices and financial returns of investments and residential real estate may force consumers to delay retirement, or to choose more modest lifestyles when they do retire. In such a case, consumers may not purchase boats, may purchase boats later in their lives, or may purchase smaller or less expensive boats. Tight lending and credit standards, which until recently have been in use by lenders in the United States, can make loans for boats harder to secure, and such loans may carry unfavorable terms, which may force consumers to forego boat purchases. These factors have also resulted in the past, and may continue to result in the future, in a reduction in the quality and number of dealers upon which Marine Products relies to sell its products.
Marine Products Relies upon Third-Party Dealer Floor Plan Lenders Which Provide Financing to its Network of Independent Dealers
Marine Products sells its products to a network of independent dealers, most of whom rely on one or more third-party dealer floor plan lenders to provide financing for their inventory prior to its sale to retail customers. In general, this source of financing is vital to Marine Products’ ability to sell products to its dealer network. While dealer floor plan credit is currently available for many of our dealers during the 2018 model year, the Company’s sales and profitability could be adversely affected in the event of a decline in floor plan financing availability, or if financing terms change unfavorably.
Interest Rates and Fuel Prices Affect Marine Products’ Sales
The Company’s products are often financed by our dealers and the retail boat consumers. Higher interest rates increase the borrowing costs and, accordingly, the cost of doing business for dealers and the cost of boat purchases for consumers. Fuel costs can represent a large portion of the costs to operate our products. Therefore, higher interest rates and fuel costs can adversely affect consumers’ decisions relating to recreational boating purchases.
Marine Products’ Dependence on its Network of Independent Boat Dealers may Affect its Operating Results and Sales
Virtually all of Marine Products’ sales are derived from its network of independent boat dealers. Marine Products has no long-term agreements with these dealers. Competition for dealers among recreational powerboat manufacturers continues to increase based on the quality of available products, the price and value of the products, and attention to customer service. The Company faces intense competition from other recreational powerboat manufacturers in attracting and retaining independent boat dealers. The number of independent boat dealers supporting the Chaparral and Robalo trade names and the quality of their marketing and servicing efforts are essential to Marine Products’ ability to generate sales. A deterioration in the number of Marine Products’ network of independent boat dealers could have a material adverse effect on its boat sales. Marine Products’ inability to attract new dealers and retain those dealers, or its inability to increase sales with existing dealers, could substantially impair its ability to execute its business plans. Although Marine Products’ management believes that the quality of its products and services in the recreational boating market should permit it to maintain its relationship with its dealers and its market position, there can be no assurance that Marine Products will be able to sustain its current sales levels.
Marine Products’ Financial Condition and Operating Results may be Adversely Affected by Boat Dealer Defaults
The Company’s products are sold through independent dealers and the financial health of these dealers is critical to the Company’s continued success. The Company’s results can be negatively affected if a dealer defaults because Marine Products or its subsidiaries may be contractually required to repurchase inventory up to certain limits, although for business reasons, the Company may decide to purchase additional boats in excess of this contractual obligation.
Marine Products’ Ability to Adjust its Business Operations to Compensate for Reduced Sales of Boats may be Restricted in the Future
In 2008 Marine Products idled certain production facilities and reduced its number of employees to offset the impact that reduced net sales had on the Company’s operating results and cash flows. As a result, the Company experienced lower rates of absorption of its fixed costs. The Company’s sales improved in 2016 and 2017, thus increasing the rate of absorption of its fixed costs and improving operating and net income.
Marine Products’ Sales are Affected by Weather Conditions
Marine Products’ business is subject to weather patterns that may adversely affect its sales. For example, drought conditions, or merely reduced rainfall levels, or excessive rain, may close area boating locations or render boating dangerous or inconvenient, thereby curtailing customer demand for our products. In addition, unseasonably cool weather and prolonged winter conditions may lead to a shorter selling season in some locations. Hurricanes and other storms could cause disruptions of our operations or damage to our boat inventories and manufacturing facilities.
Marine Products Encounters Intense Competition Which Affects our Sales and Profits
The recreational boat industry is highly fragmented, resulting in intense competition for customers, dealers and boat show exhibition space. This competition affects both the markets which we currently serve and new markets that we may enter in the future. We compete with several large national or regional manufacturers that have substantial financial, marketing and other resources.
| 12 |
Marine Products has Potential Liability for Personal Injury and Property Damage Claims
The products we sell or service may expose Marine Products to potential liabilities for personal injury or property damage claims relating to the use of those products. Historically, the resolution of product liability claims has not materially affected Marine Products’ business. Marine Products maintains product liability insurance that it believes to be adequate. However, there can be no assurance that Marine Products will not experience legal claims in excess of its insurance coverage or that claims will be covered by insurance. Furthermore, any significant claims against Marine Products could result in negative publicity, which could cause Marine Products’ sales to decline.
Because Marine Products Relies on Third-party Suppliers, Marine Products may be Unable to Obtain Adequate Raw Materials, Engines and Components Which Could Adversely Affect Sales and Profit Margins
Marine Products is dependent on third-party suppliers to provide raw materials, engines and components essential to the construction of its various powerboats. Especially critical are the availability and cost of marine engines and commodity raw materials used in the manufacture of Marine Products’ boats. While Marine Products’ management believes that supplier relationships currently in place are sufficient to provide the engines and materials necessary to meet present production demands, there can be no assurance that these relationships will continue, that these suppliers will remain in operation or that the quantity or quality of materials available from these suppliers will be sufficient to meet Marine Products’ future needs. Disruptions in current supplier relationships or the inability of Marine Products to continue to purchase construction materials in sufficient quantities and of sufficient quality at acceptable prices to meet ongoing production schedules could cause a decrease in sales or a sharp increase in the cost of goods sold. Additionally, because of this dependence, the volatility in commodity raw materials or current or future price increases in production materials or the inability of Marine Products’ management to purchase engines and materials required to execute its growth and acquisition strategies could reduce the number of boats Marine Products may be able to produce for sale or cause a reduction in Marine Products’ profit margins.
Marine Products may be Unable to Identify, Complete or Successfully Integrate Acquisitions
Marine Products intends to pursue acquisitions and form strategic alliances that will enable Marine Products to acquire complementary skills and capabilities, offer new products, expand its customer base, and obtain other competitive advantages. There can be no assurance, however, that Marine Products will be able to successfully identify suitable acquisition candidates or strategic partners, obtain financing on satisfactory terms, complete acquisitions or strategic alliances, integrate acquired operations into its existing operations, or expand into new markets. Once integrated, acquired operations may not achieve anticipated levels of sales or profitability, or otherwise perform as expected. Acquisitions also involve special risks, including risks associated with unanticipated problems, liabilities and contingencies, diversion of management resources, and possible adverse effects on earnings and earnings per share resulting from increased interest costs, the issuance of additional securities, and difficulties related to the integration of the acquired business. The failure to integrate acquisitions successfully may divert management’s attention from Marine Products’ existing operations and may damage Marine Products’ relationships with its key customers and suppliers.
Marine Products’ Success will Depend on its Key Personnel, and the Loss of any Key Personnel may Affect its Powerboat Sales
Marine Products’ success will depend to a significant extent on the continued service of key management personnel. The loss or interruption of the services of any senior management personnel or the inability to attract and retain other qualified management, sales, marketing and technical employees could disrupt Marine Products’ operations and cause a decrease in its sales and profit margins.
Marine Products’ Ability to Attract and Retain Qualified Employees is Crucial to its Results of Operations and Future Growth
Marine Products relies on the existence of an available hourly workforce to manufacture its products. As with many businesses, we are challenged at times to find qualified employees. There are no assurances that Marine Products will be able to attract and retain qualified employees to meet current and/or future growth needs.
If Marine Products is Unable to Comply with Environmental and Other Regulatory Requirements, its Business may be Exposed to Liability and Fines
Marine Products’ operations are subject to extensive regulation, supervision and licensing under various federal, state and local statutes, ordinances and regulations. While Marine Products believes that it maintains all requisite licenses and permits and is in compliance with all applicable federal, state and local regulations, there can be no assurance that Marine Products will be able to continue to maintain all requisite licenses and permits and comply with applicable laws and regulations. The failure to satisfy these and other regulatory requirements could cause Marine Products to incur fines or penalties or could increase the cost of operations. The adoption of additional laws, rules and regulations could also increase Marine Products’ costs.
The U.S. Environmental Protection Agency (EPA) has adopted regulations affecting many marine propulsion engines. This regulation has increased the cost of boats subject to the regulation, which may either reduce the Company’s profitability or reduce sales.
| 13 |
As with boat construction in general, our manufacturing processes involve the use, handling, storage and contracting for recycling or disposal of hazardous or toxic substances or wastes. Accordingly, we are subject to regulations regarding these substances, and the misuse or mishandling of such substances could expose Marine Products to liability or fines.
Additionally, certain states have required or are considering requiring a license in order to operate a recreational boat. While such licensing requirements are not expected to be unduly restrictive, regulations may discourage potential first-time buyers, thereby reducing future sales.
Marine Products’ Stock Price has been Volatile
Historically, the market price of common stock of companies engaged in the discretionary consumer products industry has been highly volatile. Likewise, the market price of our common stock has varied significantly in the past. In addition, the availability of Marine Products common stock to the investing public is limited to the extent that shares are not sold by the executive officers, directors and their affiliates, which could negatively impact the trading price of Marine Products’ common stock, increase volatility and affect the ability of minority stockholders to sell their shares. Future sales by executive officers, directors and their affiliates of all or a substantial portion of their shares could also negatively affect the trading price of Marine Products’ common stock.
Marine Products’ Management has a Substantial Ownership Interest; Public Stockholders may have no Effective Voice in Marine Products’ Management
The Company has elected the “Controlled Corporation” exemption under Section 303A of the New York Stock Exchange (“NYSE”) Listed Company Manual. The Company is a “Controlled Corporation” because a group that includes the Company’s Chairman of the Board, R. Randall Rollins and his brother, Gary W. Rollins, who is also a director of the Company, and certain companies under their control, controls in excess of fifty percent of the Company’s voting power. As a “Controlled Corporation,” the Company need not comply with certain NYSE rules including those requiring a majority of independent directors.
Marine Products’ executive officers, directors and their affiliates hold directly or through indirect beneficial ownership, in the aggregate, approximately 71 percent of Marine Products’ outstanding shares of common stock. As a result, these stockholders effectively control the operations of Marine Products, including the election of directors and approval of significant corporate transactions such as acquisitions. This concentration of ownership could also have the effect of delaying or preventing a third-party from acquiring control of Marine Products at a premium.
Provisions in Marine Products’ Certificate of Incorporation and Bylaws may Inhibit a Takeover of Marine Products
Marine Products’ certificate of incorporation, bylaws and other documents contain provisions including advance notice requirements for stockholder proposals and staggered terms of office for the Board of Directors. These provisions may make a tender offer, change in control or takeover attempt that is opposed by Marine Products’ Board of Directors more difficult or expensive.
Item 1B. Unresolved Staff Comments
None.
Item 2. Properties
Marine Products’ corporate offices are located in Atlanta, Georgia. These offices are currently shared with RPC and are leased. The monthly rent paid is allocated between Marine Products and RPC. Under this arrangement, Marine Products pays approximately $3,400 per month in rent. Marine Products may cancel this arrangement at any time after giving a 30 day notice.
Chaparral owns and maintains approximately 1,051,000 square feet of space utilized for manufacturing, research and development, warehouse, sales office and operations in Nashville, Georgia. In addition, the Company owns 83,000 square feet of manufacturing space in Valdosta, Georgia. The Company also leases 111,000 square feet of warehouse space in Nashville, Georgia under a lease arrangement expiring in 2018. Marine Products’ total square footage under roof is allocated as follows: manufacturing — 724,700, research and development — 68,500, warehousing — 315,700, office and other — 136,100.
Item 3. Legal Proceedings
Marine Products is involved in litigation from time to time in the ordinary course of its business. Marine Products does not believe that the ultimate outcome of such litigation will have a material adverse effect on its liquidity, financial condition or results of operations.
Item 4. Mine Safety Disclosures
Not applicable.
| 14 |
Item 4A. Executive Officers of the Registrant
Each of the executive officers of Marine Products was elected by the Board of Directors to serve until the Board of Directors’ meeting immediately following the next annual meeting of stockholders or until his earlier removal by the Board of Directors or his resignation. The following table lists the executive officers of Marine Products and their ages, offices, and date first elected to office.
| Name and Office with Registrant | Age | Date First Elected to Present Office | ||
| R. Randall Rollins (1) | 86 | 2/28/01 | ||
| Chairman of the Board | ||||
| Richard A. Hubbell (2) | 73 | 2/28/01 | ||
| President and Chief Executive Officer | ||||
| Ben M. Palmer (3) | 57 | 2/28/01 | ||
| Vice President, Chief Financial Officer and Corporate Secretary |
| (1) | R. Randall Rollins began working for Rollins, Inc. (consumer services) in 1949. At the time of the spin-off of RPC from Rollins, Inc. in 1984, Mr. Rollins was elected Chairman of the Board and Chief Executive Officer of RPC. He remains Chairman of RPC and stepped down from the position of Chief Executive Officer effective in 2003. He has served as Chairman of the Board of Marine Products since 2001 and Chairman of the Board of Rollins, Inc. since 1991. He is also a director of Dover Downs Gaming and Entertainment, Inc. and Dover Motorsports, Inc. |
| (2) | Richard A. Hubbell has been the President and Chief Executive Officer of Marine Products since it was spun off in 2001. He has also been President of RPC since 1987 and Chief Executive Officer since 2003. Mr. Hubbell serves on the Board of Directors of both of these companies. |
| (3) | Ben M. Palmer has been Vice President, Chief Financial Officer of Marine Products since it was spun off in 2001 and has served the same roles at RPC since 1996. He assumed the responsibilities as Corporate Secretary of Marine Products and RPC in July 2017. |
| 15 |
PART II
Item 5. Market for Registrant’s Common Equity, Related Stockholder Matters and Issuer Purchases of Equity Securities
Marine Products’ common stock is listed for trading on the New York Stock Exchange under the symbol “MPX.” As of February 16, 2018, there were 34,631,246 shares of common stock outstanding.
At the close of business on February 16, 2018, there were approximately 3,035 beneficial holders of record of the Company’s common stock. The high and low trading prices of Marine Products’ common stock and dividends paid for each quarter in the years ended December 31, 2017 and 2016 were as follows:
| 2017 | 2016 | |||||||||||||||||||||||
| Quarter | High | Low | Dividends | High | Low | Dividends | ||||||||||||||||||
| First | $ | 14.87 | $ | 9.89 | $ | 0.07 | $ | 8.40 | $ | 4.92 | $ | 0.06 | ||||||||||||
| Second | 15.76 | 10.31 | 0.07 | 9.05 | 7.29 | 0.06 | ||||||||||||||||||
| Third | 17.07 | 13.48 | 0.07 | 9.38 | 8.09 | 0.06 | ||||||||||||||||||
| Fourth | $ | 16.85 | $ | 12.01 | $ | 0.12 | $ | 14.51 | $ | 8.76 | $ | 0.06 | ||||||||||||
On January 23, 2018, the Company’s Board of Directors approved a 43 percent increase to the regular cash dividend from $0.07 per share to $0.10 per share payable March 9, 2018 to stockholders of record at the close of business on February 9, 2018. Subject to industry conditions and the Company’s earnings, financial condition, and other relevant factors, the Company expects to continue to pay regular quarterly cash dividends to common stockholders.
Issuer Purchases of Equity Securities
In accordance with actions by the Company’s Board of Directors, an aggregate of 8,250,000 shares have been authorized for repurchase in connection with a stock buyback program initially announced in 2001, and subsequent increases announced in 2005 and 2008. These programs do not have predetermined expiration dates. There were 193,476 shares repurchased as part of this program during the fourth quarter of 2017. As of December 31, 2017, a total of 2,513,052 shares remain available for repurchase under this program.
| Period | Total Number of Shares (or Units) Purchased | Average Price Paid Per Share (or Unit) | Total Number
of Shares (or Units) Purchased as Part of Publicly Announced Plans or Programs (1) | Maximum Number (or Approximate Dollar Value) of Shares (or Units) that May Yet Be Purchased Under the Plans or Programs (1) | ||||||||||||
| October 1, 2017 to October 31, 2017 | 28,038 | 14.38 | 28,038 | 2,678,490 | ||||||||||||
| November 1, 2017 to November 30, 2017 | 110,919 | 14.38 | 110,919 | 2,567,571 | ||||||||||||
| December 1, 2017 to December 31, 2017 | 54,519 | 14.81 | 54,519 | 2,513,052 | ||||||||||||
| Totals | 193,476 | 14.63 | 193,476 | 2,513,052 | ||||||||||||
| [1] | The Company's Board of Directors announced a stock buyback program on April 25, 2001 authorizing the repurchase of 2,250,000 shares in the open market and another on March 14, 2005 authorizing the repurchase of an additional 3,000,000 shares. On January 22, 2008 the Board of Directors authorized an additional 3,000,000 shares that the Company may repurchase. As of December 31, 2017, a total of 5,736,948 shares have been repurchased in the open market under this program and there are 2,513,052 shares that remain available for repurchase. |
| 16 |
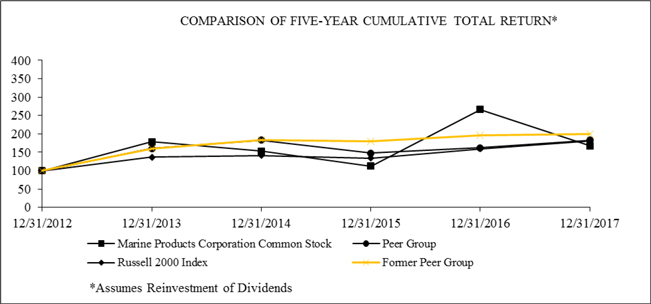
Performance Graph
The following graph shows a five-year comparison of the cumulative total stockholder return based on the performance of the stock of the Company, assuming dividend reinvestment, as compared with both a broad equity market index and an industry or peer group index. The indices included in the following graph are the Russell 2000 Index (“Russell 2000”) and a peer group which includes companies that are considered peers of the Company (“Peer Group”). The companies included in the Peer Group have been weighted according to each respective issuer’s stock market capitalization at the end of each year. The companies in the Peer Group are Brunswick Corporation, MarineMax, Inc. and Malibu Boats, Inc. Malibu Boats, Inc. is included in the Peer Group because it is a pleasure boat manufacturer with similar products and operations as the Company, as well as a market capitalization that was similar to the market capitalization of the Company at December 31, 2017. Malibu Boats, Inc. was not previously included in the Peer Group because its common stock did not trade on a securities exchange until the first quarter of 2014. For comparison purposes, the following graph includes the performance of the Peer Group as well as the peer group without the inclusion of Malibu Boats, Inc. (the “Former Peer Group”).
The Russell 2000 is used because the Company is a component of the Russell 2000, and because the Russell 2000 is a stock index representing small capitalization U.S. stocks. During 2017, the components of the Russell 2000 had an average market capitalization of $2.4 billion, and a median market capitalization of $861 million.
The graph below assumes the value of $100.00 invested on December 31, 2012.
| 17 |
Item 6. Selected Financial Data
The following table summarizes certain selected financial data of Marine Products. The historical information may not be indicative of Marine Products’ future results of operations. The information set forth below should be read in conjunction with “Management’s Discussion and Analysis of Financial Condition and Results of Operations” and the Consolidated Financial Statements and the notes thereto included elsewhere in this document.
| Years Ended December 31, | ||||||||||||||||||||
| (In thousands, except share, per share and employee data) | ||||||||||||||||||||
| 2017 | 2016 | 2015 | 2014 | 2013 | ||||||||||||||||
| Statement of Operations Data: | ||||||||||||||||||||
| Net sales | $ | 267,316 | $ | 241,330 | $ | 207,061 | $ | 171,050 | $ | 168,293 | ||||||||||
| Cost of goods sold | 208,296 | 190,863 | 163,261 | 138,379 | 138,480 | |||||||||||||||
| Gross profit | 59,020 | 50,467 | 43,800 | 32,671 | 29,813 | |||||||||||||||
| Selling, general and administrative expenses | 29,261 | 27,415 | 23,249 | 20,665 | 20,307 | |||||||||||||||
| Operating income | 29,759 | 23,052 | 20,551 | 12,006 | 9,506 | |||||||||||||||
| Interest income | 229 | 355 | 420 | 521 | 524 | |||||||||||||||
| Income before income taxes | 29,988 | 23,407 | 20,971 | 12,527 | 10,030 | |||||||||||||||
| Income tax provision (1) | 10,688 | 6,662 | 6,665 | 3,613 | 2,502 | |||||||||||||||
| Net income (1) | $ | 19,300 | $ | 16,745 | $ | 14,306 | $ | 8,914 | $ | 7,528 | ||||||||||
| Earnings per share: (1) | ||||||||||||||||||||
| Basic | $ | 0.55 | $ | 0.44 | $ | 0.39 | $ | 0.24 | $ | 0.20 | ||||||||||
| Diluted | $ | 0.55 | $ | 0.44 | $ | 0.39 | $ | 0.24 | $ | 0.20 | ||||||||||
| Dividends paid per share | $ | 0.33 | $ | 0.24 | $ | 0.20 | $ | 0.16 | $ | 0.15 | ||||||||||
| Other Financial and Operating Data: | ||||||||||||||||||||
| Gross profit margin percent | 22.1 | % | 20.9 | % | 21.2 | % | 19.1 | % | 17.7 | % | ||||||||||
| Operating margin percent | 11.1 | % | 9.6 | % | 9.9 | % | 7.0 | % | 5.6 | % | ||||||||||
| Net cash provided by operating activities | $ | 29,639 | $ | 15,837 | $ | 16,044 | $ | 10,656 | $ | 10,937 | ||||||||||
| Net cash (used for) provided by investing activities | (6,549 | ) | 22,575 | (2,489 | ) | (4,157 | ) | (1,326 | ) | |||||||||||
| Net cash used for financing activities | (18,025 | ) | (43,779 | ) | (9,641 | ) | (7,541 | ) | (6,145 | ) | ||||||||||
| Capital expenditures | $ | 2,410 | $ | 1,940 | $ | 3,878 | $ | 451 | $ | 521 | ||||||||||
| Employees at end of year | 891 | 823 | 767 | 605 | 651 | |||||||||||||||
| Factory and administrative space at end of year (square ft.) | 1,211 | 1,211 | 1,205 | 1,205 | 1,205 | |||||||||||||||
| Balance Sheet Data at end of year: | ||||||||||||||||||||
| Cash and cash equivalents | $ | 7,684 | $ | 2,619 | $ | 7,986 | $ | 4,072 | $ | 5,114 | ||||||||||
| Marketable securities — current | 2,636 | 4,109 | 7,825 | 3,653 | 5,639 | |||||||||||||||
| Marketable securities — non-current | 10,395 | 5,221 | 27,129 | 33,831 | 30,949 | |||||||||||||||
| Inventories | 38,006 | 42,488 | 32,638 | 28,819 | 28,859 | |||||||||||||||
| Working capital | 34,826 | 34,753 | 38,846 | 30,014 | 30,698 | |||||||||||||||
| Property, plant and equipment, net | 14,218 | 13,334 | 12,761 | 9,890 | 11,265 | |||||||||||||||
| Total assets | 95,900 | 88,527 | 110,677 | 103,823 | 102,553 | |||||||||||||||
| Total stockholders’ equity | $ | 69,604 | $ | 65,445 | $ | 90,212 | $ | 83,494 | $ | 81,483 | ||||||||||
| (1) | The indicated Statement of Operations data for 2017 include the impact of a net discrete tax provision of $1.7 million, or $0.05 per share, recorded as a result of the Tax Cuts and Jobs Act enacted during the fourth quarter of 2017. |
| 18 |
Item 7. Management’s Discussion and Analysis of Financial Condition and Results of Operations
The following discussion is based upon and should be read in conjunction with “Selected Financial Data” and “Financial Statements and Supplementary Data.” See also “Forward-Looking Statements” on page 2.
Overview
Marine Products, through our wholly owned subsidiaries Chaparral and Robalo, is a leading manufacturer of recreational fiberglass powerboats. Our sales and profits are generated by selling the products that we manufacture to a network of independent dealers who in turn sell the products to retail consumers. These dealers are located throughout the continental United States and in several international markets. Dealers either remit payment upon receipt of the product or finance their inventory through third-party floor plan lenders, who pay Marine Products generally within ten days of delivery of the products to the dealers.
We manage our Company by focusing on the execution of the following business and financial strategies:
| ● | Manufacturing high-quality, stylish, and innovative powerboats for our dealers and retail consumers, |
| ● | Providing our independent dealer network appropriate incentives, training, and other support to enhance their success and their customers’ satisfaction, thereby facilitating their continued relationship with us, |
| ● | Managing our production and dealer order backlog to optimize operating results and reduce risk in the event of a downturn in sales of our products, |
| ● | Maintaining a flexible, variable cost structure which can be reduced quickly when deemed appropriate, |
| ● | Focusing on the competitive nature of the boating business and designing our products and strategies in order to grow and maintain profitable market share, |
| ● | Monitoring the recreational boat market for strong complementary product lines which we may enter through new product development or acquisition, |
| ● | Extending our brand name recognition to enhance the success of new boat models that complement our existing offerings, |
| ● | Improving our sales and profits by increasing the utilization of our manufacturing capacity, |
| ● | Monitoring the activities and financial condition of our dealers and of the third-party floor plan lenders who finance our dealers’ inventories, |
| ● | Maximizing stockholder return by optimizing the balance of cash invested in the Company’s productive assets, the payment of dividends to stockholders, and the repurchase of the Company’s common stock on the open market, and |
| ● | Aligning the interests of our management and stockholders. |
In executing these strategies and attempting to optimize our financial returns, management closely monitors dealer orders and inventories, the production mix of various models, and indications of near term demand such as consumer confidence, interest rates, dealer orders placed at our annual dealer conferences, and retail attendance and orders at annual winter boat show exhibitions. We also consider trends related to certain key financial and other data, including our historical and forecasted financial results, market share, unit sales of our products, average selling price per boat, and gross profit margins, among others, as indicators of the success of our strategies. Marine Products’ financial results are affected by consumer confidence — because pleasure boating is a discretionary expenditure, interest rates — because many retail customers finance the purchase of their boats, and other socioeconomic and environmental factors such as availability of leisure time, consumer preferences, demographics and the weather.
During 2017, several segments of the recreational boating industry improved due to stable consumer confidence and improving residential real estate markets, as well as a stable financing environment for dealers and consumers. Overall industry retail sales of outboard recreational boats improved during 2017, although sterndrive unit sales declined. Our net sales improved in 2017 compared to 2016 due to higher unit sales of our Robalo sport fishing boats, coupled with higher unit sales of our Chaparral H2O models and sales of our Chaparral Surf Series and new larger SSX models. We achieved higher net sales, as well as increased gross profit and operating profit in 2017 compared to 2016. Management will continue to monitor retail demand among the various segments in the recreational boat market, dealer inventory levels and the availability of dealer and consumer financing for the purchase of our products and adjust our production levels as deemed appropriate.
We continuously monitor our market share in the 18 to 33 foot sterndrive category as one indicator of the success of our strategies and the market’s acceptance of our products. For the 12 month period ended September 30, 2017 (latest data available to us), Chaparral’s market share in the 18 to 33 foot sterndrive category was 16.7 percent compared to 14.7 percent during the same period in 2016; the highest market share in this category. Chaparral’s market share in the 18 to 20 foot category was 12.6 percent during this period in 2017, and its market share in the 21 to 33 foot category was 18.6 percent. Chaparral’s market share concentrations within these size ranges has remained relatively consistent during the past several years. For the 12 month period ended September 30, 2017, Robalo’s share of the 16 to 30 foot outboard sport fishing boat market was 5.3 percent. For the same period, Chaparral’s share of the 20 to 24 foot jet boat market was approximately 13.1 percent. We will continue to monitor our market share and believe it to be important, but we believe that maximizing profitability takes precedence over growing our market share. Furthermore, as we continue to expand the breadth of our product offerings within our core category and new categories, we consider our overall market share across the various powerboat categories to be of greater importance to the long-term health of our company than our market share within any specific type of recreational boat.
| 19 |
Outlook
We believe that recreational boating retail demand in many segments of the industry continue to improve. Attendance and sales during the 2018 winter boat shows were moderately higher than the 2017 winter boat show season, residential real estate markets have improved, consumer confidence has stabilized, and fuel prices have declined. A potential impediment to improving boat sales, however, is the increase in market interest rates. Since most consumers finance their boat purchases, higher interest rates increase the cost of boat ownership.
Although industry wide retail boat sales remain lower than they were prior to the 2008 financial crisis, retail boat sales have increased each year since 2011. We believe retail boat sales will continue to improve due to improving consumer confidence and a growing U.S. economy. Fluctuations in fuel prices can impact our industry, although they were relatively stable in 2017 and we do not believe that they have recently impacted sales. In general, the overall cost of boat ownership has increased, especially in the sterndrive recreational boat market segment, which comprises approximately 39 percent of the Company’s unit sales. The higher cost of boat ownership discourages consumers from purchasing recreational boats. For a number of years, Marine Products as well as other boat manufacturers have been improving their customer service capabilities, marketing strategies and sales promotions in order to attract more consumers to recreational boating as well as improve consumers’ boating experiences. The Company provides financial incentives to its dealers for receiving favorable customer satisfaction surveys. In addition, the recreational boating industry conducts a promotional program which involves advertising and consumer targeting efforts, as well as other activities designed to increase the potential consumer market for pleasure boats. Many manufacturers, including Marine Products, participate in this program. Management believes that these efforts have incrementally benefited the industry and Marine Products. As in past years, Marine Products enhanced its selection of models for the 2018 model year which began on July 1, 2017. We continue to emphasize the value-priced Chaparral and Robalo models, as well as the Surf Series, a line of Chaparral models first introduced for the 2017 model year and new larger SSX models. In addition, we are experiencing a favorable consumer reception to our Chaparral H2O outboard boats. We believe that these boat models will expand our customer base, and leverage our strong dealer network and reputation for quality and styling. During 2017 we expanded our nationally advertised fixed retail pricing to include more of our models. We plan to continue to develop and produce additional new products for subsequent model years. Marine Products expects to benefit from the Tax Cuts and Jobs Act (“Tax Reform”) enacted during the fourth quarter of 2017. Marine Products Corporation estimates that its annual effective tax rate for 2018 will be in the low 20 percent range. Since Marine Products believes that it will generate continued positive financial results, the Company believes that it will benefit from this lower tax rate through increased earnings in 2018.
Our financial results for 2018 will depend on a number of factors, including interest rates, consumer confidence, the availability of credit to our dealers and consumers, fuel costs, the continued acceptance of our new products in the recreational boating market, our ability to compete in the competitive pleasure boating industry, and the costs of labor and certain of our raw materials and key components.
| 20 |
Results of Operations
| Years ended December 31, | ||||||||||||
| ($’s in thousands) | 2017 | 2016 | 2015 | |||||||||
| Total number of boats sold to dealers | 5,301 | 5,049 | 4,285 | |||||||||
| Average gross selling price per boat | $ | 44.2 | $ | 42.2 | $ | 43.5 | ||||||
| Net sales | $ | 267,316 | $ | 241,330 | $ | 207,061 | ||||||
| Percentage of gross profit to net sales | 22.1 | % | 20.9 | % | 21.2 | % | ||||||
| Percentage of selling, general and administrative expenses to net sales | 10.9 | % | 11.4 | % | 11.2 | % | ||||||
| Operating income | $ | 29,759 | $ | 23,052 | $ | 20,551 | ||||||
| Warranty expense | $ | 3,343 | $ | 4,080 | $ | 1,222 | ||||||
Year Ended December 31, 2017 Compared To Year Ended December 31, 2016
Net Sales. Marine Products’ net sales increased by $26.0 million or 10.8 percent in 2017 compared to 2016. The increase was primarily due to a 5.0 percent increase in the number of boats sold, as well as an increase in parts and accessories sales, coupled with a 4.7 percent increase in the average gross selling price per boat. Unit sales increased due to higher sales of our Robalo outboard sport fishing boats, as well as increased unit sales of our Chaparral H20 models and our Chaparral Surf Series models, partially offset by decreases in unit sales of our Vortex Jet boat models. Average selling prices increased primarily due to a model mix which included increased sales of our larger boats, including new larger SSX models. Domestic net sales were $250.4 million, an increase of 13.7 percent compared to the prior year. International sales decreased 20.2 percent during 2017 compared to 2016 primarily due to the strength of the U.S. dollar.
Cost of Goods Sold. Cost of goods sold increased 9.1 percent in 2017 compared to 2016. As a percentage of net sales, cost of goods sold decreased to 77.9 percent in 2017, compared to 79.1 percent in 2016, primarily due to a model mix which included increased sales of our larger models, coupled with improved manufacturing efficiencies due to higher production volumes.
Selling, General and Administrative Expenses. Selling, general and administrative expenses increased 6.7 percent in 2017 compared to 2016 primarily due to an increase in incentive compensation consistent with improved operating results, partially offset by lower warranty expense due to favorable warranty claims experience. Selling, general and administrative expenses as a percentage of sales decreased from 11.4 percent in 2016 to 10.9 percent in 2017. As a percentage of net sales, warranty expense decreased to 1.3 percent in 2017, compared to 1.7 percent in 2016. This decrease was primarily due to lower estimates for current and future warranty claims.
Interest Income. Interest income declined to $229 thousand in 2017 compared to $355 thousand in 2016. Marine Products generates interest income primarily from investments in tax-exempt municipal obligations. This decrease was due to a reduction in the average balance of our marketable securities portfolio primarily as a result of the liquidation of marketable securities to fund a portion of a Tender Offer for the Company’s common shares completed in the fourth quarter of 2016.
Income Tax Provision. The income tax provision increased to $10.7 million compared to $6.7 million in 2016. The effective tax rate in 2017 was 35.6 percent compared to 28.5 percent in 2016. The effective rate increased primarily due to the impact of recently enacted Tax Reform in the fourth quarter of 2017. The Company revalued its deferred tax assets and deferred tax liabilities utilizing the new deferred income tax rate of 22 percent (federal corporate rate of 21 percent plus a blended state rate net of federal tax benefit) resulting in a detrimental discrete adjustment of $1.7 million, or $0.05 per share, that was recorded as a component of tax expense. The effective rate in both periods includes the effect of beneficial permanent differences including tax-exempt interest income and favorable U.S. manufacturing deductions. The 2016 effective tax rate also included certain beneficial permanent tax differences generated from the implementation of state tax planning that provided for the increased use of previously suspended net operating losses.
Year Ended December 31, 2016 Compared To Year Ended December 31, 2015
Net Sales. Marine Products’ net sales increased by $34.3 million or 16.6 percent in 2016 compared to 2015. The increase was primarily due to a 17.8 percent increase in the number of boats sold, as well as an increase in parts and accessories sales, partially offset by a 3.0 percent decrease in the average gross selling price per boat. Unit sales increased due to higher sales of our Robalo outboard sport fishing boats, as well as increased unit sales of our Chaparral H20 models and SunCoast outboards. Average selling prices decreased primarily due to a model mix which included higher sales of our value priced H2O models. Domestic net sales were $220.1 million, an increase of 19.2 percent compared to the prior year. International sales decreased 5.0 percent during 2016 compared to 2015 primarily due to the strength of the U.S. dollar.
Cost of Goods Sold. Cost of goods sold increased 16.2 percent in 2016 compared to 2015. As a percentage of net sales, cost of goods sold increased to 79.1 percent in 2016, compared to 78.8 percent in 2015, primarily due to a model mix which included increased sales of our smaller models, partially offset by improved manufacturing efficiencies due to higher production volumes.
| 21 |
Selling, General and Administrative Expenses. Selling, general and administrative expenses increased 17.9 percent in 2016 compared to 2015 primarily due to an increase in warranty expense, coupled with costs that vary with sales, such as sales commissions. Selling, general and administrative expenses as a percentage of sales increased from 11.2 percent in 2015 to 11.4 percent in 2016. As a percentage of net sales, warranty expense increased to 1.7 percent in 2016, compared to 0.6 percent in 2015. This increase was primarily due to an increase in estimates for current and future warranty claims, coupled with net favorable adjustments that were recorded for estimated warranties in 2015. Selling, general and administrative expenses also includes a net gain of approximately $91 thousand that resulted from tax free gains on life insurance of approximately $751 thousand, partially offset by accelerated stock compensation amortization of approximately $660 thousand related to shares held by an executive officer that vested immediately upon his death.
Interest Income. Interest income declined to $355 thousand in 2016 compared to $420 thousand in 2015. Marine Products generates interest income primarily from investments in tax-exempt municipal obligations. The decrease was primarily due to net realized losses on the sale of marketable securities of $39 thousand during 2016 compared to net realized gains of $45 thousand during 2015.
Income Tax Provision. The income tax provision was $6.7 million in 2016 and 2015. The effective tax rate in 2016 was 28.5 percent compared to 31.7 percent in 2015. The effective rate decreased primarily due to certain beneficial tax differences generated from life insurance proceeds, favorable provision to return adjustments and a partial release of the deferred tax asset valuation allowance associated with certain of the Company’s state net operating losses.
Liquidity and Capital Resources
Cash and Cash Flows
The Company’s cash and cash equivalents were $7.7 million at December 31, 2017, $2.6 million at December 31, 2016 and $8.0 million at December 31, 2015. In addition, the aggregate of short-term and long-term marketable securities was $13.0 million at December 31, 2017, $9.3 million at December 31, 2016 and $35.0 million at December 31, 2015. The decline in marketable securities in 2016 was primarily due to the liquidation of a portion of the portfolio during the fourth quarter of 2016 to fund a Tender Offer for the Company’s common shares.
The following table sets forth the historical cash flows for the twelve months ended December 31:
| (in thousands) | 2017 | 2016 | 2015 | |||||||||
| Net cash provided by operating activities | $ | 29,639 | $ | 15,837 | $ | 16,044 | ||||||
| Net cash (used for) provided by investing activities | (6,549 | ) | 22,575 | (2,489 | ) | |||||||
| Net cash used for financing activities | (18,025 | ) | (43,779 | ) | (9,641 | ) | ||||||
2017
Cash provided by operating activities increased by $13.8 million in 2017 compared to 2016. This increase was primarily due to a net favorable change in working capital coupled with an increase in net income.
The major components of the net favorable change in working capital were as follows: an unfavorable change in accounts receivable of $2.1 million due to the timing of payments; a favorable change of $14.3 million in inventories primarily due to the timing of engine purchases to obtain purchase discounts; and a $3.0 million favorable change in other long term liabilities primarily due to employee deferrals related to the supplemental retirement plan.
Cash used for investing activities was $6.5 million in 2017 compared to $22.6 million provided by investing activities in 2016. The increase in cash used for investing activities in 2017 is primarily due to net purchases of marketable securities. The $22.6 million cash provided by investing activities in 2016 was primarily due to sales of marketable securities to fund the Tender Offer during the fourth quarter of 2016.
Cash used for financing activities decreased $25.8 million in 2017 primarily due to a decrease in cash paid for common stock purchases in the open market, partially offset by an increase in regular cash dividends and a $0.05 special dividend paid in the fourth quarter of 2017. Cash used for financing activities in 2016 includes $34.0 million related the purchase of 3,500,000 common shares as part of the Tender Offer completed in the fourth quarter of 2016.
2016
Cash provided by operating activities decreased by $0.2 million in 2016 compared to 2015. This decrease was primarily due to a net unfavorable change in working capital, partially offset by an increase in net income.
| 22 |
The major components of the net unfavorable change in working capital were as follows: a favorable change in accounts payable of $1.4 million due to the timing of payments; an unfavorable change of $6.0 million in inventories to support higher production levels in the current year; and a $1.8 million favorable change in other accrued expenses largely attributable to the timing of payments related to retail incentives and warranty claims.
Cash provided by investing activities was $22.6 million in 2016 compared to $2.5 million used for investing activities in 2015. The increase in cash used for investing activities is primarily due to increased sales of marketable securities, primarily used to fund the Tender Offer during the fourth quarter of 2016.
Cash used for financing activities increased $34.1 million in 2016 primarily due to the Tender Offer completed in the fourth quarter of 2016, partially offset by a decrease in open market share repurchases in 2016 compared to 2015. The Company paid a $0.04 per share special dividend in the fourth quarter of 2015.
Cash Requirements
Management expects that capital expenditures during 2018 will be approximately $2.1 million.
The Company participates in a multiple employer Retirement Income Plan, sponsored by RPC. During 2017, the Company did not make a cash contribution to this plan in order to achieve the Company’s funding objective. We expect that additional contributions by the Company to the Retirement Income Plan of approximately $100 thousand will be made in 2018.
On January 23, 2018, the Board of Directors approved a quarterly cash dividend of $0.10 per common share payable March 9, 2018 to stockholders of record at the close of business on February 9, 2018.
Marine Products expects to benefit from the Tax Reform enacted during the fourth quarter of 2017. Marine Products estimates that its annual effective tax rate in 2018 will be in the low 20 percent range. Since Marine Products believes that it will generate continued positive financial results, the Company expects to benefit from this lower tax rate through increased earnings in 2018.
The Company has an agreement with one employee that provides for a monthly payment equal to 10 percent of profits (defined as pretax income before goodwill amortization and certain allocated corporate expenses).
In January 2008, the Board of Directors authorized an additional 3,000,000 shares that the Company may repurchase for a total aggregate authorization of 8,250,000 shares. The Company repurchased 345,678 shares in the open market during 2017. As of December 31, 2017, the Company has repurchased under this program a total of 5,736,948 shares in the open market and there are 2,513,052 shares that remain available for repurchase.
The Company has entered into agreements with third-party floor plan lenders where it has agreed, in the event of default by a dealer, to repurchase MPC boats repossessed from the dealer. These arrangements are subject to maximum repurchase amounts and the associated risk is mitigated by the value of the boats repurchased. There were no material repurchases of dealer inventory during 2017 or 2016. See further information regarding repurchase obligations in “NOTE 9: COMMITMENTS AND CONTINGENCIES” of the Consolidated Financial Statements.
The Company believes that the liquidity provided by its existing cash and cash equivalents, marketable securities, and cash expected to be generated from operations will provide sufficient capital to meet its requirements for at least the next twelve months. The Company’s decisions about the amount of cash to be used for investing and financing purposes are influenced by its capital position and the expected amount of cash to be provided by operations.
Contractual Obligations
The following table summarizes the Company’s contractual obligations as of December 31, 2017:
| Payments due by period | ||||||||||||||||||||
| Contractual Obligations (in thousands) | Total | Less than 1 year | 1-3 years | 3-5 years | More than 5 years | |||||||||||||||
| Long-term debt | $ | — | $ | — | $ | — | $ | — | $ | — | ||||||||||
| Capital lease obligation | — | — | — | — | — | |||||||||||||||
| Operating leases (1) | 562 | 347 | 215 | — | — | |||||||||||||||
| Purchase obligations (2) | — | — | — | — | — | |||||||||||||||
| Due to floor plan lenders (3) | — | — | — | — | — | |||||||||||||||
| Other long-term liabilities | — | — | — | — | — | |||||||||||||||
| Total | $ | 562 | $ | 347 | $ | 215 | $ | — | $ | — | ||||||||||
| (1) | Operating leases represent agreements for warehouse space, and various office and operating equipment. |
| (2) | As part of the normal course of business the Company enters into purchase commitments to manage its various operating needs. However, the Company does not have any obligations that are non-cancelable or subject to a penalty if canceled. |
| 23 |
| (3) | The Company has agreements with various third-party lenders where it guarantees varying amounts of debt for qualifying dealers on boats in dealer inventory. As of December 31, 2017, there are no payables outstanding to floor plan lenders. |
Fair Value Measurements
The Company’s assets and liabilities measured at fair value are classified in the fair value hierarchy (Level 1, 2 or 3) based on the inputs used for valuation. Assets and liabilities that are traded on an exchange with a quoted price are classified as Level 1. Assets and liabilities that are valued using significant observable inputs in addition to quoted market prices are classified as Level 2. The Company currently has no assets or liabilities measured on a recurring basis that are valued using unobservable inputs and therefore no assets or liabilities measured on a recurring basis are classified as Level 3. For defined benefit plan and Supplemental Executive Retirement Plan (“SERP”) investments measured at net asset value, the values are computed using inputs such as cost, discounted future cash flows, independent appraisals and market based comparable data or on net asset values calculated by the fund and not publicly available.
Off Balance Sheet Arrangements
To assist dealers in obtaining financing for the purchase of its boats for inventory, the Company has entered into agreements with various third-party floor plan lenders whereby the Company guarantees varying amounts of debt for qualifying dealers on boats in dealer inventory. The Company’s obligation under these guarantees becomes effective in the case of a default under the financing arrangement between the dealer and the third-party lender. The agreements typically provide for the return of all repossessed boats in “new and unused” condition subject to normal wear and tear, as defined, to the Company, in exchange for the Company’s assumption of specified percentages of the debt obligation on those boats, up to certain contractually determined dollar limits which vary by lender. There were no material repurchases of inventory under contractual agreements during 2017 or 2016.
Management continues to monitor the risk of additional defaults and resulting repurchase obligation based primarily upon information provided by the third-party floor plan lenders and to adjust the guarantee liability at the end of each reporting period based on information reasonably available at that time. As of December 31, 2017, the Company believes the fair value of its remaining guarantee liability is immaterial. See further information regarding repurchase obligations in “NOTE 9: COMMITMENTS AND CONTINGENCIES” of the Consolidated Financial Statements.
The Company currently has an agreement with one of the floor plan lenders whereby the contractual repurchase obligation is limited to a maximum of 16 percent of the average net receivables financed by the floor plan lender for dealers during the prior 12 month period, which was $12.2 million as of December 31, 2017. The Company has contractual repurchase agreements with additional lenders with an aggregate maximum repurchase obligation of approximately $6.6 million, with various expiration and cancellation terms of less than one year. Accordingly, the aggregate repurchase obligation with all financing institutions is approximately $18.8 million as of December 31, 2017. Although the Company has these agreements with financial institutions, in certain situations, the Company may decide for business reasons to repurchase boats in excess of these contractual amounts.
Related Party Transactions
In conjunction with its spin-off from RPC in 2001, the Company and RPC entered into various agreements that define the companies’ relationship after the spin-off.
The Transition Support Services Agreement provides for RPC to provide certain services, including financial reporting and income tax administration, acquisition assistance, etc., to Marine Products until the agreement is terminated by either party. Marine Products reimbursed RPC for its estimated allocable share of administrative costs incurred for services rendered on behalf of Marine Products totaling $849,000 in 2017, $739,000 in 2016, and $753,000 in 2015. The Company’s payable to RPC for these services was $47,000 as of December 31, 2017 and $60,000 as of December 31, 2016. All of the Company’s directors, except two, are also directors of RPC and all of the Company’s executive officers are employees of both the Company and RPC.
RPC and Marine Products own 50 percent each of a limited liability company called 255 RC, LLC that was created for the joint purchase and ownership of a corporate aircraft. The purchase of the aircraft was completed in January 2015, and the purchase was funded primarily by a $2,554,000 contribution by each company to 255 RC, LLC. Each of RPC and Marine Products is a party to an operating lease agreement with 255 RC, LLC for a period of five years. During 2017, Marine Products recorded certain net operating costs comprised of rent and an allocable share of fixed costs of approximately $157,000 for the corporate aircraft. The Company accounts for this investment using the equity method and its proportionate share of income or loss is recorded in selling, general and administrative expenses. As of December 31, 2017, the investment closely approximates the underlying equity in the net assets of 255 RC, LLC.
The Employee Benefits Agreement provides for, among other things, the Company’s employees to continue participating subsequent to the spin-off in two RPC sponsored benefit plans, specifically, the defined contribution 401(k) plan and the defined benefit retirement income plan.
| 24 |
A group that includes the Company’s Chairman of the Board, R. Randall Rollins and his brother Gary W. Rollins, who is also director of the Company, and certain companies under their control, controls in excess of fifty percent of the Company’s voting power.
Critical Accounting Policies
The consolidated financial statements are prepared in accordance with accounting principles generally accepted in the United States of America, which require significant judgment by management in selecting the appropriate assumptions for calculating accounting estimates. These judgments are based on our historical experience, terms of existing contracts, trends in the industry, and information available from other outside sources, as appropriate. Senior management has discussed the development, selection and disclosure of its critical accounting estimates with the Audit Committee of our Board of Directors. The Company believes that, of its significant accounting policies, the following may involve a higher degree of judgment and complexity.
Sales recognition - The Company sells its boats through its network of independent dealers. Sales orders used to plan production are firm indications of interest from dealers and are cancelable at any time, although historically very few orders are cancelled after they have been placed. The Company recognizes sales when all the following conditions are met: (1) a fully executed sales agreement exists, (2) the price of the boat is established, (3) the dealer takes delivery of the boat, and (4) collectability of the sales price is reasonably assured.
Sales incentives and discounts – The Company records incentives as a reduction of sales or as a cost of sales as appropriate. Using historical trends and management estimates, adjusted for current changes, the Company estimates the amount of incentives that will be paid in the future on boats sold and accrues an estimated liability. The Company offers various incentives that promote sales to dealers, and to a lesser extent, retail customers. These incentives are designed to encourage timely replenishment of dealer inventories after peak selling seasons, stabilize manufacturing volumes throughout the year, and improve production model mix. The dealer incentive programs are a combination of annual volume commitment discounts, and additional discounts at time of invoice for those dealers who do not finance their inventory through specified floor plan financing agreements. The annual dealer volume discounts are primarily based on July 1 through June 30 model year purchases. In addition, the Company offers at various times other time-specific or model-specific incentives.
The factors that complicate the calculation of the cost of these incentives are the ability to forecast sales of the Company and individual dealers, the volume and timing of inventory financed by specific dealers, identification of which boats have been sold subject to an incentive, and the estimated lag time between sales and payment of incentives. Settlement of the incentives generally occurs from three to twelve months after the sale. The Company regularly analyzes the historical incentive trends and makes adjustments to recorded liabilities for changes in trends and terms of incentive programs. Total cost of incentives recorded in net sales as a percentage of gross sales was 7.1 percent in 2017, 6.0 percent in 2016, and 6.8 percent in 2015. A 0.25 percentage point change in cost of incentives as a percentage of gross sales during 2017 would have increased or decreased net sales, gross margin and operating income by approximately $0.6 million.
Warranty costs -The Company records as part of selling, general and administrative expenses an experience based estimate of the future warranty costs to be incurred when sales are recognized. The Company evaluates its warranty obligation for each product line on a model year basis. The Company provides warranties against manufacturing defects for various components of the boats, primarily the fiberglass deck and hull, with warranty periods extending up to a lifetime. Warranty costs, if any, on other components of the boats are generally absorbed by the original component manufacturer. Warranty costs can vary depending upon the size and number of components in the boats sold, the pre-sale warranty claims, and the desired level of customer service. While we focus on high quality manufacturing programs and processes, including actively monitoring the quality of our component suppliers and managing the dealer and customer service warranty experience and reimbursements, our estimated warranty obligation is based upon the warranty terms and the Company’s enforcement of those terms over time, manufacturing defects or issues, repair costs, and the volume and mix of boat sales. The estimate of warranty costs is regularly analyzed and is adjusted based on several factors including the actual claims that occur. Warranty expense as a percentage of net sales was 1.3 percent in 2017, 1.7 percent in 2016, and 0.6 percent in 2015. The decrease in warranty expense in 2017 was primarily due to an improvement in warranty claims experience, coupled with net favorable adjustments for warranty provisions for prior years that were recorded in 2017. A 0.10 percentage point increase in the estimated warranty expense as a percentage of net sales during 2017 would have increased selling, general and administrative expenses and reduced operating income by approximately $0.3 million.
Income taxes - The effective income tax rate was 35.6 percent in 2017, 28.5 percent in 2016, and 31.8 percent in 2015. The effective tax rates vary due to changes in estimates of future taxable income, fluctuations in the tax jurisdictions in which the earnings and deductions are realized, variations in the relationship of tax-exempt income or losses to income before taxes and favorable or unfavorable adjustments to estimated tax liabilities related to proposed or probable assessments. As a result, the effective tax rate may fluctuate significantly on a quarterly or annual basis. The effective tax rate for 2017 includes detrimental adjustments related to the Tax Cuts and Jobs Act, enacted on December 22, 2017.
| 25 |
The Company establishes a valuation allowance against the carrying value of deferred tax assets when it is determined that it is more likely than not that the asset will not be realized through future taxable income. Such amounts are charged to earnings in the period the determination is made. Likewise, if it is later determined that it is more likely than not that the net deferred tax assets would be realized, the applicable portion of the previously provided valuation allowance is reversed. The Company considers future market growth, forecasted earnings, future taxable income, the mix of earnings in the jurisdictions in which the Company operates, and prudent and feasible tax planning strategies in determining the need for a valuation allowance.
The Company calculates the current and deferred tax provision based on estimates and assumptions that could differ from the actual results reflected in income tax returns filed during the subsequent year. Adjustments based on filed tax returns are recorded when identified, which is generally in the third quarter of the subsequent year for U.S. federal and state provisions. Deferred tax liabilities and assets are determined based on the differences between the financial and tax bases of assets and liabilities using enacted tax rates in effect in the year the differences are expected to reverse. The newly enacted Tax Cuts and Jobs Act required the revaluation of our deferred tax assets and liabilities to reflect the change in Federal income tax rates from 35 percent to 21 percent. The Company’s net deferred tax asset as of December 31, 2017 has been reduced through a discrete income tax provision adjustment of $1.7 million related to this rate change.
The amount of income taxes the Company pays is subject to ongoing audits by federal and state tax authorities, which often result in proposed assessments. Our estimate for the potential outcome for any uncertain tax issue is highly judgmental. The Company believes it has adequately provided for any reasonably foreseeable outcome related to these matters. However, future results may include favorable or unfavorable adjustments to estimated tax liabilities in the period the assessments are made or resolved or when statutes of limitation on potential assessments expire. Additionally, the jurisdictions in which earnings or deductions are realized may differ from current estimates.
Impact of Recent Accounting Pronouncements:
During the year ended December 31, 2017, the Financial Accounting Standards Board (FASB) issued the following Accounting Standards Updates (ASUs):
Recently Adopted Accounting Pronouncements:
| · | Accounting Standards Update (ASU) No. 2015-11, Inventory (Topic 330): Simplifying the Measurement of Inventory. Current requirements are to measure inventory at the lower of cost or market. Market could be replacement cost, net realizable value, or net realizable value less an approximated normal profit margin. These amendments allow inventory to be measured at lower of cost or net realizable value and eliminates the market requirement. Net realizable value is the estimated selling price in the ordinary course of business, less reasonably predictable costs of completion, disposal, and transportation. The Company adopted these provisions in the first quarter of 2017 on a prospective basis. The adoption of these provisions did not have a material impact on the Company’s consolidated financial statements. |
| · | ASU No. 2016-09, Compensation —Stock Compensation (Topic 718): Improvements to Employee Share-Based Payment Accounting. The amendments simplify several aspects of the accounting for share-based payment award transactions, requiring excess tax benefits and deficiencies to be recognized as a component of income tax expense rather than equity. This guidance also requires excess tax benefits and deficiencies to be presented as an operating activity on the statement of cash flows and allows an entity to make an accounting policy election to either estimate expected forfeitures or to account for them as they occur. The Company will continue to estimate expected forfeitures. The Company adopted these provisions in the first quarter of 2017 on a prospective basis. See Notes on Stock-Based Compensation and Income Taxes for the effect of adoption on the financial statements. |
Recently Issued Accounting Pronouncements Not Yet Adopted:
To be adopted in 2018:
REVENUE RECOGNITION:
In May 2014, the Financial Accounting Standards Board ("FASB") issued Accounting Standards Update (ASU) No. 2014-09, Revenue from Contracts with Customers (Topic 606). The provisions of this ASU require entities to recognize revenue to depict transfer of promised goods or services to customers in an amount that reflects the consideration to which the entity expects to be entitled in exchange for those goods or services. The standard creates a five step model that requires companies to exercise judgment when considering the terms of a contract and all relevant facts and circumstances. The standard allows for either a full retrospective adoption in which the standard is applied to all of the periods presented, or a modified retrospective adoption in which the standard is applied only to the most current period presented in the financial statements with a cumulative-effect adjustment reflected in retained earnings. The standard also requires expanded disclosures regarding the qualitative and quantitative information of an entity's nature, amount, timing and uncertainty of revenue and cash flows arising from contracts with customers. This new revenue recognition standard will be effective for annual reporting periods beginning after December 15, 2017, including interim periods within that reporting period.
| 26 |
Current Status of implementation:
The Company has completed a comprehensive review of a representative sample of contracts with customers. As part of planning for the adoption of this new accounting standard, the Company has prepared technical accounting memorandums, drafted new formal accounting policies, evaluated the impact of the standard will have on our control environment, and is currently working on refining required disclosures. The Company adopted the standard on January 1, 2018 using the modified retrospective method and the cumulative-effect adjustment to retained earnings upon adoption is immaterial. However, the revenue specific disclosures will be significantly expanded beginning in 2018.
Other pronouncements:
| · | ASU No. 2016-01, Financial Instruments – Overall (Subtopic 825-10): Recognition and Measurement of Financial Assets and Financial Liabilities. The amendments make targeted improvements to existing U.S. GAAP and affects accounting for equity investments and financial instruments and liabilities and related disclosures. The amendments are effective starting in the first quarter of 2018, with early adoption permitted for certain provisions. The Company does not expect the adoption of these provisions to have a material impact on its consolidated financial statements. |
| · | ASU No. 2016-15, Statement of Cash Flows (Topic 230): Classification of Certain Cash Receipts and Cash Payments. The amendments provide guidance in the presentation and classification of certain cash receipts and cash payments in the statement of cash flows including debt prepayment or debt extinguishment costs, contingent consideration payments made after a business combination, proceeds from the settlement of insurance claims, proceeds from the settlement of corporate-owned life insurance policies, and distributions received from equity method investees. The amendments are effective starting in the first quarter of 2018 with early adoption permitted. The amendments should be applied using a retrospective transition method to each period presented. If it is impracticable to apply the amendments retrospectively for some of the issues, the amendments for those issues would be applied prospectively as of the earliest date practicable. The Company does not expect the adoption of these provisions to have a material impact on its consolidated financial statements. |
| · | ASU No. 2016-16, Income Taxes (Topic 740): Intra-Entity Transfers of Assets Other Than Inventory. The amendments require an entity to recognize the income tax consequences of an intra-entity transfer of an asset other than inventory when the transfer occurs. The amendments eliminate the exception for an intra-entity transfer of an asset other than inventory. Two common examples of assets included in the scope of the amendments are intellectual property and property, plant, and equipment. The amendments do not include new disclosure requirements; however, existing disclosure requirements might be applicable when accounting for the current and deferred income taxes for an intra-entity transfer of an asset other than inventory. The amendments are effective starting in the first quarter of 2018 with early adoption permitted. The amendments are required to be applied on a modified retrospective basis through a cumulative-effect adjustment directly to retained earnings as of the beginning of the period of adoption. The Company does not expect the adoption of these provisions to have a material impact on its consolidated financial statements. |
| · | ASU No. 2017-01, Business Combinations (Topic 805): Clarifying the Definition of a Business. The amendments are intended to help companies and other organizations evaluate whether transactions should be accounted for as acquisitions (or disposals) of assets or businesses. The definition of a business affects many areas of accounting including acquisitions, disposals, goodwill, and consolidation. The amendments provide a more robust framework to use in determining when a set of assets and activities is a business. They also provide more consistency in applying the guidance, reduce the costs of application, and make the definition of a business more operable. The amendments are effective beginning in the first quarter of 2018 with early application permitted under certain circumstances. The Company expects to adopt these provisions as it completes future acquisitions and does not expect the adoption to have a material impact on its financial statements. |
| · | ASU No. 2017-09 —Compensation —Stock Compensation (Topic 718): Scope of Modification Accounting. The provisions are applicable when there are changes to the terms or conditions of a share-based payment award. The amendments require an entity to apply modification accounting for the effects of changes to the terms and conditions of a share-based payment award unless certain conditions including fair value, vesting conditions and classification are met. The amendments are effective beginning in the first quarter of 2018 with early application permitted under certain circumstances. The Company does not expect the adoption of these provisions to have a material impact on its consolidated financial statements. |
| 27 |
To be adopted in 2019 and later:
| · | ASU No. 2016-02 —Leases (Topic 842). Under the new guidance, lessees will need to recognize a right-of-use asset and a lease liability for virtually all of their leases (other than leases that meet the definition of a short-term lease), at the commencement of the lease term. The liability will be equal to the present value of lease payments. The asset will be based on the liability, subject to adjustment, such as for initial direct costs. The amendments in this standard are effective for fiscal years beginning after December 15, 2018, including interim periods within those fiscal years. Early application is permitted. Lessees (for capital and operating leases) and lessors (for sales-type, direct financing, and operating leases) must apply a modified retrospective transition approach for leases existing at, or entered into after, the beginning of the earliest comparative period presented in the financial statements. Lessees and lessors may not apply a full retrospective transition approach. The Company is currently evaluating the impact of adopting these provisions on its consolidated financial statements. |
| · | ASU No. 2016-13, Financial Instruments —Credit Losses (Topic 326): Measurement of Credit Losses on Financial Instruments. The amendments require the credit losses on available-for-sale debt securities and purchased financial assets with credit deterioration should presented as an allowance rather than a write-down. It also allows recording of credit loss reversals in current period net income. The amendments are effective starting in the first quarter of 2020 with early application permitted a year earlier. The Company is currently evaluating the impact of adopting these provisions on its consolidated financial statements. |
| · | ASU No. 2017-04 —Intangibles —Goodwill and Other (Topic 350): Simplifying the Test for Goodwill Impairment. To simplify the subsequent measurement of goodwill, the amendments eliminate Step 2 from the goodwill impairment test. The annual, or interim, goodwill impairment test is performed by comparing the fair value of a reporting unit with its carrying amount. An impairment charge should be recognized for the amount by which the carrying amount exceeds the reporting unit’s fair value; however, the loss recognized should not exceed the total amount of goodwill allocated to that reporting unit. The amendments are effective for annual or any interim goodwill impairment tests beginning in 2020 applied on a prospective basis. Early adoption is permitted for interim or annual goodwill impairment tests performed on testing dates after January 1, 2017. The Company is currently evaluating the impact of adopting these provisions on its consolidated financial statements. |
| · | ASU No. 2017-08 —Receivables —Nonrefundable Fees and Other Costs (Subtopic 310-20): Premium Amortization on Purchased Callable Debt Securities. The amendments shorten the amortization period for certain callable debt securities held at a premium and requires the premium to be amortized to the earliest call date. However, the amendments do not require an accounting change for securities held at a discount; the discount continues to be amortized to maturity. The amendments are effective starting in the first quarter of 2019 with early application permitted. The amendments are to be applied on a modified retrospective basis through a cumulative-effect adjustment directly to retained earnings as of the beginning of the period of adoption. The entity is required to provide disclosures about a change in accounting principle in the period of adoption. The Company is currently evaluating the impact of adopting these provisions on its consolidated financial statements. |
Item 7A. Quantitative and Qualitative Disclosures About Market Risk
Marine Products holds no derivative financial instruments which could expose the Company to significant market risk. Marine Products maintains an investment portfolio, comprised primarily of municipal debt and corporate debt securities, which are subject to interest rate risk exposure. This risk is managed through conservative policies to invest in high-quality obligations. Marine Products has performed an interest rate sensitivity analysis using a duration model over the near term with a 10 percent change in interest rates. Marine Products’ portfolio is not subject to material interest rate risk exposure based on this analysis. Marine Products does not expect any material changes in market risk exposures or how those risks are managed.
| 28 |
MANAGEMENT’S REPORT ON INTERNAL CONTROL OVER FINANCIAL REPORTING
To the Stockholders of Marine Products Corporation:
The management of Marine Products Corporation is responsible for establishing and maintaining adequate internal control over financial reporting for the Company. Marine Products Corporation maintains a system of internal accounting controls designed to provide reasonable assurance, at a reasonable cost, that assets are safeguarded against loss or unauthorized use and that the financial records are adequate and can be relied upon to produce financial statements in accordance with accounting principles generally accepted in the United States of America. The internal control system is augmented by written policies and procedures, an internal audit program and the selection and training of qualified personnel. This system includes policies that require adherence to ethical business standards and compliance with all applicable laws and regulations.
There are inherent limitations to the effectiveness of any controls system. A controls system, no matter how well designed and operated, can provide only reasonable, not absolute, assurance that the objectives of the controls system are met. Also, no evaluation of controls can provide absolute assurance that all control issues and any instances of fraud, if any, within the Company will be detected. Further, the design of a controls system must reflect the fact that there are resource constraints, and the benefits of controls must be considered relative to their costs. The Company intends to continually improve and refine its internal controls.
Under the supervision and with the participation of our management, including our principal executive officer and principal financial officer, we conducted an evaluation of the effectiveness of the design and operations of our internal control over financial reporting, as of December 31, 2017 based on criteria established in 2013 Internal Control—Integrated Framework issued by the Committee of Sponsoring Organizations of the Treadway Commission. Based on this evaluation, management’s assessment is that Marine Products Corporation maintained effective internal control over financial reporting as of December 31, 2017.
The independent registered public accounting firm, Grant Thornton LLP, has audited the consolidated financial statements as of and for the year ended December 31, 2017, and has also issued their report on the effectiveness of the Company’s internal control over financial reporting, included in this report on page 30.
| /s/ Richard A. Hubbell | /s/ Ben M. Palmer | |
| Richard A. Hubbell | Ben M. Palmer | |
| President and Chief Executive Officer | Vice President, Chief Financial Officer and Treasurer |
Atlanta, Georgia
February 28, 2018
| 29 |
REPORT OF INDEPENDENT REGISTERED PUBLIC ACCOUNTING FIRM
Board of Directors and Stockholders
Marine Products Corporation
Opinion on internal control over financial reporting
We have audited the internal control over financial reporting of Marine Products Corporation (a Delaware corporation) and subsidiaries (the “Company”) as of December 31, 2017, based on criteria established in the 2013 Internal Control—Integrated Framework issued by the Committee of Sponsoring Organizations of the Treadway Commission (“COSO”). In our opinion, the Company maintained, in all material respects, effective internal control over financial reporting as of December 31, 2017, based on criteria established in the 2013 Internal Control—Integrated Framework issued by COSO.
We also have audited, in accordance with the standards of the Public Company Accounting Oversight Board (United States) (“PCAOB”), the consolidated financial statements of the Company as of and for the year ended December 31, 2017, and our report dated February 28, 2018 expressed an unqualified opinion on those financial statements.
Basis for opinion
The Company’s management is responsible for maintaining effective internal control over financial reporting and for its assessment of the effectiveness of internal control over financial reporting, included in the accompanying Management’s Report on Internal Control over Financial Reporting. Our responsibility is to express an opinion on the Company’s internal control over financial reporting based on our audit. We are a public accounting firm registered with the PCAOB and are required to be independent with respect to the Company in accordance with the U.S. federal securities laws and the applicable rules and regulations of the Securities and Exchange Commission and the PCAOB.
We conducted our audit in accordance with the standards of the PCAOB. Those standards require that we plan and perform the audit to obtain reasonable assurance about whether effective internal control over financial reporting was maintained in all material respects. Our audit included obtaining an understanding of internal control over financial reporting, assessing the risk that a material weakness exists, testing and evaluating the design and operating effectiveness of internal control based on the assessed risk, and performing such other procedures as we considered necessary in the circumstances. We believe that our audit provides a reasonable basis for our opinion.
Definition and limitations of internal control over financial reporting
A company’s internal control over financial reporting is a process designed to provide reasonable assurance regarding the reliability of financial reporting and the preparation of financial statements for external purposes in accordance with generally accepted accounting principles. A company’s internal control over financial reporting includes those policies and procedures that (1) pertain to the maintenance of records that, in reasonable detail, accurately and fairly reflect the transactions and dispositions of the assets of the company; (2) provide reasonable assurance that transactions are recorded as necessary to permit preparation of financial statements in accordance with generally accepted accounting principles, and that receipts and expenditures of the company are being made only in accordance with authorizations of management and directors of the company; and (3) provide reasonable assurance regarding prevention or timely detection of unauthorized acquisition, use, or disposition of the company’s assets that could have a material effect on the financial statements.
Because of its inherent limitations, internal control over financial reporting may not prevent or detect misstatements. Also, projections of any evaluation of effectiveness to future periods are subject to the risk that controls may become inadequate because of changes in conditions, or that the degree of compliance with the policies or procedures may deteriorate.
| /s/ GRANT THORNTON LLP | |
| Atlanta, Georgia | |
| February 28, 2018 |
| 30 |
REPORT OF INDEPENDENT REGISTERED PUBLIC ACCOUNTING FIRM
Board of Directors and Stockholders
Marine Products Corporation
Opinion on the financial statements
We have audited the accompanying consolidated balance sheets of Marine Products Corporation (a Delaware corporation) and subsidiaries (the “Company”) as of December 31, 2017 and 2016, the related consolidated statements of operations, comprehensive income, stockholders’ equity, and cash flows for each of the three years in the period ended December 31, 2017, and the related notes and schedule (collectively referred to as the “financial statements”). In our opinion, the financial statements present fairly, in all material respects, the financial position of the Company as of December 31, 2017 and 2016, and the results of its operations and its cash flows for each of the three years in the period ended December 31, 2017, in conformity with accounting principles generally accepted in the United States of America.
We also have audited, in accordance with the standards of the Public Company Accounting Oversight Board (United States) (“PCAOB”), the Company’s internal control over financial reporting as of December 31, 2017, based on criteria established in the 2013 Internal Control—Integrated Framework issued by the Committee of Sponsoring Organizations of the Treadway Commission (“COSO”), and our report dated February 28, 2018 expressed an unqualified opinion.
Basis for opinion
These financial statements are the responsibility of the Company’s management. Our responsibility is to express an opinion on the Company’s financial statements based on our audits. We are a public accounting firm registered with the PCAOB and are required to be independent with respect to the Company in accordance with the U.S. federal securities laws and the applicable rules and regulations of the Securities and Exchange Commission and the PCAOB.
We conducted our audits in accordance with the standards of the PCAOB. Those standards require that we plan and perform the audit to obtain reasonable assurance about whether the financial statements are free of material misstatement, whether due to error or fraud. Our audits included performing procedures to assess the risks of material misstatement of the financial statements, whether due to error or fraud, and performing procedures that respond to those risks. Such procedures included examining, on a test basis, evidence supporting the amounts and disclosures in the financial statements. Our audits also included evaluating the accounting principles used and significant estimates made by management, as well as evaluating the overall presentation of the financial statements. We believe that our audits provide a reasonable basis for our opinion.
| /s/ GRANT THORNTON LLP | |
| We have served as the Company’s auditor since 2004. | |
| Atlanta, Georgia | |
| February 28, 2018 |
| 31 |
Item 8. Financial Statements and Supplementary Data
CONSOLIDATED BALANCE SHEETS
MARINE PRODUCTS CORPORATION AND SUBSIDIARIES
(in thousands except share information)
| December 31, | 2017 | 2016 | ||||||
| ASSETS | ||||||||
| Cash and cash equivalents | $ | 7,684 | $ | 2,619 | ||||
| Marketable securities | 2,636 | 4,109 | ||||||
| Accounts receivable, net | 3,051 | 1,087 | ||||||
| Inventories | 38,006 | 42,488 | ||||||
| Income taxes receivable | 714 | 29 | ||||||
| Prepaid expenses and other current assets | 2,096 | 1,823 | ||||||
| Current assets | 54,187 | 52,155 | ||||||
| Property, plant and equipment, net | 14,218 | 13,334 | ||||||
| Goodwill | 3,308 | 3,308 | ||||||
| Other intangibles, net | 465 | 465 | ||||||
| Marketable securities | 10,395 | 5,221 | ||||||
| Deferred income taxes | 3,649 | 5,278 | ||||||
| Other assets | 9,678 | 8,766 | ||||||
| Total assets | $ | 95,900 | $ | 88,527 | ||||
| LIABILITIES AND STOCKHOLDERS’ EQUITY | ||||||||
| Liabilities | ||||||||
| Accounts payable | $ | 5,362 | $ | 5,163 | ||||
| Accrued expenses and other liabilities | 13,999 | 12,239 | ||||||
| Current liabilities | 19,361 | 17,402 | ||||||
| Pension liabilities | 6,732 | 5,614 | ||||||
| Other long-term liabilities | 203 | 66 | ||||||
| Total liabilities | 26,296 | 23,082 | ||||||
| Commitments and contingencies (Note 9) | ||||||||
| Stockholders’ Equity | ||||||||
| Preferred stock, $0.10 par value, 1,000,000 shares authorized, none issued | — | — | ||||||
| Common stock, $0.10 par value, 74,000,000 shares authorized, issued and outstanding – 34,572,157 shares in 2017, 34,855,082 shares in 2016 | 3,457 | 3,486 | ||||||
| Capital in excess of par value | — | — | ||||||
| Retained earnings | 68,127 | 64,141 | ||||||
| Accumulated other comprehensive loss | (1,980 | ) | (2,182 | ) | ||||
| Total stockholders’ equity | 69,604 | 65,445 | ||||||
| Total liabilities and stockholders’ equity | $ | 95,900 | $ | 88,527 | ||||
The accompanying notes are an integral part of these statements.
| 32 |
CONSOLIDATED STATEMENTS OF OPERATIONS
MARINE PRODUCTS CORPORATION AND SUBSIDIARIES
(in thousands except per share data)
| Years ended December 31, | 2017 | 2016 | 2015 | |||||||||
| Net sales | $ | 267,316 | $ | 241,330 | $ | 207,061 | ||||||
| Cost of goods sold | 208,296 | 190,863 | 163,261 | |||||||||
| Gross profit | 59,020 | 50,467 | 43,800 | |||||||||
| Selling, general and administrative expenses | 29,261 | 27,415 | 23,249 | |||||||||
| Operating income | 29,759 | 23,052 | 20,551 | |||||||||
| Interest income | 229 | 355 | 420 | |||||||||
| Income before income taxes | 29,988 | 23,407 | 20,971 | |||||||||
| Income tax provision | 10,688 | 6,662 | 6,665 | |||||||||
| Net income | $ | 19,300 | $ | 16,745 | $ | 14,306 | ||||||
| EARNINGS PER SHARE | ||||||||||||
| Basic | $ | 0.55 | $ | 0.44 | $ | 0.39 | ||||||
| Diluted | 0.55 | 0.44 | 0.39 | |||||||||
| Dividends paid per share | $ | 0.33 | $ | 0.24 | $ | 0.20 | ||||||
The accompanying notes are an integral part of these statements.
| 33 |
CONSOLIDATED STATEMENTS OF COMPREHENSIVE
INCOME
MARINE PRODUCTS CORPORATION AND SUBSIDIARIES
(in thousands)
| Years ended December 31, | 2017 | 2016 | 2015 | |||||||||
| Net income | $ | 19,300 | $ | 16,745 | $ | 14,306 | ||||||
| Other comprehensive income, net of taxes: | ||||||||||||
| Pension adjustment | 215 | (252 | ) | 125 | ||||||||
| Unrealized loss on securities, net of reclassification adjustments | (13 | ) | (29 | ) | (57 | ) | ||||||
| Comprehensive income | $ | 19,502 | $ | 16,464 | $ | 14,374 | ||||||
The accompanying notes are an integral part of these statements.
| 34 |
CONSOLIDATED STATEMENTS OF STOCKHOLDERS’
EQUITY
MARINE PRODUCTS CORPORATION AND SUBSIDIARIES
(in thousands)
| Three Years Ended | Common Stock | Capital in Excess of |
Retained | Accumulated Other Comprehensive |
||||||||||||||||||||
| December 31, 2017 | Shares | Amount | Par Value | Earnings | Income (Loss) | Total | ||||||||||||||||||
| Balance, December 31, 2014 | 38,131 | $ | 3,813 | $ | 3,895 | $ | 77,755 | $ | (1,969 | ) | $ | 83,494 | ||||||||||||
| Stock issued for stock incentive plans, net | 317 | 32 | 1,953 | — | — | 1,985 | ||||||||||||||||||
| Stock purchased and retired | (336 | ) | (34 | ) | (2,225 | ) | — | — | (2,259 | ) | ||||||||||||||
| Net income | — | — | — | 14,306 | — | 14,306 | ||||||||||||||||||
| Pension adjustment, net of taxes | — | — | — | — | 125 | 125 | ||||||||||||||||||
| Unrealized loss on securities, net of taxes and reclassification adjustments | — | — | — | — | (57 | ) | (57 | ) | ||||||||||||||||
| Excess tax benefits for share-based payments | — | — | 256 | — | — | 256 | ||||||||||||||||||
| Dividends declared | — | — | — | (7,638 | ) | (7,638 | ) | |||||||||||||||||
| Balance, December 31, 2015 | 38,112 | $ | 3,811 | $ | 3,879 | $ | 84,423 | $ | (1,901 | ) | $ | 90,212 | ||||||||||||
| Stock issued for stock incentive plans, net | 369 | 37 | 2,511 | — | — | 2,548 | ||||||||||||||||||
| Stock purchased and retired | (3,626 | ) | (362 | ) | (6,550 | ) | (27,825 | ) | — | (34,737 | ) | |||||||||||||
| Net income | — | — | — | 16,745 | — | 16,745 | ||||||||||||||||||
| Pension adjustment, net of taxes | — | — | — | — | (252 | ) | (252 | ) | ||||||||||||||||
| Unrealized loss on securities, net of taxes and reclassification adjustments | — | — | — | — | (29 | ) | (29 | ) | ||||||||||||||||
| Excess tax benefits for share-based payments | — | — | 160 | — | — | 160 | ||||||||||||||||||
| Dividends declared | — | — | — | (9,202 | ) | — | (9,202 | ) | ||||||||||||||||
| Balance, December 31, 2016 | 34,855 | $ | 3,486 | $ | — | $ | 64,141 | $ | (2,182 | ) | 65,445 | |||||||||||||
| Stock issued for stock incentive plans, net | 184 | 18 | 2,664 | — | — | 2,682 | ||||||||||||||||||
| Stock purchased and retired | (467 | ) | (47 | ) | (2,664 | ) | (3,810 | ) | — | (6,521 | ) | |||||||||||||
| Net income | — | — | — | 19,300 | — | 19,300 | ||||||||||||||||||
| Pension adjustment, net of taxes | — | — | — | — | 215 | 215 | ||||||||||||||||||
| Unrealized loss on securities, net of taxes and reclassification adjustments | — | — | — | — | (13 | ) | (13 | ) | ||||||||||||||||
| Dividends declared | — | — | — | (11,504 | ) | — | (11,504 | ) | ||||||||||||||||
| Balance, December 31, 2017 | 34,572 | $ | 3,457 | $ | — | $ | 68,127 | $ | (1,980 | ) | $ | 69,604 | ||||||||||||
The accompanying notes are an integral part of these statements.
| 35 |
CONSOLIDATED STATEMENTS OF CASH FLOWS
MARINE PRODUCTS CORPORATION AND SUBSIDIARIES
(in thousands)
| Years ended December 31, | 2017 | 2016 | 2015 | |||||||||
| OPERATING ACTIVITIES | ||||||||||||
| Net income | $ | 19,300 | $ | 16,745 | $ | 14,306 | ||||||
| Adjustments to reconcile net income to net cash provided by operating activities: | ||||||||||||
| Depreciation expense | 1,526 | 1,382 | 1,013 | |||||||||
| Gain on sale of equipment and property | (8 | ) | (103 | ) | (12 | ) | ||||||
| Amortization of premium related to marketable securities | 425 | 1,152 | 1,059 | |||||||||
| Stock-based compensation expense | 2,682 | 2,624 | 1,993 | |||||||||
| Excess tax benefits for share-based payments | — | (160 | ) | (256 | ) | |||||||
| Deferred income tax provision (benefit) | 1,519 | (862 | ) | 1,309 | ||||||||
| (Increase) decrease in assets: | ||||||||||||
| Accounts receivable | (1,964 | ) | 169 | 1,113 | ||||||||
| Inventories | 4,482 | (9,850 | ) | (3,819 | ) | |||||||
| Prepaid expenses and other current assets | (273 | ) | 296 | (413 | ) | |||||||
| Income taxes receivable | (685 | ) | 791 | (441 | ) | |||||||
| Other non-current assets | (912 | ) | 1,266 | (139 | ) | |||||||
| Increase (decrease) in liabilities: | ||||||||||||
| Accounts payable | 199 | 1,482 | 104 | |||||||||
| Other accrued expenses | 1,760 | 2,282 | 486 | |||||||||
| Other long-term liabilities | 1,588 | (1,377 | ) | (259 | ) | |||||||
| Net cash provided by operating activities | 29,639 | 15,837 | 16,044 | |||||||||
| INVESTING ACTIVITIES | ||||||||||||
| Capital expenditures | (2,410 | ) | (1,940 | ) | (3,878 | ) | ||||||
| Proceeds from sale of assets | 8 | 88 | 6 | |||||||||
| Sales and maturities of marketable securities | 18,067 | 52,519 | 17,659 | |||||||||
| Purchases of marketable securities | (22,214 | ) | (28,092 | ) | (16,276 | ) | ||||||
| Net cash (used for) provided by investing activities | (6,549 | ) | 22,575 | (2,489 | ) | |||||||
| FINANCING ACTIVITIES | ||||||||||||
| Payment of dividends | (11,504 | ) | (9,202 | ) | (7,638 | ) | ||||||
| Cash paid for common stock purchased and retired | (6,521 | ) | (34,737 | ) | (2,259 | ) | ||||||
| Excess tax benefits for share-based payments | — | 160 | 256 | |||||||||
| Net cash used for financing activities | (18,025 | ) | (43,779 | ) | (9,641 | ) | ||||||
| Net increase (decrease) in cash and cash equivalents | 5,065 | (5,367 | ) | 3,914 | ||||||||
| Cash and cash equivalents at beginning of year | 2,619 | 7,986 | 4,072 | |||||||||
| Cash and cash equivalents at end of year | $ | 7,684 | $ | 2,619 | $ | 7,986 | ||||||
The accompanying notes are an integral part of these statements.
| 36 |
NOTES TO CONSOLIDATED FINANCIAL STATEMENTS
Marine Products Corporation and Subsidiaries
Years ended December 31, 2017, 2016 and 2015
NOTE 1: SIGNIFICANT ACCOUNTING POLICIES
Basis of Consolidation and Presentation — The consolidated financial statements include the accounts of Marine Products Corporation (a Delaware corporation) and its wholly owned subsidiaries (“Marine Products” or the “Company”). Marine Products, through Chaparral Boats, Inc. (“Chaparral”) and Robalo Acquisition Company LLC (“Robalo”), operates as a manufacturer of fiberglass powerboats and related products and services to a broad range of consumers worldwide.
The consolidated financial statements included herein may not necessarily be indicative of the future results of operations, financial position and cash flows of Marine Products.
The Company has only one reportable segment — its Powerboat Manufacturing business. The Company’s results of operations and its financial condition are not significantly reliant upon any single customer or product model. No single dealer accounted for more than 10 percent of net sales during 2017, 2016 or 2015. Net sales to the Company’s international dealers were approximately $17 million in 2017, $21 million in 2016, and $22 million in 2015.
Nature of Operations — Marine Products is principally engaged in manufacturing powerboats and providing related products and services. Marine Products distributes fiberglass recreational boats through a network of domestic and international independent dealers.
Common Stock — Marine Products is authorized to issue 74,000,000 shares of common stock, $0.10 par value. Holders of common stock are entitled to receive dividends when, as, and if declared by our Board of Directors out of legally available funds. Each share of common stock is entitled to one vote on all matters submitted to a vote of stockholders. Holders of common stock do not have cumulative voting rights. In the event of any liquidation, dissolution or winding up of the Company, holders of common stock are entitled to ratable distribution of the remaining assets available for distribution to stockholders.
Preferred Stock — Marine Products is authorized to issue up to 1,000,000 shares of preferred stock, $0.10 par value. As of December 31, 2017, there were no shares of preferred stock issued. The Board of Directors is authorized, subject to any limitations prescribed by law, to provide for the issuance of preferred stock as a class without series or, if so determined from time to time, in one or more series, and by filing a certificate pursuant to the applicable laws of the state of Delaware and to fix the designations, powers, preferences and rights, exchangeability for shares of any other class or classes of stock. Any preferred stock to be issued could rank prior to the common stock with respect to dividend rights and rights on liquidation.
Share Repurchases — The Company records the cost of share repurchases in stockholders’ equity as a reduction to common stock to the extent of par value of the shares acquired and the remainder is allocated to capital in excess of par value and retained earnings if capital in excess of par value is depleted. The Company tracks capital in excess of par value on a cumulative basis and for each reporting period, discloses the excess over capital in excess of par value as part of stock purchased and retired in the consolidated statements of stockholders’ equity.
Dividend — On January 23, 2018, the Board of Directors declared a 43 percent increase to the regular cash dividend from $0.07 per share to $0.10 per share payable March 9, 2018 to stockholders of record at the close of business on February 9, 2018. Subject to industry conditions and Marine Products’s earnings, financial condition, and other relevant factors, the Company expects to continue to pay regular quarterly cash dividends to common stockholders.
Use of Estimates in the Preparation of Financial Statements — The preparation of financial statements in conformity with accounting principles generally accepted in the United States of America requires management to make estimates and assumptions that affect the reported amounts of assets and liabilities and disclosure of contingent assets and liabilities at the date of the financial statements and the reported amounts of sales and expenses during the reporting period. Actual results could differ from those estimates. Significant estimates are used in the determination of sales incentives and discounts, warranty costs, and income taxes.
Sales Recognition — Marine Products recognizes sales when a fully executed agreement exists, prices are established, products are delivered to the dealer in the case of domestic dealers and collectability is reasonably assured. See “Deferred Revenue” below for recognition of sales to international dealers.
Deferred Revenue — Marine Products requires payment from international dealers and some domestic dealers prior to shipment of products to these dealers. Amounts received from these dealers toward the purchase of boats are classified as deferred revenue and recognized as sales when the products are shipped.
| 37 |
NOTES TO CONSOLIDATED FINANCIAL STATEMENTS
Marine Products Corporation and Subsidiaries
Years ended December 31, 2017, 2016 and 2015
Shipping and Handling Charges — The shipping and handling of the Company’s products to dealers is handled through a combination of third-party marine transporters and a company owned fleet of delivery trucks. Fees charged to customers for shipping and handling are included in net sales in the accompanying consolidated statements of operations and the related costs incurred by the Company are included in cost of goods sold.
Advertising — Advertising expenses are charged to expense during the period in which they are incurred. Expenses associated with product brochures and other inventoriable marketing materials are deferred and amortized over the related model year which approximates the consumption of these materials. As of December 31, 2017 and 2016, the Company had approximately $342,000 and $271,000 in prepaid expenses related to unamortized product brochure costs. Advertising expenses totaled approximately $2,305,000 in 2017, $2,545,000 in 2016 and $2,480,000 in 2015 and are recorded in selling, general and administrative expenses.
Sales Incentives and Discounts — Sales incentives including dealer discounts and retail sales promotions are provided for and recorded as a reduction of sales or as a cost of sales as appropriate. The Company records the estimated cost of these incentives at the later of the recognition of the related sales or the announcement of a promotional program.
Cash and Cash Equivalents — Highly liquid investments with original maturities of three months or less when acquired are considered to be cash equivalents. The Company maintains its cash in bank accounts, which at times, may exceed federally insured limits.
Marketable Securities — Marine Products maintains investments at a large, well-capitalized financial institution. Marine Products’ investment policy does not allow investment in any securities rated less than “investment grade” by national rating services.
Management determines the appropriate classification of debt securities at the time of purchase and re-evaluates such designations as of each balance sheet date. Debt securities are classified as available-for-sale because the Company does not have the intent to hold the securities to maturity. Available-for-sale securities are stated at their fair values, with the unrealized gains and losses, net of taxes, reported as a separate component of stockholders’ equity. The cost of securities sold is based on the specific identification method. Realized gains and losses, declines in value judged to be other than temporary, interest and dividends on available-for-sale securities are included in interest income. Net realized gains (losses) on marketable securities totaled $30,000 in 2017, ($39,000) in 2016 and $45,000 in 2015. Of the total gains (losses) realized, reclassification from other comprehensive income totaled approximately $30,000 in 2017, ($39,000) in 2016, and $45,000 in 2015. There were no gross unrealized gains on marketable securities as of December 31, 2017 and $4,000 as of December 31, 2016. Gross unrealized losses on marketable securities totaled $70,000 as of December 31, 2017 and $53,000 as of December 31, 2016. The amortized cost basis, fair value and net unrealized loss of the available-for-sale securities are as follows:
| December 31, | 2017 | 2016 | ||||||||||||||||||||||
| Type of Securities | Amortized Cost Basis | Fair Value | Net Unrealized Loss | Amortized Cost Basis | Fair Value | Net Unrealized Loss | ||||||||||||||||||
| (in thousands) | ||||||||||||||||||||||||
| Municipal Obligations | $ | 13,101 | $ | 13,031 | $ | (70 | ) | $ | 9,379 | $ | 9,330 | $ | (49 | ) | ||||||||||
| Corporate Obligations | — | — | — | — | — | — | ||||||||||||||||||
| Total | $ | 13,101 | $ | 13,031 | $ | (70 | ) | $ | 9,379 | $ | 9,330 | $ | (49 | ) | ||||||||||
Municipal debt obligations consist primarily of municipal notes rated AA- or higher ranging in maturity from less than one year to over 10 years. Investments with remaining maturities of less than 12 months are considered to be current marketable securities. Investments with remaining maturities greater than 12 months are considered to be non-current marketable securities. The Company’s non-current marketable securities as of December 31, 2017 are scheduled to mature between 2019 and 2047.
| 38 |
NOTES TO CONSOLIDATED FINANCIAL STATEMENTS
Marine Products Corporation and Subsidiaries
Years ended December 31, 2017, 2016 and 2015
Accounts Receivable — The majority of the Company’s accounts receivable is due from dealers located in markets throughout the United States. Approximately 74 percent of Marine Products’ domestic shipments are made pursuant to “floor plan financing” programs in which Marine Products’ subsidiaries participate on behalf of their dealers with various major third-party financing institutions. Under these arrangements, a dealer establishes lines of credit with one or more of these third-party lenders for the purchase of boat inventory for sales to retail customers in their show room or during boat show exhibitions. When a dealer purchases and takes delivery of a boat pursuant to a floor plan financing arrangement, it draws against its line of credit and the lender pays the invoice cost of the boat directly to Marine Products within approximately ten business days. The Company determines its allowance for doubtful accounts by considering a number of factors, including the length of time trade accounts receivable are past due, the Company’s previous loss history, the customer’s current ability to pay its obligation to the Company, and the condition of the general economy and the industry as a whole. The Company writes-off accounts receivable when they become uncollectible, and payments subsequently received on such receivables are credited to the allowance.
Inventories — Inventories are stated at the lower of cost (determined on a first-in, first-out basis) and net realizable value. When evidence exists that the net realizable value of inventory is lower than its cost, the Company recognizes the difference as a loss in earnings in the period in which it occurs. Net realizable value is the estimated selling price in the ordinary course of business, less reasonably predictable costs of completion, disposal, and transportation.
Property, Plant and Equipment — Property, plant and equipment is carried at cost. Depreciation is provided principally on a straight-line basis over the estimated useful lives of the assets. The cost of assets retired or otherwise disposed of and the related accumulated depreciation are eliminated from the accounts in the year of disposal with the resulting gain or loss credited or charged to income. Expenditures for additions, major renewals, and betterments are capitalized while expenditures for routine maintenance and repairs are expensed as incurred. Depreciation expense on operating equipment used in production is included in cost of goods sold in the accompanying consolidated statements of operations. All other depreciation is included in selling, general and administrative expenses in the accompanying consolidated statements of operations. Property, plant and equipment are reviewed for impairment when indicators of impairment exist.
Goodwill and Other Intangibles — Intangibles consist primarily of goodwill and trade names related to businesses acquired. Goodwill represents the excess of the purchase price over the fair value of net assets of businesses acquired. The carrying amount of goodwill was $3,308,000 as of December 31, 2017 and 2016. The Company evaluates whether goodwill is impaired by comparing its market capitalization based on its closing stock price (Level 1 input) to the book value of its equity on the annual evaluation date. The Company also periodically performs a valuation of its trade names and has concluded that the fair value of these assets is not impaired. Based on these evaluations, the Company concluded that no impairment of its goodwill or trade names has occurred for the years ended December 31, 2017, 2016 and 2015.
Investments — The Company maintains certain securities in the non-qualified Supplemental Executive Retirement Plan that have been classified as trading. See Note 10 for further information regarding these securities.
Warranty Costs — The Company provides a lifetime limited structural hull warranty, a five-year limited structural deck warranty, and a transferable one-year limited warranty to the original owner. Warranties for additional items are provided for periods of one to five years and are not transferrable. Additionally, as it relates to the first subsequent owner, a five-year transferrable hull warranty and the remainder of the original one-year limited warranty on certain components are available. The five-year transferable hull warranty terminates five years after the date of the original retail purchase. Claim costs related to components are generally absorbed by the original component manufacturer. The Company accrues for estimated future warranty costs at the time of the sale based on its historical claims experience. An analysis of the warranty accruals for the years ended December 31, 2017 and 2016 is as follows:
| (in thousands) | 2017 | 2016 | ||||||
| Balance at beginning of year | $ | 4,629 | $ | 3,405 | ||||
| Less: Payments made during the year | (2,599 | ) | (2,856 | ) | ||||
| Add: Warranty provision for the current year | 3,436 | 3,527 | ||||||
| Changes to warranty provision for prior years | (93 | ) | 553 | |||||
| Balance at end of year | $ | 5,373 | $ | 4,629 | ||||
Insurance Accruals — The Company fully insures its risks related to general liability, product liability, workers’ compensation, and vehicle liability, whereas the health insurance plan is self-funded up to a maximum annual claim amount for each covered employee and related dependents. The estimated cost of claims under the self-insurance program is accrued as the claims are incurred and may subsequently be revised based on developments relating to such claims.
| 39 |
NOTES TO CONSOLIDATED FINANCIAL STATEMENTS
Marine Products Corporation and Subsidiaries
Years ended December 31, 2017, 2016 and 2015
Research and Development Costs — The Company expenses research and development costs for new products and components as incurred. Research and development costs are included in selling, general and administrative expenses and totaled $960,000 in 2017, $858,000 in 2016, and $663,000 in 2015.
Repurchase Obligations — The Company has entered into agreements with third-party floor plan lenders where it has agreed, in the event of default by the dealer, to repurchase MPC boats repossessed from the dealer. These arrangements are subject to maximum repurchase amounts and the associated risk is mitigated by the value of the boats repurchased. The Company accrues estimated losses when a loss, due primarily to the default of one of our dealers, is determined to be probable and the amount of the loss is reasonably estimable.
Income Taxes — Deferred tax liabilities and assets are determined based on the difference between the financial and tax bases of assets and liabilities using enacted tax rates in effect for the year in which the differences are expected to reverse. The newly enacted Tax Cuts and Jobs Act required the revaluation of our deferred tax assets and liabilities to reflect the change in Federal income tax rates from 35 percent to 21 percent. The Company’s net deferred tax asset as of December 31, 2017 has been reduced through a discrete income tax provision adjustment of $1.7 million related to this rate change. The Company establishes a valuation allowance against the carrying value of deferred tax assets if the Company concludes that it is more likely than not that the asset will not be realized through future taxable income.
Stock-Based Compensation — Stock-based compensation expense is recognized for all share-based payment awards, net of an estimated forfeiture rate. Thus, compensation cost is amortized for those shares expected to vest on a straight-line basis over the requisite service period of the award. See Note 10 for additional information.
Earnings per Share — Basic and diluted earnings per share are computed by dividing net income by the weighted average number of shares outstanding during the respective periods. In addition, the Company has periodically issued share-based payment awards that contain non-forfeitable rights to dividends and are therefore considered participating securities. See Note 10 for further information on restricted stock granted to employees.
Restricted shares of common stock (participating securities) outstanding and a reconciliation of weighted average shares outstanding is as follows:
| (In thousands) | 2017 | 2016 | 2015 | |||||||||
| Net income available for stockholders | $ | 19,300 | $ | 16,745 | $ | 14,306 | ||||||
| Less: Adjustments for earnings attributable to participating securities | (595 | ) | (535 | ) | (464 | ) | ||||||
| Net income used in calculating earnings per share | $ | 18,705 | $ | 16,210 | $ | 13,842 | ||||||
| Weighted average shares outstanding (including participating securities) | 34,843 | 37,857 | 36,955 | |||||||||
| Adjustment for participating securities | (1,091 | ) | (1,224 | ) | (1,252 | ) | ||||||
| Shares used in calculating basic earnings per share | 33,752 | 36,633 | 35,703 | |||||||||
| Dilutive effect of stock based awards | — | — | 192 | |||||||||
| Shares used in calculating diluted earnings per share | 33,752 | 36,633 | 35,895 | |||||||||
Fair Value of Financial Instruments — The Company’s financial instruments consist primarily of cash and cash equivalents, accounts receivable, accounts payable and marketable securities. The carrying value of cash and cash equivalents, accounts receivable and accounts payable approximate their fair values because of the short-term nature of such instruments. The Company’s marketable securities are classified as available-for-sale securities with the exception of investments held in the non-qualified Supplemental Executive Retirement Plan (“SERP”) which are classified as trading securities. All of these securities are carried at fair value in the accompanying consolidated balance sheets. See Note 8 for further information regarding the fair value measurement of assets and liabilities.
Concentration of Suppliers — The Company has only four suppliers for the three types of engines it purchases. This concentration of suppliers could impact our sales and profitability in the event of a sudden interruption in the delivery of these engines.
| 40 |
NOTES TO CONSOLIDATED FINANCIAL STATEMENTS
Marine Products Corporation and Subsidiaries
Years ended December 31, 2017, 2016 and 2015
Recent Accounting Pronouncements
During the year ended December 31, 2017, the FASB issued the following Accounting Standards Updates (ASUs):
Recently Adopted Accounting Pronouncements:
| · | Accounting Standards Update (ASU) No. 2015-11, Inventory (Topic 330): Simplifying the Measurement of Inventory. Current requirements are to measure inventory at the lower of cost or market. Market could be replacement cost, net realizable value, or net realizable value less an approximated normal profit margin. These amendments allow inventory to be measured at lower of cost or net realizable value and eliminates the market requirement. Net realizable value is the estimated selling price in the ordinary course of business, less reasonably predictable costs of completion, disposal, and transportation. The Company adopted these provisions in the first quarter of 2017 on a prospective basis. The adoption of these provisions did not have a material impact on the Company’s consolidated financial statements. |
| · | ASU No. 2016-09, Compensation —Stock Compensation (Topic 718): Improvements to Employee Share-Based Payment Accounting. The amendments simplify several aspects of the accounting for share-based payment award transactions, requiring excess tax benefits and deficiencies to be recognized as a component of income tax expense rather than equity. This guidance also requires excess tax benefits and deficiencies to be presented as an operating activity on the statement of cash flows and allows an entity to make an accounting policy election to either estimate expected forfeitures or to account for them as they occur. The Company will continue to estimate expected forfeitures. The Company adopted these provisions in the first quarter of 2017 on a prospective basis. See Notes on Stock-Based Compensation and Income Taxes for the effect of adoption on the financial statements. |
Recently Issued Accounting Pronouncements Not Yet Adopted:
To be adopted in 2018:
REVENUE RECOGNITION:
In May 2014, the Financial Accounting Standards Board ("FASB") issued Accounting Standards Update (ASU) No. 2014-09, Revenue from Contracts with Customers (Topic 606). The provisions of this ASU require entities to recognize revenue to depict transfer of promised goods or services to customers in an amount that reflects the consideration to which the entity expects to be entitled in exchange for those goods or services. The standard creates a five step model that requires companies to exercise judgment when considering the terms of a contract and all relevant facts and circumstances. The standard allows for either a full retrospective adoption in which the standard is applied to all of the periods presented, or a modified retrospective adoption in which the standard is applied only to the most current period presented in the financial statements with a cumulative-effect adjustment reflected in retained earnings. The standard also requires expanded disclosures regarding the qualitative and quantitative information of an entity's nature, amount, timing and uncertainty of revenue and cash flows arising from contracts with customers. This new revenue recognition standard will be effective for annual reporting periods beginning after December 15, 2017, including interim periods within that reporting period.
Current Status of implementation:
The Company has completed a comprehensive review of a representative sample of contracts with customers. As part of planning for the adoption of this new accounting standard, the Company has prepared technical accounting memorandums, drafted new formal accounting policies, evaluated the impact of the standard will have on our control environment, and is currently working on refining required disclosures. The Company adopted the standard on January 1, 2018 using the modified retrospective method and the cumulative-effect adjustment to retained earnings upon adoption is immaterial. However, the revenue specific disclosures will be significantly expanded beginning in 2018.
Other Pronouncements:
| · | ASU No. 2016-01, Financial Instruments – Overall (Subtopic 825-10): Recognition and Measurement of Financial Assets and Financial Liabilities. The amendments make targeted improvements to existing U.S. GAAP and affects accounting for equity investments and financial instruments and liabilities and related disclosures. The amendments are effective starting in the first quarter of 2018, with early adoption permitted for certain provisions. The Company does not expect the adoption of these provisions to have a material impact on its consolidated financial statements. |
| 41 |
NOTES TO CONSOLIDATED FINANCIAL STATEMENTS
Marine Products Corporation and Subsidiaries
Years ended December 31, 2017, 2016 and 2015
| · | ASU No. 2016-15, Statement of Cash Flows (Topic 230): Classification of Certain Cash Receipts and Cash Payments. The amendments provide guidance in the presentation and classification of certain cash receipts and cash payments in the statement of cash flows including debt prepayment or debt extinguishment costs, contingent consideration payments made after a business combination, proceeds from the settlement of insurance claims, proceeds from the settlement of corporate-owned life insurance policies, and distributions received from equity method investees. The amendments are effective starting in the first quarter of 2018 with early adoption permitted. The amendments should be applied using a retrospective transition method to each period presented. If it is impracticable to apply the amendments retrospectively for some of the issues, the amendments for those issues would be applied prospectively as of the earliest date practicable. The Company does not expect the adoption of these provisions to have a material impact on its consolidated financial statements. |
| · | ASU No. 2016-16, Income Taxes (Topic 740): Intra-Entity Transfers of Assets Other Than Inventory. The amendments require an entity to recognize the income tax consequences of an intra-entity transfer of an asset other than inventory when the transfer occurs. The amendments eliminate the exception for an intra-entity transfer of an asset other than inventory. Two common examples of assets included in the scope of the amendments are intellectual property and property, plant, and equipment. The amendments do not include new disclosure requirements; however, existing disclosure requirements might be applicable when accounting for the current and deferred income taxes for an intra-entity transfer of an asset other than inventory. The amendments are effective starting in the first quarter of 2018 with early adoption permitted. The amendments are required to be applied on a modified retrospective basis through a cumulative-effect adjustment directly to retained earnings as of the beginning of the period of adoption. The Company does not expect the adoption of these provisions to have a material impact on its consolidated financial statements. |
| · | ASU No. 2017-01, Business Combinations (Topic 805): Clarifying the Definition of a Business. The amendments are intended to help companies and other organizations evaluate whether transactions should be accounted for as acquisitions (or disposals) of assets or businesses. The definition of a business affects many areas of accounting including acquisitions, disposals, goodwill, and consolidation. The amendments provide a more robust framework to use in determining when a set of assets and activities is a business. They also provide more consistency in applying the guidance, reduce the costs of application, and make the definition of a business more operable. The amendments are effective beginning in the first quarter of 2018 with early application permitted under certain circumstances. The Company expects to adopt these provisions as it completes future acquisitions and does not expect the adoption to have a material impact on its financial statements. |
| · | ASU No. 2017-09 —Compensation —Stock Compensation (Topic 718): Scope of Modification Accounting. The provisions are applicable when there are changes to the terms or conditions of a share-based payment award. The amendments require an entity to apply modification accounting for the effects of changes to the terms and conditions of a share-based payment award unless certain conditions including fair value, vesting conditions and classification are met. The amendments are effective beginning in the first quarter of 2018 with early application permitted under certain circumstances. The Company does not expect the adoption of these provisions to have a material impact on its consolidated financial statements. |
To be adopted in 2019 and later:
| · | ASU No. 2016-02 —Leases (Topic 842). Under the new guidance, lessees will need to recognize a right-of-use asset and a lease liability for virtually all of their leases (other than leases that meet the definition of a short-term lease), at the commencement of the lease term. The liability will be equal to the present value of lease payments. The asset will be based on the liability, subject to adjustment, such as for initial direct costs. The amendments in this standard are effective for fiscal years beginning after December 15, 2018, including interim periods within those fiscal years. Early application is permitted. Lessees (for capital and operating leases) and lessors (for sales-type, direct financing, and operating leases) must apply a modified retrospective transition approach for leases existing at, or entered into after, the beginning of the earliest comparative period presented in the financial statements. Lessees and lessors may not apply a full retrospective transition approach. The Company is currently evaluating the impact of adopting these provisions on its consolidated financial statements. |
| · | ASU No. 2016-13, Financial Instruments —Credit Losses (Topic 326): Measurement of Credit Losses on Financial Instruments. The amendments require the credit losses on available-for-sale debt securities and purchased financial assets with credit deterioration should presented as an allowance rather than a write-down. It also allows recording of credit loss reversals in current period net income. The amendments are effective starting in the first quarter of 2020 with early application permitted a year earlier. The Company is currently evaluating the impact of adopting these provisions on its consolidated financial statements. |
| 42 |
NOTES TO
CONSOLIDATED FINANCIAL STATEMENTS
Marine Products Corporation and Subsidiaries
Years ended December 31, 2017, 2016 and 2015
| · | ASU No. 2017-04 —Intangibles —Goodwill and Other (Topic 350): Simplifying the Test for Goodwill Impairment. To simplify the subsequent measurement of goodwill, the amendments eliminate Step 2 from the goodwill impairment test. The annual, or interim, goodwill impairment test is performed by comparing the fair value of a reporting unit with its carrying amount. An impairment charge should be recognized for the amount by which the carrying amount exceeds the reporting unit’s fair value; however, the loss recognized should not exceed the total amount of goodwill allocated to that reporting unit. The amendments are effective for annual or any interim goodwill impairment tests beginning in 2020 applied on a prospective basis. Early adoption is permitted for interim or annual goodwill impairment tests performed on testing dates after January 1, 2017. The Company is currently evaluating the impact of adopting these provisions on its consolidated financial statements. |
| · | ASU No. 2017-08 —Receivables —Nonrefundable Fees and Other Costs (Subtopic 310-20): Premium Amortization on Purchased Callable Debt Securities. The amendments shorten the amortization period for certain callable debt securities held at a premium and requires the premium to be amortized to the earliest call date. However, the amendments do not require an accounting change for securities held at a discount; the discount continues to be amortized to maturity. The amendments are effective starting in the first quarter of 2019 with early application permitted. The amendments are to be applied on a modified retrospective basis through a cumulative-effect adjustment directly to retained earnings as of the beginning of the period of adoption. The entity is required to provide disclosures about a change in accounting principle in the period of adoption. The Company is currently evaluating the impact of adopting these provisions on its consolidated financial statements. |
NOTE 2: ACCOUNTS RECEIVABLE
Accounts receivable consist of the following:
| December 31, | 2017 | 2016 | ||||||
| (in thousands) | ||||||||
| Trade receivables | $ | 1,377 | $ | 744 | ||||
| Other | 1,699 | 368 | ||||||
| Total | 3,076 | 1,112 | ||||||
| Less: allowance for doubtful accounts | (25 | ) | (25 | ) | ||||
| Net accounts receivable | $ | 3,051 | $ | 1,087 | ||||
Trade receivables consist primarily of balances related to the sales of boats which are shipped pursuant to “floor-plan financing” programs with qualified lenders. Other receivables consist primarily of rebate receivables from various suppliers. Changes in the Company’s allowance for doubtful accounts are disclosed in Schedule II on page 61 of this report.
NOTE 3: INVENTORIES
Inventories consist of the following:
| December 31, | 2017 | 2016 | ||||||
| (in thousands) | ||||||||
| Raw materials | $ | 20,116 | $ | 26,106 | ||||
| Work in process | 8,300 | 9,007 | ||||||
| Finished goods | 9,590 | 7,375 | ||||||
| Total inventories | $ | 38,006 | $ | 42,488 | ||||
NOTE 4: PROPERTY, PLANT AND EQUIPMENT
Property, plant and equipment are presented at cost, net of accumulated depreciation, and consist of the following:
| December 31, | Estimated Useful Lives | 2017 | 2016 | |||||||
| (in thousands) | ||||||||||
| Land | N/A | $ | 878 | $ | 878 | |||||
| Buildings | 7-40 | 19,611 | 18,314 | |||||||
| Operating equipment and property | 3-15 | 10,360 | 10,070 | |||||||
| Furniture and fixtures | 5-7 | 1,488 | 1,535 | |||||||
| Vehicles | 5-10 | 6,276 | 6,007 | |||||||
| Gross property, plant and equipment | 38,613 | 36,804 | ||||||||
| Less: accumulated depreciation | (24,395 | ) | (23,470 | ) | ||||||
| Net property, plant and equipment | $ | 14,218 | $ | 13,334 | ||||||
| 43 |
NOTES TO CONSOLIDATED FINANCIAL STATEMENTS
Marine Products Corporation and Subsidiaries
Years ended December 31, 2017, 2016 and 2015
Depreciation expense was $1,526,000 in 2017, $1,382,000 in 2016 and $1,013,000 in 2015. The Company’s accounts payable for purchases of property and equipment was immaterial as of December 31, 2017, December 31, 2016 and December 31, 2015.
NOTE 5: ACCRUED EXPENSES AND OTHER LIABILITIES
Accrued expenses and other liabilities consist of the following:
| December 31, | 2017 | 2016 | ||||||
| (in thousands) | ||||||||
| Accrued payroll and related expenses | $ | 3,116 | $ | 2,381 | ||||
| Accrued sales incentives and discounts | 3,969 | 4,155 | ||||||
| Accrued warranty costs | 5,373 | 4,629 | ||||||
| Deferred revenue | 864 | 416 | ||||||
| Other | 677 | 658 | ||||||
| Total accrued expenses and other liabilities | $ | 13,999 | $ | 12,239 | ||||
NOTE 6: INCOME TAXES
On December 22, 2017, the President signed into law the Tax Cuts and Jobs Act (“the Act”), which took effect on January 1, 2018. Some notable provisions of the Act include a reduction of the corporate income tax rate from 35 percent to 21 percent, a one-time transition tax on un-repatriated foreign earnings and profits, adjustments to deductible compensation paid to our executive officers, and 100 percent bonus depreciation on capital expenditures. Under the accounting rules, companies are required to recognize the effects of changes in tax laws and tax rates on deferred tax assets and liabilities in the period in which the new legislation is enacted. As a result, as of December 31, 2017, the Company recorded a discrete tax provision adjustment of $1.7 million from revaluing the Company’s net deferred tax assets. The Company did not record any adjustments related to un-repatriated foreign earnings and profits because the Company is primarily U.S. based and has no significant foreign entities or activities. We believe that the adjustments resulting from these components of the Act are complete as of December 31, 2017.
However, the Company has not completed its accounting for the income tax effects of the Act as it pertains to the deduction for executive compensation, including the impact for compensation that is paid pursuant to a binding contract that would have been deductible under the prior rules. Due to the complexity of this provision, additional time is needed to further analyze our executive compensation program, exceptions under the binding contract rule, the impact of vesting of restricted stock grants, dividends, and bonuses.
The ultimate impact of the Act may differ from the recorded amounts due to changes in our interpretations and assumptions, as well as additional regulatory guidance that may be issued. We expect to complete the accounting for tax reform with the completion of our 2017 Federal income tax return, expected to be complete by the third quarter 2018.
Also in 2017, the Company adopted the amendments of ASU 2016-09 that required excess tax benefits and deficiencies related to the vesting of restricted stock to be recognized as a component of income tax expense rather than in equity. This resulted in a beneficial discrete adjustment of approximately $718 thousand to the provision for income taxes in 2017.
The following table lists the components of the provision for income taxes:
| Years ended December 31, | 2017 | 2016 | 2015 | |||||||||
| (in thousands) | ||||||||||||
| Current provision: | ||||||||||||
| Federal | $ | 8,623 | $ | 7,263 | $ | 5,056 | ||||||
| State | 546 | 261 | 300 | |||||||||
| Deferred (benefit) provision: | ||||||||||||
| Federal | 1,511 | (507 | ) | 1,256 | ||||||||
| State | 8 | (355 | ) | 53 | ||||||||
| Total income tax provision | $ | 10,688 | $ | 6,662 | $ | 6,665 | ||||||
| 44 |
NOTES TO CONSOLIDATED FINANCIAL STATEMENTS
Marine Products Corporation and Subsidiaries
Years ended December 31, 2017, 2016 and 2015
A reconciliation between the federal statutory rate and Marine Products’ effective tax rate is as follows:
| Years ended December 31, | 2017 | 2016 | 2015 | |||||||||
| Federal statutory rate | 35.0 | % | 35.0 | % | 35.0 | % | ||||||
| State income taxes, net of federal benefit | 1.1 | 0.7 | 0.8 | |||||||||
| Research and experimentation credit | (0.8 | ) | (1.0 | ) | (1.1 | ) | ||||||
| Tax-exempt interest | (0.2 | ) | (0.4 | ) | (0.4 | ) | ||||||
| Tax-exempt gain on SERP assets | (0.6 | ) | (1.3 | ) | (0.1 | ) | ||||||
| Manufacturing deduction | (3.0 | ) | (3.0 | ) | (2.5 | ) | ||||||
| Change in valuation allowance | (0.1 | ) | (1.4 | ) | — | |||||||
| Adjustments related to the Act | 5.6 | — | — | |||||||||
| Adjustments related to vesting of restricted stock | (2.4 | ) | — | — | ||||||||
| Other | 1.0 | (0.1 | ) | — | ||||||||
| Effective tax rate | 35.6 | % | 28.5 | % | 31.7 | % | ||||||
Significant components of the Company’s deferred tax assets and liabilities are as follows:
| December 31, | 2017 | 2016 | ||||||
| (in thousands) | ||||||||
| Deferred tax assets: | ||||||||
| Warranty costs | $ | 1,182 | $ | 1,643 | ||||
| Sales incentives and discounts | 348 | 725 | ||||||
| Stock-based compensation | 611 | 1,015 | ||||||
| Pension | 1,406 | 1,993 | ||||||
| Uniform capitalization | 47 | 298 | ||||||
| All others | 479 | 489 | ||||||
| State credits and NOL’s | 6,124 | 5,129 | ||||||
| Valuation allowance | (5,447 | ) | (4,525 | ) | ||||
| Total deferred tax assets | 4,750 | 6,767 | ||||||
| Deferred tax liabilities: | ||||||||
| Depreciation and amortization expense | (781 | ) | (1,103 | ) | ||||
| Basis differences in joint venture | (320 | ) | (386 | ) | ||||
| Net deferred tax assets | $ | 3,649 | $ | 5,278 | ||||
Total net income tax payments were $9,733,000 in 2017, $6,546,000 in 2016, and $5,797,000 in 2015. As of December 31, 2017, the Company had net operating loss carry forwards related to state income taxes of approximately $14.3 million and other state credits of approximately $6.9 million (gross) that will expire between 2018 and 2035. In 2016, the Company released all valuation allowances related to net operating loss carryforwards due to implemented tax planning strategies. The Company has a valuation allowance against the corresponding deferred tax asset on all state tax credits because the Company does not expect to utilize them.
The Company’s policy is to record interest and penalties related to income tax matters as income tax expense. Accrued interest and penalties were immaterial as of December 31, 2017 and 2016.
During 2017, the Company recognized an increase in its liability for unrecognized tax benefits related primarily to state income taxes, settlements, and voluntary disclosure agreements. The liability, if recognized, would affect our effective rate. A reconciliation of the beginning and ending amount of unrecognized tax benefits is as follows:
| 2017 | 2016 | |||||||
| Balance at January 1 | $ | 15,000 | $ | 15,000 | ||||
| Additions based on tax positions related to the current year | 12,000 | — | ||||||
| Additions for tax positions of prior years | 216,000 | — | ||||||
| Balance at December 31 | $ | 243,000 | $ | 15,000 | ||||
| 45 |
NOTES TO CONSOLIDATED FINANCIAL STATEMENTS
Marine Products Corporation and Subsidiaries
Years ended December 31, 2017, 2016 and 2015
It is reasonably possible that the amount of the unrecognized benefits with respect to our unrecognized tax positions will increase or decrease in the next 12 months. These changes may be the result of, among other things, state tax settlements under voluntary disclosure agreements. However, quantification of an estimated range cannot be made at this time.
The Company and its subsidiaries are subject to U.S. federal and state income tax in multiple jurisdictions. In many cases our uncertain tax positions are related to tax years that remain open and subject to examination by the relevant taxing authorities. The Company’s 2014 through 2017 tax years remain open to examination. Additional years may be open to the extent attributes are being carried forward to an open year.
NOTE 7: ACCUMULATED OTHER COMPREHENSIVE LOSS
Accumulated other comprehensive loss consists of the following:
| Pension Adjustment | Unrealized Loss on Securities | Total | ||||||||||
| (in thousands) | ||||||||||||
| Balance at December 31, 2015 | $ | (1,899 | ) | $ | (2 | ) | $ | (1,901 | ) | |||
| Change during 2016: | ||||||||||||
| Before-tax amount | (474 | ) | (83 | ) | (557 | ) | ||||||
| Tax benefit | 168 | 29 | 197 | |||||||||
| Reclassification adjustment, net of taxes | ||||||||||||
| Amortization of net loss | 54 | — | 54 | |||||||||
| Net realized loss | — | 25 | 25 | |||||||||
| Total activity in 2016 | (252 | ) | (29 | ) | (281 | ) | ||||||
| Balance at December 31, 2016 | $ | (2,151 | ) | $ | (31 | ) | $ | (2,182 | ) | |||
| Change during 2017: | ||||||||||||
| Before-tax amount | 241 | 9 | 250 | |||||||||
| Tax expense | (85 | ) | (3 | ) | (88 | ) | ||||||
| Reclassification adjustment, net of taxes | ||||||||||||
| Amortization of net loss | 59 | — | 59 | |||||||||
| Net realized gain | — | (19 | ) | (19 | ) | |||||||
| Total activity in 2017 | 215 | (13 | ) | 202 | ||||||||
| Balance at December 31, 2017 | $ | (1,936 | ) | $ | (44 | ) | $ | (1,980 | ) | |||
NOTE 8: FAIR VALUE MEASUREMENTS
The various inputs used to measure assets at fair value establish a hierarchy that distinguishes between assumptions based on market data (observable inputs) and the Company’s assumptions (unobservable inputs). The hierarchy consists of three broad levels as follows:
| 1. | Level 1 – Quoted market prices in active markets for identical assets or liabilities. |
| 2. | Level 2 – Quoted prices for similar instruments in active markets, quoted prices for identical or similar instruments in markets that are not active, and model-based valuation techniques for which all significant assumptions are observable in the market or can be corroborated by observable market data for substantially the full term of the assets or liabilities. |
| 3. | Level 3 – Unobservable inputs developed using the Company’s estimates and assumptions, which reflect those that market participants would use. |
| 46 |
NOTES TO CONSOLIDATED FINANCIAL STATEMENTS
Marine Products Corporation and Subsidiaries
Years ended December 31, 2017, 2016 and 2015
The following table summarizes the valuation of financial instruments measured at fair value on a recurring basis on the balance sheet as of December 31, 2017 and 2016:
| Fair Value Measurements at December 31, 2017 with: | ||||||||||||||||
| (in thousands) | Total | Quoted prices in active markets for identical assets | Significant other observable inputs | Significant unobservable inputs | ||||||||||||
| (Level 1) | (Level 2) | (Level 3) | ||||||||||||||
| Assets: | ||||||||||||||||
| Available-for-sale securities: | ||||||||||||||||
| Municipal Obligations | $ | 13,031 | $ | — | $ | 13,031 | $ | — | ||||||||
| Corporate Obligations | — | — | — | — | ||||||||||||
| $ | 13,031 | $ | — | $ | 13,031 | $ | — | |||||||||
| Investments measured at Net Asset Value- Trading securities | $ | 6,031 | ||||||||||||||
| Fair Value Measurements at December 31, 2016 with: | ||||||||||||||||
| (in thousands) | Total | Quoted prices in active markets for identical assets | Significant other | Significant unobservable inputs | ||||||||||||
| (Level 1) | (Level 2) | (Level 3) | ||||||||||||||
| Assets: | ||||||||||||||||
| Available-for-sale securities: | ||||||||||||||||
| Municipal Obligations | $ | 9,330 | $ | — | $ | 9,330 | $ | — | ||||||||
| Corporate Obligations | — | — | — | — | ||||||||||||
| $ | 9,330 | $ | — | $ | 9,330 | $ | — | |||||||||
| Investments measured at Net Asset Value- Trading securities | $ | 5,547 | ||||||||||||||
The Company determines the fair value of the marketable securities that are available-for-sale through quoted prices for similar instruments in active markets or quoted prices for identical or similar instruments in markets that are not active. The trading securities are comprised of SERP assets, as described in Note 10, and are recorded primarily at their net cash surrender values calculated using their net asset values, which approximate fair value, as provided by the issuing insurance company. Significant observable inputs, in addition to quoted market prices, were used to value the trading securities. The Company’s policy is to recognize transfers between levels at the beginning of quarterly reporting periods. For the year ended December 31, 2017 there were no significant transfers in or out of levels 1, 2 or 3.
The carrying amount of other financial instruments reported in the balance sheet for current assets and current liabilities approximate their fair values because of the short-term maturity of these instruments. The Company currently does not use the fair value option to measure any of its existing financial instruments and has not determined whether or not it will elect this option for financial instruments it may acquire in the future.
NOTE 9: COMMITMENTS AND CONTINGENCIES
Lawsuits — The Company is a defendant in certain lawsuits which allege that plaintiffs have been damaged as a result of the use of the Company’s products. The Company is vigorously contesting these actions. Management, after consultation with legal counsel, is of the opinion that the outcome of these lawsuits will not have a material adverse effect on the financial position, results of operations or liquidity of Marine Products.
Dealer Floor Plan Financing — To assist dealers in obtaining financing for the purchase of its boats for inventory, the Company has entered into agreements with various dealers and selected third-party floor plan lenders to guarantee varying amounts of qualifying dealers’ debt obligations. The Company’s obligation under these guarantees becomes effective in the case of a default under the financing arrangement between the dealer and the third party lender. The agreements provide for the return of repossessed boats to the Company in new and unused condition subject to normal wear and tear as defined, in exchange for the Company’s assumption of specified percentages of the debt obligation on those boats, up to certain contractually determined dollar limits by lender.
There were no material repurchases of inventory under contractual agreements during 2017 or 2016. Management continues to monitor the risk of additional defaults and resulting repurchase obligations based in part on information provided by the third-party floor plan lenders and will adjust the guarantee liability at the end of each reporting period based on information reasonably available at that time.
| 47 |
NOTES TO CONSOLIDATED FINANCIAL STATEMENTS
Marine Products Corporation and Subsidiaries
Years ended December 31, 2017, 2016 and 2015
The Company currently has an agreement with one of the floor plan lenders whereby the contractual repurchase limit is to not exceed 16 percent of the average net receivables financed by the floor plan lender for dealers during the prior 12 month period, which was $12.2 million as of December 31, 2017. The Company has contractual repurchase agreements with additional lenders with an aggregate maximum repurchase obligation of approximately $6.6 million, with various expiration and cancellation terms of less than one year, for an aggregate repurchase obligation with all financing institutions of approximately $18.8 million as of December 31, 2017. This repurchase obligation risk is mitigated by the value of the boat repurchased.
Minimum annual operating lease obligations with terms in excess of one year, in effect at December 31, 2017, are summarized in the following table:
| (in thousands) | ||||
| 2018 | $ | 347 | ||
| 2019 | 213 | |||
| 2020 | 2 | |||
| 2021 | — | |||
| 2022 | — | |||
| Thereafter | — | |||
| Total rental commitments | $ | 562 | ||
Total rent expense charged to operations was approximately $353,000 in 2017, $352,000 in 2016 and $135,000 in 2015.
Income Taxes — The amount of income taxes the Company pays is subject to ongoing audits by federal and state tax authorities, which often result in proposed assessments. Other long-term liabilities included the Company’s estimated liabilities for these probable assessments and totaled approximately $191,000 as of December 31, 2017 compared to $43,000 as of December 31, 2016.
Employment Agreements — The Company has an agreement with one employee, that provides for a monthly payment to the employee equal to 10 percent of profits (defined as pretax income before goodwill adjustments and certain allocated corporate expenses) in addition to a base salary. The expense under these agreements totaled approximately $4,068,000 in 2017, $4,202,000 in 2016 and $6,411,000 in 2015 and is included in selling, general and administrative expenses in the accompanying consolidated statements of operations.
NOTE 10: EMPLOYEE BENEFIT PLANS
Supplemental Executive Retirement Plan (“SERP”) - The Company permits selected highly compensated employees to defer a portion of their compensation into the SERP. The SERP assets are invested primarily in company-owned life insurance (“COLI”) policies as a funding source to satisfy the obligation of the SERP. The assets are subject to claims by creditors, and the Company can designate them to another purpose at any time. Investments in COLI policies consist of variable life insurance policies of $6.6 million as of December 31, 2017 and $6.0 million as of December 31, 2016. In the COLI policies, the Company is able to allocate assets across a set of choices provided by the insurance underwriter, including fixed income securities and equity funds. The COLI policies are recorded at their net cash surrender values, which approximates fair value, as provided by the issuing insurance company, whose Standard & Poor’s credit rating was A+.
The Company classifies the SERP assets as trading securities as described in Note 1. The fair value of these assets totaled $6,031,000 as of December 31, 2017 and $5,547,000 as of December 31, 2016. The SERP assets are reported in other assets on the consolidated balance sheets and changes related to the fair value of the assets are included in selling, general and administrative expenses in the consolidated statements of operations. Trading gains (losses) related to the SERP assets totaled $470,000 in 2017, $106,000 in 2016 and $(84,000) in 2015. The SERP liabilities are recorded on the balance sheet in pension liabilities with any change in the fair value of the SERP liabilities recorded as selling, general and administrative expenses in the consolidated statements of operations.
In connection with death of an executive officer during 2016, the Company recorded tax free gains of approximately $751 thousand comprised of the following: $556 thousand generated by the insurance death proceeds under a Company-owned life insurance contract of approximately $1.9 million less cash surrender value of approximately $1.4 million, and $195 thousand as a result of insurance death benefits from a key-man life insurance policy. The net gain is reflected as part of selling, general and administrative expenses in 2016.
| 48 |
NOTES TO CONSOLIDATED FINANCIAL STATEMENTS
Marine Products Corporation and Subsidiaries
Years ended December 31, 2017, 2016 and 2015
Retirement Income Plan — Marine Products participates in the tax-qualified, defined benefit, noncontributory, trusteed retirement income plan sponsored by RPC, Inc. (“RPC”) that covers substantially all employees with at least one year of service prior to 2002.
The Company’s fair value of the plan assets exceeded the projected benefit obligation for its Retirement Income Plan by $343,000 and thus the plan was over-funded as of December 31, 2017.
The following table sets forth the funded status of the Retirement Income Plan and the amounts recognized in Marine Products’ consolidated balance sheets:
| December 31, | 2017 | 2016 | ||||||
| (in thousands) | ||||||||
| ACCUMULATED BENEFIT OBLIGATION, END OF YEAR | $ | 6,379 | $ | 6,083 | ||||
| CHANGE IN PROJECTED BENEFIT OBLIGATION: | ||||||||
| Benefit obligation at beginning of year | $ | 6,083 | $ | 5,703 | ||||
| Service cost | — | — | ||||||
| Interest cost | 266 | 274 | ||||||
| Actuarial loss | 273 | 342 | ||||||
| Benefits paid | (243 | ) | (236 | ) | ||||
| Projected benefit obligation at end of year | $ | 6,379 | $ | 6,083 | ||||
| CHANGE IN PLAN ASSETS: | ||||||||
| Fair value of plan assets at beginning of year | $ | 6,032 | $ | 5,813 | ||||
| Actual return on plan assets | 933 | 275 | ||||||
| Employer contributions | — | 180 | ||||||
| Benefits paid | (243 | ) | (236 | ) | ||||
| Fair value of plan assets at end of year | $ | 6,722 | $ | 6,032 | ||||
| Funded status at end of year | $ | 343 | $ | (51 | ) | |||
| December 31, | 2017 | 2016 | ||||||
| (in thousands) | ||||||||
| AMOUNTS RECOGNIZED IN THE CONSOLIDATED BALANCE SHEETS CONSIST OF: | ||||||||
| Noncurrent assets | $ | 343 | $ | — | ||||
| Current liabilities | — | — | ||||||
| Noncurrent liabilities | — | (51 | ) | |||||
| $ | 343 | $ | (51 | ) | ||||
The funded status of the Retirement Income Plan was recorded in the consolidated balance sheets in pension liabilities as of December 31, 2017 and in other assets as of December 31, 2016.
| December 31, | 2017 | 2016 | ||||||
| (in thousands) | ||||||||
| AMOUNTS (PRE-TAX) RECOGNIZED IN ACCUMULATED OTHER COMPREHENSIVE LOSS CONSIST OF: | ||||||||
| Net loss | $ | 2,997 | $ | 3,335 | ||||
| Prior service cost (credit) | — | — | ||||||
| Net transition obligation (asset) | — | — | ||||||
| $ | 2,997 | $ | 3,335 | |||||
The accumulated benefit obligation for the Retirement Income Plan as of December 31, 2017 and 2016 has been disclosed above. The Company uses a December 31 measurement date for this qualified plan.
| 49 |
NOTES TO CONSOLIDATED FINANCIAL STATEMENTS
Marine Products Corporation and Subsidiaries
Years ended December 31, 2017, 2016 and 2015
Amounts recorded in the consolidated balance sheet as pension liabilities consist of:
| December 31, | 2017 | 2016 | ||||||
| (in thousands) | ||||||||
| SERP liability | $ | (6,732 | ) | $ | (5,563 | ) | ||
| Funded status of Retirement Income Plan | — | (51 | ) | |||||
| Pension liabilities | $ | (6,732 | ) | $ | (5,614 | ) | ||
Marine Products’ funding policy is to contribute to the Retirement Income Plan the amount required, if any, under the Employee Retirement Income Security Act of 1974. There were no contributions to the plan during 2017. Contributions to the plan totaled $180,000 during 2016.
The components of net periodic benefit cost of the Retirement Income Plan are summarized as follows:
| Years ended December 31, | 2017 | 2016 | 2015 | |||||||||
| (in thousands) | ||||||||||||
| Service cost for benefits earned during the period | $ | — | $ | — | $ | — | ||||||
| Interest cost on projected benefit obligation | 266 | 274 | 259 | |||||||||
| Expected return on plan assets | (415 | ) | (406 | ) | (421 | ) | ||||||
| Amortization of net loss | 91 | 84 | 76 | |||||||||
| $ | (58 | ) | $ | (48 | ) | $ | (86 | ) | ||||
The Company recognized a pre-tax increase to the funded status in accumulated other comprehensive income of $334,000 in 2017 compared to a pre-tax decrease of $390,000 in 2016 and a pre-tax increase of $195,000 in 2015. There were no previously unrecognized prior service costs during 2017, 2016 and 2015. The pre-tax amounts recognized in other comprehensive income for the years ended December 31, 2017, 2016 and 2015 are summarized as follows:
| (in thousands) | 2017 | 2016 | 2015 | |||||||||
| Net loss (gain) | $ | (242 | ) | $ | 474 | $ | (119 | ) | ||||
| Amortization of net loss | (91 | ) | (84 | ) | (76 | ) | ||||||
| Net transition obligation (asset) | — | — | — | |||||||||
| Amount recognized in accumulated other comprehensive income | $ | (334 | ) | $ | 390 | $ | (195 | ) | ||||
The amounts in accumulated other comprehensive income expected to be recognized as components of net periodic benefit cost in 2018 are as follows:
| (in thousands) | 2018 | |||
| Amortization of net loss | $ | 81 | ||
| Prior service cost (credit) | — | |||
| Net transition obligation (asset) | — | |||
| Estimated net periodic cost | $ | 81 | ||
The weighted average assumptions as of December 31 used to determine the projected benefit obligation and net benefit cost were as follows:
| December 31, | 2017 | 2016 | 2015 | |||||||||
| PROJECTED BENEFIT OBLIGATION: | ||||||||||||
| Discount rate | 4.05 | % | 4.50 | % | 4.75 | % | ||||||
| Rate of compensation increase | N/A | N/A | N/A | |||||||||
| NET BENEFIT COST: | ||||||||||||
| Discount rate | 4.50 | % | 4.75 | % | 4.25 | % | ||||||
| Expected return on plan assets | 7.00 | % | 7.00 | % | 7.00 | % | ||||||
| Rate of compensation increase | N/A | N/A | N/A | |||||||||
The Company’s expected return on assets assumption is derived from a detailed periodic assessment by its management and investment advisor. It includes a review of anticipated future long-term performance of individual asset classes and consideration of the appropriate asset allocation strategy given the anticipated requirements of the plan to determine the average rate of earnings expected on the funds invested to provide for the pension plan benefits. While the assessment gives appropriate consideration to recent fund performance and historical returns, the rate of return assumption is derived primarily from a long-term, prospective view. Based on its recent assessment, the Company has concluded that its expected long-term return assumption of seven percent is reasonable.
| 50 |
NOTES TO CONSOLIDATED FINANCIAL STATEMENTS
Marine Products Corporation and Subsidiaries
Years ended December 31, 2017, 2016 and 2015
The plan’s weighted average asset allocation at December 31, 2017 and 2016 by asset category along with the target allocation for 2018 are as follows:
| Asset Category | Target Allocation for 2018 | Percentage of Plan Assets as of December 31, 2017 | Percentage of Plan Assets as of December 31, 2016 | |||||||||
| Cash and Cash Equivalents | 0% - 3% | 2.9 | % | 3.3 | % | |||||||
| Domestic Equity Securities | 0% - 40% | 42.3 | 25.5 | |||||||||
| International Equity Securities | 0% - 20% | 20.7 | 20.8 | |||||||||
| Fixed Income Securities | 15% - 25% | 23.8 | 25.3 | |||||||||
| Investments measured at net asset value | 0% - 12% | 10.3 | 25.1 | |||||||||
| Total | 100.0 | % | 100.0 | % | 100.0 | % | ||||||
The Company’s overall investment strategy is to achieve a mix of approximately 70 percent of investments for long-term growth and 30 percent for near-term benefit payments, with a wide diversification of asset types, fund strategies and fund managers. Equity securities primarily include investments in large-cap and small-cap companies domiciled domestically and internationally. Fixed-income securities include corporate bonds, mortgage-backed securities, sovereign bonds, and U.S. Treasuries. Other types of investments include real estate funds and private equity funds that follow several different investment strategies. For each of the asset categories in the pension plan, the investment strategy is identical – maximize the long-term rate of return on plan assets with an acceptable level of risk in order to minimize the cost of providing pension benefits. The investment policy establishes a target allocation for each asset class which is rebalanced as required. The plan utilizes a number of investment approaches, including but not limited to individual market securities, equity and fixed income funds in which the underlying securities are marketable, and debt funds to achieve this target allocation. Company management expects to make a contribution to the pension plan of approximately $100,000 during fiscal year 2018.
Some of our assets, primarily our private equity and real estate funds, do not have readily determinable market values given the specific investment structures involved and the nature of the underlying investments. For plan asset reporting as of December 31, 2017, publicly traded asset pricing was used where possible. For assets without readily determinable values, estimates were derived from investment manager statements combined with discussions focusing on underlying fundamentals and significant events. Additionally, these investments are valued based on the net asset value per share calculated by the funds in which the plan has invested and the valuation is based on significant non-observable inputs which do not have a readily determinable fair value. These assets have been excluded from the fair value hierarchy applied retrospectively based on the accounting guidance recently adopted. The valuations are subject to judgments and assumptions of the funds which may prove to be incorrect, resulting in risks of incorrect valuation of these investments. The Company seeks to mitigate these risks by evaluating the appropriateness of the funds’ judgments and assumptions by reviewing the financial data included in the funds’ financial statements for reasonableness.
The following tables present our plan assets using the fair value hierarchy as of December 31, 2017 and 2016. The fair value hierarchy has three levels based on the reliability of the inputs used to determine fair value. See Note 8 for a brief description of the three levels under the fair value hierarchy.
| Fair Value Hierarchy as of December 31, 2017: | ||||||||||||||||
| Investments (in thousands) | Total | Level 1 | Level 2 | |||||||||||||
| Cash and Cash Equivalents | (1 | ) | $ | 192 | $ | 192 | $ | — | ||||||||
| Fixed Income Securities | (2 | ) | 1,601 | — | 1,601 | |||||||||||
| Domestic Equity Securities | (3 | ) | 2,844 | 1,047 | 1,797 | |||||||||||
| International Equity Securities | (4 | ) | 1,394 | — | 1,394 | |||||||||||
| Total Assets in the Fair Value Hierarchy | $ | 6,031 | $ | 1,239 | $ | 4,792 | ||||||||||
| Investments measured at Net Asset Value | 691 | |||||||||||||||
| Investments at Fair Value | $ | 6,722 | ||||||||||||||
| 51 |
NOTES TO CONSOLIDATED FINANCIAL STATEMENTS
Marine Products Corporation and Subsidiaries
Years ended December 31, 2017, 2016 and 2015
| Fair Value Hierarchy as of December 31, 2016: | ||||||||||||||||
| Investments (in thousands) | Total | Level 1 | Level 2 | |||||||||||||
| Cash and Cash Equivalents | (1 | ) | $ | 200 | $ | 200 | $ | — | ||||||||
| Fixed Income Securities | (2 | ) | 1,529 | — | 1,529 | |||||||||||
| Domestic Equity Securities | (3 | ) | 1,539 | 775 | 764 | |||||||||||
| International Equity Securities | (4 | ) | 1,252 | — | 1,252 | |||||||||||
| Total Assets in the Fair Value Hierarchy | $ | 4,520 | $ | 975 | $ | 3,545 | ||||||||||
| Investments measured at Net Asset Value | 1,512 | |||||||||||||||
| Investments at Fair Value | $ | 6,032 | ||||||||||||||
| (1) | Cash and cash equivalents, which are used to pay benefits and plan administrative expenses, are held in Rule 2a-7 money market funds. |
| (2) | Fixed income securities are primarily valued using a market approach with inputs that include broker quotes, benchmark yields, base spreads and reported trades. |
| (3) | Domestic equity securities are valued using a market approach based on the quoted market prices of identical instruments in their respective markets. |
| (4) | International equity securities are valued using a market approach based on the quoted market prices of identical instruments in their respective markets. |
The Company estimates that the future benefits payable for the Retirement Income Plan over the next ten years are as follows:
| (in thousands) | ||||
| 2018 | $ | 297 | ||
| 2019 | 303 | |||
| 2020 | 293 | |||
| 2021 | 298 | |||
| 2022 | 295 | |||
| 2023-2027 | $ | 1,657 | ||
401(k) Plan— Marine Products participates in a defined contribution 401(k) plan sponsored by RPC that is available to substantially all full-time employees with more than 90 days of service. This plan allows employees to make tax-deferred contributions of up to 25 percent of their annual compensation, not exceeding the permissible deduction imposed by the Internal Revenue Code. The Company matches 50 percent of each employee’s contributions that do not exceed six percent of the employee’s compensation, as defined by the 401(k) plan. Employees vest in the Company’s contributions after three years of service. The charges to expense for Marine Products’ contributions to the 401(k) plan were approximately $317,000 in 2017, $270,000 in 2016 and $250,000 in 2015.
Stock Incentive Plan— The Company reserved 3,000,000 shares of common stock under the 2014 Stock Incentive Plan with a term of ten years expiring in April 2024. All future equity compensation awards by the Company will be issued under the 2014 plan. This plan provides for the issuance of various forms of stock incentives, including among others, incentive and non-qualified stock options and restricted shares. As of December 31, 2017, there were approximately 2,062,600 shares available for grant.
The Company recognizes compensation expense for the unvested portion of awards outstanding over the remainder of the service period. The compensation cost recorded for these awards will be based on their fair value at grant date less the cost of estimated forfeitures. Forfeitures are estimated at the time of grant and revised, if necessary, in subsequent periods to reflect actual forfeitures. Cash flows related to share-based awards to employees that result in tax benefits in excess of recognized cumulative compensation cost (excess tax benefits) are classified as financing cash flows.
Pre-tax stock-based employee compensation expense was approximately $2,682,000 ($1,729,000 after tax) for 2017, $2,624,000 ($1,692,000 after tax) for 2016 and $1,993,000 ($1,285,000 after tax) for 2015.
Stock Options— Stock options are granted at an exercise price equal to the fair market value of the Company’s common stock at the date of grant except for grants of incentive stock options to owners of greater than 10 percent of the Company’s voting securities which must be made at 110 percent of the fair market value of the Company’s common stock. Options generally vest ratably over a period of five years and expire in 10 years, except to owners of greater than 10 percent of the Company’s voting securities, which expire in five years.
| 52 |
NOTES TO CONSOLIDATED FINANCIAL STATEMENTS
Marine Products Corporation and Subsidiaries
Years ended December 31, 2017, 2016 and 2015
The Company estimates the fair value of stock options as of the date of grant using the Black-Scholes option pricing model. The Company has not granted stock options to employees since 2004.
There were no options exercised in 2017 and there have been no stock options outstanding since December 31, 2014. There was no tax benefit associated with the exercise of non-qualified stock options during 2017, 2016 or 2015.
Restricted Stock— Marine Products grants selected employees time lapse restricted stock that vest after a certain stipulated number of years from the grant date, depending on the terms of the issue. The Company has currently issued time lapse restricted shares that vest in 20 percent increments starting with the second anniversary of the grant, over the six year period beginning on the date of grant. During these years, grantees receive all dividends declared and retain voting rights for the shares.
The agreements under which the restricted stock is issued provide that shares awarded may not be sold or otherwise transferred until restrictions established under the stock plans have lapsed. Upon termination of employment from the Company, with the exception of death (fully vests), disability or retirement (partially vests based on duration of service), shares with restrictions are forfeited in accordance with the plan.
The following is a summary of the changes in non-vested restricted shares for the year ended December 31, 2017:
| Shares | Weighted Average Grant-Date Fair Value | |||||||
| Non-vested shares at January 1, 2017 | 1,200,900 | $ | 6.58 | |||||
| Granted | 202,400 | 13.39 | ||||||
| Vested | (344,250 | ) | 6.92 | |||||
| Forfeited | (18,250 | ) | 8.47 | |||||
| Non-vested shares at December 31, 2017 | 1,040,800 | $ | 7.76 | |||||
The following is a summary of the changes in non-vested restricted shares for the year ended December 31, 2016:
| Shares | Weighted Average Grant-Date Fair Value | |||||||
| Non-vested shares at January 1, 2016 | 1,254,200 | $ | 6.80 | |||||
| Granted | 371,950 | 5.77 | ||||||
| Vested | (422,533 | ) | 6.52 | |||||
| Forfeited | (2,717 | ) | 6.21 | |||||
| Non-vested shares at December 31, 2016 | 1,200,900 | $ | 6.58 | |||||
The fair value of restricted stock awards is based on the market price of the Company’s stock on the date of grant and is amortized to compensation expense on a straight line basis over the requisite service period. The weighted average grant date fair value of these restricted stock awards was $13.39 in 2017, $5.77 in 2016 and $7.08 in 2015. The total fair value of shares vested was approximately $4,432,032 in 2017, $2,686,000 in 2016 and $2,254,000 during 2015.
Pursuant to the adoption of ASU 2016-09 in 2017, the excess tax benefits realized from tax compensation deductions in excess of compensation expense have been reflected as follows:
| • | Approximately $718,000 during 2017 has been recorded as a discrete tax adjustment and classified within operating activities as part of net income in the consolidated statements of cash flows; and |
| • | Approximately $160,000 during 2016 were credited to capital in excess of par value and classified within financing activities as an inflow in addition to being disclosed as an outflow within operating activities in the consolidated statements of cash flows. |
Other Information— As of December 31, 2017 total unrecognized compensation cost related to non-vested restricted shares was approximately $6,458,000 which is expected to be recognized over a weighted-average period of 3.2 years.
| 53 |
NOTES TO CONSOLIDATED FINANCIAL STATEMENTS
Marine Products Corporation and Subsidiaries
Years ended December 31, 2017, 2016 and 2015
NOTE 11: RELATED PARTY TRANSACTIONS
In conjunction with its spin-off from RPC in 2001, the Company and RPC entered into various agreements that define the companies’ relationship after the spin-off.
The Transition Support Services Agreement provides for RPC to provide certain services, including financial reporting and income tax administration, acquisition assistance, etc., to Marine Products until the agreement is terminated by either party. Marine Products reimbursed RPC for its estimated allocable share of administrative costs incurred for services rendered on behalf of Marine Products totaling $849,000 in 2017, $739,000 in 2016 and $753,000 in 2015. The Company’s payable due to RPC for these services was $47,000 as of December 31, 2017 and $60,000 as of December 31, 2016. The Company’s directors are also directors of RPC and all of the Company’s executive officers are employees of both the Company and RPC.
The Employee Benefits Agreement provides for, among other things, the Company’s employees to continue participating subsequent to the spin-off in two RPC sponsored benefit plans, specifically, the defined contribution 401(k) plan and the defined benefit retirement income plan.
RPC and Marine Products own 50 percent each of a limited liability company called 255 RC, LLC that was created for the joint purchase and ownership of a corporate aircraft. The purchase of the aircraft was completed in January 2015, and the purchase was funded primarily by a $2,554,000 contribution by each company to 255 RC, LLC. Each of RPC and Marine Products is a party to an operating lease agreement with 255 RC, LLC for a period of five years. During 2017, Marine Products recorded certain net operating costs comprised of rent and an allocable share of fixed costs of approximately $157,000 for the corporate aircraft. The Company accounts for this investment using the equity method and its proportionate share of income or loss is recorded in selling, general and administrative expenses. As of December 31, 2017, the investment closely approximates the underlying equity in the net assets of 255 RC, LLC.
A group that includes the Company’s Chairman of the Board, R. Randall Rollins and his brother Gary W. Rollins, who is also director of the Company, and certain companies under their control, controls in excess of fifty percent of the Company’s voting power.
| 54 |
Item 9. Changes in and Disagreements with Accountants on Accounting and Financial Disclosure
None.
Item 9A. Controls and Procedures
Evaluation of disclosure controls and procedures — The Company maintains disclosure controls and procedures that are designed to ensure that information required to be disclosed in its Exchange Act reports is recorded, processed, summarized and reported within the time periods specified in the Commission’s rules and forms, and that such information is accumulated and communicated to its management, including the Chief Executive Officer and Chief Financial Officer, as appropriate, to allow timely decisions regarding required disclosure.
As of the end of the period covered by this report, December 31, 2017 (the “Evaluation Date”), the Company carried out an evaluation, under the supervision and with the participation of its management, including the Chief Executive Officer and Chief Financial Officer, of the effectiveness of the design and operation of its disclosure controls and procedures. Based upon this evaluation, the Chief Executive Officer and the Chief Financial Officer concluded that the Company’s disclosure controls and procedures were effective at a reasonable assurance level as of the Evaluation Date.
Management’s report on internal control over financial reporting — Management is responsible for establishing and maintaining adequate internal control over financial reporting, as such term is defined in Exchange Act Rules 13a-15(f) and 15d-15(f). Management’s report on internal control over financial reporting is included on page 29 of this report. Grant Thornton LLP, the Company’s independent registered public accounting firm, has audited the effectiveness of internal control as of December 31, 2017 and issued a report thereon which is included on page 30 of this report.
Changes in internal control over financial reporting — Management’s evaluation of changes in internal control did not identify any changes in the Company’s internal control over financial reporting that occurred during the Company’s most recent fiscal quarter that have materially affected, or are reasonably likely to materially affect, the Company’s internal control over financial reporting.
Item 9B. Other Information
None.
| 55 |
PART III
Item 10. Directors, Executive Officers and Corporate Governance
Information concerning directors and executive officers will be included in the Marine Products Proxy Statement for its 2018 Annual Meeting of Stockholders, in the section titled “Election of Directors.” This information is incorporated herein by reference. Information about executive officers is contained on page 15 of this document.
Audit Committee and Audit Committee Financial Expert
Information concerning the Audit Committee of the Company and the Audit Committee Financial Expert(s) will be included in the Marine Products Proxy Statement for its 2018 Annual Meeting of Stockholders, in the section titled “Corporate Governance and Board of Directors, Committees and Meetings – Audit Committee.” This information is incorporated herein by reference.
Code of Ethics
Marine Products has a Code of Business Conduct that applies to all employees. In addition, the Company has a Code of Business Conduct and Ethics for Directors and Executive Officers and Related Party Transaction Policy. Both of these documents are available on the Company’s website at www.marineproductscorp.com. Copies are also available at no extra charge by writing to Attn: Human Resources, Marine Products Corporation, 2801 Buford Highway, Suite 520, Atlanta, Georgia 30329. Marine Products intends to satisfy the disclosure requirement under Item 10 of Form 8-K regarding an amendment to, or waiver from, a provision of its code of ethics that relates to any elements of the code of ethics definition enumerated in SEC rules by posting such information on its internet website, the address of which is provided above.
Section 16(a) Beneficial Ownership Reporting Compliance
Information regarding compliance with Section 16(a) of the Exchange Act will be included under “Section 16(a) Beneficial Ownership Reporting Compliance” in the Company’s Proxy Statement for its 2018 Annual Meeting of Stockholders, which is incorporated herein by reference.
Item 11. Executive Compensation
Information concerning director and executive compensation will be included in the Marine Products Proxy Statement for its 2018 Annual Meeting of Stockholders, in the sections titled “Compensation Committee Interlocks and Insider Participation,” “Director Compensation,” “Compensation Discussion and Analysis” and “Executive Compensation.” This information is incorporated herein by reference.
Item 12. Security Ownership of Certain Beneficial Owners and Management and Related Stockholder Matters
Information concerning security ownership will be included in the Marine Products Proxy Statement for its 2018 Annual Meeting of Stockholders, in the sections titled, “Capital Stock” and “Election of Directors.” This information is incorporated herein by reference.
| 56 |
Securities Authorized for Issuance Under Equity Compensation Plans
The following table sets forth certain information regarding equity compensation plans as of December 31, 2017.
| Plan Category | (A) Number of Securities To Be Issued Upon Exercise of Outstanding Options, Warrants and Rights | (B) Weighted Average Exercise Price of Outstanding Options, Warrants and Rights | (C) Number of Securities Remaining Available for Future Issuance Under Equity Compensation Plans (Excluding Securities Reflected in Column (A)) | |||||||||
| Equity compensation plans approved by security holders | — | $ | — | 2,062,600 | (1) | |||||||
| Equity compensation plans not approved by security holders | — | — | — | |||||||||
| Total | — | $ | — | 2,062,600 | ||||||||
| (1) | All of the securities can be issued in the form of restricted stock or other stock awards. |
See “NOTE 10: EMPLOYEE BENEFIT PLANS” to the Consolidated Financial Statements for information regarding the material terms of the equity compensation plans.
Item 13. Certain Relationships and Related Transactions, and Director Independence
Information concerning certain relationships and related party transactions will be included in the Marine Products Proxy Statement for its 2018 Annual Meeting of Stockholders, in the section titled “Certain Relationships and Related Party Transactions.” Information regarding director independence will be included in the Marine Products Proxy Statement for its 2018 Annual Meeting of Stockholders in the section titled “Director Independence and NYSE Requirements.” This information is incorporated herein by reference.
Item 14. Principal Accounting Fees and Services
Information regarding principal accountant fees and services will be included in the section titled, “Independent Registered Public Accountants” in the Marine Products Proxy Statement for its 2018 Annual Meeting of Stockholders. This information is incorporated herein by reference.
| 57 |
PART IV
Item 15. Exhibits and Financial Statement Schedules
Consolidated Financial Statements, Financial Statement Schedule and Exhibits
| 1. | Consolidated financial statements listed in the accompanying Index to Consolidated Financial Statements and Schedule are filed as part of this report. |
| 2. | The financial statement schedule listed in the accompanying Index to Consolidated Financial Statements and Schedule is filed as part of this report. |
| 3. | Exhibits listed in the accompanying Index to Exhibits are filed as part of this report. The following such exhibits are management contracts or compensatory plans or arrangements: |
| 10.5 | Marine Products Corporation 2004 Stock Incentive Plan (incorporated herein by reference to Appendix B to the Definitive Proxy Statement filed on March 24, 2004). |
| 10.6 | Form of stock option grant agreement under the 2001 Employee Stock Incentive Plan (incorporated herein by reference to Exhibit 10.7 to the Form 10-K filed on March 21, 2003). |
| 10.7 | Form of performance restricted stock grant agreement under the 2001 Employee Stock Incentive Plan (incorporated herein by reference to Exhibit 10.9 to the Form 10-K filed on March 21, 2003). |
| 10.8 | Form of stock option grant agreement under the 2004 Stock Incentive Plan (incorporated herein by reference to Exhibit 10.1 to the Form 10-Q filed on November 1, 2004). |
| 10.9 | Form of time lapse restricted stock grant agreement under the 2004 Stock Incentive Plan (incorporated herein by reference to Exhibit 10.2 to the Form 10-Q filed on November 1, 2004). |
| 10.10 | Form of performance restricted stock grant agreement under the 2004 Stock Incentive Plan (incorporated herein by reference to Exhibit 10.3 to the Form 10-Q filed on November 1, 2004). |
| 10.11 | Supplemental Retirement Plan (incorporated herein by reference to Exhibit 10.16 to the Form 10-K filed on March 15, 2005). |
| 10.12 | First Amendment to 2001 Employee Stock Incentive Plan and 2004 Stock Incentive Plan (incorporated by reference to Exhibit 10.19 to the Form 10-K filed on March 2, 2007). |
| 10.13 | Performance Based Compensation Agreement between James A. Lane, Jr. and Chaparral Boats, Inc. (incorporated herein by reference to Exhibit 10.1 to the Form 8-K filed on April 26, 2013). |
| 10.14 | Summary of ‘At-Will’ compensation arrangements with the Executive Officers as of February 28, 2009 (incorporated herein by reference to Exhibit 10.20 to the Form 10-K filed on March 5, 2009). |
| 10.15 | Form of time lapse restricted stock agreement under the 2004 Stock Incentive Plan (incorporated herein by reference to Exhibit 10.1 to the Form 10-Q filed on May 2, 2012). |
| 10.16 | Summary of compensation arrangements with non-employee directors. |
| 10.17 | 2014 Stock Incentive Plan (incorporated herein by reference to Appendix A to the Registrant’s definitive Proxy Statement filed on March 17, 2014). |
| 58 |
Exhibits (inclusive of item 3 above):
| 59 |
SIGNATURES
Pursuant to the requirements of Section 13 or 15(d) of the Securities Exchange Act of 1934, the Registrant has duly caused
this report to be signed on its behalf by the undersigned, thereunto duly authorized.
|
|
Marine Products Corporation |
| /s/ Richard A. Hubbell | |
| Richard A. Hubbell | |
| President and Chief Executive Officer | |
| February 28, 2018 |
Pursuant to the requirements of the Securities Exchange Act of 1934, this report has been signed below by the following persons on behalf of the Registrant and in the capacities and on the dates indicated.
| Name | Title | Date | ||
| /s/ Richard A. Hubbell | President and Chief Executive Officer | February 28, 2018 | ||
| Richard A. Hubbell | (Principal Executive Officer) | |||
| /s/ Ben M. Palmer | Vice President, Chief Financial Officer and Corporate Secretary | February 28, 2018 | ||
| Ben M. Palmer | (Principal Financial and Accounting Officer) |
The Directors of Marine Products Corporation (listed below) executed a power of attorney, appointing Richard A. Hubbell their attorney-in-fact, empowering him to sign this report on their behalf.
|
R. Randall Rollins, Director |
Timothy C. Rollins, Director |
| Gary W. Rollins, Director | Pamela R. Rollins, Director |
| Henry B. Tippie, Director | Bill J. Dismuke, Director |
| James B. Williams, Director | Larry L. Prince, Director |
| /s/ Richard A. Hubbell | |
| Richard A. Hubbell | |
| Director and as Attorney-in-fact | |
| February 28, 2018 | |
| 60 |
INDEX TO CONSOLIDATED FINANCIAL STATEMENTS, REPORTS AND SCHEDULE
The following documents are filed as part of this report.
Schedules not listed above have been omitted because they are not applicable or the required information is included in the consolidated financial statements or notes thereto.
SCHEDULE II—VALUATION AND QUALIFYING ACCOUNTS
MARINE PRODUCTS CORPORATION AND SUBSIDIARIES (in thousands of dollars)
| For the years ended December 31, 2017, 2016 and 2015 | ||||||||||||||||
| Description | Balance at Beginning of Period | Charged to Costs and Expenses | Net (Write-Offs)/ Recoveries | Balance at End of Period | ||||||||||||
| Year ended December 31, 2017 | ||||||||||||||||
| Allowance for doubtful accounts | $ | 25 | $ | — | $ | — | $ | 25 | ||||||||
| Deferred tax asset valuation allowance | $ | 4,525 | $ | 922 | $ | — | $ | 5,447 | ||||||||
| Year ended December 31, 2016 | ||||||||||||||||
| Allowance for doubtful accounts | $ | 25 | $ | — | $ | — | $ | 25 | ||||||||
| Deferred tax asset valuation allowance | $ | 4,694 | $ | — | $ | (169 | ) | $ | 4,525 | |||||||
| Year ended December 31, 2015 | ||||||||||||||||
| Allowance for doubtful accounts | $ | 25 | $ | — | $ | — | $ | 25 | ||||||||
| Deferred tax asset valuation allowance | $ | 4,401 | $ | 293 | $ | — | $ | 4,694 | ||||||||
| 61 |
SELECTED QUARTERLY FINANCIAL DATA (UNAUDITED)
| First | Second | Third | Fourth | |||||||||||||
| (in thousands except per share data) | ||||||||||||||||
| 2017 | ||||||||||||||||
| Net sales | $ | 71,040 | $ | 71,484 | $ | 59,201 | $ | 65,591 | ||||||||
| Gross profit | 14,906 | 16,287 | 13,461 | 14,366 | ||||||||||||
| Net income (b) | 5,261 | 6,119 | 4,564 | 3,356 | ||||||||||||
| Earnings per share — basic (a) (b) | 0.15 | 0.18 | 0.13 | 0.10 | ||||||||||||
| Earnings per share — diluted (a) (b) | $ | 0.15 | $ | 0.18 | $ | 0.13 | $ | 0.10 | ||||||||
| 2016 | ||||||||||||||||
| Net sales | $ | 63,665 | $ | 65,066 | $ | 55,361 | $ | 57,238 | ||||||||
| Gross profit | 12,688 | 13,808 | 11,768 | 12,203 | ||||||||||||
| Net income | 3,921 | 4,818 | 4,284 | 3,722 | ||||||||||||
| Earnings per share — basic (a) | 0.10 | 0.13 | 0.11 | 0.10 | ||||||||||||
| Earnings per share — diluted (a) | $ | 0.10 | $ | 0.13 | $ | 0.11 | $ | 0.10 | ||||||||
| (a) | The sum of the earnings per share for the four quarters may differ from annual amounts due to the required method of computing the weighted average shares for the respective periods. |
| (b) | The indicated Quarterly Financial Data for 2017 include the impact of a net discrete tax provision of $1.7 million, or $0.05 per share, recorded as a result of the Tax Cuts and Jobs Act enacted during the fourth quarter of 2017. |
| 62 |