Attached files
| file | filename |
|---|---|
| EX-32 - EXHIBIT 32 - KEY ENERGY SERVICES INC | keg10-k12312017ex32.htm |
| EX-31.2 - EXHIBIT 31.2 - KEY ENERGY SERVICES INC | keg10-k12312017ex312.htm |
| EX-31.1 - EXHIBIT 31.1 - KEY ENERGY SERVICES INC | keg10-k12312017ex311.htm |
| EX-23 - EXHIBIT 23 - KEY ENERGY SERVICES INC | keg10-k12312017ex23.htm |
| EX-21 - EXHIBIT 21 - KEY ENERGY SERVICES INC | keg10-k12312017ex21.htm |
UNITED STATES SECURITIES AND EXCHANGE COMMISSION
Washington, D.C. 20549
______________________________________
Form 10-K
(Mark One)
þ | ANNUAL REPORT PURSUANT TO SECTION 13 OR 15(d) OF THE SECURITIES EXCHANGE ACT OF 1934 | |
For the fiscal year ended December 31, 2017
¨ | TRANSITION REPORT PURSUANT TO SECTION 13 OR 15(d) OF THE SECURITIES EXCHANGE ACT OF 1934 | |
Commission file number 001-08038
KEY ENERGY SERVICES, INC.
(Exact name of registrant as specified in its charter)
Delaware | 04-2648081 | |
(State or other jurisdiction of incorporation or organization) | (I.R.S. Employer Identification No.) | |
1301 McKinney Street
Suite 1800
Houston, Texas 77010
(Address of principal executive offices, including Zip Code)
(713) 651-4300
(Registrant’s telephone number, including area code)
Securities registered pursuant to Section 12(b) of the Act:
Title of Each Class | Name of Exchange on Which Registered | |
Common Stock, $0.01 par value | New York Stock Exchange | |
Securities registered pursuant to Section 12(g) of the Act:
Title of Class
None
Indicate by check mark if the registrant is a well-known seasoned issuer (as defined in Rule 405 of the Securities Act). Yes ¨ No þ
Indicate by check mark if the registrant is not required to file reports pursuant to Section 13 or Section 15(d) of the Exchange Act. Yes ¨ No þ
Indicate by check mark whether the registrant (1) has filed all reports required to be filed by Section 13 or 15(d) of the Securities Exchange Act of 1934 during the preceding 12 months (or for such shorter period that the registrant was required to file such reports), and (2) has been subject to such filing requirements for the past 90 days. Yes þ No ¨
Indicate by check mark whether the registrant has submitted electronically and posted on its corporate Web site, if any, every Interactive Data File required to be submitted and posted pursuant to Rule 405 of Regulation S-T (§ 232.405 of this chapter) during the preceding 12 months (or for such shorter period that the registrant was required to submit and post such files.) Yes þ No ¨
Indicate by check mark if disclosure of delinquent filers pursuant to Item 405 of Regulation S-K (§ 229.405 of this chapter) is not contained herein, and will not be contained, to the best of registrant’s knowledge, in definitive proxy or information statements incorporated by reference in Part III of this Form 10-K or any amendment to this Form 10-K. þ
Indicate by check mark whether the registrant is a large accelerated filer, an accelerated filer, a non-accelerated filer, or a smaller reporting company. See the definitions of “large accelerated filer,” “accelerated filer,” “smaller reporting company,” and “emerging growth company” in Rule 12b-2 of the Exchange Act. (Check one):
Large accelerated filer | ¨ | Accelerated filer | þ | |||
Non-accelerated filer | ¨ (Do not check if a smaller reporting company) | Smaller reporting company | ¨ | |||
Emerging growth company | ¨ | |||||
If an emerging growth company, indicate by check mark if the registrant has elected not to use the extended transition period for complying with any new or revised financial accounting standards provided pursuant to Section 13(a) of the Exchange Act. No ¨
Indicate by check mark whether the registrant is a shell company (as defined in Rule 12b-2 of the Exchange Act). Yes ¨ No þ
Indicate by check mark whether the registrant has filed all documents and reports required to be filed by Sections 12, 13 or 15(d) of the Securities Exchange Act of 1934 subsequent to the distribution of securities under a plan confirmed by a court. Yes þ No ¨
The aggregate market value of the common stock of the registrant held by non-affiliates as of June 30, 2017, based on the $19.24 per share closing price for the registrant’s common stock on such date, was $151.8 million (for purposes of calculating these amounts, only directors, officers and beneficial owners of 10% or more of the outstanding common stock of the registrant have been deemed affiliates).
As of February 15, 2018, the number of outstanding shares of common stock of the registrant was 20,217,661.
DOCUMENTS INCORPORATED BY REFERENCE
None.
KEY ENERGY SERVICES, INC.
ANNUAL REPORT ON FORM 10-K
For the Year Ended December 31, 2017
INDEX
Page Number | ||
PART I | ||
ITEM 1. | ||
ITEM 1A. | ||
ITEM 1B. | ||
ITEM 2. | ||
ITEM 3. | ||
ITEM 4. | ||
PART II | ||
ITEM 5. | ||
ITEM 6. | ||
ITEM 7. | ||
ITEM 7A. | ||
ITEM 8. | ||
ITEM 9. | ||
ITEM 9A. | ||
ITEM 9B. | ||
PART III | ||
ITEM 10. | ||
ITEM 11. | ||
ITEM 12. | ||
ITEM 13. | ||
ITEM 14. | ||
PART IV | ||
ITEM 15. | ||
ITEM 16. | ||
2
CAUTIONARY NOTE REGARDING FORWARD-LOOKING STATEMENTS
In addition to statements of historical fact, this report contains forward-looking statements within the meaning of the Private Securities Litigation Reform Act of 1995. Statements that are not historical in nature or that relate to future events and conditions are, or may be deemed to be, forward-looking statements. These “forward-looking statements” are based on our current expectations, estimates and projections about Key Energy Services, Inc. and its wholly owned and controlled subsidiaries, our industry and management’s beliefs and assumptions concerning future events and financial trends affecting our financial condition and results of operations. In some cases, you can identify these statements by terminology such as “may,” “will,” “should,” “predicts,” “expects,” “believes,” “anticipates,” “projects,” “potential” or “continue” or the negative of such terms and other comparable terminology. These statements are only predictions and are subject to substantial risks and uncertainties and are not guarantees of performance. Future actions, events and conditions and future results of operations may differ materially from those expressed in these statements. In evaluating those statements, you should carefully consider the risks outlined in “Item 1A. Risk Factors.”
We undertake no obligation to update any forward-looking statement to reflect events or circumstances after the date of this report except as required by law. All of our written and oral forward-looking statements are expressly qualified by these cautionary statements and any other cautionary statements that may accompany such forward-looking statements.
Important factors that may affect our expectations, estimates or projections include, but are not limited to, the following:
• | conditions in the oil and natural gas industry, especially oil and natural gas prices and capital expenditures by oil and natural gas companies; |
• | volatility in oil and natural gas prices; |
• | our ability to implement price increases or maintain pricing on our core services; |
• | risks that we may not be able to reduce, and could even experience increases in, the costs of labor, fuel, equipment and supplies employed in our businesses; |
• | industry capacity; |
• | asset impairments or other charges; |
• | the periodic low demand for our services and resulting operating losses and negative cash flows; |
• | our highly competitive industry as well as operating risks, which are primarily self-insured, and the possibility that our insurance may not be adequate to cover all of our losses or liabilities; |
• | significant costs and potential liabilities resulting from compliance with applicable laws, including those resulting from environmental, health and safety laws and regulations, specifically those relating to hydraulic fracturing, as well as climate change legislation or initiatives; |
• | our historically high employee turnover rate and our ability to replace or add workers, including executive officers and skilled workers; |
• | our ability to incur debt or long-term lease obligations; |
• | our ability to implement technological developments and enhancements; |
• | severe weather impacts on our business, including from hurricane activity; |
• | our ability to successfully identify, make and integrate acquisitions and our ability to finance future growth of our operations or future acquisitions; |
• | our ability to achieve the benefits expected from disposition transactions; |
• | the loss of one or more of our larger customers; |
• | our ability to generate sufficient cash flow to meet debt service obligations; |
• | the amount of our debt and the limitations imposed by the covenants in the agreements governing our debt, including our ability to comply with covenants under our debt agreements; |
• | an increase in our debt service obligations due to variable rate indebtedness; |
• | our inability to achieve our financial, capital expenditure and operational projections, including quarterly and annual projections of revenue and/or operating income and our inaccurate assessment of future activity levels, customer demand, and pricing stability which may not materialize (whether for Key as a whole or for geographic regions and/or business segments individually); |
• | our ability to respond to changing or declining market conditions, including our ability to reduce the costs of labor, fuel, equipment and supplies employed and used in our businesses; |
• | our ability to maintain sufficient liquidity; |
• | adverse impact of litigation; and |
• | other factors affecting our business described in “Item 1A. Risk Factors.” |
3
PART I
ITEM 1. BUSINESS
General Description of Business
Key Energy Services, Inc., a Delaware corporation, is the largest onshore, rig-based well servicing contractor based on the number of rigs owned. References to “Key,” the “Company,” “we,” “us” or “our” in this report refer to Key Energy Services, Inc., its wholly owned subsidiaries and its controlled subsidiaries. We were organized in April 1977 in Maryland and commenced operations in July 1978 under the name National Environmental Group, Inc. In December 1992, we became Key Energy Group, Inc. and we changed our name to Key Energy Services, Inc. in December 1998. In connection with our reorganization described below, we reincorporated as a Delaware corporation on December 15, 2016.
We provide a full range of well services to major oil companies and independent oil and natural gas production companies. Our services include rig-based and coiled tubing-based well maintenance and workover services, well completion and recompletion services, fluid management services, fishing and rental services, and other ancillary oilfield services. Additionally, certain rigs are capable of specialty drilling applications. We operate in most major oil and natural gas producing regions of the continental United States. An important component of the Company’s growth strategy is to make acquisitions that will strengthen its core services or presence in selected markets, and the Company also makes strategic divestitures from time to time. To that end, we completed the sale of our Canadian subsidiary and Russian subsidiary in the second and third quarters of 2017, respectively. The Company expects that the industry in which it operates will continue to experience consolidation, and as part of its strategy the Company actively explores opportunities arising out of this consolidation, which could include mergers, consolidations or acquisitions or further dispositions or other transactions, including by engaging in discussions with other industry participants concerning these opportunities. There can be no assurance that any such activities will be consummated.
Emergence from Voluntary Reorganization
On October 24, 2016, Key and certain of our domestic subsidiaries filed voluntary petitions for reorganization under chapter 11 of the United States Bankruptcy Code in the United States Bankruptcy Court for the District of Delaware (the “Bankruptcy Court”) pursuant to a prepackaged plan of reorganization (the “Plan”). The Plan was confirmed by the Bankruptcy Court on December 6, 2016, and the Company emerged from the bankruptcy proceedings on December 15, 2016 (the “Effective Date”). In this Annual Report on Form 10-K, we may refer to the Company prior to the Effective Date as the “Predecessor Company,” and on and after the Effective Date as the “Successor Company.”
On the Effective Date, the Company:
• | Reincorporated the Successor Company in the state of Delaware and adopted an amended and restated certificate of incorporation and bylaws; |
• | Appointed new members to the Successor Company’s board of directors to replace directors of the Predecessor Company; |
• | Issued to the Predecessor Company’s former stockholders, in exchange for the cancellation and discharge of the Predecessor Company’s common stock: |
• | 815,887 shares of the Successor Company’s common stock; |
• | 919,004 warrants to expire on December 15, 2020 (the “4-Year Warrants”), and 919,004 warrants to expire on December 15, 2021 (the “5-Year Warrants”), each exercisable for one share of the Successor Company’s common stock; |
• | Issued to former holders of the Predecessor Company’s 6.75% senior notes, in exchange for the cancellation and discharge of such notes, 7,500,000 shares of the Successor Company’s common stock; |
• | Issued 11,769,014 shares of the Successor Company’s common stock to certain participants in rights offerings conducted pursuant to the Plan; |
• | Issued to Soter Capital LLC (“Soter”) the sole share of the Successor Company’s Series A Preferred Stock, which confers certain rights to elect directors (but has no economic rights); |
• | Entered into a new $80 million senior secured asset based revolving credit facility (the “ABL Facility”), which was increased to $100 million on February 3, 2017, and a $250 million senior secured term loan facility (the “Term Loan Facility”) upon termination of the Predecessor Company’s asset-based revolving credit facility and term loan facility; |
• | Entered into a registration rights agreement (the “Registration Rights Agreement”) with certain stockholders of the Successor Company; |
• | Adopted a new management incentive plan (the “2016 Incentive Plan”) for officers, directors and employees of the Successor Company and its subsidiaries; and |
• | Entered into a corporate advisory services agreement (the “CASA”) between the Successor Company and Platinum Equity Advisors, LLC (“Platinum”) pursuant to which Platinum will provide certain business advisory services to the Company. |
4
The foregoing is a summary of the substantive provisions of the Plan and related transactions and is not intended to be a complete description of, or a substitute for a full and complete reading of, the Plan and the other documents referred to above.
Service Offerings
Our reportable business segments are U.S. Rig Services, Fluid Management Services, Coiled Tubing Services, Fishing and Rental Services and International. We also have a “Functional Support” segment associated with overhead and other costs in support of our reportable segments. Our U.S. Rig Services, Fluid Management Services, Coiled Tubing Services and Fishing and Rental Services operate geographically within the United States. The International reportable segment includes our former operations in Mexico, Canada, Colombia, Ecuador, Russia, Bahrain and Oman. During the second half of 2015, we ceased operations in Colombia, Ecuador and the Middle East. During the fourth quarter of 2016, we completed the sale of our business in Mexico. We completed the sale of our Canadian subsidiary and Russian subsidiary in the second and third quarter of 2017, respectively. We evaluate the performance of our segments based on gross margin measures. All inter-segment sales pricing is based on current market conditions. See “Note 24. Segment Information” in “Item 8. Financial Statements and Supplementary Data” for additional financial information about our reportable business segments and the various geographical areas where we operate.
U.S. Rig Services
Our U.S. Rig Services include the completion of newly drilled wells, workover and recompletion of existing oil and natural gas wells, well maintenance, and the plugging and abandonment of wells at the end of their useful lives. We also provide specialty drilling services to oil and natural gas producers with certain of our larger rigs that are capable of providing conventional and horizontal drilling services. Our rigs encompass various sizes and capabilities, allowing us to service all types of oil and gas wells. Many of our rigs are outfitted with our proprietary KeyView® technology, which captures and reports well site operating data and provides safety control systems. We believe that this technology allows our customers and our crews to better monitor well site operations, improves efficiency and safety, and adds value to the services that we offer.
The completion and recompletion services provided by our rigs prepare wells for production, whether newly drilled or recently extended through a workover operation. The completion process may involve selectively perforating the well casing to access production zones, stimulating and testing these zones, and installing tubular and downhole equipment. We typically provide a well service rig and may also provide other equipment to assist in the completion process. Completion services vary by well and our work may take a few days to several weeks to perform, depending on the nature of the completion.
The workover services that we provide are designed to enhance the production of existing wells and generally are more complex and time consuming than normal maintenance services. Workover services can include deepening or extending wellbores into new formations by drilling horizontal or lateral wellbores, sealing off depleted production zones and accessing previously bypassed production zones, converting former production wells into injection wells for enhanced recovery operations and conducting major subsurface repairs due to equipment failures. Workover services may last from a few days to several weeks, depending on the complexity of the workover.
Maintenance services provided with our rig fleet are generally required throughout the life cycle of an oil or natural gas well. Examples of these maintenance services include routine mechanical repairs to the pumps, tubing and other equipment, removing debris and formation material from wellbores, and pulling rods and other downhole equipment from wellbores to identify and resolve production problems. Maintenance services are generally less complicated than completion and workover related services and require less time to perform.
Our rig fleet is also used in the process of permanently shutting-in oil or natural gas wells that are at the end of their productive lives. These plugging and abandonment services generally require auxiliary equipment in addition to a well servicing rig. The demand for plugging and abandonment services is not significantly impacted by the demand for oil and natural gas because well operators are required by state regulations to plug wells that are no longer productive.
We believe that the largest competitors for our U.S. Rig Services include C & J Energy Services, Inc., Basic Energy Services, Inc., Superior Energy Services, Inc., Forbes Energy Services Ltd., Pioneer Energy Services Corp and Nine Energy Services. Numerous smaller companies also compete in our rig-based markets in the United States.
Fluid Management Services
We provide transportation and well-site storage services for various fluids utilized in connection with drilling, completions, workover and maintenance activities. We also provide disposal services for fluids produced subsequent to well completion. These fluids are removed from the well site and transported for disposal in saltwater disposal (“SWD”) wells owned by us or a third party. Demand and pricing for these services generally correspond to demand for our well service rigs.
We believe that the largest competitors for our domestic fluid management services include Select Energy Services, Basic Energy Services, Inc., Superior Energy Services, Inc., C & J Energy Services, Inc., Nuverra Environmental Solutions, Forbes
5
Energy Services Ltd., and Stallion Oilfield Services Ltd. Numerous smaller companies also compete in the fluid management services market in the United States.
Coiled Tubing Services
Coiled Tubing Services involve the use of a continuous metal pipe spooled onto a large reel which is then deployed into oil and natural gas wells to perform various applications, such as wellbore clean-outs, nitrogen jet lifts, through-tubing fishing, and formation stimulations utilizing acid and chemical treatments. Coiled tubing, particularly larger diameter coil units, is also used for a number of horizontal well applications such as milling temporary isolation plugs that separate frac zones and various other pre- and post-hydraulic fracturing well preparation services.
Our primary competitors in the Coiled Tubing Services market include Schlumberger Ltd., Baker Hughes Incorporated, Halliburton Company, Superior Energy Services, Inc., Nine Energy Services and C & J Energy Services, Inc. Numerous smaller companies also compete in our coiled tubing services markets in the United States. Demand for these services generally corresponds to demand for well completion services.
Fishing and Rental Services
We offer a full line of fishing services and rental equipment designed for use in providing onshore drilling and workover services. Fishing services involve recovering lost or stuck equipment in the wellbore utilizing a broad array of “fishing tools.” Our rental tool inventory consists of drill pipe, tubulars, handling tools (including our patented Hydra-Walk® pipe-handling units and services), pressure-control equipment, pumps, power swivels, reversing units and foam air units. Our rental inventory also included frac stack equipment used to support hydraulic fracturing operations and the associated flowback of frac fluids, proppants, oil and natural gas. We also had provided well testing services. Our frac stack equipment well testing services were sold in the second quarter of 2017.
Demand for our Fishing and Rental Services is also closely related to capital spending by oil and natural gas producers.
Our primary competitors for our Fishing and Rental Services include Baker Oil Tools (owned by Baker Hughes Incorporated), Weatherford International Ltd., Basic Energy Services, Inc., Smith Services (owned by Schlumberger), Superior Energy Services, Inc., Quail Tools (owned by Parker Drilling Company) and Knight Oil Tools. Numerous smaller companies also compete in our fishing and rental services markets in the United States.
International Segment
Our International segment includes our former operations in Mexico, Canada, Colombia, Ecuador, Russia, Bahrain and Oman. During the second half of 2015, we ceased operations in Colombia, Ecuador and the Middle East. During the fourth quarter of 2016, we completed the sale of our business in Mexico, and we completed the sale of our Canadian subsidiary and Russian subsidiary in the second and third quarters of 2017, respectively. Our services in these international markets consisted of rig-based services such as the maintenance, workover, and recompletion of existing oil wells, completion of newly-drilled wells, and plugging and abandonment of wells at the end of their useful lives. We also had a technology development and control systems business based in Canada, which was focused on the development of hardware and software related to oilfield service equipment controls, data acquisition and digital information flow.
Functional Support Segment
Our Functional Support segment includes unallocated overhead costs associated with sales, safety and administrative support for each of our reporting segments.
Equipment Overview
We categorize our rigs and equipment as active, warm stacked or cold stacked. We consider an active rig or piece of equipment to be a unit that is working, deployed, available for work or idle. A warm stacked rig or piece of equipment is a unit that is down for repair or needs repair. A cold stacked rig or piece of equipment is a unit that would require such significant investment to redeploy that we may salvage for parts, sell the unit or scrap the unit. The definitions of active, warm stacked or cold stacked are used for the majority of our equipment.
6
Rigs
As mentioned above, our fleet is diverse and allows us to work on all types of wells, ranging from very shallow wells to long horizontal laterals. Higher derrick lifting capacity rigs will be utilized to service the deeper wells and longer laterals as they require a higher pull weight and taller derrick. The lower derrick lifting capacity rigs are typically used on shallower, less complex wells. In most cases, these rigs can be reassigned to other regions should market conditions warrant the transfer of equipment. The following table summarizes our rigs based on derrick height measured in feet as of December 31, 2017:
Derrick Height (Feet) | ||||||||
< 102' | ≥ 102' | Total | ||||||
Active | 118 | 172 | 290 | |||||
Warm stacked | 163 | 78 | 241 | |||||
Cold stacked | 240 | 108 | 348 | |||||
Total | 521 | 358 | 879 | |||||
Coiled Tubing
Coiled tubing uses a spooled continuous metal pipe that is injected downhole in oil and gas wells in order to convey tools, log, stimulate, clean-out and perform other intervention functions. Typically, larger diameter coiled tubing is able to service longer lateral horizontal wells. The table below summarizes our Coiled Tubing Services fleet by pipe diameter as of December 31, 2017:
Pipe Diameter | |||||||||||
< 2” | ≥ 2” < 2.375” | ≥ 2.375” | Total | ||||||||
Active | 10 | 3 | 11 | 24 | |||||||
Warm stacked | 4 | 6 | 1 | 11 | |||||||
Cold stacked | 6 | 7 | 1 | 14 | |||||||
Total | 20 | 16 | 13 | 49 | |||||||
Fluid Management Services
We have an extensive and diverse fleet of oilfield transportation service vehicles. We broadly define an oilfield transportation service vehicle as any heavy-duty, revenue-generating vehicle weighing over one ton. Our transportation fleet includes vacuum trucks, winch trucks, hot oilers and other vehicles, including kill trucks and various hauling and transport trucks. The table below summarizes our Fluid Management Services fleet as of December 31, 2017:
Active | Warm Stacked | Cold Stacked | Total | ||||||||
Truck Type | |||||||||||
Vacuum Trucks | 279 | 160 | 58 | 497 | |||||||
Winch Trucks | 86 | 33 | 10 | 129 | |||||||
Hot Oil Trucks | 32 | 21 | 6 | 59 | |||||||
Kill Trucks | 39 | 31 | 11 | 81 | |||||||
Other | 47 | 15 | 20 | 82 | |||||||
Total | 483 | 260 | 105 | 848 | |||||||
7
Disposal Wells
As part of our Fluid Management Services, we provide disposal services for fluids produced subsequent to well completion. These fluids are removed from the well site and transported for disposal in SWD wells. The table below summarizes our SWD facilities, and brine and freshwater stations by state as of December 31, 2017:
Owned | Leased(1) | Total | ||||||
Location | ||||||||
Arkansas | 1 | — | 1 | |||||
Louisiana | 3 | — | 3 | |||||
New Mexico | 1 | 9 | 10 | |||||
Texas | 25 | 27 | 52 | |||||
Total | 30 | 36 | 66 | |||||
(1) | Includes SWD facilities as “leased” if we own the wellbore for the SWD but lease the land. In other cases, we lease both the wellbore and the land. Lease terms vary among different sites, but with respect to some of the SWD facilities for which we lease the land and own the wellbore, the land owner has an option under the land lease to retain the wellbore at the termination of the lease. |
Other Business Data
Raw Materials
We purchase a wide variety of raw materials, parts and components that are made by other manufacturers and suppliers for our use. We are not dependent on any single source of supply for those parts, supplies or materials.
Customers
Our customers include major oil companies, independent oil and natural gas production companies. During the year ended December 31, 2017, the period from January 1, 2016 through December 15, 2016 and the year ended December 31, 2015, Chevron Texaco Exploration and Production accounted for approximately 12%, 14% and 15% of our consolidated revenue, respectively. During the period from January 1, 2016 through December 15, 2016, OXY USA Inc. accounted for approximately 13% of our consolidated revenue. No other customer accounted for more than 10% of our consolidated revenue during the year ended December 31, 2017, periods ended from January 1, 2016 through December 15, 2016, December 16, 2016 through December 31, 2016 or in the year ended December 31, 2016.
Receivables outstanding for OXY USA Inc. were approximately 11% of our total accounts receivable as of December 31, 2016. No other customers accounted for more than 10% of our total accounts receivable as of December 31, 2017 and 2016.
Competition and Other External Factors
The markets in which we operate are highly competitive. Competition is influenced by such factors as product and service quality and availability, responsiveness, experience, technology, equipment quality, reputation for safety and price. We believe that an important competitive factor in establishing and maintaining long-term customer relationships is having an experienced, skilled and well-trained work force. We devote substantial resources toward employee safety and training programs. In addition, we believe that our proprietary KeyView® system provides important safety enhancements. We believe many of our larger customers place increased emphasis on the safety, performance and quality of the crews, equipment and services provided by their contractors. Although we believe customers consider all of these factors, price is often the primary factor in determining which service provider is awarded the work. However, in numerous instances, we secure and maintain work for large customers for which efficiency, safety, technology, size of fleet and availability of other services are of equal importance to price.
The demand for our services and price we receive fluctuates, primarily in relation to the price (or anticipated price) of oil and natural gas, which, in turn, is driven for the most part by the supply of, and demand for, oil and natural gas. Generally, as supply of those commodities decreases and demand increases, service and maintenance requirements increase as oil and natural gas producers attempt to maximize the productivity of their wells in a higher priced environment. However, in a lower oil and natural gas price environment, demand for service and maintenance generally decreases as oil and natural gas producers decrease their activity. In particular, the demand for new or existing field drilling and completion work is driven by available investment capital for such work. Because these types of services can be easily “started” and “stopped,” and oil and natural gas producers generally tend to be less risk tolerant when commodity prices are low or volatile, we may experience a more rapid decline in demand for well maintenance services compared with demand for other types of oilfield services. Furthermore, in a low commodity
8
price environment, fewer well service rigs are needed for completions, as these activities are generally associated with drilling activity.
The level of our revenues, earnings and cash flows are substantially dependent upon, and affected by, the level of U.S. and international oil and natural gas exploration, development and production activity, as well as the equipment capacity in any particular region.
Seasonality
Our operations are impacted by seasonal factors. Historically, our business has been negatively impacted during the winter months due to inclement weather, fewer daylight hours and holidays. During the summer months, our operations may be impacted by tropical or other inclement weather systems. During periods of heavy snow, ice or rain, we may not be able to operate or move our equipment between locations, thereby reducing our ability to provide services and generate revenues. In addition, the majority of our equipment works only during daylight hours. In the winter months when days become shorter, this reduces the amount of time that our assets can work and therefore has a negative impact on total hours worked. Lastly, during the fourth quarter, we historically experience a significant slowdown during the Thanksgiving and Christmas holiday seasons and demand sometimes slows during this period as our customers exhaust their annual spending budgets.
Patents, Trade Secrets, Trademarks and Copyrights
We own numerous patents, trademarks and proprietary technology that we believe provide us with a competitive advantage in the various markets in which we operate or intend to operate. We have devoted significant resources to developing technological improvements in our well service business and have sought patent protection both inside and outside the United States for products and methods that appear to have commercial significance. All the issued patents have varying remaining durations and begin expiring between 2018 and 2035. The most notable of our technologies include numerous patents surrounding our KeyView® system.
We own several trademarks that are important to our business. In general, depending upon the jurisdiction, trademarks are valid as long as they are in use, or their registrations are properly maintained and they have not been found to become generic. Registrations of trademarks can generally be renewed indefinitely as long as the trademarks are in use. While our patents and trademarks, in the aggregate, are of considerable importance to maintaining our competitive position, no single patent or trademark is considered to be of a critical or essential nature to our business.
We also rely on a combination of trade secret laws, copyright and contractual provisions to establish and protect proprietary rights in our products and services. We typically enter into confidentiality agreements with our employees, strategic partners and suppliers and limit access to the distribution of our proprietary information.
Employees
As of December 31, 2017, we employed approximately 3,000 persons. Our employees are not represented by a labor union and are not covered by collective bargaining agreements. As noted below in “Item 1A. Risk Factors,” we have historically experienced a high employee turnover rate. We have not experienced any significant work stoppages associated with labor disputes or grievances and consider our relations with our employees to be generally satisfactory.
Governmental Regulations
Our operations are subject to various federal, state and local laws and regulations pertaining to health, safety and the environment. We cannot predict the level of enforcement of existing laws or regulations or how such laws and regulations may be interpreted by enforcement agencies or court rulings in the future. We also cannot predict whether additional laws and regulations affecting our business will be adopted, or the effect such changes might have on us, our financial condition or our business. The following is a summary of the more significant existing environmental, health and safety laws and regulations to which our operations are subject and for which a lack of compliance may have a material adverse impact on our results of operations, financial position or cash flows. We believe that we are in material compliance with all such laws.
Environmental Regulations
Our operations routinely involve the storage, handling, transport and disposal of bulk waste materials, some of which contain oil, contaminants and other regulated substances. Various environmental laws and regulations require prevention, and where necessary, cleanup of spills and leaks of such materials, and some of our operations must obtain permits that limit the discharge of materials. Failure to comply with such environmental requirements or permits may result in fines and penalties, remediation orders and revocation of permits.
9
Hazardous Substances and Waste
The Comprehensive Environmental Response, Compensation, and Liability Act, as amended, referred to as “CERCLA” or the “Superfund” law, and comparable state laws, impose liability without regard to fault or the legality of the original conduct of certain defined persons, including current and prior owners or operators of a site where a release of hazardous substances occurred and entities that disposed or arranged for the disposal of the hazardous substances found at the site. Under CERCLA, these “responsible persons” may be jointly and severally liable for the costs of cleaning up the hazardous substances, for damages to natural resources and for the costs of certain health studies.
In the course of our operations, we occasionally generate materials that are considered “hazardous substances” and, as a result, may incur CERCLA liability for cleanup costs. Also, claims may be filed for personal injury and property damage allegedly caused by the release of hazardous substances or other pollutants. We also generate solid wastes that are subject to the requirements of the Resource Conservation and Recovery Act, as amended, or “RCRA,” and comparable state statutes.
Although we use operating and disposal practices that are standard in the industry, hydrocarbons or other wastes may have been released at properties owned or leased by us now or in the past, or at other locations where these hydrocarbons and wastes were taken for treatment or disposal. Under CERCLA, RCRA and analogous state laws, we could be required to clean up contaminated property (including contaminated groundwater), or to perform remedial activities to prevent future contamination.
Air Emissions
The Clean Air Act, as amended, or “CAA,” and similar state laws and regulations restrict the emission of air pollutants and also impose various monitoring and reporting requirements. These laws and regulations may require us to obtain approvals or permits for construction, modification or operation of certain projects or facilities and may require use of emission controls.
Global Warming and Climate Change
Some scientific studies suggest that emissions of greenhouse gases (including carbon dioxide and methane) may contribute to warming of Earth’s atmosphere. While we do not believe our operations raise climate change issues different from those generally raised by commercial use of fossil fuels, legislation or regulatory programs that restrict greenhouse gas emissions in areas where we conduct business could increase our costs in order to comply with any new laws.
Water Discharges
We operate facilities that are subject to requirements of the Clean Water Act, as amended, or “CWA,” and analogous state laws that impose restrictions and controls on the discharge of pollutants into navigable waters. Spill prevention, control and counter-measure requirements under the CWA require implementation of measures to help prevent the contamination of navigable waters in the event of a hydrocarbon spill. Other requirements for the prevention of spills are established under the Oil Pollution Act of 1990, as amended, or “OPA,” which applies to owners and operators of vessels, including barges, offshore platforms and certain onshore facilities. Under OPA, regulated parties are strictly and jointly and severally liable for oil spills and must establish and maintain evidence of financial responsibility sufficient to cover liabilities related to an oil spill for which such parties could be statutorily responsible.
Occupational Safety and Health Act
We are subject to the requirements of the federal Occupational Safety and Health Act, as amended, or “OSHA,” and comparable state laws that regulate the protection of employee health and safety. OSHA’s hazard communication standard requires that information about hazardous materials used or produced in our operations be maintained and provided to employees and state and local government authorities.
Saltwater Disposal Wells
We operate SWD wells that are subject to the CWA, Safe Drinking Water Act, and state and local laws and regulations, including those established by the Underground Injection Control Program of the Environmental Protection Agency, or “EPA,” which establishes the minimum program requirements. Most of our SWD wells are located in Texas. We also operate SWD wells in Arkansas, Louisiana and New Mexico. Regulations in these states require us to obtain an Underground Injection Control permit to operate each of our SWD wells. The applicable regulatory agency may suspend or modify one or more of our permits if our well operations are likely to result in pollution of freshwater, substantial violation of permit conditions or applicable rules, or if the well leaks into the environment.
10
Access to Company Reports
Our Web site address is www.keyenergy.com, and we make available free of charge through our Web site our Annual Reports on Form 10-K, Quarterly Reports on Form 10-Q, Current Reports on Form 8-K and all amendments to those reports, as soon as reasonably practicable after such materials are electronically filed with or furnished to the Securities and Exchange Commission (“SEC”). Our Web site also includes general information about us, including our Corporate Governance Guidelines and charters for the committees of our board of directors. Information on our Web site or any other Web site is not a part of this report.
ITEM 1A. RISK FACTORS
In addition to the other information in this report, the following factors should be considered in evaluating us and our business.
Risks Related to Our Business
The depressed conditions in our industry have materially and adversely affected our results of operations, cash flows and financial condition during 2017 and, unless conditions in our industry improve, this trend could continue during 2018 and potentially beyond.
Oil and natural gas prices began a rapid and substantial decline in the fourth quarter of 2014. Depressed commodity price conditions persisted and worsened during 2015 and remained depressed and volatile during 2016 and 2017. As a result, demand for our products and services declined substantially from 2014, and the prices we are able to charge our customers for our products and services also declined substantially. These trends materially and adversely affected our results of operations, cash flows and financial condition during 2017 and, unless conditions in our industry improve, this trend will continue during 2018 and potentially beyond.
We had substantial net losses during 2015, 2016 and 2017, and, during 2017, our cash flow used by operations was $51.4 million. If industry conditions do not improve, we may continue to suffer net losses and negative cash flows from operations.
Although our financial position has improved as a result of the reorganization and we are continuing to pursue cost reduction initiatives, there can be no assurance that we will be able to successfully consummate these initiatives or that they will be successful to improve our financial condition and liquidity.
Our business is cyclical and depends on conditions in the oil and natural gas industry, especially oil and natural gas prices and capital and operating expenditures by oil and natural gas companies. A continuation of the depressed state of our industry, tight credit markets and disruptions in the U.S. and global economies and financial systems may adversely impact our business.
Prices for oil and natural gas historically have been volatile as a result of changes in the supply of, and demand for, oil and natural gas and other factors. The significant decline in oil and natural gas prices that began in 2014 and continued throughout 2015, 2016 and 2017 caused many of our customers to significantly reduce drilling, completion and other production activities and related spending on our products and services in those years. In addition, the reduction in demand from our customers has resulted in an oversupply of many of the services and products we provide, and such oversupply substantially reduced the prices we can charge our customers for our services.
We depend on our customers’ willingness to make capital expenditures to explore for, develop and produce oil and natural gas. Therefore, weakness in oil and natural gas prices (or the perception by our customers that oil and natural gas prices will remain reduced or will continue to decrease in the future) has and may continue to result in a reduction in the utilization of our equipment and in lower rates for our services. In addition to adversely affecting us, the continuation and worsening of these conditions have resulted and may continue to result in a material adverse impact on certain of our customers’ liquidity and financial position resulting in further spending reductions, delays in payment of, or non-payment of, amounts owing to us and similar impacts. These conditions have had and may continue to have an adverse impact on our financial conditions, results of operations and cash flows, and it is difficult to predict how long the current uncertain commodity price environment will continue.
Many factors affect the supply of and demand for oil and natural gas and, therefore, influence product prices, including:
• | prices, and expectations about future prices, of oil and natural gas; |
• | domestic and worldwide economic conditions; |
• | domestic and foreign supply of and demand for oil and natural gas; |
• | the price and quantity of imports of foreign oil and natural gas including the ability of OPEC to set and maintain production levels for oil; |
• | the cost of exploring for, developing, producing and delivering oil and natural gas; |
• | the level of excess production capacity, available pipeline, storage and other transportation capacity; |
• | lead times associated with acquiring equipment and products and availability of qualified personnel; |
11
• | the expected rates of decline in production from existing and prospective wells; |
• | the discovery rates of new oil and gas reserves; |
• | federal, state and local regulation of exploration and drilling activities and equipment, material or supplies that we furnish; |
• | public pressure on, and legislative and regulatory interest within, federal, state and local governments to stop, significantly limit or regulate hydraulic fracturing activities; |
• | weather conditions, including hurricanes, that can affect oil and natural gas operations over a wide area and severe winter weather that can interfere with our operations; |
• | political instability in oil and natural gas producing countries; |
• | advances in exploration, development and production technologies or in technologies affecting energy consumption; |
• | the price and availability of alternative fuel and energy sources; |
• | uncertainty in capital and commodities markets; and |
• | changes in the value of the U.S. dollar relative to other major global currencies. |
Spending by exploration and production companies has also been, and may continue to be, impacted by conditions in the capital markets. Limitations on the availability of capital, and higher costs of capital, for financing expenditures have contributed to exploration and production companies making materially significant reductions to capital or operating budgets and such limitations may continue if oil and natural gas prices remain at current levels or decrease further. Such cuts in spending have curtailed, and may continue to curtail, drilling programs as well as discretionary spending on well services, which has resulted, and may continue to result, in a reduction in the demand for our services, the rates we can charge and the utilization of our assets. Moreover, reduced discovery rates of new oil and natural gas reserves, and a decrease in the development rate of reserves in our market areas whether due to increased governmental regulation, limitations on exploration and drilling activity or other factors, have had, and may continue to have, a material adverse impact on our business, even in a stronger oil and natural gas price environment.
A substantial decline in oil and natural gas prices generally leads to decreased spending by our customers. While higher oil and natural gas prices generally lead to increased spending by our customers, sustained high energy prices can be an impediment to economic growth, and can therefore negatively impact spending by our customers. Our customers also take into account the volatility of energy prices and other risk factors by requiring higher returns for individual projects if there is higher perceived risk. Any of these factors could affect the demand for oil and natural gas and could have a material adverse effect on our business, financial condition, results of operations and cash flow.
The amount of our debt and the covenants in the agreements governing our debt could negatively impact our financial condition, results of operations and business prospects.
Although we reduced the amount of our debt by approximately $697 million as a result of the reorganization in 2016, as of December 31, 2017, we had $245.6 million of total debt. Our level of indebtedness, and the covenants contained in the agreements governing our debt, could have important consequences for our operations, including:
• | making it more difficult for us to satisfy our obligations under the agreements governing our indebtedness and increasing the risk that we may default on our debt obligations; |
• | requiring us to dedicate a substantial portion of our cash flow from operations to required payments on indebtedness, thereby reducing the availability of cash flow for working capital, capital expenditures and other general business activities; |
• | limiting our ability to obtain additional financing in the future for working capital, capital expenditures, acquisitions, general corporate purposes and other activities; |
• | limiting management's flexibility in operating our business; |
• | limiting our flexibility in planning for, or reacting to, changes in our business and the industry in which we operate; |
• | diminishing our ability to successfully withstand a downturn in our business or the economy generally; |
• | placing us at a competitive disadvantage against less leveraged competitors; and |
• | making us vulnerable to increases in interest rates, because our debt has variable interest rates. |
As more fully described in “Item 7. Management’s Discussion and Analysis of Financial Condition and Results of Operations - Liquidity and Capital Resources”, each of our ABL Facility and our Term Loan Facility contains affirmative and negative covenants, including financial ratios and tests, with which we must comply. These covenants include, among others, covenants that restrict our ability to take certain actions without the permission of the holders of our indebtedness, including the incurrence of debt, the granting of liens, the making of investments, the payment of dividends and the sale of assets, and the financial ratios and tests include, among others, a requirement that we comply with a minimum liquidity covenant, a minimum asset coverage ratio and, during certain periods, a minimum fixed charge coverage ratio. In addition, under our Term Loan Facility and ABL Facility, we are required to take certain steps to perfect the security interest in the collateral within specified periods following the closing of those facilities.
12
Our ability to satisfy required financial covenants, ratios and tests in our debt agreements can be affected by events beyond our control, including commodity prices, demand for our services, the valuation of our assets, as well as prevailing economic, financial and industry conditions, and we can offer no assurance that we will be able to remain in compliance with such covenants or that the holders of our indebtedness will not seek to assert that we are not in compliance with our covenants. A breach of any of these covenants, ratios or tests could result in a default under our indebtedness. If we default, lenders under our ABL Facility will no longer be obligated to extend credit to us, and they and the administrative agent under our Term Loan Facility could declare all amounts of outstanding debt, together with accrued interest, to be immediately due and payable. The results of such actions would have a significant negative impact on our results of operations, financial position and cash flows, and absent strategic alternatives such as refinancing or restructuring our indebtedness or capital structure, we would not have sufficient liquidity to repay all of our outstanding indebtedness. If such a result were to occur, we may be forced into bankruptcy or forced to again seek bankruptcy protection to restructure our business and capital structure and may have to liquidate our assets and may receive less than the value at which those assets are carried on our financial statements.
We may incur more debt and long-term lease obligations in the future.
The agreements governing our long-term debt restrict, but do not prohibit, us from incurring additional indebtedness and other obligations in the future. As of December 31, 2017, we had $245.6 million of total debt.
An increase in our level of indebtedness could exacerbate the risks described in the immediately preceding risk factor and the occurrence of any of such events could result in a material adverse effect on our business, financial condition, results of operations, and business prospects.
We may not be able to generate sufficient cash flow to meet our debt service and other obligations.
Our ability to make payments on our indebtedness and to fund planned capital expenditures and other costs of our operations depends on our ability to generate cash in the future. This, to a large extent, is subject to conditions in the oil and natural gas industry, including commodity prices, demand for our services and the prices we are able to charge for our services, general economic and financial conditions, competition in the markets in which we operate, the impact of legislative and regulatory actions on how we conduct our business and other factors, all of which are beyond our control. During fiscal year 2017, we had negative cash flows from operations, and this trend could continue if conditions in our industry continue or worsen.
Our variable rate indebtedness subjects us to interest rate risk, which could cause our debt service obligations to increase significantly.
Borrowings under our ABL Facility and our Term Loan Facility bear interest at variable rates, exposing us to interest rate risk. If interest rates increase, our debt service obligations on the variable rate indebtedness would increase even though the amount borrowed would remain the same, and our net income and cash available for servicing our indebtedness would decrease.
We may be unable to implement price increases or maintain existing prices on our core services.
We periodically seek to increase the prices of our services to offset rising costs and to generate higher returns for our stockholders. Currently, the prices we are able to charge for our services and the demand for such services are severely depressed. Even when industry conditions are favorable, we operate in a very competitive industry and as a result, we are not always successful in raising, or maintaining our existing prices. Additionally, during periods of increased market demand, a significant amount of new service capacity, including new well service rigs, fluid hauling trucks, coiled tubing units and new fishing and rental equipment, may enter the market, which also puts pressure on the pricing of our services and limits our ability to increase or maintain prices. Furthermore, during periods of declining pricing for our services, we may not be able to reduce our costs accordingly, which could further adversely affect our profitability.
Even when we are able to increase our prices, we may not be able to do so at a rate that is sufficient to offset such rising costs. In periods of high demand for oilfield services, a tighter labor market may result in higher labor costs. During such periods, our labor costs could increase at a greater rate than our ability to raise prices for our services. Also, we may not be able to successfully increase prices without adversely affecting our activity levels. The inability to maintain our prices or to increase our prices as costs increase could have a material adverse effect on our business, financial position and results of operations.
We participate in a capital-intensive industry. We may not be able to finance future growth of our operations or future acquisitions.
Our activities require substantial capital expenditures. If our cash flow from operating activities and borrowings under our ABL Facility are not sufficient to fund our capital expenditure budget, we would be required to reduce these expenditures or fund these expenditures through debt or equity or alternative financing plans, such as refinancing or restructuring our debt or selling assets.
Our ability to raise debt or equity capital or to refinance or restructure our debt will depend on the condition of the capital markets and our financial condition at such time, among other things. Any refinancing of our debt could be at higher interest rates
13
and may require us to comply with more onerous covenants, which could further restrict our business operations. The terms of existing or future debt instruments may restrict us from adopting some of these alternatives. Any of the foregoing consequences could materially and adversely affect our business, financial condition, results of operations and prospects.
Increased labor costs or the unavailability of skilled workers could hurt our operations.
Companies in our industry, including us, are dependent upon the available labor pool of skilled employees. We compete with other oilfield services businesses and other employers to attract and retain qualified personnel with the technical skills and experience required to provide our customers with the highest quality service. We are also subject to the Fair Labor Standards Act, which governs such matters as minimum wage, overtime and other working conditions, which can increase our labor costs or subject us to liabilities to our employees. A shortage in the labor pool of skilled workers or other general inflationary pressures or changes in applicable laws and regulations could make it more difficult for us to attract and retain personnel and could require us to enhance our wage and benefits packages. Labor costs may increase in the future or we may not be able to reduce wages when demand and pricing falls, and such changes could have a material adverse effect on our business, financial condition and results of operations.
Our future financial results could be adversely impacted by asset impairments or other charges.
We have recorded goodwill impairment charges and asset impairment charges in the past. We periodically evaluate our long-lived assets such as our property and equipment for impairment. We perform the assessment of potential impairment for our property and equipment whenever facts and circumstances indicate that the carrying value of those assets may not be recoverable due to various external or internal factors. If conditions in our industry do not improve or worsen, we could record additional impairment charges in future periods, which could have a material adverse effect on our financial position and results of operations.
Our business involves certain operating risks, which are primarily self-insured, and our insurance may not be adequate to cover all insured losses or liabilities we might incur in our operations.
Our operations are subject to many hazards and risks, including the following:
• | accidents resulting in serious bodily injury and the loss of life or property; |
• | liabilities from accidents or damage by our fleet of trucks, rigs and other equipment; |
• | pollution and other damage to the environment; |
• | reservoir damage; |
• | blow-outs, the uncontrolled flow of natural gas, oil or other well fluids into the atmosphere or an underground formation; and |
• | fires and explosions. |
If any of these hazards occur, they could result in suspension of operations, damage to or destruction of our equipment and the property of others, or injury or death to our or a third party's personnel.
We self-insure against a significant portion of these liabilities. For losses in excess of our self-insurance limits, we maintain insurance from unaffiliated commercial carriers. However, our insurance may not be adequate to cover all losses or liabilities that we might incur in our operations. Furthermore, our insurance may not adequately protect us against liability from all of the hazards of our business. As a result of market conditions, premiums and deductibles for certain of our insurance policies may substantially increase. In some instances, certain insurance could become unavailable or available only for reduced amounts of coverage. We also are subject to the risk that we may be unable to maintain or obtain insurance of the type and amount we desire at a reasonable cost. If we were to incur a significant liability for which we were uninsured or for which we were not fully insured, it could have a material adverse effect on our financial position, results of operations and cash flows.
We operate in a highly competitive industry, with intense price competition, which may intensify as our competitors expand their operations.
The market for oilfield services in which we operate is highly competitive and includes numerous small companies capable of competing effectively in our markets on a local basis, as well as several large companies that possess substantially greater financial resources than we do. Contracts are traditionally awarded on the basis of competitive bids or direct negotiations with customers.
The principal competitive factors in our markets are product and service quality and availability, responsiveness, experience, technology, equipment quality, reputation for safety and price. The competitive environment has intensified as recent mergers among exploration and production companies reduced the number of available customers. The fact that drilling rigs and other vehicles and oilfield services equipment are mobile and can be moved from one market to another in response to market conditions heightens the competition in the industry. We may be competing for work against competitors that may be better able to withstand industry downturns and may be better suited to compete on the basis of price, retain skilled personnel and acquire new equipment and technologies, all of which could affect our revenues and profitability.
14
Historically, we have experienced a high employee turnover rate. Any difficulty we experience replacing or adding workers could adversely affect our business.
We believe that the high turnover rate in our industry is attributable to the nature of oilfield services work, which is physically demanding and performed outdoors. As a result, workers may choose to pursue employment in fields that offer a more desirable work environment at wage rates that are competitive with ours. The potential inability or lack of desire by workers to commute to our facilities and job sites, as well as the competition for workers from competitors or other industries, are factors that could negatively affect our ability to attract and retain workers. We may not be able to recruit, train and retain an adequate number of workers to replace departing workers. The inability to maintain an adequate workforce could have a material adverse effect on our business, financial condition and results of operations.
We may not be successful in implementing and maintaining technology development and enhancements. New technology may cause us to become less competitive.
The oilfield services industry is subject to the introduction of new drilling and completion techniques and services using new technologies, some of which may be subject to patent protection. As competitors and others use or develop new technologies in the future, we may be placed at a competitive disadvantage. Further, we may face competitive pressure to implement or acquire certain new technologies at a substantial cost. Some of our competitors have greater financial, technical and personnel resources that may allow them to implement new technologies before we can. If we are unable to develop and implement new technologies or products on a timely basis and at competitive cost, our business, financial condition, results of operations and cash flows could be adversely affected.
A component of our business strategy is to incorporate the KeyView® system, our proprietary technology, into our well service rigs. The inability to successfully develop, integrate and protect this technology could:
• | limit our ability to improve our market position; |
• | increase our operating costs; and |
• | limit our ability to recoup the investments made in this technological initiative. |
The loss of or a substantial reduction in activity by one or more of our largest customers could materially and adversely affect our business, financial condition and results of operations.
One customer accounted for more than 10% of our total consolidated revenues for the year ended December 31, 2017 and our ten largest customers represented approximately 50% of our consolidated revenues for the year ended December 31, 2017. The loss of or a substantial reduction in activity by one or more of these customers could have an adverse effect on our business, financial condition and results of operations.
Potential adoption of future state or federal laws or regulations surrounding the hydraulic fracturing process could make it more difficult to complete oil or natural gas wells and could materially and adversely affect our business, financial condition and results of operations.
Many of our customers utilize hydraulic fracturing services during the life of a well. Hydraulic fracturing is the process of creating or expanding cracks, or fractures, in underground formations where water, sand and other additives are pumped under high pressure into the formation. Although we are not a provider of hydraulic fracturing services, many of our services complement the hydraulic fracturing process.
Legislation has been introduced in Congress to provide for broader federal regulation of hydraulic fracturing operations and the reporting and public disclosure of chemicals used in the fracturing process. Additionally, the EPA has asserted federal regulatory authority over certain hydraulic fracturing activities involving diesel fuel under the Safe Drinking Water Act and in May 2012 issued draft guidance for fracturing operations that involved diesel fuels. If additional levels of regulation or permitting requirements were imposed through the adoption of new laws and regulations, our customers' business and operations could be subject to delays and increased operating and compliance costs, which could negatively impact the number of active wells in the marketplaces we serve. New regulations addressing hydraulic fracturing and chemical disclosure have been approved or are under consideration by a number of states and some municipalities have sought to restrict or ban hydraulic fracturing within their jurisdictions. For example, in June 2015, the New York Department of Environmental Conservation issued a findings statement concluding its seven-year study of high-volume hydraulic fracturing, thereby officially prohibiting the practice in New York. Additionally, in California, legislation regarding well stimulation, including hydraulic fracturing, has been adopted. The law mandates technical standards for well construction, hydraulic fracturing water management, groundwater monitoring, seismicity monitoring during hydraulic fracturing operations and public disclosure of hydraulic fracturing fluid constituents. These and other new federal, state or municipal laws regulating the hydraulic fracturing process could negatively impact our business, financial condition and results of operations.
15
Permit conditions, legislation or regulatory initiatives could restrict our ability to dispose of fluids produced subsequent to well completion, which could have a material adverse effect on our business.
As part of our fluid management services, we provide disposal services for fluids produced subsequent to well completion. These fluids are removed from the well site and transported for disposal in SWD wells. We operate SWD wells that are subject to the CWA, the Safe Drinking Water Act, and state and local laws and regulations, including those established by the Underground Injection Control Program of the EPA, which establishes the minimum program requirements. Most of our SWD wells are located in Texas. We also operate SWD wells in Arkansas, Louisiana and New Mexico. Regulations in these states require us to obtain an Underground Injection Control permit to operate each of our SWD wells. The applicable regulatory agency may suspend or modify one or more of our permits if our well operations are likely to result in pollution of freshwater or substantial violation of permit conditions or applicable rules, or if the well leaks into the environment.
In addition, there exists a growing concern that the injection of produced fluids into belowground disposal wells may trigger seismic activity in certain areas. In response to these concerns, regulators in some states are pursuing initiatives designed to impose additional requirements in connection with the permitting of SWD wells or otherwise to assess any relationship between seismicity and oil and gas operations. For example, in 2014, the Texas Railroad Commission, or TRC, published a rule governing permitting or re-permitting of disposal wells in Texas that would require, among other things, the submission of information on seismic events occurring within a specified radius of the disposal well location, as well as logs, geologic cross sections and structure maps relating to the disposal area in question. If a permittee or a prospective permittee fails to demonstrate that the saltwater or other fluids are confined to the disposal zone or if scientific data indicates such a disposal well is likely to be or determined to be contributing to seismic activity, then the TRC may deny, modify, suspend or terminate the permit application or existing operating permit for that well.
The imposition of permit conditions or the adoption and implementation of any new laws, regulations, or directives that restrict our ability to dispose of produced fluids, including by restricting disposal well locations, changing the depths of disposal wells, reducing the volume of wastewater disposed in wells, or requiring us to shut down disposal wells or otherwise, could lead to operational delays and increased operating costs, which could materially and adversely affect our business, financial condition and results of operations.
We may incur significant costs and liabilities as a result of environmental, health and safety laws and regulations that govern our operations.
Our operations are subject to U.S. federal, state and local laws and regulations that impose limitations on the discharge of pollutants into the environment and establish standards for the handling, storage and disposal of waste materials, including toxic and hazardous wastes. To comply with these laws and regulations, we must obtain and maintain numerous permits, approvals and certificates from various governmental authorities. While the cost of such compliance has not been significant in the past, new laws, regulations or enforcement policies could become more stringent and significantly increase our compliance costs or limit our future business opportunities, which could have a material adverse effect on our financial condition and results of operations.
Our operations pose risks of environmental liability, including leakage from our operations to surface or subsurface soils, surface water or groundwater. Some environmental laws and regulations may impose strict liability, joint and several liability, or both. Therefore, in some situations, we could be exposed to liability as a result of our conduct that was lawful at the time it occurred or the conduct of, or conditions caused by, third parties without regard to whether we caused or contributed to the conditions. Actions arising under these laws and regulations could result in the shutdown of our operations, fines and penalties, expenditures for remediation or other corrective measures, and claims for liability for property damage, exposure to hazardous materials, exposure to hazardous waste or personal injuries. Sanctions for noncompliance with applicable environmental laws and regulations also may include the assessment of administrative, civil or criminal penalties, revocation of permits, temporary or permanent cessation of operations in a particular location and issuance of corrective action orders. Such claims or sanctions and related costs could cause us to incur substantial costs or losses and could have a material adverse effect on our business, financial condition, results of operations and cash flow. Additionally, an increase in regulatory requirements on oil and natural gas exploration and completion activities could significantly delay or interrupt our operations.
The scope of regulation of our services may increase in light of the April 2010 Macondo accident and resulting oil spill in the Gulf of Mexico, including possible increases in liabilities or funding requirements imposed by governmental agencies. In 2012, the Bureau of Safety and Environmental Enforcement, or “BSEE,” expanded its regulatory oversight beyond oil and gas operators to include service and equipment contractors. In addition, U.S. federal law imposes on certain entities deemed to be “responsible parties” a variety of regulations related to the prevention of oil spills, releases of hazardous substances, and liability for removal costs and natural resource, real property and certain economic damages arising from such incidents. Some of these laws may impose strict and/or joint and several liability for certain costs and damages without regard to the conduct of the parties. As a provider of services and rental equipment for offshore drilling and workover services, we may be deemed a “responsible party” under federal law. The implementation of such laws and the adoption and implementation of future regulatory initiatives, or the specific responsibilities that may arise from such initiatives may subject us to increased costs and liabilities, which could interrupt our operations or have an adverse effect on our revenue or results of operations.
16
Severe weather could have a material adverse effect on our business.
Our business could be materially and adversely affected by severe weather. Our customers' oil and natural gas operations located in Louisiana and parts of Texas may be adversely affected by hurricanes and tropical storms, resulting in reduced demand for our services. Furthermore, our customers' operations may be adversely affected by seasonal weather conditions. Adverse weather can also directly impede our own operations. Repercussions of severe weather conditions may include:
• | curtailment of services; |
• | weather-related damage to facilities and equipment, resulting in suspension of operations; |
• | inability to deliver equipment, personnel and products to job sites in accordance with contract schedules; and |
• | loss of productivity. |
These constraints could delay our operations and materially increase our operating and capital costs. Unusually warm winters may also adversely affect the demand for our services by decreasing the demand for natural gas.
Acquisitions and divestitures - we may not be successful in identifying, making and integrating acquisitions or limiting ongoing costs associated with the operations we divest.
An important component of our growth strategy is to make acquisitions that will strengthen our core services or presence in selected markets. The success of this strategy will depend, among other things, on our ability to identify suitable acquisition candidates, to negotiate acceptable financial and other terms, to timely and successfully integrate acquired business or assets into our existing businesses and to retain the key personnel and the customer base of acquired businesses. Any future acquisitions could present a number of risks, including but not limited to:
• | incorrect assumptions regarding the future results of acquired operations or assets or expected cost reductions or other synergies expected to be realized as a result of acquiring operations or assets; |
• | failure to successfully integrate the operations or management of any acquired operations or assets in a timely manner; |
• | failure to retain or attract key employees; |
• | diversion of management's attention from existing operations or other priorities; |
• | the inability to implement promptly an effective control environment; |
• | potential impairment charges if purchase assumptions are not achieved or market conditions decline; |
• | the risks inherent in entering markets or lines of business with which the company has limited or no prior experience; and |
• | inability to secure sufficient financing, sufficient financing on economically attractive terms that may be required for any such acquisition or investment. |
Our business strategy anticipates, and is based upon our ability to successfully complete and integrate, acquisitions of other businesses or assets in a timely and cost effective manner. Our failure to do so could adversely affect our business, financial condition or results of operations.
We also make strategic divestitures from time to time. In the case of divestitures, we may agree to indemnify acquiring parties for certain liabilities arising from our former businesses. These divestitures may also result in continued financial involvement in the divested businesses, including through guarantees, service level agreements, or other financial arrangements, following the transaction. Lower performance by those divested businesses could affect our future financial results if there is contingent consideration associated.
Compliance with climate change legislation or initiatives could negatively impact our business.
Various state governments and regional organizations comprising state governments are considering enacting new legislation and promulgating new regulations governing or restricting the emission of greenhouse gases, or “GHG,” from stationary sources, which may include our equipment and operations. At the federal level, the EPA has already issued regulations that require us to establish and report an inventory of GHG emissions. The EPA also has established a GHG permitting requirement for large stationary sources and may lower the threshold of the permitting program, which could include our equipment and operations. Legislative and regulatory proposals for restricting GHG emissions or otherwise addressing climate change could require us to incur additional operating costs and could adversely affect demand for natural gas and oil. The potential increase in our operating costs could include new or increased costs to obtain permits, operate and maintain our equipment and facilities, install new emission controls on our equipment and facilities, acquire allowances to authorize our greenhouse gas emissions, pay taxes related to our GHG emissions and administer and manage a GHG emissions program.
In addition, in December, 2014, California adopted GHG emission rules for heavy duty vehicles equivalent to EPA rules and an optional lower emission standard for nitrogen oxides (“NOx”) in California. California has stated its intention to lower NOx standards for California-certified engines and has also requested that the EPA lower its standards. In June 2016, several regional air quality management districts in California and other states, as well as the environmental agencies for several states, petitioned the EPA to adopt lower NOx emission standards for on-road heavy duty trucks and engines. We expect that heavy duty vehicle and engine fuel economy and GHG emissions rules will be under consideration in other jurisdictions in the future. We
17
may incur significant capital expenditures and administrative costs as we update our transportation fleet to comply with emissions laws and regulations.
Conservation measures and technological advances could reduce demand for oil and natural gas.
Fuel conservation measures, alternative fuel requirements, increasing consumer demand for alternatives to oil and natural gas, technological advances in fuel economy and energy generation could reduce demand for oil and natural gas. Moreover, incentives to conserve energy or use alternative energy sources could reduce demand for oil and natural gas. Management cannot predict the impact of the changing demand for oil and natural gas services and products, and any major changes may have a material effect on our business, financial condition, results of operations and cash flows.
Risks Related to Our Emergence from Bankruptcy
Information contained in our historical financial statements will not be comparable to the information contained in our financial statements after the application of fresh start accounting.
This Annual Report on Form 10-K reflects the consummation of the Plan and the adoption of fresh start accounting. As a result, our financial statements from and after the Effective Date will not be comparable to our financial statements for prior periods. This will make it difficult for stockholders to assess our performance in relation to prior periods. Please see “Note 3. Fresh Start Accounting” in “Item 8. Financial Statements and Supplementary Data” for additional information.
We have a limited operating history since our emergence from bankruptcy and consequently our business plan is difficult to evaluate and our long term viability cannot be assured.
Our prospects for financial success are difficult to assess because we have a limited operating history since emergence from bankruptcy. The Company together with certain subsidiaries filed for Chapter 11 relief on October 24, 2016, and we emerged from bankruptcy on December 15, 2016. There can be no assurance that our business will be successful, that we will be able to achieve or maintain a profitable operation, or that we will not encounter unforeseen difficulties that may deplete our capital resources more rapidly than anticipated. There can be no assurance that we will achieve or sustain profitability or positive cash flows from our operating activities.
Our corporate advisory services agreement may result in financial burden or other adverse effects.
On the Effective Date, the Company entered into the CASA with Platinum, an affiliate of Soter. Pursuant to this agreement, Platinum provides a range of business, financial and accounting advice in exchange for an advisory fee of $2.75 million per year (subject to certain adjustments). During the term of the CASA, the Company will be obligated to accrue and pay the advisory fee in accordance with the terms set forth in the CASA. In addition, the business, financial and accounting advice provided by Platinum to the Company under the CASA could increase the influence that Platinum has over our operations.
The CASA may not be terminated by the Company until December 31, 2019, but Platinum may terminate the CASA at any time upon 90 days’ prior written notice to the Company. The CASA also terminates automatically if Soter owns less than 33% of our common stock. After the termination of the CASA, Key may need to provide its own services to replace those provided under the CASA or procure such services from third parties. Any failure of or delay in procuring comparable services following a termination of the CASA could result in unexpected costs and business disruption.
Risks Related to Our Common Stock
Our controlling stockholder may deter transactions that could be beneficial to other stockholders.
Pursuant to our certificate of incorporation, our bylaws and the Plan, beginning on the Effective Date and until the 2019 annual stockholders meeting (the “Initial Board Term”), directors appointed by Soter, our largest stockholder, will collectively hold votes that constitute a majority of all votes held by directors of the Company. As a result, subject to certain approval rights of directors selected by certain other stockholders, the Soter directors will control decisions made by the board. This control could discourage others from initiating any merger, takeover or other transaction that may otherwise be beneficial to the other holders of shares of our common stock.
After the Initial Board Term, for as long as our Series A Preferred Stock is outstanding, directors selected by Soter will continue to hold votes that constitute a majority of all votes held by all directors. As a result, subject to certain approval rights held by non-Soter directors, the Soter directors will continue to control decisions made by the board, including whether to enter into transactions that may otherwise be beneficial to the other holders of shares of our common stock.
The resale of shares of our common stock, including shares issuable upon exercise of our warrants, may adversely affect the market price of our common stock.
At the time of our emergence from bankruptcy, certain shares of our common stock issued to certain stockholders were “restricted securities” for purposes of the Securities Act of 1933, as amended (the “Securities Act”) and accordingly, were subject to limitations on resale. The shares held by these stockholders (other than the Company) are now freely resalable under the Securities Act without limitations.
18
Furthermore, as of December 16, 2016, there were 919,004 4-Year Warrants and 919,004 5-Year Warrants outstanding. The exercise price of one 4-Year Warrant is $43.52, and the exercise price of one 5-Year Warrant is $54.40, each subject to certain adjustments.
The sale of a significant number of shares of our common stock, including shares issuable upon exercise of our warrants, or substantial trading in our common stock or the perception in the market that substantial trading in our common stock will occur, may adversely affect the market price of our common stock.
We cannot assure you that an active trading market for our common stock will develop or be maintained, and the market price of our common stock may be volatile, which could cause the value of your investment to decline.
The common stock of the Successor Company was listed on the New York Stock Exchange (the “NYSE”) on December 16, 2016, following our emergence from bankruptcy. We cannot assure you that an active public market for our common stock will be sustained. In the absence of an active public trading market, it may be difficult to liquidate your investment in our common stock.
The trading price of our common stock on the NYSE may fluctuate substantially. Numerous factors, including many over which we have no control, may have a significant impact on the market price of our common stock. These risks include those described or referred to in this “Risk Factors” section as well as, among other things:
• | our operating and financial performance and prospects; |
• | our ability to repay our debt; |
• | our access to financial and capital markets to refinance our debt or replace the existing credit facilities; |
• | investor perceptions of us and the industry and markets in which we operate; |
• | future sales of equity or equity-related securities; |
• | changes in earnings estimates or buy/sell recommendations by analysts; and |
• | general financial, domestic, economic and other market conditions. |
The Company does not expect to pay dividends on its common stock in the foreseeable future.
We do not anticipate to pay cash dividends or other distributions with respect to shares of our common stock in the foreseeable future, and we cannot assure that such dividends or other distributions will be paid at any time in the future or at all. In addition, restrictive covenants in our debt agreement limit our ability to pay dividends. As a result, holders of shares of common stock likely will not be able to realize a return on their investment, if any, until the shares are sold.
Certain provisions of our corporate documents and Delaware law, as well as change of control provisions in our debt agreements, could delay or prevent a change of control, even if that change would be beneficial to stockholders, or could have a material negative impact on our business.
Certain provisions in our certificate of incorporation, bylaws and debt agreements may have the effect of deterring transactions involving a change in control, including transactions in which stockholders might receive a premium for their shares.
In addition to the risks of having a controlling stockholder as described in the risk factor “Our controlling stockholder may deter transactions that could be beneficial to other stockholders,” our certificate of incorporation provides for the issuance of up to 10,000,000 shares of preferred stock with such designations, rights and preferences as may be determined from time to time by our board of directors. The authorization of preferred shares empowers our board, without further stockholder approval, to issue preferred shares with dividend, liquidation, conversion, voting or other rights which could adversely affect the voting power or other rights of the holders of the common stock. If issued, the preferred stock could also dilute the holders of our common stock and could be used to discourage, delay or prevent a change of control.
Furthermore, our debt agreements contain provisions pursuant to which an event of default or mandatory prepayment offer may result if certain “persons” or “groups” become the beneficial owner of more than 50.1% of our common stock. This could deter certain parties from seeking to acquire us, and if any “person” or “group” were to become the beneficial owner of more than 50.1% of our common stock, we may not be able to repay our indebtedness.
We are also a Delaware corporation subject to Section 203 of the Delaware General Corporation Law (the “DGCL”). In general, Section 203 of the DGCL prevents an “interested stockholder” (as defined in the DGCL) from engaging in a “business combination” (as defined in the DGCL) with us for three years following the date that person becomes an interested stockholder unless one or more of the following occurs:
• | Before that person became an interested stockholder, our board of directors approved the transaction in which the interested stockholder became an interested stockholder or approved the business combination; |
• | Upon consummation of the transaction that resulted in the interested stockholder becoming an interested stockholder, the interested stockholder owned at least 85% of our voting stock outstanding at the time the transaction commenced, excluding for purposes of determining the voting stock outstanding stock held by certain directors and employee stock plans; or |
19
• | Following the transaction in which that person became an interested stockholder, the business combination is approved by our board of directors and authorized at a meeting of stockholders by the affirmative vote of the holders of at least 66 2/3% of our outstanding voting stock not owned by the interested stockholder. |
The DGCL generally defines “interested stockholder” as any person who, together with affiliates and associates, is the owner of 15% or more of our outstanding voting stock or is our affiliate or associate and was the owner of 15% or more of our outstanding voting stock at any time within the three-year period immediately before the date of determination.
All of these factors could materially adversely affect the price of our common stock.
ITEM 1B. UNRESOLVED STAFF COMMENTS
None.
ITEM 2. PROPERTIES
We lease office space for our principal executive offices in Houston, Texas. Additionally, we own or lease numerous rig facilities, storage facilities, truck facilities and sales and administrative offices throughout the geographic regions in which we operate. We lease temporary facilities to house employees in regions where infrastructure is limited. In connection with our Fluid Management Services, we operate a number of owned and leased SWD facilities, and brine and freshwater stations. Our leased properties are subject to various lease terms and expirations.
We believe all properties that we currently occupy are suitable for their intended uses. We believe that our current facilities are sufficient to conduct our operations. However, we continue to evaluate the purchase or lease of additional properties or the consolidation of our properties, as our business requires.
The following table shows our active owned and leased properties, as well as active SWD facilities as of December 31, 2017:
Office, Repair & Service and Other(1) | SWDs, Brine and Freshwater Stations(2) | Operational Field Services Facilities | ||||||
Owned | 43 | 30 | 59 | |||||
Leased | 28 | 36 | 26 | |||||
TOTAL | 71 | 66 | 85 | |||||
(1) | Includes six residential properties leased in the used to house employees. |
(2) | Includes SWD facilities as “leased” if we own the wellbore for the SWD but lease the land. In other cases, we lease both the wellbore and the land. Lease terms vary among different sites, but with respect to some of the SWD facilities for which we lease the land and own the wellbore, the land owner has an option under the land lease to retain the wellbore at the termination of the lease. |
ITEM 3. LEGAL PROCEEDINGS
We are subject to various suits and claims that have arisen in the ordinary course of business. We do not believe that the disposition of any of our ordinary course litigation will result in a material adverse effect on our consolidated financial position, results of operations or cash flows.
In November 2015, the Santa Barbara County District Attorney filed a criminal complaint against two former employees and Key, specifically alleging three counts of violations of California Labor Code section 6425(a) against Key. The complaint sought unspecified penalties against Key related to an October 12, 2013 accident which resulted in the death of one Key employee at a drilling site near Santa Maria, California. An arraignment was held on February 10, 2016, where Key and its former employees pleaded not guilty to all charges.
On or about January 10, 2017, Key entered into a settlement with the Santa Barbara County District Attorney. Key agreed to plead no contest to one felony count (Count 2), a violation of California Labor Code 6425(a). The Santa Barbara County District Attorney also agreed to recommend total restitution, fines, fees, and surcharges not to exceed $450,000. The court dismissed the remaining charges (Counts 1 and 3) against Key. The parties agreed to postpone sentencing in the matter until January 31, 2018. The parties agreed that if Key pays all of the total restitution, fines, fees, and surcharges by January 31, 2018, the Santa Barbara County District Attorney will not object to Key withdrawing its plea to a felony count on Count 2 and entering a plea to a misdemeanor. On January 31, 2018, the sentence was entered as a misdemeanor and the matter was concluded.
ITEM 4. MINE SAFETY DISCLOSURES
Not applicable.
20
PART II
ITEM 5. MARKET FOR REGISTRANT’S COMMON EQUITY, RELATED STOCKHOLDER MATTERS AND ISSUER PURCHASES OF EQUITY SECURITIES
Market and Share Prices
Our common stock is traded on the NYSE under the symbol “KEG.” As of February 15, 2018, there were 94 registered holders of 20,217,661 issued and outstanding shares of common stock. This number of registered holders does not include holders that have shares of common stock held for them in “street name,” meaning that the shares are held for their accounts by a broker or other nominee. In these instances, the brokers or other nominees are included in the number of registered holders, but the underlying holders of the common stock that have shares held in “street name” are not. The following table sets forth the reported high and low closing price of our common stock for the periods indicated:
High | Low | ||||||
Year Ended December 31, 2017 | |||||||
1st Quarter | $ | 37.55 | $ | 21.54 | |||
2nd Quarter | 25.17 | 15.62 | |||||
3rd Quarter | 19.79 | 11.92 | |||||
4th Quarter | 13.86 | 8.72 | |||||
High | Low | ||||||
Year Ended December 31, 2016 | |||||||
1st Quarter (Predecessor Company) | $ | 0.53 | $ | 0.19 | |||
2nd Quarter (Predecessor Company) | 0.53 | 0.21 | |||||
3rd Quarter (Predecessor Company) | 0.24 | 0.04 | |||||
4th Quarter (Predecessor Company until December 15, 2016) | 0.13 | 0.04 | |||||
4th Quarter (Successor Company from and after December 16, 2016) | 33.25 | 31.50 | |||||
The following Performance Graph and related information shall not be deemed “soliciting material” or to be “filed” with the SEC, nor shall such information be incorporated by reference into any future filing under the Securities Act or the Exchange Act, except to the extent that we specifically incorporate it by reference into such filing.
The following performance graph compares the performance of our common stock to the PHLX Oil Service Sector Index, the Russell 2000 Index and our peer group as established by management. Our peer group consists of the following companies: Archrock, Inc., Basic Energy Services, Inc., C & J Energy Services, Inc., Helix Energy Solutions Group, Inc., Oceaneering International Inc., Oil States International Inc., Patterson UTI Energy Inc., Pioneer Energy Services Corp., RPC, Inc., and Superior Energy Services, Inc. Seventy Seven Energy was formerly in our peer group, however, they were acquired by Patterson UTI Energy Inc. in 2017.
The graph below compares the cumulative total stockholder return on the Successor Company’s common stock from December 16, 2016, the date such common stock was listed on the NYSE, through December 31, 2017. The graph assumes $100 invested on December 16, 2016 in our common stock and $100 invested on each such date in each of the PHLX Oil Service Sector Index, the Russell 2000 Index and our peer group, with dividends reinvested.
21
COMPARISON OF CUMULATIVE TOTAL RETURN*
Among Key Energy Services, Inc., the Russell 2000 Index,
the PHLX Oil Service Sector Index and Peer Group
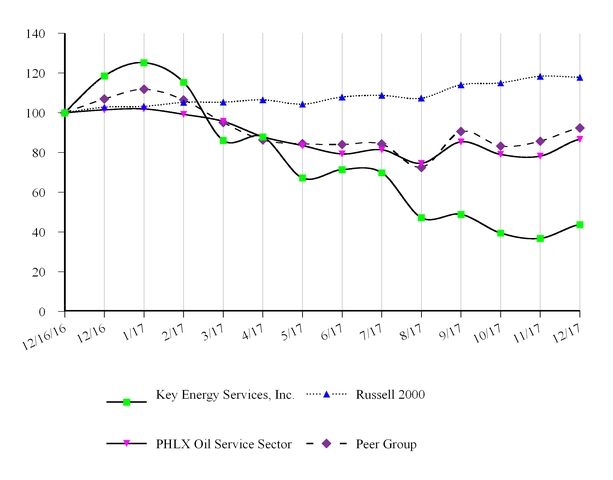
* $100 invested on December 16, 2016 in stock or index, including reinvestment of dividends.
Dividend Policy
There were no dividends declared or paid on our common stock for the years ended December 31, 2017, 2016 and 2015. Under the terms of the ABL Facility and the Term Loan Facility, our ability to pay dividends on the common stock is restricted. We do not currently intend to pay dividends.
Issuer Purchases of Equity Securities
During the fourth quarter of 2017, we repurchased an aggregate of 51,272 shares of our common stock. The repurchases were to satisfy tax withholding obligations that arose upon vesting of restricted stock. Set forth below is a summary of the share repurchases:
Period | Total Number of Shares Purchased | Average Price Paid Per Share | Total Number of Shares Purchased as Part of Publicly Announced Plans(1) | Maximum Number of Shares That May Yet Be Purchased Under the Plan(1) | ||||||||
October 1, 2017 to October 31, 2017 | — | $ | — | — | — | |||||||
November 1, 2017 to November 30, 2017 | — | $ | — | — | — | |||||||
December 1, 2017 to December 31, 2017 | 51,272 | $ | 11.93 | — | — | |||||||
(1) The Company did not have at any time between October 1 and December 31, 2017, and currently does not have, a share repurchase program in place.
22
Equity Compensation Plan Information
The following table sets forth information as of December 31, 2017 with respect to equity compensation plans (including individual compensation arrangements) under which our common stock is authorized for issuance. The material features of each of these plans are described in “Note 21. Share-Based Compensation” in “Item 8. Financial Statement and Supplementary Date.”
Plan Category | Number of Securities to be Issued Upon Exercise of Outstanding Options, Warrants And Rights (a)(2) | Weighted Average Exercise Price of Outstanding Options, Warrants And Rights (b)(3) | Number of Securities Remaining Available for Future Issuance Under Equity Compensation Plans (Excluding Securities Reflected in Column (a)) (c)(4) | ||||||
(in thousands) | (in thousands) | ||||||||
Equity compensation plans approved by stockholders(1) | 1,275 | $ | 34.24 | 1,004 | |||||
Equity compensation plans not approved by stockholders | — | $ | — | — | |||||
Total | 1,275 | 1,004 | |||||||
(1) | Represents stock-based awards outstanding under the 2016 Equity and Cash Incentive Plan (the “2016 ECIP”). |
(2) | Represents shares that may be issued upon vesting of restricted stock units (“RSUs”). |
(3) | RSUs do not have an exercise price; therefore RSUs are excluded from weighted average exercise price of outstanding awards. |
(4) | Represents the number of shares remaining available for grant under the 2016 ECIP as of December 31, 2017. If any common stock underlying an unvested award is canceled, forfeited or is otherwise terminated without delivery of shares, then such shares will again be available for issuance under the 2016 ECIP. |
23
ITEM 6. SELECTED FINANCIAL DATA
The following historical selected financial data as of and for the years ended December 31, 2013 through December 31, 2017 has been derived from our audited financial statements. The historical selected financial data should be read in conjunction with “Item 7. Management’s Discussion and Analysis of Financial Condition and Results of Operations” and the historical consolidated financial statements and related notes thereto included in “Item 8. Financial Statements and Supplementary Data.”
RESULTS OF OPERATIONS DATA
(in thousands, except per share amounts)
Successor | Predecessor | |||||||||||||||||||||||
Year Ended December 31, 2017 | Period from December 16, 2016 through December 31, 2016 | Period from January 1, 2016 through December 15, 2016 | Year Ended December 31, | |||||||||||||||||||||
2015 | 2014 | 2013 | ||||||||||||||||||||||
REVENUES | $ | 436,165 | $ | 17,830 | $ | 399,423 | $ | 792,326 | $ | 1,427,336 | $ | 1,591,676 | ||||||||||||
COSTS AND EXPENSES: | ||||||||||||||||||||||||
Direct operating expenses | 332,332 | 16,603 | 362,825 | 714,637 | 1,059,651 | 1,114,462 | ||||||||||||||||||
Depreciation and amortization expense | 84,542 | 3,574 | 131,296 | 180,271 | 200,738 | 225,297 | ||||||||||||||||||
General and administrative expenses | 115,284 | 6,501 | 163,257 | 202,631 | 249,646 | 221,753 | ||||||||||||||||||
Impairment expense | 187 | — | 44,646 | 722,096 | 121,176 | — | ||||||||||||||||||
Operating income (loss) | (96,180 | ) | (8,848 | ) | (302,601 | ) | (1,027,309 | ) | (203,875 | ) | 30,164 | |||||||||||||
Reorganization items, net | 1,501 | — | (245,571 | ) | — | — | — | |||||||||||||||||
Interest expense, net of amounts capitalized | 31,797 | 1,364 | 74,320 | 73,847 | 54,227 | 55,204 | ||||||||||||||||||
Other (income) expense, net | (7,187 | ) | 32 | (2,443 | ) | 9,394 | 1,009 | (803 | ) | |||||||||||||||
Loss before tax | (122,291 | ) | (10,244 | ) | (128,907 | ) | (1,110,550 | ) | (259,111 | ) | (24,237 | ) | ||||||||||||
Income tax (expense) benefit | 1,702 | — | (2,829 | ) | 192,849 | 80,483 | 3,064 | |||||||||||||||||
Net loss | (120,589 | ) | (10,244 | ) | (131,736 | ) | (917,701 | ) | (178,628 | ) | (21,173 | ) | ||||||||||||
Income attributable to noncontrolling interest | — | — | — | — | — | 595 | ||||||||||||||||||
LOSS ATTRIBUTABLE TO KEY | $ | (120,589 | ) | $ | (10,244 | ) | $ | (131,736 | ) | $ | (917,701 | ) | $ | (178,628 | ) | $ | (21,768 | ) | ||||||
Loss per share: | ||||||||||||||||||||||||
Basic and Diluted | $ | (6.00 | ) | $ | (0.51 | ) | $ | (0.82 | ) | $ | (5.86 | ) | $ | (1.16 | ) | $ | (0.14 | ) | ||||||
Loss per share attributable to Key: | ||||||||||||||||||||||||
Basic and Diluted | $ | (6.00 | ) | $ | (0.51 | ) | $ | (0.82 | ) | $ | (5.86 | ) | $ | (1.16 | ) | $ | (0.14 | ) | ||||||
Weighted Average Shares Outstanding: | ||||||||||||||||||||||||
Basic and Diluted | 20,105 | 20,090 | 160,587 | 156,598 | 153,371 | 152,271 | ||||||||||||||||||
CASH FLOW DATA
(in thousands)
Successor | Predecessor | |||||||||||||||||||||||
Year Ended December 31, 2017 | Period from December 16, 2016 through December 31, 2016 | Period from January 1, 2016 through December 15, 2016 | Year Ended December 31, | |||||||||||||||||||||
2015 | 2014 | 2013 | ||||||||||||||||||||||
Net cash provided by (used in) operating activities | $ | (51,367 | ) | $ | (417 | ) | $ | (138,449 | ) | $ | (22,386 | ) | $ | 164,168 | $ | 228,643 | ||||||||
Net cash provided by (used in) investing activities | 16,913 | (251 | ) | 6,544 | (19,403 | ) | (146,840 | ) | (160,881 | ) | ||||||||||||||
Net cash provided by (used in) financing activities | 17,160 | (15 | ) | 18,759 | 218,729 | (22,058 | ) | (85,492 | ) | |||||||||||||||
Effect of changes in exchange rates on cash | (146 | ) | — | (20 | ) | 110 | 3,728 | 87 | ||||||||||||||||
24
BALANCE SHEET DATA
(in thousands)
Successor | Predecessor | |||||||||||||||||||
Year Ended December 31, | Year Ended December 31, | |||||||||||||||||||
2017 | 2016 | 2015 | 2014 | 2013 | ||||||||||||||||
Working capital | $ | 83,027 | $ | 117,775 | $ | 265,943 | $ | 191,937 | $ | 273,809 | ||||||||||
Property and equipment, gross | 413,127 | 408,716 | 2,376,388 | 2,555,515 | 2,606,738 | |||||||||||||||
Property and equipment, net | 327,314 | 405,151 | 880,032 | 1,235,258 | 1,365,646 | |||||||||||||||
Total assets | 529,121 | 657,981 | 1,327,798 | 2,322,763 | 2,573,573 | |||||||||||||||
Long-term debt and capital leases, net of current maturities | 243,103 | 245,477 | 961,700 | 737,691 | 750,084 | |||||||||||||||
Total liabilities | 400,438 | 415,364 | 1,187,508 | 1,264,700 | 1,322,480 | |||||||||||||||
Equity | 128,683 | 242,617 | 140,290 | 1,058,063 | 1,251,093 | |||||||||||||||
ITEM 7. MANAGEMENT’S DISCUSSION AND ANALYSIS OF FINANCIAL CONDITION AND RESULTS OF OPERATIONS
The following discussion and analysis of our financial condition and results of operations should be read in conjunction with our consolidated financial statements and related notes thereto in “Item 8. Financial Statements and Supplementary Data.” The discussion below contains forward-looking statements that are based upon our current expectations and are subject to uncertainty and changes in circumstances including those identified in “Cautionary Note Regarding Forward-Looking Statements” above. Actual results may differ materially from these expectations due to potentially inaccurate assumptions and known or unknown risks and uncertainties. Such forward-looking statements should be read in conjunction with our disclosures under “Item 1A. Risk Factors.”
Overview
We provide a full range of well services to major oil companies and independent oil and natural gas production companies to produce, maintain and enhance the flow of oil and natural gas throughout the life of a well. These services include rig-based and coiled tubing-based well maintenance and workover services, well completion and recompletion services, fluid management services, fishing and rental services and other ancillary oilfield services. Additionally, certain of our rigs are capable of specialty drilling applications. We operate in most major oil and natural gas producing regions of the continental United States, and we previously had operations in Canada and Russia, which were sold in the second and third quarters of 2017, respectively.
The demand for our services fluctuates, primarily in relation to the price (or anticipated price) of oil and natural gas, which, in turn, is driven primarily by the supply of, and demand for, oil and natural gas. Generally, as supply of those commodities decreases and demand increases, service and maintenance requirements increase as oil and natural gas producers attempt to maximize the productivity of their wells in a higher priced environment. However, in the lower oil and natural gas price environment that has persisted since late 2014, demand for service and maintenance has decreased as oil and natural gas producers decrease their activity. In particular, the demand for new or existing field drilling and completion work is driven by available investment capital for such work and our customers have significantly curtailed their capital spending beginning in 2015 and continuing into 2017. Because these types of services can be easily “started” and “stopped,” and oil and natural gas producers generally tend to be less risk tolerant when commodity prices are low or volatile, we may experience a more rapid decline in demand for well maintenance services compared with demand for other types of oilfield services. Further, in a lower-priced environment, fewer well service rigs are needed for completions, as these activities are generally associated with drilling activity.
Emergence from Voluntary Reorganization and Fresh Start Accounting
Upon our emergence from bankruptcy on the Effective Date, the Company adopted fresh start accounting which resulted in the creation of a new entity for financial reporting purposes. As a result of the application of fresh start accounting, as well as the effects of the implementation of the Plan, the Consolidated Financial Statements on or after December 16, 2016 are not comparable with the Consolidated Financial Statements prior to that date. Refer to “Note 3. Fresh Start Accounting” in “Item 8. Financial Statements and Supplementary Data” for additional information.
25
References to “Successor” or “Successor Company” relate to the financial position and results of operations of the reorganized Company subsequent to December 15, 2016. References to “Predecessor” or “Predecessor Company” refer to the financial position and results of operations of the Company prior to December 15, 2016.
Business and Growth Strategies
Focus on Production Related Services
Over the life of an oil and gas well, regular maintenance of well bore and artificial lift systems is required to maintain production and offset natural production declines. In most of these interventions, a well service rig is required to remove and replace items needing repair, or to perform activities that would increase the oil and gas production from current levels. In many instances these interventions require additional assets or services to perform. With the decline in oil prices beginning in 2014, we believe that a number of oil and gas producers in the United States significantly curtailed their recurring well maintenance activities. We believe that a recovery in oil prices will result in oil and gas producers making the decision to resume regular well maintenance activities. Additionally, we believe that in many instances since the oil price decline began in 2014, oil and gas producers have foregone regular maintenance activities, and that additional demand for our services will be provided by oil and gas producers seeking to improve their production by repairing their wells. Key is well positioned to capitalize on these trends through its fleet of active and warm stacked well service rigs and the additional fishing and rental service offerings it provides and we will continue to invest, either in equipment or through acquisition to grow and take advantage of this dynamic.
Growth in Population of Horizontal Oil and Gas Wells
Since the revolution of horizontal well drilling and hydraulic fracturing began in the United States, thousands of new horizontal oil wells have been added, many in the period from 2012 to 2014. As the initial production from these wells decline over their first several years of production, and these wells are placed on artificial lift systems to maintain production, we believe that these wells will require periodic maintenance similar to a conventional oil well. In many instances due to the depth and long lateral sections of these wells, a larger well service rig with a higher rated derrick capacity will be needed to do this maintenance. We intend to invest in this portion of our well service rig fleet, and the needed rental equipment and services, either through organic capital deployment or acquisition to capitalize on this trend and the growing population of horizontal wells that have entered or will enter the phase of their life where regular maintenance is required.
PERFORMANCE MEASURES
The Baker Hughes U.S. rig count data, which is publicly available on a weekly basis, is often used as a coincident indicator of overall Exploration and Production (“E&P”) company spending and broader oilfield activity. In assessing overall activity in the U.S. onshore oilfield service industry in which we operate, we believe that the Baker Hughes U.S. land drilling rig count is the best barometer of E&P companies' capital spending and resulting activity levels. Historically, our activity levels have been highly correlated to U.S. onshore capital spending by our E&P company customers as a group.
Year | WTI Cushing Crude Oil(1) | NYMEX Henry Hub Natural Gas(1) | Average Baker Hughes U.S. Land Drilling Rigs(2) | Average AESC Well Service Active Rig Count(3) | |||||||||
2013 | $ | 97.98 | $ | 3.73 | 1,705 | 2,064 | |||||||
2014 | $ | 93.17 | $ | 4.37 | 1,804 | 2,024 | |||||||
2015 | $ | 48.66 | $ | 2.62 | 943 | 1,481 | |||||||
2016 | $ | 43.29 | $ | 2.52 | 486 | 1,061 | |||||||
2017 | $ | 50.80 | $ | 2.99 | 856 | 1,187 | |||||||
(1) | Represents the average of the monthly average prices for each of the years presented. Source: U.S. Energy Information Administration, Bloomberg. |
(2) | Source: www.bakerhughes.com |
(3) | Source: www.aesc.net |
26
Internally, we measure activity levels for our well servicing operations primarily through our rig and trucking hours. Generally, as capital by E&P companies increases, demand for our services also rises, resulting in increased rig and trucking services and more hours worked. Conversely, when activity levels decline due to lower spending by E&P companies, we generally provide fewer rig and trucking services, which results in lower hours worked. The following table presents our quarterly rig and trucking hours from 2015 through 2017.
Rig Hours | Trucking Hours | Key’s U.S. Working Days(1) | ||||||||||||
U.S. | International | Total | ||||||||||||
2017: | ||||||||||||||
First Quarter | 165,968 | 2,462 | 168,430 | 179,215 | 64 | |||||||||
Second Quarter | 163,966 | 1,701 | 165,667 | 185,398 | 63 | |||||||||
Third Quarter | 161,725 | 2,937 | 164,662 | 197,319 | 63 | |||||||||
Fourth Quarter | 164,480 | — | 164,480 | 223,478 | 61 | |||||||||
Total 2017 | 656,139 | 7,100 | 663,239 | 785,410 | 251 | |||||||||
2016: | ||||||||||||||
First Quarter | 153,417 | 5,715 | 159,132 | 217,429 | 63 | |||||||||
Second Quarter | 144,587 | 6,913 | 151,500 | 199,527 | 64 | |||||||||
Third Quarter | 163,206 | 6,170 | 169,376 | 198,362 | 64 | |||||||||
Fourth Quarter | 169,087 | 4,341 | 173,428 | 192,049 | 61 | |||||||||
Total 2016 | 630,297 | 23,139 | 653,436 | 807,367 | 252 | |||||||||
2015: | ||||||||||||||
First Quarter | 271,005 | 36,950 | 307,955 | 418,032 | 62 | |||||||||
Second Quarter | 232,169 | 25,555 | 257,724 | 342,271 | 63 | |||||||||
Third Quarter | 226,953 | 13,330 | 240,283 | 309,601 | 64 | |||||||||
Fourth Quarter | 203,252 | 8,279 | 211,531 | 247,979 | 62 | |||||||||
Total 2015 | 933,379 | 84,114 | 1,017,493 | 1,317,883 | 251 | |||||||||
(1) | Key's U.S. working days are the number of weekdays during the quarter minus national holidays. |
MARKET AND BUSINESS CONDITIONS AND OUTLOOK
Our core businesses depend on our customers’ willingness to make expenditures to produce, develop and explore for oil and natural gas. Industry conditions are influenced by numerous factors, such as oil and natural gas prices, the supply of and demand for oil and natural gas, domestic and worldwide economic conditions, and political instability in oil producing countries and available supply of and demand for the services we provide. Oil and natural gas prices began a rapid and substantial decline in the fourth quarter of 2014. Depressed commodity price conditions persisted and worsened during 2015 and into 2016. As a result, the Baker Hughes U.S. rig count and the AESC well service rig count, along with demand for our products and services declined substantially, and the prices we are able to charge our customers for our products and services also declined substantially. While we sought to anticipate activity declines and reshaped our organizational and cost structure to mitigate the negative impact of these declines, we have continued to experience negative operating results and cash flows from operations. In 2017, oil prices recovered off the lows of 2016 and spurred an increase in the Baker Hughes U.S. rig count and related well completion activity, however, the same magnitude of activity increase did not occur in our principal Rig Services business, as measured by the AESC well service rig count, as oil and gas producers’ production maintenance spending has not recovered to the same extent as new well drilling and completion spending.
During 2017, we saw some continued improvement in demand and pricing for our services, particularly those driven by the completion of oil and natural gas wells, continued uncertainty around the stability of oil prices dampened the pace of improvement in well services activity particularly as it relates to our customer spending for the maintenance of existing oil and gas wells. We believe that a stabilization of oil prices at a price attractive to our customers will be necessary for the demand and associated pricing of our services related to conventional well maintenance work to improve significantly. Additionally, we believe that continued aging of horizontal wells and customers choosing to increase production through accretive regular well maintenance in these horizontal wells will strengthen demand for and increase the price of our services over the next several years. With increased demand for oilfield services broadly, however, the demand for qualified employees will also increase, which may impact our ability to meet the needs of our customers or offset price increases realized due to inflation in labor costs.
27
RESULTS OF OPERATIONS
Consolidated Results of Operations
The following tables set forth consolidated results of operations and financial information by operating segment and other selected information for the periods indicated. The period from December 16 to December 31, 2016 (Successor Company) and the period from January 1 to December 15, 2016 (Predecessor Company) are distinct reporting periods as a result of our emergence from bankruptcy on December 15, 2016. References in these results of operations to the change and the percentage change combine the Successor Company and Predecessor Company results for the year ended December 31, 2016 in order to provide some comparability of such information to the years ended December 31, 2017 and December 31, 2015. While this combined presentation is not presented according to generally accepted accounting principles in the United States (“GAAP”) and no comparable GAAP measure and are presented, management believes that providing this financial information is the most relevant and useful method for making comparisons to the years ended December 31, 2017 and December 31, 2015.
Successor | Predecessor | ||||||||||||||||||
(a) | (b) | (c) | (a) - (b) - (c) | ||||||||||||||||
Year Ended December 31, 2017 | Period from December 16, 2016 through December 31, 2016 | Period from January 1, 2016 through December 15, 2016 | Change | % Change | |||||||||||||||
REVENUES | $ | 436,165 | $ | 17,830 | $ | 399,423 | $ | 18,912 | 5 | % | |||||||||
COSTS AND EXPENSES: | |||||||||||||||||||
Direct operating expenses | 332,332 | 16,603 | 362,825 | (47,096 | ) | (12 | )% | ||||||||||||
Depreciation and amortization expense | 84,542 | 3,574 | 131,296 | (50,328 | ) | (37 | )% | ||||||||||||
General and administrative expenses | 115,284 | 6,501 | 163,257 | (54,474 | ) | (32 | )% | ||||||||||||
Impairment expense | 187 | — | 44,646 | (44,459 | ) | (100 | )% | ||||||||||||
Operating loss | (96,180 | ) | (8,848 | ) | (302,601 | ) | 215,269 | (69 | )% | ||||||||||
Reorganization items, net | 1,501 | — | (245,571 | ) | 247,072 | (101 | )% | ||||||||||||
Interest expense, net of amounts capitalized | 31,797 | 1,364 | 74,320 | (43,887 | ) | (58 | )% | ||||||||||||
Other (income) loss, net | (7,187 | ) | 32 | (2,443 | ) | (4,776 | ) | 198 | % | ||||||||||
Loss before income taxes | (122,291 | ) | (10,244 | ) | (128,907 | ) | 16,860 | (12 | )% | ||||||||||
Income tax (expense) benefit | 1,702 | — | (2,829 | ) | 4,531 | (160 | )% | ||||||||||||
NET LOSS | $ | (120,589 | ) | $ | (10,244 | ) | $ | (131,736 | ) | $ | 21,391 | (15 | )% | ||||||
Years Ended December 31, 2017 and 2016
Revenues
Our revenues for the year ended December 31, 2017 increased $18.9 million, or 4.5%, to $436.2 million from $417.3 million for the combined year ended December 31, 2016, due to an increase in spending from our customers as they reacted to improving commodity prices. Internationally, we had lower revenue as a result of the sale our operations in Mexico, a decrease in activity in Russia and the sale during the third quarter of 2017 of our Russian operations. See “Segment Operating Results — Years Ended December 31, 2017 and 2016” below for a more detailed discussion of the change in our revenues.
Direct operating expenses
Our direct operating expenses decreased $47.1 million, or 12.4%, to $332.3 million (76.2% of revenues) for the year ended December 31, 2017, compared to $379.4 million (90.9% of revenues) for the combined year ended December 31, 2016. The decrease is partially related to a $21.0 million gain on the sale of certain assets and a decrease in employee compensation costs, fuel expense and repair and maintenance expense as we took steps to reduce our cost structure. See “Segment Operating Results — Years Ended December 31, 2017 and 2016” below for a more detailed discussion of the change in our direct operating expenses.
Depreciation and amortization expense
Depreciation and amortization expense decreased $50.3 million, or 37.3%, to 84.5 million (19.4% of revenues) for the year ended December 31, 2017, compared to $134.9 million (32.3% of revenues) for the combined year ended December 31, 2016. The decrease is primarily attributable to the reduction of property, plant and equipment due to the implementation of fresh start accounting in the fourth quarter of 2016.
28
General and administrative expenses
General and administrative expenses decreased $54.5 million, or 32.1%, to $115.3 million (26.4% of revenues) for the year ended December 31, 2017, compared to $169.8 million (40.7% of revenues) for the combined year ended December 31, 2016. The decrease is primarily due to a $24.0 million decrease in professional fees related to our 2016 corporate restructuring and lower employee compensation costs due to reduced staffing levels and a reduction in wages partially offset by a $5.2 million increase in legal settlement accruals.
Impairment expense
During the year ended December 31, 2017, we recorded a $0.2 million impairment to reduce the carrying value of the assets and related liabilities of our Russian business unit, which was sold in the third quarter of 2017, to fair market value. During the combined year ended December 31, 2016, we recorded a $44.6 million impairment to reduce the carrying value of assets held for sale to fair market value related to our business unit in Mexico.
Reorganization items, net
Reorganization items primarily consist of $1.5 million of professional fees incurred in connection with our emergence from voluntary reorganization for the year ended December 31, 2017 compared to a $578.7 million gain on debt discharge partially offset by a $299.6 million loss on fresh start accounting revaluations, a $19.2 million write-off of deferred financing costs and debt premiums and discounts, and $15.2 million of professional fees incurred in connection with our emergence from voluntary reorganization for the combined year ended December 31, 2016.
Interest expense, net of amounts capitalized
Interest expense decreased $43.9 million to $31.8 million (7.3% of revenues), for the year ended December 31, 2017, compared to $75.7 million (18.1% of revenues) for the combined year ended December 31, 2016. The decrease is primarily related to the elimination of the Predecessor Company’s senior secured notes in connection with our emergence from voluntary reorganization.
Other (income) loss, net
During the year ended December 31, 2017, we recognized other income, net, of $7.2 million, compared to $2.4 million for the combined year ended December 31, 2016. Our foreign exchange (gain) loss relates to U.S. dollar-denominated transactions in our foreign locations and fluctuations in exchange rates between local currencies and the U.S. dollar.
The table below presents comparative detailed information about combined other loss, net at December 31, 2017 and 2016:
Successor | Predecessor | ||||||||||||||||||
(a) | (b) | (c) | (a) - (b) - (c) | ||||||||||||||||
Year Ended December 31, 2017 | Period from December 16, 2016 through December 31, 2016 | Period from January 1, 2016 through December 15, 2016 | Change | % Change | |||||||||||||||
Interest income | $ | (711 | ) | $ | (20 | ) | $ | (407 | ) | $ | (284 | ) | 67 | % | |||||
Foreign exchange (gain) loss | (33 | ) | 17 | 1,005 | $ | (1,055 | ) | (103 | )% | ||||||||||
Other, net | (6,443 | ) | 35 | (3,041 | ) | $ | (3,437 | ) | 114 | % | |||||||||
Total | $ | (7,187 | ) | $ | 32 | $ | (2,443 | ) | $ | (4,776 | ) | 198 | % | ||||||
Income tax (expense) benefit
Our income tax benefit was $1.7 million (1.4% effective rate) on pre-tax loss of $122.3 million for the year ended December 31, 2017, compared to an income tax benefit of zero (0.00% effective rate) on a pre-tax loss of $10.2 million and a $2.8 million tax expense (2.2% effective rate) on pre-tax loss of $128.9 million for the period from December 16, 2016 through December 31, 2016 and for the period from January 1, 2016 through December 15, 2016, respectively. Our effective tax rates for such periods differ from the then-applicable U.S. statutory rate of 35% due to a number of factors, including the mix of profit and loss between domestic and international taxing jurisdictions and the impact of permanent items, including goodwill impairment expense and expenses subject to statutorily imposed limitations such as meals and entertainment expenses, that affect book income but do not affect taxable income and discrete tax adjustments, such as valuation allowances against deferred tax assets and tax expense or benefit recognized for uncertain tax positions.
29
The U.S. enacted into law the Tax Cuts and Jobs Act (“2017 Tax Act”) on December 22, 2017. The 2017 Tax Act is comprehensive tax reform legislation that, among other things, contains significant changes to corporate taxation, including a permanent reduction of the corporate income tax rate from 35% to 21%, imposing a mandatory one-time tax on accumulated earnings of foreign subsidiaries, a partial limitation on the deductibility of business interest expense, a limitation on net operating losses to 80% of taxable income each year, and a shift of the U.S. taxation of multinational corporations from a tax on worldwide income to a partial territorial system (along with rules that create a new U.S. minimum tax on earnings of foreign subsidiaries). The ultimate impact of the 2017 Tax Act may differ from the estimated tax impacts recognized in the fourth quarter due to technical corrections made to the law, future Treasury Regulations, and other interpretive guidance that may impact the Company’s actions. We continue to examine the impact of this tax reform legislation, as its overall impact is uncertain.
Years Ended December 31, 2016 and 2015
Successor | Predecessor | ||||||||||||||||||
(a) | (b) | (c) | (a) + (b) - (c) | ||||||||||||||||
Period from December 16, 2016 through December 31, 2016 | Period from January 1, 2016 through December 15, 2016 | Year Ended December 31, 2015 | Change | % Change | |||||||||||||||
REVENUES | $ | 17,830 | $ | 399,423 | $ | 792,326 | $ | (375,073 | ) | (47 | )% | ||||||||
COSTS AND EXPENSES: | |||||||||||||||||||
Direct operating expenses | 16,603 | 362,825 | 714,637 | (335,209 | ) | (47 | )% | ||||||||||||
Depreciation and amortization expense | 3,574 | 131,296 | 180,271 | (45,401 | ) | (25 | )% | ||||||||||||
General and administrative expenses | 6,501 | 163,257 | 202,631 | (32,873 | ) | (16 | )% | ||||||||||||
Impairment expense | — | 44,646 | 722,096 | (677,450 | ) | (94 | )% | ||||||||||||
Operating loss | (8,848 | ) | (302,601 | ) | (1,027,309 | ) | 715,860 | (70 | )% | ||||||||||
Reorganization items, net | — | (245,571 | ) | — | (245,571 | ) | (100 | )% | |||||||||||
Interest expense, net of amounts capitalized | 1,364 | 74,320 | 73,847 | 1,837 | 2 | % | |||||||||||||
Other (income) loss, net | 32 | (2,443 | ) | 9,394 | (11,805 | ) | (126 | )% | |||||||||||
Loss before income taxes | (10,244 | ) | (128,907 | ) | (1,110,550 | ) | 971,399 | (87 | )% | ||||||||||
Income tax (expense) benefit | — | (2,829 | ) | 192,849 | (195,678 | ) | (101 | )% | |||||||||||
NET LOSS | $ | (10,244 | ) | $ | (131,736 | ) | $ | (917,701 | ) | $ | 775,721 | (85 | )% | ||||||
Revenues
Our revenues for the combined year ended December 31, 2016 decreased $375.1 million, or 47.3%, to $417.3 million from $792.3 million for the year ended December 31, 2015, due to lower spending from our customers as a result of lower oil prices. These market conditions resulted in reduced customer activity and a reduction in the price received for our services. Internationally, we had lower revenue as a result of reduced customer activity in Russia and Colombia and the exit of operations in the Middle East and South America. See “Segment Operating Results — Years Ended December 31, 2016 and 2015” below for a more detailed discussion of the change in our revenues.
Direct operating expenses
Our direct operating expenses decreased $335.2 million, or 46.9%, to $379.4 million (90.9% of revenues) for the combined year ended December 31, 2016, compared to $714.6 million (90.2% of revenues) for the year ended December 31, 2015. The decrease is primarily related to a decrease in employee compensation costs, fuel expense and repair and maintenance expense as we sought to reduce our cost structure and as a result of lower activity levels. See “Segment Operating Results — Years Ended December 31, 2016 and 2015” below for a more detailed discussion of the change in our direct operating expenses.
Depreciation and amortization expense
Depreciation and amortization expense decreased $45.4 million, or 25.2%, to $134.9 million (32.3% of revenues) for the combined year ended December 31, 2016, compared to $180.3 million (22.8% of revenues) for the year ended December 31, 2015. The decrease is primarily attributable to the impairment of certain fixed assets in 2015 and decreases in capital expenditures and lower amortization expense due to the impairment of certain intangible assets.
30
General and administrative expenses
General and administrative expenses decreased $32.9 million, or 16.2%, to $169.8 million (40.7% of revenues) for the combined year ended December 31, 2016, compared to $202.6 million (25.6% of revenues) for the year ended December 31, 2015. The decrease is primarily due to lower employee compensation costs due to reduced staffing levels and reduction in wages and $30.8 million lower expenses related to our investigations pursuant to the Foreign Corrupt Practices Act (“FCPA”) by the DOJ and the SEC, which concluded in April and August 2016, respectively, partially off-set by $25.8 million in restructuring fees in 2016.
Impairment expense
During the combined year ended December 31, 2016, we recorded a $44.6 million impairment to reduce the carrying value of assets held for sale to fair market value related to our business unit in Mexico. During the year ended December 31, 2015, we recorded a $582.7 million impairment of goodwill, a $51.1 million impairment of fixed assets that are being held and used, a $1.5 million impairment of other intangible assets that are no longer being used, and a $86.8 million impairment of fixed assets to reduce the carrying value of assets held for sale to fair market value.
Reorganization items, net
Reorganization items primarily consist of a $578.7 million gain on debt discharge partially offset by a $299.6 million loss on fresh start accounting revaluations, a $19.2 million write-off of deferred financing costs and debt premiums and discounts, and $15.2 million of professional fees incurred in connection with our emergence from voluntary reorganization.
Interest expense, net of amounts capitalized
Interest expense increased $1.8 million to $75.7 million (18.1% of revenues), for the combined year ended December 31, 2016, compared to $73.8 million (9.3% of revenues) for the year ended December 31, 2015. The increase is primarily related to increased borrowings and interest rate under the new Term Loan Facility in the combined year ended December 31, 2016 and the write-off of the remaining $0.8 million of unamortized deferred financing costs related to a previously terminated credit facility in the second quarter of 2015.
Other (income) loss, net
During the combined year ended December 31, 2016, we recognized other income, net, of $2.4 million, compared to other loss, net, of $9.4 million for the year ended December 31, 2015. A $7.8 million allowance for the collectability of our notes receivable related to the sale of our operations in Argentina was recorded in the year ended December 31, 2015. Our foreign exchange loss relates to U.S. dollar-denominated transactions in our foreign locations and fluctuations in exchange rates between local currencies and the U.S. dollar.
The table below presents comparative detailed information about other loss, net at December 31, 2016 and 2015:
Successor | Predecessor | ||||||||||||||||||
(a) | (b) | (c) | (a) + (b) - (c) | ||||||||||||||||
Period from December 16, 2016 through December 31, 2016 | Period from January 1, 2016 through December 15, 2016 | Year Ended December 31, 2015 | Change | % Change | |||||||||||||||
Interest income | $ | (20 | ) | $ | (407 | ) | $ | (159 | ) | $ | (268 | ) | 169 | % | |||||
Foreign exchange loss | 17 | 1,005 | 4,153 | (3,131 | ) | (75 | )% | ||||||||||||
Allowance for collectability of notes receivable | — | — | 7,705 | (7,705 | ) | (100 | )% | ||||||||||||
Other, net | 35 | (3,041 | ) | (2,305 | ) | (701 | ) | 30 | % | ||||||||||
Total | $ | 32 | $ | (2,443 | ) | $ | 9,394 | $ | (11,805 | ) | (126 | )% | |||||||
31
Income tax (expense) benefit
Our income tax benefit was zero (0.0% effective rate) on pre-tax loss of $10.2 million and income tax expense of $2.8 million (2.2% effective rate) on pre-tax loss of $128.9 million for the period from December 16, 2016 through December 31, 2016 and for the period from January 1, 2016 through December 15, 2016, respectively, compared to an income tax benefit of $192.8 million (17.4% effective rate) on a pre-tax loss of $1.1 billion for the year ended December 31, 2015. Our effective tax rates for such periods differ from the then-applicable U.S. statutory rate of 35% due to a number of factors, including the mix of profit and loss between domestic and international taxing jurisdictions and the impact of permanent items, including goodwill impairment expense and expenses subject to statutorily imposed limitations such as meals and entertainment expenses, that affect book income but do not affect taxable income and discrete tax adjustments, such as valuation allowances against deferred tax assets and tax expense or benefit recognized for uncertain tax positions.
Segment Operating Results
Years Ended December 31, 2017 and 2016
The following table shows operating results for each of our reportable segments for the years ended December 31, 2017 and 2016 (in thousands):
For the year ended December 31, 2017
U.S. Rig Service | Fluid Management Services | Coiled Tubing Services | Fishing and Rental Services | International | Functional Support | Total | |||||||||||||||||||||
Revenues from external customers | $ | 248,830 | $ | 80,726 | $ | 41,866 | $ | 59,172 | $ | 5,571 | $ | — | $ | 436,165 | |||||||||||||
Operating expenses | 252,450 | 100,258 | 40,235 | 51,666 | 10,564 | 77,172 | 532,345 | ||||||||||||||||||||
Operating income (loss) | (3,620 | ) | (19,532 | ) | 1,631 | 7,506 | (4,993 | ) | (77,172 | ) | (96,180 | ) | |||||||||||||||
For the Successor period from December 16, 2016 through December 31, 2016
U.S. Rig Service | Fluid Management Services | Coiled Tubing Services | Fishing and Rental Services | International | Functional Support | Total | |||||||||||||||||||||
Revenues from external customers | $ | 8,549 | $ | 3,208 | $ | 1,392 | $ | 3,389 | $ | 1,292 | $ | — | $ | 17,830 | |||||||||||||
Operating expenses | 10,481 | 4,346 | 1,648 | 3,654 | 1,225 | 5,324 | 26,678 | ||||||||||||||||||||
Operating income (loss) | (1,932 | ) | (1,138 | ) | (256 | ) | (265 | ) | 67 | (5,324 | ) | (8,848 | ) | ||||||||||||||
For the Predecessor period from January 1, 2016 through December 15, 2016
U.S. Rig Service | Fluid Management Services | Coiled Tubing Services | Fishing and Rental Services | International | Functional Support | Total | |||||||||||||||||||||
Revenues from external customers | $ | 222,877 | $ | 76,008 | $ | 30,569 | $ | 55,790 | $ | 14,179 | $ | — | $ | 399,423 | |||||||||||||
Operating expenses | 262,335 | 113,944 | 49,891 | 82,198 | 73,405 | 120,251 | 702,024 | ||||||||||||||||||||
Operating loss | (39,458 | ) | (37,936 | ) | (19,322 | ) | (26,408 | ) | (59,226 | ) | (120,251 | ) | (302,601 | ) | |||||||||||||
U.S. Rig Services
Revenues for our U.S. Rig Services segment increased $17.4 million, or 7.5%, to $248.8 million for the year ended December 31, 2017, compared to $231.4 million for the combined year ended December 31, 2016. The increase for this segment is primarily due to an increase in completion and production spending from our customers as they reacted to improving commodity prices.
Operating expenses for our U.S. Rig Services segment were $252.5 million during the year ended December 31, 2017, which represented a decrease of $20.4 million, or 7.5%, compared to $272.8 million for the combined year ended December 31, 2016. These expenses decreased primarily as a result of reduced depreciation expense and a decrease in employee compensation on a per hour basis as we took steps to reduce our cost structure.
32
Fluid Management Services
Revenues for our Fluid Management Services segment increased $1.5 million, or 1.9%, to $80.7 million for the year ended December 31, 2017, compared to $79.2 million for the combined year ended December 31, 2016. The increase for this segment is primarily due to an increase in spending from our customers as they reacted to improving commodity prices.
Operating expenses for our Fluid Management Services segment were $100.3 million during the year ended December 31, 2017, which represented a decrease of $18.0 million, or 15.2%, compared to $118.3 million for the combined year ended December 31, 2016. These expenses decreased primarily as a result of a decrease in employee compensation costs and equipment expense as we took steps to reduce our cost structure.
Coiled Tubing Services
Revenues for our Coiled Tubing Services segment increased $9.9 million, or 31.0%, to $41.9 million for the year ended December 31, 2017, compared to $32.0 million for the combined year ended December 31, 2016. The increase for this segment is primarily due to an increase in drilling and completion spending from our customers as they reacted to improving commodity prices.
Operating expenses for our Coiled Tubing Services segment were $40.2 million during the year ended December 31, 2017, which represented a decrease of $11.3 million, or 21.9%, compared to $51.5 million for the combined year ended December 31, 2016. These expenses decreased primarily as a result of reduced depreciation expense and a decrease in employee compensation costs and equipment expense as we took steps to reduce our cost structure.
Fishing and Rental Services
Revenues for our Fishing and Rental Services segment was $59.2 million for the year ended December 31, 2017 and the combined year ended December 31, 2016. The decrease in revenue for this segment is primarily due to the sale of our frac stack and well testing business which was offset by an increase in completion and production spending from our customers as they react to improving commodity prices.
Operating expenses for our Fishing and Rental Services segment were $51.7 million during the year ended December 31, 2017, which represented a decrease of $34.2 million, or 39.8%, compared to $85.9 million for the combined year ended December 31, 2016. These expenses decreased primarily due to a $21.0 million gain on the sale of certain assets, as a result of reduced depreciation expense and a decrease in employee compensation on a per hour basis as we took steps to reduce our cost structure.
International
Revenues for our International segment decreased $9.9 million, or 64.0%, to $5.6 million for the year ended December 31, 2017, compared to $15.5 million for the combined year ended December 31, 2016. The decrease was primarily attributable to lower customer activity in Russia, the sale during the third quarter of 2017 of our Russian operations and our exit from operations in Mexico, which was sold in 2016.
Operating expenses for our International segment decreased $64.1 million, or 85.8%, to $10.6 million for the year ended December 31, 2017, compared to $74.6 million for the combined year ended December 31, 2016. These expenses decreased primarily as a result of a decrease in employee compensation costs and equipment expense related to our exit from operations in Mexico and Russia and a $44.6 million impairment to reduce the carrying value of the assets and related liabilities of our Mexican business unit, which was sold in 2016, to fair market value.
Functional support
Operating expenses for our Functional Support segment decreased $48.4 million, or 38.5%, to $77.2 million (17.7% of consolidated revenues) for the year ended December 31, 2017 compared to $125.6 million (30.1% of consolidated revenues) for the combined year ended December 31, 2016. The decrease is primarily due to lower employee compensation costs due to reduced staffing levels and reduction in wages, a $5.0 million FCPA settlement accrual in 2016 and a decrease of $24.0 million in professional fees related to the 2016 corporate restructuring.
33
Years Ended December 31, 2016 and 2015
The following table shows operating results for each of our reportable segments for the years ended December 31, 2016 and 2015 (in thousands):
For the Successor period from December 16, 2016 through December 31, 2016
U.S. Rig Service | Fluid Management Services | Coiled Tubing Services | Fishing and Rental Services | International | Functional Support | Total | |||||||||||||||||||||
Revenues from external customers | $ | 8,549 | $ | 3,208 | $ | 1,392 | $ | 3,389 | $ | 1,292 | $ | — | $ | 17,830 | |||||||||||||
Operating expenses | 10,481 | 4,346 | 1,648 | 3,654 | 1,225 | 5,324 | 26,678 | ||||||||||||||||||||
Operating loss | (1,932 | ) | (1,138 | ) | (256 | ) | (265 | ) | 67 | (5,324 | ) | (8,848 | ) | ||||||||||||||
For the Predecessor period from January 1, 2016 through December 15, 2016
U.S. Rig Service | Fluid Management Services | Coiled Tubing Services | Fishing and Rental Services | International | Functional Support | Total | |||||||||||||||||||||
Revenues from external customers | $ | 222,877 | $ | 76,008 | $ | 30,569 | $ | 55,790 | $ | 14,179 | $ | — | $ | 399,423 | |||||||||||||
Operating expenses | 262,335 | 113,944 | 49,891 | 82,198 | 73,405 | 120,251 | 702,024 | ||||||||||||||||||||
Operating income (loss) | (39,458 | ) | (37,936 | ) | (19,322 | ) | (26,408 | ) | (59,226 | ) | (120,251 | ) | (302,601 | ) | |||||||||||||
For the year ended December 31, 2015
U.S. Rig Service | Fluid Management Services | Coiled Tubing Services | Fishing and Rental Services | International | Functional Support | Total | |||||||||||||||||||||
Revenues from external customers | $ | 377,131 | $ | 153,153 | $ | 89,823 | $ | 121,883 | $ | 50,336 | $ | — | $ | 792,326 | |||||||||||||
Operating expenses | 685,070 | 196,637 | 244,991 | 319,295 | 232,872 | 140,770 | 1,819,635 | ||||||||||||||||||||
Operating income (loss) | (307,939 | ) | (43,484 | ) | (155,168 | ) | (197,412 | ) | (182,536 | ) | (140,770 | ) | (1,027,309 | ) | |||||||||||||
U.S. Rig Services
Revenues for our U.S. Rig Services segment decreased $145.7 million, or 38.6%, to $231.4 million for the combined year ended December 31, 2016, compared to $377.1 million for the year ended December 31, 2015. The decrease for this segment is primarily due to lower spending from our customers as a result of lower oil prices. These market conditions resulted in reduced customer activity and a reduction in the price received for our services.
Operating expenses for our U.S. Rig Services segment were $272.8 million during the combined year ended December 31, 2016, which represented a decrease of $412.3 million, or 60.2%, compared to $685.1 million for the year ended December 31, 2015. These expenses decreased primarily due to no impairment expense in 2016 compared to $297.7 million impairment expense in 2015 and as a result of a decrease in employee compensation costs and equipment expense as we sought to reduce our cost structure and as a result of lower activity levels.
Fluid Management Services
Revenues for our Fluid Management Services segment decreased $73.9 million, or 48.3%, to $79.2 million for the combined year ended December 31, 2016, compared to $153.2 million for the year ended December 31, 2015. The decrease for this segment is primarily due to lower spending from our customers as a result of lower oil prices. These market conditions resulted in reduced customer activity and a reduction in the price received for our services.
Operating expenses for our Fluid Management Services segment were $118.3 million during the combined year ended December 31, 2016, which represented a decrease of $78.3 million, or 39.8%, compared to $196.6 million for the year ended December 31, 2015. These expenses decreased primarily due to no impairment expense in 2016 compared to $24.5 million impairment expense in 2015 and as a result of a decrease in employee compensation costs and equipment expense as we sought to reduce our cost structure and as a result of lower activity levels.
34
Coiled Tubing Services
Revenues for our Coiled Tubing Services segment decreased $57.9 million, or 64.4%, to $32.0 million for the combined year ended December 31, 2016, compared to $89.8 million for the year ended December 31, 2015. The decrease for this segment is primarily due to lower spending from our customers as a result of lower oil prices. These market conditions resulted in reduced customer activity and a reduction in the price received for our services.
Operating expenses for our Coiled Tubing Services segment were $51.5 million during the combined year ended December 31, 2016, which represented a decrease of $193.5 million, or 79.0%, compared to $245.0 million for the year ended December 31, 2015. These expenses decreased primarily due to no impairment expense in 2016 compared to $82.7 million impairment of goodwill and a $51.1 million impairment of fixed assets in 2015 and as a result of a decrease in employee compensation costs, repair and maintenance expense and fuel costs as we sought to reduce our cost structure and as a result of lower activity levels.
Fishing and Rental Services
Revenues for our Fishing and Rental Services segment decreased $62.7 million, or 51.4%, to $59.2 million for the combined year ended December 31, 2016, compared to $121.9 million for the year ended December 31, 2015. The decrease for this segment is primarily due to lower spending from our customers as a result of lower oil prices. These market conditions resulted in reduced customer activity and a reduction in the price received for our services.
Operating expenses for our Fishing and Rental Services segment were $85.9 million during the combined year ended December 31, 2016, which represented a decrease of $233.4 million, or 73.1%, compared to $319.3 million for the year ended December 31, 2015. These expenses decreased primarily due to no impairment expense in 2016 compared to $173.5 million impairment of goodwill and a $6.0 million impairment of intangible assets in 2015 and as a result of a decrease in employee compensation costs, repair and maintenance expense and fuel costs as we sought to reduce our cost structure and as a result of lower activity levels.
International
Revenues for our International segment decreased $34.9 million, or 69.3%, to $15.5 million for the combined year ended December 31, 2016, compared to $50.3 million for the year ended December 31, 2015. The decrease was primarily attributable to lower customer activity in Mexico and the exit of operations in the Middle East, South America.
Operating expenses for our International segment decreased $158.2 million, or 68.0%, to $74.6 million for the combined year ended December 31, 2016, compared to $232.9 million for the year ended December 31, 2015. These expenses decreased primarily due to impairment expense of $44.6 million in 2016 compared to $80.8 million impairment of assets held for sale and a $4.4 million impairment of goodwill in 2015 and as a result of a decrease in employee compensation costs and equipment expense from lower activity and the exit of certain International markets.
Functional support
Operating expenses for our Functional Support segment decreased $15.2 million, or 10.8%, to $125.6 million (30.1% of consolidated revenues) for the combined year ended December 31, 2016 compared to $140.8 million (17.8% of consolidated revenues) for the year ended December 31, 2015. The decrease is primarily due to lower employee compensation costs due to reduced staffing levels and $30.8 million lower expenses related to our FCPA investigations by the DOJ and the SEC, which concluded in April and August 2016, respectively, partially off-set by $25.8 million in professional fees related to corporate restructuring in 2016.
Liquidity and Capital Resources
We require capital to fund our ongoing operations, including maintenance expenditures on our existing fleet and equipment, organic growth initiatives, investments and acquisitions, our debt service payments and our other obligations. We believe that our internally generated cash flows from operations, current reserves of cash and availability under our ABL Facility are sufficient to finance our cash requirements for current and future operations, budgeted capital expenditures, debt service and other obligations for the next twelve months.
Oil and natural gas prices began a rapid and substantial decline in the fourth quarter of 2014. Depressed commodity price conditions persisted and worsened during 2015 and remained depressed during 2016 and 2017. As a result, demand for our products and services declined substantially, and the prices we are able to charge our customers for our products and services have also declined substantially. These trends materially and adversely affected our results of operations, cash flows and financial condition during 2017 and, unless conditions in our industry improve, this trend will potentially continue beyond 2017.
In response to these conditions, we have undertaken several actions detailed below in an effort to preserve and improve our liquidity and financial position.
35
• | In April 2015, we announced our decision to exit markets in which we participate outside of North America. Our strategy is to sell or relocate the assets of the businesses operating in these markets. To this end, during the second half of 2015, we ceased operations in Colombia, Ecuador and the Middle East. During the fourth quarter of 2016, we completed the sale of our business in Mexico, and we completed the sale of our Canadian subsidiary and Russian subsidiary in the second and third quarters of 2017, respectively. Additionally, in 2017 we sold our frac stack and testing business. |
• | On December 15, 2016, the Company emerged from a pre-planned voluntary chapter 11 reorganization resulting in approximately $697 million of the Company’s long-term debt being eliminated along with more than $45.6 million of annual interest expense going forward. |
• | On December 15, 2016, we entered into our new $80 million ABL Facility (which was increased to $100 million on February 3, 2017) due June 15, 2021, and our new $250 million Term Loan Facility due December 15, 2021. As of December 31, 2017, we had no borrowings outstanding under the ABL Facility and $35.6 million of letters of credit outstanding with borrowing capacity of $24.7 million available subject to covenant constraints under our ABL Facility. |
• | Beginning in the first quarter of 2015, we began a series of structural cost cutting changes at both corporate and field levels, which include fixed costs, supply-chain efficiencies and headcount and wage reductions which has continued into 2017. |
However, we still have substantial indebtedness and other obligations, and we may incur additional expenses that we are unable to predict at this time.
Our ability to fund our operations, pay the principal and interest on our long-term debt and satisfy our other obligations will depend upon our available liquidity and the amount of cash flows we are able to generate from our operations. During 2017, our net cash used in operating activities was $51.4 million, and, if industry conditions do not improve, we may have negative cash flows from operations in 2018.
As of December 31, 2017, our working capital was $83.0 million compared to $117.8 million as of December 31, 2016. Our working capital decreased during 2017 primarily as a result of a decrease in cash and cash equivalents and restricted cash partially offset by the decrease in other accrued expenses.
As of December 31, 2017, we had $73.1 million of cash, of which approximately $0.7 million was held in the bank accounts of our foreign subsidiaries. As of December 31, 2017, $0.2 million of the cash held by our foreign subsidiaries was held in U.S. bank accounts and denominated in U.S. dollars. We believe that the cash held by our wholly owned foreign subsidiaries could be repatriated for general corporate use without material withholdings.
Cash Flows
Cash used in operating activities was $51.4 million, $0.4 million, and $138.4 million for the year ended December 31, 2017 and periods from December 16, 2016 through December 31, 2016 and from January 1, 2016 through December 15, 2016, respectively. Cash used by operating activities for these periods was primarily related to net loss adjusted for noncash items and payments of accounts payable and other accrued liabilities partially offset by cash inflows related to the collection of accounts receivable.
Cash provided by investing activities was $16.9 million and $6.5 million for the year ended December 31, 2017 and the period from January 1, 2016 through December 15, 2016, respectively, cash used in investing activities was $0.3 million for the period from December 16, 2016 through December 31, 2016. Investing cash inflows primarily relate to sales of assets during these periods. Investing cash outflows primarily relate to capital expenditures. Capital expenditures primarily relate to replacement assets for our existing fleet and equipment.
Cash provided by financing activities was $17.2 million and $18.8 million for the year ended December 31, 2017 and the period from January 1, 2016 through December 15, 2016, respectively, cash used in financing activities was less than $0.1 million for the period from January 1, 2016 through December 15, 2016. Cash provided by financing activities for the year ended December 31, 2017 primarily relate to the reduction in restricted cash. Cash provided by financing activities for the period from January 1, 2016 through December 15, 2016 was primarily related to proceeds from stock offering, which was in connection with emerging from bankruptcy, partially offset by repayment of long-term debt and increase in restricted cash.
36
The following table summarizes our cash flows for the year ended December 31, 2017, the period from December 16, 2016 through December 31, 2016 and the period from January 1, 2016 through December 15, 2016 (in thousands):
Successor | Predecessor | |||||||||||
Year Ended December 31, 2017 | Period from December 16, 2016 through December 31, 2016 | Period from January 1, 2016 through December 15, 2016 | ||||||||||
Net cash used by operating activities | $ | (51,367 | ) | $ | (417 | ) | $ | (138,449 | ) | |||
Cash paid for capital expenditures | (16,079 | ) | (375 | ) | (8,481 | ) | ||||||
Proceeds from sale of assets | 32,992 | 124 | 15,025 | |||||||||
Proceeds from notes receivable | — | — | — | |||||||||
Repayments of long-term debt | (2,500 | ) | — | (313,424 | ) | |||||||
Proceeds from long-term debt | — | — | 250,000 | |||||||||
Payment of bond tender premium | — | — | 109,082 | |||||||||
Restricted cash | 20,707 | (15 | ) | (24,692 | ) | |||||||
Payment of deferred financing costs | (350 | ) | — | (2,040 | ) | |||||||
Other financing activities, net | (697 | ) | — | (167 | ) | |||||||
Effect of changes in exchange rates on cash | (146 | ) | — | (20 | ) | |||||||
Net decrease in cash and cash equivalents | $ | (17,440 | ) | $ | (683 | ) | $ | (113,166 | ) | |||
Debt Service
At December 31, 2017, our annual maturities on our indebtedness, consisting only of our Term Loan Facility at year-end, were as follows (in thousands):
Principal Payments | |||
2018 | $ | 2,500 | |
2019 | 2,500 | ||
2020 | 2,500 | ||
2021 | 240,000 | ||
Total | $ | 247,500 | |
ABL Facility
On December 15, 2016, the Company and Key Energy Services, LLC, as borrowers (the “ABL Borrowers”), entered into the ABL Facility with the financial institutions party thereto from time to time as lenders (the “ABL Lenders”), Bank of America, N.A., as administrative agent for the lenders, and Bank of America, N.A. and Wells Fargo Bank, National Association, as co-collateral agents for the lenders. The ABL Facility provides for aggregate initial commitments from the ABL Lenders of $80 million, which, on February 3, 2017 was increased to $100 million, and matures on June 15, 2021.
The ABL Facility provides the ABL Borrowers with the ability to borrow up to an aggregate principal amount equal to the lesser of (i) the aggregate revolving commitments then in effect and (ii) the sum of (a) 85% of the value of eligible accounts receivable plus (b) 80% of the value of eligible unbilled accounts receivable, subject to a limit equal to the greater of (x) $35 million and (y) 25% of the Commitments. The amount that may be borrowed under the ABL Facility is subject to increase or reduction based on certain segregated cash or reserves provided for by the ABL Facility. In addition, the percentages of accounts receivable and unbilled accounts receivable included in the calculation described above is subject to reduction to the extent of certain bad debt write-downs and other dilutive items provided in the ABL Facility.
Borrowings under the ABL Facility will bear interest, at the ABL Borrowers’ option, at a per annum rate equal to (i) LIBOR for 30, 60, 90, 180, or, with the consent of the ABL Lenders, 360 days, plus an applicable margin that varies from 2.50% to 4.50% depending on the Borrowers’ fixed charge coverage ratio at such time or (ii) a base rate equal to the sum of (a) the greatest of (x) the prime rate, (y) the federal funds rate, plus 0.50% or (z) 30-day LIBOR, plus 1.0% plus (b) an applicable margin that varies from 1.50% to 3.50% depending on the Borrowers’ fixed charge coverage ratio at such time. In addition, the ABL Facility provides for unused line fees of 1.0% to 1.25% per year, depending on utilization, letter of credit fees and certain other factors.
The ABL Facility may in the future be guaranteed by certain of the Company’s existing and future subsidiaries (the “ABL Guarantors,” and together with the ABL Borrowers, the “ABL Loan Parties”). To secure their obligations under the ABL Facility,
37
each of the ABL Loan Parties has granted or will grant, as applicable, to the Administrative Agent a first-priority security interest for the benefit of the ABL Lenders in its present and future accounts receivable, inventory and related assets and proceeds of the foregoing (the “ABL Priority Collateral”). In addition, the obligations of the ABL Loan Parties under the ABL Facility are secured by second-priority liens on the Term Priority Collateral (as described below under “Term Loan Facility”).
The revolving loans under the ABL Facility may be voluntarily prepaid, in whole or in part, without premium or penalty, subject to breakage or similar costs.
The ABL Facility contains certain affirmative and negative covenants, including covenants that restrict the ability of the ABL Loan Parties to take certain actions including, among other things and subject to certain significant exceptions, the incurrence of debt, the granting of liens, the making of investments, entering into transactions with affiliates, the payment of dividends and the sale of assets. The ABL Facility also contains a requirement that the ABL Borrowers comply, during certain periods, with a fixed charge coverage ratio of 1.00 to 1.00.
As of December 31, 2017, we had no borrowings outstanding under the ABL Facility and $35.6 million of letters of credit outstanding with borrowing capacity of $24.7 million available subject to covenant constraints under our ABL Facility.
Term Loan Facility
On December 15, 2016, the Company entered into the Term Loan Facility among the Company, as borrower, certain subsidiaries of the Company named as guarantors therein, the financial institutions party thereto from time to time as Lenders (collectively, the “Term Loan Lenders”) and Cortland Capital Market Services LLC and Cortland Products Corp., as agent for the Term Loan Lenders. The Term Loan Facility had an outstanding principal amount of $250 million as of the Effective Date.
The Term Loan Facility will mature on December 15, 2021, although such maturity date may, at the Company’s request, be extended by one or more of the Term Loan Lenders pursuant to the terms of the Term Loan Facility. Borrowings under the Term Loan Facility will bear interest, at the Company’s option, at a per annum rate equal to (i) LIBOR for one, two, three, six, or, with the consent of the Term Loan Lenders, 12 months, plus 10.25% or (ii) a base rate equal to the sum of (a) the greatest of (x) the prime rate, (y) the Federal Funds rate, plus 0.50% and (z) 30-day LIBOR, plus 1.0% plus (b) 9.25%.
The Term Loan Facility is guaranteed by certain of the Company’s existing and future subsidiaries (the “Term Loan Guarantors,” and together with the Company, the “Term Loan Parties”). To secure their obligations under the Term Loan Facility, each of the Term Loan Parties has granted or will grant, as applicable, to the agent a first-priority security interest for the benefit of the Term Loan Lenders in substantially all of each Term Loan Party’s assets other than certain excluded assets and the ABL Priority Collateral (the “Term Priority Collateral”). In addition, the obligations of the Term Loan Parties under the Term Loan Facility are secured by second-priority liens on the ABL Priority Collateral (as described above under “ABL Facility”).
The loans under the Term Loan Facility may be prepaid at the Company’s option, subject to the payment of a prepayment premium in certain circumstances as provided in the Term Loan Facility. If a prepayment is made after the first anniversary of the loan but prior to the second anniversary, such prepayment must be made at 106% of the principle amount, if a prepayment is made after the second anniversary but prior to the third anniversary, such prepayment must be made at 103% of the principle amount. After the third anniversary, if a prepayment is made, no prepayment premium is due. The Company is required to make principal payments in the amount of $625,000 per quarter commencing with the quarter ending March 31, 2017. In addition, pursuant to the Term Loan Facility, the Company must prepay or offer to prepay, as applicable, term loans with the net cash proceeds of certain debt incurrences and asset sales, excess cash flow, and upon certain change of control transactions, subject in each case to certain exceptions.
The Term Loan Facility contains certain affirmative and negative covenants, including covenants that restrict the ability of the Term Loan Parties to take certain actions including, among other things and subject to certain significant exceptions, the incurrence of debt, the granting of liens, the making of investments, entering into transactions with affiliates, the payment of dividends and the sale of assets. The Term Loan Facility also contains financial covenants requiring that the Company maintain an asset coverage ratio of at least 1.35 to 1.0 and that Liquidity (as defined in the Term Loan Facility) must not be less than $37.5 million (of which at least $20.0 million must be in cash or cash equivalents held in deposit accounts) as of the last day of any fiscal quarter, subject to certain exceptions and cure rights.
Off-Balance Sheet Arrangements
At December 31, 2017, we did not, and we currently do not, have any off-balance sheet arrangements that have or are reasonably likely to have a material current or future effect on our financial condition, revenues or expenses, results of operations, liquidity, capital expenditures or capital resources.
38
Contractual Obligations
Set forth below is a summary of our contractual obligations as of December 31, 2017. The obligations we pay in future periods reflect certain assumptions, including variability in interest rates on our variable-rate obligations and the duration of our obligations, and actual payments in future periods may vary.
Payments Due by Period | |||||||||||||||||||
Total | Less than 1 Year (2018) | 1-3 Years (2019-2020) | 4-5 Years (2021-2022) | After 5 Years (2023+) | |||||||||||||||
(in thousands) | |||||||||||||||||||
Term Loan Facility due 2021 | $ | 247,500 | $ | 2,500 | $ | 5,000 | $ | 240,000 | $ | — | |||||||||
Interest associated with Term Loan Facility(1) | 112,836 | 28,625 | 56,457 | 27,754 | — | ||||||||||||||
Non-cancelable operating leases | $ | 14,585 | $ | 4,478 | $ | 5,133 | $ | 2,962 | $ | 2,012 | |||||||||
Total | $ | 374,921 | $ | 35,603 | $ | 66,590 | $ | 270,716 | $ | 2,012 | |||||||||
(1) | Based on interest rates in effect at December 31, 2017. |
Debt Compliance
At December 31, 2017, we were in compliance with all the financial covenants under our ABL Facility and the Term Loan Facility. Based on management’s current projections, we expect to be in compliance with all the covenants under our ABL Facility and Term Loan Facility for the next twelve months. A breach of any of these covenants, ratios or tests could result in a default under our indebtedness. See “- Debt Service” and “Item 1A. Risk Factors”
Capital Expenditures
During the year ended December 31, 2017, our capital expenditures totaled $16.1 million, primarily related to the ongoing replacement to our rig service fleet, coiled tubing units, fluid transportation equipment and rental equipment. Our capital expenditure plan for 2018 contemplates spending between $30 million and $35 million, subject to market conditions. This is primarily related to equipment replacement needs, including ongoing replacement to our rig services fleet. Our capital expenditure program for 2018 is subject to market conditions, including activity levels, commodity prices, industry capacity and specific customer needs as well as cash flows, including cash generated from asset sales. Our focus for 2018 will be the maximization of our current equipment fleet, but we may choose to increase our capital expenditures in 2018 to expand our presence in a market. We currently anticipate funding our 2018 capital expenditures through a combination of cash on hand, operating cash flow, proceeds from sales of assets and borrowings under our ABL Facility. Should our operating cash flows or activity levels prove to be insufficient to fund our currently planned capital spending levels, management expects it will adjust our capital spending plans accordingly. We may also incur capital expenditures for strategic investments and acquisitions.
Critical Accounting Policies
Our Accounting Department is responsible for the development and application of our accounting policies and internal control procedures and reports to the Chief Financial Officer.
The process of preparing our financial statements in conformity with GAAP requires us to make certain estimates, judgments and assumptions, which may affect the reported amounts of our assets and liabilities, disclosures of contingencies at the balance sheet date, the amounts of revenues and expenses recognized during the reporting period and the presentation of our statement of cash flows. We may record materially different amounts if these estimates, judgments and assumptions change or if actual results differ. However, we analyze our estimates, assumptions and judgments based on our historical experience and various other factors that we believe to be reasonable under the circumstances.
We have identified the following critical accounting policies that require a significant amount of estimation or judgment to accurately present our financial position, results of operations and cash flows:
• | Revenue recognition; |
• | Estimate of reserves for workers’ compensation, vehicular liability and other self-insurance; |
• | Contingencies; |
• | Income taxes; |
• | Estimates of depreciable lives; |
• | Valuation of indefinite-lived intangible assets; |
• | Valuation of tangible and finite-lived intangible assets; and |
• | Valuation of equity-based compensation. |
39
Revenue Recognition
We recognize revenue when all of the following criteria have been met: (i) evidence of an arrangement exists, (ii) delivery has occurred or services have been rendered, (iii) the price to the customer is fixed and determinable and (iv) collectability is reasonably assured.
• | Evidence of an arrangement exists when a final understanding between us and our customer has occurred, and can be evidenced by a completed customer purchase order, field ticket, supplier contract, or master service agreement. |
• | Delivery has occurred or services have been rendered when we have completed requirements pursuant to the terms of the arrangement as evidenced by a field ticket or service log. |
• | The price to the customer is fixed and determinable when the amount that is required to be paid is agreed upon. Evidence of the price being fixed and determinable is evidenced by contractual terms, our price book, a completed customer purchase order, or a field ticket. |
• | Collectability is reasonably assured when we screen our customers and provide goods and services to customers according to determined credit terms that have been granted in accordance with our credit policy. |
We present our revenues net of any sales taxes collected by us from our customers that are required to be remitted to local or state governmental taxing authorities.
We review our contracts for multiple element revenue arrangements. Deliverables will be separated into units of accounting and assigned fair value if they have standalone value to our customer, have objective and reliable evidence of fair value, and delivery of undelivered items is substantially controlled by us. We believe that the negotiated prices for deliverables in our services contracts are representative of fair value since the acceptance or non-acceptance of each element in the contract does not affect the other elements.
Workers’ Compensation, Vehicular Liability and Other Self-Insurance
The occurrence of an event not fully insured or indemnified against, or the failure of a customer or insurer to meet its indemnification or insurance obligations, could result in substantial losses. In addition, insurance may not be available to cover any or all of these risks, and, if available, we might not be able to obtain such insurance without a substantial increase in premiums. It is possible that, in addition to higher premiums, future insurance coverage may be subject to higher deductibles and coverage restrictions.
We estimate our liability arising out of uninsured and potentially insured events, including workers’ compensation, employer’s liability, vehicular liability, and general liability, and record accruals in our consolidated financial statements. Reserves related to claims are based on the specific facts and circumstances of the insured event and our past experience with similar claims and trend analysis. We adjust loss estimates in the calculation of these accruals based upon actual claim settlements and reported claims. Loss estimates for individual claims are adjusted based upon actual claim judgments, settlements and reported claims. The actual outcome of these claims could differ significantly from estimated amounts. Changes in our assumptions and estimates could potentially have a negative impact on our earnings.
We are primarily self-insured against physical damage to our property, rigs, equipment and automobiles due to large deductibles or self-insurance.
Contingencies
We are periodically required to record other loss contingencies, which relate to lawsuits, claims, proceedings and tax-related audits in the normal course of our operations, on our consolidated balance sheet. We record a loss contingency for these matters when it is probable that a liability has been incurred and the amount of the loss can be reasonably estimated. We periodically review our loss contingencies to ensure that we have recorded appropriate liabilities on the balance sheet. We adjust these liabilities based on estimates and judgments made by management with respect to the likely outcome of these matters, including the effect of any applicable insurance coverage for litigation matters. Our estimates and judgments could change based on new information, changes in laws or regulations, changes in management’s plans or intentions, the outcome of legal proceedings, settlements or other factors. Actual results could vary materially from these reserves.
We record liabilities when environmental assessment indicates that site remediation efforts are probable and the costs can be reasonably estimated. We measure environmental liabilities based, in part, on relevant past experience, currently enacted laws and regulations, existing technology, site-specific costs and cost-sharing arrangements. Recognition of any joint and several liability is based upon our best estimate of our final pro-rata share of such liability or the low amount in a range of estimates. These assumptions involve the judgments and estimates of management, and any changes in assumptions or new information could lead to increases or decreases in our ultimate liability, with any such changes recognized immediately in earnings.
We record legal obligations to retire tangible, long-lived assets on our balance sheet as liabilities, which are recorded at a discount when we incur the liability. Significant judgment is involved in estimating our future cash flows associated with such
40
obligations, as well as the ultimate timing of the cash flows. If our estimates on the amount or timing of the cash flows change, the change may have a material impact on our results of operations.
Income Taxes
We account for deferred income taxes using the asset and liability method and provide income taxes for all significant temporary differences. Management determines our current tax liability as well as taxes incurred as a result of current operations, yet deferred until future periods. Current taxes payable represent our liability related to our income tax returns for the current year, while net deferred tax expense or benefit represents the change in the balance of deferred tax assets and liabilities reported on our consolidated balance sheets. Deferred tax assets and liabilities are measured using enacted tax rates expected to apply to taxable income in the years in which those temporary differences are expected to be recovered or settled. Further, management makes certain assumptions about the timing of temporary tax differences for the differing treatment of certain items for tax and accounting purposes or whether such differences are permanent. The final determination of our tax liability involves the interpretation of local tax laws, tax treaties, and related authorities in each jurisdiction as well as the significant use of estimates and assumptions regarding the scope of future operations and results achieved and the timing and nature of income earned and expenditures incurred.
We record valuation allowances to reduce deferred tax assets if we determine that it is more likely than not (e.g., a likelihood of more than 50%) that some or all of the deferred tax assets will not be realized in future periods. To assess the likelihood, we use estimates and judgment regarding our future taxable income, as well as the jurisdiction in which this taxable income is generated, to determine whether a valuation allowance is required. The ultimate realization of the deferred tax assets depends on the ability to generate sufficient taxable income of the appropriate character and in the related jurisdiction in the future. Evidence supporting this ability can include our current financial position, our results of operations, both actual and forecasted results, the reversal of deferred tax liabilities, and tax planning strategies as well as the current and forecasted business economics of our industry. Additionally, we record uncertain tax positions in the financial statements at their net recognizable amount, based on the amount that management deems is more likely than not to be sustained upon ultimate settlement with the tax authorities in the domestic and international tax jurisdictions in which we operate.
If our estimates or assumptions regarding our current and deferred tax items are inaccurate or are modified, these changes could have potentially material negative impacts on our earnings.
Estimates of Depreciable Lives
We use the estimated depreciable lives of our long-lived assets, such as rigs, heavy-duty trucks and trailers, to compute depreciation expense, to estimate future asset retirement obligations and to conduct impairment tests. We base the estimates of our depreciable lives on a number of factors, such as the environment in which the assets operate, industry factors including forecasted prices and competition, and the assumption that we provide the appropriate amount of capital expenditures while the asset is in operation to maintain economical operation of the asset and prevent untimely demise to scrap. The useful lives of our intangible assets are determined by the years over which we expect the assets to generate a benefit based on legal, contractual or other expectations.
We depreciate our operational assets over their depreciable lives to their salvage value, which is generally 10% of the acquisition cost. We recognize a gain or loss upon ultimate disposal of the asset based on the difference between the carrying value of the asset on the disposal date and any proceeds we receive in connection with the disposal.
We periodically analyze our estimates of the depreciable lives of our fixed assets to determine if the depreciable periods and salvage value continue to be appropriate. We also analyze useful lives and salvage value when events or conditions occur that could shorten the remaining depreciable life of the asset. We review the depreciable periods and salvage values for reasonableness, given current conditions. As a result, our depreciation expense is based upon estimates of depreciable lives of the fixed assets, the salvage value and economic factors, all of which require management to make significant judgments and estimates. If we determine that the depreciable lives should be different than originally estimated, depreciation expense may increase or decrease and impairments in the carrying values of our fixed assets may result, which could negatively impact our earnings.
41
Valuation of Indefinite-Lived Intangible Assets
We periodically review our intangible assets not subject to amortization, including our goodwill, to determine whether an impairment of those assets may exist. These tests must be made on at least an annual basis, or more often if circumstances indicate that the assets may be impaired. These circumstances include, but are not limited to, significant adverse changes in the business climate. The test for impairment of indefinite-lived intangible assets allows us to first assess the qualitative factors to determine whether it is “more likely than not” that the fair value of a reporting unit is less than its carrying amount as a basis for determining whether it is necessary to perform the two-step goodwill impairment test. If our qualitative analysis shows that it is “more likely than not” that the fair value of a reporting unit is less than its carrying amount, we will perform the two-step goodwill impairment test. In the first step, a fair value is calculated for each of our reporting units, and that fair value is compared to the current carrying value of the reporting unit, including the reporting unit’s goodwill. If the fair value of the reporting unit exceeds its carrying value, there is no potential impairment, and the second step is not performed. If the carrying value exceeds the fair value of the reporting unit, then the second step is required. The second step of the test for impairment compares the implied fair value of the reporting unit’s goodwill to its current carrying value. The implied fair value of the reporting unit’s goodwill is determined in the same manner as the amount of goodwill that would be recognized in a business combination, with the purchase price being equal to the fair value of the reporting unit. If the implied fair value of the reporting unit’s goodwill is in excess of its carrying value, no impairment charge is recorded. If the carrying value of the reporting unit’s goodwill is in excess of its implied fair value, an impairment charge equal to the excess is recorded. In determining the fair value of our reporting units, we use a weighted-average approach of three commonly used valuation techniques — a discounted cash flow method, a guideline companies method, and a similar transactions method. We assigned a weight to the results of each of these methods based on the facts and circumstances that are in existence for that testing period. We assigned more weight to the discounted cash flow method as we believe it is more representative of the future of the business. In addition to the estimates made by management regarding the weighting of the various valuation techniques, the creation of the techniques themselves requires that we make significant estimates and assumptions. The discounted cash flow method, which was assigned the highest weight by management during the current year, requires us to make assumptions about future cash flows, future growth rates, tax rates in future periods, book-tax differences in the carrying value of our assets in future periods, and discount rates. The assumptions about future cash flows and growth rates are based on our current budgets for future periods, as well as our strategic plans, the beliefs of management about future activity levels, and analysts’ expectations about our revenues, profitability and cash flows in future periods. The assumptions about our future tax rates and book-tax differences in the carrying value of our assets in future periods are based on the assumptions about our future cash flows and growth rates, and management’s knowledge of and beliefs about tax law and practice in current and future periods. The assumptions about discount rates include an assessment of the specific risk associated with each reporting unit being tested, and were developed with the assistance of a third-party valuation consultant. The ultimate conclusions of the valuation techniques remain our responsibility.
Valuation of Tangible and Finite-Lived Intangible Assets
Our fixed assets and finite-lived intangibles are tested for potential impairment when circumstances or events indicate a possible impairment may exist. These circumstances or events are referred to as “trigger events” and examples of such trigger events include, but are not limited to, an adverse change in market conditions, a significant decrease in benefits being derived from an acquired business, a change in the use of an asset, or a significant disposal of a particular asset or asset class.
If a trigger event occurs, an impairment test is performed based on an undiscounted cash flow analysis. To perform an impairment test, we make judgments, estimates and assumptions regarding long-term forecasts of revenues and expenses relating to the assets subject to review. Market conditions, energy prices, estimated depreciable lives of the assets, discount rate assumptions and legal factors impact our operations and have a significant effect on the estimates we use to determine whether our assets are impaired. If the results of the undiscounted cash flow analysis indicate that the carrying value of the assets being tested for impairment are not recoverable, then we record an impairment charge to write the carrying value of the assets down to their fair value. Using different judgments, assumptions or estimates, we could potentially arrive at a materially different fair value for the assets being tested for impairment, which may result in an impairment charge.
Valuation of Equity-Based Compensation
We issue or have issued time-based vesting and performance-based vesting stock options, time-based vesting and performance-based vesting restricted stock units, and restricted stock awards to our employees and non-employee directors. The options we grant are fair valued using a Black-Scholes option model on the grant date and are amortized to compensation expense over the vesting period of the option, net of forfeitures. Compensation related to restricted stock units and restricted stock awards is based on the fair value of the award on the grant date and is amortized to compensation expense over the vesting period of the award, net of forfeitures. The grant-date fair value of our time-based restricted stock units and restricted stock awards is determined using our stock price on the grant date. The grant-date fair value of our performance-based restricted stock units is determined using our stock price on the grant date assuming a 1.0x payout target, however, a maximum 2.0x payout could be achieved if certain EBITDA-based performance measures are met.
42
In utilizing the Black-Scholes option pricing model to determine fair values of stock options, certain assumptions are made which are based on subjective expectations, and are subject to change. A change in one or more of these assumptions would impact the expense associated with future grants. These key assumptions include the historical stock price volatility, the risk-free interest rate and the expected life of awards. In view of the limited amount of time elapsed since our reorganization, volatility is calculated based on historical stock price volatility of our peer group with a lookback period equivalent to the expected term of the award.
Valuation of Warrants
Pursuant to the Plan and on the Effective Date, the Company issued two series of warrants to the former holders of the Predecessor Company's common stock. One series of warrants will expire on December 15, 2020 and the other series of warrants will expire on December 15, 2021. Each warrant is exercisable for one share of the Company’s common stock, par value $0.01. At issuance, the warrants were recorded at fair value, which was determined using the Black-Scholes option pricing model. The warrants are equity classified and, at issuance, were recorded as an increase to additional paid-in capital in the amount of $3.8 million.
Recent Accounting Developments
ASU 2016-18. In November 2016, the FASB issued ASU No. 2016-18 Statement of Cash Flows (Topic 230), Restricted Cash. This standard provides guidance on the presentation of restricted cash and restricted cash equivalents in the statement of cash flows. Restricted cash and restricted cash equivalents should be included with cash and cash equivalents when reconciling the beginning-of-period and end-of-period amounts shown on the statements of cash flows. The amendments of this ASU should be applied using a retrospective transition method and are effective for reporting periods beginning after December 15, 2017, with early adoption permitted. Other than the revised statement of cash flows presentation of restricted cash, the adoption of ASU 2016-18 is not expected to have an impact on our consolidated financial statements.
ASU 2016-15. In August 2016 the FASB issued ASU 2016-15, “Statement of Cash Flows (Topic 230), Classification of Certain Cash Receipts and Cash Payments (a consensus of the FASB Emerging Issues Task Force) (ASU 2016-15)”, that clarifies how entities should classify certain cash receipts and cash payments on the statement of cash flows. The guidance also clarifies how the predominance principle should be applied when cash receipts and cash payments have aspects of more than one class of cash flows. The guidance will be effective for annual periods beginning after December 15, 2017 and interim periods within those annual periods. Early adoption is permitted. The adoption of ASU 2016-15 is not expected to have an impact on our consolidated financial statements.
ASU 2016-13. In June 2016, the FASB issued ASU 2016-13, "Measurement of Credit Losses on Financial Instruments” that will change how companies measure credit losses for most financial assets and certain other instruments that aren’t measured at fair value through net income. The standard will replace today’s “incurred loss” approach with an “expected loss” model for instruments measured at amortized cost. For available-for-sale debt securities, entities will be required to record allowances rather than reduce the carrying amount. The amendments in this update will be effective for annual periods beginning after December 15, 2019 and interim periods within those annual periods. Early adoption is permitted for annual periods beginning after December 15, 2018. The Company is evaluating the effect of ASU 2016-13 on our consolidated financial statements.
ASU 2016-09. In March 2016, the FASB Issued ASU 2016-09 Compensation—Stock Compensation (Topic 718): Improvements to Employee Share-Based Payment Accounting. This standard changes how companies account for certain aspects of share-based payment awards to employees, including the accounting for income taxes, forfeitures, and statutory tax withholding requirements, as well as classification in the statement of cash flows. The Company adopted the accounting guidance as of January 1, 2017 on a prospective basis. We have elected to account for forfeitures of equity awards as they occur. The adoption of this guidance did not have a material impact our consolidated financial statements, with the exception of excess tax benefits and tax deficiencies now being recognized as income tax expense or benefit on the income statement rather than as additional paid in capital on the balance sheet and their classification on the statement of cash flow as operating activity rather than financing activity.
ASU 2016-02. In February 2016, the FASB issued ASU 2016-02, Leases (Topic 842), which will replace the existing lease guidance. The standard is intended to provide enhanced transparency and comparability by requiring lessees to record right-of-use assets and corresponding lease liabilities on the balance sheet. Additional disclosure requirements include qualitative disclosures along with specific quantitative disclosures with the objective of enabling users of financial statements to assess the amount, timing, and uncertainty of cash flows arising from leases. ASU 2016-02 is effective for the Company for annual reporting periods beginning after December 15, 2018, including interim periods within those fiscal years, with early adoption permitted. The new standard is required to be applied with a modified retrospective approach to each prior reporting period presented. We are currently evaluating the standard to determine the impact of its adoption on the consolidated financial statements.
ASU 2014-09. In May 2014, the FASB issued ASU 2014-09, Revenue from Contracts with Customers (Topic 606). The objective of this ASU is to establish the principles to report useful information to users of financial statements about the nature,
43
amount, timing, and uncertainty of revenue from contracts with customers. The core principle is to recognize revenue to depict the transfer of promised goods or services to customers in an amount that reflects the consideration to which the entity expects to be entitled in exchange for those goods or services. ASU 2014-09 must be adopted using either a full retrospective method or a modified retrospective method.
We formed a project team to implement this standard and the team has scoped, identified the relevant revenue streams and documented the procedures and control changes required to address the impacts that ASU 2014-09 may have had on our business. We are now in the process of training our staff on the procedures and controls that went into effect January 1, 2018. Our implementation efforts included the identification of revenue streams with similar contract structures, performing a detailed review of key contracts by revenue stream and comparing historical policies and practices to the new standard. The Company’s services and rental contracts, which principally charge on a day rate basis, are primarily short-term in nature, and therefore, based on the assessment, the Company has concluded that the adoption of this ASU will not have a material impact on its consolidated financial statements. We have adopted the new standard effective January 1, 2018 using the full retrospective method.
ITEM 7A. QUANTITATIVE AND QUALITATIVE DISCLOSURES ABOUT MARKET RISK
When we had operations in Russia, which was sold in the third quarter of 2017, we were exposed to certain market risks as part of our former business operations, including risks from changes in interest rates, foreign currency exchange rates that could have impacted our financial position, results of operations and cash flows. We managed our exposure to these risks through regular operating and financing activities, and could have, on a limited basis, used derivative financial instruments to manage this risk. Derivative financial instruments were not used in the years ended December 31, 2017, 2016 and 2015. To the extent that we would have used such derivative financial instruments, we would have used them only as risk management tools and not for speculative investment purposes.
Interest Rate Risk
Borrowings under our Term Loan Facility bear interest at variable interest rates, and therefore expose us to interest rate risk. As of December 31, 2017, the interest rate on our outstanding variable-rate debt obligations was 11.61%. A hypothetical 10% increase in that rate would increase the annual interest expense on those instruments by $2.9 million. Borrowings under our ABL Facility also bear interest at variable interest rates, however, there are no borrowings under this facility as of December 31, 2017.
Foreign Currency Risk
As of December 31, 2017, we no longer conduct operations in Russia. We completed the sale of our Russian subsidiary in the third quarter of 2017. We also had a Canadian subsidiary which was sold in the second quarter of 2017. The local currency was the functional currency for our former operations in Russia. For balances denominated in our former Russian subsidiary's local currency, changes in the value of their assets and liabilities due to changes in exchange rates were deferred and accumulated in other comprehensive income until we liquidated our investment. Our former Russian subsidiary remeasured its account balances at the end of each period to an equivalent amount of U.S. dollars, with changes reflected in earnings during those periods. A hypothetical 10% decrease in the average value of the U.S. dollar relative to the value of the local currency for our former Russian subsidiary would have increased our net loss by $0.2 million.
44
ITEM 8. FINANCIAL STATEMENTS AND SUPPLEMENTARY DATA
Key Energy Services, Inc. and Subsidiaries
INDEX TO CONSOLIDATED FINANCIAL STATEMENTS
Page | |
45
REPORT OF INDEPENDENT REGISTERED PUBLIC ACCOUNTING FIRM | ||||
Board of Directors and Stockholders
Key Energy Services, Inc.
Opinion on the financial statements
We have audited the accompanying consolidated balance sheets of Key Energy Services, Inc. (a Delaware corporation) and subsidiaries (the “Company”) as of December 31, 2017 and 2016, the related consolidated statements of operations, comprehensive income (loss), stockholders’ equity, and cash flows for the year ended December 31, 2017 (Successor), the period December 16, 2016 through December 31, 2016 (Successor), the period January 1, 2016 through December 15, 2016 (Predecessor), and the year ended December 31, 2015 (Predecessor), and the related notes (collectively referred to as the “financial statements”). In our opinion, the financial statements present fairly, in all material respects, the financial position of the Company as of December 31, 2017 and 2016, and the results of its operations and its cash flows for the year ended December 31, 2017 (Successor), the period December 16, 2016 through December 31, 2016 (Successor), the period January 1, 2016 through December 15, 2016 (Predecessor), and the year ended December 31, 2015 (Predecessor), in conformity with accounting principles generally accepted in the United States of America.
We also have audited, in accordance with the standards of the Public Company Accounting Oversight Board (United States) (“PCAOB”), the Company’s internal control over financial reporting as of December 31, 2017, based on criteria established in the 2013 Internal Control-Integrated Framework issued by the Committee of Sponsoring Organizations of the Treadway Commission (“COSO”), and our report dated February 28, 2018 expressed an unqualified opinion.
Basis for opinion
These financial statements are the responsibility of the Company’s management. Our responsibility is to express an opinion on the Company’s financial statements based on our audits. We are a public accounting firm registered with the PCAOB and are required to be independent with respect to the Company in accordance with the U.S. federal securities laws and the applicable rules and regulations of the Securities and Exchange Commission and the PCAOB.
We conducted our audits in accordance with the standards of the PCAOB. Those standards require that we plan and perform the audit to obtain reasonable assurance about whether the financial statements are free of material misstatement, whether due to error or fraud. Our audits included performing procedures to assess the risks of material misstatement of the financial statements, whether due to error or fraud, and performing procedures that respond to those risks. Such procedures included examining, on a test basis, evidence supporting the amounts and disclosures in the financial statements. Our audits also included evaluating the accounting principles used and significant estimates made by management, as well as evaluating the overall presentation of the financial statements. We believe that our audits provide a reasonable basis for our opinion.
/s/ GRANT THORNTON LLP
We have served as the Company’s auditor since 2006.
Houston, Texas
February 28, 2018
46
REPORT OF INDEPENDENT REGISTERED PUBLIC ACCOUNTING FIRM | ||||
Board of Directors and Stockholders
Key Energy Services, Inc.
Opinion on internal control over financial reporting
We have audited the internal control over financial reporting of Key Energy Services, Inc. (a Delaware corporation) and subsidiaries (the “Company”) as of December 31, 2017, based on criteria established in the 2013 Internal Control-Integrated Framework issued by the Committee of Sponsoring Organizations of the Treadway Commission (“COSO”). In our opinion, the Company maintained, in all material respects, effective internal control over financial reporting as of December 31, 2017, based on criteria established in the 2013 Internal Control-Integrated Framework issued by COSO.
We also have audited, in accordance with the standards of the Public Company Accounting Oversight Board (United States) (“PCAOB”), the consolidated financial statements of the Company as of and for the year ended December 31, 2017, and our report dated February 28, 2018 expressed an unqualified opinion on those financial statements.
Basis for opinion
The Company’s management is responsible for maintaining effective internal control over financial reporting and for its assessment of the effectiveness of internal control over financial reporting, included in the accompanying Management’s Report on Internal Control Over Financial Reporting. Our responsibility is to express an opinion on the Company’s internal control over financial reporting based on our audit. We are a public accounting firm registered with the PCAOB and are required to be independent with respect to the Company in accordance with the U.S. federal securities laws and the applicable rules and regulations of the Securities and Exchange Commission and the PCAOB.
We conducted our audit in accordance with the standards of the PCAOB. Those standards require that we plan and perform the audit to obtain reasonable assurance about whether effective internal control over financial reporting was maintained in all material respects. Our audit included obtaining an understanding of internal control over financial reporting, assessing the risk that a material weakness exists, testing and evaluating the design and operating effectiveness of internal control based on the assessed risk, and performing such other procedures as we considered necessary in the circumstances. We believe that our audit provides a reasonable basis for our opinion.
Definition and limitations of internal control over financial reporting
A company’s internal control over financial reporting is a process designed to provide reasonable assurance regarding the reliability of financial reporting and the preparation of financial statements for external purposes in accordance with generally accepted accounting principles. A company’s internal control over financial reporting includes those policies and procedures that (1) pertain to the maintenance of records that, in reasonable detail, accurately and fairly reflect the transactions and dispositions of the assets of the company; (2) provide reasonable assurance that transactions are recorded as necessary to permit preparation of financial statements in accordance with generally accepted accounting principles, and that receipts and expenditures of the company are being made only in accordance with authorizations of management and directors of the company; and (3) provide reasonable assurance regarding prevention or timely detection of unauthorized acquisition, use, or disposition of the company’s assets that could have a material effect on the financial statements.
Because of its inherent limitations, internal control over financial reporting may not prevent or detect misstatements. Also, projections of any evaluation of effectiveness to future periods are subject to the risk that controls may become inadequate because of changes in conditions, or that the degree of compliance with the policies or procedures may deteriorate.
/s/ GRANT THORNTON LLP
Houston, Texas
February 28, 2018
47
Key Energy Services, Inc. and Subsidiaries
CONSOLIDATED BALANCE SHEETS
(in thousands, except per share amounts)
December 31, | |||||||
2017 | 2016 | ||||||
ASSETS | |||||||
Current assets: | |||||||
Cash and cash equivalents | $ | 73,065 | $ | 90,505 | |||
Restricted cash | 4,000 | 24,707 | |||||
Accounts receivable, net of allowance for doubtful accounts of $875 and $168 | 69,319 | 71,327 | |||||
Inventories | 20,942 | 22,269 | |||||
Other current assets | 19,477 | 25,762 | |||||
Total current assets | 186,803 | 234,570 | |||||
Property and equipment, gross | 413,127 | 408,716 | |||||
Accumulated depreciation | (85,813 | ) | (3,565 | ) | |||
Property and equipment, net | 327,314 | 405,151 | |||||
Intangible assets, net | 462 | 520 | |||||
Other assets | 14,542 | 17,740 | |||||
TOTAL ASSETS | $ | 529,121 | $ | 657,981 | |||
LIABILITIES AND EQUITY | |||||||
Current liabilities: | |||||||
Accounts payable | $ | 13,697 | $ | 10,357 | |||
Other current liabilities | 87,579 | 103,938 | |||||
Current portion of long-term debt | 2,500 | 2,500 | |||||
Total current liabilities | 103,776 | 116,795 | |||||
Long-term debt | 243,103 | 245,477 | |||||
Workers’ compensation, vehicular and health insurance liabilities | 25,393 | 23,313 | |||||
Other non-current liabilities | 28,166 | 29,779 | |||||
Commitments and contingencies | |||||||
Equity: | |||||||
Preferred stock, $0.01 par value; 10,000,000 authorized and one share issued and outstanding | — | — | |||||
Common stock, $0.01 par value; 100,000,000 shares authorized, 20,217,641 and 20,096,462 outstanding | 202 | 201 | |||||
Additional paid-in capital | 259,314 | 252,421 | |||||
Accumulated other comprehensive income | — | 239 | |||||
Retained earnings deficit | (130,833 | ) | (10,244 | ) | |||
Total equity | 128,683 | 242,617 | |||||
TOTAL LIABILITIES AND EQUITY | $ | 529,121 | $ | 657,981 | |||
See the accompanying notes which are an integral part of these consolidated financial statements
48
Key Energy Services, Inc. and Subsidiaries
CONSOLIDATED STATEMENTS OF OPERATIONS
(in thousands, except per share amounts)
Successor | Predecessor | |||||||||||||||
Year Ended December 31, 2017 | Period from December 16, 2016 through December 31, 2016 | Period from January 1, 2016 through December 15, 2016 | Year Ended December 31, 2015 | |||||||||||||
REVENUES | $ | 436,165 | $ | 17,830 | $ | 399,423 | $ | 792,326 | ||||||||
COSTS AND EXPENSES: | ||||||||||||||||
Direct operating expenses | 332,332 | 16,603 | 362,825 | 714,637 | ||||||||||||
Depreciation and amortization expense | 84,542 | 3,574 | 131,296 | 180,271 | ||||||||||||
General and administrative expenses | 115,284 | 6,501 | 163,257 | 202,631 | ||||||||||||
Impairment expense | 187 | — | 44,646 | 722,096 | ||||||||||||
Operating loss | (96,180 | ) | (8,848 | ) | (302,601 | ) | (1,027,309 | ) | ||||||||
Reorganization items, net | 1,501 | — | (245,571 | ) | — | |||||||||||
Interest expense, net of amounts capitalized | 31,797 | 1,364 | 74,320 | 73,847 | ||||||||||||
Other (income) loss, net | (7,187 | ) | 32 | (2,443 | ) | 9,394 | ||||||||||
Loss before income taxes | (122,291 | ) | (10,244 | ) | (128,907 | ) | (1,110,550 | ) | ||||||||
Income tax (expense) benefit | 1,702 | — | (2,829 | ) | 192,849 | |||||||||||
NET LOSS | $ | (120,589 | ) | $ | (10,244 | ) | $ | (131,736 | ) | $ | (917,701 | ) | ||||
Loss per share: | ||||||||||||||||
Basic and diluted | $ | (6.00 | ) | $ | (0.51 | ) | $ | (0.82 | ) | $ | (5.86 | ) | ||||
Weighted Average Shares Outstanding: | ||||||||||||||||
Basic and diluted | 20,105 | 20,090 | 160,587 | 156,598 | ||||||||||||
See the accompanying notes which are an integral part of these consolidated financial statements
49
Key Energy Services, Inc. and Subsidiaries
CONSOLIDATED STATEMENTS OF COMPREHENSIVE INCOME (LOSS)
(in thousands)
Successor | Predecessor | |||||||||||||||
Year Ended December 31, 2017 | Period from December 16, 2016 through December 31, 2016 | Period from January 1, 2016 through December 15, 2016 | Year Ended December 31, 2015 | |||||||||||||
NET LOSS | $ | (120,589 | ) | $ | (10,244 | ) | $ | (131,736 | ) | $ | (917,701 | ) | ||||
Other comprehensive income (loss): | ||||||||||||||||
Foreign currency translation income (loss) | (239 | ) | 239 | 3,346 | (6,460 | ) | ||||||||||
Total other comprehensive income (loss) | (239 | ) | 239 | 3,346 | (6,460 | ) | ||||||||||
COMPREHENSIVE LOSS | $ | (120,828 | ) | $ | (10,005 | ) | $ | (128,390 | ) | $ | (924,161 | ) | ||||
See the accompanying notes which are an integral part of these consolidated financial statements
50
Key Energy Services, Inc. and Subsidiaries
CONSOLIDATED STATEMENTS OF CASH FLOWS
(in thousands)
Successor | Predecessor | |||||||||||||||
Year Ended December 31, 2017 | Period from December 16, 2016 through December 31, 2016 | Period from January 1, 2016 through December 15, 2016 | Year Ended December 31, 2015 | |||||||||||||
CASH FLOWS FROM OPERATING ACTIVITIES: | ||||||||||||||||
Net loss | $ | (120,589 | ) | $ | (10,244 | ) | $ | (131,736 | ) | $ | (917,701 | ) | ||||
Adjustments to reconcile net loss to net cash provided by (used in) operating activities: | ||||||||||||||||
Depreciation and amortization expense | 84,542 | 3,574 | 131,296 | 180,271 | ||||||||||||
Impairment expense | 187 | — | 44,646 | 722,096 | ||||||||||||
Bad debt expense | 1,420 | 168 | 2,532 | 21,172 | ||||||||||||
Accretion of asset retirement obligations | 221 | 34 | 570 | 630 | ||||||||||||
(Income) loss from equity method investments | 560 | — | 466 | (39 | ) | |||||||||||
Amortization and write-off of deferred financing costs and premium on debt | 476 | 17 | 4,414 | 4,645 | ||||||||||||
Deferred income tax expense (benefit) | (35 | ) | — | 787 | (189,327 | ) | ||||||||||
(Gain) loss on disposal of assets, net | (27,583 | ) | (12 | ) | 4,707 | 51,531 | ||||||||||
Share-based compensation | 7,591 | — | 5,740 | 10,173 | ||||||||||||
Excess tax expense from share-based compensation | — | — | — | 3,423 | ||||||||||||
Reorganization items, non-cash | — | — | (261,806 | ) | — | |||||||||||
Changes in working capital: | ||||||||||||||||
Accounts receivable | 669 | 855 | 41,574 | 151,489 | ||||||||||||
Other current assets | 7,764 | 607 | 52,010 | 12,050 | ||||||||||||
Accounts payable and accrued liabilities | (13,017 | ) | 3,729 | (135,557 | ) | (91,978 | ) | |||||||||
Share-based compensation liability awards | — | — | (227 | ) | — | |||||||||||
Other assets and liabilities | 6,427 | 855 | 102,135 | 19,179 | ||||||||||||
Net cash used in operating activities | (51,367 | ) | (417 | ) | (138,449 | ) | (22,386 | ) | ||||||||
CASH FLOWS FROM INVESTING ACTIVITIES: | ||||||||||||||||
Capital expenditures | (16,079 | ) | (375 | ) | (8,481 | ) | (40,808 | ) | ||||||||
Proceeds from sale of assets | 32,992 | 124 | 15,025 | 20,810 | ||||||||||||
Proceeds from notes receivable | — | — | — | 595 | ||||||||||||
Net cash provided by (used in) investing activities | 16,913 | (251 | ) | 6,544 | (19,403 | ) | ||||||||||
CASH FLOWS FROM FINANCING ACTIVITIES: | ||||||||||||||||
Repayments of long-term debt | (2,500 | ) | — | (313,424 | ) | (1,575 | ) | |||||||||
Proceeds from long-term debt | — | — | 250,000 | 305,550 | ||||||||||||
Proceeds from stock rights offering | — | — | 109,082 | — | ||||||||||||
Restricted cash | 20,707 | (15 | ) | (24,692 | ) | — | ||||||||||
Proceeds from borrowings on revolving credit facility | — | — | — | 130,000 | ||||||||||||
Repayments on revolving credit facility | — | — | — | (200,000 | ) | |||||||||||
Payment of deferred financing costs | (350 | ) | — | (2,040 | ) | (11,461 | ) | |||||||||
Repurchases of common stock | (697 | ) | — | (167 | ) | (362 | ) | |||||||||
Excess tax expense from share-based compensation | — | — | — | (3,423 | ) | |||||||||||
Net cash provided by (used in) financing activities | 17,160 | (15 | ) | 18,759 | 218,729 | |||||||||||
Effect of changes in exchange rates on cash | (146 | ) | — | (20 | ) | 110 | ||||||||||
Net increase (decrease) in cash and cash equivalents | (17,440 | ) | (683 | ) | (113,166 | ) | 177,050 | |||||||||
Cash and cash equivalents, beginning of period | 90,505 | 91,188 | 204,354 | 27,304 | ||||||||||||
Cash and cash equivalents, end of period | $ | 73,065 | $ | 90,505 | $ | 91,188 | $ | 204,354 | ||||||||
See the accompanying notes which are an integral part of these consolidated financial statements
51
Key Energy Services, Inc. and Subsidiaries
CONSOLIDATED STATEMENTS OF STOCKHOLDERS’ EQUITY
(in thousands, except per share data)
COMMON STOCKHOLDERS | Total | |||||||||||||||||||||
Common Stock | Additional Paid-in Capital | Accumulated Other Comprehensive Loss | Retained Earnings (Deficit) | |||||||||||||||||||
Number of Shares | Amount at par | |||||||||||||||||||||
BALANCE AT DECEMBER 31, 2014 (Predecessor) | 153,557 | $ | 15,356 | $ | 960,647 | $ | (37,280 | ) | $ | 119,340 | $ | 1,058,063 | ||||||||||
Foreign currency translation | — | — | — | (6,460 | ) | — | (6,460 | ) | ||||||||||||||
Common stock purchases | (240 | ) | (24 | ) | (338 | ) | — | — | (362 | ) | ||||||||||||
Share-based compensation | 4,226 | 422 | 9,751 | — | — | 10,173 | ||||||||||||||||
Tax expense from share-based compensation | — | — | (3,423 | ) | — | — | (3,423 | ) | ||||||||||||||
Net loss | — | — | — | — | (917,701 | ) | (917,701 | ) | ||||||||||||||
BALANCE AT DECEMBER 31, 2015 (Predecessor) | 157,543 | 15,754 | 966,637 | (43,740 | ) | (798,361 | ) | 140,290 | ||||||||||||||
Foreign currency translation | — | — | — | 3,346 | — | 3,346 | ||||||||||||||||
Common stock purchases | (569 | ) | (57 | ) | (110 | ) | — | — | (167 | ) | ||||||||||||
Share-based compensation | 3,579 | 358 | 5,382 | — | — | 5,740 | ||||||||||||||||
Distributions to holders of Predecessor common stock | — | — | (17,463 | ) | — | — | (17,463 | ) | ||||||||||||||
Other | — | — | (10 | ) | — | — | (10 | ) | ||||||||||||||
Net loss | — | — | — | — | (131,736 | ) | (131,736 | ) | ||||||||||||||
BALANCE AT DECEMBER 15, 2016 (Predecessor) | 160,553 | 16,055 | 954,436 | (40,394 | ) | (930,097 | ) | — | ||||||||||||||
Cancellation of Predecessor equity | (160,553 | ) | (16,055 | ) | (954,436 | ) | 40,394 | 930,097 | — | |||||||||||||
BALANCE AT DECEMBER 15, 2016 (Predecessor) | — | $ | — | $ | — | $ | — | $ | — | $ | — | |||||||||||
Shares issued in rights offering | 11,769 | $ | 118 | $ | 108,866 | $ | — | $ | — | $ | 108,984 | |||||||||||
Shares withheld to satisfy tax withholding obligations | (8 | ) | — | (210 | ) | — | — | (210 | ) | |||||||||||||
Issuance of shares pursuant to the Plan | 8,316 | 83 | 139,505 | — | — | 139,588 | ||||||||||||||||
Issuance of warrants pursuant to the Plan | — | — | 3,768 | — | — | 3,768 | ||||||||||||||||
BALANCE AT DECEMBER 16, 2016 (Successor) | 20,077 | 201 | 251,929 | — | — | 252,130 | ||||||||||||||||
Foreign currency translation | — | — | — | 239 | — | 239 | ||||||||||||||||
Share-based compensation | 19 | — | 492 | — | — | 492 | ||||||||||||||||
Net loss | — | — | — | — | (10,244 | ) | (10,244 | ) | ||||||||||||||
BALANCE AT DECEMBER 31, 2016 (Successor) | 20,096 | 201 | 252,421 | 239 | (10,244 | ) | 242,617 | |||||||||||||||
Foreign currency translation | — | — | — | (239 | ) | — | (239 | ) | ||||||||||||||
Common stock purchases | (56 | ) | (1 | ) | (696 | ) | — | — | (697 | ) | ||||||||||||
Share-based compensation | 177 | 2 | 7,589 | — | — | 7,591 | ||||||||||||||||
Net loss | — | — | — | — | (120,589 | ) | (120,589 | ) | ||||||||||||||
BALANCE AT DECEMBER 31, 2017 (Successor) | 20,217 | $ | 202 | $ | 259,314 | $ | — | $ | (130,833 | ) | $ | 128,683 | ||||||||||
See the accompanying notes which are an integral part of these consolidated financial statements
52
Key Energy Services, Inc. and Subsidiaries
NOTES TO CONSOLIDATED FINANCIAL STATEMENTS
NOTE 1. ORGANIZATION AND SUMMARY OF SIGNIFICANT ACCOUNTING POLICIES
Key Energy Services, Inc., and its wholly owned subsidiaries (collectively, “Key,” the “Company,” “we,” “us,” “its,” and “our”) provide a full range of well services to major oil companies, independent oil and natural gas production companies. Our services include rig-based and coiled tubing-based well maintenance and workover services, well completion and recompletion services, fluid management services, fishing and rental services, and other ancillary oilfield services. Additionally, certain of our rigs are capable of specialty drilling applications. We operate in most major oil and natural gas producing regions of the continental United States.
Basis of Presentation
The consolidated financial statements included in this Annual Report on Form 10-K present our financial position, results of operations and cash flows for the periods presented in accordance with GAAP.
The preparation of these consolidated financial statements requires us to develop estimates and to make assumptions that affect our financial position, results of operations and cash flows. These estimates also impact the nature and extent of our disclosure, if any, of our contingent liabilities. Among other things, we use estimates to (i) analyze assets for possible impairment, (ii) determine depreciable lives for our assets, (iii) assess future tax exposure and realization of deferred tax assets, (iv) determine amounts to accrue for contingencies, (v) value tangible and intangible assets, (vi) assess workers’ compensation, vehicular liability, self-insured risk accruals and other insurance reserves, (vii) provide allowances for our uncollectible accounts receivable, (viii) value our asset retirement obligations, and (ix) value our equity-based compensation. We review all significant estimates on a recurring basis and record the effect of any necessary adjustments prior to publication of our financial statements. Adjustments made with respect to the use of estimates relate to improved information not previously available. Because of the limitations inherent in this process, our actual results may differ materially from these estimates. We believe that our estimates are reasonable.
On October 24, 2016, Key and certain of our domestic subsidiaries filed voluntary petitions for reorganization under chapter 11 of the United States Bankruptcy Code in the United States Bankruptcy Court for the District of Delaware pursuant to a prepackaged plan of reorganization (“the Plan”). The Plan was confirmed by the Bankruptcy Court on December 6, 2016, and the Company emerged from the bankruptcy proceedings on December 15, 2016 (“the Effective Date”).
Upon emergence on the Effective Date, the Company adopted fresh start accounting which resulted in the creation of a new entity for financial reporting purposes. As a result of the application of fresh start accounting, as well as the effects of the implementation of the Plan, the Consolidated Financial Statements on or after December 16, 2016 are not comparable with the Consolidated Financial Statements prior to that date. Refer to “Note 3. Fresh Start Accounting” for additional information.
References to “Successor” or “Successor Company” relate to the financial position and results of operations of the reorganized Company subsequent to December 15, 2016. References to “Predecessor” or “Predecessor Company” refer to the financial position and results of operations of the Company on and prior to December 15, 2016.
We have evaluated events occurring after the balance sheet date included in this Annual Report on Form 10-K for possible disclosure as a subsequent event. Management monitored for subsequent events through the date that these financial statements were issued.
Principles of Consolidation
Within our consolidated financial statements, we include our accounts and the accounts of our majority-owned or controlled subsidiaries. We eliminate intercompany accounts and transactions. When we have an interest in an entity for which we do not have significant control or influence, we account for that interest using the cost method. When we have an interest in an entity and can exert significant influence but not control, we account for that interest using the equity method.
Acquisitions
From time to time, we acquire businesses or assets that are consistent with our long-term growth strategy. Results of operations for acquisitions are included in our financial statements beginning on the date of acquisition and are accounted for using the acquisition method. For all business combinations (whether partial, full or in stages), the acquirer records 100% of all assets and liabilities of the acquired business, including goodwill, at their fair values; including contingent consideration. Final valuations of assets and liabilities are obtained and recorded as soon as practicable no later than one year from the date of the acquisition.
Revenue Recognition
We recognize revenue when all of the following criteria have been met: (i) evidence of an arrangement exists, (ii) delivery has occurred or services have been rendered, (iii) the price to the customer is fixed and determinable and (iv) collectability is reasonably assured.
53
Key Energy Services, Inc. and Subsidiaries
NOTES TO CONSOLIDATED FINANCIAL STATEMENTS — (Continued)
• | Evidence of an arrangement exists when a final understanding between us and our customer has occurred, and can be evidenced by a completed customer purchase order, field ticket, supplier contract, or master service agreement. |
• | Delivery has occurred or services have been rendered when we have completed requirements pursuant to the terms of the arrangement as evidenced by a field ticket or service log. |
• | The price to the customer is fixed and determinable when the amount that is required to be paid is agreed upon. The price being fixed and determinable is evidenced by contractual terms, our price book, a completed customer purchase order, or a field ticket. |
• | Collectability is reasonably assured when we screen our customers and provide goods and services according to determined credit terms that have been granted in accordance with our credit policy. |
We present our revenues net of any sales taxes collected by us from our customers that are required to be remitted to local or state governmental taxing authorities.
We review our contracts for multiple element revenue arrangements. Deliverables will be separated into units of accounting and assigned fair value if they have standalone value to our customer, have objective and reliable evidence of fair value, and delivery of undelivered items is substantially controlled by us. We believe that the negotiated prices for deliverables in our services contracts are representative of fair value since the acceptance or non-acceptance of each element in the contract does not affect the other elements.
Cash and Cash Equivalents
We consider short-term investments with an original maturity of less than three months to be cash equivalents. As of December 31, 2017, all of our obligations under our ABL Facility and Term Loan Facility were secured by most of our assets, including assets held by our subsidiaries, which includes our cash and cash equivalents. We restrict investment of cash to financial institutions with high credit standing and limit the amount of credit exposure to any one financial institution.
We maintain our cash in bank deposit and brokerage accounts which exceed federally insured limits. As of December 31, 2017, accounts were guaranteed by the Federal Deposit Insurance Corporation (“FDIC”) up to $250,000 and substantially all of our accounts held deposits in excess of the FDIC limits.
We believe that the cash held by our other foreign subsidiaries could be repatriated for general corporate use without material withholdings. From time to time and in the normal course of business in connection with our operations or ongoing legal matters, we are required to place certain amounts of our cash in deposit accounts with restrictions that limit our ability to withdraw those funds. Our restricted cash is primarily used to maintain compliance with our ABL Facility.
Certain of our cash accounts are zero-balance controlled disbursement accounts that do not have right of offset against our other cash balances. We present the outstanding checks written against these zero-balance accounts as a component of accounts payable in the accompanying consolidated balance sheets.
Accounts Receivable and Allowance for Doubtful Accounts
We establish provisions for losses on accounts receivable if we determine that there is a possibility that we will not collect all or part of the outstanding balances. We regularly review accounts over 150 days past due from the invoice date for collectability and establish or adjust our allowance as necessary using the specific identification method. If we exhaust all collection efforts and determine that the balance will never be collected, we write off the accounts receivable and the associated provision for uncollectible accounts.
From time to time we are entitled to proceeds under our insurance policies for amounts that we have reserved in our self-insurance liability. We present these insurance receivables gross on our balance sheet as a component of other assets, separate from the corresponding liability.
Concentration of Credit Risk and Significant Customers
Our customers include major oil and natural gas production companies, independent oil and natural gas production companies, and natural gas production companies. We perform ongoing credit evaluations of our customers and usually do not require material collateral. We maintain reserves for potential credit losses when necessary. Our results of operations and financial position should be considered in light of the fluctuations in demand experienced by oilfield service companies as changes in oil and gas producers’ expenditures and budgets occur. These fluctuations can impact our results of operations and financial position as supply and demand factors directly affect utilization and hours which are the primary determinants of our net cash provided by operating activities.
During the year ended December 31, 2017, the period from January 1, 2016 through December 15, 2016 and the year ended December 31, 2015, Chevron Texaco Exploration and Production accounted for approximately 12%, 14% and 15% of our
54
Key Energy Services, Inc. and Subsidiaries
NOTES TO CONSOLIDATED FINANCIAL STATEMENTS — (Continued)
consolidated revenue, respectively. During the period from January 1, 2016 through December 15, 2016, OXY USA Inc. accounted for approximately 13% of our consolidated revenue. No other customer accounted for more than 10% of our consolidated revenue during the year ended December 31, 2017, periods ended from January 1, 2016 through December 15, 2016, December 16, 2016 through December 31, 2016 or in the year ended December 31, 2016.
Receivables outstanding for OXY USA Inc. were approximately 11% of our total accounts receivable as of December 31, 2016. No other customers accounted for more than 10% of our total accounts receivable as of December 31, 2017 and 2016.
Inventories
Inventories, which consist primarily of equipment parts and spares for use in our operations and supplies held for consumption, are valued at the lower of average cost or market.
Property and Equipment
Property and equipment are carried at cost less accumulated depreciation. Depreciation is provided for our assets over the estimated depreciable lives of the assets using the straight-line method. Depreciation expense for the year ended December 31, 2017, the period from December 16, 2016 through December 31, 2016, the period from January 1, 2016 through December 15, 2016 and the year ended December 31, 2015 was $84.5 million, $3.6 million, $129.5 million and $176.1 million, respectively. We depreciate our operational assets over their depreciable lives to their salvage value, which is a value higher than the assets’ value as scrap. Salvage value approximates 10% of an operational asset’s acquisition cost. When an operational asset is stacked or taken out of service, we review its physical condition, depreciable life and ultimate salvage value to determine if the asset is operable and whether the remaining depreciable life and salvage value should be adjusted. When we scrap an asset, we accelerate the depreciation of the asset down to its salvage value. When we dispose of an asset, a gain or loss is recognized.
As of December 31, 2017, the estimated useful lives of our asset classes are as follows:
Description | Years |
Well service rigs and components | 3-15 |
Oilfield trucks, vehicles and related equipment | 4-7 |
Fishing and rental tools, coiled tubing units and equipment, tubulars and pressure control equipment | 3-10 |
Disposal wells | 15 |
Furniture and equipment | 3-7 |
Buildings and improvements | 15-30 |
A long-lived asset or asset group should be tested for recoverability whenever events or changes in circumstances indicate that its carrying amount may not be recoverable. For purposes of testing for impairment, we group our long-lived assets along our lines of business based on the services provided, which is the lowest level for which identifiable cash flows are largely independent of the cash flows of other assets and liabilities. We would record an impairment charge, reducing the net carrying value to estimated fair value, if the asset group’s estimated future cash flows were less than its net carrying value. Events or changes in circumstance that cause us to evaluate our fixed assets for recoverability and possible impairment may include changes in market conditions, such as adverse movements in the prices of oil and natural gas, or changes of an asset group, such as its expected future life, intended use or physical condition, which could reduce the fair value of certain of our property and equipment. The development of future cash flows and the determination of fair value for an asset group involves significant judgment and estimates. See “Note 10. Property and Equipment,” for further discussion.
Asset Retirement Obligations
We recognize a liability for the fair value of all legal obligations associated with the retirement of tangible long-lived assets and capitalize an equal amount as a cost of the asset. We depreciate the additional cost over the estimated useful life of the assets. Our obligations to perform our asset retirement activities are unconditional, despite the uncertainties that may exist surrounding an individual retirement activity. Accordingly, we recognize a liability for the fair value of a conditional asset retirement obligation if the fair value can be reasonably estimated. In determining the fair value, we examine the inputs that we believe a market participant would use if we were to transfer the liability. We probability-weight the potential costs a third-party would charge, adjust the cost for inflation for the estimated life of the asset, and discount this cost using our credit adjusted risk free rate. Significant judgment is involved in estimating future cash flows associated with such obligations, as well as the ultimate timing of those cash flows. If our estimates of the amount or timing of the cash flows change, such changes may have a material impact on our results of operations. See “Note 13. Asset Retirement Obligations.”
55
Key Energy Services, Inc. and Subsidiaries
NOTES TO CONSOLIDATED FINANCIAL STATEMENTS — (Continued)
Deposits
Due to capacity constraints on equipment manufacturers, we are sometimes required to make advanced payments for certain oilfield service equipment and other items used in the normal course of business. As of December 31, 2017 and December 31, 2016, deposits totaled $1.2 million and $8.3 million, respectively. Deposits consist primarily of deposit requirements of insurance companies and payments made related to high demand long-lead time items.
Capitalized Interest
Interest is capitalized on the average amount of accumulated expenditures for major capital projects under construction using an effective interest rate based on related debt until the underlying assets are placed into service. The capitalized interest is added to the cost of the assets and amortized to depreciation expense over the useful life of the assets, and is included in the depreciation and amortization line in the accompanying consolidated statements of operations.
Deferred Financing Costs
Deferred financing costs associated with long-term debt are carried at cost and are amortized to interest expense using the effective interest method over the life of the related debt instrument. When the related debt instrument is retired, any remaining unamortized costs are included in the determination of the gain or loss on the extinguishment of the debt. We record gains and losses from the extinguishment of debt as a part of continuing operations. In accordance with ASU 2015-03, we record debt financing costs as a reduction of our long-term debt. See “Note 16. Long-term Debt,” for further discussion.
Goodwill and Other Intangible Assets
Goodwill results from business combinations and represents the excess of the acquisition consideration over the fair value of the net assets acquired. Goodwill and other intangible assets not subject to amortization are tested for impairment annually or more frequently if events or changes in circumstances indicate that the asset might be impaired.
The test for impairment of indefinite-lived intangible assets allows us to first assess the qualitative factors to determine whether it is “more likely than not” that the fair value of a reporting unit is less than its carrying amount as a basis for determining whether it is necessary to perform the two-step goodwill impairment test. If our qualitative analysis shows that it is “more likely than not” that the fair value of a reporting unit is less than its carrying amount, we will perform the two-step goodwill impairment test. In the first step of the test, a fair value is calculated for each of our reporting units, and that fair value is compared to the carrying value of the reporting unit, including the reporting unit’s goodwill. If the fair value of the reporting unit exceeds its carrying value, there is no impairment, and the second step of the test is not performed. If the carrying value exceeds the fair value for the reporting unit, then the second step of the test is required.
The second step of the test compares the implied fair value of the reporting unit’s goodwill to its carrying value. The implied fair value of the reporting unit’s goodwill is determined in the same manner as the amount of goodwill recognized in a business combination, with the purchase price being equal to the fair value of the reporting unit. If the implied fair value of the reporting unit’s goodwill is in excess of its carrying value, no impairment is recorded. If the carrying value is in excess of the implied fair value, an impairment equal to the excess is recorded.
To assist management in the preparation and analysis of the valuation of our reporting units, we utilize the services of a third-party valuation consultant. The ultimate conclusions of the valuation techniques remain our sole responsibility. The determination of the fair value used in the test is heavily impacted by the market prices of our equity and debt securities, as well as the assumptions and estimates about our future activity levels, profitability and cash flows.
Internal-Use Software
We capitalize costs incurred during the application development stage of internal-use software and amortize these costs over the software’s estimated useful life, generally five to seven years. Costs incurred related to selection or maintenance of internal-use software are expensed as incurred.
Litigation
When estimating our liabilities related to litigation, we take into account all available facts and circumstances in order to determine whether a loss is probable and reasonably estimable.
Various suits and claims arising in the ordinary course of business are pending against us. We conduct business throughout the continental United States and may be subject to jury verdicts or arbitrations that result in outcomes in favor of the plaintiffs. We are also exposed to various claims abroad. We continually assess our contingent liabilities, including potential litigation liabilities, as well as the adequacy of our accruals and our need for the disclosure of these items. We establish a provision for a
56
Key Energy Services, Inc. and Subsidiaries
NOTES TO CONSOLIDATED FINANCIAL STATEMENTS — (Continued)
contingent liability when it is probable that a liability has been incurred and the amount is reasonably estimable. See “Note 17. Commitments and Contingencies.”
Environmental
Our operations routinely involve the storage, handling, transport and disposal of bulk waste materials, some of which contain oil, contaminants, and regulated substances. These operations are subject to various federal, state and local laws and regulations intended to protect the environment. Environmental expenditures are expensed or capitalized depending on their future economic benefit. Expenditures that relate to an existing condition caused by past operations and that have no future economic benefits are expensed. We record liabilities on an undiscounted basis when our remediation efforts are probable and the costs to conduct such remediation efforts can be reasonably estimated. While our litigation reserves reflect the application of our insurance coverage, our environmental reserves do not reflect management’s assessment of the insurance coverage that may apply to the matters at issue. See “Note 17. Commitments and Contingencies.”
Self-Insurance
We are primarily self-insured against physical damage to our equipment and automobiles as well as workers’ compensation claims. The accruals that we maintain on our consolidated balance sheet relate to these deductibles and self-insured retentions, which we estimate through the use of historical claims data and trend analysis. To assist management with the liability amount for our self-insurance reserves, we utilize the services of a third party actuary. The actual outcome of any claim could differ significantly from estimated amounts. We adjust loss estimates in the calculation of these accruals, based upon actual claim settlements and reported claims. See “Note 17. Commitments and Contingencies.”
Income Taxes
We account for deferred income taxes using the asset and liability method and provide income taxes for all significant temporary differences. Management determines our current tax liability as well as taxes incurred as a result of current operations, yet deferred until future periods. Current taxes payable represent our liability related to our income tax returns for the current year, while net deferred tax expense or benefit represents the change in the balance of deferred tax assets and liabilities reported on our consolidated balance sheets. Deferred tax assets and liabilities are measured using enacted tax rates expected to apply to taxable income in the years in which those temporary differences are expected to be recovered or settled. Further, management makes certain assumptions about the timing of temporary tax differences for the differing treatment of certain items for tax and accounting purposes or whether such differences are permanent. The final determination of our tax liability involves the interpretation of local tax laws, tax treaties, and related authorities in each jurisdiction as well as the significant use of estimates and assumptions regarding the scope of future operations and results achieved and the timing and nature of income earned and expenditures incurred.
We record valuation allowances to reduce deferred tax assets if we determine that it is more likely than not (e.g., a likelihood of more than 50%) that some or all of the deferred tax assets will not be realized in future periods. To assess the likelihood, we use estimates and judgment regarding our future taxable income, as well as the jurisdiction in which this taxable income is generated, to determine whether a valuation allowance is required. The ultimate realization of the deferred tax assets depends on the ability to generate sufficient taxable income of the appropriate character and in the related jurisdiction in the future. Evidence supporting this ability can include our current financial position, our results of operations, both actual and forecasted results, the reversal of deferred tax liabilities, and tax planning strategies as well as the current and forecasted business economics of our industry. Additionally, we record uncertain tax positions in the financial statements at their net recognizable amount, based on the amount that management deems is more likely than not to be sustained upon ultimate settlement with the tax authorities in the domestic and international tax jurisdictions in which we operate.
If our estimates or assumptions regarding our current and deferred tax items are inaccurate or are modified, these changes could have potentially material negative impacts on our earnings. See “Note 15. Income Taxes” for further discussion of accounting for income taxes, changes in our valuation allowance, components of our tax rate reconciliation and realization of loss carryforwards.
Earnings Per Share
Basic earnings per common share is determined by dividing net earnings applicable to common stock by the weighted average number of common shares actually outstanding during the period. Diluted earnings per common share is based on the increased number of shares that would be outstanding assuming conversion of dilutive outstanding convertible securities using the treasury stock and “as if converted” methods. See “Note 12. Earnings Per Share.”
57
Key Energy Services, Inc. and Subsidiaries
NOTES TO CONSOLIDATED FINANCIAL STATEMENTS — (Continued)
Share-Based Compensation
We issue or have issued time-based vesting and performance-based vesting stock options, time-based vesting and performance-based vesting restricted stock units, and restricted stock awards to our employees as part of those employees’ compensation and as a retention tool for non-employee directors. We calculate the fair value of the awards on the grant date and amortize that fair value to compensation expense ratably over the vesting period of the award, net of forfeitures. The grant-date fair value of our time-based restricted stock units and restricted stock awards is determined using our stock price on the grant date. The grant-date fair value of our performance-based restricted stock units is determined using our stock price on the grant date assuming a 1.0x payout target, however, a maximum 2.0x payout could be achieved if certain EBITDA-based performance measures are met. The fair value of our stock option awards are estimated using a Black-Scholes fair value model. The valuation of our stock options requires us to estimate the expected term of award, which we estimate using the simplified method, as we do not have sufficient historical exercise information. Additionally, the valuation of our stock option awards is also dependent on historical stock price volatility. In view of the limited amount of time elapsed since our reorganization, volatility is calculated based on historical stock price volatility of our peer group with a lookback period equivalent to the expected term of the award. Fair value of performance-based stock options and restricted stock units is estimated in the same manner as our time-based awards and assumes that performance goals will be achieved and the awards will vest. If the performance based awards do not vest, any previously recognized compensation costs will be reversed. We record share-based compensation as a component of general and administrative or direct operating expense based on the role of the applicable individual. See “Note 21. Share-Based Compensation.”
Foreign Currency Gains and Losses
With respect to our former operations in Russia, which was sold in the third quarter of 2017, where the local currency was the functional currency, assets and liabilities were translated at the rates of exchange in effect on the balance sheet date, while income and expense items were translated at average rates of exchange during the period. The resulting gains or losses arising from the translation of accounts from the functional currency to the U.S. dollar were included as a separate component of stockholders’ equity in other comprehensive income until a partial or complete sale or liquidation of our net investment in the foreign entity. See “Note 18. Accumulated Other Comprehensive Loss.”
From time to time our former foreign subsidiaries may have entered into transactions that are denominated in currencies other than their functional currency. These transactions were initially recorded in the functional currency of that subsidiary based on the applicable exchange rate in effect on the date of the transaction. At the end of each month, those transactions were remeasured to an equivalent amount of the functional currency based on the applicable exchange rates in effect at that time. Any adjustment required to remeasure a transaction to the equivalent amount of the functional currency at the end of the month was recorded in the income or loss of the foreign subsidiary as a component of other income, net.
Comprehensive Loss
We display comprehensive loss and its components in our financial statements, and we classify items of comprehensive income (loss) by their nature in our financial statements and display the accumulated balance of other comprehensive income (loss) separately in our stockholders’ equity.
Leases
We lease real property and equipment through various leasing arrangements. When we enter into a leasing arrangement, we analyze the terms of the arrangement to determine whether the lease should be accounted for as an operating lease or a capital lease.
We periodically incur costs to improve the assets that we lease under these arrangements. If the value of the leasehold improvements exceeds our threshold for capitalization, we record the improvement as a component of our property and equipment and amortize the improvement over the useful life of the improvement or the lease term, whichever is shorter.
Certain of our operating lease agreements are structured to include scheduled and specified rent increases over the term of the lease agreement. These increases may be the result of an inducement or “rent holiday” conveyed to us early in the lease, or are included to reflect the anticipated effects of inflation. We recognize scheduled and specified rent increases on a straight-line basis over the term of the lease agreement. In addition, certain of our operating lease agreements contain incentives to induce us to enter into the lease agreement, such as up-front cash payments to us, payment by the lessor of our costs, such as moving expenses, or the assumption by the lessor of our pre-existing lease agreements with third parties. Any payments made to us or on our behalf represent incentives that we consider to be a reduction of our rent expense, and are recognized on a straight-line basis over the term of the lease agreement.
58
Key Energy Services, Inc. and Subsidiaries
NOTES TO CONSOLIDATED FINANCIAL STATEMENTS — (Continued)
Recent Accounting Developments
ASU 2016-18. In November 2016, the FASB issued ASU No. 2016-18 Statement of Cash Flows (Topic 230), Restricted Cash. This standard provides guidance on the presentation of restricted cash and restricted cash equivalents in the statement of cash flows. Restricted cash and restricted cash equivalents should be included with cash and cash equivalents when reconciling the beginning-of-period and end-of-period amounts shown on the statements of cash flows. The amendments of this ASU should be applied using a retrospective transition method and are effective for reporting periods beginning after December 15, 2017, with early adoption permitted. Other than the revised statement of cash flows presentation of restricted cash, the adoption of ASU 2016-16 is not expected to have an impact on our consolidated financial statements.
ASU 2016-15. In August 2016 the FASB issued ASU 2016-15, “Statement of Cash Flows (Topic 230), Classification of Certain Cash Receipts and Cash Payments (a consensus of the FASB Emerging Issues Task Force) (ASU 2016-15)”, that clarifies how entities should classify certain cash receipts and cash payments on the statement of cash flows. The guidance also clarifies how the predominance principle should be applied when cash receipts and cash payments have aspects of more than one class of cash flows. The guidance will be effective for annual periods beginning after December 15, 2017 and interim periods within those annual periods. Early adoption is permitted. The adoption of ASU 2016-15 is not expected to have an impact on our consolidated financial statements.
ASU 2016-13. In June 2016, the FASB issued ASU 2016-13, "Measurement of Credit Losses on Financial Instruments” that will change how companies measure credit losses for most financial assets and certain other instruments that aren’t measured at fair value through net income. The standard will replace today’s “incurred loss” approach with an “expected loss” model for instruments measured at amortized cost. For available-for-sale debt securities, entities will be required to record allowances rather than reduce the carrying amount. The amendments in this update will be effective for annual periods beginning after December 15, 2019 and interim periods within those annual periods. Early adoption is permitted for annual periods beginning after December 15, 2018. The Company is evaluating the effect of ASU 2016-13 on our consolidated financial statements.
ASU 2016-09. In March 2016, the FASB Issued ASU 2016-09 Compensation—Stock Compensation (Topic 718): Improvements to Employee Share-Based Payment Accounting. This standard changes how companies account for certain aspects of share-based payment awards to employees, including the accounting for income taxes, forfeitures, and statutory tax withholding requirements, as well as classification in the statement of cash flows. The Company adopted the accounting guidance as of January 1, 2017 on a prospective basis. We have elected to account for forfeitures of equity awards as they occur. The adoption of this guidance did not have a material impact our consolidated financial statements, with the exception of excess tax benefits and tax deficiencies now being recognized as income tax expense or benefit on the income statement rather than as additional paid in capital on the balance sheet and their classification on the statement of cash flow as operating activity rather than financing activity.
ASU 2016-02. In February 2016, the FASB issued ASU 2016-02, Leases (Topic 842), which will replace the existing lease guidance. The standard is intended to provide enhanced transparency and comparability by requiring lessees to record right-of-use assets and corresponding lease liabilities on the balance sheet. Additional disclosure requirements include qualitative disclosures along with specific quantitative disclosures with the objective of enabling users of financial statements to assess the amount, timing, and uncertainty of cash flows arising from leases. ASU 2016-02 is effective for the Company for annual reporting periods beginning after December 15, 2018, including interim periods within those fiscal years, with early adoption permitted. The new standard is required to be applied with a modified retrospective approach to each prior reporting period presented. We are currently evaluating the standard to determine the impact of its adoption on the consolidated financial statements.
ASU 2014-09. In May 2014, the FASB issued ASU 2014-09, Revenue from Contracts with Customers (Topic 606). The objective of this ASU is to establish the principles to report useful information to users of financial statements about the nature, amount, timing, and uncertainty of revenue from contracts with customers. The core principle is to recognize revenue to depict the transfer of promised goods or services to customers in an amount that reflects the consideration to which the entity expects to be entitled in exchange for those goods or services. ASU 2014-09 must be adopted using either a full retrospective method or a modified retrospective method.
We formed a project team to implement this standard and the team has scoped, identified the relevant revenue streams and documented the procedures and control changes required to address the impacts that ASU 2014-09 may have had on our business. We are now in the process of training our staff on the procedures and controls that went into effect January 1, 2018. Our implementation efforts included the identification of revenue streams with similar contract structures, performing a detailed review of key contracts by revenue stream and comparing historical policies and practices to the new standard. The Company’s services and rental contracts, which principally charge on a day rate basis, are primarily short-term in nature, and therefore, based on the assessment, the Company has concluded that the adoption of this ASU will not have a material impact on its consolidated financial statements. We have adopted the new standard effective January 1, 2018 using the full retrospective method.
59
Key Energy Services, Inc. and Subsidiaries
NOTES TO CONSOLIDATED FINANCIAL STATEMENTS — (Continued)
NOTE 2. EMERGENCE FROM VOLUNTARY REORGANIZATION
On October 24, 2016, Key and certain of our domestic subsidiaries filed voluntary petitions for reorganization under chapter 11 of the United States Bankruptcy Code in the United States Bankruptcy Court for the District of Delaware pursuant to a prepackaged plan of reorganization. The Plan was confirmed by the Bankruptcy Court on December 6, 2016, and the Company emerged from the bankruptcy proceedings on December 15, 2016.
On the Effective Date, the Company:
• | Reincorporated the Successor Company in the state of Delaware and adopted an amended and restated certificate of incorporation and bylaws; |
• | Appointed new members to the Successor Company’s board of directors to replace directors of the Predecessor Company; |
• | Issued to the Predecessor Company’s former stockholders, in exchange for the cancellation and discharge of the Predecessor Company’s common stock: |
◦ | 815,887 shares of the Successor Company’s common stock; |
◦ | 919,004 warrants to expire on December 15, 2020, and 919,004 warrants to expire on December 15, 2021, each exercisable for one share of the Successor Company’s common stock; |
• | Issued to former holders of the Predecessor Company’s 6.75% senior notes, in exchange for the cancellation and discharge of such notes, 7,500,000 shares of the Successor Company’s common stock; |
• | Issued 11,769,014 shares of the Successor Company’s common stock to certain participants in rights offerings conducted pursuant to the Plan; |
• | Issued to Soter Capital LLC (“Soter”) the sole share of the Successor Company’s Series A Preferred Stock, which confers certain rights to elect directors (but has no economic rights); |
• | Entered into a new $80 million ABL Facility (which was increased to $100 million on February 3, 2017) and a $250 million Term Loan Facility upon termination of the Predecessor Company’s asset-based revolving credit facility and term loan facility; |
• | Entered into a Registration Rights Agreement with certain stockholders of the Successor Company; |
• | Adopted the 2016 Incentive Plan for officers, directors and employees of the Successor Company and its subsidiaries; and |
• | Entered into a corporate advisory services agreement between the Successor Company and Platinum Equity Advisors, LLC (“Platinum”) pursuant to which Platinum will provide certain business advisory services to the Company. |
The foregoing is a summary of the substantive provisions of the Plan and related transactions and is not intended to be a complete description of, or a substitute for a full and complete reading of, the Plan and the other documents referred to above.
NOTE 3. FRESH START ACCOUNTING
In accordance ASC 852 Reorganizations (“ASC 852”), fresh-start accounting was required upon the Company’s emergence from Chapter 11 because (i) the holders of existing voting shares of the Predecessor received less than 50% of the voting shares of the Successor and (ii) the reorganization value of the Predecessor assets immediately prior to confirmation of the Plan was less than the total of all post-petition liabilities and allowed claims.
60
Key Energy Services, Inc. and Subsidiaries
NOTES TO CONSOLIDATED FINANCIAL STATEMENTS — (Continued)
All conditions required for the adoption of fresh-start accounting were met when the Company’s Plan of Reorganization became effective, December 15, 2016. The implementation of the Plan and the application of fresh-start accounting materially changed the carrying amounts and classifications reported in the Company’s consolidated financial statements and resulted in the Company becoming a new entity for financial reporting purposes. As a result of the application of fresh-start accounting and the effects of the implementation of the Plan, the financial statements after December 15, 2016 are not comparable with the financial statements on and prior to December 15, 2016.
Upon the application of fresh-start accounting, the Company allocated the reorganization value to its individual assets and liabilities in conformity with ASC 805, Business Combinations (“ASC 805”). Reorganization value represents the fair value of the Successor Company’s assets before considering liabilities. The excess reorganization value over the fair value of identified tangible and intangible assets is reported as goodwill.
Reorganization Value - Under ASC 852, the Successor Company must determine a value to be assigned to the equity of the emerging company as of the date of adoption of fresh-start accounting. To facilitate this calculation, the Company estimated the enterprise value of the Successor Company by relying on a discounted cash flow (“DCF”) analysis under the income approach. The Company also considered the guideline public company and guideline transactions methods under the market approach as reasonableness checks to the indications from the income approach.
Enterprise value represents the fair value of an entity’s interest-bearing debt and stockholders’ equity. In the disclosure statement associated with the Plan, which was confirmed by the Bankruptcy Court, the Company estimated a range of enterprise values between $425 million and $475 million, with a midpoint of $450 million. The Company deemed it appropriate to use the midpoint between the low end and high end of the range to determine the final enterprise value of $450 million utilized for fresh-start accounting. The enterprise value plus excess cash adjustments of approximately $52 million less the fair value of debt of $250 million, resulted in equity value of the Successor of $252.1 million.
To estimate enterprise value utilizing the DCF method, the Company established an estimate of future cash flows for the period ranging from 2016 to 2025 and discounted the estimated future cash flows to present value. The expected cash flows for the period 2016 to 2025 were based on the financial projections and assumptions utilized in the disclosure statement. The expected cash flows for the period 2016 to 2025 were derived from earnings forecasts and assumptions regarding growth and margin projections, as applicable. A terminal value was included, based on the cash flows of the final year of the forecast period.
The discount rate of 14.5% was estimated based on an after-tax weighted average cost of capital (“WACC”) reflecting the rate of return that would be expected by a market participant. The WACC also takes into consideration a company specific risk premium reflecting the risk associated with the overall uncertainty of the financial projections used to estimate future cash flows.
The guideline public company and guideline transaction analysis identified a group of comparable companies and transactions that have operating and financial characteristics comparable in certain respects to the Company, including, for example, comparable lines of business, business risks and market presence. Under these methodologies, certain financial multiples and ratios that measure financial performance and value are calculated for each selected company or transactions and then compared to the implied multiples from the DCF analysis. The Company considered enterprise value as a multiple of each selected company and transactions publicly available earnings before interest, taxes, depreciation and amortization (“EBITDA”).
The estimated enterprise value and the equity value are highly dependent on the achievement of the future financial results contemplated in the projections that were set forth in the Plan. The estimates and assumptions made in the valuation are inherently subject to significant uncertainties. The primary assumptions for which there is a reasonable possibility of the occurrence of a variation that would have significantly affected the reorganization value include the assumptions regarding revenue growth, operating expenses, the amount and timing of capital expenditures and the discount rate utilized.
Fresh-start accounting reflects the value of the Successor Company as determined in the confirmed Plan. Under fresh-start accounting, asset values are remeasured and allocated based on their respective fair values in conformity with the purchase method of accounting for business combinations in ASC 805. Liabilities existing as of the Effective Date, other than deferred taxes were recorded at the present value of amounts expected to be paid using appropriate risk adjusted interest rates. Deferred taxes were determined in conformity with applicable accounting standards. Predecessor accumulated depreciation, accumulated amortization, accumulated other comprehensive loss and retained deficit were eliminated.
The significant assumptions related to the valuations of assets and liabilities in connection with fresh-start accounting include the following:
61
Key Energy Services, Inc. and Subsidiaries
NOTES TO CONSOLIDATED FINANCIAL STATEMENTS — (Continued)
Machinery and Equipment
To estimate the fair value of machinery and equipment, the Company considered the income approach, the cost approach, and the sales comparison (market) approach. The primary approaches that were relied upon to value these assets were the cost approach and the market approach. Although the income approach was not applied to value the machinery and equipment assets individually, the Company did consider the earnings of the enterprise of which these assets are a part. When more than one approach is used to develop a valuation, the various approaches are reconciled to determine a final value conclusion.
The typical starting point or basis of the valuation estimate is replacement cost new (RCN), reproduction cost new (CRN), or a combination of both. Once the RCN and CRN estimates are adjusted for physical and functional conditions, they are then compared to market data and other indications of value, where available, to confirm results obtained by the cost approach.
Where direct RCN estimates were not available or deemed inappropriate, the CRN for machinery and equipment was estimated using the indirect (trending) method, in which percentage changes in applicable price indices are applied to historical costs to convert them into indications of current costs. To estimate the CRN amounts, inflation indices from established external sources were then applied to historical costs to estimate the CRN for each asset.
The market approach measures the value of an asset through an analysis of recent sales or offerings of comparable property, and takes into account physical, functional and economic conditions. Where direct or comparable matches could not be reasonably obtained, the Company utilized the percent of cost technique of the market approach. This technique looks at general sales, sales listings, and auction data for each major asset category. This information is then used in conjunction with each asset’s effective age to develop ratios between the sales price and RCN or CRN of similar asset types. A market-based depreciation curve was developed and applied to asset categories where sufficient sales and auction information existed.
Where market information was not available or a market approach was deemed inappropriate, the Company developed a cost approach. In doing so, an indicated value is derived by deducting physical deterioration from the RCN or CRN of each identifiable asset or group of assets. Physical deterioration is the loss in value or usefulness of a property due to the using up or expiration of its useful life caused by wear and tear, deterioration, exposure to various elements, physical stresses, and similar factors.
Functional and economic obsolescence related to these was also considered. Functional obsolescence due to excess capital costs was eliminated through the direct method of the cost approach to estimate the RCN. Functional obsolescence was applied in the form of a cost-to-cure penalty to certain personal property assets needing significant capital repairs. Economic obsolescence was also applied to stacked and underutilized assets based on the status of the asset. Economic obsolescence was also considered in situations in which the earnings of the applicable business segment in which the assets are employed suggest economic obsolescence. When penalizing assets for economic obsolescence, an additional economic obsolescence penalty was levied , while considering scrap value to be the floor value for an asset.
Land and Building
In establishing the fair value of the real property assets, each of the three traditional approaches to value: the income approach, the market approach and the cost approach was considered. The Company primarily relied on the market and cost approaches.
Land - In valuing the fee simple interest in the land, the Company utilized the sales comparison approach (market approach). The sales comparison approach estimates value based on what other purchasers and sellers in the market have agreed to as the price for comparable properties. This approach is based on the principle of substitution, which states that the limits of prices, rents and rates tend to be set by the prevailing prices, rents and rates of equally desirable substitutes. In conducting the sales comparison approach, data was gathered on comparable properties and adjustments were made for factors including market conditions, size, access/frontage, zoning, location, and conditions of sale. Greatest weight was typically given to the comparable sales in proximity and similar in size to each of the owned sites. In some cases, market participants were contacted to augment the analysis and to confirm the conclusions of value.
Building & Site Improvements - In valuing the fee simple interest in the real property improvements, the Company utilized the direct and indirect methods of the cost approach. For the direct method cost approach analysis, the starting point or basis of the cost approach is the RCN. In order to estimate the RCN of the buildings and site improvements, various factors were considered including building size, year built, number of stories, and the breakout of the space, property history, and maintenance history. We used the data collected to calculate the RCN of the buildings using recognized estimating sources for developing replacement, reproduction, and insurable value costs.
In the application of the indirect method cost approach, the first step is to estimate a CRN for each improvement via the indirect (trending) method of the cost approach. To estimate the CRN amounts, the Company applied published inflation indices
62
Key Energy Services, Inc. and Subsidiaries
NOTES TO CONSOLIDATED FINANCIAL STATEMENTS — (Continued)
obtained from third party sources to each asset’s historical cost to convert the known cost into an indication of current cost. As historical cost was used as the starting point for estimating RCN, we only considered this approach for assets with historical records.
Once the RCN and CRN of the improvements was computed, the Company estimated an allowance for physical depreciation for the buildings and land improvements based upon its respective age.
Intangible Assets
The financial information used to estimate the fair values of intangible assets was consistent with the information used in estimating the Company’s enterprise value. Trademarks and tradenames were valued primarily utilizing the relief from royalty method of the income approach. The resulting value of the intangible assets based on the application of this approach was $520. Significant inputs and assumptions included remaining useful lives, the forecasted revenue streams, applicable royalty rates, tax rates, and applicable discount rates. Customer relationships were considered in the analysis, but based on the valuation under the excess earnings methodology, no value was attributed to customer relationships.
Debt
The fair value of debt was $250 million of which $2.5 million represents the current portion. The fair value of debt was determined using an income approach based on market yields for comparable securities. The fair value with respect to the Term Loan was estimated to approximate par value.
Asset Retirement Obligations
The fair value of the asset retirement obligations was determined by using estimated plugging and abandonment costs as of December 15, 2016, adjusted for inflation using an annual average of 1.26% and then discounted at the appropriate credit-adjusted risk free rate ranging from 2.2% to 2.9% depending on the life of the well. The fair value of asset retirement obligations was estimated at $9.1 million.
Income Taxes
The amount of deferred income taxes recorded was determined in accordance with ASC 740, Income Taxes (“ASC 740”).
Warrants
Pursuant to the Plan and on the Effective Date, the Company issued two series of warrants to the former holders of the Predecessor Company's common stock. One series of warrants will expire on December 15, 2020 and the other series of warrants will expire on December 15, 2021. Each warrant is exercisable for one share of the Company’s common stock, par value $0.01. At issuance, the warrants were recorded at fair value, which was determined using the Black-Scholes option pricing model with the assumptions detailed in the following table. The warrants are equity classified and, at issuance, were recorded as an increase to additional paid-in capital in the amount of $3.8 million.
Assumptions for Black-Scholes option pricing model:
Volatility | 60.0% to 62.0% |
Risk-free Interest Rate | 1.86% to 2.10% |
Time Until Expiration | 4 years to 5 years |
63
Key Energy Services, Inc. and Subsidiaries
NOTES TO CONSOLIDATED FINANCIAL STATEMENTS — (Continued)
The following fresh-start condensed consolidated balance sheet presents the implementation of the Plan and the adoption of fresh-start accounting as of December 15, 2016. Reorganization adjustments have been recorded within the condensed consolidated balance sheet to reflect the effects of the Plan, including discharge of liabilities subject to compromise and the adoption of fresh-start accounting in accordance with ASC 852 (in thousands).
Predecessor Company | Reorganization Adjustments (A) | Fresh Start Adjustments | Successor Company | ||||||||||||
ASSETS | |||||||||||||||
Current assets: | |||||||||||||||
Cash and cash equivalents | $ | 38,751 | $ | 52,437 | B | $ | — | $ | 91,188 | ||||||
Restricted cash | 19,292 | 5,400 | C | — | 24,692 | ||||||||||
Accounts receivable, net | 72,560 | (210 | ) | D | — | 72,350 | |||||||||
Inventories | 22,900 | — | 383 | N | 23,283 | ||||||||||
Other current assets | 27,648 | (2,295 | ) | E | — | 25,353 | |||||||||
Total current assets | 181,151 | 55,332 | 383 | 236,866 | |||||||||||
Property and equipment, gross | 2,235,828 | — | (1,827,392 | ) | O | 408,436 | |||||||||
Accumulated depreciation | (1,523,585 | ) | — | 1,523,585 | O | — | |||||||||
Property and equipment, net | 712,243 | — | (303,807 | ) | 408,436 | ||||||||||
Other intangible assets, net | 3,596 | — | (3,076 | ) | P | 520 | |||||||||
Other assets | 17,428 | — | 369 | Q | 17,797 | ||||||||||
TOTAL ASSETS | $ | 914,418 | $ | 55,332 | $ | (306,131 | ) | $ | 663,619 | ||||||
LIABILITIES AND EQUITY | |||||||||||||||
Current liabilities: | |||||||||||||||
Accounts payable | $ | 12,338 | $ | — | $ | — | $ | 12,338 | |||||||
Other current liabilities | 99,524 | (1,032 | ) | F | (264 | ) | R | 98,228 | |||||||
Current portion of long-term debt | (3,099 | ) | 5,599 | G | — | 2,500 | |||||||||
Total current liabilities | 108,763 | 4,567 | (264 | ) | 113,066 | ||||||||||
Long-term debt | — | 245,460 | H | — | 245,460 | ||||||||||
Workers’ compensation, vehicular and health insurance liabilities | 23,126 | — | — | 23,126 | |||||||||||
Deferred tax liabilities | 35 | — | — | 35 | |||||||||||
Other non-current liabilities | 35,754 | 332 | I | (6,284 | ) | S | 29,802 | ||||||||
Liabilities subject to compromise | 996,527 | (996,527 | ) | J | — | — | |||||||||
Equity: | |||||||||||||||
Common stock | 16,055 | (15,854 | ) | K | — | 201 | |||||||||
Additional paid-in capital | 969,915 | 252,516 | L | (970,502 | ) | T | 251,929 | ||||||||
Accumulated other comprehensive loss | (40,394 | ) | — | 40,394 | T | — | |||||||||
Retained earnings (deficit) | (1,195,363 | ) | 564,838 | M | 630,525 | T | — | ||||||||
Total equity | (249,787 | ) | 801,500 | (299,583 | ) | 252,130 | |||||||||
TOTAL LIABILITIES AND EQUITY | $ | 914,418 | $ | 55,332 | $ | (306,131 | ) | $ | 663,619 | ||||||
Reorganization and Fresh Start Adjustments
Reorganization Adjustments (in thousands)
A. | Represents amounts recorded on the Effective Date for the implementation of the Plan, including the settlement of liabilities subject to compromise, issuance of new debt and repayment of old debt, reinstatement of contract rejection obligations, write-off of debt issuance costs, proceeds received from the rights offering, distributions of Successor common stock and the Warrants, the cancellation of the Predecessor common stock, and the cancellation of the Predecessor stock incentive plan. |
64
Key Energy Services, Inc. and Subsidiaries
NOTES TO CONSOLIDATED FINANCIAL STATEMENTS — (Continued)
B. | The Effective Date cash activity from the implementation of the Plan and the Rights Offering are as follows: | ||||
Sources: | |||||
Proceeds from Rights Offering | $ | 108,984 | |||
Overfunding of Rights Offering to be returned | 98 | ||||
Total Sources | $ | 109,082 | |||
Uses: | |||||
Payment of Predecessor Term Loan Facility | $ | (38,876 | ) | ||
Payment of interest on Predecessor Term Loan Facility | (4,277 | ) | |||
Payment of bank fees | (2,126 | ) | |||
Transfer to restricted cash to fund professional fee escrow | (5,400 | ) | |||
Payment of professional fees | (5,656 | ) | |||
Payment of letters of credit fees and fronting fees of Predecessor ABL Facility | (260 | ) | |||
Equity Holder Cash-Out Subscription | 200 | ||||
Payment to Equity Holders who chose to cash out | (200 | ) | |||
Payment to non-qualified holders of the 2021 Notes | (25 | ) | |||
Payment of contract rejection damage claim | (25 | ) | |||
Total Uses | $ | (56,645 | ) | ||
Net sources of cash | $ | 52,437 | |||
C. | Transfer of cash and cash equivalents to fund professional fee escrow cash account as required by the Plan. | ||||
D. | Satisfaction of payroll withholdings related to accelerated vesting of Predecessor restricted stock units and awards. | ||||
E. | Elimination of Predecessor Directors and Officers ("D&O") insurance policies and release of prepaid professional retainer net of capitalized ABL Facility related fee: | ||||
Predecessor D&O insurance | $ | (2,203 | ) | ||
Release of professional retainer | (150 | ) | |||
Payment of ABL Facility related fee | 58 | ||||
Total | $ | (2,295 | ) | ||
F. | Decrease in accrued current liabilities consists of the following: | ||||
Reinstate rejection damage and other claims from Liabilities Subject to Compromise (short-term) | $ | 2,677 | |||
Accrual for success fees incurred upon emergence | 3,786 | ||||
Over funding of Rights Offering to be returned | 98 | ||||
Payment of interest on Predecessor Term Loan Facility | (4,277 | ) | |||
Payment of professional fees and the application of retainer balances | (3,056 | ) | |||
Payment of letters of credit fees and fronting fees on the Predecessor ABL Facility | (260 | ) | |||
Total | $ | (1,032 | ) | ||
65
Key Energy Services, Inc. and Subsidiaries
NOTES TO CONSOLIDATED FINANCIAL STATEMENTS — (Continued)
G. | Elimination of debt issuance costs on Predecessor ABL Facility and record current portion of Term Loan Facility: | ||||
Predecessor ABL Facility issuance costs | $ | 3,099 | |||
Current portion of Term Loan Facility | 2,500 | ||||
Total | $ | 5,599 | |||
H. | Represents Term Loan Facility, at fair value, net of deferred finance costs on ABL Facility: | ||||
Long-term debt | $ | 250,000 | |||
Less: current portion | (2,500 | ) | |||
Bank fees on the ABL Facility | (2,040 | ) | |||
Total | $ | 245,460 | |||
I. | Reinstate rejection damage and other claims from Liabilities Subject to Compromise. | ||||
J. | Liabilities Subject to Compromise were settled as follows in accordance with the Plan: | ||||
Write-off of Liabilities Subject to Compromise | $ | 996,527 | |||
Term Loan Facility | (250,000 | ) | |||
Payment of Predecessor Term Loan Facility principal | (38,876 | ) | |||
Contract rejection damage and other claims to be satisfied in cash (long and short-term) | (3,010 | ) | |||
Payment of contract rejection damage claim | (25 | ) | |||
Payment to non-qualified holders of the 2021 Notes | (25 | ) | |||
Issuance of Successor common stock to satisfy 2021 Notes claims | (125,892 | ) | |||
Gain due to settlement of Liabilities Subject to Compromise | $ | 578,699 | |||
K. | Represents the cancellation of Predecessor common stock (par value of $16,055) and the distribution of Successor common stock (par value of $201). | ||||
L. | Consists of the net impact of the following: | ||||
Predecessor additional paid in capital: | |||||
Elimination of par value of Predecessor common stock | $ | 16,055 | |||
Compensation expense related to acceleration of Predecessor restricted stock units and awards | 1,996 | ||||
Warrants issued to holders of Predecessor common stock | (3,768 | ) | |||
Issuance of Successor common stock to holders of Predecessor common stock | (13,695 | ) | |||
Total | $ | 588 | |||
Successor additional paid in capital: | |||||
Issuance of common stock for the Rights Offering | $ | 108,866 | |||
Issuance of Successor common stock to satisfy 2021 Notes claims | 125,817 | ||||
Issuance of Successor common stock to holders of Predecessor common stock | 13,687 | ||||
Warrants issued to holders of Predecessor common stock | 3,768 | ||||
Shares withheld to satisfy payroll tax obligations | (210 | ) | |||
Total | 251,928 | ||||
Net impact of Predecessor and Successor additional paid in capital | $ | 252,516 | |||
66
Key Energy Services, Inc. and Subsidiaries
NOTES TO CONSOLIDATED FINANCIAL STATEMENTS — (Continued)
M. | Reflects the cumulative impact of the reorganization adjustments discussed above: | ||||
Reorganization items: | |||||
Gain due to settlement of Liabilities Subject to Compromise | $ | 578,699 | |||
Success fees incurred upon emergence | (6,536 | ) | |||
Write of deferred issuance costs of Predecessor ABL Facility | (3,099 | ) | |||
Total | $ | 569,064 | |||
Other: | |||||
Elimination of Predecessor D&O prepaid insurance | $ | (2,203 | ) | ||
Bank fees and charges | (27 | ) | |||
Compensation expense related to acceleration of Predecessor restricted stock awards | (1,996 | ) | |||
Total | $ | (4,226 | ) | ||
Net cumulative impact of the reorganization adjustments | $ | 564,838 | |||
N. | A fresh start adjustment to increase the net book value of inventories to their estimated fair value, based upon current replacement costs. | ||||
O. | An adjustment to adjust the net book value of property and equipment to estimated fair value. | ||||||||
The following table summarizes the components of property and equipment, net as of the Effective Date, both before (Predecessor) and after (Successor) fair value adjustments: | |||||||||
Successor Fair Value | Predecessor Historical Cost | ||||||||
Oilfield service equipment | $ | 267,648 | $ | 1,660,592 | |||||
Disposal wells | 23,288 | 74,008 | |||||||
Motor vehicles | 39,322 | 262,370 | |||||||
Furniture and equipment | 8,835 | 129,084 | |||||||
Buildings and land | 65,525 | 103,635 | |||||||
Work in progress | 3,818 | 6,139 | |||||||
Gross property and equipment | 408,436 | 2,235,828 | |||||||
Accumulated depreciation | — | (1,523,585 | ) | ||||||
Net property and equipment | $ | 408,436 | $ | 712,243 | |||||
P. | An adjustment the net book value of other intangible assets to estimated fair value. | ||||||||
The following table summarizes the components of other intangible assets, net as of the Effective Date, both before (Predecessor) and after (Successor) fair value adjustments: | |||||||||
Successor Fair Value | Predecessor Historical Cost | ||||||||
Non-compete agreements | $ | — | $ | 1,535 | |||||
Patents, trademarks and tradenames | 520 | 400 | |||||||
Customer relationships and contracts | — | 40,640 | |||||||
Developed technology | — | 4,778 | |||||||
Gross carrying value | 520 | 47,353 | |||||||
Accumulated amortization | — | (43,757 | ) | ||||||
Net other intangible assets | $ | 520 | $ | 3,596 | |||||
67
Key Energy Services, Inc. and Subsidiaries
NOTES TO CONSOLIDATED FINANCIAL STATEMENTS — (Continued)
Q. | Represents fair value adjustment related to assets held for sale. | ||||||
R. | Reduction in other current liabilities relates to the elimination of the current portion of deferred rent liabilities. | ||||||
S. | Reduction in other long term liabilities relates to the elimination of the non-current portion of deferred rent liabilities totaling $3,429 and reduction in asset retirement obligation to reflect estimated fair value totaling $2,855. | ||||||
T. | Reflects the cumulative impact of the fresh start accounting adjustments discussed above and the elimination of the Predecessor Company's accumulated other comprehensive loss: | ||||||
Property and equipment fair value adjustment | $ | (303,807 | ) | ||||
Assets held for sale fair value adjustment | 369 | ||||||
Elimination of deferred rent liability | 3,693 | ||||||
ARO fair value adjustment | 2,855 | ||||||
Inventory fair value adjustment | 383 | ||||||
Intangible assets fair value adjustment | (3,076 | ) | |||||
Elimination of Predecessor accumulated other comprehensive loss | (40,394 | ) | |||||
Elimination of Predecessor additional paid in capital | 970,502 | ||||||
Elimination of Predecessor retained deficit | $ | 630,525 | |||||
NOTE 4. LIABILITIES SUBJECT TO COMPROMISE
Pursuant to ASC 852 liabilities subject to compromise in chapter 11 cases are distinguished from liabilities of non-filing entities, liabilities not expected to be compromised and from post-petition liabilities. The amount of liabilities subject to compromise represent the Company’s estimate, where an estimate is determinable, of known or potential prepetition claims to be addressed in connection with the bankruptcy proceedings. Such liabilities are reported at the Company’s current estimate, of the allowed claim amounts even though the claims may be settled for lesser amounts.
Prior to settlements pursuant to the Plan, liabilities subject to compromise was comprised of the following (in thousands):
2021 Notes | $ | 675,000 | |
2021 Notes Interest | 29,616 | ||
Predecessor Term Loan Facility | 288,876 | ||
Severance | 1,980 | ||
Lease and claim rejections | 1,055 | ||
Total | $ | 996,527 | |
NOTE 5. REORGANIZATION ITEMS
ASC 852 requires that the financial statements for periods subsequent to the filing of the Chapter 11 cases distinguish transactions and events that are directly associated with the reorganization of the ongoing operations of the business. Revenues, expenses, realized gains and losses, adjustments to the expected amount of allowed claims for liabilities subject to compromise and provisions for losses that can be directly associated with the reorganization and restructuring of the business have been reported as “Reorganization items, net” in the Consolidated Statements of Operations.
68
Key Energy Services, Inc. and Subsidiaries
NOTES TO CONSOLIDATED FINANCIAL STATEMENTS — (Continued)
The following table summarizes reorganizations items (in thousands):
Successor | Predecessor | |||||||
Year Ended December 31, 2017 | Period from January 1, 2016 through December 15, 2016 | |||||||
(Gain) on debt discharge | $ | — | $ | (578,699 | ) | |||
Settlement/Rejection damages | — | (770 | ) | |||||
Fresh-start asset revaluation (gain) loss, net | 10 | 299,583 | ||||||
Professional fees | 1,491 | 15,156 | ||||||
Write-off of deferred financing costs, debt premiums and debt discounts | — | 19,159 | ||||||
Total reorganization items, net | $ | 1,501 | $ | (245,571 | ) | |||
With the exception of $1.5 million and $15.2 million in professional fees for the year ended December 31, 2017 and the period from December 16, 2016 to December 31, 2016, respectively, and $1.0 million in settlement and rejection damages for the period from December 16, 2016 to December 31, 2016, reorganization items are non cash expenses.
NOTE 6. ASSETS HELD FOR SALE
In April 2015, we announced our decision to exit markets in which we participate outside of North America. Our strategy was to sell or relocate the assets of the businesses operating in these markets. During the fourth quarter of 2015, the assets and related liabilities of our Russian business unit, which were included in our International reporting segment, met the criteria for assets held for sale. The sale of our Russian business unit was completed in the third quarter of 2017.
NOTE 7. OTHER BALANCE SHEET INFORMATION
The table below presents comparative detailed information about other current assets at December 31, 2017 and 2016 (in thousands):
December 31, | |||||||
2017 | 2016 | ||||||
Other current assets: | |||||||
Prepaid current assets | $ | 9,598 | $ | 10,291 | |||
Reinsurance receivable | 7,328 | 7,922 | |||||
Current assets held for sale | — | 3,667 | |||||
Other | 2,551 | 3,882 | |||||
Total | $ | 19,477 | $ | 25,762 | |||
The table below presents comparative detailed information about other non-current assets at December 31, 2017 and 2016 (in thousands):
December 31, | |||||||
2017 | 2016 | ||||||
Other non-current assets: | |||||||
Reinsurance receivable | $ | 7,768 | $ | 8,393 | |||
Deposits | 1,246 | 8,292 | |||||
Equity method investments | — | 560 | |||||
Non-current assets held for sale | — | 360 | |||||
Other | 5,528 | 135 | |||||
Total | $ | 14,542 | $ | 17,740 | |||
69
Key Energy Services, Inc. and Subsidiaries
NOTES TO CONSOLIDATED FINANCIAL STATEMENTS — (Continued)
The table below presents comparative detailed information about other current liabilities at December 31, 2017 and 2016 (in thousands):
December 31, | |||||||
2017 | 2016 | ||||||
Other current liabilities: | |||||||
Accrued payroll, taxes and employee benefits | $ | 19,874 | $ | 23,224 | |||
Accrued operating expenditures | 11,644 | 16,669 | |||||
Income, sales, use and other taxes | 12,151 | 10,748 | |||||
Self-insurance reserves | 26,761 | 35,484 | |||||
Accrued interest | 6,605 | 1,419 | |||||
Accrued insurance premiums | 4,077 | 2,347 | |||||
Unsettled legal claims | 4,747 | 5,398 | |||||
Accrued severance | 250 | 2,219 | |||||
Current liabilities held for sale | — | 371 | |||||
Other | 1,470 | 6,059 | |||||
Total | $ | 87,579 | $ | 103,938 | |||
The table below presents comparative detailed information about other non-current liabilities at December 31, 2017 and 2016 (in thousands):
December 31, | |||||||
2017 | 2016 | ||||||
Other non-current liabilities: | |||||||
Deferred tax liabilities | $ | — | $ | 35 | |||
Asset retirement obligations | 8,931 | 9,035 | |||||
Environmental liabilities | 1,977 | 3,446 | |||||
Accrued sales, use and other taxes | 17,142 | 16,735 | |||||
Other | 116 | 528 | |||||
Total | $ | 28,166 | $ | 29,779 | |||
NOTE 8. OTHER (INCOME) LOSS, NET
The table below presents comparative detailed information about our other income and expense for the year ended December 31, 2017, the period from December 16, 2016 through December 31, 2016, the period from January 1, 2016 through December 15, 2016 and the year ended December 31, 2015 (in thousands):
Successor | Predecessor | |||||||||||||||
Year Ended December 31, 2017 | Period from December 16, 2016 through December 31, 2016 | Period from January 1, 2016 through December 15, 2016 | Year Ended December 31, 2015 | |||||||||||||
Interest income | $ | (711 | ) | $ | (20 | ) | $ | (407 | ) | $ | (159 | ) | ||||
Foreign exchange loss | (33 | ) | 17 | 1,005 | 4,153 | |||||||||||
Allowance for collectability of notes receivable | — | — | — | 7,705 | ||||||||||||
Other, net | (6,443 | ) | 35 | (3,041 | ) | (2,305 | ) | |||||||||
Total | $ | (7,187 | ) | $ | 32 | $ | (2,443 | ) | $ | 9,394 | ||||||
70
Key Energy Services, Inc. and Subsidiaries
NOTES TO CONSOLIDATED FINANCIAL STATEMENTS — (Continued)
NOTE 9. ALLOWANCE FOR DOUBTFUL ACCOUNTS
The table below presents a rollforward of our allowance for doubtful accounts for the year ended December 31, 2017, the period from December 16, 2016 through December 31, 2016, the period from January 1, 2016 through December 15, 2016 and the year ended December 31, 2015 (in thousands):
Balance at Beginning of Period | Charged to Expense | Deductions | Balance at End of Period | |||||||||||
Successor: | ||||||||||||||
As of December 31, 2017 | $ | 168 | $ | 1,420 | $ | (713 | ) | 875 | ||||||
As of December 31, 2016 | — | 168 | — | 168 | ||||||||||
Predecessor: | ||||||||||||||
As of December 15, 2016 | 20,915 | 2,532 | (20,404 | ) | 3,043 | |||||||||
As of December 31, 2015 | 2,925 | 21,172 | (3,182 | ) | 20,915 | |||||||||
In connection with the application of fresh start accounting on December 15, 2016, the carrying value of trade receivables was adjusted to fair value, eliminating the reserve for doubtful accounts. See “Note 3. Fresh Start Accounting” for more details.
NOTE 10. PROPERTY AND EQUIPMENT
Property and equipment consists of the following (in thousands):
December 31, | |||||||
2017 | 2016 | ||||||
Major classes of property and equipment: | |||||||
Oilfield service equipment | $ | 260,396 | $ | 267,648 | |||
Disposal wells | 29,633 | 23,288 | |||||
Motor vehicles | 43,366 | 39,322 | |||||
Furniture and equipment | 5,456 | 8,835 | |||||
Buildings and land | 66,964 | 65,525 | |||||
Work in progress | 7,312 | 4,098 | |||||
Gross property and equipment | 413,127 | 408,716 | |||||
Accumulated depreciation | (85,813 | ) | (3,565 | ) | |||
Net property and equipment | $ | 327,314 | $ | 405,151 | |||
Interest is capitalized on the average amount of accumulated expenditures for major capital projects under construction using an effective interest rate based on related debt until the underlying assets are placed into service. Capitalized interest for the year ended December 31, 2017, the period from December 16, 2016 through December 31, 2016, the period from January 1, 2016 through December 15, 2016 and the year ended December 31, 2015 was zero. As of December 31, 2017 and 2016, we have no capital lease obligations.
The decline in market value of our common stock in comparison to the carrying value of our assets during the third quarter of 2015 as well as the persistent low oil prices and the affect that low oil prices has on our industry were determined to be goodwill testing triggering events. These triggering events required us to perform step one of the goodwill impairment test to identify potential impairment. Our step one testing indicated potential impairment in our Coiled Tubing Services segment which required us to perform step two of the goodwill impairment test to determine the amount of impairment, if any. Our preliminary step two testing performed during the third quarter of 2015, using a discounted cash flow model to determine fair value, concluded that certain fixed assets were impaired. As a result, we recorded an estimated pre-tax charge of $45.0 million in the third quarter of 2015. During the fourth quarter of 2015 we finalized our step two testing, preliminarily performed in the third quarter of 2015, based on additional analysis performed by outside consultants. As a result, we recorded an additional pre-tax asset impairment charge of $6.1 million in the fourth quarter of 2015.
71
Key Energy Services, Inc. and Subsidiaries
NOTES TO CONSOLIDATED FINANCIAL STATEMENTS — (Continued)
NOTE 11. GOODWILL AND OTHER INTANGIBLE ASSETS
The components of our other intangible assets as of December 31, 2017 and 2016 are as follows (in thousands):
December 31, | |||||||
2017 | 2016 | ||||||
Gross carrying value | $ | 520 | $ | 520 | |||
Accumulated amortization | (58 | ) | — | ||||
Net carrying value | $ | 462 | $ | 520 | |||
Amortization expense for our intangible assets with determinable lives was as follows (in thousands):
Successor | Predecessor | |||||||||||||||
Year Ended December 31, 2017 | Period from December 16, 2016 through December 31, 2016 | Period from January 1, 2016 through December 15, 2016 | Year Ended December 31, 2015 | |||||||||||||
Noncompete agreements | $ | — | $ | — | $ | 179 | $ | 278 | ||||||||
Patents and trademarks | 58 | — | 40 | 40 | ||||||||||||
Customer relationships and contracts | — | — | 1,239 | 3,430 | ||||||||||||
Developed technology | — | — | 340 | 370 | ||||||||||||
Total intangible asset amortization expense | $ | 58 | $ | — | $ | 1,798 | $ | 4,118 | ||||||||
The weighted average remaining amortization periods and expected amortization expense for the next five years for our definite lived intangible assets are as follows (in thousands):
Weighted average remaining amortization period (years) | Expected Amortization Expense | ||||||||||||||||||||
2018 | 2019 | 2020 | 2021 | 2022 | |||||||||||||||||
Trademarks | 8.0 | $ | 58 | $ | 58 | $ | 58 | $ | 58 | $ | 58 | ||||||||||
Total expected intangible asset amortization expense | $ | 58 | $ | 58 | $ | 58 | $ | 58 | $ | 58 | |||||||||||
As a result of the sale of our Enhanced Oilfield Technology business unit assets, we will no longer be using a certain developed technology patent. As a result, we fully impaired the $3.4 million patent in 2015. In addition, we will no longer use our Edge tradename. As a result, we fully impaired the $1.5 million tradename in 2015. Both the Edge tradename and Enhanced Oilfield Technology developed technology patent were part of our Fishing and Rental Services segment.
We perform an analysis of goodwill impairment on an annual basis unless an event occurs that triggers additional interim testing. The decline in market value of our stock during the third quarter of 2015 as well as the persistent low oil prices and the affect that low oil prices have on our industry were also determined to be triggering events making it necessary to perform testing for possible goodwill impairment for our U.S. Rig Services, Coiled Tubing Services, Fishing and Rental Services, Fluid Management Services and International segments. Our analysis concluded that the remaining $561.0 million of goodwill of these segments was fully impaired. Also, during our goodwill analysis, there was an indication of impairment of fixed assets in our Coiled Tubing Services segment. See “Note 10. Property and Equipment,” for further discussion.
72
NOTE 12. EARNINGS PER SHARE
The following table presents our basic and diluted earnings per share (“EPS”) for the years ended December 31, 2017, 2016 and 2015 (in thousands, except per share amounts):
Successor | Predecessor | |||||||||||||||
Year Ended December 31, 2017 | Period from December 16, 2016 through December 31, 2016 | Period from January 1, 2016 through December 15, 2016 | Year Ended December 31, 2015 | |||||||||||||
Basic and diluted EPS Calculation: | ||||||||||||||||
Numerator | ||||||||||||||||
Net loss | $ | (120,589 | ) | $ | (10,244 | ) | $ | (131,736 | ) | $ | (917,701 | ) | ||||
Denominator | ||||||||||||||||
Weighted average shares outstanding | 20,105 | 20,090 | 160,587 | 156,598 | ||||||||||||
Basic loss per share | $ | (6.00 | ) | $ | (0.51 | ) | $ | (0.82 | ) | $ | (5.86 | ) | ||||
Stock options, warrants and stock appreciation rights (“SARs”) are included in the computation of diluted earnings per share using the treasury stock method. Restricted stock awards are legally considered issued and outstanding when granted and are included in basic weighted average shares outstanding.
The company has issued potentially dilutive instruments such as RSUs, stock options, SARs and warrants. However, the company did not included these instruments in its calculation of diluted loss per share during the periods presented, because to include them would be anti-dilutive. The following table shows potentially dilutive instruments (in thousands):
Successor | Predecessor | |||||||||||
Year Ended December 31, 2017 | Period from December 16, 2016 through December 31, 2016 | Period from January 1, 2016 through December 15, 2016 | Year Ended December 31, 2015 | |||||||||
RSUs | 1,778 | 667 | 93 | 47 | ||||||||
Stock options | 701 | 648 | 812 | 1,319 | ||||||||
SARs | — | — | 240 | 315 | ||||||||
Warrants | 1,838 | 1,838 | — | — | ||||||||
Total | 4,317 | 3,153 | 1,145 | 1,681 | ||||||||
There have been no material changes in share amounts subsequent to the balance sheet date that would have a material impact on the earnings per share calculation.
NOTE 13. ASSET RETIREMENT OBLIGATIONS
In connection with our well servicing activities, we operate a number of saltwater disposal (“SWD”) facilities. Our operations involve the transportation, handling and disposal of fluids in our SWD facilities that are by-products of the drilling process. SWD facilities used in connection with our fluid hauling operations are subject to future costs associated with the retirement of these properties. As a result, we have incurred costs associated with the proper storage and disposal of these materials.
73
Key Energy Services, Inc. and Subsidiaries
NOTES TO CONSOLIDATED FINANCIAL STATEMENTS — (Continued)
Annual accretion of the assets associated with the asset retirement obligations were $0.2 million, less than $0.1 million and $0.6 million for the year ended December 31, 2017, for the periods from December 16, 2016 through December 31, 2016 and from January 1, 2016 through December 15, 2016 and for the year ended December 31, 2015, respectively. The application of fresh-start accounting with the effectiveness of the Company's Plan of Reorganization has resulted in the financial statements of the Predecessor and Successor not being comparable. A summary of changes in our asset retirement obligations is as follows (in thousands):
Predecessor | |||
Balance at December 31, 2015 | $ | 12,570 | |
Additions | 68 | ||
Costs incurred | (918 | ) | |
Accretion expense | 570 | ||
Disposals | (400 | ) | |
Balance at December 15, 2016 | 11,890 | ||
Successor | |||
Balance at December 15, 2016 | 9,035 | ||
Additions | — | ||
Costs incurred | — | ||
Accretion expense | 34 | ||
Disposals | — | ||
Balance at December 31, 2016 | 9,069 | ||
Additions | 36 | ||
Costs incurred | (147 | ) | |
Accretion expense | 221 | ||
Disposals | (248 | ) | |
Balance at December 31, 2017 | $ | 8,931 | |
NOTE 14. ESTIMATED FAIR VALUE OF FINANCIAL INSTRUMENTS
Cash, cash equivalents, accounts receivable, accounts payable and accrued liabilities. These carrying amounts approximate fair value because of the short maturity of the instruments or because the carrying value is equal to the fair value of those instruments on the balance sheet date.
Term Loan Facility due 2021. Because the variable interest rates of these loans approximate current market rates, the fair values of the loans borrowed under this facility approximate their carrying values.
NOTE 15. INCOME TAXES
The U.S. Tax Cuts and Jobs Act (the “2017 Tax Act”) was enacted on December 22, 2017. The 2017 Tax Act is comprehensive tax reform legislation that contains significant changes to corporate taxation. Provisions on the enacted law include a permanent reduction of the corporate income tax rate from 35% to 21%, imposing a mandatory one-time tax on un-repatriated accumulated earnings of foreign subsidiaries, a partial limitation on the deductibility of business interest expense, a limitation on net operating losses to 80% of taxable income each year, a shift of the U.S. taxation of multinational corporations from a tax on worldwide income to a partial territorial system (along with rules that create a new U.S. minimum tax on earnings of foreign subsidiaries), and other related provisions to maintain the U.S. tax base.
We recognized the income tax effects of the 2017 Tax Act in accordance with Staff Accounting Bulletin No. 118, which provides SEC staff guidance for the application of ASC Topic 740, Income Taxes. The guidance allows for a measurement period of up to one year after the enactment date to finalize the recording of the related tax impacts. As such, our 2017 financial results reflect the provisional income tax effects of the 2017 Tax Act for which the accounting under ASC Topic 740 is incomplete but a reasonable estimate could be determined. We did not identify any items for which the income tax effects of the 2017 Tax Act could not be reasonably estimated as of December 31, 2017. Due to the changes to U.S. tax laws as a result of the 2017 Tax Act, we recorded a provisional amount related to the following:
74
Key Energy Services, Inc. and Subsidiaries
NOTES TO CONSOLIDATED FINANCIAL STATEMENTS — (Continued)
Reduction of the U.S. Corporate Income Tax Rate- We measure deferred tax assets and liabilities using enacted tax rates that will apply in the years in which the temporary differences are expected to reverse. Accordingly, our deferred tax assets and liabilities were re-measured to reflect the reduction in the U.S. corporate income tax rate from 35% to 21%, resulting in a provisional $82.4 million income tax expense recorded. However, this change also resulted in a corresponding provisional $82.4 million income tax benefit with respect to the existing valuation allowance recorded against our net deferred tax assets as of December 31, 2017. Both offsetting provisional amounts were recorded during the fourth quarter of 2017.
As we do not have all the necessary information to analyze all effects of the 2017 Tax Act, we believe the provisional amounts recorded during the fourth quarter of 2017 represent a reasonable estimate of the accounting implications of this U.S. tax reform. Our ultimate determination of the tax impacts may differ from the provisional amounts recorded during the fourth quarter of 2017 due to regulatory guidance expected to be issued in the future, any tax law technical corrections, and possible changes in the our interpretations, assumptions, and actions taken as a result of tax legislation clarification. In addition, we are still analyzing certain aspects of the 2017 Tax Act and refining our calculations, which could potentially affect the measurement of these provisional balances. We will continue to evaluate the 2017 Tax Act, and any adjustment to these provisional amounts will be reported in the reporting period in which any such adjustments are determined, which will be no later than the fourth quarter of 2018.
The components of our income tax expense are as follows (in thousands):
Successor | Predecessor | |||||||||||||||
Year Ended December 31, 2017 | Period from December 16, 2016 through December 31, 2016 | Period from January 1, 2016 through December 15, 2016 | Year Ended December 31, 2015 | |||||||||||||
Current income tax (expense) benefit | $ | 1,667 | $ | — | $ | (2,042 | ) | $ | 3,522 | |||||||
Deferred income tax (expense) benefit | 35 | — | (787 | ) | 189,327 | |||||||||||
Total income tax (expense) benefit | $ | 1,702 | $ | — | $ | (2,829 | ) | $ | 192,849 | |||||||
We made federal income tax payments of zero for the year ended December 31, 2017, the period from December 16, 2016 through December 31, 2016, the period from January 1, 2016 through December 15, 2016 and the year ended December 31, 2015, respectively. In addition, we received federal income tax refunds of zero, $0.4 million, $6.9 million and $11.9 million during the year ended December 31, 2017, the period from December 16, 2016 through December 31, 2016, the period from January 1, 2016 through December 15, 2016 and the year ended December 31, 2015, respectively.
75
Key Energy Services, Inc. and Subsidiaries
NOTES TO CONSOLIDATED FINANCIAL STATEMENTS — (Continued)
Income tax (expense) benefit differs from amounts computed by applying the statutory federal rate as follows:
Successor | Predecessor | |||||||||||
Year Ended December 31, 2017 | Period from December 16, 2016 through December 31, 2016 | Period from January 1, 2016 through December 15, 2016 | Year Ended December 31, 2015 | |||||||||
Income tax benefit computed at Federal statutory rate | 35.0 | % | 35.0 | % | 35.0 | % | 35.0 | % | ||||
State taxes | — | % | — | % | (9.1 | )% | 1.6 | % | ||||
Meals and entertainment | (0.4 | )% | — | % | (0.3 | )% | (0.1 | )% | ||||
Foreign rate difference | 0.4 | % | — | % | (0.3 | )% | (1.3 | )% | ||||
Non-deductible goodwill and asset impairments | — | % | — | % | (4.0 | )% | (4.8 | )% | ||||
Non-deductible bankruptcy costs | — | % | — | % | (15.7 | )% | — | % | ||||
Non-taxable cancellation of debt income | — | % | — | % | 154.6 | % | — | % | ||||
Penalties and other non-deductible expenses | — | % | — | % | (2.3 | )% | — | % | ||||
Sale of Mexico | — | % | — | % | 16.5 | % | — | % | ||||
Change in valuation allowance | (33.8 | )% | (35.0 | )% | (171.1 | )% | (12.9 | )% | ||||
Equity compensation | (1.0 | )% | — | % | — | % | — | % | ||||
US tax reform - impact to deferred tax assets and liabilities | (67.4 | )% | — | % | — | % | — | % | ||||
US tax reform - change in valuation allowance | 67.4 | % | — | % | — | % | — | % | ||||
Other | 1.2 | % | — | % | (5.5 | )% | (0.1 | )% | ||||
Effective income tax rate | 1.4 | % | — | % | (2.2 | )% | 17.4 | % | ||||
As of December 31, 2017 and 2016, our deferred tax assets and liabilities consisted of the following (in thousands):
December 31, | |||||||
2017 | 2016 | ||||||
Deferred tax assets: | |||||||
Net operating loss and tax credit carryforwards | $ | 103,251 | $ | 99,636 | |||
Capital loss carryforwards | 16,375 | 49,901 | |||||
Foreign tax credit carryforward | 17,095 | 18,587 | |||||
Self-insurance reserves | 8,734 | 12,576 | |||||
Accrued liabilities | 9,479 | 16,542 | |||||
Share-based compensation | 513 | — | |||||
Intangible assets | 52,146 | 93,453 | |||||
Other | 1,036 | 2,946 | |||||
Total deferred tax assets | 208,629 | 293,641 | |||||
Valuation allowance for deferred tax assets | (175,577 | ) | (227,402 | ) | |||
Net deferred tax assets | 33,052 | 66,239 | |||||
Deferred tax liabilities: | |||||||
Property and equipment | (33,052 | ) | (64,609 | ) | |||
Other | — | (1,665 | ) | ||||
Total deferred tax liabilities | (33,052 | ) | (66,274 | ) | |||
Net deferred tax asset (liability), net of valuation allowance | $ | — | $ | (35 | ) | ||
The December 31, 2017 net deferred tax asset is comprised of $208.6 million deferred tax assets before valuation allowance, and $33.1 million deferred tax liabilities. The valuation allowance against the net deferred tax asset decreased by approximately $51.8 million from December 31, 2016 to December 31, 2017. The decrease was primarily due to the reduction of the U.S. corporate income tax rate from enactment of the 2017 Tax Act.
76
Key Energy Services, Inc. and Subsidiaries
NOTES TO CONSOLIDATED FINANCIAL STATEMENTS — (Continued)
Deferred tax assets and liabilities are recognized for the estimated future tax effects of temporary differences between the tax basis of an asset or liability and its reported amount in the Consolidated Financial Statements. The measurement of deferred tax assets and liabilities is based on enacted tax laws and rates currently in effect in each of the jurisdictions in which we have operations.
In recording deferred income tax assets, we consider whether it is more likely than not that some portion or all of the deferred income tax assets will be realized. The ultimate realization of deferred income tax assets is dependent upon the generation of future taxable income of the appropriate character during the periods in which those deferred income tax assets would be deductible. We consider the scheduled reversal of deferred income tax liabilities and projected future taxable income for this determination. Due to the history of losses in recent years and the continued challenges in the oil and gas industry, management continues to believe that it is more likely than not that we will not be able to realize our net deferred tax assets, and therefore a valuation allowance remains on the net deferred tax asset balance.
We estimate that as of December 31, 2017, 2016 and 2015, we have available $373.1 million, $252.8 million (after attribute reduction) and $243.8 million, respectively, of federal net operating loss carryforwards. However, Internal Revenue Code Sections 382 and 383 impose limitations on a corporation’s ability to utilize tax attributes if the corporation experiences an “ownership change.” The Company experienced an ownership change on December 15, 2016, as the emergence of the Company and certain of its domestic subsidiaries from chapter 11 bankruptcy proceedings is considered a change in ownership for purposes of IRC Section 382. As a result, approximately $2.4 million of our net operating losses as of December 31, 2017 are subject to Section 382 limitation and expire in 2019 to 2020. If a subsequent ownership change were to occur as a result of future transactions in the Company’s stock, the Company’s use of remaining U.S. tax attributes may be further limited.
We estimate that as of December 31, 2017, 2016 and 2015, we have available $485.6 million, $378.8 million and $258.9 million, respectively, of state net operating loss carryforwards that will expire between 2018 and 2037. We estimate that we have remaining capital loss carryforward of $78.0 million, as $61.2 million expired during 2017. Our remaining capital loss carryforwards will expire in 2021.
We did not provide for U.S. income taxes or withholding taxes on unremitted earnings of our subsidiary in Canada, as these earnings are considered permanently reinvested because the cash flow generated by this business is needed to fund additional equipment and working capital requirements in this jurisdiction. Furthermore, we did not provide for U.S. income taxes on unremitted earnings of our other foreign subsidiaries, because as of December 31, 2017, the Company’s non-Canadian foreign subsidiaries had an accumulated deficit in earnings. The Company does not intend to repatriate the earnings of its foreign subsidiaries.
We file income tax returns in the U.S., including federal and various state filings, and certain foreign jurisdictions. The number of years that are open under the statute of limitations and subject to audit varies depending on the tax jurisdiction. In 2014 the Internal Revenue Service (“IRS”) concluded their audit of our returns for the tax years ended December 31, 2010, 2011 and 2012 with no material changes. In 2015 the IRS concluded their audit of our returns for the tax year ended December 31, 2014 with no changes. Our other significant filings, which are in Mexico, have been examined through tax years 2010.
Under the Plan, a substantial portion of the Company’s pre-petition debt securities, revolving credit facility and other obligations were extinguished. Absent an exception, a debtor recognizes cancellation of indebtedness income (“CODI”) upon discharge of its outstanding indebtedness for an amount of consideration that is less than its adjusted issue price. The Internal Revenue Code of 1986, as amended (“IRC”), provides that a debtor in a bankruptcy case may exclude CODI from taxable income but must reduce certain of its tax attributes by the amount of any CODI realized as a result of the consummation of a plan of reorganization. The amount of CODI realized by a taxpayer is the adjusted issue price of any indebtedness discharged less the sum of (i) the amount of cash paid, (ii) the issue price of any new indebtedness issued and (iii) the fair market value of any other consideration, including equity, issued. As a result of the market value of equity upon emergence from chapter 11 bankruptcy proceedings, the estimated amount of U.S. CODI is approximately $295.8 million, which will reduce the value of Key’s U.S. net operating losses including federal and state that had a value of $518.8 million as of December 15, 2016. The actual reduction in tax attributes does not occur until the first day of the Company’s tax year subsequent to the date of emergence, or December 16, 2016.
Uncertainty in Income Taxes
As of December 31, 2017, December 31, 2016, December 16, 2016, and December 31, 2015 we had $0.1 million, $0.4 million, $0.4 million and $0.6 million, respectively, of unrecognized tax benefits which, if recognized, would impact our effective tax rate. We recognized a net tax benefit $0.3 million in 2017, zero for the period ended December 31, 2016, $0.2 million for the period ended December 15, 2016, and $0.9 million in 2015 for statutes of limitations expiration. We expect our remaining reserve
77
Key Energy Services, Inc. and Subsidiaries
NOTES TO CONSOLIDATED FINANCIAL STATEMENTS — (Continued)
for uncertain tax positions to reverse within the next twelve months. A reconciliation of the gross change in the unrecognized tax benefits is as follows (in thousands):
Predecessor: | |||
Balance at January 1, 2015 | $ | 1,449 | |
Additions based on tax positions related to the current year | — | ||
Reductions as a result of a lapse of the applicable statute of limitations | (883 | ) | |
Settlements | — | ||
Balance at December 31, 2015 | 566 | ||
Additions based on tax positions related to the current period | — | ||
Reductions as a result of a lapse of the applicable statute of limitations | (206 | ) | |
Settlements | — | ||
Balance at December 15, 2016 | $ | 360 | |
Successor: | |||
Balance at December 15, 2016 | $ | 360 | |
Additions based on tax positions related to the current period | — | ||
Reductions as a result of a lapse of the applicable statute of limitations | — | ||
Settlements | — | ||
Balance at December 31, 2016 | $ | 360 | |
Additions based on tax positions related to the current period | — | ||
Reductions as a result of a lapse of the applicable statute of limitations | (252 | ) | |
Settlements | — | ||
Balance at December 31, 2017 | $ | 108 | |
NOTE 16. LONG-TERM DEBT
The components of our long-term debt are as follows (in thousands):
December 31, | |||||||
2017 | 2016 | ||||||
Term Loan Facility due 2021 | $ | 247,500 | $ | 250,000 | |||
Debt issuance costs and unamortized premium (discount) on debt, net | (1,897 | ) | (2,023 | ) | |||
Total | 245,603 | 247,977 | |||||
Less current portion | (2,500 | ) | (2,500 | ) | |||
Long-term debt | $ | 243,103 | $ | 245,477 | |||
ABL Facility
On December 15, 2016, the Company and Key Energy Services, LLC, as borrowers (the “ABL Borrowers”), entered into the ABL Facility with the financial institutions party thereto from time to time as lenders (the “ABL Lenders”), Bank of America, N.A., as administrative agent for the lenders, and Bank of America, N.A. and Wells Fargo Bank, National Association, as co-collateral agents for the lenders. The ABL Facility provides for aggregate initial commitments from the ABL Lenders of $80 million, which, on February 3, 2017 was increased to $100 million, and matures on June 15, 2021.
The ABL Facility provides the ABL Borrowers with the ability to borrow up to an aggregate principal amount equal to the lesser of (i) the aggregate revolving commitments then in effect and (ii) the sum of (a) 85% of the value of eligible accounts receivable plus (b) 80% of the value of eligible unbilled accounts receivable, subject to a limit equal to the greater of (x) $35 million and (y) 25% of the Commitments. The amount that may be borrowed under the ABL Facility is subject to increase or reduction based on certain segregated cash or reserves provided for by the ABL Facility. In addition, the percentages of accounts receivable and unbilled accounts receivable included in the calculation described above is subject to reduction to the extent of certain bad debt write-downs and other dilutive items provided in the ABL Facility.
78
Key Energy Services, Inc. and Subsidiaries
NOTES TO CONSOLIDATED FINANCIAL STATEMENTS — (Continued)
Borrowings under the ABL Facility will bear interest, at the ABL Borrowers’ option, at a per annum rate equal to (i) LIBOR for 30, 60, 90, 180, or, with the consent of the ABL Lenders, 360 days, plus an applicable margin that varies from 2.50% to 4.50% depending on the Borrowers’ fixed charge coverage ratio at such time or (ii) a base rate equal to the sum of (a) the greatest of (x) the prime rate, (y) the federal funds rate, plus 0.50% or (z) 30-day LIBOR, plus 1.0% plus (b) an applicable margin that varies from 1.50% to 3.50% depending on the Borrowers’ fixed charge coverage ratio at such time. In addition, the ABL Facility provides for unused line fees of 1.0% to 1.25% per year, depending on utilization, letter of credit fees and certain other factors.
The ABL Facility may in the future be guaranteed by certain of the Company’s existing and future subsidiaries (the “ABL Guarantors,” and together with the ABL Borrowers, the “ABL Loan Parties”). To secure their obligations under the ABL Facility, each of the ABL Loan Parties has granted or will grant, as applicable, to the Administrative Agent a first-priority security interest for the benefit of the ABL Lenders in its present and future accounts receivable, inventory and related assets and proceeds of the foregoing (the “ABL Priority Collateral”). In addition, the obligations of the ABL Loan Parties under the ABL Facility are secured by second-priority liens on the Term Priority Collateral (as described below under “Term Loan Facility”).
The revolving loans under the ABL Facility may be voluntarily prepaid, in whole or in part, without premium or penalty, subject to breakage or similar costs.
The ABL Facility contains certain affirmative and negative covenants, including covenants that restrict the ability of the ABL Loan Parties to take certain actions including, among other things and subject to certain significant exceptions, the incurrence of debt, the granting of liens, the making of investments, entering into transactions with affiliates, the payment of dividends and the sale of assets. The ABL Facility also contains a requirement that the ABL Borrowers comply, during certain periods, with a fixed charge coverage ratio of 1.00 to 1.00.
As of December 31, 2017, we had no borrowings outstanding under the ABL Facility and $35.6 million of letters of credit outstanding with borrowing capacity of $24.7 million available subject to covenant constraints under our ABL Facility.
Term Loan Facility
On December 15, 2016, the Company entered into the Term Loan Facility among the Company, as borrower, certain subsidiaries of the Company named as guarantors therein, the financial institutions party thereto from time to time as Lenders (collectively, the “Term Loan Lenders”) and Cortland Capital Market Services LLC and Cortland Products Corp., as agent for the Lenders. The Term Loan Facility had an outstanding principal amount of $250 million.
The Term Loan Facility will mature on December 15, 2021, although such maturity date may, at the Company’s request, be extended by one or more of the Term Loan Lenders pursuant to the terms of the Term Loan Facility. Borrowings under the Term Loan Facility will bear interest, at the Company’s option, at a per annum rate equal to (i) LIBOR for one, two, three, six, or, with the consent of the Term Loan Lenders, 12 months, plus 10.25% or (ii) a base rate equal to the sum of (a) the greatest of (x) the prime rate, (y) the Federal Funds rate, plus 0.50% and (z) 30-day LIBOR, plus 1.0% plus (b) 9.25%.
The Term Loan Facility is guaranteed by certain of the Company’s existing and future subsidiaries (the “Term Loan Guarantors,” and together with the Company, the “Term Loan Parties”). To secure their obligations under the Term Loan Facility, each of the Term Loan Parties has granted or will grant, as applicable, to the agent a first-priority security interest for the benefit of the Term Loan Lenders in substantially all of each Term Loan Party’s assets other than certain excluded assets and the ABL Priority Collateral (the “Term Priority Collateral”). In addition, the obligations of the Term Loan Parties under the Term Loan Facility are secured by second-priority liens on the ABL Priority Collateral (as described above under “ABL Facility”).
The loans under the Term Loan Facility may be prepaid at the Company’s option, subject to the payment of a prepayment premium in certain circumstances as provided in the Term Loan Facility. If a prepayment is made after the first anniversary of the loan but prior to the second anniversary, such prepayment must be made at 106% of the principle amount, if a prepayment is made after the second anniversary but prior to the third anniversary, such prepayment must be made at 103% of the principle amount. After the third anniversary, if a prepayment is made, no prepayment premium is due. The Company is required to make principal payments in the amount of $625,000 per quarter commencing with the quarter ending March 31, 2017. In addition, pursuant to the Term Loan Facility, the Company must prepay or offer to prepay, as applicable, term loans with the net cash proceeds of certain debt incurrences and asset sales, excess cash flow, and upon certain change of control transactions, subject in each case to certain exceptions.
The Term Loan Facility contains certain affirmative and negative covenants, including covenants that restrict the ability of the Term Loan Parties to take certain actions including, among other things and subject to certain significant exceptions, the incurrence of debt, the granting of liens, the making of investments, entering into transactions with affiliates, the payment of dividends and the sale of assets. The Term Loan Facility also contains financial covenants requiring that the Company maintain an asset coverage ratio of at least 1.35 to 1.0 and that Liquidity (as defined in the Term Loan Facility) must not be less than $37.5
79
Key Energy Services, Inc. and Subsidiaries
NOTES TO CONSOLIDATED FINANCIAL STATEMENTS — (Continued)
million (of which at least $20.0 million must be in cash or cash equivalents held in deposit accounts) as of the last day of any fiscal quarter, subject to certain exceptions and cure rights.
The weighted average interest rates on the outstanding borrowings under the Term Loan Facility for the year ended December 31, 2017 was as follows:
Year Ended December 31, 2017 | ||
Term Loan Facility | 11.45 | % |
Long-Term Debt Principal Repayment and Interest Expense
Presented below is a schedule of the repayment requirements of long-term debt for each of the next five years and thereafter as of December 31, 2017 (in thousands):
Principal Amount of Long-Term Debt | |||
2018 | $ | 2,500 | |
2019 | 2,500 | ||
2020 | 2,500 | ||
2021 | 240,000 | ||
Total long-term debt | $ | 247,500 | |
Interest expense for the year ended December 31, 2017, the period from December 16, 2016 through December 31, 2016, the period from January 1, 2016 through December 15, 2016 and the year ended December 31, 2015 consisted of the following (in thousands):
Successor | Predecessor | |||||||||||||||
Year Ended December 31, 2017 | Period from December 16, 2016 through December 31, 2016 | Period from January 1, 2016 through December 15, 2016 | Year Ended December 31, 2015 | |||||||||||||
Cash payments | $ | 30,397 | $ | 1,312 | $ | 69,134 | $ | 68,105 | ||||||||
Commitment and agency fees paid | 924 | 35 | 772 | 1,097 | ||||||||||||
Amortization of discount and premium on debt | — | — | 1,086 | 547 | ||||||||||||
Amortization of deferred financing costs | 476 | 17 | 3,328 | 3,277 | ||||||||||||
Write-off of deferred financing costs | — | — | — | 821 | ||||||||||||
Net interest expense | $ | 31,797 | $ | 1,364 | $ | 74,320 | $ | 73,847 | ||||||||
80
Key Energy Services, Inc. and Subsidiaries
NOTES TO CONSOLIDATED FINANCIAL STATEMENTS — (Continued)
Deferred Financing Costs
A summary of deferred financing costs including capitalized costs, write-offs and amortization are presented in the table below (in thousands):
Predecessor | |||
Balance at December 31, 2015 | $ | 18,098 | |
Capitalized costs | — | ||
Amortization | (3,328 | ) | |
Write-off | (14,770 | ) | |
Balance at December 15, 2016 | — | ||
Successor | |||
Balance at December 15, 2016 | 2,040 | ||
Capitalized costs | — | ||
Amortization | (17 | ) | |
Write-off | — | ||
Balance at December 31, 2016 | $ | 2,023 | |
Capitalized costs | 350 | ||
Amortization | (476 | ) | |
Balance at December 31, 2017 | $ | 1,897 | |
The Predecessor balance of $14.8 million was eliminated in accordance with ASC 852, recorded as a reorganization item on the consolidated statement of operations. See “Note 5. Reorganization Items” for more details.
NOTE 17. COMMITMENTS AND CONTINGENCIES
Operating Lease Arrangements
We lease certain property and equipment under non-cancelable operating leases that expire at various dates through 2024, with varying payment dates throughout each month. In addition, we have a number of leases scheduled to expire during 2018.
As of December 31, 2017, the future minimum lease payments under non-cancelable operating leases are as follows (in thousands):
Lease Payments | |||
2018 | $ | 4,478 | |
2019 | 3,380 | ||
2020 | 1,753 | ||
2021 | 1,503 | ||
2022 | 1,459 | ||
Thereafter | 2,012 | ||
Total | $ | 14,585 | |
We are also party to a significant number of month-to-month leases that can be canceled at any time. Operating lease expense was $6.4 million, less than $0.1 million, $11.4 million, and $16.9 million for the year ended December 31, 2017, the period from December 16, 2016 through December 31, 2016, the period from January 1, 2016 through December 15, 2016 and the year ended December 31, 2015, respectively.
81
Key Energy Services, Inc. and Subsidiaries
NOTES TO CONSOLIDATED FINANCIAL STATEMENTS — (Continued)
Litigation
Various suits and claims arising in the ordinary course of business are pending against us. We conduct business throughout the continental United States and may be subject to jury verdicts or arbitrations that result in outcomes in favor of the plaintiffs. We are also exposed to various claims abroad. We continually assess our contingent liabilities, including potential litigation liabilities, as well as the adequacy of our accruals and the need for disclosure of these items, if any. We establish a provision for a contingent liability when it is probable that a liability has been incurred and the amount is reasonably estimable. As of December 31, 2017, the aggregate amount of our liabilities related to litigation that are deemed probable and reasonably estimable is $4.7 million. We do not believe that the disposition of any of these matters will result in an additional loss materially in excess of amounts that have been recorded. Our liabilities related to litigation matters that were deemed probable and reasonably estimable as of December 31, 2016 were $5.4 million.
In November 2015, the Santa Barbara County District Attorney filed a criminal complaint against two former employees and Key, specifically alleging three counts of violations of California Labor Code section 6425(a) against Key. The complaint sought unspecified penalties against Key related to an October 12, 2013 accident which resulted in the death of one Key employee at a drilling site near Santa Maria, California. An arraignment was held on February 10, 2016, where Key and its former employees pleaded not guilty to all charges.
On or about January 10, 2017, Key entered into a settlement with the Santa Barbara County District Attorney. Key agreed to plead no contest to one felony count (Count 2), a violation of California Labor Code 6425(a). The Santa Barbara County District Attorney also agreed to recommend total restitution, fines, fees, and surcharges not to exceed $450,000. The court dismissed the remaining charges (Counts 1 and 3) against Key. The parties agreed to postpone sentencing in the matter until January 31, 2018. The parties agreed that if Key pays all of the total restitution, fines, fees, and surcharges by January 31, 2018, the Santa Barbara County District Attorney will not object to Key withdrawing its plea to a felony count on Count 2 and entering a plea to a misdemeanor. On January 31, 2018, the sentence was entered as a misdemeanor and the matter was concluded.
Tax Audits
We are routinely the subject of audits by tax authorities, and in the past have received material assessments from tax auditors. As of December 31, 2017 and 2016, we have recorded reserves that management feels are appropriate for future potential liabilities as a result of prior audits. While we believe we have fully reserved for these assessments, the ultimate amount of settlements can vary from our estimates.
Self-Insurance Reserves
We maintain reserves for workers’ compensation and vehicle liability on our balance sheet based on our judgment and estimates using an actuarial method based on claims incurred. We estimate general liability claims on a case-by-case basis. We maintain insurance policies for workers’ compensation, vehicular liability and general liability claims. These insurance policies carry self-insured retention limits or deductibles on a per occurrence basis. The retention limits or deductibles are accounted for in our accrual process for all workers’ compensation, vehicular liability and general liability claims. The deductibles have a $5 million maxim per vehicular liability claim and $2 million per general liability claim. As of December 31, 2017 and 2016, we have recorded $52.2 million and $58.7 million, respectively, of self-insurance reserves related to workers’ compensation, vehicular liabilities and general liability claims. Partially offsetting these liabilities, we had approximately $15.1 million and $16.3 million of insurance receivables as of December 31, 2017 and 2016, respectively. We believe that the liabilities we have recorded are appropriate based on the known facts and circumstances and do not expect further losses materially in excess of the amounts already accrued for existing claims.
Environmental Remediation Liabilities
For environmental reserve matters, including remediation efforts for current locations and those relating to previously-disposed properties, we record liabilities when our remediation efforts are probable and the costs to conduct such remediation efforts can be reasonably estimated. As of December 31, 2017 and 2016, we have recorded $2.0 million and $3.4 million, respectively, for our environmental remediation liabilities. We believe that the liabilities we have recorded are appropriate based on the known facts and circumstances and do not expect further losses materially in excess of the amounts already accrued.
We provide performance bonds to provide financial surety assurances for the remediation and maintenance of our SWD properties to comply with environmental protection standards. Costs for SWD properties may be mandatory (to comply with applicable laws and regulations), in the future (required to divest or cease operations), or for optimization (to improve operations, but not for safety or regulatory compliance).
82
Key Energy Services, Inc. and Subsidiaries
NOTES TO CONSOLIDATED FINANCIAL STATEMENTS — (Continued)
NOTE 18. ACCUMULATED OTHER COMPREHENSIVE INCOME (LOSS)
The components of our accumulated other comprehensive loss are as follows (in thousands):
December 31, | |||||||
2017 | 2016 | ||||||
Foreign currency translation income | $ | — | $ | 239 | |||
Accumulated other comprehensive income | $ | — | $ | 239 | |||
The local currency was the functional currency for our former operations in Russia, which was sold in the third quarter of 2017. As of December 31, 2017 and December 31, 2016, one U.S. dollar was equal to 57.61 and 61.23 Russian rubles, respectively. The cumulative translation gains and losses resulting from translating financial statements from the functional currency to U.S. dollars are included in other comprehensive loss and accumulated in stockholders’ equity until a partial or complete sale or liquidation of our net investment in the entity.
NOTE 19. EMPLOYEE BENEFIT PLANS
We maintain a 401(k) plan as part of our employee benefits package. In the third quarter of 2015, management suspended the 401(k) matching program as part of our cost cutting efforts. Prior to this, we matched 100% of employee contributions up to 4% of the employee’s salary, which vest immediately, into our 401(k) plan, subject to maximums of $10,800, $10,600 and $10,600 for the years ended December 31, 2017, 2016 and 2015, respectively. Our matching contributions were zero, zero, zero and $5.5 million for the year ended December 31, 2017, the period from December 16, 2016 through December 31, 2016, the period from January 1, 2016 through December 15, 2016 and the year ended December 31, 2015, respectively. We do not offer participants the option to purchase shares of our common stock through a 401(k) plan fund.
NOTE 20. STOCKHOLDERS’ EQUITY
Preferred Stock
As of December 31, 2017, we had 10,000,000 shares of preferred stock authorized with a par value of $0.01 per share. As of December 31, 2017, the sole share of the Successor Company’s Series A Preferred Stock, which confers certain rights to elect directors (but has no economic rights), was held by Soter.
Common Stock
As of December 31, 2017 and December 31, 2016, we had 100,000,000 shares of common stock authorized with a par value of $0.01 per share, of which 20,217,641 and 20,096,462 shares were issued and outstanding, respectively. During 2017, 2016 and 2015, no dividends were declared or paid and we currently do not intend to pay dividends.
Tax Withholding
We repurchase shares of restricted common stock that have been previously granted to certain of our employees, pursuant to an agreement under which those individuals are permitted to sell shares back to us in order to satisfy the minimum income tax withholding requirements related to vesting of these grants. We repurchased a total of 56,328 shares, zero shares, 1,614,047 shares and 239,636 shares for an aggregate cost of $0.7 million, zero, $0.2 million and $0.4 million during the year ended December 31, 2017, the period from December 16, 2016 through December 31, 2016, the period from January 1, 2016 through December 15, 2016 and the year ended December 31, 2015, respectively, which represented the fair market value of the shares based on the price of our stock on the dates of purchase.
83
Key Energy Services, Inc. and Subsidiaries
NOTES TO CONSOLIDATED FINANCIAL STATEMENTS — (Continued)
NOTE 21. SHARE-BASED COMPENSATION
Equity and Cash Incentive Plan
On the Effective Date, pursuant to the Plan, the Company adopted a new management incentive plan titled the Key Energy Services, Inc. 2016 Equity and Cash Incentive Plan. The 2016 Incentive Plan authorizes the grant of compensation described in the following sentence comprised of stock or economic rights tied to the value of stock collectively representing up to 11% of the fully diluted shares of Common Stock as of the Effective Date (without regard to shares reserved for issuance pursuant to the Warrants) (as increased by the Board from the initial pool of 7% of fully diluted shares on the Effective Date, as permitted under the terms of the 2016 Incentive Plan). The 2016 Incentive Plan provides for awards of restricted stock, restricted stock units, options, stock appreciation rights and cash-based awards, for distribution to officers, directors and employees of the Company and its subsidiaries as determined by the New Board. As of the Effective Date, the New Board or an authorized committee thereof is authorized, without further approval of Key equity holders, to execute and deliver all agreements, documents, instruments and certificates relating to the 2016 Incentive Plan and to perform their obligations thereunder in accordance with, and subject to, the terms of the 2016 Incentive Plan. As of December 31, 2017, there were 1.0 million shares available for grant under the 2016 ECIP.
Stock Option Awards
Stock option awards granted under our incentive plans have a maximum contractual term of ten years from the date of grant. Shares issuable upon exercise of a stock option are issued from authorized but unissued shares of our common stock.
The following tables summarize the stock option activity for the year ended December 31, 2017 (shares in thousands):
Year Ended December 31, 2017 | ||||||||||
Options | Weighted Average Exercise Price | Weighted Average Fair Value | ||||||||
Outstanding at beginning of period | 648 | $ | 33.67 | $ | 10.53 | |||||
Granted | 53 | $ | 40.63 | $ | 12.14 | |||||
Exercised | — | $ | — | $ | — | |||||
Canceled or expired | (537 | ) | $ | 34.19 | $ | 10.65 | ||||
Outstanding at end of period | 164 | $ | 34.24 | $ | 10.66 | |||||
Exercisable at end of period | 159 | $ | 34.25 | $ | 10.66 | |||||
Cancellations for the year ended December 31, 2017 include 0.5 million options that were forfeited by employees in exchange for a new grant of time based and performance based RSUs which have different vesting terms than the forfeited options. The weighted average grant date fair market of stock options granted during the year ended December 31, 2017, period from December 16, 2016 through December 31, 2016, period from January 1, 2016 through December 15, 2016 and year ended December 31, 2015 was $12.14, $10.53, zero and zero, respectively. The total fair value of stock options vested during the year ended December 31, 2017, period from December 16, 2016 through December 31, 2016, period from January 1, 2016 through December 15, 2016 and year ended December 31, 2015 was $1.7 million, zero, zero and zero, respectively. For the year ended December 31, 2017, period from December 16, 2016 through December 31, 2016, period from January 1, 2016 through December 15, 2016 and year ended December 31, 2015, we recognized $1.8 million, $0.1 million, zero and zero in pre-tax expense related to stock options, respectively. The weighted average remaining contractual term for stock option awards exercisable as of December 31, 2017 is 9.0 years.
84
Key Energy Services, Inc. and Subsidiaries
NOTES TO CONSOLIDATED FINANCIAL STATEMENTS — (Continued)
Common Stock Awards
Our common stock awards include restricted stock awards and restricted stock units. The weighted average grant date fair market value of all common stock awards granted during the year ended December 31, 2017 and for the period from December 16, 2016 through December 31, 2016, period from January 1, 2016 through December 15, 2016 and year ended December 31, 2015 was $12.37, $31.99, $0.26 and $1.89 respectively. The total fair market value of all common stock awards vested during the year ended December 31, 2017, for the period from December 16, 2016 through December 31, 2016, period from January 1, 2016 through December 15, 2016 and year ended December 31, 2015 was $6.2 million, zero, 14.5 million and 13.2 million, respectively.
The following tables summarize information for the year ended December 31, 2017 about our unvested common stock awards that we have outstanding (shares in thousands):
Year Ended December 31, 2017 | ||||||
Outstanding | Weighted Average Issuance Price | |||||
Shares at beginning of period | 667 | $ | 31.99 | |||
Granted | 1,161 | $ | 12.37 | |||
Vested | (197 | ) | $ | 31.44 | ||
Canceled | (519 | ) | $ | 31.36 | ||
Shares at end of period | 1,112 | $ | 11.90 | |||
Cancellations for the year ended December 31, 2017 include 0.5 million RSUs that were forfeited by employees in exchange for a new grant of time based and performance based RSUs which have different vesting terms than the forfeited RSUs. The grant-date fair value of our time-based restricted stock units and restricted stock awards is determined using our stock price on the grant date. The grant-date fair value of our performance-based restricted stock units is determined using our stock price on the grant date assuming a 1.0x payout target, however, a maximum 2.0x payout could be achieved if certain EBITDA-based performance measures are met. We recognize compensation expense ratably over the graded vesting period of the grant, net of forfeitures. For the year ended December 31, 2017, period from December 16, 2016 through December 31, 2016, period from January 1, 2016 through December 15, 2016 and year ended December 31, 2015 we recognized $5.3 million, $0.4 million, $5.7 million and $10.2 million, respectively, of pre-tax expense from continuing operations associated with common stock awards. For the unvested common stock awards outstanding as of December 31, 2017, we anticipate that we will recognize $13.3 million of pre-tax expense over the next 2.0 years.
Phantom Share Plan
In December 2017, we implemented a “Phantom Share Plan,” in which certain of our employees were granted “Phantom Shares.” Phantom Shares vest ratably over a three-year period and convey the right to the grantee to receive a cash payment on the anniversary date of the grant equal to the fair market value of the Phantom Shares vesting on that date. Grantees are not permitted to defer this payment to a later date. The Phantom Shares are a “liability” type award and we account for these awards at fair value. We recognize compensation expense related to the Phantom Shares based on the change in the fair value of the awards during the period and the percentage of the service requirement that has been performed, net of forfeitures, with an offsetting liability recorded on our consolidated balance sheets.
NOTE 22. TRANSACTIONS WITH RELATED PARTIES
Board of Director Relationships
The Company has purchased equipment and services from a few affiliates of certain directors. The dollar amounts related to these related party activities are not material to the Company’s condensed consolidated financial statements.
85
Key Energy Services, Inc. and Subsidiaries
NOTES TO CONSOLIDATED FINANCIAL STATEMENTS — (Continued)
NOTE 23. SUPPLEMENTAL CASH FLOW INFORMATION
Presented below is a schedule of noncash investing and financing activities and supplemental cash flow entries (in thousands):
Successor | Predecessor | |||||||||||||||
Year Ended December 31, 2017 | Period from December 16, 2016 through December 31, 2016 | Period from January 1, 2016 through December 15, 2016 | Year Ended December 31, 2015 | |||||||||||||
Supplemental cash flow information: | ||||||||||||||||
Cash paid for reorganization items | $ | — | $ | — | $ | 6,955 | $ | — | ||||||||
Cash paid for interest | 30,397 | 1,312 | 69,134 | 68,048 | ||||||||||||
Cash paid for taxes | — | — | 57 | 1,077 | ||||||||||||
Tax refunds | — | — | 1,834 | 6,972 | ||||||||||||
Cash paid for interest includes cash payments for interest on our long-term debt and capital lease obligations, and commitment and agency fees paid.
NOTE 24. SEGMENT INFORMATION
Our reportable business segments are U.S. Rig Services, Fluid Management Services, Coiled Tubing Services, Fishing and Rental Services and International. We also have a “Functional Support” segment associated with overhead and other costs in support of our reportable segments. Our U.S. Rig Services, Fluid Management Services, Coiled Tubing Services, Fishing and Rental Services operate geographically within the United States. Our International segment includes our former operations in Mexico, Canada, Colombia, Ecuador, Russia, Bahrain and Oman. During the second half of 2015, we ceased operations in Colombia, Ecuador and the Middle East. During the fourth quarter of 2016, we completed the sale of our business in Mexico. We completed the sale of our Canadian subsidiary and Russian subsidiary in the second and third quarters of 2017, respectively. We evaluate the performance of our segments based on gross margin measures. All inter-segment sales pricing is based on current market conditions. We aggregate services that create our reportable segments in accordance with ASC 280, and the accounting policies for our segments are the same as those described in “Note 1. Organization and Summary of Significant Accounting Policies” above.
U.S. Rig Services
Our U.S. Rig Services include the completion of newly drilled wells, workover and recompletion of existing oil and natural gas wells, well maintenance, and the plugging and abandonment of wells at the end of their useful lives. We also provide specialty drilling services to oil and natural gas producers with certain of our larger rigs that are capable of providing conventional and horizontal drilling services. Our rigs encompass various sizes and capabilities, allowing us to service all types of oil and gas wells. Many of our rigs are outfitted with our proprietary KeyView® technology, which captures and reports well site operating data and provides safety control systems. We believe that this technology allows our customers and our crews to better monitor well site operations, improves efficiency and safety, and adds value to the services that we offer.
The completion and recompletion services provided by our rigs prepare wells for production, whether newly drilled, or recently extended through a workover operation. The completion process may involve selectively perforating the well casing to access production zones, stimulating and testing these zones, and installing tubular and downhole equipment. We typically provide a well service rig and may also provide other equipment to assist in the completion process. Completion services vary by well and our work may take a few days to several weeks to perform, depending on the nature of the completion.
The workover services that we provide are designed to enhance the production of existing wells and generally are more complex and time consuming than normal maintenance services. Workover services can include deepening or extending wellbores into new formations by drilling horizontal or lateral wellbores, sealing off depleted production zones and accessing previously bypassed production zones, converting former production wells into injection wells for enhanced recovery operations and conducting major subsurface repairs due to equipment failures. Workover services may last from a few days to several weeks, depending on the complexity of the workover.
Maintenance services provided with our rig fleet are generally required throughout the life cycle of an oil or natural gas well. Examples of these maintenance services include routine mechanical repairs to the pumps, tubing and other equipment, removing debris and formation material from wellbores, and pulling rods and other downhole equipment from wellbores to identify
86
Key Energy Services, Inc. and Subsidiaries
NOTES TO CONSOLIDATED FINANCIAL STATEMENTS — (Continued)
and resolve production problems. Maintenance services are generally less complicated than completion and workover related services and require less time to perform.
Our rig fleet is also used in the process of permanently shutting-in oil or natural gas wells that are at the end of their productive lives. These plugging and abandonment services generally require auxiliary equipment in addition to a well servicing rig. The demand for plugging and abandonment services is not significantly impacted by the demand for oil and natural gas because well operators are required by state regulations to plug wells that are no longer productive.
Fluid Management Services
We provide transportation and well-site storage services for various fluids utilized in connection with drilling, completions, workover and maintenance activities. We also provide disposal services for fluids produced subsequent to well completion. These fluids are removed from the well site and transported for disposal in SWD wells owned by us or a third party. In addition, we operate a fleet of hot oilers capable of pumping heated fluids used to clear soluble restrictions in a wellbore. Demand and pricing for these services generally correspond to demand for our well service rigs.
Coiled Tubing Services
Coiled Tubing Services involve the use of a continuous metal pipe spooled onto a large reel which is then deployed into oil and natural gas wells to perform various applications, such as wellbore clean-outs, nitrogen jet lifts, through-tubing fishing, and formation stimulations utilizing acid and chemical treatments. Coiled tubing is also used for a number of horizontal well applications such as milling temporary isolation plugs that separate frac zones, and various other pre- and post- hydraulic fracturing well preparation services.
Fishing and Rental Services
We offer a full line of services and rental equipment designed for use in providing drilling and workover services. Fishing services involve recovering lost or stuck equipment in the wellbore utilizing a broad array of “fishing tools.” Our rental tool inventory consists of drill pipe, tubulars, handling tools (including our patented Hydra-Walk® pipe-handling units and services), pressure-control equipment, pumps, power swivels, reversing units, foam air units. Our rental inventory also included frac stack equipment used to support hydraulic fracturing operations and the associated flowback of frac fluids, proppants, oil and natural gas. We also had provided well testing services. Our frac stack equipment well testing services were sold in the second quarter of 2017.
Demand for our Fishing and Rental Services is closely related to capital spending by oil and natural gas producers, which is generally a function of oil and natural gas prices.
International
Our International segment includes our former operations in Mexico, Canada, Colombia, Ecuador, Russia, Bahrain and Oman. In April 2015, we announced our decision to exit markets in which we participate outside of North America. To this end, during the second half of 2015, we ceased operations in Colombia, Ecuador and the Middle East. During the fourth quarter of 2016, we completed the sale of our business in Mexico, and we completed the sale of our Canadian subsidiary and Russian subsidiary in the second and third quarters of 2017, respectively. Our services in these international markets consisted of rig-based services such as the maintenance, workover, and recompletion of existing oil wells, completion of newly-drilled wells, and plugging and abandonment of wells at the end of their useful lives. We also had a technology development and control systems business based in Canada, which was focused on the development of hardware and software related to oilfield service equipment controls, data acquisition and digital information flow.
Functional Support
Our Functional Support segment includes unallocated overhead costs associated with administrative support for our U.S. and International reporting segments.
87
Key Energy Services, Inc. and Subsidiaries
NOTES TO CONSOLIDATED FINANCIAL STATEMENTS — (Continued)
Financial Summary
The following table presents our segment information as of and for the year ended December 31, 2017, the period from December 16, 2016 through December 31, 2016, the period from January 1, 2016 through December 15, 2016 and the year ended December 31, 2015 (in thousands):
Successor company as of and for the year ended December 31, 2017
U.S. Rig Service | Fluid Management Services | Coiled Tubing Services | Fishing and Rental Services | International | Functional Support(2) | Reconciling Eliminations | Total | ||||||||||||||||||||||||
Revenues from external customers | $ | 248,830 | $ | 80,726 | $ | 41,866 | $ | 59,172 | $ | 5,571 | $ | — | $ | — | $ | 436,165 | |||||||||||||||
Depreciation and amortization | 31,493 | 21,917 | 5,187 | 23,454 | 791 | 1,700 | — | 84,542 | |||||||||||||||||||||||
Impairment expense | — | — | — | — | 187 | — | — | 187 | |||||||||||||||||||||||
Other operating expenses | 220,957 | 78,341 | 35,048 | 28,212 | 9,586 | 75,472 | — | 447,616 | |||||||||||||||||||||||
Operating income (loss) | (3,620 | ) | (19,532 | ) | 1,631 | 7,506 | (4,993 | ) | (77,172 | ) | — | (96,180 | ) | ||||||||||||||||||
Reorganization items, net | — | — | — | — | — | 1,501 | — | 1,501 | |||||||||||||||||||||||
Interest expense, net of amounts capitalized | — | — | — | — | — | 31,797 | — | 31,797 | |||||||||||||||||||||||
Income (loss) before taxes | (3,449 | ) | (19,537 | ) | 1,643 | 7,748 | (298 | ) | (108,398 | ) | — | (122,291 | ) | ||||||||||||||||||
Long-lived assets(1) | 160,170 | 74,591 | 19,064 | 63,340 | 7 | 122,965 | (97,819 | ) | 342,318 | ||||||||||||||||||||||
Total assets | 287,856 | (985 | ) | 41,523 | 360,581 | 9,473 | 513,393 | (682,720 | ) | 529,121 | |||||||||||||||||||||
Capital expenditures | 8,375 | 3,288 | 886 | 741 | 475 | 2,314 | — | 16,079 | |||||||||||||||||||||||
Successor company as of December 31, 2016 and for the period from December 16, 2016 through December 31, 2016
U.S. Rig Service | Fluid Management Services | Coiled Tubing Services | Fishing and Rental Services | International | Functional Support(2) | Reconciling Eliminations | Total | ||||||||||||||||||||||||
Revenues from external customers | $ | 8,549 | $ | 3,208 | $ | 1,392 | $ | 3,389 | $ | 1,292 | $ | — | $ | — | $ | 17,830 | |||||||||||||||
Depreciation and amortization | 1,129 | 987 | 202 | 1,158 | 16 | 82 | — | 3,574 | |||||||||||||||||||||||
Other operating expenses | 9,352 | 3,359 | 1,446 | 2,496 | 1,209 | 5,242 | — | 23,104 | |||||||||||||||||||||||
Operating income (loss) | (1,932 | ) | (1,138 | ) | (256 | ) | (265 | ) | 67 | (5,324 | ) | — | (8,848 | ) | |||||||||||||||||
Interest expense, net of amounts capitalized | — | — | — | — | — | 1,364 | — | 1,364 | |||||||||||||||||||||||
Income (loss) before taxes | (1,932 | ) | (1,138 | ) | (256 | ) | (265 | ) | 49 | (6,702 | ) | — | (10,244 | ) | |||||||||||||||||
Long-lived assets(1) | 172,871 | 94,887 | 24,741 | 95,544 | 1,236 | 142,580 | (108,448 | ) | 423,411 | ||||||||||||||||||||||
Total assets | 1,348,587 | 226,503 | 106,609 | 462,163 | 62,971 | (1,276,652 | ) | (272,200 | ) | 657,981 | |||||||||||||||||||||
Capital expenditures | 331 | 29 | — | 10 | — | 5 | — | 375 | |||||||||||||||||||||||
88
Key Energy Services, Inc. and Subsidiaries
NOTES TO CONSOLIDATED FINANCIAL STATEMENTS — (Continued)
Predecessor company as of December 15, 2016 and for the period from January 1, 2016 through December 15, 2016
U.S. Rig Service | Fluid Management Services | Coiled Tubing Services | Fishing and Rental Services | International | Functional Support(2) | Reconciling Eliminations | Total | ||||||||||||||||||||||||
Revenues from external customers | $ | 222,877 | $ | 76,008 | $ | 30,569 | $ | 55,790 | $ | 14,179 | $ | — | $ | — | $ | 399,423 | |||||||||||||||
Intersegment revenues | 922 | 934 | 73 | 4,958 | 284 | — | (7,171 | ) | — | ||||||||||||||||||||||
Depreciation and amortization | 56,241 | 22,583 | 10,730 | 26,547 | 6,497 | 8,698 | — | 131,296 | |||||||||||||||||||||||
Impairment expense | — | — | — | — | 44,646 | — | — | 44,646 | |||||||||||||||||||||||
Other operating expenses | 206,094 | 91,361 | 39,161 | 55,651 | 22,262 | 111,553 | — | 526,082 | |||||||||||||||||||||||
Operating loss | (39,458 | ) | (37,936 | ) | (19,322 | ) | (26,408 | ) | (59,226 | ) | (120,251 | ) | — | (302,601 | ) | ||||||||||||||||
Reorganization items, net | 262,455 | 9,374 | (52,094 | ) | 76,918 | 377 | (542,601 | ) | — | (245,571 | ) | ||||||||||||||||||||
Interest expense, net of amounts capitalized | — | — | — | — | — | 74,320 | — | 74,320 | |||||||||||||||||||||||
Income (loss) before taxes | (301,647 | ) | (48,014 | ) | 32,891 | (103,474 | ) | (59,773 | ) | 351,110 | — | (128,907 | ) | ||||||||||||||||||
Long-lived assets(1) | 173,762 | 95,848 | 24,944 | 96,692 | 1,252 | 142,704 | (108,449 | ) | 426,753 | ||||||||||||||||||||||
Total assets | 1,350,566 | 227,749 | 106,760 | 462,759 | 62,520 | (1,274,533 | ) | (272,199 | ) | 663,622 | |||||||||||||||||||||
Capital expenditures | 1,477 | 2,950 | 110 | 3,005 | 711 | 228 | — | 8,481 | |||||||||||||||||||||||
Predecessor company as of and for the year ended December 31, 2015
U.S. Rig Service | Fluid Management Services | Coiled Tubing Services | Fishing and Rental Services | International | Functional Support(2) | Reconciling Eliminations | Total | ||||||||||||||||||||||||
Revenues from external customers | $ | 377,131 | $ | 153,153 | $ | 89,823 | $ | 121,883 | $ | 50,336 | $ | — | $ | — | $ | 792,326 | |||||||||||||||
Intersegment revenues | 813 | 1,393 | 4 | 5,988 | 4,256 | 1,264 | (13,718 | ) | — | ||||||||||||||||||||||
Depreciation and amortization | 59,515 | 28,138 | 21,593 | 34,662 | 23,872 | 12,491 | — | 180,271 | |||||||||||||||||||||||
Impairment expense | 297,719 | 24,479 | 133,795 | 180,974 | 85,129 | — | — | 722,096 | |||||||||||||||||||||||
Other operating expenses | 327,836 | 144,020 | 89,603 | 103,659 | 123,871 | 128,279 | — | 917,268 | |||||||||||||||||||||||
Operating loss | (307,939 | ) | (43,484 | ) | (155,168 | ) | (197,412 | ) | (182,536 | ) | (140,770 | ) | — | (1,027,309 | ) | ||||||||||||||||
Interest expense, net of amounts capitalized | — | — | — | — | 57 | 73,790 | — | 73,847 | |||||||||||||||||||||||
Loss before taxes | (307,899 | ) | (43,402 | ) | (155,154 | ) | (197,325 | ) | (185,306 | ) | (221,464 | ) | — | (1,110,550 | ) | ||||||||||||||||
Long-lived assets(1) | 492,906 | 133,553 | 54,156 | 129,204 | 48,538 | 186,211 | (137,196 | ) | 907,372 | ||||||||||||||||||||||
Total assets | 1,325,591 | 267,466 | 138,177 | 468,214 | 185,342 | (643,226 | ) | (413,766 | ) | 1,327,798 | |||||||||||||||||||||
Capital expenditures | 14,356 | 6,509 | 4,621 | 8,581 | 2,881 | 3,860 | — | 40,808 | |||||||||||||||||||||||
(1) | Long-lived assets include: fixed assets, goodwill, intangibles and other assets. |
(2) | Functional Support is geographically located in the United States. |
89
Key Energy Services, Inc. and Subsidiaries
NOTES TO CONSOLIDATED FINANCIAL STATEMENTS — (Continued)
NOTE 25. UNAUDITED QUARTERLY RESULTS OF OPERATIONS
The following table presents our summarized, unaudited quarterly information for the two most recent years covered by these consolidated financial statements (in thousands, except for per share data):
Successor | |||||||||||||||
Quarter Ended | |||||||||||||||
March 31 | June 30 | September 30 | December 31 | ||||||||||||
Year Ended December 31, 2017: | |||||||||||||||
Revenues | $ | 101,452 | $ | 107,780 | $ | 110,653 | $ | 116,280 | |||||||
Direct operating expenses | 87,306 | 63,560 | 87,115 | 94,351 | |||||||||||
Net loss | (46,859 | ) | (13,183 | ) | (38,220 | ) | (22,327 | ) | |||||||
Loss per share(1): | |||||||||||||||
Basic and diluted | (2.33 | ) | (0.66 | ) | (1.90 | ) | (1.11 | ) | |||||||
Predecessor | Successor | |||||||||||||||||||
Quarter Ended | Period from October 1, 2016 through December 15 | Period from December 16, 2016 through December 31 | ||||||||||||||||||
March 31 | June 30 | September 30 | ||||||||||||||||||
Year Ended December 31, 2016: | ||||||||||||||||||||
Revenues | $ | 111,088 | $ | 95,012 | $ | 102,406 | $ | 90,917 | $ | 17,830 | ||||||||||
Direct operating expenses | 90,598 | 89,419 | 96,071 | 86,737 | 16,603 | |||||||||||||||
Net income (loss) | (81,614 | ) | (92,802 | ) | (130,752 | ) | 173,432 | (10,244 | ) | |||||||||||
Income (loss) per share(1): | ||||||||||||||||||||
Basic and Diluted | (0.51 | ) | (0.58 | ) | (0.81 | ) | 1.08 | (0.51 | ) | |||||||||||
(1) | Quarterly earnings per common share are based on the weighted average number of shares outstanding during the quarter, and the sum of the quarters may not equal annual earnings per common share. |
90
Key Energy Services, Inc. and Subsidiaries
NOTES TO CONSOLIDATED FINANCIAL STATEMENTS — (Continued)
NOTE 26. CONDENSED CONSOLIDATING FINANCIAL STATEMENTS
The senior notes of the Predecessor Company were registered securities. As a result of these registered securities, we are required to present the following condensed consolidating financial information pursuant to SEC Regulation S-X Rule 3-10, “Financial Statements of Guarantors and Issuers of Guaranteed Securities Registered or Being Registered.” Our ABL Facility and Term Loan Facility of the Successor Company are not registered securities, so the presentation of condensed consolidating financial information is not required for the Successor period. The following is our condensed consolidated statement of operations and statement of cash flows for the Predecessor periods (in thousands):
CONDENSED CONSOLIDATING STATEMENTS OF OPERATIONS
(in thousands)
Period from January 1, 2016 through December 15, 2016 | |||||||||||||||||||
Parent Company | Guarantor Subsidiaries | Non-Guarantor Subsidiaries | Eliminations | Consolidated | |||||||||||||||
Revenues | $ | — | $ | 387,291 | $ | 15,121 | $ | (2,989 | ) | 399,423 | |||||||||
Direct operating expense | — | 353,152 | 10,963 | (1,290 | ) | 362,825 | |||||||||||||
Depreciation and amortization expense | — | 129,364 | 1,932 | — | 131,296 | ||||||||||||||
General and administrative expense | 1,225 | 155,097 | 8,601 | (1,666 | ) | 163,257 | |||||||||||||
Impairment expense | — | 44,646 | — | — | 44,646 | ||||||||||||||
Operating loss | (1,225 | ) | (294,968 | ) | (6,375 | ) | (33 | ) | (302,601 | ) | |||||||||
Reorganization items, net | (560,058 | ) | 313,691 | 377 | 419 | (245,571 | ) | ||||||||||||
Interest expense, net of amounts capitalized | 74,320 | — | — | — | 74,320 | ||||||||||||||
Other (income) expense, net | 9,337 | (11,607 | ) | (553 | ) | 380 | (2,443 | ) | |||||||||||
Income (loss) before income taxes | 475,176 | (597,052 | ) | (6,199 | ) | (832 | ) | (128,907 | ) | ||||||||||
Income tax (expense) benefit | (6,484 | ) | 15,095 | (11,859 | ) | 419 | (2,829 | ) | |||||||||||
Net income (loss) | $ | 468,692 | $ | (581,957 | ) | $ | (18,058 | ) | $ | (413 | ) | $ | (131,736 | ) | |||||
CONDENSED CONSOLIDATING STATEMENTS OF OPERATIONS
(in thousands)
Year Ended December 31, 2015 | |||||||||||||||||||
Parent Company | Guarantor Subsidiaries | Non-Guarantor Subsidiaries | Eliminations | Consolidated | |||||||||||||||
Revenues | $ | — | $ | 751,923 | $ | 52,567 | $ | (12,164 | ) | $ | 792,326 | ||||||||
Direct operating expense | — | 667,551 | 52,616 | (5,530 | ) | 714,637 | |||||||||||||
Depreciation and amortization expense | — | 170,574 | 9,697 | — | 180,271 | ||||||||||||||
General and administrative expense | 803 | 193,241 | 15,197 | (6,610 | ) | 202,631 | |||||||||||||
Impairment expense | — | 643,250 | 78,846 | — | 722,096 | ||||||||||||||
Operating loss | (803 | ) | (922,693 | ) | (103,789 | ) | (24 | ) | (1,027,309 | ) | |||||||||
Interest expense, net of amounts capitalized | 73,791 | — | 56 | — | 73,847 | ||||||||||||||
Other (income) expense, net | (2,318 | ) | 10,278 | 1,325 | 109 | 9,394 | |||||||||||||
Loss before income taxes | (72,276 | ) | (932,971 | ) | (105,170 | ) | (133 | ) | (1,110,550 | ) | |||||||||
Income tax (expense) benefit | 234,142 | (44,629 | ) | 3,336 | — | 192,849 | |||||||||||||
Net income (loss) | $ | 161,866 | $ | (977,600 | ) | $ | (101,834 | ) | $ | (133 | ) | $ | (917,701 | ) | |||||
91
Key Energy Services, Inc. and Subsidiaries
NOTES TO CONSOLIDATED FINANCIAL STATEMENTS — (Continued)
CONDENSED CONSOLIDATING STATEMENTS OF CASH FLOWS
(in thousands)
Period from January 1, 2016 through December 15, 2016 | |||||||||||||||||||
Parent Company | Guarantor Subsidiaries | Non-Guarantor Subsidiaries | Eliminations | Consolidated | |||||||||||||||
Net cash provided by (used in) operating activities | $ | — | $ | (139,713 | ) | $ | 1,264 | $ | — | $ | (138,449 | ) | |||||||
Cash flows from investing activities: | |||||||||||||||||||
Capital expenditures | — | (8,134 | ) | (347 | ) | — | (8,481 | ) | |||||||||||
Intercompany notes and accounts | — | 122,798 | — | (122,798 | ) | — | |||||||||||||
Other investing activities, net | — | 15,025 | — | — | 15,025 | ||||||||||||||
Net cash provided by (used in) investing activities | — | 129,689 | (347 | ) | (122,798 | ) | 6,544 | ||||||||||||
Cash flows from financing activities: | |||||||||||||||||||
Repayment of long-term debt | (313,424 | ) | — | — | — | (313,424 | ) | ||||||||||||
Proceeds from long-term debt | 250,000 | — | — | — | 250,000 | ||||||||||||||
Proceeds from stock rights offering | 109,082 | — | — | — | 109,082 | ||||||||||||||
Restricted cash | (24,692 | ) | — | — | — | (24,692 | ) | ||||||||||||
Payment of deferred financing costs | (2,040 | ) | — | — | — | (2,040 | ) | ||||||||||||
Intercompany notes and accounts | (122,798 | ) | — | — | 122,798 | — | |||||||||||||
Other financing activities, net | (167 | ) | — | — | — | (167 | ) | ||||||||||||
Net cash provided by (used in) financing activities | (104,039 | ) | — | — | 122,798 | 18,759 | |||||||||||||
Effect of changes in exchange rates on cash | — | — | (20 | ) | — | (20 | ) | ||||||||||||
Net increase (decrease) in cash and cash equivalents | (104,039 | ) | (10,024 | ) | 897 | — | (113,166 | ) | |||||||||||
Cash and cash equivalents at beginning of period | 191,065 | 10,024 | 3,265 | — | 204,354 | ||||||||||||||
Cash and cash equivalents at end of period | $ | 87,026 | $ | — | $ | 4,162 | $ | — | $ | 91,188 | |||||||||
92
Key Energy Services, Inc. and Subsidiaries
NOTES TO CONSOLIDATED FINANCIAL STATEMENTS — (Continued)
CONDENSED CONSOLIDATING STATEMENTS OF CASH FLOWS
(in thousands)
Year Ended December 31, 2015 | |||||||||||||||||||
Parent Company | Guarantor Subsidiaries | Non-Guarantor Subsidiaries | Eliminations | Consolidated | |||||||||||||||
Net cash used in operating activities | $ | — | $ | (19,878 | ) | $ | (2,508 | ) | $ | — | $ | (22,386 | ) | ||||||
Cash flows from investing activities: | |||||||||||||||||||
Capital expenditures | — | (39,566 | ) | (1,242 | ) | — | (40,808 | ) | |||||||||||
Intercompany notes and accounts | — | 47,613 | — | (47,613 | ) | — | |||||||||||||
Other investing activities, net | — | 21,405 | — | — | 21,405 | ||||||||||||||
Net cash provided by (used in) investing activities | — | 29,452 | (1,242 | ) | (47,613 | ) | (19,403 | ) | |||||||||||
Cash flows from financing activities: | |||||||||||||||||||
Repayments of long-term debt | (1,575 | ) | — | — | — | (1,575 | ) | ||||||||||||
Proceeds from long term debt | 305,550 | — | — | — | 305,550 | ||||||||||||||
Proceeds from borrowings on revolving credit facility | 130,000 | — | — | — | 130,000 | ||||||||||||||
Repayments on revolving credit facility | (200,000 | ) | — | — | — | (200,000 | ) | ||||||||||||
Payment of deferred financing cost | (11,461 | ) | — | — | — | (11,461 | ) | ||||||||||||
Repurchases of common stock | (362 | ) | — | — | — | (362 | ) | ||||||||||||
Intercompany notes and accounts | (47,613 | ) | — | — | 47,613 | — | |||||||||||||
Other financing activities, net | (3,423 | ) | — | — | — | (3,423 | ) | ||||||||||||
Net cash provided by financing activities | 171,116 | — | — | 47,613 | 218,729 | ||||||||||||||
Effect of changes in exchange rates on cash | — | — | 110 | — | 110 | ||||||||||||||
Net increase (decrease) in cash and cash equivalents | 171,116 | 9,574 | (3,640 | ) | — | 177,050 | |||||||||||||
Cash and cash equivalents at beginning of period | 19,949 | 450 | 6,905 | — | 27,304 | ||||||||||||||
Cash and cash equivalents at end of period | $ | 191,065 | $ | 10,024 | $ | 3,265 | $ | — | $ | 204,354 | |||||||||
93
ITEM 9. CHANGES IN AND DISAGREEMENTS WITH ACCOUNTANTS ON ACCOUNTING AND FINANCIAL DISCLOSURE
None.
ITEM 9A. CONTROLS AND PROCEDURES
Disclosure Controls and Procedures
We maintain a set of disclosure controls and procedures that are designed to provide reasonable assurance that information required to be disclosed in our reports filed under the Securities Exchange Act of 1934 (the “Exchange Act”) is recorded, processed, summarized, and reported within the time periods specified in the SEC’s rules and forms. Disclosure controls and procedures include, without limitation, controls and procedures designed to ensure that information required to be disclosed by us in the reports that we file or submit under the Exchange Act is accumulated and communicated to our management, including our principal executive officer and principal financial officer, as appropriate to allow timely decisions regarding required disclosure.
Our management, with the participation of our principal executive officer and principal financial officer, has evaluated the effectiveness of our disclosure controls and procedures (as such term is defined in Rules 13a-15(e) and 15d-15(e) under the Exchange Act) as of the end of the period covered by this report. Based on such evaluation, our principal executive and financial officers have concluded that our disclosure controls and procedures were effective as of the end of such period.
Management’s Report on Internal Control Over Financial Reporting
Management is responsible for establishing and maintaining adequate internal control over financial reporting. Internal control over financial reporting is a process designed to provide reasonable assurance regarding the reliability of financial reporting and the preparation of financial statements for external purposes in accordance with generally accepted accounting principles. Internal control over financial reporting includes those policies and procedures that (i) pertain to the maintenance of records that, in reasonable detail, accurately and fairly reflect our transactions and dispositions of our assets; (ii) provide reasonable assurance that transactions are recorded as necessary to permit preparation of financial statements in accordance with generally accepted accounting principles, and that our receipts and expenditures are being made only in accordance with authorizations of our management and directors; and (iii) provide reasonable assurance regarding prevention or timely detection of unauthorized acquisition, use, or disposition of our assets that could have a material effect on the financial statements.
Internal control over financial reporting cannot provide absolute assurance of achieving financial reporting objectives because of its inherent limitations. Internal control over financial reporting is a process that involves human diligence and compliance and is subject to lapses in judgment and breakdowns resulting from human failures. Internal control over financial reporting can also be circumvented by collusion or improper management override. Because of such limitations, there is a risk that material misstatements may not be prevented or detected on a timely basis by internal control over financial reporting. Also, projections of any evaluation of effectiveness to future periods are subject to the risk that controls may become inadequate because of changes in conditions, or that the degree of compliance with the policies or procedures may deteriorate. However, these inherent limitations are known features of the financial reporting process. Therefore, it is possible to design into the process safeguards to reduce, though not eliminate, this risk.
A material weakness (as defined in Rule 12b-2 under the Exchange Act) is a deficiency, or combination of deficiencies, in internal control over financial reporting such that there is a reasonable possibility that a material misstatement of the annual or interim financial statements will not be prevented or detected on a timely basis.
Management conducted an assessment of the effectiveness of our internal control over financial reporting as of December 31, 2017. In making this assessment, management used the criteria described in 2013 Internal Control — Integrated Framework issued by the Committee of Sponsoring Organizations of the Treadway Commission. Based on this assessment, management concluded that our internal control over financial reporting was effective as of December 31, 2017.
Our internal control over financial reporting has been audited by Grant Thornton LLP, an independent registered public accounting firm, as stated in their report included herein.
Changes in Internal Control Over Financial Reporting
There were no changes in our internal control over financial reporting during our last fiscal quarter of 2017, that materially affected, or are reasonably likely to materially affect, our internal control over financial reporting.
ITEM 9B. OTHER INFORMATION
Not applicable.
94
PART III
ITEM 10. DIRECTORS, EXECUTIVE OFFICERS AND CORPORATE GOVERNANCE
Board of Directors
Following the Company’s emergence from bankruptcy, pursuant to the Plan, the Board consists of ten members including five directors appointed by Soter (each such director, a “Soter Director”), two directors appointed by certain other former creditors of the Company (each such director, an “Other Director,” and such former creditors, the “Other Parties”), and three independent directors (as such term is defined in NYSE Rule 303A), one of which was appointed by Soter, another of which was appointed by the Other Parties, and another of which was appointed by mutual agreement of Soter and the Other Parties. These directors will serve for the Initial Board Term, which commenced on the Effective Date and will conclude upon the election of directors at the 2019 annual stockholders meeting.
Three of the directors selected by Soter hold two votes each on matters presented to the Board (subject to certain exceptions), and the directors selected by Soter collectively hold votes that constitute a majority of all votes held by directors. As a result, subject to certain approval rights held by directors selected by the Other Parties, the Soter Directors control decisions made by the Board, and the Company is considered to be a “Controlled Company” for purposes of the New York Stock Exchange (“NYSE”) Rule 303A.
Below is the name, age, number of votes and certain other information of each member of our Board, including information regarding the positions each director holds, his or her principal occupation and business experience for the past five years and the names of other publicly held companies of which he or she currently serves as a director or has served as a director during the past five years. In addition to the information presented below regarding each director’s specific experience, qualifications, attributes and skills that led our Board to the conclusion that he or she should serve as a director, we also believe that all of our directors exhibit high standards of integrity, honesty and ethical values.
Jacob Kotzubei, age 49, Mr. Kotzubei joined Platinum Equity in 2002 and is a Partner at the firm and a member of the firm’s Investment Committee. Mr. Kotzubei serves as an officer and/or director of a number of Platinum’s portfolio companies. Prior to joining Platinum in 2002, Mr. Kotzubei worked for 4 1/2 years for Goldman Sachs’ Investment Banking Division in New York City. Previously, he was an attorney at Sullivan & Cromwell LLP in New York City, specializing in mergers and acquisitions. Mr. Kotzubei received a Bachelor’s degree from Wesleyan University and holds a Juris Doctor from Columbia University School of Law where he was elected a member of the Columbia Law Review. Mr. Kotzubei’s experience in executive management oversight, private equity, capital markets and transactional matters has led the Board to conclude that he has the varied expertise necessary to serve as a director of the Company. Mr. Kotzubei is a Soter Director and holds two votes on matters presented to the Board. Mr. Kotzubei is also currently a director of Ryerson Holdings Corporation ("Ryerson"), a metal supplier and fabricating company and Kemet Corporation, a global manufacturer of passive electronic components. Mr. Kotzubei served as a director of CanWel Building Materials Group until April 11, 2016.
Philip E. Norment, age 58, Mr. Norment is a partner at Platinum Equity and a member of Platinum Equity’s Investment Committee and is a senior advisor on specific operational initiatives throughout the portfolio. He is also the senior operations executive responsible for evaluating acquisition opportunities and integrating new acquisitions into the portfolio. Prior to joining Platinum Equity in 1997, Mr. Norment served in a variety of management positions at Pilot Software, Inc. Over the course of 12 years he worked in the areas of global support, operations, consultative services and sales support, achieving the position of Chief Operating Officer. Mr. Norment earned a Bachelor’s degree in Economics and an MBA from the University of Massachusetts, Amherst. Mr. Norment’s experience in executive management oversight, private equity and transactional matters has led the Board to conclude that he has the varied expertise necessary to serve as a director of the Company. Mr. Norment is a Soter Director and holds two votes on matters presented to the Board. Mr. Norment is also a director of Ryerson.
Mary Ann Sigler, age 63, Ms. Sigler is the Chief Financial Officer of Platinum Equity. Ms. Sigler joined Platinum Equity in 2004 and is responsible for overall accounting, tax, and financial reporting as well as managing strategic planning projects for the firm. Prior to joining Platinum Equity, Ms. Sigler was with Ernst & Young LLP for 25 years where she was a partner. Ms. Sigler is a member of the board of Ryserson where she has served since January of 2010. Ms. Sigler also served as an acting Vice President of Ryerson from July 2007 through August 2014. Ms. Sigler has a B.A. in Accounting from California State University Fullerton and a Masters in Business Taxation from the University of Southern California. Ms. Sigler is a Certified Public Accountant in California, as well as a member of the American Institute of Certified Public Accountants and the California Society of Certified Public Accountants. Ms. Sigler’s experience in accounting and strategic planning matters has led the Board to conclude that she has the requisite qualifications to serve as a director of the Company and facilitate its continued growth. Ms. Sigler is a Soter Director and holds one vote on matters presented to the Board.
Bryan Kelln, age 52, Mr. Kelln is a Partner at Platinum Equity and the President of Portfolio Operations, a group responsible for overseeing business strategy and operations at Platinum Equity's portfolio companies. Mr. Kelln joined Platinum in 2008. He
95
works closely with the firm's Operations Team and portfolio company executive management to drive strategic initiatives and to deploy operational resources. Prior to joining Platinum Equity, Mr. Kelln held senior operations roles at a number of companies including Nortek, Inc., Jacuzzi, Inc., RockShox, Inc. and General Cable Corporation. During a portion of this time, Mr. Kelln was an Operating Executive with The Jordan Company, a private investment firm, where he was involved in acquisitions, divestitures and operations for the firm and served as a board member of various portfolio companies. Mr. Kelln also previously served as a Partner in the Supply Chain Management Practice of Mercer Management Consulting. Mr. Kelln received his bachelor’s degree, summa cum laude, from Washington State University and a Masters of Business Administration from The Ohio State University, Fisher College of Business. Mr. Kelln’s experience as a seasoned executive with a strong track record of conceiving and executing successful strategic and operational transformation programs across a broad range of different industries and his unique combination of financial, management and transactional expertise has led the Board to conclude that he has the requisite qualifications to serve as a director of the Company. Mr. Kelln is a Soter Director and holds two votes on matters presented to the Board.
Robert Drummond, age 57, Mr. Drummond is Key’s President and Chief Executive Officer. He joined the Company in June 2015 as President and Chief Operating Officer and has been a member of the Board of Directors since November 2015. Prior to joining the Company, Mr. Drummond served for 31 years at Schlumberger Limited, where he held various executive positions including President North America, Vice President of General Manager US Land, Vice President of Global Sales, Vice President General Manager US Gulf of Mexico, and President North American Offshore and Alaska. Mr. Drummond has been a Supervisory Director at Frank's International N.V. since May 19, 2017. He currently sits on the board of directors of the Petroleum Equipment Suppliers Association and resigned in January 2017 as a member of the board of directors of the National Ocean Industries Association. Previously, he served on the board of directors of Houston Offshore Energy Center, Greater Houston Partnership, and as Advisory Board Member of the University of Houston Global Energy Management Institute. Mr. Drummond received a Bachelor’s degree in Mineral/Petroleum Engineering from the University of Alabama in 1983 and sits on their College of Engineering Leadership Board. Mr. Drummond’s successful operational and industry experience has led the Board to conclude that he has the varied expertise necessary to serve as a director of the Company. Mr. Drummond is a Soter Director and holds one vote on matters presented to the Board.
Sherman K. Edmiston III, age 55, Mr. Edmiston is a senior restructuring executive and has over 20 years of experience working with companies in transition. Mr. Edmiston was a Partner and Managing Director at Zolfo Cooper LLC from November 2009 until December 2015. Mr. Edmiston served as Chief Restructuring Officer of Xinergy, Ltd, a Central Appalachian producer of thermal and metallurgical coal, and previously served as Chairman of the Finance and Transaction committee of JL French Automotive Castings, Inc. Mr. Edmiston currently serves on the board of directors of Arch Coal, Inc. Mr. Edmiston received his B.S. in mechanical Engineering from Arizona State University and his MBA from the University of Michigan. Mr. Edmiston’s experience as a director of other public companies, including those undergoing significant transitions and his qualification as an “audit committee financial expert”, led the Board to conclude that he has the expertise necessary to serve as a director of the Company. Mr. Edmiston is an Other Director and holds one vote on matters presented to the Board.
Scott D. Vogel, age 42, Mr. Vogel is the Managing Member at Vogel Partners LLC, a private investment firm, after serving as Managing Director at Davidson Kempner Capital Management investing in distressed debt securities. Previously, Vogel worked at MFP Investors, investing in special situations and turnaround opportunities for the private investment firm of Michael F. Price, and at Chase Securities in its investment banking group. Vogel has served on numerous boards during his career and is currently a member of the board of Arch Coal, Avaya, Bonanza Creek Energy, and several private companies. Mr. Vogel is a member of the Olin Alumni Board of Washington University and a member of the Advisory Board of Grameen America. Mr. Vogel received his M.B.A. from The Wharton School at the University of Pennsylvania and his B.S.B.A. from Washington University. Mr. Vogel contributes to the mix of experience and qualifications the Board seeks to maintain primarily through his executive management oversight, finance and capital markets, human resources and compensation, and strategic planning experiences. Mr. Vogel is an Other Director and holds one vote on matters presented to the Board.
Steven H. Pruett, age 56, Mr. Pruett is the President and Chief Executive Officer of Elevation Resources LLC, a Permian Basin focused exploration and production company which he co-founded in 2013. Mr. Pruett was previously senior vice president of corporate development of Concho Resources between 2012 and 2013. He co-founded and served as president and CFO of Legacy Reserves LP, a public MLP, from 2005 to 2012. Mr. Pruett has over 30 years of oil and gas operating, financial and management experience, most of which has been in the Permian Basin. Prior to forming Legacy Reserves, Mr. Pruett was a venture partner with Quantum Energy Partners and was President of Petroleum Place and P2 Energy Solutions. He previously served as president and CEO of First Permian, founded and was president and CEO of First Reserve Oil & Gas Co, and served as a Vice President for First Reserve Corporation originating upstream equity investments. Mr. Pruett began his career as a petroleum engineer for ARCO Oil & Gas and worked in planning and business development for Amoco Production Company. Mr. Pruett received his B.S. in Petroleum Engineering from the University of Texas and graduated with an MBA from the Harvard Business School. Mr. Pruett’s successful operating, financial, management and industry experience and his qualification as an "audit committee financial expert", has led the Board to conclude he has the expertise necessary to serve as a director of the Company. Mr. Pruett is an independent director appointed by the Other Parties and holds one vote on matters presented to the Board.
96
C. Christopher Gaut, age 61, Mr. Gaut is the Chairman of Forum Energy Technologies ("Forum"), a position he has held since May 2017. He has also served as a director of Forum since December 2006, as Chairman and Chief Executive Officer from August 2010 through May 2017 and as the President from August 2010 through May 18, 2016. In addition, he is an industry adviser to SCF Partners and he served as Managing Director of SCF Partners from October 2009 until August 2010.Mr. Gaut served as the President of Drilling & Evaluation Division of Halliburton Company ("Halliburton") from January 2008 to April 8, 2009 and as an Executive Vice President and CFO of Halliburton from March 2003 to December 31, 2007. Prior to joining Halliburton in 2003, he served as Member of Office of the President and Chief Operating Officer at Ensco plc from January, 2002 to February 2003. Mr. Gaut also served as Senior Vice President and Chief Financial Officer of Ensco plc from December 1987 to February 2003. Prior to joining Ensco plc, he was a Partner in Pacific Asset Capital. He began his career with Amoco Corporation in 1980 and served in various financial management positions. He has also served as a non-executive director of Ensco plc since May 2008, and as a non-executive director of EOG Resources since October 2017. Mr. Gaut received his Bachelor of Arts degree in Engineering from Dartmouth College and an M.B.A. from the Wharton School of Business at the University of Pennsylvania. Mr. Gaut’s financial and operations management expertise and industry experience and his qualification as an "audit committee financial expert", has led the Board to conclude that he has the skills necessary to serve as a director of the Company. Mr. Gaut is an independent director appointed by mutual agreement of Soter and the Other Parties and holds one vote on matters presented to the Board.
H.H. “Tripp” Wommack, III, age 62, Mr. Wommack is currently the Chairman, President and Chief Executive Officer of Anchor Energy Resources, LLC, an oil and gas company that focuses on acquisition and exploration efforts in the Permian Basin of West Texas and Southeast New Mexico. Mr. Wommack has served in this position since July 2016. In addition, Mr. Wommack serves as the Chairman of Cibolo Creek Partners, LLC, which specializes in commercial real estate investments, a position he has held since January 1993. Mr. Wommack also serves as Chairman, CEO, and President of Warrior Technologies, LLC, which is involved in tank bottom cleaning in the Permian Basin of West Texas and Southeastern New Mexico, and as Chairman and Chief Executive Officer of Pyote Well Service, a company which serves as managing member and operator for a number of salt water disposal wells in the Permian Basin in west Texas and southeastern New Mexico and in the Eagleford area of south Texas. Mr. Wommack previously served as Chairman, President and Chief Executive Officer of Southwest Royalties, Inc. from August 1983 to August 2004 and Saber Resources from July 2004 until August 2008. Mr. Wommack also served as a member of the board and President of Pyote Water Solutions from 2010 until 2017. Additionally, Mr. Wommack served on the board of directors of C&J Energy Services, Inc. from March 2015 through December 2016. Additionally, Mr. Wommack was the founder, Chairman and Chief Executive Officer of Basic Energy Services (formerly Sierra Well Services, Inc.), and following its initial public offering, Mr. Wommack continued to serve on the board of directors of Basic Energy Services through June 2009. Mr. Wommack graduated with a B.A. from the University of North Carolina, Chapel Hill, and earned a J.D. from the University of Texas. Mr. Wommack was selected as a director because of his extensive executive-level management experience and proven leadership and business capabilities in the oil and gas industry and his qualification as an "audit committee financial expert". Additionally, Mr. Wommack’s knowledge and experience from serving as chairman and chief executive officer of a company that went through an initial public offering adds a unique and valuable perspective to the Company as a public company. Mr. Wommack is an independent director appointed by Soter and holds one vote on matters presented to the Board.
Involvement in Certain Legal Proceedings
There have been no known events under any bankruptcy act, no criminal proceedings and no judgments, injunctions, orders or decrees material to the evaluation of the ability and integrity of any director, executive officer, promoter or control person of the Company during the past ten years.
General
This section describes our principal corporate governance guidelines and practices. Complete copies of our Corporate Governance Guidelines, committee charters and codes of business conduct described below are available on our website at www.keyenergy.com. You can also request a copy of any of these documents by writing to: Investor Relations, Key Energy Services, Inc., 1301 McKinney Street, Suite 1800, Houston, Texas 77010. Our Board strongly believes that good corporate governance is important to ensure that Key is managed for the long-term benefit of our stockholders.
Corporate Governance Guidelines
Our Board has adopted Corporate Governance Guidelines that address significant issues of corporate governance and set forth the procedures by which the Board carries out its responsibilities. Among the areas addressed by the Corporate Governance Guidelines are director qualifications and responsibilities, Board committee responsibilities, director compensation and tenure, director orientation and continuing education, access to management and independent advisors, succession planning and management development, and Board and committee performance evaluations. The nominating and governance committee (the
97
“NGC”) is responsible for assessing and periodically reviewing the adequacy of these guidelines and recommending proposed changes to the Board, as appropriate. The Corporate Governance Guidelines are posted on our website at www.keyenergy.com. We will provide these guidelines in print, free of charge, to stockholders who request them.
Director Independence
As stated above, because the Company currently qualifies as a “Controlled Company” under the NYSE Rule 303A we are permitted, and have elected, to opt out of the NYSE rules that would otherwise require our Board to be comprised of a majority of independent directors and require our compensation committee and NGC to be comprised entirely of independent directors. However, all members of our audit committee meet the independence requirements set forth in the rules of the NYSE and SEC and all members of our subcommittee of the compensation committee meet the independence requirements set forth in the rules of the NYSE and SEC. Under applicable rules of the NYSE, a director will only qualify as “independent” if our Board affirmatively determines that he or she has no direct or indirect material relationship with Key.
The Board has determined that, except for Mr. Drummond, who serves as our President and Chief Executive Officer (“CEO”), and Messrs. Norment, Kotzubei and Kelln and Ms. Sigler, each of our current directors is independent within the meaning of the foregoing rules, including Messrs. Edmiston, Vogel, Gaut, Pruett and Wommack. The Board also considered Mr. Gaut’s position as a former executive officer of Forum, one of our equipment suppliers, and determined that the relationship between Forum and Key does not affect Mr. Gaut’s independence. For additional information regarding the relationships of Mr. Gaut, see the discussion below under the heading “Certain Relationships and Related Party Transactions.”
Board Leadership Structure
Our Board consists of Mr. Norment, the Chairman, and nine other directors. Our Corporate Governance Guidelines provide that non-employee directors will meet in executive session on a regular basis without management present. The Chairman presides at all meetings of the Board, as well as executive sessions of non-employee directors and, in consultation with the CEO, non-employee directors and management, establishes the agenda for each Board meeting. In the event that the non-management directors include directors who are not independent under the listing requirements of the NYSE, as is currently the case, our Corporate Governance Guidelines provide that at least once a year, there shall be an executive session including only independent directors and the director who presides at these meetings (the “Lead Director”) shall be chosen by the Board based on the recommendation of the NGC. The Board has appointed Mr. Gaut as Lead Director. The Board has also delegated certain matters to its certain committees. Mr. Drummond, as the Company’s President, CEO and Director, works in concert with the rest of our Board to oversee the execution of the Company’s strategy.
Director Nomination Process
Pursuant to the Plan and our certificate of incorporation and bylaws, during the Initial Board Term, directors were appointed by Soter and the Other Parties, as described in “Board of Directors” above.
Following the Initial Board Term, for as long as our Series A Preferred Stock is outstanding, the Board will consist of nine members, five of whom will be nominated and elected by Soter as the holder of our Series A Preferred Stock and four of whom will be nominated by the Board and elected by holders of our common stock. Upon the cancellation of the Series A Preferred Stock, the holder of the Series A Preferred Stock will no longer have the right to nominate any directors. At the first annual meeting following the cancellation of the Series A Preferred Stock, the then-current Board will nominate their successors, and the stockholders of the Company will elect the directors.
The NGC is responsible for identifying individuals who are qualified to become Board members following the Initial Board Term, provided that Soter, and not the NGC, will identify any individuals whom Soter will nominate and elect to the Board. Nominees for directorship are selected by the NGC in accordance with the policies and principles of its charter. Although there is no formal diversity policy, our Board believes that the backgrounds and qualifications of its directors, considered as a group, should provide a composite mix of experience, knowledge and abilities that will allow it to fulfill its responsibilities. Pursuant to its charter, the NGC is tasked with recommending director candidates who will assist in achieving this mix of Board members having diverse professional backgrounds and a broad spectrum of knowledge, experience and capability. At least once a year, the NGC will review the size and structure of the Board and its committees, including recommendations on Board committee structure and responsibilities.
In accordance with NYSE requirements, the NGC also oversees an annual performance evaluation process for the Board, the audit committee, the compensation committee and the NGC. In this process, anonymous responses from directors on a number of topics, including matters related to experience of Board and committee members, are discussed in executive sessions at Board
98
and committee meetings. Although the effectiveness of the policy to consider diversity of director nominees has not been separately assessed, it is within the general subject matter covered in the NGC’s annual assessment and review of Board and committee structure and responsibilities, as well as within the Board and committee annual performance evaluation process.
Board Role in Risk Oversight
The Board’s role in the risk oversight process includes receiving regular reports from members of senior management on areas of material risk to Key, including operational, financial, legal and regulatory, and strategic and reputational risks. The full Board (or the appropriate committee in the case of risks that are under the purview of a particular committee) receives these reports from the appropriate “risk owner” within the organization to enable it to understand our risk identification, risk management and risk mitigation strategies. When a committee receives the report, the chair of the relevant committee reports on the discussion to the full Board during the committee reports portion of the next Board meeting. This enables the Board and its committees to coordinate the risk oversight role, particularly with respect to risk interrelationships. In addition, as part of its charter, the audit committee regularly reviews and discusses with management, our internal auditors and our independent registered public accounting firm, Key’s policies relating to risk assessment and risk management. The compensation committee also specifically reviews and discusses risks that relate to compensation policies and practices.
Board Meetings and Attendance
During 2017, the Board held seventeen (17) meetings. Non-management directors meet regularly in executive session. Additionally, management frequently discusses matters with the directors on an informal basis. Each director attended, either in person or by telephone conference, at least 92% of the Board and committee meetings held while serving as a director or committee member in 2017. The Company expects the directors to attend annual meetings of stockholders. Pursuant to the Company’s certificate of incorporation and bylaws, as amended, adopted on the Effective Date, the current Board will serve for the Initial Board Term, which commenced on the Effective Date and will conclude upon the election of directors at the 2019 annual stockholders meeting.
Board Committees
The Board has established three standing committees: the audit committee, the compensation committee, and the NGC. Current copies of the charters of each of these committees are posted in the “Corporate Governance” section of our website, www.keyenergy.com. The compensation committee also has a subcommittee for purposes of Section 16 of the Exchange Act and to approve and grant awards in order for such awards to qualify as performance-based compensation under Section 162(m) of the United States Internal Revenue Code. The subcommittee consists of two directors who both qualify as independent for NYSE purposes. The subcommittee of the compensation committee does not have a charter.
Audit Committee
The current members of our audit committee are Messrs. Edmiston, Gaut, Pruett and Wommack. Mr. Wommack is the chair of the audit committee. The Board has determined that all of the members of the audit committee are independent under the NYSE rules, including the independence requirements contemplated by Rule 10A-3 under the Exchange Act. All members of the audit committee meet the financial literacy standard required by the NYSE rules and each qualify as having accounting or related financial management expertise under the NYSE rules. In addition, as required by the Sarbanes-Oxley Act of 2002, the SEC adopted rules requiring that each public company disclose whether or not its audit committee has an “audit committee financial expert” as a member. An “audit committee financial expert” is defined as a person who, based on his or her experience, satisfies all of the following attributes:
• | an understanding of generally accepted accounting principles and financial statements; |
• | an ability to assess the general application of such principles in connection with the accounting for estimates, accruals and reserves; |
• | experience preparing, auditing, analyzing or evaluating financial statements that present a breadth and level of complexity of accounting issues that are generally comparable to the breadth and level of complexity of issues that can reasonably be expected to be raised by Key’s financial statements, or experience actively supervising one or more persons engaged in such activities; |
• | an understanding of internal control over financial reporting; and |
99
• | an understanding of audit committee functions. |
The Board has determined that all members of the audit committee satisfy the definition of “audit committee financial expert,” and has designated each member of the audit committee as an “audit committee financial expert.” For more information about each audit committee member’s background and experience, see “Board of Directors” above.
Our Board has adopted a written charter for the audit committee, pursuant to which the audit committee has, among others, the following duties and responsibilities:
• | appointing, evaluating, approving the services provided by and the compensation of, and assessing the independence of, our independent registered public accounting firm; |
• | overseeing the work of our independent registered public accounting firm, including through the receipt and consideration of certain reports from such firm; |
• | reviewing with the internal auditors and our independent registered public accounting firm the overall scope and plans for audits, and reviewing with the independent registered public accounting firm any audit problems or difficulties and management’s response; |
• | reviewing and discussing with management and the independent registered public accounting firm our annual and quarterly financial statements and related disclosures; |
• | reviewing and discussing with management and the independent registered public accounting firm our system of internal controls, financial and critical accounting practices and policies relating to risk assessment and risk management; |
• | reviewing the effectiveness of our system for monitoring compliance with laws and regulations; and |
• | preparing the Audit Committee Report required by SEC rules (which is included under the heading “Report of the Audit Committee” below). |
During 2017, the audit committee held six (6) meetings. In addition, members of the audit committee speak regularly with our independent registered public accounting firm and separately with the members of management to discuss any matters that the audit committee or these individuals believe should be discussed, including any significant issues or disagreements concerning our accounting practices or financial statements. For further information, see “Report of the Audit Committee” below.
The audit committee has the authority to retain legal, accounting or other experts that it determines to be necessary or appropriate to carry out its duties. We will provide the appropriate funding, as determined by the audit committee, for the payment of compensation to our independent registered public accounting firm and to any legal, accounting or other experts retained by the audit committee and for the payment of the audit committee’s ordinary administrative expenses necessary and appropriate for carrying out the duties of the audit committee.
The audit committee charter provides that no member of the audit committee may simultaneously serve on the audit committees of more than three public companies (including our audit committee) unless the Board has determined that such simultaneous service would not impair his or her ability to effectively serve on our audit committee. Currently, no member of the audit committee serves on the audit committees of more than three public companies.
The charter of our audit committee can be accessed on the “Corporate Governance” section of our website, www.keyenergy.com.
Compensation Committee
Our compensation committee reviews and recommends policies relating to compensation and benefits of our executive officers and employees, including reviewing and approving corporate goals and objectives relevant to the compensation of chief executive officer and other executive officers, evaluating the performance of those officers in light of those goals and objectives and setting compensation of those officers based on such evaluations. During 2017, the compensation committee met seven (7) times. Because the Company currently qualifies as a “Controlled Company” under the NYSE Rule 303A, we are permitted, and
100
have elected, to opt out of the NYSE rules that would otherwise require our compensation committee to be comprised entirely of independent directors. The compensation committee consists of Messrs. Kelln (chair), Kotzubei, Norment, Vogel and Wommack. The compensation committee also has a subcommittee for purposes of Section 16 of the Exchange Act and to approve and grant awards in order for such awards to qualify as performance-based compensation under Section 162(m) of the United States Internal Revenue Code. The subcommittee consists of Messrs. Vogel and Wommack who both qualify as independent for NYSE purposes. No compensation committee member participates in any of our employee compensation programs other than the Key Energy Services, Inc. 2016 Equity and Cash Incentive Plan.
The compensation committee has responsibility for establishing, implementing and continually monitoring adherence with our compensation philosophy. Our Board has adopted a written charter for the compensation committee, pursuant to which the compensation committee has, among others, the following duties and responsibilities:
• | reviewing and approving corporate goals and objectives relevant to the compensation of the CEO; |
• | evaluating the CEO’s performance in light of corporate goals and objectives and determining and approving the CEO’s compensation level based on this evaluation; |
• | reviewing and approving the compensation of senior executive officers other than the CEO; |
• | reviewing and approving any incentive-compensation plans or equity-based plans; |
• | approving any new equity compensation plan or any material change to an existing plan where stockholder approval has not been obtained; |
• | in consultation with management, overseeing regulatory compliance with respect to compensation matters, including overseeing Key’s policies on structuring compensation programs to preserve tax deductibility; |
• | making recommendations to the Board with respect to any severance or similar termination payments proposed to be made to any current or former senior executive officer or member of senior management of Key; |
• | reviewing any potential conflicts of interest of our compensation consultant; |
• | preparing an annual report of the compensation committee on executive compensation for inclusion in Key’s annual proxy statement or annual report in accordance with applicable SEC rules and regulations; and |
• | reviewing and approving the Compensation Disclosure and Analysis for inclusion in Key’s annual proxy statement or annual report in accordance with applicable SEC rules and regulations. |
The compensation committee has the sole authority to select, retain, terminate and approve the fees and other retention terms of special counsel or other experts or consultants, as it deems appropriate in order to carry out its responsibilities, without seeking approval of the Board or management. With respect to compensation consultants retained to assist in the evaluation of director, CEO or executive officer compensation, this authority is vested solely in the compensation committee.
The charter of our compensation committee can be accessed in the “Corporate Governance” section of our website, www.keyenergy.com.
Nominating and Governance Committee
As stated above, because the Company currently qualifies as a “Controlled Company” under the NYSE Rule 303A, we are permitted, and have elected, to opt out of the NYSE rules that would otherwise require the NGC to be comprised entirely of independent directors. The NGC consists of Ms. Sigler (chair), and Messrs. Drummond, Kelln, Kotzubei and Vogel. During 2017, the NGC met four (4) times. Our Board has adopted a written charter for the NGC, pursuant to which the NGC has, among others, the following duties and responsibilities:
• | identifying and recommending individuals to the Board for nomination as members of the Board and its committees, consistent with criteria approved by the Board; |
• | developing and recommending to the Board corporate governance guidelines applicable to Key; and |
101
• | overseeing the evaluation of the Board and management of Key. |
The NGC has the authority and funding to retain counsel and other experts or consultants, including the sole authority to select, retain and terminate any search firm to be used to identify director candidates and to approve the search firm’s fees and other retention terms.
The charter of our NGC can be accessed in the “Corporate Governance” section of our website, www.keyenergy.com.
Code of Business Conduct and Code of Business Conduct for Members of the Board of Directors
Our Code of Business Conduct applies to all of our employees, including our directors, CEO, Chief Financial Officer, or CFO and senior financial and accounting officers. Among other matters, the Code of Business Conduct establishes policies to deter wrongdoing and to promote both honest and ethical conduct, including ethical handling of actual or apparent conflicts of interest, compliance with applicable laws, rules and regulations, full, fair, accurate, timely and understandable disclosure in public communications and prompt internal reporting of violations of the Code of Business Conduct. We also have an ethics and compliance committee, composed of members of management, which administers our ethics and compliance program with respect to our employees. In addition, we provide an ethics line for reporting any violations on a confidential basis. Copies of our Code of Business Conduct are available in the “Corporate Governance” section of our website at www.keyenergy.com. We will post on our website all waivers to or amendments of our Code of Business Conduct and the Code of Business Conduct for Members of the Board of Directors that are required to be disclosed by applicable law and the NYSE listing standards.
Executive Officers
Below are the names, ages and certain other information on each of our current executive officers, other than Mr. Drummond, whose information is provided above.
J. Marshall Dodson, age 46, Senior Vice President, Chief Financial Officer and Treasurer. Mr. Dodson was appointed Senior Vice President and Chief Financial Officer on March 25, 2013. Mr. Dodson joined Key as Vice President and Chief Accounting Officer on August 22, 2005 and served in that capacity until being appointed Vice President and Treasurer on June 8, 2009. From February 6, 2009, until March 26, 2009, Mr. Dodson served in the additional capacity as interim principal financial officer. Prior to joining Key, Mr. Dodson served in various capacities at Dynegy, Inc., an electric energy production and services company, from 2002 to August 2005, most recently serving as Managing Director and Controller, Dynegy Generation since 2003. Mr. Dodson started his career with Arthur Andersen LLP in Houston, Texas in 1993, serving most recently as a senior manager prior to joining Dynegy, Inc. Mr. Dodson received a BBA from the University of Texas at Austin in 1993. Mr. Dodson also serves as a director for Enduro Resource Partners LLC, a private exploration and production company.
David J. Brunnert, age 50, Senior Vice President and Chief Operating Officer. Mr. Brunnert joined Key as its Senior Vice President and Chief Operating Officer effective November 30, 2016. Prior to joining Key, Mr. Brunnert served as the Senior Vice President, Western Hemisphere for Franks International, Inc., a publicly traded global oil services company, from July 2015 through September 2016. From June 2013 through December 2014, Mr. Brunnert served as Chief Operating Officer of Express Energy Services, an oilfield service company. From September 1997 through May 2013, Mr. Brunnert served in various roles for Weatherford International, plc, a publicly traded global oil and natural gas service company, including, lastly, as the Vice President of Drilling Tools and Intervention Services. Mr. Brunnert began his career in the oil and gas services business after serving as an Engineer Officer in the Army Corps of Engineers. Mr. Brunnert received his B.S. in Mechanical Engineering from the United States Military Academy (West Point) and a Masters in Mechanical Engineering from the University of Houston.
Scott P. Miller, age 39, Senior Vice President of Operational Services and Chief Administrative Officer. Mr. Miller joined the Company in May, 2006 serving in various leadership roles in Supply Chain Management, Enterprise Projects, Fluid Management Services and Strategy before accepting the role of Vice President and Chief Information Officer in March of 2013. Mr. Miller was promoted to his current position effective January 1, 2016. Prior to joining Key, Mr. Miller served in various financial and supply chain roles at Dynegy, Inc. and Capital One. Mr. Miller received a B.S. in Management of Information Systems from Louisiana State University and a Master of Business Administration from the University of Houston.
Katherine I. Hargis, age 46, Senior Vice President, General Counsel and Secretary. Ms. Hargis joined Key in July 2013 as Associate General Counsel, Corporate and Transactional & Assistant Secretary and was promoted to Vice President, Associate General Counsel & Assistant Secretary in November 2015. She was then promoted to Vice President, Chief Legal Officer and Secretary on January 1, 2016 and was promoted to her current position as Senior Vice President, General Counsel and Secretary
102
on September 12, 2017. Prior to joining Key, she served as the Vice President, General Counsel and Corporate Secretary for U.S. Concrete, Inc., a publicly traded company providing ready-mixed concrete and aggregates, from June 2012 through July 2013, and as its Deputy General Counsel & Corporate Secretary from December 2011 through June 2012, and as its Assistant General Counsel from December 2006 through December 2011. From February 2006 through December 2006, Ms. Hargis served as an attorney with King & Spalding LLP. From August 2002 through February 2006, Ms. Hargis served as an attorney for Andrews Kurth Kenyon LLP. Ms. Hargis received her B.S. in Administration of Justice from Arizona State University in 1999 and her J.D. from Tulane University in 2002.
Eddie V. Picard, age 52, Vice President and Controller serving as the Company’s principal accounting officer. Mr. Picard most recently served as the Senior Director of Finance, Drilling & Completions at C&J Energy Services (“C&J”) from July 2014 to June 2016. C&J is a provider of well construction, well completions and well services to the oil and gas industry. Prior to his time at C&J Mr. Picard worked as a professional certified public accountant, consulting at companies within various industries from November 2011 to June 2014. From September 2010 until November 2011, Mr. Picard served as the Chief Accounting Officer at BPZ Energy, which is an independent oil and gas exploration and production company which has license contracts covering areas in offshore and onshore Peru. From March 2008 until September 2010, Mr. Picard served as Chief Financial Officer of Marlin Offshore International. Marlin is an independent drilling rig owner performing contract development drilling throughout southeast Asia. Earlier in his career, Mr. Picard worked for Arthur Andersen LLP in Dallas, Texas where he advanced to the level of fifth year senior auditor. Mr. Picard has a B.S. in Accounting from the University of Louisiana. Mr. Picard is a Certified Public Accountant in Oklahoma, as well as a member of the American Institute of Certified Public Accountants and the Texas Society of Certified Public Accountants.
Section 16(a) Beneficial Ownership Reporting Compliance
Section 16(a) of the Securities Exchange Act of 1934, as amended, requires our directors, executive officers and persons who beneficially own more than 10% of a registered class of our equity securities, to file initial reports of ownership on Form 3 and changes in ownership on Forms 4 or 5 with the SEC. Such officers, directors and 10% stockholders also are required by SEC rules to furnish Key with copies of all Section 16(a) reports they file. Based solely on its review of the copies of such forms furnished or available to us, we believe that our directors, executive officers and 10% stockholders complied with all Section 16(a) filing requirements for the fiscal year ended December 31, 2017. In making these statements, we have relied upon an examination of the copies of Forms 3, 4 and 5, and amendments thereto, and the written representations of our directors, executive officers and 10% stockholders.
ITEM 11. EXECUTIVE COMPENSATION
COMPENSATION DISCUSSION AND ANALYSIS
This section of the Form 10-K describes and analyzes our executive compensation philosophy and program in the context of the compensation paid to our Named Executive Officers for 2017. Our Named Executive Officers and their titles during the 2017 calendar year are listed below:
• | Robert Drummond, President and Chief Executive Officer; |
• | J. Marshall Dodson, our Senior Vice President, Chief Financial Officer and Treasurer; |
• | David Brunnert, our Senior Vice President and Chief Operating Officer; |
• | Scott P. Miller, our Senior Vice President, Operations Services & Chief Administrative Officer; |
• | Katherine I. Hargis, our Senior Vice President, General Counsel and Secretary. |
In this Compensation Discussion and Analysis, we first provide an executive summary of our actions and results from 2017 related to compensation of our Named Executive Officers. We next explain the factors affecting our compensation decisions, results from 2017 and changes for the 2018 executive compensation program. We will also explain the principles that guide our compensation committee’s executive compensation decisions, including our compensation philosophy. We encourage you to read the entirety of the executive compensation discussion.
103
Executive Summary
Overview
As previously noted, decisions with respect to compensation for executive officers, including our chief executive officer, are made by the compensation committee of our Board. The following discussion and analysis are focused primarily on the compensation for our executive officers during 2017, with additional detail provided for our NEOs.
Pay for Performance Philosophy
We are committed to providing value to our stockholders. We believe that our executive compensation program fairly and appropriately compensates our executive officers. The core principle of our executive compensation philosophy is to pay for performance in ways that we believe will motivate our executives to develop and execute strategies that deliver performance improvements over the short and long term. Accordingly, our executive compensation program is heavily weighted toward “at-risk” performance-based compensation. We have three principal elements of total direct compensation: base salary, annual incentive compensation and long-term incentive compensation. These elements provide our compensation committee with a platform to reinforce our pay-for-performance philosophy while addressing our business needs and goals with appropriate flexibility.
Compensation Philosophy
Our compensation strategy is to ensure progress towards the successful attainment of our vision, values and business objectives by aligning the interests of our executive officers with stockholder interests. The primary goals of our compensation program are to attract and retain the talent we need to successfully manage the Company, reward exceptional organizational and individual performance improvements, and accomplish these objectives at a reasonable total cost in relation to performance and market conditions.
The following compensation objectives are considered in setting the compensation components for our executive officers:
• | Attracting and retaining key executives responsible not only for our continued growth and profitability, but also for ensuring proper corporate governance and carrying out the goals and plans of Key; |
• | Motivating management to enhance long-term stockholder value by aligning our executives’ interests with those of our stockholders; |
• | Paying for performance by linking a substantial portion of management’s compensation to measurable performance, including specific financial and operating goals; |
• | Evaluating and rating performance relative to the existing market conditions during the measurement period; and |
• | Setting compensation and incentive levels that reflect competitive market practices. |
We want our executives to be motivated to achieve Key's short-term and long-term goals, without sacrificing our financial and corporate integrity in trying to achieve those goals. While an executive’s overall compensation should be strongly influenced by the achievement of specific financial targets, we believe that an executive must be provided a degree of financial certainty and stability in his or her compensation. The design and operation of the compensation arrangements provide the executives with incentives to engage in business activities that support the value of Key and its stockholders.
Elements of Compensation
The principal components of our executive compensation program are base salary, cash incentive bonuses and long-term incentive awards in the form of equity, including performance-based equity. We blend these elements in order to formulate compensation packages that provide competitive pay, reward the achievement of financial, operational and strategic objectives on a short-term and long-term basis, and align the interests of our executive officers with those of our stockholders. We strive to hire and retain talented people who are compatible with our corporate culture and committed to our core values and who want to make a contribution to our mission.
104
Base Salaries
We provide base salaries to compensate our executive officers for services performed during the fiscal year. This provides a level of financial certainty and stability in an industry with historic volatility and cyclicality. The base salaries are designed to reflect the experience, education, responsibilities and contribution of the individual executive officers. This compensation component is initially established for each executive through individual negotiation, and is reflected in his or her employment agreement or offer letter, as applicable. Thereafter, salaries are reviewed annually for merit increases based on a number of factors, both quantitative (including detailed organizational and competitive analysis performed by an independent consultant engaged by the compensation committee) and qualitative (including the compensation committee’s perception of the executive’s experience, performance and contribution to our business objectives and corporate values). The base salaries are generally targeted to the 50th percentile for salaries as compared to our peers (all of whom are listed below).
No increases were made to any NEO salary for 2017, except for Ms. Hargis in connection with her promotion to Senior Vice President, General Counsel & Secretary. Effective December 4, 2017, Ms. Hargis' base salary was increased from $275,000 to $300,000.
2017 Base Salaries | ||
Name | ||
Robert Drummond | $750,000 | |
J. Marshall Dodson | $375,000 | |
David Brunnert | $350,000 | |
Katherine I. Hargis (1) | $300,000 | |
Scott P. Miller | $275,000 | |
(1) Amount for Ms. Hargis reflects her salary increase from $275,000 to $300,000, effective December 4, 2017, in connection with her promotion to Senior Vice President, General Counsel & Secretary.
Cash Bonus Incentive Plan
The cash bonus incentive plan is designed to pay for performance and align the interests of our executives with stockholder interests. The cash bonus incentive plan provides variable cash compensation earned only when established performance goals are achieved. It is designed to reward the plan participants, including the NEOs, who have achieved certain corporate and executive performance objectives and have contributed to the achievement of certain objectives of Key.
In January of 2017, the compensation committee approved a performance-based cash bonus plan for 2017, the 2017 Annual Incentive Plan (the “2017 AIP”), pursuant to which eligible employees, including each of the NEOs, were eligible to receive cash bonuses based on the achievement of certain performance metrics, and subject to their continued employment with the Company through payout of the 2017 AIP in 2018. The 2017 AIP is a sub-plan under the Key Energy Services, Inc. 2016 Equity and Cash Incentive Plan (the “2016 ECIP”). Individual target bonuses under the 2017 AIP were based on a percentage of each eligible employee’s base salary. Performance metrics under the 2017 AIP consisted of (i) adjusted earnings before interest expense, taxes, depreciation and amortization (“Adjusted EBITDA,” weighted 80%), (ii) safety performance (weighted 10%) and (iii) free cash flow (weighted 10%), as described in more detail below.
Adjusted EBITDA (weighted 80%). The financial target was based on Adjusted EBITDA which is defined as total revenue, less operating expenses (excluding depreciation and amortization), adjusted for non-recurring and non-cash charges as disclosed in public reporting documents. Earnout of the Adjusted EBITDA portion of the cash bonus could range between 0% and 126% of the applicable target.
Safety (weighted 10%). Positive safety results are critical in this industry to ensure the safety of our people. This goal represents the improvement required in the safety performance index made up of 4 leading and lagging indicators including (i) the Occupational Safety and Health Administration, or OSHA, total recordable incident rate (“TRIR”) of .88, (ii) Behavioral Based Safety Observations (“BBS”) equal to 2 per week per supervisor, Total Incident Reporting/Recordable Incidents greater than 15:1 and (iv) quality incident reporting greater than 2/200,000 man hours worked. Achievement of 4 out of the 4 metrics results in 100% attainment of the 10% target, achievement of 3 out of the 4 metrics results in attainment of 50% of the 10% target, and achievement of 1 or 2 out of the 4 metrics results in attainment of 0% of the 10% target. OSHA total recordable incident rates are
105
determined by measuring the number of injury incidents involving our employees against the number of exposure hours worked. Incidents that are considered recordable include injuries resulting in a fatality, an employee missing work, an employee having to switch to “light” duty or restricted work or an employee requiring medical treatment.
Free Cash Flow (weighted 10%). Cash flow management is critical. This goal measures the ability to provide accurate and signed work tickets for invoicing in less than 12 days in order to invoice more quickly and drive down the days of sales outstanding (“DSO”). Earnout of the Free Cash Flow portion of the cash bonus could range between 0% and 100% of the applicable target.
The 2017 AIP was originally divided into five measurement periods with each quarter representing 12.5% of an individual’s bonus opportunity and the whole year actual versus the original plan representing 50%. Performance metric goals under the 2017 AIP were originally based on an average oil price of over $54. Actual oil prices remained lower throughout the majority of 2017. In response to the continued depressed oil prices and in order to keep executive officers motivated to perform, in August 2017, the compensation committee determined to adjust the Adjusted EBITDA targets for the third and fourth quarters of 2017, increase the weighting of both measurement periods from 12.5% to 25% each and eliminate the annual Adjusted EBITDA measurement period (which originally represented 50% of an individual’s bonus opportunity). The 2017 AIP goals and related actual performance were as follows:
2017 AIP Measurements (January - March 2017 “First Performance Period”)
Adjusted EBITDA (weighted 80%). The Adjusted EBITDA target for the First Performance Period was set at negative $9.75 million with no threshold. Because this goal was negative, the potential earnout was capped at 100% if actual performance was above target but still negative, with the maximum earnout of 126% possible if actual performance was positive. The Adjusted EBITDA results for the First Performance Period was negative $8.67 million which exceeded the target. As discussed below, the compensation committee used negative discretion to cap Adjusted EBITDA earnings at 100% of target. Thus, the Company attained 100% of the Adjusted EBITDA target for the period.
Safety (weighted 10%). The target safety goal for the First Performance Period was a corporate-wide Safety Performance Index ("SPI") of 100%. The SPI for the First Performance Period was 75% resulting in attainment of 50% of the safety target for the period.
Free Cash Flow (weighted 10%). The target Free Cash Flow goal for the First Performance Period was to provide accurate and signed work tickets for invoicing in less than 12 days. Free Cash Flow for the First Performance Period was 15 days resulting in 0% attainment of the Free Cash Flow target for the period.
2017 AIP Measurements (April - June 2017 “Second Performance Period”)
Adjusted EBITDA (weighted 80%). The Adjusted EBITDA target for the Second Performance Period was set at $5.44 million. The Adjusted EBITDA results for the Second Performance Period was $32,000. Of the $14.1 million targeted improvement in Adjusted EBITDA above actual First Performance Period Adjusted EBITDA, the Company achieved $8.7 million. Based on this improvement, the compensation committee approved attainment of the Adjusted EBITDA target for the period at 62%, calculated by determining the extent to which earnings increased during the Second Performance Period as compared to the First Performance Period.
Safety (weighted 10%). The target safety goal for the Second Performance Period was a corporate-wide SPI of 100%. The SPI for the Second Performance Period was 50% resulting in attainment of 0% of the safety target for the period.
Free Cash Flow (weighted 10%). The target Free Cash Flow goal for the Second Performance Period was to provide accurate and signed work tickets for invoicing in less than 12 days. Free Cash Flow for the Second Performance Period was 14 days resulting in 0% attainment of the Free Cash Flow target for the period.
2017 AIP Measurements (July - September 2017 “Third Performance Period”)
Adjusted EBITDA (weighted 80%). The Adjusted EBITDA target was originally set at $16.1 million and adjusted to $1.62 million in August 2017. The Adjusted EBITDA results for the Third Performance Period was $1.87 million which was $0.24 million more than target. As discussed below, the compensation committee used negative discretion to cap the Adjusted EBITDA earnings at 100% of target, which resulted in 100% attainment of the Adjusted EBITDA target for the period.
106
Safety (weighted 10%). The target safety goal for the Third Performance Period was a corporate-wide SPI of 100%. The SPI for the Third Performance Period was 50% resulting in attainment of 0% of the safety target for the period.
Free Cash Flow (weighted 10%). The target Free Cash Flow goal for the Third Performance Period was to provide accurate and signed work tickets for invoicing in less than 12 days. Free Cash Flow for the Third Performance Period was 17 days resulting in 0% attainment of the Free Cash Flow target for the period.
2017 AIP Measurements (October - December 2017 “Fourth Performance Period”)
Adjusted EBITDA (weighted 80%). The Adjusted EBITDA target was originally set at $21.7 million and adjusted to $.94 million in August 2017. The Adjusted EBITDA results for the Fourth Performance Period was $2.0 million which was $1.06 million more than target. As discussed below, the compensation committee used negative discretion to cap Adjusted EBITDA earnings at 100% of target, which resulted in 100% attainment of the Adjusted EBITDA target for the period.
Safety (weighted 10%). The target safety goal for the Fourth Performance Period was a corporate-wide SPI of 100%. The SPI for the Fourth Performance Period was 50% resulting in attainment of 0% of the safety target for the period.
Free Cash Flow (weighted 10%). The target Free Cash Flow goal for the Fourth Performance Period was to provide accurate and signed work tickets for invoicing in less than 12 days. Free Cash Flow for the Fourth Performance Period was 17 days resulting in 0% attainment of the Free Cash Flow target for the period.
Long-Term Equity-Based Incentive Compensation
The purpose of our long-term incentive compensation is to align the interests of our executives with those of our stockholders and to retain our executives and other eligible employees over the long term. We want our executives to be focused on increasing stockholder value, and we use the 2016 ECIP as the long-term vehicle to encourage and establish this focus.
Our compensation committee may elect to grant equity-based awards under the 2016 ECIP to NEOs in connection with an employee’s initial hire, promotion and other events. The compensation committee granted option awards to certain employees, including each of the NEOs upon our emergence from bankruptcy (the "Emergence Awards"), and on December 20, 2016, the compensation committee granted additional time-based and performance-based restricted stock units and options to certain employees, including each of the NEOs (collectively with the Emergence Awards, the “December 2016 Awards”). On September 12, 2017, the compensation committee granted Ms. Hargis additional time-based and performance-based restricted stock units and options on the same terms as the December 2016 Awards in connection with her promotion from Vice President, Chief Legal and Secretary to Senior Vice President, General Counsel and Secretary (the “Hargis Awards”). The December 2016 Awards and the Hargis Awards are hereby referred to as the 2016 Awards.
On November 29, 2017, the compensation committee approved certain modifications to the 2016 Awards, which were determined to be appropriate and necessary for retention and incentive purposes. The compensation committee confirmed that the first tranche of the 2016 Awards, including both time-based awards and performance-based awards, would vest as scheduled in December 2017 subject to the satisfaction of the original vesting terms. The compensation committee also approved providing each holder of 2016 Awards with the option to either (i) continue to hold the remainder of their 2016 Awards that did not vest in December 2017 pursuant to their original terms, or (ii) forfeit the remainder of their 2016 Awards in exchange for a new grant made up of 50% time-vested restricted stock unit awards (a “Time RSU Award”) and 50% performance share awards (a “Performance RSU Award”). The Time RSU Awards and the Performance RSU Award are collectively referred to herein as the “Replacement Awards”. Each of the NEOs determined to forfeit the remainder of their 2016 Awards and accept the Replacement Awards, and the Replacement Awards were granted on December 31, 2017.
One-third of the Time RSU Awards will become vested on each anniversary of the date of grant. Upon a termination of the holder’s employment for any reason, any portion of the Time RSU Award which remains unvested will be forfeited; except that, if the holder’s employment is terminated by the Company without “cause” (as defined in the Time RSU Award) or by the holder for “good reason” (as defined in the Time RSU Award), in each case, within 12 months following a “change of control” (as defined in the Time RSU Award), then any portion of the Time RSU Award which remains unvested will become vested.
107
One-third of each Performance RSU Award will be earned based on the Adjusted EBITDA-based performance goals achieved over each of the one-year performance periods with respect to the 2018, 2019, and 2020 calendar years, and the earned portion of the entire Performance RSU Award will settle following the end of the performance period with respect to the 2020 calendar year. Upon a termination of the holder’s employment for any reason, any portion of the Performance RSU Award which remains unvested will be forfeited.
2017 Compensation Results and Decisions
Cash Bonus Plan Results for the Year Ended December 31, 2017
For 2017, the compensation committee gave greater weight to the financial performance metrics compared to 2016 to further align management with the shareholders. For 2017, each NEO had a bonus opportunity as a percentage of base salary as follows:
Minimum Payout (% of base salary) | Target Payout (% of base salary) | Maximum Payout (% of base salary) | ||||
Participant | ||||||
Robert Drummond | 0% | 125% | 151% | |||
J. Marshall Dodson | 0% | 80% | 97% | |||
David Brunnert | 0% | 80% | 97% | |||
Scott P. Miller | 0% | 80% | 97% | |||
Katherine I. Hargis | 0% | 80% | 97% | |||
Payment under the 2017 AIP for each NEO was determined based on achievement of each of three performance metrics for each of four quarterly performance periods. The performance metrics were Adjusted EBITDA (80%), Safety (10%) and Free Cash Flow (10%) with the First and Second quarterly performance periods each weighted 12.5% of the total 2017 AIP and the Third and Fourth Performance Periods (as adjusted in August 2017) each weighted 25% of the total 2017 AIP. (As a result of the compensation committee’s adjustments in August 2017, including the elimination of the annual measurement period, the aggregate weighting of all measurement periods was reduced from 100% to 75%. Accordingly, the target and maximum payouts for Mr. Drummond were reduced to 94% and 113% of base salary, respectively, and the target and maximum payout for each other NEO were reduced to 60% and 72% of base salary, respectively.)3 The results of these performance metrics were as follows:
Adjusted EBITDA. The compensation committee determined that the Adjusted EBITDA metric would emphasize the Company’s business goals and reorganizational goals of focusing on cash management, seeking revenue growth and reducing expenses. The Adjusted EBITDA targets for the First, Second, Third and Fourth Performance Periods, as adjusted in August 2017, were ($9.8) million, $5.4 million, $1.6 million and $0.9 million, respectively. Actual Adjusted EBITDA results for the First, Second, Third and Fourth Performance Periods were ($8.6) million, $32,000, $1.9 million and $2.0 million, respectively, which resulted in achievement of 70% of the target, Adjusted EBITDA goal, giving effect to the weighting of each performance period and capping the percentage at 100% for each period.
Safety. The Company achieved 6% of its total goal for 2017 which qualified for 6% payment under the 2017 AIP.
Free Cash Flow. The Company achieved 0% of its total goal for 2017 which did not qualify for payment under the 2017 AIP.
The compensation committee used negative discretion to cap Adjusted EBITDA earnings at 100%, reduce the actual bonus paid to the CEO by 5% and reduce the actual bonus paid to each of the other NEOs by 3%. This decision was largely driven by the understanding that overall profitability was still negative. Based on these results, the bonus opportunities with respect to each performance metric (as adjusted in August 2017) and the payments earned by each NEO in 2017 under the 2017 AIP were as set forth in the tables below. Bonuses under the 2017 AIP will be paid out in March 2018 in a lump sum.
108
2017 Bonus Paid
Robert Drummond
Performance Metric | Base Salary | Performance Metric Weighting | Original Target Bonus Opportunity | Revised Target Bonus Opportunity | Maximum Bonus Opportunity | Actual Bonus Paid(1) | |||||||||||||||||
First Performance Period (weighted 12.5%) | Adjusted EBITDA | $ | 750,000 | 80 | % | $ | 187,500 | $ | 93,750 | $ | 118,125 | $ | 89,063 | ||||||||||
Safety | $ | 750,000 | 10 | % | $ | 23,438 | $ | 11,719 | $ | 11,719 | $ | 5,566 | |||||||||||
Free Cash Flow | $ | 750,000 | 10 | % | $ | 23,438 | $ | 11,719 | $ | 11,719 | $ | — | |||||||||||
Total Bonus - First Performance Period | $ | 234,376 | $ | 117,188 | $ | 141,563 | $ | 94,629 | |||||||||||||||
Second Performance Period (weighted 12.5%) | Adjusted EBITDA | $ | 750,000 | 80 | % | $ | 187,500 | $ | 93,750 | $ | 118,125 | $ | 54,916 | ||||||||||
Safety | $ | 750,000 | 10 | % | $ | 23,438 | $ | 11,719 | $ | 11,719 | $ | — | |||||||||||
Free Cash Flow | $ | 750,000 | 10 | % | $ | 23,438 | $ | 11,719 | $ | 11,719 | $ | — | |||||||||||
Total Bonus - Second Performance Period | $ | 234,376 | $ | 117,188 | $ | 141,563 | $ | 54,916 | |||||||||||||||
Third Performance Period (weighted 25%) | Adjusted EBITDA | $ | 750,000 | 80 | % | $ | 187,500 | $ | 187,500 | $ | 236,250 | $ | 178,125 | ||||||||||
Safety | $ | 750,000 | 10 | % | $ | 23,438 | $ | 23,438 | $ | 23,438 | $ | — | |||||||||||
Free Cash Flow | $ | 750,000 | 10 | % | $ | 23,438 | $ | 23,438 | $ | 23,438 | $ | — | |||||||||||
Total Bonus - Third Performance Period | $ | 234,376 | $ | 234,376 | $ | 283,126 | $ | 178,125 | |||||||||||||||
Fourth Performance Period (weighted 25%) | Adjusted EBITDA | $ | 750,000 | 80 | % | $ | 187,500 | $ | 187,500 | $ | 236,250 | $ | 178,125 | ||||||||||
Safety | $ | 750,000 | 10 | % | $ | 23,438 | $ | 23,438 | $ | 23,438 | $ | — | |||||||||||
Free Cash Flow | $ | 750,000 | 10 | % | $ | 23,437 | $ | 23,437 | $ | 23,437 | $ | — | |||||||||||
Total Bonus - Fourth Performance Period | $ | 234,375 | $ | 234,375 | $ | 283,125 | $ | 178,125 | |||||||||||||||
Total Bonus | $ | 937,503 | $ | 703,127 | $ | 849,377 | $ | 505,795 | |||||||||||||||
(1) Amounts reflect Mr. Drummond’s target bonus opportunity equal to 125% of base salary, actual performance as described above and the compensation committee’s exercise of negative discretion to cap Adjusted EBITDA earnings 100% and reduce Mr. Drummond’s actual bonus paid by 5%.
J. Marshall Dodson
Performance Metric | Base Salary | Performance Metric Weighting | Original Target Bonus Opportunity | Revised Target Bonus Opportunity | Maximum Bonus Opportunity | Actual Bonus Paid(1) | |||||||||||||||||
First Performance Period (weighted 12.5%) | Adjusted EBITDA | $ | 375,000 | 80 | % | $ | 60,000 | $ | 30,000 | $ | 37,800 | $ | 29,100 | ||||||||||
Safety | $ | 375,000 | 10 | % | $ | 7,500 | $ | 3,750 | $ | 3,750 | $ | 1,819 | |||||||||||
Free Cash Flow | $ | 375,000 | 10 | % | $ | 7,500 | $ | 3,750 | $ | 3,750 | $ | — | |||||||||||
Total Bonus - First Performance Period | $ | 75,000 | $ | 37,500 | $ | 45,300 | $ | 30,919 | |||||||||||||||
Second Performance Period (weighted 12.5%) | Adjusted EBITDA | $ | 375,000 | 80 | % | $ | 60,000 | $ | 30,000 | $ | 37,800 | $ | 17,943 | ||||||||||
Safety | $ | 375,000 | 10 | % | $ | 7,500 | $ | 3,750 | $ | 3,750 | $ | — | |||||||||||
Free Cash Flow | $ | 375,000 | 10 | % | $ | 7,500 | $ | 3,750 | $ | 3,750 | $ | — | |||||||||||
Total Bonus - Second Performance Period | $ | 75,000 | $ | 37,500 | $ | 45,300 | $ | 17,943 | |||||||||||||||
Third Performance Period (weighted 25%) | Adjusted EBITDA | $ | 375,000 | 80 | % | $ | 60,000 | $ | 60,000 | $ | 75,600 | $ | 58,200 | ||||||||||
Safety | $ | 375,000 | 10 | % | $ | 7,500 | $ | 7,500 | $ | 7,500 | $ | — | |||||||||||
Free Cash Flow | $ | 375,000 | 10 | % | $ | 7,500 | $ | 7,500 | $ | 7,500 | $ | — | |||||||||||
Total Bonus - Third Performance Period | $ | 75,000 | $ | 75,000 | $ | 90,600 | $ | 58,200 | |||||||||||||||
Fourth Performance Period (weighted 25%) | Adjusted EBITDA | $ | 375,000 | 80 | % | $ | 60,000 | $ | 60,000 | $ | 75,600 | $ | 58,200 | ||||||||||
Safety | $ | 375,000 | 10 | % | $ | 7,500 | $ | 7,500 | $ | 7,500 | $ | — | |||||||||||
Free Cash Flow | $ | 375,000 | 10 | % | $ | 7,500 | $ | 7,500 | $ | 7,500 | $ | — | |||||||||||
Total Bonus - Fourth Performance Period | $ | 75,000 | $ | 75,000 | $ | 90,600 | $ | 58,200 | |||||||||||||||
Total Bonus | $ | 300,000 | $ | 225,000 | $ | 271,800 | $ | 165,262 | |||||||||||||||
109
(1) Amounts reflect Mr. Dodson’s target bonus opportunity equal to 80% of base salary, actual performance as described above and the compensation committee’s exercise of negative discretion to cap Adjusted EBITDA earnings 100% and reduce Mr. Dodson’s actual bonus paid by 3%.
David Brunnert
Performance Metric | Base Salary | Performance Metric Weighting | Original Target Bonus Opportunity | Revised Target Bonus Opportunity | Maximum Bonus Opportunity | Actual Bonus Paid(1) | |||||||||||||||||
First Performance Period (weighted 12.5%) | Adjusted EBITDA | $ | 350,000 | 80 | % | $ | 56,000 | $ | 28,000 | $ | 35,280 | $ | 27,160 | ||||||||||
Safety | $ | 350,000 | 10 | % | $ | 7,000 | $ | 3,500 | $ | 3,500 | $ | 1,698 | |||||||||||
Free Cash Flow | $ | 350,000 | 10 | % | $ | 7,000 | $ | 3,500 | $ | 3,500 | $ | — | |||||||||||
Total Bonus - First Performance Period | $ | 70,000 | $ | 35,000 | $ | 42,280 | $ | 28,858 | |||||||||||||||
Second Performance Period (weighted 12.5%) | Adjusted EBITDA | $ | 350,000 | 80 | % | $ | 56,000 | $ | 28,000 | $ | 35,280 | $ | 16,747 | ||||||||||
Safety | $ | 350,000 | 10 | % | $ | 7,000 | $ | 3,500 | $ | 3,500 | $ | — | |||||||||||
Free Cash Flow | $ | 350,000 | 10 | % | $ | 7,000 | $ | 3,500 | $ | 3,500 | $ | — | |||||||||||
Total Bonus - Second Performance Period | $ | 70,000 | $ | 35,000 | $ | 42,280 | $ | 16,747 | |||||||||||||||
Third Performance Period (weighted 25%) | Adjusted EBITDA | $ | 350,000 | 80 | % | $ | 56,000 | $ | 56,000 | $ | 70,560 | $ | 54,320 | ||||||||||
Safety | $ | 350,000 | 10 | % | $ | 7,000 | $ | 7,000 | $ | 7,000 | $ | — | |||||||||||
Free Cash Flow | $ | 350,000 | 10 | % | $ | 7,000 | $ | 7,000 | $ | 7,000 | $ | — | |||||||||||
Total Bonus - Third Performance Period | $ | 70,000 | $ | 70,000 | $ | 84,560 | $ | 54,320 | |||||||||||||||
Fourth Performance Period (weighted 25%) | Adjusted EBITDA | $ | 350,000 | 80 | % | $ | 56,000 | $ | 56,000 | $ | 70,560 | $ | 54,320 | ||||||||||
Safety | $ | 350,000 | 10 | % | $ | 7,000 | $ | 7,000 | $ | 7,000 | $ | — | |||||||||||
Free Cash Flow | $ | 350,000 | 10 | % | $ | 7,000 | $ | 7,000 | $ | 7,000 | $ | — | |||||||||||
Total Bonus - Fourth Performance Period | $ | 70,000 | $ | 70,000 | $ | 84,560 | $ | 54,320 | |||||||||||||||
Total Bonus | $ | 280,000 | $ | 210,000 | $ | 253,680 | $ | 154,245 | |||||||||||||||
(1) Amounts reflect Mr. Brunnert’s target bonus opportunity equal to 80% of base salary, actual performance as described above and the compensation committee’s exercise of negative discretion to cap Adjusted EBITDA earnings 100% and reduce Mr. Brunnert’s actual bonus paid by 3%.
Scott P. Miller
Performance Metric | Base Salary | Performance Metric Weighting | Original Target Bonus Opportunity | Revised Target Bonus Opportunity | Maximum Bonus Opportunity | Actual Bonus Paid(1) | |||||||||||||||||
First Performance Period (weighted 12.5%) | Adjusted EBITDA | $ | 275,000 | 80 | % | $ | 44,000 | $ | 22,000 | $ | 27,720 | $ | 21,340 | ||||||||||
Safety | $ | 275,000 | 10 | % | $ | 5,500 | $ | 2,750 | $ | 2,750 | $ | 1,334 | |||||||||||
Free Cash Flow | $ | 275,000 | 10 | % | $ | 5,500 | $ | 2,750 | $ | 2,750 | $ | — | |||||||||||
Total Bonus - First Performance Period | $ | 55,000 | $ | 27,500 | $ | 33,220 | $ | 22,674 | |||||||||||||||
Second Performance Period (weighted 12.5%) | Adjusted EBITDA | $ | 275,000 | 80 | % | $ | 44,000 | $ | 22,000 | $ | 27,720 | $ | 13,158 | ||||||||||
Safety | $ | 275,000 | 10 | % | $ | 5,500 | $ | 2,750 | $ | 2,750 | $ | — | |||||||||||
Free Cash Flow | $ | 275,000 | 10 | % | $ | 5,500 | $ | 2,750 | $ | 2,750 | $ | — | |||||||||||
Total Bonus - Second Performance Period | $ | 55,000 | $ | 27,500 | $ | 33,220 | $ | 13,158 | |||||||||||||||
Third Performance Period (weighted 25%) | Adjusted EBITDA | $ | 275,000 | 80 | % | $ | 44,000 | $ | 44,000 | $ | 55,440 | $ | 42,680 | ||||||||||
Safety | $ | 275,000 | 10 | % | $ | 5,500 | $ | 5,500 | $ | 5,500 | $ | — | |||||||||||
Free Cash Flow | $ | 275,000 | 10 | % | $ | 5,500 | $ | 5,500 | $ | 5,500 | $ | — | |||||||||||
Total Bonus - Third Performance Period | $ | 55,000 | $ | 55,000 | $ | 66,440 | $ | 42,680 | |||||||||||||||
Fourth Performance Period (weighted 25%) | Adjusted EBITDA | $ | 275,000 | 80 | % | $ | 44,000 | $ | 44,000 | $ | 55,440 | $ | 42,680 | ||||||||||
Safety | $ | 275,000 | 10 | % | $ | 5,500 | $ | 5,500 | $ | 5,500 | $ | — | |||||||||||
Free Cash Flow | $ | 275,000 | 10 | % | $ | 5,500 | $ | 5,500 | $ | 5,500 | $ | — | |||||||||||
Total Bonus - Fourth Performance Period | $ | 55,000 | $ | 55,000 | $ | 66,440 | $ | 42,680 | |||||||||||||||
Total Bonus | $ | 220,000 | $ | 165,000 | $ | 199,320 | $ | 121,192 | |||||||||||||||
110
(1) Amounts reflect Mr. Miller’s target bonus opportunity equal to 80% of base salary, actual performance as described above and the compensation committee’s exercise of negative discretion to cap Adjusted EBITDA earnings 100% and reduce Mr. Miller’s actual bonus paid by 3%.
Katherine I. Hargis
Performance Metric | Base Salary | Performance Metric Weighting | Original Target Bonus Opportunity | Revised Target Bonus Opportunity | Maximum Bonus Opportunity | Actual Bonus Paid(1) | |||||||||||||||||
First Performance Period (weighted 12.5%) | Adjusted EBITDA | $ | 300,000 | 80 | % | $ | 48,000 | $ | 24,000 | $ | 30,240 | $ | 23,280 | ||||||||||
Safety | $ | 300,000 | 10 | % | $ | 6,000 | $ | 3,000 | $ | 3,000 | $ | 1,455 | |||||||||||
Free Cash Flow | $ | 300,000 | 10 | % | $ | 6,000 | $ | 3,000 | $ | 3,000 | $ | — | |||||||||||
Total Bonus - First Performance Period | $ | 60,000 | $ | 30,000 | $ | 36,240 | $ | 24,735 | |||||||||||||||
Second Performance Period (weighted 12.5%) | Adjusted EBITDA | $ | 300,000 | 80 | % | $ | 48,000 | $ | 24,000 | $ | 30,240 | $ | 14,355 | ||||||||||
Safety | $ | 300,000 | 10 | % | $ | 6,000 | $ | 3,000 | $ | 3,000 | $ | — | |||||||||||
Free Cash Flow | $ | 300,000 | 10 | % | $ | 6,000 | $ | 3,000 | $ | 3,000 | $ | — | |||||||||||
Total Bonus - Second Performance Period | $ | 60,000 | $ | 30,000 | $ | 36,240 | $ | 14,355 | |||||||||||||||
Third Performance Period (weighted 25%) | Adjusted EBITDA | $ | 300,000 | 80 | % | $ | 48,000 | $ | 48,000 | $ | 60,480 | $ | 46,560 | ||||||||||
Safety | $ | 300,000 | 10 | % | $ | 6,000 | $ | 6,000 | $ | 6,000 | $ | — | |||||||||||
Free Cash Flow | $ | 300,000 | 10 | % | $ | 6,000 | $ | 6,000 | $ | 6,000 | $ | — | |||||||||||
Total Bonus - Third Performance Period | $ | 60,000 | $ | 60,000 | $ | 72,480 | $ | 46,560 | |||||||||||||||
Fourth Performance Period (weighted 25%) | Adjusted EBITDA | $ | 300,000 | 80 | % | $ | 48,000 | $ | 48,000 | $ | 60,480 | $ | 46,560 | ||||||||||
Safety | $ | 300,000 | 10 | % | $ | 6,000 | $ | 6,000 | $ | 6,000 | $ | — | |||||||||||
Free Cash Flow | $ | 300,000 | 10 | % | $ | 6,000 | $ | 6,000 | $ | 6,000 | $ | — | |||||||||||
Total Bonus - Fourth Performance Period | $ | 60,000 | $ | 60,000 | $ | 72,480 | $ | 46,560 | |||||||||||||||
Total Bonus | $ | 240,000 | $ | 180,000 | $ | 217,440 | $ | 132,210 | |||||||||||||||
(1) Amounts reflect Ms. Hargis’ target bonus opportunity equal to 80% of base salary, actual performance as described above and the compensation committee’s exercise of negative discretion to cap Adjusted EBITDA earnings 100% and reduce Ms. Hargis’ actual bonus paid by 3%.
2017 Equity Award Grants
Overview:
As previously noted, the compensation committee made grants to certain employees, including each of the NEOs, of option awards upon our emergence from bankruptcy and of time-based and performance-based restricted stock units and options on December 20, 2016, each as described below. As a result, the Company did not make any annual grants of equity awards to the NEOs in 2017 for 2017 performance. However, the Company made additional grants of equity awards to Ms. Hargis in September 2017 in connection with her promotion to Senior Vice President, General Counsel and Secretary and made the Replacement Awards as described above and below on December 31, 2017.
On November 29, 2017, the compensation committee confirmed that the first tranche of the 2016 Awards would vest as scheduled in December 2017, subject to the satisfaction of the original vesting terms. Accordingly, the first tranche of all outstanding 2016 Awards (including the awards granted to Ms. Hargis in September 2017 in connection with her promotion) vested in December 2017.
The compensation committee also determined to permit the holders of 2016 Awards to elect to forfeit the remainder of the 2016 Awards that did not vest in December 2017 in exchange for Replacement Awards consisting 50% of Time RSU Awards and 50% of Performance RSU Awards. Each of the NEOs elected to forfeit the remainder of the 2016 Awards in exchange for Replacement Awards, and Replacement Awards were granted on December 31, 2017.
Hargis Awards
On September 12, 2017, in connection with her promotion to Senior Vice President, General Counsel and Secretary, Ms. Hargis received an additional grant of 11,848 shares of time-based restricted stock units, 11,848 shares of performance-based restricted stock units with a fair market value of $302,361 based on the closing stock price of $12.76 per share on September 12,
111
2017 and 23,696 options with a fair market value of $109,002 based on grant date Black Sholes fair valued half at $3.31 and the other half at $5.89.
Replacement Awards
The compensation committee offered each holder of 2016 Awards (including the Hargis Awards) the opportunity to elect to forfeit the remainder of their 2016 Awards that did not vest in December 2017 in exchange for Replacement Awards consisting 50% of Time RSU Awards and 50% of Performance RSU Awards. Each of the NEOs elected to forfeit the remainder of their 2016 Awards in exchange for Replacement Awards, which were granted on December 31, 2017.
Time RSU Awards
The following table sets forth the number of shares of time-based restricted stock units granted on December 31, 2017 to our NEOs:
2017 | ||||
Participant | Time-Based Restricted Stock Units Granted | Grant Value (based on $11.82 stock price) | ||
Robert Drummond | 150,637 | $1,780,529 | ||
J. Marshall Dodson | 76,518 | $904,442 | ||
David Brunnert | 60,000 | $709,200 | ||
Scott P. Miller | 35,544 | $420,130 | ||
Katherine I. Hargis | 32,500 | $384,150 | ||
The Time RSU Awards represent the right to receive one share of common stock of the Company for each vested restricted stock unit. The Time RSU Awards will become vested as to 1/3 of the restricted stock units on each anniversary of the date of grant date of December 31. Upon a termination of the holder’s employment for any reason, any portion of the Time RSU Award which remains unvested will be forfeited; provided, however, that if the holder’s employment is terminated by the Company without “cause” (as defined in the Time RSU Award) or by the holder for “good reason” (as defined in the Time RSU Award), in each case, within 12 months following a “change of control” (as defined in the Time RSU Award), then any portion of the Time RSU Award which remains unvested will become vested. For additional information about equity grants awarded in 2017, see “Compensation of Executive Officers- Summary Compensation Table” and “2017 Grants of Plan-Based Awards.”
Performance RSU Awards
The following table sets forth the number of shares of performance-based restricted stock units granted on December 31, 2017 to our NEOs:
2017 | ||||
Participant | Performance-Based Restricted Stock Units Granted | Grant Value (based on $11.82 stock price) | ||
Robert Drummond | 150,637 | $1,780,529 | ||
J. Marshall Dodson | 76,518 | $904,442 | ||
David Brunnert | 60,000 | $709,200 | ||
Scott P. Miller | 35,544 | $420,130 | ||
Katherine I. Hargis | 32,500 | $384,150 | ||
112
The Performance RSU Awards represent the right to earn one share of common stock of the Company for each vested restricted stock unit. The Performance RSU Awards will settle following the end of the performance period with respect to the 2020 calendar year; however, one-third of the restricted stock units are earned based on EBITDA-based performance goals achieved over each of the one-year performance periods with respect to the 2018, 2019, and 2020 calendar years. Upon a termination of the holder’s employment for any reason, any portion of the Performance RSU Award which remains unvested will be forfeited. For additional information about equity grants awarded in 2017, see “Compensation of Executive Officers- Summary Compensation Table” and “-2017 Grants of Plan-Based Awards.”
2018 Annual Cash Incentive Plan
In November of 2017, the compensation committee approved the 2018 Annual Incentive Plan (the “2018 AIP”), pursuant to which eligible Company employees, including each of the NEOs, are eligible to receive cash bonuses based upon the achievement of certain performance metrics, and subject to their continued employment with the Company through payout of the 2018 AIP in 2019. The 2018 AIP is a sub-plan under the 2016 ECIP. Individual target bonuses under the 2018 AIP are based on a percentage of each eligible employee’s base salary, and actual bonus amounts will be earned between 0% and 140% of the applicable target.
Performance metrics under the 2018 AIP, and their respective weightings, are the same as under the 2017 AIP. For all executives of the Company, including each NEO, the 2018 AIP consists of a single one-year measurement period equal to 100% of an individual’s bonus opportunity.
Oversight of Executive Compensation Program
As described above under “Corporate Governance-Board Committees-Compensation Committee,” the compensation committee is responsible for establishing, implementing and continually monitoring adherence with our compensation philosophy. The compensation committee has the sole authority to engage independent compensation consultants, who report directly to the committee, to advise and consult on compensation issues.
Role of Executives in Establishing Compensation
The compensation committee makes the final determination of all compensation paid to our NEOs and is involved in all compensation decisions affecting our CEO. When making compensation decisions for individual executive officers, the compensation committee considers many factors, including:
• | the individual’s role and responsibilities, performance, tenure, and experience; |
• | our overall performance; |
• | individual compensation as compared to our peers; |
• | the individual’s historical compensation, equity holdings, realized gains on past equity grants; and |
• | comparisons to other executive officers of our Company. |
The compensation committee evaluates the performance of the chief executive officer and considers the evaluations of the other Named Executive Officers on an annual basis following the close of each fiscal year. Although these performance evaluations are most closely connected to the qualitative portion of the officer’s annual incentive award, the compensation committee considers individual performance in evaluating the appropriateness of the officer’s base salary specifically and the compensation package as a whole. However, management also plays a role in the determination of executive compensation levels. The key members of management involved in the compensation process are the chief executive officer and the chief administrative officer. Management proposes certain corporate safety and individual executive performance objectives based on the following year’s business plan, which is approved by the Board each year. Management also participates in the discussion of peer companies to be used to benchmark NEO compensation, and recommends the overall funding level for cash bonuses and equity incentive awards. The compensation committee meets regularly in executive session without management present.
The Role of our Compensation Consultant
The compensation committee has sole authority over the selection, use, and retention of any compensation consultant or any other experts engaged to assist the compensation committee in discharging its responsibilities. In 2017, the compensation committee engaged Longnecker & Associates to assist with its overall compensation review and decision- making. In late 2017, Longnecker conducted an independent, comprehensive, broad-based analysis of our executive compensation program, and the compensation committee used this analysis as one of several reference points in making decisions regarding 2018 compensation. Longnecker’s objectives were to:
113
• | Review the total direct compensation (base salary, annual incentives, and long-term incentives) for the NEOs; |
• | Assess the competitiveness of executive compensation, based on revenue size, asset size, enterprise value and market capitalization, as compared to the peer group and published survey companies in the energy services industry; and |
• | Provide conclusions and recommend considerations for total direct compensation. |
Longnecker performed services solely on behalf of the compensation committee. In accordance with the rules and regulations of the SEC and the NYSE, the compensation committee assessed the independence of Longnecker and concluded that no conflicts of interest exist that would prevent Longnecker from providing independent and objective advice.
Longnecker also provides guidance on industry best practices. This information assists us in developing and implementing compensation programs generally competitive with those of other companies in our industry and other companies with which we generally compete for executive talent. The compensation committee reviews salary ranges for all senior executive positions annually.
Longnecker tailored its recommendations to (i) balance external market data, (ii) reflect our internal environment to ensure fiscal responsibility, and (iii) address potential retention concerns. Specifically, Longnecker evaluated the total direct compensation of the senior executives, assessed the competitiveness of our executive compensation and analyzed other factors such as cost of management, pay versus total stockholder return performance, mix of pay, peer annual incentive targets and mix of peer long-term incentive awards.
The companies used for the executive compensation comparisons in November 2017 included the following:
Basic Energy Services, Inc. | Patterson-UTI Energy, Inc. |
C & J Energy Services, Inc. | Pioneer Energy Services Corp. |
Exterran Corporation | RPC, Inc. |
Helix Energy Solutions Group, Inc. | Superior Energy Services, Inc. |
Oceaneering International, Inc. | |
Based on its review of the compensation program in 2017, Longnecker recommended to the compensation committee that we consider the following compensation practices for 2018:
• | maintain the practice of generally aligning targeted total cash opportunity at the median, but paying above market only when performance warrants; |
• | use of restricted stock units and performance units for the senior executive team to continue alignment of executive and stockholder interests with 50% of the NEO’s long-term incentive award vesting only when performance metrics are met; |
• | consider no base salary increases; |
• | assess the market 50th percentile for long-term incentive awards, but give consideration to the total stockholder return, as well as share usage and retention concerns. |
As a result of discussions with its compensation consultant, and in light of the macro-economic conditions affecting the industry and the need to retain employees critical to the operations of the Company, the compensation committee elected to issue Replacement Awards to holders of the 2016 Awards, including each of the NEOs, and certain additional critical employees.
Executive Compensation Risk Management
We do not believe that our compensation policies and practices encourage excessive or unnecessary risk-taking. Historically, our compensation committee annually reviews and discusses risks that relate to compensation policies and practices, and considers risk management in connection with overseeing the executive compensation program. We believe that our executive compensation program is designed with an appropriate balance of risk and reward. To achieve this balance, our program includes:
• | performance incentives with both financial and operational metrics that are not completely based on arithmetic formulas, but also incorporate the exercise of negative and positive discretion and judgment; |
114
• | long-term incentives that are principally based on the retention and motivation of employees through a combination of long-term incentive vehicles; |
• | different types of equity awards, including performance-based awards, to mitigate risk that our executive officers will take actions that are detrimental to or not in the best interest of our stockholders; |
• | regularly benchmarking our current compensation practices, policies and pay levels with our peer group; |
• | aligning with the market mid-point for targeted total direct compensation, such that management interests are aligned with stockholder interests while rewarding for exceptional performance in comparison with its peer group; |
• | capping the maximum amounts that may be earned under our incentive compensation plans; |
• | granting equity awards annually, with appropriate vesting periods, to encourage consistent behavior and reward long-term, sustained performance; and |
• | ensuring that our executive compensation programs are overseen by a committee of independent directors, who are advised by an external compensation consultant. |
Other Components of Total Compensation
The total compensation program for our Named Executive Officers also consists of the following components:
• | retirement, health and welfare benefits; |
• | limited perquisites; |
• | discretionary bonuses; and |
• | certain post-termination payments. |
Retirement, Health and Welfare Benefits
We offer a 401(k) savings plan and health and welfare programs to all eligible employees. Under the terms of their employment agreements, the NEOs are eligible for the same broad-based benefit programs on the same basis as the rest of our employees. Our health and welfare programs include medical, pharmacy, dental, vision, life insurance and accidental death and disability. For additional information about employment agreements, see “Compensation of Executive Officers-Employment Agreements” below.
Under the 401(k) plan, eligible employees may elect to contribute up to 100% of their eligible compensation on a pre-tax basis in accordance with the limitations imposed under the Internal Revenue Code of 1986, as amended, and the regulations promulgated there under (collectively, the “Code”). The cash amounts contributed under the 401(k) plan are held in a trust and invested among various investment funds in accordance with the directions of each participant. Effective as of September 1, 2015, we suspended the matching contribution under our 401(k) plan. Accordingly, for the year ended December 31, 2017, we made no employer matching contributions to the 401(k) plan.
Perquisites
We provide our NEOs with the opportunity to receive certain perquisites that we believe are reasonable and consistent with the practices of our peer group. With respect to certain NEOs, we pay all covered out-of-pocket medical and dental expenses not otherwise covered by insurance. The NEOs receive these reimbursements under the terms of, and subject to the limitations set forth in, our Executive Health Reimbursement Plan. These programs are intended to promote the health and financial security of our executives. The programs are provided at competitive market levels to attract, retain and reward superior executives in key positions. Perquisites did not constitute a material portion of the compensation to the NEOs for 2017. Our costs associated with providing these benefits for NEOs in 2017 are reflected under “Compensation of Executive Officers-Perquisites” and “Employment Agreements” below.
115
Severance Payments/Change of Control
We have determined that it is appropriate to formally document the employment relationships that we have with certain executive officers of the Company, and we have entered into employment agreements with each of our NEOs that offer severance payments and other benefits following termination of the applicable executive officer’s employment under various scenarios, as described below. The Company believes that offering severance benefits is beneficial in attracting and retaining key executive officers, encourages the retention of such executive officers during the pendency of a potential change of control transaction or other organizational changes within the Company and protects the Company’s interest.
We have employment arrangements in place with each of the NEOs providing for severance compensation for a period of up to three years if the executive’s employment is terminated for a variety of reasons, including a change of control of Key. We have provided more information about these benefits, along with estimates of the value under various circumstances, under the heading “Compensation of Executive Officers-Payments upon Termination or Change of Control” below.
Change of control benefits are structured as “double trigger” benefits. In other words, the change of control does not itself trigger benefits. Rather, benefits are paid only if the employment of the executive is terminated during a specified period after a change of control. We believe a “double trigger” benefit maximizes stockholder value because it prevents an unintended windfall to executives in the event of a friendly change of control, while still providing appropriate incentives to cooperate in negotiating any change of control. In addition, these agreements avoid distractions involving executive management that arise when the Board is considering possible strategic transactions involving a change of control, and assure continuity of executive management and objective input to the Board when it is considering any strategic transaction. For additional information concerning our change of control agreements, see “Compensation of Executive Officers-Payments upon Termination or Change of Control” below.
Regulatory Considerations
The tax and accounting consequences of utilizing various forms of compensation are considered by the compensation committee when adopting new or modifying existing compensation.
Under Section 162(m) of the Code, publicly held corporations may not take a tax deduction for compensation in excess of $1 million paid to our chief executive officer, and our three most highly compensated executive officers other than our chief financial officer during any fiscal year. Prior to the federal tax reform legislation enacted in December 2017, Section 162(m) included an exception to this $1 million limit for performance-based compensation meeting certain requirements. However, the new tax legislation removed this performance-based compensation exception. To maintain flexibility in compensating executives in a manner designed to promote varying corporate goals, the compensation committee has not adopted a policy requiring all compensation to be deductible under Section 162(m) and the compensation committee reserves the right to grant non-deductible compensation.
Accounting for Equity-Based Compensation
We account for equity-based compensation in accordance with the requirements of FASB ASC Topic 718, “Stock Compensation.”
Compensation Committee Report
The compensation committee reviewed and discussed the Compensation Discussion and Analysis required by Item 402(b) of Regulation S-K with our management. Based on this review and discussion, the compensation committee recommended to the Board that the Compensation Discussion and Analysis be included in this Form 10-K for the year ended December 31, 2017.
By the compensation committee of the Board of Directors of Key Energy Services, Inc.
Bryan Kelln, Chair
Philip Norment
Jacob Kotzubei
Scott D. Vogel
H. H. Tripp Wommack, III
116
Compensation of Executive Officers
Summary Compensation Table
The following table contains information about the compensation that our NEOs earned for fiscal years 2017, 2016 and 2015 as applicable to their status as NEOs for each given year:
Name and Principal Position | Year | Salary ($) | Bonus ($)(1) | Stock Awards ($)(2) | Option Awards ($)(2) | Non-equity Incentive Plan Compensation ($)(3) | All Other Compensation ($)(4) | Total | ||||||||||||||||||||||
Robert Drummond | 2017 | $ | 750,000 | $ | 766,000 | $ | 3,561,059 | $ | — | $ | 505,795 | $ | 6,916 | $ | 5,589,770 | |||||||||||||||
Chief Executive Officer | 2016 | $ | 683,654 | $ | 1,000,000 | $ | 6,804,358 | $ | 2,114,929 | $ | 632,419 | $ | 15,299 | $ | 11,250,659 | |||||||||||||||
2015 | $ | 293,269 | $ | 59,063 | $ | 2,000,001 | $ | — | $ | 140,937 | $ | 208 | $ | 2,493,478 | ||||||||||||||||
J. Marshall Dodson | 2017 | $ | 375,000 | $ | 283,333 | $ | 1,808,886 | $ | — | $ | 165,262 | $ | 13,420 | $ | 2,645,901 | |||||||||||||||
Chief Financial Officer | 2016 | $ | 359,351 | $ | 141,667 | $ | 3,464,858 | $ | 1,074,313 | $ | 202,350 | $ | 11,002 | $ | 5,253,541 | |||||||||||||||
2015 | $ | 352,788 | $ | 31,500 | $ | 731,250 | $ | — | $ | 93,500 | $ | 10,238 | $ | 1,219,276 | ||||||||||||||||
David Brunnert | 2017 | $ | 350,000 | $ | — | $ | 1,418,400 | $ | — | $ | 154,244 | $ | 624 | $ | 1,923,268 | |||||||||||||||
Chief Operating Officer | 2016 | $ | 24,231 | $ | — | $ | 2,021,384 | $ | 665,370 | $ | — | $ | — | $ | 2,710,985 | |||||||||||||||
Scott P. Miller | 2017 | $ | 275,000 | $ | 100,000 | $ | 840,260 | $ | — | $ | 121,192 | $ | 486 | $ | 1,336,938 | |||||||||||||||
Chief Administrative Officer | 2016 | $ | 266,233 | $ | 50,000 | $ | 1,587,870 | $ | 499,038 | $ | 148,390 | $ | 486 | $ | 2,552,017 | |||||||||||||||
Katherine I. Hargis | 2017 | $ | 276,442 | $ | 80,000 | $ | 1,070,661 | $ | 109,002 | $ | 132,210 | $ | 594 | $ | 1,668,909 | |||||||||||||||
General Counsel | 2016 | $ | 266,437 | $ | 40,000 | $ | 537,878 | $ | 166,332 | $ | 115,493 | $ | 594 | $ | 1,126,734 | |||||||||||||||
_________________________
(1) | Amounts for 2017 consists of payments received pursuant to cash retention awards granted on January 28, 2016 to our NEOs as follows: |
2016 | ||
Participant | Cash Retention Awards | |
Robert Drummond | $766,000 | |
J. Marshall Dodson | $425,000 | |
Scott P. Miller | $150,000 | |
Katherine I. Hargis | $120,000 | |
Each of Messrs. Dodson, Miller and Ms. Hargis received payment of one-third of their award amount on October 21, 2016 ($141,667, $50,000 and $40,000, respectively). The remainder of the original award amounts for such executives ($283,333, $100,000 and $80,000, respectively), and the entire amount for Mr. Drummond, vested on June 30, 2017.
(2) | The amounts in these columns represent the aggregate grant date fair value dollar amounts with respect to restricted stock, RSU, and option awards granted in each year under the 2014 Incentive Plan or 2016 Incentive Plan, as applicable, calculated on the respective grant date of each such award in accordance with FASB ASC Topic 718. The assumptions made in the valuation of the expense amounts included in these columns are discussed in Note 21 in the notes to our consolidated financial statements included in Part II of this Form 10-K. Amounts for 2017 for Ms. Hargis include the value of options, performance-based RSUs and time-based RSUs, as applicable, granted on September 12, 2017 in connection with her promotion to Senior Vice President, General Counsel & Secretary. Amounts for each NEO include the value of Replacement Awards (granted 50% in the form of time-based RSUs vesting in three equal installments over a three-year period from the date of grant and 50% in the form of performance-based RSUs with a three-year performance period using an EBITDA performance metric) granted on December 31, 2017 in exchange for the forfeiture of all outstanding unvested equity awards, including time and performance-based options, performance-based stock units and time-based restricted stock units. The value of the portion of the Replacement Awards granted in the form of performance-based restricted stock units reflects performance at target, the probable outcome of the performance conditions underlying those awards as of the date of grant; however, the ultimate amount that may become earned, subject to achievement of the applicable performance conditions, by each of Messrs. Drummond, Dodson, Brunnert and Miller and Ms. Hargis is $3.6 million, $1.8 million, $1.4 million, $0.8 million and $0.8 million, respectively. Although the amounts in this table reflect the grant date value of all awards granted in the 2016 and 2017 year, the values do not reflect the cancellation and forfeiture of certain awards and thus, the amounts reflected in the table are over-stated. The forfeited awards for each of Messrs. Drummond, Dodson, Brunnert and Miller and Ms. Hargis had an aggregate |
117
grant date value of $6,405,043, $3,253,524, $2,015,002, $1,511,331 and $812,257, respectively. For further information, please see “2017 Replacement Awards” section under “Compensation Discussion and Analysis” above and the “2017 Grants of Plan-Based Awards” table below. In connection with the reorganization of the Company, all unvested restricted stock awards granted prior to Key’s bankruptcy filing were accelerated and exchanged for vested stock and warrants in the post-emergence entity as part of the emergence process on the Effective Date.
(3) | The amounts shown in this column consist of annual bonus payments made to the NEOs under each of the 2015 cash bonus incentive plan, the 2016 cash bonus incentive plan and the 2017 AIP. |
(4) | A breakdown of the amounts shown in this column for 2017 for each of the NEOs is set forth in the table below. |
Medical Expenses(2) | ||||||||||||||
Name | Insurance(1) | Other(3) | Total | |||||||||||
Robert Drummond | 324 | 5,818 | 774 | 6,916 | ||||||||||
J. Marshall Dodson | 324 | 12,826 | 270 | 13,420 | ||||||||||
David Brunnert | 274 | — | 350 | 624 | ||||||||||
Scott P. Miller | 324 | — | 162 | 486 | ||||||||||
Katherine I. Hargis | 324 | — | 270 | 594 | ||||||||||
_________________________
(1) | Includes premiums paid by the Company on behalf of the NEO for life insurance, accidental death and disability or other insurance policy for which the officer (or his or her family) is the beneficiary. |
(2) | Represents out-of-pocket medical expenses reimbursed to the NEO. |
(3) | Includes amounts for imputed income with respect to life insurance and other benefits, including the Excess Group Life Policies. |
2017 Grants of Plan-Based Awards
The following table presents information on plan-based awards made to the NEOs in fiscal 2017:
Estimated Possible Payouts Under Non-Equity Incentive Plan Awards (1) | Estimated Future Payouts Under Equity Incentive Plan Awards | All Other Stock Awards: Number of Shares of Stock or Units (#)(4) | All Other Option Awards: Number of Securities Underlying Options (#)(3) | Exercise or Base Price of Option Awards ($/Sh) | Grant Date Fair Value of Stock and Option Awards ($)(2) | ||||||||||||||||||||
Name | Grant Date | Target ($) | Maximum Awards ($) | Threshold (#) | Target (#) | Maximum # | |||||||||||||||||||
Robert Drummond | — | 937,500 | 1,132,500 | — | — | — | — | — | — | — | |||||||||||||||
12/31/2017 | (3) | — | — | 75,319 | 150,637 | 301,274 | 150,637 | — | — | 3,561,059 | |||||||||||||||
J. Marshall Dodson | — | 300,000 | 363,750 | — | — | — | — | — | — | — | |||||||||||||||
12/31/2017 | (3) | — | — | 38,259 | 76,518 | 153,036 | 76,518 | — | — | 1,808,886 | |||||||||||||||
David Brunnert | — | 280,000 | 339,500 | — | — | — | — | — | — | — | |||||||||||||||
12/31/2017 | (3) | — | — | 30,000 | 60,000 | 120,000 | 60,000 | — | — | 1,418,400 | |||||||||||||||
Scott P. Miller | — | 220,000 | 266,750 | — | — | — | — | — | — | — | |||||||||||||||
12/31/2017 | (3) | — | — | 17,772 | 35,544 | 71,088 | 35,544 | — | — | 840,260 | |||||||||||||||
Katherine I. Hargis | — | 240,000 | 291,000 | — | — | — | — | — | — | ||||||||||||||||
9/12/2017 | (4) | — | — | — | 17,772 | — | 11,848 | 5,924 | 19.35 | 372,146 | |||||||||||||||
9/12/2017 | (4) | — | — | — | 5,924 | — | — | 5,924 | 47.94 | 39,217 | |||||||||||||||
12/31/2017 | (3) | — | — | 16,250 | 32,500 | 65,000 | 32,500 | — | — | 768,300 | |||||||||||||||
_________________________
118
(1) | The columns represent the potential annual value of the payout for each NEO under the cash bonus incentive compensation component if the target or maximum goals were satisfied. For a detailed description of the cash bonus incentive plan, see the “Cash Bonus Incentive Plan” section under “Compensation Discussion and Analysis” above. Amounts actually paid for the 2017 year are reflected in the “Non-equity Incentive Plan Compensation” column of the “Summary Compensation Table” above. |
(2) | These amounts represent the grant date fair value calculated in accordance with FASB ASC Topic 718. |
(3) | The Replacement Awards, which were granted on December 31, 2017, were approved by the compensation committee on November 29, 2017 for grant in December subject to the executive’s election to accept the Replacement Awards. |
(4) | Includes 8,886 time-based RSUs, 8,886 performance-based RSUs, 8,886 time-based options and 8,886 performance-based options, which were forfeited in exchange for the December 31, 2017 grant of Replacement Awards. These forfeited awards had an aggregate grant date fair value of $308,522. |
2017 Outstanding Equity Awards at Fiscal Year-End
The following table provides information with respect to outstanding stock options, time-based RSUs and performance-based RSUs held by the NEOs as of December 31, 2017:
OPTION AWARDS | STOCK AWARDS | |||||||||||||||||||||||||||||
Name | Number of Securities Underlying Unexercised Options (#) Exercisable | Number of Securities Underlying Unexercised Options (#) Unexercisable | Equity Incentive Plan Awards: Number of Securities Underlying Unexercised Unearned Options (#) | Option Exercise Price ($) | Option Expiration Date | Number of Shares or Units of Stock That Have Not Vested (#)(2) | Market Value of Shares or Units of Stock That Have Not Vested ($)(1) | Equity Incentive Plan Awards: Number of Unearned Performance Units That Have Not Vested ($)(2) | Equity Incentive Plan Awards: Market Value of Unearned Units That Have Not Vested ($)(1) | |||||||||||||||||||||
Robert Drummond | 25,106 | — | — | $ | 19.35 | 12/15/26 | 150,637 | $ | 1,776,010 | 150,637 | $ | 1,776,010 | ||||||||||||||||||
25,106 | — | — | $ | 47.99 | 12/20/26 | — | — | — | — | |||||||||||||||||||||
J. Marshall Dodson | 12,754 | — | — | $ | 19.35 | 12/15/26 | 76,518 | $ | 902,147 | 76,518 | $ | 902,147 | ||||||||||||||||||
12,754 | — | — | $ | 47.99 | 12/20/26 | — | — | — | — | |||||||||||||||||||||
David Brunnert | 7,900 | — | — | $ | 19.35 | 12/15/26 | 60,000 | $ | 707,400 | 60,000 | $ | 707,400 | ||||||||||||||||||
7,900 | — | — | $ | 47.99 | 12/20/26 | — | — | — | — | |||||||||||||||||||||
Scott P. Miller | 5,924 | — | — | $ | 19.35 | 12/15/26 | 35,544 | $ | 419,064 | 35,544 | $ | 419,064 | ||||||||||||||||||
5,924 | — | — | $ | 47.99 | 12/20/26 | — | — | — | — | |||||||||||||||||||||
Katherine I. Hargis | 4,938 | — | — | $ | 19.35 | 12/15/26 | 32,500 | $ | 383,175 | 32,500 | $ | 383,175 | ||||||||||||||||||
4,938 | — | — | $ | 47.99 | 12/20/26 | — | — | — | — | |||||||||||||||||||||
_________________________
(1) | The market price of stock awards is determined by multiplying the number of shares by the closing price of the stock on the last trading day of the year. The closing price quoted on the NYSE on December 29, 2017 was $11.79. |
(2) | Represents RSUs which vest in annual increments beginning on the one-year anniversary of the date of grant. Performance-based RSUs are shown assuming target performance. With respect to each NEO, the vesting applicable to each outstanding award as of December 31, 2017 (including performance-based RSUs, assuming target performance) is as follows: |
119
Name | Number of Shares | Vesting Date | ||||
Robert Drummond | 100,426 | December 31, 2018 | ||||
100,424 | December 31, 2019 | |||||
100,424 | December 31, 2020 | |||||
J. Marshall Dodson | 51,012 | December 31, 2018 | ||||
51,012 | December 31, 2019 | |||||
51,012 | December 31, 2020 | |||||
David Brunnert | 40,000 | December 31, 2018 | ||||
40,000 | December 31, 2019 | |||||
40,000 | December 31, 2020 | |||||
Scott P. Miller | 23,696 | December 31, 2018 | ||||
23,696 | December 31, 2019 | |||||
23,696 | December 31, 2020 | |||||
Katherine I. Hargis | 21,668 | December 31, 2018 | ||||
21,666 | December 31, 2019 | |||||
21,666 | December 31, 2020 | |||||
2017 Option Exercises and Stock Vested
The following table sets forth certain information regarding options and stock awards exercised and vested, respectively, during 2017 for the NEOs:
Option Awards | Stock Awards | ||||||||||||
Name | Number of Shares Acquired on Exercise (#) | Value Realized on Exercise ($) | Number of Shares Acquired on Vesting (#)(1) | Value Realized on Vesting ($)(2) | |||||||||
Robert Drummond | — | — | 50,214 | $ | 599,304 | ||||||||
J. Marshall Dodson | — | — | 25,506 | $ | 304,414 | ||||||||
David Brunnert | — | — | 15,798 | $ | 188,549 | ||||||||
Scott P. Miller | — | — | 11,848 | $ | 141,406 | ||||||||
Katherine I. Hargis | — | — | 9,874 | $ | 117,846 | ||||||||
_________________________
(1) | Represents the number of shares of time-based RSUs and performance-based RSUs that vested during 2017. The Board determined at the time of grant to waive the performance criteria for the first tranche of performance-based RSUs vesting December 31, 2017. |
120
(2) | The value realized on vesting of restricted stock was calculated as the number of shares acquired on vesting (including shares withheld for tax withholding purposes) multiplied by the market value of our common stock on each respective vesting date. Market value is determined in accordance with the terms of the applicable incentive plan under which the restricted stock was granted, and, in the table above, was either (i) the closing price of our common stock on the NYSE for vesting dates that were trading days or (ii) using the average of the closing price of a share of Common Stock on the immediately preceding trading day and the opening price of a share of Common Stock on the immediately following trading day for vesting dates that were on a weekend or holidays. |
Potential Payments Upon Termination or Change of Control
Key has entered into employment arrangements with each NEO that provide for certain payments upon a termination of employment, depending upon the circumstances of the NEO’s separation from Key, as summarized below. Our rationale for maintaining certain severance and change in control benefits has been described above within the Compensation Discussion and Analysis. Each of the arrangements with our NEOs that was effective for the 2017 year is summarized below.
Robert Drummond, President and Chief Executive Officer
On June 22, 2015, the Company entered into an employment agreement with Mr. Drummond pursuant to which Mr. Drummond would serve as the Company’s President and Chief Operating Officer. The Company amended and restated this employment agreement effective April 19, 2016 to reflect Mr. Drummond’s promotion to President and Chief Executive Officer. The agreement provides for an initial term to expire on March 5, 2018. The term will be automatically renewed for an additional one-year period on that date (and on each subsequent anniversary of the effective date of the agreement) unless either party gives written notice of its intent not to extend the term. The agreement provides for an annual base salary of $750,000 and an annual incentive bonus opportunity based on the achievement of performance objectives established by the compensation committee with the target bonus based on a percentage of his base salary as determined by the compensation committee. Mr. Drummond is entitled to at least four weeks of vacation per year and to participate in the Company’s Executive Health Reimbursement Plan, Director and Officer Liability Insurance, voluntary annual physicals and other benefit plans on terms consistent with those applicable to the Company’s employees generally, including, without limitation, personal time off, group medical and dental, life, accident and disability insurance, retirement plans and supplemental and excess retirement benefits as the Company may from time-to-time provide to similarly situated employees. As a condition of employment, Mr. Drummond entered into a non-competition agreement pursuant to which Mr. Drummond has agreed not to compete with Key or to solicit customers or employees of Key for a period of one year after the termination of his employment. In addition, in connection with Mr. Drummond’s promotion to Chief Executive Officer, the Company entered into a Promotion Bonus Agreement with Mr. Drummond on March 7, 2016 pursuant to which Mr. Drummond would receive a promotion bonus of $750,000 (the “Promotion Bonus”) if he was still employed by the Company on March 5, 2018. The Company revised the Promotion Bonus Agreement on April 6, 2016 to provide that the promotion bonus will vest in full if Mr. Drummond’s employment with the Company is terminated for any reason other than for “Cause” within 12 months following a “Change of Control” (both terms as defined in the revised Promotion Bonus Agreement), rather than on a pro-rata basis.
If Mr. Drummond’s employment with the Company is terminated by the Company without Cause or by Mr. Drummond for Good Reason (as such terms are defined in the employment agreement), or due to non-renewal of the agreement, subject to Mr. Drummond’s delivery of a release of claims in favor of the Company, Mr. Drummond will be entitled to a severance benefit equal to (i) two times his base salary in effect on the termination date payable in twenty-four equal monthly installments, (ii) full vesting of all equity-based incentive awards, and (iii) the cost of COBRA premiums for continued medical insurance coverage for Mr. Drummond and his dependents until the earlier of two years from the date of termination or the date on which he commences full-time employment with another employer. In the event Mr. Drummond terminates his employment for Good Reason or is terminated without Cause (including non-renewal of his agreement) within one year following a Change of Control (as such term is defined in his employment agreement), Mr. Drummond shall receive a severance benefit equal to (i) three times his base salary in effect on the termination date payable in twenty-four equal monthly installments plus three times his annual target cash bonus payable in a lump sum, (ii) full vesting of all equity-based incentive awards, (iii) the Promotion Bonus and (iv) a lump sum payment in cash equal to the cost of COBRA premiums for continued medical insurance coverage for Mr. Drummond and his dependents for two years from the date of termination. If Mr. Drummond’s employment with the Company is terminated by reason of Disability (as defined in his employment agreement), Mr. Drummond shall receive a severance benefit equal to (i) one times his base salary in effect on the termination date, payable in twelve equal monthly installments, reduced by the amount of any disability insurance proceeds actually paid to Mr. Drummond or for his benefit from the Company’s disability plans and programs during such time period, (ii) full vesting of all equity-based incentive awards, and (iii) the cost of COBRA premiums for continued medical insurance coverage for Mr. Drummond and his dependents until the earlier of two years from the date of termination or the date on which he commences full-time employment with another employer. If Mr. Drummond’s employment is terminated by reason of death, Mr. Drummond shall not receive any severance payments pursuant to his agreement; however, his spouse and his dependents shall
121
be entitled to receive continued group health, dental and vision coverage under the Company’s Welfare Plans and the Company shall pay all required COBRA premiums until the earlier of the second anniversary of his death or the date on which his spouse and his dependents receive replacement coverage that would terminate their COBRA termination rights.
J. Marshall Dodson, Senior Vice President, Chief Financial Officer and Treasurer
On March 25, 2013, the Company entered into an employment agreement with Mr. Dodson pursuant to which Mr. Dodson would serve as the Company’s Senior Vice President, Chief Financial Officer and Treasurer. The employment agreement provides for an initial two-year term expiring on the second anniversary of the effective date of the agreement. The term will be automatically renewed for an additional one-year period on that date (and on each subsequent anniversary of the effective date of the agreement) unless either party gives written notice of its intent not to extend the term. The agreement provides for an annual base salary of $350,000 which may be increased at the discretion of the Chief Executive Officer and the compensation committee and an annual incentive bonus opportunity based on the achievement of performance objectives established by the compensation committee. In January 2014, the compensation committee increased Mr. Dodson’s base salary to $375,000. Mr. Dodson is entitled to at least four weeks of vacation per year and to participate in the Company’s Executive Health Reimbursement Plan, Director and Officer Liability Insurance, voluntary annual physicals and other benefit plans on terms consistent with those applicable to the Company’s employees generally, including, without limitation, personal time off, group medical and dental, life, accident and disability insurance, retirement plans and supplemental and excess retirement benefits as the Company may from time-to-time provide to similarly situated employees. As a condition of employment, Mr. Dodson entered into a non-competition agreement pursuant to which Mr. Dodson has agreed not to compete with Key or to solicit customers or employees of Key after the termination of his employment for a period of time equal to which he receives severance compensation or for a period of three years following a severance received after a Change of Control (as defined in his agreement).
If Mr. Dodson’s employment with the Company is terminated by the Company without Cause or by Mr. Dodson for Good Reason (as such terms are defined in the employment agreement), or due to non-renewal of the agreement, subject to Mr. Dodson’s delivery of a release of claims in favor of the Company, Mr. Dodson will be entitled to a severance benefit equal to (i) two times his base salary in effect on the termination date payable in twenty-four equal monthly installments, (ii) full vesting of all equity-based incentive awards, and (iii) the cost of COBRA premiums for continued medical insurance coverage for Mr. Dodson and his dependents until the earlier of two years from the date of termination or the date on which he commences full-time employment with anther employer. In the event Mr. Dodson terminates his employment for Good Reason or is terminated without Cause (including non-renewal of his agreement) within one year following a Change of Control (as such term is defined in his employment agreement), Mr. Dodson shall receive a severance benefit equal to (i) three times his base salary in effect on the termination date payable in twenty-four equal monthly installments plus three times his annual target cash bonus payable in a lump sum, (ii) full vesting of all equity-based incentive awards, and (iii) a lump sum payment in cash equal to the cost of COBRA premiums for continued medical insurance coverage for Mr. Dodson and his dependents for two years from the date of termination. If Mr. Dodson’s employment with the Company is terminated by reason of Disability (as defined in his employment agreement), Mr. Dodson shall receive a severance benefit equal to (i) one times his base salary in effect on the termination date, payable in twelve equal monthly installments, reduced by the amount of any disability insurance proceeds actually paid to Mr. Dodson or for his benefit from the Company’s disability plans and programs during such time period, (ii) full vesting of all equity-based incentive awards, and (iii) the cost of COBRA premiums for continued medical insurance coverage for Mr. Dodson and his dependents until the earlier of two years from the date of termination or the date on which he commences full-time employment with another employer. If Mr. Dodson’s employment is terminated by reason of death, Mr. Dodson shall not receive any severance payments pursuant to his agreement; however, his spouse and his dependents shall be entitled to receive continued group health, dental and vision coverage under the Company’s Welfare Plans and the Company shall pay all required COBRA premiums until the earlier of the second anniversary of his death or the date on which his spouse and his dependents receive replacement coverage that would terminated their COBRA termination rights.
David Brunnert, Senior Vice President and Chief Operations Officer
On December 4, 2017, the Company entered into an employment agreement with Mr. Brunnert which supersedes and replaces that certain amended and restated Change of Control Agreement between the Company and Mr. Brunnert dated January 31, 2017. The employment agreement provides for an annual base salary of $350,000. The employment agreement contains certain confidentiality, non-competition and intellectual property covenants.
Upon a termination of Mr. Brunnert’s employment with the Company (i) by the Company without “cause” (as defined in the Brunnert Employment Agreement), (ii) by either the Company or the executive at the end of the term of the employment agreement after such term expires due to the Company delivering a notice of non-renewal, (iii) due to death or “disability” (as defined in the Brunnert Employment Agreement), or (iv) by the executive for “good reason” within one year following a “change of control” (each as defined in the Brunnert Employment Agreement), in each case, subject to the execution and non-revocation of
122
a release, the Company will provide (x) a lump sum severance payment equal to the executive’s annual base salary, (y) continued coverage under the Company’s medical and dental benefit plans for 12 months, and (z) accelerated vesting of outstanding equity awards. If any amounts due to the executive on a termination of employment with the Company by the executive for good reason within one year following a change of control is includable in the executive’s gross income under Section 409A of the Internal Revenue Code of 1986, as amended, then the Company will pay an additional amount necessary to pay the executive for additional income taxes on such amounts.
Scott P. Miller, Senior Vice President, Operations Services and Chief Administrative
On January 28, 2016, the Company entered into an employment agreement with Mr. Miller pursuant to which Mr. Miller would serve as the Company’s Senior Vice President, Operations Services Officer and Chief Administrative Officer. The employment agreement provides for an initial term expiring on January 31, 2017. The term will be automatically renewed for an additional one-year period on that date (and on each subsequent anniversary of the effective date of the agreement) unless either party gives written notice of its intent not to extend the term. The agreement provides for an annual base salary of $275,000. Mr. Miller is entitled to at least four weeks of vacation per year and to participate in other benefit plans on terms consistent with those applicable to the Company’s employees generally, including, without limitation, personal time off, group medical and dental, life, accident and disability insurance, retirement plans and supplemental and excess retirement benefits as the Company may from time-to-time provide to similarly situated employees.
If Mr. Miller’s employment with the Company is terminated by the Company for death, Disability or without Cause (as such terms are defined in his employment agreement) or due to non-renewal of the agreement, subject to Mr. Miller’s delivery of a release of claims in favor of the Company, Mr. Miller will be entitled to a severance benefit equal to one times his annual base salary in effect at the time of his termination payable in a lump sum. In the event Mr. Miller terminates his employment for Good Reason or is terminated without Cause (including non-renewal of his agreement) within one year following a Change of Control (as such term is defined in his employment agreement), Mr. Miller shall receive the severance benefit stated above and in addition he will be entitled to continued coverage for himself and his dependents under the Company’s medical and dental benefit plans for a period of twelve months at a cost equal to the cost of such coverage for similarly-situated employees of the Company. Accelerated vesting of Mr. Miller’s equity awards is controlled by Mr. Miller’s equity award agreements. In the event of a not for Cause termination, including a termination for Good Reason, within one year of a Change of Control (as such terms are defined in Mr, Miller’s equity award agreements), Mr. Miller’s outstanding time-vested equity awards will automatically vest and his performance-based equity awards will vest at the discretion of the Board.
Katherine I. Hargis, Vice President, Chief Legal Officer & Secretary
In connection with her promotion as the Company’s Senior Vice President, General Counsel and Corporate Secretary on September 12, 2017, the compensation committee approved the terms for an employment agreement to be entered into with Ms. Hargis effective December 4, 2017, which supersedes and replaces that certain Change of Control Agreement between the Company and Ms. Hargis dated January 6, 2014. The employment agreement provides for an annual base salary of $300,000 and contains certain confidentiality, non-competition and intellectual property covenants.
Upon a termination of Ms. Hargis’ employment with the Company (i) by the Company without “cause” (as defined in the Hargis Employment Agreement), (ii) by either the Company or the executive at the end of the term of the employment agreement after such term expires due to the Company delivering a notice of non-renewal, (iii) due to death or “disability” (as defined in the Hargis Employment Agreement), or (iv) by the executive for “good reason” within one year following a “change of control” (each as defined in the Hargis Employment Agreement), in each case, subject to the execution and non-revocation of a release, the Company will provide (x) a lump sum severance payment equal to the executive’s annual base salary, (y) continued coverage under the Company’s medical and dental benefit plans for 12 months, and (z) accelerated vesting of outstanding equity awards. If any amounts due to the executive on a termination of employment with the Company by the executive for good reason within one year following a change of control is includable in the executive’s gross income under Section 409A of the Internal Revenue Code of 1986, as amended, then the Company will pay an additional amount necessary to pay the executive for additional income taxes on such amounts.
The following tables reflect the potential payments to which our NEOs would have been entitled upon termination of employment and/or a change in control event that occurred on December 31, 2017. The closing price of a share of our common stock on December 29, 2017, the last trading day of the year, was $11.79. The actual amounts to be paid out to executives upon termination can only be determined at the time of each NEO’s separation from Key.
123
Name | Non-Renewal(1) | For Cause or Voluntary Resignation(2) | Death(3) | Disability(4) | Without Cause or For Good Reason(5) | Change of Control (No Termination)(6) | Change of Control and Termination(7) | |||||||||||||||||||||
Robert Drummond | ||||||||||||||||||||||||||||
Cash Severance | $ | 1,500,000 | $ | — | $ | — | $ | 750,000 | $ | 1,500,000 | $ | — | $ | 5,062,500 | ||||||||||||||
RSU(8) | $ | 3,552,020 | $ | — | $ | 3,552,020 | $ | 3,552,020 | $ | 3,552,020 | $ | — | $ | 3,552,020 | ||||||||||||||
Health & Welfare(9) | $ | 88,224 | $ | — | $ | 88,224 | $ | 88,224 | $ | 88,224 | $ | — | $ | 88,224 | ||||||||||||||
Promotion Bonus(10) | $ | — | $ | — | $ | — | $ | — | $ | — | $ | — | $ | 750,000 | ||||||||||||||
Total Benefit | $ | 5,140,244 | $ | — | $ | 3,640,244 | $ | 4,390,244 | $ | 5,140,244 | $ | — | $ | 9,452,744 | ||||||||||||||
Name | Non-Renewal(1) | For Cause or Voluntary Resignation(2) | Death(3) | Disability(4) | Without Cause or For Good Reason(5) | Change of Control (No Termination)(6) | Change of Control and Termination(7) | |||||||||||||||||||||
J. Marshall Dodson | ||||||||||||||||||||||||||||
Cash Severance | $ | 750,000 | $ | — | $ | — | $ | 375,000 | $ | 750,000 | $ | — | $ | 2,025,000 | ||||||||||||||
RSU(8) | $ | 1,804,294 | $ | — | $ | 1,804,294 | $ | 1,804,294 | $ | 1,804,294 | $ | — | $ | 1,804,294 | ||||||||||||||
Health & Welfare(9) | $ | 53,787 | $ | — | $ | 69,268 | $ | 71,716 | $ | 53,787 | $ | — | $ | 71,716 | ||||||||||||||
Total Benefit | $ | 2,608,081 | $ | — | $ | 1,873,562 | $ | 2,251,010 | $ | 2,608,081 | $ | — | $ | 3,901,010 | ||||||||||||||
Name | Non-Renewal(1) | For Cause or Voluntary Resignation(2) | Death(3) | Disability(4) | Without Cause or For Good Reason(5) | Change of Control (No Termination)(6) | Change of Control and Termination(7) | |||||||||||||||||||||
David Brunnert | ||||||||||||||||||||||||||||
Cash Severance | $ | 350,000 | $ | — | $ | 350,000 | $ | 350,000 | $ | 350,000 | $ | — | $ | 350,000 | ||||||||||||||
RSU(8) | $ | 1,414,800 | $ | — | $ | 1,414,800 | $ | 1,414,800 | $ | 1,414,800 | $ | — | $ | 1,414,800 | ||||||||||||||
Health & Welfare(9) | $ | 21,808 | $ | — | $ | 21,808 | $ | 21,808 | $ | 21,808 | $ | — | $ | 21,808 | ||||||||||||||
Total Benefit | $ | 1,786,608 | $ | — | $ | 1,786,608 | $ | 1,786,608 | $ | 1,786,608 | $ | — | $ | 1,786,608 | ||||||||||||||
Name | Non-Renewal(1) | For Cause or Voluntary Resignation(2) | Death(3) | Disability(4) | Without Cause or For Good Reason(5) | Change of Control (No Termination)(6) | Change of Control and Termination(7) | |||||||||||||||||||||
Scott P. Miller | ||||||||||||||||||||||||||||
Cash Severance | $ | 275,000 | $ | — | $ | 275,000 | $ | 275,000 | $ | 275,000 | $ | — | $ | 275,000 | ||||||||||||||
RSU(8) | $ | — | $ | — | $ | — | $ | — | $ | — | $ | 838,128 | ||||||||||||||||
Health & Welfare(9) | $ | — | $ | — | $ | — | $ | — | $ | — | $ | — | $ | 21,808 | ||||||||||||||
Total Benefit | $ | 275,000 | $ | — | $ | 275,000 | $ | 275,000 | $ | 275,000 | $ | — | $ | 1,134,936 | ||||||||||||||
124
Name | Non-Renewal(1) | For Cause or Voluntary Resignation(2) | Death(3) | Disability(4) | Without Cause or For Good Reason(5) | Change of Control (No Termination)(6) | Change of Control and Termination(7) | |||||||||||||||||||||
Katherine I. Hargis | ||||||||||||||||||||||||||||
Cash Severance | $ | 300,000 | $ | — | $ | 300,000 | $ | 300,000 | $ | 300,000 | $ | — | $ | 300,000 | ||||||||||||||
RSU(8) | $ | 766,350 | $ | — | $ | 766,350 | $ | 766,350 | $ | 766,350 | $ | — | $ | 766,350 | ||||||||||||||
Health & Welfare(9) | $ | 23,225 | $ | — | $ | 23,225 | $ | 23,225 | $ | 23,225 | $ | — | $ | 23,225 | ||||||||||||||
Total Benefit | $ | 1,089,575 | $ | — | $ | 1,089,575 | $ | 1,089,575 | $ | 1,089,575 | $ | — | $ | 1,089,575 | ||||||||||||||
_________________________
(1) | Represents compensation payable if Key does not renew the NEO’s employment agreement after the initial term or any extension of the agreement. |
(2) | Represents compensation payable if Key terminates the NEO’s employment for “Cause” or the NEO otherwise resigns without “Good Reason” as defined in the respective employment agreements. |
(3) | Represents compensation due to the NEO’s estate upon his or her death. |
(4) | Represents compensation payable to the NEO upon termination following determination of NEO’s permanent disability. |
(5) | Represents compensation due to the NEO if terminated by Key without “Cause” or for Messrs. Drummond and Dodson, if the NEO resigns for “Good Reason,” as each such term is defined in the respective employment and equity agreements. |
(6) | Represents payments due to the NEO in connection with a “Change of Control” (as defined in the respective employment and equity agreements) in which the NEO is not terminated. |
(7) | Represents payments due to the NEO if the NEO is terminated without “Cause” or for “Good Reason” in connection with a “Change of Control” (as such terms are defined in the respective employment and equity agreements). |
(8) | Represents the value of accelerated vesting of RSUs determined by multiplying the number of awards vesting by $11.79, the closing price on December 29, 2017 (and for performance-based RSUs, assuming target performance). |
(9) | Represents the value of health and welfare benefits at December 31, 2017 determined under each NEO’s employment agreement. |
(10) | Represents the benefit of a promotion award for Mr. Drummond pursuant to the Revised Promotion Bonus Agreement by and between the Company and Mr. Drummond, dated April 6, 2016. |
Director Compensation
Pursuant to the compensation program for independent directors adopted by our compensation committee in connection with the Company’s reorganization, our independent directors receive an annual fee equal to $125,000. The independent directors also receive an annual equity award having a fair market value of $125,000 (which for 2017 was granted in the form of RSUs), and are reimbursed for travel and other expenses directly associated with Key business. Additionally, the chair of the audit committee receives an additional $20,000 per year for his service. All members of the audit committee, excluding the chair receive an additional $10,000 per year for their service. All annual director fees are paid in quarterly installments. In January 2018, the compensation committee determined to grant an additional annual retainer to the Lead Director for his service in the amount of 676 shares of restricted stock equal to $10,000. This award was granted to Mr. Gaut on February 1, 2018 and will vest in four equal quarterly installments beginning March 31, 2018.
The following table discloses the cash and equity awards earned, paid or awarded, as the case may be, to each of our independent directors during the fiscal year ended December 31, 2017. As a director who is also an employee, Mr. Drummond received no additional compensation for his service as a director and, as directors who are not considered independent for NYSE purposes, Messrs. Norment, Kotzubei and Kelln and Ms. Sigler received no additional compensation for their services as a director; thus these directors are not included in the following table:
125
Fees Earned or Paid in Cash ($) | Stock Awards ($) (1) | |||||
Name | Total ($) | |||||
Scott D. Vogel | $125,000 | $— | $125,000 | |||
Sherman K. Edmiston III | $135,000 | $— | $135,000 | |||
H.H. Tripp Wommack, III | $145,000 | $— | $145,000 | |||
Steven H. Pruett | $135,000 | $— | $135,000 | |||
C. Christopher Gaut | $135,000 | $— | $135,000 | |||
_________________________
(1) | No grants were made to directors in 2017. In 2017, the compensation committee determined to grant the director’s annual equity awards relating to the 2017 calendar year on January 2, 2018. Due to SEC rules regarding timing of the disclosure of equity awards, the awards relating to the 2017 calendar year are not reflected within the table above. The January 2, 2018 grant to directors was made pursuant to the 2016 ECIP and consisted of 10,603 shares of RSUs granted to each non-employee director that will vest in four equal quarterly installments beginning March 31, 2018. Although the annual equity awards are based on a number of shares having a fair market value of $125,000 on the grant date of the award, because fractional shares are not granted, the amount of the award granted is slightly different than the target award amount. In addition, and as stated above, Mr. Gaut received an additional annual retainer for his service as Lead Director in the amount of 676 shares of restricted stock equal to $10,000. This award was granted to Mr. Gaut on February 1, 2018 and will vest in four equal quarterly installments beginning March 31, 2018. Because fractional shares are not granted, the amount of the award is slightly different than the target award amount. The January 2, 2018 and February 1, 2018 grants will be reflected within the Director Compensation table for the 2018 year. |
Compensation Committee Interlocks and Insider Participation
The compensation committee consists of Messrs. Kelln (chair), Kotzubei, Norment, Vogel and Wommack, all of whom are non-employee directors. None of the compensation committee members has served as an officer or employee of Key and none of Key’s executive officers has served as a member of a compensation committee or board of directors of any other entity that has an executive officer serving as a member of the Board. Because the Company currently qualifies as a “Controlled Company” under the NYSE Rule 303A, we are permitted, and have elected, to opt out of the NYSE rules that would otherwise require our compensation committee to be comprised entirely of independent directors. Both Messrs. Vogel and Wommack qualify as independent for NYSE purposes.
CEO Pay Ratio Calculations
As required by Section 953(b) of the Dodd-Frank Wall Street Reform and Consumer Protection Act, and Item 402(u) of Regulation S-K, we are providing the following information about the relationship of the annual total compensation of our employees and the annual total compensation of Robert Drummond, our Chief Executive Officer (our “CEO”).
For 2017, our last completed fiscal year:
• | The median of the annual total compensation of all employees of our Company (other than the CEO) was $56,999.82; and |
• | The annual total compensation of our CEO, as reported in the 2017 Summary Compensation Table included above in Part III of this Form 10-K, was $5,589,770. |
• | Based on this information, for 2017 the ratio of the annual total compensation of our CEO to the median of the annual total compensation of all employees was reasonably estimated to be 98.07 to 1. |
To identity the median of the annual total compensation of all our employees, as well as to determine the annual total compensation of our median employee and our CEO, we took the following steps:
• | We determined that, as of December 1, 2017, our employee population consisted of approximately 3009 individuals with all of these individuals located in the United States (as reported in Part I, Item 1 of this Form 10-K). This population consisted of our full-time, part-time, and temporary employees, as we do not have seasonal workers. |
126
• | We identified our median employee by comparing the amount of salary or wages (including overtime pay) reflected in our payroll records as reported to the Internal Revenue Service on Form W-2 for 2017. We did not include the value of annual equity award grants as such awards are not widely distributed to our employees. |
• | After we identified our median employee, we calculated the median employee’s annual total compensation using the same methodology that we used to determine our CEO’s total compensation for the 2017 Summary Compensation Table, resulting in annual total compensation of $57,105. The difference between our median employee’s salary, wages and overtime pay and the employee’s annual total compensation represents the estimated value of such employee’s health care benefits (estimated for the employee and such employee’s eligible dependents at $105) for the 2017 year). |
With respect to the annual total compensation of our CEO, we used the amount reported in the “Total” column of our 2017 Summary Compensation Table included in Part III of this Form 10-K.
ITEM 12. SECURITY OWNERSHIP OF CERTAIN BENEFICIAL OWNERS AND MANAGEMENT AND RELATED STOCKHOLDER MATTERS
Stock Ownership of Certain Beneficial Owners and Management
This section provides information about the beneficial ownership of our common stock by our directors and executive officers. The number of shares of our common stock beneficially owned by each person is determined under the rules of the SEC, and the information is not necessarily indicative of beneficial ownership for any other purpose. Under these rules, beneficial ownership includes any shares as to which the individual has sole or shared voting power or investment power and also any shares that the individual has the right to acquire within 60 days through the exercise of any stock options or other rights. Unless otherwise indicated, each person has sole investment and voting power, or shares such power with his or her spouse, with respect to the shares set forth in the following table. The inclusion in this table of any shares deemed beneficially owned does not constitute an admission of beneficial ownership of those shares.
The address for each person identified below is care of Key Energy Services, Inc., 1301 McKinney Street, Suite 1800, Houston, Texas 77010.
Throughout this Form 10-K, the individuals who served as our Principal Executive Officer and Principal Financial Officer during fiscal year 2017, and each of our other most highly compensated executive officers that are required to be in our executive compensation disclosures in fiscal year 2017 are referred to as the “Named Executive Officers” or “NEOs.”
Set forth below is certain information with respect to beneficial ownership of our common stock as of February 1, 2018 by each of our NEOs, each of our directors, as well as the directors and all executive officers as a group:
127
Total Beneficial Ownership (1) | Percent of Outstanding Shares (2) | ||||||
Name of Beneficial Owner | |||||||
Non-Management Directors: | |||||||
Scott D. Vogel (3) | 31,558 | * | |||||
Sherman K. Edmiston III (4) | 6,558 | * | |||||
H.H. Tripp Wommack III (5) | 6,113 | * | |||||
Steven H. Pruett (6) | 6,558 | * | |||||
C. Cristopher Gaut (7) | 6,727 | * | |||||
Bryan Kelln | — | * | |||||
Jacob Kotzubei | — | * | |||||
Philip Norment | — | * | |||||
Mary Ann Sigler | — | * | |||||
Named Executive Officers: | |||||||
Robert W. Drummond (8) | 118,335 | * | |||||
J. Marshall Dodson (9) | 59,896 | * | |||||
David Brunnert (10) | 24,408 | * | |||||
Scott P. Miller (11) | 24,086 | * | |||||
Katherine I. Hargis (12) | 12,345 | * | |||||
Current Directors and NEOs as a group (14 Persons): | 296,584 | 1.47% | |||||
*Less than 1% | |||||||
(1) | Includes all shares with respect to which each director or executive officer directly or indirectly, through any contract, arrangement, understanding, relationship or otherwise, has or shares the power to vote or to direct voting of such shares and/or the power to dispose or to direct the disposition of such shares. Includes shares that may be purchased under stock options and/or warrants that are exercisable currently or within 60 days after February 1, 2018. |
(2) | An individual’s percentage ownership of common stock outstanding is based on 20,217,661 shares of our common stock outstanding as of February 1, 2018. Shares of common stock subject to stock options and warrants currently exercisable or exercisable within 60 days, are deemed outstanding for purposes of the percentage ownership of the person holding such securities but are not deemed outstanding for computing the percentage ownership of any other person. |
(3) | Includes 2,651 unvested restricted stock units. |
(4) | Includes 2,651 unvested restricted stock units. |
(5) | Includes 2,651 unvested restricted stock units. |
(6) | Includes 2,651 unvested restricted stock units. |
(7) | Includes 2,820 unvested restricted stock units. |
(8) | Includes 29,212 shares of common stock issuable upon the exercise of warrants and includes 50,212 shares of common stock issuable upon the exercise of options. |
(9) | Includes 13,786 shares of common stock issuable upon the exercise of warrants and includes 25,508 shares of common stock issuable upon the exercise of options. |
(10) | Includes 15,800 shares of common stock issuable upon the exercise of options. |
128
(11) | Includes 3,632 shares of common stock issuable upon the exercise of warrants and includes 11,848 shares of common stock issuable upon the exercise of options. |
(12) | Includes 1,852 shares of common stock issuable upon the exercise of warrants and includes 9,876 shares of common stock issuable upon the exercise of options. |
The following table sets forth, certain information regarding the beneficial ownership of common stock by each person, other than our directors or executive officers, who is known by us to beneficially own more than 5% of the outstanding shares of our common stock.
Shares Beneficially Owned | |||||
Name and Address of Beneficial Owner | Number | Percent | |||
Soter Capital, LLC (1) | 9,800,630 | 48.48 | % | ||
360 North Crescent Drive, South Building | |||||
Beverly Hills, CA 90210 | |||||
Contrarian Funds (2) | 2,376,935 | 11.76 | % | ||
411 West Putnam Avenue, Suite 425 | |||||
Greenwich, CT 06830 | |||||
Quantum Partners (3) | 1,318,474 | 6.52 | % | ||
250 West 55th Street, 38th Floor | |||||
New York, NY 10019 | |||||
Silver Point Funds (4) | 1,223,496 | 6.05 | % | ||
Two Greenwich Plaza | |||||
Greenwich, CT 06830 | |||||
Goldman Sachs Reporting Units (5) | 1,038,308 | 5.14 | % | ||
200 West Street | |||||
New York, NY 10282 | |||||
(1) | Number of shares beneficially owned is based solely on a Schedule 13D filed with the SEC on December 27, 2016 on behalf of each of: (i) Soter Capital, LLC, a Delaware limited liability company, (ii) Soter Capital Holdings, LLC, a Delaware limited liability company, (iii) PE Soter Holdings, LLC, a Delaware limited liability company, (iv) Platinum Equity Capital Soter Partners, L.P., a Delaware limited partnership, (v) Platinum Equity Partners III, LLC, a Delaware limited liability company, (vi) Platinum Equity Investment Holdings III, LLC, a Delaware limited liability company, (vii) Platinum Equity, LLC, a Delaware limited liability company and (viii) Tom Gores, an individual. |
(2) | Number of shares beneficially owned is based solely on a Schedule 13G filed with the SEC on December 27, 2016 on behalf of Contrarian Capital Management, L.L.C. and Contrarian Capital Fund I, L.P. |
(3) | Includes 5,752 shares underlying warrants to purchase shares of Key common stock. Number of shares beneficially owned is based solely on a Schedule 13G/A filed with the SEC on February 14, 2017 on behalf of Soros Fund Management LLC, George Soros and Robert Soros relating to shares held for the account of Quantum Partners LP, a Cayman Islands exempted limited partnership. |
(4) | Number of shares beneficially owned is based solely on a Schedule 13G/A filed jointly with the SEC on February 14, 2017 by Silver Point Capital, L.P., Mr. Edward A. Mule and Mr. Robert J. O’Shea with respect to ownership of the common stock of the Company by Silver Point Capital Fund., L.P. and Silver Point Capital Offshore Master Fund. |
129
(5) | Number of shares beneficially owned is based solely on a Schedule 13G filed jointly with the SEC on February 7, 2018 by the Goldman Sachs Group, Inc. and Goldman Sachs & Co. LLC relating to securities beneficially owned by certain operating units (collectively, the “Goldman Sachs Reporting Units”) of the Goldman Sachs Group, Inc. and its subsidiaries and affiliates. The Goldman Sachs Reporting Units disclaim beneficial ownership of the securities beneficially owned by (i) any client accounts with respect to which the Goldman Sachs Reporting Units or their employees have voting or investment discretion or both, or with respect to which there are limits on their voting or investment authority or both and (ii) certain investment entities of which the Goldman Sachs Reporting Units act as the general partner, managing general partner or other manager, to the extent interests in such entities are held by persons other than the Goldman Sachs Reporting Units. |
We have not made any independent determination as to the beneficial ownership of each stockholder, and are not restricted in any determination we may make by reason of inclusion of such stockholder or its shares in this table.
ITEM 13. CERTAIN RELATIONSHIPS AND RELATED TRANSACTIONS, AND DIRECTOR INDEPENDENCE
Certain Relationships and Related Party Transactions Related to Our Reorganization
On the Effective Date, pursuant to the Plan, the Company issued to former holders of the Predecessor Company’s 6.75% senior notes, in exchange for the cancellation and discharge of such notes, 7,500,000 shares of the Successor Company’s common stock. The Successor Company also issued 11,769,014 shares of the Successor Company’s common stock to certain participants in rights offerings conducted pursuant to the Plan. As a result of these issuances, on the Effective Date, a number of former holders of the Predecessor Company’s senior notes became beneficial owners of greater than 5% of the Successor Company’s common stock, including (i) Soter, (ii) certain funds managed by Contrarian Capital Management, L.L.C. (the “Contrarian Funds”), (iii) Quantum Partners LP (“Quantum”), and (iv) certain funds managed by Silver Point Capital, L.P. (the “Silver Point Funds,” and collectively with Soter, the Contrarian Funds and Quantum, the “Initial 5% Holders”). In addition, on February 7, 2018, The Goldman Sachs Group, Inc. (the “GS Group”) reported that certain operating units of the GS Group and its affiliates became beneficial owners of greater than 5% of the Successor Company’s common stock.
Term Loan Facility
On the Effective Date, the Company entered into the Term Loan Facility among the Company, as borrower, certain subsidiaries of the Company named as guarantors therein, Cortland Capital Market Services LLC and Cortland Products Corp., as agents for the lenders, and certain financial institutions party thereto as lenders, including certain affiliates of the Contrarian Funds, the Silver Point Funds and Quantum. Affiliates of the Silver Point Funds, Quantum and the Contrarian Funds own approximately $69.39 million, $26.41 million and $1.25 million, respectively, of the $250 million outstanding principal amount of the Term Loan Facility. Please refer to the disclosure in the “Liquidity and Capital Resources” section of “Item 7. Management’s Discussion and Analysis of Financial Condition and Results of Operations” for a discussion of the material terms of the Term Loan Facility.
Registration Rights Agreement
On the Effective Date, the Company entered into the Registration Rights Agreement with certain stockholders of the Successor Company, including the Initial 5% Holders and an affiliate of the GS Group. Pursuant to the Registration Rights Agreement, Key committed to file a resale shelf registration statement covering all Registrable Securities (as defined in the Registration Rights Agreement) of each stockholder party to the Registration Rights Agreement (each such party, together with its permitted transferees, a “Rights Agreement Party”) by no later than March 6, 2017. Key filed a shelf registration statement covering shares owned by all Rights Agreement Parties other than Soter on March 6, 2017 and the shelf registration statement was declared effective on April 13, 2017. On August 29, 2017, in light of the fact that the holding period prescribed by Rule 144 under the Securities Act of 1933 had expired for all Rights Agreement Parties other than Soter, the Rights Agreement Parties amended the Registration Rights Agreement to terminate the Company’s obligation to keep a registration statement continuously effective. The amendment also provided that if the safe harbor provisions of Rule 144 become unavailable to any Rights Agreement Party, such that the Rights Agreement Party can no longer sell shares without limitations on volume or manner of sale or a notice requirement, then the obligations related to filing and keeping effective a shelf registration statement will be reinstated. On September 5, 2017, the Company terminated the shelf registration statement filed on March 6, 2017.
To the extent Key does not have available such an effective shelf registration statement, each Rights Agreement Party that holds Registrable Securities will have two demand registration rights per calendar year (subject to customary blackout periods); provided that any such demand must be for an offering of at least $12.5 million of estimated gross proceeds (taking into account
130
the requests of all requesting Rights Agreement Parties); provided, further, that in no event will Key be required to comply with more than one demand by any Rights Agreement Party (other than Soter, Platinum and its other affiliates) in any six-month period.
Key is also required to effect underwritten offerings pursuant to shelf takedowns (if a shelf registration statement is then in effect) and demands by the Rights Agreement Parties. Key will not be required to facilitate an underwritten offering facilitated by marketing efforts on the part of Key (a “Marketed Underwritten Offering”) unless the proceeds to all requesting Rights Agreement Parties from such offering are at least $12.5 million. Furthermore, Key will not be required to effect (i) more than two Marketed Underwritten Offerings in any calendar year or more than six Marketed Underwritten Offerings in the aggregate, or (ii) more than four underwritten offerings other than Marketed Underwritten Offerings in any calendar year or more than eight underwritten offerings that are not Marketed Underwritten Offerings in the aggregate, in each case of (i) and (ii), as requested by any Rights Agreement Party other than Soter, Platinum and its other affiliates.
The Rights Agreement Parties have certain piggyback registration rights, and the Registration Rights Agreement also includes customary indemnification provisions. The Registration Rights Agreement will terminate with respect to any Rights Agreement Party when such party ceases to hold or beneficially own Registrable Securities.
Corporate Advisory Services Agreement
On the Effective Date, the Company entered into the CASA with Platinum, an affiliate of Soter. Pursuant to the CASA, Platinum will provide certain business advisory services to Key, and Key, as consideration therefor, will pay Platinum an advisory fee of $2.75 million per year (subject to certain limitations and adjustments). In addition, Key will reimburse Platinum for ordinary course, reasonable and documented out-of-pocket expenses of up to an aggregate amount of $375,000, on an annual basis, subject to certain limitations.
The CASA has an initial term commencing on the Effective Date and ending on December 31, 2019. Thereafter, the independent members of the Board will have the option to renew the CASA for additional one-year terms, with each such extended term ending on December 31 of the subsequent year. The CASA may be terminated by Platinum upon 90-days’ written notice, and automatically terminates 45 days after the date Platinum owns less than 33% of the outstanding shares of our common stock.
Relationships and Transactions with Other Related Persons
Mr. C. Christopher Gaut joined our Board on December 15, 2016, Mr. Gaut served as the Chairman and Chief Executive Officer of Forum until May of 2017. Forum owns approximately 100% of Global Tubing, LLC (“Global”), an equipment supplier of the Company. Sales to Key from Global were approximately $1.8 million for the year ended December 31, 2017. Transactions with Global for their equipment supplies are made on terms consistent with other equipment suppliers. The Board has determined that our relationship with Global did not affect the independence of Mr. Gaut and that Mr. Gaut qualifies as “independent” in accordance with NYSE listing standards.
Review and Approval Policies and Procedures for Related Party Transactions
Bylaw Provisions Regarding Related Party Transactions
Our bylaws, which were amended and restated on the Effective Date, require the approval of a Supermajority (as defined below) of the Board for the Company to enter into any transaction with related parties of Key, Platinum or any Related Advisor (as defined below), except for (i) compensation agreements with directors in the ordinary course of business, and (ii) arm’s-length commercial transactions in the ordinary course of business between any Platinum portfolio company and the Company if the aggregate transaction does not exceed $1 million per calendar year. “Related Advisor” means (i) any affiliates, current employees and certain former employees of Platinum, (ii) any person or entity that earns more than 50% of its annual revenue from Platinum or its affiliates or (iii) Palm Tree Advisors LLC or any of its successors or affiliates.
During the Initial Board Term, if our CEO is currently serving on the Board, then “Supermajority” Board approval means at least nine of the thirteen director votes, including (i) at least seven votes cast by Soter Directors, (ii) at least two votes cast by directors who are not Soter Directors and (iii) at least one vote cast by an Other Director.
131
Our Affiliate Transaction Policy
Our Affiliate Transaction Policy requires advance review and approval of any proposed transactions (other than employee or director compensation) between Key and an affiliate of Key. For this purpose, affiliates include major stockholders, directors and executive officers and members of their immediate family (including in-laws), nominees for director, and affiliates of the foregoing persons, as determined in accordance with SEC rules. In determining whether to approve an affiliate transaction, the Board will use such processes as it deems reasonable in light of the circumstances, such as the nature of the transaction and the affiliate involved, which may include an analysis of any auction process involved, an analysis of market comparables, use of an appraisal, obtaining an investment banking opinion or a review by independent counsel. The policy requires the Board to determine that, under all of the circumstances, the covered transaction is in, or not inconsistent with, the best interests of Key, and requires approval of covered transactions by a majority of the Board (excluding any interested directors). The Board, in its discretion, may delegate this authority to the NGC or another committee comprised solely of independent directors, as appropriate.
In addition, we require each of our directors and executive officers to complete an annual Directors and Officers Questionnaire to describe certain information and relationships (including those involving their immediate family members) that may be required to be disclosed in our Form 10-K, annual proxy statement and other filings with the SEC. Director nominees and newly appointed executive officers must complete the questionnaire at or before the time they are nominated or appointed. Directors and executive officers must immediately report to Key any changes to the information reported in their questionnaires arising throughout the year, including changes in relationships between immediate family members and Key, compensation paid from third parties for services rendered to Key not otherwise disclosed, interests in certain transactions and other facts that could affect director independence. Directors are required to disclose in the questionnaire, among other things, any transaction that the director or any immediate family member has entered into with Key or relationships that a director or an immediate family member has with Key, whether direct or indirect. This information is provided to our legal department for review and, if required, submitted to the Board for the process of determining independence.
ITEM 14. | PRINCIPAL ACCOUNTING FEES AND SERVICES |
Fees of Independent Registered Public Accounting Firm
Audit Fees
Effective December 1, 2006, Grant Thornton LLP was engaged as our independent registered public accounting firm. The following table sets forth the fees for the fiscal period to which the fees relate. The audit committee approved all such fees in accordance with the Audit and Non-Audit Services Pre-Approval Policy described below.
2017 | 2016 (1) | |||||
Audit fees | $ | 1,129,000 | $ | 1,243,440 | ||
Audit-related fees | — | — | ||||
Tax fees | — | — | ||||
All other fees | — | — | ||||
Total | $ | 1,129,000 | $ | 1,243,440 | ||
(1) | Includes estimated fees of $4,950 for the 2016 statutory audit of our Colombian branch, fees of $7,490 for the 2016 statutory audit of our Dubai subsidiary, and fees of $21,000 for the 2016 statutory audit of our Russian subsidiaries. |
Audit fees consist of professional services rendered for the audit of our annual financial statements, the audit of the effectiveness of our internal control over financial reporting and the reviews of the quarterly financial statements. This category also includes fees for issuance of comfort letters, consents, assistance with and review of documents filed with the SEC, statutory audit fees, work done by tax professionals in connection with the audit and quarterly reviews and accounting consultations and research work necessary to comply with the standards of the Public Company Accounting Oversight Board. Fees are generally presented in the period to which they relate as opposed to the period in which they were billed. Other services performed include certain advisory services and do not include any fees for financial information systems design and implementation.
Policy for Pre-Approval of Audit and Non-Audit Fees
The audit committee has an Audit and Non-Audit Services Pre-Approval Policy. The policy requires the audit committee to pre-approve the audit and non-audit services performed by our independent registered public accounting firm. Under the policy,
132
the audit committee establishes the audit, audit-related, tax and all other services that have the approval of the audit committee. The term of any such pre-approval is twelve months from the date of pre-approval, unless the audit committee adopts a shorter period and so states. The audit committee will periodically review the list of pre-approved services and will add to or subtract from the list of pre-approved services from time to time. The audit committee will also establish annually pre-approval fee levels or budgeted amounts for all services to be provided by the independent registered public accounting firm. Any proposed services exceeding these levels or amounts will require specific pre-approval by the audit committee.
The audit committee has delegated to its chair the authority to pre-approve services, not previously pre-approved by the audit committee, that involve aggregate payments (with respect to each such service or group of related services) of $50,000 or less. The chair will report any such pre-approval to the audit committee at its next scheduled meeting.
The policy contains procedures for a determination by the CFO that proposed services are included within the list of services that have received pre-approval of the audit committee. Proposed services that require specific approval by the audit committee must be submitted jointly by the independent registered public accounting firm and the CFO and must include backup statements and documentation regarding the proposed services and whether the proposed services are consistent with SEC and NYSE rules on auditor independence.
Report of the Audit Committee
The audit committee has reviewed the Company’s audited financial statements for the fiscal year ended December 31, 2017 and has discussed these financial statements with the Company’s management and independent registered public accounting firm.
The audit committee has also received from, and discussed with, Grant Thornton LLP, the Company’s independent registered public accounting firm, various communications that the Company’s independent registered public accounting firm is required to provide to the audit committee, including the matters required to be discussed by Statement on Auditing Standards No. 61, as amended (AICPA, Professional Standards, Vol. 1. AU section 380), as adopted by the Public Company Accounting Oversight Board in Rule 3200T.
The Company’s independent registered public accounting firm also provided the audit committee with the written disclosures required by Public Company Accounting Oversight Board Rule 3526 (Communication with Audit Committees Concerning Independence). The audit committee has discussed with the independent registered public accounting firm their independence from Key.
As set forth in the audit committee charter, it is not the responsibility of the audit committee to plan or conduct audits or to determine that the Company’s financial statements and disclosures are complete and accurate and are in accordance with GAAP and applicable laws, rules and regulations. It is furthermore not the responsibility of the audit committee to maintain the accounting and financial reporting principles and policies and internal controls and procedures that provide for compliance with accounting standards and applicable laws and regulations, or to plan and carry out the audit of the Company’s internal control over financial reporting. These are the responsibilities of management, the internal auditor and the independent registered public accounting firm.
Furthermore, the members of the audit committee are not full-time employees of the Company and are not performing the functions of auditors or accountants. As such, it is not the responsibility of the audit committee or its members to conduct “field work” or other types of auditing or accounting reviews or procedures or to set auditor independence standards. Members of the audit committee necessarily rely on the information provided to them by management and the independent registered public accounting firm. Accordingly, the audit committee’s considerations and discussions referred to above do not assure that the audits of the Company’s financial statements and internal control over financial reporting have been carried out in accordance with generally accepted auditing standards, that the financial statements are presented in accordance with GAAP or that the Company’s auditors are in fact “independent.”
Based on the reports and discussions described in this report, and subject to the limitations on the role and responsibilities of the audit committee referred to above and in the audit committee charter, the audit committee recommended to the Board of Directors of the Company that the audited financial statements be included in the Company’s Annual Report on Form 10-K for the year ended December 31, 2017.
133
By the Audit Committee of the Board of Directors | |
H.H. Tripp Wommack, III, Chair Steven H. Pruett C. Christopher Gaut Sherman K. Edmiston, III | |
PART IV
ITEM 15. EXHIBITS, FINANCIAL STATEMENT SCHEDULES
The following financial statements and exhibits are filed as part of this report:
1. Financial Statements — See “Index to Consolidated Financial Statements” at Page 45.
2. We have omitted all financial statement schedules because they are not required or are not applicable, or the required information is shown in the financial statements or the notes to the financial statements.
3. Exhibits
The Exhibit Index, which follows the signature pages to this report and is incorporated by reference herein, sets forth a list of exhibits to this report.
134
ITEM 16. FORM 10-K SUMMARY
Not applicable.
EXHIBIT INDEX
Exhibit No. | Description | |
2.1 | ||
2.2 | ||
3.1 | ||
3.2 | ||
4.1.1 | ||
4.1.2 | ||
4.1.3 | ||
4.1.4 | ||
4.1.5 | ||
4.2 | ||
4.3 | ||
10.1 | ||
10.2 | ||
135
Exhibit No. | Description | |
10.3.1 | ||
10.3.2 | ||
10.3.3 | ||
10.3.4 | ||
10.3.5 | ||
10.3.6 | ||
10.3.7 | ||
10.3.8 | ||
10.3.9 | ||
136
Exhibit No. | Description | |
10.4.1† | ||
10.4.2† | ||
10.4.3† | ||
10.4.4† | ||
10.4.5† | ||
10.4.6† | ||
10.4.7† | ||
10.4.8† | ||
10.4.9† | ||
10.4.10† | ||
10.4.11† | ||
10.4.12† | ||
10.4.13† | ||
137
Exhibit No. | Description | |
10.5.1 | ||
10.5.2 | ||
10.5.3 | ||
10.5.4 | ||
10.6† | ||
21* | ||
23* | ||
31.1* | ||
31.2* | ||
32* | ||
101* | Interactive Data File. | |
† | Indicates a management contract or compensatory plan, contract or arrangement in which any Director or any Executive Officer participates. | |
* | Filed herewith. | |
138
SIGNATURES
Pursuant to the requirements of Section 13 or 15(d) of the Securities Exchange Act of 1934, the registrant has duly caused this report to be signed on its behalf by the undersigned, thereunto duly authorized.
KEY ENERGY SERVICES, INC.
By: | /s/ J. MARSHALL DODSON | |
J. Marshall Dodson, | ||
Senior Vice President and Chief Financial Officer (As duly authorized officer and Principal Financial Officer) | ||
Date: February 28, 2018
POWER OF ATTORNEY
Each person whose signature appears below hereby constitutes and appoints Robert Drummond and J. Marshall Dodson, and each of them, his true and lawful attorney-in-fact and agent, with full powers of substitution, for him and in his name, place and stead, in any and all capacities, to sign any and all amendments to this Annual Report on Form 10-K, and to file the same, with all exhibits thereto, and other documents in connection therewith, with the Securities and Exchange Commission granting to said attorneys-in-fact, and each of them, full power and authority to perform any other act on behalf of the undersigned required to be done in connection therewith.
139
Pursuant to the requirements of the Securities Exchange Act of 1934, this report has been signed below by the following persons on behalf of the registrant in their capacities and on February 28, 2018.
Signature | Title | |
/s/ PHILIP NORMENT | Chairman | |
Philip Norment | ||
/s/ ROBERT DRUMMOND | Director | |
Robert Drummond | President and Chief Executive Officer | |
(Principal Executive Officer) | ||
/s/ J. MARSHALL DODSON | Senior Vice President and Chief Financial Officer | |
J. Marshall Dodson | (Principal Financial Officer) | |
/s/ EDDIE PICARD | Vice President and Controller | |
Eddie Picard | (Principal Accounting Officer) | |
/s/ SHERMAN K. EDMISTON, III | Director | |
Sherman K. Edmiston, III | ||
/s/ C. CHRISTOPHER GAUT | Director | |
C. Christopher Gaut | ||
/s/ BRYAN KELLN | Director | |
Bryan Kelln | ||
/s/ JACOB KOTZUBEI | Director | |
Jacob Kotzubei | ||
/s/ STEVEN H. PRUETT | Director | |
Steven H. Pruett | ||
/s/ MARY ANN SIGLER | Director | |
Mary Ann Sigler | ||
/s/ SCOTT D. VOGEL | Director | |
Scott D. Vogel | ||
/s/ H.H. TRIPP WOMMACK, III | Director | |
H.H. Tripp Wommack, III | ||
140