Attached files
| file | filename |
|---|---|
| EX-32.2 - EXHIBIT 32.2 - John Bean Technologies CORP | a123117-jbtexhibit322.htm |
| EX-32.1 - EXHIBIT 32.1 - John Bean Technologies CORP | a123117-jbtexhibit321.htm |
| EX-31.2 - EXHIBIT 31.2 - John Bean Technologies CORP | a123117-jbtexhibit312.htm |
| EX-31.1 - EXHIBIT 31.1 - John Bean Technologies CORP | a123117-jbtexhibit311.htm |
| EX-23.1 - EXHIBIT 23.1 - John Bean Technologies CORP | a123117-jbtexhibit231.htm |
| EX-21.1 - EXHIBIT 21.1 - John Bean Technologies CORP | a123117-jbtexhibit211.htm |
| EX-10.17A - EXHIBIT 10.17A - John Bean Technologies CORP | a123117-jbtexhibiit1017a.htm |
UNITED STATES |
SECURITIES AND EXCHANGE COMMISSION |
Washington, D.C. 20549 |
FORM 10-K |
(Mark One) | |
☒ | ANNUAL REPORT PURSUANT TO SECTION 13 OR 15(d) OF THE SECURITIES EXCHANGE ACT OF 1934 |
For the fiscal year ended December 31, 2017
OR
☐ | TRANSITION REPORT PURSUANT TO SECTION 13 OR 15(d) OF THE SECURITIES EXCHANGE ACT OF 1934 |
Commission file number: 1-34036
John Bean Technologies Corporation
(Exact name of registrant as specified in its charter)
Delaware | 91-1650317 | |
(State or other jurisdiction of incorporation or organization) | (I.R.S. Employer Identification Number) | |
70 West Madison Street
Chicago, IL 60602
(Address of principal executive offices)
(312) 861-5900
(Registrant’s telephone number, including area code)
Securities registered pursuant to Section 12(b) of the Act: | ||
Title of Each Class | Name of Exchange on Which Registered | |
Common Stock, $0.01 par value Preferred Share Purchase Rights | New York Stock Exchange New York Stock Exchange | |
Securities registered pursuant to Section 12(g) of the Act: None
Indicate by check mark if the registrant is a well-known seasoned issuer as defined in Rule 405 of the Securities Act. Yes ☒ No ☐
Indicate by check mark if the registrant is not required to file reports pursuant to Section 13 or Section 15(d) of the Act. Yes ☐ No ☒
Indicate by check mark whether the registrant (1) has filed all reports required to be filed by Section 13 or 15(d) of the Securities Exchange Act of 1934 during the preceding 12 months (or for such shorter period that the registrant was required to file such reports), and (2) has been subject to such filing requirements for the past 90 days. Yes ☒ No ☐
Indicate by check mark whether the registrant has submitted electronically and posted on its corporate Web site, if any, every Interactive Data File required to be submitted and posted pursuant to Rule 405 of Regulation S-T during the preceding 12 months (or for such shorter period that the registrant was required to submit and post such files). Yes ☒ No ☐
Indicate by check mark if disclosure of delinquent filers pursuant to Item 405 of Regulation S-K is not contained herein, and will not be contained, to the best of the registrant’s knowledge, in definitive proxy or information statements incorporated by reference in Part III of this Form 10-K or any amendment to this Form 10-K. ☒
Indicate by check mark whether the registrant is a large accelerated filer, an accelerated filer, a non-accelerated filer, smaller reporting company, or an emerging growth company. See definitions of “large accelerated filer,” “accelerated filer,” “smaller reporting company,” and "emerging growth company" in Rule 12b-2 of the Exchange Act.
Large accelerated filer ☒ | Accelerated filer ☐ | Non-accelerated filer ☐ | Smaller reporting company ☐ | Emerging growth company ☐ |
If an emerging growth company, indicate by check mark if the registrant has elected not to use the extended transition period for complying with any new or revised financial accounting standards provided pursuant to Section 13(a) of the Exchange Act. ☐ | ||||
Indicate by check mark whether the registrant is a shell company (as defined in Rule 12b-2 of the Exchange Act). Yes ☐ No ☒
The aggregate market value of common stock held by non-affiliates of the registrant on the last business day of the registrant’s most recently completed second fiscal quarter was: $3,034,429,468.
At February 26, 2018, there were 31,577,182 shares of the registrant’s common stock outstanding.
DOCUMENTS INCORPORATED BY REFERENCE
Portions of the registrant’s Proxy Statement for the 2018 Annual Meeting of Stockholders are incorporated herein by reference in Part III of this Annual Report on Form 10-K to the extent stated herein.
TABLE OF CONTENTS
Page | ||
Item 9B. Other Information | ||
Item 16. Form 10-K Summary | ||
2
SPECIAL NOTE ABOUT FORWARD-LOOKING STATEMENTS
This Annual Report on Form 10-K and other materials filed or to be filed by John Bean Technologies Corporation, as well as information in oral statements or other written statements made or to be made by us, contain statements that are, or may be considered to be, forward-looking statements. All statements that are not historical facts, including statements about our beliefs or expectations regarding future performance, strategic plans, income, earnings, cash flows, restructuring and optimization plans and related cost savings, operating improvements, and covenant compliance are forward-looking statements. You can identify these forward-looking statements by the use of forward-looking words such as “outlook,” “believes,” “expects,” “potential,” “continues,” “may,” “will,” “should,” “seeks,” “approximately,” “predicts,” “intends,” “plans,” “estimates,” “anticipates,” “foresees” or the negative version of those words or other comparable words and phrases. Any forward-looking statements contained in this Annual Report on Form 10-K are based upon our historical performance and on current plans, estimates and expectations. The inclusion of this forward-looking information should not be regarded as a representation by us or any other person that the future plans, estimates or expectations contemplated by us will be achieved. There are factors that could cause our actual results to differ materially from these forward-looking statements, including but not limited to the factors we describe herein, including under “Risk Factors,” and “Management’s Discussion and Analysis of Financial Condition and Results of Operations,” and the following factors:
• | Fluctuations in our financial results; |
• | Unanticipated delays or acceleration in our sales cycles; |
• | Deterioration of economic conditions; |
• | Sensitivity of segments to variable or volatile factors; |
• | Changes in demand for our products and services; |
• | Changes in commodity prices, including those impacting materials used in our business; |
• | Disruptions in the political, regulatory, economic and social conditions of the foreign countries in which we conduct business; |
• | Increases in energy prices; |
• | Changes in food consumption patterns; |
• | Impacts of pandemic illnesses, food borne illnesses and diseases to various agricultural products; |
• | Weather conditions and natural disasters; |
• | Acts of terrorism or war; |
• | Termination or loss of major customer contracts; |
• | Customer sourcing initiatives; |
• | Competition and innovation in our industries; |
• | Our ability to develop and introduce new or enhanced products and services; |
• | Difficulty in developing, preserving and protecting our intellectual property; |
• | Our ability to protect our information systems; |
• | Adequacy of our internal controls; |
• | Our ability to successfully integrate, operate and manage acquired businesses and assets; |
• | Loss of key management and other personnel; |
• | Potential liability arising out of the installation or use of our systems; |
• | Our ability to comply with the laws and regulations governing our U.S. government contracts; |
• | Our ability to comply with U.S. and international laws governing our operations and industries; |
• | The outcome of pending or future litigation; |
• | Increases in tax liabilities; |
• | Difficulty in implementing our business strategies; and |
• | Availability and access to financial and other resources. |
If one or more of those or other risks or uncertainties materialize, or if our underlying assumptions prove to be incorrect, actual results may vary materially from what we projected. Consequently, actual events and results may vary significantly from those included in or contemplated or implied by our forward-looking statements. The forward-looking statements included in this Annual Report on Form 10-K are made only as of the date hereof, and we undertake no obligation to publicly update or review any forward-looking statement made by us or on our behalf, whether as a result of new information, future developments, subsequent events or circumstances or otherwise.
3
PART I
Unless otherwise specified or indicated by the context, JBT Corporation, JBT, we, us, our and the Company refer to John Bean Technologies Corporation and its subsidiaries.
ITEM 1. BUSINESS
We are a leading global technology solutions provider to high-value segments of the food and beverage industry with focus on proteins, liquid foods and automated system solutions. JBT designs, produces and services sophisticated products and systems for multi-national and regional customers through its FoodTech segment. JBT also sells critical equipment and services to domestic and international air transportation customers through its AeroTech segment.
The product offerings of our FoodTech businesses include:
• | Protein. Providing comprehensive solutions to our customers, our Protein technology offerings include chilling, mixing/grinding, injecting, marinating, tumbling, portioning, packaging, coating, frying, freezing, weighing, X-ray food inspection, and packaging systems for poultry, beef, pork and seafood, as well as ready-to-eat meals, fruits, vegetables, dairy, and bakery products. |
• | Liquid Foods. Our Liquid Foods portfolio includes fruit and juice solutions that extract, concentrate and aseptically process citrus, tomato and other fruits, vegetables, and juices. It also includes in-container solutions for the filling, closing and preservation of fruits, vegetables, soups, sauces, dairy, and pet food products as well as ready-to-eat meals in a wide variety of modern packages. Strategic acquisitions completed in 2017 added significant capabilities in the powder filling and high pressure processing segments to our product portfolio. |
• | Automated Systems. We also provide stand-alone, fully-integrated, and dual-mode robotic automated guided vehicle systems for material movement requirements with a wide variety of applications including manufacturing and warehouse facilities. |
JBT AeroTech markets its solutions and services to domestic and international airport authorities, passenger airlines, airfreight and ground handling companies, military forces and defense contractors. The product offerings of our AeroTech businesses include:
• | Mobile Equipment. JBT AeroTech’s portfolio of mobile air transportation equipment includes commercial and military cargo loading, aircraft deicing, aircraft towing, and aircraft ground power and cooling systems. |
• | Fixed Equipment. JBT AeroTech provides gate equipment for passenger boarding. |
• | Airport Services. JBT AeroTech also maintains the maintenance of airport equipment, systems, and facilities. |
For financial information about our business segments see Note 16. Business Segments of our Consolidated Financial Statements included in Item 8. Financial Statements and Supplementary Data of this Annual Report on Form 10-K.
We were originally incorporated as Frigoscandia, Inc. in Delaware in May 1994. Our principal executive offices are located at 70 West Madison, Suite 4400, Chicago, Illinois 60602.
BUSINESS SEGMENTS
JBT FoodTech
JBT FoodTech supplies both customized industrial and turnkey solutions and services used in the food and beverage industry. We design, manufacture and service technologically sophisticated food processing systems for the preparation of meat, seafood and poultry products, ready-to-eat meals, shelf stable packaged foods, bakery products, juice and dairy products, and fruit and vegetable products.
We believe our success is derived from our continued innovation, applying our differentiated and proprietary technologies to meet our customers’ food processing needs. We continually strive to improve our existing solutions and develop new solutions by working closely with our customers to meet their evolving needs.
Our historically strong position in the markets we serve has provided us with a large installed base of systems and equipment. We deliver industrial capacity equipment which includes freezers, citrus juice extractors, preservation systems, coating systems and
4
packaging systems. The installed base of our equipment provides a stream of recurring revenue from aftermarket products, parts, services, and lease arrangements. Recurring revenue accounted for 41.5% of our FoodTech total revenue in 2017. Our installed base also provides us with strong, long-term customer relationships from which we derive information for new product development to meet the evolving needs of our food processing customers. We also provide stand-alone and fully integrated automated guided vehicle systems for repetitive material handling requirements, for example in manufacturing and warehouse facilities.
We have operations strategically positioned around the world to serve our existing JBT FoodTech equipment base located in more than 100 countries. Our principal production facilities are located in the United States (Arkansas, California, Florida, New York, North Carolina, Ohio, and Wisconsin), Brazil, Belgium, Germany, Italy, Sweden, the Netherlands, the United Kingdom, South Africa and China. In addition to sales and services offices based in more than 25 countries, we also support our customers in their development of new food products and processes as well as the refinement and testing of their current applications through eleven technical centers located in the United States (California, Florida, and Ohio), Mexico, Brazil, Belgium, Italy, Spain, Sweden, the Netherlands and China. Our global presence allows us to provide direct customized support to customers virtually anywhere they process foods.
Solutions, Products and Services
We offer a broad portfolio of systems, equipment and services to our customers which are often sold as part of a fully integrated processing line solution. Our systems are typically customized to meet the specific customer application needs. Thus, actual production capacity ranges vary and are dependent on the food and product packaging type being processed.
Protein. Our fully integrated processing lines often span from the initial point of entry of raw products through further processing. Our Protein systems include Wolf-Tec Polar Dissolver brine preparation, IMAX injection, Polar Massager marination, Polar Flex Carve maceration, TMAX tenderization, TVI portion cutting systems, the DSI™ waterjet portioners, slicers and attribute scanner/sorters; the Stein™ coating and seasoning applicators, teflon coated Formcook Contact and Combi Cookers, THERMoFIN® fryers, GYRoCOMPACT® spiral ovens, JSO Jet Stream® ovens; Double D™ Revoband™ linear ovens and cooking systems; Novus X-ray systems; C.A.T. FATCAT chillers, ULTRACAT injectors, scales and weighing systems, GLACIERCAT freezers and Tipper Tie Clip packaging systems. Although our solutions are primarily used in the processing of meat and poultry (including nuggets, strips, and wings), we also provide systems that portion, coat or cook other food products ranging from breads and pizzas, seafood, and ready-to-eat meals to pet food. Through our acquisition of Tipper Tie, Inc. we also serve industrial, non-food customers, primarily in the adhesives, glues, silicone and industrial explosives industries.
With our first commercial food processing developed in the 1960s, we remain a leading supplier of freezing and chilling solutions to the food processing industry. We design, assemble, test, and install industry-leading technologies under the Frigoscandia® brand, which include the GYRoCOMPACT® self-stacking spiral, the FLoFREEZE® individual quick freezing (IQF) system, and the ADVANTEC™ linear/impingement freezing system, as well as flat product and contact freezers, chillers and proofers. We also offer a structure-supported Northfield SuperTRAK® spiral freezer for high volume, large packaged products. Our freezers are designed to meet the most stringent demands for quality, economy, food safety and user-friendliness. Our industrial freezers can be found in plants processing food products ranging from meat, seafood, and poultry to bakery products and ready-to-eat meals, fruits, vegetables, and dairy products.
Protein technology offerings accounted for 34% of our total revenue in 2017.
Liquid Foods. We offer comprehensive processing lines from primary juice extraction through end of line packaging. In the primary space, we supply industrial citrus, tropical and temperate fruit processing equipment. Our citrus processing solutions include citrus extractors, finishers, pulp systems, evaporators, and citrus ingredient recovery systems as well as aseptic systems (including sterilizers, fillers, and controls) integrated with bulk aseptic storage systems for not-from-concentrate orange juice. Our READYGo™ family of skid-mounted products includes solutions for aseptic sterilization and bulk filling, as well as ingredients and by-products recovery and clean-up systems. In addition to our high capacity industrial extractors, we also offer point of use Fresh’n Squeeze® produce juicers. These juicers are used around the world in hotels, restaurants, coffee shops, grocery stores, convenience stores, quick service restaurants, and juice bars.
We are among the leading worldwide suppliers of fruit, vegetable, and juice processing equipment and aseptic sterilization and bulk filling systems. Our fruit, vegetable, and juice processing lines are comprised of extraction, finishing, heating and mixing equipment, enzyme inactivators, evaporators, flash coolers, sterilizers, and aseptic fillers. Our equipment is primarily sold as an integrated processing line, but can also satisfy a specific need within a line. Our tomato processing lines are installed with processors throughout the world’s key tomato growing regions and produce a range of finished tomato products including tomato paste, concentrates, peeled tomato products, diced tomatoes, salsa, pizza sauce, ketchup, and pureed and crushed tomatoes. Our
5
aseptic processing lines are used in the bulk processing of a wide range of temperate and tropical fruits into juices, particulates, purees, and concentrates. These fruit products are used as ingredients for dairy products (yogurts, smoothies, flavored milk, and ice cream), bakery products, and fruit-based beverages.
We provide technology solutions and products to extend the life, improve the appearance and preserve the taste of fresh fruits and vegetables. Once protected, fresh fruits and vegetables can be individually labeled by our fast and efficient produce labeling systems. We also provide an integrated equipment and aftermarket service program, including the patented Bin Scrubber System, the Single Pass Dryer and Smart Dryer System, and additional ancillary produce processing technologies.
We are a global supplier of fully integrated industrial preservation systems that enable production of shelf stable foods in a wide variety of flexible, rigid, and semi-rigid packages. These integrated solutions for the processing of shelf-stable food and liquid products include a line of continuous hydrostatic sterilizers, our continuous rotary sterilizers, Steam Water Spray static and SuperAgi™ batch retorts, XL-series fillers, SeamTec™ and X-series closers, material handling systems and LOG-TEC® thermal process controls. We are a recognized U.S. Department of Agriculture (USDA) and Food and Drug Administration (FDA) Food Process Authority and offer the largest selection of preservation products in the industry. We offer consulting services to help design food production processes in accordance with USDA and FDA's stringent requirements. Our automated batch retorts can handle an array of flexible and rigid packages such as plastic pouches, cartons, glass and cans. Our solutions also include specialized material handling systems to automate the handling and tracking of processed and unprocessed containers. Additionally, we offer modeling software as well as thermal processing controls that help our customers optimize and track their cooking processes to allow real time modifications in the case of process deviations.
In 2017, we acquired the Avure Technologies and PLF International businesses, adding capabilities in the high pressure processing space for a broad array of market segments, and powdered product filling and handling systems, respectively.
Liquid Foods solution offerings accounted for 34% of our total revenue in 2017.
Automated Systems. We are a leading global supplier of robotic automated guided vehicle systems for material movement in manufacturing and warehouse facilities. We provide engineering services and simulations to evaluate the material handling requirements, standard and custom automated guided vehicle hardware and software, and stand-alone (JayBoT®) and fully-integrated system hardware and software for a scalable solution that can be applied individually or across the entire customer enterprise.
Aftermarket Products, Consumables, Parts, and Services. We provide aftermarket products, parts, and services for all of our integrated food processing systems and equipment. We provide retrofits and refurbishments to accommodate changing operational requirements, and we supply our own brand of food grade lubricants and cleaners designed specifically for our equipment. We supply packaging material components for our clip packaging customers in the form of metal clips and hanging loops. We also provide continuous, proactive service to our customers including the fulfillment of preventative maintenance agreements, consulting services such as water treatment, corrosion monitoring control, food safety and process auditing, and the expertise of on-site technical personnel. In addition to helping our customers reduce their operating costs and improve efficiencies, our customer service focus also helps us maintain strong commercial relationships and provides us with ongoing access to information about our customers’ requirements and strategies to foster continuing product development. Our aftermarket products, parts, and services coupled with our large installed base of food processing systems and equipment, provide us with a strong base for growing recurring revenue. Sales of aftermarket products, parts and services are consolidated within the total revenue of their related JBT FoodTech businesses. As part of our aftermarket program we also offer technology for enterprise asset management and real-time operations monitoring with our patented iOPS™ suite.
JBT AeroTech
JBT AeroTech supplies customized solutions and services used for applications in the air transportation industry, including airport authorities, airlines, airfreight, ground handling companies, the military and defense contractors. We believe our strong market positions result from our ability to customize our equipment and services utilizing differentiated technology to meet the specific needs of our customers. We continually strive to improve our existing technologies and develop new technologies by working closely with our well established customer base.
There is a significant installed base of our airport and airline equipment around the world. We are a leading supplier of cargo loaders, passenger boarding bridges, and aircraft deicers. We have also sold a significant number of mobile passenger steps, cargo transporters, and tow tractors that are operating at airports around the world. This installed base provides a stream of recurring revenue from aftermarket parts, products, and services. Recurring revenue accounted for 36% of AeroTech total revenue in 2017. Our installed base also offers continuous access to customer feedback for improvements and new product development.
6
JBT AeroTech products have been delivered to more than 100 countries. To support this equipment, we have operations located throughout the world. Our principal production facilities are located in the United States (Florida and Utah), China, Mexico, the United Kingdom and Spain. We also have sales and service offices located in nine countries and collaborative relationships with independent sales representatives, distributors, and service providers in over thirty additional countries.
Solutions, Products, and Services
We offer a broad portfolio of systems, equipment, and services to airport authorities, airlines, air cargo handlers, ground handling companies, military customers and defense contractors.
Mobile Equipment. We supply air cargo loaders, aircraft deicers, mobile power and environmental air conditioning systems, and other mobile ground support equipment to commercial air passenger and freight carriers, ground handlers, military customers and defense contractors.
Our Commander™ and Ranger™ loaders service containerized narrow-body and wide-body jet aircraft and are available in a wide range of configurations. Our Tempest™ aircraft deicers offer a broad range of options that can be configured to meet customers’ specific and regional need to provide efficient aircraft deicing while on the tarmac. We manufacture and supply a full array of B-series conventional aircraft tow tractors for moving aircraft without consumption of jet fuel, mobile passenger steps for tarmac boarding and deplaning, belt loaders, and self-propelled transporters for pallet and container handling.
Airlines and ground handling companies face increased pressure to reduce emissions and minimize fuel usage. We have a long history of delivering alternative fuel ground support equipment that provides a solution to these environmental and operational challenges. Our alternative fuel design approach is to provide modular ground support equipment, capable of being powered by a variety of power sources. Our electric powered product offering includes Commander cargo loaders, cargo transporters, conventional aircraft pushback tractors, belt loaders, and passenger boarding steps. We also offer electric retrofit kits for our existing delivered base of diesel powered Commander cargo loaders.
We manufacture a variety of sizes and configurations of auxiliary equipment including 400 Hertz ground power and preconditioned air units that supply aircraft requirements for electrical power and cooled air circulation for the environmental control system (air-conditioning) and main engine starting during ground operations.
Within mobile equipment, we also have a portfolio of military equipment, including a wide range of cargo loaders, ground power air conditioning, aircraft air compressors, air start, and bleed air units for the U.S. Air Force, the U.S. Navy, international military forces, airframe manufacturers and defense contractors. Mobile equipment technology offerings accounted for 12% of our total revenue in 2017.
In 2017, we acquired Aircraft Maintenance Support Services, Ltd. (AMSS), a manufacturer of military and commercial aviation equipment that enhances our offerings and expands our access to foreign customers with our existing products.
Fixed Equipment. We supply airport gate equipment. Our Jetway® passenger boarding bridges have set the standard for airlines and airport authorities to move passengers between the terminal building and the aircraft since 1959. Our passenger boarding bridges support a range of aircraft types, from regional aircraft up to the Airbus A380. Within fixed equipment, we also supply point-of-use and mobile 400 Hertz and pre-conditioned air units that enable our customers to reduce fuel consumption and emissions by minimizing requirements to use auxiliary power units or aircraft engines while parked at the gate, as well as remote gate monitoring equipment to improve equipment availability and reduce turn times. We also offer aircraft in-ground service pits to provide utility access on airport ramps, hangars and remote parking areas. Fixed equipment accounted for 10% of our total revenue in 2017.
Airport Services. We are an industry provider for the design and management of technical support programs supplied to airlines and airports at over 20 major locations most of which are in the continental United States. Our specialty services extend to expertise in the development of sustainable and value orientated operation, maintenance, and repair of sophisticated in-line baggage handling systems, gate equipment, facilities, and ground support equipment.
Aftermarket Products, Parts, and Services. We provide aftermarket products, parts, and services for our installed base of JBT AeroTech equipment. We also provide retrofits to accommodate changing operational requirements and continuous, proactive service, including, in some cases, on-site technical personnel. These systems and other services represent an integrated approach to addressing critical problems faced by our customers and ensure that we remain well positioned to respond to their new
7
requirements and strategic initiatives through our strong customer relations. Sales of aftermarket products, parts and services are consolidated within the total revenue of their associated JBT AeroTech businesses.
In support of our focus and strategy of meeting our customers’ needs, we have developed a global parts service network to enable us to market with confidence our ability to “provide the right part in the right place.” Our highly experienced global parts representatives help reduce equipment downtime by providing fast, accurate responses to technical questions. We also provide worldwide operations and maintenance training programs to provide maintenance technicians with the tools necessary to deliver the highest possible level of systems reliability.
OTHER BUSINESS INFORMATION RELEVANT TO ALL OF OUR BUSINESS SEGMENTS
Order Backlog
For information regarding order backlog, refer to the section entitled “Inbound Orders and Order Backlog” in Item 7. Management's Discussion and Analysis of Financial Condition and Results of Operations of this Annual Report on Form 10-K.
Sources and Availability of Raw Materials
All of our business segments purchase carbon steel, stainless steel, aluminum, and/or steel castings and forgings both domestically and internationally. We do not use single source suppliers for the majority of our raw material purchases and believe the available supplies of raw materials are adequate to meet our needs.
Research and Development
The objectives of our research and development programs are to create new products and business opportunities in relevant fields, and to improve existing products.
For additional financial information about our research and development activities, refer to Note 1. Summary of Significant Accounting Policies and Note 16. Business Segments to our Consolidated Financial Statements included in Item 8. Financial Statements and Supplementary Data of this Annual Report on Form 10-K.
Sales and Marketing
We sell and market our products and services predominantly through a direct sales force, supplemented with independent distributors and sales representatives. Our experienced international sales force is comprised of individuals with strong technical expertise in our products and services and the industries in which they are sold.
We support our sales force with marketing and training programs that are designed to increase awareness of our product offerings and highlight our differentiation while providing a set of sales tools to aid in the sales of our technology solutions. We actively employ a broad range of marketing programs to inform and educate customers, the media, industry analysts, and academia through targeted newsletters, our web site, seminars, trade shows, user groups, and conferences.
Patents, Trademarks and Other Intellectual Property
We own a number of United States and foreign patents, trademarks, and licenses that are cumulatively important to our business. We own approximately 725 United States and foreign issued patents and have approximately 240 patent applications pending in the United States and abroad. Further, we license certain intellectual property rights to or from third parties. We also own numerous United States and foreign trademarks and trade names and have approximately 820 registrations and pending applications in the United States and abroad. Developing and maintaining a strong intellectual property portfolio is an important component of our strategy to extend our technology leadership. However, we do not believe that the loss of any one or group of related patents, trademarks, or licenses would have a material adverse effect on our overall business.
Competition
We conduct business worldwide and compete with large multinational companies as well as a variety of local and regional companies, which typically are focused on a specific application, technology or geographical area.
We compete by leveraging our industry expertise to provide differentiated and proprietary technology, integrated systems, high product quality and reliability, and comprehensive aftermarket service. We strive to provide our customers with equipment that delivers a lower total cost of ownership, distinguishing ourselves by providing excellent equipment uptime and increased yields with improved final product quality.
JBT FoodTech’s major competitors include Advanced Equipment Inc.; Alit SRL; Allpax Products, Inc.; Atlas Pacific Engineering Company, Inc.; Barry-Wehmiller Companies, Inc.; Brown International Corp.; CFT S.p.A.; Egemin Automation Inc.; Elettric 80 S.p.a. Italia; Ferrum; Food Processing Equipment Company; FPS Process Foods Solutions; GEA Group AG; Marel hf.;
8
METALQUIMIA, S.A.; Mettler-Toledo International, Inc.; Morris & Associates, Inc.; MYCOM; Middleby Corporation; Nantong Freezing Equipment Company, Ltd.; Poly-clip system GmbH & Co. KG; Provisur Technologies, Inc.; Scanico A/S; Shibuya Corporation; Starfrost; Statco Engineering; Steriflow SAS.; Tetra Laval; and Tecnopool S.p.A.
JBT AeroTech’s major competitors include Cavotec SA; Elite Line Services Inc.; ERMC; Global Ground Support LLC; Goldhofer AG; Illinois Tool Works Inc.; Mallaghan Engineering Ltd; Shenzhen CIMC - Tianda Airport Support CO. LTD.; ThyssenKrupp AG; TLD Group SAS; Trepel Airport Equipment GmbH; Textron Inc.; TwistAero; Vanderlande Industries B.V.; Vestergaard Company A/S; and Weihai Guangtai Airport Equipment Co., LTD.
Employees
We have approximately 5,800 employees with approximately 3,600 located in the United States. Approximately 7% of our employees in the United States are represented by two collective bargaining agreements.
Outside the United States, we enter into employment contracts and agreements in those countries in which such relationships are mandatory or customary. The provisions of these agreements correspond in each case with the required or customary terms in the subject jurisdiction. Approximately 62% of our international employees are covered under national employee unions.
We maintain good employee relations and have successfully concluded all of our recent negotiations without a work stoppage. However, we cannot predict the outcome of future contract negotiations.
Customers
No single customer accounted for more than 10% of our total revenue in any of the last three fiscal years.
Government Contracts
We supply equipment and logistics support to the U.S. Department of Defense and international forces. The amount of equipment and parts supplied to these programs is dependent upon annual government appropriations and levels of military spending. In addition, United States defense contracts are unilaterally terminable at the option of the United States government with compensation for work completed and costs incurred. Contracts with the United States government and defense contractors are subject to special laws and regulations, the noncompliance with which may result in various sanctions that could materially affect our ongoing government business.
Governmental Regulation and Environmental Matters
Our operations are subject to various federal, state, local, and foreign laws and regulations governing the prevention of pollution and the protection of environmental quality. If we fail to comply with these environmental laws and regulations, administrative, civil, and criminal penalties may be imposed, and we may become subject to regulatory enforcement actions in the form of injunctions and cease and desist orders. We may also be subject to civil claims arising out of an accident or other event causing environmental pollution. These laws and regulations may expose us to liability for the conduct of or conditions caused by others or for our own acts even though these actions were in compliance with all applicable laws at the time they were performed.
Under the Comprehensive Environmental Response, Compensation and Liability Act, referred to as CERCLA, and related state laws and regulations, joint and several liability can be imposed without regard to fault or the legality of the original conduct on certain classes of persons that contributed to the release of a hazardous substance into the environment. These persons include the owner and operator of a contaminated site where a hazardous substance release occurred and any company that transported, disposed of, or arranged for the transport or disposal of hazardous substances that have been released into the environment, including hazardous substances generated by any closed operations or facilities. In addition, neighboring landowners or other third parties may file claims for personal injury, property damage, and recovery of response cost. We may also be subject to the corrective action provisions of the Resource, Conservation and Recovery Act, or RCRA, and analogous state laws that require owners and operators of facilities that treat, store, or dispose of hazardous waste to clean up releases of hazardous waste constituents into the environment associated with their operations.
Many of our facilities and operations are also governed by laws and regulations relating to worker health and workplace safety, including the Federal Occupational Safety and Health Act, or OSHA. We believe that appropriate precautions are taken to protect our employees and others from harmful exposure to potentially hazardous materials handled and managed at our facilities, and that we operate in substantial compliance with all OSHA or similar regulations.
We are also subject to laws and regulations related to conflict minerals, export compliance, local hiring and anti-corruption, and we have adopted policies, procedures and employee training programs that are designed to facilitate compliance with those laws and regulations.
9
Financial Information about Geographic Areas
A significant portion of our consolidated revenue is generated in markets outside of the United States. For financial information about geographic areas see Note 16. Business Segments of our Consolidated Financial Statements in Item 8. Financial Statements and Supplementary Data of this Annual Report on Form 10-K.
Available Information
All periodic and current reports, registration statements, and other filings that we are required to make with the Securities and Exchange Commission (SEC), including annual reports on Form 10-K, quarterly reports on Form 10-Q, current reports on Form 8-K, and amendments to those reports filed or furnished pursuant to Section 13(a) or 15(d) of the Securities Exchange Act of 1934, proxy statements and other information are available free of charge through our website as soon as reasonably practicable after we file them with, or furnish them to, the SEC. You may access and read our SEC filings free of charge through our website at www.jbtc.com, under “Investor Relations – SEC Filings,” or the SEC’s website at www.sec.gov. These reports are also available to read and copy at the SEC’s Public Reference Room by contacting the SEC at 1-800-SEC-0330.
The information contained on or connected to our website, www.jbtc.com, is not incorporated by reference into this Annual Report on Form 10-K or any other report we file with the SEC.
EXECUTIVE OFFICERS OF THE REGISTRANT
The executive officers of JBT Corporation, together with the offices currently held by them, their business experience and their ages as of February 19, 2018, are as follows:
Name | Age | Office | ||
Thomas W. Giacomini | 52 | Chairman, President and Chief Executive Officer | ||
Brian A. Deck | 49 | Executive Vice President and Chief Financial Officer | ||
Paul Sternlieb | 45 | Executive Vice President and President, Protein | ||
Carlos Fernandez | 48 | Executive Vice President and President, Liquid Foods | ||
David C. Burdakin | 62 | Executive Vice President and President, JBT AeroTech | ||
Steven R. Smith | 57 | Executive Vice President | ||
James L. Marvin | 57 | Executive Vice President, General Counsel and Secretary | ||
Jason T. Clayton | 41 | Executive Vice President, Human Resources | ||
Debarshi Sengupta | 41 | Executive Vice President, Business Development | ||
Megan J. Rattigan | 49 | Vice President and Controller | ||
THOMAS W. GIACOMINI became the President and Chief Executive Officer of JBT Corporation as well as a member of the JBT Board of Directors in September 2013. In May 2014, Mr. Giacomini was elected Chairman of the Board. Prior to joining JBT, he served as Vice President (since February 2008) of Dover Corporation, a diversified global manufacturer, and President and Chief Executive Officer (since November 2011) of Dover Engineered Systems. Prior to serving in these roles, Mr. Giacomini served as President (from April 2009 to November 2011) and Chief Executive Officer (from July 2009 to November 2011) of Dover Industrial Products and President (from October 2007 to July 2009) of Dover's Material Handling Platform. Mr. Giacomini joined Dover in 2003 following its acquisition of Warn Industries, an industrial manufacturer specializing in vehicle performance enhancing equipment. During his 12 year tenure at Warn Industries he held a variety of leadership roles including President and Chief Operating Officer. Prior to joining Warn Industries, Mr. Giacomini held various positions at TRW, Inc. Since June 2017, Mr. Giacomini has served as a director of MSA Safety Incorporated, a global safety equipment manufacturer.
BRIAN A. DECK became the Vice President and Chief Financial Officer of JBT Corporation in February 2014. In May 2014, Mr. Deck’s title changed to Executive Vice President and Chief Financial Officer, and he was appointed Treasurer. In December 2014, Mr. Deck appointed a Treasurer and resigned from that position. Prior to joining JBT, he served as Chief Financial Officer (since May 2011) of National Material L.P., a private diversified industrial holding company. Mr. Deck served as Vice President of Finance and Treasury (from November 2007 to May 2011) and as Director, Corporate Financial Planning and Analysis (from August 2005 to November 2007) of Ryerson Inc., a metals distributor and processor. Prior to his service with Ryerson, Mr. Deck had increasing responsibilities with General Electric Capital, Bank One (now JPMorgan Chase & Co.), and Cole Taylor Bank.
PAUL STERNLIEB became the Executive Vice President and President, Protein in October 2017. Prior to joining JBT, he was Group President, Global Cooking (since 2014) of Illinois Tool Works (ITW). Prior to ITW, he served as a Vice President and
10
General Manager (2011 to 2014) for Danaher. Prior to that, he held management roles with H.J. Heinz Company and was a consultant with McKinsey & Company leading consulting engagements for global food and beverage clients.
CARLOS FERNANDEZ became the Executive Vice President and President, Liquid Foods in August 2017. Previously, Mr. Fernandez served as a Vice President of JBT (since 2014) and President, Liquid Foods (since 2016). He joined FMC Corporation in 1996 as a Financial Analyst in Madrid, Spain. Since then Mr. Fernandez served in a variety of finance and general manager roles with FMC Corporation and FMC Technologies, Inc., JBT’s previous parent company, as well as with JBT FoodTech, including serving as the General Manager of Fruit and Juice Solutions from 2012 to 2014.
DAVID C. BURDAKIN became the Executive Vice President and President, JBT AeroTech in May 2014. Previously, Mr. Burdakin was Vice President and Division Manager-JBT AeroTech beginning in January 2014. Prior to joining JBT, he worked as an independent consultant and as Non-Executive Chairman of Mayline Corporation, a private equity owned industrial company (2012 to 2013). Prior to Mayline, he served as President and Chief Executive Officer (2007 to 2012) of Paladin Brands, a leading independent manufacturer of attachment tools for construction equipment including mobile aviation support equipment. Prior to that, Mr. Burdakin progressed through various leadership roles at HNI Corporation (1993 to 2007), including seven years as President of The HON Company, HNI's largest operating company. Prior to joining HNI, he held various positions at Illinois Tool Works Inc. and Bendix Industrial Group.
STEVEN R. SMITH became the Vice President and Division Manager-JBT FoodTech in December 2013. In May 2014, Mr. Smith’s title changed to Executive Vice President and Division President- JBT FoodTech. It was announced in August 2017 that Mr. Smith's title would change to Executive Vice President, and would plan to retire in the 2nd quarter of 2018. Previously Mr. Smith served as our Vice President and Division Manager-Food Processing Systems (since October 2011). Mr. Smith joined FMC Corporation in 1989 as a Business Planner with FMC's Petroleum Equipment Group in Houston, Texas. Since then, he has served in a variety of sales, marketing, and line management roles within FMC Corporation and FMC Technologies, Inc., JBT's previous parent companies, as well as with JBT FoodTech, including most recently serving as the General Manager for the America's Operations of FoodTech's Food Solutions and Services Division from 2003 to 2011.
JAMES L. MARVIN became our Executive Vice President and General Counsel in May 2014, and has served as Secretary since July 2008. From July 2008 until May 2014, Mr. Marvin served as Deputy General Counsel and Secretary, acting as Division Counsel for JBT AeroTech and managing corporate legal matters. Mr. Marvin joined FMC Technologies, Inc. in April 2003, serving as Assistant General Counsel and Assistant Secretary, acting as Division Counsel for FMC Technologies’ Airport Systems Division and managing corporate legal matters. Before joining FMC Technologies in 2003, Mr. Marvin served in the roles of Chief Corporate Counsel and Division Counsel for Corporate Finance at Heller Financial, Inc., a publicly-traded middle-market financial services business. Mr. Marvin was previously a partner with the Chicago-based law firm Katten Muchin Zavis, with a practice focused in commercial financial transactions. Mr. Marvin was a corporate securities attorney with O’Connor Cavanagh Anderson Westover Killingsworth & Beshears in Phoenix, Arizona.
JASON T. CLAYTON became our Executive Vice President, Human Resources in September 2016. Prior to joining us, Mr. Clayton served as the Vice President, Human Resources for Signode Industrial Group LLC., From 2010 to 2015, Mr. Clayton worked in various Human Resources roles with IDEX Corporation, most recently as Vice President, Human Resources. Mr. Clayton worked for Pepsi Beverages Company/Pepsico from 2004 to 2010 in various positions, most recently as Director, Human Resources, Chicagoland/Wisconsin Market Unit. Mr. Clayton worked for Newell Rubbermaid from 2001 to 2004, where he served in various positions, most recently as Human Resources Manager, Sanford North America Division. Mr. Clayton worked for Burlington Industries, Inc. from 2000 to 2001.
DEBARSHI SENGUPTA was named our Executive Vice President, Corporate Development in March 2016. Mr. Sengupta assumed our Corporate Development portfolio in 2014 as Vice President, Corporate Development and Investor Relations. From 2011 to 2014, Mr. Sengupta led Investor Relations and Financial Planning and Analysis. Mr. Sengupta joined us in 2009 as a Business Planner. From 2007 to 2009, Mr. Sengupta worked as a consumer & retail investment banker at Banc of America Securities.
MEGAN J. RATTIGAN became a Vice President in August 2014 and has served as our Controller since December 2013. Previously, Ms. Rattigan served as our Chief Accounting Officer (since November 2008) and Director of Financial Control (since July 2008). Ms. Rattigan was FMC Technologies’ Manager of Financial Reporting and Accounting Research from April 2005 until July 2008. Prior to that, Ms. Rattigan served as a consultant to FMC Technologies from January 2002 until April 2005. From July 1998 until December 2001, Ms. Rattigan was Director of Finance for Chart House Enterprises, Inc. Ms. Rattigan is a certified public accountant and began her professional career in the Assurance practice of Ernst & Young LLP in 1992.
11
ITEM 1A. RISK FACTORS
You should carefully consider the risks described below, together with all of the other information included in this Annual Report on Form 10-K, in evaluating our company and our common stock. If any of the risks described below actually occurs, our business, financial condition, results of operations, cash flows and stock price could be materially adversely affected.
Our financial results are subject to fluctuations caused by many factors that could result in our failing to achieve anticipated financial results and cause a drop in our stock price.
Our quarterly and annual financial results have varied in the past and are likely to continue to vary in the future due to a number of factors, many of which are beyond our control. In particular, the contractual terms and the number and size of orders in the capital goods industries in which we compete vary significantly over time. The timing of our sales cycle from receipt of orders to shipment of the products or provision of services can significantly impact our sales and income in any given fiscal period. These and any one or more of the factors listed below, among other things, could cause us not to achieve our revenue or profitability expectations in any given period and the resulting failure to meet such expectations could cause a drop in our stock price:
• | volatility in demand for our products and services, including volatility in growth rates in the food processing and air transportation industries; |
• | downturns in our customers’ businesses resulting from deteriorating domestic and international economies where our customers conduct substantial business; |
• | increases in commodity prices resulting in increased manufacturing costs, such as petroleum-based products, metals or other raw materials we use in significant quantities; |
• | supply chain interruptions; |
• | changes in pricing policies resulting from competitive pressures, including aggressive price discounting by our competitors and other market factors; |
• | our ability to develop and introduce on a timely basis new or enhanced versions of our products and services; |
• | unexpected needs for capital expenditures or other unanticipated expenses; |
• | changes in the mix of revenue attributable to domestic and international sales; |
• | changes in the mix of products and services that we sell; |
• | changes in foreign currency rates; |
• | seasonal fluctuations in buying patterns; and |
• | future acquisitions and divestitures of technologies, products, and businesses. |
Variability in the length of our sales cycles makes accurate estimation of our revenue in any single period difficult and can result in significant fluctuation in quarterly operating results.
The length of our sales cycle varies depending on a number of factors over which we may have little or no control, including the size and complexity of a potential transaction, the level of competition that we encounter during our selling process, and our current and potential customers’ internal budgeting and approval process. Many of our sales are subject to an extended sales cycle. As a result, we may expend significant effort and resources over a significant period of time in an attempt to obtain an order, but ultimately not obtain the order, or obtain an order that is smaller than we anticipated. Revenue generated by any one of our customers may vary from quarter to quarter, and a customer who places a large order in one quarter may generate significantly lower revenue in subsequent quarters. Due to the length and uncertainty of our sales cycle, and the variability of orders from period to period, we believe that quarter-to-quarter comparisons of our revenue and operating results may not be an accurate indicator of our short term or future performance.
12
We face risks associated with current and future acquisitions.
To achieve our strategic objectives, we have pursued and expect to continue to pursue expansion opportunities such as acquiring other businesses or assets. Expanding through acquisitions involves risks such as:
• | the incurrence of additional debt to finance the acquisition or expansion; |
• | additional liabilities (whether known or unknown), including environmental or pension liabilities of the acquired business or assets; |
• | risks and costs associated with integrating the acquired business or new facility into our operations; |
• | the need to retain and assimilate key employees of the acquired business or assets; |
• | unanticipated demands on our management, operational resources and financial and internal control systems; |
• | unanticipated regulatory risks; |
• | the risk of being denied the necessary licenses, permits and approvals from state, local and foreign governments, and the costs and time associated with obtaining such licenses, permits and approvals; |
• | risks that we do not achieve anticipated operating efficiencies, synergies and economies of scale; and |
• | risks in retaining the existing customers and contracts of the acquired business or assets. |
If we are unable to effectively integrate acquired businesses or newly formed operations, or if such acquired businesses underperform relative to our expectations, such an expansion may have a material adverse effect on our business, financial position, and results of operations.
Deterioration of economic conditions could adversely impact our business.
Our business may be adversely affected by changes in current or future national or global economic conditions, including lower growth rates or recession, high unemployment, rising interest rates, limited availability of capital, decreases in consumer spending rates, the availability and cost of energy, and the effect of government deficit reduction, sequestration, and other austerity measures impacting the markets we serve. Any such changes could adversely affect the demand for our products or the cost and availability of our required raw materials, which can have a material adverse effect on our financial results. Adverse national and global economic conditions could, among other things:
• | make it more difficult or costly for us to obtain necessary financing for our operations, our investments and our acquisitions, or to refinance our debt; |
• | cause our lenders or other financial instrument counterparties to be unable to honor their commitments or otherwise default under our financing arrangements; |
• | impair the financial condition of some of our customers, thereby hindering our customers’ ability to obtain financing to purchase our products and/or increasing customer bad debts; |
• | cause customers to forgo or postpone new purchases in favor of repairing existing equipment and machinery, and delay or reduce preventative maintenance, thereby reducing our revenue and/or profits; |
• | negatively impact our customers’ ability to raise pricing to counteract increased fuel, labor, and other costs, making it less likely that they will expend the same capital and other resources on our equipment as they have in the past; |
• | impair the financial condition of some of our suppliers thereby potentially increasing both the likelihood of our having to renegotiate supply terms on terms that may not be as favorable to us and the risk of non-performance by suppliers; |
• | negatively impact global demand for air transportation services as well as the food preparation industry, which could result in a reduction of sales, operating income, and cash flows in our JBT AeroTech and JBT FoodTech segments; |
13
• | negatively affect the rates of expansion, consolidation, renovation, and equipment replacement within the air transportation industry and within the food processing industry, which may adversely affect the results of operations of our JBT AeroTech and JBT FoodTech segments; and |
• | impair the financial viability of our insurers. |
Disruptions in the political, regulatory, economic and social conditions of the foreign countries in which we conduct business could negatively affect our business, financial condition, and results of operations.
We operate manufacturing facilities in eleven countries other than the United States, the largest of which are located in Belgium, China, Sweden, Brazil, Italy, Spain, United Kingdom, the Netherlands and Germany. Our international sales accounted for 40% of our 2017 revenue. Multiple factors relating to our international operations and to those particular countries in which we operate or seek to expand our operations could have an adverse effect on our financial condition or results of operations. These factors include, among others:
• | economic downturns, inflationary and recessionary markets, including in capital and equity markets; |
• | civil unrest, political instability, terrorist attacks, and wars; |
• | nationalization, expropriation, or seizure of assets; |
• | potentially burdensome taxation in other jurisdictions; |
• | changes in the mix of our international business operations and revenue relative to our domestic operations, resulting in increasing tax liabilities resulting from repatriation of income generated outside of the United States; |
• | inability to repatriate income or capital; |
• | foreign ownership restrictions; |
• | export regulations that could erode profit margins or restrict exports, including import or export licensing regulations; |
• | trade restrictions, trade protection measures, or price controls; |
• | restrictions on operations, trade practices, trade partners, and investment decisions resulting from domestic and foreign laws and regulations; |
• | compliance with the U.S. Foreign Corrupt Practices Act and other similar laws; |
• | burden and cost of complying with foreign laws, treaties, and technical standards and changes in those regulations; |
• | transportation delays and interruptions; and |
• | reductions in the availability of qualified personnel. |
Changes to trade regulation, quotas, duties or tariffs, caused by the changing U.S. and geopolitical environments or otherwise, may increase our costs or limit the amount of raw materials and products that we can import.
The current U.S. administration has voiced strong concerns about imports from countries that it perceives as engaging in unfair trade practices, and may decide to impose import duties or other restrictions on products or raw materials sourced from those countries, which may include China and other countries from which we import raw materials or in which we manufacture our products. Any such duties or restrictions could have a material adverse effect on our business, results of operations or financial condition.
The result of the Referendum of the United Kingdom’s Membership in the European Union have created uncertainties that could have negative effects on us.
The announcement of the Referendum of the United Kingdom’s (or the U.K.) Membership in the European Union (E.U.) (referred to as Brexit), advising for the exit of the United Kingdom from the European Union, has resulted in significant volatility in global stock markets and currency exchange rate fluctuations that resulted in the strengthening of the U.S. dollar against certain foreign currencies
14
in which we conduct business. As described in Item 7A. Quantitative and Qualitative Disclosures About Market Risk - Foreign Currency Exchange Rate Risk, we translate revenue denominated in foreign currency into U.S. dollars for our financial statements. During periods of a strengthening dollar, our reported international revenue is reduced because foreign currencies translate into fewer U.S. dollars.
The effects of Brexit will depend on any agreements the U.K. makes to retain access to E.U. markets either during a transitional period or more permanently. The measures could potentially disrupt the markets we serve and may cause us to lose customers and employees. In addition, Brexit could lead to legal uncertainty and potentially divergent national laws and regulations as the U.K. determines which E.U. laws to replace or replicate. These uncertainties may cause our customers to closely monitor their costs and reduce their spending budget on our products and services.
Any of these effects of Brexit, among others, could materially adversely affect our business, results of operations and financial condition.
Fluctuations in currency exchange rates could negatively affect our business, financial condition, and results of operations.
A significant portion of our revenue and expenses are realized in foreign currencies. As a result, changes in exchange rates will result in increases or decreases in our costs and earnings and may adversely affect our Consolidated Financial Statements, which are stated in U.S. dollars. Although we may seek to minimize currency exchange risk by engaging in hedging transactions where we deem appropriate, we cannot be assured that our efforts will be successful. Currency fluctuations may also result in our systems and services becoming more expensive and less competitive than those of other suppliers in the foreign countries in which we sell our systems and services.
We have invested substantial resources in certain markets where we expect growth, and our business may suffer if we are unable to achieve the growth we expect.
As part of our strategy to grow, we are expanding our operations in certain emerging or developing markets, and accordingly have made and expect to continue to make substantial investments to support anticipated growth in those regions. We may fail to realize expected rates of return on our existing investments or incur losses on such investments, and we may be unable to redeploy capital to take advantage of other markets. Our results will also suffer if these regions do not grow as quickly as we anticipate.
Our restructuring initiatives may not achieve the expected cost reductions or other anticipated benefits.
We regularly evaluate our existing operations, service capacity, and business efficiencies to determine if a realignment or restructuring could improve our results of operations or achieve some other business goal. Our realignment and restructuring initiatives are designed to result in more efficient and increasingly profitable operations. Our ability to achieve the anticipated cost savings and other benefits from these initiatives within the expected time frame is subject to many estimates and assumptions. These estimates and assumptions are subject to significant economic, competitive, and other uncertainties, some of which are beyond our control. In 2016, we implemented an optimization program to realign FoodTech’s Protein business in North America and Liquid Foods business in Europe, accelerate our strategic sourcing initiatives, and consolidate smaller facilities, and have incurred restructuring charges of $12.0 million related to this plan to date. We may incur similar charges in the future. Failure to achieve the expected cost reductions related to these restructuring initiatives could have a material adverse effect on our business and results of operations.
Our inability to obtain raw materials, component parts, and/or finished goods in a timely and cost-effective manner from suppliers would adversely affect our ability to manufacture and market our products.
We purchase raw materials and component parts from suppliers for use in manufacturing our products. We also purchase certain finished goods from suppliers. Changes in our relationships with suppliers or increases in our costs for raw materials, component parts, or finished goods we purchase could result in manufacturing interruptions, delays, inefficiencies, or our inability to market products if we cannot timely and efficiently manufacture them. In addition, our gross margins could decrease if prices of purchased raw materials, component parts, or finished goods increase and we are unable to pass on such price increases to customers.
Regulations related to conflict minerals could adversely impact our business.
The Dodd-Frank Wall Street Reform and Consumer Protection Act contains provisions to improve transparency and accountability concerning the supply of certain minerals, known as “conflict minerals”, originating from the Democratic Republic of Congo (DRC) and adjoining countries. To implement this legislation, the SEC adopted annual disclosure and reporting requirements for those companies that use conflict minerals mined from the DRC and adjoining countries in their products. We will continue to incur costs associated with complying with these annual disclosure requirements, including those incurred to conduct diligence to determine the sources of conflict minerals used in our products and other potential changes to products, processes, or sources of supply as a
15
consequence of such verification activities. These rules could adversely affect the sourcing, supply and pricing of materials used in our products. As there may be only a limited number of suppliers offering “conflict free” conflict minerals of certain types, we cannot be certain that we will continue to be able to obtain necessary conflict minerals from such suppliers in sufficient quantities or at competitive prices. Also, we may face reputational challenges if we determine that certain of our products contain minerals not determined to be conflict free or if we are unable to sufficiently verify the origins for all conflict minerals used in our products.
An increase in energy or raw material prices may reduce the profitability of our customers, which ultimately could negatively affect our business, financial condition, results of operations, and cash flows.
Energy prices are volatile and have been historically high. High energy prices have a negative trickledown effect on our customers’ business operations by reducing their profitability because of increased operating costs. Our customers require large amounts of energy to run their businesses, particularly in the air transportation industry. Higher energy prices can reduce passenger and cargo air carrier profitability as a result of increased jet and ground support equipment fuel prices. Higher energy prices also increase food processors’ operating costs through increased energy and utility costs to run their plants, higher priced chemical and petroleum based raw materials used in food processing, and higher fuel costs to run their logistics and service fleet vehicles.
Food processors are also affected by the cost and availability of raw materials such as feed grains, livestock, produce, and dairy products. Increases in the cost of and limitations in the availability of such raw materials can negatively affect the profitability of food processors’ operations.
Any reduction in our customers’ profitability due to higher energy or raw material costs or otherwise may reduce their future expenditures in the food processing equipment or airport equipment that we provide. This reduction may have a material adverse effect on our business, financial condition, results of operations, and cash flows.
Changes in food consumption patterns due to dietary trends or economic conditions may adversely affect our business, financial condition, results of operations, and cash flows.
Dietary trends can create demand for protein food products but negatively impact demand for high-carbohydrate foods, or create demand for easy to prepare, transportable meals but negatively impact traditional canned food products. Because different food types and food packaging can quickly go in and out of style as a function of dietary, health, or convenience trends, food processors can be challenged in accurately forecasting their needed manufacturing capacity and the related investment in equipment and services. During periods of economic uncertainty, consumer demand for protein products or processed food products may be negatively impacted by increases in food prices. A demand shift away from protein products or processed foods could have a material adverse effect on our business, financial condition, results of operations, and cash flows.
An outbreak of animal borne diseases (H5N1, BSE, or other virus strains affecting poultry or livestock), citrus tree diseases, or food borne illnesses or other food safety or quality concerns may negatively affect our business, financial condition, results of operations, and cash flows.
An outbreak or pandemic stemming from H5N1 (avian flu) or BSE (mad cow disease) or any other animal related disease strains could reduce the availability of poultry or beef that is processed for the restaurant, food service, wholesale or retail consumer. Any limitation on the availability of such raw materials could discourage food producers from making additional capital investments in processing equipment, aftermarket products, parts, and services that our JBT FoodTech business provides. Such a decrease in demand for our products could have a material adverse effect on our business, financial condition, results of operations, and cash flows.
The success of our business that serves the citrus food processing industry is directly related to the viability and health of citrus crops. The citrus industries in Florida, Brazil, and other countries are facing increased pressure on their harvest productivity and citrus bearing acreage due to citrus canker and greening diseases. These citrus tree diseases are often incurable once a tree has been infested and the end result can be the destruction of the tree. Reduced amounts of available fruit for the processed or fresh food markets could materially adversely affect our business, financial condition, results of operations, and cash flows.
In the event an E. coli or other food borne illness causes a recall of meat or produce, the companies supplying those fresh, further processed or packaged forms of those products could be severely adversely affected. Any negative impact on the financial viability of our fresh or processed food provider customers could adversely affect our immediate and recurring revenue base.
16
Freezes, hurricanes, droughts, or other natural disasters may negatively affect our business, financial condition, results of operations, and cash flows.
In the event a natural disaster negatively affects growers or farm production, the food processing industry may not have the fresh food raw materials necessary to meet consumer demand. Crops of entire groves or fields can be severely damaged by a drought, freeze, or hurricane. An extended drought or freeze or a high category hurricane could permanently damage or destroy a tree crop area. If orchards have to be replanted, trees may not produce viable product for several years. Since our recurring revenue is dependent on growers’ and farmers’ ability to provide high quality crops to certain of our customers, our business, financial condition, results of operations, and cash flows could be materially adversely impacted in the event of a freeze, hurricane, drought, or other natural disaster.
Our failure to comply with the laws and regulations governing our U.S. government contracts or the loss of production funding of any of our U.S. government contracts could harm our business.
The U.S. government represented approximately 2% of our 2017 revenue, directly or through subcontracts. Our JBT AeroTech business contracts with the U.S. government and subcontracts with defense contractors conducting business with U.S. government. As a result, we are subject to various laws and regulations that apply to companies doing business with the U.S. government.
The laws governing U.S. government contracts differ in several respects from the laws governing private company contracts. Government contracts are highly regulated to curb misappropriation of funds and to ensure uniform policies and practices across various governmental agencies. Funding for such contracts is tied to National Defense Budgets and Procurement Programs that are annually negotiated and approved or disapproved by the U.S. Department of Defense, the Executive Branch, and the Congress. For example, if there were any shifts in spending priorities or if funding for the military aircraft programs were reduced or canceled as a result of the sequestration, policy changes, or for other reasons, the resulting loss of revenue could have a material adverse impact on our JBT AeroTech business. Many U.S. government contracts contain pricing terms and conditions that are not applicable to private contracts. In particular, U.S. defense contracts are unilaterally terminable at the option of the U.S. government with compensation only for work completed and costs incurred to date. In addition, any deliverable delays under such contracts as a result of our non-performance could also have a negative impact on these contracts.
Non-compliance with the laws and regulations governing U.S. government contracts or subcontracts may result in significant sanctions such as debarment (restrictions from future business with the government). If we were found not to be in compliance now or in the future with any such laws or regulations, our results of operations could be adversely impacted.
Terrorist attacks and threats, escalation of military activity in response to such attacks, or acts of war may negatively affect our business, financial condition, results of operations, and cash flows.
Any future terrorist attacks against U.S. targets, rumors or threats of war, actual conflicts involving the United States or its allies, or military or trade disruptions affecting our customers or the economy as a whole may materially adversely affect our operations or those of our customers. As a result, there could be delays or losses in transportation and deliveries to our customers, decreased sales of our products, and delays in payments by our customers. Strategic targets such as those relating to transportation and food processing may be at greater risk of future terrorist attacks than other targets in the United States. Our airport authority, airline, air cargo and ground handling customers are particularly sensitive to safety concerns, and their businesses may decline after terrorist attacks or threats or during periods of political instability when travelers are concerned about safety issues. A decline in these customers’ businesses could have a negative impact on their demand for our products. It is possible that any of these occurrences, or a combination of them, could have a material adverse effect on our business, financial condition, results of operations, and cash flows.
The cumulative loss of several significant contracts may negatively affect our business, financial condition, results of operations, and cash flows.
We often enter into large, project-oriented contracts, or long-term equipment leases and service agreements. These agreements may be terminated or breached, or our customers may fail to renew these agreements. If we were to lose several significant agreements and if we were to fail to develop alternative business opportunities, we could experience a material adverse effect on our business, financial condition, results of operations, and cash flows.
17
We may lose money or not achieve our expected profitability on fixed-price contracts.
As is customary for several of the business areas in which we operate, we may provide products and services under fixed-price contracts. Under such contracts, we are typically responsible for cost overruns. Our actual costs and any gross profit realized on these fixed-price contracts may vary from our estimates on which the pricing for such contracts was based. There are inherent risks and uncertainties in the estimation process, including those arising from unforeseen technical and logistical challenges or longer than expected lead times for sourcing raw materials and assemblies. A fixed-price contract may significantly limit or prohibit our ability to mitigate the impact of unanticipated increases in raw material prices (including the price of steel and other significant raw materials) by passing on such price increases. Depending on the volume of our work performed under fixed-price contracts at any one time, differences in actual versus estimated performance could have a material adverse impact on our business, financial condition, results of operations, and cash flows.
Customer sourcing initiatives may adversely affect our new equipment and aftermarket businesses.
Many multi-national companies, including our customers and prospective customers, have undertaken supply chain integration to provide a sustainable competitive advantage against their competitors. Under continued price pressure from consumers, wholesalers and retailers, our manufacturer customers are focused on controlling and reducing cost, enhancing their sourcing processes, and improving their profitability.
A key value proposition of our equipment and services is low total cost of ownership. If our customers implement sourcing initiatives that focus solely on immediate cost savings and not on total cost of ownership, our new equipment and aftermarket sales could be adversely affected.
To remain competitive, we need to rapidly and successfully develop and introduce complex new solutions in a global, competitive, demanding, and changing environment.
If we lose our significant technology advantage in our products and services, our market share and growth could be materially adversely affected. In addition, if we are unable to deliver products, features, and functionality as projected, we may be unable to meet our commitments to customers, which could have a material adverse effect on our reputation and business. Significant investments in research and development efforts that do not lead to successful products, features, and functionality, could also materially adversely affect our business, financial condition, and results of operations.
Our business, financial condition, results of operations, and cash flows could be materially adversely affected by competing technology. Some of our competitors are large multinational companies that may have greater financial resources than us, and they may be able to devote greater resources to research and development of new systems, services, and technologies than we are able to do. Moreover, some of our competitors operate in narrow business areas, allowing them to concentrate their research and development efforts more directly on products and services for those areas than we may be able to.
High capacity products or products with new technology may be more likely to experience reliability, quality, or operability problems.
Even with rigorous testing prior to release and investment on product quality processes, problems may be found in newly developed or enhanced products after such products are launched and shipped to customers. Resolution of such issues may cause project delays, additional development costs, and deferred or lost revenue.
New products and enhancements of our existing products may also reduce demand for our existing products or could delay purchases by customers who instead decide to wait for our new or enhanced products. Difficulties that arise in our managing the transition from our older products to our new or enhanced products could result in additional costs and deferred or lost revenue.
We may need to make significant capital and operating expenditures to keep pace with technological developments in our industry.
The industries in which we participate are constantly undergoing development and change, and it is likely that new products, equipment, and service methods will be introduced in the future. We may need to make significant expenditures to purchase new equipment and to train our employees to keep pace with any new technological developments. These expenditures could adversely affect our results of operations and financial condition.
18
If we are unable to develop, preserve, and protect our intellectual property assets, our business, financial condition, results of operations, and cash flows may be negatively affected.
We strive to protect and enhance our proprietary intellectual property rights through patent, copyright, trademark, and trade secret laws, as well as through technological safeguards and operating policies and procedures. To the extent we are not successful, our business, financial condition, results of operations, and cash flows could be materially adversely impacted. We may be unable to prevent third parties from using our technology without our authorization, or from independently developing technology that is similar to ours, particularly in those countries where the laws do not protect our proprietary rights as fully as in others. With respect to our pending patent applications, we may not be successful in securing patents for these claims, and our competitors may already have applied for patents that, once issued, will prevail over our patent rights or otherwise limit our ability to sell our products.
Claims by others that we infringe their intellectual property rights could harm our business, financial condition, results of operations, and cash flows.
We have seen a trend towards aggressive enforcement of intellectual property rights as product functionality in our industry increasingly overlaps and the number of issued patents continues to grow. As a result, there is a risk that we could be subject to infringement claims which, regardless of their validity, could:
• | be expensive, time consuming, and divert management attention away from normal business operations; |
• | require us to pay monetary damages or enter into non-standard royalty and licensing agreements; |
• | require us to modify our product sales and development plans; or |
• | require us to satisfy indemnification obligations to our customers. |
Regardless of whether these claims have any merit, they can be burdensome and costly to defend or settle and can harm our business and reputation.
Infrastructure failures or catastrophic loss at any of our facilities could lead to production or service curtailments or shutdowns.
We manufacture our products at facilities in the United States, Belgium, China, Sweden, Brazil, Italy, Spain, United Kingdom, the Netherlands and Germany. An interruption in production or service capabilities at any of our facilities as a result of equipment failure or other reasons could result in our inability to manufacture our products. In the event of a stoppage in production at any of our facilities, even if only temporary, or if we experience delays as a result of events that are beyond our control, delivery times to our customers could be severely affected. Any significant delay in deliveries to our customers could lead to cancellations. Our facilities are also subject to the risk of catastrophic loss due to unanticipated events such as earthquake, fire, natural disaster, explosions, power loss, unauthorized intrusions, and other catastrophic events. We may also experience plant shutdowns or periods of reduced production as a result of equipment failure, delays in deliveries or catastrophic loss, which could have a material adverse effect on our business, financial condition, results of operations, and cash flows.
The business continuity of our information systems, computer equipment, and information databases are critical to our business operations, and any damage or disruptions could negatively affect our business, financial condition, results of operations, and cash flows.
Our operations are dependent on our ability to protect our computer equipment and the information stored in our databases from damage by, among other things, earthquake, fire, natural disaster, power loss, telecommunications failures, unauthorized intrusions, and other catastrophic events. A part of our operations is based in an area of California that has experienced earthquakes and other natural disasters, while another part of our operations is based in an area of Florida that has experienced hurricanes and other natural disasters. Despite our best efforts at planning for such contingencies, catastrophic events of this nature may still result in system failures and other interruptions in our operations, which could have a material adverse effect on our business, financial condition, results of operations, and cash flows.
In addition, it is periodically necessary to replace, upgrade, or modify our internal information systems. For example we are currently in the process of implementing common Enterprise Resource Planning (ERP) systems across the majority of our businesses. If we are unable to do this in a timely and cost-effective manner, especially in light of demands on our information technology resources, our ability to capture and process financial transactions and therefore our business, financial condition, results of operations, and cash flows may be materially adversely impacted.
19
We are subject to cyber-security risks arising out of breaches of security relating to sensitive company, client, and employee information and to the technology that manages our operations and other business processes.
Our business operations rely upon secure information technology systems for data capture, processing, storage, and reporting. Notwithstanding careful security and controls design, our information technology systems, and those of our third-party providers could become subject to cyber-attacks. Network, system, application, and data breaches could result in operational disruptions or information misappropriation, including, but not limited to, interruptions to systems availability and denial of access to and misuse of applications required by our clients to conduct business with us. Phishing and other forms of electronic fraud may also subject us to risks associated with improper access to financial assets and customer information. Theft of intellectual property or trade secrets and inappropriate disclosure of confidential information could stem from such incidents. Any such operational disruption and/or misappropriation of information could result in lost sales, negative publicity or business delays and could have a material adverse effect on our business.
Our business success depends on retaining our senior management and other key personnel and attracting and retaining other qualified employees.
We depend on our senior executive officers and other key personnel. The loss of any of these officers or key personnel could materially adversely affect our business, financial condition, results of operations, and cash flows. In addition, competition for skilled and non-skilled employees among companies that rely heavily on engineering, technology, and manufacturing is intense, and the loss of skilled or non-skilled employees or an inability to attract, retain, and motivate additional skilled and non-skilled employees required for the operation and expansion of our business could hinder our ability to conduct research activities successfully, develop new products and services and meet our customers’ requirements.
The industries in which we operate expose us to potential liabilities arising out of the installation or use of our systems that could negatively affect our business, financial condition, results of operations, and cash flows.
Our equipment, systems and services create potential exposure for us for personal injury, wrongful death, product liability, commercial claims, product recalls, production loss, property damage, pollution, and other environmental damages. In the event that a customer who purchases our equipment becomes subject to claims relating to food borne illnesses or other food safety or quality issues relating to food processed through the use of our equipment, we could be exposed to significant claims from our customers. Although we have obtained business and related risk insurance, we cannot assure you that our insurance will be adequate to cover all potential liabilities. Further, we cannot assure you that insurance will generally be available in the future or, if available, that premiums to obtain such insurance will be commercially reasonable. If we incur substantial liability and damages arising from such liability are not covered by insurance or are in excess of policy limits, or if we were to incur liability at a time when we are not able to obtain liability insurance, our business, financial condition, results of operations, and cash flows could be materially adversely affected.
Environmental protection initiatives may negatively impact the profitability of our business.
Future environmental regulatory developments in the United States and abroad concerning environmental issues, such as climate change, could adversely affect our operations and increase operating costs and, through their impact on our customers, reduce demand for our products and services. Actions may be taken in the future by the U.S. government, state governments within the United States, foreign governments, or by signatory countries through a new global climate change treaty to regulate the emission of greenhouse gases. Pressures to reduce the footprint of carbon emissions impact the air transportation and manufacturing sectors. Airports, airlines, and air cargo providers are continually looking for new ways to become more energy efficient and reduce pollutants. Manufacturing plants are seeking means to reduce their heat-trapping emissions and minimize their energy and water usage. The precise nature of any such future environmental regulatory requirements and their applicability to us and our customers are difficult to predict, but the impact to us and the industries that we serve would likely be adverse and could be significant, including the potential for increased fuel costs, carbon taxes or fees, or a requirement to purchase carbon credits.
Our operations and industries are subject to a variety of U.S. and international laws, which can change. We therefore face uncertainties with regard to lawsuits, regulations, and other related matters.
In the normal course of business, we are subject to proceedings, lawsuits, claims, and other matters, including those that relate to the environment, health and safety, employee benefits, import and export compliance, intellectual property, product liability, tax matters, securities regulation, and regulatory compliance. For example, we are subject to changes in foreign laws and regulations that may encourage or require us to hire local contractors or require foreign contractors to employ citizens of, or purchase supplies from, a particular non-U.S. jurisdiction. In addition, environmental laws and regulations affect the systems and services we design, market and sell, as well as the facilities where we manufacture our systems. We are required to invest financial and managerial resources to comply with environmental laws and regulations and anticipate that we will continue to be required to do so in the future.
20
We could be adversely affected by violations of the U.S. Foreign Corrupt Practices Act and similar worldwide anti-bribery laws.
The U.S. Foreign Corrupt Practices Act (FCPA), the U.K. Bribery Act of 2010 (the U.K. Bribery Act), and similar anti-bribery laws in other jurisdictions generally prohibit companies and their intermediaries from making improper payments for the purpose of obtaining or retaining business. Our policies mandate compliance with these anti-bribery laws. We operate in many parts of the world that have experienced governmental corruption to some degree and, in certain circumstances, strict compliance with anti-bribery laws may conflict with local customs and practices. Despite our training and compliance programs, there is no assurance that our internal control policies and procedures will protect us from acts committed by our employees or agents. If we are found to be liable for FCPA, the U.K. Bribery Act or other similar violations (either due to our own acts or our inadvertence, or due to the acts or inadvertence of others), we could suffer from civil and criminal penalties or other sanctions, which could have a material adverse impact on our business, financial condition, and results of operations.
We are subject to governmental export controls and economic sanctions laws that could impair our ability to compete in international markets and subject us to liability if we are not in full compliance with applicable laws.
Our business activities are subject to various restrictions under U.S. export controls and trade and economic sanctions laws, including the U.S. Commerce Department’s Export Administration Regulations (EAR), the International Traffic in Arms Regulations (ITAR), and economic and trade sanctions regulations maintained by the U.S. Treasury Department’s Office of Foreign Assets Control (OFAC). We are subject to similar laws and regulations in other countries in which we operate or make sales. If we fail to comply with these laws and regulations, we and certain of our employees could be subject to civil or criminal penalties and reputational harm. Obtaining the necessary authorizations, including any required license, for a particular transaction may be time-consuming, is not guaranteed, and may result in the delay or loss of sales opportunities. Furthermore, U.S. export control laws and economic sanctions laws in the U.S. and other countries prohibit certain transactions with U.S. embargoed or sanctioned countries, governments, persons and entities. Although we take precautions to prevent transactions with sanction targets, the possibility exists that we could inadvertently provide our products or services to persons prohibited by sanctions. This could result in negative consequences to us, including government investigations, penalties, and reputational harm.
Unfavorable tax law changes and tax authority rulings may adversely affect results.
We are subject to income taxes in the United States and in various foreign jurisdictions. Domestic and international tax liabilities are subject to the allocation of income among various tax jurisdictions. Our effective tax rate could be adversely affected by changes in the mix of earnings among countries with differing statutory tax rates, changes in the valuation allowance of deferred tax assets, or tax laws. The amount of income taxes and other taxes are subject to ongoing audits by U.S. federal, state, and local tax authorities and by non-U.S. authorities. If these audits result in assessments different from amounts we record, future financial results may include unfavorable tax adjustments.
If we repatriate any cash and cash equivalents from our foreign subsidiaries back to the U.S., we could be subject to significant tax liabilities.
As of December 31, 2017, our foreign subsidiaries held $29.8 million, or 88%, of our cash and cash equivalents. While we currently intend that cash and cash equivalents held by these foreign subsidiaries will be indefinitely reinvested in foreign jurisdictions in order to fund working capital requirements, make investments, and repay debt (primarily inter-company), if, in the future, cash and cash equivalents held by foreign subsidiaries are needed to fund our operations in the United States or for the purpose of making certain strategic investments in the United States or otherwise, the repatriation of such amounts to the United States could result in a significant incremental tax liability in the period in which the decision to repatriate occurs. Payment of any incremental tax liability would reduce the cash available to us to fund our operations or to make such strategic investment in the United States or otherwise.
Our business could suffer in the event of a work stoppage by our unionized or non-union labor force.
A portion of our employees in the United States are represented by collective bargaining agreements. Outside the United States, we enter into employment contracts and agreements in those countries in which such relationships are mandatory or customary, such as in Belgium, Sweden, Spain, Italy, the Netherlands and China.
Any future strikes, employee slowdowns, or similar actions by one or more unions, in connection with labor contract negotiations or otherwise, could have a material adverse effect on our ability to operate our business.
21
Our existing financing agreements include restrictive and financial covenants.
Certain of our loan agreements require us to comply with various restrictive covenants and some contain financial covenants that require us to comply with specified financial ratios and tests. Our failure to meet these covenants could result in default under these loan agreements and would result in a cross-default under other loan agreements. In the event of a default and our inability to obtain a waiver of the default, all amounts outstanding under loan agreements could be declared immediately due and payable. Our failure to comply with these covenants could adversely affect our results of operations and financial condition.
Significant changes in actual investment return on pension assets, discount rates, and other factors could affect our results of operations, equity, and pension contributions in future periods.
Our results of operations may be positively or negatively affected by the amount of income or expense we record for our defined benefit pension plans. U.S. generally accepted accounting principles (GAAP) require that we calculate income or expense for the plans using actuarial valuations. These valuations reflect assumptions about financial market and other economic conditions, which may change based on changes in key economic indicators. The most significant year-end assumptions we use to estimate pension income or expense are the discount rate and the expected long-term rate of return on plans assets. In addition, we are required to make an annual measurement of plan assets and liabilities, which may result in a significant change to equity through a reduction or increase to accumulated other comprehensive income. For a discussion regarding how our financial statements can be affected by pension plan accounting policies, see Part II, Item 7. Management's Discussion and Analysis of Financial Condition and Results of Operations -Critical Accounting Estimates – Defined Benefit Pension and Other Post-retirement Plans and Note 8. Pension and Post-Retirement and Other Benefit Plans to the Consolidated Financial Statements in Part II, Item 8. Financial Statements and Supplementary Data of this Annual Report on Form 10-K. Although GAAP expense and pension funding contributions are not directly related, key economic factors that affect GAAP expense would also likely affect the amount of cash we would contribute to pension plans as required under the Employee Retirement Income Security Act.
As a publicly traded company, we incur regulatory costs that reduce profitability.
As a publicly traded corporation, we incur certain costs to comply with regulatory requirements of the NYSE and of the federal securities laws. If regulatory requirements were to become more stringent or if accounting or other controls thought to be effective later fail, we may be forced to make additional expenditures, the amounts of which could be material. Many of our competitors are privately owned, so our accounting and control costs can be a competitive disadvantage.
Our share repurchase program could increase the volatility of the price of our common stock.
On December 2, 2015, the Board authorized a share repurchase program for up to $30 million of our common stock beginning January 1, 2016 and continuing through December 31, 2018. We have funded the repurchases through cash flows generated by our operations. The amount and timing of share repurchases was based on a variety of factors. Important factors that could cause us to limit, suspend or delay the Company’s stock repurchases include unfavorable market conditions, the trading price of the Company’s common stock, the nature of other investment opportunities presented to us from time to time, the ability to obtain financing at attractive rates, and the availability of U.S. cash. Repurchases of our shares will reduce the number of outstanding shares of our common stock and might incrementally increase the potential for volatility in our common stock by reducing the potential volumes at which our common stock may trade in the public market.
Our actual operating results may differ significantly from our guidance.
We regularly release guidance regarding our future performance that represents our management’s estimates as of the date of release. This guidance, which consists of forward-looking statements, is prepared by our management and is qualified by, and subject to, the assumptions and the other information contained or referred to in the release or report in which guidance is given. Our guidance is not prepared with a view toward compliance with published guidelines of the American Institute of Certified Public Accountants, and neither our independent registered public accounting firm nor any other independent expert or outside party compiles or examines the guidance and, accordingly, no such person expresses any opinion or any other form of assurance with respect thereto.
Guidance is based upon a number of assumptions and estimates that, while presented with numerical specificity, are inherently subject to significant business, economic and competitive uncertainties and contingencies, many of which are beyond our control and are based upon specific assumptions with respect to future business decisions, some of which will change. We generally state possible outcomes as high and low ranges which are intended to provide a sensitivity analysis as variables are changed, but are not intended to represent that actual results could not fall outside of the suggested ranges. The principal reason that we release this data is to provide a basis for our management to discuss our business outlook with analysts and investors. We do not accept any responsibility for any projections or reports published by any such persons.
22
Guidance is necessarily speculative in nature, and it can be expected that some or all of the assumptions of the guidance furnished by us will not materialize or will vary significantly from actual results. Accordingly, our guidance is only an estimate of what management believes is realizable as of the date of release. Actual results will vary from the guidance and the variations may be material. Investors should also recognize that the reliability of any forecasted financial data diminishes the farther in the future that the data are forecast. In light of the foregoing, investors are urged to put the guidance in context and not to place undue reliance on it.
Our corporate governance documents, our rights plan, and Delaware law may delay or discourage takeovers and business combinations that our stockholders might consider in their best interests.
Provisions in our certificate of incorporation and by-laws may make it difficult and expensive for a third-party to pursue a tender offer, change-in-control, or takeover attempt that is opposed by our management and Board of Directors. These provisions include, among others:
• | A Board of Directors that is divided into three classes with staggered terms; |
• | Limitations on the right of stockholders to remove directors; |
• | The right of our Board of Directors to issue preferred stock without stockholder approval; |
• | The inability of our stockholders to act by written consent; and |
• | Rules and procedures regarding how stockholders may present proposals or nominate directors at stockholders meetings. |
Public stockholders who might desire to participate in this type of transaction may not have an opportunity to do so. These anti-takeover provisions could substantially impede the ability of public stockholders to benefit from a change-in-control or a change in our management or Board of Directors and, as a result, may adversely affect the marketability and market price of our common stock.
In addition, we have adopted a stockholder rights plan intended to deter hostile or coercive attempts to acquire us. Under the plan, if any person or group acquires, or begins a tender or exchange offer that could result in such person acquiring 15% or more of our common stock, without approval of our Board of Directors under specified circumstances, our other stockholders will have the right to purchase shares of our common stock, or shares of the acquiring company, at a substantial discount to the public market price. Therefore, the rights will cause substantial dilution to a person or group that attempts to acquire us on terms not approved by our Board of Directors, except pursuant to any offer conditioned on a substantial number of rights being acquired. Although we believe these provisions protect our stockholders from coercive or otherwise unfair takeover tactics and thereby provide for an opportunity to receive a higher bid by requiring potential acquirers to negotiate with our Board of Directors, these provisions apply even if the offer may be considered beneficial by some stockholders. The stockholders rights plan will expire in July 2018, and our Board of Directors does not currently intend to replace it.
ITEM 1B. UNRESOLVED STAFF COMMENTS
None.
23
ITEM 2. PROPERTIES
We lease executive offices totaling approximately 24,000 square feet in Chicago, Illinois. We believe that our properties and facilities meet our current operating requirements and are in good operating condition. We believe that each of our significant manufacturing facilities is operating at a level consistent with the industries in which we operate. The following are significant production facilities for our JBT operations:
LOCATION | SEGMENT | SQUARE FEET (approximate) | LEASED OR OWNED | |||
United States: | ||||||
Madera, California | JBT FoodTech | 271,000 | Owned | |||
Orlando, Florida | JBT AeroTech | 248,000 | Owned | |||
Ogden, Utah | JBT AeroTech | 240,000 | Owned/Leased | |||
Lakeland, Florida | JBT FoodTech | 200,000 | Owned | |||
Stratford, Wisconsin | JBT FoodTech | 160,000 | Owned | |||
Sandusky, Ohio | JBT FoodTech | 140,000 | Owned | |||
Kingston, New York | JBT FoodTech | 133,000 | Owned | |||
Chalfont, Pennsylvania | JBT FoodTech | 67,000 | Leased | |||
Apex, North Carolina | JBT FoodTech | 65,000 | Owned | |||
Middletown, Ohio | JBT FoodTech | 65,000 | Leased | |||
Russellville, Arkansas | JBT FoodTech | 65,000 | Owned | |||
Riverside, California | JBT FoodTech | 50,000 | Leased | |||
International: | ||||||
Sint Niklaas, Belgium | JBT FoodTech | 289,000 | Owned | |||
Helsingborg, Sweden | JBT FoodTech | 227,000 | Owned/Leased | |||
Araraquara, Brazil | JBT FoodTech | 128,000 | Owned | |||
Amsterdam, The Netherlands | JBT FoodTech | 105,000 | Leased | |||
Madrid, Spain | JBT FoodTech, JBT AeroTech | 88,000 | Owned | |||
Livingston, Scotland | JBT FoodTech | 87,000 | Owned | |||
Kunshan, China | JBT FoodTech, JBT AeroTech | 80,000 | Leased | |||
Parma, Italy | JBT FoodTech | 72,000 | Owned | |||
Bridgend, Wales | JBT AeroTech | 58,000 | Owned | |||
Glinde, Germany | JBT FoodTech | 41,000 | Leased | |||
Harwich, England | JBT FoodTech | 40,000 | Leased | |||
Cape Town, South Africa | JBT FoodTech | 38,000 | Leased | |||
Juarez, Mexico | JBT AeroTech | 27,000 | Leased | |||
24
ITEM 3. LEGAL PROCEEDINGS
We are involved in legal proceedings arising in the ordinary course of business. Although the results of litigation cannot be predicted with certainty, we do not believe that the resolution of the proceedings that we are involved in, either individually or taken as a whole, will have a material adverse effect on our business, results of operations, cash flows or financial condition.
In the normal course of our business, we are at times subject to pending and threatened legal actions, some for which the relief or damages sought may be substantial. Although we are not able to predict the outcome of such actions, after reviewing all pending and threatened actions with counsel and based on information currently available, management believes that the outcome of such actions, individually or in the aggregate, will not have a material adverse effect on the results of operations or financial position of our Company. However, it is possible that the ultimate resolution of such matters, if unfavorable, may be material to the results of operations in a particular future period as the time and amount of any resolution of such actions and its relationship to the future results of operations are not currently known.
Liabilities are established for pending legal claims only when losses associated with the claims are judged to be probable, and the loss can be reasonably estimated. In many lawsuits and arbitrations, it is not considered probable that a liability has been incurred or not possible to estimate the ultimate or minimum amount of that liability until the case is close to resolution, in which case no liability would be recognized until that time.
ITEM 4. MINE SAFETY DISCLOSURES
Not applicable.
25
PART II
ITEM 5. MARKET FOR REGISTRANT’S COMMON EQUITY AND RELATED STOCKHOLDER MATTERS
Our common stock is listed on the New York Stock Exchange under the symbol JBT. As of February 26, 2018, there were 1,543 holders of record of our common stock. Information regarding the market prices of our common stock and dividends declared for the two most recent fiscal years is provided in Note 18. Quarterly Information to our Consolidated Financial Statements.
The following graph shows the cumulative total return of an investment of $100 (and reinvestment of any dividends thereafter) on December 31, 2012 in: (i) our common stock, (ii) the S&P Smallcap 600 Stock Index and (iii) the Russell 2000 Index. These indices are included for comparative purposes only and do not necessarily reflect management’s opinion that such indices are an appropriate measure of the relative performance of the stock involved, and are not intended to forecast or be indicative of possible future performance of the common stock.
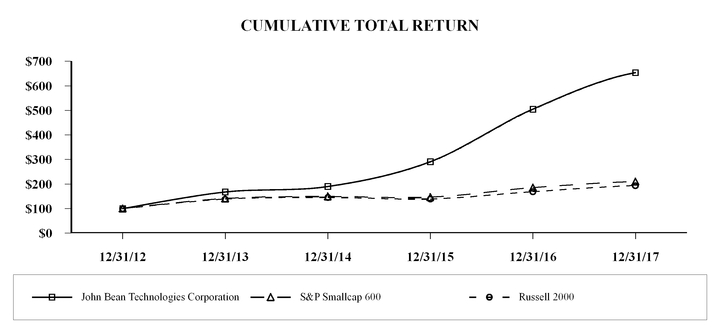
Issuer purchases of Equity Securities
The following table includes information about the Company’s stock repurchases during the three months ended December 31, 2017:
(Dollars in millions, except per share amounts) | |||||||||||||||
Period | Total Number of Shares Purchased | Average Price Paid per Share | Total Number of Shares Purchased as part of Publicly Announced Program(1) | Approximate Dollar Value of Shares that may yet be Purchased under the Program | |||||||||||
October 1, 2017 through October 31, 2017 | — | $ | — | — | $ | 20.7 | |||||||||
November 1, 2017 through November 30, 2017 | — | — | — | 20.7 | |||||||||||
December 1, 2017 through December 31, 2017 | — | — | — | 20.7 | |||||||||||
— | $ | — | — | $ | 20.7 | ||||||||||
(1) | On December 2, 2015, the Board authorized a share repurchase program for up to $30 million of our common stock beginning on January 1, 2016 and continuing through December 31, 2018. |
26
ITEM 6. SELECTED FINANCIAL DATA
The following table presents selected financial and other data about us for the most recent five fiscal years. The data has been derived from our Consolidated Financial Statements. The historical Consolidated Balance Sheet data set forth below reflects the assets and liabilities that existed as of the dates presented.
The selected financial data should be read in conjunction with, and are qualified by reference to, Item 7. Management's Discussion and Analysis of Financial Condition and Results of Operations. The income statement and cash flow data for the three years ended December 31, 2017, 2016 and 2015 and the balance sheet data as of December 31, 2017 and 2016 are derived from our audited Consolidated Financial Statements included elsewhere in this report, and should be read in conjunction with those financial statements and the accompanying notes. The balance sheet data as of December 31, 2015, 2014, 2013 and the income statement and cash flow data for the years ended December 31, 2014 and 2013 were derived from audited financial statements that are not presented in this report.
The following financial information may not reflect what our results of operations, financial position and cash flows will be in the future. In addition, Item 1A. Risk Factors of this report includes a discussion of risk factors that could impact our future results of operations.
27
Year Ended December 31, | ||||||||||||||||||||
(In millions, except per share data) | 2017 | 2016 | 2015 | 2014 | 2013 | |||||||||||||||
Income Statement Data: | ||||||||||||||||||||
Revenue: | ||||||||||||||||||||
JBT FoodTech | $ | 1,171.9 | $ | 928.0 | $ | 725.1 | $ | 634.7 | $ | 611.1 | ||||||||||
JBT AeroTech | 463.0 | 422.5 | 383.1 | 350.2 | 323.6 | |||||||||||||||
Other revenue and intercompany eliminations | 0.2 | — | (0.9 | ) | (0.7 | ) | (0.5 | ) | ||||||||||||
Total revenue | $ | 1,635.1 | $ | 1,350.5 | $ | 1,107.3 | $ | 984.2 | $ | 934.2 | ||||||||||
Operating expenses: | ||||||||||||||||||||
Cost of sales | $ | 1,164.4 | $ | 969.8 | $ | 790.4 | $ | 719.5 | $ | 699.0 | ||||||||||
Selling, general and administrative expense | 294.4 | 236.7 | 207.0 | 183.3 | 166.6 | |||||||||||||||
Research and development expense | 28.7 | 23.6 | 18.2 | 14.6 | 14.0 | |||||||||||||||
Restructuring expense | 1.7 | 12.3 | — | 14.5 | 1.6 | |||||||||||||||
Other (income) expense, net | 0.1 | 4.7 | 2.7 | 1.6 | (0.2 | ) | ||||||||||||||
Operating income | 145.8 | 103.4 | 89.0 | 50.7 | 53.2 | |||||||||||||||
Interest income | 0.7 | 1.6 | 1.1 | 1.6 | 2.2 | |||||||||||||||
Interest expense | 14.3 | 11.0 | 7.9 | 7.6 | 7.6 | |||||||||||||||
Income from continuing operations before income taxes | 132.2 | 94.0 | 82.2 | 44.7 | 47.8 | |||||||||||||||
Provision for income taxes | 50.1 | 26.0 | 26.2 | 13.9 | 13.8 | |||||||||||||||
Income from continuing operations | 82.1 | 68.0 | 56.0 | 30.8 | 34.0 | |||||||||||||||
Loss from discontinued operations, net of income taxes | 1.6 | 0.4 | 0.1 | — | 0.9 | |||||||||||||||
Net income | $ | 80.5 | $ | 67.6 | $ | 55.9 | $ | 30.8 | $ | 33.1 | ||||||||||
Diluted earnings per share: | ||||||||||||||||||||
Income from continuing operations | $ | 2.58 | $ | 2.28 | $ | 1.88 | $ | 1.03 | $ | 1.15 | ||||||||||
Net income | $ | 2.53 | $ | 2.27 | $ | 1.88 | $ | 1.03 | $ | 1.11 | ||||||||||
Diluted weighted average shares outstanding | 31.9 | 29.8 | 29.8 | 29.9 | 29.7 | |||||||||||||||
Cash dividends declared per common share | $ | 0.40 | $ | 0.40 | $ | 0.37 | $ | 0.36 | $ | 0.34 | ||||||||||
Common Stock Data: | ||||||||||||||||||||
Common stock sales price range: | ||||||||||||||||||||
High | $ | 120.55 | $ | 93.55 | $ | 51.34 | $ | 33.99 | $ | 30.00 | ||||||||||
Low | $ | 80.70 | $ | 41.35 | $ | 29.69 | $ | 25.52 | $ | 17.78 | ||||||||||
At December 31, | ||||||||||||||||||||
(In millions) | 2017 | 2016 | 2015 | 2014 | 2013 | |||||||||||||||
Balance Sheet Data: | ||||||||||||||||||||
Total assets | $ | 1,391.4 | $ | 1,187.4 | $ | 876.1 | $ | 697.8 | $ | 621.2 | ||||||||||
Long-term debt, less current portion | 372.7 | 491.6 | 280.6 | 173.8 | 94.1 | |||||||||||||||
Year Ended December 31, | ||||||||||||||||||||
(In millions) | 2017 | 2016 | 2015 | 2014 | 2013 | |||||||||||||||
Other Financial Information: | ||||||||||||||||||||
Capital expenditures | $ | 37.9 | $ | 37.1 | $ | 37.7 | $ | 36.7 | $ | 29.2 | ||||||||||
Cash flows provided by continuing operating activities | 106.3 | 67.9 | 112.2 | 78.0 | 63.1 | |||||||||||||||
Order backlog (unaudited) | 625.2 | 557.0 | 520.7 | 366.7 | 376.5 | |||||||||||||||
28
ITEM 7. MANAGEMENT’S DISCUSSION AND ANALYSIS OF FINANCIAL CONDITION AND RESULTS OF OPERATIONS
Executive Overview
We are a leading global technology solutions provider to high-value segments of the food and beverage industry with focus on proteins, liquid foods and automated system solutions. JBT designs, produces and services sophisticated products and systems for multi-national and regional customers through its FoodTech segment. JBT also sells critical equipment and services to domestic and international air transportation customers through its AeroTech segment.
In 2017 we began to implement our Elevate plan that was developed in 2016 to capitalize on the leadership position of our businesses and favorable macroecomonic trends. The Elevate plan is based on a four-pronged approach to deliver continued growth and margin expansion.
• | Accelerate New Product & Service Development. JBT is accelerating the development of innovative products and services to provide customers with solutions that enhance yield and productivity and reduce lifetime cost of ownership. |
• | Grow Recurring Revenue. JBT is capitalizing on its extensive installed base to expand recurring revenue from aftermarket parts and services, equipment leases, consumables and airport services. |
• | Execute Impact Initiatives. JBT is enhancing organic growth through initiatives that enable us to sell the entire FoodTech portfolio globally, including enhancing our international sales and support infrastructure, localizing targeted products for emerging markets, and strategic cross selling of Protein and Liquid Foods products. Additionally, our impact initiatives are designed to support the reduction in operating cost including strategic sourcing, relentless continuous improvement (lean) efforts, and the optimization of organization structure. In AeroTech, we plan to continue to develop advanced military product offering and customer support capability to service global military customers. |
• | Maintain Disciplined Acquisition Program. We are also continuing our strategic acquisition program focused on companies that add complementary products, which enable us to offer more comprehensive solutions to customers, and meet our strict economic criteria for returns and synergies. |
As we evaluate our operating results, we consider our key performance indicators of segment revenue, segment operating profit, the level of inbound orders and order backlog.
We continue to enhance our comprehensive approach to Corporate Social Responsibility (CSR), building on our culture and long tradition of concern for our employees’ health, safety, and well-being; partnering with our customers to improve their operations; and giving back to the communities where we live and work. Our equipment and technology continue to deliver quality performance while striving to minimize waste and maximize efficiency in order to create shared value for both our food processing and beverage and air transportation customers. A key CSR objective is to further align our business with our customers in order to support their ambitious quality, financial, and CSR goals.
29
Non-GAAP Financial Measures
The results for the periods ended December 31, 2017, 2016 and 2015 include several items that affect the comparability of our results. These include significant expenses that are not indicative of our ongoing operations as detailed in the table below:
Year Ended December 31, | ||||||||||||
(In millions) | 2017 | 2016 | 2015 | |||||||||
Income from continuing operations as reported | $ | 82.1 | $ | 68.0 | $ | 56.0 | ||||||
Non-GAAP adjustments | ||||||||||||
Restructuring expense | 1.7 | 12.3 | — | |||||||||
Impact on tax provision from restructuring expense(1) | (0.5 | ) | (3.9 | ) | — | |||||||
Impact on tax provision from mandatory repatriation tax | 7.7 | — | — | |||||||||
Impact on tax provision from tax law changes to deferred taxes | 7.8 | — | — | |||||||||
Adjusted income from continuing operations | $ | 98.8 | $ | 76.4 | $ | 56.0 | ||||||
(In millions, except per share data) | ||||||||||||
Income from continuing operations as reported | $ | 82.1 | $ | 68.0 | $ | 56.0 | ||||||
Total shares and dilutive securities | 31.9 | 29.8 | 29.8 | |||||||||
Diluted earnings per share from continuing operations | $ | 2.58 | $ | 2.28 | $ | 1.88 | ||||||
Adjusted income from continuing operations | 98.8 | 76.4 | 56.0 | |||||||||
Total shares and dilutive securities | 31.9 | 29.8 | 29.8 | |||||||||
Adjusted diluted earnings per share from continuing operations | $ | 3.10 | $ | 2.56 | $ | 1.88 | ||||||
(1) Impact on tax provision was calculated using the actual rate for the relevant jurisdiction for the years ended December 31, 2017, 2016 and 2015.
The above table contains adjusted income from continuing operations and adjusted diluted earnings per share from continuing operations, which are non-GAAP financial measures, and are intended to provide an indication of our underlying ongoing operating results and to enhance investors’ overall understanding of our financial performance by eliminating the effects of certain items that are not comparable from one period to the next. In addition, this information is used as a basis for evaluating our performance and for the planning and forecasting of future periods.
The table below provides a reconciliation of net income to EBITDA to Adjusted EBITDA:
Year Ended December 31, | |||||||
(In millions) | 2017 | 2016 | |||||
Net income | $ | 80.5 | $ | 67.6 | |||
Loss from discontinued operations, net of taxes | 1.6 | 0.4 | |||||
Income from continuing operations as reported | 82.1 | 68.0 | |||||
Provision for income taxes | 50.1 | 26.0 | |||||
Net interest expense | 13.6 | 9.4 | |||||
Depreciation and amortization | 51.7 | 38.5 | |||||
EBITDA | 197.5 | 141.9 | |||||
Restructuring expense | 1.7 | 12.3 | |||||
Adjusted EBITDA | $ | 199.2 | $ | 154.2 | |||
The above table provides net income as adjusted by income taxes, net interest expense and depreciation and amortization expense recorded during the period to arrive at EBITDA. Further, we add back to EBITDA significant expenses that are not indicative of our
30
ongoing operations to calculate an Adjusted EBITDA for the periods reported. Given our focus on growth through strategic acquisitions, management considers Adjusted EBITDA to be an important non-GAAP financial measure. This measure allows us to monitor business performance while excluding the impact of amortization of intangible assets, and the depreciation of fixed assets. We use Adjusted EBITDA internally to make operating decisions and believe this information is helpful to investors because it allows more meaningful period-to-period comparisons of our ongoing operating results.
We evaluate our results of operations on both an as reported and a constant currency basis. The constant currency presentation is a non-GAAP financial measure, which excludes the impact of fluctuations in foreign currency exchange rates. We believe providing constant currency information provides valuable supplemental information regarding our results of operations, consistent with how we evaluate our performance. We calculate constant currency percentages by converting our financial results in local currency for a period using the average exchange rate for the prior period to which we are comparing. This calculation may differ from similarly-titled measures used by other companies.
The non-GAAP financial measures disclosed in this Annual Report on Form 10-K are not intended to nor should they be considered in isolation or as a substitute for financial measures prepared in accordance with U.S. GAAP.
CONSOLIDATED RESULTS OF OPERATIONS
Year Ended December 31, | Favorable / (Unfavorable) | |||||||||||||||||||
(in millions) | 2017 | 2016 | 2015 | 2017 vs. 2016 | 2016 vs. 2015 | |||||||||||||||
Revenue | $ | 1,635.1 | $ | 1,350.5 | $ | 1,107.3 | $ | 284.6 | $ | 243.2 | ||||||||||
Cost of sales | 1,164.4 | 969.8 | 790.4 | (194.6 | ) | (179.4 | ) | |||||||||||||
Gross profit | 470.7 | 380.7 | 316.9 | 90.0 | 63.8 | |||||||||||||||
Gross profit % | 28.8 | % | 28.2 | % | 28.6 | % | 60 bps | -40 bps | ||||||||||||
Selling, general and administrative expense | 294.4 | 236.7 | 207.0 | (57.7 | ) | (29.7 | ) | |||||||||||||
Research and development expense | 28.7 | 23.6 | 18.2 | (5.1 | ) | (5.4 | ) | |||||||||||||
Restructuring expense | 1.7 | 12.3 | — | 10.6 | (12.3 | ) | ||||||||||||||
Other expense, net | 0.1 | 4.7 | 2.7 | 4.6 | (2.0 | ) | ||||||||||||||
Operating income | 145.8 | 103.4 | 89.0 | 42.4 | 14.4 | |||||||||||||||
Operating income % | 8.9 | % | 7.7 | % | 8.0 | % | 120 bps | -30 bps | ||||||||||||
Interest expense, net | 13.6 | 9.4 | 6.8 | (4.2 | ) | (2.6 | ) | |||||||||||||
Income from continuing operations before income taxes | 132.2 | 94.0 | 82.2 | 38.2 | 11.8 | |||||||||||||||
Provision for income taxes | 50.1 | 26.0 | 26.2 | (24.1 | ) | 0.2 | ||||||||||||||
Income from continuing operations | 82.1 | 68.0 | 56.0 | 14.1 | 12.0 | |||||||||||||||
Loss from discontinued operations, net of income taxes | 1.6 | 0.4 | 0.1 | (1.2 | ) | (0.3 | ) | |||||||||||||
Net income | $ | 80.5 | $ | 67.6 | $ | 55.9 | $ | 12.9 | $ | 11.7 | ||||||||||
2017 Compared With 2016
Total revenue increased $284.6 million, or $272.8 million in constant currency, in 2017 compared to 2016. The increase was driven by revenue from acquired companies, which added $175.0 million, organic growth of $97.8 million and $11.7 million due to currency translation.
Operating income margin was 8.9% in 2017 compared to 7.7% in the same period in 2016, an increase of 120 bps, as a result of the following items:
• | Gross profit margin increased 60 bps to 28.8% compared to 28.2% in the same period last year. This increase was primarily the result of acquisitions. |
• | Selling, general and administrative (SG&A) increased both in dollars and as a percentage of revenue. These increases are a result of higher relative SG&A expenses from recently acquired companies, including higher amortization costs of acquired |
31
intangible assets in 2017 compared to 2016. Additionally, FoodTech, which carries a higher SG&A expense rate than AeroTech represented a larger mix of JBT revenue at 72% compared to 69% in 2016.
• | Research and development expense increased by $5.1 million as we continue to invest in Elevate new product development initiatives. As a percent of revenues, these expenses have increased slightly to 1.8% in 2017 compared to 1.7% in the same period last year as we continue to support Elevate growth initiatives. |
• | Restructuring expense decreased $10.6 million. In the prior year we recorded restructuring expense of $12.3 million in connection with our plan to realign portions of the FoodTech business, accelerate sourcing initiatives and consolidate smaller facilities. |
• | Other expense, net, decreased by $4.6 million, primarily due to foreign currency gains, gains on disposals of assets, and lower acquisition costs in the year. |
Net interest expense increased by $4.2 million as a result of higher average debt balances incurred to acquire new businesses and increased interest rates.
Income tax expense for 2017 reflects an effective income tax rate of 37.9% compared to 27.6% in 2016. We recognized $15.5 million, or 11.7%, in income tax provision resulting from the enactment of the Tax Act in December 2017. See Tax Cuts and Jobs Act section below for further detail. The rate in 2017 also includes a $6.4 million favorable impact, or 4.8%, resulting from the adoption of new stock-based compensation guidance in 2017 requiring excess tax benefits to be recorded directly in earnings. The remaining unfavorable impact on our rate in 2017 reflects an increase in the mix of U.S. taxable income to our global earnings.
2016 Compared With 2015
Total revenue increased $243.2 million, or $250.4 million in constant currency, in 2016 compared to 2015. The increase was largely driven by revenue from acquisitions of $143.3 million. Organic growth of $107.1 million was also substantial with both FoodTech and AeroTech contributing organic growth rates of 10%, a reflection of higher demand for equipment and services across our businesses, success in accessing new sales opportunities with the integration of acquired businesses, and strategic value selling. Operating income increased $14.4 million, or $16.5 million in constant currency, in 2016 compared to 2015. Factors impacting operating income include:
• | Gross profit increased $63.8 million, or $67.3 million in constant currency, but declined as a percentage of revenue from 28.6% to 28.2%. The decrease in profit margins reflect lower gross profit margins contributed from businesses acquired in 2015 and 2016 which was somewhat offset by higher margins from strategic value selling. |
• | Selling, general and administrative (SG&A) expenses increased by $29.7 million, or $33.0 million in constant currency, but declined as a percentage of revenue from 18.7% to 17.5%. The increase was primarily a result of higher corporate expenses of $8.0 million including costs incurred in preparation for the implementation of a new global ERP system, and investments in Next Level initiatives including global sourcing initiatives and continuous improvement projects. In addition, we incurred $8.6 million in incremental SG&A from businesses acquired during 2015 and 2016. |
• | Research and development expense increased by $5.4 million from new product development primarily in newly acquired businesses, higher spend on new technology and product upgrades. |
• | Restructuring expense increased $12.3 million. We initiated an optimization program in early 2016 designed to realign certain FoodTech businesses. |
• | Other expense, net, increased by $2.0 million, primarily due to higher acquisition costs incurred on acquisitions pursued or completed in 2016. |
Net interest expense increased by $2.6 million as a result of higher average debt balances incurred to acquire new businesses.
Income tax expense for 2016 reflects an income tax rate of 27.6% compared to 31.9% in 2015. The decrease was driven by an increase in the R&D tax credit in 2016 compared to 2015. In addition, in 2016 we recorded $1.5 million of favorable discrete adjustments to the income tax provision, primarily reflecting a lower tax liability for fiscal year 2015.
Restructuring
In the first quarter of 2016, we implemented our optimization program to realign FoodTech’s Protein business in North America and Liquid Foods business in Europe, accelerate JBT’s strategic sourcing initiatives, and consolidate smaller facilities. The total estimated cost in connection with this plan is approximately $12.0 million.
During the fourth quarter of 2016, in connection with our acquisition of Tipper Tie, we implemented a restructuring plan to consolidate certain facilities and optimize our general and administrative infrastructure subsequent to a FoodTech acquisition. The total estimated cost in connection with this plan is approximately $4.0 million.
32
The following table shows the cumulative cost savings (annualized) to date from inception of the plans through December 31, 2017, and expected through the duration of the plans:
(In millions) | Cumulative to Date | 2018 | ||||||
Cost of Sales | $ | 1.8 | $ | 0.5 | ||||
Selling, General and Administrative Expense | 5.3 | 0.6 | ||||||
Total | $ | 7.1 | $ | 1.1 | ||||
The amount and timing of these cost savings were generally consistent with our expectations. A portion of the $7 million in savings was used to fund our JBT Elevate growth initiatives.
Tax Cuts and Job Act
Our effective tax rate was 37.9% compared to 27.6% in 2016. The higher rate in 2017 includes a $15.5 million unfavorable impact, or 11.7%, resulting from the enactment of the Tax Cuts and Jobs Act on December 22, 2017. Various provisions of the Tax Act have an impact on the 2017 results. We recorded a $7.0 million tax provision by remeasuring our U.S. net deferred tax assets to the new lower U.S. corporate tax rate. Additionally, we recorded a provisional $7.7 million one-time tax expense related to the deemed repatriation of foreign unremitted earnings and a provisional $0.8 million one-time tax expense related to executive compensation.
33
OPERATING RESULTS OF BUSINESS SEGMENTS
Year Ended December 31, | Favorable / (Unfavorable) | |||||||||||||||||||
(in millions) | 2017 | 2016 | 2015 | 2017 vs. 2016 | 2016 vs. 2015 | |||||||||||||||
Revenue | ||||||||||||||||||||
JBT FoodTech | $ | 1,171.9 | $ | 928.0 | $ | 725.1 | $ | 243.9 | $ | 202.9 | ||||||||||
JBT AeroTech | 463.0 | 422.5 | 383.1 | 40.5 | 39.4 | |||||||||||||||
Other revenue and intercompany eliminations | 0.2 | — | (0.9 | ) | 0.2 | 0.9 | ||||||||||||||
Total revenue | $ | 1,635.1 | $ | 1,350.5 | $ | 1,107.3 | $ | 284.6 | $ | 243.2 | ||||||||||
Income before income taxes | ||||||||||||||||||||
Segment operating profit: | ||||||||||||||||||||
JBT FoodTech | $ | 139.1 | $ | 113.2 | $ | 85.4 | $ | 25.9 | $ | 27.8 | ||||||||||
JBT FoodTech segment operating profit % | 11.9 | % | 12.2 | % | 11.8 | % | -30 bps | 40 bps | ||||||||||||
JBT AeroTech | 50.7 | 45.1 | 38.2 | 5.6 | 6.9 | |||||||||||||||
JBT AeroTech segment operating profit % | 11.0 | % | 10.7 | % | 10.0 | % | 30 bps | 70 bps | ||||||||||||
Total segment operating profit | 189.8 | 158.3 | 123.6 | 31.5 | 34.7 | |||||||||||||||
Total segment operating profit % | 11.6 | % | 11.7 | % | 11.2 | % | -10 bps | 60 bps | ||||||||||||
Corporate items: | ||||||||||||||||||||
Corporate expense | 42.3 | 42.6 | 34.6 | 0.3 | (8.0 | ) | ||||||||||||||
Restructuring expense | 1.7 | 12.3 | — | 10.6 | (12.3 | ) | ||||||||||||||
Net interest expense | 13.6 | 9.4 | 6.8 | (4.2 | ) | (2.6 | ) | |||||||||||||
Total corporate items | 57.6 | 64.3 | 41.4 | 6.7 | (22.9 | ) | ||||||||||||||
Income from continuing operations before income taxes | 132.2 | 94.0 | 82.2 | 38.2 | 11.8 | |||||||||||||||
Provision for income taxes | 50.1 | 26.0 | 26.2 | (24.1 | ) | 0.2 | ||||||||||||||
Income from continuing operations | 82.1 | 68.0 | 56.0 | 14.1 | 12.0 | |||||||||||||||
Loss from discontinued operations, net of income taxes | 1.6 | 0.4 | 0.1 | (1.2 | ) | (0.3 | ) | |||||||||||||
Net income | $ | 80.5 | $ | 67.6 | $ | 55.9 | $ | 12.9 | $ | 11.7 | ||||||||||
Segment operating profit is defined as total segment revenue less segment operating expenses. The following items have been excluded in computing segment operating profit: corporate staff expense, stock-based compensation, LIFO provisions, restructuring costs, certain employee benefit expenses, interest income and expense and income taxes.
JBT FoodTech
2017 Compared With 2016
JBT FoodTech’s revenue increased by $243.9 million, or $232.4 million in constant currency, in 2017 compared to 2016. North American customers drove the majority of this growth, with the remaining growth primarily driven by customers in Europe. Acquisitions contributed $166.6 million in revenue, and the remaining FoodTech business contributed $77.3 million in revenue growth, $11.6 million of which was from foreign currency translation.
JBT FoodTech's operating profit margin for the year ended December 31, 2017 was 11.9% compared to 12.2% in prior year, a decrease of 30 bps. Gross profit margins increased 20 bps year-over-year driven by acquisitions. This was more than offset by higher selling, general and administrative costs primarily attributable to recently acquired businesses and higher amortization costs in 2017 compared to 2016.
Currency translation did not have a significant impact on our operating profit comparative results for FoodTech.
34
2016 Compared With 2015
JBT FoodTech’s revenue increased by $202.9 million, or $210.4 million in constant currency, in 2016 compared to 2015. Acquisitions contributed $143.3 million in revenue, and the remaining FoodTech business contributed $67.1 million in revenue growth, which was partially offset by $7.5 million of foreign currency translation. The key driver of organic revenue performance was higher Protein equipment and aftermarket sales and higher Liquid Foods equipment sales across all regions.
JBT FoodTech's operating profit increased by $27.8 million, or $29.2 million in constant currency, in 2016 compared to 2015. The increase was driven by higher volume, acquisitions and increased profitability. Strategic value selling, sourcing savings, and other cost reduction initiatives helped drive operating profit improvement, partially offset by increased selling, general and administrative costs of $20.0 million from acquisitions and Next Level initiatives. Operating profit margin increased from 11.8% to 12.2%.
JBT AeroTech
2017 Compared With 2016
JBT AeroTech's revenue increased $40.5 million, or $40.4 million in constant currency, in 2017 compared to 2016. Acquisitions contributed $8.4 million, $32.0 million was from organic growth and $0.1 million in currency translation. Revenues from our fixed equipment business increased $16.5 million mainly due to higher shipments of passenger boarding bridges to domestic airports. Service revenues increased by $17.8 million driven by higher revenues from new maintenance contracts. Our organic mobile equipment revenue declined $2.3 million resulting mainly from decreased sales to military customers.
JBT AeroTech's operating profit margin was 11.0% compared to 10.7% in the prior year, reflecting an increase of 30 bps. Gross profit margins increased by 30 bps driven primarily by our value based selling and material sourcing savings Elevate initiatives. In addition, SG&A as a percent of sales decreased due to improved leveraging of fixed costs. These improvements were partially offset by higher operating expenses in 2017 driven by investment in research and development to support Elevate growth initiatives and acquisition related items.
Currency translation did not have a significant impact on our operating profit comparative results for AeroTech.
2016 Compared With 2015
JBT AeroTech's revenue increased $39.4 million, or $41.0 million in constant currency, in 2016 compared to 2015. Revenues from our fixed equipment business increased $15.3 million mainly due to higher deliveries of passenger boarding bridges and related equipment to domestic airports. Revenues from our mobile equipment business increased $11.6 million primarily due to higher deliveries of ground support equipment to domestic and foreign military customers and domestic ground handlers. Revenues from our airport services business improved by $14.1 million as a result of higher revenues from new and existing maintenance contracts.
JBT AeroTech's operating profit increased $6.9 million, or $7.2 million in constant currency, in 2016 compared to 2015. Higher sales volume accounted for $8.6 million of improved profit. Lower gross profit margins resulted in a decline of $1.2 million driven largely by the absence of higher than average margins on parts and services to military customers in the prior period and a lower mix of higher margin products partly offset by improved value selling. Selling, administrative and research and development costs were flat from the prior period.
Corporate Items
2017 Compared With 2016
Corporate items decreased by $6.7 million compared to 2016, driven primarily by a $10.6 million reduction in restructuring expense year-over-year, offset by $4.2 million higher net interest expense due to increased borrowings to fund acquisitions. Corporate expense as a percent of revenues decreased to 2.6% in 2017 compared to 3.1% in 2016, a decrease of 50 bps driven by increased leveraging of fixed costs.
2016 Compared With 2015
Corporate items increased by $22.9 million compared to 2015 driven by $12.3 million in restructuring expense incurred in 2016, $2.6 million in higher net interest expense resulting from increased borrowings, and $8.0 million in higher corporate expenses. Significant increases in corporate costs include $3.1 million in higher incentive compensation charges and $3.2 million in investments in initiatives including sourcing and continuous improvement initiatives as well as preparation for the implementation of a new global ERP system.
35
Inbound Orders and Order Backlog
Inbound orders represent the estimated sales value of confirmed customer orders received during the years ended December 31, 2017 and 2016.
(In millions) | 2017 | 2016 | ||||||
JBT FoodTech | $ | 1,184.4 | $ | 915.6 | ||||
JBT AeroTech | 481.7 | 442.0 | ||||||
Total inbound orders | $ | 1,666.1 | $ | 1,357.6 | ||||
Order backlog is calculated as the estimated sales value of unfilled, confirmed customer orders as of December 31, 2017 and 2016.
(In millions) | 2017 | 2016 | ||||||
JBT FoodTech | $ | 371.2 | $ | 325.5 | ||||
JBT AeroTech | 254.0 | 231.5 | ||||||
Total order backlog | $ | 625.2 | $ | 557.0 | ||||
Order backlog in our JBT FoodTech segment at December 31, 2017 increased by $17.4 million compared to December 31, 2016. Excluding the effect of foreign exchange, FoodTech backlog increased by $23.1 million due to higher demand across all regions. We expect to convert almost all of JBT FoodTech backlog at December 31, 2017 into revenue during 2018.
Order backlog in our JBT AeroTech segment at December 31, 2017 increased by $18.9 million compared to December 31, 2016. The increase was due to $6.4 million from acquisitions and an increase in both fixed and mobile equipment orders. We expect to convert approximately 70% of the JBT AeroTech backlog at December 31, 2017 into revenue during 2018.
Seasonality
We experience seasonality in our operating results. Historically, our revenues and operating income have been lower in the first quarter and highest in the fourth quarter as a result of our customers' purchasing trends.
Liquidity and Capital Resources
Our primary sources of liquidity are cash provided by operating activities of our U.S. and foreign operations and borrowings from our credit facility. Our liquidity as of December 31, 2017, or cash plus borrowing capacity under our credit facilities was $367.3 million. The cash flows generated by our operations and the credit facility are expected to be sufficient to satisfy our working capital needs, research and development activities, restructuring costs, capital expenditures, pension contributions, anticipated share repurchases, acquisitions and other financing requirements.
As of December 31, 2017, we had $34.0 million of cash and cash equivalents, $29.8 million of which was held by our foreign subsidiaries. Although these funds are considered permanently invested in our foreign subsidiaries, we are not presently aware of any restriction on the repatriation of these funds. We maintain significant operations outside of the U.S., and many of our uses of cash for working capital, capital expenditures and business acquisitions arise in these foreign jurisdictions. If these funds were needed to fund our operations or satisfy obligations in the U.S., they could be repatriated and their repatriation into the U.S. could cause us to incur additional U.S. income taxes and foreign withholding taxes. Any additional taxes could be offset, in part or in whole, by foreign tax credits. The amount of such taxes and application of tax credits would be dependent on the income tax laws and other circumstances at the time any of these amounts were repatriated.
As noted above, funds held outside of the U.S. are considered permanently invested in our non-U.S. subsidiaries. At times, these foreign subsidiaries have cash balances that exceed their immediate working capital or other cash needs. In these circumstances, the foreign subsidiaries may loan funds to the U.S. parent company on a temporary basis; the U.S. parent company has in the past and may in the future use the proceeds of these temporary intercompany loans to reduce outstanding borrowings under our committed credit facilities. By using available non-U.S. cash to repay our debt on a short-term basis, we can optimize our leverage ratio, which has the effect of lowering our interest costs.
36
Under Internal Revenue Service (IRS) guidance, no incremental tax liability is incurred on the proceeds of these loans as long as each individual loan has a term of 30 days or less and all such loans from each subsidiary are outstanding for a total of less than 60 days during the year. As of December 31, 2017 there were no amounts outstanding subject to this IRS guidance. During 2017, each such loan was outstanding for less than 30 days, and all such loans were outstanding for less than 60 days in the aggregate. We used the proceeds of these intercompany loans to reduce outstanding borrowings under our revolving credit facility. We may choose to access such funds again in the future to the extent they are available and can be transferred without significant cost, and use them on a temporary basis to repay outstanding borrowings or for other corporate purposes, but intend to do so only as allowed under this IRS guidance.
On December 2, 2015, the Board authorized a share repurchase program for up to $30 million of our common stock beginning January 1, 2016 and continuing through December 31, 2018. Shares may be purchased from time to time in open market transactions, subject to market conditions. Repurchased shares become treasury shares, which are accounted for using the cost method and are used for future equity compensation awards. The timing, price and volume of future repurchases will be based on market conditions, relevant securities laws and other factors. As of December 31, 2017, $20.7 million was still available under the program. Refer to Note 11. Stockholders' Equity for further details.
Contractual Obligations and Off-Balance Sheet Arrangements
The following is a summary of our contractual obligations at December 31, 2017:
Payments due by period | ||||||||||||||||||||
(In millions) | Total payments | Less than 1 year | 1 - 3 years | 3-5 years | After 5 years | |||||||||||||||
Long-term debt(a) | $ | 383.5 | $ | 10.5 | $ | 373.0 | $ | — | $ | — | ||||||||||
Interest payments on long-term debt(b) | 17.5 | 8.1 | 9.4 | — | — | |||||||||||||||
Operating leases | 41.4 | 11.6 | 13.8 | 9.8 | 6.2 | |||||||||||||||
Amounts due sellers from acquisitions(c) | 13.8 | 6.1 | 7.7 | — | — | |||||||||||||||
Unconditional purchase obligations(d) | 74.3 | 74.2 | 0.1 | — | — | |||||||||||||||
Pension and other post-retirement benefits(e) | 15.3 | 15.3 | — | — | — | |||||||||||||||
Transition tax due under Tax Act(f) | 7.7 | 1.0 | 1.2 | 1.2 | 4.3 | |||||||||||||||
Total contractual obligations | $ | 553.5 | $ | 126.8 | $ | 405.2 | $ | 11.0 | $ | 10.5 | ||||||||||
(a) | Our available long-term debt is dependent upon our compliance with covenants described under the heading “Financing Arrangements” later in Item 7. Management's Discussion and Analysis of Financial Condition and Results of Operations. Any violations of covenants or other events of default, which are not waived or cured, could have a material impact on our ability to maintain our committed financial arrangements and could accelerate our obligation to repay the amount due. We were in compliance with all debt covenants as of December 31, 2017. |
(b) | Interest payments were determined using the weighted average rates for all debt outstanding as of December 31, 2017. |
(c) | See Note 2. Acquisitions for further details on our recent acquisitions. |
(d) | In the normal course of business, we enter into agreements with our suppliers to purchase raw materials or services. These agreements include a requirement that our supplier provide products or services to our specifications and require us to make a firm purchase commitment to our supplier. As substantially all of these commitments are associated with purchases made to fulfill our customers’ orders, the costs associated with these agreements will ultimately be reflected in cost of sales on our consolidated statements of income. |
(e) | This amount reflects planned contributions in 2018 to our pension plans. Required contributions for future years depend on factors that cannot be determined at this time. |
(f) | This amount reflects the provisional transition tax on the previously untaxed and unrepatriated current and accumulated post-1986 foreign earnings of certain foreign subsidiaries as required by the Tax Act. |
37
The following is a summary of other off-balance sheet arrangements at December 31, 2017:
Amount of commitment expiration per period | ||||||||||||||||||||
(In millions) | Total amount | Less than 1 year | 1 - 3 years | 3-5 years | After 5 years | |||||||||||||||
Letters of credit and bank guarantees | $ | 43.6 | $ | 39.6 | $ | 3.6 | $ | — | $ | 0.4 | ||||||||||
Surety bonds | 158.2 | 44.9 | 87.5 | 25.8 | — | |||||||||||||||
Total other off-balance sheet arrangements | $ | 201.8 | $ | 84.5 | $ | 91.1 | $ | 25.8 | $ | 0.4 | ||||||||||
To provide required security regarding our performance on certain contracts, we provide letters of credit, surety bonds and bank guarantees, for which we are contingently liable. In order to obtain these financial instruments, we pay fees to various financial institutions in amounts competitively determined in the marketplace. Our ability to generate revenue from certain contracts is dependent upon our ability to obtain these off-balance sheet financial instruments.
Our off-balance sheet financial instruments may be renewed, revised or released based on changes in the underlying commitment. Historically, our commercial commitments have not been drawn upon to a material extent; consequently, management believes it is not likely that there will be claims against these commitments that would result in a negative impact on our key financial ratios or our ability to obtain financing.
Cash Flows
Cash flows for each of the three year periods ended on December 31, were as follows:
(In millions) | 2017 | 2016 | 2015 | |||||||||
Cash provided by continuing operating activities | $ | 106.3 | $ | 67.9 | $ | 112.2 | ||||||
Cash required by continuing investing activities | (139.9 | ) | (266.8 | ) | (185.1 | ) | ||||||
Cash provided by financing activities | 34.7 | 194.9 | 83.9 | |||||||||
Cash required by discontinued operations | (1.7 | ) | (0.5 | ) | (0.3 | ) | ||||||
Effect of foreign exchange rate changes on cash and cash equivalents | 1.4 | 0.5 | (6.8 | ) | ||||||||
Increase (decrease) in cash and cash equivalents | $ | 0.8 | $ | (4.0 | ) | $ | 3.9 | |||||
2017 Compared with 2016
Cash provided by continuing operating activities in 2017 were $106.3 million, representing a $38.4 million increase compared to 2016. The increase in the operating cash flows is driven by higher income in 2017 compared to 2016 offset by higher investments in working capital in 2017 compared to 2016.
Cash required by investing activities during 2017 was $139.9 million, representing a $126.9 million decrease compared to 2016. The change was due primarily to a lower level of investments in acquired companies, where we invested $104.2 million on acquisitions completed during 2017 compared to an investment in 2016 of $232.0 million.
Cash provided by financing activities in 2017 were $34.7 million, representing a $160.2 million decrease compared to 2017. On March 6, 2017 we issued 2.3 million shares of common stock which resulted in net proceeds of $184.1 million. We used the net proceeds from this offering to repay a portion of our outstanding borrowings under our revolving credit facility and for general corporate purposes. Higher operating cash flows and lower investments in acquisitions allowed for significant reduction in borrowings under our revolving credit facility.
2016 Compared with 2015
Cash flows provided by continuing operating activities in 2016 were $67.9 million, representing a $44.3 million decrease compared to 2015. The change in the operating cash flows is driven primarily by a decrease in advance payments and progress billings, an increase in inventory, as well as an increase in trade receivables due to timing of customer payments. These decreases in operating cash flow were partially offset by higher income in 2016 compared to 2015.
38
Cash required by investing activities during 2016 was $266.8 million, representing a $81.7 million increase compared to 2015. The change was due primarily to larger investments in acquired companies, where we invested $232.0 million on acquisitions completed during 2016 compared to acquisition costs in 2015 of $150.9 million.
Cash flows provided by financing activities in 2016 were $194.9 million, representing a $111.0 million increase compared to 2015. The change in financing cash flows was primarily driven by borrowings against our revolving credit facility to provide the funding required for the acquisitions completed during 2016.
Financing Arrangements
We have a $600.0 million revolving credit facility, with Wells Fargo Bank, N.A. as administrative agent, that matures in February 2020. This revolving credit facility permits borrowings in the U.S. and in the Netherlands. Borrowings bear interest, at our option, at U.S. LIBOR subject to a floor rate of zero or an alternative base rate, which is the greater of Wells Fargo’s Prime Rate, the Federal Funds Rate plus 50 basis points, and LIBOR plus 1%, plus, in each case, a margin dependent on our leverage ratio. We must also pay an annual commitment fee of 15.0 to 30.0 basis points dependent on our leverage ratio. The Credit Agreement evidencing the facility contains customary representations, warranties, and covenants, including a maximum interest coverage ratio and maximum leverage ratio, as well as certain events of default.
We have an incremental term loan in the amount of $150.0 million which bears interest on the same fully funded terms as the revolving credit facility and matures in February 2020. We are required to make mandatory prepayments, subject to certain exceptions, of the term loan with the net cash proceeds of (i) any issuance or other incurrence of indebtedness not otherwise permitted under the Credit Agreement and (ii) certain sales or other dispositions of assets subject to certain exceptions and thresholds. We are required to repay the term loan in quarterly principal installments of $1.9 million beginning on March 31, 2018, with a balloon payment at maturity to pay the remaining outstanding balance.
As of December 31, 2017 we had $150.0 million outstanding under the term loan within the credit facility, $230.5 million drawn on and $354.7 million of availability under the revolving credit facility. Our ability to use this availability is limited by the leverage ratio covenant described below.
The Credit Agreement includes covenants that, if not met, could lead to a renegotiation of our credit lines, a requirement to repay our borrowings and/or a significant increase in our cost of financing. As of December 31, 2017, we were in compliance with all covenants in the Credit Agreement. We expect to remain in compliance with all covenants in the foreseeable future. However, there can be no assurance that continued or increased volatility in global economic conditions will not impair our ability to meet our covenants, or that we will continue to be able to access the capital and credit markets on terms acceptable to us or at all. In February 2017, we exercised our option to temporarily increase the maximum allowable leverage ratio under the Credit Agreement from 3.5x to 4.0x, for the quarter ended December 31, 2016 and the following three quarters. The leverage ratio increase option is available for the first quarter end after we complete a permitted acquisition with a purchase price in excess of $100 million. Our exercise of the leverage ratio increase option has the effect of temporarily increasing the amount we are able to borrow under the revolving credit facility.
In May 2017, we entered into a fourth amendment to the Credit Agreement. This amendment revoked the leverage ratio increase period and returned us to the original maximum leverage ratio of 3.5x, as well as immediately reset the leverage ratio increase option so it would be available to us without a waiting period that would otherwise apply. The amendment expanded the qualifying event to allow for the option to be exercised if any permitted acquisition, or a series of permitted acquisitions occurring within any consecutive twelve (12) month period following the first such permitted acquisition, had aggregate consideration in excess of $100.0 million. It also provided flexibility to JBT in determining the length of the leverage ratio increase period, but not to exceed four quarters.
We have entered into interest rate swaps to fix the interest rate applicable to certain of our variable-rate debt. The agreements swap one-month LIBOR for fixed rates. We have designated these swaps as cash flow hedges and all changes in fair value of the swaps are recognized in Accumulated other comprehensive income (loss). As a result, as of December 31, 2017, some of our debt was effectively fixed rate debt while approximately $155.9 million, or 40.7%, was subject to floating, or market, rates. To the extent interest rates increase in future periods, our earnings could be negatively impacted by higher interest expense.
As part of our strategy to grow in Asia, we are expanding our operations in China and India. Due to greater restrictions on foreign currency exchange in these regions, we have established credit facilities to fund some of the local working capital requirements in these markets. Four of our wholly owned subsidiaries have short term credit facilities that allow us to borrow up to $12 million in China, which mature on June 30, 2018. We had $2.7 million in borrowings under the credit facilities in China as of December 31, 2017. Our wholly-owned subsidiary in India has a short term credit facility that allows us to borrow up to $1.4 million. As of December 31, 2017, we had no outstanding amount borrowed under this credit facility.
39
Critical Accounting Estimates
We prepare our consolidated financial statements in conformity with U.S. generally accepted accounting principles. As such, we are required to make certain estimates, judgments and assumptions about matters that are inherently uncertain. On an ongoing basis, our management re-evaluates these estimates, judgments and assumptions for reasonableness because of the critical impact that these factors have on the reported amounts of assets and liabilities at the dates of the financial statements and the reported amounts of revenue and expenses during the periods presented. Management has discussed the development and selection of these critical accounting estimates with the Audit Committee of our Board of Directors and the Audit Committee has reviewed this disclosure. We believe that the following are the critical accounting estimates used in preparing our financial statements.
Inventory Valuation
Inventory is recorded at the lower of cost or net realizable value. In order to determine net realizable value, we evaluate each component of inventory on a regular basis to determine whether it is excess or obsolete. We record the estimated decline in the carrying value of excess or obsolete inventory as a reduction of inventory and as an expense included in cost of sales in the period in which it is identified. Our estimate of excess and obsolete inventory is a critical accounting estimate because it is highly susceptible to change from period to period. In addition, it requires management to make judgments about the future demand for inventory.
In order to quantify excess or obsolete inventory, we begin by preparing a candidate listing of the components of inventory that have not demonstrated usage within the most recent three-year period. This list is then reviewed by management personnel to determine whether this list of potential excess or obsolete inventory items have orders or expected demand in the near term. The remaining items on the candidate listing are written down to their estimated net realizable value. Inherent in the estimates of net realizable value are estimates related to our future manufacturing schedules, customer demand, possible alternative uses, and ultimate realization of potentially excess inventory.
Goodwill
Goodwill represents the excess of the cost of an acquired business over the amounts assigned to the identifiable net assets. Goodwill is not amortized but is tested for impairment at a reporting unit level on an annual basis, or whenever an event occurs or circumstances change that would more likely than not reduce the fair value of a reporting unit below its carrying amount. We are required to make certain subjective and complex judgments in assessing whether an event that could indicate an impairment of goodwill has occurred, and must make assumptions and estimates to determine the fair value of our reporting units. We may first assess qualitative factors to make this determination. If we conclude that it is not more likely than not that the fair value of a reporting unit is less than its carrying amount based on our qualitative assessment, then a quantitative test is not necessary.
We may also choose to bypass the qualitative assessment and perform the quantitative test. In performing the quantitative test, we determine the fair value of a reporting unit using the “income approach” valuation method. We use a discounted cash flow model in which cash flows anticipated over several periods, plus a terminal value at the end of that time horizon, are discounted to their present value using an appropriate cost of capital rate. Judgment is required in developing the assumptions for the discounted cash flow model. These assumptions include revenue growth rates, profit margin percentages, discount rates, perpetuity growth rates, future capital expenditures, and working capital requirements, among others. If the estimated fair value of a reporting unit exceeds its carrying value, we consider that goodwill is not impaired. If the carrying value exceeds estimated fair value, there is an indication of potential impairment, and an impairment loss is recorded. We calculate the impairment loss by comparing the fair value of the reporting unit less its carrying amount, including goodwill.
We completed our annual goodwill impairment test as of October 31, 2017 using a quantitative assessment approach. As a result of this assessment we noted that the fair value of each reporting unit substantially exceeds its carrying value and therefore none of our goodwill was impaired.
Income Taxes
In determining our current income tax provision, we assess temporary differences resulting from differing treatments of items for tax and accounting purposes. These differences result in deferred tax assets and liabilities, which are recorded in our consolidated balance sheets. When we maintain deferred tax assets, we must assess the likelihood that these assets will be recovered through adjustments to future taxable income. To the extent we believe, based on available evidence, it is more likely than not that all or some portion of the asset will not be realized, we establish a valuation allowance. We record an allowance reducing the asset to a value we believe is more likely than not of being realized based on our expectation of future taxable income. We believe the accounting estimate related to the valuation allowance is a critical accounting estimate because it is highly susceptible to change from period to period as it requires management to make assumptions about our future income over the lives of the deferred tax assets, and the impact of increasing or decreasing the valuation allowance is potentially material to our results of operations.
40
Forecasting future income requires us to use a significant amount of judgment. In estimating future income, we use our internal operating budgets and long-range planning projections. We develop our budgets and long-range projections based on recent results, trends, economic and industry forecasts influencing our segments’ performance, our backlog, planned timing of new product launches, and customer sales commitments. Significant changes in the expected realization of the net deferred tax assets would require that we adjust the valuation allowance, resulting in a change to net income.
On December 22, 2017, Congress passed, and the President signed, the Tax Cuts and Jobs Act (the “Tax Act”). The Tax Act makes broad and complex changes to the U.S. tax Code, including, but not limited to, (1) reducing the U.S. federal corporate income tax rate from 35.0 percent to 21.0 percent; (2) requiring companies to pay a one-time transitional tax on certain un-repatriated earnings of foreign subsidiaries; (3) generally eliminating U.S. federal income tax on dividends from foreign subsidiaries of U.S. corporations; (4) repealing the domestic production activity deduction; (5) providing for the full expensing of qualified property; (6) adding a new provision designed to tax global intangible low-taxed income (“GILTI”); (7) revising the limitation imposed on deductions for executive compensation paid by publicly-traded companies; (8) eliminating the corporate alternative minimum tax (“AMT”) and changing how existing AMT credits can be utilized; (9) creating a base erosion-anti-abuse tax (“BEAT”), a new minimum tax on payments made by certain U.S. corporations to related foreign parties; (10) imposing a new limitation on the deductibility of interest expense; (11) allowing for a deduction related to foreign-derived intangible income (“FDII”); and (12) changing the rules related to the uses and limitations of net operating loss carryforwards generated in tax years beginning after December 31, 2017. See Note. 7 Income Taxes for further details on the impacts of these changes to the Company.
Defined Benefit Pension and Other Post-retirement Plans
The measurement of pension and other post-retirement plans’ costs requires the use of assumptions for discount rates, investment returns, employee turnover rates, retirement rates, mortality rates and other factors. The actuarial assumptions used in our pension and post-retirement benefit reporting are reviewed annually and compared with external benchmarks to ensure that they appropriately account for our future pension and post-retirement benefit obligations. While we believe that the assumptions used are appropriate, differences between assumed and actual experience may affect our operating results.
Our accrued pension and other post-retirement benefits liability reflects the funded status of our worldwide plans, or the projected benefit obligation net of plan assets. Our discount rate assumption is determined by developing a yield curve based on high quality corporate bonds with maturities matching the plan’s expected benefit payment streams. The plans’ expected cash flows are then discounted by the resulting year-by-year spot rates. The projected benefit obligation is sensitive to changes in our estimate of the discount rate. The discount rate used in calculating the projected benefit obligation for the U.S. pension plan, which represents 85% of all pension plan obligations, was 3.73% in 2017, 4.30% in 2016 and 4.60% in 2015. A decrease of 50 basis points in the discount rate used in our calculation would increase our projected benefit obligation by $19.8 million.
Our pension expense is sensitive to changes in our estimate of the expected rate of return on plan assets. The expected return on assets used in calculating the pension expense for the U.S. pension plan, which represents 96% of all pension plan assets, was 6.75% for 2017, 7.00% for 2016 and 7.25% for 2015. For 2018, the rate is expected to be 6.50%. A change of 50 basis points in the expected return on assets assumption would impact pension expense by $1.3 million (pre-tax).
See Note 8. Pension and Post-Retirement and Other Benefit Plans of the notes to Consolidated Financial Statements in Item 8. Financial Statements and Supplementary Data for additional discussion of our assumptions and the amounts reported in the Consolidated Financial Statements.
Recently Adopted Accounting Standards
In July 2015, the FASB issued ASU No. 2015-11, Inventory (Topic 330) – Simplifying the Measurement of Inventory. The core principle of the ASU is that entities that historically used the lower of cost or market in the subsequent measurement of inventory will instead be required to measure inventory at the lower of cost and net realizable value. The guidance will not change U.S. GAAP for inventory measured using LIFO or the retail inventory method. The ASU is effective for annual reporting periods, including interim periods within those annual periods, beginning after December 15, 2016. This guidance became effective for us as of January 1, 2017 and there was no effect on our consolidated financial statements and related disclosures.
In March 2016, the FASB issued ASU No. 2016-09, Stock Compensation (Topic 718) - Improvements to Employee Share-Based Payment Accounting. The new guidance was developed as part of the FASB’s simplification initiative. The core principle of the ASU requires income tax effects of awards to be recognized in the income statement when the awards vest or are settled, and eliminates the requirement to report excess tax benefits in additional paid-in capital (APIC pool). It also allows an employer to repurchase more of an employee’s shares for tax withholding purposes without triggering liability accounting, and allows an employer to make a policy election to account for forfeitures as they occur. The new standard became effective for us as of January 1, 2017. During 2017,
41
296,608 awards vested, and resulted in a $6.4 million tax benefit reported in earnings, and is classified as an operating activity within the condensed consolidated Statements of Cash Flows. The elimination of the APIC pool affects the treasury stock method used to calculate weighted average shares outstanding; however, the impact was not material. We elected to change our policy surrounding forfeitures, and beginning January 2017 we no longer estimate the number of awards expected to be forfeited but rather account for them as they occur. We are required to implement this portion of the guidance using a modified retrospective approach, and as such have recorded a cumulative adjustment of $0.6 million in retained earnings as of January 1, 2017.
We also amended our incentive compensation and stock plan to allow JBT to have the discretion to withhold up to the maximum statutory rates on an individual tax basis. A liability was not established as the withholding limits do not exceed the maximum. Cash paid for tax withholdings are classified as financing activity on the condensed consolidated Statement of Cash Flows, consistent with prior years.
In August 2016, the FASB issued ASU No. 2016-15, Statement of Cash Flows (Topic 230) Classification of Certain Cash Receipts and Cash Payments and Restricted Cash. The new guidance is intended to reduce the existing diversity in practice in how certain cash receipts and cash payments are presented and classified in the statement of cash flows. The core principle of the ASU requires the classification of eight specific cash flow issues identified under ASC 230 to be presented as either financing, investing or operating, or some combination thereof, depending upon the nature of the issue. Entities are required to use a retrospective transition approach for all of the issues identified for each period presented. The Company adopted the new ASU as of September 30, 2017. There was no impact on our consolidated financial statements and related disclosures as a result of adopting the ASU.
In January 2017, the FASB issued ASU No. 2017-01, Business Combinations (Topic 805) - Clarifying the Definition of a Business. The core principle of the ASU is to clarify the definition of a business to require certain transactions to be accounted for as business combinations versus an acquisition of assets. The Company adopted the new ASU as of September 30, 2017. There was no impact on our consolidated financial statements and related disclosures as a result of adopting the ASU.
In January 2017, the FASB issued ASU No. 2017-04, Intangibles - Goodwill and Other (Topic 350) - Simplifying the Test for Goodwill Impairment. The new guidance will simplify the accounting for goodwill impairment. The core principle of the ASU is to remove the requirement to calculate an implied fair value to determine impairment (Step 2 of the goodwill impairment test) and allow instead for goodwill impairment to equal the amount by which a reporting unit's carrying value exceeds its fair value, not to exceed the carrying amount of goodwill. The Company early adopted the new ASU as of September 30, 2017, prior to our 2017 annual testing of goodwill impairment, performed as of October 31st. There was no impact on our consolidated financial statements and related disclosures as a result of adopting the ASU.
In May 2017, the FASB issued ASU No. 2017-09, Compensation - Stock Compensation (ASC 718) - Scope of Modification Accounting. The amendments provide guidance as to how an entity should account for a change in the terms and conditions of its share-based payment awards. The core principle of the ASU is to provide clarity, and reduce the variation in applied practice, as well as, cost and complexity in accounting for a change in the terms and conditions in an entity's share-based payment awards. The Company adopted the new ASU as of September 30, 2017. There was no impact on our consolidated financial statements and related disclosures as a result of adopting the ASU.
Recently Issued Accounting Standards Not Yet Adopted
Beginning in 2014, the FASB issued ASU No. 2014-09, Revenue from Contracts with Customers (Topic 606), plus a number of related ASU’s designed to clarify and interpret Topic 606. The new standard will replace most existing revenue recognition guidance in U.S. GAAP. The core principle of the ASU requires companies to reevaluate when revenue is recorded based upon newly defined criteria, either at a point in time or over time as goods or services are delivered. The ASU requires additional disclosure about the nature, amount, timing and uncertainty of revenue and cash flows arising from customer contracts, including significant judgments and estimates, and changes in those estimates. The new standard became effective for us as of January 1, 2018. As previously disclosed, we will adopt Topic 606 on a modified-retrospective basis.
In 2017, we completed our gap assessment and determined that in certain contracts, we will qualify for over time recognition for our manufactured equipment that is highly engineered to unique customer specifications. In addition, we expect that due to the nature of our equipment and installation contracts that we will combine these into one performance obligation. Under Topic 606, revenue recognized for contracts that meet certain criteria will result in revenue being recognized as the equipment is being manufactured which is an acceleration of revenue as compared to our current revenue recognition methodology of recognizing revenue, generally when the equipment is shipped to the customer. This conclusion, specific to equipment contracts for which the equipment is highly engineered to unique customer specifications, is dependent on whether our contract with the customer provides us, upon customer cancellation, with an enforceable right to payment for performance completed to date. Where the contract does not provide explicit language regarding cancellation payments, revenue will be recognized at a point in time, usually upon completion of the installation of the equipment. Therefore, some revenue will be deferred and recognized at a later date. This impacts both equipment contracts with
42
installation that qualify as one performance obligation, and that were previously recognized upon shipment, as well as certain equipment contracts for which revenue was recognized under percentage of completion accounting under legacy GAAP.
We continue to execute our implementation plan and have developed new revenue accounting policies and processes; changed our internal controls over revenue recognition; created pro forma disclosures; and continue to implement system changes and enhancements. We are in the process of evaluating all contracts not completed on January 1, 2018 and have preliminarily determined the net impact of adopting this standard will be a reduction to retained earnings within the range of $25 million to $30 million. This differs significantly from the expected impact previously disclosed and is due solely due to interpretations published subsequent to our previous disclosure regarding what constitutes an enforceable right to payment. For full year 2018 results, we expect the financial statement impact of this deferral will be substantially offset by the requirement to defer revenue on contracts that, under legacy GAAP, would have been recognized in 2018, but will be deferred until 2019 under the new standard. Our assessment of the foregoing is ongoing and subject to finalization, such that the actual impact of the adoption may differ materially from the estimated ranges described above.
Upon adoption of the new revenue standard in the first quarter of 2018, the timing of revenue recognition for certain projects will vary and may be recorded upon shipment based on contract terms, when previously such projects were recorded over time. The impact to future revenue trends is uncertain as it will depend on future orders and contract terms. However, cash flows and overall profitability of a contract at completion are unchanged by the new standard.
In February 2016, the FASB issued ASU No. 2016-02, Leases (Topic 842). The new standard will replace most existing lease guidance in U.S. GAAP. The core principle of the ASU is the requirement for lessees to report a right to use asset and a lease payment obligation on the balance sheet, but recognize expenses on their income statements in a manner similar to today’s accounting. Accounting for lessors will remains substantially similar to current U.S. GAAP. The ASU is effective for annual reporting periods, including interim periods within those annual periods, beginning after December 15, 2018. However, early adoption is permitted. Entities are required to use a modified retrospective approach for leases that exist or are entered into after the beginning of the earliest comparative period in the financial statements. We are in the process of evaluating the impact this standard will have on our consolidated financial statements and related disclosures.
In October 2016, the FASB issued ASU 2016-16, Income Taxes: Intra-Entity Transfers of Assets Other Than Inventory. The new guidance is intended to simplify the accounting for intercompany asset transfers. The core principle requires an entity to immediately recognize the tax consequences of intercompany asset transfers. The ASU is effective for annual reporting periods, including interim periods within those annual periods, beginning after December 15, 2017. However, early adoption is permitted only at the beginning of an annual period for which no financial statements (interim or annual) have already been issued. The Company will adopt this standard in the effective period. The impact to our consolidated financial statements and related disclosures will be immaterial.
In March 2017, the FASB issued ASU No. 2017-07, Compensation - Retirement Benefits (ASC 715) - Improving the Presentation of Net Periodic Pension Costs and Net Periodic Postretirement Benefit Cost. The new guidance will change the presentation of pension cost by providing additional guidance on the presentation of net benefit cost in the income statement and on the components eligible for capitalization in assets. The core principle of the ASU is to provide more transparency in the presentation of these costs by requiring the service cost component to be reported in the same line item as other compensation costs arising from services rendered by the pertinent employees during the period. The other components of net benefit cost are required to be presented separately from the service cost component and outside a subtotal of income from operations. The amendments require that the Statements of Income impacts be applied retrospectively, while Balance Sheet changes should be applied prospectively. As such, upon adoption in 2018, the Company expects to reduce operating income for fiscal year 2017 by $2.0 million, and report this income in non operating income. Operating income for the fiscal year 2016 will be reduced by $2.3 million. There will be no impact to net income or to the Balance Sheet or Statement of Cash Flows.
The ASU is effective for annual reporting periods, including interim periods within those annual periods, beginning after December 15, 2017. However, early adoption is permitted as of the beginning of an annual period for which financial statements (interim or annual) have not been issued or made available for issuance. The Company will adopt the newly issued ASU as of January 1, 2018.
In August 2017, the FASB issued ASU No. 2017-12, Derivatives and Hedging (ASC 815) - Targeted Improvements to Accounting for Hedging Activities. The core of the principle is to simplify hedge accounting, as well as improve the financial reporting of hedging results, for both financial and commodity risks, in the financial statements and related disclosures. The ASU is effective for annual reporting periods, including interim periods within those annual periods, beginning after December 15, 2018. Early adoption is permitted in any interim period after the issuance of the amendment, however, any adjustments should be made as of the beginning of the fiscal year in which the interim period occurred. The Company is currently evaluating the effect, if any, that the ASU will have on our consolidated financial statements and related disclosures.
43
ITEM 7A. QUANTITATIVE AND QUALITATIVE DISCLOSURES ABOUT MARKET RISK
We are subject to financial market risks, including fluctuations in foreign currency exchange rates and interest rates. In order to manage and mitigate our exposure to these risks, we may use derivative financial instruments in accordance with established policies and procedures. We do not use derivative financial instruments where the objective is to generate profits solely from trading activities. At December 31, 2017 and 2016, our derivative holdings consisted of foreign currency forward contracts and foreign currency instruments embedded in purchase and sale contracts and interest rate swap contracts.
These forward-looking disclosures address potential impacts from market risks only as they affect our financial instruments. They do not include other potential effects resulting from changes in foreign currency exchange rates, interest rates, commodity prices or equity prices that could impact our business..
Foreign Currency Exchange Rate Risk
During 2017, our foreign subsidiaries generated 31.4% of our revenue, the largest component of which was our operations in Sweden which generated 8.3% of our revenue. Financial statements of our foreign subsidiaries for which the U.S. dollar is not the functional currency are translated into U.S. dollars. As a result, we are exposed to foreign currency translation risk.
When we sell or purchase products or services, transactions are frequently denominated in currencies other than an operation’s functional currency. As a result, we are exposed to foreign currency transaction risk. When foreign currency exposures exist, we may enter into foreign exchange forward instruments with third parties to economically hedge foreign currency exposures. Our hedging policy reduces, but does not entirely eliminate, the impact of foreign currency exchange rate movements. We do not apply hedge accounting for our foreign currency forward instruments.
We economically hedge our recognized foreign currency assets and liabilities to reduce the risk that our earnings and cash flows will be adversely affected by fluctuations in foreign currency exchange rates. We expect any gains or losses in the hedging portfolio to be substantially offset by a corresponding gain or loss in the underlying exposures being hedged. We also economically hedge firmly committed anticipated transactions in the normal course of business. As these are not offset by an underlying balance sheet position being hedged, our earnings can be significantly impacted on a periodic basis by the change in unrealized value of these hedges.
We use a sensitivity analysis to measure the impact of an immediate 10% adverse movement in the foreign currency exchange rates. This calculation assumes that each exchange rate would change in the same direction relative to the U.S. dollar and all other variables are held constant. We expect that changes in the fair value of derivative instruments will offset the changes in fair value of the underlying assets and liabilities on the balance sheet. A 10% adverse movement in the foreign currency exchange rates would have an immaterial impact on the value of our derivative instruments as of December 31, 2017. This amount would be reflected in our net income but would be significantly offset by the changes in the fair value of the underlying hedged assets and liabilities.
Interest Rate Risk
Our debt instruments subject us to market risk associated with movements in interest rates. We had $383.3 million in variable rate debt outstanding at December 31, 2017. A hypothetical 10% adverse movement in the interest rate would not significantly impact the annual interest expense.
We have entered into interest rate swaps to fix the interest rate applicable to certain of our variable-rate debt. The agreements swap one-month LIBOR for fixed rates. We have designated these swaps as cash flow hedges and all changes in fair value of the swaps are recognized in accumulated other comprehensive income. We use a sensitivity analysis to measure the impact on fair value of the interest rate swaps of an immediate adverse movement in the interest rates of 50 basis points. This analysis was based on a modeling technique that measures the hypothetical market value resulting from a 50 basis point change in interest rates. This adverse change in the applicable interest rates would result in an increase of $2.5 million in the net fair value of our interest rate swaps at December 31, 2017.
44
ITEM 8. FINANCIAL STATEMENTS AND SUPPLEMENTARY DATA
Report of Independent Registered Public Accounting Firm
The Stockholders and Board of Directors
John Bean Technologies Corporation:
Opinion on the Consolidated Financial Statements
We have audited the accompanying consolidated balance sheets of John Bean Technologies Corporation and subsidiaries (the “Company”) as of December 31, 2017 and 2016, the related consolidated statements of income, comprehensive income (loss), changes in stockholders’ equity, and cash flows for each of the years in the three‑year period ended December 31, 2017, and the related notes and financial statement schedule II (collectively, the “consolidated financial statements”). In our opinion, the consolidated financial statements present fairly, in all material respects, the financial position of the Company as of December 31, 2017 and 2016, and the results of its operations and its cash flows for each of the years in the three‑year period ended December 31, 2017, in conformity with U.S. generally accepted accounting principles.
We also have audited, in accordance with the standards of the Public Company Accounting Oversight Board (United States) (“PCAOB”), the Company’s internal control over financial reporting as of December 31, 2017, based on criteria established in Internal Control - Integrated Framework (2013) issued by the Committee of Sponsoring Organizations of the Treadway Commission, and our report dated February 28, 2018 expressed an unqualified opinion on the effectiveness of the Company’s internal control over financial reporting.
Basis for Opinion
These consolidated financial statements are the responsibility of the Company’s management. Our responsibility is to express an opinion on these consolidated financial statements based on our audits. We are a public accounting firm registered with the PCAOB and are required to be independent with respect to the Company in accordance with the U.S. federal securities laws and the applicable rules and regulations of the Securities and Exchange Commission and the PCAOB.
We conducted our audits in accordance with the standards of the PCAOB. Those standards require that we plan and perform the audit to obtain reasonable assurance about whether the consolidated financial statements are free of material misstatement, whether due to error or fraud. Our audits included performing procedures to assess the risks of material misstatement of the consolidated financial statements, whether due to error or fraud, and performing procedures that respond to those risks. Such procedures included examining, on a test basis, evidence regarding the amounts and disclosures in the consolidated financial statements. Our audits also included evaluating the accounting principles used and significant estimates made by management, as well as evaluating the overall presentation of the consolidated financial statements. We believe that our audits provide a reasonable basis for our opinion.
/s/ KPMG LLP
We have served as the Company's auditor since 2007.
Chicago, Illinois
February 28, 2018
45
JOHN BEAN TECHNOLOGIES CORPORATION
CONSOLIDATED STATEMENTS OF INCOME
Year Ended December 31, | ||||||||||||
(In millions, except per share data) | 2017 | 2016 | 2015 | |||||||||
Revenue: | ||||||||||||
Product revenue | $ | 1,376.8 | $ | 1,133.1 | $ | 957.8 | ||||||
Service revenue | 258.3 | 217.4 | 149.5 | |||||||||
Total revenue | 1,635.1 | 1,350.5 | 1,107.3 | |||||||||
Operating expenses: | ||||||||||||
Cost of products | 961.1 | 803.8 | 676.2 | |||||||||
Cost of services | 203.3 | 166.0 | 114.2 | |||||||||
Selling, general and administrative expense | 294.4 | 236.7 | 207.0 | |||||||||
Research and development expense | 28.7 | 23.6 | 18.2 | |||||||||
Restructuring expense | 1.7 | 12.3 | — | |||||||||
Other expense, net | 0.1 | 4.7 | 2.7 | |||||||||
Operating income: | 145.8 | 103.4 | 89.0 | |||||||||
Interest expense, net | 13.6 | 9.4 | 6.8 | |||||||||
Income from continuing operations before income taxes | 132.2 | 94.0 | 82.2 | |||||||||
Provision for income taxes | 50.1 | 26.0 | 26.2 | |||||||||
Income from continuing operations | 82.1 | 68.0 | 56.0 | |||||||||
Loss from discontinued operations, net of income taxes | 1.6 | 0.4 | 0.1 | |||||||||
Net income | $ | 80.5 | $ | 67.6 | $ | 55.9 | ||||||
Basic earnings per share: | ||||||||||||
Income from continuing operations | $ | 2.61 | $ | 2.31 | $ | 1.90 | ||||||
Loss from discontinued operations | (0.05 | ) | (0.01 | ) | (0.01 | ) | ||||||
Net income | $ | 2.56 | $ | 2.30 | $ | 1.89 | ||||||
Diluted earnings per share: | ||||||||||||
Income from continuing operations | $ | 2.58 | $ | 2.28 | $ | 1.88 | ||||||
Loss from discontinued operations | (0.05 | ) | (0.01 | ) | — | |||||||
Net income | $ | 2.53 | $ | 2.27 | $ | 1.88 | ||||||
Dividends declared per share | $ | 0.40 | $ | 0.40 | $ | 0.37 | ||||||
Weighted average shares outstanding: | ||||||||||||
Basic | 31.4 | 29.4 | 29.5 | |||||||||
Diluted | 31.9 | 29.8 | 29.8 | |||||||||
The accompanying notes are an integral part of the consolidated financial statements.
46
CONSOLIDATED STATEMENTS OF COMPREHENSIVE INCOME (LOSS)
Year Ended December 31, | ||||||||||||
(In millions) | 2017 | 2016 | 2015 | |||||||||
Net income | $ | 80.5 | $ | 67.6 | $ | 55.9 | ||||||
Other comprehensive income | ||||||||||||
Foreign currency translation adjustments | 20.5 | (5.7 | ) | (21.9 | ) | |||||||
Pension and other post-retirement benefits adjustments, net of tax | (5.2 | ) | (4.8 | ) | (7.4 | ) | ||||||
Derivatives designated as hedges, net of tax | 1.5 | 0.7 | (0.8 | ) | ||||||||
Other comprehensive income (loss) | 16.8 | (9.8 | ) | (30.1 | ) | |||||||
Comprehensive income | $ | 97.3 | $ | 57.8 | $ | 25.8 | ||||||
The accompanying notes are an integral part of the consolidated financial statements.
47
JOHN BEAN TECHNOLOGIES CORPORATION
CONSOLIDATED BALANCE SHEETS
(In millions, except per share and number of shares) | December 31, 2017 | December 31, 2016 | ||||||
Assets | ||||||||
Current Assets: | ||||||||
Cash and cash equivalents | $ | 34.0 | $ | 33.2 | ||||
Trade receivables, net of allowances of $3.2 and $3.1, respectively | 316.4 | 260.5 | ||||||
Inventories | 190.2 | 139.6 | ||||||
Other current assets | 48.0 | 51.7 | ||||||
Total current assets | 588.6 | 485.0 | ||||||
Property, plant and equipment, net of accumulated depreciation of $273.3 and $238.0, respectively | 233.0 | 210.2 | ||||||
Goodwill | 301.8 | 239.5 | ||||||
Intangible assets, net | 216.8 | 186.0 | ||||||
Deferred income taxes | 13.1 | 35.0 | ||||||
Other assets | 38.1 | 31.7 | ||||||
Total Assets | $ | 1,391.4 | $ | 1,187.4 | ||||
Liabilities and Stockholders' Equity | ||||||||
Current Liabilities: | ||||||||
Short-term debt and current portion of long-term debt | $ | 10.5 | $ | 7.1 | ||||
Accounts payable, trade and other | 157.1 | 135.7 | ||||||
Advance and progress payments | 127.6 | 110.5 | ||||||
Accrued payroll | 49.8 | 49.1 | ||||||
Other current liabilities | 96.4 | 90.6 | ||||||
Total current liabilities | 441.4 | 393.0 | ||||||
Long-term debt, less current portion | 372.7 | 491.6 | ||||||
Accrued pension and other post-retirement benefits, less current portion | 85.9 | 86.1 | ||||||
Other liabilities | 49.5 | 36.8 | ||||||
Commitments and contingencies (Note 15) | ||||||||
Stockholders' Equity: | ||||||||
Preferred stock, $0.01 par value; 20,000,000 shares authorized; no shares issued in 2017 or 2016 | — | — | ||||||
Common stock, $0.01 par value; 120,000,000 shares authorized; 2017: 31,623,079 issued, and 31,577,182 outstanding; 2016: 29,316,041 issued and 29,156,847 outstanding | 0.3 | 0.3 | ||||||
Common stock held in treasury, at cost; 2017: 45,897; and 2016: 159,194 shares | (4.0 | ) | (7.2 | ) | ||||
Additional paid-in capital | 252.2 | 77.2 | ||||||
Retained earnings | 333.7 | 266.6 | ||||||
Accumulated other comprehensive loss | (140.3 | ) | (157.0 | ) | ||||
Total Stockholders' Equity | 441.9 | 179.9 | ||||||
Total Liabilities and Stockholders' Equity | $ | 1,391.4 | $ | 1,187.4 | ||||
The accompanying notes are an integral part of the consolidated financial statements.
48
JOHN BEAN TECHNOLOGIES CORPORATION
CONSOLIDATED STATEMENTS OF CASH FLOWS
Year Ended December 31, | ||||||||||||
(In millions) | 2017 | 2016 | 2015 | |||||||||
Cash Flows From Operating Activities: | ||||||||||||
Net income | $ | 80.5 | $ | 67.6 | $ | 55.9 | ||||||
Loss from discontinued operations, net | 1.6 | 0.4 | 0.1 | |||||||||
Income from continuing operations | 82.1 | 68.0 | 56.0 | |||||||||
Adjustments to reconcile net income from continuing operations to cash provided by operating activities of continuing operations: | ||||||||||||
Depreciation | 29.7 | 25.4 | 20.0 | |||||||||
Amortization | 22.0 | 13.1 | 9.6 | |||||||||
Stock-based compensation | 9.0 | 9.9 | 7.2 | |||||||||
Pension and other post-retirement benefits expense | (0.2 | ) | (1.0 | ) | (1.4 | ) | ||||||
Deferred income taxes | 18.3 | (0.1 | ) | 5.8 | ||||||||
Other | (0.4 | ) | (0.7 | ) | 0.1 | |||||||
Changes in operating assets and liabilities, net of effects of acquisitions: | ||||||||||||
Trade receivables, net | (35.8 | ) | (29.0 | ) | (11.3 | ) | ||||||
Inventories | (23.7 | ) | (2.9 | ) | 15.6 | |||||||
Accounts payable, trade and other | 8.5 | 16.1 | 10.4 | |||||||||
Advance payments and progress billings | 3.4 | (17.0 | ) | 26.9 | ||||||||
Accrued pension and other post-retirement benefits, net | (11.2 | ) | (10.5 | ) | (14.3 | ) | ||||||
Other assets and liabilities, net | 4.6 | (3.4 | ) | (12.4 | ) | |||||||
Cash provided by continuing operating activities | 106.3 | 67.9 | 112.2 | |||||||||
Net cash required by discontinued operating activities | (1.7 | ) | (0.5 | ) | (0.3 | ) | ||||||
Cash provided by operating activities | 104.6 | 67.4 | 111.9 | |||||||||
Cash Flows From Investing Activities: | ||||||||||||
Acquisitions, net of cash acquired | (104.2 | ) | (232.0 | ) | (150.9 | ) | ||||||
Capital expenditures | (37.9 | ) | (37.1 | ) | (37.7 | ) | ||||||
Proceeds from disposal of assets | 2.2 | 2.3 | 1.5 | |||||||||
Proceeds from property available for sale | — | — | 2.0 | |||||||||
Cash required by investing activities | (139.9 | ) | (266.8 | ) | (185.1 | ) | ||||||
Cash Flows From Financing Activities: | ||||||||||||
Net proceeds (payments) on short-term debt | (1.0 | ) | 0.9 | (1.5 | ) | |||||||
Proceeds from short-term foreign credit facilities | 6.8 | 15.3 | — | |||||||||
Payments of short-term foreign credit facilities | (8.4 | ) | (11.0 | ) | — | |||||||
Net proceeds (payments) from domestic credit facilities | (111.8 | ) | 62.4 | 184.3 | ||||||||
Issuance of long-term debt | — | 149.5 | — | |||||||||
Cash payments to settle private placement debt | — | — | (75.0 | ) | ||||||||
Repayment of long-term debt | (1.5 | ) | (2.0 | ) | (1.4 | ) | ||||||
Proceeds from stock issuance, net of stock issuance costs | 184.1 | |||||||||||
Excess tax benefits | — | 1.5 | 2.2 | |||||||||
Settlement of taxes withheld on equity compensation awards | (10.5 | ) | (2.6 | ) | (5.8 | ) | ||||||
Purchase of treasury stock | (5.0 | ) | (4.3 | ) | (7.7 | ) | ||||||
Dividends | (12.7 | ) | (11.8 | ) | (11.2 | ) | ||||||
Deferred acquisition payments | (5.3 | ) | (3.0 | ) | — | |||||||
Cash provided by financing activities | 34.7 | 194.9 | 83.9 | |||||||||
Effect of foreign exchange rate changes on cash and cash equivalents | 1.4 | 0.5 | (6.8 | ) | ||||||||
Increase (decrease) in cash and cash equivalents | 0.8 | (4.0 | ) | 3.9 | ||||||||
Cash and cash equivalents, beginning of period | 33.2 | 37.2 | 33.3 | |||||||||
Cash and cash equivalents, end of period | $ | 34.0 | $ | 33.2 | $ | 37.2 | ||||||
Supplemental Cash Flow Information: | ||||||||||||
Interest paid | $ | 13.1 | $ | 10.4 | $ | 7.7 | ||||||
Income taxes paid | 24.0 | 25.8 | 13.8 | |||||||||
Acquisition - deferred consideration (non-cash) | 13.8 | 12.0 | — | |||||||||
The accompanying notes are an integral part of the consolidated financial statements.
49
JOHN BEAN TECHNOLOGIES CORPORATION
CONSOLIDATED STATEMENTS OF CHANGES IN STOCKHOLDERS’ EQUITY
(In millions) | Common Stock | Common Stock Held in Treasury | Additional Paid-In Capital | Retained Earnings | Accumulated Other Comprehensive Income(Loss) | Total Equity | ||||||||||||||||||
December 31, 2014 | $ | 0.3 | $ | (1.5 | ) | $ | 71.1 | $ | 166.4 | $ | (117.1 | ) | $ | 119.2 | ||||||||||
Net income | — | — | — | 55.9 | — | 55.9 | ||||||||||||||||||
Issuance of common stock | — | 3.1 | (3.1 | ) | — | — | — | |||||||||||||||||
Taxes withheld on issuance of stock-based awards | — | — | (5.8 | ) | — | — | (5.8 | ) | ||||||||||||||||
Excess tax benefits on stock-based payment arrangements | — | — | 2.2 | — | — | 2.2 | ||||||||||||||||||
Dividends on stock-based payment arrangements | — | — | — | (0.4 | ) | — | (0.4 | ) | ||||||||||||||||
Common stock cash dividends | — | — | — | (10.8 | ) | — | (10.8 | ) | ||||||||||||||||
Share repurchases | — | (7.7 | ) | — | — | — | (7.7 | ) | ||||||||||||||||
Foreign currency translation adjustments | — | — | — | — | (21.9 | ) | (21.9 | ) | ||||||||||||||||
Derivatives designated as hedges, net of income taxes of $0.6 | — | — | — | — | (0.8 | ) | (0.8 | ) | ||||||||||||||||
Pension and other post-retirement liability adjustments, net of income taxes of $5.5 | — | — | — | — | (7.4 | ) | (7.4 | ) | ||||||||||||||||
Stock-based compensation expense | — | — | 7.2 | — | — | 7.2 | ||||||||||||||||||
December 31, 2015 | 0.3 | (6.1 | ) | 71.6 | 211.1 | (147.2 | ) | 129.7 | ||||||||||||||||
Net income | — | — | — | 67.6 | — | 67.6 | ||||||||||||||||||
Issuance of common stock | — | 3.2 | (3.2 | ) | — | — | — | |||||||||||||||||
Taxes withheld on issuance of stock-based awards | — | — | (2.6 | ) | — | — | (2.6 | ) | ||||||||||||||||
Excess tax benefits on stock-based payment arrangements | — | — | 1.5 | — | — | 1.5 | ||||||||||||||||||
Dividends on stock-based payment arrangements | — | — | — | (0.4 | ) | — | (0.4 | ) | ||||||||||||||||
Common stock cash dividends | — | — | — | (11.7 | ) | — | (11.7 | ) | ||||||||||||||||
Share repurchases | — | (4.3 | ) | — | — | — | (4.3 | ) | ||||||||||||||||
Foreign currency translation adjustments | — | — | — | — | (5.7 | ) | (5.7 | ) | ||||||||||||||||
Derivatives designated as hedges, net of income taxes of $0.4 | — | — | — | — | 0.7 | 0.7 | ||||||||||||||||||
Pension and other post-retirement liability adjustments, net of income taxes of $(1.8) | — | — | — | — | (4.8 | ) | (4.8 | ) | ||||||||||||||||
Stock-based compensation expense | — | — | 9.9 | — | — | 9.9 | ||||||||||||||||||
December 31, 2016 | 0.3 | (7.2 | ) | 77.2 | 266.6 | (157.0 | ) | 179.9 | ||||||||||||||||
Net income | — | — | — | 80.5 | — | 80.5 | ||||||||||||||||||
Issuance of treasury stock | — | 8.2 | (8.2 | ) | — | — | — | |||||||||||||||||
Issuance of common stock | — | — | 184.1 | — | — | 184.1 | ||||||||||||||||||
Taxes withheld on issuance of stock-based awards | — | — | (10.5 | ) | — | — | (10.5 | ) | ||||||||||||||||
Dividends on stock-based payment arrangements | — | — | — | (0.4 | ) | — | (0.4 | ) | ||||||||||||||||
Common stock cash dividends | — | — | — | (12.4 | ) | — | (12.4 | ) | ||||||||||||||||
Share repurchases | — | (5.0 | ) | — | — | — | (5.0 | ) | ||||||||||||||||
Foreign currency translation adjustments | — | — | — | — | 20.5 | 20.5 | ||||||||||||||||||
Derivatives designated as hedges, net of income taxes of $0.9 | — | — | — | — | 1.5 | 1.5 | ||||||||||||||||||
Pension and other postretirement liability adjustments, net of income taxes of ($1.7) | — | — | — | — | (5.3 | ) | (5.3 | ) | ||||||||||||||||
Cumulative adjustment - Change in accounting policy ASU 2016-09 | — | — | 0.6 | (0.6 | ) | — | — | |||||||||||||||||
Stock-based compensation expense | — | — | 9.0 | — | — | 9.0 | ||||||||||||||||||
December 31, 2017 | $ | 0.3 | $ | (4.0 | ) | $ | 252.2 | $ | 333.7 | $ | (140.3 | ) | $ | 441.9 | ||||||||||
The accompanying notes are an integral part of the consolidated financial statements.
50
JOHN BEAN TECHNOLOGIES CORPORATION
NOTES TO CONSOLIDATED FINANCIAL STATEMENTS
NOTE 1. SUMMARY OF SIGNIFICANT ACCOUNTING POLICIES
Consolidation
The consolidated financial statements include the accounts of John Bean Technologies Corporation (JBT, we, or the Company) and all wholly-owned subsidiaries. All intercompany investments, accounts, and transactions have been eliminated.
Use of estimates
Preparation of financial statements that follow accounting principles generally accepted in the U.S. (U.S. GAAP) requires management to make estimates and judgments that affect the reported amounts of assets and liabilities and the disclosure of contingent assets and liabilities at the date of the financial statements, and the reported amounts of revenues and expenses during the reporting period. Actual results could differ from these estimates.
Cash and cash equivalents
Cash and cash equivalents consist of cash and highly liquid investments with original maturities of three months or less.
Inventories
Inventories are stated at the lower of cost or net realizable value, which includes an estimate for excess and obsolete inventories. Inventory costs include those costs directly attributable to products, including all manufacturing overhead but excluding costs to distribute. Cost is determined on the last-in, first-out (“LIFO”) basis for all domestic inventories, except certain inventories relating to construction-type contracts, which are stated at the actual production cost incurred to date, reduced by the portion of these costs identified with revenue recognized. The first-in, first-out (“FIFO”) method is used to determine the cost for all other inventories.
Property, plant, and equipment
Property, plant, and equipment are recorded at cost. Depreciation for financial reporting purposes is provided principally on the straight-line basis over the estimated useful lives of the assets (land improvements—20 to 35 years; buildings—20 to 50 years; and machinery and equipment—3 to 20 years). Gains and losses are reflected in other expense, net on the consolidated statements of income upon the sale or retirement of assets. Expenditures that extend the useful lives of property, plant, and equipment are capitalized and depreciated over the estimated new remaining life of the asset.
Capitalized software costs
Other assets include the capitalized cost of internal use software (including Internet web sites). The assets are stated at cost less accumulated amortization and were $16.7 million and $12.3 million at December 31, 2017 and 2016, respectively. These software costs include the amount paid for purchases of software and internal and external costs incurred during the application development stage of software projects. These costs are amortized on a straight-line basis over the estimated useful lives of the assets. For internal use software, the useful lives range from three to ten years. For Internet web site costs, the estimated useful lives do not exceed three years.
Goodwill
We test goodwill for impairment annually during the fourth quarter and whenever events occur or changes in circumstances indicate that impairment may have occurred. Impairment testing is performed for each of our reporting units by first assessing qualitative factors to see if further testing of goodwill is required. If we conclude that it is more likely than not that a reporting unit’s fair value is less than its carrying amount based on our qualitative assessment, then a quantitative test is required. We may also choose to bypass the qualitative assessment and perform the quantitative test. In performing the quantitative test, we determine the fair value of a reporting unit using the “income approach” valuation method. We use a discounted cash flow model in which cash flows anticipated over several periods, plus a terminal value at the end of that time horizon, are discounted to their present value using an appropriate cost of capital rate. Judgment is required in developing the assumptions for the discounted cash flow model. These assumptions include revenue growth rates, profit margin percentages, discount rates, perpetuity growth rates, future capital expenditures, and working capital requirements, among others. If the estimated fair value of a reporting unit exceeds its carrying value, we consider that goodwill is not impaired. If the carrying value exceeds estimated fair value, there is an indication of potential impairment, and an
51
impairment loss is recorded. We calculate the impairment loss by comparing the fair value of the reporting unit less its carrying amount, including goodwill. Impairment would be limited to the carrying value of the goodwill.
We completed our annual goodwill impairment test as of October 31, 2017 using a quantitative assessment approach. As a result of this assessment we noted that the fair value of each reporting unit exceeds its carrying value and therefore we determined that none of our goodwill was impaired.
Acquired intangible assets
Our acquired intangible assets are being amortized on a straight-line basis over their estimated useful lives, which range from less than 1 year to 15 years. We have determined the trade names for our 2017 and 2016 acquired businesses of Avure, Tipper Tie, C.A.T. and PLF have indefinite lives.
The carrying values of intangible assets with indefinite lives are reviewed for recoverability on an annual basis, and whenever events occur or changes in circumstances indicate that impairment may have occurred. The facts and circumstances considered include an assessment of the recoverability of the cost of intangible assets from future cash flows to be derived from the use of the asset. It is not possible for us to predict the likelihood of any possible future impairments or, if such an impairment were to occur, the magnitude of any impairment. However, any potential impairment would be limited to the carrying value of the indefinite-lived intantigible asset.
Intangible assets with finite useful lives are subject to amortization over the expected period of economic benefit to us. We evaluate whether events or circumstances have occurred that warrant a revision to the remaining useful lives of intangible assets. In cases where a revision is deemed appropriate, the remaining carrying amounts of the intangible assets are amortized over the revised remaining useful life.
Impairment of long-lived assets
Our long-lived assets other than goodwill and acquired intangible assets are reviewed for impairment whenever events or changes in circumstances indicate that the carrying amount of the long-lived asset may not be recoverable. The carrying amount of a long-lived asset is not recoverable if it exceeds the sum of the undiscounted cash flows expected to result from the use and eventual disposition of the asset. If it is determined that an impairment loss has occurred, the loss is measured as the amount by which the carrying amount of the long-lived asset exceeds its fair value.
Revenue recognition
Refer to the Recently Issued Accounting Standards Not Yet Adopted section below for discussion of the impacts to revenue recognition resulting from the new revenue guidance effective January 1, 2018. The following discussion focuses on the revenue recognition methodology in place as of December 31, 2017.
For most of our products we recognize revenue when the following criteria are met: we have an agreement with the customer, the product has been delivered to the customer, the sales price is fixed or determinable and collectability is reasonably assured.
Each customer arrangement is evaluated to determine the presence of multiple deliverables. For multiple-element revenue arrangements, such as the sale of equipment with a service agreement, we allocate the contract value to the various elements based on relative selling price for each element and recognize revenue consistent with the nature of each deliverable.
Our standard agreements generally do not include customer acceptance provisions. However, if there is a customer-specific acceptance provision, the associated revenue is deferred until we have satisfied the acceptance provision.
Certain of our product sales are generated from construction-type contracts and revenue is recognized under the percentage of completion method. Under this method, revenue is recognized as work progresses on each contract. However, revenue recognition does not begin until a substantial portion of the labor hours are incurred to ensure that revenue is not recognized based solely upon materials procurement. Depending upon the product, we measure progress using an input method, such as costs incurred, or an output method, such as units completed or milestones achieved. Any expected losses are charged to earnings, in total, in the period the losses are identified.
Progress billings generally are issued upon the completion of certain phases of the work as stipulated in the contract. Revenue in excess of progress billings on contracts amounted to $90.6 million and $63.0 million at December 31, 2017 and 2016, respectively. These unbilled receivables are reported in trade receivables on the consolidated balance sheets. Progress billings and cash collections in excess of revenue recognized on a contract are classified as advance and progress payments on the consolidated balance sheets. All
52
unbilled trade payables are accrued in other current liabilities when revenue is recognized. Unbilled trade payables were $13.3 million and $8.3 million at December 31, 2017 and 2016, respectively.
Service revenue is recognized either when performance is complete or proportionately over the period of the underlying contract, depending on the terms of the arrangement.
Some of our operating lease revenue is earned from full-service leases for which we are paid annual fixed rates plus, in some cases, an additional amount based on production volumes. Revenue from production volumes is recognized when determinable and collectible.
We provide an allowance for doubtful accounts on trade receivables equal to the estimated uncollectible amounts. This estimate is based on historical collection experience and a specific review of each customer’s trade receivable balance.
Research and Development
The objectives of our research and development programs are to create new products and business opportunities in relevant fields, and to improve existing products. Research and development costs are expensed as incurred.
Income taxes
Income taxes are provided on income reported for financial statement purposes, adjusted for permanent differences between financial statement reporting and income tax regulations. Deferred tax assets and liabilities are measured using enacted tax rates, and reflect the expected future tax consequences of temporary differences between the carrying amounts and the tax bases of assets and liabilities. A valuation allowance is established whenever management believes that it is more likely than not that deferred tax assets may not be realizable.
A liability for uncertain tax positions is recorded whenever management believes it is not likely that the position will be sustained on examination based solely on its technical merits. Interest and penalties related to underpayment of income taxes are classified as income tax expense.
Income taxes are not provided on undistributed earnings of foreign subsidiaries or affiliates when it is management’s intention that such earnings will remain invested in those companies. Taxes are provided on such earnings in the year in which the decision is made to repatriate the earnings.
Stock-based employee compensation
We measure compensation cost on restricted stock awards based on the market price of our common stock at the grant date and the number of shares awarded. The compensation cost for each award is recognized ratably over the lesser of the stated vesting period or the period until the employee becomes retirement eligible, after taking into account forfeitures.
Foreign currency
Financial statements of operations for which the U.S. dollar is not the functional currency are translated to the U.S. dollar prior to consolidation. Assets and liabilities are translated at the exchange rate in effect at the balance sheet date, while income statement accounts are translated at the average exchange rate for each period. For these operations, translation gains and losses are recorded as a component of accumulated other comprehensive loss in stockholders’ equity until the foreign entity is sold or liquidated.
Derivative financial instruments
Derivatives are recognized in the consolidated balance sheets at fair value, with classification as current or non-current based upon the maturity of the derivative instrument. We do not offset fair value amounts for derivative instruments held with the same counterparty. Changes in the fair value of derivative instruments are recorded in current earnings or deferred in accumulated other comprehensive loss, depending on the type of hedging transaction and whether a derivative is designated as, and is effective as, a hedge.
In the consolidated statements of income, earnings from foreign currency derivatives related to sales and remeasurement of sales-related assets, liabilities and contracts are recorded in revenue, while earnings from foreign currency derivatives related to purchases and remeasurement of purchase-related assets, liabilities and contracts are recorded in cost of products. Earnings from foreign currency derivatives related to cash management of foreign currencies throughout the world and remeasurement of cash are recorded in other expense, net.
53
When hedge accounting is applied, we ensure that the derivative is highly effective at offsetting changes in anticipated cash flows of the hedged item or transaction. Changes in fair value of derivatives that are designated as cash flow hedges are deferred in accumulated other comprehensive income (loss) until the underlying transactions are recognized in earnings. At such time, related deferred hedging gains or losses are also recorded in earnings on the same line as the hedged item. Effectiveness is assessed at the inception of the hedge and on a quarterly basis. Effectiveness of forward contract cash flow hedges is assessed solely on changes in fair value attributable to the change in the spot rate. The change in the fair value of the contract related to the change in forward rates is excluded from the assessment of hedge effectiveness. Changes in this excluded component of the derivative instrument, along with any ineffectiveness identified, are recorded in earnings as incurred. We document our risk management strategy and method for assessing hedge effectiveness at the inception of and throughout the term of each hedge.
Cash flows from derivative contracts are reported in the consolidated statements of cash flows in the same categories as the cash flows from the underlying transactions.
Recently Adopted Accounting Standards
In July 2015, the FASB issued ASU No. 2015-11, Inventory (Topic 330) – Simplifying the Measurement of Inventory. The core principle of the ASU is that entities that historically used the lower of cost or market in the subsequent measurement of inventory will instead be required to measure inventory at the lower of cost and net realizable value. The guidance will not change U.S. GAAP for inventory measured using LIFO or the retail inventory method. The ASU is effective for annual reporting periods, including interim periods within those annual periods, beginning after December 15, 2016. This guidance became effective for us as of January 1, 2017 and there was no effect on our consolidated financial statements and related disclosures.
In March 2016, the FASB issued ASU No. 2016-09, Stock Compensation (Topic 718) - Improvements to Employee Share-Based Payment Accounting. The new guidance was developed as part of the FASB’s simplification initiative. The core principle of the ASU requires income tax effects of awards to be recognized in the income statement when the awards vest or are settled, and eliminates the requirement to report excess tax benefits in additional paid-in capital (APIC pool). It also allows an employer to repurchase more of an employee’s shares for tax withholding purposes without triggering liability accounting, and allows an employer to make a policy election to account for forfeitures as they occur. The new standard became effective for us as of January 1, 2017. During 2017, 296,608 awards vested, and resulted in a $6.4 million tax benefit reported in earnings, and is classified as an operating activity within the condensed consolidated Statements of Cash Flows. The elimination of the APIC pool affects the treasury stock method used to calculate weighted average shares outstanding; however, the impact was not material. We elected to change our policy surrounding forfeitures, and beginning January 2017 we no longer estimate the number of awards expected to be forfeited but rather account for them as they occur. We are required to implement this portion of the guidance using a modified retrospective approach, and as such have recorded a cumulative adjustment of $0.6 million in retained earnings as of January 1, 2017.
We also amended our incentive compensation and stock plan to allow JBT to have the discretion to withhold up to the maximum statutory rates, on an individual tax basis. A liability was not established as the withholding limits do not exceed the maximum. Cash paid for tax withholdings are classified as financing activity on the condensed consolidated Statement of Cash Flows, consistent with prior years.
In August 2016, the FASB issued ASU No. 2016-15, Statement of Cash Flows (Topic 230) Classification of Certain Cash Receipts and Cash Payments and Restricted Cash. The new guidance is intended to reduce the existing diversity in practice in how certain cash receipts and cash payments are presented and classified in the statement of cash flows. The core principle of the ASU requires the classification of eight specific cash flow issues identified under ASC 230 to be presented as either financing, investing or operating, or some combination thereof, depending upon the nature of the issue. Entities are required to use a retrospective transition approach for all of the issues identified for each period presented. The Company adopted the new ASU as of September 30, 2017. There was no impact on our consolidated financial statements and related disclosures as a result of adopting the ASU.
In January 2017, the FASB issued ASU No. 2017-01, Business Combinations (Topic 805) - Clarifying the Definition of a Business. The core principle of the ASU is to clarify the definition of a business to require certain transactions to be accounted for as business combinations versus an acquisition of assets. The Company adopted the new ASU as of September 30, 2017. There was no impact on our consolidated financial statements and related disclosures as a result of adopting the ASU.
In January 2017, the FASB issued ASU No. 2017-04, Intangibles - Goodwill and Other (Topic 350) - Simplifying the Test for Goodwill Impairment. The new guidance will simplify the accounting for goodwill impairment. The core principle of the ASU is to remove the requirement to calculate an implied fair value to determine impairment (Step 2 of the goodwill impairment test) and allow instead for goodwill impairment to equal the amount by which a reporting unit's carrying value exceeds its fair value, not to exceed the carrying amount of goodwill. The Company early adopted the new ASU as of September 30, 2017, prior to our 2017 annual testing of goodwill impairment, to be performed as of October 31st. There was no impact on our consolidated financial statements and related disclosures as a result of adopting the ASU.
54
In May 2017, the FASB issued ASU No. 2017-09, Compensation - Stock Compensation (ASC 718) - Scope of Modification Accounting. The amendments provide guidance as to how an entity should account for a change in the terms and conditions of its share-based payment awards. The core principle of the ASU is to provide clarity, and reduce the variation in applied practice, as well as, cost and complexity in accounting for a change in the terms and conditions in an entity's share-based payment awards. The Company adopted the new ASU as of September 30, 2017. There was no impact on our consolidated financial statements and related disclosures as a result of adopting the ASU.
Recently Issued Accounting Standards Not Yet Adopted
Beginning in 2014, the FASB issued ASU No. 2014-09, Revenue from Contracts with Customers (Topic 606), plus a number of related ASU’s designed to clarify and interpret Topic 606. The new standard will replace most existing revenue recognition guidance in U.S. GAAP. The core principle of the ASU requires companies to reevaluate when revenue is recorded based upon newly defined criteria, either at a point in time or over time as goods or services are delivered. The ASU requires additional disclosure about the nature, amount, timing and uncertainty of revenue and cash flows arising from customer contracts, including significant judgments and estimates, and changes in those estimates. The new standard became effective for us as of January 1, 2018. As previously disclosed, we will adopt Topic 606 on a modified-retrospective basis.
In 2017, we completed our gap assessment and determined that in certain contracts, we will qualify for over time recognition for our manufactured equipment that is highly engineered to unique customer specifications. In addition, we expect that due to the nature of our equipment and installation contracts that we will combine these into one performance obligation. Under Topic 606, revenue recognized for contracts that meet certain criteria will result in revenue being recognized as the equipment is being manufactured which is an acceleration of revenue as compared to our current revenue recognition methodology of recognizing revenue, generally when the equipment is shipped to the customer. This conclusion, specific to equipment contracts for which the equipment is highly engineered to unique customer specifications, is dependent on whether our contract with the customer provides us, upon customer cancellation, with an enforceable right to payment for performance completed to date. Where the contract does not provide explicit language regarding cancellation payments, revenue will be recognized at a point in time, usually upon completion of the installation of the equipment. Therefore, some revenue will be deferred and recognized at a later date. This impacts both equipment contracts with installation that qualify as one performance obligation, and that were previously recognized upon shipment, as well as certain equipment contracts for which revenue was recognized under percentage of completion accounting under legacy GAAP.
We continue to execute our implementation plan and have developed new revenue accounting policies and processes; changed our internal controls over revenue recognition; created pro forma disclosures; and continue to implement system changes and enhancements. We are in the process of evaluating all contracts not completed on January 1, 2018 and have preliminarily determined the net impact of adopting this standard will be a reduction to retained earnings within the range of $25 million to $30 million. This differs significantly from the expected impact previously disclosed and is due solely due to interpretations published subsequent to our previous disclosure regarding what constitutes an enforceable right to payment. For full year 2018 results, we expect the financial statement impact of this deferral will be offset by the requirement to defer revenue on contracts that, under legacy GAAP, would have been recognized in 2018, but will be deferred until 2019 under the new standard. Our assessment of the foregoing is ongoing and subject to finalization, such that the actual impact of the adoption may differ materially from the estimated ranges described above.
In February 2016, the FASB issued ASU No. 2016-02, Leases (Topic 842). The new standard will replace most existing lease guidance in U.S. GAAP. The core principle of the ASU is the requirement for lessees to report a right to use asset and a lease payment obligation on the balance sheet but recognize expenses on their income statements in a manner similar to today’s accounting, and for lessors the guidance remains substantially similar to current U.S. GAAP. The ASU is effective for annual reporting periods, including interim periods within those annual periods, beginning after December 15, 2018. However, early adoption is permitted. Entities are required to use a modified retrospective approach for leases that exist or are entered into after the beginning of the earliest comparative period in the financial statements. We are in the process of evaluating the impact this standard will have on our consolidated financial statements and related disclosures.
In October 2016, the FASB issued ASU 2016-16, Income Taxes: Intra-Entity Transfers of Assets Other Than Inventory. The new guidance is intended to simplify the accounting for intercompany asset transfers. The core principle requires an entity to immediately recognize the tax consequences of intercompany asset transfers. The ASU is effective for annual reporting periods, including interim periods within those annual periods, beginning after December 15, 2017. However, early adoption is permitted only at the beginning of an annual period for which no financial statements (interim or annual) have already been issued. The Company anticipates the adoption in the effective period and we are currently evaluating the effect, if any, that the ASU will have on our consolidated financial statements and related disclosures.
In March 2017, the FASB issued ASU No. 2017-07, Compensation - Retirement Benefits (ASC 715) - Improving the Presentation of Net Periodic Pension Costs and Net Periodic Postretirement Benefit Cost. The new guidance will improve the presentation of pension
55
cost by providing additional guidance on the presentation of net benefit cost in the income statement and on the components eligible for capitalization in assets. The core principle of the ASU is to provide more transparency in the presentation of these costs by requiring the service cost component to be reported in the same line item as other compensation costs arising from services rendered by the pertinent employees during the period. The other components of net benefit cost are required to be presented separately from the service cost component and outside a subtotal of income from operations. The amendments require that the Consolidated Statements of Income impacts be applied retrospectively, while Balance Sheet changes should be applied prospectively. As such, upon adoption in 2018, the Company expects to revise operating income for fiscal year 2017 by $1.1 million, and report this income in non operating income. Operating income for the fiscal year 2016 will be reduced by $2.3 million and operating income for 2015 will be revised by $0.6 million. There will be no impact to net income or to the Balance Sheet or Statement of Cash Flows.
The ASU is effective for annual reporting periods, including interim periods within those annual periods, beginning after December 15, 2017. However, early adoption is permitted as of the beginning of an annual period for which financial statements (interim or annual) have not been issued or made available for issuance. The Company will adopt the newly issued ASU as of January 1, 2018.
In August 2017, the FASB issued ASU No. 2017-12, Derivatives and Hedging (ASC 815) - Targeted Improvements to Accounting for Hedging Activities. The core of the principle is to simplify hedge accounting, as well as improve the financial reporting of hedging results, for both financial and commodity risks, in the financial statements and related disclosures. The ASU is effective for annual reporting periods, including interim periods within those annual periods, beginning after December 15, 2018. Early adoption is permitted in any interim period after the issuance of the amendment, however, any adjustments should be made as of the beginning of the fiscal year in which the interim period occurred. The Company is currently evaluating the effect, if any, that the ASU will have on our consolidated financial statements and related disclosures.
56
NOTE 2. ACQUISITIONS
During 2017 and 2016 the Company acquired six businesses for an aggregate consideration of $354.4 million, net of cash acquired. A summary of the acquisitions made during the period is as follows:
Date | Type | Company/Product Line | Location | Segment | ||||
July 31, 2017 | Stock | PLF International Ltd. | Harwich (Sussex), England | FoodTech | ||||
Manufacturer and leading provider of powder filling systems for global food and beverage, and nutraceutical markets headquartered in Harwich (Essex), England. | ||||||||
July 3, 2017 | Stock | Aircraft Maintenance Support Services, Ltd. (AMSS) | Mid Glamorgan, England | AeroTech | ||||
Manufacturer of military and commercial aviation equipment. | ||||||||
February 24, 2017 | Stock | Avure Technologies, Inc. | Middletown, OH | FoodTech | ||||
Manufacturer of high pressure processing (HPP) systems. HPP is a cold pasteurization technology that ensures food safety without heat or preservatives, maintaining fresh food characteristics such as flavor and nutritional value, while extending shelf life. | ||||||||
February 17, 2016 | Asset | Novus X-Ray LLC | Doylestown, PA | FoodTech | ||||
Manufacturer of modular X-Ray systems for the automated food inspection industry. | ||||||||
November 1, 2016 | Stock | Tipper Tie, Inc. | Apex, NC | FoodTech | ||||
Manufacturer of engineered processing and packaging solutions, and related consumables to the food industry. | ||||||||
October 14, 2016 | Asset | Cooling Applied Technologies, Inc. (C.A.T.) | Russellville, AR | FoodTech | ||||
Manufacturer of value-added food solutions primarily for the poultry industry. | ||||||||
Each acquisition has been accounted for as a business combination. For stock acquisitions, 100% of the equity interests were acquired. Tangible and identifiable intangible assets acquired and liabilities assumed were recorded at their respective estimated fair values. The excess of the consideration transferred over the estimated fair value of the net assets received has been recorded as goodwill. The factors that contributed to the recognition of goodwill primarily relate to acquisition-driven anticipated cost savings and revenue enhancement synergies coupled with the assembled workforce acquired.
57
The following presents the purchase price allocation of the assets acquired and the liabilities assumed, based on their estimated values:
PLF(1) | Avure(2) | Tipper Tie(2) | C.A.T.(2) | Other (3)(1) | Total | ||||||||||||||||||
(In millions) | |||||||||||||||||||||||
Financial assets | $ | 20.8 | $ | 4.3 | 27.8 | $ | 3.3 | $ | 7.8 | $ | 64.0 | ||||||||||||
Inventories | 1.0 | 14.4 | 17.2 | 16.4 | 2.5 | 51.5 | |||||||||||||||||
Property, plant and equipment | 2.2 | 4.5 | 17.2 | 2.9 | 2.6 | 29.4 | |||||||||||||||||
Other intangible assets(4) | 17.9 | 20.8 | 66.3 | 48.0 | 7.1 | 160.1 | |||||||||||||||||
Deferred taxes | (3.4 | ) | (3.6 | ) | (4.9 | ) | — | (0.7 | ) | (12.6 | ) | ||||||||||||
Financial liabilities | (5.5 | ) | (10.5 | ) | (21.2 | ) | (14.9 | ) | (4.4 | ) | (56.5 | ) | |||||||||||
Total identifiable net assets | $ | 33.0 | $ | 29.9 | 102.4 | $ | 55.7 | $ | 14.9 | $ | 235.9 | ||||||||||||
Cash consideration paid | $ | 46.1 | $ | 58.9 | 160.6 | $ | 78.4 | $ | 15.6 | $ | 359.6 | ||||||||||||
Holdback payments due to seller | 5.5 | — | 6.0 | 1.9 | 13.4 | ||||||||||||||||||
Total consideration | 51.6 | 58.9 | 160.6 | 84.4 | 17.5 | 373.0 | |||||||||||||||||
Cash acquired | 15.5 | — | 2.4 | — | 0.7 | 18.6 | |||||||||||||||||
Net consideration | $ | 36.1 | $ | 58.9 | 158.2 | $ | 84.4 | $ | 16.8 | $ | 354.4 | ||||||||||||
Goodwill | $ | 18.6 | $ | 29.0 | 58.2 | $ | 28.7 | $ | 2.6 | $ | 137.1 | ||||||||||||
(1) | The purchase accounting for these acquisitions is provisional. For PLF and AMSS the valuation of certain working capital balances, intangibles, income tax balances and residual goodwill related to each is not complete. These amounts are subject to adjustment as additional information is obtained within the measurement period (not to exceed 12 months from the acquisition date). During the quarter ended December 31, 2017, we revalued the net assets acquired, and the net consideration, to reflect the accurate foreign currency rate on the date of the acquisition. In addition we increased the cash consideration paid by $0.5 million, reflecting a working capital adjustment required by the purchase agreement. The impact of these adjustments was reflected as a net increase in goodwill of $1.4 million. These adjustments resulted in an immaterial impact to the consolidated statement of income. All other measurement period adjustments in the quarter and twelve months ended December 31, 2017 were not material. |
(2) | The amounts shown represent final allocation of the purchase price for these acquisitions. For Avure, during the quarter ended December 31, 2017, we adjusted deferred tax liabilities by ($0.8) million, with an offset to goodwill for the same amount. During the quarter ended September 30, 2017 we refined our estimates of deferred tax assets for Avure by ($1.8) million and deferred tax liabilities by $0.7 million. The impact of these adjustments was reflected as a decrease in goodwill of $1.1 million. During the quarter ended June 30, 2017 we refined our other intangible asset estimates for Avure by $2.6 million, deferred taxes by ($0.7) million and inventory by ($0.7) million. The impact of these adjustments was reflected as a decrease in goodwill of $1.2 million. All adjustments in the year resulted in an immaterial impact to the consolidated statement of income. All other measurement period adjustments in the quarter and twelve months ended December 31, 2017 related to Tipper Tie and Avure were not material. |
Of the $137.1 million in goodwill reported, $71.6 million is expected to be tax deductible.
The CAT purchase agreement required an additional payment of $6.0 million in October 2017. This payment was reflected as cash consideration paid in the purchase price allocation above. There is a remaining $6.0 million payment due in October 2018.
(3) | Other includes Novus and AMSS. The purchase price allocation for AMSS is provisional, refer to Note (1). |
(4) | The acquired intangible assets with definite lives are being amortized on a straight-line basis over their estimated useful lives, which range from five to nineteen years. The intangible assets acquired in 2017 include customer relationships totaling $14.5 million (10- year weighted average useful life), technology totaling $21.8 million (10-year weighted average useful life). The tradenames for Avure, Tipper Tie, C.A.T. and PLF have been determined to have indefinite lives and are reviewed annually for impairment. |
58
During the twelve months ended December 31, 2017, PLF, AMSS and Avure had revenue and earnings (losses) of, $7.5 million and ($0.9) million, $8.9 million and $0.2 million, and $50.1 million and $1.7 million, respectively.
NOTE 3. INVENTORIES
Inventories as of December 31, consisted of the following:
(In millions) | 2017 | 2016 | |||||
Raw materials | $ | 72.6 | $ | 62.9 | |||
Work in process | 73.7 | 57.3 | |||||
Finished goods | 109.2 | 86.2 | |||||
Gross inventories before LIFO reserves and valuation adjustments | 255.5 | 206.4 | |||||
LIFO reserves and valuation adjustments | (65.3 | ) | (66.8 | ) | |||
Net inventories | $ | 190.2 | $ | 139.6 | |||
Inventories accounted for under the LIFO method totaled $124.2 million and $119.1 million at December 31, 2017 and 2016, respectively. The current replacement costs of LIFO inventories exceeded their recorded values by $48.9 million at December 31, 2017 and $47.9 million at December 31, 2016.
NOTE 4. PROPERTY, PLANT AND EQUIPMENT
Property, plant and equipment as of December 31, consisted of the following:
(In millions) | 2017 | 2016 | ||||||
Land and land improvements | $ | 17.2 | $ | 14.7 | ||||
Buildings | 101.5 | 92.7 | ||||||
Machinery and equipment | 366.5 | 326.0 | ||||||
Construction in process | 21.1 | 14.8 | ||||||
506.3 | 448.2 | |||||||
Accumulated depreciation | (273.3 | ) | (238.0 | ) | ||||
Property, plant and equipment, net | $ | 233.0 | $ | 210.2 | ||||
NOTE 5. GOODWILL AND INTANGIBLE ASSETS
The changes in the carrying amount of goodwill by business segment were as follows:
(In millions) | JBT FoodTech | JBT AeroTech | Total | ||||||||
Balance as of January 1, 2016 | $ | 144.8 | $ | 7.7 | $ | 152.5 | |||||
Acquisitions | 90.1 | — | 90.1 | ||||||||
Currency translation | (3.1 | ) | — | (3.1 | ) | ||||||
Balance as of December 31, 2016 | 231.8 | 7.7 | 239.5 | ||||||||
Acquisitions | 51.4 | 3.1 | 54.5 | ||||||||
Currency translation | 7.6 | 0.2 | 7.8 | ||||||||
Balance as of December 31, 2017 | $ | 290.8 | $ | 11.0 | $ | 301.8 | |||||
59
The components of intangible assets as of December 31, were as follows:
2017 | 2016 | ||||||||||||||
(In millions) | Gross carrying amount | Accumulated amortization | Gross carrying amount | Accumulated amortization | |||||||||||
Customer relationships | $ | 158.8 | $ | 33.5 | $ | 141.5 | $ | 21.5 | |||||||
Patents and acquired technology | 92.1 | 32.1 | 64.8 | 24.5 | |||||||||||
Tradenames | 20.0 | 9.5 | 18.1 | 8.4 | |||||||||||
Indefinite lived intangible assets | 15.9 | — | 9.5 | — | |||||||||||
Other | 14.5 | 9.4 | 14.8 | 8.3 | |||||||||||
Total intangible assets | $ | 301.3 | $ | 84.5 | $ | 248.7 | $ | 62.7 | |||||||
Intangible asset amortization expense was $19.6 million, $10.9 million, and $7.1 million for 2017, 2016 and 2015, respectively. Annual amortization expense for intangible assets is estimated to be $21.7 million in 2018, $21.6 million in 2019, $21.3 million in 2020, $20.9 million in 2021 and $20.3 million in 2022.
NOTE 6. DEBT
Our short-term debt consists of borrowings under short-term credit facilities entered into by our wholly-owned subsidiaries in China and India. The Chinese short-term credit facilities, which mature on June 30, 2018, allow us to borrow up to a total of $12.0 million. We had $2.7 million and $4.4 million in borrowings under the credit facilities in China as of December 31, 2017, and 2016, respectively. The Indian credit facility allows us to borrow up to a total of $1.4 million and $2.3 million; and we had no borrowings outstanding as of December 31, 2017 and 2016, respectively.
Five-year Revolving Credit Facility and Term Loan
We have a five-year $600.0 million revolving credit facility, which matures in February 2020, with Wells Fargo Bank, N.A. as administrative agent. This revolving credit facility permits borrowings in the U.S. and in The Netherlands. Borrowings bear interest, at our option, at one month U.S. LIBOR subject to a floor rate of zero or an alternative base rate, which is the greater of Wells Fargo’s Prime Rate, the Federal Funds Rate plus 50 basis points, and LIBOR plus 1%, plus, in each case, a margin dependent on our leverage ratio. We are required to make periodic interest payments on the borrowed amounts and to pay an annual facility fee ranging from 15.0 to 30.0 basis points, depending on our leverage ratio.
We have an incremental term loan in the amount of $150.0 million which bears interest on the same fully funded terms as the revolving credit facility and matures in February 2020. We are required to make mandatory prepayments, subject to certain exceptions, of the term loan with the net cash proceeds of (i) any issuance or other incurrence of indebtedness not otherwise permitted under the Credit Agreement and (ii) certain sales or other dispositions of assets subject to certain exceptions and thresholds. We are required to repay the term loan in quarterly principal installments of $1.9 million beginning on March 31, 2018, with a balloon payment at maturity to pay the remaining outstanding balance.
As of December 31, 2017 we had $150.0 million outstanding under the term loan within the credit facility, $230.5 million drawn on and $354.7 million of availability under the revolving credit facility. Our ability to use this availability is limited by the leverage ratio covenant described below.
Our credit facility includes restrictive covenants that, if not met, could lead to renegotiation of our credit facility, a requirement to repay our borrowings, and/or a significant increase in our cost of financing. Restrictive covenants include a minimum interest coverage ratio, a maximum leverage ratio, and limitations on payments made to stockholders. For information, refer to the section entitled “Contractual Obligations and Off-Balance Sheet Arrangements” in Item 7. Management's Discussion and Analysis of Financial Condition and Results of Operations of this Annual Report on Form 10-K.
60
Our debt as of December 31, consisted of the following:
(In millions) | Interest Rate at December 31, 2017 | Maturity Date | 2017 | 2016 | |||||||||
Short-term borrowings | |||||||||||||
Foreign credit facilities | 5.2 | % | $ | 2.8 | $ | 4.4 | |||||||
Other | 0.1 | % | 0.2 | 1.2 | |||||||||
Total short-term borrowings | $ | 3.0 | $ | 5.6 | |||||||||
Long-term debt | |||||||||||||
Revolving credit facility | 2.1 | % | February 10, 2020 | $ | 230.5 | $ | 342.1 | ||||||
Term loan | 2.1 | % | February 10, 2020 | 150.0 | 150.0 | ||||||||
Brazilian Real Loan | 8.0 | % | October 16, 2017 | — | 1.5 | ||||||||
Total long-term debt | 380.5 | 493.6 | |||||||||||
Less: current portion | (7.5 | ) | (1.5 | ) | |||||||||
Long-term debt, less current portion | 373.0 | 492.1 | |||||||||||
Less: unamortized debt issuance costs - term loan | (0.4 | ) | (0.5 | ) | |||||||||
Long-term debt, net | $ | 372.6 | $ | 491.6 | |||||||||
Scheduled maturities of long-term debt for the years ending December 31, are as follows:
(In millions) | Maturities of Long-term debt | |||
2018 | $ | 7.5 | ||
2019 | 7.5 | |||
2020 | 365.5 | |||
Total | $ | 380.5 | ||
NOTE 7. INCOME TAXES
Domestic and foreign components of income from continuing operations before income taxes for the years ended on December 31, are shown below:
(In millions) | 2017 | 2016 | 2015 | |||||||||
Domestic | $ | 72.8 | $ | 43.6 | $ | 38.2 | ||||||
Foreign | 59.4 | 50.4 | 44.0 | |||||||||
Income before income taxes | $ | 132.2 | $ | 94.0 | $ | 82.2 | ||||||
61
The provision for income taxes related to income from continuing operations for the years ended on December 31, consisted of:
(In millions) | 2017 | 2016 | 2015 | |||||||||
Current: | ||||||||||||
Federal | $ | 13.2 | $ | 7.8 | $ | 6.0 | ||||||
State | 1.0 | 2.2 | 1.2 | |||||||||
Foreign | 17.6 | 16.1 | 13.2 | |||||||||
Total current | 31.8 | 26.1 | 20.4 | |||||||||
Deferred: | ||||||||||||
Federal | 16.6 | 1.0 | 4.8 | |||||||||
State | 1.6 | 0.3 | 0.9 | |||||||||
Foreign | (1.0 | ) | (0.9 | ) | (0.8 | ) | ||||||
Change in the valuation allowance for deferred tax assets | 0.4 | — | — | |||||||||
Change in deferred tax liabilities due to foreign tax rate change | 0.3 | — | 0.4 | |||||||||
Benefits of operating loss carryforward | 0.4 | (0.5 | ) | 0.5 | ||||||||
Total deferred | 18.3 | (0.1 | ) | 5.8 | ||||||||
Provision for income taxes | $ | 50.1 | $ | 26.0 | $ | 26.2 | ||||||
Significant components of our deferred tax assets and liabilities at December 31, were as follows:
(In millions) | 2017 | 2016 | ||||||
Deferred tax assets attributable to: | ||||||||
Accrued pension and other post-retirement benefits | $ | 20.5 | $ | 30.1 | ||||
Accrued expenses and accounts receivable allowances | 13.6 | 20.5 | ||||||
Net operating loss carryforwards | 5.9 | 2.3 | ||||||
Inventories | 5.5 | 9.0 | ||||||
Stock-based compensation | 5.4 | 8.4 | ||||||
Research and development credit carryforwards | 3.4 | 1.5 | ||||||
Foreign tax credit carryforward | 0.3 | 0.2 | ||||||
Total deferred tax assets | 54.6 | 72.0 | ||||||
Valuation allowance | (2.7 | ) | — | |||||
Deferred tax assets, net of valuation allowance | 51.9 | 72.0 | ||||||
Deferred tax liabilities attributable to: | ||||||||
Liquidation of subsidiary for income tax purposes | 13.3 | 13.3 | ||||||
Property, plant and equipment | 11.6 | 14.1 | ||||||
Goodwill and amortization | 24.3 | 15.5 | ||||||
Other | 0.6 | 0.2 | ||||||
Total deferred tax liabilities | 49.8 | 43.1 | ||||||
Net deferred tax assets | $ | 2.1 | $ | 28.9 | ||||
Included in our deferred tax assets are tax benefits related to net operating loss carryforwards attributable to our foreign and domestic operations. At December 31, 2017, we had $7.8 million of net operating losses that are available to offset future taxable income in several foreign jurisdictions indefinitely, and $18.5 million of net operating losses that are available to offset future taxable income through 2034. Of the $18.5 million, approximately $14.1 million of net operating losses in Switzerland are subject to a full valuation allowance. During 2017, we expect to use $3.6 million of net operating losses relating to prior years in the filing of our 2017 corporate income tax returns.
Also included in our deferred tax assets at December 31, 2017 are $2.5 million of U.S. research and development credit carryforwards, which will expire beginning in 2022, if unused.
62
The effective income tax rate was different from the statutory U.S. federal income tax rate due to the following:
2017 | 2016 | 2015 | |||||||
Statutory U.S. federal tax rate | 35 | % | 35 | % | 35 | % | |||
Net difference resulting from: | |||||||||
Research and development tax credit | (4 | ) | (4 | ) | (2 | ) | |||
Foreign earnings subject to different tax rates | (2 | ) | (3 | ) | (3 | ) | |||
Tax on foreign intercompany dividends and deemed dividends for tax purposes | — | — | 6 | ||||||
Nondeductible expenses | 1 | — | — | ||||||
State income taxes | 2 | 2 | 2 | ||||||
Foreign tax credits | (1 | ) | (1 | ) | (7 | ) | |||
Foreign withholding taxes | 1 | — | 1 | ||||||
Effect of US Law Change | 12 | — | — | ||||||
Stock Based Compensation - Excess Tax Benefit under ASC 2016-09 | (5 | ) | — | — | |||||
Other | (1 | ) | (1 | ) | — | ||||
Total difference | 3 | (7 | ) | (3 | ) | ||||
Effective income tax rate | 38 | % | 28 | % | 32 | % | |||
U.S. income taxes have not been provided on $15.4 million of undistributed earnings of foreign subsidiaries at December 31, 2017 as these amounts are considered permanently invested under ASC 740-30-25-17 [formerly known as APB 23]. A liability could arise if our intention to permanently invest such earnings were to change and amounts are distributed by such subsidiaries, or if such subsidiaries are ultimately disposed. It is not practicable to estimate the additional income taxes related to the hypothetical distribution of permanently invested earnings.
Additionally, in accordance with guidance as set-forth in SEC Staff Accounting Bulletin No. 118 ("SAB 118") other than the amount accrued for the Transition Tax per IRC 965, the company does not include a provisional amount related to any of the impacted items covered under APB 23, as we have not performed sufficient analysis to make a determination as to the appropriateness and resulting tax effects.
The following tax years remain subject to examination in the following significant jurisdictions:
Belgium | 2014-2017 |
Brazil | 2012-2017 |
Italy | 2014-2017 |
Netherlands | 2012-2017 |
Sweden | 2011-2017 |
United States | 2016-2017 |
Income Tax Reform Disclosures
On December 22, 2017, Congress passed, and the President signed, the Tax Cuts and Jobs Act (the “Tax Act”). The Tax Act makes broad and complex changes to the U.S. tax Code, including, but not limited to, (1) reducing the U.S. federal corporate income tax rate from 35.0 percent to 21.0 percent; (2) requiring companies to pay a one-time transitional tax on certain un-repatriated earnings of foreign subsidiaries; (3) generally eliminating U.S. federal income tax on dividends from foreign subsidiaries of U.S. corporations; (4) repealing the domestic production activity deduction; (5) providing for the full expensing of qualified property; (6) adding a new provision designed to tax global intangible low-taxed income (“GILTI”); (7) revising the limitation imposed on deductions for executive compensation paid by publicly-traded companies; (8) eliminating the corporate alternative minimum tax (“AMT”) and changing how existing AMT credits can be utilized; (9) creating a base erosion-anti-abuse tax (“BEAT”), a new minimum tax on payments made by certain U.S. corporations to related foreign parties; (10) imposing a new limitation on the deductibility of interest expense; (11) allowing for a deduction related to foreign-derived intangible income (“FDII”); and (12) changing the rules related to the uses and limitations of net operating loss carryforwards generated in tax years beginning after December 31, 2017. Some of the changes that are material to the company are discussed below in more detail.
63
The SEC recently issued SAB 118 which provides guidance on how companies should account for the tax effects related to the Tax Act. According to SAB 118, companies should make a good faith effort to compute the impact of the Tax Act in a timely manner once the company has obtained, prepared, and analyzed the information needed in order to complete their accounting requirements under ASC 740, which in no circumstances should extend beyond one year from the enactment date. However, in situations when the company’s accounting is incomplete, SAB 118 authorizes companies to record a reasonable provisional estimate of the tax impact resulting from the Tax Act.
The Tax Act imposed a one-time deemed repatriation transition tax on the previously untaxed and un-repatriated current and accumulated post-1986 foreign earnings of certain foreign subsidiaries. The Tax Act further provides for a deduction to offset a portion of the deemed repatriated earnings such that taxpayers are effectively taxed at a reduced tax rate of 15.5 percent to the extent that the earnings are held in cash or cash equivalents, and 8.0 percent on all other earnings. In order to compute the tax impact of this deemed repatriation for the Company’s taxable year ending December 31, 2017, the applicable amount of un-repatriated earnings and foreign taxes paid by each relevant foreign subsidiary must be determined. We have computed a reasonable estimate of the tax impact related to this deemed repatriation in accordance with SAB 118 and recorded a provisional tax obligation because the Company is still collecting and analyzing the necessary information and will reflect any changes to this calculation in a subsequent reporting period. Due to the timing of the Tax Act and related changes we will update our computations as information becomes available with regard to the 2017 tax return filings and as tax technical guidance on remaining items is issued at the federal and state level.
The Tax Act also revised the definition of “covered employees” who are subject to the $1.0 million limitation imposed on deductions for executive compensation paid by publicly-traded corporations. As a result, the limitation now applies to the Company’s CEO, CFO and the 3 highest paid employees. The Tax Act also eliminated the exception to this rule for commission or performance-based compensation paid to these covered employees. This new provision is effective for contracts executed on or after November 3, 2017. Based on this new provision, the Company adjusted its deferred tax asset related to future stock compensation deductions for amounts that it does not expect it will be able to deduct in the future. We will continue to analyze executive compensation in future periods and adjust our Deferred Tax Asset for future stock compensation deductions as information becomes available.
The Tax Act reduces the corporate tax rate to 21.0 percent, effective January 1, 2018. For certain deferred taxes, we have recorded a provisional adjustment to decrease net deferred tax assets by $7.0 million, with a corresponding net adjustment to deferred tax expense of $7.0 million for the year ended December 31, 2017. We made a reasonable estimate of the impact of the reduction in the corporate tax rate under the Tax Act, but the analysis will continue during 2018 and will be completed once the Company files its income tax returns in 2018.
The Tax Act changes also require JBT to analyze other areas including, but not limited to, interest deductibility, accelerated cost recovery of fixed assets, GILTI, BEAT, FDII, and stranded tax effects within Accumulated other comprehensive income. The Company has not made any policy decisions as to how to account for the tax effects of these items and will continue to analyze the impact during 2018 as more information is available and more technical guidance is issued at the federal and state levels.
(in millions) | Increase (Decrease)(a) | |||||||||||
Tax Act Provision | Income Tax Provision | Income Taxes Payable | Deferred Tax Assets and Liabilities | Other Long-term Liabilities | ||||||||
Reduction in U.S. Federal corporate rate | $ | 7.0 | $ | — | $ | (7.0 | ) | $ | — | |||
One-time repatriation transition tax | 7.7 | 1.0 | — | 6.7 | ||||||||
Revision to deduction for executive compensation | 0.8 | — | (0.8 | ) | — | |||||||
Tax Act impact as of and for the year ended December 31, 2017 | $ | 15.5 | $ | 1.0 | $ | (7.8 | ) | $ | 6.7 | |||
(a) Reflects provisional amounts reported in results until full accounting for the income tax effect is complete.
NOTE 8. PENSION AND POST-RETIREMENT AND OTHER BENEFIT PLANS
We sponsor qualified and nonqualified defined benefit pension plans that together cover many of our U.S. employees. The plans provide defined benefits based on years of service and final average salary. We also sponsor a noncontributory plan that provides post-retirement life insurance benefits to some of our U.S. employees. Foreign-based employees are eligible to participate in either Company-sponsored or government-sponsored benefit plans to which we contribute. We also sponsor separate defined contribution plans that cover substantially all of our U.S. employees and some international employees.
64
The funded status of our pension and post-retirement benefit plans, together with the associated balances recognized in our consolidated financial statements as of December 31, 2017 and 2016, were as follows:
Pensions | Other post-retirement benefits | |||||||||||||||
(In millions) | 2017 | 2016 | 2017 | 2016 | ||||||||||||
Projected benefit obligation at January 1 | $ | 317.4 | $ | 316.3 | $ | 3.3 | $ | 3.2 | ||||||||
Service cost | 1.7 | 1.4 | — | — | ||||||||||||
Interest cost | 10.7 | 11.4 | 0.1 | 0.1 | ||||||||||||
Actuarial (gain) loss | 23.9 | 11.4 | 0.3 | 0.4 | ||||||||||||
Plan participants' contributions | 0.1 | 0.2 | — | — | ||||||||||||
Business combinations | — | 2.1 | — | — | ||||||||||||
Benefits paid | (13.8 | ) | (23.2 | ) | (0.2 | ) | (0.4 | ) | ||||||||
Currency translation adjustments | 4.9 | (2.2 | ) | — | — | |||||||||||
Projected benefit obligation at December 31 | $ | 344.9 | $ | 317.4 | $ | 3.5 | $ | 3.3 | ||||||||
Fair value of plan assets at January 1 | $ | 233.0 | $ | 227.3 | $ | — | $ | — | ||||||||
Company contributions | 11.1 | 10.3 | 0.2 | 0.4 | ||||||||||||
Actual return (loss) on plan assets | 29.8 | 18.8 | — | — | ||||||||||||
Plan participants' contributions | 0.1 | 0.2 | — | — | ||||||||||||
Benefits paid | (13.8 | ) | (23.2 | ) | (0.2 | ) | (0.4 | ) | ||||||||
Currency translation adjustments | 1.3 | (0.4 | ) | — | — | |||||||||||
Fair value of plan assets at December 31 | $ | 261.5 | $ | 233.0 | $ | — | $ | — | ||||||||
Funded status of the plans (liability) at December 31 | $ | (83.4 | ) | $ | (84.4 | ) | $ | (3.5 | ) | $ | (3.3 | ) | ||||
Amounts recognized in the Consolidated Balance Sheets at December 31 | ||||||||||||||||
Other current liabilities | (0.9 | ) | (1.3 | ) | (0.3 | ) | (0.2 | ) | ||||||||
Accrued pension and other post-retirement benefits, less current portion | (82.5 | ) | (83.1 | ) | (3.2 | ) | (3.1 | ) | ||||||||
Net amount recognized | $ | (83.4 | ) | $ | (84.4 | ) | $ | (3.5 | ) | $ | (3.3 | ) | ||||
Amounts recognized in accumulated other comprehensive loss at December 31, 2017 and 2016 were $182.4 million and $174.1 million, respectively for pensions and $.2 million and $(0.1) million for other post-retirement benefits, respectively. These amounts were primarily unrecognized actuarial gains and losses.
The accumulated benefit obligation for all pension plans was $336.2 million and $310.3 million at December 31, 2017 and 2016, respectively. All pension plans had accumulated benefit obligations in excess of plan assets as of December 31.
Pension and other post-retirement benefit costs (income) for the years ended December 31, were as follows:
Pensions | Other post-retirement benefits | |||||||||||||||||||||||
(In millions) | 2017 | 2016 | 2015 | 2017 | 2016 | 2015 | ||||||||||||||||||
Service cost | $ | 1.7 | $ | 1.4 | $ | 1.5 | $ | — | $ | — | $ | — | ||||||||||||
Interest cost | 10.7 | 11.4 | 13.7 | 0.1 | 0.1 | 0.2 | ||||||||||||||||||
Expected return on plan assets | (17.1 | ) | (18.0 | ) | (19.1 | ) | — | — | — | |||||||||||||||
Settlement charge | — | 0.1 | 0.3 | — | — | — | ||||||||||||||||||
Amortization of prior service credit | — | — | — | — | — | (2.5 | ) | |||||||||||||||||
Amortization of net actuarial loss | 4.3 | 4.1 | 4.5 | — | — | — | ||||||||||||||||||
Total (income) costs | $ | (0.4 | ) | $ | (1.0 | ) | $ | 0.9 | $ | 0.1 | $ | 0.1 | $ | (2.3 | ) | |||||||||
65
Pre-tax changes in projected benefit obligations and plan assets recognized in other comprehensive income during 2017 were as follows:
(In millions) | Pensions | Other post-retirement benefits | ||||||
Actuarial loss | $ | 12.1 | $ | 0.3 | ||||
Amortization of net actuarial loss | (5.1 | ) | — | |||||
Net loss recognized in other comprehensive income | $ | 7.0 | $ | 0.3 | ||||
Total recognized in net periodic benefit cost and other comprehensive income | $ | 6.6 | $ | 0.4 | ||||
The Company uses a corridor approach to recognize actuarial gains and losses that result from changes in actuarial assumptions. The corridor approach defers all actuarial gains and losses resulting from changes in assumptions in other accumulated other comprehensive income (loss), such as those related to changes in the discount rate and differences between actual and expected returns on plan assets. These unrecognized gains and losses are amortized when the net gains and losses exceed 10% of the higher of the market-related value of the assets or the projected benefit obligation for each respective plan. The amortization is on a straight-line basis over the life expectancy of the plan’s participants for the frozen plans and the expected remaining service periods for the other plans. We expect to amortize $6.3 million of net actuarial loss from accumulated other comprehensive income (loss) into net periodic benefit cost in 2018.
Beginning in 2010, the U.S. defined benefit plans were frozen to new entrants and future benefit accruals for non-union participants were discontinued.
On August 31, 2015, JBT amended the Retiree Welfare Benefits Plan to terminate future healthcare benefits effective January 1, 2016, which resulted in a release of $1.2 million of other post-retirement benefit liability into other comprehensive income. The resulting negative prior service cost of $1.8 million was amortized out of accumulated other comprehensive income into net income over the remaining life of the plan (through January 1, 2016).
The following weighted-average assumptions were used to determine the benefit obligations:
Pensions | Other post-retirement benefits | |||||||||||||||||
2017 | 2016 | 2015 | 2017 | 2016 | 2015 | |||||||||||||
Discount rate | 3.48 | % | 4.00 | % | 4.40 | % | 3.73 | % | 4.30 | % | 4.60 | % | ||||||
Rate of compensation increase | 3.10 | % | 3.09 | % | 3.19 | % | — | — | — | |||||||||
The following weighted-average assumptions were used to determine net periodic benefit cost:
Pensions | Other post-retirement benefits | |||||||||||||||||
2017 | 2016 | 2015 | 2017 | 2016 | 2015 | |||||||||||||
Discount rate | 3.98 | % | 4.34 | % | 4.03 | % | 4.30 | % | 4.60 | % | 4.25 | % | ||||||
Rate of compensation increase | 3.10 | % | 3.09 | % | 3.19 | % | — | — | — | |||||||||
Expected rate of return on plan assets | 6.58 | % | 6.83 | % | 7.08 | % | — | — | — | |||||||||
The estimate of the expected rate of return on plan assets is based primarily on the historical performance of plan assets, asset allocation, current market conditions and long-term growth expectations.
Plan assets
Our pension investment strategy balances the requirements to generate returns using higher-returning assets, such as equity securities, with the need to control risk in the pension plan with less volatile assets, such as fixed-income securities. Risks include, among others, the likelihood of the pension plans being underfunded, thereby increasing their dependence on Company contributions. The assets are managed by professional investment firms and performance is evaluated against specific benchmarks.
66
Our target asset allocations and actual allocations as of December 31, 2017 and 2016 were as follows:
Target | 2017 | 2016 | ||||
Equity | 30% - 70% | 54% | 50% | |||
Fixed income | 20% - 40% | 29% | 30% | |||
Real estate and other | 10% - 30% | 16% | 19% | |||
Cash | 0% - 10% | 1% | 1% | |||
100% | 100% | |||||
Our actual pension plans’ asset holdings by category and level within the fair value hierarchy are presented in the following table:
As of December 31, 2017 | As of December 31, 2016 | |||||||||||||||||||||||||||||||
(In millions) | Total | Level 1 | Level 2 | Level 3 | Total | Level 1 | Level 2 | Level 3 | ||||||||||||||||||||||||
Cash and cash equivalents | $ | 2.7 | $ | 2.7 | $ | — | $ | — | $ | 3.4 | $ | 3.4 | $ | — | $ | — | ||||||||||||||||
Equity securities: | ||||||||||||||||||||||||||||||||
Large cap (1) | 53.5 | — | 53.5 | — | 44.0 | — | 44.0 | — | ||||||||||||||||||||||||
Small cap (2) | 48.8 | 48.8 | — | — | 71.1 | 71.1 | — | — | ||||||||||||||||||||||||
International (3) | 39.9 | 39.9 | — | — | — | — | — | — | ||||||||||||||||||||||||
Fixed income securities: | ||||||||||||||||||||||||||||||||
Government securities (4) | 9.0 | — | 9.0 | — | 8.8 | — | 8.8 | — | ||||||||||||||||||||||||
Corporate bonds (5) | 61.5 | 49.0 | 12.5 | — | 57.4 | 46.2 | 11.2 | — | ||||||||||||||||||||||||
Real estate and other investments (6) | 46.1 | 19.0 | 27.1 | — | 48.3 | 19.3 | 29.0 | — | ||||||||||||||||||||||||
Total assets at fair value | $ | 261.5 | $ | 159.4 | $ | 102.1 | $ | — | $ | 233.0 | $ | 140.0 | $ | 93.0 | $ | — | ||||||||||||||||
(1) | Includes funds that invest primarily in large cap equity securities. |
(2) | Includes small cap equity securities and funds that invest primarily in small cap equity securities. |
(3) | Includes funds that invest primarily in international equity securities. |
(4) | Includes U.S. government securities and funds that invest primarily in U.S. government bonds, including treasury inflation protected securities. |
(5) | Includes investment grade bonds, high yield bonds and mortgage-backed fixed income securities and funds that invest in such securities. |
(6) | Includes funds that invest primarily in REITs, funds that invest in commodities and investments in insurance contracts held by our foreign pension plans. |
The fair value of assets classified as Level 1 is based on unadjusted quoted prices in active markets for identical assets. The fair value of assets classified as Level 2 is based on quoted prices for similar assets or based on valuations made using inputs that are either directly or indirectly observable as of the reporting date. Such inputs include net asset values reported at a minimum on a monthly basis by investment funds or contract values provided by the issuing insurance company. We are able to sell any of our investment funds with notice of no more than 30 days. For more information on the fair value hierarchy, see Note 14. Fair Value of Financial Instruments.
Contributions
We expect to contribute $15.3 million to our pension and other post-retirement benefit plans in 2018. The pension contributions will be primarily for the U.S. qualified pension plan. All of the contributions are expected to be in the form of cash.
67
Estimated future benefit payments
The following table summarizes expected benefit payments from our various pension and post-retirement benefit plans through 2027. Actual benefit payments may differ from expected benefit payments.
(In millions) | Pensions | Other post-retirement benefits | ||||||
2018 | $ | 15.3 | $ | 0.2 | ||||
2019 | 15.6 | 0.2 | ||||||
2020 | 18.6 | 0.2 | ||||||
2021 | 16.9 | 0.2 | ||||||
2022 | 17.5 | 0.2 | ||||||
2023-2027 | 99.2 | 1.0 | ||||||
Savings Plans
Our U.S. and some international employees participate in defined contribution savings plans that we sponsor. These plans generally provide company matching contributions on participants’ voluntary contributions and/or company non-elective contributions. Additionally, certain highly compensated employees participate in a non-qualified deferred compensation plan, which also allows for company matching contributions and company non-elective contributions on compensation in excess of the Internal Revenue Code Section 401(a) (17) limit. The expense for matching contributions was $13.5 million, $11.3 million and $9.0 million in 2017, 2016 and 2015, respectively.
NOTE 9. ACCUMULATED OTHER COMPREHENSIVE INCOME (LOSS)
Accumulated other comprehensive income or loss (“AOCI”) represents the cumulative balance of other comprehensive income, net of tax, as of the balance sheet date. For JBT, AOCI is primarily composed of adjustments related to pension and other post-retirement benefits plans, derivatives designated as hedges and foreign currency translation adjustments. Changes in the AOCI balances for the years ended December 31, 2017 and 2016 by component are shown in the following table:
Pension and Other Post-retirement Benefits | Derivatives Designated as Hedges | Foreign Currency Translation | Total | |||||||||||||
(In millions) | ||||||||||||||||
Balance as of January 1, 2016 | $ | (103.8 | ) | $ | (0.8 | ) | $ | (42.6 | ) | $ | (147.2 | ) | ||||
Other comprehensive gain (loss) before reclassification | (7.3 | ) | (0.1 | ) | (5.7 | ) | (13.1 | ) | ||||||||
Amounts reclassified from accumulated other comprehensive income | 2.5 | 0.8 | — | 3.3 | ||||||||||||
Balance as of December 31, 2016 | (108.6 | ) | (0.1 | ) | (48.3 | ) | (157.0 | ) | ||||||||
Other comprehensive gain (loss) before reclassification | (8.1 | ) | 0.4 | 20.5 | 12.8 | |||||||||||
Amounts reclassified from accumulated other comprehensive income | 2.8 | 1.1 | — | 3.9 | ||||||||||||
Balance as of December 31, 2017 | $ | (113.9 | ) | $ | 1.4 | $ | (27.8 | ) | $ | (140.3 | ) | |||||
Reclassification adjustments from AOCI into earnings for pension and other post-retirement benefits plans for the year ended December 31, 2017 were $4.8 million of charges in selling, general and administrative expenses net of $2.0 million in provision for income taxes. Reclassification adjustments for derivatives designated as hedges for the same period were $1.2 million of charges in interest expense, net of $0.5 million in provision for income taxes.
Reclassification adjustments from AOCI into earnings for pension and other post-retirement benefits plans for the year ended December 31, 2016 were $4.1 million of charges in selling, general and administrative expenses net of $1.6 million in provision for income taxes. Reclassification adjustments for derivatives designated as hedges for the same period were $1.3 million of charges in interest expense, net of $0.5 million in provision for income taxes.
68
NOTE 10. STOCK-BASED COMPENSATION
We recorded stock-based compensation expense and related income tax effects for the years ended December 31, as follows:
(In millions) | 2017 | 2016 | 2015 | |||||||||
Stock-based compensation expense | $ | 9.0 | $ | 9.9 | $ | 7.2 | ||||||
Tax benefit recorded in consolidated statements of income | $ | 9.9 | $ | 3.9 | $ | 2.9 | ||||||
As of December 31, 2017, there was $13.3 million of unrecognized stock-based compensation expense for outstanding awards expected to be recognized over a weighted average period of 1.6 years.
Incentive Compensation Plan
We sponsor a stock-based compensation plan (the “Incentive Compensation Plan”) that provides certain incentives and awards to our officers, employees, directors and consultants. The Incentive Compensation Plan allows the Compensation Committee (the “Committee”) of our Board of Directors to make various types of awards to eligible individuals. Awards that may be issued include common stock, stock options, stock appreciation rights, restricted stock and stock units.
Restricted stock unit awards specify any applicable performance goals, the time and rate of vesting and such other provisions as determined by the Committee. Restricted stock units generally vest after 3 years of service, but may also vest upon a change of control as defined in the Incentive Compensation Plan. The 2017 Incentive Compensation Plan was approved by stockholders in May 2017. The 2017 Incentive Compensation Plan replaced the our prior incentive compensation plan (the “2008 Incentive Compensation Plan”), which remains in existence solely for the purpose of governing the terms of awards that had been granted under the 2008 Incentive Compensation Plan prior to May 2017. The aggregate number of shares of common stock that are authorized for issuance under the 2017 Incentive Compensation Plan is (i) 1,000,000 shares, plus (ii) the number of shares of common stock that remained available for issuance under the 2008 Incentive Compensation Plan on the effective date of the 2017 Incentive Compensation Plan, plus (iii) the number of shares of common stock that were subject to outstanding awards under the 2008 Incentive Compensation Plan on the effective date of the 2017 Incentive Compensation Plan that are canceled, forfeited, returned or withheld without the issuance of shares thereunder.
Impact of Retirement on Outstanding LTIP Awards
In the event of a named executive officer’s retirement from the Company upon or after attaining age 62 and a specified number of years of service, any unvested long-term incentive plan (LTIP) equity or cash awards remain outstanding after retirement and vest on the originally scheduled vesting date. This permits flexibility in retirement planning, permits us to provide an incentive for the vesting period and does not penalize our employees who receive long-term cash and equity awards as incentive compensation when they retire. For awards granted prior to 2016, separation prior to attaining age 62 and 10 years of service will result in the forfeiture of unvested awards. In 2016, the Committee approved a variation to these terms, permitting the Committee to selectively grant awards that will permit unvested equity awards outstanding after retirement to vest on their originally scheduled vesting date following a retirement upon or after attaining the age of 62 and 5 years of service. This variation was approved to allow the Company the option to offer long term equity incentive compensation as a means of attracting and retaining personnel hired near their retirement or to incentivize existing employees who are nearing retirement, but who have not been with the Company for a full ten year period.
Restricted Stock Units
A summary of the non-vested restricted stock units as of December 31, 2017 and changes during the year is presented below:
Shares | Weighted-Average Grant-Date Fair Value | ||||||
Nonvested at December 31, 2016 | 1,066,207 | $ | 32.21 | ||||
Granted | 129,569 | $ | 88.02 | ||||
Vested | (296,608 | ) | $ | 30.03 | |||
Forfeited | (47,271 | ) | $ | 47.49 | |||
Nonvested at December 31, 2017 | 851,897 | $ | 40.61 | ||||
We grant time-based and performance-based restricted stock units that typically vest after three years, but can vary based on the discretion of the Committee. The fair value of these awards is determined using the market value of our common stock on the grant
69
date. Compensation cost is recognized over the lesser of the stated vesting period or the period until the employee meets the retirement eligible age and service requirements under the plan.
For performance-based restricted stock units awards made in 2017, 2016 and 2015; the number of shares to be issued is dependent upon our performance over the three year period ending December 31st of the respective term, with respect to cumulative diluted earnings per share from continuing operations and average operating return on invested capital (ROIC). ROIC is defined as net income plus after tax net interest expense divided by average invested capital, which is an average of total shareholders equity plus debt plus future pension expenses held in AOCI less cash and cash equivalents. Based on results achieved in 2017, 2016 and 2015, and the forecasted amounts over the remainder of the performance period, we expect to issue a total of 65,073, 134,139 and 188,787 shares at the vesting dates in April 2020, April 2019 and April 2018, respectively. Compensation cost has been measured in 2017 based on the projected performance values calculated against the established target.
The following summarizes values for restricted stock activity in each of the years in the three year period ended December 31:
2017 | 2016 | 2015 | ||||||||||
Weighted-average grant-date fair value of restricted stock units granted (per share) | $ | 88.02 | $ | 45.18 | $ | 35.48 | ||||||
Fair value of restricted stock vested (in millions) | $ | 25.8 | $ | 7.0 | $ | 14.9 | ||||||
NOTE 11. STOCKHOLDERS’ EQUITY
The following is a summary of our capital stock activity (in shares) for the year ended December 31, 2017:
Common stock outstanding | Common stock held in treasury | |||||
December 31, 2016 | 29,156,847 | 159,194 | ||||
Stock awards issued | 170,270 | (170,270 | ) | |||
Treasury stock purchases | (56,973 | ) | 56,973 | |||
Common stock issued | 2,307,038 | — | ||||
December 31, 2017 | 31,577,182 | 45,897 | ||||
On March 13, 2017 we issued 2.3 million shares of common stock in an underwritten public offering which resulted in proceeds of $184.1 million, net of underwriting discounts and offering expenses. We used the net proceeds from this offering to repay a portion of our outstanding borrowings under our revolving credit facility and for general corporate purposes.
On December 2, 2015, the Board authorized a share repurchase program for up to $30 million of our common stock beginning January 1, 2016 and continuing through December 31, 2018. Shares may be purchased from time to time in open market transactions, subject to market conditions. Repurchased shares become treasury shares, which are accounted for using the cost method and are used for future awards under the Incentive Compensation Plan. We repurchased $5.0 million of common stock in 2017 and $4.3 million of common stock in 2016.
On October 27, 2011, the Board authorized a share repurchase program for up to $30 million of our common stock, which expired on December 31, 2015. We repurchased $7.7 million of common stock in 2015.
On July 31, 2008, our Board declared a dividend distribution to each record holder of common stock of one Preferred Share Purchase Right for each share of common stock outstanding on that date. Each right entitles the holder to purchase, under certain circumstances related to a change in control of the Company, one one-hundredth of a share of Series A Junior Participating Preferred Stock, par value $0.01, at a price of $72 per share (subject to adjustment), subject to the terms and conditions of a Rights Agreement dated July 31, 2008. The rights expire on July 31, 2018, unless redeemed by us at an earlier date. The redemption price of $0.01 per right is subject to adjustment to reflect stock splits, stock dividends or similar transactions. We have reserved 1,500,000 shares of Series A Junior Participating Preferred Stock for possible issuance under the agreement.
70
NOTE 12. EARNINGS PER SHARE
Basic earnings per share (“EPS”) is computed by dividing net income by the weighted average number of common shares outstanding for the period. Diluted EPS reflects the assumed conversion of all dilutive securities.
The following table sets forth the computation of basic and diluted EPS utilizing income from continuing operations for the respective periods and our basic and dilutive shares outstanding:
(In millions, except per share data) | 2017 | 2016 | 2015 | |||||||||
Basic earnings per share: | ||||||||||||
Income from continuing operations | $ | 82.1 | $ | 68.0 | $ | 55.9 | ||||||
Weighted average number of shares outstanding | 31.4 | 29.4 | 29.5 | |||||||||
Basic earnings per share from continuing operations | $ | 2.61 | $ | 2.31 | $ | 1.90 | ||||||
Diluted earnings per share: | ||||||||||||
Income from continuing operations | $ | 82.1 | $ | 68.0 | $ | 55.9 | ||||||
Weighted average number of shares outstanding | 31.4 | 29.4 | 29.5 | |||||||||
Effect of dilutive securities: | ||||||||||||
Restricted stock units | 0.5 | 0.4 | 0.3 | |||||||||
Total shares and dilutive securities | 31.9 | 29.8 | 29.8 | |||||||||
Diluted earnings per share from continuing operations | $ | 2.58 | $ | 2.28 | $ | 1.88 | ||||||
NOTE 13. DERIVATIVE FINANCIAL INSTRUMENTS AND CREDIT RISK
Derivative financial instruments
All derivatives are recorded as other assets or liabilities in the Consolidated Balance Sheets at their respective fair values. For derivatives designated as cash flow hedges, the effective portion of the unrealized gain or loss related to the derivatives are recorded in other comprehensive income (loss) until the transaction affects earnings. We assess both at inception of the hedge and on an ongoing basis, whether the derivative in the hedging transaction has been, and will continue to be, highly effective in offsetting changes in cash flows of the hedged item. The impact of any ineffectiveness is recognized in the Consolidated Statements of Income. Changes in the fair value of derivatives that do not meet the criteria for designation as a hedge are recognized in earnings.
Foreign Exchange: We manufacture and sell our products in a number of countries throughout the world and, as a result, are exposed to movements in foreign currency exchange rates. Our major foreign currency exposures involve the markets in Western Europe, South America and Asia. Some of our sales and purchase contracts contain embedded derivatives due to the nature of doing business in certain jurisdictions, which we take into consideration as part of our risk management policy. The purpose of our foreign currency hedging activities is to manage the economic impact of exchange rate volatility associated with anticipated foreign currency purchases and sales made in the normal course of business. We primarily utilize forward foreign exchange contracts with maturities of less than 2 years in managing this foreign exchange rate risk. We have not designated these forward foreign exchange contracts, which have a notional value at December 31, 2017 of $421.2 million, as hedges and therefore do not apply hedge accounting.
The following table presents the fair value of foreign currency derivatives, including embedded derivatives, included within the consolidated balance sheets:
As of December 31, 2017 | As of December 31, 2016 | |||||||||||||||
(In millions) | Derivative Assets | Derivative Liabilities | Derivative Assets | Derivative Liabilities | ||||||||||||
Other current assets / liabilities | $ | 3.3 | $ | 5.7 | $ | 7.2 | $ | 4.8 | ||||||||
A master netting arrangement allows counterparties to net settle amounts owed to each other as a result of separate offsetting derivative transactions. We enter into master netting arrangements with our counterparties when possible to mitigate credit risk in derivative transactions by permitting us to net settle for transactions with the same counterparty. However, we do not net settle with such counterparties. As a result, we present derivatives at their gross fair values in the consolidated balance sheets.
71
As of December 31, 2017 and 2016, information related to these offsetting arrangements was as follows:
(in millions) | As of December 31, 2017 | |||||||||||||||||||
Offsetting of Assets | ||||||||||||||||||||
Gross Amounts of Recognized Assets | Gross Amounts Offset in the Consolidated Balance Sheets | Amount Presented in the Consolidated Balance Sheets | Amount Subject to Master Netting Agreement | Net Amount | ||||||||||||||||
Derivatives | $ | 5.2 | $ | — | $ | 5.2 | $ | (1.3 | ) | $ | 3.9 | |||||||||
Offsetting of Liabilities | As of December 31, 2017 | |||||||||||||||||||
Gross Amounts of Recognized Liabilities | Gross Amounts Offset in the Consolidated Balance Sheets | Amount Presented in the Consolidated Balance Sheets | Amount Subject to Master Netting Agreement | Net Amount | ||||||||||||||||
Derivatives | $ | 5.5 | $ | — | $ | 5.5 | $ | (1.3 | ) | $ | 4.2 | |||||||||
(in millions) | As of December 31, 2016 | |||||||||||||||||||
Offsetting of Assets | ||||||||||||||||||||
Gross Amounts of Recognized Assets | Gross Amounts Offset in the Consolidated Balance Sheets | Amount Presented in the Consolidated Balance Sheets | Amount Subject to Master Netting Agreement | Net Amount | ||||||||||||||||
Derivatives | $ | 7.2 | $ | — | $ | 7.2 | $ | (4.3 | ) | $ | 2.9 | |||||||||
Offsetting of Liabilities | As of December 31, 2016 | |||||||||||||||||||
Gross Amounts of Recognized Liabilities | Gross Amounts Offset in the Consolidated Balance Sheets | Amount Presented in the Consolidated Balance Sheets | Amount Subject to Master Netting Agreement | Net Amount | ||||||||||||||||
Derivatives | $ | 5.0 | $ | — | $ | 5.0 | $ | (4.3 | ) | $ | 0.7 | |||||||||
The following table presents the location and amount of the gain (loss) on foreign currency derivatives and on the remeasurement of assets and liabilities denominated in foreign currencies, as well as the net impact recognized in the consolidated statements of income:
Derivatives not designated as hedging instruments | Location of Gain (Loss) Recognized in Income | Amount of Gain (Loss) Recognized in Income | |||||||||||||
(In millions) | 2017 | 2016 | 2015 | ||||||||||||
Foreign exchange contracts | Revenue | $ | 0.2 | $ | (0.5 | ) | $ | 0.8 | |||||||
Foreign exchange contracts | Cost of products | 0.8 | (0.5 | ) | (0.3 | ) | |||||||||
Foreign exchange contracts | Other expense, net | 1.0 | (1.0 | ) | (0.1 | ) | |||||||||
Total | 2.0 | (2.0 | ) | 0.4 | |||||||||||
Remeasurement of assets and liabilities in foreign currencies | (2.6 | ) | 0.4 | (1.3 | ) | ||||||||||
Net loss on foreign currency transactions | $ | (0.6 | ) | $ | (1.6 | ) | $ | (0.9 | ) | ||||||
Interest Rates: We have entered into three interest rate swaps to fix the interest rate applicable to certain of our variable-rate debt. The agreements swap one-month LIBOR for fixed rates. We have designated these swaps as cash flow hedges and all changes in fair value of the swaps are recognized in Accumulated other comprehensive income (loss).
At December 31, 2017, the fair value recorded in other assets on the Consolidated Balance Sheet is $2.0 million. The effective portion of these derivatives designated as cash flow hedges of $1.3 million has been reported in other comprehensive loss on the Consolidated Statements of Comprehensive Income (Loss) as of December 31, 2017.
Ineffectiveness from cash flow hedges, all of which are interest rate swaps, was immaterial as of December 31, 2017.
72
Refer to Note 14. Fair Value of Financial Instruments, for a description of how the values of the above financial instruments are determined.
Credit risk
By their nature, financial instruments involve risk including credit risk for non-performance by counterparties. Financial instruments that potentially subject us to credit risk primarily consist of trade receivables and derivative contracts. We manage the credit risk on financial instruments by transacting only with financially secure counterparties, requiring credit approvals and establishing credit limits, and monitoring counterparties’ financial condition. Our maximum exposure to credit loss in the event of non-performance by the counterparty is limited to the amount drawn and outstanding on the financial instrument. Allowances for losses are established based on collectability assessments.
NOTE 14. FAIR VALUE OF FINANCIAL INSTRUMENTS
The fair value framework requires the categorization of assets and liabilities into three levels based upon the assumptions (inputs) used to price the assets or liabilities. Level 1 provides the most reliable measure of fair value, whereas Level 3 generally requires significant management judgment. The three levels are defined as follows:
• | Level 1: Unadjusted quoted prices in active markets for identical assets and liabilities that the Company can assess at the measurement date. |
• | Level 2: Observable inputs other than those included in Level 1 that are observable for the asset or liability, either directly or indirectly. For example, quoted prices for similar assets or liabilities in active markets or quoted prices for identical assets or liabilities in inactive markets. |
• | Level 3: Unobservable inputs reflecting management’s own assumptions about the inputs used in pricing the asset or liability. |
Financial assets and financial liabilities measured at fair value on a recurring basis are as follows:
As of December 31, 2017 | As of December 31, 2016 | ||||||||||||||||||||||||||||||
(In millions) | Total | Level 1 | Level 2 | Level 3 | Total | Level 1 | Level 2 | Level 3 | |||||||||||||||||||||||
Assets: | |||||||||||||||||||||||||||||||
Investments | $ | 13.1 | $ | 13.1 | $ | — | $ | — | $ | 11.9 | $ | 11.9 | $ | — | $ | — | |||||||||||||||
Derivatives | 5.2 | — | 5.2 | — | 7.2 | — | 7.2 | — | |||||||||||||||||||||||
Total assets | $ | 18.3 | $ | 13.1 | $ | 5.2 | $ | — | $ | 19.1 | $ | 11.9 | $ | 7.2 | $ | — | |||||||||||||||
Liabilities: | |||||||||||||||||||||||||||||||
Derivatives | $ | 5.5 | $ | — | $ | 5.5 | $ | — | $ | 5.0 | $ | — | $ | 5.0 | $ | — | |||||||||||||||
Contingent Consideration | — | — | — | — | 0.8 | — | — | 0.8 | |||||||||||||||||||||||
Total liabilities | $ | 5.5 | $ | — | $ | 5.5 | $ | — | $ | 5.8 | $ | — | $ | 5.0 | $ | 0.8 | |||||||||||||||
Investments represent securities held in a trust for the non-qualified deferred compensation plan. Investments are classified as trading securities and are valued based on quoted prices in active markets for identical assets that we have the ability to access. Investments are reported separately on the consolidated balance sheet. Investments include an unrealized gain of $0.5 million as of December 31, 2017 and an unrealized gain of $0.6 million as of December 31, 2016.
We use the income approach to measure the fair value of derivative instruments on a recurring basis. This approach calculates the present value of the future cash flow by measuring the change between the derivative contract rate and the published market indicative currency rate, multiplied by the contract notional values, and applying an appropriate discount rate as well as a factor of credit risk.
The carrying amounts of cash and cash equivalents, trade receivables and payables, as well as financial instruments included in other current assets and other current liabilities, approximate fair values because of their short-term maturities.
73
The carrying values and the estimated fair values of our debt financial instruments as of December 31 are as follows:
2017 | 2016 | |||||||||||||||
(In millions) | Carrying Value | Estimated Fair Value | Carrying Value | Estimated Fair Value | ||||||||||||
Revolving credit facility, expires February 10, 2020 | $ | 230.5 | $ | 230.5 | $ | 342.1 | $ | 342.1 | ||||||||
Term loan due February 10, 2020 | 150.0 | 150.0 | 150.0 | 150.0 | ||||||||||||
Brazilian loan due October 16, 2017 | — | — | 1.5 | 1.4 | ||||||||||||
Foreign credit facilities | 2.7 | 2.7 | 4.4 | 4.4 | ||||||||||||
Other | 0.2 | 0.2 | 1.2 | 1.2 | ||||||||||||
There was no active or observable market for our fixed rate Brazilian loans. Therefore, the estimated fair value was based on discounted cash flows using current interest rates available for debt with similar terms and remaining maturities. The estimates of the all-in interest rate for discounting the loans are based on a broker quote for loans with similar terms. We do not have a rate adjustment for risk profile changes, covenant issues or credit rating changes, therefore the broker quote is deemed to be the closest approximation of current market rates. The carrying values of the remaining borrowings approximate their fair values due to their variable interest rates.
NOTE 15. COMMITMENTS AND CONTINGENCIES
In the normal course of our business, we are at times subject to pending and threatened legal actions, some for which the relief or damages sought may be substantial. Although we are not able to predict the outcome of such actions, after reviewing all pending and threatened actions with counsel and based on information currently available, management believes that the outcome of such actions, individually or in the aggregate, will not have a material adverse effect on the results of operations or financial position of our Company. However, it is possible that the ultimate resolution of such matters, if unfavorable, may be material to the results of operations in a particular future period as the time and amount of any resolution of such actions and its relationship to the future results of operations are not currently known.
Liabilities are established for pending legal claims only when losses associated with the claims are judged to be probable, and the loss can be reasonably estimated. In many lawsuits and arbitrations, it is not considered probable that a liability has been incurred or not possible to estimate the ultimate or minimum amount of that liability until the case is close to resolution, in which case no liability would be recognized until that time.
In 2013, we received a notice of examination from the Delaware Department of Finance commencing an examination of our books and records to determine compliance with Delaware unclaimed property law. The examination was not complete when, in 2017, Delaware promulgated a law which permitted companies an election to convert an examination to a review under the Secretary of State’s voluntary disclosure agreement program. In December 2017, we elected this alternative and are in the process of meeting the requirements under the voluntary disclosure agreement program. The requirements include reviewing our books and records and filing any previously unfiled reports for all unclaimed property presumed unclaimed, under the law, from 2003.
We are required to work with the Secretary of State to complete this exercise by December 2019. We are not able to estimate whether we have significant unclaimed property obligations at this time.
Guarantees and Product Warranties
In the ordinary course of business with customers, vendors and others, we issue standby letters of credit, performance bonds, surety bonds and other guarantees. These financial instruments, which totaled approximately $175.8 million at December 31, 2017, represent guarantees of our future performance. We also have provided approximately $10.5 million of bank guarantees and letters of credit to secure a portion of our existing financial obligations. The majority of these financial instruments expire within two years; we expect to replace them through the issuance of new or the extension of existing letters of credit and surety bonds.
In some instances, we guarantee our customers’ financing arrangements. We are responsible for payment of any unpaid amounts but will receive indemnification from third parties for between seventy-five and ninety-five percent of the contract values. In addition, we generally retain recourse to the equipment sold. As of December 31, 2017, the gross value of such arrangements was $7.7 million, of which our net exposure under such guarantees was $0.6 million.
We provide warranties of various lengths and terms to certain of our customers based on standard terms and conditions and negotiated agreements. We provide for the estimated cost of warranties at the time revenue is recognized for products where reliable, historical
74
experience of warranty claims and costs exists. We also provide specific warranty for significant claims for which initial estimates are not likely to be sufficient. The warranty obligation reflected in other current liabilities in the consolidated balance sheets is based on historical experience by product and considers failure rates and the related costs in correcting a product failure. Warranty cost and accrual information is as follows:
(In millions) | 2017 | 2016 | ||||||
Balance at beginning of year | $ | 14.5 | $ | 12.5 | ||||
Expenses for new warranties | 12.7 | 13.4 | ||||||
Adjustments to existing accruals | (0.4 | ) | (0.3 | ) | ||||
Claims paid | (15.2 | ) | (11.2 | ) | ||||
Added through acquisition | 2.4 | 0.3 | ||||||
Translation | 0.5 | (0.2 | ) | |||||
Balance at end of year | $ | 14.5 | $ | 14.5 | ||||
Leases
We lease office space, manufacturing facilities and various types of manufacturing and data processing equipment. Leases of real estate generally provide that we pay for repairs, property taxes and insurance. Substantially all leases are classified as operating leases for accounting purposes. Rent expense under operating leases amounted to $5.3 million, $6.2 million and $8.9 million in 2017, 2016 and 2015, respectively.
Future minimum lease payments under non-cancelable operating leases as of December 31, 2017, for the following fiscal years were:
(In millions) | Total Amount | 2018 | 2019 | 2020 | 2021 | 2022 | After 2023 | |||||||||||||||||||||
Operating lease obligations | $ | 41.4 | $ | 11.6 | $ | 7.4 | $ | 6.4 | $ | 5.7 | $ | 4.1 | $ | 6.2 | ||||||||||||||
NOTE 16. BUSINESS SEGMENTS
Operating segments for the Company are determined based on information used by the chief operating decision maker (CODM) in deciding how to evaluate performance and allocate resources to each of the segments. JBT’s CODM is the Chief Executive Officer (CEO). While there are many measures the CEO reviews in this capacity, the key segment measures reviewed include operating profit, operating income margin, and EBITDA.
In the third quarter of 2017, we changed the internal structure of our management team; insofar that it increased the number of operating segments, as defined by ASC 280, Segment Reporting, for the Company. Although the number of operating segments has increased from prior periods, we have aggregated multiple operating segments into one reportable segment, FoodTech, as they exhibit similar long-term operational, financial and economic characteristics. As such, our reportable segments remain the same and prior period disclosures are still comparable.
Our reportable segments are:
• | JBT FoodTech—designs, manufactures and services technologically sophisticated food processing systems used for, among other things, fruit juice production, frozen food production, in-container food production, automated systems and convenience food preparation by the food industry. |
• | JBT AeroTech—designs, manufactures and services technologically sophisticated airport ground support and gate equipment and provides services for airport authorities; airlines, airfreight, and ground handling companies; the defense contractors and other industries. |
Total revenue by segment includes intersegment sales, which are made at prices that reflect, as nearly as practicable, the market value of the transaction. Segment operating profit is defined as total segment revenue less segment operating expenses. The following items have been excluded in computing segment operating profit: corporate expense, restructuring costs, interest income and expense, and income taxes. See the table below for further details on corporate expense.
75
Segment revenue and segment operating profit
(In millions) | 2017 | 2016 | 2015 | |||||||||
Revenue | ||||||||||||
JBT FoodTech | $ | 1,171.9 | $ | 928.0 | $ | 725.1 | ||||||
JBT AeroTech | 463.0 | 422.5 | 383.1 | |||||||||
Intercompany eliminations | 0.2 | — | (0.9 | ) | ||||||||
Total revenue | $ | 1,635.1 | $ | 1,350.5 | $ | 1,107.3 | ||||||
Income before income taxes | ||||||||||||
Segment operating profit: | ||||||||||||
JBT FoodTech | $ | 139.1 | $ | 113.2 | $ | 85.4 | ||||||
JBT AeroTech | 50.7 | 45.1 | 38.2 | |||||||||
Total segment operating profit | 189.8 | 158.3 | 123.6 | |||||||||
Corporate items: | ||||||||||||
Corporate expense(1) | 42.3 | 42.6 | 34.6 | |||||||||
Restructuring expense(2) | 1.7 | 12.3 | — | |||||||||
Net interest expense | 13.6 | 9.4 | 6.8 | |||||||||
Total corporate items | 57.6 | 64.3 | 41.4 | |||||||||
Income from continuing operations before income taxes | 132.2 | 94.0 | 82.2 | |||||||||
Provision for income taxes | 50.1 | 26.0 | 26.2 | |||||||||
Income from continuing operations | 82.1 | 68.0 | 56.0 | |||||||||
Loss from discontinued operations, net of income taxes | 1.6 | 0.4 | 0.1 | |||||||||
Net income | $ | 80.5 | $ | 67.6 | $ | 55.9 | ||||||
(1) | Corporate expense generally includes corporate staff-related expense, stock-based compensation, pension and other post-retirement benefits expenses not related to service, LIFO adjustments, certain foreign currency-related gains and losses, and the impact of unusual or strategic transactions not representative of segment operations. |
(2) | Refer to Note 17. Restructuring for further information on restructuring expense. |
76
Segment operating capital employed and segment assets
(In millions) | 2017 | 2016 | 2015 | |||||||||
Segment operating capital employed(1): | ||||||||||||
JBT FoodTech | $ | 802.2 | $ | 654.2 | $ | 414.7 | ||||||
JBT AeroTech | 157.5 | 125.9 | 114.1 | |||||||||
Total segment operating capital employed | 959.7 | 780.1 | 528.8 | |||||||||
Segment liabilities included in total segment operating capital employed(2) | 405.6 | 365.2 | 322.6 | |||||||||
Corporate(3) | 26.1 | 42.1 | 24.7 | |||||||||
Total assets | $ | 1,391.4 | $ | 1,187.4 | $ | 876.1 | ||||||
Segment assets: | ||||||||||||
JBT FoodTech | $ | 1,134.7 | $ | 950.5 | $ | 663.1 | ||||||
JBT AeroTech | 230.6 | 194.8 | 188.9 | |||||||||
Intercompany eliminations | — | — | (0.6 | ) | ||||||||
Total segment assets | 1,365.3 | 1,145.3 | 851.4 | |||||||||
Corporate(3) | 26.1 | 42.1 | 24.7 | |||||||||
Total assets | $ | 1,391.4 | $ | 1,187.4 | $ | 876.1 | ||||||
(1) | Management views segment operating capital employed, which consists of segment assets, net of its liabilities, as the primary measure of segment capital. Segment operating capital employed excludes debt, pension liabilities, restructuring reserves, income taxes and LIFO inventory reserves. |
(2) | Segment liabilities included in total segment operating capital employed consist of trade and other accounts payable, advance and progress payments, accrued payroll and other liabilities. |
(3) | Corporate includes cash, LIFO inventory reserves, income tax balances, investments, and property, plant and equipment not associated with a specific segment. |
Geographic segment information
Geographic segment sales were identified based on the location where our products and services were delivered. Geographic segment long-lived assets include property, plant and equipment, net and certain other non-current assets.
(In millions) | 2017 | 2016 | 2015 | |||||||||
Revenue (by location of customers): | ||||||||||||
United States | $ | 967.1 | $ | 807.7 | $ | 600.9 | ||||||
All other countries | 668.0 | 542.8 | 506.4 | |||||||||
Total revenue | $ | 1,635.1 | $ | 1,350.5 | $ | 1,107.3 | ||||||
(In millions) | 2017 | 2016 | 2015 | |||||||||
Long-lived assets: | ||||||||||||
United States | $ | 161.6 | $ | 154.1 | $ | 132.7 | ||||||
Brazil | 13.9 | 12.6 | 9.5 | |||||||||
All other countries | 75.7 | 57.8 | 49.1 | |||||||||
Total long-lived assets | $ | 251.2 | $ | 224.5 | $ | 191.3 | ||||||
77
Other business segment information
Capital Expenditures | Depreciation and Amortization | Research and Development Expense | ||||||||||||||||||||||||||||||||||
(In millions) | 2017 | 2016 | 2015 | 2017 | 2016 | 2015 | 2017 | 2016 | 2015 | |||||||||||||||||||||||||||
JBT FoodTech | $ | 34.6 | $ | 30.7 | $ | 31.9 | $ | 46.8 | $ | 34.6 | $ | 25.5 | $ | 21.8 | $ | 18.0 | $ | 13.5 | ||||||||||||||||||
JBT AeroTech | 2.6 | 3.9 | 3.5 | 2.5 | 2.2 | 2.0 | 6.9 | 5.6 | 4.7 | |||||||||||||||||||||||||||
Corporate | 0.7 | 2.5 | 2.3 | 2.4 | 1.7 | 2.1 | — | — | — | |||||||||||||||||||||||||||
Total | $ | 37.9 | $ | 37.1 | $ | 37.7 | $ | 51.7 | $ | 38.5 | $ | 29.6 | $ | 28.7 | $ | 23.6 | $ | 18.2 | ||||||||||||||||||
NOTE 17. RESTRUCTURING
Restructuring costs primarily consist of employee separation benefits under our existing severance programs, foreign statutory termination benefits, certain one-time termination benefits, contract termination costs, asset impairment charges and other costs that are associated with restructuring actions. Certain restructuring charges are accrued prior to payments made in accordance with applicable guidance. For such charges, the amounts are determined based on estimates prepared at the time the restructuring actions were approved by management.
In the first quarter of 2016, we implemented our optimization program to realign FoodTech’s Protein business in North America and Liquid Foods business in Europe, accelerate JBT’s strategic sourcing initiatives, and consolidate smaller facilities. The total estimated cost in connection with this plan is approximately $12.0 million.
During the fourth quarter of 2016, in connection with our acquisition of Tipper Tie, we implemented a restructuring plan to consolidate certain facilities and optimize our general and administrative infrastructure subsequent to a FoodTech acquisition. The total estimated cost in connection with this plan is approximately $4.0 million.
The following table details the amounts reported in Restructuring expense on the consolidated statement of income since the implementation of these plans:
Cumulative Amount | For the Quarter Ended | Cumulative Amount | |||||||||||||||||||||
(In millions) | As of December 31, 2016 | March 31, 2017 | June 30, 2017 | September 30, 2017 | December 31, 2017 | As of December 31, 2017 | |||||||||||||||||
Severance and related expense | $ | 6.1 | $ | 0.5 | $ | 0.1 | $ | — | $ | — | $ | 6.7 | |||||||||||
Other | 6.2 | 0.2 | 0.6 | 0.3 | 0.6 | 7.9 | |||||||||||||||||
Total restructuring charges | $ | 12.3 | $ | 0.7 | $ | 0.7 | $ | 0.3 | $ | 0.6 | $ | 14.6 | |||||||||||
The restructuring expense is associated with the FoodTech segment, and is excluded from our calculation of segment operating profit. Expenses incurred during the three months ended December 31, 2017 primarily relate to costs to streamline operations and consolidate facilities as a direct result of our plan.
78
Liability balances for restructuring activities are included in other current liabilities in the accompanying consolidated balance sheets. The table below details the activity in 2017:
(In millions) | Balance as of December 31, 2016 | Charged to Earnings | Payments Made | Release of Liability | Balance as of December 31, 2017 | ||||||||||||||
Severance and related expense | $ | 8.3 | $ | 0.5 | $ | (4.9 | ) | $ | (0.7 | ) | $ | 3.2 | |||||||
Other | 0.6 | 1.8 | (2.4 | ) | — | — | |||||||||||||
Total | $ | 8.9 | $ | 2.3 | $ | (7.3 | ) | $ | (0.7 | ) | $ | 3.2 | |||||||
We released $0.7 million of the liability during the year ended December 31, 2017 which we no longer expect to pay in connection with this plan due to actual severance payments differing from the original estimates and natural attrition of employees.
NOTE 18. QUARTERLY INFORMATION (UNAUDITED)
(In millions, except per share data and common stock prices) | 2017 | 2016 | ||||||||||||||||||||||||||||||
4th Qtr. | 3rd Qtr. | 2nd Qtr. | 1st Qtr. | 4th Qtr. | 3rd Qtr. | 2nd Qtr. | 1st Qtr. | |||||||||||||||||||||||||
Revenue | $ | 483.7 | $ | 420.8 | $ | 386.1 | $ | 344.5 | $ | 405.0 | $ | 349.6 | $ | 328.8 | $ | 267.1 | ||||||||||||||||
Cost of sales | 346.9 | 299.3 | 271.3 | 246.9 | 291.0 | 255.5 | 233.0 | 190.3 | ||||||||||||||||||||||||
Income from continuing operations | 19.8 | 26.4 | 18.3 | 17.6 | 23.4 | 20.6 | 18.8 | 5.2 | ||||||||||||||||||||||||
Loss from discontinued operations, net of tax | 0.4 | 0.6 | 0.4 | 0.2 | 0.3 | — | — | 0.1 | ||||||||||||||||||||||||
Net income | $ | 19.4 | $ | 25.8 | $ | 17.9 | $ | 17.4 | $ | 23.1 | $ | 20.6 | $ | 18.8 | $ | 5.1 | ||||||||||||||||
Basic earnings per share(1): | ||||||||||||||||||||||||||||||||
Income from continuing operations | $ | 0.62 | $ | 0.83 | $ | 0.57 | $ | 0.59 | $ | 0.79 | $ | 0.70 | $ | 0.64 | $ | 0.18 | ||||||||||||||||
Loss from discontinued operations, net of tax | (0.01 | ) | (0.02 | ) | (0.01 | ) | (0.01 | ) | (0.01 | ) | — | — | (0.01 | ) | ||||||||||||||||||
Net income | $ | 0.61 | $ | 0.81 | $ | 0.56 | $ | 0.58 | $ | 0.78 | $ | 0.70 | $ | 0.64 | $ | 0.17 | ||||||||||||||||
Diluted earnings per share(1): | ||||||||||||||||||||||||||||||||
Income from continuing operations | $ | 0.61 | $ | 0.82 | $ | 0.57 | $ | 0.58 | $ | 0.78 | $ | 0.69 | $ | 0.63 | $ | 0.17 | ||||||||||||||||
Loss from discontinued operations, net of tax | (0.01 | ) | (0.02 | ) | (0.01 | ) | (0.01 | ) | (0.01 | ) | — | — | — | |||||||||||||||||||
Net income | $ | 0.60 | $ | 0.80 | $ | 0.56 | $ | 0.57 | $ | 0.77 | $ | 0.69 | $ | 0.63 | $ | 0.17 | ||||||||||||||||
Dividends declared per share | $ | 0.10 | $ | 0.10 | $ | 0.10 | $ | 0.10 | $ | 0.10 | $ | 0.10 | $ | 0.10 | $ | 0.10 | ||||||||||||||||
Weighted average shares outstanding | ||||||||||||||||||||||||||||||||
Basic | 31.9 | 31.9 | 31.9 | 30.0 | 29.4 | 29.4 | 29.4 | 29.5 | ||||||||||||||||||||||||
Diluted | 32.3 | 32.3 | 32.3 | 30.4 | 29.9 | 29.8 | 29.8 | 29.8 | ||||||||||||||||||||||||
Common stock sales price | ||||||||||||||||||||||||||||||||
High | $ | 120.55 | $ | 101.40 | $ | 99.15 | $ | 92.05 | $ | 93.55 | $ | 71.00 | $ | 65.67 | $ | 57.48 | ||||||||||||||||
Low | $ | 99.09 | $ | 85.09 | $ | 82.45 | $ | 80.70 | $ | 70.55 | $ | 59.90 | $ | 51.20 | $ | 41.35 | ||||||||||||||||
(1) | Basic and diluted earnings per share (EPS) are computed independently for each of the periods presented. Accordingly, the sum of the quarterly EPS amounts may not agree to the annual total. |
NOTE 19. SUBSEQUENT EVENTS
On February 22, 2018, the Board of Directors approved a quarterly cash dividend of $0.10 per share of outstanding common stock. The dividend will be paid on March 19, 2018 to stockholders of record at the close of business on March 5, 2018.
79
Schedule II—Valuation and Qualifying Accounts
(In thousands) | Additions | ||||||||||||||||||
Description | Balance at beginning of period | Charged to costs and expenses | Charged to other accounts(a) | Deductions and other(a) | Balance at end of period | ||||||||||||||
Year ended December 31, 2015: | |||||||||||||||||||
Allowance for doubtful accounts | $ | 3,042 | $ | 471 | $ | — | $ | 1,450 | $ | 2,063 | |||||||||
Valuation allowance for deferred tax assets | $ | — | $ | — | $ | — | $ | — | $ | — | |||||||||
Year ended December 31, 2016: | |||||||||||||||||||
Allowance for doubtful accounts | $ | 2,063 | $ | 2,060 | $ | — | $ | 1,054 | $ | 3,069 | |||||||||
Valuation allowance for deferred tax assets | $ | — | $ | — | $ | — | $ | — | $ | — | |||||||||
Year ended December 31, 2017: | |||||||||||||||||||
Allowance for doubtful accounts | $ | 3,069 | $ | 288 | $ | — | $ | 147 | $ | 3,210 | |||||||||
Valuation allowance for deferred tax assets | $ | — | $ | — | $ | 2,654 | $ | — | $ | 2,654 | |||||||||
(a) "Additions charged to other accounts" includes allowances added through business combinations.
(b) “Deductions and other” includes translation adjustments, write-offs, net of recoveries, and reductions in the allowances credited to expense.
See accompanying Report of Independent Registered Public Accounting Firm.
80
ITEM 9. CHANGES IN AND DISAGREEMENTS WITH ACCOUNTANTS ON ACCOUNTING AND FINANCIAL DISCLOSURE
None.
ITEM 9A. CONTROLS AND PROCEDURES
(a) | Disclosure Controls and Procedures |
As of the end of the period covered by this Annual Report on Form 10-K, we carried out an evaluation of the effectiveness of the design and operation of our disclosure controls and procedures. Based upon that evaluation, our Chief Executive Officer and Chief Financial Officer concluded that our disclosure controls and procedures were effective to ensure that information required to be disclosed by us in reports we file or submit under the Exchange Act is (1) recorded, processed, summarized and reported within the time periods specified in SEC rules and forms, and (2) accumulated and communicated to our management, including our Chief Executive Officer and Chief Financial Officer, to allow timely decisions regarding required disclosure.
(b) | Management’s Annual Report on Internal Control over Financial Reporting |
Internal control over financial reporting is defined in Rule 13a-15(f) promulgated under the Securities Exchange Act of 1934, as a process designed by, or under the supervision of, the Company’s principal executive and principal financial officers and effected by the Company’s Board, management and other personnel, to provide reasonable assurance regarding the reliability of financial reporting and the preparation of financial statements for external purposes in accordance with U.S. generally accepted accounting principles (GAAP) and includes those policies and procedures that:
(i) | pertain to the maintenance of records that in reasonable detail accurately and fairly reflect the transactions and dispositions of assets of the Company; |
(ii) | provide reasonable assurance that transactions are recorded as necessary to permit preparation of financial statements in accordance with GAAP, and that receipts and expenditures of the Company are being made only in accordance with authorizations of management and directors of the Company; and |
(iii) | provide reasonable assurance regarding prevention or timely detection of unauthorized acquisition, use or disposition of the Company’s assets that could have a material effect on the financial statements. |
Because of its inherent limitations, internal control over financial reporting may not prevent or detect misstatements. Projections of any evaluation of effectiveness to future periods are subject to the risk that controls may become inadequate because of changes in conditions, or that the degree of compliance with the policies or procedures may deteriorate. Management’s report on internal control over financial reporting is set forth below and should be read with these limitations in mind.
Our management is responsible for establishing and maintaining adequate internal control over financial reporting. Under the supervision and with the participation of our management, including our Chief Executive Officer and Chief Financial Officer, we conducted an evaluation of the effectiveness of the Company’s internal control over financial reporting based upon the framework in Internal Control – Integrated Framework (2013) issued by the Committee of Sponsoring Organizations of the Treadway Commission. Based on that evaluation, our management concluded that the Company’s internal control over financial reporting is effective as of December 31, 2017.
During 2017, the Company completed the acquisitions of Avure Technologies, Inc., Aircraft Maintenance Support Services, Ltd., and PLF International Ltd. The net assets acquired in these transactions reflected less than 10% of the consolidated assets of JBT Corporation as of December 31, 2017. The total revenue generated by these acquired businesses since the dates of acquisition totaled less than 5% of the consolidated revenue of JBT Corporation for the year ended December 31, 2017. Management’s assessment of the Company’s internal control over financial reporting as of December 31, 2017 excluded the internal control over financial reporting of these businesses during this period while we integrated the acquirees’ existing internal control structure with JBT policies and procedures.
Attestation Report of the Registered Public Accounting Firm
KPMG LLP, the Company’s independent registered public accounting firm, has issued their report, included herein on page 82, on the effectiveness of the Company’s internal control over financial reporting.
(c) | Changes in Internal Control over Financial Reporting |
In the ordinary course of business, we review our system of internal control over financial reporting and make changes to our systems and processes to improve such controls and increase efficiency, while ensuring that we maintain an effective internal control environment. Changes may include such activities as implementing new, more efficient systems,
81
automating manual processes and updating existing systems. For example, we centralized certain administrative and transaction functions in Europe to leverage a shared services model. As a result of the transition of these accounting operations to a central location, the personnel responsible for executing controls over the processing of transactions in certain processes changed. This transition process continued throughout 2017. Management believes it took the necessary steps to maintain appropriate internal controls and to monitor their operation during the period of change. The implementation of shared services will allow us to be more efficient and further enhance our internal control over financial reporting.
We acquired multiple businesses during 2017. Our integration process includes evaluating the internal control structure, including information technology, to change certain systems, controls and/or procedures to align each business with JBT systems, controls and procedures.
Other than as noted above, there were no changes in controls identified in the evaluation for the quarter ended December 31, 2017 that have materially affected, or are reasonably likely to materially affect, our internal control over financial reporting, as defined in Rule 13a-15(f) under the Exchange Act.
82
Report of Independent Registered Public Accounting Firm
To the Stockholders and Board of Directors
John Bean Technologies Corporation:
Opinion on Internal Control Over Financial Reporting
We have audited John Bean Technologies Corporation and subsidiaries (the “Company”) internal control over financial reporting as of December 31, 2017, based on criteria established in Internal Control - Integrated Framework (2013) issued by the Committee of Sponsoring Organizations of the Treadway Commission. In our opinion, the Company maintained, in all material respects, effective internal control over financial reporting as of December 31, 2017, based on criteria established in Internal Control - Integrated Framework (2013) issued by the Committee of Sponsoring Organizations of the Treadway Commission.
We also have audited, in accordance with the standards of the Public Company Accounting Oversight Board (United States) (“PCAOB”), the consolidated balance sheets of the Company as of December 31, 2017 and 2016, the related consolidated statements of income, comprehensive income (loss), changes in stockholders’ equity, and cash flows for each of the years in the three-year period ended December 31, 2017, and the related notes and financial statement schedule II (collectively, the consolidated financial statements), and our report dated February 28, 2018 expressed an unqualified opinion on those consolidated financial statements.
The Company acquired Avure Technologies, Inc., Aircraft Maintenance Support Services, Ltd., and PLF International Ltd. during 2017, and management excluded from its assessment of the effectiveness of the Company’s internal control over financial reporting as of December 31, 2017, Avure Technologies, Inc.’s, Aircraft Maintenance Support Services, Ltd.’s, and PLF International Ltd.’s internal control over financial reporting associated with total assets of less than 10% of consolidated assets and total revenues of less than 5% of consolidated revenues in the consolidated financial statements of the Company as of and for the year ended December 31, 2017. Our audit of internal control over financial reporting of the Company also excluded an evaluation of the internal control over financial reporting of Avure Technologies, Inc., Aircraft Maintenance Support Services, Ltd., and PLF International Ltd.
Basis for Opinion
The Company’s management is responsible for maintaining effective internal control over financial reporting and for its assessment of the effectiveness of internal control over financial reporting, included in the accompanying Management’s Annual Report on Internal Control over Financial Reporting in Item 9A: Controls and Procedures. Our responsibility is to express an opinion on the Company’s internal control over financial reporting based on our audit. We are a public accounting firm registered with the PCAOB and are required to be independent with respect to the Company in accordance with the U.S. federal securities laws and the applicable rules and regulations of the Securities and Exchange Commission and the PCAOB.
We conducted our audit in accordance with the standards of the PCAOB. Those standards require that we plan and perform the audit to obtain reasonable assurance about whether effective internal control over financial reporting was maintained in all material respects. Our audit of internal control over financial reporting included obtaining an understanding of internal control over financial reporting, assessing the risk that a material weakness exists, and testing and evaluating the design and operating effectiveness of internal control based on the assessed risk. Our audit also included performing such other procedures as we considered necessary in the circumstances. We believe that our audit provides a reasonable basis for our opinion.
Definition and Limitations of Internal Control Over Financial Reporting
A company’s internal control over financial reporting is a process designed to provide reasonable assurance regarding the reliability of financial reporting and the preparation of financial statements for external purposes in accordance with generally accepted accounting principles. A company’s internal control over financial reporting includes those policies and procedures that (1) pertain to the maintenance of records that, in reasonable detail, accurately and fairly reflect the transactions and dispositions of the assets of the company; (2) provide reasonable assurance that transactions are recorded as necessary to permit preparation of financial statements in accordance with generally accepted accounting principles, and that receipts and expenditures of the company are being made only in accordance with authorizations of management and directors of the company; and (3) provide reasonable assurance regarding prevention or timely detection of unauthorized acquisition, use, or disposition of the company’s assets that could have a material effect on the financial statements.
Because of its inherent limitations, internal control over financial reporting may not prevent or detect misstatements. Also, projections of any evaluation of effectiveness to future periods are subject to the risk that controls may become inadequate because of changes in conditions, or that the degree of compliance with the policies or procedures may deteriorate.
/s/ KPMG LLP
Chicago, Illinois
February 28, 2018
83
ITEM 9B. OTHER INFORMATION
None.
PART III
ITEM 10. DIRECTORS, EXECUTIVE OFFICERS AND CORPORATE GOVERNANCE
We have a code of ethics entitled the “Code of Business Conduct and Ethics” that applies to our employees, including our principal executive and financial officers (including our principal executive officer, principal financial officer and principal accounting officer) as well as our directors. A copy of our Code of Business Conduct and Ethics may be found on our website at www.jbtcorporation.com under “Investor Relations – Corporate Governance” and is available in print to stockholders without charge by submitting a request to the General Counsel and Secretary of JBT Corporation, 70 West Madison Street, Suite 4400, Chicago, Illinois 60602.
We also elect to disclose the information required by Form 8-K, Item 5.05, “Amendments to the registrant’s code of ethics, or waiver of a provision of the code of ethics,” through our website, and such information will remain available on our website for at least a twelve-month period.
Information regarding our executive officers is presented in the section entitled “Executive Officers of the Registrant” in Part I of this Annual Report on Form 10-K.
Other information required by this Item can be found in the Proxy Statement for our 2018 Annual Meeting of Stockholders and is incorporated herein by reference.
ITEM 11. EXECUTIVE COMPENSATION
Information required by this item can be found in the sections entitled “Director Compensation,” “Compensation Committee Interlocks and Insider Participation in Compensation Decisions,” “Executive Compensation” and "Compensation Tables and Explanatory Information" of the Proxy Statement for our 2018 Annual Meeting of Stockholders and is incorporated herein by reference.
ITEM 12. | SECURITY OWNERSHIP OF CERTAIN BENEFICIAL OWNERS AND MANAGEMENT AND RELATED STOCKHOLDER MATTERS |
Information required by this item can be found in the sections entitled “Security Ownership of John Bean Technologies Corporation” and "Compensation Tables and Explanatory Information - Securities Authorized for Issuance Under Equity Compensation Plans Table" of the Proxy Statement for our 2018 Annual Meeting of Stockholders and is incorporated herein by reference.
ITEM 13. CERTAIN RELATIONSHIPS AND RELATED TRANSACTIONS, AND DIRECTOR INDEPENDENCE
Information required by this item can be found in the sections entitled “Transactions with Related Persons” and “Director Independence” of the Proxy Statement for our 2018 Annual Meeting of Stockholders and is incorporated herein by reference.
ITEM 14. PRINCIPAL ACCOUNTANT FEES AND SERVICES
Information required by this item can be found in the section entitled “Ratification of Appointment of Independent Registered Public Accounting Firm” of the Proxy Statement for our 2018 Annual Meeting of Stockholders and is incorporated herein by reference.
84
PART IV
ITEM 15. EXHIBITS AND FINANCIAL STATEMENT SCHEDULES
(a)The following documents are filed as part of this Report:
1. | Financial Statements: The consolidated financial statements required to be filed in this Annual Report on Form 10-K are listed below and appear on pages 46 through 79 herein: |
INDEX TO CONSOLIDATED FINANCIAL STATEMENTS
2. | Financial Statement Schedule: Schedule II—Valuation and Qualifying Accounts is included in this Annual Report on Form 10-K on page 80. All other schedules are omitted because of the absence of conditions under which they are required or because information called for is shown in the consolidated financial statements and notes thereto in Item 8. Financial Statements and Supplementary Data of this Annual Report on Form 10-K. |
3. | Exhibits: |
See Index of Exhibits below for a list of the exhibits being filed or furnished with or incorporated by reference to this Annual Report on Form 10-K.
INDEX OF EXHIBITS
Exhibit Number | Exhibit Description | |
2.1 | ||
2.1A | ||
3.1 | ||
3.2 | ||
3.3 | ||
3.4 | ||
85
3.5 | ||
3.6 | ||
3.7 | ||
4.1 | ||
4.2 | ||
10.1 | ||
10.1A | ||
10.1B | ||
10.1C | ||
10.1D | ||
10.2 | ||
10.3 | ||
10.4 | ||
10.5 | ||
10.5A | ||
86
10.5B | ||
10.5C | ||
10.5D | ||
10.5E | ||
10.5F | ||
10.5G | ||
10.5H | ||
10.5I | ||
10.5J | ||
10.5K | ||
10.5L | ||
10.5M | ||
10.5N | ||
10.5O | ||
10.5P | ||
10.5Q | ||
10.5R | ||
10.5S | ||
10.5T | ||
87
10.5U | ||
10.5V | ||
10.6 | ||
10.6A | ||
10.6B | ||
10.6C | ||
10.6D | ||
10.6E | ||
10.6F | ||
10.7 | ||
10.7A | ||
10.7B | ||
10.7C | ||
10.8 | ||
10.9 | ||
10.9A | ||
88
10.9B | ||
10.10 | ||
10.10A | ||
10.10B | ||
10.11 | ||
10.11A | ||
10.11B | ||
10.11C | ||
10.11D | ||
10.11E | ||
10.11F | ||
10.11G | ||
10.11H | ||
10.11I | ||
10.11J | ||
89
10.11K | ||
10.11L | ||
10.11M | ||
10.12 | ||
10.12A | ||
10.12B | ||
10.12C | ||
10.12D | ||
10.12E | ||
10.12F | ||
10.12G | ||
10.12H | ||
10.12I | ||
10.12J | ||
10.12K | ||
10.12L | ||
90
10.12M | ||
10.12N | ||
10.12O | ||
10.12P | ||
10.12Q | ||
10.12R | ||
10.12S | ||
10.12T | ||
10.12U | ||
10.12V | ||
10.12W | ||
10.12X | ||
10.13 | ||
10.14 | ||
10.14A | ||
10.15 | ||
10.16 | ||
91
10.17 | ||
10.17A* | ||
10.18 | ||
10.19 | ||
10.20 | ||
10.20A | ||
10.20B | ||
10.20C | ||
10.20D | ||
10.20E | ||
10.20F | ||
10.20G | ||
10.20H | ||
10.20I | ||
10.20J | ||
21.1* | ||
23.1* | ||
92
31.1* | ||
31.2* | ||
32.1* | ||
32.2* | ||
101* | The following materials from John Bean Technologies Corporation’s Annual Report on Form 10-K for the year ended December 31, 2017, formatted in XBRL (eXtensible Business Reporting Language): (i) Consolidated Statements of Income, (ii) Consolidated Balance Sheets, (iii) Consolidated Statements of Cash Flows, and (iv) Notes to Consolidated Financial Statements. | |
1 | A management contract or compensatory plan required to be filed with this report. | |
* | Filed herewith | |
93
ITEM 16. FORM 10-K SUMMARY
None.
SIGNATURES
Pursuant to the requirements of Section 13 or 15(d) of the Securities Exchange Act of 1934, the registrant has duly caused this report to be signed on its behalf by the undersigned, thereunto duly authorized.
John Bean Technologies Corporation | ||
(Registrant) | ||
By: | /s/ THOMAS W. GIACOMINI | |
Thomas W. Giacomini | ||
President and Chief Executive Officer | ||
(Principal Executive Officer) | ||
Date: February 28, 2018
Pursuant to the requirements of the Securities Exchange Act of 1934, this report has been signed below by the following persons on behalf of the registrant and in the capacities and on the date indicated.
94
Signature | Title | Date | ||
/s/ THOMAS W. GIACOMINI | President, Director and | February 28, 2018 | ||
Chief Executive Officer | ||||
Thomas W. Giacomini | (Principal Executive Officer) | |||
/s/ Brian A. Deck | Executive Vice President and | February 28, 2018 | ||
Chief Financial Officer | ||||
Brian A. Deck | (Principal Financial Officer) | |||
/s/ MEGAN J. Rattigan | Vice President and Controller | February 28, 2018 | ||
(Principal Accounting Officer) | ||||
Megan J. Rattigan | ||||
/s/ C. MAURY DEVINE | Director | February 28, 2018 | ||
C. Maury Devine | ||||
/s/ EDWARD L. DOHENY, II | Director | February 28, 2018 | ||
Edward L. Doheny, II | ||||
/s/ ALAN D. FELDMAN | Director | February 28, 2018 | ||
Alan D. Feldman | ||||
/s/ JAMES E. GOODWIN | Director | February 28, 2018 | ||
James E. Goodwin | ||||
/s/ POLLY B. KAWALEK | Director | February 28, 2018 | ||
Polly B. Kawalek | ||||
/s/ JAMES M. RINGLER | Director | February 28, 2018 | ||
James M. Ringler | ||||
95