Attached files
| file | filename |
|---|---|
| EX-31.1 - EXHIBIT 31.1 - GENERAL CABLE CORP /DE/ | bgc-20171231_ex311.htm |
| EX-32.1 - EXHIBIT 32.1 - GENERAL CABLE CORP /DE/ | bgc-20171231_ex321.htm |
| EX-31.2 - EXHIBIT 31.2 - GENERAL CABLE CORP /DE/ | bgc-20171231_ex312.htm |
| EX-24.1 - EXHIBIT 24.1 - GENERAL CABLE CORP /DE/ | bgc-20171231_ex241.htm |
| EX-23.1 - EXHIBIT 23.1 - GENERAL CABLE CORP /DE/ | bgc-20171231_ex231.htm |
| EX-21.1 - EXHIBIT 21.1 - GENERAL CABLE CORP /DE/ | bgc-20171231_ex211.htm |
| EX-12.1 - EXHIBIT 12.1 - GENERAL CABLE CORP /DE/ | bgc-20171231_ex121.htm |
UNITED STATES SECURITIES AND EXCHANGE COMMISSION
Washington, D.C. 20549
FORM 10-K
(Mark One)
þ | ANNUAL REPORT PURSUANT TO SECTION 13 OR 15(d) OF THE SECURITIES EXCHANGE ACT OF 1934 | |
For the fiscal year ended December 31, 2017
OR
o | TRANSITION REPORT PURSUANT TO SECTION 13 OR 15(d) OF THE SECURITIES EXCHANGE ACT OF 1934 | |
For the transition period from to .
Commission file number: 1-12983
GENERAL CABLE CORPORATION
(Exact name of registrant as specified in its charter)
Delaware | 06-1398235 | |
(State or other jurisdiction of | (I.R.S. Employer Identification No.) | |
incorporation or organization) | ||
4 Tesseneer Drive | 41076-9753 | |
Highland Heights, KY | (Zip Code) | |
(Address of principal executive offices) | ||
Registrant’s telephone number, including area code: (859) 572-8000
Securities Registered Pursuant to Section 12(b) of the Act:
Title of each class | Name of each exchange on which registered | |
Common Stock, $.01 Par Value | New York Stock Exchange | |
Securities Registered Pursuant to Section 12(g) of the Act: None
Indicate by check mark if the registrant is a well-known seasoned issuer, as defined in Rule 405 of the Securities Act. Yes þ No o
Indicate by check mark if the registrant is not required to file reports pursuant to Section 13 or Section 15(d) of the Act. Yes o No þ
Indicate by check mark whether the registrant (1) has filed all reports required to be filed by Section 13 or 15(d) of the Securities Exchange Act of 1934 during the preceding 12 months (or for such shorter period that the registrant was required to file such reports), and (2) has been subject to such filing requirements for the past 90 days. Yes þ No o
Indicate by check mark whether the registrant has submitted electronically and posted on its corporate Web site, if any, every Interactive Data File required to be submitted and posted pursuant to Rule 405 of Regulation S-T (§ 232.405 of this chapter) during the preceding 12 months (or for such shorter period that the registrant was required to submit and post such files). Yes þ No o
Indicate by check mark if disclosure of delinquent filers pursuant to Item 405 of Regulation of S-K (§229.405 of this chapter) is not contained herein, and will not be contained, to the best of the registrant’s knowledge, in definitive proxy or information statements incorporated by reference in Part III of this Form 10-K or any amendment to this Form 10-K. þ
Indicate by check mark whether the registrant is a large accelerated filer, an accelerated filer, a non-accelerated filer, a smaller reporting company, or an emerging growth company. See the definitions of “large accelerated filer,” “accelerated filer," “smaller reporting company,” and "emerging growth company" in Rule 12b-2 of the Exchange Act.
Large accelerated filer þ | Accelerated filer o | |
Non-accelerated filer o (Do not check if a smaller reporting company) | Smaller reporting company o | |
Emerging growth company o | ||
If an emerging growth company, indicate by check mark if the registrant has elected not to use the extended transition period for complying with any new or revised financial accounting standards provided pursuant to Section 13(a) of the Exchange Act. o
Indicate by check mark whether the registrant is a shell company (as defined in Rule 12b-2 of the Act). Yes o No þ
The aggregate market value of the registrant’s Common Stock held by non-affiliates of the registrant was $799.5 million at June 30, 2017 (based upon non-affiliate holdings of 48,896,572 shares and a market price of $16.35 per share).
As of February 20, 2018 there were 50,627,503 shares of the registrant’s Common Stock outstanding.
GENERAL CABLE CORPORATION AND SUBSIDIARIES
INDEX TO ANNUAL REPORT
ON FORM 10-K
PAGE | |
2
PART I.
ITEM 1. | BUSINESS |
General Cable Corporation ("the Company") is a global leader in the development, design, manufacture, marketing and distribution of copper, aluminum and fiber optic wire and cable products for use in the energy, industrial, construction, automotive, specialty and communications markets. The Company additionally engages in the design, integration, and installation on a turn-key basis for products such as high and extra-high voltage terrestrial and submarine systems.
On December 3, 2017, the Company entered into an Agreement and Plan of Merger (the “Merger Agreement”), among the Company, Prysmian S.p.A., a company organized under the laws of the Republic of Italy (“Parent”), and Alisea Corp., a Delaware corporation and a wholly-owned subsidiary of Parent (“Merger Sub”), providing for the merger of Merger Sub with and into the Company (the “Merger”), with the Company surviving the Merger as a wholly owned subsidiary of Parent. Subject to the terms and conditions of the Merger Agreement, at the effective time of the Merger (the “Effective Time”), each issued and outstanding share of common stock of the Company (each, a “Share”), except for certain excluded shares, will automatically be canceled and converted into the right to receive $30.00 in cash, without interest (the “Merger Consideration”). See Note 3 - Merger Agreement with Prysmian S.p.A. for additional details.
The Company remains committed to executing the guiding principles set forth by the Company as follows:
• | Executing the implementation of the Company's strategy to deliver increased operating income margins and returns from the Company's core strategic operations in North America, Latin America and Europe by leveraging economies of scale and capitalizing on the Company's leading positions across key markets where the Company has built long-standing customer relationships, efficient supply chains and a wide range of product offerings; |
• | Capitalizing on the Company's leading market positions to benefit from key end markets, such as electric utility, industrial and communications; |
• | Strengthening and expanding customer relationships by providing high quality product lines and customer service; |
• | Continuing to increase cash flow through operational excellence by leveraging the Company's operating systems, logistical expertise, Lean Six Sigma manufacturing tools and techniques to improve the Company's cost position to increase margins and delivering improved returns through restructuring initiatives; |
• | Managing the Company's product portfolio by pursuing market share in faster growing and value added product lines; |
• | Enhancing organization capabilities by leveraging the Company's diversity and intellectual property through the sharing of best practices across the organization; and |
• | Cultivating a high performance culture with focus on operational execution, compliance, sustainability, safety, and innovation. |
By operating under these guiding principles, the Company has been able to build a strong market position in the areas in which it competes. These guiding principles are the foundation of the Company's strategic roadmap developed in 2015 that focuses on optimization of the portfolio, developing leading cost and efficiency positions, growth through innovation and cultivation of a high-performance culture. The Company achieved significant progress in the execution of the strategic roadmap designed to transform the Company into a more focused, efficient and innovative organization. While the Company is benefiting from these significant operational and financial performance improvements, current dynamics in the industry are partially offsetting those accomplishments.
The Company considers its key performance indicators to be volume, as measured in metal pounds sold, operating income, net income, adjusted operating income, earnings before interest, taxes, depreciation and amortization ("EBITDA"), earnings per share, operating cash flows, cash conversion, working capital efficiency and returns on capital employed and invested capital.
The Company is a Delaware corporation and was incorporated in 1994. The Company and its predecessors have served various wire and cable markets for over 150 years. The Company's immediate predecessor was a unit of American Premier Underwriters, Inc. (“American Premier”), previously known as The Penn Central Corporation. American Premier acquired the Company's existing wire and cable business in 1981. In 1994, a subsidiary of Wassall PLC acquired the predecessor by purchase of General Cable's outstanding subordinated promissory note, the General Cable common stock held by American Premier and a tender offer for the publicly-held General Cable common stock. In 1997, Wassall consummated public offerings for the sale of all of its interest in General Cable's common stock. The Company has operated as an independent public company since completion of the offerings and its common stock is traded on the New York Stock Exchange under the ticker symbol, BGC.
For purposes of this report, unless the context otherwise requires, all references herein to the “Company,” “General Cable,” “we,” “us,” and “our” shall refer to General Cable Corporation and its subsidiaries.
3
Business Segments
The Company's operating structure is the basis for its financial reporting. The Company's four geographic operating and reportable segments are North America, Europe, Latin America, and Africa/Asia Pacific. Additional financial information regarding the segments appears in Note 18 - Segment Information.
North America
The North America segment engages in the development, design, manufacture, marketing and distribution of copper, aluminum and fiber optic wire and cable products for the energy, industrial, construction, specialty and communications markets as well as manufacture and distribution of rod mill wire and cable products primarily in the United States and Canada. The North America segment contributed approximately 58%, 53% and 51% of the Company’s consolidated revenues for 2017, 2016 and 2015, respectively.
The North America segment primarily consists of 17 manufacturing facilities across the region. In 2017, the Company has continued to execute its restructuring programs in North America.
Additionally, the North America segment has regional centers of excellence and state-of-the-art laboratories for technical expertise and innovation in material technology and compounding, electrical testing, data cables, and specialty and military cables.
Europe
The Europe segment engages in the development, design, manufacture, marketing and distribution of copper, aluminum and fiber optic wire and cable products for the energy, industrial, construction, specialty and communications markets with operations in France, Germany, Norway, Portugal and Spain, and sells into markets throughout Europe, Latin America, Africa, Asia and North America. Additionally, the Europe segment engages in the design, integration, and installation on a turn-key basis of products such as high and extra-high voltage terrestrial and submarine power and communication systems around the world. The Europe segment contributed approximately 23%, 23% and 21% of the Company’s consolidated revenues for 2017, 2016 and 2015, respectively.
The Europe segment primarily consists of 6 manufacturing facilities across the region. In 2017, the Company has continued to execute its restructuring programs in Europe. The Europe segment has regional centers of excellence and state-of-the-art laboratories for high and extra-high voltage power cables and systems, submarine power and communications systems, and halogen-free flame retardant technology and compounding.
Latin America
The Latin America segment engages in the development, design, manufacture, marketing and distribution of copper and aluminum wire and cable products for use in the energy, industrial, construction, specialty and communications markets as well as manufacture and distribution of rod mill wire and cable products. The principal Latin America operations are located in Brazil, Chile, Colombia, Costa Rica and Mexico. The Latin America segment contributed approximately 17%, 17% and 16% of the Company’s consolidated revenues in 2017, 2016 and 2015, respectively.
The Latin America segment primarily consists of 6 manufacturing facilities across the region. In 2017, the Company has continued to execute its restructuring programs in Latin America. The Latin America segment has regional centers of excellence and state-of-the-art laboratories for rod fabrication and drawing.
4
Africa/Asia Pacific
The Africa/Asia Pacific segment engages in the development, design, manufacture, marketing and distribution of copper and aluminum wire and cable products for use in the energy, industrial, construction, specialty and communications markets as well as manufacture and distribution of rod mill wire and cable products. The Africa/Asia Pacific manufacturing operations are primarily located in Angola. The Africa/Asia Pacific segment contributed approximately 2%, 7% and 12% of the Company’s consolidated revenues in 2017, 2016 and 2015, respectively.
The Africa/Asia Pacific segment primarily consists of 1 manufacturing facility across the region. In October 2014, the Company announced the intent to divest all of its operations in Asia Pacific and Africa. As part of the October 2014 announcement, the Company completed the following as of December 31, 2017:
Entity | Sale / Closure | Sale / Closure Date | ||
General Cable New Zealand Limited ("New Zealand") | Closure | Fourth Quarter 2017 | ||
General Cable (Tianjin) Alloy Products Company Limited ("China") | Sale | Third Quarter 2017 | ||
Entreprise des Industries du Cable de Biskra SPA ("Algeria") - 70% interest | Sale | Second Quarter 2017 | ||
General Cable Australia Pty. Ltd. ("Australia") | Closure | Second Quarter 2017 | ||
Pakistan Cables Limited ("Pakistan") - 24.6% interest | Sale | First Quarter 2017 | ||
General Cable Phoenix South Africa Pty. Ltd. (" South Africa - Durban") | Closure | Fourth Quarter 2016 | ||
National Cables (Pty) Ltd. ("South Africa - National Cables") | Closure | Fourth Quarter 2016 | ||
Metal Fabricators of Zambia PLC ("Zambia") - 75.39% interest | Sale | Third Quarter 2016 | ||
General Cable S.A.E. ("Egypt") | Sale | Second Quarter 2016 | ||
General Cable Energy India Private Ltd. ("India") | Sale | First Quarter 2016 | ||
Phelps Dodge International Thailand ("Thailand") - 75.47% interest | Sale | Third Quarter 2015 | ||
Dominion Wire and Cables ("Fiji") - 51% interest | Sale | First Quarter 2015 | ||
Keystone Electric Wire and Cable ("Keystone") - 20% interest | Sale | First Quarter 2015 | ||
Phelps Dodge International Philippines, Inc. ("PDP") - 60% interest | Sale | Fourth Quarter 2014 | ||
Phelps Dodge Philippines Energy Products Corp (“PDEP”) | Sale | Fourth Quarter 2014 | ||
5
Products
The Company serves its customers through a network of manufacturing facilities with worldwide sales representation and distribution. The Company believes it has one of the most diversified product lines in the industry to meet customers' needs. Revenue by product line and geographic region is included in Note 18 - Segment Information. The majority of products sold by the Company's four segments include the following:
Product Category | Principal Products | Principal Markets | Principal End-Users |
Electric Utility | - low- and medium-voltage distribution cables - high- and extra-high-voltage underground transmission cables and installation - bare overhead conductors - submarine transmission and distribution cables | - electric utilities | - investor-owned utility companies - government-owned and state and local public power companies - contractors |
Electrical Infrastructure | - rubber- and plastic-jacketed wire and cables - low- and medium-voltage industrial power cables - cable wire harnesses - rail and mass transit cables - shipboard cables - oil and gas cables - armored mining cables - alternative energy power generation cables | - power generating stations; solar, nuclear and wind applications - industrial applications; marine, mining, oil and gas, transit, machine builders and entertainment - automotive - military - infrastructure - industrial power and control - medical | - industrial consumers - contractors - electrical distributors - electrical retailers - OEM (original equipment manufacturers) - DIY (do-it-yourself customers) - industrial equipment manufacturers - military customers |
Communications | - high-bandwidth twisted copper and fiber optic cables - multi-conductor and multi-pair fiber and copper networking cables - outside plant telecommunications exchange cables - coaxial cables - fiber-optic submarine cable systems - low detection profile cables - turn-key submarine networks - offshore integration systems | - telecom local loop - enterprise networking and multimedia applications - industrial instrumentation control - commercial - residential - building management - entertainment - renewable energy | - telecommunications system operators - contractors - telecommunications distributors - system integrators - OEM - DIY |
Construction | - construction cable - flexible cords; halogen-free, low-smoke and flame retardant cables | - residential and non-residential construction | - retail home centers - electricians - distributors - installation and engineering contractors - DIY |
Rod Mill | - copper rod - aluminum rod | - wire and cable industry | - wire and cable manufacturers |
Industry and Market Overview
The Company produces and sells to a variety of end markets including markets for electric utility, electrical infrastructure, communications, construction and rod mill products. The underlying growth drivers in each of these end markets are similar and dependent on healthy GDP rates and construction cycles. Additionally, the global electric utility industry is dependent on a variety of factors including electricity consumption and grid integration, housing and construction, including the urbanization of emerging economies, governmental energy and tax policy, the investment policies of electric utilities, as well as renewable energy initiatives primarily related to wind and solar power. The market for electrical infrastructure cable products has many sub-sectors and niches and is heavily influenced by the level of industrial construction spending, the level of capital equipment investment and transit, marine, and mining activity as well as renewable energy initiatives primarily related to terrestrial and offshore drilling. The market for communications products is primarily influenced by residential and non-residential construction and fiber-to-the-home initiatives as well as the level of broadband investments. The market demand for construction products is heavily influenced by the level of residential and non-residential construction spending. Rod mill product demand is principally driven by fundamental demand stemming from economic growth and development.
6
Customers
The Company has a regionally coordinated direct sales force and in certain of its businesses operates under supply agreements of varying lengths. These agreements generally do not require a minimum level of sales and customers are not contractually obligated to buy the Company's products exclusively; however, these agreements generally provide adjustments to selling prices to reflect fluctuations in the cost of raw materials and typically have one to four year terms. The primary agreements are strategic alliances with a number of major utility customers and respective markets. The Company sells direct to utilities, independent distributors, retailers, contractors, and OEMs.
Raw Materials
The principal raw materials used by the Company in the manufacturing of its wire and cable products are copper and aluminum. The Company's products are material intensive with copper and aluminum comprising the major cost components for cable products. At current metal prices, material costs are approximately 85% of total product costs with copper and aluminum metal costs comprising approximately 50% of total product costs for the year ended December 31, 2017. The average price of copper and aluminum based on the London Metal Exchange (“LME”) and Commodity Exchange, Inc ("COMEX") per quarter for the last three years is:
Quarter 1 | Quarter 2 | Quarter 3 | Quarter 4 | Full Year | |
Copper Cathode | |||||
2017 | $2.65 | $2.58 | $2.89 | $3.10 | $2.80 |
2016 | 2.11 | 2.13 | 2.16 | 2.39 | 2.20 |
2015 | 2.66 | 2.77 | 2.40 | 2.20 | 2.51 |
Aluminum | |||||
2017 | 0.94 | 0.96 | 0.99 | 1.05 | 0.98 |
2016 | 0.77 | 0.79 | 0.80 | 0.85 | 0.80 |
2015 | 1.04 | 0.92 | 0.80 | 0.76 | 0.88 |
The price of copper and aluminum as traded on the LME and COMEX has historically been subject to considerable volatility. Volatility in the price of copper and aluminum and other raw materials, as well as fuel and energy, may in turn lead to significant fluctuations in our cost of sales or revenues. A significant portion of the Company's electric utility and telecommunications business and, to a lesser extent, the Company's electrical infrastructure business has metal escalators and de-escalators included in customer contracts under a variety of price setting and recovery formulas. The remainder of the Company's business requires that volatility in the cost of metals be recovered through negotiated price changes with customers. In these instances, the ability to change the Company's selling prices may lag the movement in metal prices by a period of time as the customer price changes are implemented.
Therefore, in the short-term, during periods of escalating raw material cost inputs, to the extent the Company is able to increase prices in the market to recover the higher raw material costs, the Company will generally experience an increase in gross profit from the sale of its relatively lower value inventory as computed under the weighted average inventory costing method. If the Company is unable to increase prices with the rise in the raw material market prices due to low levels of demand or market dynamics, the Company will experience lower gross profit. Conversely, during periods of declining raw material cost inputs, to the extent the Company has to decrease prices in the market due to competitive pressure as the current cost of metals declines, the Company will generally experience downward pressure on its gross profit due to the sale of relatively higher value inventory as computed under the weighted average inventory costing method. If the Company is able to maintain price levels in an environment in which raw material prices are declining due to high levels of demand, the Company will experience higher gross profit. There is no exact future measure of the effect to the Company's profitability of the change of raw material cost inputs due to the unique set of selling variables and the high volume of transactions in any given period, each of which involves numerous individual pricing decisions. In 2017, if there were a 10% increase in copper and aluminum costs, then our cost of sales would have increased approximately $171 million. The impact of this would directly impact gross profit if the Company was unable to increase prices with the rise in the price of copper and aluminum. To help reduce this volatility, the Company has implemented various pricing mechanisms and hedges a portion of its metal purchases when there is a firm price commitment for a future delivery but does not engage in speculative metals trading.
The Company purchases copper and aluminum from various global sources, generally through annual supply agreements. These agreements do not contractually obligate the Company to purchase products exclusively, or require the Company to purchase products for a significant period of time. Copper and aluminum raw material supply is available from many sources and supply is generally expected to remain adequate for the Company's requirements, however, unanticipated problems with the Company's copper or aluminum rod suppliers could negatively affect the Company's business. The Company has centralized purchasing of its copper, aluminum and other significant raw materials to capitalize on economies of scale and to facilitate the negotiation of purchase terms from suppliers. In North America, the Company's largest supplier of copper accounted for approximately 70% of
7
its total copper purchases while the largest supplier of aluminum accounted for approximately 60% of its total aluminum purchases. In Europe, the Company's largest supplier of copper accounted for approximately 45% of its total copper purchases while the largest supplier of aluminum accounted for approximately 30% of its total aluminum purchases. In Latin America, the Company’s largest supplier of copper accounted for approximately 75% of its total copper purchases while the largest supplier of aluminum accounted for approximately 30% of its total aluminum purchases.
Other raw materials utilized by the Company include nylon, polyethylene resin and compounds and plasticizers, fluoropolymer compounds, optical fiber and a variety of filling, binding and sheathing materials. The Company believes that all of these materials are available in sufficient quantities through purchases in the open market.
Foreign Currency
The Company's results are directly influenced by fluctuations in foreign currency exchange rates. Uncertainty in the global market conditions has resulted in significant volatility in foreign currency exchange rates. This volatility results in gains / losses on transactions whose terms are denominated in a currency other than the entity's functional currency and the Company's consolidated results are influenced by the translation of the international units' results to U.S. dollars. To help reduce this volatility, the Company enters into foreign currency exchange contracts principally to hedge the currency fluctuations in certain transactions denominated in foreign currencies.
Patents and Trademarks
The Company believes that the success of its business depends more on the technical competence, creativity and marketing abilities of its employees rather than on any individual patent, trademark or copyright. Nonetheless, the Company has a policy of seeking patents when appropriate on inventions concerning new products and product improvements. The Company owns numerous patents and trademarks globally, with pending applications for additional patents and trademarks, and maintains trade secret protection for certain confidential and proprietary information.
Although in the aggregate these patents are of considerable importance to the manufacturing and marketing of many of the Company's products, the Company does not consider any single patent to be material to its business as a whole. Trademarks and trade names, which are important to the Company, are General Cable®, Anaconda® Brand, Carol® Brand, GenSPEED® Brand, NextGen® Brand, NSW® Brand, NUAL® Brand, Prestolite Wire® Brand, Silec® Brand, STABILOY® Brand and the Company's triad symbol. The Company believes that products bearing these trademarks have achieved significant brand recognition within the industry.
Seasonality
The Company generally has experienced and expects to continue to experience certain seasonal trends in many products in which demand is linked with construction spending. Demand for these products during winter months in certain geographies is usually lower than demand during spring and summer months. Therefore, larger amounts of working capital are generally required during winter months in order to build inventories in anticipation of higher demand during the spring and summer months, when construction activity increases. In turn, receivables related to higher sales activity during the spring and summer months are generally collected during the fourth quarter of the year. Additionally, the Company has historically experienced changes in demand resulting from poor or unusual weather.
Competition
The markets for all of the Company's products are highly competitive and most markets include several competitors. The degree of competition varies by operating segment and product line. However, in general, the industry is mature and cost driven. Although the primary competitive factors for the Company's products vary somewhat across the different product categories, the principal factors influencing competition include, but are not limited to, price, quality, breadth of product line, inventory, delivery time, customer service, the environmental impact of the products, and the ability to meet customers' needs.
Many of the Company's products are made to industry specifications, and are therefore functionally interchangeable with those of competitors. However, the Company believes that significant opportunities exist to differentiate all of its products on the basis of quality, consistent availability, conformance to manufacturer's specifications and customer service. The Company believes its competitive strengths include breadth of product line, brand recognition, distribution and logistics, strong customer relations, operating efficiency and commitment to quality control and continuous improvement.
Advertising Expense
Advertising expense consists of expenses to promote the Company’s products, including trade shows, catalogs, and e-commerce promotions, and is charged to expense when incurred. Advertising expense was $6.4 million, $7.9 million and $10.4 million in 2017, 2016 and 2015, respectively.
8
Environmental Matters
The Company is subject to a variety of federal, state, local and foreign laws and regulations covering the storage, handling, emission and discharge of materials into the environment, including the Comprehensive Environmental Response, Compensation and Liability Act (“CERCLA”), the Clean Water Act, the Clean Air Act (including the 1990 amendments) and the Resource Conservation and Recovery Act. While it is difficult to estimate future environmental liabilities accurately, the Company does not currently anticipate any material adverse effect on its consolidated results of operations, financial position or cash flows as a result of compliance with federal, state, local or foreign environmental laws or regulations or remediation costs of the sites as discussed in Note 19 - Commitments and Contingencies.
Employees
At December 31, 2017, General Cable employed approximately 8,500 employees worldwide. Approximately 45% of our employees were covered by collective bargaining agreements, of which approximately 40% are subject to agreements that expire within one year from December 31, 2017. The Company believes it will successfully renegotiate these contracts as they come due. Generally, labor agreements are negotiated on an annual or bi-annual basis. The Company believes that its relations with its employees are generally good.
Disclosure Regarding Forward-Looking Statements
Certain statements in the 2017 Annual Report on Form 10-K for the fiscal year ended December 31, 2017 (the "2017 Annual Report on Form 10-K") including, without limitation, statements regarding future financial results and performance, plans and objectives, the merger agreement with Prysmian, capital expenditures, understanding of competition, projected sources of cash flow, potential legal liability, proposed legislation and regulatory action, and our management's beliefs, expectations or opinions, are forward-looking statements, and as such, we desire to take advantage of the “safe harbor” which is afforded such statements under the Private Securities Litigation Reform Act of 1995. Forward-looking statements are those that predict or describe future events or trends and that do not relate solely to historical matters. Forward-looking statements can generally be identified as statements containing the words “believe,” “expect,” “may,” “could,” “anticipate,” “intend,” “should,” “estimate,” “project,” “will,” “plan,” “assume,” “seek to” or other similar expressions, although not all forward-looking statements contain these identifying words. In addition, forward-looking statements are subject to certain risks and uncertainties that could cause actual results to differ materially from those discussed in forward-looking statements as a result of factors, risks and uncertainties over many of which we have no control.
These factors, risks and uncertainties include, but are not limited to, the following: (1) the conditions to the completion of the merger may not be satisfied, or the regulatory approvals required for the merger may not be obtained on the terms expected or on the anticipated schedule; (2) the parties’ ability to meet expectations regarding the timing, completion and accounting and tax treatments of the merger; (3) the occurrence of any event, change or other circumstance that could give rise to the termination of the merger agreement between the parties to the merger; (4) the effect of the announcement or pendency of the merger on our business relationships, operating results, and business generally; (5) risks that the proposed merger disrupts our current plans and operations and potential difficulties in our employee retention as a result of the proposed merger; (6) risks related to diverting management’s attention from our ongoing business operations; (7) the outcome of any legal proceedings that may be instituted against us related to the merger or the merger agreement; (8) the amount of the costs, fees, expenses and other charges related to the merger; (9) general economic conditions, particularly those in the construction, energy and information technology sectors; (10) the volatility in the price of raw materials, particularly copper and aluminum; (11) our ability to maintain or negotiate and consummate new business or strategic relationships or transactions; (12) impairment charges with respect to our long-lived assets; (13) our ability to achieve all of our anticipated cost savings associated with our previously announced global restructuring plan; (14) our ability to invest in product development, to improve the design and performance of our products; (15) economic, political and other risks of maintaining facilities and selling products in foreign countries; (16) domestic and local country price competition; (17) the impact of technology; (18) our ability to maintain relationships with our distributors and retailers; (19) the changes in tax rates and exposure to new tax laws; (20) our ability to adapt to current and changing industry standards; (21) our ability to execute large customer contracts; (22) our ability to maintain relationships with key suppliers; (23) the impact of fluctuations in foreign currency rates; (24) compliance with foreign and U.S. laws and regulations, including the Foreign Corrupt Practices Act; (25) our ability to negotiate extensions of labor agreements; (26) our ability to continue our uncommitted accounts payable confirming arrangements; (27) our exposure to counterparty risk in our hedging arrangements; (28) our ability to achieve target returns on investments in our defined benefit plans; (29) possible future environmental liabilities and asbestos litigation; (30) our ability to attract and retain key employees; (31) our ability to make payments on our indebtedness; (32) our ability to comply with covenants in our existing or future financing agreements; (33) lowering of one or more of our debt ratings; (34) our ability to maintain adequate liquidity; (35) our ability to maintain effective disclosure controls and procedures and internal control over financial reporting; (36) the trading price of our common stock; and (37) and other material factors described in Item 1A - Risk Factors and elsewhere in this 2017 Annual Report on Form 10-K and those described from time to time in our future reports filed with the Securities and Exchange Commission (the "SEC").
9
Forward-looking statements reflect the views and assumptions of management as of the date of this report with respect to future events. The Company does not undertake, and hereby disclaims, any obligation, unless required to do so by applicable securities laws, to update any forward-looking statements as a result of new information, future events or other factors. The inclusion of any statement in this report does not constitute an admission by the Company or any other person that the events or circumstances described in such statement are material.
Available Information
The Company’s principal executive offices are located at 4 Tesseneer Drive, Highland Heights, Kentucky 41076-9753 and its telephone number is (859) 572-8000. The Company’s internet address is www.generalcable.com. General Cable’s annual report on Form 10-K, quarterly reports on Form 10-Q, current reports on Form 8-K, and amendments to those reports filed or furnished pursuant to Section 13(a) or 15(d) of the Securities Exchange Act of 1934, as amended, are made available free of charge at www.generalcable.com as soon as reasonably practicable after we electronically file such material with, or furnish it to, the SEC. In addition, the Company will provide, at no cost, paper or electronic copies of our reports and other filings made with the SEC. Requests should be directed to: Investor Relations, General Cable Corporation, 4 Tesseneer Drive, Highland Heights, KY 41076-9753.
The information on the website listed above is not and should not be considered part of this 2017 Annual Report on Form 10-K and is not incorporated by reference in this document. This website address is only intended to be an inactive textual reference.
Executive Officers of the Registrant
The following table sets forth certain information concerning the executive officers of General Cable as of February 20, 2018.
Name | Age | Position | ||
Michael T. McDonnell | 60 | President and Chief Executive Officer | ||
Matti M. Masanovich | 46 | Senior Vice President and Chief Financial Officer | ||
Shruti Singhal | 48 | Senior Vice President and President General Cable Europe | ||
Juan B. Mogollon | 57 | Senior Vice President General Cable Latin America | ||
Roberto A. Sacasa | 42 | Senior Vice President and Chief Compliance Officer | ||
Emerson C. Moser | 41 | Senior Vice President, General Counsel and Corporate Secretary | ||
Leah S. Stark | 41 | Senior Vice President and Chief Human Resources Officer | ||
Mr. McDonnell has been President and Chief Executive Officer of General Cable Corporation since July 2015. He is also a member of the Board of Directors. Mr. McDonnell has more than 25 years of experience in management and executive roles. Most recently, Mr. McDonnell was Chairman, President and Chief Executive Officer of TPC Group, a leading processor and producer of value-add products derived from petrochemicals that are sold into a wide range of performance, specialty and intermediate markets. Prior to joining TPC Group, Mr. McDonnell served as President and Chief Executive Officer of Pregis Corporation from 2006 to 2011, a leading global specialty packaging and hospital supply products company. From 2002 to 2006, Mr. McDonnell was Group Vice President, Environmental Technologies of Engelhard Corporation; and from 1998 to 2002, he was Vice President of a chemicals division for Cytec Industries, Inc. Early in his career, Mr. McDonnell held management roles with increasing levels of responsibility at Henkel Corporation and DuPont.
Mr. Masanovich has been Senior Vice President and Chief Financial Officer since November 2016. Mr. Masanovich has over 20 years of finance, accounting and operations experience across large, international manufacturing companies. Prior to joining General Cable, Mr. Masanovich served as Vice President, Finance and Corporate Controller of International Automotive Components Group North America, LLC, a privately held global automotive interior, exterior and systems components supplier. From 2011 to 2016, Mr. Masanovich was employed by Delphi Automotive PLC, a publicly held global vehicle components manufacturer and provider of electrical and electronic, powertrain and safety technology solutions to the global automotive and commercial vehicle markets, where he served as Vice President, Finance, Packard Electrical and Electronic Architecture Division from 2013 to 2016 and as Vice President and Chief Audit Executive from 2011 to 2013. From 2010 to 2011, Mr. Masanovich was Senior Vice President, Controller and Chief Accounting Officer at Pro-Build Holdings, Inc., a privately held supplier of lumber and building materials to professional builders and contractors in the United States. Prior to 2010, Mr. Masanovich served in various executive accounting positions with both public and private companies. Mr. Masanovich began his career in public accounting at Coopers & Lybrand (from 1994 to 1997) and PricewaterhouseCoopers LLP (from 1997 to 2001).
Mr. Singhal has been Senior Vice President and President General Cable Europe since February 2017. Mr. Singhal has more than 20 years of extensive and progressive leadership experience across multiple industries and geographies. From 2014 to 2017, prior to joining General Cable, Mr. Singhal served as the Vice President and General Manager for Solenis, a manufacturer of specialty chemicals for the global pulp, paper and industrial water treatment markets. Mr. Singhal was Global Vice President-Construction
10
Specialties from 2012 to 2014 and Senior Global Marketing Director-Coatings & Biocides from 2011 to 2012 at Ashland Global Holdings Inc., a global specialty chemicals company serving adhesives, architectural coatings, automotive, construction, energy, food and beverage, personal care and pharmaceutical markets. Prior to 2011, Mr. Singhal held a variety of leadership roles of increasing responsibility at multinational companies including Rohm and Haas (now The Dow Chemical Company) from 2006 to 2011 and Henkel and Cognis (now BASF Group) from 1993 to 2006.
Mr. Mogollon has been Senior Vice President of General Cable Latin America since August 2016. Mr. Mogollon has more than 25 years of experience across multiple industry segments in mature and emerging markets. Prior to joining General Cable, from 2012 to 2016, Mr. Mogollon served as President of the Growth Markets business at Tyco International, a publicly held global provider of security products and services, fire detection and suppression products and services and life safety products. From 2010 to 2012, Mr. Mogollon was Vice President of Global Operations at Tyco Security Services, a global provider of security equipment and services. Prior to 2010, Mr. Mogollon served in various global leadership positions at United Technology Corporation and General Electric.
Mr. Sacasa has been Senior Vice President and Chief Compliance Officer since August 2016, and has been with General Cable since March 2015. Mr. Sacasa has more than 17 years of experience conducting investigations and providing forensic accounting and auditing services in both the public and private sectors. Prior to joining General Cable, from 2004 to 2012 and again from 2014 to 2015, Mr. Sacasa held various roles of increasing responsibility with PricewaterhouseCoopers, a multinational professional services network, ultimately culminating as a Director in the Forensic Services practice. From 2012 to 2014, Mr. Sacasa led the Forensic Audit team at PPG Industries, Inc. a publicly held global supplier of paints, coatings, optical products, specialty materials, and fiber glass. Prior to joining PricewaterhouseCoopers, Mr. Sacasa served as an Officer in the U.S. Coast Guard and as a Senior Financial Investigator with the Florida Office of Financial Regulation.
Mr. Moser has been Senior Vice President, General Counsel and Corporate Secretary since January 2015. Mr. Moser joined General Cable in September 2008 as Assistant General Counsel and Assistant Corporate Secretary. He subsequently was promoted to Vice President in March 2013 and served as the interim General Counsel from July 2014 through his current appointment. Before joining General Cable, Mr. Moser was in private practice with the law firm, Dinsmore & Shohl LLP, and then served as Assistant General Counsel of NIBCO, INC., an international manufacturer of flow control products for use in industrial, commercial and residential construction markets.
Ms. Stark has been Senior Vice President and the Chief Human Resources Officer since July 2016. Ms. Stark has extensive and progressive human resources experience across multiple industries and geographies. Prior to joining General Cable, from 2006 to 2016, Ms. Stark held various human resources leadership roles of increasing responsibility in M&A, talent, and human resources business partnership at Whirlpool Corporation, a publicly held global manufacturer of major home appliances, and most recently served as the Human Resources leader for Greater China, KitchenAid’s global business, and global functions. Prior to 2006, Ms. Stark served in various human resources and labor relations positions at Schneider National and General Mills, Inc., a publicly held global manufacturer and marketer of branded consumer foods sold through retail stores and a leading supplier of branded and unbranded food products to the North American foodservice and commercial baking industries.
ITEM 1A. RISK FACTORS
We are subject to a number of risks listed below, which could have a material adverse effect on our financial condition, results of operations and the value of our securities.
Certain statements in the 2017 Annual Report on Form 10-K including, without limitation, statements regarding future financial results and performance, plans and objectives, the Merger Agreement with Parent, capital expenditures, understanding of competition, projected sources of cash flow, potential legal liability, proposed legislation and regulatory action, and our management's beliefs, expectations or opinions, are forward-looking statements, and as such, we desire to take advantage of the “safe harbor” which is afforded such statements under the Private Securities Litigation Reform Act of 1995. Our forward-looking statements should be read in conjunction with our comments in this report under the heading, “Disclosure Regarding Forward-Looking Statements.” Actual results may differ materially from those statements as a result of factors, risks and uncertainties over which we have no control. These risks and uncertainties are not the only ones we face. Additional risks and uncertainties not presently known to us or that we currently believe to be immaterial may also impair our business or adversely affect our financial condition or results of operations.
• | The Company will be subject to business uncertainties and contractual restrictions while the Merger is pending that could adversely affect our business, financial condition and results of operations. |
Whether or not the Merger is ultimately consummated, as a result of uncertainty about the effect of the Merger on our employees, customers, and other parties, risks relating to the impact of the announcement and pendency of the Merger on our business include the following, all of which could be exacerbated by a delay in the completion of the Merger:
11
• | diversion of significant management time and resources towards the completion of the Merger; |
• | impairment of our ability to attract, retain and motivate our employees, including key personnel; |
• | difficulties in maintaining or negotiating and consummating new business or strategic relationships or transactions with customers, suppliers and other business partners; |
• | delays or deferments of certain business decisions by our customers, suppliers and other business partners; |
• | vendors and others that deal with us seeking to change, terminating or failing to extend existing business relationships with us; |
• | inability to pursue alternative business opportunities or make appropriate changes to our business because the Merger Agreement with Parent restricts our ability to take certain actions prior to the completion of the Merger; |
• | litigation relating to the Merger and the costs related thereto; and |
• | incurrence of significant costs, expenses, and fees for professional services and other transaction costs in connection with the Merger. |
If we are unable to mitigate these or other potential risks related to the Merger, it may disrupt our business or could have a material adverse effect on our results of operations and liquidity in future periods.
• | Completion of the Merger with Parent is subject to certain closing conditions, some of which are outside of the parties’ control, and if these conditions are not satisfied or waived, the Merger will not be completed. |
Consummation of the Merger is subject to the satisfaction or waiver of specified closing conditions, including (i) the adoption of the Merger Agreement by the holders of a majority of the outstanding shares entitled to vote on such matter at a meeting of the holders of Shares duly called and held for such purpose, (ii) the expiration or termination of the applicable waiting period under the Hart-Scott-Rodino Antitrust Improvements Act of 1976, (iii) the adoption of a decision by the European Commission pursuant to Regulation (EC) 139/2004 of the European Union declaring that the Merger is compatible with the internal market, (iv) the approval by certain other requisite governmental regulators and authorities, (v) a thirty-day period beginning on the date the Company provides written notice to the DOJ of the Merger in accordance with the DOJ Agreement, will have expired and the DOJ Agreement will remain in full force and effect, and (vi) other customary closing conditions, including (a) the absence of any law or order prohibiting the Merger or the other transactions contemplated by the Merger Agreement, (b) the accuracy of each party’s representations and warranties (subject to customary materiality qualifiers) and (c) each party’s performance of its obligations and covenants contained in the Merger Agreement. The satisfaction of the required conditions could delay the completion of the Merger. Further, there can be no assurance that the conditions to the closing of the Merger will be satisfied or waived in a timely manner or at all, or that other events will not intervene to delay or result in the failure to consummate the Merger.
• | Failure to complete the Merger could negatively impact our business, financial condition and results of operations and/or the trading price of our common stock. |
There can be no assurance that the Merger will occur. If the Merger is not completed for any reason, the market price of our common stock may decline to the extent that the current market price of our common stock reflects a market assumption that there is a high probability that the Merger will be completed. Additionally, if the Merger is not completed, we will have incurred significant costs, as well as the diversion of the time and attention of management, for which we will have received little or no benefit. A failure to complete the Merger may also result in negative publicity, litigation against the Company or our directors and officers, and a negative impression of us in the investment and business community and among our customers, suppliers and other business partners. The occurrence of any of these events individually or in combination could have a material adverse effect on our financial condition, results of operations and our stock price.
On January 2, 2018, a purported stockholder of the Company filed an action against the Company and the members of the Company’s board of directors on behalf of a putative class of stockholders of the Company in the United States District Court for the District of Delaware, captioned Stanfield v. General Cable Corp., No. 1:18-cv-00006-UNA (D. Del.), and on January 9, 2018, a purported stockholder of the Company filed a substantively similar action against the Company, Parent, Merger Sub and the members of the Company’s board of directors in the United States District Court for the Eastern District of Kentucky, captioned Rosenblatt v. General Cable Corp., No. 2:18-cv-00010-WOB-CJS (E.D. Ky.), in each case seeking, among other things, to enjoin the completion of the Merger. Other lawsuits may be brought against us related to the Merger. If these actions or similar actions that may be brought are successful, the Merger could be delayed or prevented.
12
Further, if the Merger with Parent is not completed on or before June 3, 2018 (subject to certain extension rights), we or Parent may choose not to proceed with the Merger. We or Parent may also terminate the Merger Agreement under other circumstances as provided by the Merger Agreement, and in certain specified circumstances upon termination of the Merger Agreement we will be required to pay Parent a termination fee of $47 million. If we are required to make this payment, doing so may materially adversely affect our business, financial condition and results of operations.
• | Our net sales, net income and growth depend largely on the economic strength of the geographic markets that we serve, and if these markets become weaker, we could experience decreased sales and net income. |
Many of our customers use our products as components in their own products or in projects undertaken for their customers. Our ability to sell our products is largely dependent on general economic conditions, including end user spending on power transmission and distribution infrastructures, industrial manufacturing assets, new construction and building, information technology and maintaining or reconfiguring their communications networks. In periods of negative or no economic growth, we would likely experience a decrease in sales and net income.
• | Volatility in the price of copper and aluminum and other raw materials, as well as fuel and energy, could adversely affect our businesses. |
The costs of copper and aluminum, the most significant raw materials we use, have been subject to considerable volatility caused by supply conditions, weather, political and economic variables as well as other unknown and unpredictable variables. Other raw materials such as fuel and energy have additionally been subject to considerable volatility.
We typically pass these changes in copper and aluminum prices along to our customers, although there are timing delays of varying lengths depending upon the volatility of metals prices, the type of product, competitive conditions, pricing mechanisms and particular customer arrangements. Although the general trends are detailed in Item 1 - Business – Raw Materials, there is no exact future measure of the effect of the change of raw material cost inputs due to the unique set of selling variables and the high volume of transactions in any given period, each of which involves numerous individual pricing decisions.
In addition, we may be required to recognize an expense to record our inventory at market value, which would negatively impact our financial results. Although we attempt to recover copper and aluminum and other raw material price changes either in the selling price of our products or through commodity hedging programs, there is no assurance that we can do so successfully or at all in the future.
• | We have recently recorded impairment charges with respect to certain of our long-lived assets as a result of our restructuring programs and market and industry conditions, and we could recognize additional impairment charges for our long-lived assets in the future. |
As of December 31, 2017, property, plant and equipment, goodwill and other intangible assets account for approximately $564.6 million, or 25% of our total assets. In accordance with accounting principles generally accepted in the United States of America ("GAAP"), we periodically assess our long-lived assets to determine if they are impaired. The testing for impairment is based on assumptions regarding our future business outlook as well as other factors. While we continue to review and analyze many factors that can impact our business, such as industry and economic trends, our analyses are subjective and are based on conditions existing at and trends leading up to the time the assumptions are made. Actual results could differ materially from these assumptions particularly in the event of disruptions to our business, unexpected significant changes or planned changes in the use of assets or divestitures or expropriations of assets.
Future impairment charges could significantly affect our results of operations in the period recognized.
• | We may not be able to achieve all of our anticipated cost savings associated with our global restructuring plans. |
The Company committed to a strategic roadmap focused on growth and optimization of the portfolio, developing leading cost and efficiency positions, growth through innovation and cultivation of a high-performance culture. Although we have identified key initiatives, the program will take time and management effort to execute and implement changes.
Restructuring programs are expected to create ongoing annual savings. We may not achieve the full amount of expected cost savings, or it may take us longer to achieve them than we currently anticipate. In addition, other unexpected costs could offset any savings we achieve. Our failure to achieve our anticipated annual cost savings could have a material adverse effect on our results of operations in future periods.
• | The markets for our products are highly competitive, and if we fail to successfully invest in product development, productivity improvements and customer service and support, sales of our products could be adversely affected. |
The markets for copper, aluminum and fiber optic wire and cable products are highly competitive and some of our competitors may have greater financial resources than we have. We compete with at least one major competitor with respect to each of our business segments. Many of our products are made to common specifications and, therefore, may be interchangeable with
13
competitors' products. Accordingly, we are subject to competition in many markets on the basis of price, quality, breadth of product line, inventory, delivery time, customer service, the environmental impact of our products, and the ability to meet customers' needs.
We believe the design and performance of products will improve and new products will be introduced with competitive price and performance characteristics. We expect that we will be required to continue to invest in product development, productivity improvements and customer service and support in order to compete in our markets. Furthermore, an increase in imports of competing products could adversely affect our sales on a region by region basis.
• | Our business is subject to the economic, political and other risks of maintaining facilities and selling products in foreign countries. |
During the year ended December 31, 2017, approximately 42% of our sales and approximately 56% of our assets were in markets outside of North America. Our operations outside of North America reported operating cash inflows of approximately $32.9 million during this period. Some of our facilities, in particular, certain locations such as Angola, among others, are at higher risk of being targets of economic and political destabilization, international conflicts, restrictive actions by foreign governments, nationalizations or expropriations, changes in regulatory requirements, the difficulty of effectively managing diverse global operations, terrorist activities, natural disasters, adverse foreign tax laws or trade agreements and the threat posed by potential pandemics in countries that do not have the resources necessary to deal with such outbreaks. Our financial results may be adversely affected by the enactment of exchange controls or foreign governmental or regulatory restrictions on the transfer of funds. In addition, negative tax consequences relating to the repatriation of certain foreign income may adversely affect our cash flows. Economic and political developments in the countries in which we have operations, including future economic changes or crises (such as inflation, currency devaluation, changes in functional currency or recession), government deadlock, political instability, political activism, terrorist activities, civil strife, international conflicts, changes in laws and regulations and expropriation or nationalization of property or other resources, could impact our operations or the market value of our common stock and have an adverse effect on our business, financial condition and results of operations.
• | In each of our markets, we face pricing pressures. Such pricing pressures could adversely affect our results of operations and financial performance. |
We face pricing pressures in each of our markets as a result of significant competition or over-capacity. In the event we are unable to implement cost reduction measures that are designed to improve our manufacturing techniques and processes, we may not achieve desired efficiency or productivity levels or reduce our manufacturing costs. In addition, productivity increases are related in part to factory utilization rates. Decreases in utilization rates may adversely impact productivity. Further pricing pressures, without offsetting cost reductions, could adversely affect our results of operations and financial performance.
• | Alternative technologies, such as fiber optic and wireless technologies, may make some of our products less competitive. |
Alternative technologies continue to have an adverse effect on elements of our business. For example, a continued increase in the rate of installations using fiber optic systems, an increase in the cost of copper-based systems, or advancing wireless technologies, as they relate to network and communications systems, may have an adverse effect on our business. While we do manufacture and sell fiber optic cables, any further acceleration in the erosion of our sales of copper cables due to increased market demand for fiber optic cables would most likely not be offset by an increase in sales of our fiber optic cables. In addition, our sales of copper premise cables currently face downward pressure from wireless and other similar technology and the increased acceptance and use of these technologies has increased this pressure and the potential negative impact on our future financial results, cash flows or financial position.
• | We are substantially dependent upon distributors and retailers for non-exclusive sales of our products and they could cease purchasing our products at any time. |
Distributors and retailers account for a material portion of our sales. These distributors and retailers are not contractually obligated to carry our product lines exclusively or for any period of time. Therefore, these distributors and retailers may purchase products that compete with our products or cease purchasing our products at any time. The loss of one or more large distributors or retailers could have a material adverse effect on our ability to bring our products to end users and on our results of operations. Moreover, a downturn in the business of one or more large distributors or retailers could adversely affect our sales and could create significant credit exposure.
• | Changes in our tax rates or exposure to new tax laws could impact our profitability. |
We are subject to income tax in the United States and in various other global jurisdictions. Our effective tax rates could be adversely affected by changes in the mix of earnings by jurisdiction and the valuation of deferred tax assets and liabilities. Our effective tax rate could also be adversely affected by changes in tax laws. The recently passed comprehensive U.S. tax reform could adversely affect our business and financial condition. On December 22, 2017, the U.S. government enacted tax legislation commonly referred to as the Tax Cuts and Jobs Act (“Tax Reform Act”). The Tax Reform Act makes substantial changes to U.S. tax law, including a reduction in the corporate tax rate from 35% to 21% beginning in 2018, deemed repatriation of foreign earnings, future limitations
14
on interest and net operating loss deductions and significant changes to the taxation of foreign earnings going forward. In addition, we are subject to audits in various jurisdictions. Although we believe that our tax estimates are reasonable and appropriate, there are significant uncertainties in these estimates and as a result of these estimates there could be material adjustments. As a result of ongoing or possible future tax audits, we may be required to pay additional taxes and/or penalties as a result of such tax audits, which could have a potential negative impact on our future financial results, cash flows and financial position.
• | Changes in industry standards and regulatory requirements may adversely affect our business. |
Our global business is subject to the requirements of federal, state, local and foreign regulatory authorities as well as industry standard-setting authorities. Changes in the standards and requirements imposed by such authorities could have an adverse effect on us. In the event that we are unable to meet any such new or modified standards when adopted, our business could be adversely affected.
In addition, changes in the legislative environment could affect the growth and other aspects of important markets served by us. The wire and cable industry growth has been partially driven by energy related legislation, including alternative and renewable energy sources, investment incentives for utilities and government infrastructure spending. We cannot predict the impact of legislative efforts or changes in laws or industry standards on our future financial results, cash flows or financial position.
• | Failure to be awarded large turn-key projects or failure to properly execute large customer projects may negatively impact our results of operations and financial performance in the future and may result in material financial penalties. |
In recent years, primarily in Europe, we have been awarded large turn-key projects for specific customers. These projects involve numerous challenges associated with large long-term contracts and the contracts related to these projects generally include material financial penalties for non-performance on our part. We actively seek to increase our market share through successful execution of contracts for medium-voltage infield array projects and high-voltage export projects as well as underground terrestrial and submarine high-voltage projects. In addition, the terrestrial and submarine transmission cable markets in Europe, which are being driven by large investments in grid interconnections and alternative energy such as offshore wind power, represent an attractive long-term opportunity for us. The successful award and execution of large turn-key projects is important to our long-term success in this market.
• | Interruptions of supplies from key suppliers may affect our results of operations and financial performance. |
Interruptions of supplies from our key suppliers, including those from catastrophes such as hurricanes, earthquakes, floods or terrorist activities, could disrupt production or impact our ability to increase or maintain production and sales. Most copper and aluminum rod used in our North American operations is externally sourced, and our largest supplier of copper rod accounted for approximately 70% of our North American purchases in 2017, while our largest supplier of aluminum rod accounted for approximately 60% of our North American purchases in 2017. Our largest supplier of copper rod accounted for approximately 45% of our European purchases in 2017 while the largest supplier of aluminum rod accounted for approximately 30% of our European aluminum purchases in 2017. Our largest supplier of copper rod accounted for approximately 75% of our Latin American purchases in 2017 while the largest supplier of aluminum rod accounted for approximately 30% of our Latin American aluminum purchases in 2017. Any unanticipated problems with our copper or aluminum rod suppliers could have a material adverse effect on our business. Additionally, we use a limited number of sources for most of the other raw materials that we do not produce. We do not have long-term or volume purchase agreements with most of our suppliers, and may have limited options in the short-term for alternative supply if these suppliers fail to continue the supply of materials or components for any reason, including their business failure, inability to obtain raw materials or financial difficulties. Moreover, identifying and accessing alternative sources may increase our costs.
• | We source and sell products globally and are exposed to fluctuations in foreign currency exchange rates. |
We manufacture and sell products and finance operations throughout the world and are exposed to the impact of foreign currency fluctuations on our results of operations. Also, our consolidated financial results are presented in U.S. dollars; therefore, a change in the value of currencies may adversely impact our financial statements after currency remeasurements and translation to U.S. dollars. In addition, devaluations of currencies could negatively affect the value of our earnings from, and the assets located in, those markets.
• | If we fail to comply with the reporting obligations of the Exchange Act or if we fail to maintain adequate internal control over financial reporting, our business, the market value of our securities and our access to capital markets could be materially adversely affected. |
As a public company, we are required to comply with the periodic reporting obligations of the Securities Exchange Act of 1934, as amended, referred to as the “Exchange Act,” including the requirement that we file annual reports and quarterly reports with the SEC. Our failure to file required information in a timely manner could subject us to penalties under federal securities laws, expose us to additional lawsuits, create a default under our existing debt instruments and facilities, and restrict our ability to access financing. In addition, our management is responsible for establishing and maintaining adequate internal control over financial
15
reporting. Our internal control over financial reporting is a process designed to provide reasonable assurance regarding the reliability of financial reporting and the preparation of financial statements in accordance with GAAP.
If we identify material weaknesses or fail to maintain adequate internal controls over financial reporting in the future, we may not be able to prepare reliable financial reports and comply with our reporting obligations under the Exchange Act on a timely basis. Any such delays in the preparation of financial reports and the filing of our periodic reports may result in a loss of public confidence in the reliability of our financial statements, the commencement of additional litigation, or the commencement of regulatory action against us, which may include court actions or administrative proceedings, any of which could materially adversely affect our business, the market value of our securities and our access to the capital markets.
• | Compliance with foreign and U.S. laws and regulations applicable to our international operations, including the Foreign Corrupt Practices Act (“FCPA”), other applicable anti-corruption laws and anti-competition regulations, may increase the cost of doing business in international jurisdictions. |
Various laws and regulations associated with our current international operations are complex and increase our cost of doing business. Furthermore, these laws and regulations expose us to fines and penalties if we fail to comply with them. These laws and regulations include import and export requirements, anti-competition regulations, U.S. laws such as the FCPA, and local laws prohibiting payments to governmental officials and other corrupt practices. Although we have implemented policies and procedures designed to ensure compliance with these laws, there can be no assurance that our employees, contractors and agents will not take actions in violation of our policies. Any such violations could subject us to civil or criminal penalties, including material fines or prohibitions on our ability to offer our wire and cable products in one or more countries, and could also materially damage our reputation, brand, business and operating results.
On December 29, 2016, the Company entered into agreements with the SEC and Department of Justice (“DOJ”) that bring to a conclusion those agencies’ respective investigations relating to previously disclosed FCPA matters. The Company has entered into a non-prosecution agreement with the DOJ which will be in effect for three years. No criminal charges will be brought against the Company provided it complies with its obligations under the agreement. The Company also agreed to annual self-reporting for a period of three years. Pursuant to those agreements, the Company paid fines, disgorgement and pre-judgment interest to the SEC and DOJ. For additional information, you should refer to the Section entitled “Item 8. - Financial Statements and Supplementary Data - Notes to Consolidated Financial Statements - Note 19 - Commitments and Contingencies - Resolution of SEC and DOJ Investigations.”
Our failure to comply with any terms or conditions of the respective settlement agreements, including notably, ongoing compliance obligations, could result in additional criminal and/or civil penalties and continued expenses related to additional investigations and defense costs for addressing such a default, which could have a material adverse effect on our business and operating results.
• | Failure to negotiate extensions of our labor agreements as they expire may result in a disruption of our operations. |
As of December 31, 2017, approximately 45% of our employees were represented by various labor unions, of which approximately 40% are subject to agreements that expire within the next twelve months.
We are party to labor agreements with unions that represent employees at many of our manufacturing facilities. Labor agreements are generally negotiated on an annual or bi-annual basis and the risk exists that we may not be able to renew labor agreements on reasonably satisfactory terms or at all. We cannot predict what issues may be raised by the collective bargaining units representing our employees and, if raised, whether negotiations concerning such issues will be successfully concluded. A protracted work stoppage could result in a disruption of our operations which could, in turn, adversely affect our financial results, customer satisfaction, and our ability to deliver certain products.
• | Failure or disruptions of our information systems, including a cybersecurity breach or failure of one or more key information technology systems, networks, hardware, processes, associated sites or service providers could interfere with our business and operations. |
We rely on our information systems for processing customer orders, shipment of products, billing our customers, tracking inventory, supporting accounting functions and financial statement preparation, paying our employees, and otherwise running our business. Any disruption, whether from hackers or other sources, in our information systems could have a significant impact on our business. In addition, we may need to enhance our information systems to provide additional capabilities and functionality. The implementation of new information systems and enhancements is frequently disruptive to the underlying business of an enterprise. Any disruptions affecting our ability to accurately report our financial performance on a timely basis could adversely affect our business in a number of respects. If we are unable to successfully implement potential future information systems enhancements, our financial position, results of operations, and cash flows could be negatively impacted.
Increased IT security threats and more sophisticated computer crime, including advanced persistent threats, pose a potential risk to the security of our IT systems, networks and services, as well as the confidentiality, availability and integrity of our data. If the IT systems, networks or service providers we rely upon fail to function properly, or if we suffer a loss or disclosure of business
16
or financial information, due to any number of causes, including catastrophic events, power outages and security breaches, and our business continuity plans do not effectively address these failures on a timely basis, we may suffer interruptions in our ability to manage operations, reputational, competitive and/or business harm as well as litigation and regulatory action, which may adversely impact our results of operations and/or financial condition. The costs and operational consequences of responding to breaches and implementing remediation measures could be significant.
• | The Company is exposed to counterparty risk in our hedging arrangements. |
The Company is exposed to counterparty risk in our hedging arrangements. The failure of one or more counterparties to our hedging arrangements to fulfill or renew their obligations to us could adversely affect our results of operations. At times, depending on the extent of any unrealized loss position on a derivative contract, certain counterparties may require us to post collateral to secure our derivative contract positions.
• | Declining returns in the investment portfolio of our defined benefit pension plans and changes in actuarial assumptions could increase the volatility in our pension expense and require us to increase cash contributions to the plans. |
We sponsor defined benefit pension plans around the world. Pension expense for the defined benefit pension plans sponsored by us is determined based upon a number of actuarial assumptions, including an expected long-term rate of return on assets and discount rate. The use of these assumptions makes our pension expense and our cash contributions subject to year-to-year volatility. As of December 31, 2017, 2016 and 2015, the defined benefit pension plans were underfunded by approximately $119.5 million, $117.4 million and $121.0 million, respectively, based on the actuarial methods and assumptions utilized for purposes of the applicable accounting rules and interpretations. We have experienced volatility in our pension expense and our cash contributions to our defined benefit pension plans. In 2017, pension expense was $6.1 million, a decrease of approximately $10.1 million from 2016, and cash contributions were $6.8 million. We estimate our 2018 pension expense for our defined benefit plans will be approximately $4.6 million. In the event that actual results differ from the actuarial assumptions or the actuarial assumptions are changed, the funded status of our defined benefit pension plans may change and any such deficiency could result in additional charges to equity and an increase in our future pension expense and cash contributions. Refer to Note 14 - Employee Benefit Plans of this document for details.
• | Environmental liabilities could potentially adversely impact us and our affiliates. |
We are subject to federal, state, local and foreign environmental protection laws and regulations governing our operations and the use, handling, disposal and remediation of hazardous substances currently or formerly used by us and our affiliates. A risk of environmental liability is inherent in our and our affiliates' current and former manufacturing activities in the event of a release or discharge of a hazardous substance generated by us or our affiliates. Under certain environmental laws, we could be held jointly and severally responsible for the remediation of any hazardous substance contamination at our current and former facilities and at third party waste disposal sites. We could also be held liable for any consequences arising out of human exposure to such substances or other environmental damage. We and our affiliates have been named as potentially responsible parties in proceedings that involve environmental remediation. There can be no assurance that the costs of complying with environmental, health and safety laws and requirements in our current operations or the liabilities arising from past releases of, or exposure to, hazardous substances, will not result in future expenditures by us that could materially and adversely affect our financial results, cash flows or financial condition.
• | We are subject to certain asbestos litigation and unexpected judgments or settlements that could have a material adverse effect on our financial results. |
Our subsidiaries have been named as defendants in non-maritime asbestos cases which involve plaintiffs alleging exposure to asbestos-containing cable manufactured by our predecessors. Our subsidiaries have also been named, along with numerous other product manufacturers, as defendants in cases in which plaintiffs alleged that they suffered an asbestos related injury while working in the maritime industry. Refer to Note 19 - Commitments and Contingencies for a summary of our outstanding asbestos-related litigation. There can be no assurance that any judgments or settlements of the pending asbestos cases or any cases which may be filed in the future will not have a material adverse effect on our financial results, cash flows or financial position.
• | If we fail to retain our key employees and attract qualified personnel, our business may be harmed. |
Our success has been largely dependent on the skills, experience and efforts of our key employees and the loss of the services of any of our key personnel, without a properly executed transition plan, could have an adverse effect on us. In recent years, we announced a number of changes in our executive leadership team. Failure to effectively integrate our executives or failure of our executives to implement our business strategies could materially adversely affect our future financial condition and results of operations. The future loss of any key personnel could damage customer relationships, result in the loss of vital knowledge, experience and expertise, could lead to an increase in recruitment and training costs and make it more difficult to successfully operate our business and execute our business strategy. We may not be able to find qualified potential replacements for these individuals and the integration of potential replacements may be disruptive to our business. In addition, the loss of our key employees who have intimate knowledge of our manufacturing process could lead to increased competition to the extent that those employees
17
are hired by a competitor and are able to recreate our manufacturing process. Our future success will also depend in part upon our continuing ability to attract and retain highly qualified personnel, who are in great demand.
• | Our indebtedness and our ability to pay our indebtedness could adversely affect our business and financial condition. |
We have a significant amount of debt and may incur additional debt in the future. If new debt is added to our current debt levels, the risks described herein would increase. Refer to Note 11 - Long-Term Debt of this document for details on the various debt agreements.
The degree to which we are leveraged could have adverse consequences to us, limiting management's choices in responding to business, economic, regulatory and other competitive conditions. In addition, our ability to generate cash flow from operations sufficient to make scheduled payments on our debts as they become due will depend on our future performance, our ability to successfully execute our business strategy and our ability to obtain other financing, which may be influenced by economic, financial, competitive, legislative, regulatory and other factors that are beyond our control. Our material indebtedness may affect our ability to pay principal and interest on outstanding indebtedness, increase our vulnerability to adverse economic and industry conditions, limit future capital expenditures and research and development, limit our ability to fund working capital needs and general corporate requirements, decrease our flexibility to react to changes in our business and industry, and place us at a competitive disadvantage to our competitors with less debt.
Our ability to make payments on our indebtedness, to refinance our indebtedness and fund planned capital expenditures will depend on our ability to generate cash in the future. This, to a certain extent, is subject to general economic, financial, competitive, legislative, regulatory and other factors that are beyond our control. There can be no assurance that our business will generate sufficient cash flows from operations or that future borrowings will be available to us under our credit facilities in an amount sufficient to enable us to make payments with respect to our indebtedness or to fund our other liquidity needs. If this were the case, we might need to refinance all or a portion of our indebtedness on or before maturity, sell assets, reduce or delay capital expenditures or seek additional equity financing. With respect to our Subordinated Convertible Notes, the settlement amount and potential recapture of income tax deductions could be material upon a triggering event or maturity of the Subordinated Convertible Notes. There can be no assurance that we will be able to refinance any of our indebtedness on commercially reasonable terms or at all.
• | Failure to comply with covenants and other provisions in our existing or future financing agreements could result in cross-defaults under some of our financing agreements, which could jeopardize our ability to satisfy our obligations. |
Various risks, uncertainties and events beyond our control could affect our ability or the ability of our subsidiaries to comply with the covenants, financial tests and ratios required by the instruments governing our and their financing arrangements, including, without limitation, the requirement that no final judgment or judgments of a court of competent jurisdiction have been rendered against us or our subsidiaries in excess of stated amounts. Failure to comply with any of the covenants in our existing or future financing agreements could result in a default under those agreements as well as other agreements containing cross-default provisions. A default would permit lenders to cease to make further extensions of credit, accelerate the maturity of the debt under these agreements and foreclose upon any collateral securing that debt as well as restrict our ability to make certain investments and payments, pay dividends, purchase company stock, enter into transactions with affiliates, make acquisitions, merge and consolidate, or transfer or sell assets. Under these circumstances, we might not have sufficient funds or other resources to satisfy all of our obligations.
Our ability and the ability of our subsidiaries to comply with these covenants is subject to various risks and uncertainties. In addition, events beyond our control could affect our ability to comply with and maintain the financial tests and ratios required by this indebtedness. Even if we or our subsidiaries, as applicable, are able to comply with all applicable covenants, the restrictions on our ability to operate our business in our sole discretion could harm our business by, among other things, limiting our ability to take advantage of financing, mergers, acquisitions and other opportunities.
Certain portions of our debt contain prepayment or acceleration rights at the election of the holders upon a covenant default, change in control or fundamental change, which, if exercised, could constitute an event of default under other portions of our debt. It is possible that we would be unable to fulfill all of these obligations simultaneously, which could adversely affect our financial position.
• | If we fail to meet our payment or other obligations under our secured indebtedness, the lenders under this indebtedness could foreclose on, and acquire control of, substantially all of our assets. |
Indebtedness under our senior secured credit facility is secured by: (a) for U.S. borrowings under the facility, a first priority security interest in certain tangible and intangible property and assets of certain of the Company’s U.S. subsidiaries, and (b) for Canadian and European borrowings under the facility, a first priority security interest in certain tangible and intangible property and assets of certain of the Company’s Canadian subsidiaries and European subsidiaries. In addition, the lenders under our senior secured credit facility have received a pledge of (i) 100% of the equity interests in certain of the Company’s domestic, Canadian and European subsidiaries, and (ii) 65% of the voting equity interests in and 100% of the non-voting equity interests in each material
18
foreign subsidiary directly owned by a U.S. Loan Party. As a result of these pledges and liens, if we fail to meet our payment or other obligations under the facility, then the lenders under the facility would be entitled to foreclose on the assets pledged as collateral to secure the facility and liquidate such assets. Under those circumstances, we may not have sufficient funds to pay our obligations, which could adversely affect our financial position.
• | Our ability to pay principal and interest on outstanding indebtedness depends upon our receipt of dividends or other intercompany transfers from our subsidiaries. |
We are a holding company and substantially all of our properties and assets are owned by, and all our operations are conducted through, our subsidiaries. As a result, we are dependent upon cash dividends and distributions or other transfers from our subsidiaries to meet our debt service obligations, including payment of the interest on and principal of our indebtedness when due, and other obligations. The ability of our subsidiaries to pay dividends and make other payments to us may be restricted by, among other things, applicable corporate, tax and other laws and regulations in the United States and abroad and agreements made by us and our subsidiaries, including under the terms of our existing and potentially future indebtedness.
In addition, claims of creditors, including trade creditors, of our subsidiaries will generally have priority with respect to the assets and earnings of such subsidiaries over the claims of our creditors, except to the extent the claims of our creditors are guaranteed by these subsidiaries. Certain of our indebtedness may be guaranteed by only some of our subsidiaries. In the event of our dissolution, bankruptcy, liquidation or reorganization, the holders of such indebtedness will not receive any amounts from our non-guarantor subsidiaries with respect to such indebtedness until after the payment in full of the claims of the creditors of those subsidiaries.
• | A downgrade in our financial strength or credit ratings could limit our ability to conduct our business or offer and sell additional debt securities. |
Nationally recognized rating agencies currently rate our debt. Ratings are not recommendations to buy or sell our securities. We may, in the future, incur indebtedness with interest rates that may be affected by changes in or other actions associated with our credit ratings. Each of the rating agencies reviews its ratings periodically and previous ratings for our debt may not be maintained in the future. Rating agencies may also place us under review for potential downgrade in certain circumstances or if we seek to take certain actions. A downgrade of our debt ratings or other negative action, such as a review for a potential downgrade, could affect the market price of our existing subordinated and senior notes. Furthermore, these events may negatively affect our ability to raise additional debt with terms and conditions similar to our current debt, and accordingly, likely increase our cost of capital. In addition, a downgrade of these ratings, or other negative action, could make it more difficult for us to raise capital to refinance any maturing debt obligations to support business growth and to maintain or improve the current financial strength of our business and operations.
• | The trading price of our common stock may be adversely affected by many factors, not all of which are within our control, as well as by future issuances of our common stock or additional series of preferred stock. |
The trading price of our common stock has been and may in the future be volatile. Our stock price could be subject to wide fluctuations in response to a variety of factors, including the Merger Agreement with Prysmian, quarterly variations in our operating results or our competitors' operating results, announcements of new products or services by us or our competitors, adverse or unfavorable publicity about us or our services, or our competitors, timing and announcement of acquisitions by us or our competitors, technological innovations by us or our competitors, changes in our or our competitors' earnings estimates, financial strength or credit ratings of us or our competitors, changes in estimates or recommendations by security analysts for our stock or our competitors' stock, commencement of material litigation or unfavorable verdicts against us, and additions or departures of key personnel.
In addition, our trading price may be adversely affected by future issuances of our common stock. Our amended and restated certificate of incorporation provides that we have authority to issue 200 million shares of common stock. As of December 31, 2017, there were approximately 50.6 million shares of common stock outstanding (net of treasury shares), approximately 1.1 million shares of common stock are issuable upon the exercise of currently outstanding stock options and approximately 1.1 million shares of common stock are issuable upon the vesting of currently outstanding restricted stock units and performance stock units. In addition, a maximum of approximately 14.3 million shares of our common stock could be issuable upon conversion of our Subordinated Convertible Notes. All of the shares of our common stock that could be issued pursuant to the conversion of our Subordinated Convertible Notes by holders who are not our affiliates would be freely tradable by such holders.
Our trading price also may be adversely affected by future issuances of series of preferred stock. Our Board of Directors is authorized to issue series of preferred stock without any action on the part of our stockholders. Our Board of Directors also has the power, without stockholder approval, to set the terms of any such series of preferred stock that may be issued, including voting rights, conversion rights, dividend rights, preferences over our common stock with respect to dividends or if we liquidate, dissolve or wind up our business and other terms. If we issue preferred stock in the future that has preference over our common stock with respect to the payment of dividends or upon our liquidation, dissolution or winding-up, or if we issue preferred stock with voting rights that dilute the voting power of our common stock, the market price of our common stock could be adversely affected.
19
ITEM 1B. | UNRESOLVED STAFF COMMENTS |
None.
ITEM 2. PROPERTIES
The Company’s principal manufacturing facilities are listed below by country. The Company owns the building at its global headquarters located in Highland Heights, Kentucky and leases various distribution centers and sales and administrative offices around the world. Many of the domestic and international facilities produce products for multiple markets including electrical infrastructure, electric utility, communications, construction and rod mill products. The Company believes that its properties are generally well maintained and are adequate for the Company’s current level of operations.
North American Operating Segment Manufacturing Properties | ||
Number of Properties by Country | Owned or Leased | |
United States - 12 | 11 owned, 1 leased | |
Canada - 3 | 3 owned | |
Mexico - 2 | 2 leased | |
European Operating Segment Manufacturing Properties | ||
Number of Properties by Country | Owned or Leased | |
Spain - 3 | 3 owned | |
France - 1 | 1 owned | |
Germany - 1 | 1 owned | |
Portugal - 1 | 1 owned | |
Latin American Operating Segment Manufacturing Properties | ||
Number of Properties by Country | Owned or Leased | |
Brazil - 1 | 1 owned | |
Colombia - 1 | 1 leased | |
Chile - 1 | 1 owned | |
Costa Rica - 1 | 1 owned | |
Ecuador - 1 | 1 leased | |
Mexico - 1 | 1 owned | |
Africa / Asia Pacific Operating Segment Manufacturing Properties | ||
Number of Properties by Country | Owned or Leased | |
Angola - 1 | 1 owned | |
ITEM 3. | LEGAL PROCEEDINGS |
We are subject to a number of lawsuits, investigations and claims arising out of the conduct of our business. Information regarding our litigation and other legal proceedings can be found in Note 19 - Commitments and Contingencies.
ITEM 4. | MINE SAFETY DISCLOSURES |
Not applicable.
20
PART II.
ITEM 5. | MARKET FOR REGISTRANT’S COMMON EQUITY, RELATED STOCKHOLDER MATTERS AND ISSUER PURCHASES OF EQUITY SECURITIES |
Market Information and Holders
General Cable’s common stock is listed on the New York Stock Exchange under the symbol “BGC”. As of February 20, 2018, there were approximately 1,256 registered holders of the Company’s common stock. The following table sets forth the high and low daily sales prices for the Company’s common stock as reported on the New York Stock Exchange during the years ended December 31:
2017 | 2016 | ||||||||||||||
High | Low | High | Low | ||||||||||||
First Quarter | $ | 20.61 | $ | 15.83 | $ | 13.28 | $ | 6.22 | |||||||
Second Quarter | 19.80 | 14.95 | 16.41 | 11.09 | |||||||||||
Third Quarter | 19.85 | 15.85 | 16.46 | 11.65 | |||||||||||
Fourth Quarter | 30.18 | 19.18 | 20.80 | 11.70 | |||||||||||
Dividends on Common Stock
On May 20, 2013, the Company's Board of Directors authorized the payment of a regular quarterly dividend of $0.18 per share (starting in the second quarter of 2013). During the year ended December 31, 2017, the Company paid in total approximately $37.4 million to all common shareholders of record, or $0.72 per share. During the year ended December 31, 2016, the Company paid in total approximately $35.6 million to all common shareholders of record, or $0.72 per share. Future declarations of dividends and the establishment of future record dates and payment dates are subject to the final determination of our Board of Directors. In determining dividends, the Board of Directors takes into consideration items such as general business conditions, financial performance, projected cash flows and anticipated financing needs. Future payments of dividends is also subject to the requirements of the Company's Revolving Credit Facility with JP Morgan Chase Bank, NA, as administrative agent, and other lenders (“Revolving Credit Facility”), the 5.75% Senior Notes due 2022 (“5.75% Senior Notes"), and the requirements of the Delaware General Corporation law.
Securities Authorized for Issuance under Equity Compensation Plans
Refer to Item 12 - Security Ownership of Certain Beneficial Owners and Management and Related Stockholder Matters for information related to the Company’s securities authorized for issuance under equity compensation plans, including the tabular disclosure.
21
Performance Graph
The graph below compares the annual percentage change in cumulative total shareholder return on General Cable stock in relation to cumulative total return of the Standard & Poor’s 500 Stock Index, and a peer group of companies (“2017 Peer Group”). The data shown are for the period beginning May 16, 1997, the date that General Cable (“BGC”) common stock began trading on the NYSE, through December 31, 2017.
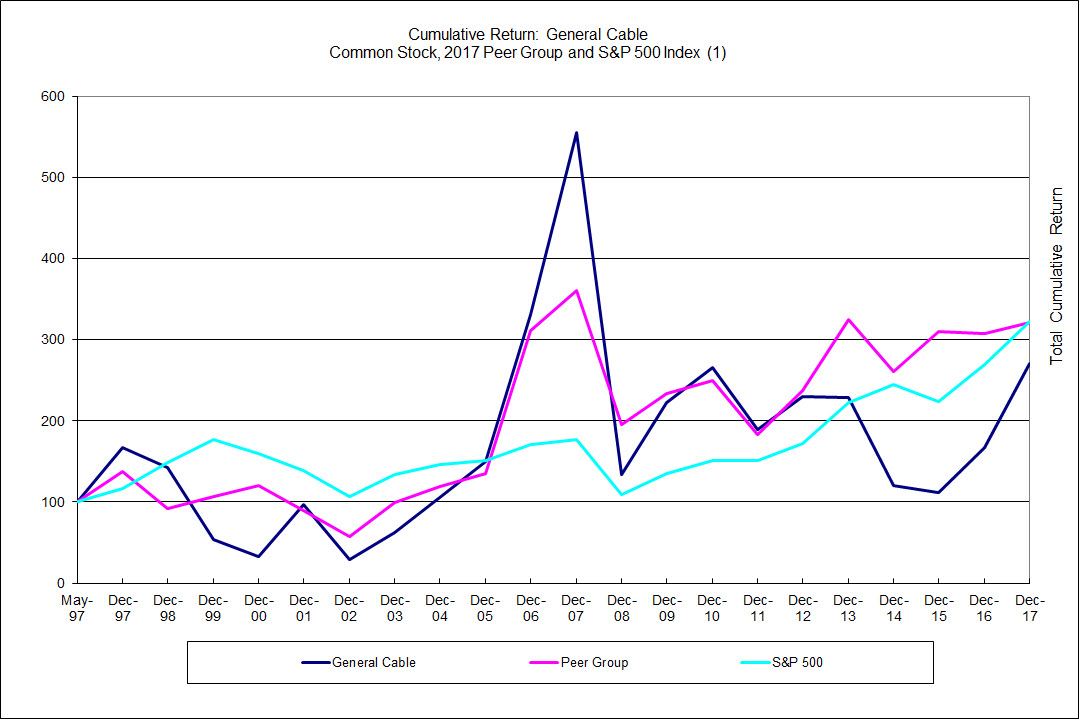
May 1997 | Dec 1997 | Dec 1998 | Dec 1999 | Dec 2000 | Dec 2001 | Dec 2002 | Dec 2003 | Dec 2004 | Dec 2005 | Dec 2006 | Dec 2007 | Dec 2008 | Dec 2009 | Dec 2010 | Dec 2011 | Dec 2012 | Dec 2013 | Dec 2014 | Dec 2015 | Dec 2016 | Dec 2017 | |||||||||||||||||||||||
General Cable | 100 | 167 | 143 | 53 | 32 | 97 | 29 | 62 | 105 | 149 | 331 | 555 | 134 | 223 | 266 | 189 | 230 | 228 | 120 | 112 | 168 | 270 | ||||||||||||||||||||||
2017 Peer Group | 100 | 138 | 92 | 107 | 121 | 89 | 58 | 99 | 118 | 135 | 311 | 361 | 195 | 234 | 249 | 184 | 238 | 324 | 261 | 310 | 308 | 321 | ||||||||||||||||||||||
S&P 500 | 100 | 117 | 148 | 177 | 159 | 138 | 106 | 134 | 146 | 150 | 171 | 177 | 109 | 134 | 152 | 152 | 172 | 223 | 248 | 223 | 270 | 322 | ||||||||||||||||||||||
(1) | Assumes dividend reinvestment and assumes the value of the investment in General Cable common stock and each index was $100 on May 16, 1997. The 2017 Peer Group consists of Belden Inc. (NYSE: BDC), Prysmian (Italy Stock Exchange) and Nexans (Paris Stock Exchange). Returns in the 2017 Peer Group are weighted by capitalization. |
22
Purchases of Equity Securities by the Issuer and Affiliated Purchasers
The following table summarizes purchases of equity securities by the issuer during the quarter ended December 31, 2017:
Period | Total number of shares purchased (1), (2) | Average price paid per share | |||
September 30, 2017 through October 27, 2017 | 1,839 | $ | 21.50 | ||
October 28, 2017 through November 24, 2017 | 40 | $ | 16.35 | ||
November 25, 2017 through December 31, 2017 | 184,891 | $ | 29.70 | ||
(1) Includes 186,560 shares of common stock that were withheld for taxes on the vesting of restricted stock issued pursuant to the Company's equity compensation plans, and the average price paid per share was $29.62 during the quarter ended December 31, 2017. 312,240 shares of common stock were withheld for taxes on the vesting of restricted stock issued pursuant to the Company's equity compensation plans, and the average price paid per share was $25.41 during the year ended December 31, 2017.
(2) Includes 210 shares of common stock that were purchased through a rabbi trust as investments of participants in the Company's deferred compensation plan, and the average price paid per share was $29.60 during the quarter ended December 31, 2017. 1,868 shares of common stock were purchased through a rabbi trust as investments of participants in the Company's deferred compensation plan, and the average price paid per share was $18.98 during the year ended December 31, 2017. The Rabbi Trust (“Trust”) was established in connection with the deferred compensation plan, and the Trust assets are available to satisfy the claims of the Company’s creditors in the event of bankruptcy or insolvency of the Company.
ITEM 6. | SELECTED FINANCIAL DATA |
The selected financial information for the years ended December 31, 2017, 2016 and 2015 and as of December 31, 2017 and 2016, was derived from audited consolidated financial statements included in this filing and for the years ended December 31, 2014 and 2013 and as of December 31, 2015, 2014 and 2013 was derived from previously audited consolidated financial statements. The following selected financial data should be read in conjunction with “Management’s Discussion and Analysis of Financial Condition and Results of Operations” and the consolidated financial statements and related notes thereto, especially as the information pertains to 2017, 2016 and 2015 activity.
23
Year Ended December 31, | |||||||||||||||||||
2017 | 2016 | 2015 | 2014 | 2013 | |||||||||||||||
(in millions, except metal price and share data) | |||||||||||||||||||
Net sales | $ | 3,837.2 | $ | 3,858.4 | $ | 4,514.5 | $ | 5,979.8 | $ | 6,421.2 | |||||||||
Cost of sales | 3,411.1 | 3,451.3 | 4,082.1 | 5,586.6 | 5,717.5 | ||||||||||||||
Gross profit | 426.1 | 407.1 | 432.4 | 393.2 | 703.7 | ||||||||||||||
Selling, general and administrative expenses | 416.8 | 408.9 | 412.3 | 450.7 | 492.0 | ||||||||||||||
Goodwill impairment charges | — | 9.0 | 3.9 | 155.1 | — | ||||||||||||||
Intangible asset impairment charges | — | 7.5 | 1.7 | 98.8 | — | ||||||||||||||
Operating income (loss) | 9.3 | (18.3 | ) | 14.5 | (311.4 | ) | 211.7 | ||||||||||||
Other income (expense) | 28.5 | 7.2 | (71.3 | ) | (212.9 | ) | (66.7 | ) | |||||||||||
Interest expense, net | (76.7 | ) | (87.0 | ) | (94.3 | ) | (111.8 | ) | (118.0 | ) | |||||||||
Income (loss) before income taxes | (38.9 | ) | (98.1 | ) | (151.1 | ) | (636.1 | ) | 27.0 | ||||||||||
Income tax (provision) benefit | (15.8 | ) | 3.7 | 14.8 | (8.3 | ) | (38.8 | ) | |||||||||||
Equity in net earnings of affiliated companies | — | 0.9 | 0.5 | 1.4 | 1.7 | ||||||||||||||
Net income (loss) including noncontrolling interest | (54.7 | ) | (93.5 | ) | (135.8 | ) | (643.0 | ) | (10.1 | ) | |||||||||
Less: preferred stock dividends | — | — | — | — | 0.3 | ||||||||||||||
Less: net income (loss) attributable to noncontrolling interest | 1.9 | 0.3 | (13.9 | ) | (15.4 | ) | 7.7 | ||||||||||||
Net income (loss) attributable to Company common shareholders | $ | (56.6 | ) | $ | (93.8 | ) | $ | (121.9 | ) | $ | (627.6 | ) | $ | (18.1 | ) | ||||
Earnings (loss) per share: Net income (loss) attributable to Company common shareholders per common share | |||||||||||||||||||
Earnings (loss) per common share-basic | $ | (1.13 | ) | $ | (1.89 | ) | $ | (2.49 | ) | $ | (12.86 | ) | $ | (0.37 | ) | ||||
Earnings (loss) per common share-assuming dilution | $ | (1.13 | ) | $ | (1.89 | ) | $ | (2.49 | ) | $ | (12.86 | ) | $ | (0.37 | ) | ||||
Weighted average common shares-basic | 50.1 | 49.6 | 48.9 | 48.8 | 49.4 | ||||||||||||||
Weighted average common shares-assuming dilution | 50.1 | 49.6 | 48.9 | 48.8 | 49.4 | ||||||||||||||
Dividends per common share | $ | 0.72 | $ | 0.72 | $ | 0.72 | $ | 0.72 | $ | 0.54 | |||||||||
Other Data: | |||||||||||||||||||
Depreciation and amortization | $ | 73.9 | $ | 86.0 | $ | 96.4 | $ | 126.4 | $ | 133.5 | |||||||||
Capital expenditures | 85.4 | 84.1 | 61.5 | 89.6 | 89.1 | ||||||||||||||
Average daily COMEX price per pound of copper cathode | 2.80 | 2.20 | 2.51 | 3.12 | 3.34 | ||||||||||||||
Average daily price per pound of aluminum rod | 0.98 | 0.80 | 0.88 | 1.05 | 0.95 | ||||||||||||||
Dec 31, 2017 | Dec 31, 2016 | Dec 31, 2015 | Dec 31, 2014 | Dec 31, 2013 | |||||||||||||||
Balance Sheet Data: | |||||||||||||||||||
Working capital (1,2) | $ | 801.8 | $ | 698.1 | $ | 791.1 | $ | 911.7 | $ | 1,448.8 | |||||||||
Total assets (2) | 2,235.3 | 2,241.6 | 2,454.6 | 3,353.0 | 4,563.3 | ||||||||||||||
Total debt | 1,085.7 | 938.6 | 1,079.7 | 1,323.7 | 1,371.3 | ||||||||||||||
Dividends to common shareholders | 37.4 | 35.6 | 35.3 | 35.4 | 26.7 | ||||||||||||||
Total equity | 131.8 | 168.9 | 242.9 | 513.2 | 1,379.8 | ||||||||||||||
(1) | Working capital means current assets less current liabilities. |
(2) | December 31, 2017, 2016 and 2015 amounts are not comparable to the prior periods presented due to the Company's adoption of ASU 2015-17, "Income Taxes (Topic 740): Balance Sheet Classification of Deferred Taxes" on a prospective basis for the year ended December 31, 2015. |
24
ITEM 7. | MANAGEMENT’S DISCUSSION AND ANALYSIS OF FINANCIAL CONDITION AND RESULTS OF OPERATIONS |
The following Management's Discussion and Analysis of Financial Condition and Results of Operations (“MD&A”) is intended to help the reader understand General Cable Corporation's financial position, changes in financial condition, and results of operations. MD&A is provided as a supplement to the Company's Consolidated Financial Statements and the accompanying Notes to Consolidated Financial Statements ("Footnote" or “Notes”) and should be read in conjunction with the Consolidated Financial Statements and Notes.
Certain statements in this report including, without limitation, statements regarding future financial results and performance, plans and objectives, the Merger Agreement with Prysmian, capital expenditures and the Company's or management's beliefs, expectations or opinions, are forward-looking statements, and as such, General Cable desires to take advantage of the “safe harbor” which is afforded such statements under the Private Securities Litigation Reform Act of 1995. The Company's forward-looking statements should be read in conjunction with the Company's comments in this report under the heading, “Disclosure Regarding Forward-Looking Statements.” Actual results may differ materially from those statements as a result of factors, risks and uncertainties over which the Company has no control. For a list of these factors, risks and uncertainties, refer to Item 1A - Risk Factors.
Overview
The Company is a global leader in the development, design, manufacture, marketing and distribution of copper, aluminum and fiber optic wire and cable products for use in the energy, industrial, construction, specialty and communications markets. The Company additionally engages in the design, integration, and installation on a turn-key basis for products such as high and extra-high voltage terrestrial and submarine systems. The Company analyzes its worldwide operations based on four geographical segments: North America, Europe, Latin America, and Africa/Asia Pacific. As of December 31, 2017, the Company manufactures its product lines in 30 principal manufacturing facilities and sells its products worldwide through its global operations. Additional financial information regarding the segments appears in Note 18 - Segment Information.
Significant Current Business Trends and Events
The wire and cable industry is competitive, mature and cost driven with minimal differentiation for many product offerings among industry participants from a manufacturing or technology standpoint. Over the last several years, the Company and the industry have experienced uneven demand with pockets of relative demand strength and the industry dynamics remain challenging. In certain markets, however, global demand remains below historical levels. The following are significant trends and events that affected the financial results in 2017:
Merger Agreement with Prysmian S.p.A.
On December 3, 2017, the Company entered into a Merger Agreement with Prysmian S.p.A. Subject to the terms and conditions of the Merger Agreement, at the Effective Time, each Share, except for certain excluded shares, will automatically be canceled and converted into the right to receive $30.00 in cash, without interest.
During the year ended December 31, 2017, the Company recognized $16.2 million of merger related expenses in the SG&A expenses caption in the Consolidated Statements of Operations and Comprehensive Income (Loss).
See Note 3 - Merger Agreement with Prysmian S.p.A. for additional details and the full text of the Merger Agreement, which was included as Exhibit 2.1 to the Form 8-K filed with the SEC on December 4, 2017.
Effect of copper and aluminum prices
The Company’s results are directly influenced by the price of copper, and to a lesser extent, aluminum. The price of copper and aluminum as traded on the London Metal Exchange (“LME”) and Commodity Exchange, Inc. ("COMEX") has historically been subject to considerable volatility. The Company continued and expects to continue to experience volatile commodity pricing, primarily copper and aluminum, as well as in other cost inputs. The Company typically passes these changes in copper and aluminum prices along to its customers, although there are timing delays of varying lengths depending upon the volatility of metal prices, the type of product, competitive conditions, pricing mechanisms and particular customer arrangements. Although the general trends are detailed in Item 1 - Business - Raw Materials, there is no exact measure of the effect of the change of raw material cost inputs due to the high volume of transactions in any given period, each of which involves a number of factors in the individual pricing decisions. To help reduce this volatility, the Company has implemented various pricing mechanisms and hedges a portion of its metal purchases when there is a firm price commitment for a future delivery, but does not engage in speculative metals trading.
25
Asia Pacific and Africa divestitures
Since October 2014, the Company completed the following as of December 31, 2017 (amounts presented in millions):
Entity | Sale / Closure | Sale / Closure Date | Gross Proceeds | Pre-tax Gain / (Loss) | ||||||||
New Zealand | Closure | Fourth Quarter 2017 | $ | 10.3 | $ | 5.4 | ||||||
China | Sale | Third Quarter 2017 | 8.8 | (19.9 | ) | |||||||
Algeria | Sale | Second Quarter 2017 | 3.8 | (38.0 | ) | |||||||
Australia | Closure | Second Quarter 2017 | — | (4.2 | ) | |||||||
Pakistan | Sale | First Quarter 2017 | 5.3 | (3.5 | ) | |||||||
South Africa - Durban | Closure | Fourth Quarter 2016 | — | 1.6 | ||||||||
South Africa - National Cables | Closure | Fourth Quarter 2016 | — | (29.4 | ) | |||||||
Zambia | Sale | Third Quarter 2016 | 9.8 | (14.4 | ) | |||||||
Egypt | Sale | Second Quarter 2016 | 5.8 | (8.4 | ) | |||||||
India | Sale | First Quarter 2016 | 10.8 | 1.6 | ||||||||
Thailand | Sale | Third Quarter 2015 | 88.0 | 16.1 | ||||||||
Fiji | Sale | First Quarter 2015 | 9.3 | (2.6 | ) | |||||||
Keystone | Sale | First Quarter 2015 | 11.0 | 3.6 | ||||||||
PDP and PDEP | Sale | Fourth Quarter 2014 | 67.1 | 17.6 | ||||||||
See Note 4 - Divestitures for additional details.
2015 Strategic Roadmap
In the fourth quarter of 2015, the Company committed to a strategic roadmap focused on growth and optimization of the portfolio, developing leading cost and efficiency positions, growth through innovation and cultivation of a high-performance culture. In 2017, the Company approved additional expenditures to further expand, strengthen and accelerate the Company's program targeting operational effectiveness and efficiencies. As of December 31, 2017 the total remaining costs are immaterial.
Total expected costs and costs incurred to date by reportable segment are below (in millions):
North America | Europe | Latin America | Total | |||||||||
Total expected restructuring costs | $ | 81.0 | $ | 23.0 | $ | 6.0 | $ | 110.0 | ||||
Total costs incurred in the year ended December 31, 2015 | $ | 0.1 | $ | 6.7 | $ | 1.8 | $ | 8.6 | ||||
Total costs incurred in the year ended December 31, 2016 | 48.7 | 13.7 | 3.4 | 65.8 | ||||||||
Total costs incurred in the year ended December 31, 2017 | 31.5 | 1.2 | 0.3 | 33.0 | ||||||||
Total aggregate costs to date | $ | 80.3 | $ | 21.6 | $ | 5.5 | $ | 107.4 | ||||
Total aggregate costs of the program to date include $15.4 million of employee separation costs, $23.7 million of asset-related costs and $68.3 million of other costs, including $49.1 million of consulting fees. As of December 31, 2017, total aggregate cash outlays related to the program were $83.5 million. These actions resulted in the elimination of approximately 480 positions globally. See Note 5 - Restructuring for additional details.
Resolution of SEC and DOJ investigations
As previously disclosed, in December 2016, we entered into agreements with the SEC and the DOJ to resolve those agencies’ respective investigations relating to the FCPA and the SEC’s separate accounting investigation related to our financial restatements impacting fiscal years 2012 and prior. Pursuant to those agreements, we paid fines, disgorgement and pre-judgment interest to the SEC and DOJ in the total amount of $82.3 million. Specifically, we paid $20.5 million to the DOJ in January 2017 and $12.4 million, $18.5 million and $30.9 million to the SEC in January 2017, June 2017 and December 2017, respectively.
26
Revolving Credit Facility
The Revolving Credit Facility was amended and restated on May 22, 2017 to, among other things, extend the maturity date to May 22, 2022. The facility size remained unchanged at $700 million, $441 million of which may be borrowed by the U.S. borrower, $210 million of which may be borrowed by the European borrowers and $49 million of which may be borrowed by the Canadian borrower. See Note 11 - Long-Term Debt for additional details.
Foreign currency
The Company's results are directly influenced by fluctuations in foreign currency exchange rates. Uncertainty in the global market conditions has resulted in, and may continue to cause, significant volatility in foreign currency exchange rates. This volatility results in gains / losses on transactions whose terms are denominated in a currency other than the entity's functional currency and the Company's consolidated results are influenced by the translation of the international units' results to U.S. dollars. To help reduce this volatility, the Company enters into foreign currency exchange contracts principally to hedge the currency fluctuations in certain transactions denominated in foreign currencies.
Seasonality
The Company generally has experienced and expects to continue to experience certain seasonal trends in many products in which demand is linked with construction spending. Demand for these products during winter months in certain geographies, primarily North America, is usually lower than demand during spring and summer months. Therefore, larger amounts of working capital are generally required during winter months in order to build inventories in anticipation of higher demand during the spring and summer months, when construction activity increases. In turn, receivables related to higher sales activity during the spring and summer months are generally collected during the fourth quarter of the year. Additionally, the Company has historically experienced changes in demand resulting from poor or unusual weather.
In addition to the factors previously mentioned, the Company is currently being affected by the following general macro-level trends:
• | Global demand and pricing are uneven as a result of macroeconomic factors, and therefore, continues to hamper growth in key end markets; |
• | Currency volatility and continued political uncertainty in certain markets; |
• | Volatility in the price of copper and aluminum; |
• | Competitive price pressures in certain markets; |
• | New commodity deposits are more difficult to find, harder and more expensive to extract, and lower in quantities; |
• | End market demand in Latin America continues to be hampered by inconsistent construction spending and electrical infrastructure investment; |
• | Recovery is slow in Europe and demand continues to be uneven for a broad spectrum of products in Europe; |
• | The U.S. market has remained relatively stable compared to the uneven and challenging operating environments of the emerging economies; |
• | New communications networks are an enabling technology, which require communication infrastructure investment; |
• | Climate change concerns are resulting in increased regulatory energy mandates, emphasizing renewable sources of energy; |
• | Project timing continues to be volatile resulting in a lag in demand in all segments; and |
• | Countries are seeking greater energy independence for political and economic reasons. |
The Company's overall financial results discussed in this section of the annual report reflect the above trends.
27
Results of Operations
The following table sets forth, for the periods indicated, consolidated statement of operations data in millions of dollars and as a percentage of net sales. Percentages may not add due to rounding.
Year Ended December 31, | ||||||||||||||||||||
2017 | 2016 | 2015 | ||||||||||||||||||
Amount | % | Amount | % | Amount | % | |||||||||||||||
Net sales | $ | 3,837.2 | 100.0 | % | $ | 3,858.4 | 100.0 | % | $ | 4,514.5 | 100.0 | % | ||||||||
Cost of sales | 3,411.1 | 88.9 | % | 3,451.3 | 89.4 | % | 4,082.1 | 90.4 | % | |||||||||||
Gross profit | 426.1 | 11.1 | % | 407.1 | 10.6 | % | 432.4 | 9.6 | % | |||||||||||
Selling, general and administrative expenses | 416.8 | 10.9 | % | 408.9 | 10.6 | % | 412.3 | 9.1 | % | |||||||||||
Goodwill impairment charges | — | — | % | 9.0 | 0.2 | % | 3.9 | 0.1 | % | |||||||||||
Intangible asset impairment charges | — | — | % | 7.5 | 0.2 | % | 1.7 | — | % | |||||||||||
Operating income (loss) | 9.3 | 0.2 | % | (18.3 | ) | (0.5 | )% | 14.5 | 0.3 | % | ||||||||||
Other income (expense) | 28.5 | 0.7 | % | 7.2 | 0.2 | % | (71.3 | ) | (1.6 | )% | ||||||||||
Interest expense, net | (76.7 | ) | (2.0 | )% | (87.0 | ) | (2.3 | )% | (94.3 | ) | (2.1 | )% | ||||||||
Income (loss) before income taxes | (38.9 | ) | (1.0 | )% | (98.1 | ) | (2.5 | )% | (151.1 | ) | (3.3 | )% | ||||||||
Income tax (provision) benefit | (15.8 | ) | (0.4 | )% | 3.7 | 0.1 | % | 14.8 | 0.3 | % | ||||||||||
Equity in net earnings of affiliated companies | — | — | % | 0.9 | — | % | 0.5 | — | % | |||||||||||
Net income (loss) including noncontrolling interest | (54.7 | ) | (1.4 | )% | (93.5 | ) | (2.4 | )% | (135.8 | ) | (3.0 | )% | ||||||||
Less: net income (loss) attributable to noncontrolling interest | 1.9 | — | % | 0.3 | — | % | (13.9 | ) | (0.3 | )% | ||||||||||
Net income (loss) attributable to Company common shareholders | $ | (56.6 | ) | (1.5 | )% | $ | (93.8 | ) | (2.4 | )% | $ | (121.9 | ) | (2.7 | )% | |||||
Year Ended December 31, 2017 Compared with Year Ended December 31, 2016
Net Sales
The following tables set forth net sales, metal-adjusted net sales and metal pounds sold by segment, in millions. For the metal-adjusted net sales results, net sales for 2016 have been adjusted to reflect the 2017 copper average price (based on COMEX) of $2.80 per pound (a $0.60 increase compared to 2016) and the 2017 aluminum average price (based on LME) of $0.98 per pound (a $0.18 increase compared to 2016).
Net Sales Year Ended | |||||||||||||
Dec 31, 2017 | Dec 31, 2016 | ||||||||||||
Amount | % | Amount | % | ||||||||||
North America | $ | 2,218.1 | 58 | % | $ | 2,041.7 | 53 | % | |||||
Europe | 874.5 | 23 | % | 875.7 | 23 | % | |||||||
Latin America | 677.9 | 17 | % | 655.2 | 17 | % | |||||||
Africa/Asia Pacific | 66.7 | 2 | % | 285.8 | 7 | % | |||||||
Total net sales | $ | 3,837.2 | 100 | % | $ | 3,858.4 | 100 | % | |||||
28
Metal-adjusted net sales, a non-GAAP financial measure, are provided below in order to eliminate an estimate of metal price volatility from the comparison of revenues from one period to another. The comparable GAAP financial measure is set forth above. Refer to Item 1 - Business for a discussion of metal price volatility.
Metal-Adjusted Net Sales Year Ended | |||||||||||||
Dec 31, 2017 | Dec 31, 2016 | ||||||||||||
Amount | % | Amount | % | ||||||||||
North America | $ | 2,218.1 | 58 | % | $ | 2,235.8 | 53 | % | |||||
Europe | 874.5 | 23 | % | 936.0 | 22 | % | |||||||
Latin America | 677.9 | 17 | % | 755.7 | 18 | % | |||||||
Africa/Asia Pacific | 66.7 | 2 | % | 320.8 | 7 | % | |||||||
Total metal-adjusted net sales | $ | 3,837.2 | 100 | % | $ | 4,248.3 | 100 | % | |||||
Metal adjustment | — | (389.9 | ) | ||||||||||
Total net sales | $ | 3,837.2 | $ | 3,858.4 | |||||||||
Metal pounds sold is provided below as the Company believes this metric to be an appropriate measure of sales volume since it is not impacted by metal prices or foreign currency exchange rate changes.
Metal Pounds Sold Year Ended | |||||||||||
Dec 31, 2017 | Dec 31, 2016 | ||||||||||
Pounds | % | Pounds | % | ||||||||
North America | 580.9 | 59 | % | 548.0 | 54 | % | |||||
Europe | 152.4 | 16 | % | 154.0 | 15 | % | |||||
Latin America | 232.2 | 24 | % | 239.3 | 23 | % | |||||
Africa/Asia Pacific | 14.5 | 1 | % | 85.1 | 8 | % | |||||
Total metal pounds sold | 980.0 | 100 | % | 1,026.4 | 100 | % | |||||
Consolidated
Net sales remained relatively flat in 2017 from 2016 primarily attributable to:
• | The sale or exit of operations of $243.3 million |
• | Unfavorable product mix of $231.7 million |
• | These trends were offset by higher copper and aluminum prices of $389.9 million, favorable foreign currency exchange rate changes of $39.1 million and increased volume of $24.8 million |
Volume, as measured by metal pounds sold, decreased 46.4 million pounds, or 5%, in 2017 compared to 2016, principally due to the divestiture of businesses in Africa/Asia Pacific. Excluding divested businesses, volume, as measured by metal pounds sold, increased 13.0 million pounds.
North America
Net sales in the North America segment increased $176.4 million, or 9%, in 2017 from 2016. The net increase was primarily attributable to:
• | Higher copper and aluminum prices of $194.1 million |
• | Increased volume of $62.9 million |
• | Favorable foreign currency exchange rate changes of $7.3 million |
• | These trends were partially offset by net sales of $52.6 million attributable to the sale of non-core operations and unfavorable product mix of $35.3 million |
Volume, as measured by metal pounds sold, increased 32.9 million pounds, or 6%, in 2017 compared to 2016 due to stronger demand for construction and electric utility aerial transmission products.
29
Europe
Net sales in the Europe segment remained relatively flat in 2017 from 2016 primarily attributable to:
• | Higher copper and aluminum prices of $60.3 million |
• | Favorable foreign currency exchange rate changes of $20.1 million |
• | These trends were offset by unfavorable product mix of $78.5 million and lower volume of $3.1 million |
Volume, as measured by metal pounds sold, remained relatively flat in 2017 compared to 2016. Stronger demand for electric utility products including land-based turn-key projects was offset by the lower performance of the subsea turn-key project activity and weaker demand for industrial and construction products.
Latin America
Net sales in the Latin America segment increased $22.7 million, or 3%, in 2017 from 2016. The net increase was primarily attributable to:
• | Higher copper and aluminum prices of $100.5 million |
• | Favorable foreign currency exchange rate changes of $12.1 million |
• | These trends were partially offset by unfavorable product mix of $76.3 million and lower volume of $13.6 million |
Volume, as measured by metal pounds sold, decreased 7.1 million pounds, or 3%, in 2017 compared to 2016. The decrease in demand was primarily driven by uneven spending on electric infrastructure and construction projects, partially offset by higher shipments of aerial transmission cables in Brazil.
Africa/Asia Pacific
Net sales in the Africa/Asia Pacific segment decreased $219.1 million, or 77%, in 2017 from 2016. Volume, as measured by metal pounds sold, decreased by 70.6 million pounds, or 83%, in 2017 compared to 2016, primarily attributable to divested businesses.
Cost of Sales
Cost of sales decreased $40.2 million to $3,411.1 million in 2017 from $3,451.3 million in 2016. The percentage decrease in cost of sales was consistent with the percentage decrease in sales. As previously noted, cost of sales is raw material intensive with copper and aluminum comprising the major cost components for cable products. At current metal prices, material costs are approximately 85% of total product cost with copper and aluminum metal costs comprising approximately 50% of total product cost for the year ended December 31, 2017.
Gross Profit
Gross profit increased $19 million, or 5% in 2017 as compared to 2016. Gross profit as a percentage of sales was 11% for the years ended December 31, 2017 and 2016.
Selling, General and Administrative Expenses
SG&A expense increased $7.9 million, or 2%, in 2017 from 2016. The net impact to SG&A expense was primarily attributable to the following discrete items:
• | In 2017, the Company recorded net pre-tax losses of $67.1 million on asset sales and restructuring expenses of $25.7 million |
• | In 2016, the Company recorded net pre-tax gains of $10.1 million on asset sales, restructuring related expenses of $48.8 million and SEC and DOJ related expenses of $54.3 million |
SG&A as a percentage of net sales was approximately 11% in 2017 and 2016.
30
Operating Income (Loss)
The following table sets forth operating income (loss) by segment, in millions of dollars.
Operating Income (Loss) Year Ended | |||||||||||||
Dec 31, 2017 | Dec 31, 2016 | ||||||||||||
Amount | % | Amount | % | ||||||||||
North America | $ | 68.6 | 738 | % | $ | 62.4 | (341 | )% | |||||
Europe | (12.4 | ) | (133 | )% | 2.6 | (14 | )% | ||||||
Latin America | 17.6 | 189 | % | (14.4 | ) | 79 | % | ||||||
Africa/Asia Pacific | (64.5 | ) | (694 | )% | (68.9 | ) | 376 | % | |||||
Total operating income (loss) | $ | 9.3 | 100 | % | $ | (18.3 | ) | 100 | % | ||||
North America
The increase in operating income for the North America segment was $6.2 million in the year ended December 31, 2017 compared to the year ended December 31, 2016. In the year ended December 31, 2017, the Company recognized other restructuring related charges of $31.5 million and a $6.9 million loss related to asset sales. In the year ended December 31, 2016, the Company recognized restructuring related charges of $54.7 million, additional FCPA related expense of $54.3 million and a $53.2 million gain related to the disposal of its North American Automotive Ignition Wire business.
Europe
The decrease in operating income for the Europe segment was $15.0 million in the year ended December 31, 2017 compared to the year ended December 31, 2016. The net decrease in operating income was primarily attributable to the unfavorable impact of lower subsea project activity in the year ended December 31, 2017.
Latin America
The increase in operating income for the Latin America segment was $32.0 million in the year ended December 31, 2017 compared to the year ended December 31, 2016. The net increase in operating income was primarily driven by the impact of performance initiatives in the year ended December 31, 2017 and increased aerial transmission product shipments in Brazil.
Africa/Asia Pacific
The decrease in operating loss for the Africa/Asia Pacific segment was $4.4 million in the year ended December 31, 2017 compared to the year ended December 31, 2016. In the year ended December 31, 2017, the Company recognized pre-tax losses of $60.2 million on asset sales. In the year ended December 31, 2016, the Company recognized pre-tax losses of $49.0 million on asset sales.
Other Income (Expense)
Other income (expense) primarily includes foreign currency transaction gains or losses, which result from changes in exchange rates between the designated functional currency and the currency in which a transaction is denominated as well as gains and losses on derivative instruments that are not designated as cash flow hedges. During 2017 and 2016, the Company recorded other income of $28.5 million and $7.2 million, respectively.
For 2017, other income was primarily attributable to $31.0 million related to gains on derivative instruments that were not designated as cash flow hedges, partially offset by $2.5 million related to foreign currency transaction losses.
For 2016, other income was primarily attributable to $8.9 million related to gains on derivative instruments that were not designated as cash flow hedges, partially offset by $1.7 million related to foreign currency transaction losses.
Interest Expense
Net interest expense decreased $10.3 million in 2017 as compared to 2016 primarily due to lower borrowings of the Company's Latin America credit facilities due to the efficient management of working capital.
31
Tax Provision
The Company’s effective tax rate for 2017 and 2016 was (40.6)% and 3.8%, respectively. The Company’s effective tax rate for 2017 was significantly impacted by the following unfavorable items:
• | Recognizing no tax benefit on operating losses incurred in jurisdictions where valuation allowances are recorded against net deferred tax assets, |
• | Recognizing no tax benefit on $38.0 million, $19.9 million, $6.9 million, and $3.5 million of losses resulting from the sale of our Algerian, Chinese, North American Automotive Europe, and Pakistani businesses, respectively, |
• | Recording $45.9 million of U.S. tax expense associated with the one-time deemed taxable repatriation of the accumulated earnings and profits of foreign subsidiaries in connection with the Tax Reform Act, |
• | Recording $9.8 million of income tax expense associated with changes in judgment concerning uncertain tax positions related to the FCPA settlement, |
• | Recording $5.7 million of tax expense associated with prior year U.S. Subpart F inclusions, and |
• | Recording $5.7 million of tax expense to establish a valuation allowance against net deferred tax assets in New Zealand. |
The unfavorable effective tax rate drivers presented above were partially offset by the following favorable items:
• | Recording $62.1 million of U.S. tax benefit associated with the reduction of the federal corporate income tax rate from 35% to 21% in connection with the Tax Reform Act, and |
• | Recording $7.6 million of tax benefit associated with the release of reserves for uncertain tax positions due to settlements and statute of limitation lapses. |
The Company’s low effective tax rate for 2016 was primarily due to the adverse impact of recognizing no tax benefit on operating losses incurred in jurisdictions where valuation allowances are recorded against net deferred tax assets, recording $6.7 million of tax expense to establish a valuation allowance against beginning of year net deferred tax assets in China, and recognizing no tax benefit on $27.8 million of foreign currency translation adjustments reclassified out of accumulated other comprehensive income into continuing operations related to the closure of our South African operations. These adverse effects were partially offset by the use of U.S. capital losses for which no tax benefit was previously recognized. This resulted in the recognition of only $2.2 million of income tax expense on $53.2 million of pre-tax gain associated with the sale of the North American Automotive Ignition Wire business.
On December 22, 2017, the Tax Reform Act was signed into law. The Tax Reform Act makes comprehensive and complex changes to the U.S. tax law, including but not limited to the following provisions that may have a significant current or future impact on the Company’s tax position: 1) one-time deemed taxable repatriation of the accumulated earnings and profits of foreign subsidiaries as of December 31, 2017; 2) reduction of the federal corporate income tax rate from 35% to 21%; 3) bonus depreciation that will allow for full expensing of qualified fixed assets in the year of acquisition; 4) a new provision designed to effectively impose a minimum tax on certain foreign earnings (commonly referred to as “GILTI”); 5) a new percentage of taxable income limitation on the deductibility of interest expense; 6) adoption of a territorial-type tax system that would generally eliminate U.S. federal income tax on dividends from foreign subsidiaries; 7) repeal of the alternative minimum tax (“AMT”) and related provision enabling the refund of existing AMT credits; 8) creation of a new base erosion tax (“BEAT”) for certain payments made to non-U.S. affiliates; and 9) limitation on the use of net operating losses generated after December 31, 2017 to 80% of taxable income and allowance of an indefinite carry forward period for such net operating losses.
The SEC issued Staff Accounting Bulletin ("SAB") 118, which provides guidance on accounting for the tax effects of the Tax Reform Act. In recognition of the inherent complexities associated with the ASC 740 tax accounting for the Tax Reform Act, SAB 118 provides a measurement period of up to one year from enactment for companies to complete the ASC 740 tax accounting. Although the accounting for the tax effects of the Tax Reform Act are not yet complete, the Company was able to make reasonable estimates of the significant tax effects. Therefore, in accordance with SAB 118, the Company’s consolidated financial statements for the year ended December 31, 2017 reflect provisional estimates of the tax effects of the deemed repatriation of accumulated earnings and profits of foreign subsidiaries as well as the federal tax rate reduction. Although other provisions of the Tax Reform Act could potentially have a significant impact on the future tax position of the Company, they did not have a material impact on the consolidated financial statements for the year ended December 31, 2017. The Company has elected to account for the GILTI tax in the period in which any tax is incurred and, therefore, has not recorded any deferred tax impacts in the consolidated financial statements for the year ended December 31, 2017.
The Company’s provisional estimate of the tax effect of the Tax Reform Act for the year ended December 31, 2017 is a net deferred tax benefit of approximately $16 million, which consists of approximately $46 million of deferred tax expense attributable to the deemed repatriation of off-shore accumulated earnings and profits, and approximately $62 million of deferred tax benefit attributable to the U.S. tax rate reduction. In order to finalize the ASC 740 tax accounting for the deemed repatriation of foreign earnings and profits, the Company will need to gather additional information and complete a detailed analysis of the following: 1) its pro rata share of post-1986 earnings and profits of relevant foreign subsidiaries; 2) the amount of non-U.S. income taxes
32
paid with respect to such post-1986 earnings and profits; 3) its cash and liquid asset position at relevant dates; and 4) complex foreign tax credit computations to determine whether it may be beneficial to elect to claim foreign tax credits in lieu of offsetting the deemed repatriation income with net operating losses. In order to finalize the ASC 740 tax accounting for the tax rate reduction, the Company will need to complete the analysis of the tax effect of the deemed repatriation of foreign earnings and profits. In addition, the provisional estimate of the tax effects of the Tax Reform Act could be modified by changes in assumptions or interpretations, additional guidance that may be issued by the Internal Revenue Service, Treasury Department or state tax authorities, or actions we may take. The ASC 740 tax accounting will be completed within the one year period allowed under SAB 118.
As a result of the Tax Reform Act, the Company’s provisional estimate is that approximately $296 million of accumulated foreign earnings and profits were deemed to be distributed to the U.S. This deemed repatriation did not alter the Company’s intent or ability to reinvest or redeploy off-shore earnings indefinitely.
During 2017, after weighing all positive and negative evidence but primarily based on the wind down and substantially complete liquidation of the New Zealand business units, a valuation allowance was recorded against $5.7 million of beginning of year net deferred tax assets in New Zealand. Various other business units maintained full deferred tax asset valuation allowances that had been established in prior years. Also during 2017, after weighing all positive and negative evidence including a three-year cumulative income position and expectations of future profitability, the valuation allowance against the Colombian entity's deferred tax assets was released, resulting in a $1.6 million tax benefit. During 2017, many of these valuation allowances significantly increased or decreased in various jurisdictions as a result of deferred tax asset increases or decreases due to earnings, losses, cumulative translation adjustment, and divestitures.
During 2016, after weighing all positive and negative evidence, including three year cumulative loss positions, forecasted future profitability, impairments and restructuring charges, difficult market and industry conditions, and factoring in prudent and feasible tax planning strategies, a valuation allowance was recorded against $6.7 million of beginning of year net deferred tax assets associated with the business unit in China. The business unit did not have a deferred tax valuation allowance prior to 2016. Various other business units maintained full deferred tax asset valuation allowances that had been established in prior years, some for which the valuation allowance amounts increased significantly due to impairments, restructuring charges and operating losses.
The Company derives significant cash tax savings from the Subordinated Convertible Notes. For U.S. federal income tax purposes, the interest deduction on the Subordinated Convertible Notes is computed based on the comparable yield of a hypothetical fixed rate debt instrument with similar terms and conditions but no conversion feature. The comparable yield was determined based on independent appraisal to be 12.5%. Accordingly, annual interest deductions are calculated at 12.5% of the adjusted issue price. The adjusted issue price, and consequently the interest deduction for income tax purposes, grows over the term of the debt due to the difference between the interest deduction using a comparable yield of 12.5% on the adjusted issue price, and the coupon rate of 4.5% on the principal amount. Interest expense recognized in accordance with GAAP is calculated at 12.5% of the liability component of the Subordinated Convertible Notes, which is substantially lower than the adjusted issue price for tax purposes. The difference between the tax and GAAP interest computations results in substantially greater interest deductions for tax purposes than GAAP interest expense. The Company paid no U.S. federal income taxes for 2017 or 2016.
33
Year Ended December 31, 2016 Compared with Year Ended December 31, 2015
Net Sales
The following tables set forth net sales, metal-adjusted net sales and metal pounds sold by segment, in millions. For the metal-adjusted net sales results, net sales for 2015 have been adjusted to reflect the 2016 copper average price (based on COMEX) of $2.20 per pound (a $0.31 decrease compared to 2015) and the aluminum average price (based on LME) of $0.80 per pound (a $0.08 decrease compared to 2015).
Net Sales Year Ended | |||||||||||||
Dec 31, 2016 | Dec 31, 2015 | ||||||||||||
Amount | % | Amount | % | ||||||||||
North America | $ | 2,041.7 | 53 | % | $ | 2,299.3 | 51 | % | |||||
Europe | 875.7 | 23 | % | 960.2 | 21 | % | |||||||
Latin America | 655.2 | 17 | % | 726.8 | 16 | % | |||||||
Africa/Asia Pacific | 285.8 | 7 | % | 528.2 | 12 | % | |||||||
Total net sales | $ | 3,858.4 | 100 | % | $ | 4,514.5 | 100 | % | |||||
Metal-adjusted net sales, a non-GAAP financial measure, are provided below in order to eliminate an estimate of metal price volatility from the comparison of revenues from one period to another. The comparable GAAP financial measure is set forth above. See previous discussion of metal price volatility in “Significant Current Business Trends and Events - Effect of copper and aluminum prices".
Metal-Adjusted Net Sales Year Ended | |||||||||||||
Dec 31, 2016 | Dec 31, 2015 | ||||||||||||
Amount | % | Amount | % | ||||||||||
North America | $ | 2,041.7 | 53 | % | $ | 2,196.9 | 51 | % | |||||
Europe | 875.7 | 23 | % | 927.6 | 22 | % | |||||||
Latin America | 655.2 | 17 | % | 672.3 | 16 | % | |||||||
Africa/Asia Pacific | 285.8 | 7 | % | 491.3 | 11 | % | |||||||
Total metal-adjusted net sales | $ | 3,858.4 | 100 | % | $ | 4,288.1 | 100 | % | |||||
Metal adjustment | — | 226.4 | |||||||||||
Total net sales | $ | 3,858.4 | $ | 4,514.5 | |||||||||
Metal pounds sold is provided below as the Company believes this metric to be an appropriate measure of sales volume since it is not impacted by metal prices or foreign currency exchange rate changes.
Metal Pounds Sold Year Ended | |||||||||||
Dec 31, 2016 | Dec 31, 2015 | ||||||||||
Pounds | % | Pounds | % | ||||||||
North America | 548.0 | 54 | % | 543.9 | 51 | % | |||||
Europe | 154.0 | 15 | % | 155.0 | 15 | % | |||||
Latin America | 239.3 | 23 | % | 239.3 | 22 | % | |||||
Africa/Asia Pacific | 85.1 | 8 | % | 130.8 | 12 | % | |||||
Total metal pounds sold | 1,026.4 | 100 | % | 1,069.0 | 100 | % | |||||
Consolidated
Net sales decreased $656.1 million, or 15%, in 2016 from 2015. The net decrease was primarily attributable to:
• | The sale or exit of operations as part of the restructuring and divestiture programs of $211.2 million |
• | Lower copper and aluminum prices of $226.4 million |
• | Unfavorable product mix and foreign currency rate changes of $125.9 million and $97.3 million, respectively |
34
Volume, as measured by metal pounds sold, decreased 42.6 million pounds, or 4%, in 2016 compared to 2015, principally due to the impact of businesses sold in 2016. Excluding divested businesses, volume, as measured by metal pounds sold, increased 3.0 million pounds.
North America
Net sales in the North America segment decreased $257.6 million, or 11%, in 2016 from 2015. The net decrease was primarily attributable to:
• | Net sales of $51.7 million attributable to the automotive ignition wire business that was sold in 2016 |
• | Lower copper and aluminum prices of $102.4 million |
• | Unfavorable product mix and foreign currency rate changes of $94.9 million and $15.1 million, respectively |
Volume, as measured by metal pounds sold, increased 4.1 million pounds, or 1%, in 2016 compared to 2015. The increase was primarily attributable to favorable market demand for construction and electric utility cables which was partially offset by unfavorable market demand for specialty products, particularly oil and gas.
Europe
Net sales in the Europe segment decreased $84.5 million, or 9%, in 2016 from 2015. The net decrease was primarily attributable to:
• | Lower copper and aluminum prices of $32.6 million |
• | Unfavorable product mix and foreign currency exchange rate changes of $45.0 million and $5.3 million, respectively |
Volume, as measured by metal pounds sold, remained relatively flat in 2016 compared to 2015. Stronger demand for electric utility products including land-based turn-key projects as well as energy cables was offset by the continued weak demand for industrial and construction products throughout the region.
Latin America
Net sales in the Latin America segment decreased $71.6 million, or 10%, in 2016 from 2015. The net decrease was primarily attributable to:
• | Lower copper and aluminum prices of $54.5 million |
• | Unfavorable foreign currency exchange rate changes of $36.1 million |
• | These trends were partially offset by favorable product mix of $18.4 million |
Volume, as measured by metal pounds sold, remained relatively flat in 2016 compared to 2015. Increased volume for aerial transmission cables was offset by a decrease of 3.9 million pounds related to the sale of Venezuela coupled with ongoing difficult economic conditions and reduced government spending.
Africa/Asia Pacific
Net sales in the Africa/Asia Pacific segment decreased $242.4 million, or 46%, in 2016 from 2015. The net decrease was primarily attributable to:
• | Net sales of $153.9 million attributable to businesses that were sold as part of the divestiture program in 2016 |
• | Lower copper and aluminum prices of $36.9 million |
• | Unfavorable foreign currency exchange rate changes of $40.8 million |
Volume, as measured by metal pounds sold, decreased 45.7 million pounds, or 35%, in 2016 compared to 2015. The decrease in volume sold was primarily attributable to divested businesses of 41.7 million pounds.
Cost of Sales
Cost of sales decreased $630.8 million to $3,451.3 million in 2016 from $4,082.1 million in 2015. The percentage decrease in cost of sales was consistent with the percentage decrease in sales. As previously noted, cost of sales is raw material intensive with copper and aluminum comprising the major cost components for cable products. For the year ended December 31, 2016, material costs were approximately 85% of total product cost with copper and aluminum metal costs comprising approximately 45% of total product cost.
35
Gross Profit
Gross profit decreased $25.3 million, or 6% in 2016 as compared to 2015. Gross profit as a percentage of sales was 11% and 10% for the years ended December 31, 2016 and 2015, respectively.
Selling, General and Administrative Expenses
SG&A expense decreased $3.4 million, or 1%, in 2016 from 2015. The net favorable impact to SG&A expense was primarily attributable to the benefit of restructuring savings recognized in the year ended December 31, 2016. For 2016 and 2015, SG&A expense reflects the net impact of restructuring and divestiture actions as well as discrete items including the following:
• | In 2016, the Company recorded net pre-tax gains of $10.1 million on asset sales, restructuring related expenses of $48.8 million and SEC and DOJ related expenses of $54.3 million |
• | In 2015, the Company recorded restructuring expenses of $26.7 million and a Venezuela deconsolidation charge of $12.0 million, which were partially offset by net pre-tax gains on asset sales of $16.1 million |
SG&A as a percentage of net sales was approximately 11% in 2016 and 9% in 2015.
Operating Income
The following table sets forth operating income by segment, in millions of dollars.
Operating Income (Loss) Year Ended | |||||||||||||
Dec 31, 2016 | Dec 31, 2015 | ||||||||||||
Amount | % | Amount | % | ||||||||||
North America | $ | 62.4 | (341 | )% | $ | 84.5 | 583 | % | |||||
Europe | 2.6 | (14 | )% | 6.6 | 45 | % | |||||||
Latin America | (14.4 | ) | 79 | % | (22.8 | ) | (157 | )% | |||||
Africa/Asia Pacific | (68.9 | ) | 376 | % | (53.8 | ) | (371 | )% | |||||
Total operating income | $ | (18.3 | ) | 100 | % | $ | 14.5 | 100 | % | ||||
North America
The decrease in operating income for the North America segment was $22.1 million in the year ended December 31, 2016 compared to the year ended December 31, 2015. The net decrease in operating income was primarily due to the unfavorable net impact of the resolution of the SEC and DOJ investigations of $50.3 million coupled with the impact of weak end market demand for oil and gas products. The decrease was partially offset by the benefit of restructuring initiatives and by $10.5 million due to lower restructuring related charges (including gains on asset sales) and the impact of stronger demand for the electric utility and non-residential construction markets.
Europe
The decrease in operating income for the Europe segment was $4.0 million in the year ended December 31, 2016 compared to the year ended December 31, 2015. The net decrease in operating income was primarily attributable to the unfavorable impact of lower subsea project activity, the continued weak industrial and construction activity throughout the region and divestiture related charges of $8.4 million, including losses on divested businesses. The decrease was partially offset by $30.3 million due to lower restructuring related charges and the impact of divesting certain businesses, including the sale and deconsolidation of Venezuela (recorded in Europe based on the legal entity structure).
Latin America
The Latin America segment operating income improved $8.4 million in the year ended December 31, 2016 compared to the year ended December 31, 2015. The improvement in operating income was primarily driven by restructuring savings in the year ended December 31, 2016.
Africa/Asia Pacific
The increase in operating loss for the Africa/Asia Pacific segment was $15.1 million in the year ended December 31, 2016 compared to the year ended December 31, 2015. The net increase in operating loss was primarily attributable to higher costs related to divestiture activity of $18.3 million including gains and losses on sales and closures of businesses and asset-related costs.
36
Other Income (Expense)
Other income (expense) primarily includes foreign currency transaction gains or losses, which result from changes in exchange rates between the designated functional currency and the currency in which a transaction is denominated as well as gains and losses on derivative instruments that are not designated as cash flow hedges and Venezuela devaluation charges. During 2016 and 2015, the Company recorded other income of $7.2 million and other expense of $71.3 million, respectively.
For 2016, other income was primarily attributable to $8.9 million related to gains on derivative instruments that were not designated as cash flow hedges, partially offset by $1.7 million related to foreign currency transaction losses.
For 2015, other expense was primarily attributable to the adoption of the SIMADI currency exchange system in Venezuela and ongoing remeasurement of the local balance sheet, which resulted in an expense of $22.9 million, $41.2 million related to foreign currency transaction losses, and $7.2 million related to losses on derivative instruments which were not designated as cash flow hedges.
Interest Expense
Net interest expense decreased $7.3 million in 2016 as compared to 2015 primarily due to cash proceeds from divestitures which were utilized to pay down debt and lower borrowings due to the efficient management of working capital and lower metal prices in the year ended December 31, 2016 as well as the incremental interest expense recognized in the year ended December 31, 2015 on the Company's Senior Floating Rate Notes, which were paid on March 31, 2015.
Tax Provision
The Company’s effective tax rate for 2016 and 2015 was 3.8% and 9.8%, respectively. The Company’s low effective tax rate for 2016 was primarily due to the adverse impact of recognizing no tax benefit on operating losses incurred in jurisdictions where valuation allowances are recorded against net deferred tax assets, recording $6.7 million of tax expense to establish a valuation allowance against beginning of year net deferred tax assets in China, and recognizing no tax benefit on $27.8 million of foreign currency translation adjustments reclassified out of accumulated other comprehensive income into continuing operations related to the closure of our South African operations. These adverse effects were partially offset by the use of U.S. capital losses for which no tax benefit was previously recognized. This resulted in the recognition of only $2.2 million of income tax expense on $53.2 million of pre-tax gain associated with the sale of the North American Automotive Ignition Wire business. The Company’s relatively low 2015 effective tax rate was primarily due to the adverse impact of operating losses incurred in jurisdictions where valuation allowances are recorded against net deferred tax assets, partially offset by tax benefits associated with the exiting of business in India and the expiration of statutes of limitation on contingent tax liabilities in various jurisdictions.
During 2016, after weighing all positive and negative evidence, including three year cumulative loss positions, forecasted future profitability, impairments and restructuring charges, difficult market and industry conditions, and factoring in prudent and feasible tax planning strategies, a valuation allowance was recorded against $6.7 million of beginning of year net deferred tax assets associated with the business unit in China. The business unit did not have a deferred tax valuation allowance prior to 2016. Various other business units maintained full deferred tax asset valuation allowances that had been established in prior years, some for which the valuation allowance amounts increased significantly due to impairments, restructuring charges and operating losses.
During 2015, $1.4 million of valuation allowances were recorded against the December 31, 2015 deferred tax assets of the Brazilian automotive and South African units, and a $4.3 million tax benefit was recognized for the release of the valuation allowance against the German unit's deferred tax assets due to a sustained level of profitability. In addition, several other business units maintained full deferred tax asset valuation allowances that had been established in prior years, some for which the valuation allowance amounts increased significantly due to impairments, restructuring charges and operating losses.
The Company derives significant cash tax savings from the Subordinated Convertible Notes. For U.S. federal income tax purposes, the interest deduction on the Subordinated Convertible Notes is computed based on the comparable yield of a hypothetical fixed rate debt instrument with similar terms and conditions but no conversion feature. The comparable yield was determined based on independent appraisal to be 12.5%. Accordingly, annual interest deductions are calculated at 12.5% of the adjusted issue price. The adjusted issue price, and consequently the interest deduction for income tax purposes, grows over the term of the debt due to the difference between the interest deduction using a comparable yield of 12.5% on the adjusted issue price, and the coupon rate of 4.5% on the principal amount. Interest expense recognized in accordance with GAAP is calculated at 12.5% of the liability component of the Subordinated Convertible Notes, which is substantially lower than the adjusted issue price for tax purposes. The difference between the tax and GAAP interest computations results in substantially greater interest deductions for tax purposes than GAAP interest expense. The Company paid no U.S. federal income taxes for 2016 or 2015.
37
Liquidity and Capital Resources
Cash flows from operations as well as borrowings under the Revolving Credit Facility provide the primary source for financing operating expenses and other short term liquidity needs. As necessary, the Company incurs additional borrowings to fund working capital, debt and interest payments, as well as discretionary investment in product development, acquisitions, cash dividends and to fund tax payments. The overall cash position of the Company reflects the business results and a global cash management strategy that incorporates liquidity management, economic factors, and tax considerations.
Short term borrowings vary by period based on working capital requirements, which is dependent on incremental demand for products and changes in the price of copper, aluminum, and other raw material cost inputs. At December 31, 2017, current assets exceeded current liabilities by $801.8 million. Based upon historical experience, the cash on the balance sheet and the expected availability of funds under its credit facilities, the Company believes it has sufficient liquidity to meet funding requirements for cash dividends, working capital, capital expenditures, debt repayment, salaries and related benefits, restructuring activities, interest and taxes for the next twelve months and foreseeable future. The Company maintains approximately $369.1 million of excess availability under its various credit facilities around the world.
The Company generally borrows and repays its Revolving Credit Facility multiple times per month for working capital needs; borrowing on a short term basis is the most effective method to reduce interest costs based on the terms of the agreement. The Company's European operations also participate in accounts payable confirming arrangements with several financial institutions to address working capital requirements in the business. At December 31, 2017, the arrangements had a maximum availability limit of the equivalent of approximately $115.8 million, of which approximately $113.6 million was utilized. The Company's Latin American operations participate in short-term loans and accounts payable confirming arrangements for working capital purposes. At December 31, 2017, the short-term loans and accounts payable confirming arrangements had a maximum availability limit of the equivalent of approximately $87.5 million, of which approximately $44.6 million was utilized.
General Cable Corporation is a holding company with no operations of its own. All of the Company’s operations are conducted, and net sales are generated, by its subsidiaries and investments. Accordingly, the Company’s cash flow comes from the cash flows of its global operations. The Company’s ability to use cash flow from its international operations, if necessary, has historically been adversely affected by limitations on the Company’s ability to repatriate such earnings tax efficiently. As of December 31, 2017, and 2016, approximately 99% of cash and cash equivalents were held outside of the U.S. by the Company's foreign subsidiaries. If these funds were to be needed for the Company’s operations in the U.S., repatriation of the funds would, generally, result in foreign withholding taxes. However, the Company does not foresee a need to repatriate this cash to fund U.S. operations. In addition, the Revolving Credit Facility provides the Company flexibility in financing operating expenses and any other short term liquidity needs.
Summary of Cash Flows
Operating cash outflow of $39.0 million in 2017 reflects a net working capital use of $126.3 million driven principally by a decrease in accounts payable, accrued and other liabilities of $125.5 million primarily due to the $82.3 million of payments related to the resolution of the SEC and DOJ investigations and the $20.7 million decrease of the restructuring reserve in 2017 as well as an increase in receivables of $25.3 million reflecting an increase in copper and aluminum prices from December 31, 2016. The working capital use was partially offset by a decrease in inventories of $18.1 million as the Company has continued to tightly manage inventory levels despite rising metal prices. Partially offsetting the above use of cash to fund working capital requirements were cash earnings of $87.3 million defined as net income (loss) adjusted for depreciation and amortization, foreign currency exchange (gains) losses, deferred income taxes, non-cash asset impairment charges, non-cash interest charges, (gain) loss on disposal of subsidiaries and (gains) losses on disposal of property.
Operating cash inflow of $156.2 million in 2016 reflects a net working capital source of $144.8 million driven principally by a decrease in inventories of $52.6 million as the Company has continued to tightly manage inventory levels as well as an increase in accounts payables, accrued and other liabilities of $73.7 million primarily due to the $54.3 million increase in the SEC and DOJ investigations accrual in 2016 and a decrease in receivables of $11.2 million through timely customer collections. In addition, the operating cash inflow of $156.2 million in 2016 reflects a source of $11.4 million related to net income (loss) adjusted for depreciation and amortization, foreign currency exchange (gains) losses, deferred income taxes, non-cash asset impairment charges, non-cash interest charges, (gains) losses on disposal of subsidiaries and (gains) losses on disposal of property.
Operating cash inflow of $199.7 million in 2015 reflects a net working capital source of $121.8 million driven principally by a decrease in receivables of $133.5 million due to a decrease in volume sold and lower copper and aluminum prices in the fourth quarter of 2015 compared to the fourth quarter of 2014 and due to a decrease in inventory of $34.0 million related to the continued efficient management of inventory levels in 2015 and lower copper and aluminum prices in the fourth quarter of 2015 compared to the fourth quarter of 2014. The net working capital source was partially offset by a decrease in accounts payable, accrued and other liabilities of $68.7 million in 2015 which was primarily driven by the decrease in working capital needs. In addition, the operating cash inflow of $199.7 million in 2015 reflects a source of $77.9 million related to net income (loss) adjusted for depreciation and amortization, foreign currency exchange (gains) losses, deferred income taxes, Venezuela deconsolidation charge,
38
non-cash asset impairment charges, non-cash interest charges, (gains) losses on disposal of subsidiaries and (gains) losses on disposal of property.
The cash outflow from investing activities was $81.4 million in 2017 principally reflecting $85.4 million of capital expenditures. The Company anticipates capital spending to be approximately $50 million to $60 million in 2018.
Financing activities resulted in $98.5 million of cash inflows in 2017. The cash inflows of $98.5 million in 2017 were primarily attributable to increased borrowings on the Company's Revolving Credit Facility of $183.6 million, partially offset by repayments to the Latin America credit facilities and dividend payments of $37.4 million to all common shareholders of record for the year ended December 31, 2017. Future declarations of dividends and the establishment of future record dates and payment dates are subject to the final determination of our Board of Directors. In determining dividends, the Board of Directors takes into consideration items such as general business conditions, financial performance, projected cash flows and anticipated financing needs. Future payments of dividends are also subject to the Company's Revolving Credit Facility, the indenture governing the 5.75% Senior Notes, and the requirements of the Delaware General Corporation law.
Financing activities resulted in $166.9 million of cash outflows in 2016 as compared to cash outflows of $260.1 million in 2015. During the year ended December 31, 2016, the Company paid $18.0 million to the minority shareholders for their entire 40% interest in Procables. During the years ended December 31, 2016 and 2015, the Company paid dividends in total of approximately $35.6 million and $35.3 million to all common shareholders of record, respectively.
The Company evaluates various factors such as future operating cash flow requirements, other cash flow expectations, investment and financing strategic plans and the overall cost of capital to determine the appropriate levels of short and long-term debt to maintain. Refer to "Debt and Other Contractual Obligations" below for details.
Debt and Other Contractual Obligations
The Company had outstanding debt obligations of $1,085.7 million as of December 31, 2017 and maintained approximately $369.1 million of excess availability under its various credit facilities around the world. The Company utilizes short and long-term debt to address working capital needs, restructuring payments, merger related expenses, debt repayments and interest payments as well as discretionary investments in product development, acquisitions, payment of dividends, repurchase of common stock and taxes. Short-term liquidity and working capital needs are generally supported through operating cash flows as well as borrowings under the Revolving Credit Facility. The Revolving Credit Facility was amended and restated on May 22, 2017 to, among other things, extend the maturity date to May 22, 2022; the facility size remained unchanged at $700 million, $441 million of which may be borrowed by the U.S. borrower, $210 million of which may be borrowed by the European borrowers and $49 million of which may be borrowed by the Canadian borrower. The Company maintains ratings on its public debt; therefore, the Company has and expects to continue to obtain market rates on any new borrowings.
Failure to comply with any of the covenants, financial tests and ratios required by the Company's existing or future debt obligations could result in a default under those agreements and under other agreements containing cross-default provisions, as defined in the Company's Revolving Credit Facility, Subordinated Convertible Notes, 5.75% Senior Notes and various other credit facilities maintained by the Company's subsidiaries. A default would permit lenders to cease making further extensions of credit, accelerate the maturity of the debt under these agreements and foreclose upon any collateral securing that debt. Indebtedness under the Revolving Credit Facility is secured by: (a) for US borrowings under the facility, a first priority security interest in certain tangible and intangible property and assets of certain of the Company’s U.S. subsidiaries, and (b) for Canadian and European borrowings under the facility, a first priority security interest in certain tangible and intangible property and assets of certain of the Company’s Canadian subsidiaries and European subsidiaries. In addition, the lenders under the Revolving Credit Facility have received a pledge of (i) 100% of the equity interests in certain of the Company’s domestic, Canadian and European subsidiaries, and (ii) 65% of the voting equity interests in and 100% of the non-voting equity interests in each material foreign subsidiary directly owned by a U.S. Loan Party.
As of December 31, 2017 and December 31, 2016, the Company was in compliance with all debt covenants.
The Company’s defined benefit plans at December 31, 2017 and 2016 were underfunded by $119.5 million and $117.4 million, respectively. The Company recorded an after-tax loss of $6.0 million and an after-tax gain of $6.6 million in 2017 and 2016, respectively, to accumulated other comprehensive income. The Company estimates its 2018 pension expense for its defined benefit pension plans will be approximately $4.6 million and cash contributions are expected to be approximately $10.7 million. In 2017, pension expense was $6.1 million and cash contributions were $6.8 million.
39
The Company anticipates being able to meet its obligations as they come due based on historical experience and the expected availability of funds under its credit facilities. The Company’s contractual obligations and commercial commitments as of December 31, 2017 (in millions of dollars) are summarized below:
Payments Due by Period | ||||||||||||||||||||
Less than | 1 – 3 | 4 – 5 | More than | |||||||||||||||||
Contractual obligations (1,2,3): | Total | 1 Year | Years | Years | 5 Years | |||||||||||||||
Total debt | $ | 1,085.7 | $ | 46.9 | $ | 1.7 | $ | 855.0 | $ | 182.1 | ||||||||||
Convertible debt at maturity (4) | 253.1 | — | — | — | 253.1 | |||||||||||||||
Interest payments on 5.75% Senior Notes | 163.9 | 34.5 | 69.0 | 60.4 | — | |||||||||||||||
Interest payments on Subordinated Convertible Notes | 132.8 | 19.3 | 27.8 | 19.3 | 66.4 | |||||||||||||||
Operating leases (5) | 63.2 | 15.4 | 24.3 | 13.6 | 9.9 | |||||||||||||||
Purchase obligations (6) | 15.9 | 15.9 | — | — | — | |||||||||||||||
Defined benefit pension obligations (7) | 185.7 | 21.5 | 37.1 | 37.3 | 89.8 | |||||||||||||||
Postretirement benefits | 7.4 | 0.7 | 1.1 | 1.0 | 4.6 | |||||||||||||||
Restructuring activities | 3.0 | 3.0 | — | — | — | |||||||||||||||
Unrecognized tax benefits, including interest and penalties (8) | — | — | — | — | — | |||||||||||||||
Total | $ | 1,910.7 | $ | 157.2 | $ | 161.0 | $ | 986.6 | $ | 605.9 | ||||||||||
(1) | This table does not include interest payments on General Cable’s revolving credit facilities because the future amounts are based on variable interest rates and the amount of the borrowings under the Revolving Credit Facility fluctuate depending upon the Company’s working capital requirements. |
(2) | This table does not include derivative instruments as the ultimate cash outlays cannot be reasonably predicted. Refer to Note 12 - Financial Instruments and Item 7A - Quantitative and Qualitative Disclosures about Market Risk for additional information. |
(3) | This table does not include any impact from the one-time deemed repatriation tax provision of the Tax Reform Act as the Company currently expects to utilize net operating loss carryforwards as opposed to cash to settle the repatriation tax liability. |
(4) | Represents the current debt discount on the Company’s Subordinated Convertible Notes as a result of adopting provisions of ASC 470 - Debt ("ASC 470"). Refer to Note 2 - Summary of Significant Accounting Policies for additional information. |
(5) | Operating lease commitments are described under “Off Balance Sheet Assets and Obligations.” |
(6) | Represents our firm purchase commitments. |
(7) | Defined benefit pension obligations reflect actuarially projected benefit payments which may differ from funding requirements based on local laws and regulations through 2025. |
(8) | Unrecognized tax benefits of $10.0 million have not been reflected in the above table due to the inherent uncertainty as to the amount and timing of settlement, which is contingent upon the occurrence of possible future events, such as examinations and determinations by various tax authorities. |
Off Balance Sheet Assets and Obligations
As of December 31, 2017, the Company had $31.7 million in letters of credit, $187.6 million in various performance bonds and $123.6 million in other guarantees outstanding. Other guarantees include bank guarantees and advance payment bonds. These letters of credit, performance bonds and guarantees are periodically renewed and are generally related to risk associated with self-insurance claims, defined benefit plan obligations, contract performance, quality and other various bank and financing guarantees. Advance payment bonds are often required by customers when the Company obtains advance payments to secure the production of cable for long-term contracts. The advance payment bonds provide the customer protection on their deposit in the event that the Company does not perform under the contract. See "Liquidity and Capital Resources" for excess availability under the Company’s various credit borrowings.
Environmental Matters
The Company’s expenditures for environmental compliance and remediation amounted to approximately $4.2 million in 2017 and 2016 and $2.7 million in 2015. In addition, certain General Cable subsidiaries have been named as potentially responsible parties in proceedings that involve environmental remediation. The Company has accrued $4.7 million and $5.6 million at December 31, 2017 and 2016, respectively, for all environmental liabilities. Environmental matters are described in Item 1 - Business and Note 19 - Commitments and Contingencies. While it is difficult to estimate future environmental liabilities, the Company does not currently anticipate any material adverse effect on results of operations, cash flows or financial position as a result of compliance with federal, state, local or foreign environmental laws or regulations or remediation costs.
Legal Matters
Refer to Note 19 - Commitments and Contingencies for review of the Company's litigation contingencies.
40
Critical Accounting Policies and Estimates
The Company’s consolidated financial statements have been prepared in accordance with GAAP. A summary of significant accounting policies is provided in Note 2 - Summary of Significant Accounting Policies. The application of these policies requires management to make estimates and judgments that affect the amounts reflected in the consolidated financial statements. Management bases its estimates and judgments on historical experience, information that is available to management about current events and actions the Company may take in the future and various other factors that are believed to be reasonable under the circumstances. Actual results may differ from these estimates under different assumptions or conditions. In addition, estimates and judgments include allowances for accounts receivable and deferred income taxes; legal, compliance, environmental, and asbestos liabilities; inventory costing and valuation; share-based compensation; uncertain tax positions; assets and obligations related to pension and other postretirement benefits; intangible and long-lived asset valuations; financial instruments; and revenue recognized under the percentage-of-completion method. There can be no assurance that actual results will not differ from these estimates.
Principles of Consolidation
The Company’s consolidated financial statements include the accounts of wholly-owned subsidiaries and majority-owned controlled subsidiaries. The Company records its investment in each unconsolidated affiliated Company (generally 20-50 percent ownership in which it has the ability to exercise significant influence) at its respective equity in net assets. Other investments (generally less than 20 percent ownership) are recorded at cost. All intercompany transactions and balances among the consolidated companies have been eliminated.
Revenue Recognition
The majority of the Company’s revenue is recognized when goods are shipped to the customer, title and risk of loss are transferred, pricing is fixed or determinable and collectability is reasonably assured. Most revenue transactions represent sales of inventory. A provision for payment discounts, product returns, warranty and customer rebates is estimated based upon historical experience and other relevant factors and is recorded within the same period that the revenue is recognized. The Company has a portion of long-term contracts for specialized products that can include installation and/or other services and is recognized based on the percentage of completion method generally based on the cost-to-cost method if there are reasonably reliable estimates of total revenue, total cost, and the extent of progress toward completion; and there is an enforceable agreement between parties who can fulfill their contractual obligations. Management reviews contract price and cost estimates periodically as the work progresses and reflects adjustments proportionate to the percentage-of-completion to income in the period when those estimates are revised. For these contracts, if a current estimate of total contract cost indicates a loss on a contract, the projected loss is recognized in full when determined.
Accounts Receivable
The accounts receivable balance is recorded at the stated amount, less allowances for doubtful accounts, price discounts, and returns. At the time of the sale and at each quarter, the Company evaluates the accounts receivable balance to determine a best estimate for doubtful accounts, price discounts, and returns. The Company reviews general historical trends in the account, customer overdue balances, high risk accounts that have been specifically identified based on historical and current customer patterns, contractual obligations, and current economic conditions to determine an estimate for these allowances.
Inventory Costing and Valuation
The Company’s inventories are valued using the average cost method. All inventories are stated at the lower of cost and net realizable value. To determine if a lower of cost or net realizable value is required, the Company evaluates evidence to indicate if the cost will be recovered with an approximately normal profit upon sale in the ordinary course of business based on product groupings within the reportable segments. Metal costs, particularly copper and aluminum costs, are significant to our overall costs in inventory. Factors such as technological innovations, future demand trends, pricing environment, inventory levels and turns and specific identification of inventory items, such as regulatory-related changes or changes in engineering or material, are considered in the obsolete and slow moving inventory analysis.
Pension Accounting
The Company provides retirement benefits through contributory and non-contributory qualified and non-qualified defined benefit pension plans covering eligible domestic and international employees as well as through defined contribution plans and other postretirement benefits. Benefits under the Company’s qualified U.S. defined benefit pension plan generally are based on years of service multiplied by a specific fixed dollar amount, and benefits under the Company’s qualified non-U.S. defined benefit pension plans generally are based on years of service and a variety of other factors that can include a specific fixed dollar amount or a percentage of either current salary or average salary over a specific period of time. The amounts funded for any plan year for the qualified U.S. defined benefit pension plan are neither less than the minimum required under federal law nor more than the maximum amount deductible for federal income tax purposes. The Company’s non-qualified unfunded U.S. defined benefit pension
41
plans include a plan that provides defined benefits to select senior management employees beyond those benefits provided by other programs. The Company’s non-qualified unfunded non-U.S. defined benefit pension plans include plans that provide retirement indemnities to employees. Pension obligations for the non-qualified unfunded defined benefit pension plans are provided for and are based on local practices and regulations of the respective countries. The Company makes cash contributions for the costs of the non-qualified unfunded defined benefit pension plans as the benefits are paid.
Benefit costs for the defined benefit pension plans sponsored by the Company are determined based principally upon certain actuarial assumptions, including the discount rate and the expected long-term rate of return on plan assets. The weighted-average discount rate used to determine the net pension expense for 2017 was 3.87% for the U.S. defined benefit pension plans. The weighted-average discount rate as of December 31, 2017 that was used to determine benefit obligations was 3.50% for the U.S. defined benefit pension plans, and was determined based on hypothetical yield curves developed using yields of corporate bonds across the full maturity spectrum of the projected pension benefit obligations and based on information received from actuaries. The included bonds are AA-rated (or equivalent quality) by a a recognized rating agency. The weighted-average discount rate used to determine the net pension cost for 2017 was 2.92% for the non-U.S. defined benefit pension plans. Non-U.S. defined benefit pension plans followed a similar evaluation process based on financial markets in those countries where the Company provides a defined benefit pension plan, and the weighted-average discount rate used to determine benefit obligations for the Company’s non-U.S. defined benefit pension plans was 2.30% as of December 31, 2017. The Company’s expense under both U.S. and non-U.S. defined benefit pension plans is determined using the discount rate as of the beginning of the fiscal year, and as a result, 2018 expense for the defined benefit pension plans will be based on the weighted-average discount rate of 3.50% for U.S. plans and 2.30% for non-U.S. plans.
The weighted-average long-term expected rate of return on assets is based on input from actuaries, including their review of historical 10-year, 20-year, and 25-year rates of inflation and real rates of return on various broad equity and bond indices in conjunction with the diversification of the asset portfolio. The Company’s overall investment strategy is to diversify its investments for the qualified U.S. defined benefit pension plan based on an asset allocation assumption of 65% allocated to equity investments, with an expected real rate of return of 6%, and 35% to fixed-income investments, with an expected real rate of return of 2%, and an assumed long-term rate of inflation of 3%. Equity investments primarily include investments in large-cap and mid-cap companies primarily located in the United States.
The determination of pension expense for the qualified defined benefit pension plans is based on the fair market value of assets as of the measurement date. Investment gains and losses are recognized in the measurement of assets immediately. Such gains and losses will be amortized and recognized as part of the annual benefit cost to the extent that unrecognized net gains and losses from all sources exceed 10% of the greater of the projected benefit obligation or the market value of assets.
The Company evaluates its actuarial assumptions at least annually, and adjusts them as necessary. The Company uses a measurement date of December 31 for all of its defined benefit pension plans. In 2017, pension expense for the Company’s defined benefit pension plans was $6.1 million. Based on a weighted-average expected rate of return on plan assets of 5.87%, a weighted-average discount rate of 2.92% and various other assumptions, the Company estimates its 2018 pension expense for its defined benefit pension plans will decrease to approximately $4.6 million. A 1% decrease in the assumed discount rate would increase pension expense by approximately $1.0 million. Future pension expense will depend on future investment performance, changes in future discount rates and various other factors related to the populations participating in the plans. In the event that actual results differ from the actuarial assumptions, the funded status of the defined benefit pension plans may change and any such change could result in a charge or credit to equity and an increase or decrease in future pension expense and cash contributions.
The Company’s investment policies and strategies, categories of plan assets, fair value measurements of plan assets, and significant concentrations of risk are described in further detail in Note 14 - Employee Benefit Plans.
Income Taxes
The Company is subject to income tax in numerous United States federal, state, and foreign jurisdictions. Significant judgments and estimates are inherent in determining the Company's consolidated income tax expense, current tax payable, deferred tax assets and liabilities, and liabilities for uncertain tax positions. Future events such as changes in business conditions, tax legislation, tax audit resolutions, or foreign earnings repatriation plans could materially impact these estimates and the Company's tax position.
Deferred tax assets and liabilities are determined based on the differences between the financial statement basis and tax basis of assets and liabilities using enacted tax rates in effect for the year in which the differences are expected to reverse. The effect of a change in tax rates on deferred tax assets and liabilities is recognized in income in the period that includes the enactment date. At December 31, 2017, the Company had recorded a net deferred tax liability of $100.7 million ($128.4 million deferred tax asset less $229.1 million deferred tax liability). The valuation of deferred tax assets is dependent on, among other things, the ability of the Company to generate a sufficient level of future taxable income. In estimating future taxable income, the Company has considered both positive and negative evidence, such as historical and forecasted results of operations, including prior losses, and has considered the implementation of prudent and feasible tax planning strategies. As of December 31, 2017, the Company recorded a valuation allowance of $157.4 million to reduce deferred tax assets to the amount judged more likely than not to be realized.
42
The Company has and will continue to review on a quarterly basis its assumptions and tax planning strategies, and, if the amount of the estimated realizable deferred tax assets is less than the amount currently on the balance sheet, the Company will reduce its deferred tax asset, recognizing a non-cash charge against reported earnings. Likewise, if the Company determines that a valuation allowance against a deferred tax asset is no longer appropriate, the adjustment to the valuation allowance would reduce income tax expense.
The Company operates in multiple jurisdictions with complex tax policies and regulations. In certain jurisdictions, the Company has taken tax positions that it believes are supportable, but which could be subject to challenge by the tax authorities. These tax positions are evaluated and liabilities for uncertain tax positions are established in accordance with the ASC 740 - Income Taxes ("ASC 740") tax accounting guidance. The status of uncertain tax positions is reviewed in light of changing facts and circumstances, such as tax audits, rulings, and case law, and the related liabilities are adjusted accordingly.
The Company recognizes interest and penalties related to unrecognized tax benefits within the income tax expense line in the accompanying Consolidated Statements of Operations and Comprehensive Income (Loss). Accrued interest and penalties are included within the related tax liability line item in the Consolidated Balance Sheets.
Long-Lived Assets and Impairment
The valuation and classification of long-lived assets and the assignment of useful depreciable and amortizable lives and salvage values involve significant judgments and the use of estimates. The testing of these long-lived assets for impairment also requires a significant amount of judgment and assumptions, particularly as it relates to identification of asset groups and the determination of fair market value. The Company periodically evaluates the recoverability of the carrying amount of long-lived assets whenever events or changes in circumstances indicate that the carrying amount of an asset may not be fully recoverable. The Company evaluates events or changes in circumstances based on historical operating results, forecasts, general and industry trends and anticipated cash flows. Impairment is assessed when the undiscounted expected future cash flows derived from an asset group are less than its carrying amount. Impairment losses are measured as the amount by which the carrying value of an asset group exceeds its fair value and are recognized in earnings. The Company also continually evaluates the estimated useful lives of all long-lived assets and, when warranted, revises such estimates based on current events. See Note 4 - Divestitures, Note 5 - Restructuring and Note 8 - Property, Plant and Equipment.
Share-Based Compensation
The Company has various plans which provide for granting options and common stock to certain employees and independent directors of the Company and its subsidiaries. All share-based payments to employees, including grants of employee stock options, are recognized in the financial statements based on their fair values. The fair values of certain awards are estimated on the grant date using the Black-Scholes valuation and the Monte Carlo simulation models, which incorporate certain assumptions regarding the expected term of an award and expected stock price volatility. The Company develops the expected term assumptions based on the vesting period and contractual term of an award, historical exercise and post-vesting cancellation experience, stock price history, plan provisions that require exercise or cancellation of awards after employees terminate, and the extent to which currently available information indicates that the future is reasonably expected to differ from past experience. The Company develops the expected volatility assumptions based on the monthly historical price data from the Company’s common stock and other economic data trended into future years. After calculating the aggregate fair value of an award, the Company uses an estimated forfeiture rate to discount the amount of share-based compensation costs to be recognized in the operating results over the service period of the award. The Company develops the forfeiture assumption based on its historical pre-vesting cancellation experience. Key assumptions are described in further detail in Note 16 - Share-Based Compensation.
Loss Contingencies
The Company determines whether to accrue and/or disclose for loss contingencies based on an assessment of whether the risk of loss is remote, reasonably possible or probable. The Company's assessment is developed in consultation with its outside counsel and other advisers and is based on an analysis of possible outcomes. Loss contingency assumptions involve judgments that are inherently subjective and can involve matters that are in litigation, which, by its nature is unpredictable. The Company believes that its assessment of the probability of loss contingencies is reasonable, but because of the subjectivity involved and the unpredictable nature of the subject matter at issue, the Company's assessment may prove ultimately to be incorrect, which could materially impact the consolidated financial statements. See Note 19 - Commitments and Contingencies.
New Accounting Standards
A discussion of recently issued accounting pronouncements is described in Note 2 - Summary of Significant Accounting Policies, in Item 8 - Financial Statements and Supplementary Data of this report, and we incorporate such discussion in this MD&A by reference and make it a part hereof.
43
ITEM 7A. | QUANTITATIVE AND QUALITATIVE DISCLOSURES ABOUT MARKET RISK |
The Company is exposed to various market risks, including changes in interest rates, foreign currency exchange rates and raw material (commodity) prices. To manage risk associated with the volatility of these natural business exposures, the Company enters into commodity and foreign currency derivative agreements as well as copper and aluminum forward pricing agreements. The Company does not purchase or sell derivative instruments for trading purposes. The Company does not engage in trading activities involving commodity contracts for which a lack of marketplace quotations would necessitate the use of fair value estimation techniques.
Interest Rate Risk
The Company is subject to interest rate risk on its fixed and floating rate debt. As of December 31, 2017, $318.4 million of the Company’s debt and $113.6 million of the Company's accounts payable confirming arrangements were subject to changes in short-term interest rates.
As it relates to the Company’s variable rate debt and accounts payable confirming arrangements, assuming no changes in the Company’s financial structure, if market interest rates average 1% higher over the next twelve months than the market interest rates as of December 31, 2017, interest expense for the next twelve months would increase by approximately $4.3 million. This amount was determined by calculating the effect of the hypothetical interest rate on our variable rate debt. This calculated, hypothetical increase in interest expense for the following twelve months may be different from the actual increase in interest expense from a 1% increase in interest rates due to varying interest rate reset dates on the Company’s floating rate debt.
Raw Material Price Risk
The costs of copper and aluminum, the most significant raw materials we use, have been subject to considerable volatility caused by supply conditions, weather, political and economic variables as well as other unknown and unpredictable variables. This copper and aluminum price volatility is representative of all reportable segments. In addition, the Company has historically experienced volatility on raw materials other than copper and aluminum used in cable manufacturing, such as insulating compounds, wood reels, freight costs and energy costs. Generally, the Company attempts to adjust selling prices in most of its markets in order to offset the impact of this raw material price and other cost volatility on reported earnings. The Company’s ability to execute and ultimately realize price adjustments is influenced by competitive conditions in its markets, including manufacturing capacity utilization.
The Company enters into commodity instruments to hedge the purchase of copper, aluminum as well as other raw materials in future periods. Principal transactions hedged during the year were firm sales and purchase commitments. In 2017, the Company accounted for these commodity instruments as economic hedges. Changes in the fair value of economic hedges are recognized in current period earnings in other income (expense).
In 2017, the Company estimates that a 10% increase in copper and aluminum costs over current market prices would have increased the Company's Cost of sales by approximately $171 million. The impact of this would directly impact gross profit if the Company was unable to increase prices with the rise in the price of copper and aluminum.
Foreign Currency Exchange Rate Risk
The Company operates in multiple countries throughout the globe; therefore, the Company is exposed to fluctuations in foreign currency exchange rates. The Company is exposed to transactional foreign currency risk, the risk when transactions not denominated in the functional currency in which the Company operates are revalued. The Company enters into foreign currency exchange contracts principally to hedge the currency fluctuations in certain transactions denominated in foreign currencies, thereby limiting the Company's risk that would otherwise result from changes in exchange rates. Principal transactions hedged during the year were firm sales and purchase commitments. The fair value of foreign currency contracts represents the amount required to enter into offsetting contracts with similar remaining maturities based on quoted market prices.
In 2017, the Company accounted for these foreign currency exchange contracts as economic hedges. Changes in the fair value of economic hedges are recognized in current period earnings in other income (expense).
In addition, to mitigate these risks, the Company believes it is appropriate to finance those operations with borrowings denominated in the local currency to the extent practicable where debt financing is desirable or necessary. Considerations which influence the amount of such borrowings include long- and short-term business plans, tax implications, and the availability of borrowings with acceptable interest rates and terms. In those countries where the local currency is the designated functional currency, this strategy mitigates the risk of reported losses or gains in the event the foreign currency strengthens or weakens against the U.S. dollar.
The Company also has exposure to foreign currency exchange risk when the results of its international operating units are translated from the local currency into the U.S. dollar. At December 31, 2017 and 2016, the accumulated other comprehensive income (loss) account included in the total equity section of the Consolidated Balance Sheets included a cumulative translation loss of
44
$165.3 million and $228.2 million, respectively. A 10% increase in the value of the U.S. dollar relative to foreign currencies would increase the cumulative translation loss resulting in a reduction to recorded equity of approximately $40.1 million in 2017. This sensitivity analysis is inherently limited as it assumes that rates of multiple foreign currencies will always move in the same direction relative to the value of the U.S. dollar.
Uncertainty in the global market conditions has resulted in, and may continue to cause, significant volatility in foreign currency exchange rates which could increase these risks, particularly in the Company’s emerging or developing markets within its Latin America segment.
ITEM 8. | FINANCIAL STATEMENTS AND SUPPLEMENTARY DATA |
Page | |
ITEM 9. | CHANGES IN AND DISAGREEMENTS WITH ACCOUNTANTS ON ACCOUNTING AND FINANCIAL DISCLOSURE |
None.
45
ITEM 9A. | CONTROLS AND PROCEDURES |
The Company maintains disclosure controls and procedures that are designed to ensure that information required to be disclosed in the Company's reports under the Securities Exchange Act of 1934, as amended (the “Exchange Act”), is recorded, processed, summarized and reported within the time periods specified in the SEC's rules and forms, and that such information is accumulated and communicated to management, including the Company's Chief Executive Officer (“CEO”) and Chief Financial Officer (“CFO”) as appropriate to allow timely decisions regarding required disclosure. A control system, no matter how well conceived and operated, can provide only reasonable, not absolute, assurance that the objectives of the control system are met.
Management, under the supervision and with the participation of our CEO and CFO, evaluated the effectiveness of the Company's disclosure controls and procedures (as defined in Rule 13a-15(e) and 15d-15(e) under the Exchange Act) as of the end of the period covered by this report (the “Evaluation Date”). Based upon that evaluation, the CEO and CFO have concluded that the design and operation of the Company's disclosure controls and procedures at a reasonable assurance level were effective as of December 31, 2017.
Management's Annual Report on Internal Control over Financial Reporting
Management, under the supervision of the CEO and CFO, is responsible for establishing and maintaining adequate internal control over financial reporting. Internal control over financial reporting, as defined in Rules 13a-15(f) and 15d-15(f) promulgated under the Exchange Act, is a process designed by, or under the supervision of, the CEO and CFO and is effected by the board of directors, management and other personnel to provide reasonable assurance regarding the reliability of financial reporting and the preparation of financial statements for external reporting purposes in accordance with GAAP. Internal control over financial reporting includes those policies and procedures that:
• | Pertain to the maintenance of records that, in reasonable detail, accurately and fairly reflect the transactions and dispositions of the assets of the Company; |
• | Provide reasonable assurance that transactions are recorded as necessary to permit preparation of financial statements in accordance with GAAP, and that the receipts and expenditures of the Company are being made only in accordance with appropriate authorization of management and the board of directors; and |
• | Provide reasonable assurance regarding prevention or timely detection of unauthorized acquisition, use or disposition of the Company's assets that could have a material effect on the financial statements. |
Because of its inherent limitations, internal control over financial reporting may not prevent or detect misstatements. Also, projections of any evaluation of effectiveness to future periods are subject to the risk that controls may become inadequate because of changes in conditions, or that the degree of compliance with the policies or procedures may deteriorate.
Management evaluated the effectiveness of the Company's internal control over financial reporting as of December 31, 2017 using the framework established in "Internal Control-Integrated Framework (2013)" issued by the Committee of Sponsoring Organizations of the Treadway Commission (“COSO”). Based on this assessment, management concluded that, as of December 31, 2017, the Company’s internal control over financial reporting was effective.
The effectiveness of the Company’s internal control over financial reporting as of December 31, 2017 has been audited by Deloitte & Touche LLP, an independent registered public accounting firm, as stated in their report which appears herein.
Changes in Internal Control Over Financial Reporting
There have been no changes in the Company’s internal control over financial reporting, as such item is defined in Exchange Act Rules 13a–15(f) and 15d–15(f), during the fiscal quarter ended December 31, 2017, that have materially affected, or are reasonably likely to materially affect, the Company’s internal control over financial reporting.
46
REPORT OF INDEPENDENT REGISTERED PUBLIC ACCOUNTING FIRM
To the Board of Directors and Shareholders of
General Cable Corporation
Highland Heights, Kentucky
Opinion on Internal Control over Financial Reporting
We have audited the internal control over financial reporting of General Cable Corporation and subsidiaries (the "Company") as of December 31, 2017, based on criteria established in Internal Control - Integrated Framework (2013) issued by the Committee of Sponsoring Organizations of the Treadway Commission (COSO). In our opinion, the Company maintained, in all material respects, effective internal control over financial reporting as of December 31, 2017, based on the criteria established in Internal Control - Integrated Framework (2013) issued by COSO.
We have also audited, in accordance with the standards of the Public Company Accounting Oversight Board (United States) (PCAOB), the consolidated financial statements as of and for the year ended December 31, 2017 of the Company and our report dated February 28, 2018 expressed an unqualified opinion on those financial statements.
Basis for Opinion
The Company's management is responsible for maintaining effective internal control over financial reporting and for its assessment of the effectiveness of internal control over financial reporting, included in the accompanying Management's Annual Report on Internal Control over Financial Reporting. Our responsibility is to express an opinion on the Company's internal control over financial reporting based on our audit. We are a public accounting firm registered with the PCAOB and are required to be independent with respect to the Company in accordance with the U.S. federal securities laws and the applicable rules and regulations of the Securities and Exchange Commission and the PCAOB.
We conducted our audit in accordance with the standards of the PCAOB. Those standards require that we plan and perform the audit to obtain reasonable assurance about whether effective internal control over financial reporting was maintained in all material respects. Our audit included obtaining an understanding of internal control over financial reporting, assessing the risk that a material weakness exists, testing and evaluating the design and operating effectiveness of internal control based on the assessed risk, and performing such other procedures as we considered necessary in the circumstances. We believe that our audit provides a reasonable basis for our opinion.
Definition and Limitations of Internal Control over Financial Reporting
A company's internal control over financial reporting is a process designed to provide reasonable assurance regarding the reliability of financial reporting and the preparation of financial statements for external purposes in accordance with generally accepted accounting principles. A company's internal control over financial reporting includes those policies and procedures that (1) pertain to the maintenance of records that, in reasonable detail, accurately and fairly reflect the transactions and dispositions of the assets of the company; (2) provide reasonable assurance that transactions are recorded as necessary to permit preparation of financial statements in accordance with generally accepted accounting principles, and that receipts and expenditures of the company are being made only in accordance with authorizations of management and directors of the company; and (3) provide reasonable assurance regarding prevention or timely detection of unauthorized acquisition, use, or disposition of the company's assets that could have a material effect on the financial statements.
Because of its inherent limitations, internal control over financial reporting may not prevent or detect misstatements. Also, projections of any evaluation effectiveness to future periods are subject to the risk that the controls may become inadequate because of changes in conditions, or that the degree of compliance with the policies or procedures may deteriorate.
/s/ Deloitte & Touche LLP
Cincinnati, Ohio
February 28, 2018
47
ITEM 9B. | OTHER INFORMATION |
None.
PART III.
ITEM 10. | DIRECTORS, EXECUTIVE OFFICERS AND CORPORATE GOVERNANCE |
The information provided below is biographical information, as of February 20, 2018, about each of our directors, and the background, experience and qualifications the Corporate Governance Committee and the Board considered in determining that each such person should serve as a director.
John E. Welsh, III Age 67 Director since 1997 Non-Executive Chairman of the Board and Member of the Corporate Governance Committee | Mr. Welsh has served as President of Avalon Capital Partners LLC, an investment firm focused on private equity and public securities investments since 2002. From October 2000 to December 2002, he was a Managing Director of CIP Management LLC, the management company for Continuation Investments Group Inc. From November 1992 to December 1999, he served as Managing Director and Vice-Chairman of the Board of Directors of SkyTel Communications, Inc. (“SkyTel”) and as a Director of SkyTel from September 1992 until December 1999. During that period, he served as Chief Financial Officer and President and Chief Executive Officer of the International Division. Prior to 1992, Mr. Welsh was a Managing Director in the Investment Banking Division of Prudential Securities, Inc., and served as Co-Head of the Mergers and Acquisitions Department. Mr. Welsh has served as a director of various public companies, including Spreckels Industries, Inc., SkyTel, York International, and Integrated Electrical Services (NASDAQ: IESC). Mr. Welsh currently serves on the board of Liberty Broad Band (NASDAQ: LBRDA). Mr. Welsh has (i) a strong financial background in investment banking and investment management; (ii) leadership and collaboration skills; (iii) substantial experience involving acquisitions and strategic alliances; and (iv) a background in telecommunications products and services. Mr. Welsh’s investment management and acquisition experience and refined leadership skills have been critical in the creation of a strong, independent Board of Directors. | |
48
Sallie B. Bailey Age 58 Director since 2013 Member of the Audit Committee and Corporate Governance Committee | Ms. Bailey has been Executive Vice President and Chief Financial Officer of Louisiana-Pacific Corporation (NYSE: LPX), a leading manufacturer of engineered wood building products for residential, industrial, and light commercial construction, since December 2011. Ms. Bailey previously served as Vice President and Chief Financial Officer of Ferro Corporation (NYSE: FOE), a global specialty materials company, from January 2007 to July 2010. Prior to that, she held senior management positions of increasing responsibility with The Timken Company (NYSE: TKR), a global producer of engineered bearings and alloy steel, from 1995 to 2006, lastly as Senior Vice President, Finance and Controller. Earlier in her career, she was an audit supervisor for Deloitte & Touche LLP and Assistant Treasurer at Tenneco, Inc. Ms. Bailey has (i) extensive experience as a financial executive with broad knowledge of financial controls and systems; (ii) substantial leadership experience in domestic and international business; (iii) a strong background in acquisition, divestitures, and strategic alliances; and (iv) significant management experience in the manufacturing and materials industry. Ms. Bailey’s extensive financial leadership experience in global, publicly traded companies, knowledge of financial controls and systems, and understanding of operating a manufacturing business have made her a valuable member of the Board, Audit Committee and Corporate Governance Committee. | |
49
Edward (“Ned”) Childs Hall, III Age: 58 Director since 2014 Member of the Audit Committee and the Corporate Governance Committee | Mr. Hall served as Executive Vice President - Chief Operating Officer of Atlantic Power Corporation, a publicly traded power generation and infrastructure company (NYSE: AT), from April 2013 through February 2015. Prior to joining Atlantic Power, Mr. Hall spent more than 24 years working in the energy sector at AES Corporation, a publicly traded power company (NYSE: AES). While at AES Corporation, Mr. Hall held various positions including Managing Director, Global Business Development from 2003 to 2005; President, Wind Generation from 2005 to 2008; President, North America from 2008 to 2011; and Chief Operating Officer, Global Generation from 2011 to 2013. Mr. Hall served as Chairman of the Board of American Wind Energy Association (“AWEA”) from 2010 to 2011 and as a Member of the AWEA Board from 2005 to 2013. Mr. Hall has (i) extensive operating and management experience in power generation, transmission and distribution companies; (ii) a deep understanding of the global energy sector and the challenges and opportunities presented in the energy generation, transmission and distribution sector; and (iii) a deep understanding of alternative energy generation technology and economics. Mr. Hall’s extensive operating and management experience and relevant industry experience have made him a valuable member of the Board, Audit Committee and Corporate Governance Committee. | |
50
Gregory E. Lawton Age 67 Director since 1998 Chair of the Corporate Governance Committee and Member of the Compensation Committee | Mr. Lawton served as President and Chief Executive Officer of JohnsonDiversey, Inc. from October 2000 to February 2006. From January 1999 until September 2000, he was President and Chief Operating Officer of Johnson Wax Professional. Prior to joining Johnson Wax, Mr. Lawton was President of NuTone Inc., a subsidiary of Williams plc based in Cincinnati, Ohio, from 1994 to 1998. From 1989 to 1994, Mr. Lawton served with Procter & Gamble (NYSE: PG) where he was Vice President and General Manager of several consumer product groups. Mr. Lawton has been a consultant since March 2006. He is also a director of Stepan Company (NYSE: SCL). Mr. Lawton has (i) substantial operating and management experience in manufacturing businesses and in application of technology to business; (ii) a strong background in marketing, sales, and human resources management; and (iii) significant experience involving acquisitions and leading a global business. Mr. Lawton’s extensive operational and executive management experience and understanding of corporate governance matters have made him a valuable member of the Board and Compensation Committee and Chair of the Corporate Governance Committee. | |
51
Michael T. McDonnell Age 60 Director since 2015 President and Chief Executive Officer of General Cable Corporation | Mr. McDonnell has been President and Chief Executive Officer of General Cable Corporation since July 2015. Prior to joining General Cable, Mr. McDonnell was Chairman, President and Chief Executive Officer of TPC Group, a leading processor and producer of value-added products derived from petrochemicals that are sold into a wide range of performance, specialty and intermediate markets. Prior to joining TPC Group, Mr. McDonnell served as President and Chief Executive Officer of Pregis Corporation from 2006 to 2011, a leading global provider of innovative protective, flexible and food service packaging and hospital supply products with 47 facilities in 18 countries. From 2002 to 2006, Mr. McDonnell was Group Vice President, Environmental Technologies of Engelhard Corporation; and from 1998 to 2002, he was Vice President of a chemicals division for Cytec Industries, Inc. Earlier in his career, he held management roles with increasing levels of responsibility at Henkel Corporation and DuPont. Mr. McDonnell’s wide range of executive leadership experience within a variety of manufacturing and materials sectors, both domestically and globally, as well as his unique position as the Company’s CEO and in-depth knowledge of the Company’s operations, finances and strategy, have made him a valuable member of the Board. | |
52
Craig P. Omtvedt Age 68 Director since 2004 Chair of the Compensation Committee and Member of the Audit Committee | Mr. Omtvedt served as Senior Vice President and Chief Financial Officer of Fortune Brands, Inc., a former leading consumer products company (formerly NYSE: FO) from 2000 until his retirement in October 2011 and as a consultant to Beam Inc. (NYSE: BEAM), the successor to Fortune Brands, during 2012. Previously, he held positions with Fortune Brands as Senior Vice President and Chief Accounting Officer from 1998 to 1999; Vice President and Chief Accounting Officer from 1997 to 1998; Vice President, Deputy Controller and Chief Internal Auditor from 1996 to 1997; Deputy Controller from 1992 to 1996; and Director of Audit from 1989 to 1992. Before joining Fortune Brands, Mr. Omtvedt worked for Pillsbury Company in Minneapolis, Minnesota from 1985 to 1989 in various audit and controller roles. He is also a director of Oshkosh Corporation (NYSE: OSK), a director of Conagra Brands, Inc. (NYSE: CAG), a Trustee of Lake Forest College and a National Trustee of Boys and Girls Clubs of America. Mr. Omtvedt has (i) extensive experience as a financial executive with broad knowledge of financial controls and systems; (ii) substantial leadership experience in domestic and international business; (iii) an extensive background in acquisitions and strategic alliances; (iv) experience with major sales channels (retailers and distributors); and (v) experience with compensation matters at public companies. Mr. Omtvedt’s extensive financial leadership experience in global, publicly traded companies, knowledge of audit practices, and proven expertise in acquisitions and strategic alliances and knowledge of compensation issues affecting public companies have made him a valuable member of the Board and Audit Committee and Chair of the Compensation Committee. | |
53
Patrick M. Prevost Age 62 Director since 2010 Chair of the Audit Committee and Member of the Compensation Committee | Mr. Prevost served as President and Chief Executive Officer of Cabot Corporation (NYSE: CBT), a global specialty chemicals company, from January 2008 to March 2016. Mr. Prevost served as President, Performance Chemicals at BASF AG, an international chemical company, from October 2005 to December 2007. Prior to that, he was responsible for BASF Corporation’s Chemicals and Plastics business in North America. Mr. Prevost previously held senior management positions with increasing responsibility at BP Plc from 1999 to 2003 and Amoco Chemicals from 1983 until 1999. He is also a director of Cabot Corporation, a director of Southwestern Energy Company (NYSE: SWN) and a member of the Board of Directors of the American Chemistry Council. Mr. Prevost has (i) substantial leadership experience in a variety of complex international businesses, (ii) a chemical engineering background with broad experience in material science and chemistry, which are important to our wire and cable business; (iii) extensive experience involving acquisitions and strategic alliances; and (iv) deep knowledge of international business, strategic planning, manufacturing and financial matters. Mr. Prevost's demonstrated executive leadership expertise and keen understanding of operating a global manufacturing organization have made him a valuable member of the Board, Compensation Committee and Chair of the Audit Committee. | |
54
The Company's executive officer information is provided in Part I, Item I of this Form 10-K.
Section 16(a) Beneficial Ownership Reporting Compliance
Section 16(a) of the Exchange Act requires our directors and executive officers, and persons who own more than 10 percent of a registered class of equity securities, to file initial reports of ownership and reports of changes in ownership of General Cable common stock with the SEC. These persons are required by SEC regulations to furnish us with copies of all Section 16(a) forms which they file. Based solely on a review of the copies of forms furnished to us and filed with the SEC, we believe that all such SEC filings during 2017 complied with the reporting requirements.
Corporate Governance
Our By-laws, Corporate Governance Principles and Guidelines (the “Governance Principles”), charters of our Board committees, Code of Ethics and Business Conduct (“Code of Ethics”), and Related Party Transactions Policy and Procedures are the framework for our corporate governance. They are designed to ensure that our Company complies with SEC rules and regulations and the corporate governance listing standards of the NYSE, the stock exchange on which our common stock is listed. All of these corporate governance documents are available on our website www.generalcable.com via the Investor Relations page and are available in print to any stockholder on request to the Company’s Secretary at 4 Tesseneer Drive, Highland Heights, Kentucky 41076. Information on our website does not constitute a part of this Form 10-K.
Corporate Governance Principles and Guidelines
Our Board has adopted a policy that describes our corporate governance practices. The objective of our Corporate Governance Principles is to provide guidance to ensure that our Board maintains its independence, objectivity, and effectiveness in fulfilling its responsibilities to our stockholders. The Corporate Governance Principles establish criteria and requirements for:
• | the requisite qualifications, selection process, and retention of directors; |
• | the responsibilities of the directors; and |
• | procedures and practices governing the operation and compensation of our Board. |
Our Corporate Governance Principles also provide that directors must be willing to devote sufficient time to carry out their duties and responsibilities effectively, prepare for Board and Committee meetings by reviewing the materials provided to them in advance of the meeting, and should be committed to serve on the Board for an extended period of time. Directors should offer their resignation in the event of any significant change in their personal circumstances, including a change in their principal job responsibilities that would adversely affect their ability to fulfill their duties and responsibilities as directors. Further, directors who also serve as Chief Executive Officer or in equivalent positions should not serve on more than two boards of public companies in addition to our Board, and other directors should not serve on more than four other boards of public companies. In certain circumstances, the Board may determine that positions in excess of these limits may be maintained if doing so would not impair the director’s service on the Company’s Board. Our Corporate Governance Principles provide that arbitrary term limits on director’s service are not appropriate, nor should directors expect to be renominated annually until they reach retirement age. The Corporate Governance Principles further state that seventy (70) is an appropriate retirement age for non-employee directors; however, the Board will utilize its own self-evaluation process as an important determinant of Board tenure.
In addition to the above matters, our Corporate Governance Principles have a process whereby nominees must agree to tender their irrevocable resignations if they do not receive the required vote at the Annual Meeting at which they face re-election. Our Corporate Governance Committee reviews the circumstances surrounding the director nominee’s resignation and will submit such recommendation for prompt consideration to the Board. The Corporate Governance Committee and the Board may take into consideration any factors deemed relevant, including, without limitation, reported reasons for the “against” votes, the director’s length of service on the Board and contributions to General Cable in such role, and the effect of the director’s resignation on General Cable’s compliance with any law, rule, regulation, stock exchange listing standard, or contractual arrangement. After considering the Corporate Governance Committee’s recommendation, our Board will make a determination with respect to whether the director should continue to serve.
55
Code of Ethics
The Company has adopted a Code of Ethics and Business Conduct that applies to its directors, officers (including the Company’s principal executive officer, principal financial officer and principal accounting officer) and employees. A copy of the Code of Ethics and Business Conduct is available on the Company’s website, www.generalcable.com, and may be found under the “Investor Information” section by clicking on “Corporate Governance.” This document is also available in print to any shareholders who request it. The Company intends to satisfy the disclosure requirement under Item 5.05 of Form 8-K regarding an amendment to, or waiver from, a provision of our Code of Ethics and Business Conduct by posting such information on our website at the location specified above.
Our Board and its Committees
Private Sessions: At each regularly scheduled Board meeting, the non-employee directors meet without management present. The Non-Executive Chairman presides at such meetings. The non-employee directors also may and do meet without management present at other times as deemed necessary.
Our Committees
Our Board has three standing Committees: the Audit Committee, the Compensation Committee, and the Corporate Governance Committee. During fiscal 2017, each incumbent director attended at least 75% of the aggregate of (1) the total number of meetings of the directors which were held during the period for which the director was a director, and (2) the total number of meetings held by any committees of which the director was a member during the period that the director served. Each Committee operates under a written charter adopted by the Board. All of the Committee charters are available on our website at www.generalcable.com via our Investor Relations page. All of our Committees have the authority to retain outside advisors to assist each Committee, respectively, in meeting their responsibilities, as necessary and appropriate, and to ensure that we provide funding to pay the fees and expenses of such advisors.
2017 Committee Membership
Non-Employee Directors | Audit Committee | Compensation Committee | Corporate Governance Committee |
Sallie B. Bailey | X | X | |
Edward Childs Hall, III | X | X | |
Gregory E. Lawton | X | X* | |
Craig P. Omtvedt | X | X* | |
Patrick M. Prevost | X* | X | |
John E. Welsh, III | X | ||
* Chair of the Committee
Audit Committee: The Audit Committee met 8 times in 2017, including four telephonic meetings. Our Board of Directors has determined that all of our Audit Committee members are independent and financially literate under the rules of the SEC and NYSE and that Sallie Bailey and Craig Omtvedt each qualify as an audit committee financial expert under rules of the SEC. The Audit Committee assists the Board in the oversight of (i) the integrity of the Company’s financial statements; (ii) the Company’s compliance with legal and regulatory requirements; (iii) the independent auditor’s qualifications and independence; and (iv) the performance of the Company’s internal audit functions and independent auditors. The responsibilities of the Audit Committee are further described in the Audit Committee Charter which is available on our website at www.generalcable.com via our Investor Relations page.
The Audit Committee selects the Company’s independent registered public accounting firm, reviews such firm’s procedures for ensuring their independence with respect to the services performed for the Company, approves all fees to be paid to the independent registered public accounting firm and preapproves the professional services provided by the independent registered public accounting firm. The Audit Committee has adopted formal preapproval policies and procedures relating to the services provided by its independent auditor consistent with requirements of the SEC rules. Under the Company’s preapproval policy, all audit and permissible non-audit services provided by the independent auditor must be preapproved. The Audit Committee will generally preapprove a list of specific services and categories of services, including audit, audit-related, tax and other services, for the upcoming or current fiscal year. Any services that are not included in the approved list of services must be separately
56
preapproved by the Audit Committee. The Audit Committee delegates to the Audit Committee Chair the authority to approve permitted audit and non-audit services to be provided by the independent auditor between Audit Committee meetings for the sake of efficiency. The Audit Committee Chair reports any such interim preapproval at the next meeting of the Audit Committee. In 2017, all audit and permissible non-audit services were preapproved in accordance with the policy.
The Audit Committee approved the appointment of Deloitte & Touche LLP as the Company’s independent registered public accounting firm for 2018.
Compensation Committee: The Compensation Committee met six times in 2017, including three telephonic meetings. Our Board of Directors has determined that all of our Compensation Committee members are independent under the rules of the NYSE, qualify as “non-employee directors” for purposes of Rule 16b-3 under the Securities Exchange Act of 1934, as amended (the “Exchange Act”), and qualify as “outside directors” for purposes of Section 162(m) of the Code. The Compensation Committee assists our Board in fulfilling its oversight responsibilities with respect to executive compensation. The Compensation Committee performs this function by: (i) evaluating the performance of the Company’s Chief Executive Officer and other executive officers; (ii) reviewing and establishing the compensation of the Company’s Chief Executive Officer and other executive officers; (iii) evaluating the Company’s executive compensation competitiveness and establishing the appropriate competitive positioning of the levels and mix of executive compensation elements; (iv) making recommendations to the Board with respect to the establishment of or changes to existing incentive and equity-based compensation plans of the Company; (v) administering the Company’s incentive and equity-based compensation plans; and (vi) reviewing potential risk to the Company from its compensation policies and practices for all employees, including incentive plans. In addition, the Compensation Committee makes recommendations to the Board with respect to director compensation. The responsibilities of the Compensation Committee are further described in the Compensation Committee Charter which is available on our website at www.generalcable.com via our Investor Relations page. The Compensation Committee approved the appointment of Korn Ferry Hay Group (“Hay Group”) as its independent compensation consultant for 2017. Hay Group reports directly to the Compensation Committee.
Corporate Governance Committee: The Corporate Governance Committee met four times in 2017. Our Board of Directors has determined that all of our Corporate Governance Committee members are independent under the rules of the NYSE. The Corporate Governance Committee is responsible for assisting the Board in (i) evaluating and recommending nominees for election as directors; (ii) evaluating the membership and responsibilities of Board committees; (iii) developing and recommending to the Board a set of corporate governance guidelines and principles; (iv) devising and implementing a program or system to evaluate the performance of all directors and overseeing the annual evaluations of our Board; and (v) reviewing and advising the Board on executive officer succession plans. The responsibilities of the Corporate Governance Committee are further described in the Corporate Governance Committee Charter which is available on our website at www.generalcable.com via our Investor Relations page.
ITEM 11. EXECUTIVE COMPENSATION
Compensation Discussion and Analysis
This Compensation Discussion and Analysis (“CD&A”) describes our compensation philosophy, policies, programs, and the pay decisions regarding our Named Executive Officers (“NEOs”) for 2017 in the context of our company strategy and our fiscal 2017 performance. The Compensation Committee (the “Committee”) is responsible for the oversight of executive compensation matters. For 2017, our NEOs were as follows:
• | Michael T. McDonnell, President and Chief Executive Officer, our “CEO” |
• | Matti M. Masanovich, Senior Vice President and Chief Financial Officer, our “CFO” |
• | Emerson C. Moser, Senior Vice President, General Counsel and Corporate Secretary |
• | Shruti Singhal, Senior Vice President and President, Europe* |
• | Leah S. Stark, Senior Vice President and Human Resources Officer |
• | Juan E. Picon, Former Senior Vice President and President, North America* |
________________________
* Changes in Executive Leadership in 2017: Mr. Singhal joined the Company in February 2017. Mr. Picon, who joined the Company in January 2017, separated from the Company in April 2017.
57
EXECUTIVE SUMMARY
Compensation Philosophy
At General Cable, our executive compensation philosophy is to provide a well-balanced and competitive program that aligns the interests of our executives with those of our stockholders. Our incentive programs are designed to deliver sustainable, long-term stockholder value through the execution and achievement of key financial and strategic objectives. In recent years, we have continued to adjust our compensation program to further align with our evolving business, focusing on refining elements of our incentive designs that we feel are critical to our strategic roadmap.
In setting and designing annual compensation for our executives, the Committee considers the following principles:
• | annual target compensation that is realized when target performance is achieved and positioned competitively relative to our peers and other relevant market data; |
• | incentive programs that consider financial and strategic objectives that directly support the execution of the Company’s strategic roadmap; |
• | a balanced pay structure that reinforces pay for performance while promoting retention through an appropriate mix of fixed and variable pay components. |
Proposed Transaction with Prysmian Group
On December 3, 2017, we entered into a definitive merger agreement with Prysmian Group (“Prysmian”) under which, at the closing, Prysmian will acquire our outstanding common shares for $30 per share in cash. We believe that the proposed transaction:
• | Maximizes value for our shareholders; |
• | Is an ideal strategic fit and ensures that we are well-positioned to meet the future opportunities and challenges in the dynamic and evolving wire and cable industry. Together, we will be able to deliver a robust portfolio of products and services and new product innovation across the full breadth of the wire and cable industry globally; and |
• | Prysmian and General Cable have a shared vision and highly compatible cultures founded on similar values. |
We believe that the proposed transaction also provides significant value for our shareholders. The transaction represents a premium of approximately 81% to the General Cable closing price of $16.55 per share on July 14, 2017, the last day of trading before we announced our review of strategic alternatives.
2017 Compensation Committee Actions
For 2017, the Committee made the following changes to our compensation programs as it believes they are consistent with our compensation pay-for-performance philosophy, best governance practices, and market trends:
• | Annual Incentive Plan: rebalanced weightings of overall financial and strategic measurement for all executives to place significant emphasis on financial performance over strategic performance components in our 2017 Annual Incentive Plan (“AIP”). |
• | Long-Term Incentive Mix: reintroduced stock options for executive officers to further align executive and stockholder interests and promote longer-term value creation. As such, our 2017 long-term incentives were delivered 50% in performance-based stock units, 35% in time-based restricted stock units, and 15% in non-qualified stock options. |
• | Vesting of Restricted Stock Units: eliminated the “carry-over” feature within the time-vested RSUs that allowed additional opportunities to vest award tranches if the performance trigger was not achieved. |
58
HOW WE MAKE PAY DECISIONS
The Roles of the Committee and Management in the Process
The Committee annually engages in a comprehensive assessment of General Cable’s executive officer total target compensation levels and executive pay program design. For purposes of this review, total target compensation means the sum of base salary, annual cash incentive targets, and long-term incentive targets. In preparation for the annual determination of each executive officer’s total target compensation, the Committee meets to consider market trends, the competitiveness of our compensation program, and the performance of our executive officers individually and in relation to our overall performance. In making its final total target compensation determinations, the Committee applies a common methodology for all of our executive officers, including our NEOs.
CEO Compensation. The Committee sets our CEO’s total compensation based on its assessment of our CEO’s individual performance and our Company’s overall performance, as well as the financial and operating performance of a peer group and other relevant market data. Mr. McDonnell’s target annual cash compensation and target long-term incentive are targeted to approximate the median of our peer group and industry survey data and are designed to align his interests with the long-term interests of our stockholders.
Other NEO Compensation. The Committee sets total compensation for our other NEOs based on recommendations by our CEO. The Committee considers these recommendations based on each executive’s individual responsibility, experience, and overall performance, including the attainment of their individual performance objectives and internal pay comparisons among our executive group. In addition, in setting the compensation of our other NEOs, the Committee reviews compensation data from a peer group and compensation surveys.
Interaction between the Committee and Our Executive Officers. Our CEO and CFO recommend to the Committee the performance targets to be used for our annual and long-term incentive awards, subject to Committee review and approval. In addition, the senior executive officer responsible for human resources works with the Committee, its independent compensation consultant and senior management to (i) provide the Committee with appropriate information to make its decisions; (ii) propose recommendations for the Committee’s consideration and action; and (iii) communicate the Committee’s decisions to senior management for implementation.
The Role of the Independent Compensation Consultant
The Committee retains Korn Ferry Hay Group (“Hay Group”) as its independent compensation consultant to ensure that the Committee has objective and comprehensive information needed to make informed decisions in the best interests of the Company’s stockholders. The consultant provides the Committee with information on compensation best practices, competitive market data for executive officers, and current trend and regulatory updates regarding executive compensation programs and policies. Hay Group provides guidance to the Committee in establishing compensation levels and practices for the NEOs and other executive officers.
With regard to Hay Group, the Committee considered the following factors to determine whether such firm’s service as a compensation consultant raised a conflict of interest, including among other things:
• | Whether the firm provided other services to the Company; |
• | The amount of fees received by Hay Group from the Company as a percentage of Hay Group’s total revenue; |
• | Hay Group’s policies and procedures designed to prevent conflicts of interest; and |
• | Whether the individual Hay Group advisors to the Committee own any Company stock or have any business or personal relationships with member of the Committee or our executive officers. |
After considering the above factors, the Committee has determined that the work of Hay Group as a compensation consultant does not raise any conflict of interest.
59
Use of a Peer Group and Competitive Market Pay Information
The Committee reviews a comparative analysis prepared by Hay Group as well as survey data and market trend information for each of our executive officers. Hay Group also provides an annual review of long-term incentive award trends as a reference point for setting long-term incentive awards for each executive officer.
The Committee reviews data from two sources as reference points to ensure that our executive compensation program offers competitive total compensation opportunities and reflects best practices in compensation plan design. These two sources are a comparator peer group and compensation survey data. The peer group analysis serves as the primary source in assessing our pay competitiveness. The survey analysis serves as a secondary source in validating and balancing peer group results by assessing pay competitiveness from a broader market and job function perspective. The use of multiple data sources contributes to a more holistic market analysis and provides clarity on the ranges of pay opportunity in the market.
The development of an appropriate peer group involves a balanced approach that focuses on size (revenue and/or market capitalization), sector (industry/business competitors) and business model (how the company makes money) with consideration of talent market, degree of internationalization, and customer base/market share. For 2017 compensation decisions, with advice from the Committee’s independent compensation consultant, the Committee reaffirmed the current comparator group of public companies as follows:
2017 Comparator Peer Group
AK Steel Holding Corporation Allegheny Technologies Incorporated Amphenol Corporation Anixter International Inc. Belden Inc. | Corning Incorporated Dover Corporation EMCOR Group Inc. Hubbell Incorporated ITT Corporation Joy Global Inc. (1) | Mastec, Inc. Quanta Services, Inc. Steel Dynamics Inc. The Timken Company Valmont Industries Inc. WESCO International, Inc. |
(1) | In April 2017, Komatsu America Corp. completed its acquisition of Joy Global Inc. (JOY) and therefore JOY was removed from our peer group after that date. |
The Committee also uses compensation survey data in its evaluation of executive pay. Survey data provides insight into positions that may not generally be reported in proxy statements. To help evaluate fiscal year 2017 compensation levels, the Compensation Committee reviewed survey information from the US Willis Towers Watson CDB General Industry Executive Compensation survey. In addition to reviewing broad-based data and information from a peer group, our Compensation Committee also considers internal comparisons of pay within the executive group.
Say on Pay Advisory Vote
We conduct an annual advisory vote on executive compensation, commonly referred to as “Say on Pay.” While the votes are not binding, the outcome of stockholder advisory votes on executive compensation serve as inputs for the Committee when making any decisions related to compensation levels or design. At our 2017 Annual Meeting of Stockholders, our executive compensation program was approved by approximately 97% of the votes cast.
60
2017 Executive Compensation Program Highlights
Consistent with our executive compensation philosophy, our executive compensation program includes a mix of a lower percentage of fixed and higher percentage of variable compensation elements and provides alignment with business goals through both annual and long-term incentives. Incentives are designed to drive overall corporate performance, specific business strategies and individual performance using measures the Committee believes correlate to stockholder value and align with our business strategy and operating priorities. Individual compensation packages include both fixed and variable components and vary depending on the executive’s level, scope of responsibilities, growth potential, performance, tenure, and consideration of internal pay equity and external market data. The main elements of our 2017 executive compensation program are outlined in the table below.
Compensation Element | Purpose | |
Annual Compensation | Base Salary | Represents pay for an individual’s primary duties and responsibilities. Base salaries are reviewed annually and are established based on scope of responsibility, individual performance, potential, and competitiveness versus the relevant external market and our operating performance. |
Annual Incentives | Provides a performance-based short-term cash incentive opportunity. Rewards achievement of specific financial and strategic measures including corporate and geographic regional results as well as individual performance. The amount earned will vary relative to the targeted level based on our results and the individual’s performance. | |
Long-Term Incentive Compensation | Performance Stock Units (PSUs) | Provides a performance-based equity incentive opportunity. Rewards achievement of financial measures, as well as supporting retention and aligning pay with performance. Value of awards will vary depending on our actual results over the course of a three-year performance period. |
Stock Options | Stock options provide both performance-based and retention incentives as the value recognized through stock option grants is based on absolute stock price appreciation over the longer-term. | |
Restricted Stock Units (RSUs) | Provides time-based awards under a plan designed to enhance executive stock ownership, as well as an incentive for retention and sustaining stockholder value. Value of awards is directly dependent on our stock price and our performance. | |
Benefits and Retirement | U.S. Retirement Benefits and Deferred Compensation | Provides benefits to our U.S.-based executive officers at retirement from our Company. Our core plan is a defined contribution retirement and savings plan, including a 401(k)-employee contribution with matching Company contributions as well as a non-elective Company contribution (“Retirement Plan”). The Retirement Plan is identical to the plan provided to non-executive employees. Our deferred compensation plan (“DCP”) permits U.S.-based participants to defer salary, incentive bonuses or stock awards to a future date, generally separation from service with the Company. Within the DCP, we have a non-qualified supplemental or excess retirement plan (“the BEP”), which provides benefits in excess of IRS limits under the Retirement Plan. |
Welfare Plans and Other Benefits | Provides for basic health care, life, and income security needs, including life, medical, dental, disability, and other employee welfare benefits, and fringe benefits and limited perquisites (expatriate program). | |
Executive Officer Severance Benefit Plans and Arrangements | Provides severance benefits in the case of involuntary termination of employment in the form of salary continuation, target bonus, pro-rata bonus, health and welfare benefits and outplacement services. | |
We believe these compensation elements are consistent with relevant competitive market practices.
61
Compensation Practices and Governance Policies
Highlighted below are some of the key elements of our executive compensation program and good governance practices that the Committee believes provide a framework for prudent compensation decisions and serve the long-term interests of our stockholders:
What We Do | What We Don’t Do | ||
+ | Pay for Performance | X | Design compensation programs that encourage unreasonable risk taking, confirmed by annual compensation risk assessment |
+ | Closely tie objective financial metrics in our annual incentive plan and performance-based long-term equity awards to our business strategy | X | Allow excise tax gross-ups in any future severance plans and agreements |
+ | Clawbacks that allow us to recoup compensation in the event of violation of our Code of Ethics or upon a restatement of our financials due to material noncompliance | X | Permit hedging transactions or pledging of Company stock by officers or directors |
+ | Robust stock ownership and retention requirements for NEOs | X | Allow for stock option repricing, reloads or exchanges without stockholder approval |
+ | Have double-trigger change in control provisions | X | Enter into employment contracts unless required by local law or prevailing market practices |
Setting Target Compensation - Significant Pay at Risk
The target pay mix for our CEO and other NEOs for 2017 emphasizes performance-based compensation over fixed-compensation. Particularly, annual cash incentives and equity awards are generally “at risk” and subject to achievement of company and individual performance objectives for annual incentives, and company performance and the long-term value creation through stock price appreciation for equity-based incentives.
Named Executive Officer | Base Salary | Target Annual Incentive (AIP) | Target Long-Term Incentives |
Mr. McDonnell | $950,000 | $1,045,000 | $4,275,000 |
Mr. Masanovich | $500,000 | $350,000 | $1,125,000 |
Mr. Moser | $400,000 | $280,000 | $600,000 |
Mr. Singhal (1) | $345,078 | $246,021 | $365,625 |
Ms. Stark | $410,000 | $287,000 | $553,500 |
CEO | 15% | 17% | 68% |
All Other NEOs (in the aggregate) | 30% | 21% | 49% |
(1) | For Mr. Singhal, base salary and target AIP amounts reflect prorated compensation attributable to his hire in February 2017. |
62
Annual Cash Compensation
Base Salary. Base salaries are an important element of compensation and provide our executive officers with a base level of income. In determining base pay, our Compensation Committee considers the executive’s responsibilities, growth potential, individual performance against predetermined objectives, base salary competitiveness, as compared to the external market, and our Company’s operating performance. Base salaries are reviewed annually by the Compensation Committee as part of its regular compensation review process based on the benchmarking process and the other factors described above, as well as special achievements and promotions. The 2017 approved annual salaries for our NEOs were as follows:
Named Executive Officer | 2016 Base Salary (1) | 2017 Base Salary (1) |
Mr. McDonnell | $950,000 | $950,000 |
Mr. Masanovich | $475,000 | $500,000 |
Mr. Moser | $375,000 | $400,000 |
Mr. Singhal | NA | $390,000 |
Ms. Stark | $380,000 | $410,000 |
(1) | For each NEO other than Mr. Singhal, the amounts represent the annualized base salary for 2016 and 2017. For Mr. Singhal, the amount represents his annualized base salary upon his hire in February 2017. |
Annual Incentive Awards. Each executive officer’s target annual incentive opportunity is based on job responsibilities, alignment with internally comparable positions and peer company market data. Award levels at target under the AIP are within the competitive range as determined by reference to our comparator peer group and compensation survey data, with the opportunity to earn more or less depending on actual financial performance of the Company and individual performance. When determining the actual annual incentive award payable to each executive officer, the Committee considers both business and individual performance. If performance with respect to a specific measure is above or below target, the actual payout will be above or below the target annual incentive opportunity for that measure.
For 2017, the Committee, with input from Hay Group, rebalanced relative weightings of overall financial and strategic measurements to place increased emphasis on business results-oriented performance. The Committee determined that the AIP would again consist of four separate performance measures by which executive officers would be evaluated. These are business performance measures: (i) adjusted EBITDA (operating income plus depreciation and amortization), a strong indicator of overall operating performance; (ii) Operating Margin, which is an indication of operating efficiency, profitability and ability to take on additional investments; (iii) Cash Conversion Cycle days, or CCCD, which is an efficient measure of inventory-to-cash conversion; and (iv) individual strategic measures: strategic initiatives tailored to each executive officer’s assigned focus areas.
The performance criteria used as the basis for awards and the specific targets can vary from year to year. Generally, the financial targets are based on our annual financial plan and are typically set at levels that exceed the level of performance in prior years but consider our business and market outlook at that time as we operate in a highly cyclical industry.
The following table sets forth the weightings assigned to each performance measure under the 2017 AIP for each NEO. The performance weightings assigned to each executive are intended to balance the importance of achieving key corporate and regional financial metrics with the individual strategic measures. Individual performance weightings were decreased to allow each NEO to focus on the Company’s strategic initiatives that are critical to its longer-term transformation.
2017 AIP Performance Measures and Weightings
Named Executive Officer | Company Adjusted EBITDA | Company Operating Margin | Company CCCD | Regional EBITDA | Regional Operating Margin | Regional CCCD | Individual Strategic Objectives |
Mr. McDonnell | 50% | 20% | 10% | — | — | — | 20% |
Mr. Masanovich | 50% | 20% | 10% | — | — | — | 20% |
Mr. Moser | 50% | 20% | 10% | — | — | — | 20% |
Mr. Singhal | 15% | 7.5% | 7.5% | 30% | 12.5% | 0.075 | 20% |
Ms. Stark | 50% | 20% | 10% | — | — | — | 20% |
Based on business performance, payouts would be determined from 0% for below threshold performance, 50% at threshold, 100% at target, and up to 200% (maximum) for above target performance.
63
Business Performance Targets and Results. In determining the NEOs annual incentive awards for 2017, the Committee considered actual Company performance, and also Regional performance for Mr. Singhal, against the pre-established performance targets noted in the table below. The performance targets were set at levels necessary to meet or exceed the financial goals of our 2017 business plan to ensure the performance targets are challenging and our executive officers are motivated to deliver on our financial goals.
Performance Measure | Threshold Payout (50%) | Target Payout (100%) | Maximum Payout (200%) | Actual 2017 Performance |
Company Adjusted EBITDA (1) | $203.0 million | $254.0 million | $305.0 million | $209.8 |
Regional EBITDA - Europe | $36.9 million | $46.4 million | $55.9 million | $16.8 |
Company Operating Margin (2) | 3.8% | 4.7% | 5.7% | 3.7% |
Regional Operating Margin - Europe | 1.9% | 2.4% | 2.9% | (0.8)% |
Company CCCD (3) | 102 | 97 | 92 | 101.4 |
Regional CCCD - Europe | 100 | 95 | 90 | 105.8 |
(1) | Adjusted EBITDA is a non-GAAP financial measure. For a reconciliation of non-GAAP financial measures to their corresponding GAAP financial measures see Exhibit A to this Form 10-K. For purposes of the AIP, “adjusted EBITDA” is defined as: operating income plus depreciation and amortization, with operating income being adjusted for extraordinary, nonrecurring or unusual charges and other certain items. |
(2) | Operating Margin is defined as Net Operating Profit After Tax, or NOPAT, divided by net revenue. |
(3) | Cash Conversion Cycle Days, or CCCD, is defined as days inventory outstanding plus days sales outstanding minus days payable outstanding. |
2017 Individual Strategic Measures
The individual strategic measures of our executive officers were established by the Committee with input from the CEO and Senior Vice President, Chief Human Resources Officer. We have not disclosed the individual strategic measures because we believe this disclosure would reveal confidential strategic objectives and would result in competitive harm to us. The strategic measures were designed to be “stretch” goals that were achievable with what we believe represented an elevated level of effort and performance. The payout of the strategic measure component of annual performance awards under the AIP is more qualitative in nature and subjective in measurement.
2017 AIP Award Determination
At the end of the performance year, the Committee subjectively reviews each executive’s performance against the various strategic measures and considers any special factors that could have affected performance during the year. Prior to the end of the performance year, the Committee approved AIP payouts to the NEOs as set forth in the table below based on the achievement of estimated corporate and regional performance measures and an assessment of individual performance against their various strategic measures on the date of approval. The estimated corporate and regional performance measures which were the basis of the estimated December payouts exceeded actual 2017 performance and resulted in excess AIP payouts in the following amounts: Mr. McDonnell, $80,113; Mr. Masanovich, $26,832; Mr. Moser, $21,466; Mr. Singhal, $1,468 and Ms. Stark, $22,002 (all of which amounts are included in the table below). After considering the management team’s demonstrated commitment related to oversight of the transaction with Prysmian, and the immaterial nature of the potential adjustment, the Committee concluded that 2017 AIP awards paid in December 2017 would not be adjusted to reflect actual results. Mr. McDonnell determined that in light of his role as both CEO and a member of the Board, he would limit his 2017 AIP award to amounts payable based upon 2017 actual performance results. Accordingly, Mr. McDonnell repaid $80,113 to the Company in February 2018.
Named Executive Officer | 2017 AIP Target | 2017 AIP Award Paid | Award as % of Target |
Mr. McDonnell | $1,045,000 | $643,460(1) | 61.6% |
Mr. Masanovich | $350,000 | $250,513 | 71.6% |
Mr. Moser | $280,000 | $200,410 | 71.6% |
Mr. Singhal | $246,021 | $52,376 | 21.3% |
Ms. Stark | $287,000 | $219,771 | 76.6% |
(1) | As described above, Mr. McDonnell repaid $80,133 to the Company in February 2018 which resulted in an actual 2017 AIP Award of $563,347 (53.9% of Target). |
64
In addition, for 2017, the Committee took under advisement the considerable amount of time and effort certain NEOs, Messrs. Masanovich and Moser and Ms. Stark, devoted to reviewing strategic alternatives for the Company, in addition to their normal strategic measurement goals. In recognition of the additional duties and responsibilities assumed by these individuals over the course of 2017, in December 2017, the Committee approved an incremental AIP payout of $100,000 to each of Messrs. Masanovich and Moser and Ms. Stark. The incremental AIP amounts are not reflected in the table above. The total 2017 AIP amounts are shown in the Summary Compensation Table.
Long-Term Incentives
Long-term incentive awards for 2017 were granted to our executive officers under the Amended and Restated General Cable Stock Incentive Plan (the “Stock Incentive Plan”). Our 2017 long-term incentive awards are equity-based awards designed to align executive interest to the interests of our stockholders. The target value for each long-term incentive award for each executive officer is determined by the Committee taking into consideration our Company’s performance in the past year and the contributions made by our executive officers, as applicable, and are generally consistent with competitive market practices.
We typically make grants of long-term incentive awards in the first quarter of each year, following the release of the prior year’s financial results. We believe that consistent timing of equity award grants reflects good corporate governance and reduces the risk in selecting a grant date with a preferential stock price. The Committee, with input from its compensation consultant, reviews the relative long-term equity and cash incentive mix for our executive officers and makes a final determination. For 2017, the Committee determined that the long-term incentive award would be comprised of a mix of 50% Performance Stock Units (PSUs), 35% Restricted Stock Units (RSUs) with both performance and time-based vesting restrictions, and 15% stock option awards. The Committee determined that this mix would be an effective balance of providing a meaningful level of retention and emphasizing direct performance linkage and approved 2017 long-term incentive target awards and mix of equity as follows:
Named Executive Officer | Target Value of Long-Term Incentive Compensation |
Mr. McDonnell | $4,275,000 |
Mr. Masanovich | $1,125,000 |
Mr. Moser | $600,000 |
Mr. Singhal | $365,625 |
Ms. Stark | $553,500 |
Once the target value of the annual long-term incentive award is set by the Committee, the number of PSUs, RSUs, and stock options is calculated based on the mix of long-term incentive awards approved by the Committee (illustrated above) and for PSUs and RSUs, the 20-day average closing price preceding the date of grant and, for stock options, the grant date fair value.
2017 Long-Term Incentive Awards
Stock Options. Stock options provide for the right of an executive to purchase shares of Company stock in the future based on a fixed price established on the date of grant. As such, we believe stock options are inherently performance-based as the option has value to the executive only in the case that the stock price increases over time. If the stock price does not increase above the grant price, the executive will not realize any value from the award. The 2017 stock option awards will vest in three equal installments on the first, second and third anniversaries of the grant date and expire on the tenth anniversary of the grant date.
RSU Awards. The 2017 RSU Awards vest in equal installments over a three-year period commencing December 31, 2017, provided that the executive officer remains employed with the Company and if adjusted EBITDA divided by $100 million is greater than 1 for that year. The Compensation Committee believes that the adjusted EBITDA performance metric provides a meaningful indicator of financial soundness for purposes of vesting of long-term incentive awards.
• | For awards made prior to 2017, if any portion does not vest, it is carried forward to the next year, where vesting is again contingent on the executive’s continued employment and the adjusted EBITDA performance threshold. |
• | Beginning with awards granted in 2017, the carry-forward practice was eliminated. |
• | The RSUs include dividend equivalent rights, subject to the same vesting requirements and forfeiture provisions as the RSUs, and are settled in the form of a cash payment at the same time that the vested RSUs are settled. |
65
PSUs. PSUs granted in 2017 vest only if the Company meets the following cumulative three-year (2017-2019) performance metrics: relative total stockholder return (“RTSR”) and return on invested capital (“ROIC”), with assigned weightings of 50% and 50%, respectively. The Committee determined that RTSR and ROIC provide the best balance between outperformance and absolute performance, while strengthening the alignment of long-term incentive payments with stockholder value creation and capital efficiency.
RTSR is measured by ranking the Company’s 3-year stock price return to the companies in a comparator peer group, which differs from the comparator peer group used for benchmarking and setting compensation levels. The Committee selected, with the assistance of Hay Group, the S&P 1500 Capital Goods Index to use as the comparator peer group because it reflects companies and business cycles similar to General Cable. Therefore, companies within the Index may be similarly affected by relevant market and industry conditions.
Our RTSR performance will be assessed against the S&P 1500 Capital Goods Index at the end of the performance period. The RTSR performance percentiles were adopted by the Committee based on their assessment that such percentiles reflect market competitive long-term incentive pay practices, as well as meaningful levels of relative performance that warrant PSU payouts at threshold, target and maximum levels. ROIC measures how effectively we manage capital invested in our operations.
At the beginning of the performance period, threshold, target, and maximum ROIC goals were set by the Committee based on the Company’s business outlook and market conditions at that time. The performance period commenced on January 1, 2017 and ends on December 31, 2019. Based on the performance at the end of the three-year period, our NEOs may earn less or more than the target award granted in 2017. The two performance metrics operate independently. RTSR performance below the 30th percentile of our performance peer group, or ROIC performance below 8.0%, will result in 0% payout for each metric. The maximum payout for each metric is 200%.
Limitations on the PSUs subject to the RTSR performance metric dictate that, if General Cable’s total shareholder return over the period is negative, the maximum amount earned shall be capped at target. As a result, even if General Cable’s relative three-year total shareholder return is ranked at the top of its performance comparator group, but is negative on an absolute basis, our NEOs would only earn target amounts on the RTSR portion of the PSUs. The PSUs include dividend equivalent rights, subject to the same vesting requirements and forfeiture provisions as the PSUs, and are settled in the form of a cash payment at the same time that the vested PSUs are settled.
The following table sets forth the percentage of PSUs which will vest at the end of the three-year performance period based on the level of performance under both performance metrics. If the performance thresholds are met, grants are denominated and settled in shares of General Cable common stock. The targets set forth below were set for compensation determination purposes only and do not constitute, and should not be viewed as, management’s projection of future results.
<Minimum | Minimum | Target | Maximum | |
RTSR(1) | Less than 30th Percentile | 30th Percentile | 50th Percentile | 75th Percentile or Above |
Vested Percent of RTSR Units | 0% | 50% | 100% | 200% |
ROIC(2) | Less than 8.0% | 8.0% | 9.5% | 11.7% or Above |
Vested Percent of ROIC Units | 0% | 50% | 100% | 200% |
(1) | The 2017 PSUs defined RTSR as the Company’s average total shareholder return for each performance period in comparison to the average total shareholder return for the S&P 1500 Capital Goods Index for each performance period. Total shareholder return was defined as ending stock price minus beginning stock price plus dividends divided by beginning stock price. Beginning and ending stock price based on a 30-day average to minimize stock volatility that may occur on a point-to-point calculation when specific dates are involved. |
(2) | The 2017 PSUs defined ROIC as net operating profit after tax divided by invested capital. Invested capital is equal to the Company’s net debt plus shareholder’s equity. Net operating profit after tax will be adjusted for extraordinary, nonrecurring or unusual charges and other certain items. |
66
The Committee occasionally grants additional “off-cycle” awards to key employees, including NEOs, in connection with recruitment, promotion, retention efforts and recognition of special achievements. In 2017, the Committee granted recruitment related awards to Messrs. Singhal upon his acceptance of employment and in lieu of forgone incentives at prior employment. Mr. Singhal was granted $457,000 in the form of 6,858 2017-2019 PSUs and 20,574 RSUs in March 2017 upon his commencement of employment. The additional PSU and RSU awards granted to Mr. Singhal will vest and be distributed consistent with the terms and condition of his other 2017 long-term incentive awards. In addition to the 2017 LTI awards, in February 2017 the Committee granted to Mr. Moser a special performance recognition and strategic retention award of $300,000 in the form of 15,504 time-based RSUs that would vest 50% in 2018 and 50% in 2019 on the anniversary of the grant date.
Vesting of 2015 Performance-Based Long-Term Incentive Awards
In 2015, the Committee awarded a target number of PSUs to all executive officers at that time, including Messrs. McDonnell and Moser, that would be earned subject to the Company’s performance under two cumulative three-year performance metrics, RTSR and ROIC, with assigned weightings of 50% and 50%, respectively. In addition, executive officers at that time, which includes Mr. Moser, but not Mr. McDonnell, were awarded a target amount of long-term incentive cash, that would be earned subject to the Company's performance under three one-year performance metrics of Corporate EBITDA divided by 100 million is greater than one (1).
The 2015 PSUs performance period commenced on January 1, 2015 and ended on December 31, 2017. The payouts for these awards could have ranged from 0% to 200% of each officer’s respective target, with a threshold payout for each performance measure equal to 50% of target. For these awards to be payable, the threshold or minimum achievement level for at least one of the performance measures must have been attained. Based on the performance at the end of the three-year period, the Committee determined that threshold performance of 120% for ROIC and 200% for RTSR was achieved and that a resulting performance factor of 160% would be applied to the 2015 PSU awards. The final tranche of the 2015 long term incentive cash award performance period commenced on January 1, 2017 and ended on December 31, 2017. The payout for these awards for Mr. Moser targets a 100% payout if the performance objectives are met. Corporate EBITDA divided by 100 million greater than one (1) was achieved and a resulting performance factor of 100% would be applied to the long-term cash award. Both performance objectives were certified by the Committee with distributions in December 2017 and February 2018.
OTHER ELEMENTS OF COMPENSATION
Retirement Plans and Other Company Benefits
Our U.S.-based NEOs participate in the full range and scope of retirement and welfare and other plans as all other U.S.-based employees of General Cable do, except as noted below. In this area, as in other aspects of our compensation program, we target these types of benefits to be competitive within the relevant market identified. These benefits are consistent with our compensation philosophy, and we continue to offer them because we believe they are necessary in order to attract, retain and motivate talented executive officers.
Retirement Benefits. General Cable and our subsidiaries sponsor Retirement and Savings Plans (“Retirement Plans”) for employees in the United States. The Retirement Plans are tax-qualified, defined contribution plans under which fixed contributions are made for the account of each participating employee each year. For employees, under the retirement component (subject to collective bargaining agreements), the Company makes a contribution of 3% of eligible compensation, and under the savings or 401(k) component, the Company makes a matching contribution of 50% of the employee’s contribution up to 6% of compensation through our payroll deduction program. The federal statutory limit for eligible compensation in 2017 was $270,000. These contribution and matching percentages are intended to reflect competitive market terms and conditions for plans of this type. Participating employees may direct the investment of Company and individual contributions into one or more of the investment options offered by the Retirement Plans.
The Company and its subsidiaries also maintain the General Cable Deferred Compensation Plan (“DCP”), which permits deferral of salary, incentive bonuses, and stock awards by U.S.-based participants, including our U.S.-based NEOs. We offer the DCP as part of our competitive benefits program. In 2007, we combined this plan with our supplemental or excess retirement plan (“the BEP”) and our former Supplemental Executive Retirement Plan. The BEP is designed to make up benefits on certain wages, which are not eligible for Company matching or retirement contributions because of Internal Revenue Service limits on inclusion of these amounts in our Retirement Plans. The BEP has investment options and vesting requirements similar to the Retirement Plans.
Limited Perquisites. We maintain an expatriate program that provides certain benefits to our employees who accept expatriate assignments. Our executive officers, including NEOs, are entitled to the same benefits under the Company’s expatriate program as other Company employees. Under the Company’s expatriate program, such benefits include providing gross ups on taxable foreign assignment assistance.
67
OUR POLICIES AND GOOD GOVERNANCE PRACTICES
Stock Ownership Guidelines
Consistent with our executive compensation philosophy and the principle of aligning executive and stockholder interests, we expect our executive officers to maintain minimum ownership levels of General Cable common stock as follows:
Named Executive Officers | Ownership as Multiple of Base Salary |
Chief Executive Officer Mr. McDonnell | 6 times |
Chief Financial Officer Mr. Masanovich | 3 times |
Other Executive Officers Mr. Moser Mr. Singhal Ms. Stark | 3 times |
For purposes of satisfying ownership requirements, shares directly owned, unvested restricted stock units, and deferred shares held in General Cable’s Deferred Compensation Plan are counted for purposes of satisfying ownership guidelines. All of our executive officers, including our NEOs, must comply with these ownership requirements within five (5) years from their appointment as an executive officer. As of December 31, 2017, all NEOs are compliant with the stock ownership guidelines.
Compensation Recoupment Policy
Our Board of Directors has adopted an incentive compensation recoupment policy (“Clawback Policy”) that allows us to recover incentive-based compensation from our executive officers in the event we are required to prepare an accounting restatement due to our material noncompliance with any financial reporting requirement under the securities laws or from executive officers or key employees if the individual materially violates our Code of Ethics. Upon the restatement of our financial statements due to material noncompliance, our Board of Directors may, to the fullest extent permitted by law, require each current and former executive officer to reimburse us for any amount paid within the last thirty-six (36) months in excess of the amounts that would have been paid under our restated financial statements.
In the event of a material violation of our Code of Ethics by an executive officer or key employee, our Board of Directors can recover any incentive-based compensation paid to such individual within the last twelve (12) months. Our Board of Directors has the sole discretion to determine the form and timing of the recovery, which may include repayment and an adjustment to future incentive-based compensation payouts or grants. The remedies under our Clawback Policy are in addition to, and not in lieu of, any legal and equitable claims we may have or any actions imposed by law enforcement agencies, regulators or other authorities. Our Clawback Policy was effective and applies to all incentive-based compensation payouts or grants, including grants, awards or amounts paid under the AIP or under the Stock Incentive Plan.
Accounting Considerations
The accounting standards applicable to the various forms of long-term incentive plans under FASB ASC Topic 718 (formerly FASB Statement 123R) is one factor that the Compensation Committee and we consider in the design of our long-term equity incentive programs. The Compensation Committee and the Company monitor FASB ASC Topic 718 expense, but expense will not be the only factor in making decisions about our long-term incentive plans.
Deductibility of Executive Compensation
The Committee takes into account the tax impact of material provisions of and changes to our executive compensation program and discusses such matters periodically during the year. Generally, we realize a tax deduction upon the payment of compensation to the executive officer. In general, our policy is to optimize the tax deductibility of executive compensation so long as satisfying the conditions for deductibility is consistent with the objectives (as determined by the Committee, in the exercise of its business judgment) of maintaining competitive, motivational performance-based compensation that is aligned with stockholder interests and retaining executive officers. Accordingly, the Committee approved an initial performance target designed to qualify both our 2017 AIP payouts and 2017 RSUs as performance-based compensation for purposes of Section 162(m) of the Code (i.e., “umbrella plan”). The Committee may, in the exercise of such discretion, approve the payment of compensation regardless of its deductibility.
68
Severance and Change-in-Control Arrangements
In connection with the pending transaction with Prysmian, on January 16, 2018, we and Prysmian filed a definitive joint proxy statement containing certain disclosures, including disclosure of the interests of our directors and executive officers in the pending transaction. For a discussion of the payments that would be owed to our executive officers, including our NEOs, upon consummation of the proposed merger, please refer to the section entitled, “The Merger Agreement,” beginning on page 57 of the joint proxy statement, available at: www.sec.gov.
None of our NEOs has an employment agreement with the Company. Our NEOs may be eligible for post-employment payments and benefits in certain circumstances upon involuntary termination (without cause), or a qualifying termination following a change in control of the Company. These post-employment payments and benefits arise under the General Cable Corporation 2014 Executive Officer Severance Benefit Plan (the “Severance Plan”) and the outstanding equity award agreements. These potential severance benefits are discussed under the section titled, “Change in Control and Other Post-Employment Payments and Benefits.”
COMPENSATION COMMITTEE REPORT
The Compensation Committee has reviewed and discussed the Compensation Discussion and Analysis section appearing in this Annual Report on Form 10-K for the fiscal year ended December 31, 2017 with the Company’s management. Based on its review and discussions with management, the Compensation Committee recommended to our Board of Directors that the Compensation Discussion and Analysis be included in General Cable’s Annual Report on Form 10-K for the fiscal year ended December 31, 2017.
Compensation Committee
Craig P. Omtvedt, Chair
Gregory E. Lawton
Patrick M. Prevost
Compensation Committee Interlocks and Insider Participation
During fiscal 2017, the Compensation Committee consisted of Craig Omtvedt, Gregory Lawton and Patrick Prevost. No person who served as a member of the Compensation Committee during fiscal 2017 was a current or former officer or employee of the Company or engaged in certain transactions with us required to be disclosed as “related person transactions” under regulations of the SEC. There were no compensation committee “interlocks” during fiscal 2017, which generally means that none of our executive officers served as a director or member of the compensation committee of another entity, one of whose executive officers served as a member of the Board or as a member of the Compensation Committee.
Risk Assessment of Compensation Programs
The Compensation Committee oversees management’s annual assessment of the Company’s compensation programs. At its February 2018 meeting, the Compensation Committee reviewed the results of the 2017 annual compensation risk assessment and concurred with management’s conclusion that the Company’s compensation policies and practices do not create risks that are reasonably likely to have a material adverse effect on the company. This risk assessment included reviewing the design and operation of our compensation programs, identifying and evaluating situations or compensation elements that could raise more significant risks and evaluating other controls and processes designed to identify and manage risk.
69
EXECUTIVE COMPENSATION: COMPENSATION TABLES
Summary Compensation Table
The following table sets forth summary information relating to all compensation awarded to, earned by or paid to the individuals listed in the table below, collectively referred to as our NEOs for 2017 for all services rendered in all capacities to us and our subsidiaries during the fiscal years noted below.
Name and Principal Position | Year | Salary ($) | Bonus ($)(3) | Stock Awards ($)(4) | Option Awards ($)(5) | Non-Equity Incentive Plan Compensation ($)(6) | All Other Compensation ($)(7) | Total ($) |
Michael T. McDonnell President and Chief Executive Officer | 2017 2016 2015 | 950,000 945,192 462,500 | 500,000 | 3,371,203 2,167,170 5,656,663 | 527,756 - 1,999,995 | 563,347 920,123 637,862 | 150,560 55,277(8) 31,413 | 5,562,866 4,087,762 9,288,433 |
Matti M. Masanovich Senior Vice President and Chief Financial Officer | 2017 2016 | 495,192 56,635 | 50,000 | 887,158 288,161 | 138,881 - | 350,513 53,068 | 102,280 13,682 | 1,974,024 461,546 |
Emerson C. Moser Senior Vice President, General Counsel and Corporate Secretary | 2017 2016 2015 | 395,192 365,385 315,205 | 733,610 321,086 362,688 | 74,069 - - | 361,521 315,212 373,672 | 59,729 42,433(8) 22,906 | 1,624,121 1,044,116 1,074,471 | |
Shruti Singhal (1) Senior Vice President and President, Europe | 2017 | 345,078 | 250,000 | 852,951 | 54,847 | 52,376 | 113,190 | 1,668,442 |
Leah S. Stark Senior Vice President and Chief Human Resources Officer | 2017 2016 | 404,231 169,538 | - 350,000 | 436,892 558,587 | 68,394 - | 319,771 108,865 | 51,935 179,163 | 1,281,223 1,366,153 |
Juan Picon (2) Former Senior Vice President and President, North America | 2017 | 115,962 | 806,120 | 806,151 | 69,504 | - | 39,717 | 1,837,454 |
(1) | Mr. Singhal joined the Company as its Senior Vice President and President, Europe in February 2017. Compensation amounts for Mr.Singhal paid in euros have been converted to U.S. dollars using a monthly average currency conversion rate. |
(2) | Mr. Picon separated from service on April 28, 2017. Under his award agreements, all equity awards were cancelled upon his separation. |
(3) | Represents cash payments in connection with commencement of employment. For Mr. Singhal, the sign-on payment was to provide transition assistance and address unvested equity from former employer. For Mr. Picon, the payment was to provide transition assistance and to cover payback of relocation costs to former employer. |
70
(4) | Reflects fair value of target performance-based restricted stock units (“PSUs”) and time-based restricted stock unit awards (“RSUs”) on the award date. See our “Share-Based Incentive Plans” Note to the Consolidated Financial Statements included in this Form 10-K for the applicable fiscal year for a discussion of the relevant assumptions used to account for these awards. Under FASB ASC Topic 718, the RTSR metric applicable to a portion of the performance-based restricted stock units is a market condition and not a performance condition. Accordingly, there is not a grant date fair value below or in excess of the amounts reflected in the table above that could be calculated and disclosed based on achievement of market conditions. |
Name | Grant Date Fair Value 2017 RSUs ($) | Grant Date Fair Value of 2017 PSUs ($) | Value of 2017 PSUs at Maximum Performance Level ($)(a) |
Mr. McDonnell | 1,299,077 | 2,072,126 | 3,018,219 |
Mr. Masanovich | 341,863 | 545,295 | 794,273 |
Mr. Moser | 442,781 | 290,829 | 423,624 |
Mr. Singhal | 498,718 | 354,233 | 511,600 |
Ms. Stark | 168,353 | 268,539 | 391,148 |
Mr. Picon | 435,019 | 371,132 | 540,599 |
(a) | Represents the sum of (i) the grant date fair value of the portion of the PSU with the RTSR metric and (ii) the grant date value of the portion of the PSU with the ROIC metric assuming maximum performance (200% of target). |
(5) | Represents the fair value of stock option awards on the award date. See our “Share-Based Incentive Plan” Note to the Consolidated Financial Statements included in this Form 10-K for the applicable fiscal year for a discussion of the relevant assumptions used in calculating these values. |
(6) | Represents the cash incentive awards earned in 2017 under the 2017 AIP based on 2017 performance. For Mr. Moser, this amount also includes the long-term incentive cash award of $61,111 earned for the 2017 performance period. |
(7) | “All Other Compensation” column in 2017 included the following: |
Name | Company Contributions to Retirement Plan ($)(a) | Company Contribution to BEP ($)(b) | Value of Life Insurance Premiums ($)(c) | Relocation and Global Mobility ($)(d) | Severance ($)(e) | Total ($) |
Mr. McDonnell | 16,200 | 128,807 | 5,553 | — | — | 150,560 |
Mr. Masanovich | 16,200 | 37,726 | 990 | 47,364 | — | 102,280 |
Mr. Moser | 16,200 | 42,869 | 660 | — | — | 59,729 |
Mr. Singhal | 14,850 | 16,793 | 533 | 81,014 | — | 113,190 |
Ms. Stark | 16,200 | 35,075 | 660 | — | — | 51,935 |
Mr. Picon | 11,215 | — | 257 | 14,112 | 14,133 | 39,717 |
(a) | Represents the amount of all matching and retirement contributions earned under the Company’s 401(k) Savings and Investment Plan. |
(b) | Represents the amount of contributions earned under the BEP component of the DCP. |
(c) | Represents the amount of imputed income from Company-provided life insurance coverage. |
(d) | For Mr. Masanovich, the amount represents relocation expenses ($30,085) and related tax gross up ($17,279). For Mr. Singhal, the amount represents relocation allowance ($10,000), relocation related tax gross up ($3,733), expatriate relocation and assignment expenses ($65,136), and car allowance ($2,145), consistent with our local policy in Spain. For Mr. Picon, the amount represents relocation allowance ($10,000) and relocation related travel expenses ($4,112). |
(e) | Represents a lump sum payment ($8,635) and related tax gross up ($5,498) for Mr. Picon to cover the Company-paid portion of the COBRA health insurance continuation for the period of April 2017 through December 2017. |
(8) | “All Other Compensation” for 2016 was adjusted for Messrs. McDonnell and Moser for corrections to the calculations for Company Contributions to BEP. Mr. McDonnell received $2,192 less than originally reported for 2016 and Mr. Moser received $2,192 more than originally reported for 2016. |
71
CEO Pay Ratio
The following describes the relationship of the annual total compensation of General Cable employees to the annual total compensation of Michael T. McDonnell, our President and Chief Executive Officer.
For 2017, the median of the annual total compensation of all of our employees, other than Mr. McDonnell, was $40,634. Mr. McDonnell’s annual total compensation was $5,562,866. This represents the amount reported in the Total column of the 2017 Summary Compensation Table. Based on this information, the ratio of the annual total compensation of Mr. McDonnell to the median of the annual total compensation of all employees is estimated to be 137 to 1.
Identification of Median Employee
We selected October 1, 2017 as the date on which to determine our median employee. As of that date, General Cable had approximately 8,725 employees, with approximately 3,087 employees based in the United States and 5,638 employees located outside of the United States. The pay ratio disclosure rules provide an exemption for companies to exclude non-U.S. employees from the median employee calculation if non-U.S. employees in a particular jurisdiction account for five percent (5%) or less of the company’s total number of employees. General Cable applied this de minimis exemption when identifying the median employee by excluding 408 employees: Columbia (376), Ecuador (20), Honduras (7), El Salvador (4) and Italy (1). After taking into account the de minimis exemption, 3,087 employees in the United States and 5,230 employees located outside of the United States were considered for identifying the median employee.
For purposes of identifying the median employee from our employee population base, we considered base wages, as compiled from our payroll records. We selected base wages because it represents the principal form of compensation delivered to all of our employees and this information is readily available in each country. In addition, we measured compensation for purposes of determining the median employee using the year-to-date period ending October 1, 2017. Compensation paid in foreign currencies was converted to U.S. dollars based on exchange rates in effect on October 1, 2017.
Using this methodology, we determined that our median employee was a full-time, hourly employee located in the United States. In determining the annual total compensation of the median employee, such employee’s compensation was calculated in accordance with the SEC executive compensation disclosure rules.
72
Grants of Plan-Based Awards
The following table details the grants of plan-based awards to our NEOs in 2017.
Name | Grant Date | Estimated Possible Payouts Under Non-Equity Incentive Plan Awards(1) | Estimated Future Payouts Under Equity Incentive Plan Awards(2) | All Other Stock Awards: Number of Shares of Stock or Units (#)(3) | All Other Option Awards: Number of Securities Underlying Option (#)(4) | Exercise or Base Price of Option Awards ($/SH) | Grant Date Fair Value of Stock and Option Awards ($)(5) | ||||
Threshold ($) | Target ($) | Maximum ($) | Threshold (#) | Target (#) | Maximum (#) | ||||||
Mr. McDonnell | 2/10/2017 | 522,500 | 1,045,000 | 2,090,000 | 94,580 | 16.80 | 527,756 | ||||
2/10/2017 | — | 77,326 | — | 1,299,077 | |||||||
2/22/2017 | 57,865 | 115,729 | 231,458 | 2,072,126 | |||||||
Mr. Masanovich | 2/10/2017 | 175,000 | 350,000 | 700,000 | 24,889 | 16.80 | 138,881 | ||||
2/10/2017 | — | 20,349 | — | 341,863 | |||||||
2/22/2017 | 15,228 | 30,455 | 60,910 | 545,295 | |||||||
Mr. Moser | 2/10/2017 | 140,000 | 280,000 | 560,000 | 13,274 | 16.80 | 74,069 | ||||
2/10/2017 | — | 10,852 | — | 182,314 | |||||||
2/10/2017 | 15,504 | 260,467 | |||||||||
2/22/2017 | 8,122 | 16,243 | 32,486 | 290,829 | |||||||
Mr. Singhal | 3/17/2017 | 123,011 | 246,021 | 492,042 | 9,126 | 17.65 | 54,847 | ||||
3/17/2017 | — | 28,256 | — | 498,718 | |||||||
3/17/2017 | 8,916 | 17,832 | 35,664 | 354,233 | |||||||
Ms. Stark | 2/10/2017 | 143,500 | 287,000 | 574,000 | 12,257 | 16.80 | 68,394 | ||||
2/10/2017 | — | 10,021 | — | 168,353 | |||||||
2/22/2017 | 7,499 | 14,998 | 29,996 | 268,539 | |||||||
Mr. Picon(6) | 2/10/2017 | 191,250 | 382,500 | 765,000 | 12,456 | 16.80 | 69,504 | ||||
2/10/2017 | — | 25,894 | — | 435,019 | |||||||
2/22/2017 | 10,364 | 20,728 | 41,456 | 371,132 | |||||||
(1) | Reflects the incentive opportunities granted in 2017 under the AIP. Actual amounts earned in 2017 by our NEOs are reflected in the Summary Compensation Table. For more information on the 2017 AIP awards, including the applicable performance conditions, please see the “Annual Cash Compensation” section of the CD&A of this Form 10-K. |
(2) | Reflects RSUs and PSUs awarded to our NEOs in 2017. There are no threshold or maximum future payouts under the RSU awards. For more information on the 2017 RSU and PSU awards, including the applicable performance periods and performance conditions, please see the “Long Term Incentives” section of the CD&A of this Form 10-K. |
(3) | Reflects time-based RSU award granted as an additional incentive and vests in two equal installments upon first and second anniversary of the award, generally subject to the NEOs continued employment through the applicable vesting period. |
(4) | Stock options were granted as part of the Company’s annual long-term incentive program and vest over a three-year term in equal annual installments on each anniversary of the award date, generally subject to continued employment through the applicable vesting date. |
(5) | See our “Share-Based Compensation” Note to the Consolidated Financial Statements in this Form 10-K for a discussion of the relevant assumptions used to account for these awards. |
(6) | Mr. Picon’s separated from the Company effective April 28, 2017. Under his award agreements, all equity awards were cancelled upon his separation. |
73
Outstanding Equity Awards at Fiscal Year End
The following table provides information with respect to outstanding equity awards held by our NEOs as of December 31, 2017.
Name | OPTION AWARDS | STOCK AWARDS | ||||||||
Grant Date | Number of Securities Underlying Unexercised Options Exercisable (#) | Number of Securities Underlying Unexercised Options Unexercisable (#)(2) | Option Exercise Price ($) | Option Expiration Date | Grant Date | Number of Shares or Units of Stock that Have not Vested (#)(3) | Market Value of Shares or Units of Stock that Have not Vested ($)(4) | Equity Incentive Plan Awards: Number of Unearned Shares, Units or Other Rights That Have Not Vested (#)(3) | Equity Incentive Plan Awards: Market or Payout Value of Unearned Shares, Units or Other Rights That Have Not Vested ($)(4) | |
Mr. McDonnell | 7/1/2015 | 234,724 | 117,363 | 19.65 | 7/1/2025 | 2/11/2016 | 58,588 | 1,734,205 | ||
2/10/2017 | - | 94,580 | 16.80 | 2/10/2027 | 2/11/2016 | 351,528(5) | 10,405,228 | |||
2/10/2017 | 51,151 | 1,525,910 | ||||||||
2/22/2017 | 231,458(5) | 6,851,157 | ||||||||
Mr. Masanovich | 2/10/2017 | - | 24,889 | 16.80 | 2/10/2027 | 11/11/2016 | 3,272 | 96,851 | ||
11/11/2016 | 12,572(5) | 372,131 | ||||||||
2/10/2017 | 13,566 | 401,554 | ||||||||
2/22/2017 | 60,910(5) | 1,802,936 | ||||||||
Mr. Moser | 2/10/2017 | - | 13,274 | 16.80 | 2/10/2027 | 2/11/2016 | 8,681 | 256,958 | ||
2/11/2016 | 52,082(5) | 1,541,627 | ||||||||
2/10/2017 | 7,752 | 229,459 | 7,235 | 214,156 | ||||||
2/22/2017 | 32,486(5) | 961,586 | ||||||||
Mr. Singhal | 3/17/2017 | - | 9,126 | 17.65 | 3/17/2027 | 3/17/2017 | 18,838 | 557,605 | ||
3/17/2017 | 35,664(5) | 1,055,654 | ||||||||
Ms. Stark | 2/10/2017 | - | 12,257 | 16.80 | 2/10/2027 | 7/15/2016 | 5,728 | 169,549 | ||
7/15/2016 | 34,364(5) | 1,017,174 | ||||||||
2/10/2017 | 6,681 | 197,758 | ||||||||
2/22/2017 | 29,996(5) | 887,882 | ||||||||
Mr. Picon(1) | None | None | ||||||||
(1) | Mr. Picon separated from the Company effective April 28, 2017. Under his award agreements, all unvested equity awards were canceled upon his separation, and there were no equity awards outstanding as of December 31, 2017. |
(2) | As shown in the table above, Mr. McDonnell has awards from 2015 and 2017 with remaining unvested stock options listed in this column. All other NEOs have unvested stock options from 2017. Stock options vest and become exercisable in equal installments on the first, second and third anniversary of the grant date. The award made in 2015 has one vesting date remaining. The awards made in 2017 have three vesting dates remaining. |
74
(3) | The vesting schedule for RSUs and PSUs that have not vested is as follows: |
Name | Grant Date | Unvested Shares/Units | Vesting Schedule |
Mr. McDonnell | 2/11/2016 | 58,588 | (a) |
2/11/2016 | 351,528 | (b) | |
2/10/2017 | 51,551 | (c) | |
2/22/2017 | 231,458 | (d) | |
Mr. Masanovich | 11/11/2016 | 3,272 | (a) |
11/11/2016 | 12,572 | (b | |
2/10/2017 | 13,566 | (c) | |
2/22/2017 | 60,910 | (d) | |
Mr. Moser | 2/11/2016 | 8,681 | (a) |
2/11/2016 | 52,082 | (b) | |
2/10/2017 | 7,235 | (c) | |
2/10/2017 | 7,752 | (e) | |
2/22/2017 | 32,486 | (d) | |
Mr. Singhal | 3/17/2017 | 18,838 | (c) |
3/17/2017 | 35,664 | (d) | |
Ms. Stark | 7/15/2016 | 5,728 | (a) |
7/15/2016 | 34,364 | (b) | |
2/10/2017 | 6,681 | (c) | |
2/22/2017 | 29,996 | (d) | |
(a) | RSUs vest one-third each year beginning December 31, 2016; the vesting is contingent upon certification by the Compensation Committee that the applicable performance condition has been achieved. The performance condition operates on a rolling basis with a catch-up feature for each vesting tranche. One-third of such RSUs vested December 31, 2016 and are not included in this table. One-third of such RSUs vested on December 18, 2017 and are not included in this table. |
(b) | PSUs granted for the 2016-2018 performance period vest December 31, 2018 pending certification of certain performance conditions applicable to the 2016-2018 performance period. |
(c) | RSUs vest one-third each year beginning December 31, 2017; the vesting is contingent upon certification by the Compensation Committee that the applicable performance condition has been achieved. One-third of such RSUs vested December 18, 2017 and are not included in this table. |
(d) | PSUs granted for the 2017-2019 performance period vest December 31, 2019 pending certification of certain performance conditions applicable to the 2017-2019 performance period. |
(e) | Time-based RSUs vest in two equal installments in each year on the anniversary of the date of grant. One-half of such RSUs vested December 18, 2017 at the discretion of the Committee and are not included in this table. |
(4) | Represents the product of the stock units and the closing price of our common stock of $29.60 as reported on December 29, 2017. |
(5) | Represents PSUs granted in 2016 and 2017. However, the amount, if any, of these awards that will be paid out will depend upon the actual performance over the full performance period and the Compensation Committee’s certification of performance after completion of each of the performance cycles. |
75
Option Exercises and Stock Vested
The following table provides information on the shares acquired upon the vesting and distribution of awards held by our NEOs in 2017. None of the NEOs exercised stock options in 2017.
Name | OPTION AWARDS | STOCK AWARDS | ||
Number of Shares Acquired on Exercise (#) | Valued Realized on Exercise ($) | Number of Shares Acquired on Vesting (#) | Valued Realized on Vesting ($)(1) | |
Mr. McDonnell | — | — | 324,587 | 9,639,935 |
Mr. Masanovich | — | — | 10,054 | 298,604 |
Mr. Moser | — | — | 49,198 | 1,428,078 |
Mr. Singhal | — | — | 9,418 | 279,715 |
Ms. Stark | — | — | 9,067 | 269,290 |
Mr. Picon | — | — | — | — |
(1) | The Value Realized on Vesting of stock awards is calculated by multiplying the number of shares of common stock vested by the Fair Market Value of our common stock on the respective vesting dates and reflects the gross amount realized without netting the value of shares surrendered to satisfy tax withholding obligations. |
Non-Qualified Deferred Compensation
The Deferred Compensation Plan (DCP) permits key U.S.-based executive officers to elect to defer a portion of salary and bonus payments into the DCP.
Prior to 2016, the DCP also permitted employee participants to defer any stock based awards under the Amended Stock Incentive Plan (and predecessor plans). Distributions are not permitted until termination of employment. Cash deferred and dividends paid on deferred shares of stock may be invested in any of the investment vehicles provided under the DCP. Shares of stock representing employee stock awards may not be reinvested into other vehicles, but must remain in the DCP as whole shares and will be distributed as such in accord with distribution elections made by each participant. The DCP assets are held in a “rabbi trust,” and as such, are subject to the claims of general creditors of our Company. Operation of the plan and distributions are also subject to Section 409A of the Code, which imposes procedural (including timing) restrictions on the DCP and on any future changes in distribution elections.
The BEP provides excess benefits that make up benefits on certain wages that are not eligible for contribution under federal IRS limitations relating to our Retirement Plans. Under the BEP component of the DCP, our Company makes discretionary Company contributions similar to the matching and retirement contributions made under the Company’s Retirement Plans. BEP contributions are made annually by our Company.
The following table provides information on benefits for our NEOs under our DCP.
Name | Executive Contributions in Last FY(1) | Registrant Contributions in Last FY(2) | Aggregate Earnings in Last FY | Aggregate Withdrawals/Distributions | Aggregate Balance at Last FYE(3) | ||||||||||
Mr. McDonnell | $ | — | $ | 128,807 | $ | 1,138 | $ | — | $ | 165,164 | |||||
Mr. Masanovich | $ | — | $ | 37,726 | $ | — | $ | — | $ | 37,726 | |||||
Mr. Moser | $ | 47,485 | $ | 42,869 | $ | 11,599 | $ | — | $ | 170,675 | |||||
Mr. Singhal | $ | — | $ | 16,793 | $ | — | $ | — | $ | 16,793 | |||||
Ms. Stark | $ | 21,720 | $ | 35,075 | $ | 983 | $ | — | $ | 65,414 | |||||
Mr. Picon | $ | — | $ | — | $ | — | $ | — | $ | — | |||||
(1) | Amount shown reflects deferral of a portion of Mr. Moser’s and Ms. Stark’s salary for 2017, which is included as Salary in the Summary Compensation Table for 2017. |
(2) | Represents the amount of our Company’s contribution for 2017 to the DCP for the BEP component. These amounts are included in the “All Other Compensation” column of the Summary Compensation Table for 2017. |
(3) | Includes amounts reported as compensation for Messrs. McDonnell and Moser in the Summary Compensation Table for previous years. |
76
Potential Payments Upon Termination or Change in Control of the Company
In connection with the pending transaction with Prysmian, on January 16, 2018 we and Prysmian filed a definitive joint proxy statement containing certain disclosures, including disclosure of the interests of our executive officers in the proposed merger. For a discussion of the payments that would be owed to our executive officers, including Messrs. McDonnell, Masanovich, Moser and Ms. Stark, upon consummation of the proposed merger, please refer to the section entitled, “Merger Agreement,” beginning on page 57 of the joint proxy statement, available at: www.sec.gov.
Our NEOs may be eligible for post-employment payments and benefits in certain circumstances upon termination or a change in control of our Company. These post-employment payments and benefits arise under the 2014 Executive Officer Severance Plan (“Severance Plan”). Additionally, all participants, including our NEOs, are entitled to certain payments and benefits upon termination or change in control as specified in our equity plans and grant agreements under the Amended and Restated General Cable Stock Incentive Plan (“Stock Incentive Plan”) and our Annual Incentive Plan.
The following information describes the payments or benefits that would be available under these plans for our NEOs, other than Mr. Picon, (the “eligible NEOs”) as Mr. Picon separated from service on April 28, 2017. Upon his separation from service, Mr. Picon received a cash payment of $586,120, which represented the remaining unpaid portion of the cash payment agreed to at Mr. Picon's hire to assist with transition and relocation costs with his previous employer. The Company also paid to Mr. Picon a lump sum payment, grossed up for taxes, equal to the employer portion of the COBRA health care continuation coverage (including dental) through December 31, 2017. All amounts paid to Mr. Picon, including these severance payments, are included in the Summary Compensation Table. The table below discloses amounts payable to our eligible NEOs under various termination of employment scenarios occurring as of December 31, 2017, assuming in each case that the merger agreement with Prysmian had not been signed as of that date. The payments to our NEOs are governed by the Severance Plan, the Stock Incentive Plan, and the Annual Incentive Plan as described in the footnotes and narratives below:
Name | Severance Payments ($)(1) | Target Annual Incentive ($)(2) | Current Year Annual Incentive ($)(3) | Vesting of Stock Options ($)(4) | Vesting of RSUs and PSUs ($)(5) | Dividend Equivalent Rights ($)(6) | Health, Welfare and Other Benefits ($)(7) | Total ($) |
Involuntary Termination Without Cause | ||||||||
Mr. McDonnell | 1,900,000 | 2,090,000 | 563,347 | 89,938 | 4,643,285 | |||
Mr. Masanovich | 750,000 | 525,000 | 350,513 | 35,098 | 1,660,611 | |||
Mr. Moser | 600,000 | 420,000 | 300,410 | 54,954 | 1,375,364 | |||
Mr. Singhal | 585,000 | 438,750 | 52,376 | 59,866 | 1,135,992 | |||
Ms. Stark | 615,000 | 430,500 | 319,771 | 54,954 | 1,420,225 | |||
Qualifying Termination Upon Change in Control | ||||||||
Mr. McDonnell | 2,850,000 | 3,135,000 | 563,347 | 2,378,386 | 13,605,170 | 457,620 | 109,907 | 23,099,430 |
Mr. Masanovich | 1,000,000 | 700,000 | 350,513 | 318,579 | 1,647,340 | 40,297 | 38,464 | 4,095,193 |
Mr. Moser | 800,000 | 560,000 | 300,410 | 169,907 | 2,206,548 | 72,485 | 64,938 | 4,174,288 |
Mr. Singhal | 780,000 | 585,000 | 52,376 | 109,056 | 1,259,615 | 19,802 | 71,514 | 2,877,363 |
Ms. Stark | 820,000 | 574,000 | 319,771 | 156,890 | 1,487,668 | 37,652 | 64,938 | 3,460,919 |
(1) | Salary continuation was calculated using the following base salaries for 2017: $950,000 for Mr. McDonnell, $500,000 for Mr. Masanovich, $400,000 for Mr. Moser, $390,000 for Mr. Singhal, and $410,000 for Ms. Stark. This amount would be paid in equal installments based on regularly scheduled payroll periods over the applicable severance period. |
(2) | Target Bonus equals the higher of our NEOs current target or the average of the AIP bonuses paid to the NEOs in the prior three years. This amount will be paid in a lump sum. |
(3) | Awards under the AIP are determined based on a calendar year performance. These amounts reflect the 2017 AIP awards as approved by the Committee. |
(4) | These amounts assume unvested stock options are accelerated and exercised at $29.60, the closing price per share of our common stock on December 29, 2017. |
(5) | The fair market value of acceleration of unvested equity awards shown above is based on the closing price of $29.60 per share of our common stock on December 29, 2017. These amounts represent the value of all unvested RSUs granted in 2016 and 2017; outstanding 2016 and 2017 PSUs are included in this column at performance value. |
(6) | These amounts represent the value of dividend equivalent rights accrued on RSUs and PSUs. |
77
(7) | This amount represents (a) the maximum outplacement benefits that are available under the Severance Plan of $50,000 for the CEO and $25,000 for other NEOs, and (b) the aggregate amount of cash payments that the NEO would be entitled to receive in lieu of continuation of the NEO’s health care benefits, as they existed on December 31, 2017 for the maximum stated period of time required by the Severance Plan. |
Severance Plan
The Severance Plan provides for severance benefits in case of (i) involuntary termination of employment without change in control and (ii) termination of employment in connection with a change in control as such term is defined in the Severance Plan, as applicable. The potential severance benefits upon these termination events are discussed below.
Involuntary Termination without Change in Control. A NEO may be entitled to severance and benefits in the event of an involuntary termination of the executive officer’s employment. An involuntary termination will not include any of the following circumstances:
• | the executive officer is offered or agrees to assume another position with our Company or a successor owner of our Company; |
• | the executive officer receives an offer of reemployment with our Company or a successor owner after the executive officer’s termination but before the full payment of severance benefits; and |
• | the executive officer’s termination is due to a voluntary termination or resignation, including retirement, death, disability or the failure to return from a leave of absence. |
If the executive officer’s involuntary termination qualifies, the severance benefits would be the following:
CEO: two (2) years of base pay and target level bonus under our AIP, a pro-rated bonus for the year of termination based on relevant performance, continued participation in employer health and life insurance plans or the equivalent premium cost of the employer for two years, and limited outplacement assistance; and
Other NEOs: one and one-half (1.5) years of base pay and target level bonus under our AIP, a pro-rated bonus for the year of termination based on relevant performance, continued participation in employer health and life insurance plans or the equivalent premium cost of the employer for one and one-half years, and limited outplacement assistance.
Termination in Connection with Change in Control. In the event of an involuntary termination, including a termination for good reason, in connection with a change in control of General Cable, the Severance Plan operates using what is commonly called a “double trigger.” This means that for the executive officer to receive payments or benefits under the Severance Plan, both a change in control and a triggering event must occur.
Under our Severance Plan, “change in control” is defined as the occurrence of any of the following events:
• | any outside person or other entity beneficially owns more than 50 percent of all classes of our capital stock that are normally entitled to vote upon the election of our directors; |
• | we sell all or substantially all of our property or assets; |
• | we consolidate or merge with a third party whereby persons who were our stockholders immediately before the consolidation or merger together own less than 60 percent of the voting stock of the surviving entity; or |
• | individuals who constituted our Board of Directors (referred to as the incumbent board) cease to constitute at least a majority of our Board of Directors. |
After a change in control, one of the following events will be considered the second “trigger” that will require us to provide an NEO with specified benefits:
• | if we or our successor terminates the executive officer’s employment without “cause” within twenty four (24) months (as to our CEO) or eighteen (18) months (as to our other NEOs) after a change in control. “Cause” is generally defined to mean any of the following with respect to an executive officer: |
• | willful or continuous neglect of or refusal to perform duties and responsibilities; |
• | insubordination, dishonesty, fraud, gross neglect or willful malfeasance by the executive officer in the performance of duties and responsibilities; |
• | conviction or entry into a plea of nolo contendere to any felony; and |
• | serious violation of our Company rules or regulations. |
78
• | if the executive officer terminates employment for “good reason” within twenty-four (24) months (as to our CEO) or eighteen (18) months (as to our other NEOs) after a change in control. “Good reason” is generally defined to mean the occurrence of any of the following without the executive officer’s consent: |
• | any material diminution in the executive officer’s position, authority, duties or responsibilities; |
• | a reduction in the executive officer’s annual base salary or incentive compensation opportunities; and |
• | a material change in the geographic location of the principal place of employment |
In the event of a change in control followed by a triggering event, we (or our successor) would be required to pay each of our NEOs the following:
CEO: three (3) years of base pay and target level bonus and a pro-rated bonus for the year of termination based on relevant performance, continued participation in employer’s health and life insurance plans or the equivalent premium cost of the employer for three years, and limited outplacement assistance; and
Other NEOs: two (2) years of base pay and target level bonus and a pro-rated bonus for the year of termination based on relevant performance, continued participation in employer’s health and life insurance plans or the equivalent premium cost of the employer for two years, and limited outplacement assistance.
Under the Severance Plan, a severance payment that would constitute an “excess parachute payment” (as defined in Section 280G of the Code) will be reduced to the largest amount that will not result in the executive’s receipt of such excess parachute payment if such reduction will provide the executive with the net after-tax payment that is greater than the one that would have been received without such reduction.
Conditions to Severance Benefits. Our executive officers will not be eligible for benefits under the Severance Plan if the executive officer is covered by an employment, severance, or separation agreement that entitles the executive officer to severance benefits after termination of employment. As a condition to receiving severance benefits, an eligible executive officer will be required to enter into a customary separation agreement in which the executive officer will agree to the following:
• | a release and waiver of any claims against our Company; |
• | non-compete and non-solicit limitations unless otherwise approved by our Board; and |
• | performance or satisfaction of any remaining obligations to our Company. |
Stock Incentive Plan
Change in Control Payments and Benefits
In May 2015, our stockholders approved the Stock Incentive Plan, which provides for “double trigger vesting” after a change in control.
Unless the Compensation Committee determines otherwise, if a change in control occurs in which the Company is not the surviving corporation (or the Company survives only as a subsidiary of another corporation), all outstanding awards that are not exercised or paid at the time of the change in control will be assumed by, or replaced with awards that have comparable terms by, the surviving corporation (or a parent or subsidiary of the surviving corporation).
Unless the award agreement provides otherwise, if a participant’s employment is terminated by us without cause, or the participant terminates employment for good reason, in either case within 12 months following the change in control, the participant’s outstanding awards will become fully vested as of the date of termination. If the vesting of any such award is based, in whole or in part, on performance, the applicable award agreement will specify how the portion of the award that becomes vested upon termination will be calculated. RSUs granted beginning in 2015 provide that if a participant’s employment is terminated by the Company without cause or by the participant for good reason upon or within 12 months following a change in control, any unvested portion of the RSUs become fully vested upon termination of employment. PSUs granted beginning in 2015 provide that if a change in control occurs prior to the end of the performance period, achievement of the performance goals will be measured as of the change in control date, and vesting of the PSUs will remain subject to the participant’s continued employment through the end of the performance period. However, if the participant’s employment is terminated by the Company without cause or by the participant for good reason upon or within 12 months following such change in control, then the PSUs will vest in full based on the achievement of performance goals as of the change in control.
79
In the event of a change in control, if all outstanding awards are not assumed by, or replaced with awards with comparable terms by, the surviving corporation, the Compensation Committee may not determine to immediately vest the unvested portion of any awards or take other action to permit participants to realize the value of rights granted to them under the Stock Incentive Plan.
Under the Stock Incentive Plan, “change in control” means:
• | any person or entity, other than General Cable, its subsidiaries or an employee benefit plan sponsored by General Cable or its subsidiaries, becomes the beneficial owner of more than 35% of our voting stock; |
• | consummation of a sale of all or substantially all of General Cable’s assets or property; |
• | our common stock ceases to be publicly traded; |
• | consummation of a merger or consolidation of General Cable with another corporation following which our stockholders immediately before the transaction own less than 51% of the voting stock of the surviving entity; or |
• | individuals who, as of January 1, 2015, constituted our Board of Directors (referred to as the incumbent board) cease to constitute at least a majority of our Board of Directors. Any individual who becomes a director after such date and whose election or nomination was approved by at least two-thirds of the directors then comprising the incumbent board will be considered a member of the incumbent board. However, no individual who was initially elected as a member of our Board of Directors in connection with an actual or threatened election contest or settlement of an actual or threatened election contest will be considered to be a member of the incumbent board. |
The Committee may provide a different definition of change in control in an award agreement if it determines a different definition is necessary or appropriate, including to comply with Section 409A of the Code.
Other Termination Events. Outstanding vested and unvested awards under our incentive plans will be subject to the following treatment, subject to applicable award agreements and our Compensation Committee’s discretion:
Reason for Termination | Effect on Awards under the Stock Incentive Plan |
Death or Disability | • Unvested RSUs will become vested upon death or disability without regard to the satisfaction of applicable performance conditions.• Unvested PSUs upon Death: vest pro-rata at target.• Unvested PSU upon Disability: vest pro-rata to the extent performance targets are satisfied.• All other unvested awards will become vested• Unexercisable stock options will become exercisable for one year unless the award has an earlier expiration date. |
For Cause Termination | • All outstanding awards, whether or not vested, earned or exercisable will be forfeited. |
Other Termination Events | • Unvested awards will be forfeited.• Vested stock options will be exercisable for a 90-day period unless the award has an earlier expiration date. |
Dividend Equivalent Rights (“DERs”) accrue on RSUs and PSUs and are subject to the same vesting and other terms as RSUs or PSUs to which they relate. If underlying RSUs or PSUs are forfeited, all related DERs are also forfeited. DERs are paid in cash at the same time as the underlying RSUs or PSUs are settled. No interest is credited with respect to any outstanding DERs.
80
Death or Disability and Retirement. The table below discloses amounts payable to our eligible NEOs under termination of employment upon death or disability as of December 31, 2017. None of our NEOs were retirement eligible as of December 31, 2017.
Name | Current Year Annual Incentive ($)(1) | Vesting of Stock Options ($)(2) | Vesting of RSUs and PSUs ($)(3) | Dividend Equivalent Rights ($)(4) | Total ($) |
Death/Disability | |||||
Mr. McDonnell | 563,347 | 2,378,386 | 7,858,543 | 317,704 | 11,117,980 |
Mr. Masanovich | 350,513 | 318,579 | 871,253 | 22,222 | 1,562,567 |
Mr. Moser | 300,410 | 169,907 | 1,374,713 | 52,189 | 1,897,219 |
Mr. Singhal | 52,376 | 109,056 | 689,562 | 12,580 | 863,574 |
Ms. Stark | 319,771 | 156,890 | 732,585 | 22,975 | 1,232,221 |
(1) | Awards under the AIP are determined based on a calendar year performance. These amounts reflect the 2017 AIP awards as approved by the Committee. |
(2) | These amounts assume unvested stock options are accelerated and exercised at $29.60, the closing price per share of our common stock on December 29, 2017. |
(3) | These amounts represent the value of all unvested RSUs granted in 2016 and 2017 and all outstanding 2016 and 2017 PSUs (at target performance value and prorated for the portion of the completed performance period) with valuation based on $29.60, the closing price per share of our common stock on December 29, 2017. |
(4) | These amounts represent the value of dividend equivalent rights accrued on RSUs and PSUs. |
Non-Employee Director Compensation
For 2017, our non-employee director compensation program consisted of the following components:
Amount/Value | |||
Annual Cash Retainer | $ | 100,000 | |
Annual Cash Retainer for Non-Employee Chairman | $ | 185,000 | |
Annual Equity Award Retainer | $ | 130,000 | |
Annual Equity Award Retainer for Non-Employee Chairman | $ | 210,000 | |
Additional Annual Cash Retainer for Committee Chair | |||
Audit Committee Chair | $ | 20,000 | |
Compensation Committee Chair | $ | 15,000 | |
Corporate Governance Committee Chair | $ | 12,500 | |
Limit on Non-Employee Director Annual Compensation
Effective 2017, our non-employee director compensation program is subject to an annual aggregate limit on compensation. The annual cash retainer paid during any calendar year and the value of equity awards as determined on the date of grant for each non-employee director may not exceed $690,000.
Non-Employee Director Equity Awards
In 2017, our non-employee director compensation included a grant of restricted stock units (“RSUs”) on the date of the annual meeting of stockholders, based on the equity award retainer amount of $130,000 ($210,000 for Non-Employee Chairman), with the number of RSUs to be issued determined by the 20-day average closing price of our common stock immediately preceding the annual meeting. Each RSU represents the right to receive one share of common stock. The RSUs vest and are distributed on the one-year anniversary of the grant date, along with dividend equivalents credited during the vesting period.
81
Additional 2017 Compensation - Board Chairman
In December 2017, The Compensation Committee, upon the review and advice of its independent consultant Hay Group, recommended, and the Board approved, a special cash payment of $300,000 to Mr. Welsh for the additional time, responsibilities and leadership assumed in 2017 and his anticipated efforts in 2018 during the pendency of the acquisition of General Cable Corporation by Prysmian Group.
Deferral of Annual Retainer and Equity Awards
Non-employee directors may elect to defer all or a portion of their annual retainers and equity awards on an annual basis before the beginning of each calendar year. Deferrals remain in the General Cable Deferred Compensation Plan (“DCP”) until termination of services as a director. Cash retainers deferred and dividends paid on deferred equity awards may be invested in any of the investment vehicles provided under the DCP. Deferred equity awards may not be reinvested into other vehicles and will be distributed in accordance with distribution elections made by each participant. Operation of the DCP and distributions are also subject to Section 409A of the Code, which imposes procedural (including timing) restrictions on the DCP and on any future changes in distribution elections.
Non-Employee Director Stock Ownership Guidelines
The Board encourages directors to attain a meaningful stock ownership interest in General Cable. Under our Stock Ownership Guidelines, non-employee directors are required to own common stock with a value equal to five times the annual cash retainer within five years from their date of appointment. Each of our non-employee directors was in compliance with these requirements as of December 31, 2017.
Non-Employee Director Compensation Table
Name | Fees Earned or Paid in Cash ($) | Stock Awards ($)(2) | All Other Compensation ($)(3) | Total ($) |
Sallie B. Bailey | 100,000 | 115,630 | 215,630 | |
Edward Childs Hall, III | 100,000 | 115,630 | 215,630 | |
Gregory E. Lawton | 112,500 | 115,630 | 228,130 | |
Craig P. Omtvedt | 115,000 | 115,630 | 230,630 | |
Patrick M. Prevost (1) | 120,000 | 115,630 | 235,630 | |
John E. Welsh, III | 185,000 | 186,775 | 300,000 | 671,775 |
(1) | Mr. Prevost deferred his 2017 cash fees and annual equity award into our DCP. |
(2) | Represents the grant date fair value of the annual equity award of RSUs made on May 18, 2017 as determined under Financial Accounting Standards Board Accounting Standards Codification 718, Stock Compensation (“ASC Topic 718”). The following table sets forth the number of outstanding RSUs held by each director as of December 31, 2017. |
Name | RSUs |
Sallie B. Bailey | 7,460 |
Edward Childs Hall, III | 7,460 |
Gregory E. Lawton | 7,460 |
Craig P. Omtvedt | 7,460 |
Patrick M. Prevost (1) | 7,460 |
John E. Welsh, III | 12,050 |
(3) | Represents special cash payment to Mr. Welsh as noted above under “Additional 2017 Compensation - Board Chairman.” |
82
ITEM 12. | SECURITY OWNERSHIP OF CERTAIN BENEFICIAL OWNERS AND MANAGEMENT AND RELATED STOCKHOLDER MATTERS |
The following table sets forth information, as of February 20, 2018, concerning the beneficial ownership of General Cable common stock by: (i) each current director; (ii) each of our named executive officers; and (iii) all current directors and executive officers as a group. The address of each of the persons named below is c/o General Cable Corporation, 4 Tesseneer Drive, Highland Heights, Kentucky 41076.
Whenever we refer in this Form 10-K to the “named executive officers,” we are referring to those executive officers that we identified in the Summary Compensation Table in Item 11.
Name of Beneficial Owner(1) | Amount and Nature of Beneficial Ownership(1)(2)(3)(4) | Percent of Class(5) | |
Non-Employee Directors | |||
Sallie B. Bailey | 25,580 | * | |
Edward Childs Hall, III | 26,110 | * | |
Gregory E. Lawton | 68,991 | * | |
Craig P. Omtvedt | 263,486 | * | |
Patrick M. Prevost | 34,780 | * | |
John E. Welsh, III (Chairman of the Board) | 251,451 | * | |
Named Executive Officers | |||
Michael T. McDonnell | 534,268 | 1.1% | |
Matti M. Masanovich | 17,002 | * | |
Emerson C. Moser | 54,523 | * | |
Shruti Singhal | 8,219 | * | |
Leah S. Stark | 14,506 | * | |
All Directors and Executive Officers, as a Group | 1,291,220 | 2.6 | % |
(1) | Beneficial ownership is determined under SEC rules and includes voting or investment power with respect to the shares. |
The amounts in the table above do not include the following interests in our common stock, which interests do not confer voting or investment power:
• | shares of common stock underlying options which are not currently exercisable or not exercisable within 60 days of February 20, 2018, as follows: 180,416 options for Mr. McDonnell; 24,889 options for Mr. Masanovich; 8,849 options for Mr. Moser; 6,084 options for Mr. Singhal; 8,171 options for Ms. Stark and 7,197 options for the other executive officers as a group; |
• | shares of common stock underlying RSUs which have not vested as of February 20, 2018 and will not vest within 60 days of February 20, 2018, as follows: 7,460 RSUs for Ms. Bailey; 7,460 RSUs for Mr. Hall; 7,460 RSUs for Mr. Lawton; 7,460 RSUs for Mr. Omtvedt; 7,460 RSUs for Mr. Prevost; 12,050 RSUs for Mr. Welsh; 110,139 RSUs for Mr. McDonnell; 16,838 RSUs for Mr. Masanovich; 23,668 RSUs for Mr. Moser; 18,838 RSUs for Mr. Singhal; 12,409 RSUs for Ms. Stark; and 18,583 RSUs for the other executive officers as a group; and |
• | shares of common stock underlying PSUs (at target) which have not vested as of February 20, 2018 and will not vest within 60 days of February 20, 2018, as follows: 291,493 PSUs for Mr. McDonnell; 36,741 PSUs for Mr. Masanovich; 42,284 PSUs for Mr. Moser; 17,832 PSUs for Mr. Singhal; 32,180 PSUs for Ms. Stark; and 23,337 PSUs for the other executive officers as a group. |
(2) | Includes shares that could be acquired by the exercise of stock options that are currently exercisable or exercisable within 60 days of February 20, 2018, as follows: 266,249 shares for Mr. McDonnell; 8,296 shares for Mr. Masanovich; 4,424 shares for Mr. Moser; 3,042 shares for Mr. Singhal; 4,085 shares for Ms. Stark; and 3,598 shares for all other executive officers as a group. |
(3) | Includes shares allocated to the beneficial owner’s account in the General Cable Corporation Retirement Savings Plan as follows: 2,157 shares for Mr. Moser and 23 shares for all other executive officers as a group. Shares allocated to a participant’s account in the General Cable Corporation Retirement Savings Plan will be voted by the trustee in accordance with the participant's instructions. If the trustee does not receive instructions as to the voting of particular shares, the trustee will vote such shares in the same proportion to instructions actually received from other participants in the General Cable Corporation Retirement Savings Plan. |
83
(4) | Includes: (a) deferred shares held under the DCP as follows: 27,411 shares for Mr. Lawton; 14,139 shares for Mr. Omtvedt; 26,070 shares for Mr. Prevost; 109,451 shares for Mr. Welsh and 4 shares for Mr. Moser. Deferred shares allocated to a participant’s account in the DCP will be voted by the trustee in accordance with the participant's instructions. If the trustee does not receive instructions as to the voting of particular deferred shares, the trustee will vote such shares as instructed by the Company. |
(5) | The percentages shown are calculated based on the total outstanding shares on February 20, 2018 of 50,627,503. |
The * symbol means less than 1 percent. Percentage calculations assume, for each person and for each group, that all shares that may be acquired by such person or by such group pursuant to stock options currently exercisable or that become exercisable within 60 days of February 20, 2018 are outstanding for the purpose of computing the percentage of common stock owned by such person or by such group. However, those unissued shares of our common stock described above are not deemed to be outstanding for the purpose of calculating the percentage of common stock beneficially owned by any other person.
SIGNIFICANT STOCKHOLDERS
The following table sets forth information about each person known to General Cable to be the beneficial owner of more than 5 percent of General Cable’s common stock as of December 31, 2017. We obtained this information from records and statements filed with the SEC under Sections 13(d) and 13(g) of the Exchange Act.
Name and Business Address of Beneficial Owner | Amount and Nature of Beneficial Ownership(1) | Percent of Class(2) |
The Vanguard Group(3) 100 Vanguard Boulevard Malvern, Pennsylvania 19355 | 4,813,714 | 9.51% |
BlackRock, Inc.(4) 55 East 52nd Street New York, New York 10055 | 6,265,298 | 12.38% |
Deutsche Bank AG(5) Taunusanlage 12 60325 Frankfurt am Main Federal Republic of Germany | 3,447,538 | 6.81% |
The Goldman Sachs Group, Inc.(6) 200 West Street New York, New York 10282 | 2,637,798 | 5.21% |
(1) | Beneficial ownership is determined under SEC rules and includes voting or investment power with respect to the shares. |
(2) | The percentages shown are calculated based on the total outstanding shares on February 20, 2018 of 50,627,503. |
(3) | Based solely on a Schedule 13G filed with the SEC on February 9, 2018 by The Vanguard Group (“Vanguard”). Of the shares listed, Vanguard has sole power to vote 94,531 shares, shared power to vote 9,200 shares, and sole dispositive power over 4,714,783 shares and shared dispositive power over 98,931 shares. |
(4) | Based solely on a Schedule 13G/A filed with the SEC on January 19, 2018 by BlackRock, Inc. (“BlackRock”). Of the shares listed, BlackRock has sole power to vote 6,133,812 shares and sole dispositive power over 6,265,298 shares. |
(5) | Based solely on a Schedule 13G filed with the SEC on February 14, 2018 by Deutsche Bank AG and its subsdiaries and affiliates (""Deutsche Bank"). Of the shares listed, Deutsche Bank has sole power to vote 3,404,594 shares and sole dispositive power over 3,447,538 shares. |
(6) | Based solely on a Schedule 13G filed with the SEC on February 12, 2018 by The Goldman Sachs Group, Inc. ("Goldman"). Of the shares listed, Goldman has shared voting power to vote 2,637,798 shares and shared dispositive power over 2,637,798 shares. |
84
EQUITY COMPENSATION PLAN INFORMATION AS OF THE END OF FISCAL 2017
The following table sets forth information about General Cable’s equity compensation plans as of December 31, 2017:
Plan Category | Number of securities to be issued upon exercise of outstanding options, warrants and rights(1) | Weighted-average exercise price of outstanding options, warrants and right(2) | Number of securities remaining available for future issuance under equity compensation plans (excluding securities reflected in first column) | |||||||||||||||||
Shareholder approved plans(1) | 2,262,700 | $ | 30.75 | 4,124,700 | ||||||||||||||||
Non-shareholder approved plans | — | — | — | |||||||||||||||||
Total | 2,262,700 | $ | 30.75 | 4,124,700 | ||||||||||||||||
(1) | Includes 1,115,200 outstanding stock options, 688,100 RSUs, and 459,400 PSUs, which were reported at the maximum 200% payout rate. |
(2) | The weighted average exercise price is based only on outstanding stock options. |
ITEM 13. | CERTAIN RELATIONSHIPS AND RELATED TRANSACTIONS, AND DIRECTOR INDEPENDENCE |
Transactions with Related Persons
The Company has adopted written policies and procedures for the review and approval of any related party transactions that meet the minimum threshold for disclosure in this Form 10-K under the applicable SEC rules (generally, transactions involving amounts exceeding $120,000 in which a related person has a direct or indirect material interest). The Company has not entered into any such transactions since the beginning of its last fiscal year with any related person.
Under our current policies and procedures, related parties are expected to seek Audit Committee approval of related party transactions before the transaction is entered into or amended. The Audit Committee may ratify a transaction after it has been entered into, in which case the transaction will be evaluated on the same standards as a transaction being preapproved. In certain circumstances, the Audit Committee Chair may act on behalf of the Audit Committee. The policy specifically requires approval or ratification if the Company hires a family member of a director (including a director nominee), executive officer, or significant stockholder for total compensation in excess of $120,000 or, after initial approval of the hire, makes any material changes to an employment arrangement.
When seeking approval, the related party will provide the Company’s General Counsel with information about the transaction for the General Counsel’s evaluation and submission to the Audit Committee. The evaluation information includes:
• | the related person’s relationship to the Company and interest in the transaction; |
• | material facts of the proposed transaction, including the proposed aggregate value of the transaction; |
• | benefits to the Company of the proposed transaction; |
• | availability of other sources of comparable products or services; |
• | an assessment of whether the proposed transaction is on terms that are comparable to terms available to an unrelated third party or to employees generally; and |
• | any effect on a director’s independence if the transaction involves a director. |
After considering the evaluation information, the Audit Committee will approve or ratify only those transactions that are not opposed to the interests of the Company and that are on terms that are fair to the Company. The Audit Committee may make its approval conditional upon revisions to the terms of the transaction.
85
Director Independence
With the exception of our Chief Executive Officer, all of our directors, including our Non-Executive Chairman of the Board, are independent based on the application of the rules and standards of the NYSE and our Governance Principles and meet the independence requirements on each of the committees on which they serve. Consistent with NYSE standards, the Board has adopted guidelines for determining director independence. The guidelines can be found in our Governance Principles on our website www.generalcable.com via the Investor Relations page.
ITEM 14. | PRINCIPAL ACCOUNTING FEES AND SERVICES |
Principal Accounting Firm Fees
Aggregate fees for professional services rendered for the Company by Deloitte for the fiscal years 2017 and 2016 were:
Fiscal Year Ended | ||||||||
Services Rendered(1) | 2017 | 2016 | ||||||
Audit Fees(2) | $ | 4,546,000 | $ | 4,683,000 | ||||
Audit-related Fees(3) | 138,000 | 100,000 | ||||||
Tax Fees(4) | 400,000 | 373,000 | ||||||
All Other Fees(5) | — | 20,000 | ||||||
Total | $ | 5,084,000 | $ | 5,176,000 | ||||
(1) The aggregate fees included in Audit Fees are fees billed for the fiscal years. The aggregate fees included in each of the other categories are fees billed in the fiscal years.
(2) | Includes foreign and statutory audit fees and reviews of registration statements, including related consents and comfort letters. |
(3) | Includes employee benefit plan audits and consultation concerning financial accounting and reporting standards. |
(4) | Includes fees for tax compliance, advisory services and planning. |
(5) | Includes fees associated with training and permissible advisory services. |
Deloitte has served as our independent registered public accounting firm since we became a publicly traded company in 1997 and, prior to that, served as the independent auditor for our predecessor companies. No relationship exists between Deloitte and our Company other than the usual relationship between independent auditor and client.
Audit Committee Pre-Approval Policies and Procedures
Our Audit Committee is responsible for the appointment, compensation, retention and oversight of the work of the independent auditor. As part of this responsibility, the Audit Committee is required to pre-approve the audit and non-audit services performed by the independent auditor in order to assure that the provision of these services does not impair the auditor’s independence. No services were provided to us by Deloitte other than in accordance with the pre-approval procedures described herein.
86
PART IV.
ITEM 15. | EXHIBITS AND FINANCIAL STATEMENT SCHEDULE |
(a) Documents filed, or furnished as applicable, as part of the 2017 Annual Report on Form 10-K: |
1. Consolidated Financial Statements are included in Part II, Item 8 - Financial Statements and Supplementary Data. |
2. Financial Statement Schedule filed herewith for 2017, 2016 and 2015: |
II. Valuation and Qualifying Accounts Page 148 |
All other schedules for which provisions are made in the applicable SEC regulation have been omitted as they are not applicable, not required, or the required information is included in the Consolidated Financial Statements or Notes thereto. |
3. The exhibits listed on the accompanying Exhibit Index are filed or furnished, as applicable, herewith or incorporated herein by reference. |
Documents indicated by a double asterisk (**) are filed or furnished, as applicable, herewith; documents indicated by an asterisk (*) identify each management contract or compensatory plan. Documents not indicated by a double asterisk are incorporated by reference to the document indicated. The warranties, representations and covenants contained in any of the agreements included herein or which appear as exhibits hereto (or as exhibits, schedules, annexes or other attachments thereto) should not be relied upon by buyers, sellers or holders of the Company’s securities and are not intended as warranties, representations or covenants to any individual or entity except as specifically set forth in such agreement. |
87
Exhibit Index
Exhibit Number | Description |
88
89
101.INS** | XBRL Instance Document |
101.SCH** | XBRL Taxonomy Extension Schema Document |
101.CAL** | XBRL Taxonomy Extension Calculation Linkbase Document |
101.DEF** | XBRL Taxonomy Extension Definition Linkbase Document |
101.LAB** | XBRL Taxonomy Extension Label Linkbase Document |
101.PRE** | XBRL Taxonomy Extension Presentation Linkbase Document |
90
* | Management contract or compensatory plan. | |
** | Filed or furnished, as applicable, herewith. | |
(†) | Certain portions of this agreement have been omitted pursuant to a confidential treatment request filed separately with the SEC on January 22, 2014. | |
(††) | Certain portions of this agreement have been omitted pursuant to a confidential treatment request filed separately with the SEC on August 1, 2014. | |
(†††) | Certain portions of this agreement have been omitted pursuant to a confidential treatment request filed separately with the SEC on August 3, 2017. | |
91
Signatures
Pursuant to the requirements of Section 13 or 15(d) of the Securities Exchange Act of 1934, General Cable Corporation has duly caused this report to be signed on its behalf by the undersigned, thereunto duly authorized.
General Cable Corporation | |||||
Signed: | February 28, 2018 | By: | /s/ MICHAEL T. MCDONNELL | ||
Michael T. McDonnell | |||||
President and Chief Executive Officer | |||||
Pursuant to the requirements of the Securities Exchange Act of 1934, this report has been signed below by the following persons on behalf of General Cable Corporation and in the capacities and on the date indicated.
/s/ MICHAEL T. MCDONNELL | President, Chief Executive Officer and Director | February 28, 2018 | ||
Michael T. McDonnell | (Principal Executive Officer) | |||
/s/ MATTI M. MASANOVICH | Senior Vice President and Chief Financial Officer | February 28, 2018 | ||
Matti M. Masanovich | (Principal Financial Officer) | |||
/s/ LEONARD R. TEXTER | Senior Vice President and Global Controller | February 28, 2018 | ||
Leonard R. Texter | (Principal Accounting Officer) | |||
/s/ JOHN E. WELSH, III* | Non-executive Chairman and Director | February 28, 2018 | ||
John E. Welsh, III | ||||
/s/ SALLIE B. BAILEY* | Director | February 28, 2018 | ||
Sallie B. Bailey | ||||
/s/ NED HALL* | Director | February 28, 2018 | ||
Ned Hall | ||||
/s/ GREGORY E. LAWTON* | Director | February 28, 2018 | ||
Gregory E. Lawton | ||||
/s/ CRAIG P. OMTVEDT* | Director | February 28, 2018 | ||
Craig P. Omtvedt | ||||
/s/ PATRICK M. PREVOST* | Director | February 28, 2018 | ||
Patrick M. Prevost | ||||
* By | /s/ EMERSON C. MOSER | |
Emerson C. Moser | ||
Attorney - in - fact | ||
92
REPORT OF INDEPENDENT REGISTERED PUBLIC ACCOUNTING FIRM
To the Board of Directors and Shareholders of
General Cable Corporation
Highland Heights, Kentucky
Opinion on the Financial Statements
We have audited the accompanying consolidated balance sheets of General Cable Corporation and subsidiaries (the "Company") as of December 31, 2017 and 2016, and the related consolidated statements of operations and comprehensive income (loss), cash flows, and changes in total equity for each of the three years in the period ended December 31, 2017, and the related notes and financial statement schedule listed in the Index at Item 15 (collectively referred to as the “financial statements”). In our opinion, the financial statements present fairly, in all material respects, the financial position of the Company as of December 31, 2017 and 2016, and the results of its operations and its cash flows for each of the three years in the period ended December 31, 2017, in conformity with accounting principles generally accepted in the United States of America.
We have also audited, in accordance with the standards of the Public Company Accounting Oversight Board (United States) (PCAOB), the Company's internal control over financial reporting as of December 31, 2017, based on the criteria established in Internal Control - Integrated Framework (2013) issued by the Committee of Sponsoring Organizations of the Treadway Commission and our report dated February 28, 2018 expressed an unqualified opinion on the Company's internal control over financial reporting.
Basis for Opinion
These financial statements are the responsibility of the Company's management. Our responsibility is to express an opinion on the Company’s financial statements based on our audits. We are a public accounting firm registered with the PCAOB and are required to be independent with respect to the Company in accordance with the U.S. federal securities laws and the applicable rules and regulations of the Securities and Exchange Commission and the PCAOB.
We conducted our audits in accordance with the standards of the PCAOB. Those standards require that we plan and perform the audit to obtain reasonable assurance about whether the financial statements are free of material misstatement, whether due to error or fraud. Our audits included performing procedures to assess the risks of material misstatement of the financial statements, whether due to error or fraud, and performing procedures that respond to those risks. Such procedures included examining, on a test basis, evidence regarding the amounts and disclosures in the financial statements. Our audits also included evaluating the accounting principles used and significant estimates made by management, as well as evaluating the overall presentation of the financial statements. We believe that our audits provide a reasonable basis for our opinion.
/s/ Deloitte & Touche LLP
Cincinnati, Ohio
February 28, 2018
We have served as the Company’s auditor since 1996.
93
GENERAL CABLE CORPORATION AND SUBSIDIARIES
Consolidated Statements of Operations and Comprehensive Income (Loss)
(in millions, except per share data)
Year Ended | |||||||||||
Dec 31, 2017 | Dec 31, 2016 | Dec 31, 2015 | |||||||||
Net sales | $ | 3,837.2 | $ | 3,858.4 | $ | 4,514.5 | |||||
Cost of sales | 3,411.1 | 3,451.3 | 4,082.1 | ||||||||
Gross profit | 426.1 | 407.1 | 432.4 | ||||||||
Selling, general and administrative expenses | 416.8 | 408.9 | 412.3 | ||||||||
Goodwill impairment charges | — | 9.0 | 3.9 | ||||||||
Intangible asset impairment charges | — | 7.5 | 1.7 | ||||||||
Operating income (loss) | 9.3 | (18.3 | ) | 14.5 | |||||||
Other income (expense) | 28.5 | 7.2 | (71.3 | ) | |||||||
Interest income (expense): | |||||||||||
Interest expense | (78.7 | ) | (89.5 | ) | (97.0 | ) | |||||
Interest income | 2.0 | 2.5 | 2.7 | ||||||||
(76.7 | ) | (87.0 | ) | (94.3 | ) | ||||||
Income (loss) before income taxes | (38.9 | ) | (98.1 | ) | (151.1 | ) | |||||
Income tax (provision) benefit | (15.8 | ) | 3.7 | 14.8 | |||||||
Equity in net earnings of affiliated companies | — | 0.9 | 0.5 | ||||||||
Net income (loss) including noncontrolling interest | (54.7 | ) | (93.5 | ) | (135.8 | ) | |||||
Less: net income (loss) attributable to noncontrolling interest | 1.9 | 0.3 | (13.9 | ) | |||||||
Net income (loss) attributable to Company common shareholders | $ | (56.6 | ) | $ | (93.8 | ) | $ | (121.9 | ) | ||
Earnings (loss) per share - Net income (loss) attributable to Company common shareholders per common share | |||||||||||
Earnings (loss) per common share-basic | $ | (1.13 | ) | $ | (1.89 | ) | $ | (2.49 | ) | ||
Earnings (loss) per common share-assuming dilution | $ | (1.13 | ) | $ | (1.89 | ) | $ | (2.49 | ) | ||
Dividends per common share | $ | 0.72 | $ | 0.72 | $ | 0.72 | |||||
Comprehensive income (loss): | |||||||||||
Net income (loss) | $ | (54.7 | ) | $ | (93.5 | ) | $ | (135.8 | ) | ||
Currency translation gain (loss) | 72.9 | 47.9 | (100.2 | ) | |||||||
Defined benefit plan adjustments, net of tax of $7.7 million in 2017, $3.6 million in 2016 and $7.2 million in 2015 | (6.0 | ) | 6.6 | 15.1 | |||||||
Comprehensive income (loss), net of tax | $ | 12.2 | $ | (39.0 | ) | $ | (220.9 | ) | |||
Comprehensive income (loss) attributable to noncontrolling interest, net of tax | 13.2 | 1.0 | (22.2 | ) | |||||||
Comprehensive income (loss) attributable to Company common shareholders, net of tax | $ | (1.0 | ) | $ | (40.0 | ) | $ | (198.7 | ) | ||
See accompanying Notes to Consolidated Financial Statements.
94
GENERAL CABLE CORPORATION AND SUBSIDIARIES
Consolidated Balance Sheets
(in millions, except share data)
Dec 31, 2017 | Dec 31, 2016 | ||||||
Assets | |||||||
Current Assets: | |||||||
Cash and cash equivalents | $ | 84.7 | $ | 101.1 | |||
Receivables, net of allowances of $19.2 million in 2017 and $20.2 million in 2016 | 714.2 | 664.5 | |||||
Inventories | 736.1 | 768.2 | |||||
Prepaid expenses and other | 60.0 | 65.4 | |||||
Total current assets | 1,595.0 | 1,599.2 | |||||
Property, plant and equipment, net | 530.3 | 529.3 | |||||
Deferred income taxes | 7.9 | 20.4 | |||||
Goodwill | 11.0 | 12.0 | |||||
Intangible assets, net | 23.3 | 28.3 | |||||
Unconsolidated affiliated companies | 0.2 | 9.0 | |||||
Other non-current assets | 67.6 | 43.4 | |||||
Total assets | $ | 2,235.3 | $ | 2,241.6 | |||
Liabilities and Total Equity | |||||||
Current Liabilities: | |||||||
Accounts payable | $ | 437.5 | $ | 414.0 | |||
Accrued liabilities | 308.8 | 419.6 | |||||
Current portion of long-term debt | 46.9 | 67.5 | |||||
Total current liabilities | 793.2 | 901.1 | |||||
Long-term debt | 1,038.8 | 871.1 | |||||
Deferred income taxes | 108.6 | 126.7 | |||||
Other liabilities | 162.9 | 173.8 | |||||
Total liabilities | 2,103.5 | 2,072.7 | |||||
Commitments and Contingencies (See Note 19) | |||||||
Total Equity: | |||||||
Common stock, $0.01 par value, issued and outstanding shares: | |||||||
2017 — 50,583,870 (net of 8,054,826 treasury shares) 2016 — 49,390,850 (net of 9,419,116 treasury shares) | 0.6 | 0.6 | |||||
Additional paid-in capital | 706.6 | 711.0 | |||||
Treasury stock | (151.9 | ) | (169.9 | ) | |||
Retained earnings (deficit) | (195.3 | ) | (102.2 | ) | |||
Accumulated other comprehensive income (loss) | (230.8 | ) | (286.4 | ) | |||
Total Company shareholders’ equity | 129.2 | 153.1 | |||||
Noncontrolling interest | 2.6 | 15.8 | |||||
Total equity | 131.8 | 168.9 | |||||
Total liabilities and equity | $ | 2,235.3 | $ | 2,241.6 | |||
See accompanying Notes to Consolidated Financial Statements.
95
GENERAL CABLE CORPORATION AND SUBSIDIARIES
Consolidated Statements of Cash Flows (in millions)
Year Ended | |||||||||||
Dec 31, 2017 | Dec 31, 2016 | Dec 31, 2015 | |||||||||
Cash flows of operating activities: | |||||||||||
Net income (loss) including noncontrolling interest | $ | (54.7 | ) | $ | (93.5 | ) | $ | (135.8 | ) | ||
Adjustments to reconcile net income (loss) to net cash provided by operating activities: | |||||||||||
Depreciation and amortization | 73.9 | 86.0 | 96.4 | ||||||||
Foreign currency exchange (gain) loss | 3.4 | 0.6 | 61.4 | ||||||||
Non-cash asset impairment charges | 2.3 | 59.5 | 67.3 | ||||||||
Non-cash interest charges | 4.0 | 5.0 | 3.6 | ||||||||
Deferred income taxes | (12.1 | ) | (22.7 | ) | (24.4 | ) | |||||
Venezuela deconsolidation charge | — | — | 12.0 | ||||||||
(Gain) loss on disposal of subsidiaries | 71.9 | (25.6 | ) | (5.1 | ) | ||||||
(Gain) loss on disposal of property | (1.4 | ) | 2.1 | 2.5 | |||||||
Changes in operating assets and liabilities, net of effect of divestitures: | |||||||||||
(Increase) decrease in receivables | (25.3 | ) | 11.2 | 133.5 | |||||||
(Increase) decrease in inventories | 18.1 | 52.6 | 34.0 | ||||||||
(Increase) decrease in other assets | 6.4 | 7.3 | 23.0 | ||||||||
Increase (decrease) in accounts payable | 7.8 | 2.8 | (37.6 | ) | |||||||
Increase (decrease) in accrued and other liabilities | (133.3 | ) | 70.9 | (31.1 | ) | ||||||
Net cash flows of operating activities | (39.0 | ) | 156.2 | 199.7 | |||||||
Cash flows of investing activities: | |||||||||||
Capital expenditures | (85.4 | ) | (84.1 | ) | (61.5 | ) | |||||
Proceeds from properties sold | 11.9 | 1.5 | 1.8 | ||||||||
Reduction of cash due to Venezuela deconsolidation | — | — | (8.2 | ) | |||||||
Disposal of subsidiaries, net of cash disposed of | 2.2 | 81.8 | 78.4 | ||||||||
Investment in restricted cash | (10.0 | ) | — | — | |||||||
Other | (0.1 | ) | 0.2 | — | |||||||
Net cash flows of investing activities | (81.4 | ) | (0.6 | ) | 10.5 | ||||||
Cash flows of financing activities: | |||||||||||
Dividends paid to shareholders | (37.4 | ) | (35.6 | ) | (35.3 | ) | |||||
Proceeds from debt | 2,101.1 | 1,516.2 | 2,945.5 | ||||||||
Repayments of debt | (1,967.3 | ) | (1,635.2 | ) | (3,167.2 | ) | |||||
Purchase of noncontrolling interest | — | (18.0 | ) | — | |||||||
Dividends paid to noncontrolling interest | — | (0.1 | ) | (2.5 | ) | ||||||
Proceeds from sale leaseback transaction | — | 6.2 | — | ||||||||
Impact of stock options and other | 2.1 | (0.4 | ) | (0.6 | ) | ||||||
Net cash flows of financing activities | 98.5 | (166.9 | ) | (260.1 | ) | ||||||
Effect of exchange rate changes on cash and cash equivalents | 5.5 | — | (43.5 | ) | |||||||
Increase (decrease) in cash and cash equivalents | (16.4 | ) | (11.3 | ) | (93.4 | ) | |||||
Cash and cash equivalents — beginning of year | 101.1 | 112.4 | 205.8 | ||||||||
Cash and cash equivalents — end of year | $ | 84.7 | $ | 101.1 | $ | 112.4 | |||||
Supplemental Information | |||||||||||
Cash paid during the year for: | |||||||||||
Income tax payments | $ | 9.6 | $ | 16.3 | $ | 13.6 | |||||
Interest paid | $ | 75.5 | $ | 81.4 | $ | 87.1 | |||||
Non-cash investing and financing activities: | |||||||||||
Capital expenditures included in accounts payable | $ | 10.3 | $ | 24.1 | $ | 13.3 | |||||
See accompanying Notes to Consolidated Financial Statements.
96
GENERAL CABLE CORPORATION AND SUBSIDIARIES
Consolidated Statements of Changes in Total Equity (dollars in millions, share amounts in thousands)
See accompanying Notes to Consolidated Financial Statements.
General Cable Total Equity | ||||||||||||||||||||||||||||||||||
Total | Common Stock | Add’l Paid in | Treasury | Retained | Accumulated Other Comprehensive | Total GCC | Noncontrolling | |||||||||||||||||||||||||||
Equity | Shares | Amount | Capital | Stock | Earnings/(Deficit) | Income/(Loss) | Equity | Interest | ||||||||||||||||||||||||||
Balance, December 31, 2014 | $ | 513.2 | 48,683 | $ | 0.6 | $ | 714.8 | $ | (184.3 | ) | $ | 184.4 | $ | (263.4 | ) | $ | 452.1 | $ | 61.1 | |||||||||||||||
Comprehensive income (loss) | (220.9 | ) | (121.9 | ) | (76.8 | ) | (198.7 | ) | (22.2 | ) | ||||||||||||||||||||||||
Common stock dividend ($0.72 per share) | (35.3 | ) | (35.3 | ) | (35.3 | ) | ||||||||||||||||||||||||||||
Sale of subsidiaries - noncontrolling interest | (21.5 | ) | — | (21.5 | ) | |||||||||||||||||||||||||||||
Stock option and RSU expense | 7.5 | 7.5 | 7.5 | |||||||||||||||||||||||||||||||
Exercise of stock options | 0.2 | 18 | (0.1 | ) | 0.3 | 0.2 | ||||||||||||||||||||||||||||
Treasury shares related to nonvested stock vesting | (0.7 | ) | (56 | ) | (0.7 | ) | (0.7 | ) | ||||||||||||||||||||||||||
Excess tax benefits (deficiencies) from stock-based compensation | (1.7 | ) | (1.7 | ) | (1.7 | ) | ||||||||||||||||||||||||||||
Dividends paid to noncontrolling interest | (2.5 | ) | — | (2.5 | ) | |||||||||||||||||||||||||||||
Other | 4.6 | 263 | 4.6 | 4.6 | ||||||||||||||||||||||||||||||
Balance, December 31, 2015 | $ | 242.9 | 48,908 | $ | 0.6 | $ | 720.5 | $ | (180.1 | ) | $ | 27.2 | $ | (340.2 | ) | $ | 228.0 | $ | 14.9 | |||||||||||||||
Comprehensive income (loss) | (39.0 | ) | (93.8 | ) | 53.8 | (40.0 | ) | 1.0 | ||||||||||||||||||||||||||
Common stock dividend ($0.72 per share) | (35.6 | ) | (35.6 | ) | (35.6 | ) | ||||||||||||||||||||||||||||
Stock option and RSU expense | 5.4 | 5.4 | 5.4 | |||||||||||||||||||||||||||||||
Exercise of stock options | 1.2 | 60 | 0.1 | 1.1 | 1.2 | |||||||||||||||||||||||||||||
Excess tax benefits (deficiencies) from stock-based compensation | (5.0 | ) | (5.0 | ) | (5.0 | ) | ||||||||||||||||||||||||||||
Dividends paid to noncontrolling interest | (0.1 | ) | — | (0.1 | ) | |||||||||||||||||||||||||||||
Other | (0.9 | ) | 423 | (10.0 | ) | 9.1 | (0.9 | ) | ||||||||||||||||||||||||||
Balance, December 31, 2016 | $ | 168.9 | 49,391 | $ | 0.6 | $ | 711.0 | $ | (169.9 | ) | $ | (102.2 | ) | $ | (286.4 | ) | $ | 153.1 | $ | 15.8 | ||||||||||||||
Comprehensive income (loss) | 12.2 | (56.6 | ) | 55.6 | (1.0 | ) | 13.2 | |||||||||||||||||||||||||||
Common stock dividend ($0.72 per share) | (37.4 | ) | (37.4 | ) | (37.4 | ) | ||||||||||||||||||||||||||||
Sale of subsidiaries - noncontrolling interest | (26.4 | ) | — | (26.4 | ) | |||||||||||||||||||||||||||||
Stock option and RSU expense | 10.6 | 10.6 | 10.6 | |||||||||||||||||||||||||||||||
Exercise of stock options | 10.0 | 470 | 1.5 | 8.5 | 10.0 | |||||||||||||||||||||||||||||
Other | (6.1 | ) | 723 | (16.5 | ) | 9.5 | 0.9 | (6.1 | ) | |||||||||||||||||||||||||
Balance, December 31, 2017 | $ | 131.8 | 50,584 | $ | 0.6 | $ | 706.6 | $ | (151.9 | ) | $ | (195.3 | ) | $ | (230.8 | ) | $ | 129.2 | $ | 2.6 | ||||||||||||||
97
GENERAL CABLE CORPORATION AND SUBSIDIARIES
Notes to Consolidated Financial Statements
1. General
The Company is a global leader in the development, design, manufacture, marketing and distribution of copper, aluminum and fiber optic wire and cable products for use in the energy, industrial, construction, specialty and communications markets. The Company sells copper, aluminum and fiber optic wire and cable products worldwide.
The Company additionally engages in the design, integration, and installation on a turn-key basis for products such as high and extra-high voltage terrestrial and submarine systems. The Company analyzes its worldwide operations based on four geographical segments: North America, Europe, Latin America, and Africa/Asia Pacific. Additional financial information regarding the segments appears in Note 18 - Segment Information. As of December 31, 2017, the Company manufactured its product lines in 30 principal manufacturing facilities in 13 countries with regional distribution centers around the world in addition to the corporate headquarters in Highland Heights, Kentucky.
2. Summary of Significant Accounting Policies
Principles of Consolidation
The Company’s consolidated financial statements include the accounts of wholly-owned subsidiaries and majority-owned controlled subsidiaries. The Company records its investment in each unconsolidated affiliated Company (generally 20-50 percent ownership in which it has the ability to exercise significant influence) at its respective equity in net assets. Other investments (generally less than 20 percent ownership) are recorded at cost. All intercompany transactions and balances among the consolidated companies have been eliminated.
Use of Estimates
The preparation of the financial statements in conformity with GAAP requires management to make estimates and assumptions that affect the reported amounts of assets and liabilities and disclosure of contingent assets and liabilities at the date of the financial statements and the reported amounts of revenues and expenses during the reporting period. These estimates are based on historical experience and information that is available to management about current events and actions the Company may take in the future. Significant items subject to estimates and assumptions include valuation allowances for accounts receivable and deferred income taxes; legal, compliance, environmental and asbestos liabilities; uncertain tax positions; impacts of the tax reform enactment; inventory costing and valuation; share-based compensation; assets and obligations related to pension and other postretirement benefits; intangible and long-lived asset valuations; financial instruments; self-insured workers’ compensation and health insurance reserves; and revenue recognized under the percentage-of-completion method. There can be no assurance that actual results will not differ from these estimates.
Revenue Recognition
The majority of the Company’s revenue is recognized when goods are shipped to the customer, title and risk of loss are transferred, pricing is fixed and determinable and collectability is reasonably assured. Most revenue transactions represent sales of inventory. A provision for payment discounts, product returns, warranty and customer rebates is estimated based upon historical experience and other relevant factors and is recorded within the same period that the revenue is recognized. A portion of the Company's revenue consists of long-term contracts for specialized products that can include installation and/or other services and is recognized based on the percentage of completion method generally based on the cost-to-cost method if there are reasonably reliable estimates of total revenue, total cost, and the extent of progress toward completion; and there is an enforceable agreement between parties who can fulfill their contractual obligations. The Company reviews contract price and cost estimates periodically as the work progresses and reflects adjustments proportionate to the percentage-of-completion to income in the period when those estimates are revised. For these contracts, if a current estimate of total contract cost indicates a loss on a contract, the projected loss is recognized in full in the period when determined.
Share-Based Compensation
The Company has various plans which provide for granting options and common stock to certain employees and independent directors of the Company and its subsidiaries. All share-based payments to employees, including grants of employee stock options, are recognized in the financial statements based on their fair values. The fair values of certain awards are estimated on the grant date using the Black-Scholes valuation and the Monte Carlo simulation models, which incorporate certain assumptions regarding the expected term of an award and expected stock price volatility. Key assumptions are described in further detail in Note 16 - Share-Based Compensation.
98
Earnings Per Share
Earnings or loss per common share-basic is determined by dividing net income applicable to common shareholders by the weighted average number of common shares-basic outstanding. Earnings per common share-assuming dilution is computed based on the weighted average number of common shares-assuming dilution outstanding which gives effect (when dilutive) to stock options, other stock-based awards, the assumed conversion of the Subordinated Convertible Notes, if applicable, and other potentially dilutive securities. Refer to discussion in Note 17 - Earnings Per Common Share.
Foreign Currency
For operations outside the United States that prepare financial statements in currencies other than the U.S. dollar, results of operations and cash flows are translated at average exchange rates during the period, and assets and liabilities are translated at spot exchange rates at the end of the period. Foreign currency translation adjustments are included as a separate component of accumulated other comprehensive income (loss) in total equity. Upon sale or upon complete or substantially complete liquidation of an investment in a foreign entity, the foreign currency translation adjustment attributable to that entity is removed from accumulated other comprehensive income (loss) and reported as part of the gain or loss on sale or liquidation of the investment for the period during which the sale or liquidation occurs. The effects of changes in exchange rates between the designated functional currency and the currency in which a transaction is denominated are recorded as foreign currency transaction gains (losses) within Other income (expense) in the Consolidated Statements of Operations and Comprehensive Income (Loss).
Cash Equivalents
The Company considers all highly liquid investments with an original maturity of three months or less from the date of purchase to be cash equivalents. Cash equivalents are carried at cost, which approximates fair value.
Accounts Receivable
The accounts receivable balance is recorded at the stated amount, less allowances for doubtful accounts, price discounts, and returns. At the time of the sale and at each quarter, the Company evaluates the accounts receivable balance to determine a best estimate for doubtful accounts, price discounts, and returns. The Company reviews general historical trends in the account, customer overdue balances, high risk accounts that have been specifically identified based on historical and current customer patterns, contractual obligations, and current economic conditions to determine an estimate for these allowances.
Inventories
The Company’s inventories are valued using the weighted average cost method. All inventories are stated at the lower of cost and net realizable value.
The Company has consignment inventory at certain of its customer locations for purchase and use by the customer or other parties. The Company retains title to the inventory and records no sale until it is ultimately sold either to the customer storing the inventory or to another party.
Property, Plant and Equipment
Property, plant and equipment are stated at cost, less accumulated depreciation. Costs assigned to property, plant and equipment relating to acquisitions are based on estimated fair values at the acquired date. Depreciation is provided using the straight-line method over the estimated useful lives of the assets: buildings, from 15 to 50 years; and machinery, equipment and office furnishings, from 2 to 20 years. Leasehold improvements are depreciated over the life of the lease or over the useful life if shorter. The Company’s manufacturing facilities perform major maintenance activities during planned shutdown periods which traditionally occur in July and December, and costs related to major maintenance activities are expensed as incurred.
The testing of these long-lived assets for impairment also requires a significant amount of judgment and assumptions, particularly as it relates to identification of asset groups and the determination of fair market value. The Company evaluates the recoverability of the carrying amount of long-lived assets (including property, plant and equipment and intangible assets with determinable lives) whenever events or changes in circumstances indicate that the carrying amount of an asset may not be fully recoverable. The Company evaluates events or changes in circumstances based mostly on actual historical operating results, but business plans, forecasts, general and industry trends and anticipated cash flows are also considered. Impairment is assessed when the undiscounted expected future cash flows derived from an asset are less than its carrying amount. Impairment losses are measured as the amount by which the carrying value of an asset exceeds its fair value and are recognized in earnings. The Company also continually evaluates the estimated useful lives of all long-lived assets and, when warranted, revises such estimates based on current events. The Company evaluates long-lived assets to be sold or abandoned to determine if the long-lived assets shall be classified as held for sale. See Note 5 - Restructuring and Note 8 - Property, Plant and Equipment.
99
Goodwill and Intangible Assets
Goodwill and intangible assets with indefinite useful lives are not amortized, but are reviewed at least annually for impairment. Goodwill is allocated to various reporting units, which are generally an operating segment or one level below the operating segment. The Company compares the fair value of each reporting unit to its carrying amount to determine if there is potential goodwill impairment. If the fair value of a reporting unit is less than its carrying value, an impairment loss is recorded to the extent that the fair value of the goodwill within the reporting unit is less than the carrying value of the goodwill. The impairment test for the Company’s indefinite-lived intangible assets involves comparing the fair value of the intangibles to their carrying values. If the carrying amount of an intangible asset with an indefinite life exceeds its fair value, an impairment loss would be recognized in the amount equal to the excess.
The annual impairment test for both remaining goodwill and indefinite-lived intangible assets indicated there was no impairment. However, future changes in judgments, assumptions and estimates that are used in the annual impairment testing, including discount and tax rates, future cash flow projections, or the long term growth rate could result in significantly different estimates of fair value.
Intangible assets that are not deemed to have an indefinite life, principally customer relationships and tradenames, are amortized over their useful lives based on the expected economic benefit consistent with the historical customer attrition rates. See Note 9 - Goodwill and Other Intangible Assets, net.
Severance Expenses
The Company has incurred restructuring costs which include employee separation costs. The charges relate to involuntary separations and the amounts are based on current salary levels and past service periods and are either considered one-time employee termination benefits in accordance with ASC 420 - Exit or Disposal Cost Obligations ("ASC 420") or as charges for contractual termination benefits under ASC 712 - Compensation - Nonretirement Postemployment Benefits ("ASC 712"). The charges are recognized when it is probable that a liability has been incurred and the amount of such liability is reasonably estimable. Management estimates must be applied to determine when it is appropriate to record restructuring accruals as well as assumptions in calculating the restructuring accruals, as employees could choose to voluntarily leave the Company, forfeiting termination benefits. To the extent these assumptions and estimates change, there could be future subsequent adjustments to the accrual balance.
Long-Term Debt
In accordance with ASC 470, convertible debt instruments that may be settled in cash or other assets, or partially in cash, upon conversion, are separately accounted for as long-term debt and equity components (or conversion feature). The accounting applies to the Subordinated Convertible Notes. The debt component represents the Company’s contractual obligation to pay principal and interest and the equity component represents the Company’s option to convert the debt security into equity of the Company or the equivalent amount of cash. Upon issuance, the Company allocated the debt component on the basis of the estimated fair value of an identical debt instrument that it would issue excluding the convertible option and the remaining proceeds are allocated to the equity component. The bifurcation of the debt and equity components resulted in a debt discount for the aforementioned notes. In accordance with ASC 470, the Company uses the interest method to amortize the debt discount to interest expense over the amortization period which is the expected life of the debt.
Derivative Financial Instruments
It is the Company’s policy that derivative transactions are executed only to manage exposures arising in the normal course of business and not for the purpose of creating speculative positions or trading. Derivative financial instruments are utilized to manage commodity and foreign currency risk. In the normal course of business, the Company occasionally enters into forward pricing agreements for the purchase of copper and aluminum for delivery in a future month to match certain sales transactions. ASC 815 - Derivatives and Hedging, as amended, requires that all derivatives be recorded on the balance sheet at fair value. At December 31, 2017, there were no derivatives that were designated as cash flow hedges.
Fair Value of Financial Instruments
The Company carries derivative assets, derivative liabilities and marketable equity securities held in a rabbi trust as part of the Company’s deferred compensation plan at fair value. The Company determines the fair market value of its financial instruments based on the fair value hierarchy established in ASC 820 - Fair Value Measurement ("ASC 820").
Pension Plans
The Company provides retirement benefits through contributory and non-contributory qualified and non-qualified defined benefit pension plans covering eligible domestic and international employees as well as through defined contribution plans and other postretirement benefits. Benefits under General Cable’s qualified U.S. defined benefit pension plan generally are based on years of service multiplied by a specific fixed dollar amount, and benefits under the Company’s qualified non-U.S. defined benefit
100
pension plans generally are based on years of service and a variety of other factors that can include a specific fixed dollar amount or a percentage of either current salary or average salary over a specific period of time. The amounts funded for any plan year for the qualified U.S. defined benefit pension plan are neither less than the minimum required under federal law nor more than the maximum amount deductible for federal income tax purposes. General Cable’s non-qualified unfunded U.S. defined benefit pension plans include a plan that provides defined benefits to select senior management employees beyond those benefits provided by other programs. The Company’s non-qualified unfunded non-U.S. defined benefit pension plans include plans that provide retirement indemnities to employees. Pension obligations for the non-qualified unfunded defined benefit pension plans are recognized in the Consolidated Balance Sheets and are based on local practices and regulations of the respective countries. The Company makes cash contributions for the costs of the non-qualified unfunded defined benefit pension plans as the benefits are paid.
Loss Contingencies
The Company determines whether to accrue and/or disclose for loss contingencies based on an assessment of whether the risk of loss is remote, reasonably possible or probable. The Company's assessment is developed in consultation with its outside counsel and other advisers and is based on an analysis of possible outcomes. Loss contingency assumptions involve judgments that are inherently subjective and can involve matters that are in litigation, which, by its nature is unpredictable. The Company believes that its assessment of the probability of loss contingencies is reasonable, but because of the subjectivity involved and the unpredictable nature of the subject matter at issue, the Company's assessment may prove ultimately to be incorrect, which could materially impact the consolidated financial statements. See Note 19 - Commitments and Contingencies.
Self-insurance
The Company is self-insured for certain employee medical benefits, workers’ compensation benefits, environmental and asbestos-related issues. The Company has purchased stop-loss coverage in order to limit its exposure to any significant level of workers’ compensation claims. Certain insurers are also partly responsible for coverage on many of the asbestos-related issues (refer to Note 19 - Commitments and Contingencies). Self-insured losses are accrued based upon estimates of the aggregate liability for uninsured claims incurred using the Company’s historical claims experience.
Concentration of Risk
The Company sells a broad range of products globally. Concentrations of credit risk with respect to trade receivables are limited due to the large number of customers, including members of buying groups, composing General Cable’s customer base. Customers generally receive a 30 to 60 day payment period on purchases from the Company, with exceptions in certain end markets. Certain automotive customers of the Company receive payment terms ranging from 45 days to 360 days, which is common in this particular market. Ongoing credit evaluations of customers’ financial condition are performed, and generally, no collateral is required. The Company maintains reserves for potential credit losses and such losses, in the aggregate, have not exceeded management’s estimates. Certain subsidiaries also maintain credit insurance for certain customer balances. Bad debt expense associated with uncollectible accounts for the years ended December 31, 2017, 2016 and 2015 was $4.1 million, $5.1 million and $8.1 million, respectively.
The Company has centralized purchasing of copper, aluminum and other significant raw materials. Our largest supplier of copper rod accounted for approximately 70% of our North American purchases in 2017, while our largest supplier of aluminum rod accounted for approximately 60% of our North American purchases in 2017. Our largest supplier of copper rod accounted for approximately 45% of our European purchases in 2017, while our largest supplier of aluminum rod accounted for approximately 30% of our European aluminum purchases in 2017. Our largest supplier of copper rod accounted for approximately 75% of our Latin American purchases in 2017, while our largest supplier of aluminum rod accounted for approximately 30% of our Latin American aluminum purchases in 2017.
Income Taxes
The Company is subject to income tax in numerous United States federal, state, and foreign jurisdictions. Significant judgments and estimates are inherent in determining the Company's consolidated income tax expense, current tax payable, deferred tax assets and liabilities, and liabilities for uncertain tax positions. Future events such as changes in business conditions, tax legislation, tax audit resolutions, or foreign earnings repatriation plans could materially impact these estimates and the Company's tax position.
Deferred tax assets and liabilities are determined based on the differences between the financial statement basis and tax basis of assets and liabilities using enacted tax rates in effect for the year in which the differences are expected to reverse. The effect of a change in tax rates on deferred tax assets and liabilities is recognized in income in the period that includes the enactment date. At December 31, 2017, the Company had recorded a net deferred tax liability of $100.7 million ($128.4 million deferred tax asset less $229.1 million deferred tax liability). The valuation of deferred tax assets is dependent on, among other things, the ability of the Company to generate a sufficient level of future taxable income. In estimating future taxable income, the Company has considered both positive and negative evidence, such as historical and forecasted results of operations, including prior losses, and has considered the implementation of prudent and feasible tax planning strategies. As of December 31, 2017, the Company recorded
101
a valuation allowance of $157.4 million to reduce deferred tax assets to the amount judged more likely than not to be realized. The Company has and will continue to review on a quarterly basis its assumptions and tax planning strategies, and, if the amount of the estimated realizable deferred tax assets is less than the amount currently on the balance sheet, the Company will reduce its deferred tax asset, recognizing a non-cash charge against reported earnings. Likewise, if the Company determines that a valuation allowance against a deferred tax asset is no longer appropriate, the adjustment to the valuation allowance would reduce income tax expense.
The Company operates in multiple jurisdictions with complex tax policies and regulations. In certain jurisdictions, the Company has taken tax positions that it believes are supportable, but which could be subject to challenge by the tax authorities. These tax positions are evaluated and liabilities for uncertain tax positions are established in accordance with the ASC 740 tax accounting guidance. The status of uncertain tax positions is reviewed in light of changing facts and circumstances, such as tax audits, rulings, and case law, and the related liabilities are adjusted accordingly.
The Company recognizes interest and penalties related to unrecognized tax benefits within the income tax expense line in the accompanying Consolidated Statements of Operations and Comprehensive Income (Loss). Accrued interest and penalties are included within the related tax liability line item in the Consolidated Balance Sheets.
Shipping and Handling Costs
All shipping and handling amounts billed to a customer in a sales transaction are classified as revenue. Shipping and handling costs associated with storage and handling of finished goods and storage and handling of shipments to customers are included in cost of sales and totaled $112.5 million, $114.2 million and $118.0 million for the years ended December 31, 2017, 2016 and 2015, respectively.
Advertising Expense
Advertising expense consists of expenses relating to promoting the Company’s products, including trade shows, catalogs, and e-commerce promotions, and is charged to expense when incurred. Advertising expense was $6.4 million, $7.9 million and $10.4 million in 2017, 2016 and 2015, respectively.
New Accounting Pronouncements
During the year ended December 31, 2017, the Company did not change any of its existing accounting policies that are expected to have a material effect on the consolidated financial statements.
The following accounting pronouncements were adopted and became effective with respect to the Company in 2017 and 2016:
In March 2016, the Financial Accounting Standards Board ("FASB") issued ASU 2016-09, "Compensation - Stock Compensation (Topic 718): Improvements to Employee Share-Based Payment Accounting." The update simplified several areas of accounting for share-based compensation arrangements such as accounting for income taxes, forfeitures and statutory tax withholding requirements and the classification of related amounts on the statement of cash flows. This update was effective for the Company beginning January 1, 2017 and was applied using a modified retrospective transition method. The impact to beginning retained earnings was $0.9 million due to the recognition of deferred tax assets on excess tax benefits that had not previously reduced taxes payable. The adoption of this ASU did not have a material effect on the Company’s consolidated financial statements.
In July 2015, the FASB issued ASU 2015-11, “Inventory (Topic 330): Simplifying the Measurement of Inventory.” This update provides guidance on simplifying the measurement of inventory. Prior to the adoption of ASU 2015-11, inventory was measured at lower of cost or market; where market could be replacement cost, net realizable value, or net realizable value less an approximately normal profit margin. ASU 2015-11 updates this guidance to measure inventory at the lower of cost and net realizable value; where net realizable value is the estimated selling price in the ordinary course of business, less reasonably predictable cost of completion, disposal, and transportation. This update was effective for the Company beginning January 1, 2017 and was applied prospectively. The adoption of this ASU did not have a material effect on the Company’s consolidated financial statements.
In May 2015, the FASB issued ASU 2015-07, "Disclosures for Investments in Certain Entities That Calculate Net Asset Value per Share (or Its Equivalent)." The amendments in this update remove the requirement to categorize within the fair value hierarchy all investments for which fair value is measured using the net asset value (“NAV”) per share practical expedient in accordance with the standard for fair value measurement. The update was effective for the Company beginning January 1, 2016 and required retrospective application. The fair value disclosure for the Company’s defined benefit pension plan investments as of December 31, 2017 and December 31, 2016 reflect the adoption of this standard (refer to Note 14 - Employee Benefit Plans). The adoption of this ASU did not have a material effect on the Company’s consolidated financial statements.
The following recently issued accounting pronouncements will become effective in future periods with respect to the Company:
In February 2018, the FASB issued ASU 2018-02 “Income Statement - Reporting Comprehensive Income (Topic 220): Reclassification of Certain Tax Effects from Accumulated Other Comprehensive Income.” This update allows a reclassification
102
from accumulated other comprehensive income to retained earnings for stranded tax effects resulting from the Tax Reform Act. This update is effective for annual and interim periods beginning after December 15, 2018 and should be applied either in the period of adoption or retrospectively to each period (or periods) in which the effect of the change in the U.S. federal corporate income tax rate in the Tax Reform Act is recognized. Early adoption is permitted for any interim and annual financial statements that have not yet been issued. The Company is currently evaluating the impact of this standard on the Company's consolidated financial statements.
In August 2017, the FASB issued ASU 2017-12 “Derivatives and Hedging (Topic 815): Targeted Improvements to Accounting for Hedging Activities.” This update amends and simplifies existing guidance in order to better align hedge accounting with risk management activities, simplify the hedge accounting requirements, and improve the presentation and disclosure of hedging arrangements. The update is effective for annual and interim reporting periods beginning after December 15, 2018. Early adoption is permitted for any interim and annual financial statements that have not yet been issued. The Company is currently evaluating the impact of this standard on the Company's consolidated financial statements.
In May 2017, the FASB issued ASU 2017-09 “Compensation-Stock Compensation (Topic 718).” This update provides clarification on when modification accounting should be used for changes to the terms or conditions of a share-based payment award. This ASU does not change the accounting for modifications but clarifies that modification accounting guidance should only be applied if there is a change to the value, vesting conditions or award classification and would not be required if the changes are considered non-substantive. The amendments of this ASU are effective for reporting periods beginning after December 15, 2017. ASU 2017-09 is not expected to have a material impact on the Company's consolidated financial statements.
In March 2017, the FASB issued ASU 2017-07, "Compensation - Retirement Benefits (Topic 715): Improving the Presentation of Net Periodic Pension Cost and Net Periodic Postretirement Benefit Cost." This update requires presentation of the service cost component in the same line item or items as other compensation costs arising from services rendered by the pertinent employees during the period. The other components of pension expense are required to be presented separately from the service cost component and outside a subtotal of income from operations. The update requires retrospective application and represents a change in accounting principle. The update is effective for fiscal years beginning after December 15, 2017. The Company will adopt this standard on January 1, 2018 and pension expense of $2.3 million, $11.1 million and $10.4 million for the years ended December 31, 2017, 2016 and 2015, respectively, currently recorded in Cost of sales, will be presented in Other income (expense) on the Company’s Consolidated Statements of Operations and Comprehensive Income (Loss) upon adoption.
In January 2017, the FASB issued ASU 2017-04, "Intangibles - Goodwill and Other (Topic 350): Simplifying the Test for Goodwill Impairment." This update eliminates Step 2 from the goodwill impairment test that requires the impairment to be measured as the difference between the implied value of a reporting unit’s goodwill and the goodwill’s carrying amount. Instead, an entity should perform its annual, or interim, goodwill impairment test by comparing the fair value of a reporting unit with its carrying amount. An entity should recognize an impairment charge for the amount by which the carrying amount exceeds the reporting unit’s fair value; however, the loss recognized should not exceed the total amount of goodwill allocated to that reporting unit. The update is effective for annual and interim reporting periods beginning after December 15, 2019 and should be applied on a prospective basis. Early adoption is permitted for interim or annual goodwill impairment tests performed on testing dates after January 1, 2017. ASU 2017-04 is not expected to have a material impact on the Company’s consolidated financial statements.
In November 2016, the FASB issued ASU 2016-18, "Statement of Cash Flows: Restricted Cash." This ASU requires entities to show the changes in the total of cash and restricted cash in the statement of cash flows. As a result, entities will no longer present transfers between cash and restricted cash in the statement of cash flows. The new guidance requires retrospective application and is effective for annual and interim reporting periods beginning after December 15, 2017. The standard will have an impact on the presentation of the Company's Consolidated Statements of Cash Flows. As of December 31, 2017, the Company has $1.4 million and $10.1 million of restricted cash in Prepaid expenses and other and Other non-current assets in the Company's Consolidated Balance Sheet, respectively. As of December 31, 2016, the Company has $2.2 million and $0.3 million of restricted cash in Prepaid expenses and other and Other non-current assets in the Company's Consolidated Balance Sheet, respectively.
In February 2016, the FASB issued ASU 2016-02, "Leases (Topic 842)." The standard requires lessees to recognize the assets and liabilities that arise from leases on the balance sheet. A lessee should recognize in the balance sheet a liability to make lease payments (the lease liability) and a right-of-use asset representing its right to use the underlying asset for the lease term. The new guidance is effective for annual and interim reporting periods beginning after December 15, 2018. The amendments should be applied at the beginning of the earliest period presented using a modified retrospective approach with earlier application permitted as of the beginning of an interim or annual reporting period. The Company is currently evaluating the impact of the pending adoption of ASU 2016-02 on the consolidated financial statements. The Company expects that most of our operating lease commitments will be subject to the new standard and recognized as operating lease liabilities and right-of-use assets upon the adoption of ASU 2016-02. The standard is expected to increase Total assets and Total liabilities on the Company's Consolidated Balance Sheets. The standard is not expected to have a material impact on the Company's Consolidated Statements of Operations and Comprehensive Income (Loss).
103
In May 2014, the FASB issued ASU 2014-09, “Revenue from Contracts with Customers (Topic 606).” This ASU outlines a single, comprehensive model for accounting for revenue from contracts with customers which requires an entity to recognize the amount of revenue to which it expects to be entitled for the transfer of promised goods or services to customers. The ASU requires expanded qualitative and quantitative disclosures relating to the nature, amount, timing and uncertainty of revenue and cash flows arising from contracts with customers, including significant judgments and changes in judgments. In August 2015, the FASB issued ASU 2015-14, “Revenue from Contracts with Customers (Topic 606)", which defers the effective date of ASU 2014-09 to annual and interim reporting periods beginning after December 15, 2017. The standard will accelerate the timing of when revenue is recognized for arrangements involving consignment inventory and arrangements when the Company's performance does not create an asset with an alternative use to the Company and the Company has an enforceable right to payment for performance completed to date. The Company will adopt this standard on January 1, 2018 using the modified retrospective (cumulative effect) transition method. The standard will result in expanded disclosures in the notes to the Company's Consolidated Financial Statements and the expected impact to beginning retained earnings on the Company's Consolidated Balance Sheets is estimated to be approximately $11 million due to accelerated revenue recognition.
3. Merger Agreement with Prysmian S.p.A.
On December 3, 2017, the Company entered into an Agreement and Plan of Merger (the “Merger Agreement”), among the Company, Prysmian S.p.A., a company organized under the laws of the Republic of Italy (“Parent”), and Alisea Corp., a Delaware corporation and a wholly-owned subsidiary of Parent (“Merger Sub”), providing for the merger of Merger Sub with and into the Company (the “Merger”), with the Company surviving the Merger as a wholly owned subsidiary of Parent. Subject to the terms and conditions of the Merger Agreement, at the effective time of the Merger (the “Effective Time”), each issued and outstanding share of common stock of the Company (each, a “Share”), except for certain excluded shares, will automatically be cancelled and converted into the right to receive $30.00 in cash, without interest (the “Merger Consideration”).
The board of directors of the Company (i) unanimously determined that the Merger is fair to, and in the best interests of, the Company and its stockholders, (ii) approved and declared advisable the Merger Agreement and the Merger and the other transactions contemplated by the Merger Agreement, (iii) resolved to recommend adoption of the Merger Agreement to the holders of Shares and (iv) directed that the Merger Agreement be submitted to the holders of Shares for their adoption.
Consummation of the Merger is subject to the satisfaction or waiver of specified closing conditions, including (i) the adoption of the Merger Agreement by the holders of a majority of the outstanding Shares entitled to vote on such matter at a meeting of the holders of Shares duly called and held for such purpose, (ii) the expiration or termination of the applicable waiting period under the Hart-Scott-Rodino Antitrust Improvements Act of 1976, (iii) the adoption of a decision by the European Commission pursuant to Regulation (EC) 139/2004 of the European Union declaring that the Merger is compatible with the internal market, (iv) the approval by certain other requisite governmental regulators and authorities, (v) a thirty-day period beginning on the date the Company provides written notice to the DOJ of the Merger in accordance with the Non-Prosecution Agreement, dated as of December 22, 2016, between the Company and the DOJ (the “DOJ Agreement”), will have expired and the DOJ Agreement will remain in full force and effect, and (vi) other customary closing conditions, including (a) the absence of any law or order prohibiting the Merger or the other transactions contemplated by the Merger Agreement, (b) the accuracy of each party’s representations and warranties (subject to customary materiality qualifiers) and (c) each party’s performance of its obligations and covenants contained in the Merger Agreement.
The Merger Agreement includes customary representations, warranties and covenants of the Company, Parent and Merger Sub. The Company has also made certain covenants in the Merger Agreement, including covenants regarding the operation of the business of the Company and its subsidiaries prior to the Effective Time. The Company has also agreed to a customary non-solicitation covenant in the Merger Agreement prohibiting the Company from (a) soliciting, providing information or engaging or participating in any discussions or negotiations regarding proposals relating to alternative business combination transactions, or (b) entering into an acquisition agreement in connection with such an alternative business combination transaction, in each case, except as permitted under the Merger Agreement (including a customary exception for the Company’s board of directors to consider certain unsolicited proposals relating to alternative business combination transactions received prior to the adoption of the Merger Agreement by the holders of Shares, but subject to Parent’s right to propose amendments to its transaction in response to any such acquisition proposal during a specified notice period).
The Merger Agreement may be terminated by each of the Company and Parent under certain circumstances, including if the Merger is not consummated by June 3, 2018 (subject to one 90-day extension that may be elected by either the Company or Parent if certain regulatory approvals required in connection with the Merger have not been obtained). The Merger Agreement provides for certain other customary termination rights for the Company and Parent, subject to the payment by the Company of a termination fee in the amount of $47 million in certain circumstances, including if the Company terminates the Merger Agreement in order to accept a superior proposal for an alternative business combination transaction of the type described in the relevant provisions of
104
the Merger Agreement. The parties to the Merger Agreement are also entitled to an injunction or injunctions to prevent breaches of the Merger Agreement, and to specifically enforce the terms and provisions of the Merger Agreement.
The representations, warranties and covenants of each of the Company, Parent, and Merger Sub contained in the Merger Agreement have been made solely for the benefit of the parties to the Merger Agreement. In addition, such representations, warranties and covenants (i) have been made only for purposes of the Merger Agreement, (ii) have been qualified by confidential disclosures made by the Company in connection with the Merger Agreement, (iii) are subject to materiality qualifications contained in the Merger Agreement which may differ from what may be viewed as material by investors, (iv) were made only as of the date of the Merger Agreement or such other date as is specified in the Merger Agreement and (v) have been included in the Merger Agreement for the purpose of allocating risk between the contracting parties rather than establishing matters as facts. Investors should not rely on the representations, warranties and covenants or any descriptions thereof as characterizations of the actual state of facts or condition of the parties or any of its subsidiaries or affiliates. Moreover, information concerning the subject matter of the representations and warranties may change after the date of the Merger Agreement, which subsequent information may or may not be fully reflected in the public disclosures by the parties or their subsidiaries. The Merger Agreement should not be read alone, but should instead be read in conjunction with the other information regarding the parties that is or will be contained in, or incorporated by reference into, the Forms 10-K, Forms 10-Q and other documents that the Company files with the SEC.
The foregoing summary of the Merger Agreement and the transactions contemplated thereby does not purport to be complete and is subject to, and qualified in its entirety by, the full text of the Merger Agreement.
During the year ended December 31, 2017, the Company recognized $16.2 million of merger-related expenses in the SG&A expenses caption in the Consolidated Statements of Operations and Comprehensive Income (Loss).
Treatment of Stock-Based Awards and Performance Awards
At the effective time of the Merger, each stock option outstanding immediately prior to the effective time of the Merger (whether vested or unvested) will be cancelled and converted into the right to receive (without interest) an amount in cash equal to the excess, if any, of $30.00 over the exercise price per share under such stock option. Each option for which the exercise price per share is equal to or greater than $30.00 shall be cancelled at the effective time without payment of consideration.
At the effective time of the Merger, (i) each Company restricted stock unit (“RSU”) award held by a non-employee director that is outstanding immediately prior to the effective time of the Merger will be accelerated and converted into the right to receive (without interest) an amount in cash equal to $30.00 with respect to each share of Company common stock underlying such award, and (ii) each Company RSU award not held by a non-employee director that is outstanding immediately prior to the effective time of the Merger will be converted into an award representing the right to receive (without interest and less applicable withholding taxes) an amount in cash equal to $30.00, which shall be subject to the same terms and conditions that were applicable to such restricted stock unit award immediately prior to the effective time, provided that any performance-based vesting condition measured over a period of one year will be deemed satisfied and the converted award will vest on the earlier of (A) the originally scheduled vesting date and (B) the date that is six months following the closing date, subject to continued employment with Parent and its subsidiaries through such applicable date (or upon the holder’s earlier termination by Parent, the surviving corporation or any of their respective affiliates without “cause” or for “good reason” (as each term is defined in the Company’s 2015 Stock Incentive Plan)).
At the effective time of the Merger, each Company performance-based stock unit (“PSU”) award outstanding immediately prior to the effective time of the Merger will be cancelled and converted into an award representing the right to receive (without interest and less applicable withholding taxes) an amount in cash equal to the number of shares subject to the award multiplied by $30.00. The number of shares of the Company’s common stock subject to such PSU will be determined (i) for any award with a performance period commencing as of January 1, 2016, based on actual performance as determined by the Compensation Committee of the Board and (ii) for any award with a performance period commencing as of January 1, 2017, based on performance deemed satisfied at the target level. Each converted PSU award will be subject to the same terms and conditions that were applicable immediately prior to the effective time, provided that as of the effective time, the performance-vesting conditions shall no longer apply and each award shall be subject solely to service-based vesting. For Company PSU awards with a performance period commencing as of January 1, 2015, settlement is expected to occur prior to the effective time of the merger and will be based on the actual level of achievement of the applicable performance goals.
Treatment of Outstanding Debt
The Company has agreed to (and to cause its subsidiaries to) issue, upon Parent’s written request, a notice of optional redemption on the closing date for all of the outstanding aggregate principal amount of the Company’s 5.75% Senior Notes due 2022 ("5.75% Senior Notes") issued pursuant to the indenture, dated September 25, 2012, among the Company, certain of its subsidiaries party thereto as guarantors, and U.S. Bank National Association and to provide any other cooperation reasonably requested by Parent
105
to facilitate the satisfaction and discharge of the Company’s 5.75% Senior Notes, if elected by Parent, effective as of the closing date, or at such later date at Parent’s election.
Additionally, the Company will, and will cause its subsidiaries to, take all actions required to repay in full on the closing date all obligations then outstanding under the credit agreement and to use reasonable best efforts to cause the release on the closing date of all liens securing obligations under the credit agreement.
The Company and its subsidiaries will also take certain actions with respect to and pursuant to the terms of the Asset-Based Revolving Credit Facility ("Revolving Credit Facility"), the 5.75% Senior Notes and the Subordinated Convertible Notes due 2029 ("Subordinated Convertible Notes") that are required to be performed by the Company or its subsidiaries at or prior to the effective time of the Merger as a result of the execution and delivery of the Merger Agreement, the Merger and the other transactions contemplated thereby, including the giving of notices or execution and delivery of certain documents. If the closing date of the merger would have been December 31, 2017, each holder of a Subordinated Convertible Note with a principal amount of $1,000 who elected to convert such Subordinated Convertible Note in connection with the merger pursuant to the Subordinated Convertible Notes indenture would have been entitled to receive $1,081.59 for such Subordinated Convertible Note.
In addition, the Company will use its reasonable best efforts to (and to cause its subsidiaries to) take any actions that are reasonably requested by Parent with respect to the treatment specified by Parent of any other indebtedness of the Company.
4. Divestitures
Since October 2014, the Company has completed the following as of December 31, 2017 (in millions):
Asia Pacific divestitures
Entity | Sale / Closure | Sale / Closure Date | Gross Proceeds | Pre-tax Gain / (Loss) (1) | ||||||||
New Zealand (2) | Closure | Fourth Quarter 2017 | $ | 10.3 | $ | 5.4 | ||||||
China (3) | Sale | Third Quarter 2017 | 8.8 | (19.9 | ) | |||||||
Australia | Closure | Second Quarter 2017 | — | (4.2 | ) | |||||||
Pakistan | Sale | First Quarter 2017 | 5.3 | (3.5 | ) | |||||||
India | Sale | First Quarter 2016 | 10.8 | 1.6 | ||||||||
Thailand | Sale | Third Quarter 2015 | 88.0 | 16.1 | ||||||||
Fiji | Sale | First Quarter 2015 | 9.3 | (2.6 | ) | |||||||
Keystone | Sale | First Quarter 2015 | 11.0 | 3.6 | ||||||||
PDP and PDEP | Sale | Fourth Quarter 2014 | 67.1 | 17.6 | ||||||||
(1) | The pre-tax gain / (loss) for each sale or liquidation was recorded in the SG&A expenses caption of the Consolidated Statements of Operations and Comprehensive Income (Loss); the pre-tax gain / (loss) includes the reclassification of foreign currency translation adjustments upon sale or liquidation of the entity. The aggregate net pre-tax loss on the reclassification of foreign currency translation adjustments upon sale or liquidation of the Asia Pacific divestiture entities is $46.9 million. |
(2) | The pre-tax gain includes a reclassification of foreign currency translation adjustments upon the substantially complete liquidation of the entity of $0.9 million and a pre-tax gain on the sale of the land and building of $4.5 million. |
(3) | In the fourth quarter of 2016, the Company updated its strategic path forward based on the current business environment and economic challenges for its China business. In anticipation of a prolonged sales process given the challenging environment, the Company's updated internal projections (based on a probability weighted cash flows approach), resulted in a long-lived asset impairment loss recorded in cost of sales of $11.0 million in the fourth quarter of 2016. The Company continued to pursue process improvement initiatives through the first half of 2017; however, in the third quarter of 2017, the Company completed an accelerated sale of China, recognizing a pre-tax loss of $19.9 million. |
As of December 31, 2017, the Company's Asia Pacific businesses, and disposals of related operations to date (that occurred over a three year period), are not considered a strategic shift that has or will have a major effect on the Company's operations and financial results. Refer to Note 18 - Segment Information for results of the Africa / Asia Pacific segment.
The sale of Thailand in the year ended December 31, 2015 was considered a disposal of an individually significant component of an entity per ASC 205 - Presentation of Financial Statements. The pre-tax loss of Thailand and the pre-tax loss attributable to the Company in the year ended December 31, 2015 was $7.6 million and $5.7 million, respectively.
106
Africa divestitures
Entity | Sale / Closure | Sale / Closure Date | Gross Proceeds | Pre-tax Gain (Loss)(1) | ||||||||
Algeria | Sale | Second Quarter 2017 | $ | 3.8 | $ | (38.0 | ) | |||||
South Africa - Durban | Closure | Fourth Quarter 2016 | — | 1.6 | ||||||||
South Africa - National Cables | Closure | Fourth Quarter 2016 | — | (29.4 | ) | |||||||
Zambia | Sale | Third Quarter 2016 | 9.8 | (14.4 | ) | |||||||
Egypt | Sale | Second Quarter 2016 | 5.8 | (8.4 | ) | |||||||
(1) | The pre-tax gain / (loss) for each sale or liquidation was recorded in the SG&A expenses caption of the Consolidated Statements of Operations and Comprehensive Income (Loss); the pre-tax gain / (loss) includes the reclassification of foreign currency translation adjustments upon sale or liquidation of the entity. The aggregate pre-tax loss on the reclassification of foreign currency translation adjustments upon sale or liquidation of the Africa divestiture entities is $79.4 million. |
The Company's Africa businesses, and disposals of related operations to date, are not considered a strategic shift that has or will have a major effect on the Company's operations and financial results. As of December 31, 2017, the Company determined that the remaining Africa business did not meet the held for sale criteria. Refer to Note 18 - Segment Information for results of the Africa / Asia Pacific segment.
The Company has incurred total aggregate costs of $9.4 million related to its Asia Pacific and Africa divestitures, primarily legal and transaction fees, as of December 31, 2017. Charges incurred for the years ended December 31, 2017, 2016 and 2015 were $3.9 million, $2.1 million and $3.4 million, respectively.
Venezuela divestiture
In the third quarter of 2016, the Company completed the sale of its Venezuelan subsidiary for cash consideration of approximately $6 million. The pre-tax gain recognized in the year ended December 31, 2016 was $5.9 million, and is included in the SG&A expenses caption in the Consolidated Statements of Operations and Comprehensive Income (Loss) in the Europe segment (based on the legal entity structure).
North America automotive divestitures
As part of the strategic roadmap, the Company recognized a $6.9 million pre-tax loss in the year ended December 31, 2017 and a $53.2 million pre-tax gain in the year ended December 31, 2016 from asset sales related to the restructuring program for total consideration of $70.7 million. The gains/losses are recognized in the SG&A expenses caption in the Consolidated Statements of Operations and Comprehensive Income (Loss) in the North America segment. The disposals did not represent a strategic shift that has or will have a major effect on the Company’s operations and financial results; therefore, the results are presented as continued operations.
Spain subsidiary divestiture
As part of the July 2014 restructuring program, in the second quarter of 2015, the Company completed the disposal of a subsidiary in Spain for cash consideration of $1.8 million. The pre-tax loss on the sale from the disposition in the second quarter of 2015 was $11.6 million. The loss is recognized in the SG&A expenses caption in the Consolidated Statements of Operations and Comprehensive Income (Loss) in the Europe segment. The disposal did not represent a strategic shift that had or will have a major effect on the Company's operations and financial results; therefore, the results are presented as continued operations.
107
5. Restructuring
November 2015 restructuring program
In the fourth quarter of 2015, the Company committed to a strategic roadmap focused on growth and optimization of the portfolio, developing leading cost and efficiency positions, growth through innovation and cultivation of a high-performance culture. In 2017, the Company approved additional expenditures to further expand, strengthen and accelerate the Company's program targeting operational effectiveness and efficiencies. As of December 31, 2017 the total remaining costs are immaterial.
Total expected costs and costs incurred to date by reportable segment are below (in millions):
North America | Europe | Latin America | Total | |||||||||
Costs incurred 2015 - Cost of sales | $ | 0.1 | $ | 5.0 | $ | 1.7 | $ | 6.8 | ||||
Costs incurred 2015 - SG&A | — | 1.7 | 0.1 | 1.8 | ||||||||
Total costs incurred, December 31, 2015 | $ | 0.1 | $ | 6.7 | $ | 1.8 | $ | 8.6 | ||||
Costs incurred 2016 - Cost of sales | $ | 7.4 | $ | 10.5 | $ | 2.6 | $ | 20.5 | ||||
Costs incurred 2016 - SG&A | 41.3 | 3.2 | 0.8 | 45.3 | ||||||||
Total costs incurred, December 31, 2016 | $ | 48.7 | $ | 13.7 | $ | 3.4 | $ | 65.8 | ||||
Costs incurred 2017 - Cost of sales | $ | 6.9 | $ | 0.1 | $ | 0.3 | $ | 7.3 | ||||
Costs incurred 2017 - SG&A | 24.6 | 1.1 | — | 25.7 | ||||||||
Total costs incurred, December 31, 2017 | $ | 31.5 | $ | 1.2 | $ | 0.3 | $ | 33.0 | ||||
Total aggregate costs to date | $ | 80.3 | $ | 21.6 | $ | 5.5 | $ | 107.4 | ||||
Changes in the restructuring reserve and activity for the years ended December 31, 2017 and 2016 are below (in millions):
Employee Separation Costs | Asset-Related Costs | Other Costs | Total | |||||||||
Balance, December 31, 2015 | $ | 1.3 | $ | — | $ | 3.2 | $ | 4.5 | ||||
Net provisions | $ | 10.5 | $ | 19.4 | $ | 35.9 | $ | 65.8 | ||||
Net benefits charged against the assets and other | — | (19.4 | ) | (0.7 | ) | (20.1 | ) | |||||
Payments | (5.8 | ) | — | (25.0 | ) | (30.8 | ) | |||||
Foreign currency translation | (0.1 | ) | — | (0.1 | ) | (0.2 | ) | |||||
Balance, December 31, 2016 | $ | 5.9 | $ | — | $ | 13.3 | $ | 19.2 | ||||
Net provisions | $ | 2.7 | $ | 2.4 | $ | 27.9 | $ | 33.0 | ||||
Net benefits charged against the assets and other | — | (2.4 | ) | (0.2 | ) | (2.6 | ) | |||||
Payments | (7.6 | ) | — | (39.7 | ) | (47.3 | ) | |||||
Foreign currency translation | 0.2 | — | 0.5 | 0.7 | ||||||||
Balance, December 31, 2017 | $ | 1.2 | $ | — | $ | 1.8 | $ | 3.0 | ||||
Total aggregate costs to date | $ | 15.4 | $ | 23.7 | $ | 68.3 | $ | 107.4 | ||||
108
Employee Separation Costs
The Company recorded employee separation costs of $2.7 million, $10.5 million and $2.2 million for the years ended December 31, 2017, 2016 and 2015, respectively. The employee separation charges were $1.4 million, $6.3 million and $0.1 million in North America and $1.3 million, $3.4 million and $1.4 million in Europe for the years ended December 31, 2017, 2016 and 2015 respectively. The employee separation charges were $0.8 million and $0.7 million in Latin America for the years ended December 31, 2016 and 2015, respectively.
Employee separation costs include severance and retention bonuses. As of December 31, 2017, employee separation costs included severance charges for approximately 480 employees; approximately 360 of these employees were classified as manufacturing employees and approximately 120 of these employees were classified as non-manufacturing employees. The charges relate to involuntary separations based on current salary levels and past service periods and are either considered one-time employee termination benefits in accordance with ASC 420 - Exit or Disposal Cost Obligations ("ASC 420") or charges for contractual termination benefits under ASC 712 - Compensation - Nonretirement Postemployment Benefits ("ASC 712").
Asset-Related Costs
The Company recorded asset-related costs of $2.4 million, $19.4 million and $1.9 million for the years ended December 31, 2017, 2016 and 2015, respectively. The asset-related charges were $2.3 million and $13.9 million in North America for the years ended December 31, 2017 and 2016, respectively. The asset-related charges were $0.1 million, $3.7 million and $1.0 million in Europe for the years ended December 31, 2017, 2016 and 2015, respectively. The asset-related charges for the years ended December 31, 2016 and 2015 were $1.8 million and $0.9 million in Latin America, respectively.
Asset-related costs consist of asset write-downs, including goodwill and intangible assets, and accelerated depreciation. Asset write-downs relate to the establishment of a new fair value basis for assets to be classified as held-for-sale or to be disposed of, as well as asset impairment charges for asset groups to be held-and-used in locations which are being restructured and it has been determined the undiscounted cash flows expected to result from the use and eventual disposition of the assets are less than their carrying value. Refer to Note 9 - Goodwill and Other Intangible Assets, net for additional information and refer to Note 21 - Fair Value for additional details regarding valuation techniques used to determine fair value.
The Company notes the plan to abandon a long-lived asset before the end of its previously estimated useful life is a change in accounting estimate per ASC 250 - Accounting Changes and Error Corrections. The annual depreciation impact from the asset write-downs and changes in estimated useful lives is not material.
Other Costs
The Company recorded other restructuring-type charges of $27.9 million, $35.9 million and $4.5 million for the years ended December 31, 2017, 2016 and 2015, respectively. The other restructuring-type charges were $27.8 million and $28.5 million in North America for the years ended December 31, 2017 and 2016, respectively. In Europe, the Company recorded a benefit of $0.2 million for the year ended December 31, 2017 and other restructuring-type charges of $6.6 million and $4.3 million for the years ended December 31, 2016 and 2015, respectively. The other restructuring-type charges were $0.3 million, $0.8 million and $0.2 million in Latin America for the years ended December 31, 2017, 2016 and 2015, respectively.
Other restructuring-type charges are incurred as a direct result of the restructuring program. These restructuring-type charges primarily include project management costs, such as consulting fees related to the supply chain redesign and the cost to change internal systems and processes to support the underlying organizational changes, as well as working capital write-downs not associated with normal operations, equipment relocation, termination of contracts and other immaterial costs.
109
July 2014 restructuring program
In third quarter of 2014, the Company announced a comprehensive restructuring program. As of December 31, 2017, this program is substantially complete and future estimated costs are expected to be immaterial. The restructuring program was focused on the closure of certain underperforming assets as well as the consolidation and realignment of other facilities. The Company also implemented initiatives to reduce SG&A expenses globally. Total aggregate costs incurred as part of the program were approximately $220 million and the remaining restructuring reserve at December 31, 2017 and December 31, 2016 was not material. Total costs incurred to date by reportable segment for the years ended December 31, 2016 and 2015 are below (in millions). Total costs incurred were immaterial for the year ended December 31, 2017.
North America | Europe | Latin America | Africa/Asia Pacific | Total | |||||||||||
Costs incurred 2015 - Cost of sales | $ | 6.4 | $ | 7.4 | $ | 3.4 | $ | (0.1 | ) | $ | 17.1 | ||||
Costs incurred 2015 - SG&A | 5.5 | 14.7 | 4.5 | 0.2 | 24.9 | ||||||||||
Total costs incurred, December 31, 2015 | $ | 11.9 | $ | 22.1 | $ | 7.9 | $ | 0.1 | $ | 42.0 | |||||
Costs incurred 2016 - Cost of sales | $ | 5.7 | $ | 0.7 | $ | 1.7 | $ | — | $ | 8.1 | |||||
Costs incurred 2016 - SG&A | 0.3 | 2.0 | 1.2 | — | 3.5 | ||||||||||
Total costs incurred, December 31, 2016 | $ | 6.0 | $ | 2.7 | $ | 2.9 | $ | — | $ | 11.6 | |||||
6. Other Income (Expense)
Other income (expense) primarily includes foreign currency transaction gains or losses, which result from changes in exchange rates between the designated functional currency and the currency in which a transaction is denominated as well as gains and losses on derivative instruments that are not designated as cash flow hedges and Venezuela devaluation charges. During 2017, 2016 and 2015, the Company recorded other income of $28.5 million and $7.2 million and other expense of $71.3 million, respectively.
For 2017, other income was primarily attributable to $31.0 million related to gains on derivative instruments that were not designated as cash flow hedges, partially offset by $2.5 million related to foreign currency transaction losses.
For 2016, other income was primarily attributable to $8.9 million related to gains on derivative instruments that were not designated as cash flow hedges, partially offset by $1.7 million related to foreign currency transaction losses.
For 2015, other expense was primarily attributable to the adoption of the SIMADI currency exchange system in Venezuela and ongoing remeasurement of the local balance sheet, which resulted in an expense of $22.9 million, $41.2 million related to foreign currency transaction losses, and $7.2 million related to losses on derivative instruments which were not designated as cash flow hedges.
110
7. Inventories
As of December 31, 2017, all inventories are stated at the lower of cost or net realizable value and consisted of the following (in millions):
Dec 31, 2017 | Dec 31, 2016 | |||||||
Raw materials | $ | 175.8 | $ | 170.7 | ||||
Work in process | 131.8 | 130.3 | ||||||
Finished goods | 428.5 | 467.2 | ||||||
Total | $ | 736.1 | $ | 768.2 | ||||
At December 31, 2017 and 2016, the Company had $14.1 million and $19.3 million of consignment inventory at locations not operated by the Company, respectively, with approximately 90% and 80% of the consignment inventory located in the United States and Canada, respectively.
8. Property, Plant and Equipment
Property, plant and equipment consisted of the following (in millions):
Dec 31, 2017 | Dec 31, 2016 | ||||||
Land | $ | 44.0 | $ | 44.7 | |||
Buildings and leasehold improvements | 223.4 | 206.5 | |||||
Machinery, equipment and office furnishings | 755.8 | 714.4 | |||||
Construction in progress | 39.0 | 53.5 | |||||
Total — gross book value | 1,062.2 | 1,019.1 | |||||
Less accumulated depreciation | (531.9 | ) | (489.8 | ) | |||
Total — net book value | $ | 530.3 | $ | 529.3 | |||
Depreciation expense totaled $66.0 million, $75.8 million and $84.1 million for the years ended December 31, 2017, 2016 and 2015, respectively.
The 2016 and 2015 asset impairments below incorporated Level 3 inputs in determining the fair value of the underlying assets. Development of estimates of fair values in these circumstances is complex and is dependent upon, among other factors, the nature of potential sales transactions, if any, composition of assets, comparability to market transactions, negotiations with third party purchasers, etc. Such factors bear directly on the range of potential fair values and the selection of the best estimates. Refer to Note 21 - Fair Value for additional details regarding valuation techniques used to determine fair value.
2016 China Asset Impairment
In the fourth quarter of 2016, the Company updated its strategic path forward based on the current business environment and economic challenges. As a result, the performance of the business was anticipated to deteriorate such that the updated internal projections, using a probability weighted-average approach, indicated that the undiscounted expected future cash flows were less than the carrying value of the assets. A valuation of the China machinery and equipment and real property assets was performed; based on the results of the analysis, the Company recorded an impairment charge of $11.0 million in the fourth quarter of 2016. The impairment charge was recorded in the Cost of sales caption in the Consolidated Statements of Operations and Comprehensive Income (Loss). The results of the China business are reported within the Africa/Asia Pacific reportable segment.
2016 Egypt Asset Impairment
In the first quarter of 2016, the Egyptian financial outlook, including anticipated cash flows from potential sales transactions, deteriorated due to evolving political and macroeconomic conditions in Egypt. Using a probability weighted-average approach, based on updated internal projections developed by management, the Company determined that the undiscounted expected future cash flows were less than the carrying value of the assets. A valuation of the Egypt machinery and equipment and real property assets was performed; based on the results of the analysis, the Company recorded an impairment charge of $6.0 million in the first quarter of 2016. The impairment charge was recorded in the Cost of sales caption in the Consolidated Statements of Operations and Comprehensive Income (Loss). The Egyptian results are reported within the Africa/Asia Pacific reportable segment.
111
2015 India Asset Impairment
In the third quarter of 2015, anticipated cash flows from potential sales transactions deteriorated. Using a probability weighted-average approach, based on internal financial projections developed by management and non-binding sale offers, the Company determined that the undiscounted expected future cash flows were less than the carrying value of the assets. A valuation of the India machinery and equipment and real property assets was performed. Based on the results of the analysis, the Company recorded an impairment charge of $13.6 million in the third quarter of 2015. The impairment charge was recorded in the Cost of sales caption in the Consolidated Statements of Operations and Comprehensive Income (Loss). The results of the Company's India operations are reported within the Africa/Asia Pacific reportable segment.
2015 Algeria Asset Impairment
In the fourth quarter of 2015, the Algerian financial outlook deteriorated due to a significant decline in the oil and gas market, which is a major component of the Algerian economy. Based on updated internal projections developed by management, the Company determined that the undiscounted expected future cash flows were less than the carrying value of the assets. Based on the results of the analysis, the Company recorded an impairment charge of $30.7 million in the fourth quarter of 2015. The impairment charge was recorded in the Cost of sales caption in the Consolidated Statements of Operations and Comprehensive Income (Loss). The Algerian results are reported within the Africa/Asia Pacific reportable segment.
9. Goodwill and Other Intangible Assets, net
The amounts of goodwill and indefinite-lived intangible assets were as follows (in millions):
Goodwill | Indefinite-lived intangible assets — Trade names | ||||||||||||||||||||||||||
North America | Latin America | Africa/Asia Pacific | Total | North America | Europe | Total | |||||||||||||||||||||
Balance, December 31, 2015 | $ | 16.5 | $ | 3.9 | $ | 1.8 | $ | 22.2 | $ | 0.3 | $ | 0.4 | $ | 0.7 | |||||||||||||
Currency translation and other adjustments | (1.0 | ) | — | (0.2 | ) | (1.2 | ) | 0.4 | — | 0.4 | |||||||||||||||||
Goodwill and indefinite-lived asset impairment | (7.4 | ) | — | (1.6 | ) | (9.0 | ) | (0.3 | ) | — | (0.3 | ) | |||||||||||||||
Balance, December 31, 2016 | $ | 8.1 | $ | 3.9 | $ | — | $ | 12.0 | $ | 0.4 | $ | 0.4 | $ | 0.8 | |||||||||||||
Currency translation and other adjustments | (1.0 | ) | — | — | (1.0 | ) | — | (0.1 | ) | (0.1 | ) | ||||||||||||||||
Goodwill and indefinite-lived asset impairment | — | — | — | — | — | — | — | ||||||||||||||||||||
Balance, December 31, 2017 | $ | 7.1 | $ | 3.9 | $ | — | $ | 11.0 | $ | 0.4 | $ | 0.3 | $ | 0.7 | |||||||||||||
At December 31, 2017 and 2016, the total accumulated goodwill impairment charge was $7.4 million, prior to foreign currency translation adjustments, within the North America segment, $82.6 million, prior to foreign currency translation adjustments, within the Latin America segment and $77.4 million, prior to foreign currency translation adjustments, within the Africa / Asia Pacific segment. At December 31, 2017 and 2016, the total accumulated indefinite-lived asset trade name impairment charge was $2.1 million, prior to foreign currency translation adjustments, within the North America segment, $68.9 million, prior to foreign currency translation adjustments, within the Latin America segment and $24.2 million, prior to foreign currency translation adjustments, within the Africa / Asia Pacific segment.
The amounts of other intangible assets were as follows (in millions):
Dec 31, 2017 | Dec 31, 2016 | ||||||
Amortized intangible assets: | |||||||
Amortized intangible assets | $ | 108.9 | $ | 108.9 | |||
Accumulated amortization | (89.8 | ) | (85.0 | ) | |||
Foreign currency translation adjustment | (5.1 | ) | (5.2 | ) | |||
Total Amortized intangible assets | $ | 14.0 | $ | 18.7 | |||
As part of the Company's strategic plan, the Company's management evaluated alternatives for its automotive business which included the sale of its automotive ignition wire business in the second quarter of 2016. In the third quarter of 2016, the Company continued to pursue alternatives for the remaining automotive business. As a result of this change in strategy, the Company performed an impairment test in the third quarter of 2016. Using a market approach, the Company recorded a goodwill impairment charge of $7.4 million and an impairment charge on the amortized intangible assets of $4.7 million. These costs are included as
112
asset-related costs, and were recorded in the SG&A expenses caption in the Consolidated Statements of Operations and Comprehensive Income (Loss) in the North America reportable segment. As of December 31, 2017, goodwill and intangible assets related to the acquisition of the remaining automotive business was zero.
Amortized intangible assets are stated at cost less accumulated amortization as of December 31, 2017 and 2016. Amortized intangible assets have been determined to have a useful life in the range of 7 to 12 years. The approximate weighted average useful life of the amortized intangible assets is 10 years. For customer relationships, the Company has accelerated the amortization expense to align with the historical customer attrition rates. All other amortized intangible assets are amortized on a straight-line basis. The amortization of intangible assets in 2017, 2016 and 2015 was $4.8 million, $8.6 million, and $11.6 million, respectively. The estimated amortization expense for the next five years in millions of dollars is: 2018 — $2.3 million, 2019 — $2.2 million, 2020 — $2.2 million, 2021 — $2.2 million, 2022 — $2.2 million and $2.9 million thereafter.
The Company capitalizes costs for internal use software incurred during the application development stage. Costs related to preliminary project activities and post implementation activities are expensed as incurred. Capitalized software will be amortized once the product is ready for its intended use, using the straight-line method over the estimated useful lives of the assets, which is three years. As of December 31, 2017 and 2016, capitalized software was $8.6 million and $8.8 million, respectively.
10. Accrued Liabilities
Accrued liabilities consisted of the following (in millions):
Dec 31, 2017 | Dec 31, 2016 | ||||||
Payroll related accruals | $ | 68.0 | $ | 79.1 | |||
Customers deposits and prepayments | 56.1 | 63.6 | |||||
Taxes other than income | 18.5 | 20.0 | |||||
Customer rebates | 32.4 | 29.4 | |||||
Insurance claims and related expenses | 6.9 | 13.4 | |||||
Current income tax liabilities | 19.3 | 4.8 | |||||
Restructuring reserve | 3.0 | 23.7 | |||||
SEC and DOJ settlements | — | 82.3 | |||||
Other accrued liabilities | 104.6 | 103.3 | |||||
Total | $ | 308.8 | $ | 419.6 | |||
113
11. Long-Term Debt
(in millions) | Dec 31, 2017 | Dec 31, 2016 | ||||||
North America | ||||||||
5.75% Senior Notes | $ | 600.0 | $ | 600.0 | ||||
Subordinated Convertible Notes | 429.5 | 429.5 | ||||||
Debt discount | (253.1 | ) | (255.6 | ) | ||||
Debt issuance costs | (9.1 | ) | (10.6 | ) | ||||
Revolving Credit Facility | 219.9 | 75.9 | ||||||
Other | 9.0 | 9.0 | ||||||
Europe | ||||||||
Revolving Credit Facility | 39.6 | — | ||||||
Other | 5.3 | 7.4 | ||||||
Latin America credit facilities | 44.6 | 82.4 | ||||||
Africa/Asia Pacific credit facilities | — | 0.6 | ||||||
Total debt | 1,085.7 | 938.6 | ||||||
Less current maturities | 46.9 | 67.5 | ||||||
Long-term debt | $ | 1,038.8 | $ | 871.1 | ||||
At December 31, 2017, maturities of long-term debt during the twelve month periods beginning December 31, 2018 through December 31, 2022 and thereafter were $46.9 million, $0.9 million, $0.8 million, $0.4 million and $854.6 million, respectively, and $182.1 million thereafter.
5.75% Senior Notes
The Company's 5.75% Senior Notes are summarized in the table below:
5.75% Senior Notes | ||||||||
(in millions) | December 31, 2017 | December 31, 2016 | ||||||
Face Value | $ | 600.0 | $ | 600.0 | ||||
Debt issuance costs | (5.8 | ) | (7.0 | ) | ||||
Book value | 594.2 | 593.0 | ||||||
Fair Value (Level 1) | 619.7 | 579.0 | ||||||
Stated Interest Rate | 5.75 | % | 5.75 | % | ||||
Interest Payment | Semi-Annual: Apr 1 & Oct 1 | |||||||
Maturity Date | October 2022 | |||||||
Guarantee | Jointly and severally guaranteed by the Company's wholly owned U.S. subsidiaries | |||||||
5.75% Senior Notes | |||
Beginning Date | Percentage | ||
Call Option (1) | October 1, 2017 | 102.875 | % |
October 1, 2018 | 101.917 | % | |
October 1, 2019 | 100.958 | % | |
October 1, 2020 and thereafter | 100.000 | % | |
(1) | The Company may, at its option, redeem the 5.75% Senior Notes on or after the stated beginning dates at percentages noted above (plus accrued and unpaid interest). Additionally, on or prior to October 1, 2015, the Company had the right to redeem in the aggregate up to 35% of the aggregate principal amount of 5.75% Senior Notes issued with the cash proceeds from one or more equity offerings, at a redemption price in cash equal to 105.75% of the principal plus accrued and unpaid interest so long as (i) at least 65% of the aggregate principal amount of the 5.75% Senior Notes issued remained outstanding immediately after giving effect to any such redemption; and (ii) notice of any such redemption was given within 60 days after the date of the closing of any such equity offering. |
114
The 5.75% Senior Notes' indenture contains covenants that limit the ability of the Company and certain of its subsidiaries to (i) incur additional indebtedness and guarantee indebtedness; (ii) pay dividends or make other distributions or repurchase or redeem the Company's capital stock; (iii) purchase, redeem or retire debt; (iv) issue certain preferred stock or similar equity securities; (v) make loans and investments; (vi) sell assets; (vii) incur liens; (viii) enter into transactions with affiliates; (ix) enter into agreements restricting the Company's subsidiaries' ability to pay dividends; and (x) consolidate, merge or sell all or substantially all assets. However, these covenants are subject to exceptions and qualifications.
Subordinated Convertible Notes
The Company’s Subordinated Convertible Notes outstanding as of December 31, 2017 and 2016 are as follows:
Subordinated Convertible Notes | ||||||||
(in millions) | Dec 31, 2017 | Dec 31, 2016 | ||||||
Face value | $ | 429.5 | $ | 429.5 | ||||
Debt discount | (253.1 | ) | (255.6 | ) | ||||
Debt issuance costs | (3.3 | ) | (3.6 | ) | ||||
Book value | 173.1 | 170.3 | ||||||
Fair value (Level 1) | 453.4 | 343.8 | ||||||
Maturity date | Nov 2029 | |||||||
Stated annual interest rate | 4.50% until Nov 2019 2.25% until Nov 2029 | |||||||
Interest payments | Semi-annually: May 15 & Nov 15 | |||||||
The Company’s Subordinated Convertible Notes were issued on December 18, 2009 in the amount of $429.5 million. The notes and the common stock issuable upon conversion were registered on a Registration Statement on Form S-4, initially filed with the SEC on October 27, 2009, as amended and as declared effective by the SEC on December 18, 2009. At issuance, the Company separately accounted for the liability and equity components of the instrument, based on the Company’s nonconvertible debt borrowing rate on the instrument’s issuance date of 12.5%. At issuance, the liability and equity components were $162.9 million and $266.6 million, respectively. The equity component (debt discount) is being amortized to interest expense based on the effective interest method. The Subordinated Convertible Notes were issued to complete an exchange offer; therefore, all proceeds were used to extinguish the Company's previously held 1.00% Senior Convertible Notes due 2012. The Company incurred issuance fees and expenses of approximately $14.5 million as a result of the exchange offer which have been proportionately allocated to the liability and equity components of the Subordinated Convertible Notes due in 2029. Additional terms have been summarized in the table below.
115
The Company’s Subordinated Convertible Notes and terms are summarized in the tables below. For a discussion of the effects on earnings per share, refer to Note 17 - Earnings Per Common Share.
Subordinated Convertible Notes due 2029 (1) | ||
Conversion Rights — The notes are convertible at the option of the holder into the Company’s common stock upon the occurrence of certain events, including | (i) during any calendar quarter commencing after March 31, 2010, in which the closing price of the Company’s common stock is greater than or equal to 130% of the conversion price for at least 20 trading days during the period of 30 consecutive trading days ending on the last trading day of the preceding calendar quarter (establishing a contingent conversion price of $47.78); | |
(ii) during any five business day period after any five consecutive trading day period in which the trading price per $1,000 principal amount of the notes for each day of that period is less than 98% of the product of the closing sale price of the Company’s common stock and the applicable conversion rate; | ||
(iii) certain distributions to holders of the Company’s common stock are made or upon specified corporate transactions including a consolidation or merger; | ||
(iv) a fundamental change as defined; | ||
(v) at any time during the period beginning on August 31, 2029 and ending on the close of business on the business day immediately preceding the stated maturity date; and | ||
(vi) on or after November 15, 2019, the Company may redeem all or a part of the notes for cash at a price equal to 100% of the principal amount of the notes, plus interest, if the price of the Company's common stock has been at least 150% of the conversion price then in effect for at least 20 trading days during the 30 consecutive trading day period immediately preceding the date on which notice is given. | ||
Initial conversion rate | $36.75 per share — approximating 27.2109 shares per $1,000 principal amount of notes | |
Upon conversion | A holder will receive, in lieu of common stock, an amount of cash equal to the lesser of (i) the principal amount of the notes, or (ii) the conversion value, determined in the manner set forth in the indenture governing the notes, of a number of shares equal to the conversion rate. | |
If the conversion value exceeds the principal amount of the notes on the conversion date, the Company will also deliver, at the Company’s election, cash or common stock or a combination of cash and common stock with respect to the conversion value upon conversion. | ||
If conversion occurs in connection with a “fundamental change” as defined in the notes indenture, the Company may be required to repurchase the notes for cash at a price equal to the principal amount plus accrued but unpaid interest. | ||
If conversion occurs in connection with certain changes in control, the Company may be required to deliver additional shares of the Company’s common stock (a “make whole” premium) by increasing the conversion rate with respect to such notes. | ||
Share issuable upon conversion | The Company may issue additional shares up to 11,686,075 under almost all conditions and up to 14,315,419 under the “make-whole” premium | |
Guarantee | None | |
(1) | In the event of a “fundamental change” or exceeding the aforementioned average pricing thresholds, the Company would be required to classify the amount outstanding as a current liability. |
116
Revolving Credit Facility
On July 21, 2011, the Company entered into a $400 million Revolving Credit Facility, which was first amended in 2012 to increase the facility size to $700 million and then subsequently amended and restated on September 6, 2013 and further amended on October 22, 2013, May 20, 2014, September 23, 2014, October 28, 2014 and February 9, 2016, to, among other things, increase the Revolving Credit Facility to $1.0 billion. The Revolving Credit Facility was subsequently amended effective November 15, 2016 to decrease the facility size to $700 million, $441 million of which may be borrowed by the U.S. borrower, $210 million of which may be borrowed by the European borrowers and $49 million of which may be borrowed by the Canadian borrower. The Revolving Credit Facility was subsequently amended and restated on May 22, 2017 to, among other things, extend the maturity date to May 22, 2022. The Revolving Credit Facility contains restrictions including limitations on, among other things, distributions and dividends, acquisitions and investments, indebtedness, liens and affiliate transactions. The Revolving Credit Facility provides the Company with financial flexibility such that restrictions in the Revolving Credit Facility generally only apply in the event that undrawn availability under the Revolving Credit Facility falls below certain specific thresholds.
The Revolving Credit Facility has a maturity date of May 22, 2022. The commitment amount under the Revolving Credit Facility may be increased by an additional $250 million, subject to certain conditions and approvals as set forth in the Revolving Credit Facility. The Revolving Credit Facility requires maintenance of a minimum fixed charge coverage ratio of 1.00 to 1.00 if availability under the Revolving Credit Facility is less than $70 million or 10% of the then existing aggregate lender commitment under the Revolving Credit Facility. As of December 31, 2017, the availability under the Revolving Credit Facility is greater than $70 million. The fair value of the Revolving Credit Facility approximates the carrying value based on Level 2 inputs based on the short-term and asset-based nature of the Revolving Credit Facility and the related variable interest rate.
Indebtedness under the Revolving Credit Facility is secured by: (a) for US borrowings under the facility, a first priority security interest in certain tangible and intangible property and assets of certain of the Company’s U.S. subsidiaries, and (b) for Canadian and European borrowings under the facility, a first priority security interest in certain tangible and intangible property and assets of certain of the Company’s Canadian subsidiaries and European subsidiaries. In addition, the lenders under the Revolving Credit Facility have received a pledge of (i) 100% of the equity interests in certain of the Company’s domestic, Canadian and European subsidiaries, and (ii) 65% of the voting equity interests in and 100% of the non-voting equity interests in each material foreign subsidiary directly owned by a U.S. Loan Party.
Borrowings under the Revolving Credit Facility bear interest at an interest rate base elected by the Company plus an applicable margin calculated quarterly. The Revolving Credit Facility also requires the payment of a commitment fee equal to the available but unused commitments multiplied by an applicable margin of either 0.25% or 0.375% based on the average daily unused commitments.
The Company's Revolving Credit Facility is summarized in the table below:
Revolving Credit Facility | ||||||||
(in millions) | Dec 31, 2017 | Dec 31, 2016 | ||||||
Outstanding borrowings | $ | 259.5 | $ | 75.9 | ||||
Total credit under facility | 700.0 | 700.0 | ||||||
Undrawn availability | 326.2 | 399.0 | ||||||
Interest rate | 2.8 | % | 2.5 | % | ||||
Outstanding letters of credit | $ | 24.6 | $ | 21.7 | ||||
Original issuance | July 2011 | |||||||
Maturity date | May 2022 | |||||||
117
Latin America Credit Facilities
The Company’s Latin America credit facilities are summarized in the table below:
(in millions) | Dec 31, 2017 | Dec 31, 2016 | ||||||
Outstanding borrowings | $ | 44.6 | $ | 82.4 | ||||
Undrawn availability | 42.9 | 38.2 | ||||||
Interest rate — weighted average | 7.8 | % | 11.0 | % | ||||
Maturity date | Various | |||||||
The Company’s Latin America credit facilities are primarily short term loans utilized for working capital purposes. The fair value of the Latin America credit facilities approximates the carrying value due to the short term nature ($44.5 million is short-term) and variable interest rates of the facilities based on Level 2 inputs.
12. Financial Instruments
The Company is exposed to various market risks, including changes in foreign currency exchange rates and raw material (commodity) prices. To manage risks associated with the volatility of these natural business exposures, the Company enters into commodity and foreign currency derivative agreements, as well as copper and aluminum forward pricing agreements. The Company does not purchase or sell derivative instruments for trading purposes. The Company does not engage in derivative contracts for which a lack of marketplace quotations would necessitate the use of fair value estimation techniques.
The Company enters into commodity instruments to hedge the purchase of copper, aluminum and lead in future periods and foreign currency exchange contracts principally to hedge the currency fluctuations in certain transactions denominated in foreign currencies, thereby limiting the Company's risk that would otherwise result from changes in exchange rates. Principal transactions hedged during the year were firm sales and purchase commitments. The fair value of foreign currency contracts represents the amount required to enter into offsetting contracts with similar remaining maturities based on quoted market prices.
The Company accounts for these commodity instruments and foreign currency exchange contracts as economic hedges. Changes in the fair value of economic hedges are recognized in current period earnings in Other income (expense).
Fair Value of Derivatives Instruments
The notional amounts and fair values of derivatives not designated as cash flow hedges at December 31, 2017 and 2016 are shown below (in millions).
December 31, 2017 | December 31, 2016 | |||||||||||||||||||||||
Notional | Fair Value | Notional | Fair Value | |||||||||||||||||||||
(in millions) | Amount | Asset (1) | Liability (2) | Amount | Asset (1) | Liability (2) | ||||||||||||||||||
Derivatives not designated as cash flow hedges: | ||||||||||||||||||||||||
Commodity futures | $ | 106.1 | $ | 26.1 | $ | 0.1 | $ | 142.5 | $ | 9.2 | $ | 1.8 | ||||||||||||
Foreign currency exchange | 105.5 | 1.3 | 0.7 | 30.7 | 0.1 | 1.1 | ||||||||||||||||||
$ | 27.4 | $ | 0.8 | $ | 9.3 | $ | 2.9 | |||||||||||||||||
(1) | Balance recorded in “Prepaid expenses and other” and “Other non-current assets” |
(2) | Balance recorded in “Accrued liabilities” and “Other liabilities” |
As of December 31, 2017 and 2016, all financial instruments held by the Company were subject to enforceable master netting arrangements held by various financial institutions. In general, the terms of our agreements provide that in the event of an early termination the counterparties have the right to offset amounts owed or owing under that and any other agreement with the same counterparty. The Company's accounting policy is to not offset these positions in the Consolidated Balance Sheets. As of December 31, 2017 and 2016, the net positions of the enforceable master netting agreements are not significantly different from the gross positions noted in the table above. Depending on the extent of an unrealized loss position on a derivative contract held by the Company, certain counterparties may require collateral to secure the Company's derivative contract position. As of December 31, 2017 and 2016, there were no contracts held by the Company that required collateral to secure the Company’s derivative liability positions.
118
13. Income Taxes
For financial reporting purposes, income before income taxes includes the following components (in millions):
Year Ended | |||||||||||
Dec 31, 2017 | Dec 31, 2016 | Dec 31, 2015 | |||||||||
United States | $ | (32.0 | ) | $ | (72.4 | ) | $ | (30.2 | ) | ||
Foreign | (6.9 | ) | (25.7 | ) | (120.9 | ) | |||||
Total | $ | (38.9 | ) | $ | (98.1 | ) | $ | (151.1 | ) | ||
The provision (benefit) for income taxes consisted of the following (in millions):
Year Ended | |||||||||||
Dec 31, 2017 | Dec 31, 2016 | Dec 31, 2015 | |||||||||
Current tax expense (benefit): | |||||||||||
Federal | $ | 0.7 | $ | 0.6 | $ | (0.2 | ) | ||||
State | (0.9 | ) | (0.2 | ) | (1.1 | ) | |||||
Foreign | 28.1 | 18.6 | 10.9 | ||||||||
Deferred tax expense (benefit): | |||||||||||
Federal | (13.5 | ) | (26.9 | ) | (20.1 | ) | |||||
State | 3.8 | (1.0 | ) | (0.5 | ) | ||||||
Foreign | (2.4 | ) | 5.2 | (3.8 | ) | ||||||
Total | $ | 15.8 | $ | (3.7 | ) | $ | (14.8 | ) | |||
The reconciliation of reported income tax expense (benefit) to the amount of income tax expense that would result from applying domestic federal statutory tax rates to pretax income is as follows (in millions):
Year Ended | |||||||||||
Dec 31, 2017 | Dec 31, 2016 | Dec 31, 2015 | |||||||||
Income tax expense (benefit) at Federal statutory tax rate | $ | (13.6 | ) | $ | (34.3 | ) | $ | (52.9 | ) | ||
Foreign tax rate differential | 6.2 | 2.5 | 13.2 | ||||||||
U.S. tax reform | (16.2 | ) | — | — | |||||||
Permanent difference | 5.6 | 1.5 | 2.8 | ||||||||
Impact of divestitures and liquidations (net of valuation allowances) | 16.4 | (9.0 | ) | (14.2 | ) | ||||||
Change in uncertain tax positions | 3.7 | 9.0 | (8.8 | ) | |||||||
Withholding tax and surcharges | 3.5 | 3.0 | 4.3 | ||||||||
Change in valuation allowance | 6.6 | 26.8 | 39.0 | ||||||||
Other (net) | 3.6 | (3.2 | ) | 1.8 | |||||||
Total | $ | 15.8 | $ | (3.7 | ) | $ | (14.8 | ) | |||
On December 22, 2017, the Tax Reform Act was signed into law. The Tax Reform Act makes comprehensive and complex changes to the U.S. tax law, including but not limited to the following provisions that may have a significant current or future impact on the Company’s tax position: 1) one-time deemed taxable repatriation of the accumulated earnings and profits of foreign subsidiaries as of December 31, 2017; 2) reduction of the federal corporate income tax rate from 35% to 21%; 3) bonus depreciation that will allow for full expensing of qualified fixed assets in the year of acquisition; 4) a new provision designed to effectively impose a minimum tax on certain foreign earnings (commonly referred to as “GILTI”); 5) a new percentage of taxable income limitation on the deductibility of interest expense; 6) adoption of a territorial-type tax system that would generally eliminate U.S. federal income tax on dividends from foreign subsidiaries; 7) repeal of the alternative minimum tax (“AMT”) and related provision enabling the refund of existing AMT credits; 8) creation of a new base erosion tax (“BEAT”) for certain payments made to non-U.S. affiliates; and 9) limitation on the use of net operating losses generated after December 31, 2017 to 80% of taxable income and allowance of an indefinite carry forward period for such net operating losses.
The SEC issued Staff Accounting Bulletin ("SAB") 118, which provides guidance on accounting for the tax effects of the Tax Reform Act. In recognition of the inherent complexities associated with the ASC 740 tax accounting for the Tax Reform Act, SAB
119
118 provides a measurement period of up to one year from enactment for companies to complete the ASC 740 tax accounting. Although the accounting for the tax effects of the Tax Reform Act are not yet complete, the Company was able to make reasonable estimates of the significant tax effects. Therefore, in accordance with SAB 118, the Company’s consolidated financial statements for the year ended December 31, 2017 reflect provisional estimates of the tax effects of the deemed repatriation of accumulated earnings and profits of foreign subsidiaries as well as the federal tax rate reduction. Although other provisions of the Tax Reform Act could potentially have a significant impact on the future tax position of the Company, they did not have a material impact on the consolidated financial statements for the year ended December 31, 2017. The Company has elected to account for the GILTI tax in the period in which any tax is incurred and, therefore, has not recorded any deferred tax impacts in the consolidated financial statements for the year ended December 31, 2017.
The Company’s provisional estimate of the tax effect of the Tax Reform Act for the year ended December 31, 2017 is a net deferred tax benefit of approximately $16 million, which consists of approximately $46 million of deferred tax expense attributable to the deemed repatriation of off-shore accumulated earnings and profits, and approximately $62 million of deferred tax benefit attributable to the U.S. tax rate reduction. In order to finalize the ASC 740 tax accounting for the deemed repatriation of foreign earnings and profits, the Company will need to gather additional information and complete a detailed analysis of the following: 1) its pro rata share of post-1986 earnings and profits of relevant foreign subsidiaries; 2) the amount of non-U.S. income taxes paid with respect to such post-1986 earnings and profits; 3) its cash and liquid asset position at relevant dates; and 4) complex foreign tax credit computations to determine whether it may be beneficial to elect to claim foreign tax credits in lieu of offsetting the deemed repatriation income with net operating losses. In order to finalize the ASC 740 tax accounting for the tax rate reduction, the Company will need to complete the analysis of the tax effect of the deemed repatriation of foreign earnings and profits. In addition, the provisional estimate of the tax effects of the Tax Reform Act could be modified by changes in assumptions or interpretations, additional guidance that may be issued by the Internal Revenue Service, Treasury Department or state tax authorities, or actions we may take. The ASC 740 tax accounting will be completed within the one year period allowed under SAB 118.
As a result of the Tax Reform Act, the Company’s provisional estimate is that approximately $296 million of accumulated foreign earnings and profits were deemed to be distributed to the U.S. This deemed repatriation did not alter the Company’s intent or ability to reinvest or redeploy off-shore earnings indefinitely.
The components of deferred tax assets and liabilities were as follows (in millions):
Dec 31, 2017 | Dec 31, 2016 | ||||||
Deferred tax assets: | |||||||
Net operating loss carryforwards | $ | 202.3 | $ | 238.7 | |||
Pension and retiree benefits accruals | 25.0 | 33.5 | |||||
Inventory | 7.5 | 9.4 | |||||
Depreciation and fixed assets | 4.4 | 11.7 | |||||
Intangibles | 1.6 | 3.3 | |||||
Tax credit carryforwards | 10.9 | 10.3 | |||||
Equity compensation | 6.8 | 16.2 | |||||
Other | 27.3 | 53.3 | |||||
Valuation allowance | (157.4 | ) | (177.1 | ) | |||
Total deferred tax assets | 128.4 | 199.3 | |||||
Deferred tax liabilities: | |||||||
Convertible debt discount | 178.1 | 247.0 | |||||
Inventory | 1.2 | 2.4 | |||||
Depreciation and fixed assets | 21.8 | 25.7 | |||||
Intangibles | 3.9 | 4.9 | |||||
Other | 24.1 | 25.6 | |||||
Total deferred tax liabilities | 229.1 | 305.6 | |||||
Net deferred tax assets (liabilities) | $ | (100.7 | ) | $ | (106.3 | ) | |
The valuation of deferred tax assets is dependent on, among other things, the ability of the Company to generate a sufficient level of future taxable income in relevant taxing jurisdictions. In estimating future taxable income, the Company has considered both positive and negative evidence and has considered the implementation of prudent and feasible tax planning strategies. The Company has and will continue to review on a quarterly basis its assumptions and tax planning strategies and, if the amount of the estimated realizable net deferred tax asset is less than the amount currently on the balance sheet, the Company will reduce its deferred tax asset, recognizing a non-cash charge against reported earnings.
120
As of December 31, 2017, the Company has recorded approximately $157.4 million of valuation allowance to adjust deferred tax assets to the amount judged more likely than not to be realized. The valuation allowance is primarily attributable to certain foreign temporary differences and tax loss and tax credit carryforwards due to uncertainties regarding the ability to obtain future tax benefits for these tax attributes.
As of December 31, 2017, the Company has recognized deferred tax assets of approximately $62.8 million for gross tax loss carryforwards in various taxing jurisdictions as follows (in millions):
Tax Loss | ||||||
Jurisdiction | Carryforward | Expiration | ||||
United States | $ | 229.2 | 2033-2036 | |||
France | 7.3 | Indefinite | ||||
Others | 1.7 | Various | ||||
Total | $ | 238.2 | ||||
The Company also has various foreign subsidiaries with approximately $535 million of tax loss carryforwards in various jurisdictions that are subject to a valuation allowance due to statutory limitations on utilization, uncertainty of future profitability, and other relevant factors.
During 2017, after weighing all positive and negative evidence but primarily based on the wind down and substantially complete liquidation of the New Zealand business units, a valuation allowance was recorded against $5.7 million of beginning of year net deferred tax assets in New Zealand. Various other business units maintained full deferred tax asset valuation allowances that had been established in prior years. Also during 2017, after weighing all positive and negative evidence including a three-year cumulative income position and expectations of future profitability, the valuation allowance against the Colombian entity's deferred tax assets was released, resulting in a $1.6 million tax benefit. During 2017, many of these valuation allowances significantly increased or decreased in various jurisdictions as a result of deferred tax asset increases or decreases due to earnings, losses, cumulative translation adjustment, and divestitures.
In general, it is the practice and intention of the Company to permanently reinvest the earnings of its non-U.S. subsidiaries in those operations. As such, historically, the Company has not provided for deferred income taxes on the excess of financial reporting over tax basis in investments in foreign subsidiaries. These basis differences could become taxable upon the repatriation of assets from the foreign subsidiaries or upon a sale or liquidation of the foreign subsidiaries.
In the second quarter of 2016, the Company conducted a review of the cash position and forecasted cash needs of certain Central American distributor entities. The Company had historically asserted that the earnings of these entities would be indefinitely reinvested. As a result of this review and after taking into account financial and geopolitical risks, the Company reassessed the situation and decided to repatriate the earnings of these Central American distributor entities in the near future. In 2017, the Company recorded a $1.2 million tax benefit associated with changes in financial reporting basis and the impact of the deemed repatriation of foreign earnings and profits under the Tax Reform Act, and as of December 31, 2017 has recorded a deferred tax liability of $1.1 million related to foreign taxes that would result from repatriation back to the U.S.
No deferred taxes have been recorded on the temporary difference associated with the excess of financial reporting over tax basis in investments in foreign subsidiaries outside of the above mentioned Central American distributor entities. The Company remains committed to permanently reinvesting these earnings and does not see a need to repatriate cash to fund operations, including investing and financing activities, in the foreseeable future. The determination of the additional income taxes that would be incurred upon repatriation of assets or disposition of such foreign subsidiaries is not practical due to the complexities, variables, and assumptions inherent in the hypothetical calculation.
The Company applies ASC 740 in determining unrecognized tax benefits. ASC 740 prescribes a recognition threshold that a tax position is required to meet before being recognized in the financial statements and provides guidance on derecognition, measurement, classification, interest and penalties, accounting in interim periods and disclosures.
121
The following is a tabular reconciliation of the total amounts of unrecognized tax benefits for the year:
(in millions) | Dec 31, 2017 | Dec 31, 2016 | Dec 31, 2015 | |||||||||
Unrecognized Tax Benefit — Beginning balance | $ | 33.4 | $ | 25.1 | $ | 31.9 | ||||||
Gross Increases — Tax Positions in Prior Period | 10.7 | 1.6 | 2.1 | |||||||||
Gross Decreases — Tax Positions in Prior Period | (3.8 | ) | (0.4 | ) | (0.6 | ) | ||||||
Gross Increases — Tax Positions in Current Period | 1.0 | 11.1 | 2.6 | |||||||||
Dispositions | — | — | (2.2 | ) | ||||||||
Settlements | — | (0.4 | ) | — | ||||||||
Lapse of Statute of Limitations | (2.7 | ) | (3.3 | ) | (5.3 | ) | ||||||
Impact of U.S. Tax Reform Tax Rate Reduction | (10.1 | ) | — | — | ||||||||
Foreign Currency Translation | 0.1 | (0.3 | ) | (3.4 | ) | |||||||
Unrecognized Tax Benefit — Ending Balance | $ | 28.6 | $ | 33.4 | $ | 25.1 | ||||||
Included in the balance of unrecognized tax benefits at December 31, 2017, 2016 and 2015 are $25.9 million, $31.0 million and $22.7 million, respectively, of tax benefits that, if recognized, would affect the effective tax rate.
The Company recognizes interest and penalties related to unrecognized tax benefits as income tax expense. Related to the unrecognized tax benefits noted above, the Company accrued penalties of $(0.3) million and interest of $(0.7) million during 2017 and in total, as of December 31, 2017, has recognized a liability for penalties of $1.5 million and interest of $2.2 million. During 2016 and 2015, the Company accrued penalties of $0.3 million and $(1.4) million, respectively, and interest of $0.3 million and $(3.0) million, respectively, and in total, as of December 31, 2016 and 2015, had recognized liabilities for penalties of $1.8 million and interest of $2.9 million and $3.5 million, respectively.
The Company files income tax returns in numerous tax jurisdictions around the world. Due to uncertainties regarding the timing and outcome of various tax audits, appeals and settlements, it is difficult to reliably estimate the amount of unrecognized tax benefits that could change within the next twelve months. The Company believes it is reasonably possible that approximately $2 million of unrecognized tax benefits could change within the next twelve months due to the resolution of tax audits and statute of limitations expirations.
The Internal Revenue Service (“IRS”) proposed cumulative taxable income adjustments of approximately $50 million for the 2012-2013 tax years in February 2016. The proposed adjustments related to the Original Issue Discount (“OID”) yield claimed on the Company’s $429.5 million Subordinated Convertible Notes (“Notes”). The Company believed that the amount of the OID deductions claimed on its federal income tax returns since the 2009 issuance of the Notes was proper and appealed the IRS audit adjustment. In March 2017, the IRS Appeals Office ruled in favor of the Company and the audit was closed with no adjustment to reported income or tax. The IRS is currently in the process of auditing the Company’s 2015 federal income tax return. With limited exceptions, tax years prior to 2013 are no longer open in major foreign, state, or local tax jurisdictions.
122
14. Employee Benefit Plans
General Cable provides retirement benefits through contributory and noncontributory qualified and non-qualified defined benefit pension plans covering eligible domestic and international employees as well as through defined contribution plans and other postretirement benefits.
Defined Benefit Pension Plans
The changes in the benefit obligation and plan assets, the funded status of the plans and the amounts recognized in the Consolidated Balance Sheets are as follows (in millions):
U.S. Plans | Non-U.S. Plans | ||||||||||||||
Dec 31, 2017 | Dec 31, 2016 | Dec 31, 2017 | Dec 31, 2016 | ||||||||||||
Changes in Benefit Obligation: | |||||||||||||||
Beginning benefit obligation | $ | 151.6 | $ | 175.0 | $ | 130.7 | $ | 115.8 | |||||||
Foreign currency exchange rate changes and other | — | — | 14.7 | 8.5 | |||||||||||
Transfers | — | — | (3.0 | ) | — | ||||||||||
Service cost | 0.7 | 1.4 | 3.9 | 4.2 | |||||||||||
Interest cost | 4.4 | 7.3 | 3.0 | 3.7 | |||||||||||
Curtailment (gain) loss | — | — | (0.1 | ) | (0.8 | ) | |||||||||
Settlements | — | (19.3 | ) | — | — | ||||||||||
Benefits paid | (13.0 | ) | (9.8 | ) | (5.2 | ) | (7.1 | ) | |||||||
Employee contributions | — | — | 0.4 | 0.4 | |||||||||||
Amendments / Change in assumptions | — | — | 3.7 | (1.3 | ) | ||||||||||
Actuarial (gain) loss | 7.0 | (3.0 | ) | (0.5 | ) | 7.3 | |||||||||
Ending benefit obligation | $ | 150.7 | $ | 151.6 | $ | 147.6 | $ | 130.7 | |||||||
Changes in Plan Assets: | |||||||||||||||
Beginning fair value of plan assets | $ | 112.4 | $ | 132.1 | $ | 52.5 | $ | 37.7 | |||||||
Foreign currency exchange rate changes and other | — | — | 4.5 | 10.1 | |||||||||||
Employee contributions | — | — | 0.4 | 0.4 | |||||||||||
Actual return on plan assets | 15.3 | 6.2 | 5.1 | 5.1 | |||||||||||
Company contributions | 2.1 | 3.2 | 4.7 | 6.3 | |||||||||||
Settlements | — | (19.3 | ) | — | — | ||||||||||
Benefits paid | (13.0 | ) | (9.8 | ) | (5.2 | ) | (7.1 | ) | |||||||
Ending fair value of plan assets | $ | 116.8 | $ | 112.4 | $ | 62.0 | $ | 52.5 | |||||||
Funded status at end of year | $ | (33.9 | ) | $ | (39.2 | ) | $ | (85.6 | ) | $ | (78.2 | ) | |||
Amounts Recognized in Consolidated Balance Sheets: | |||||||||||||||
Other Assets | $ | — | $ | — | $ | 1.0 | $ | 1.7 | |||||||
Accrued liabilities | $ | (0.3 | ) | $ | (0.3 | ) | $ | (2.7 | ) | $ | (2.3 | ) | |||
Other liabilities | $ | (33.6 | ) | $ | (38.9 | ) | $ | (83.9 | ) | $ | (77.6 | ) | |||
Recognized in Accumulated Other Comprehensive Income: | |||||||||||||||
Net actuarial loss | $ | 55.6 | $ | 58.9 | $ | 29.4 | $ | 26.9 | |||||||
Prior service cost | (0.2 | ) | (0.2 | ) | — | 1.2 | |||||||||
$ | 55.4 | $ | 58.7 | $ | 29.4 | $ | 28.1 | ||||||||
123
The accumulated benefit obligation for U.S. defined benefit retirement pension plans was $150.0 million and $150.8 million for 2017 and 2016, respectively. The accumulated benefit obligation for Non-U.S. defined benefit retirement pension plans was $140.2 million and $123.3 million for 2017 and 2016, respectively. Pension plans with accumulated benefit obligations in excess of plan assets consist of the following (in millions):
U.S. Plans | Non-U.S. Plans | ||||||||||||||
Dec 31, 2017 | Dec 31, 2016 | Dec 31, 2017 | Dec 31, 2016 | ||||||||||||
Projected benefit obligation | $ | 150.7 | $ | 151.6 | $ | 94.0 | $ | 102.4 | |||||||
Accumulated benefit obligation | 150.0 | 150.8 | 90.7 | 97.2 | |||||||||||
Fair value of the plan assets | 116.8 | 112.4 | 10.4 | 41.5 | |||||||||||
Pension expense included the following components (in millions):
U.S. Plans Year ended | Non-U.S. Plans Year ended | ||||||||||||||||||||||
Dec 31, 2017 | Dec 31, 2016 | Dec 31, 2015 | Dec 31, 2017 | Dec 31, 2016 | Dec 31, 2015 | ||||||||||||||||||
Pension expense: | |||||||||||||||||||||||
Service cost | $ | 0.7 | $ | 1.4 | $ | 1.5 | $ | 3.9 | $ | 4.2 | $ | 4.9 | |||||||||||
Interest cost | 4.4 | 7.3 | 7.3 | 3.0 | 3.7 | 3.6 | |||||||||||||||||
Expected return on plan assets | (7.7 | ) | (9.2 | ) | (10.2 | ) | (2.9 | ) | (2.9 | ) | (2.4 | ) | |||||||||||
Amortization of prior service cost | — | — | — | 0.4 | 0.7 | 0.7 | |||||||||||||||||
Amortization of net loss | 2.6 | 2.5 | 7.7 | 1.6 | 1.3 | 1.7 | |||||||||||||||||
Amortization of transition obligation | — | — | — | — | — | 0.1 | |||||||||||||||||
Curtailment (gain) loss | — | — | — | 0.1 | (0.2 | ) | — | ||||||||||||||||
Settlement loss | — | 7.4 | — | — | — | 0.9 | |||||||||||||||||
Net pension expense | $ | — | $ | 9.4 | $ | 6.3 | $ | 6.1 | $ | 6.8 | $ | 9.5 | |||||||||||
The estimated net loss for the defined benefit pension plans that will be amortized from accumulated other comprehensive income into net pension expense over the next fiscal year is $3.9 million. The prior service cost to be amortized from accumulated other comprehensive income into net pension expense over the next fiscal year is $0.2 million.
In 2016, the Company offered a one-time lump sum payment option to deferred vested participants in the U.S. defined benefit pension plan. Lump sum payments were approximately $19.3 million in 2016, which exceeded the settlement threshold, and the Company recorded a pre-tax non-cash settlement loss of approximately $7.4 million for the year ended December 31, 2016.
In 2015, the Company recorded a pre-tax non-cash settlement loss of $0.9 million for the termination of pension plans related to the closure of one North America manufacturing plant.
The Company evaluates its actuarial assumptions at least annually, and adjusts them as necessary. The Company uses a measurement date of December 31 for all of its defined benefit pension plans. The weighted average assumptions used in determining benefit obligations were:
U.S. Plans | Non-U.S. Plans | ||||||||||
Dec 31, 2017 | Dec 31, 2016 | Dec 31, 2017 | Dec 31, 2016 | ||||||||
Discount rate | 3.50 | % | 4.01 | % | 2.30 | % | 2.55 | % | |||
Expected rate of increase in future compensation levels | 2.50 | % | 2.50 | % | 2.70 | % | 2.88 | % | |||
124
The weighted average assumptions used to determine net pension expense were:
U.S. Plans | Non-U.S. Plans | ||||||||||||||||
Dec 31, 2017 | Dec 31, 2016 | Dec 31, 2015 | Dec 31, 2017 | Dec 31, 2016 | Dec 31, 2015 | ||||||||||||
Discount rate | 3.87 | % | 4.30 | % | 4.00 | % | 2.92 | % | 3.18 | % | 3.18 | % | |||||
Expected rate of increase in future compensation levels | 2.50 | % | 2.50 | % | 2.50 | % | 3.08 | % | 3.46 | % | 3.78 | % | |||||
Long-term expected rate of return on plan assets | 7.25 | % | 7.50 | % | 7.50 | % | 5.88 | % | 6.30 | % | 6.36 | % | |||||
Pension expense for the defined benefit pension plans sponsored by General Cable is determined based principally upon certain actuarial assumptions, including the discount rate and the expected long-term rate of return on assets. The discount rates for the U.S. defined benefit pension plans were determined based on hypothetical yield curves developed using yields of corporate bonds across the full maturity spectrum of the projected pension benefit obligations and based on information received from actuaries. The included bonds are AA-rated (or equivalent quality) by a recognized rating agency. Non-U.S. defined benefit pension plans followed a similar evaluation process based on financial markets in those countries where General Cable provides a defined benefit pension plan.
The weighted-average long-term expected rate of return on assets is based on input from actuaries, including their review of historical 10-year, 20-year, and 25-year rates of inflation and real rates of return on various broad equity and bond indices in conjunction with the diversification of the asset portfolio. The Company’s overall investment strategy is to diversify its investments for the qualified U.S. defined benefit pension plan based on an asset allocation assumption of 65% allocated to equity investments, with an expected real rate of return of 6%, and 35% to fixed-income investments, with an expected real rate of return of 2%, and an assumed long-term rate of inflation of 3%. Equity investments primarily include investments in large-cap and mid-cap companies primarily located in the United States. The actual asset allocations were 76% of equity investments and 24% of fixed-income investments at December 31, 2017 and 64% of equity investments and 36% of fixed-income investments at December 31, 2016. Approximately 15% and 30% of plan assets were concentrated in two mutual funds as of December 31, 2017 and 2016, respectively. The expected long-term rate of return on assets for qualified non-U.S. defined benefit plans is based on a weighted-average asset allocation assumption of 50% allocated to equity investments and 50% to fixed-income investments. The actual weighted-average asset allocations were 48% of equity investments and 52% of fixed-income investments at December 31, 2017 and 2016. Management believes that long-term asset allocations on average and by location will approximate the Company’s assumptions and that the long-term rate of return used by each country that is included in the weighted-average long-term expected rate of return on assets is a reasonable assumption.
The Company determined the fair market values of the pension plan assets based on the fair value hierarchy established in ASC 820. The standard describes three levels of inputs that may be used to measure fair values which are provided in Note 2 - Summary of Significant Accounting Policies. The fair value of Level 1 assets are based on quoted market prices in active markets. The fair value of Level 2 assets are determined using a market approach and inputs that are primarily directly or indirectly observable. The fair value of the Company’s pension plan assets at December 31, 2017 by asset category are as follows (in millions):
Quoted prices in Active Markets for Identical | Significant Observable | Significant Unobservable | ||||||||||||||
Asset Category | Total | Assets (Level 1) | Inputs (Level 2) | Inputs (Level 3) | ||||||||||||
Equity Securities | $ | 29.2 | $ | 29.2 | $ | — | $ | — | ||||||||
Equity Securities at NAV (1) | 29.6 | — | — | — | ||||||||||||
Mutual Funds - Equity Securities | 59.0 | 59.0 | — | — | ||||||||||||
Mutual Funds - Fixed Income | 17.9 | 17.9 | — | — | ||||||||||||
Bond Funds - Fixed Income at NAV (1) | 20.1 | — | — | — | ||||||||||||
Equitable Contract | 12.3 | — | 12.3 | — | ||||||||||||
Equitable Contract at NAV (1) | 0.7 | — | — | — | ||||||||||||
Coal Lease (2) | 2.8 | — | — | 2.8 | ||||||||||||
Cash and cash equivalents | 7.2 | 7.2 | — | — | ||||||||||||
Total | $ | 178.8 | $ | 113.3 | $ | 12.3 | $ | 2.8 | ||||||||
125
The fair value of the Company’s pension plan assets at December 31, 2016 by asset category are as follows (in millions):
Quoted prices in Active Markets for Identical | Significant Observable | Significant Unobservable | ||||||||||||||
Asset Category | Total | Assets (Level 1) | Inputs (Level 2) | Inputs (Level 3) | ||||||||||||
Equity Securities | $ | 35.9 | $ | 35.9 | $ | — | $ | — | ||||||||
Equity Securities at NAV (1) | 25.0 | — | — | — | ||||||||||||
Mutual Funds - Equity Securities | 35.8 | 35.8 | — | — | ||||||||||||
Mutual Funds - Fixed Income | 33.6 | 33.6 | — | — | ||||||||||||
Bond Funds - Fixed Income at NAV (1) | 16.5 | — | — | — | ||||||||||||
Equitable Contract | 11.0 | — | 11.0 | — | ||||||||||||
Equitable Contract at NAV (1) | 0.8 | — | — | — | ||||||||||||
Coal Lease (2) | 3.2 | — | — | 3.2 | ||||||||||||
Cash and cash equivalents | 3.1 | 3.1 | — | — | ||||||||||||
Total | $ | 164.9 | $ | 108.4 | $ | 11.0 | $ | 3.2 | ||||||||
(1) | In accordance with ASC 820, investments measured at fair value using the NAV practical expedient are excluded from the fair value hierarchy. |
(2) | The Company’s interest represents approximately 26% of the lease which is currently between American Premier Underwriters (APU), the Lessor and CONSOL Energy (CONSOL), the Lessee. The lease pertains to real property mined by CONSOL located in Pennsylvania. |
The following table represents details of the fair value measurements using significant unobservable inputs (Level 3):
(in millions) | Coal Lease | |||
Beginning balance at January 1, 2016 | $ | 3.5 | ||
Change in fair value of plan assets | (0.3 | ) | ||
Ending balance December 31, 2016 | $ | 3.2 | ||
Change in fair value of plan assets | (0.4 | ) | ||
Ending balance at December 31, 2017 | $ | 2.8 | ||
The determination of pension expense for the qualified defined benefit pension plans is impacted by the fair market value of assets as of the measurement date. Investment gains and losses are recognized in the measurement of assets immediately. Such gains and losses will be amortized and recognized as part of the annual benefit cost to the extent that unrecognized net gains and losses from all sources exceed 10% of the greater of the projected benefit obligation or the market value of assets.
The Company’s expense under both U.S. and non-U.S. defined benefit pension plans is determined using the discount rate as of the beginning of the fiscal year. The 2018 expense for the pension plans will be based on the weighted-average discount rate of approximately 3.50% for U.S. defined benefit pension plans and 2.30% for non-U.S. defined benefit pension plans.
The Company expects to contribute, at least the minimum required, but not more than is tax deductible, $10.7 million to its defined benefit pension plans for 2018. The estimated future benefit payments expected to be paid for the Company’s defined benefit pension plans are $21.5 million in 2018, $18.2 million in 2019, $18.9 million in 2020, $18.9 million in 2021, $18.4 million in 2022 and $89.8 million from 2023 through 2026.
Defined Contribution Plans
Expense under both U.S. and non-U.S. defined contribution plans generally equals up to six percent of each eligible employee’s covered compensation based on the location and status of the employee. The net defined contribution plan expense recognized was $12.1 million, $11.5 million and $12.0 million, respectively, for the years ended December 31, 2017, 2016 and 2015.
126
15. Equity and Accumulated Other Comprehensive Income
General Cable is authorized to issue 200 million shares of common stock and 25 million shares of preferred stock.
The components of accumulated other comprehensive income (loss) as of December 31, 2017 and 2016, respectively, consisted of the following (in millions):
Fiscal Years Ended | |||||||||||||||
December 31, 2017 | December 31, 2016 | ||||||||||||||
Company Common Shareholders | Noncontrolling Interest | Company Common Shareholders | Noncontrolling Interest | ||||||||||||
Foreign currency translation adjustment | $ | (165.3 | ) | $ | (3.0 | ) | $ | (228.2 | ) | $ | (13.0 | ) | |||
Pension adjustments, net of tax | (65.5 | ) | — | (58.2 | ) | (1.3 | ) | ||||||||
Accumulated other comprehensive income (loss) | $ | (230.8 | ) | $ | (3.0 | ) | $ | (286.4 | ) | $ | (14.3 | ) | |||
The following is the detail of the change in the Company's accumulated other comprehensive income (loss) from December 31, 2015 to December 31, 2017 including the effect of significant reclassifications out of accumulated other comprehensive income (in millions, net of tax):
Foreign currency translation | Change of fair value of pension benefit obligation | Total | |||||||||
Balance, December 31, 2015 | $ | (275.6 | ) | $ | (64.6 | ) | $ | (340.2 | ) | ||
Other comprehensive income (loss) before reclassifications | (12.2 | ) | 9.3 | (2.9 | ) | ||||||
Amounts reclassified from accumulated other comprehensive income (loss) | 59.6 | (2.9 | ) | 56.7 | |||||||
Net current - period other comprehensive income (loss) | 47.4 | 6.4 | 53.8 | ||||||||
Balance, December 31, 2016 | $ | (228.2 | ) | $ | (58.2 | ) | $ | (286.4 | ) | ||
Other comprehensive income (loss) before reclassifications | 26.9 | (1.6 | ) | 25.3 | |||||||
Amounts reclassified from accumulated other comprehensive income (loss) | 36.0 | (5.7 | ) | 30.3 | |||||||
Net current - period other comprehensive income (loss) | 62.9 | (7.3 | ) | 55.6 | |||||||
Balance, December 31, 2017 | $ | (165.3 | ) | $ | (65.5 | ) | $ | (230.8 | ) | ||
127
The following is the detail of the reclassifications out of accumulated other comprehensive income (loss) for the year ended December 31, 2017 and 2016 (in millions, net of tax):
Year Ended | Year Ended, | ||||||||
December 31, 2017 | December 31, 2016 | ||||||||
Amount reclassified from accumulated other comprehensive income (loss) | Amount reclassified from accumulated other comprehensive income (loss) | Affected line item in the Consolidated Statement of Operations and Comprehensive Income (Loss) | |||||||
Foreign currency translation | |||||||||
Closure of subsidiaries | $ | 3.3 | $ | 27.8 | SG&A | ||||
Sale of subsidiaries | 32.7 | 31.8 | SG&A | ||||||
Total - foreign currency items | $ | 36.0 | $ | 59.6 | |||||
Defined pension items | |||||||||
Amortization of prior service cost | $ | (0.3 | ) | $ | (0.6 | ) | Cost of sales | ||
Amortization of net loss | (5.0 | ) | (7.0 | ) | Cost of sales | ||||
Settlement loss | — | 4.7 | Cost of sales | ||||||
Sale of subsidiaries | (0.4 | ) | — | SG&A | |||||
Total - pension items | $ | (5.7 | ) | $ | (2.9 | ) | |||
Total | $ | 30.3 | $ | 56.7 | |||||
16. Share-Based Compensation
The Company has various plans that provide for granting options and restricted stock units to certain employees and independent directors of the Company and its subsidiaries. The Company recognizes compensation expense for share-based payments based on the fair value of the awards at the grant date. The table below summarizes compensation expense for the Company’s non-qualified stock options based on the fair value method estimated using the Black-Scholes valuation model, and non-vested stock awards, including restricted stock units, and performance-based non-vested stock units based on the fair value method estimated using the Monte Carlo simulation model and the grant date stock market value for the years ended December 31, 2017, 2016 and 2015. The Company records compensation expense related to non-vested stock awards as a component of the SG&A expenses caption in the Consolidated Statements of Operations and Comprehensive Income (Loss).
Year Ended | |||||||||||
(in millions) | Dec 31, 2017 | Dec 31, 2016 | Dec 31, 2015 | ||||||||
Non-qualified stock option expense | $ | 0.9 | $ | 0.6 | $ | 1.5 | |||||
Stock unit awards | 4.3 | 3.4 | 4.5 | ||||||||
Performance-based non-vested stock awards expense | 5.4 | 1.4 | 6.1 | ||||||||
Total pre-tax share-based compensation expense | $ | 10.6 | $ | 5.4 | $ | 12.1 | |||||
Excess tax benefit (deficiency) on share-based compensation | $ | (0.7 | ) | $ | (5.0 | ) | $ | (1.7 | ) | ||
During the years ended December 31, 2017, 2016 and 2015, cash received from stock option exercises was $10.0 million, $1.2 million and $0.2 million, respectively. The total tax benefit to be realized for tax deductions from these option exercises was $0.5 million for the year ended December 31, 2017 and less than $0.1 million for the years ended December 31, 2016 and December 31, 2015. The $22.4 million and $6.5 million tax deductions for all share-based compensation for the years ended December 31, 2017 and 2016, respectively, includes $(0.7) million and $(5.0) million of excess tax benefits (deficiencies). The 2017, 2016 and 2015 deficiency does not impact cash flow due to the U.S. tax loss carry forward position. The Company has elected the shortcut method to calculate the pool of excess tax benefits available to absorb tax deficiencies recognized subsequent to the adoption of ASC 718.
The Company currently has share-based compensation awards outstanding under the General Cable Corporation 2005 Stock Incentive Plan (“2005 Plan”) and the General Cable Corporation Stock Incentive Plan, as amended and restated, ("Amended Plan"). The Amended Plan is an amendment and restatement of the 2005 Plan and was effective as of May 14, 2015 and subsequently amended and restated as of May 18, 2017. These plans allow the Company to fulfill its incentive award obligations generally by granting nonqualified stock options and nonvested stock awards. New shares are issued when nonqualified stock options are exercised and when non-vested stock awards vest. The Compensation Committee of the Board of Directors will no longer grant
128
any awards under the 2005 Plan but will continue to administer awards which were previously granted under such plan. The Amended Plan authorized a maximum of approximately 9 million shares to be granted. Shares reserved for future grants, including options, under the Amended Plan, approximated 1.9 million at December 31, 2017.
The Amended Plan authorizes the following types of awards to be granted: (i) Nonqualified Stock Options; (ii) Stock Appreciation Rights; (iii) Stock Awards; (iv) Stock Units and (v) Cash Awards, as more fully described in the Amended Plan. Stock awards, stock units and cash awards may constitute performance-based awards. Each award is subject to such terms and conditions consistent with the Amended Plan as determined by the Compensation Committee and as set forth in an award agreement.
Stock Options
All options awarded under the 2005 Plan and the Amended Plan have a term not to exceed 10 years from the grant date. The majority of the options vest ratably over three years of continued employment from the grant date. A summary of stock option activity for the year ended December 31, 2017 is as follows (options in thousands and aggregate intrinsic value in millions):
Weighted Average | Weighted Average Remaining | Aggregate | ||||||||||
Options Outstanding | Exercise Price | Contractual Term | Intrinsic Value | |||||||||
Outstanding as of December 31, 2016 | 1,679.6 | $ | 31.01 | 4.3 years | $ | — | ||||||
Granted | 177.4 | 16.79 | ||||||||||
Exercised | (470.0 | ) | 21.34 | |||||||||
Forfeited or Expired | (271.8 | ) | 39.53 | |||||||||
Outstanding as of December 31, 2017 | 1,115.2 | $ | 30.75 | 5.5 years | $ | 5.6 | ||||||
Exercisable at December 31, 2017 | 832.9 | $ | 35.07 | 4.4 years | $ | 2.3 | ||||||
Options expected to vest in the next twelve months | 172.3 | $ | 18.74 | 8.9 years | $ | 1.9 | ||||||
During the year ended December 31, 2017 there were 177.4 thousand stock options granted and the weighted average grant date fair value of options granted was $16.79. During the year ended December 31, 2016 there were no stock options granted. During the year ended December 31, 2015, there were 352.1 thousand stock options granted and the weighted average grant date fair value of options granted was $19.65. The total intrinsic value of options exercised was $1.9 million during the year ended December 31, 2017 and less than $0.1 million during the years ended December 31, 2016 and 2015. The total fair value of options vested during the years ended December 31, 2017, 2016 and 2015 was $0.7 million, $1.0 million, and $27.7 million, respectively. At December 31, 2017, 2016 and 2015, the total compensation cost related to nonvested options not yet recognized was $1.6 million, $1.3 million and $1.5 million with a weighted average expense recognition period of 1.8 years, 1.6 years and 2.3 years, respectively.
The fair value of each option award is estimated on the date of grant using the Black-Scholes valuation model. The weighted-average assumptions for the stock options granted in the years ended December 31, 2017 and 2015 are as follows (during the year ended December 31, 2016 there were no stock options granted):
Year Ended | ||||||||
Dec 31, 2017 | Dec 31, 2015 | |||||||
Risk-free interest rate (1) | 2.1 | % | 1.4 | % | ||||
Expected dividend yield | 4.3 | % | 3.7 | % | ||||
Expected option life (2) | 6.0 years | 4.0 years | ||||||
Expected stock price volatility (3) | 50.7 | % | 47.2 | % | ||||
Weighted average fair value of options granted | $ | 5.60 | $ | 5.68 | ||||
(1) | Risk-free interest rate — This is the U.S. Treasury rate at the grant date having a term approximately equal to the expected life of the option. An increase in the risk-free interest rate will increase compensation expense. |
(2) | Expected option life — This is the period of time over which the options granted are expected to remain outstanding and is based on historical experience. Options granted have a maximum term of ten years. An increase in expected life will increase compensation expense. |
(3) | Expected stock price volatility — This is a measure of the amount by which a price has fluctuated or is expected to fluctuate. The Company uses actual historical changes in the market value of the Company’s stock to calculate the volatility assumption as it is management’s belief that this is the best indicator of future volatility. An increase in the expected volatility will increase compensation expense. |
129
Additional information regarding options outstanding as of December 31, 2017 is as follows (options in thousands):
Range of Option Prices | Options Outstanding | Weighted Average Exercise Price | Weighted Average Remaining Contractual Life | Options Exercisable | Weighted Average Exercise Price | |||||||||||
$0 -$14 | — | $ | — | 0.0 | — | $ | — | |||||||||
$14 - $28 | 517.0 | 18.74 | 8.0 | 234.7 | 19.65 | |||||||||||
$28 -$42 | 325.0 | 33.01 | 1.2 | 325.0 | 33.01 | |||||||||||
$42 - $56 | 169.0 | 42.87 | 1.0 | 169.0 | 42.87 | |||||||||||
$56 - $70 | 104.2 | 63.64 | 0.1 | 104.2 | 63.64 | |||||||||||
Nonvested Stock
The majority of the nonvested stock and stock unit awards granted under the 2005 Plan and the Amended Plan are in the form of RSUs and PSUs. The Company's RSUs include performance and/or service-based conditions and are restricted as to transferability and salability with these restrictions being removed in equal annual installments over a three-year period following the grant date. The vesting is contingent upon certification that the applicable performance and/or service-based conditions have been achieved, and the performance condition operates on a rolling basis with a catch-up feature for each vesting tranche for RSU's granted in 2015. The Company's PSUs vest upon certification of the achievement of two cumulative three-year performance metrics: relative total shareholder return (“RTSR”) and return on invested capital (“ROIC”).
A summary of all nonvested stock activity for the year ended December 31, 2017, is as follows (shares in thousands):
Shares Outstanding | Weighted Average Grant Date Fair Value | |||||
Balance, December 31, 2016 | 1,438.8 | $ | 13.87 | |||
Granted | 817.5 | 16.83 | ||||
Vested | (875.4 | ) | 17.39 | |||
Forfeited | (233.4 | ) | 11.83 | |||
Balance, December 31, 2017 | 1,147.5 | $ | 13.54 | |||
The fair values of RSUs and PSUs are estimated based on the assumed probable outcome on the date of grant in accordance with ASC 718 - Compensation - Stock Compensation. The probable outcome is assumed to be at the target level attainment. The estimated fair value of the RSUs and the PSUs with the performance condition tied to ROIC are calculated using the closing price per share of the Company's common stock on the grant date. The estimated fair value of the PSUs with the performance condition tied to RTSR are calculated using the simulated fair value per share of the Company's common stock based on the application of a Monte Carlo simulation model.
The weighted-average grant date fair value of all nonvested stock granted, the total fair value (in millions) of all nonvested stock granted, and the fair value (in millions) of all nonvested stock that have vested during each of the past three years is as follows:
Year Ended | |||||||||||
Dec 31, 2017 | Dec 31, 2016 | Dec 31, 2015 | |||||||||
Weighted-average grant date fair value of nonvested shares granted | $ | 16.83 | $ | 7.96 | $ | 15.97 | |||||
Fair value of nonvested shares granted | $ | 13.8 | $ | 9.2 | $ | 15.2 | |||||
Fair value of shares vested | $ | 15.2 | $ | 14.2 | $ | 8.7 | |||||
As of December 31, 2017, there was $7.8 million of total unrecognized compensation cost related to all nonvested stock. The cost is expected to be recognized over a weighted average period of 1.8 years. There is approximately 0.9 million nonvested stock with a weighted average grant price of $10.47 and a fair value of $9.9 million expected to vest in 2018.
130
17. Earnings Per Common Share
The Company applies the treasury stock method of computing basic and diluted earnings per share. Future declarations of dividends and the establishment of future record dates and payment dates are subject to the final determination of our Board of Directors.
A reconciliation of the numerator and denominator of earnings (loss) per common share-basic to earnings (loss) per common share-assuming dilution is as follows (in millions, except per share data):
Year Ended | |||||||||||
Dec 31, 2017 | Dec 31, 2016 | Dec 31, 2015 | |||||||||
Amounts attributable to the Company — basic and diluted: | |||||||||||
Net income (loss) attributable to Company common shareholders | $ | (56.6 | ) | $ | (93.8 | ) | $ | (121.9 | ) | ||
Net income (loss) for EPS computations(1) | $ | (56.6 | ) | $ | (93.8 | ) | $ | (121.9 | ) | ||
Weighted average shares outstanding for basic EPS computation (2,3) | 50.1 | 49.6 | 48.9 | ||||||||
Earnings (loss) per common share attributable to Company common shareholders – basic(3) | $ | (1.13 | ) | $ | (1.89 | ) | $ | (2.49 | ) | ||
Weighted average shares outstanding including nonvested shares | 50.1 | 49.6 | 48.9 | ||||||||
Weighted average shares outstanding for diluted EPS computation (2) | 50.1 | 49.6 | 48.9 | ||||||||
Earnings (loss) per common share attributable to Company common shareholders – assuming dilution | $ | (1.13 | ) | $ | (1.89 | ) | $ | (2.49 | ) | ||
(1) | Numerator |
(2) | Denominator |
(3) | Under the treasury stock method, earnings (loss) per share — basic reflects undistributed earnings per share for both common stock and unvested share-based payment awards (restricted stock). |
As of December 31, 2017, 2016 and 2015, there were approximately 2.6 million, 3.4 million, and 3.6 million shares excluded from the earnings per common share — assuming dilution computation because their impact was anti-dilutive, respectively.
Under ASC 260 - Earnings per Share and ASC 470 and because of the Company’s obligation to settle the par value of the Subordinated Convertible Notes in cash, the Company is not required to include any shares underlying the Subordinated Convertible Notes in its weighted average shares outstanding — assuming dilution until the average stock price per share for the quarter exceeds the $36.75 conversion price of the Subordinated Convertible Notes and only to the extent of the additional shares that the Company may be required to issue in the event that the Company’s conversion obligation exceeds the principal amount of the Subordinated Convertible Notes.
The average stock price threshold conditions had not been met as of December 31, 2017 or December 31, 2016. At any such time in the future the threshold conditions are met, only the number of shares issuable under the “treasury” method of accounting for the share dilution would be included in the Company’s earnings per share — assuming dilution calculation, which is based upon the amount by which the average stock price exceeds the conversion price.
The following table provides examples of how changes in the Company’s stock price would require the inclusion of additional shares in the denominator of the weighted average shares outstanding — assuming dilution calculation for the Subordinated Convertible Notes.
Shares Underlying Subordinated Convertible Notes | Total Treasury Method Incremental Shares (1) | |||||
Share Price | ||||||
$31.00 | 280,970 | 280,970 | ||||
$33.00 | 1,120,585 | 1,120,585 | ||||
$35.00 | 1,864,244 | 1,864,244 | ||||
$37.00 | 2,527,507 | 2,527,507 | ||||
$39.00 | 3,122,743 | 3,122,743 | ||||
(1) | Represents the number of incremental shares that must be included in the calculation of fully diluted shares under GAAP. |
131
18. Segment Information
The Company conducts its operations through four geographic operating and reportable segments — North America, Europe, Latin America, and Africa/Asia Pacific. The Company’s operating and reportable segments align with the structure of the Company’s internal management organization. All four segments engage in the development, design, manufacturing, marketing and distribution of copper, aluminum, and fiber optic communication, construction, electric utility and electrical infrastructure wire and cable products. In addition to the above products, the North America and Latin America segments manufacture and distribute rod mill wire and cable products and the Europe segment engages in turn-key project services for both land and submarine cables.
Net revenues as shown below represent sales to external customers for each segment. Intersegment sales have been eliminated. For the year ended December 31, 2017, intersegment sales were $16.2 million in North America, $6.4 million in Europe and $22.7 million in Latin America. For the year ended December 31, 2016, intersegment sales were $38.0 million in North America, $9.9 million in Europe, $22.9 million in Latin America and $0.2 million in Africa/Asia Pacific. For the year ended December 31, 2015, intersegment sales were $29.8 million in North America, $18.3 million in Europe and $19.5 million in Latin America.
The chief operating decision maker evaluates segment performance and allocates resources based on segment operating income. Summarized financial information for the Company's reportable segments is as follows:
Year Ended | ||||||||||||
(in millions) | Dec 31, 2017 | Dec 31, 2016 | Dec 31, 2015 | |||||||||
Net Sales: | ||||||||||||
North America | $ | 2,218.1 | $ | 2,041.7 | $ | 2,299.3 | ||||||
Europe | 874.5 | 875.7 | 960.2 | |||||||||
Latin America | 677.9 | 655.2 | 726.8 | |||||||||
Africa/Asia Pacific | 66.7 | 285.8 | 528.2 | |||||||||
Total | $ | 3,837.2 | $ | 3,858.4 | $ | 4,514.5 | ||||||
Segment Operating Income (Loss): | ||||||||||||
North America | $ | 68.6 | $ | 62.4 | $ | 84.5 | ||||||
Europe | (12.4 | ) | 2.6 | 6.6 | ||||||||
Latin America | 17.6 | (14.4 | ) | (22.8 | ) | |||||||
Africa/Asia Pacific | (64.5 | ) | (68.9 | ) | (53.8 | ) | ||||||
Total | $ | 9.3 | $ | (18.3 | ) | $ | 14.5 | |||||
Capital Expenditures: | ||||||||||||
North America | $ | 49.7 | $ | 51.3 | $ | 20.9 | ||||||
Europe | 28.6 | 19.8 | 20.7 | |||||||||
Latin America | 6.9 | 12.4 | 11.1 | |||||||||
Africa/Asia Pacific | 0.2 | 0.6 | 8.8 | |||||||||
Total | $ | 85.4 | $ | 84.1 | $ | 61.5 | ||||||
Depreciation Expense: | ||||||||||||
North America | $ | 32.2 | $ | 37.9 | $ | 37.1 | ||||||
Europe | 22.1 | 22.4 | 25.2 | |||||||||
Latin America | 10.7 | 10.7 | 12.6 | |||||||||
Africa/Asia Pacific | 1.0 | 4.8 | 9.2 | |||||||||
Total | $ | 66.0 | $ | 75.8 | $ | 84.1 | ||||||
Total Assets: | ||||||||||||
North America | $ | 988.8 | $ | 950.2 | $ | 986.9 | ||||||
Europe | 729.9 | 624.1 | 632.0 | |||||||||
Latin America | 487.2 | 466.4 | 480.8 | |||||||||
Africa/Asia Pacific | 29.4 | 200.9 | 354.9 | |||||||||
Total | $ | 2,235.3 | $ | 2,241.6 | $ | 2,454.6 | ||||||
132
Revenues by Major Product Lines Revenues to external customers are attributable to sales of electric utility, electrical infrastructure, construction, communications and rod mill wire product lines.
Year Ended | ||||||||||||
(in millions) | Dec 31, 2017 | Dec 31, 2016 | Dec 31, 2015 | |||||||||
Electric Utility | $ | 1,336.2 | $ | 1,357.1 | $ | 1,550.2 | ||||||
Electrical Infrastructure | 976.7 | 989.7 | 1,234.6 | |||||||||
Construction | 855.8 | 820.8 | 962.9 | |||||||||
Communications | 490.8 | 473.8 | 517.0 | |||||||||
Rod Mill Products | 177.7 | 217.0 | 249.8 | |||||||||
Total | $ | 3,837.2 | $ | 3,858.4 | $ | 4,514.5 | ||||||
Geographic Information The following table presents net sales to unaffiliated customers by country of destination for the last three years and long-lived assets by country as of December 31:
Net Sales | Non - Current Assets | |||||||||||||||||||
Year Ended | Year Ended | |||||||||||||||||||
(in millions) | Dec 31, 2017 | Dec 31, 2016 | Dec 31, 2015 | Dec 31, 2017 | Dec 31, 2016 | |||||||||||||||
United States | $ | 1,900.7 | $ | 1,738.4 | $ | 1,914.0 | $ | 240.6 | $ | 242.2 | ||||||||||
Canada | 317.5 | 293.0 | 345.5 | 24.5 | 25.2 | |||||||||||||||
France | 308.1 | 284.4 | 295.2 | 69.0 | 66.8 | |||||||||||||||
Brazil | 251.1 | 222.6 | 247.4 | 74.2 | 61.4 | |||||||||||||||
Spain | 173.5 | 149.2 | 153.5 | 53.9 | 48.1 | |||||||||||||||
Others | 886.3 | 1,170.8 | 1,558.9 | 178.1 | 198.7 | |||||||||||||||
Total | $ | 3,837.2 | $ | 3,858.4 | $ | 4,514.5 | $ | 640.3 | $ | 642.4 | ||||||||||
19. Commitments and Contingencies
Environmental matters
We are subject to a variety of federal, state, local and foreign laws and regulations covering the storage, handling, emission and discharge of materials into the environment, including CERCLA, the Clean Water Act, the Clean Air Act (including the 1990 amendments) and the Resource Conservation and Recovery Act.
Our subsidiaries in the United States have been identified as potentially responsible parties with respect to several sites designated for cleanup under CERCLA or similar state laws, which impose liability for cleanup of certain waste sites and for related natural resource damages without regard to fault or the legality of waste generation or disposal. Persons liable for such costs and damages generally include the site owner or operator and persons that disposed or arranged for the disposal of hazardous substances found at those sites. Although CERCLA imposes joint and several liability on all potentially responsible parties, in application, the potentially responsible parties typically allocate the investigation and cleanup costs based upon, among other things, the volume of waste contributed by each potentially responsible party.
Settlements can often be achieved through negotiations with the appropriate environmental agency or the other potentially responsible parties. Potentially responsible parties that contributed small amounts of waste (typically less than 1% of the waste) are often given the opportunity to settle as “de minimus” parties, resolving their liability for a particular site. We do not own or operate any of the waste sites with respect to which we have been named as a potentially responsible party by the government. Based on our review and other factors, we believe that costs relating to environmental clean-up at these sites will not have a material adverse effect on our results of operations, cash flows or financial position.
As previously disclosed, GK Technologies, Inc. (“GK Tech”) was one of several defendants named in a suit filed by the Housing Authority of the City of Los Angeles (“HACLA”) alleging that GK Tech and others were responsible for environmental contamination at the location of a former steel recycling mill in Los Angeles. As previously disclosed, in January 2017, we, the other defendants and HACLA reached an agreement to settle the matter for $12 million (the “Settlement Payment”), with GK Tech responsible for an immaterial portion of the Settlement Payment. In the first quarter of 2017, we paid GK Tech’s portion of the Settlement Payment, and the Court dismissed the suit, with prejudice.
133
At December 31, 2017 and 2016, we had a total accrued liability of approximately $4.7 million and $5.6 million, respectively, for various environmental-related liabilities to the extent costs are known and can be reasonably estimated as a liability. While it is difficult to estimate future environmental-related liabilities accurately, we do not currently anticipate any material adverse effect on our results of operations, financial position or cash flows as a result of compliance with federal, state, local or foreign environmental laws or regulations or cleanup costs of the sites discussed above.
Asbestos litigation
We have been a defendant in asbestos litigation for the past 29 years. Our subsidiaries have been named as defendants in lawsuits alleging exposure to asbestos in products manufactured by us. As of December 31, 2017, we were a defendant in approximately 247 cases brought in state and federal courts throughout the United States. In the calendar year 2017, 63 asbestos cases were brought against us. In the calendar year 2016, 84 asbestos cases were brought against us. In the last 29 years, we have had no cases proceed to verdict. In many of the cases, we were dismissed as a defendant before trial for lack of product identification. As of December 31, 2017, 51,069 asbestos cases have been dismissed. In the calendar year 2017, 111 asbestos cases were dismissed. As of December 31, 2016, 50,958 cases were dismissed. With regards to the approximately 247 remaining pending cases, we are aggressively defending these cases based upon either lack of product identification as to whether we manufactured asbestos-containing product and/or lack of exposure to asbestos dust from the use of our product.
As of December 31, 2017, plaintiffs have asserted monetary damages in 146 cases. In 44 of these cases, plaintiffs allege only damages in excess of some dollar amount (about $726 thousand per plaintiff); in these cases there are no claims for specific dollar amounts requested as to any defendant. In 100 other cases pending in state and federal district courts, plaintiffs seek approximately $425 million in damages from as many as 50 defendants. In two cases, plaintiffs have asserted damages related to General Cable in the amount of $20 million. In addition, in relation to these 146 cases, there are claims of $271 million in punitive damages from all of the defendants. However, many of the plaintiffs in these cases allege non-malignant injuries. As of December 31, 2017 and 2016, we had accrued, on a gross basis, approximately $1.2 million and $4.4 million, respectively, and as of December 31, 2017 and 2016, had recovered approximately $0.1 million and $0.4 million, respectively, of insurance recoveries for these lawsuits. The net amount of $1.1 million and $4.0 million, as of December 31, 2017 and 2016, respectively, represents our best estimate in order to cover resolution of current asbestos-related claims.
The components of the asbestos litigation reserve are current and future asbestos-related claims. The significant assumptions are: (1) the number of cases per state, (2) an estimate of the judgment per case per state, (3) an estimate of the percentage of cases per state that would make it to trial and (4) the estimated total liability percentage, excluding insurance recoveries, per case judgment. Management's estimates are based on the Company's historical experience with asbestos related claims. The Company's current history of asbestos claims does not provide sufficient and reasonable information to estimate a range of loss for potential future, unasserted asbestos claims because the number and the value of the alleged damages of such claims have not been consistent. As such, the Company does not believe a reasonably possible range can be estimated with respect to asbestos claims that may be filed in the future.
Settlement payments are made, and the asbestos accrual is relieved, when we receive a fully executed settlement release from the plaintiff's counsel. As of December 31, 2017 and 2016, aggregate settlement costs were $10.5 million and $9.8 million, respectively. In calendar years 2017, 2016 and 2015, the settlement costs totaled $0.7 million, $0.1 million and $0.2 million, respectively. As of December 31, 2017 and 2016, aggregate litigation costs were $29.2 million and $27.1 million, respectively. In calendar years 2017, 2016 and 2015, the costs of administering and litigating asbestos claims totaled $2.1 million, $1.0 million and $1.4 million, respectively.
In January 1994, we entered into a settlement agreement with certain principal primary insurers concerning liability for the costs of defense, judgments and settlements, if any, in all of the asbestos litigation described above. Subject to the terms and conditions of the settlement agreement, the insurers were responsible for a substantial portion of the costs and expenses incurred in the defense or resolution of this litigation. However, one of the insurers participating in the settlement that was responsible for a significant portion of the contribution under the settlement agreement entered into insurance liquidation proceedings and another became insolvent. As a result, the contribution of the insurers has been reduced and we have had to bear substantially most of the costs relating to these lawsuits.
European Commission competition matter
As part of the Company’s acquisition of Silec in December 2005, SAFRAN SA (“SAFRAN”), agreed to indemnify the Company for the full amount of losses arising from, related to or attributable to practices, if any, that are similar to previous practices investigated by the French competition authority for alleged competition law violations related to medium-and high voltage cable markets. The Company has asserted a claim under this indemnity against SAFRAN related to the European Commission’s Statement of Objections, discussed below, to preserve the Company’s rights in case of an adverse European Commission decision.
On July 5, 2011, the European Commission issued a Statement of Objections in relation to its ongoing competition investigation to a number of wire and cable manufacturers in the submarine and underground power cables business, including our Spanish
134
affiliate, Grupo General Cable Sistemas, and its French subsidiary, Silec. The Statement of Objections alleged that the two affiliates engaged in violations of competition law in the underground power cables businesses for limited periods of time. The allegations related to Grupo General Cable Sistemas claimed that it had participated in a cartel from January 2003 to May 2007, while the allegations related to Silec were for the ten month period following its December 22, 2005 acquisition from SAFRAN by Grupo General Cable Sistemas.
Following our formal responses to the Statement of Objections in October 2011 and a hearing in 2012, the European Commission issued a final decision on April 2, 2014. In the decision, the claims of infringement against Grupo General Cable Sistemas were dismissed for lack of evidence of alleged cartel activity. With regard to Silec, the European Commission’s decision imposed a fine of 1.9 million Euros related to the period Silec has been owned by us. This fine was based on participation that allegedly commenced well before Silec was acquired by us. On June 13, 2014, we filed an appeal with the General Court of the European Union challenging the European Commission’s decision as to Silec in Europe based on established precedent. We also continue to pursue our claim for full indemnification for the Silec fine under the terms of the acquisition agreement with SAFRAN executed in 2005.
Brazil tax matters
A Brazilian subsidiary is involved in administrative proceedings with State treasury offices regarding whether tax incentives granted to us by one Brazilian state are applicable to goods sold in another Brazilian State. We believe we correctly relied on the tax incentives granted and that we have substantial defenses to their disallowance by the Brazilian State claimant. The total amount of taxes allegedly due for the infractions including potential interest and penalties is up to $8 million. In September 2012, an Administrative Court found that we were not liable for any incentive tax payments claimed by the State treasury office, however this determination was overturned on appeal and has since been further appealed. This appeal remains pending at the Brazilian Courts. Despite the pending appeal, in October 2014, the State issued a summons to recover the approximately $8 million of contested incentives described above, and we are complying with the terms of the State’s summons while continuing to contest the Court’s ruling. We currently estimate our range of reasonably possible loss to be between $0 million and $8 million.
Our Brazilian subsidiary has received notifications of various other claims related to disputed tax credits taken on Federal Tax Offset returns, which are in various phases of litigation. We believe we correctly applied the tax credits taken and that we have substantial defenses to these claims. The total amount of reasonably possible loss for the disputed credits, including potential interest and penalties is up to $22 million.
Resolution of SEC and DOJ investigations
As previously disclosed, in December 2016, we entered into agreements with the SEC and the DOJ to resolve those agencies’ respective investigations relating to the FCPA and the SEC’s separate accounting investigation related to our financial restatements impacting fiscal years 2012 and prior. Pursuant to those agreements, we paid fines, disgorgement and pre-judgment interest to the SEC and DOJ in the total amount of $82.3 million. Specifically, we paid $20.5 million to the DOJ in January 2017 and $12.4 million, $18.5 million and $30.9 million to the SEC in January 2017, June 2017 and December 2017, respectively.
FCPA-related litigation matters
A civil complaint was filed in the United States District Court for the Southern District of New York on January 5, 2017, by named plaintiffs, on behalf of purported classes of persons who purchased or otherwise acquired our publicly traded securities, against us, Gregory Kenny, our former President and Chief Executive Officer, and Brian Robinson, our former Executive Vice President and Chief Financial Officer (the “Doshi Complaint”). The parties stipulated to the transfer of the matter to the Eastern District of Kentucky, which was approved. The Doshi Complaint alleged claims under the antifraud and controlling person liability provisions of the Exchange Act, alleging generally, among other assertions, that the defendants made materially false and misleading statements in various quarterly and annual reports filed with the SEC between February 2012 and February 2016. Plaintiffs claimed that the Corporation failed to disclose during that period that it had paid bribes in violation of the FCPA, failed to disclose that a portion of its profits were subject to disgorgement, and failed to disclose that when this conduct was discovered it would subject the Corporation to significant monetary penalties. The Doshi Complaint alleged that as a result of the foregoing, our stock price was artificially inflated and the plaintiffs suffered damages in connection with their purchase of our stock. The Doshi Complaint further sought damages in an unspecified amount; reasonable costs and expenses, including counsel and experts fees; and such equitable injunctive or other relief as the Court deems just and proper. As required under the Exchange Act, motions for appointment as lead plaintiff were filed on March 6, 2017, by three movants, including named plaintiff Doshi. On November 7, 2017, the Court issued an opinion appointing a different movant, the Long Trust Group, as lead plaintiff. Following appointment of lead plaintiff, the parties submitted a stipulated agreement with the Court which included a schedule for the filing of a consolidated complaint and renaming the action In Re General Cable Corporation Securities Litigation (Civil Action No. 2:17-025-WOB). Based on the stipulated schedule, lead plaintiff filed an amended consolidated complaint on January 19, 2018 that asserts the same claims and names the same defendants as the Doshi Complaint. At this time, we cannot determine the likelihood of, nor can we reasonably estimate the range of, any possible loss.
135
Purported class action litigation - Stanfield v. General Cable Corp. and Rosenblatt v. General Cable Corp.
On January 2, 2018, a purported stockholder of the Company filed an action against the Company and the members of the Company’s board of directors on behalf of a putative class of stockholders of the Company in the United States District Court for the District of Delaware, captioned Stanfield v. General Cable Corp., No. 1:18-cv-00006-UNA (D. Del.), and on January 9, 2018, a purported stockholder of the Company filed a substantively similar action against the Company, Parent, Merger Sub and the members of the Company’s board of directors in the United States District Court for the Eastern District of Kentucky, captioned Rosenblatt v. General Cable Corp., No. 2:18-cv-00010-WOB-CJS (E.D. Ky.), in each case seeking, among other things, to enjoin the completion of the Merger. At this time, we cannot determine the likelihood of, nor can we reasonably estimate the range of, any possible loss.
Purported class action litigation - Employee Retirement Income Security Act of 1974
On March 15, 2017, litigation was initiated against us and certain of our current and former directors, executive officers and employees by a former employee on behalf of a purported class of employees who invested in the common stock of General Cable through our 401(k) plan. The Plaintiff alleges that we should have not retained the General Cable stock fund as an investment option in our 401(k) plan during the period 2003-2016, when they claim the price of the Company stock was artificially inflated. The suit alleges various violations of the Employee Retirement Income Security Act of 1974 (“ERISA”) and was filed in the United States District Court for the Eastern District of Kentucky. At this time, we cannot determine the likelihood of, nor can we reasonably estimate the range of, any possible loss.
Other
In addition, we are involved in various routine legal proceedings and administrative actions incidental to our business. In the opinion of our management, these routine proceedings and actions should not, individually or in the aggregate, have a material adverse effect on our consolidated results of operations, cash flows or financial position. However, in the event of unexpected future developments, it is possible that the ultimate resolution of these matters or other similar matters, if unfavorable, may have such adverse effects.
In accordance with GAAP, we record a liability when it is both probable that a liability has been incurred and the amount of the loss can be reasonably estimated. These provisions are reviewed at least quarterly and adjusted to reflect the impacts of negotiations, settlements, rulings, advice of legal counsel, and other information and events pertaining to a particular case. To the extent additional information arises or our strategies change, it is possible that our estimate of our probable liability in these matters may change.
The 2014 Executive Officer Severance Plan ("2014 Severance Plan"), applicable to the Company’s executive officers holding a position of Executive Vice President or above or the position of Chief Financial Officer, General Counsel, Chief Compliance Officer or Chief Human Resources Officer and were hired or first promoted into such position after August 1, 2014, includes a change in control provision such that the executives may receive payments or benefits in accordance with the 2014 Severance Plan to the extent that both a change of control and a triggering event, each as defined in the 2014 Severance Plan, occur. Unless there are circumstances of ineligibility, as defined, the Company must provide payments and benefits upon both a change in control and a triggering event.
The Company has entered into various operating lease agreements related principally to certain administrative, manufacturing and distribution facilities and transportation equipment. At December 31, 2017, future minimum rental payments required under non-cancelable lease agreements during the twelve month periods beginning December 31, 2017 through December 31, 2022 and thereafter are $15.4 million, $13.4 million, $10.9 million, $8.0 million and $5.6 million, respectively, and $9.9 million thereafter. Rental expense recorded in operating income (loss) was $21.4 million, $23.9 million and $41.6 million for the years ended December 31, 2017, 2016 and 2015, respectively.
As of December 31, 2017, the Company had $31.7 million in letters of credit, $187.6 million in various performance bonds and $123.6 million in other guarantees outstanding. Other guarantees include bank guarantees and advance payment bonds. These letters of credit, performance bonds and guarantees are periodically renewed and are generally related to risk associated with self-insurance claims, contract performance, quality and other various bank and financing guarantees. Advance payment bonds are often required by customers when the Company obtains advance payments to secure the production of cable for long term contracts. The advance payment bonds provide the customer protection on their deposit in the event that the Company does not perform under the contract.
136
20. Unconsolidated Affiliated Companies
Unconsolidated affiliated companies are those in which the Company generally owns less than 50 percent of the outstanding voting shares. The Company does not control these companies and accounts for its investments in them on the equity method basis. The unconsolidated affiliated companies primarily manufacture or market wire and cable products in our Latin America and Europe segments. As of December 31, 2017 and 2016, the Company has recorded on its Consolidated Balance Sheets an investment in unconsolidated affiliated companies of $0.2 million and $9.0 million, respectively. The Company’s share of the income of these companies is reported in the Consolidated Statements of Operations and Comprehensive Income (Loss) under “Equity in net earnings of affiliated companies.” The Company did not have equity in net earnings of affiliated companies in 2017. In 2016 and 2015, equity in net earnings of affiliated companies was $0.9 million, and $0.5 million, respectively. As of December 31, 2017, the Company’s ownership percentage was as follows: Colada Continua Chilena, S.A. 41% and Nostag GmBH & Co. KG 33%. In the first quarter of 2017, the Company completed the sale of its 24.6% interest in Pakistan Cables Limited for cash consideration of approximately $5.3 million. Refer to Note 4 - Divestitures for more information.
21. Fair Value
The fair market values of the Company’s financial instruments are determined based on the fair value hierarchy as discussed in ASC 820.
The Company carries derivative assets and liabilities (Level 2) and marketable equity securities (Level 1) held in the rabbi trust as part of the Company’s Deferred Compensation Plan at fair value. The fair values of derivative assets and liabilities traded in the over-the-counter market are determined using quantitative models that require the use of multiple market inputs including interest rates, prices and indices to generate pricing and volatility factors, which are used to value the position. The predominance of market inputs are actively quoted and can be validated through external sources, including brokers, market transactions and third-party pricing services. Marketable equity securities are recorded at fair value, which are based on quoted market prices.
Financial assets and liabilities measured at fair value on a recurring basis are summarized below (in millions).
Fair Value Measurement | ||||||||||||||||||||||||||||||||
December 31, 2017 | December 31, 2016 | |||||||||||||||||||||||||||||||
(in millions) | Level 1 | Level 2 | Level 3 | Fair Value | Level 1 | Level 2 | Level 3 | Fair Value | ||||||||||||||||||||||||
Assets: | ||||||||||||||||||||||||||||||||
Derivative assets | $ | — | $ | 27.4 | $ | — | $ | 27.4 | $ | — | $ | 9.3 | $ | — | $ | 9.3 | ||||||||||||||||
Equity securities (1) | 8.4 | — | — | 8.4 | 9.8 | — | — | 9.8 | ||||||||||||||||||||||||
Total Assets | $ | 8.4 | $ | 27.4 | $ | — | $ | 35.8 | $ | 9.8 | $ | 9.3 | $ | — | $ | 19.1 | ||||||||||||||||
Liabilities: | ||||||||||||||||||||||||||||||||
Derivative liabilities | $ | — | $ | 0.8 | $ | — | $ | 0.8 | $ | — | $ | 2.9 | $ | — | $ | 2.9 | ||||||||||||||||
Total liabilities | $ | — | $ | 0.8 | $ | — | $ | 0.8 | $ | — | $ | 2.9 | $ | — | $ | 2.9 | ||||||||||||||||
(1) Balance represents the market value of the assets, exclusive of the market value of restricted stock and restricted stock units held ("Deferred Stock") and the General Cable Stock Fund by participants’ elections, held in the Rabbi Trust in connection with the Company's deferred compensation plan at December 31, 2017 and December 31, 2016 classified as “other non-current assets” in the Consolidated Balance Sheets. The market value of mutual fund investments and the General Cable Stock Fund in the Rabbi Trust was $17.9 million and $17.2 million as of December 31, 2017 and December 31, 2016, respectively. Amounts payable to the plan participants at December 31, 2017 and December 31, 2016, excluding the Deferred Stock, were $9.4 million and $11.0 million, respectively, and are classified as “Other liabilities” in the Consolidated Balance Sheets.
At December 31, 2017, there were no material financial assets or financial liabilities measured at fair value on a recurring basis using significant unobservable inputs (Level 3). Similarly, there were no other nonfinancial assets or nonfinancial liabilities measured at fair value on a non-recurring basis.
The following long-lived asset impairment charges were recorded in the years ended December 31, 2017, December 31, 2016 and December 31, 2015:
In the fourth quarter of 2016, the Company recorded an impairment charge of $11.0 million related to its China machinery and equipment and real property assets. The remaining property, plant and equipment, $18.6 million, was measured at fair value at December 31, 2016.
In 2016, the Company also recognized asset-related charges of $21.4 million related to the Company's restructuring programs (the remaining property, plant and equipment is immaterial) and $6.0 million related to the Company's Egypt operations (Egypt was sold in the second quarter of 2016).
137
In 2015, the Company recognized asset-related charges of $17.7 million related to the Company's restructuring programs, $30.7 million related to the Company's Algerian operations and $13.6 million related to the Company's India operations.
Refer to Note 5 - Restructuring and Note 8 - Property, Plant and Equipment for additional details regarding the impairment charges.
To determine the fair value for the above long-lived asset groups, the Company utilized standard valuation techniques, including both income and market-based approaches. The fair value of the asset groups were based on significant inputs that were not observable in the market and are considered to be Level 3 inputs as defined by ASC 820. Under the income approach, the Company used a discounted cash flow method to calculate fair value based on the present value of estimated future cash flows. Assumptions used in the discounted cash flow method, such as forecasted operating results, expected growth rates, working capital needs, tax rates, and the weighted average cost of capital ("WACC"), were based on the then current market conditions and were consistent with internal management projections. The WACC rates and the growth rates assumed were in the range of 10% to 12% and 0% to 6%, respectively. Under the market approach, the Company provided an estimate of value using multiples of earnings derived from the market values of similar type businesses and considered other binding and non-binding sales offers.
22. Quarterly Operating Results (Unaudited)
The interim financial information is unaudited. In the opinion of management, the interim financial information reflects all adjustments necessary for a fair presentation of quarterly financial information. Quarterly results have been influenced by seasonal factors inherent in General Cable’s businesses. The sum of the quarters’ earnings per share amounts may not add to full year earnings per share because each quarter is calculated independently, and the sum of the quarters’ other figures may not add to the full year because of rounding. The Company's fiscal quarters consist of 13-week periods ending on the Friday nearest to the end of the calendar months of March, June and September. Adjustments that are material to the quarterly operating results include the effect of the disposals of businesses, restructuring costs, long-lived asset impairment charges and SEC and DOJ related charges. Refer to Note 4 - Divestitures, Note 5 - Restructuring, Note 8 - Property, Plant and Equipment and Note 19 - Commitments and Contingencies for the effect and nature of these adjustments.
First Quarter | Second Quarter | Third Quarter | Fourth Quarter | ||||||||||||
2017 | |||||||||||||||
Net sales | $ | 918.2 | $ | 943.1 | $ | 994.0 | $ | 981.9 | |||||||
Gross profit | 118.6 | 100.9 | 109.2 | 97.4 | |||||||||||
Net income (loss) including noncontrolling interest | 12.4 | (68.7 | ) | (14.2 | ) | 15.8 | |||||||||
Less: net income (loss) attributable to noncontrolling interest | — | 2.1 | — | (0.2 | ) | ||||||||||
Net income (loss) attributable to Company common shareholders | 12.4 | (70.8 | ) | (14.2 | ) | 16.0 | |||||||||
Net income (loss) attributable to Company common shareholders — for diluted EPS computation | 12.4 | (70.8 | ) | (14.2 | ) | 16.0 | |||||||||
Earnings (loss) per common share — basic | $ | 0.25 | $ | (1.42 | ) | $ | (0.28 | ) | $ | 0.32 | |||||
Earnings (loss) per common share — assuming dilution | $ | 0.24 | $ | (1.42 | ) | $ | (0.28 | ) | $ | 0.31 | |||||
First Quarter | Second Quarter | Third Quarter | Fourth Quarter | ||||||||||||
2016 | |||||||||||||||
Net sales | $ | 1,002.7 | $ | 1,021.2 | $ | 924.5 | $ | 910.0 | |||||||
Gross profit | 110.9 | 119.2 | 102.9 | 74.1 | |||||||||||
Net income (loss) including noncontrolling interest | (4.4 | ) | 28.3 | (13.7 | ) | (103.7 | ) | ||||||||
Less: net income (loss) attributable to noncontrolling interest | 0.3 | (1.5 | ) | 0.6 | 0.9 | ||||||||||
Net income (loss) attributable to Company common shareholders | (4.7 | ) | 29.8 | (14.3 | ) | (104.6 | ) | ||||||||
Net income (loss) attributable to Company common shareholders — for diluted EPS computation | (4.7 | ) | 29.8 | (14.3 | ) | (104.6 | ) | ||||||||
Earnings (loss) per common share — basic | $ | (0.10 | ) | $ | 0.60 | $ | (0.29 | ) | $ | (2.10 | ) | ||||
Earnings (loss) per common share — assuming dilution | $ | (0.10 | ) | $ | 0.57 | $ | (0.29 | ) | $ | (2.10 | ) | ||||
138
23. Supplemental Guarantor Condensed Financial Information
General Cable Corporation (“Parent Company”) and its U.S. 100% wholly-owned subsidiaries (“Guarantor Subsidiaries”) fully and unconditionally guarantee the $600.0 million of 5.75% Senior Notes due in 2022 of the Parent Company on a joint and several basis. The following tables present financial information about the Parent Company, Guarantor Subsidiaries and Non-Guarantor Subsidiaries in millions. Intercompany transactions are eliminated in the "Eliminations" column of the Supplemental Guarantor Condensed Financial Information tables.
Condensed Statement of Operations and Comprehensive Income (Loss) Information
Year Ended December 31, 2017
Parent | Guarantor Subsidiaries | Non- Guarantor Subsidiaries | Eliminations | Total | |||||||||||||||
Net sales: | |||||||||||||||||||
Customers | $ | — | $ | 1,905.2 | $ | 1,932.0 | $ | — | $ | 3,837.2 | |||||||||
Intercompany | 70.5 | 180.9 | 178.1 | (429.5 | ) | — | |||||||||||||
70.5 | 2,086.1 | 2,110.1 | (429.5 | ) | 3,837.2 | ||||||||||||||
Cost of sales | — | 1,848.0 | 1,922.1 | (359.0 | ) | 3,411.1 | |||||||||||||
Gross profit | 70.5 | 238.1 | 188.0 | (70.5 | ) | 426.1 | |||||||||||||
Selling, general and administrative expenses | 67.6 | 189.8 | 229.9 | (70.5 | ) | 416.8 | |||||||||||||
Goodwill impairment charges | — | — | — | — | — | ||||||||||||||
Intangible asset impairment charges | — | — | — | — | — | ||||||||||||||
Operating income (loss) | 2.9 | 48.3 | (41.9 | ) | — | 9.3 | |||||||||||||
Other income (expense) | — | 4.4 | 24.1 | — | 28.5 | ||||||||||||||
Interest income (expense): | |||||||||||||||||||
Interest expense | (57.9 | ) | (36.8 | ) | (17.7 | ) | 33.7 | (78.7 | ) | ||||||||||
Interest income | 28.4 | 5.2 | 2.1 | (33.7 | ) | 2.0 | |||||||||||||
(29.5 | ) | (31.6 | ) | (15.6 | ) | — | (76.7 | ) | |||||||||||
Income (loss) before income taxes | (26.6 | ) | 21.1 | (33.4 | ) | — | (38.9 | ) | |||||||||||
Income tax (provision) benefit | 79.5 | (68.7 | ) | (26.6 | ) | — | (15.8 | ) | |||||||||||
Equity in net earnings of affiliated companies and subsidiaries | (109.5 | ) | (61.9 | ) | — | 171.4 | — | ||||||||||||
Net income (loss) including noncontrolling interest | (56.6 | ) | (109.5 | ) | (60.0 | ) | 171.4 | (54.7 | ) | ||||||||||
Less: net income (loss) attributable to noncontrolling interest | — | — | 1.9 | — | 1.9 | ||||||||||||||
Net income (loss) attributable to Company common shareholders | $ | (56.6 | ) | $ | (109.5 | ) | $ | (61.9 | ) | $ | 171.4 | $ | (56.6 | ) | |||||
Comprehensive income (loss): | |||||||||||||||||||
Net income (loss) | $ | (56.6 | ) | $ | (109.5 | ) | $ | (60.0 | ) | $ | 171.4 | $ | (54.7 | ) | |||||
Currency translation gain (loss) | 61.6 | 61.6 | 46.9 | (97.2 | ) | 72.9 | |||||||||||||
Defined benefit plan adjustments, net of tax | (6.0 | ) | (6.0 | ) | 1.2 | 4.8 | (6.0 | ) | |||||||||||
Comprehensive income (loss), net of tax | (1.0 | ) | (53.9 | ) | (11.9 | ) | 79.0 | 12.2 | |||||||||||
Comprehensive income (loss) attributable to noncontrolling interest, net of tax | — | — | 13.2 | — | 13.2 | ||||||||||||||
Comprehensive income (loss) attributable to Company common shareholders, net of tax | $ | (1.0 | ) | $ | (53.9 | ) | $ | (25.1 | ) | $ | 79.0 | $ | (1.0 | ) | |||||
139
Condensed Statement of Operations and Comprehensive Income (Loss) Information
Year Ended December 31, 2016
Parent | Guarantor Subsidiaries | Non- Guarantor Subsidiaries | Eliminations | Total | |||||||||||||||
Net sales: | |||||||||||||||||||
Customers | $ | — | $ | 1,730.3 | $ | 2,128.1 | $ | — | $ | 3,858.4 | |||||||||
Intercompany | 63.2 | 206.4 | 155.3 | (424.9 | ) | — | |||||||||||||
63.2 | 1,936.7 | 2,283.4 | (424.9 | ) | 3,858.4 | ||||||||||||||
Cost of sales | — | 1,703.0 | 2,110.0 | (361.7 | ) | 3,451.3 | |||||||||||||
Gross profit | 63.2 | 233.7 | 173.4 | (63.2 | ) | 407.1 | |||||||||||||
Selling, general and administrative expenses | 111.8 | 127.9 | 232.4 | (63.2 | ) | 408.9 | |||||||||||||
Goodwill impairment charges | — | 7.4 | 1.6 | — | 9.0 | ||||||||||||||
Intangible asset impairment charges | — | 5.0 | 2.5 | — | 7.5 | ||||||||||||||
Operating income | (48.6 | ) | 93.4 | (63.1 | ) | — | (18.3 | ) | |||||||||||
Other income (expense) | — | 1.5 | 5.7 | — | 7.2 | ||||||||||||||
Interest income (expense): | |||||||||||||||||||
Interest expense | (57.6 | ) | (65.3 | ) | (27.3 | ) | 60.7 | (89.5 | ) | ||||||||||
Interest income | 55.6 | 5.1 | 2.5 | (60.7 | ) | 2.5 | |||||||||||||
(2.0 | ) | (60.2 | ) | (24.8 | ) | — | (87.0 | ) | |||||||||||
Income (loss) before income taxes | (50.6 | ) | 34.7 | (82.2 | ) | — | (98.1 | ) | |||||||||||
Income tax (provision) benefit | 9.7 | 18.4 | (24.4 | ) | — | 3.7 | |||||||||||||
Equity in net earnings of affiliated companies and subsidiaries | (52.9 | ) | (106.0 | ) | 0.2 | 159.6 | 0.9 | ||||||||||||
Net income (loss) including noncontrolling interest | (93.8 | ) | (52.9 | ) | (106.4 | ) | 159.6 | (93.5 | ) | ||||||||||
Less: net income (loss) attributable to noncontrolling interest | — | — | 0.3 | — | 0.3 | ||||||||||||||
Net income (loss) attributable to Company common shareholders | $ | (93.8 | ) | $ | (52.9 | ) | $ | (106.7 | ) | $ | 159.6 | $ | (93.8 | ) | |||||
Comprehensive income (loss): | |||||||||||||||||||
Net income (loss) | $ | (93.8 | ) | $ | (52.9 | ) | $ | (106.4 | ) | $ | 159.6 | $ | (93.5 | ) | |||||
Currency translation gain (loss) | 47.2 | 47.2 | 45.6 | (92.1 | ) | 47.9 | |||||||||||||
Defined benefit plan adjustments, net of tax | 6.6 | 6.6 | 0.6 | (7.2 | ) | 6.6 | |||||||||||||
Comprehensive income (loss), net of tax | (40.0 | ) | 0.9 | (60.2 | ) | 60.3 | (39.0 | ) | |||||||||||
Comprehensive income (loss) attributable to noncontrolling interest, net of tax | — | — | 1.0 | — | 1.0 | ||||||||||||||
Comprehensive income (loss) attributable to Company common shareholders, net of tax | $ | (40.0 | ) | $ | 0.9 | $ | (61.2 | ) | $ | 60.3 | $ | (40.0 | ) | ||||||
140
Condensed Statement of Operations and Comprehensive Income (Loss) Information
Year Ended December 31, 2015
Parent | Guarantor Subsidiaries | Non- Guarantor Subsidiaries | Eliminations | Total | |||||||||||||||
Net sales: | |||||||||||||||||||
Customers | $ | — | $ | 1,926.4 | $ | 2,588.1 | $ | — | $ | 4,514.5 | |||||||||
Intercompany | 75.6 | 219.2 | 151.1 | (445.9 | ) | — | |||||||||||||
75.6 | 2,145.6 | 2,739.2 | (445.9 | ) | 4,514.5 | ||||||||||||||
Cost of sales | — | 1,889.9 | 2,562.5 | (370.3 | ) | 4,082.1 | |||||||||||||
Gross profit | 75.6 | 255.7 | 176.7 | (75.6 | ) | 432.4 | |||||||||||||
Selling, general and administrative expenses | 75.6 | 185.1 | 227.2 | (75.6 | ) | 412.3 | |||||||||||||
Goodwill impairment charges | — | — | 3.9 | — | 3.9 | ||||||||||||||
Intangible asset impairment charges | — | — | 1.7 | — | 1.7 | ||||||||||||||
Operating income | — | 70.6 | (56.1 | ) | — | 14.5 | |||||||||||||
Other income (expense) | 0.7 | (8.1 | ) | (63.9 | ) | — | (71.3 | ) | |||||||||||
Interest income (expense): | |||||||||||||||||||
Interest expense | (58.2 | ) | (66.2 | ) | (36.4 | ) | 63.8 | (97.0 | ) | ||||||||||
Interest income | 56.2 | 7.5 | 2.8 | (63.8 | ) | 2.7 | |||||||||||||
(2.0 | ) | (58.7 | ) | (33.6 | ) | — | (94.3 | ) | |||||||||||
Income (loss) before income taxes | (1.3 | ) | 3.8 | (153.6 | ) | — | (151.1 | ) | |||||||||||
Income tax (provision) benefit | 0.3 | 21.2 | (6.7 | ) | — | 14.8 | |||||||||||||
Equity in net earnings of affiliated companies and subsidiaries | (120.9 | ) | (145.9 | ) | 0.2 | 267.1 | 0.5 | ||||||||||||
Net income (loss) including noncontrolling interest | (121.9 | ) | (120.9 | ) | (160.1 | ) | 267.1 | (135.8 | ) | ||||||||||
Less: net income (loss) attributable to noncontrolling interest | — | — | (13.9 | ) | — | (13.9 | ) | ||||||||||||
Net income (loss) attributable to Company common shareholders | $ | (121.9 | ) | $ | (120.9 | ) | $ | (146.2 | ) | $ | 267.1 | $ | (121.9 | ) | |||||
Comprehensive income (loss): | |||||||||||||||||||
Net income (loss) | $ | (121.9 | ) | $ | (120.9 | ) | $ | (160.1 | ) | $ | 267.1 | $ | (135.8 | ) | |||||
Currency translation gain (loss) | (100.2 | ) | (100.2 | ) | (71.4 | ) | 171.6 | (100.2 | ) | ||||||||||
Defined benefit plan adjustments, net of tax | 15.1 | 15.1 | 10.0 | (25.1 | ) | 15.1 | |||||||||||||
Comprehensive income (loss), net of tax | (207.0 | ) | (206.0 | ) | (221.5 | ) | 413.6 | (220.9 | ) | ||||||||||
Comprehensive income (loss) attributable to noncontrolling interest, net of tax | — | — | (22.2 | ) | — | (22.2 | ) | ||||||||||||
Comprehensive income (loss) attributable to Company common shareholders, net of tax | $ | (207.0 | ) | $ | (206.0 | ) | $ | (199.3 | ) | $ | 413.6 | $ | (198.7 | ) | |||||
141
Condensed Balance Sheet Information
December 31, 2017
Parent | Guarantor Subsidiaries | Non- Guarantor Subsidiaries | Eliminations | Total | |||||||||||||||
Assets | |||||||||||||||||||
Current assets: | |||||||||||||||||||
Cash and cash equivalents | $ | — | $ | — | $ | 84.7 | $ | — | $ | 84.7 | |||||||||
Receivables, net of allowances | — | 226.2 | 488.0 | — | 714.2 | ||||||||||||||
Inventories | — | 380.2 | 355.9 | — | 736.1 | ||||||||||||||
Prepaid expenses and other | — | 27.0 | 33.0 | — | 60.0 | ||||||||||||||
Total current assets | — | 633.4 | 961.6 | — | 1,595.0 | ||||||||||||||
Property, plant and equipment, net | 0.3 | 209.3 | 320.7 | — | 530.3 | ||||||||||||||
Deferred income taxes | — | 26.1 | 7.9 | (26.1 | ) | 7.9 | |||||||||||||
Intercompany accounts | 1,022.7 | 114.8 | 70.3 | (1,207.8 | ) | — | |||||||||||||
Investment in subsidiaries | 19.4 | 581.1 | — | (600.5 | ) | — | |||||||||||||
Goodwill | — | 5.6 | 5.4 | — | 11.0 | ||||||||||||||
Intangible assets, net | 0.1 | 5.6 | 17.6 | — | 23.3 | ||||||||||||||
Unconsolidated affiliated companies | — | — | 0.2 | — | 0.2 | ||||||||||||||
Other non-current assets | — | 17.3 | 50.3 | — | 67.6 | ||||||||||||||
Total assets | $ | 1,042.5 | $ | 1,593.2 | $ | 1,434.0 | $ | (1,834.4 | ) | $ | 2,235.3 | ||||||||
Liabilities and Total Equity | |||||||||||||||||||
Current liabilities: | |||||||||||||||||||
Accounts payable | $ | — | $ | 118.1 | $ | 319.4 | $ | — | $ | 437.5 | |||||||||
Accrued liabilities | 15.6 | 88.6 | 204.6 | — | 308.8 | ||||||||||||||
Current portion of long-term debt | — | — | 46.9 | — | 46.9 | ||||||||||||||
Total current liabilities | 15.6 | 206.7 | 570.9 | — | 793.2 | ||||||||||||||
Long-term debt | 776.3 | 219.9 | 42.6 | — | 1,038.8 | ||||||||||||||
Deferred income taxes | 121.4 | — | 13.3 | (26.1 | ) | 108.6 | |||||||||||||
Intercompany accounts | — | 1,092.3 | 115.5 | (1,207.8 | ) | — | |||||||||||||
Other liabilities | — | 54.9 | 108.0 | — | 162.9 | ||||||||||||||
Total liabilities | 913.3 | 1,573.8 | 850.3 | (1,233.9 | ) | 2,103.5 | |||||||||||||
Total Company shareholders’ equity | 129.2 | 19.4 | 581.1 | (600.5 | ) | 129.2 | |||||||||||||
Noncontrolling interest | — | — | 2.6 | — | 2.6 | ||||||||||||||
Total liabilities and equity | $ | 1,042.5 | $ | 1,593.2 | $ | 1,434.0 | $ | (1,834.4 | ) | $ | 2,235.3 | ||||||||
142
Condensed Balance Sheet Information
December 31, 2016
Parent | Guarantor Subsidiaries | Non- Guarantor Subsidiaries | Eliminations | Total | |||||||||||||||
Assets | |||||||||||||||||||
Current assets: | |||||||||||||||||||
Cash and cash equivalents | $ | — | $ | 1.0 | $ | 100.1 | $ | — | $ | 101.1 | |||||||||
Receivables, net of allowances | — | 202.9 | 461.6 | — | 664.5 | ||||||||||||||
Inventories | — | 363.4 | 404.8 | — | 768.2 | ||||||||||||||
Prepaid expenses and other | — | 26.2 | 39.2 | — | 65.4 | ||||||||||||||
Total current assets | — | 593.5 | 1,005.7 | — | 1,599.2 | ||||||||||||||
Property, plant and equipment, net | 0.3 | 202.8 | 326.2 | — | 529.3 | ||||||||||||||
Deferred income taxes | — | 42.9 | 20.4 | (42.9 | ) | 20.4 | |||||||||||||
Intercompany accounts | 1,092.4 | 104.7 | 69.4 | (1,266.5 | ) | — | |||||||||||||
Investment in subsidiaries | 73.2 | 612.7 | — | (685.9 | ) | — | |||||||||||||
Goodwill | — | 5.6 | 6.4 | — | 12.0 | ||||||||||||||
Intangible assets, net | — | 6.0 | 22.3 | — | 28.3 | ||||||||||||||
Unconsolidated affiliated companies | — | 8.8 | 0.2 | — | 9.0 | ||||||||||||||
Other non-current assets | — | 15.5 | 27.9 | — | 43.4 | ||||||||||||||
Total assets | $ | 1,165.9 | $ | 1,592.5 | $ | 1,478.5 | $ | (1,995.3 | ) | $ | 2,241.6 | ||||||||
Liabilities and Total Equity | |||||||||||||||||||
Current liabilities: | |||||||||||||||||||
Accounts payable | $ | — | $ | 112.4 | $ | 301.6 | $ | — | $ | 414.0 | |||||||||
Accrued liabilities | 93.4 | 105.0 | 221.2 | — | 419.6 | ||||||||||||||
Current portion of long-term debt | — | — | 67.5 | — | 67.5 | ||||||||||||||
Total current liabilities | 93.4 | 217.4 | 590.3 | — | 901.1 | ||||||||||||||
Long-term debt | 772.3 | 75.9 | 22.9 | — | 871.1 | ||||||||||||||
Deferred income taxes | 147.1 | — | 22.5 | (42.9 | ) | 126.7 | |||||||||||||
Intercompany accounts | — | 1,161.1 | 105.4 | (1,266.5 | ) | — | |||||||||||||
Other liabilities | — | 64.9 | 108.9 | — | 173.8 | ||||||||||||||
Total liabilities | 1,012.8 | 1,519.3 | 850.0 | (1,309.4 | ) | 2,072.7 | |||||||||||||
Total Company shareholders’ equity | 153.1 | 73.2 | 612.7 | (685.9 | ) | 153.1 | |||||||||||||
Noncontrolling interest | — | — | 15.8 | — | 15.8 | ||||||||||||||
Total liabilities and equity | $ | 1,165.9 | $ | 1,592.5 | $ | 1,478.5 | $ | (1,995.3 | ) | $ | 2,241.6 | ||||||||
143
Condensed Statement of Cash Flows Information
Year Ended December 31, 2017
Parent | Guarantor Subsidiaries | Non- Guarantor Subsidiaries | Eliminations | Total | |||||||||||||||
Net cash flows of operating activities | $ | (102.0 | ) | $ | 20.5 | $ | 42.5 | $ | — | $ | (39.0 | ) | |||||||
Cash flows of investing activities: | |||||||||||||||||||
Capital expenditures | (0.1 | ) | (47.3 | ) | (38.0 | ) | — | (85.4 | ) | ||||||||||
Proceeds from properties sold | — | 0.8 | 11.1 | — | 11.9 | ||||||||||||||
Disposal of subsidiaries, net of cash disposed of | — | 5.3 | (3.1 | ) | — | 2.2 | |||||||||||||
Intercompany accounts | — | 46.8 | — | (46.8 | ) | — | |||||||||||||
Investment in restricted cash | — | — | (10.0 | ) | — | (10.0 | ) | ||||||||||||
Other | — | — | (0.1 | ) | — | (0.1 | ) | ||||||||||||
Net cash flows of investing activities | (0.1 | ) | 5.6 | (40.1 | ) | (46.8 | ) | (81.4 | ) | ||||||||||
Cash flows of financing activities: | |||||||||||||||||||
Dividends paid to shareholders | (37.4 | ) | — | — | — | (37.4 | ) | ||||||||||||
Intercompany accounts | 137.4 | (175.7 | ) | (8.5 | ) | 46.8 | — | ||||||||||||
Proceeds from debt | — | 1,579.9 | 521.2 | — | 2,101.1 | ||||||||||||||
Repayments of debt | — | (1,435.9 | ) | (531.4 | ) | — | (1,967.3 | ) | |||||||||||
Impact of stock options and other | 2.1 | — | — | — | 2.1 | ||||||||||||||
Net cash flows of financing activities | 102.1 | (31.7 | ) | (18.7 | ) | 46.8 | 98.5 | ||||||||||||
Effect of exchange rate changes on cash and cash equivalents | — | 4.6 | 0.9 | — | 5.5 | ||||||||||||||
Increase (decrease) in cash and cash equivalents | — | (1.0 | ) | (15.4 | ) | — | (16.4 | ) | |||||||||||
Cash and cash equivalents — beginning of period | — | 1.0 | 100.1 | — | 101.1 | ||||||||||||||
Cash and cash equivalents — end of period | $ | — | $ | — | $ | 84.7 | $ | — | $ | 84.7 | |||||||||
144
Condensed Statement of Cash Flows Information
Year Ended December 31, 2016
Parent | Guarantor Subsidiaries | Non- Guarantor Subsidiaries | Eliminations | Total | |||||||||||||||
Net cash flows of operating activities | $ | 7.9 | $ | 63.2 | $ | 85.1 | $ | — | $ | 156.2 | |||||||||
Cash flows of investing activities: | |||||||||||||||||||
Capital expenditures | — | (48.0 | ) | (36.1 | ) | — | (84.1 | ) | |||||||||||
Proceeds from properties sold | — | 0.7 | 0.8 | — | 1.5 | ||||||||||||||
Disposal of subsidiaries, net of cash disposed of | — | 76.8 | 5.0 | — | 81.8 | ||||||||||||||
Other | — | (1.0 | ) | 1.2 | — | 0.2 | |||||||||||||
Net cash flows of investing activities | — | 28.5 | (29.1 | ) | — | (0.6 | ) | ||||||||||||
Cash flows of financing activities: | |||||||||||||||||||
Dividends paid to shareholders | (35.6 | ) | — | — | — | (35.6 | ) | ||||||||||||
Intercompany accounts | 28.1 | (42.0 | ) | 13.9 | — | — | |||||||||||||
Proceeds from debt | — | 1,114.0 | 402.2 | — | 1,516.2 | ||||||||||||||
Repayments of debt | — | (1,165.7 | ) | (469.5 | ) | — | (1,635.2 | ) | |||||||||||
Purchase of noncontrolling interest | — | — | (18.0 | ) | — | (18.0 | ) | ||||||||||||
Dividends paid to noncontrolling interest | — | — | (0.1 | ) | — | (0.1 | ) | ||||||||||||
Impact of stock options and other | (0.4 | ) | — | — | — | (0.4 | ) | ||||||||||||
Proceeds from sale leaseback transaction | — | — | 6.2 | — | 6.2 | ||||||||||||||
Net cash flows of financing activities | (7.9 | ) | (93.7 | ) | (65.3 | ) | — | (166.9 | ) | ||||||||||
Effect of exchange rate changes on cash and cash equivalents | — | 2.2 | (2.2 | ) | — | — | |||||||||||||
Increase (decrease) in cash and cash equivalents | — | 0.2 | (11.5 | ) | — | (11.3 | ) | ||||||||||||
Cash and cash equivalents — beginning of period | — | 0.8 | 111.6 | — | 112.4 | ||||||||||||||
Cash and cash equivalents — end of period | $ | — | $ | 1.0 | $ | 100.1 | $ | — | $ | 101.1 | |||||||||
145
Condensed Statement of Cash Flows Information
Year Ended December 31, 2015
Parent | Guarantor Subsidiaries | Non- Guarantor Subsidiaries | Eliminations | Total | |||||||||||||||
Net cash flows of operating activities | $ | 2.6 | $ | 179.2 | $ | 29.6 | $ | (11.7 | ) | $ | 199.7 | ||||||||
Cash flows of investing activities: | |||||||||||||||||||
Capital expenditures | — | (18.6 | ) | (42.9 | ) | — | (61.5 | ) | |||||||||||
Proceeds from properties sold | — | 0.1 | 1.7 | — | 1.8 | ||||||||||||||
Reduction of cash due to Venezuela deconsolidation | — | — | (8.2 | ) | — | (8.2 | ) | ||||||||||||
Disposal of subsidiaries, net of cash disposed of | — | 88.4 | (10.0 | ) | — | 78.4 | |||||||||||||
Other | — | (0.2 | ) | 0.2 | — | — | |||||||||||||
Net cash flows of investing activities | — | 69.7 | (59.2 | ) | — | 10.5 | |||||||||||||
Cash flows of financing activities: | |||||||||||||||||||
Dividends paid to shareholders | (35.3 | ) | — | — | — | (35.3 | ) | ||||||||||||
Intercompany accounts | 158.3 | (208.4 | ) | 38.4 | 11.7 | — | |||||||||||||
Proceeds from debt | — | 2,082.1 | 863.4 | — | 2,945.5 | ||||||||||||||
Repayments of debt | (125.0 | ) | (2,091.3 | ) | (950.9 | ) | — | (3,167.2 | ) | ||||||||||
Dividends paid to noncontrolling interest | — | — | (2.5 | ) | — | (2.5 | ) | ||||||||||||
Impact of stock options and other | (0.6 | ) | — | — | — | (0.6 | ) | ||||||||||||
Net cash flows of financing activities | (2.6 | ) | (217.6 | ) | (51.6 | ) | 11.7 | (260.1 | ) | ||||||||||
Effect of exchange rate changes on cash and cash equivalents | — | (31.7 | ) | (11.8 | ) | — | (43.5 | ) | |||||||||||
Increase (decrease) in cash and cash equivalents | — | (0.4 | ) | (93.0 | ) | — | (93.4 | ) | |||||||||||
Cash and cash equivalents — beginning of period | — | 1.2 | 204.6 | — | 205.8 | ||||||||||||||
Cash and cash equivalents — end of period | $ | — | $ | 0.8 | $ | 111.6 | $ | — | $ | 112.4 | |||||||||
Intercompany Activity
The Parent Company and its Guarantor Subsidiaries participate in a cash pooling program. As part of this program, cash balances are generally swept on a daily basis between the Guarantor Subsidiaries’ bank accounts and those of the Parent Company. There are a significant number of the Company’s subsidiaries that participate in this cash pooling arrangement and there are thousands of transactions per week that occur between the Parent Company and Guarantor Subsidiaries, all of which are accounted for through the intercompany accounts.
Parent Company transactions include interest, dividends, tax payments and intercompany sales transactions related to administrative costs incurred by the Parent Company, which are billed to Guarantor Subsidiaries on a cost-plus basis. These costs are reported in the Parent’s SG&A expenses on the Consolidated Statement of Operations and Comprehensive Income (Loss) Information for the respective period(s). All intercompany transactions are presumed to be settled in cash when they occur and are included in operating activities on the Consolidated Statements of Cash Flows. Non-operating cash flow changes have been classified as financing activities beginning in 2009.
146
A summary of cash and non-cash transactions of the Parent Company’s intercompany account is provided below:
Year ended | ||||||||||||
(in millions) | Dec 31, 2017 | Dec 31, 2016 | Dec 31, 2015 | |||||||||
Beginning Balance | $ | 1,092.4 | $ | 1,114.5 | $ | 1,280.8 | ||||||
Non-cash transactions | ||||||||||||
Deferred tax | 53.8 | (27.6 | ) | (19.9 | ) | |||||||
Equity based awards | 13.3 | 5.2 | 11.7 | |||||||||
Foreign currency and other | 0.6 | 28.4 | 0.2 | |||||||||
Cash transactions | (137.4 | ) | (28.1 | ) | (158.3 | ) | ||||||
Ending Balance | $ | 1,022.7 | $ | 1,092.4 | $ | 1,114.5 | ||||||
Dividends
There were no dividend payments to the Parent Company from the Guarantor Subsidiaries in the twelve months ended December 31, 2017, 2016, and 2015.
Parent Company Long-Term Debt
At December 31, 2017 and 2016, the Parent Company was party to various long-term financing arrangements, as summarized below (in millions):
(in millions) | Dec 31, 2017 | Dec 31, 2016 | ||||||
5.75% Senior Notes due 2022 | $ | 600.0 | $ | 600.0 | ||||
Subordinated Convertible Notes due 2029 | 429.5 | 429.5 | ||||||
Debt discount | (253.1 | ) | (255.6 | ) | ||||
Debt issuance costs | (9.1 | ) | (10.6 | ) | ||||
Other | 9.0 | 9.0 | ||||||
Total Parent Company debt | 776.3 | 772.3 | ||||||
Less current maturities | — | — | ||||||
Parent Company Long-term debt | $ | 776.3 | $ | 772.3 | ||||
(in millions) | 2018 | 2019 | 2020 | 2021 | 2022 | |||||||||||||||
Debt maturities | $ | — | $ | — | $ | — | $ | — | $ | 600.0 | ||||||||||
Long-term debt related to the Parent Company is discussed in Note 11 - Long-Term Debt.
Commitments and Contingencies
For contingencies and guarantees related to the Parent Company, refer to Note 11 - Long-Term Debt and Note 19 - Commitments and Contingencies.
147
Schedule II
GENERAL CABLE CORPORATION AND SUBSIDIARIES
Valuation and Qualifying Accounts
(in millions)
For the Year Ended | |||||||||||
Dec 31, 2017 | Dec 31, 2016 | Dec 31, 2015 | |||||||||
Accounts Receivable Allowances: | |||||||||||
Beginning balance | $ | 20.2 | $ | 23.0 | $ | 32.0 | |||||
Impact of foreign currency exchange rate changes | 0.8 | (0.1 | ) | (4.2 | ) | ||||||
Provision | 4.1 | 5.1 | 8.1 | ||||||||
Write-offs | (1.1 | ) | (4.4 | ) | (3.1 | ) | |||||
Other | (4.8 | ) | (3.4 | ) | (9.8 | ) | |||||
Ending balance | $ | 19.2 | $ | 20.2 | $ | 23.0 | |||||
Deferred Tax Valuation Allowance: | |||||||||||
Beginning balance | $ | 177.1 | $ | 172.1 | $ | 145.4 | |||||
Additions charged to tax expense | 13.7 | 27.9 | 45.8 | ||||||||
Changes attributable to acquisitions and dispositions | (38.9 | ) | (20.5 | ) | 6.3 | ||||||
Changes impacting equity and other movements | 18.9 | 0.9 | (18.6 | ) | |||||||
Reductions from utilization and reassessments | (13.4 | ) | (3.3 | ) | (6.8 | ) | |||||
Ending balance | $ | 157.4 | $ | 177.1 | $ | 172.1 | |||||
148