Attached files
| file | filename |
|---|---|
| EX-32.2 - EX-32.2 - BIG 5 SPORTING GOODS Corp | bgfv-ex322_9.htm |
| EX-32.1 - EX-32.1 - BIG 5 SPORTING GOODS Corp | bgfv-ex321_7.htm |
| EX-31.2 - EX-31.2 - BIG 5 SPORTING GOODS Corp | bgfv-ex312_10.htm |
| EX-31.1 - EX-31.1 - BIG 5 SPORTING GOODS Corp | bgfv-ex311_8.htm |
| EX-23.1 - EX-23.1 - BIG 5 SPORTING GOODS Corp | bgfv-ex231_6.htm |
| EX-10.17 - EX-10.17 - BIG 5 SPORTING GOODS Corp | bgfv-ex1017_352.htm |
UNITED STATES
SECURITIES AND EXCHANGE COMMISSION
WASHINGTON, DC 20549
FORM 10-K
(Mark One)
|
☑ |
ANNUAL REPORT PURSUANT TO SECTION 13 OR 15(d) OF THE SECURITIES EXCHANGE ACT OF 1934 |
For the fiscal year ended December 31, 2017
OR
|
☐ |
TRANSITION REPORT PURSUANT TO SECTION 13 OR 15(d) OF THE SECURITIES EXCHANGE ACT OF 1934 |
For the transition period from _____________________ to ______________________
Commission file number: 000-49850
BIG 5 SPORTING GOODS CORPORATION
(Exact name of registrant as specified in its charter)
|
Delaware |
|
95-4388794 |
|
(State or Other Jurisdiction of Incorporation or Organization) |
|
(I.R.S. Employer Identification No.) |
|
|
|
|
|
2525 East El Segundo Boulevard El Segundo, California |
|
90245 |
|
(Address of Principal Executive Offices) |
|
(Zip Code) |
Registrant’s telephone number, including area code: (310) 536-0611
Securities registered pursuant to Section 12(b) of the Act:
|
Title of Each Class: |
|
Name of Each Exchange on which Registered: |
|
|
|
|
|
Common Stock, par value $0.01 per share |
|
The NASDAQ Stock Market LLC |
Securities registered pursuant to Section 12(g) of the Act:
None
Indicate by check mark if the registrant is a well-known seasoned issuer, as defined in Rule 405 of the Securities Act. Yes ☐ No ☑
Indicate by check mark if the registrant is not required to file reports pursuant to Section 13 or Section 15(d) of the Act. Yes ☐ No ☑
Indicate by check mark whether the registrant (1) has filed all reports required to be filed by Section 13 or 15(d) of the Securities Exchange Act of 1934 during the preceding 12 months (or for such shorter period that the registrant was required to file such reports), and (2) has been subject to such filing requirements for the past 90 days. Yes ☑ No ☐
Indicate by check mark whether the registrant has submitted electronically and posted on its corporate Website, if any, every Interactive Data File required to be submitted and posted pursuant to Rule 405 of Regulation S-T (§232.405 of this chapter) during the preceding 12 months (or for such shorter period that the registrant was required to submit and post such files). Yes ☑ No ☐
Indicate by check mark if disclosure of delinquent filers pursuant to Item 405 on Regulation S-K is not contained herein, and will not be contained, to the best of the registrant’s knowledge, in definitive proxy or information statements incorporated by reference in Part III of this Form 10-K or in any amendment to this Form 10-K. ☑
Indicate by check mark whether the registrant is a large accelerated filer, an accelerated filer, a non-accelerated filer, or a smaller reporting company. See the definitions of “large accelerated filer,” “accelerated filer” and “smaller reporting company” in Rule 12b-2 of the Exchange Act.
|
Large accelerated filer |
☐ |
Accelerated filer |
☑ |
|
Non-accelerated filer |
☐ (Do not check if a smaller reporting company) |
Smaller reporting company |
☐ |
|
Emerging growth company |
☐ |
|
|
Indicate by check mark whether the registrant is a shell company (as defined in Rule 12b-2 of the Act). Yes ☐ No ☑
The aggregate market value of the voting stock held by non-affiliates of the registrant was $176,236,713 as of July 2, 2017 (the last business day of the registrant’s most recently completed second fiscal quarter) based upon the closing price of the registrant’s common stock on the NASDAQ Stock Market LLC reported for June 30, 2017. Shares of common stock held by each executive officer and director and by each person who, as of such date, may be deemed to have beneficially owned more than 5% of the outstanding voting stock have been excluded in that such persons may be deemed to be affiliates of the registrant under certain circumstances. This determination of affiliate status is not necessarily a conclusive determination of affiliate status for any other purpose.
The registrant had 21,271,821 shares of common stock outstanding at February 21, 2018.
Documents Incorporated by Reference
Part III of this Form 10-K incorporates by reference certain information from the registrant’s 2018 definitive proxy statement (the “Proxy Statement”) to be filed with the Securities and Exchange Commission no later than 120 days after the end of the registrant’s fiscal year.
|
|
|
Page |
|
PART I |
|
|
|
|
4 |
|
|
|
9 |
|
|
|
18 |
|
|
|
18 |
|
|
|
20 |
|
|
|
20 |
|
|
|
|
|
|
PART II |
|
|
|
|
21 |
|
|
|
23 |
|
|
ITEM 7. MANAGEMENT’S DISCUSSION AND ANALYSIS OF FINANCIAL CONDITION AND RESULTS OF OPERATIONS |
|
25 |
|
ITEM 7A. QUANTITATIVE AND QUALITATIVE DISCLOSURES ABOUT MARKET RISK |
|
39 |
|
|
39 |
|
|
ITEM 9. CHANGES IN AND DISAGREEMENTS WITH ACCOUNTANTS ON ACCOUNTING AND FINANCIAL DISCLOSURE |
|
39 |
|
|
40 |
|
|
|
42 |
|
|
|
|
|
|
PART III |
|
|
|
ITEM 10. DIRECTORS, EXECUTIVE OFFICERS AND CORPORATE GOVERNANCE |
|
43 |
|
|
43 |
|
|
|
43 |
|
|
ITEM 13. CERTAIN RELATIONSHIPS AND RELATED TRANSACTIONS, AND DIRECTOR INDEPENDENCE |
|
43 |
|
|
43 |
|
|
|
|
|
|
PART IV |
|
|
|
|
44 |
|
|
|
|
|
|
|
45 |
|
|
|
48 |
|
|
|
F-1 |
This document includes certain “forward-looking statements” within the meaning of the Private Securities Litigation Reform Act of 1995. Such forward-looking statements relate to, among other things, our financial condition, our results of operations, our growth strategy and the business of our company generally. In some cases, you can identify such statements by terminology such as “may,” “could,” “project,” “estimate,” “potential,” “continue,” “should,” “expects,” “plans,” “anticipates,” “believes,” “intends” or other such terminology. These forward-looking statements involve known and unknown risks, uncertainties and other factors that may cause our actual results in future periods to differ materially from forecasted results. These risks and uncertainties include, among other things, changes in the consumer spending environment, fluctuations in consumer holiday spending patterns, increased competition from e-commerce retailers, breach of data security or other unauthorized disclosure of sensitive personal or confidential information, the competitive environment in the sporting goods industry in general and in our specific market areas, inflation, product availability and growth opportunities, changes in the current market for (or regulation of) firearm-related products, seasonal fluctuations, weather conditions, changes in cost of goods, operating expense fluctuations, increases in labor and benefit-related expense, changes in laws or regulations, including those related to tariffs and duties, lower-than-expected profitability of our e-commerce platform or cannibalization of sales from our existing store base which could occur as a result of operating our e-commerce platform, litigation risks, stockholder campaigns and proxy contests, disruption in product flow, changes in interest rates, credit availability, higher expense associated with sources of credit resulting from uncertainty in financial markets and economic conditions in general. Those and other risks and uncertainties are more fully described in Part I, Item 1A, Risk Factors, in this report. We caution that the risk factors set forth in this report are not exclusive. In addition, we conduct our business in a highly competitive and rapidly changing environment. Accordingly, new risk factors may arise. It is not possible for management to predict all such risk factors, nor to assess the impact of all such risk factors on our business or the extent to which any individual risk factor, or combination of factors, may cause results to differ materially from those contained in any forward-looking statement. We undertake no obligation to revise or update any forward-looking statement that may be made from time to time by us or on our behalf.
3
General
Big 5 Sporting Goods Corporation (“we,” “our,” “us” or the “Company”) is a leading sporting goods retailer in the western United States, operating 435 stores and an e-commerce platform under the “Big 5 Sporting Goods” name as of December 31, 2017. We provide a full-line product offering in a traditional sporting goods store format that averages approximately 11,000 square feet. In the fourth quarter of fiscal 2014, we launched our e-commerce platform to also offer selected products online. Our product mix includes athletic shoes, apparel and accessories, as well as a broad selection of outdoor and athletic equipment for team sports, fitness, camping, hunting, fishing, tennis, golf, winter and summer recreation and roller sports.
We believe that over our 63-year history we have developed a reputation with the competitive and recreational sporting goods customer as a convenient neighborhood sporting goods retailer that consistently delivers value on quality merchandise. Our stores carry a wide range of products at competitive prices from well-known brand name manufacturers, including adidas, Coleman, Columbia, Everlast, New Balance, Nike, Rawlings, Skechers, Spalding, Under Armour and Wilson. We also offer brand name merchandise produced exclusively for us, private label merchandise and specials on quality items we purchase through opportunistic buys of vendor over-stock and close-out merchandise. We reinforce our value reputation through weekly print advertising in major and local newspapers, direct mailers and digital marketing programs designed to generate customer traffic, drive net sales and build brand awareness. We also maintain social media sites to enhance distribution capabilities for our promotional offers and to enable communication with our customers.
Robert W. Miller co-founded our company in 1955 with the establishment of five retail locations in California. We sold World War II surplus items until 1963, when we began focusing exclusively on sporting goods and changed our trade name to “Big 5 Sporting Goods.” In 1971, we were acquired by Thrifty Corporation, which was subsequently purchased by Pacific Enterprises. In 1992, management bought our company in conjunction with Green Equity Investors, L.P., an affiliate of Leonard Green & Partners, L.P. In 1997, Robert W. Miller, Steven G. Miller and Green Equity Investors, L.P. recapitalized our company so that the majority of our common stock would be owned by our management and employees. In 2002, we completed an initial public offering of our common stock and became a publicly-traded company.
Our accumulated management experience and expertise in sporting goods merchandising, advertising, operations, store development and overall cost management have enabled us to historically generate profitable growth. We believe our historical success can be attributed to a value-based and execution-driven operating philosophy, a controlled growth strategy and a proven business model. Additional information regarding our management experience is available in Item 1, Business, under the sub-heading “Management Experience,” of this Annual Report on Form 10-K.
We are a holding company incorporated in Delaware on October 31, 1997. We conduct our business through Big 5 Corp., a 100%-owned subsidiary incorporated in Delaware on October 27, 1997. We conduct our gift card operations through Big 5 Services Corp., a 100%-owned subsidiary of Big 5 Corp. incorporated in Virginia on December 19, 2003.
Our corporate headquarters are located at 2525 East El Segundo Boulevard, El Segundo, California 90245. Our Internet address is www.big5sportinggoods.com. Our Annual Report on Form 10-K, our Quarterly Reports on Form 10-Q, our Current Reports on Form 8-K and amendments, if any, to those reports filed or furnished pursuant to Section 13(a) or 15(d) of the Securities Exchange Act, are available on our website, free of charge, as soon as reasonably practicable after we electronically file such material with, or furnish it to, the Securities and Exchange Commission.
4
Expansion and Store Development
Throughout our operating history, we have sought to expand our business with the addition of new stores through a disciplined strategy of controlled growth. Our expansion within the western United States has been systematic and designed to capitalize on our name recognition, economical store format and economies of scale related to distribution and advertising. Over the past five fiscal years, we have opened 49 stores including relocations, an average of 10 new stores annually, of which 51% were in California. Over the past three fiscal years, we have reduced our store openings to an average of approximately five new stores annually, including relocations, as we have maintained a cautious approach toward store expansion in the current retail environment, which included the liquidation and closure of certain major competitors in our markets in fiscal 2016. The following table reflects our store opening, closing and relocation activity during the periods indicated:
|
|
|
Stores Opened |
|
|
|
|
|
|
|
|
|
|||||||||
|
Year |
|
California |
|
|
Other Markets |
|
|
Total |
|
|
Stores Relocated |
|
Stores Closed |
|
Number of Stores at Period End |
|
||||
|
2013 |
|
|
8 |
|
|
|
9 |
|
|
|
17 |
|
|
(2) |
|
— |
|
|
429 |
|
|
2014 |
|
|
9 |
|
|
|
7 |
|
|
|
16 |
|
|
(4) |
|
(2) |
|
|
439 |
|
|
2015 |
|
|
3 |
|
|
|
2 |
|
|
|
5 |
|
|
(3) |
|
(3) |
|
|
438 |
|
|
2016 |
|
|
3 |
|
|
|
2 |
|
|
|
5 |
|
|
(1) |
|
(10) |
|
|
432 |
|
|
2017 |
|
|
2 |
|
|
|
4 |
|
|
|
6 |
|
|
(1) |
|
(2) |
|
|
435 |
|
Our store format enables us to have substantial flexibility regarding new store locations. We have successfully operated stores in major metropolitan areas and in areas with as few as 30,000 people. Our 11,000 average square foot store format differentiates us from superstores that typically average over 35,000 square feet, require larger target markets, are more expensive to operate and require higher net sales per store for profitability.
New store openings typically represent attractive investment opportunities due to the relatively low investment required and the relatively short time necessary before our stores typically become profitable. Our store format normally requires investments of approximately $0.5 million in fixtures, equipment and leasehold improvements, net of landlord allowances, and approximately $0.3 million in net working capital with limited pre-opening and real estate expense related to leased locations that are built to our specifications. We seek to maximize new store performance by staffing new store management with experienced personnel from our existing stores.
Our in-house store development personnel analyze new store locations with the assistance of real estate firms that specialize in retail properties. We seek expansion opportunities to further penetrate our established markets, develop recently entered markets and expand into new, contiguous markets with attractive demographic, competitive and economic profiles.
Management Experience
We believe the experience and tenure of our professional staff in the retail industry gives us a competitive advantage. The table below indicates the tenure of our professional staff in some of our key functional areas as of December 31, 2017:
|
|
|
Number of Employees |
|
|
Average Number of Years With Us |
|
||
|
Executive Management |
|
|
9 |
|
|
|
29 |
|
|
Vice Presidents |
|
|
7 |
|
|
|
27 |
|
|
Buyers |
|
|
22 |
|
|
|
16 |
|
|
Store Territory / District / Regional Supervisors |
|
|
51 |
|
|
|
23 |
|
|
Store Managers |
|
|
435 |
|
|
|
13 |
|
Merchandising
We target the competitive and recreational sporting goods customer with a full-line product offering at a wide variety of price points. We offer a product mix that includes athletic shoes, apparel and accessories, as well as a broad selection of outdoor and athletic equipment for team sports, fitness, camping, hunting, fishing, tennis, golf, winter and summer recreation and roller sports. We believe we offer consistent value to consumers by offering a distinctive merchandise mix that includes a combination of well-known brand name merchandise, merchandise produced exclusively for us under a manufacturer’s brand name, private label merchandise and specials on quality items we purchase through opportunistic buys of vendor over-stock and close-out merchandise.
5
Through our 63 years of experience across different demographic, competitive and economic markets, we have refined our merchandising strategy in an effort to offer a selection of products that meets customer demand. Specifically, we continue to strategically refine our merchandise and marketing strategies in order to better align our product mix and promotional efforts with today’s consumer. We have not made wholesale changes to our model, but rather have adjusted the model in an effort to broaden both our product offering and customer base. We have selectively refined our purchase strategy for certain product categories, and have expanded our assortment of branded products and introduced new products, some at higher price points.
The following table illustrates our mix of soft goods, which are non-durable items such as shirts and shoes, and hard goods, which are durable items such as exercise equipment and baseball gloves, as a percentage of net sales:
|
|
|
Fiscal Year |
|
|||||||||||||||||
|
|
|
2017 |
|
|
2016 |
|
|
2015 |
|
|
2014 |
|
|
2013 |
|
|||||
|
Soft goods |
|
|
|
|
|
|
|
|
|
|
|
|
|
|
|
|
|
|
|
|
|
Athletic and sport apparel |
|
|
20.6 |
% |
|
|
19.7 |
% |
|
|
19.4 |
% |
|
|
18.6 |
% |
|
|
17.6 |
% |
|
Athletic and sport footwear |
|
28.7 |
|
|
28.2 |
|
|
28.4 |
|
|
28.2 |
|
|
27.8 |
|
|||||
|
Total soft goods |
|
49.3 |
|
|
47.9 |
|
|
47.8 |
|
|
46.8 |
|
|
45.4 |
|
|||||
|
Hard goods |
|
50.7 |
|
|
52.1 |
|
|
52.2 |
|
|
53.2 |
|
|
54.6 |
|
|||||
|
Total |
|
|
100.0 |
% |
|
|
100.0 |
% |
|
|
100.0 |
% |
|
|
100.0 |
% |
|
|
100.0 |
% |
We purchase our popular branded merchandise from an extensive list of major sporting goods equipment, athletic footwear and apparel manufacturers. Below is a selection of some of the brands we carry:
|
adidas |
Coleman |
Footjoy |
Impex |
Nike |
Skechers |
|
Asics |
Columbia |
Franklin |
JanSport |
Rawlings |
Spalding |
|
Bearpaw |
Crosman |
Gildan |
Lifetime |
Razor |
Speedo |
|
Bushnell |
Daisy |
Head |
McDavid |
Remington |
Timex |
|
Callaway |
Dickies |
Heelys |
Mizuno |
Rollerblade |
Titleist |
|
Camp Chef |
Easton |
Hillerich & Bradsby |
Mossberg |
Russell Athletic |
Under Armour |
|
Carhartt |
Everlast |
Icon (Proform) |
Mueller Sports Medicine |
Saucony |
Wilson |
|
Casio |
Fila |
Igloo |
New Balance |
Shimano |
Winchester |
We believe we enjoy significant advantages in making opportunistic buys of vendor over-stock and close-out merchandise because of our strong vendor relationships, purchasing volume and rapid decision-making process. Our strong vendor relationships and purchasing volume also enable us to purchase merchandise produced exclusively for us under a manufacturer’s brand name which allows us to differentiate our product selection from competition, obtain volume pricing discounts from vendors and offer unique value to our customers. Our weekly advertising highlights our opportunistic buys together with merchandise produced exclusively for us in order to reinforce our reputation as a retailer that offers attractive values to our customers.
In order to complement our branded product offerings, we offer a variety of private label merchandise, which represents approximately 2% of our net sales. Our sale of private label merchandise enables us to provide our customers with a broader selection of quality merchandise at a wider range of price points and allows us the potential to achieve higher margins than on sales of comparable name brand products. Our private label items include shoes, apparel, camping equipment, fishing supplies and snowsport equipment. Private label merchandise is sold under trademarks owned by us or licensed by us from third parties. Our owned trademarks include Golden Bear, Harsh, Pacifica and Rugged Exposure, all of which are registered as federal trademarks. The renewal dates for these trademark registrations range from 2018 to 2027. Our licensed trademarks include Beach Feet, Bearpaw, Body Glove, Morrow and The Realm. One of the license agreements for these trademarks expires in 2018 and the other license agreements renew automatically on an annual basis unless terminated by either party upon prior written notice. We intend to renew these trademark registrations and license agreements if we are still using the trademarks in commerce and they continue to provide value to us at the time of renewal.
Seasonality influences our buying patterns and we purchase merchandise for seasonal activities in advance of a season and supplement our merchandise assortment as necessary and when possible during the season. We tailor our merchandise selection on a store-by-store basis in an effort to satisfy each region’s specific needs and seasonal buying habits. In the fourth fiscal quarter we normally experience higher inventory purchase volumes in anticipation of the winter and holiday selling season.
6
Our buyers, who average 16 years of experience with us, work in collaboration with senior management to determine and enhance product selection, promotion and pricing of our merchandise mix. Management utilizes integrated merchandising, business intelligence analytics, distribution, point-of-sale and financial information systems to continuously refine our merchandise mix, pricing strategy, advertising effectiveness and inventory levels to best serve the needs of our customers.
Advertising and Marketing
Through years of targeted advertising, we have solidified our reputation for offering quality products at attractive prices. We have advertised predominantly through weekly print advertisements since 1955. We typically utilize four-page color advertisements to highlight promotions across our merchandise categories. We believe our print advertising, which includes an average weekly distribution of approximately 12.1 million newspaper inserts or mailers, consistently reaches more households in our established markets than that of our full-line sporting goods competitors. For non-subscribers of newspapers, we provide our print advertisements through carrier delivery and direct mail. The consistency and reach of our print advertising programs drive sales and create high customer awareness of the name “Big 5 Sporting Goods.”
We use our own professional in-house advertising staff to generate our advertisements, including design, layout, production and media management. Our in-house advertising department provides management with the flexibility to react quickly to merchandise trends and to maximize the effectiveness of our weekly inserts and mailers. We are able to effectively target different population zones for our advertising expenditures. We place inserts in over 225 newspapers throughout our markets, supplemented in many areas by mailer distributions to create market saturation.
Though print advertising is the core of our promotional advertising, we also promote our products through digital marketing programs that include e-mail marketing (the “E-Team”), search engine marketing, social media including Facebook, Twitter and Instagram, mobile programs and other website initiatives.
Our digital promotional strategy is designed to provide additional opportunities to connect with potential customers and enable us to promote the Big 5 brand. Our e-mail marketing program invites our customers to subscribe to our E-Team for weekly advertisements, special deals and product information disseminated on a regular basis. We use search engine marketing methods as a means to reach those customers searching the Internet to gather information about our products. Within our social media program, our customers have the opportunity to engage in conversations with other sports-minded people and receive exclusive information about new products and unique weekly offers. All of these marketing methods are intended to simplify the shopping experience for our customers and further demonstrate our commitment to provide great brands at great values.
Our website features a broad representation of our product assortment and provides visibility of store inventory to our customers, thereby enabling them to determine if items featured on our website are in-stock in one or more of our store locations. In fiscal 2014, we launched our e-commerce platform to deliver an online shopping experience to our customers. We continue to develop our online capabilities to meet customer expectations of being able to shop at their convenience.
We have developed a strong cause marketing platform through our 18-year support of the March of Dimes annual fundraising campaign and numerous other charities and organizations throughout our marketplace. We also build brand awareness by providing sponsorship support of established, high profile events that benefit our customers’ active lifestyles, such as the “LA Marathon” in Los Angeles, California, and the “Duke City Marathon” in Albuquerque, New Mexico, for which we are the title sponsor.
Vendor Relationships
We have developed strong vendor relationships over the past 63 years. We currently purchase merchandise from over 700 vendors. In fiscal 2017, only one vendor represented greater than 5% of total purchases, at 11.0%. We believe current relationships with our vendors are good. We benefit from the long-term working relationships with vendors that our senior management and our buyers have carefully nurtured throughout our history.
Information Technology Systems
We have fully integrated information technology (“IT”) systems that support critical business functions, such as sales reporting, inventory management and distribution functions and provide pertinent information for financial reporting, as well as robust business intelligence and retail analytics tools. We manage IT solutions for e-commerce, email and networks that connect our employees to appropriate technology solutions and tools. This includes connecting our stores via a managed wide area network (“WAN”) connection for purchasing card (i.e., credit and debit card) encryption, tokenization, authorization and processing, as well as providing access to valuable tools such as collaboration, online training, workforce management, online hiring, Company website functions and corporate communications. Our separate disaster recovery facility and solutions provide redundant networks and applications to be used in the event of an emergency or unplanned outage. We believe our IT systems are effectively supporting our current operations and continue to provide a foundation for future growth and new business initiatives.
7
We operate a distribution center located in Riverside, California, that services all of our stores. The facility has 953,000 square feet of storage and office space. The distribution center warehouse management system is fully integrated with our enterprise-level IT systems and provides comprehensive warehousing and distribution capabilities. We generally distribute merchandise from our distribution center to our stores at least once per week, using our fleet of leased tractors, as well as contract carriers. Our lease for the distribution center is scheduled to expire on August 31, 2020, and includes two additional five-year renewal options.
In November 2015, we commenced operations at an additional 172,000 square foot distribution space adjacent to our distribution center in Riverside, California that enabled us to more efficiently fulfill our expanding distribution requirements. Our lease for this additional facility is scheduled to expire on August 31, 2020, and includes four additional five-year renewal options.
We operate a small distribution hub in Oregon to help mitigate fuel costs. This 12,000 square-foot facility enables us to ship full trailers of product from our Riverside distribution center to the Pacific Northwest, where we separate products for regional delivery. This distribution hub has greatly reduced the number of transportation miles logged to distribute our product to the Pacific Northwest. Our lease for the Oregon hub is scheduled to expire on January 31, 2019, and includes four additional five-year renewal options.
Industry and Competition
The retail market for sporting goods is highly competitive. In general, competition tends to fall into the following six basic categories:
Sporting Goods Superstores. Stores in this category typically are larger than 35,000 square feet and tend to be free-standing locations. These stores emphasize high volume sales and a large number of stock-keeping units. Examples include Academy Sports & Outdoors and Dick’s Sporting Goods.
Traditional Sporting Goods Stores. This category consists of traditional sporting goods chains, including us. These stores range in size from 5,000 to 20,000 square feet and are frequently located in regional malls and multi-store shopping centers. The traditional chains typically carry a varied assortment of merchandise and attempt to position themselves as convenient neighborhood stores. Sporting goods retailers operating stores within this category include Hibbett Sports and Modell’s.
Specialty Sporting Goods Stores. Specialty sporting goods retailers are stores that typically carry a wide assortment of one specific product category or brand, such as athletic shoes, golf, or outdoor equipment. Examples of these retailers include Bass Pro Shops, Cabela’s, Foot Locker, Sportsman’s Warehouse and REI. This category also includes pro shops that often are single-store operations.
Mass Merchandisers. This category includes discount retailers such as Wal-mart, Target and KMart and department stores such as JC Penney, Kohl’s and Sears. These stores range in size from 50,000 to 200,000 square feet and are primarily located in regional malls, shopping centers or on free-standing sites. Sporting goods merchandise and apparel represent a small portion of the total merchandise in these stores and the selection is often more limited than in other sporting goods retailers.
E-commerce Retailers. This category consists of many retailers that sell a broad array of new and used sporting goods products via e-commerce or catalogs, including Amazon.com. The types of retailers mentioned above may also sell their products through e-commerce. E-commerce has been a rapidly growing sales channel, particularly with younger consumers, and an increasing source of competition in the sporting goods retail industry.
Athletic and Sporting Goods Brands. This category consists of athletic and sporting goods brands that engage in direct-to-consumer sales through traditional retail channels, e-commerce or a combination of both. These brands may also sell their products to us and other competitors. Examples of brands that sell directly to consumers include Nike, adidas and Under Armour.
In competing with the retailers discussed above, we focus on what we believe are the primary factors of competition in the sporting goods retail industry, including breadth, depth, price and quality of merchandise offered; advertising; purchasing and pricing policies; experienced and knowledgeable personnel; customer service; effective sales techniques; direct involvement of senior officers in monitoring store operations; enterprise-level IT systems; and, convenience of store location and format.
8
As of December 31, 2017, we had nearly 9,000 active full and part-time employees. The General Teamsters, Airline, Aerospace and Allied Employees, Warehousemen, Drivers, Construction, Rock and Sand, Local Union No. 986, affiliated with the International Brotherhood of Teamsters (“Local 986”) represents approximately 450 hourly employees in our distribution center and select stores. In December 2017, we negotiated a new five-year contract with Local 986 for the covered distribution center employees, and in January 2018, we negotiated a new five-year contract with Local 986 for the covered store employees. Both contracts are retroactive to September 1, 2017, and expire on August 31, 2022. We have not had a strike or work stoppage in over 30 years, although such a disruption could have a significant negative impact on our business operations and financial results. We believe we provide working conditions and wages that are comparable to those offered by other retailers in the sporting goods industry and that employee relations are good.
Employee Training
We utilize an automated Learning Management System (“LMS”) and have developed comprehensive training that can be expressly tailored for each store and corporate position. Our LMS allows us to rapidly convey and track the dissemination of important information as it develops, such as product merchandising strategies, policy changes, safety rules, cash handling procedures, systems resolution and utilization, loss prevention updates and inventory control guidelines. All new store employees are assigned introductory LMS learning material as well as provided with a live orientation highlighting basic policies and responsibilities and our expectation that each employee strives to deliver excellence in customer service, product knowledge and salesmanship. New full-time store salespeople, cashiers and manager trainees receive supplementary training and evaluations specific to their job responsibilities and their ongoing development. The versatility of the LMS provides us with the ability to track and monitor many different types of training and the flexibility we need to deliver our message to widely dispersed personnel within the structure of our on-the-go work environment. Our employee training programs include self-directed online courses, live webinars, production of soft and hard reference materials, one-on-one training, hands-on training and progressive developmental training. In the stores, manager trainees are expected to complete a progressive series of outlines and evaluations in order to be considered for each successive level of advancement. Experienced store management training includes advanced merchandising, delegation, personnel management, scheduling, payroll control, harassment and discrimination prevention and loss prevention. Our overall training strategy and LMS enable us to efficiently manage, monitor, assign and report employee training results online and in real time.
Description of Service Marks and Trademarks
We use the “Big 5” and “Big 5 Sporting Goods” names as service marks in connection with our business operations and have registered these names as federal service marks. The renewal dates for these service mark registrations are in 2025 and 2023, respectively. We have also registered the names Golden Bear, Harsh, Pacifica and Rugged Exposure as federal trademarks under which we sell a variety of merchandise. The renewal dates for these trademark registrations range from 2018 to 2027. We intend to renew these service mark and trademark registrations if we are still using the marks in commerce and they continue to provide value to us at the time of renewal.
An investment in the Company entails risks and uncertainties including the following. You should carefully consider these risk factors when evaluating any investment in the Company. Any of these risks and uncertainties could cause our actual results to differ materially from the results contemplated by the forward-looking statements set forth herein, and could otherwise have a significant adverse impact on our business, prospects, financial condition or results of operations or on the price of our common stock.
Risks Related to Our Business and Industry
Disruptions in the overall economy and the financial markets may adversely impact our business and results of operations.
The retail industry can be greatly affected by macroeconomic factors, including changes in national, regional and local economic conditions, as well as consumers’ perceptions of such economic factors. In general, sales represent discretionary spending by our customers. Discretionary spending is affected by many factors, including general business conditions, interest rates, inflation, consumer debt levels, the availability of consumer credit, currency exchange rates, taxation, gasoline prices, income, unemployment trends, home values and other matters that influence consumer confidence and spending. Many of these factors are outside of our control. We have experienced in the past, and may continue to experience, increased inflationary pressure on our product costs. Our customers’ purchases of discretionary items, including our products, generally decline during periods when disposable income is lower, when prices increase in response to rising costs, or in periods of actual or perceived unfavorable economic conditions. Deterioration of the consumer spending environment could be harmful to our financial position and results of operations, could adversely affect our ability to comply with covenants under our credit facility and, as a result, may negatively impact our ability to continue payment of our quarterly dividend, to repurchase our stock and to open additional stores in the manner that we have in the past.
9
Intense competition in the sporting goods industry could limit our growth and reduce our profitability.
The retail market for sporting goods is highly fragmented and intensely competitive. We compete directly or indirectly with the following categories of companies, through traditional retail and e-commerce channels:
|
|
• |
sporting goods superstores, such as Academy Sports & Outdoors and Dick’s Sporting Goods; |
|
|
• |
traditional sporting goods stores and chains, such as Hibbett Sports and Modell’s; |
|
|
• |
specialty sporting goods shops and pro shops, such as Bass Pro Shops, Cabela’s, Foot Locker, Sportsman’s Warehouse and REI; |
|
|
• |
mass merchandisers, discount stores and department stores, such as Wal-Mart, Target, Kohl’s, JC Penney, Kmart and Sears; |
|
|
• |
e-commerce retailers, such as Amazon.com; and |
|
|
• |
athletic and sporting goods brands that engage in direct-to-consumer sales, such as Nike, adidas and Under Armour. |
Some of our competitors have a larger number of stores and greater financial, distribution, marketing and other resources than we have. If our competitors reduce their prices, it may be difficult for us to retain market share without reducing our prices, which could impact our margins. As a result of this competition, we may also need to spend more on advertising and promotion than we anticipate. Increased competition in our current markets or the adoption or proliferation by competitors of innovative store formats, aggressive pricing strategies and retail sales methods, such as e-commerce, could cause us to lose market share and could have a material adverse effect on our business.
While e-commerce has been a rapidly growing sales channel and an increasing source of competition in the retail industry, sales from our e-commerce channel are not material to our operations. We began selling products through our e-commerce platform in late fiscal 2014. We have no assurance that our e-commerce efforts will prove profitable, whether due to product preferences of online buyers, ability to compete with other (often more established) online retailers, or for other reasons, such as the cannibalization of sales from our existing store base. If we are unable to compete successfully, our operating results may suffer.
If we fail to anticipate changes in consumer preferences, we may experience lower net sales, higher inventory, higher inventory markdowns and lower margins.
Our products must appeal to a broad range of consumers whose preferences cannot be predicted with certainty. These preferences are also subject to change and can be impacted by various factors, including sports participation levels in our market areas, the performance of sports teams for which we sell licensed products, weather conditions in our market areas and regulatory or political changes. Our success depends upon our ability to anticipate and respond in a timely manner to consumer trends and consumers’ participation in sports and other recreational activities for which we sell products. If we fail to identify and respond in a timely manner to these changes, our net sales and profitability may decline. In addition, because we often make commitments to purchase products from our vendors up to nine months in advance of the proposed delivery, if we misjudge the market for our merchandise or conditions change after we have committed to purchase products, we may over-stock unpopular products and be forced to take inventory markdowns that could have a negative impact on profitability.
Our quarterly net sales and operating results, reported and expected, can fluctuate substantially, which may adversely affect the market price of our common stock.
Our net and same store sales and results of operations, reported and expected, have fluctuated in the past and will vary from quarter to quarter in the future. These fluctuations may adversely affect our financial condition and the market price of our common stock. A number of factors, many of which are outside our control, have historically caused and will continue to cause variations in our quarterly net and same store sales and operating results, including changes in consumer demand for our products, competition in our markets, inflation, changes in pricing or other actions taken by our competitors, weather conditions in our markets, natural disasters, litigation, political events, government regulation, changes in accounting standards, changes in management’s accounting estimates or assumptions and economic conditions, including those specific to our western United States markets.
10
Increased costs or declines in the effectiveness of print advertising, or a reduction in publishers of print advertising, could cause our operating results to suffer.
Our business relies heavily on print advertising. We utilize print advertising programs that include newspaper inserts, direct mailers and courier-delivered inserts in order to effectively deliver our message to our targeted markets. Newspaper circulation and readership has been declining, which could limit the number of people who receive or read our advertisements. Additionally, declining newspaper demand is adversely impacting newspaper publishers and could jeopardize their ability to operate, which could restrict our ability to advertise in the manner we have in the past. In an effort to continue to deliver our message to consumers, we have been shifting some of our advertising from print to digital. If these efforts fail or we are unable to develop other effective strategies to reach potential customers within our desired markets, awareness of our stores, products and promotions could decline and our net sales could suffer. In addition, an increase in the cost of print advertising, paper or postal or other delivery fees could increase the cost of our advertising and adversely affect our operating results.
Because our stores are concentrated in the western United States, we are subject to regional risks.
Our stores are located in the western United States. Because of this, we are subject to regional risks, such as the economy, including downturns in the housing market, state financial conditions, unemployment and gas prices. Other regional risks include adverse weather and climate conditions, power outages, earthquakes and other natural disasters specific to the states in which we operate. For example, particularly in California where we have a high concentration of stores, seasonal factors such as unfavorable weather conditions or other localized conditions such as flooding, drought, fires, earthquakes or electricity blackouts could impact our sales and harm our operations. State and local regulatory compliance, such as with recent minimum wage increases in our market areas, also can impact our financial results. Economic downturns or other adverse regional events could have an adverse impact upon our net sales and profitability and our ability to open additional stores in the manner that we have in the past.
A significant amount of our sales is impacted by seasonal weather conditions in our markets.
Because many of the products we sell are used for seasonal outdoor sporting and recreational activities, our business is significantly impacted by weather and climate conditions in our markets. For example, our winter sports and apparel sales are dependent on cold winter weather and snowfall in our markets, and can be negatively impacted by unseasonably warm or dry weather in our markets during the winter product selling season. Conversely, sales of our spring products and summer products, such as baseball gear and camping and water sports equipment, can be adversely impacted by unseasonably cold or wet weather in those periods. Accordingly, our sales results and financial condition will typically suffer when weather and climate patterns do not conform to seasonal norms.
Our business is subject to seasonal fluctuations, and unanticipated changes in our customers’ seasonal buying patterns can impact our business.
We experience seasonal fluctuations in our net sales and operating results. Seasonality influences our buying patterns which directly impacts our merchandise and accounts payable levels and cash flows. We purchase merchandise for seasonal activities in advance of a season and supplement our merchandise assortment as necessary and when possible during the season. Our efforts to replenish products during a season are not always successful. In the fourth fiscal quarter, which includes the holiday selling season and the start of the winter selling season, we normally experience higher inventory purchase volumes and increased expense for staffing and advertising. If we miscalculate the consumer demand for our products generally or for our product mix in advance of a season, our net sales can decline, which can harm our financial performance. A significant shortfall from expected net sales can negatively impact our annual operating results.
If we lose key management or are unable to attract and retain the talent required for our business, our operating results could suffer.
Our future success depends to a significant degree on the skills, experience and efforts of Steven G. Miller, our Chairman, President and Chief Executive Officer, and other key personnel with longstanding tenure who are not obligated to stay with us. The loss of the services of any of these individuals for any reason could harm our business and operations. In addition, as our business grows, we will need to attract and retain additional qualified personnel in a timely manner and develop, train and manage an increasing number of management-level sales associates and other employees. Competition for qualified employees could require us to pay higher wages and benefits to attract a sufficient number of qualified employees, and increases in the minimum wage or other employee benefit costs could increase our operating expense. If we are unable to attract and retain personnel as needed in the future, our net sales growth and operating results may suffer.
11
All of our stores rely on a single distribution center. Any disruption or other operational difficulties at this distribution center could reduce our net sales or increase our operating expense.
We rely on a single distribution center located in Riverside, California to service our business. Any natural disaster or other serious disruption to the distribution center due to fire, earthquake or any other cause could damage a significant portion of our inventory and could materially impair both our ability to adequately stock our stores and our net sales and profitability. If the security measures used at our distribution center do not prevent inventory theft, our gross profit may significantly decrease. Our distribution center is staffed in part by employees represented by Local 986. We have not had a strike or work stoppage in over 30 years, although such a disruption could have a significant negative impact on our business operations and financial results. Further, in the event that we are unable to grow our net sales sufficiently to allow us to leverage the costs of this distribution center in the manner we anticipate, our financial results could be negatively impacted.
Additionally, because we rely on a single distribution center, our store growth could be limited to the geographic areas to which we can efficiently distribute products from this facility. Our store growth also could be limited if our distribution center reaches full capacity. Such constraints could result in a loss of market share and our inability to execute our business plan, which could have a material adverse effect on our financial condition and results of operations.
If we are unable to successfully implement our controlled growth strategy or manage our growing business, our future operating results could suffer.
One of our strategies includes opening profitable stores in new and existing markets. Our ability to successfully implement and capitalize on our growth strategy could be negatively affected by various factors including:
|
|
• |
we may slow our expansion efforts, or close underperforming stores, as a result of challenging conditions in the retail industry and the economy overall; |
|
|
• |
we may not be able to find suitable sites available for leasing within our existing market areas, and our distribution capabilities may limit our ability to expand beyond our current market areas; |
|
|
• |
we may not be able to negotiate acceptable lease terms; |
|
|
• |
we may not be able to hire and retain qualified store personnel; and |
|
|
• |
we may not have the financial resources necessary to fund our expansion plans. |
In the past three fiscal years, we have slowed our store openings and strategically closed certain stores as we maintained a cautious approach toward store expansion in the current retail environment, which included the liquidation and closure of certain major competitors in our markets. If we are unable to resume our store expansion efforts for any of the reasons discussed above, our operating results could suffer.
In addition, our expansion in new and existing markets may present competitive, merchandising, marketing and distribution challenges that differ from our current challenges. These potential new challenges include competition among our stores, added strain on our distribution center, additional information to be processed by our IT systems, diversion of management attention from ongoing operations and challenges associated with managing a larger enterprise. We face additional challenges in entering new markets, including consumers’ lack of awareness of us, difficulties in hiring personnel and problems due to our unfamiliarity with local real estate markets and demographics. New markets may also have different competitive conditions, consumer tastes, responsiveness to print advertising and discretionary spending patterns than our existing markets. To the extent that we are not able to meet these new challenges, our net sales could decrease and our operating expense could increase.
Our information technology systems are critical to the functioning of our business and are vulnerable to failure, damage, theft or intrusion that could harm our operations.
Our success, in particular our ability to successfully manage inventory levels and process customer transactions, largely depends upon the efficient operation of our information technology (“IT”) systems. We use IT systems to track inventory at the store level and aggregate daily sales information, communicate customer information and process purchasing card transactions, process shipments of goods and report financial information. These systems and our operations are vulnerable to damage or interruption from:
|
|
• |
earthquake, fire, flood and other natural disasters; |
|
|
• |
power loss, computer systems failures, Internet and telecommunications or data network failures, third-party vendor system failures, operator negligence, improper operation by or supervision of employees; |
12
|
|
• |
physical and electronic loss of data, security breaches, misappropriation, data theft and similar events; and |
|
|
• |
computer viruses, worms, Trojan horses, intrusions, or other external threats. |
Any failure of our IT systems that causes an interruption in our operations, loss of data, or a decrease in inventory tracking could result in reduced net sales and profitability. Additionally, if any data intrusion, security breach, misappropriation or theft were to occur, we could incur significant costs in responding to such event, including responding to any resulting claims, litigation or investigations, which could harm our operating results.
Breach of data security or other unauthorized disclosure of sensitive or confidential information could harm our business, employees and standing with our customers.
The protection of our customer, employee and business data is critical to us. Our business, like that of most retailers, involves the receipt, storage and transmission of customers’ personal information, consumer preferences and payment card information, as well as confidential information about our employees, our suppliers and our Company. We rely on commercially available systems, software, tools and monitoring to provide security for processing, transmission and storage of all such data, including confidential information. Despite the security measures we have in place, our facilities and systems, and those of our third-party service providers, may be vulnerable to security breaches, acts of vandalism, computer viruses, data theft, misplaced or lost data, programming or human errors, or other similar events. Unauthorized parties may attempt to gain access to our systems or information through fraud or other means, including deceiving our employees or third party service providers. The methods used to obtain unauthorized access, disable or degrade service, or sabotage systems are also constantly changing and evolving, and may be difficult to anticipate or detect for long periods of time. We have implemented and regularly review and update our control systems, processes and procedures to protect against unauthorized access to or use of secured data and to prevent data loss. However, the ever-evolving threats mean we must continually evaluate and adapt our systems and processes, and there is no guarantee that they will be adequate to safeguard against all data security breaches or misuses of data. Any security breach involving the misappropriation, loss or other unauthorized disclosure of customer payment card or personal information or employee personal or confidential information, whether by us or our vendors, could damage our reputation, expose us to risk of litigation and liability, disrupt our operations, harm our business and have an adverse impact upon our net sales and profitability. In addition, as the regulatory environment related to information security, data collection and use, and privacy becomes increasingly rigorous, with new and changing requirements applicable to our business, compliance with those requirements could also result in additional costs.
If our suppliers do not provide sufficient quantities of products, our net sales and profitability could suffer.
We purchase merchandise from over 700 vendors. Although only one vendor represented more than 5.0% of our total purchases during fiscal 2017, our dependence on principal suppliers involves risk. Our 20 largest vendors collectively accounted for 40.9% of our total purchases during fiscal 2017. If there is a disruption in supply from a principal supplier or distributor, we may be unable to obtain merchandise that we desire to sell and that consumers desire to purchase. A vendor could discontinue or restrict selling products to us at any time for reasons that may or may not be within our control. In recent years, athletic and sporting goods brands have been increasingly developing the direct-to-consumer segments of their businesses, and this shift could result in restrictions on the products available for us to purchase and sell. Our net sales and profitability could decline if we are unable to promptly replace a product vendor who is unwilling or unable to satisfy our requirements with a vendor providing equally appealing products. Moreover, many of our suppliers provide us with incentives, such as return privileges, volume purchase allowances and co-operative advertising. A decline or discontinuation of these incentives could reduce our profits.
Because many of the products that we sell are manufactured abroad, we may face delays, increased cost or quality control deficiencies in the importation of these products, which could reduce our net sales and profitability.
Like many other sporting goods retailers, a significant portion of the products that we purchase for resale, including those purchased from domestic suppliers, is manufactured abroad in China and other countries. In addition, we believe most, if not all, of our private label merchandise is manufactured abroad. Foreign imports subject us to the risks of changes in, or the imposition of new, import tariffs, duties or quotas, new restrictions on imports, loss of “most favored nation” status with the United States for a particular foreign country, antidumping or countervailing duty orders, retaliatory actions in response to illegal trade practices, work stoppages, delays in shipment, freight expense increases, product cost increases due to foreign currency fluctuations or revaluations and economic uncertainties. If any of these or other factors were to cause a disruption of trade from the countries in which the suppliers of our vendors are located or impose additional costs in connection with the purchase of our products, we may be unable to obtain sufficient quantities of products to satisfy our requirements and our results of operations could be adversely affected.
To the extent that any foreign manufacturers which supply products to us directly or indirectly utilize quality control standards, labor practices or other practices that vary from those legally mandated or commonly accepted in the United States, we could be hurt by any resulting negative publicity or, in some cases, face potential liability.
13
In addition, instability in the political and economic environments of the countries in which our vendors or we obtain our products, or general international instability, could have an adverse effect on our operations. In the event of disruptions or delays in supply due to economic or political conditions in foreign countries, such disruptions or delays could adversely affect our results of operations unless and until alternative supply arrangements could be made. In addition, merchandise purchased from alternative sources may be of lesser quality or more expensive than the merchandise we currently purchase abroad.
Disruptions in transportation, including disruptions at shipping ports through which our products are imported, could prevent us from timely distribution and delivery of inventory, which could reduce our net sales and profitability.
A substantial amount of our inventory is manufactured abroad. From time to time, shipping ports experience capacity constraints, labor strikes, work stoppages or other disruptions that may delay the delivery of imported products. A contract dispute at the ports through which our products travel, particularly the Ports of Los Angeles and Long Beach, could lead to protracted delays in the movement of our products, which could further delay the delivery of products to our stores and impact net sales and profitability. In addition, other conditions outside of our control, such as adverse weather conditions or acts of terrorism, could significantly disrupt operations at shipping ports or otherwise impact transportation of the imported merchandise we sell.
Future disruptions in transportation services or at a shipping port at which our products are received may result in delays in the transportation of such products to our distribution center and may ultimately delay the stocking of our stores with the affected merchandise. As a result, our net sales and profitability could decline.
Our costs may change as a result of currency exchange rate fluctuations or inflation in the purchase cost of merchandise manufactured abroad.
We and our suppliers source goods from various countries, including China, and thus changes in the value of the U.S. dollar compared to other currencies, or foreign labor and raw material cost inflation, may affect the cost of goods that we purchase. If the cost of goods that we purchase increases, we may not be able to similarly increase the retail prices of goods that we charge consumers without impacting our sales and our operating profits may suffer.
Increases in transportation costs due to rising fuel costs, climate change regulation and other factors may negatively impact our operating results.
We rely upon various means of transportation, including ship and truck, to deliver products from vendors to our distribution center and from our distribution center to our stores. Consequently, our results can vary depending upon the price of fuel. The price of oil has fluctuated drastically over the last few years, creating volatility in our fuel costs. In addition, efforts to combat climate change through reduction of greenhouse gases may result in higher fuel costs through taxation or other means. Any such future increases in fuel costs would increase our transportation costs for delivery of product to our distribution center and distribution to our stores, as well as our vendors’ transportation costs, which could decrease our operating profits.
In addition, labor shortages or other factors in the transportation industry could negatively affect transportation costs and our ability to supply our stores in a timely manner. In particular, our business is highly dependent on the trucking industry to deliver products to our distribution center and our stores. Our operating results may be adversely affected if we or our vendors are unable to secure adequate trucking resources at competitive prices to fulfill our delivery schedules to our distribution center or stores.
Terrorism and the uncertainty of war may harm our operating results.
Terrorist attacks or acts of war may cause damage or disruption to us and our employees, facilities, information systems, vendors and customers, which could significantly impact our net sales, profitability and financial condition. Terrorist attacks could also have a significant impact on ports or international shipping on which we are substantially dependent for the supply of much of the merchandise we sell. Our corporate headquarters is located near Los Angeles International Airport and the Port of Los Angeles, which have been identified as potential terrorism targets. The potential for future terrorist attacks, the national and international responses to terrorist attacks and other acts of war or hostility may cause greater uncertainty and cause our business to suffer in ways that we cannot currently predict. Military action taken in response to such attacks could also have a short or long-term negative economic impact upon the financial markets, international shipping and our business in general.
14
Risks Related to Our Capital Structure
Our future cash flows may not be sufficient to meet our obligations and we might have difficulty obtaining more financing or refinancing our existing indebtedness on favorable terms.
As of December 31, 2017, the aggregate amount of our outstanding indebtedness, including capital lease obligations, was $49.6 million. We have historically maintained a leveraged financial position. This means:
|
|
• |
our ability to obtain financing in the future for working capital, capital expenditures and general corporate purposes might be impeded; |
|
|
• |
we are more vulnerable to economic downturns and our ability to withstand competitive pressures is limited; and |
|
|
• |
we are more vulnerable to increases in interest rates, which may affect our interest expense and negatively impact our operating results. |
If our business declines, our future cash flows might not be sufficient to meet our obligations and commitments.
If we fail to make any required payment under our revolving credit facility, our debt payments may be accelerated under this agreement. In addition, in the event of bankruptcy, insolvency or a material breach of any covenant contained in our revolving credit facility, our debt may be accelerated. This acceleration could also result in the acceleration of other indebtedness that we may have outstanding at that time.
The level of our indebtedness, and our ability to service our indebtedness, is directly affected by our cash flows from operations. If we are unable to generate sufficient cash flows from operations to meet our obligations, commitments and covenants of our revolving credit facility, we may be required to refinance or restructure our indebtedness, raise additional debt or equity capital, sell material assets or operations, delay or forego expansion opportunities, or cease or curtail our quarterly dividends or share repurchase plans. These alternative strategies might not be effected on satisfactory terms, if at all.
The terms of our revolving credit facility impose operating and financial restrictions on us, which may impair our ability to respond to changing business and economic conditions.
The terms of our revolving credit facility impose operating and financial restrictions on us, including, among other things, covenants that require us to maintain a fixed-charge coverage ratio of not less than 1.0 to 1.0 in certain circumstances, restrictions on our ability to incur liens, incur additional indebtedness, transfer or dispose of assets, change the nature of the business, guarantee obligations, pay dividends or make other distributions or repurchase stock, and make advances, loans or investments. For example, our ability to engage in the foregoing transactions will depend upon, among other things, our level of indebtedness at the time of the proposed transaction and whether we are in default under our revolving credit facility. As a result, our ability to respond to changing business and economic conditions and to secure additional financing, if needed, may be significantly restricted, and we may be prevented from engaging in transactions that might further our growth strategy or otherwise benefit us and our stockholders without obtaining consent from our lenders. In addition, our revolving credit facility is secured by a perfected security interest in our assets. In the event of our insolvency, liquidation, dissolution or reorganization, the lenders under our revolving credit facility would be entitled to payment in full from our assets before distributions, if any, were made to our stockholders.
Disruptions in the economy and financial markets may adversely impact our lenders.
Volatility in capital and credit markets can impact the ability of financial institutions to meet their lending obligations. Based on information available to us, all of the lenders under our revolving credit facility are currently able to fulfill their commitments thereunder. However, circumstances could arise that may impact their ability to fund their obligations in the future. Although we believe the commitments from our lenders under the revolving credit facility, together with our cash on hand and anticipated operating cash flows, should be sufficient to meet our near-term borrowing requirements, if Wells Fargo Bank, National Association, our principal lender, or any other lender, is for any reason unable to perform its lending or administrative commitments under the facility, then disruptions to our business could result and may require us to replace this facility with a new facility or to raise capital from alternative sources on less favorable terms, including higher rates of interest.
15
Risks Related to Regulatory, Legislative and Legal Matters
Current and future government regulation may negatively impact demand for our products and increase our cost of conducting business.
The conduct of our business, and the distribution, sale, advertising, labeling, safety, transportation and use of many of our products are subject to various laws and regulations administered by federal, state and local governmental agencies in the United States. These laws and regulations may change, sometimes dramatically, as a result of political, economic or social events. Changes in laws, regulations or governmental policy may alter the environment in which we do business and the demand for our products and, therefore, may impact our financial results or increase our liabilities. Some of these laws and regulations include:
|
|
• |
laws and regulations governing the manner in which we advertise or sell our products; |
|
|
• |
laws and regulations that prohibit or limit the sale, in certain localities, of certain products we offer, such as firearm-related products; |
|
|
• |
laws and regulations governing the activities for which we sell products, such as hunting and fishing; |
|
|
• |
laws and regulations governing consumer products generally, such as the federal Consumer Product Safety Act and Consumer Product Safety Improvement Act, as well as similar state laws; |
|
|
• |
labor and employment laws, such as minimum wage or living wage laws, paid time off and other wage and hour laws; |
|
|
• |
laws requiring mandatory health insurance for employees, such as the Affordable Care Act; and |
|
|
• |
U.S. customs laws and regulations pertaining to duties and tariffs, including proper item classification, quotas and payment of duties and tariffs. |
Changes in these and other laws and regulations or additional regulation could cause the demand for and sales of our products to decrease. Moreover, complying with increased or changed regulations could cause our cost of obtaining products and our operating expense to increase. This could adversely affect our net sales and profitability.
We may be subject to periodic litigation that may adversely affect our business and financial performance.
From time to time, we may be involved in lawsuits and regulatory actions relating to our business, certain of which may be maintained in jurisdictions with reputations for aggressive application of laws and procedures against corporate defendants. Due to the inherent uncertainties of litigation and regulatory proceedings, we cannot accurately predict the ultimate outcome of any such proceedings. An unfavorable outcome could have a material adverse impact on our business, results of operations and financial condition. In addition, regardless of the outcome of any litigation or regulatory proceedings, these proceedings could result in substantial costs and may require that we devote substantial resources to defend against these claims, which could impact our results of operations.
In particular, we may be involved in lawsuits related to employment, advertising and other matters, including class action lawsuits brought against us for alleged violations of the Fair Labor Standards Act, state wage and hour laws, state or federal advertising laws and other laws. An unfavorable outcome or settlement in any such proceeding could, in addition to requiring us to pay any settlement or judgment amount, increase our operating expense as a consequence of any resulting changes we might be required to make in employment, advertising or other business practices.
In addition, we sell products manufactured by third parties, some of which may be defective. Many such products are manufactured overseas in countries which may utilize quality control standards that vary from those legally allowed or commonly accepted in the United States, which may increase our risk that such products may be defective. If any products that we sell were to cause physical injury or injury to property, the injured party or parties could bring claims against us as the retailer of the products based upon strict product liability. In addition, our products are subject to the federal Consumer Product Safety Act and the Consumer Product Safety Improvement Act, which empower the Consumer Product Safety Commission to protect consumers from hazardous products. The Consumer Product Safety Commission has the authority to exclude from the market and recall certain consumer products that are found to be hazardous. Similar laws exist in some states and cities in the United States. If we fail to comply with government and industry safety standards or reporting requirements, we may be subject to claims, lawsuits, product recalls, fines and negative publicity that could harm our results of operations and financial condition.
16
We also sell firearm-related products, which may be associated with an increased risk of injury and related lawsuits. We may incur losses due to lawsuits relating to our performance of background checks on firearms purchases as mandated by state and federal law or the improper use of firearms sold by us, including lawsuits by individuals, municipalities or other organizations attempting to recover damages or costs from firearms manufacturers and retailers relating to the misuse or release of firearms. Commencement of these lawsuits against us could reduce our net sales and decrease our profitability. The sale of firearm-related products also may present reputational risks and negative publicity that could affect consumers’ perception of us or willingness to shop with us, which could harm our results of operations and financial condition.
Our insurance coverage may not be adequate to cover claims that could be asserted against us. If a successful claim was to be brought against us in excess of our insurance coverage, or for which we have no insurance coverage, it could harm our business. Even unsuccessful claims could result in the expenditure of substantial funds and management time and could have a negative impact on our business.
The sale of firearm-related products is subject to strict regulation, which could affect our operating results.
Because we sell firearm-related products, we are required to comply with federal, state and local laws and regulations pertaining to the purchase, storage, transfer and sale of such products. These laws and regulations require us to, among other things, obtain and maintain federal, state or local permits or licenses in order to sell firearms, ensure that all purchasers of firearms are subjected to a pre-sale background check and other requirements, record the details of each firearm sale on appropriate government-issued forms, record each receipt or transfer of a firearm at our distribution center or any store location on acquisition and disposition records, and maintain these records for a specified period of time. Additionally, in certain jurisdictions we are required to obtain a license to sell ammunition or record the details of each ammunition sale and maintain these records for a specified period of time. We also are required to timely respond to traces of firearms by law enforcement agencies. Over the past several years, the purchase and sale of firearm-related products has been the subject of increased federal, state and local regulation, such as recently enacted requirements related to performing a safe-handling demonstration of firearms in California. These regulatory efforts are likely to continue in our current markets and other markets into which we may expand. If enacted, new laws and regulations could limit the types of firearm-related products that we are permitted to purchase and sell, impose new restrictions and requirements on the manner in which we purchase, sell and store these products, and impact our ability to offer these products in certain retail locations or markets. If we fail to comply with existing or newly enacted laws and regulations relating to the purchase and sale of firearm-related products, our permits or licenses to sell firearm-related products at our stores or maintain inventory of firearm-related products at our distribution center may be suspended or revoked. If this occurs, our net sales and profitability could suffer. Further, complying with increased regulation relating to the sale of firearm-related products could cause our operating expense to increase and this could adversely affect our results of operations.
Changes in accounting standards and subjective assumptions, estimates and judgments by management related to complex accounting matters could significantly affect our financial results.
Accounting principles generally accepted in the United States of America (“GAAP”) and related accounting pronouncements, implementation guidelines and interpretations with regard to a wide range of matters that are relevant to our business, such as revenue recognition; lease accounting; income taxes; the carrying amount of merchandise inventories, property and equipment and goodwill; valuation allowances for receivables, sales returns and deferred income tax assets; estimates related to gift card breakage and the valuation of share-based compensation awards; and obligations related to litigation, self-insurance liabilities and employee benefits are highly complex and may involve many subjective assumptions, estimates and judgments by our management, such as the assumptions used in our goodwill impairment analysis as of December 31, 2017. Changes in these rules or their interpretation or changes in underlying assumptions, estimates or judgments by our management could significantly change our reported or expected financial performance.
Risks Related to Investing in Our Common Stock
The declaration of discretionary dividend payments or the repurchase of our common stock pursuant to our share repurchase program may not continue.
We currently pay quarterly dividends subject to capital availability and periodic determinations by our Board of Directors that cash dividends are in the best interest of us and our stockholders. Our dividend policy may be affected by, among other items, business conditions, our financial condition, our views on potential future capital requirements, the terms of our debt instruments, legal risks, changes in federal income tax law and challenges to our business model. Our dividend policy may change from time to time and we may or may not continue to declare discretionary dividend payments. Additionally, although we have a share repurchase program authorized by our Board of Directors, we are not obligated to make any purchases under the program and we may reduce the amount of purchases we make under the program or discontinue the program at any time.
17
Our anti-takeover provisions could prevent or delay a change in control of our Company, even if such change of control would be beneficial to our stockholders.
Provisions of our amended and restated certificate of incorporation and amended and restated bylaws as well as provisions of Delaware law could discourage, delay or prevent a merger, acquisition or other change in control of our Company, even if such change in control would be beneficial to our stockholders. The provisions of our amended and restated certificate of incorporation, amended and restated bylaws and Delaware law that could discourage, delay or prevent a merger, acquisition or other change in control include:
|
|
• |
a Board of Directors that is classified such that two to three of the seven directors, depending on classification, are elected each year; |
|
|
• |
limitations on the ability of stockholders to call special meetings of stockholders; |
|
|
• |
prohibition of stockholder action by written consent and requiring all stockholder actions to be taken at a meeting of our stockholders; |
|
|
• |
a requirement in our certificate of incorporation that stockholder amendments to our bylaws and certain amendments to our certificate of incorporation must be approved by 80% of the outstanding shares of our capital stock; |
|
|
• |
authorization of the issuance of “blank check” preferred stock that could be issued by our Board of Directors to increase the number of outstanding shares and thwart a takeover attempt; and |
|
|
• |
establishment of advance notice requirements for nominations for election to the Board of Directors or for proposing matters that can be acted upon by stockholders at stockholder meetings. |
In addition, Section 203 of the Delaware General Corporations Law limits business combination transactions with 15% stockholders that have not been approved by the Board of Directors. These provisions and other similar provisions make it more difficult for a third party to acquire us without negotiation. These provisions may apply even if the transaction may be considered beneficial by some stockholders.
Significant stockholders or potential stockholders may attempt to effect changes or acquire control over our Company, which could adversely affect our results of operations and financial condition.
Stockholders may from time to time attempt to effect changes, engage in proxy solicitations or advance stockholder proposals, such as the publicly-disclosed proxy contest that the Company settled in 2015. Responding to proxy contests and other actions by activist stockholders can be costly and time-consuming, disrupting our operations and diverting the attention of our Board of Directors and senior management from the pursuit of business strategies. As a result, stockholder campaigns could adversely affect our results of operations and financial condition.
None.
Properties
Our primary corporate headquarters are located at 2525 East El Segundo Boulevard, El Segundo, California 90245, with a satellite office located nearby at 2401 East El Segundo Boulevard, El Segundo, California 90245. We lease 55,000 square feet of office and adjoining retail space related to our primary corporate headquarters, and we lease 11,500 square feet related to our satellite office. The lease for the primary corporate headquarters is scheduled to expire on February 28, 2021 and provides us with two five-year renewal options, while the lease for the satellite office is scheduled to expire on February 28, 2021 and provides us with one five-year renewal option.
Our distribution facility is located in Riverside, California and has 953,000 square feet of warehouse and office space. Our lease for the distribution center is scheduled to expire on August 31, 2020, and includes two additional five-year renewal options. In the first quarter of fiscal 2015, we executed a lease for 172,000 square feet of additional distribution space adjacent to our distribution center in Riverside, California that enables us to more efficiently fulfill our expanding distribution requirements. Our lease for this additional facility is scheduled to expire on August 31, 2020, and includes four additional five-year renewal options. We commenced operations in this facility in November 2015. We have a distribution hub located in Salem, Oregon, utilizing 12,000 square feet of space to separate consolidated truckloads of product for delivery to our regional markets. Our lease for the hub is scheduled to expire on January 31, 2019, and includes four additional five-year renewal options.
18
We lease all of our retail store sites. Most of our store leases contain multiple fixed-price renewal options having a typical duration of five years per option. As of December 31, 2017, of our total store leases, 58 leases are due to expire in the next five years without renewal options. In most cases, as current leases expire, we believe we will be able to obtain lease renewals for existing store locations or new leases for substantially equivalent locations in the same general area.
Our Stores
Throughout our history, we have focused on operating traditional, full-line sporting goods stores. Our stores generally range from 8,000 to 15,000 square feet and average approximately 11,000 square feet. Our typical store is located in either a free-standing street location or a multi-store shopping center. Our numerous convenient locations and accessible store format encourage frequent customer visits, resulting in approximately 26.8 million sales transactions and an average transaction size of approximately $37 in fiscal 2017. The following table details our store locations by state as of December 31, 2017:
|
State |
|
Year Entered |
|
Number of Stores |
|
|
Percentage of Total Number of Stores |
|
||
|
California |
|
1955 |
|
|
226 |
|
|
|
52.0 |
% |
|
Washington |
|
1984 |
|
|
47 |
|
|
|
10.8 |
|
|
Arizona |
|
1993 |
|
|
42 |
|
|
|
9.6 |
|
|
Oregon |
|
1995 |
|
|
29 |
|
|
|
6.7 |
|
|
Colorado |
|
2001 |
|
|
22 |
|
|
|
5.1 |
|
|
New Mexico |
|
1995 |
|
|
19 |
|
|
|
4.4 |
|
|
Nevada |
|
1978 |
|
|
18 |
|
|
|
4.1 |
|
|
Utah |
|
1997 |
|
|
17 |
|
|
|
3.9 |
|
|
Idaho |
|
1994 |
|
|
11 |
|
|
|
2.5 |
|
|
Texas |
|
1995 |
|
|
3 |
|
|
|
0.7 |
|
|
Wyoming |
|
2010 |
|
|
1 |
|
|
|
0.2 |
|
|
Total |
|
|
|
|
435 |
|
|
|
100.0 |
% |
Our same store sales per square foot were approximately $204 for fiscal 2017. Our same store sales per square foot combined with our efficient store-level operations and low store maintenance costs have allowed us to historically generate strong store-level returns.
19
The Company is involved in various claims and legal actions arising in the ordinary course of business. In the opinion of management, the ultimate disposition of these matters is not expected to have a material adverse effect on the Company’s results of operations or financial condition.
None.
20
|
ITEM 5. |
MARKET FOR REGISTRANT’S COMMON EQUITY, RELATED STOCKHOLDER MATTERS AND ISSUER PURCHASES OF EQUITY SECURITIES |
Our common stock, par value $0.01 per share, trades on The NASDAQ Stock Market LLC under the symbol “BGFV.” The following table sets forth the high and low closing prices for our common stock as reported by The NASDAQ Stock Market LLC during fiscal 2017 and 2016:
|
|
|
2017 |
|
|
2016 |
|
||||||||||
|
Fiscal Period |
|
High |
|
|
Low |
|
|
High |
|
|
Low |
|
||||
|
First Quarter |
|
$ |
17.40 |
|
|
$ |
13.35 |
|
|
$ |
13.70 |
|
|
$ |
9.49 |
|
|
Second Quarter |
|
$ |
16.55 |
|
|
$ |
13.05 |
|
|
$ |
12.42 |
|
|
$ |
8.35 |
|
|
Third Quarter |
|
$ |
13.35 |
|
|
$ |
7.25 |
|
|
$ |
14.51 |
|
|
$ |
9.22 |
|
|
Fourth Quarter |
|
$ |
8.15 |
|
|
$ |
6.05 |
|
|
$ |
20.00 |
|
|
$ |
13.85 |
|
As of February 21, 2018, the closing price for our common stock as reported on The NASDAQ Stock Market LLC was $5.93 per share.
As of February 21, 2018, there were 21,271,821 shares of common stock outstanding held by 413 holders of record.
Performance Graph
Set forth below is a graph comparing the cumulative total stockholder return for our common stock with the cumulative total return of (i) the NASDAQ Composite Stock Market Index and (ii) the NASDAQ Retail Trade Index. The information in this graph is provided at annual intervals for the fiscal years ended 2013, 2014, 2015, 2016 and 2017. This graph shows historical stock price performance (including reinvestment of dividends) and is not necessarily indicative of future performance:
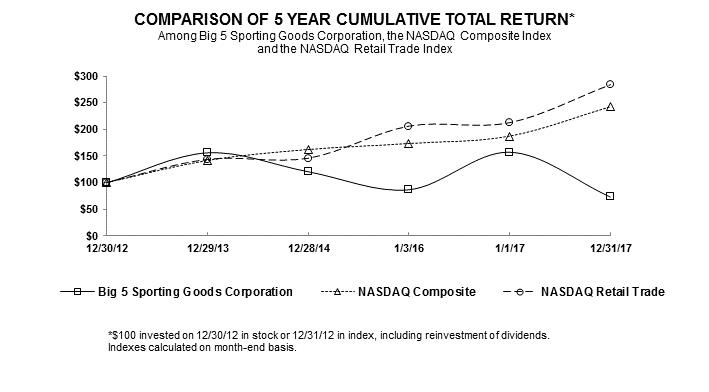
21
Dividends are paid at the discretion of the Board of Directors. In fiscal 2017, 2016 and 2015 we paid annual cash dividends of $0.60, $0.525 and $0.40 per share, respectively, of outstanding common stock. In the first quarter of fiscal 2018, our Board of Directors declared a quarterly cash dividend of $0.15 per share of outstanding common stock, which will be paid on March 23, 2018 to stockholders of record as of March 9, 2018.
The agreement governing our revolving credit facility imposes restrictions on our ability to make dividend payments. For example, our ability to pay cash dividends on our common stock will depend upon, among other things, our compliance with certain availability and fixed charge coverage ratio requirements at the time of the proposed dividend or distribution, and whether we are in default under the agreement. Our future dividend policy will also depend on the requirements of any future credit or other financing agreements to which we may be a party and other factors considered relevant by our Board of Directors, including the General Corporation Law of the State of Delaware, which provides that dividends are only payable out of surplus or current net profits.
Issuer Purchases
The following tabular summary reflects the Company’s share repurchase activity during the quarter ended December 31, 2017:
|
ISSUER PURCHASES OF EQUITY SECURITIES |
|
|||||||||||||||
|
Period |
|
Total Number of Shares Purchased |
|
|
Average Price Paid per Share |
|
|
Total Number of Shares Purchased as Part of Publicly Announced Plans or Programs (1)(2) |
|
|
Maximum Number (or Approximate Dollar Value) of Shares that May Yet Be Purchased Under the Plans or Programs (1)(2)(3) |
|
||||
|
October 2 – October 29 |
|
|
60,210 |
|
|
$ |
7.29 |
|
|
|
60,210 |
|
|
$ |
16,084,000 |
|
|
October 30 – November 26 |
|
|
56,499 |
|
|
$ |
6.58 |
|
|
|
56,499 |
|
|
$ |
15,713,000 |
|
|
November 27 – December 31 |
|
|
1,900 |
|
|
$ |
6.77 |
|
|
|
1,900 |
|
|
$ |
15,700,000 |
|
|
Total |
|
|
118,609 |
|
|
|
|
|
|
|
118,609 |
|
|
$ |
15,700,000 |
|
|
(1) |
In the third quarter of fiscal 2016, the Company’s Board of Directors authorized the current share repurchase program for the purchase of up to $25.0 million of the Company’s common stock. This program replaced the Company’s previous share repurchase program, under which $2.9 million remained available for repurchase. All share repurchases shown in this table were made under the Company’s current share repurchase program. Under the current authorization, the Company may purchase shares from time to time in the open market or in privately negotiated transactions in compliance with the applicable rules and regulations of the Securities and Exchange Commission. However, the timing and amount of such purchases, if any, would be at the discretion of the Company’s management and Board of Directors and would depend upon market conditions and other considerations. Since the inception of its initial share repurchase program in May 2006 through December 31, 2017, the Company has repurchased a total of 3,453,224 shares for $41.4 million. As of December 31, 2017, a total of $15.7 million remained available for share repurchases under the current share repurchase program. |
|
(2) |
The Company’s dividends and stock repurchases are generally funded by distributions from its subsidiary, Big 5 Corp. The Company’s Credit Agreement contains covenants that require it to maintain a fixed charge coverage ratio of not less than 1.0:1.0 in certain circumstances, and limit the ability to, among other things, pay dividends or repurchase stock. The Company may declare or pay cash dividends or repurchase stock only if, among other things, no default or event of default then exists or would arise from such dividend or repurchase of stock and, after giving effect to such dividend or repurchase, certain availability and/or fixed charge coverage ratio requirements are satisfied. See Part I, Item 2, Management’s Discussion and Analysis of Financial Condition and Results of Operations – Liquidity and Capital Resources, for a further discussion of the Credit Agreement. |
|
(3) |
This amount reflects the dollar value of shares remaining available to repurchase under the Company’s current share repurchase program. |
22
The “Statement of Operations Data” and the “Balance Sheet Data” for all years presented below have been derived from our audited consolidated financial statements. Selected consolidated financial data under the captions “Store Data” and “Other Financial Data” have been derived from the unaudited internal records of our operations. The information contained in these tables should be read in conjunction with our consolidated financial statements and accompanying notes and Management’s Discussion and Analysis of Financial Condition and Results of Operations appearing elsewhere in this Annual Report on Form 10‑K.
|
|
|
Fiscal Year (1) |
|
|||||||||||||||||
|
|
|
2017 |
|
|
2016 |
|
|
2015 |
|
|
2014 |
|
|
2013 |
|
|||||
|
|
|
(Dollars and shares in thousands, except per share, certain store and other financial data) |
|
|||||||||||||||||
|
Statement of Operations Data: |
|
|
|
|
|
|
|
|
|
|
|
|
|
|
|
|
|
|
|
|
|
Net sales (2) |
|
$ |
1,009,635 |
|
|
$ |
1,021,235 |
|
|
$ |
1,029,098 |
|
|
$ |
977,860 |
|
|
$ |
993,323 |
|
|
Cost of sales (3) |
|
|
686,303 |
|
|
|
696,777 |
|
|
|
704,134 |
|
|
|
664,411 |
|
|
|
664,583 |
|
|
Gross profit (2) |
|
|
323,332 |
|
|
|
324,458 |
|
|
|
324,964 |
|
|
|
313,449 |
|
|
|
328,740 |
|
|
Selling and administrative expense (2) (4) (5) (6) (7) (8) |
|
|
306,990 |
|
|
|
294,971 |
|
|
|
298,425 |
|
|
|
288,274 |
|
|
|
281,313 |
|
|
Operating income |
|
|
16,342 |
|
|
|
29,487 |
|
|
|
26,539 |
|
|
|
25,175 |
|
|
|
47,427 |
|
|
Interest expense |
|
|
1,644 |
|
|
|
1,551 |
|
|
|
1,791 |
|
|
|
1,667 |
|
|
|
1,745 |
|
|
Income before income taxes |
|
|
14,698 |
|
|
|
27,936 |
|
|
|
24,748 |
|
|
|
23,508 |
|
|
|
45,682 |
|
|
Income taxes (9) |
|
|
13,594 |
|
|
|
11,050 |
|
|
|
9,451 |
|
|
|
8,632 |
|
|
|
17,736 |
|
|
Net income (2) (5) (6) (7) (8) (9) |
|
$ |
1,104 |
|
|
$ |
16,886 |
|
|
$ |
15,297 |
|
|
$ |
14,876 |
|
|
$ |
27,946 |
|
|
Earnings per share: |
|
|
|
|
|
|
|
|
|
|
|
|
|
|
|
|
|
|
|
|
|
Basic |
|
$ |
0.05 |
|
|
$ |
0.78 |
|
|
$ |
0.70 |
|
|
$ |
0.68 |
|
|
$ |
1.28 |
|
|
Diluted |
|
$ |
0.05 |
|
|
$ |
0.77 |
|
|
$ |
0.70 |
|
|
$ |
0.67 |
|
|
$ |
1.27 |
|
|
|
|
|
|
|
|
|
|
|
|
|
|
|
|
|
|
|
|
|
|
|
|
Dividends per share |
|
$ |
0.60 |
|
|
$ |
0.525 |
|
|
$ |
0.40 |
|
|
$ |
0.40 |
|
|
$ |
0.40 |
|
|
|
|
|
|
|
|
|
|
|
|
|
|
|
|
|
|
|
|
|
|
|
|
Weighted-average shares of common stock outstanding: |
|
|
|
|
|
|
|
|
|
|
|
|
|
|
|
|
|
|
|
|
|
Basic |
|
|
21,439 |
|
|
|
21,607 |
|
|
|
21,741 |
|
|
|
21,933 |
|
|
|
21,765 |
|
|
Diluted |
|
|
21,585 |
|
|
|
21,816 |
|
|
|
21,927 |
|
|
|
22,133 |
|
|
|
22,083 |
|
|
Store Data: |
|
|
|
|
|
|
|
|
|
|
|
|
|
|
|
|
|
|
|
|
|
Same store sales (decrease) increase (10) |
|
|
(1.2 |
)% |
|
|
1.7 |
% |
|
|
1.3 |
% |
|
|
(2.9 |
)% |
|
|
3.9 |
% |
|
Same store sales per square foot (in dollars) (11) |
|
$ |
204 |
|
|
$ |
207 |
|
|
$ |
208 |
|
|
$ |
203 |
|
|
$ |
212 |
|
|
End of period stores |
|
|
435 |
|
|
|
432 |
|
|
|
438 |
|
|
|
439 |
|
|
|
429 |
|
|
End of period same stores |
|
|
423 |
|
|
|
422 |
|
|
|
414 |
|
|
|
402 |
|
|
|
394 |
|
|
Same store sales per store (12) |
|
$ |
2,333 |
|
|
$ |
2,365 |
|
|
$ |
2,383 |
|
|
$ |
2,324 |
|
|
$ |
2,415 |
|
|
Other Financial Data: |
|
|
|
|
|
|
|
|
|
|
|
|
|
|
|
|
|
|
|
|
|
Gross profit margin |
|
|
32.0 |
% |
|
|
31.8 |
% |
|
|
31.6 |
% |
|
|
32.1 |
% |
|
|
33.1 |
% |
|
Selling and administrative expense as a percentage of net sales |
|
|
30.4 |
% |
|
|
28.9 |
% |
|
|
29.0 |
% |
|
|
29.5 |
% |
|
|
28.3 |
% |
|
Operating margin |
|
|
1.6 |
% |
|
|
2.9 |
% |
|
|
2.6 |
% |
|
|
2.6 |
% |
|
|
4.8 |
% |
|
Depreciation and amortization |
|
$ |
19,222 |
|
|
$ |
19,130 |
|
|
$ |
21,410 |
|
|
$ |
21,505 |
|
|
$ |
20,192 |
|
|
Capital expenditures (13) |
|
$ |
16,462 |
|
|
$ |
14,109 |
|
|
$ |
24,567 |
|
|
$ |
22,565 |
|
|
$ |
22,035 |
|
|
Inventory turns (14) |
|
2.2x |
|
|
2.4x |
|
|
2.2x |
|
|
2.1x |
|
|
2.3x |
|
|||||
|
Balance Sheet Data: |
|
|
|
|
|
|
|
|
|
|
|
|
|
|
|
|
|
|
|
|
|
Cash |
|
$ |
7,170 |
|
|
$ |
7,895 |
|
|
$ |
7,119 |
|
|
$ |
11,503 |
|
|
$ |
9,400 |
|
|
Working capital (15) |
|
$ |
167,171 |
|
|
$ |
136,972 |
|
|
$ |
172,010 |
|
|
$ |
182,664 |
|
|
$ |
156,693 |
|
|
Total assets |
|
$ |
445,060 |
|
|
$ |
433,579 |
|
|
$ |
445,029 |
|
|
$ |
455,576 |
|
|
$ |
441,888 |
|
|
Long-term debt and capital leases, less current portion |
|
$ |
47,800 |
|
|
$ |
11,999 |
|
|
$ |
57,238 |
|
|
$ |
67,467 |
|
|
$ |
44,613 |
|
|
Stockholders’ equity |
|
$ |
187,069 |
|
|
$ |
205,037 |
|
|
$ |
198,831 |
|
|
$ |
195,004 |
|
|
$ |
190,770 |
|
(See notes on following page:)
23
(Notes to table on previous page)
|
(1) |
Our fiscal year is the 52 or 53 week reporting period ending on the Sunday nearest December 31. Fiscal 2017, 2016, 2014 and 2013 each included 52 weeks, and fiscal 2015 included 53 weeks. |
|
(2) |
In fiscal 2015, 2014 and 2013, we recorded pre-tax charges of $0.4 million, $1.4 million and $1.3 million, respectively, reflecting legal accruals. In fiscal 2015 and 2014, the amounts were classified as selling and administrative expense. In fiscal 2013, $0.3 million was classified as a reduction to net sales and $1.0 million was classified as selling and administrative expense. These charges reduced net income in fiscal 2015, 2014 and 2013 by $0.2 million, or $0.01 per diluted share, $0.9 million, or $0.04 per diluted share, and $0.8 million, or $0.04 per diluted share, respectively. |
|
(3) |
Cost of sales includes the cost of merchandise, net of discounts or allowances earned, freight, inventory reserves, buying, distribution center expense, including depreciation, and store occupancy expense. Store occupancy expense includes rent, amortization of leasehold improvements, common area maintenance, property taxes and insurance. |
|
(4) |
Selling and administrative expense includes store-related expense, other than store occupancy expense, as well as advertising, depreciation and amortization, expense associated with operating our corporate headquarters and impairment charges, if any. |
|
(5) |
In fiscal 2016, we recorded pre-tax charges related to store closing costs of $1.2 million. These charges reduced net income in fiscal 2016 by $0.7 million, or $0.03 per diluted share. |
|
(6) |
In fiscal 2017, 2015, 2014 and 2013, we recorded pre-tax non-cash impairment charges of $0.6 million, $0.2 million, $1.2 million and $0.1 million, respectively, related to certain underperforming stores. These impairment charges reduced net income in fiscal 2017, 2015, 2014 and 2013 by $0.4 million, or $0.02 per diluted share, $0.1 million, or $0.00 per diluted share, $0.8 million, or $0.03 per diluted share, and $44,000, or $0.00 per diluted share, respectively. |
|
(7) |
In fiscal 2015, we recorded pre-tax charges of $1.6 million related to a publicly-disclosed proxy contest. These charges reduced net income in fiscal 2015 by $1.0 million, or $0.05 per diluted share. |
|
(8) |
In fiscal 2017, we recorded a non-cash goodwill impairment charge of $4.4 million, which reduced net income in fiscal 2017 by the same amount, or $0.21 per diluted share. |
|
(9) |
In fiscal 2017, we recorded a charge of $5.5 million to revalue existing net deferred tax assets resulting from the enactment of the Tax Cuts and Jobs Act in December 2017. This charge reduced net income in fiscal 2017 by the same amount, or $0.26 per diluted share. Additionally, in fiscal 2017, we recorded a charge of $0.6 million, net of the federal income tax benefit, to establish a valuation allowance related to unused California Enterprise Zone Tax Credits, which reduced net income in fiscal 2017 by the same amount, or $0.03 per diluted share. In fiscal 2016, we recorded charges of $0.5 million to write off deferred tax assets related to share-based compensation. These charges reduced net income in fiscal 2016 by the same amount, or $0.02 per diluted share. |
|
(10) |
Same store sales for a period reflect net sales from stores operated throughout that period as well as the full corresponding prior year period. For purposes of reporting same store sales comparisons to prior years, we generally use comparable 52-week periods. However, for purposes of reporting fiscal 2015 same store sales comparisons to fiscal 2014, we used comparable 53-week periods. |
|
(11) |
Same store sales per square foot is calculated by dividing net sales for same stores, as defined above, by the total square footage for those stores. |
|
(12) |
Same store sales per store is calculated by dividing net sales for same stores, as defined above, by total same store count. |
|
(13) |
Increased capital expenditures in fiscal 2017 primarily reflected increased investment in new stores compared with fiscal 2016. Reduced capital expenditures in fiscal 2016 primarily reflected lower required investment in our distribution center and reduced investment in new stores compared with fiscal 2015. Reduced investment in new stores in fiscal 2016 was due primarily to payments made in early fiscal 2015 related to new stores opened in late fiscal 2014. Capital expenditures in fiscal 2017, 2016, 2015, 2014 and 2013 included increased investment in existing store remodeling to support our merchandising initiatives, added costs related to the development of an e-commerce platform and enhanced information security measures to support our infrastructure. Capital expenditures for computer hardware and software in fiscal 2017, 2016, 2015 and 2014 included amounts related to the development of a new point-of-sale system. |
|
(14) |
Inventory turns equal fiscal year cost of sales divided by the fiscal year four-quarter weighted-average cost of merchandise inventory. |
|
(15) |
Working capital is defined as current assets less current liabilities. In accordance with the early adoption of a new accounting standard in the first quarter of fiscal 2016, deferred income tax assets in the amount of $11.1 million, $11.0 million and $12.0 million, which were previously classified as current assets as of January 3, 2016, December 28, 2014 and December 29, 2013, respectively, were reclassified to non-current deferred income tax assets on our consolidated balance sheets to conform to current year presentation. Accordingly, working capital in fiscal 2015, 2014 and 2013 was reduced by the same respective amounts. |
24
Throughout this section, the Big 5 Sporting Goods Corporation (“we,” “our,” “us”) fiscal years ended December 31, 2017, January 1, 2017 and January 3, 2016 are referred to as fiscal 2017, 2016 and 2015, respectively. The following discussion and analysis of our financial condition and results of operations for fiscal 2017, 2016 and 2015 includes information with respect to our plans and strategies for our business and should be read in conjunction with the consolidated financial statements and related notes, the risk factors and the cautionary statement regarding forward-looking information included elsewhere in this Annual Report on Form 10-K.
Our fiscal year ends on the Sunday nearest December 31. Fiscal 2017 and 2016 each included 52 weeks and fiscal 2015 included 53 weeks.
Overview
We are a leading sporting goods retailer in the western United States, operating 435 stores and an e-commerce platform under the name “Big 5 Sporting Goods” as of December 31, 2017. We provide a full-line product offering in a traditional sporting goods store format that averages approximately 11,000 square feet. Through our e-commerce platform, we also offer selected products online. E-commerce sales for fiscal 2017, 2016 and 2015 were not material. Our product mix includes athletic shoes, apparel and accessories, as well as a broad selection of outdoor and athletic equipment for team sports, fitness, camping, hunting, fishing, tennis, golf, winter and summer recreation and roller sports.
We believe that over our 63-year history we have developed a reputation with the competitive and recreational sporting goods customer as a convenient neighborhood sporting goods retailer that consistently delivers value on quality merchandise. Our stores carry a wide range of products at competitive prices from well-known brand name manufacturers, including adidas, Coleman, Columbia, Everlast, New Balance, Nike, Rawlings, Skechers, Spalding, Under Armour and Wilson. We also offer brand name merchandise produced exclusively for us, private label merchandise and specials on quality items we purchase through opportunistic buys of vendor over-stock and close-out merchandise. We reinforce our value reputation through weekly print advertising in major and local newspapers, direct mailers and digital marketing designed to generate customer traffic, drive sales and build brand awareness. We also maintain social media sites to enhance distribution capabilities for our promotional offers and to enable communication with our customers.
Throughout our history, we have emphasized controlled growth. In fiscal 2017, we opened six new stores, two of which were relocations, and closed three stores, one of which was a relocation. In fiscal 2016, we opened five new stores and closed 11 stores, one of which was a relocation. In fiscal 2015, we opened five new stores and closed six stores, three of which were relocations. The following table summarizes our store count for the periods presented:
|
|
|
Fiscal Year |
|
|||||||||
|
|
|
2017 |
|
|
2016 |
|
|
2015 |
|
|||
|
Big 5 Sporting Goods stores: |
|
|
|
|
|
|
|
|
|
|
|
|
|
Beginning of period |
|
|
432 |
|
|
|
438 |
|
|
|
439 |
|
|
New stores (1) |
|
|
6 |
|
|
|
5 |
|
|
|
5 |
|
|
Stores relocated |
|
|
(1 |
) |
|
|
(1 |
) |
|
|
(3 |
) |
|
Stores closed |
|
|
(2 |
) |
|
|
(10 |
) |
|
|
(3 |
) |
|
End of period |
|
|
435 |
|
|
|
432 |
|
|
|
438 |
|
|
Stores opened (closed) per year, net |
|
|
3 |
|
|
|
(6 |
) |
|
|
(1 |
) |
|
(1) |
Stores that are relocated are classified as new stores. Sales from the prior location are treated as sales from a closed store and thus are excluded from same store sales calculations. |
For fiscal 2018, we anticipate opening approximately eight new stores and closing approximately three stores.
25
Our lower earnings for fiscal 2017 compared to fiscal 2016 were mainly attributable to lower net sales and higher selling and administrative expense combined with an increased income tax provision resulting from the enactment of the Tax Cuts and Jobs Act (“TCJA”) in December 2017, partially offset by higher merchandise margins in fiscal 2017. Our lower net sales in fiscal 2017 primarily reflected sales declines experienced in the fourth quarter as unseasonably dry and warm weather conditions negatively affected the sale of winter-related products, as well as softness in sales of firearm-related products throughout much of the year.
|
|
• |
Net sales for fiscal 2017 decreased 1.1% to $1,009.6 million compared to fiscal 2016. The decrease in net sales was primarily attributable to a reduction in sales from same stores and closed stores, partially offset by added sales from new stores. |
|
|
• |
Our same store sales decreased 1.2% for fiscal 2017 versus the comparable period in fiscal 2016. Same store sales comparisons to the prior year largely reflected sales declines in the fourth quarter of fiscal 2017 as unseasonably dry and warm weather conditions in most of our major markets had a significant negative effect on sales of cold-weather and snow-related products, which followed higher sales during the first half of fiscal 2017 after the liquidation and closure of certain major competitors in our markets that concluded in the third quarter of fiscal 2016. Same store sales in fiscal 2017 reflected a decrease in our hard goods category, primarily firearm-related products. This decrease was partially offset by increases in our apparel and footwear categories. Same store sales for a period reflect net sales from stores that operated throughout the period as well as the full corresponding prior year period, and same store sales comparisons exclude sales from stores closed during the comparable periods. |
|
|
• |
Gross profit for fiscal 2017 represented 32.0% of net sales, compared with 31.8% in the prior year. Merchandise margins were 47 basis points higher in fiscal 2017 than the prior year and distribution expense as a percentage of net sales was lower than the prior year, while store occupancy expense as a percentage of net sales was higher than the prior year. |
|
|
• |
Selling and administrative expense for fiscal 2017 increased 4.1% to $307.0 million, or 30.4% of net sales, compared to $295.0 million, or 28.9% of net sales, for fiscal 2016. The increase in selling and administrative expense primarily reflects higher employee labor and benefit-related expense and non-cash impairment charges related to goodwill and certain underperforming stores. |
|
|
• |
Net income for fiscal 2017 decreased to $1.1 million, or $0.05 per diluted share, compared to $16.9 million, or $0.77 per diluted share, for fiscal 2016. The decrease was driven primarily by lower net sales, increased selling and administrative expense and a higher income tax provision resulting from the enactment of the TCJA, partially offset by an increased gross profit margin. |
Our principal liquidity requirements are for working capital, capital expenditures and cash dividends. We fund our liquidity requirements primarily through cash on hand, cash flows from operations and borrowings from our revolving credit facility.
|
|
• |
Operating cash flow for fiscal 2017 was a negative $4.4 million compared to a positive $73.7 million last year. The decrease in operating cash flow primarily reflects increased funding of merchandise inventory purchases, reduced accrued expenses primarily for income taxes, increased prepaid expenses mainly for income taxes and rent, and lower net income in fiscal 2017. |
|
|
• |
Capital expenditures for fiscal 2017 increased to $16.5 million from $14.1 million in fiscal 2016. |
|
|
• |
We ended fiscal 2017 with a balance under our revolving credit facility of $45.0 million compared with $10.0 million at the end of fiscal 2016. |
|
|
• |
We paid aggregate cash dividends in fiscal 2017 of $13.0 million, or $0.60 per share, compared with $11.5 million, or $0.525 per share, in fiscal 2016. |
|
|
• |
We repurchased 795,718 shares of common stock for $7.7 million in fiscal 2017, compared with 126,899 shares of common stock for $1.6 million in fiscal 2016. |
26
The following table sets forth selected items from our consolidated statements of operations by dollar and as a percentage of our net sales, and other financial data, for the periods indicated:
|
|
|
Fiscal Year (1) |
|
|||||||||||||||||||||
|
|
|
2017 |
|
|
2016 |
|
|
2015 |
|
|||||||||||||||
|
|
|
(Dollars in thousands) |
|
|||||||||||||||||||||
|
Statement of Operations Data: |
|
|
|
|
|
|
|
|
|
|
|
|
|
|
|
|
|
|
|
|
|
|
|
|
|
Net sales |
|
$ |
1,009,635 |
|
|
|
100.0 |
% |
|
$ |
1,021,235 |
|
|
|
100.0 |
% |
|
$ |
1,029,098 |
|
|
|
100.0 |
% |
|
Cost of sales (2) |
|
|
686,303 |
|
|
|
68.0 |
|
|
|
696,777 |
|
|
|
68.2 |
|
|
|
704,134 |
|
|
|
68.4 |
|
|
Gross profit |
|
|
323,332 |
|
|
|
32.0 |
|
|
|
324,458 |
|
|
|
31.8 |
|
|
|
324,964 |
|
|
|
31.6 |
|
|
Selling and administrative expense (3) |
|
|
306,990 |
|
|
|
30.4 |
|
|
|
294,971 |
|
|
|
28.9 |
|
|
|
298,425 |
|
|
|
29.0 |
|
|
Operating income |
|
|
16,342 |
|
|
|
1.6 |
|
|
|
29,487 |
|
|
|
2.9 |
|
|
|
26,539 |
|
|
|
2.6 |
|
|
Interest expense |
|
|
1,644 |
|
|
|
0.2 |
|
|
|
1,551 |
|
|
|
0.2 |
|
|
|
1,791 |
|
|
|
0.2 |
|
|
Income before income taxes |
|
|
14,698 |
|
|
|
1.4 |
|
|
|
27,936 |
|
|
|
2.7 |
|
|
|
24,748 |
|
|
|
2.4 |
|
|
Income taxes |
|
|
13,594 |
|
|
|
1.3 |
|
|
|
11,050 |
|
|
|
1.1 |
|
|
|
9,451 |
|
|
|
0.9 |
|
|
Net income |
|
$ |
1,104 |
|
|
|
0.1 |
% |
|
$ |
16,886 |
|
|
|
1.6 |
% |
|
$ |
15,297 |
|
|
|
1.5 |
% |
|
Other Financial Data: |
|
|
|
|
|
|
|
|
|
|
|
|
|
|
|
|
|
|
|
|
|
|
|
|
|
Net sales change |
|
|
|
|
|
|
(1.1 |
)% |
|
|
|
|
|
|
(0.8 |
)% |
|
|
|
|
|
|
5.2 |
% |
|
Same store sales change (4) |
|
|
|
|
|
|
(1.2 |
)% |
|
|
|
|
|
|
1.7 |
% |
|
|
|
|
|
|
1.3 |
% |
|
Net income change |
|
|
|
|
|
|
(93.5 |
)% |
|
|
|
|
|
|
10.4 |
% |
|
|
|
|
|
|
2.8 |
% |
|
(1) |
Fiscal 2017 and 2016 each included 52 weeks and fiscal 2015 included 53 weeks. |
|
(2) |
Cost of sales includes the cost of merchandise, net of discounts or allowances earned, freight, inventory reserves, buying, distribution center expense, including depreciation, and store occupancy expense. Store occupancy expense includes rent, amortization of leasehold improvements, common area maintenance, property taxes and insurance. |
|
(3) |
Selling and administrative expense includes store-related expense, other than store occupancy expense, as well as advertising, depreciation and amortization, expense associated with operating our corporate headquarters and impairment charges, if any. |
|
(4) |
Same store sales for a period reflect net sales from stores that operated throughout the period as well as the full corresponding prior year period. For purposes of reporting same store sales comparisons to the prior year for fiscal 2017 and 2016, we used comparable 52-week periods. For purposes of reporting same store sales comparisons to the prior year for fiscal 2015, we used comparable 53-week periods. |
Fiscal 2017 Compared to Fiscal 2016
Net Sales. Net sales decreased by $11.6 million, or 1.1%, to $1,009.6 million for fiscal 2017 from $1,021.2 million for fiscal 2016. The change in net sales was primarily attributable to the following:
|
|
• |
Same store sales decreased 1.2% for fiscal 2017 versus fiscal 2016. Same store sales comparisons to the prior year largely reflected sales declines in the fourth quarter of fiscal 2017 as unseasonably dry and warm weather conditions in most of our major markets had a significant negative effect on sales of cold-weather and snow-related products, which followed higher sales during the first half of fiscal 2017 after the liquidation and closure of certain major competitors in our markets that concluded in the third quarter of fiscal 2016. Same store sales in fiscal 2017 reflected a decrease in our hard goods category, primarily firearm-related products. This decrease was partially offset by increases in our apparel and footwear categories. Same store sales for a period reflect net sales from stores that operated throughout the period as well as the full corresponding prior year period, and same store sales comparisons exclude sales from stores closed during the comparable periods. |
|
|
• |
A reduction in sales from closed stores was largely offset by added sales from new stores that reflected the opening of 11 new stores since January 3, 2016. |
|
|
• |
Although we experienced decreased customer transactions in our retail stores, the average sale per transaction increased slightly in fiscal 2017 compared to fiscal 2016. |
27
Gross Profit. Gross profit decreased by $1.2 million to $323.3 million, or 32.0% of net sales, in fiscal 2017 from $324.5 million, or 31.8% of net sales, in fiscal 2016. The change in gross profit was primarily attributable to the following:
|
|
• |
Net sales decreased by $11.6 million, or 1.1%, in fiscal 2017 compared to the prior year. |
|
|
• |
Store occupancy expense for fiscal 2017 increased by $2.2 million, or an unfavorable 32 basis points, year over year due primarily to lease renewals for existing stores. |
|
|
• |
Merchandise margins, which exclude buying, occupancy and distribution expense, increased by a favorable 47 basis points from fiscal 2016. This increase reflected a shift in sales mix driven primarily by strong demand for winter products in the first quarter of fiscal 2017 as a result of favorable weather conditions and reduced demand for lower-margin products such as firearms, combined with the favorable impact of lower clearance activity and reduced promotional activities over the prior year resulting from competitive store closures in our markets in fiscal 2016. These favorable impacts were partially offset by a decrease in merchandise margins in the fourth quarter of fiscal 2017, driven primarily by reduced demand for winter products as a result of the unseasonably dry and warm weather conditions experienced in our western markets. |
|
|
• |
Distribution expense decreased $2.8 million, or a favorable 24 basis points, primarily resulting from higher costs capitalized into inventory, partially offset by higher employee labor and benefit-related expense and higher freight costs. |
Selling and Administrative Expense. Selling and administrative expense increased by $12.0 million, or 4.1%, to $307.0 million, or 30.4% of net sales, in fiscal 2017 from $295.0 million, or 28.9% of net sales, in fiscal 2016. The change in selling and administrative expense was primarily attributable to the following:
|
|
• |
Administrative expense increased by $7.2 million, primarily attributable to a non-cash goodwill impairment charge of $4.4 million, as further discussed in Note 4 to the consolidated financial statements included in Part II, Item 8, Financial Statements and Supplementary Data, of this Annual Report on Form 10-K. Other factors contributing to the increase included higher expense associated with various IT-related systems and services of $2.7 million, higher employee labor and benefit-related expense of $0.9 million and a non-cash impairment charge of $0.6 million related to certain underperforming stores, partially offset by a charge of $1.2 million related to store closing costs in the prior year. |
|
|
• |
Store-related expense, excluding occupancy, increased by $5.0 million, primarily reflecting increased employee labor and benefit-related expense of $4.4 million. Our labor expense continues to reflect the incremental impact of legislated minimum wage rate increases in many of our markets, as well as overall inflationary pressures. In April 2016, California, where over fifty percent of our store operations are located, passed legislation to enact additional minimum wage rate increases from $10.00 to $15.00 per hour to be implemented in annual increments through fiscal 2022, with annual increases of $0.50 per hour effective in fiscal 2017 and fiscal 2018, and annual increases of $1.00 per hour effective in fiscal 2019 through fiscal 2022. We estimate that the impact of the California minimum wage rate increase of $0.50 per hour effective in January 2017 caused our labor expense to increase by approximately $1.0 million for fiscal 2017. |
Interest Expense. Interest expense remained even at $1.6 million in fiscal 2017 compared with $1.6 million in fiscal 2016. Interest expense reflects a decrease in average debt levels of $4.5 million to $42.7 million in fiscal 2017 from $47.2 million in fiscal 2016, offset by an increase in average interest rates of approximately 40 basis points to 2.6% in fiscal 2017 from 2.2% in fiscal 2016.
Income Taxes. The provision for income taxes was $13.6 million for fiscal 2017 compared with $11.1 million for fiscal 2016. Our effective tax rate was 92.5% for fiscal 2017 compared with 39.6% for fiscal 2016. The higher effective tax rate year over year primarily reflects a charge of $5.5 million to revalue existing net deferred tax assets resulting from the enactment of the TCJA in December 2017, which will reduce the federal corporate income tax rate from 35.0% to 21.0%, as well as the one-time impact of a non-deductible goodwill impairment charge of $4.4 million, as further discussed in Note 4 to the consolidated financial statements included in Part II, Item 8, Financial Statements and Supplementary Data, of this Annual Report on Form 10-K. Additionally, the provision for income taxes for fiscal 2017 includes a charge of $0.6 million, net of the federal income tax benefit, to establish a valuation allowance related to unused California Enterprise Zone Tax Credits.
Fiscal 2016 Compared to Fiscal 2015
Net Sales. Net sales decreased by $7.9 million, or 0.8%, to $1,021.2 million for fiscal 2016 from $1,029.1 million for fiscal 2015. The change in net sales was primarily attributable to the following:
|
|
• |
Net sales comparisons for fiscal 2016 were unfavorably impacted by the calendar shift from a 53-week fiscal year in 2015 to a 52-week fiscal year in 2016. This calendar shift unfavorably impacted net sales comparisons to fiscal 2015 by approximately $21.5 million. |
28
|
|
• |
A reduction in sales from closed stores was partially offset by added sales from new stores that reflected the opening of 10 new stores since December 28, 2014. |
|
|
• |
Same store sales increased 1.7% for fiscal 2016 versus fiscal 2015. Because same store sales comparisons to fiscal 2015 are made on a comparable 52-week basis, same store sales comparisons in fiscal 2016 were not materially impacted by the calendar shift from a 53-week year in fiscal 2015. Our higher same store sales reflected the liquidation and closure of certain major competitors in the second half of fiscal 2016. For fiscal 2016, same store sales in all of our major merchandise categories of hard goods, apparel and footwear increased compared to fiscal 2015. Same store sales for a period reflect net sales from stores that operated throughout the period as well as the full corresponding prior year period, and same store sales comparisons exclude sales from stores closed during the comparable periods. |
|
|
• |
Although we experienced decreased customer transactions in our retail stores, the average sale per transaction increased in fiscal 2016 compared to fiscal 2015, continuing to reflect a shift in our product mix to more branded merchandise. |
Gross Profit. Gross profit decreased by $0.5 million to $324.5 million, or 31.8% of net sales, in fiscal 2016 from $325.0 million, or 31.6% of net sales, in fiscal 2015. The change in gross profit was primarily attributable to the following:
|
|
• |
Net sales decreased by $7.9 million, or 0.8%, in fiscal 2016 compared to fiscal 2015. |
|
|
• |
Distribution expense increased $1.2 million, or an unfavorable 16 basis points, primarily resulting from higher employee labor expense, and lower costs capitalized into inventory, partially offset by reduced freight costs. |
|
|
• |
Merchandise margins, which exclude buying, occupancy and distribution expense, increased by a favorable nine basis points from fiscal 2015. |
|
|
• |
Store occupancy expense for fiscal 2016 decreased by $1.1 million, or a favorable four basis points, year over year due primarily to decreased expense associated with a lower store count. |
Selling and Administrative Expense. Selling and administrative expense decreased by $3.4 million, or 1.1%, to $295.0 million, or 28.9% of net sales, in fiscal 2016 from $298.4 million, or 29.0% of net sales, in fiscal 2015. The change in selling and administrative expense was primarily attributable to the following:
|
|
• |
Selling and administrative expense for fiscal 2016 included one less week than fiscal 2015. |
|
|
• |
Store-related expense, excluding occupancy, decreased by $2.0 million primarily reflecting the following items: |
|
|
o |
Reduced employee benefit-related expense of $2.2 million primarily related to lower health and welfare and workers’ compensation expense resulting from more favorable claims activity. |
|
|
o |
The favorable impact of one less fiscal week of payroll expense in fiscal 2016. |
|
|
o |
Our labor expense continued to reflect the incremental impact of legislated minimum wage rate increases in California, where over fifty percent of our store operations are located. California previously enacted a minimum wage rate increase from $8.00 to $10.00 per hour, which was implemented in two separate increments with the first increase of $1.00 per hour effective in July 2014 and the second increase of $1.00 per hour effective in January 2016. In April 2016, California passed legislation to enact additional minimum wage rate increases from $10.00 to $15.00 per hour to be implemented in annual increments through fiscal 2022 with annual increases of $0.50 per hour effective in fiscal 2017 and fiscal 2018, and annual increases of $1.00 per hour effective in fiscal 2019 through fiscal 2022. |
|
|
• |
Advertising expense for fiscal 2016 decreased by $1.7 million, due primarily to lower newspaper advertising, partially offset by increases in digital marketing and other advertising programs. |
|
|
• |
Administrative expense increased by $0.2 million, primarily attributable to store closing costs of $1.2 million and higher expense associated with various IT-related systems and services of $0.6 million, partially offset by proxy contest costs of $1.6 million in fiscal 2015. |
Interest Expense. Interest expense decreased by $0.2 million, or 11.1%, to $1.6 million in fiscal 2016 from $1.8 million in fiscal 2015. The decrease in interest expense reflected a decrease in average debt levels of $22.4 million to $47.2 million in fiscal 2016 from $69.6 million in fiscal 2015, partially offset by an increase in average interest rates of approximately 30 basis points to 2.2% in fiscal 2016 from 1.9% in fiscal 2015.
29
Income Taxes. The provision for income taxes was $11.1 million for fiscal 2016 compared with $9.5 million for fiscal 2015. This increase was primarily due to a higher effective tax rate and higher pre-tax income in fiscal 2016. Our effective tax rate was 39.6% for fiscal 2016 compared with 38.2% for fiscal 2015. The higher effective tax rate year over year reflected the write-off of deferred tax assets related to share-based compensation of $0.5 million, partially offset by an increase in Work Opportunity Tax Credits compared to fiscal 2015.
Liquidity and Capital Resources
Our principal liquidity requirements are for working capital, capital expenditures and cash dividends. We fund our liquidity requirements primarily through cash on hand, cash flows from operations and borrowings from our revolving credit facility. We believe our cash on hand, future cash flows from operations and borrowings from our revolving credit facility will be sufficient to fund our cash requirements for at least the next 12 months.
We ended fiscal 2017 with $7.2 million of cash compared with $7.9 million in fiscal 2016. We increased our long-term debt by $35.0 million during fiscal 2017 to $45.0 million from $10.0 million at the end of fiscal 2016 and decreased our long-term debt by $9.8 million from $54.8 million at the end of fiscal 2015. The following table summarizes our cash flows from operating, investing and financing activities for each of the past three fiscal years:
|
|
|
Fiscal Year |
|
|||||||||
|
|
|
2017 |
|
|
2016 |
|
|
2015 |
|
|||
|
|
|
(In thousands) |
|
|||||||||
|
Total cash (used in) provided by: |
|
|
|
|
|
|
|
|
|
|
|
|
|
Operating activities |
|
$ |
(4,384 |
) |
|
$ |
73,671 |
|
|
$ |
39,645 |
|
|
Investing activities |
|
|
(16,462 |
) |
|
|
(14,109 |
) |
|
|
(24,567 |
) |
|
Financing activities |
|
|
20,121 |
|
|
|
(58,786 |
) |
|
|
(19,462 |
) |
|
Net (decrease) increase in cash |
|
$ |
(725 |
) |
|
$ |
776 |
|
|
$ |
(4,384 |
) |
The seasonality of our business historically provides greater cash flows from operations during the holiday and winter selling season. We use operating cash flows and borrowings under our revolving credit facility to fund inventory increases in anticipation of the holidays and our inventory levels are normally at their highest in the months leading up to Christmas. As holiday sales typically reduce inventory levels, this reduction, combined with net income, historically provides us with strong cash flows from operations at the end of our fiscal year.
For fiscal 2017, we increased our purchases of merchandise inventory compared to fiscal 2016 to support anticipated customer demand resulting from the closure of certain major competitors in our markets that concluded in the third quarter of fiscal 2016. The increased purchases of merchandise inventory combined with lower-than-anticipated sales in the fourth quarter of fiscal 2017 resulting from unseasonably dry and warm weather conditions that had a significant negative effect on sales of our winter-related products, contributed to significantly lower operating cash flow in fiscal 2017 compared to fiscal 2016, and a higher debt balance at the end of fiscal 2017.
For fiscal 2016, the level of inventory purchases in the months leading up to Christmas was higher compared to fiscal 2015, resulting in higher accounts payable at the end of fiscal 2016 compared to fiscal 2015. Healthy sales in the fourth quarter of fiscal 2016 contributed to reduced inventory compared to fiscal 2015 and reflected increased customer demand resulting from the competitor closures that concluded in the third quarter of fiscal 2016. These effects contributed to higher operating cash flow in fiscal 2016 compared to fiscal 2015, which allowed us to significantly pay down debt balances during the year.
For fiscal 2015, the level of inventory purchases in the months leading up to Christmas was lower compared to fiscal 2014, resulting in reduced inventory and accounts payable balances at the end of fiscal 2015 compared to fiscal 2014. Additionally, improved net sales in fiscal 2015 compared to fiscal 2014 contributed to higher operating cash flow, which allowed us to significantly pay down debt balances year over year.
Operating Activities. Operating cash flows for fiscal 2017, 2016 and 2015 were a negative $4.4 million, a positive $73.7 million and a positive $39.6 million, respectively. The decrease in cash flow from operating activities for fiscal 2017 compared to fiscal 2016 primarily reflects an increase in merchandise inventory for fiscal 2017 compared to a decrease for fiscal 2016, combined with the timing of payments for purchases of merchandise inventory, as well as decreases in accrued expenses and increases in prepaid expense primarily related to income tax and rent, and lower net income in fiscal 2017. The increase in cash provided by operating activities for fiscal 2016 compared to fiscal 2015 was due primarily to the timing of payments for purchases of merchandise inventory, which resulted in an increase in accounts payable compared with fiscal 2015, as well as reduced funding for other liabilities primarily related to workers’ compensation benefits, decreases in prepaid expenses and higher net income in fiscal 2016.
30
Investing Activities. Net cash used in investing activities for fiscal 2017, 2016 and 2015 was $16.5 million, $14.1 million and $24.6 million, respectively. Our capital spending is primarily to fund the opening of new stores, store-related remodeling, distribution center equipment and computer hardware and software purchases. Capital expenditures by category for each of the last three fiscal years are as follows:
|
|
|
Fiscal Year |
|
|||||||||
|
|
|
2017 |
|
|
2016 |
|
|
2015 |
|
|||
|
|
|
(In thousands) |
|
|||||||||
|
New stores |
|
$ |
4,193 |
|
|
$ |
2,383 |
|
|
$ |
5,508 |
|
|
Store-related remodels |
|
|
7,456 |
|
|
|
7,295 |
|
|
|
8,607 |
|
|
Distribution center |
|
|
2,321 |
|
|
|
2,296 |
|
|
|
7,866 |
|
|
Computer hardware, software and other |
|
|
2,492 |
|
|
|
2,135 |
|
|
|
2,586 |
|
|
Total |
|
$ |
16,462 |
|
|
$ |
14,109 |
|
|
$ |
24,567 |
|
Our capital expenditures included six new stores in fiscal 2017, five new stores in fiscal 2016 and five new stores in fiscal 2015. Increased capital expenditures in fiscal 2017 primarily reflected increased investment in new stores compared with fiscal 2016. Reduced capital expenditures in fiscal 2016 primarily reflected lower required investment in our distribution center and reduced investment in new stores compared with fiscal 2015. Reduced investment in new stores in fiscal 2016 was due primarily to lower cost required to open new stores in fiscal 2016 combined with higher payments made in early fiscal 2015 related to new stores opened in fiscal 2014. Capital expenditures in all fiscal years presented included increased investment in existing store remodeling to support our merchandising initiatives, added costs related to the development of an e-commerce platform, enhanced information security measures to support our infrastructure and amounts related to the development of a new point-of-sale system.
Financing Activities. Financing cash flows for fiscal 2017, 2016 and 2015 were a positive $20.1 million, a negative $58.8 million and a negative $19.5 million, respectively. For fiscal 2017, net cash was provided primarily from increased borrowings under our revolving credit facility, partially offset by dividend payments, treasury stock repurchases and capital lease payments. For fiscal 2016 and 2015, we used cash provided by operating activities primarily to pay down borrowings from our revolving credit facility and fund dividend payments, treasury stock repurchases and capital lease payments.
As of December 31, 2017, we had revolving credit borrowings of $45.0 million and letter of credit commitments of $0.5 million outstanding. These balances compare to borrowings of $10.0 million and letter of credit commitments of $0.5 million outstanding as of January 1, 2017.
Our revolving credit facility balances have historically increased from the end of the first quarter to the end of the second quarter and from the end of the third quarter to the week of Thanksgiving. The historical increases in our revolving credit facility balances reflect the build-up of inventory in anticipation of our summer and winter selling seasons. Revolving credit facility balances typically fall from the week of Thanksgiving to the end of the fourth quarter, reflecting inventory sales during the holiday and winter selling season. The increase in our revolving credit borrowings at the end of fiscal 2017 compared to the end of fiscal 2016 primarily reflects higher merchandise inventory levels, as discussed above, combined with lower accounts payable as a percentage of merchandise inventory due in part to the timing of payments.
In fiscal 2015 we paid quarterly cash dividends of $0.10 per share of outstanding common stock, for an annual rate of $0.40 per share. In the first three quarters of fiscal 2016 we paid quarterly cash dividends of $0.125 per share of outstanding common stock, and in the fourth quarter of fiscal 2016 we paid a quarterly cash dividend of $0.15 per share of outstanding common stock, for an annual rate of $0.525 per share in fiscal 2016. In fiscal 2017 we paid quarterly cash dividends of $0.15 per share of outstanding common stock, for an annual rate of $0.60 per share. In the first quarter of fiscal 2018, our Board of Directors declared a quarterly cash dividend of $0.15 per share of outstanding common stock, which will be paid on March 23, 2018 to stockholders of record as of March 9, 2018.
31
Periodically, we repurchase our common stock in the open market pursuant to programs approved by our Board of Directors. We may repurchase our common stock for a variety of reasons, including, among other things, our alternative cash requirements, existing business conditions and the current market price of our stock. In the third quarter of fiscal 2016, our Board of Directors authorized a new share repurchase program for the purchase of up to $25.0 million of our common stock. This program replaced the previous share repurchase program, under which $2.9 million remained available for repurchases. Under the current authorization, we may purchase shares from time to time in the open market or in privately negotiated transactions in compliance with the applicable rules and regulations of the Securities and Exchange Commission. However, the timing and amount of such purchases, if any, would be at the discretion of our management and Board of Directors, and would depend on market conditions and other considerations. We repurchased 795,718 shares of common stock for $7.7 million in fiscal 2017, we repurchased 126,899 shares of common stock for $1.6 million in fiscal 2016 and we repurchased 379,930 shares of common stock for $4.2 million in fiscal 2015. Since the inception of our initial share repurchase program in May 2006 through December 31, 2017, we have repurchased a total of 3,453,224 shares for $41.4 million. As of December 31, 2017, a total of $15.7 million remained available for share repurchases under our current share repurchase program.
Credit Agreement. On October 18, 2010, we entered into a credit agreement with Wells Fargo Bank, National Association (“Wells Fargo”), as administrative agent, and a syndicate of other lenders, which was amended on October 31, 2011 and December 19, 2013 (as so amended, the “Credit Agreement”). On September 29, 2017, the parties amended certain provisions of the Credit Agreement (such amendment, the “Third Amendment”), as further discussed below. The Third Amendment extended the maturity date of the Credit Agreement from December 19, 2018 to September 29, 2022. The amendment represented a modification and resulted in the payment and capitalization of $0.2 million in deferred financing fees.
The Credit Agreement provides for a revolving credit facility (the “Credit Facility”) with an aggregate committed availability of up to $140.0 million, which amount may be increased at our option up to a maximum of $165.0 million. We may also request additional increases in aggregate availability, up to a maximum of $200.0 million, in which case the existing lenders under the Credit Agreement will have the option to increase their commitments to accommodate the requested increase. If such existing lenders do not exercise that option, we may (with the consent of Wells Fargo, not to be unreasonably withheld) seek other lenders willing to provide such commitments. The Third Amendment includes a provision which permits us to elect to reduce the aggregate committed availability under the Credit Agreement to $100.0 million for a three-month period each calendar year. Prior to the Third Amendment, the Credit Facility included a $50.0 million sublimit for issuances of letters of credit. The Third Amendment reduced the letter of credit sublimit to $25.0 million. The Credit Facility includes a $20.0 million sublimit for swingline loans. As of December 31, 2017 and January 1, 2017, our total remaining borrowing availability under the Credit Agreement, after subtracting letters of credit, was $94.5 million and $129.5 million, respectively.
We may borrow under the Credit Facility from time to time, provided the amounts outstanding will not exceed the lesser of the then aggregate availability (as discussed above) and the Borrowing Base (such lesser amount being referred to as the “Loan Cap”). The “Borrowing Base” generally is comprised of the sum, at the time of calculation, of (a) 90.00% of eligible credit card receivables; plus (b) the cost of eligible inventory (other than eligible in-transit inventory), net of inventory reserves, multiplied by 90.00% of the appraised net orderly liquidation value of eligible inventory (expressed as a percentage of the cost of eligible inventory); plus (c) the lesser of (i) the cost of eligible in-transit inventory, net of inventory reserves, multiplied by 90.00% of the appraised net orderly liquidation value of eligible in-transit inventory (expressed as a percentage of the cost of eligible in-transit inventory), or (ii) $10.0 million, minus (d) certain reserves established by Wells Fargo in its role as the Administrative Agent in its reasonable discretion.
Generally, we may designate specific borrowings under the Credit Facility as either base rate loans or LIBO rate loans. The applicable interest rate on our borrowings is a function of the daily average, over the preceding fiscal quarter, of the excess of the Loan Cap over amounts borrowed (such amount being referred to as the “Average Daily Availability”). Prior to the Third Amendment, those loans designated as LIBO rate loans bore interest at a rate equal to the then applicable LIBO rate plus an applicable margin as shown in the table below. Those loans designated as base rate loans bore interest at a rate equal to the applicable margin for base rate loans (as shown below) plus the highest of (a) the Federal funds rate, as in effect from time to time, plus one-half of one percent (0.50%), (b) the LIBO rate, as adjusted to account for statutory reserves, plus one percent (1.00%), or (c) the rate of interest in effect for such day as publicly announced from time to time by Wells Fargo as its “prime rate.” Prior to the Third Amendment, the applicable margin for all loans under the existing Credit Agreement was as set forth below as a function of Average Daily Availability for the preceding fiscal quarter.
|
Level |
|
Average Daily Availability |
|
LIBO Rate Applicable Margin |
|
Base Rate Applicable Margin |
|
I |
|
Greater than or equal to $100,000,000 |
|
1.25% |
|
0.25% |
|
II |
|
Less than $100,000,000 but greater than or equal to $40,000,000 |
|
1.50% |
|
0.50% |
|
III |
|
Less than $40,000,000 |
|
1.75% |
|
0.75% |
32
Prior to the Third Amendment, the commitment fee assessed on the unused portion of the Credit Facility was 0.25% per annum.
After giving effect to the Third Amendment, those loans designated as LIBO rate loans will bear interest at a rate equal to the then applicable adjusted LIBO rate plus an applicable margin as shown in the table below. Those loans designated as base rate loans bear interest at a rate equal to the applicable margin for base rate loans (as shown below) plus the highest of (a) the Federal funds rate, as in effect from time to time, plus one-half of one percent (0.50%), (b) the LIBO rate, plus one percentage point (1.00%), or (c) the rate of interest in effect for such day as announced from time to time within Wells Fargo as its “prime rate.” The applicable margin for all loans will be a function of Average Daily Availability for the preceding fiscal quarter as set forth below.
|
Level |
|
Average Daily Availability |
|
LIBO Rate Applicable Margin |
|
Base Rate Applicable Margin |
|
I |
|
Greater than or equal to $70,000,000 |
|
1.25% |
|
0.25% |
|
II |
|
Less than $70,000,000 |
|
1.375% |
|
0.50% |
After giving effect to the Third Amendment, the commitment fee assessed on the unused portion of the Credit Facility is 0.20% per annum.
Obligations under the Credit Facility are secured by a general lien and perfected security interest in substantially all of our assets. The Credit Agreement contains covenants that require us to maintain a fixed charge coverage ratio of not less than 1.0:1.0 in certain circumstances, and limit the ability to, among other things, incur liens, incur additional indebtedness, transfer or dispose of assets, change the nature of the business, guarantee obligations, pay dividends or make other distributions or repurchase stock, and make advances, loans or investments. We may declare or pay cash dividends or repurchase stock only if, among other things, no default or event of default then exists or would arise from such dividend or repurchase of stock and, after giving effect to such dividend or repurchase, certain availability and/or fixed charge coverage ratio requirements are satisfied. The Credit Agreement contains customary events of default, including, without limitation, failure to pay when due principal amounts with respect to the Credit Facility, failure to pay any interest or other amounts under the Credit Facility for five days after becoming due, failure to comply with certain agreements or covenants contained in the Credit Agreement, failure to satisfy certain judgments against us, failure to pay when due (or any other default which does or may lead to the acceleration of) certain other material indebtedness in principal amount in excess of $5.0 million, and certain insolvency and bankruptcy events.
The following table provides information about our revolving credit borrowings as of and for the periods indicated:
|
|
|
Fiscal Year |
|
|||||
|
|
|
2017 |
|
|
2016 |
|
||
|
|
|
(Dollars in thousands) |
|
|||||
|
Fiscal year-end balance |
|
$ |
45,000 |
|
|
$ |
10,000 |
|
|
Average interest rate |
|
|
2.60 |
% |
|
|
2.20 |
% |
|
Maximum outstanding during the year |
|
$ |
85,841 |
|
|
$ |
75,724 |
|
|
Average outstanding during the year |
|
$ |
42,728 |
|
|
$ |
47,160 |
|
Future Capital Requirements. We had cash on hand of $7.2 million as of December 31, 2017. We expect capital expenditures for fiscal 2018, excluding non-cash acquisitions, to range from approximately $18.0 million to $22.0 million, primarily for an expected purchase of property adjacent to our corporate headquarters location in the amount of $4.5 million, the opening of new stores, store-related remodeling, distribution center equipment and computer hardware and software purchases. For fiscal 2018, we anticipate opening approximately eight new stores and closing approximately three stores.
In fiscal 2017, 2016 and 2015 we paid annual cash dividends of $0.60 per share, $0.525 per share and $0.40 per share, respectively, of outstanding common stock. In the first quarter of fiscal 2018, our Board of Directors declared a quarterly cash dividend of $0.15 per share of outstanding common stock, which will be paid on March 23, 2018 to stockholders of record as of March 9, 2018.
As of December 31, 2017, a total of $15.7 million remained available for share repurchases under our share repurchase program. We consider several factors in determining when and if we make share repurchases including, among other things, our alternative cash requirements, existing business conditions and the market price of our stock.
33
We believe we will be able to fund our cash requirements from cash on hand, operating cash flows and borrowings from our revolving credit facility, for at least the next twelve months. However, our ability to satisfy our cash requirements depends upon our future performance, which in turn is subject to general economic conditions and regional risks, as well as financial, business and other factors affecting our operations, including factors beyond our control. There is no assurance that we will be able to generate sufficient cash flows or that we will be able to maintain our ability to borrow under our revolving credit facility.
Off-Balance Sheet Arrangements and Contractual Obligations. Our material off-balance sheet arrangements are operating lease obligations. We excluded these items from the balance sheet in accordance with accounting principles generally accepted in the United States of America (“GAAP”). A summary of our operating lease obligations and other commitments by fiscal year is included in the table below. Additional information regarding our operating leases is available in Item 2, Properties and Note 9, Lease Commitments, of the notes to consolidated financial statements included in Item 8, Financial Statements and Supplementary Data, of this Annual Report on Form 10-K.
Our future obligations and commitments as of December 31, 2017, include the following:
|
|
|
Payments Due by Period |
|
|||||||||||||||||
|
|
|
Total |
|
|
Less Than 1 Year |
|
|
1-3 Years |
|
|
3-5 Years |
|
|
After 5 Years |
|
|||||
|
|
|
(In thousands) |
|
|||||||||||||||||
|
Capital lease obligations |
|
$ |
4,891 |
|
|
$ |
1,933 |
|
|
$ |
2,571 |
|
|
$ |
387 |
|
|
$ |
— |
|
|
Lease commitments: |
|
|
|
|
|
|
|
|
|
|
|
|
|
|
|
|
|
|
|
|
|
Operating lease commitments |
|
|
337,435 |
|
|
|
80,889 |
|
|
|
128,323 |
|
|
|
70,204 |
|
|
|
58,019 |
|
|
Other occupancy expense |
|
|
59,627 |
|
|
|
15,313 |
|
|
|
23,676 |
|
|
|
12,420 |
|
|
|
8,218 |
|
|
Other liabilities |
|
|
12,829 |
|
|
|
4,322 |
|
|
|
3,422 |
|
|
|
1,464 |
|
|
|
3,621 |
|
|
Revolving credit facility |
|
|
45,000 |
|
|
|
— |
|
|
|
— |
|
|
|
45,000 |
|
|
|
— |
|
|
Letters of credit |
|
|
525 |
|
|
|
525 |
|
|
|
— |
|
|
|
— |
|
|
|
— |
|
|
Total |
|
$ |
460,307 |
|
|
$ |
102,982 |
|
|
$ |
157,992 |
|
|
$ |
129,475 |
|
|
$ |
69,858 |
|
Capital lease obligations, which include imputed interest, consist principally of leases for some of our IT systems hardware and distribution center delivery tractors. Payments for these lease obligations are provided by cash flows generated from operations or through borrowings from our revolving credit facility.
Operating lease commitments consist principally of leases for our retail store facilities, distribution center and corporate office, as well as IT systems hardware and distribution center delivery tractors. These leases frequently include options which permit us to extend the terms beyond the initial fixed lease term. With respect to most of those leases, we intend to renegotiate those leases as they expire.
In February 2008, we entered into a lease for a parcel of land with an existing building adjacent to our corporate headquarters location, including a parking lot we are currently using (the “premises”). The lease term commenced in 2009 and the primary term was originally scheduled to expire on February 28, 2019, subject to renewal for six successive periods of five years each. In accordance with terms of the original lease agreement, we were committed to the construction of a new retail building on the premises before the primary term expired, regardless of whether or not any renewal options were exercised. In May 2017, we entered into an amendment to the lease to, among other things, extend the primary lease term, and consequently the construction deadline, to a date between February 29, 2020 and June 30, 2020. Such extension required a non-refundable payment of $40,000, which we made concurrently with execution of the amendment. In November 2017, we entered into an additional amendment to the lease concurrently with entering into a purchase and sale agreement. Pursuant to the purchase and sale agreement, we have the right to purchase the premises for $4.5 million, subject to a due diligence period expiring March 2, 2018. If we do not terminate the purchase and sale agreement during the due diligence period, then we will pay $300,000 as an escrow deposit to purchase the property. The closing of the sale is scheduled to occur on or before November 27, 2018, subject to seller’s right to elect an earlier closing date. Pursuant to the amended lease, if consummation of the sale fails to occur by November 27, 2018, then our lease would remain in full force and effect, including the construction deadline, which would be the later of (a) February 29, 2020, or (b) the earlier of (i) two (2) years after the date that the purchase and sale agreement is terminated, or (ii) November 27, 2020. We are currently in the process of conducting due diligence to determine whether to proceed with the purchase.
Other occupancy expense includes estimated property maintenance fees and property taxes for our stores, distribution center and corporate headquarters.
34
Other liabilities consist principally of actuarially-determined reserve estimates related to self-insurance liabilities, of which certain self-insurance liabilities are secured by surety bonds, a contractual obligation for the surviving spouse of Robert W. Miller, our co-founder, and asset retirement obligations related to the removal and retirement of leasehold improvements for certain stores upon termination of their leases.
Periodic interest payments on the Credit Agreement are not included in the preceding table because interest expense is based on variable indices, and the balance of our Credit Agreement fluctuates daily depending on operating, investing and financing cash flows. Assuming no changes in our revolving credit facility debt or interest rates as of the fiscal 2017 year-end, our projected annual interest payments would be approximately $1.3 million.
Issued and outstanding letters of credit were $0.5 million as of December 31, 2017, and were related primarily to securing insurance program liabilities.
In the ordinary course of business, we enter into arrangements with vendors to purchase merchandise in advance of expected delivery. Because most of these purchase orders do not contain any termination payments or other penalties if cancelled, they are not included as outstanding contractual obligations.
Critical Accounting Estimates
Our critical accounting estimates are included in our significant accounting policies as described in Note 2 of the consolidated financial statements included in Item 8, Financial Statements and Supplementary Data, of this Annual Report on Form 10-K. Those consolidated financial statements were prepared in accordance with GAAP. Critical accounting estimates are those that we believe are most important to the portrayal of our financial condition and results of operations. The preparation of our consolidated financial statements requires us to make estimates and judgments that affect the reported amounts of assets, liabilities, revenue and expense. Our estimates are evaluated on an ongoing basis and drawn from historical experience, current trends and other factors that management believes to be relevant at the time our consolidated financial statements are prepared. Actual results may differ from our estimates. Management believes that the following accounting estimates reflect the more significant judgments and estimates we use in preparing our consolidated financial statements.
Valuation of Merchandise Inventories, Net
Our merchandise inventories are made up of finished goods and are valued at the lower of cost or net realizable value using the weighted-average cost method that approximates the first-in, first-out (“FIFO”) method. Average cost consists of the direct purchase price of merchandise inventory, net of vendor allowances and cash discounts, in-bound freight-related costs and allocated overhead costs associated with our distribution center.
We record valuation reserves on a quarterly basis for damaged and defective merchandise, merchandise items with slow-moving or obsolescence exposure and merchandise that has a carrying value that exceeds net realizable value. These reserves are estimates of a reduction in value to reflect inventory valuation at the lower of cost or net realizable value. Factors included in determining slow-moving or obsolescence reserve estimates include current and anticipated demand or customer preferences, merchandise aging, seasonal trends and decisions to discontinue certain products. Because of our merchandise mix, we have not historically experienced significant occurrences of obsolescence. Our inventory valuation reserves for damaged and defective merchandise, slow-moving or obsolete merchandise and for lower of cost or net realizable value provisions totaled $3.4 million and $3.1 million as of December 31, 2017 and January 1, 2017, respectively, representing approximately 1% of our merchandise inventory for both periods.
Inventory shrinkage is accrued as a percentage of merchandise sales based on historical inventory shrinkage trends. We perform physical inventories at each of our stores at least once per year and cycle count inventories at our distribution center throughout the year. The reserve for inventory shrinkage primarily represents an estimate for inventory shrinkage for each store since the last physical inventory date through the reporting date. Inventory shrinkage can be impacted by internal factors such as the level of investment in employee training and loss prevention and external factors such as the health of the overall economy, and shrink reserve estimates can vary from actual results. Our reserve for inventory shrinkage was $2.4 million and $2.6 million as of December 31, 2017 and January 1, 2017, respectively, representing approximately 1% of our merchandise inventory for both periods.
A 10% change in our inventory reserves estimate in total as of December 31, 2017, would result in a change in reserves of approximately $0.6 million and a change in pre-tax earnings by the same amount. Our reserves are estimates, which could vary significantly, either favorably or unfavorably, from actual results if future economic conditions, consumer demand and competitive environments differ from our expectations. At this time, we do not believe that there is a reasonable likelihood that there will be a material change in the future estimates or assumptions that we use to calculate our inventory reserves.
35
Valuation of Long-Lived Assets
We review our long-lived assets for impairment whenever events or changes in circumstances indicate that the carrying amount of an asset may not be recoverable.
Long-lived assets are reviewed for recoverability at the lowest level in which there are identifiable cash flows (“asset group”), usually at the store level. Each store typically requires net investments of approximately $0.5 million in long-lived assets to be held and used, subject to recoverability testing. The carrying amount of an asset group is not considered recoverable if it exceeds the sum of the undiscounted cash flows expected to result from the asset group. If the asset group is determined not to be recoverable, then an impairment charge will be recognized in the amount by which the carrying amount of the asset group exceeds its fair value, determined using discounted cash flow valuation techniques, as defined in the impairment provisions of Financial Accounting Standards Board (“FASB”) Accounting Standards Codification (“ASC”) 360, Property, Plant, and Equipment.
We determine the sum of the undiscounted cash flows expected to result from the asset group by projecting future revenue, gross margin and operating expense for each store under evaluation for impairment. The estimates of future cash flows involve management judgment and are based upon assumptions about expected future operating performance. Assumptions used in these forecasts are consistent with internal planning, and include assumptions about sales growth rates, gross margins and operating expense in relation to the current economic environment and our future expectations, competitive factors in our various markets and inflation. The actual cash flows could differ from management’s estimates due to changes in business conditions, operating performance and economic conditions.
Our evaluation resulted in impairment charges of $0.6 million and $0.2 million recognized in fiscal 2017 and 2015, respectively, related to certain underperforming stores, with no impairment charges recognized in fiscal 2016.
A 10% change in the sum of our undiscounted cash flow estimates resulting from different assumptions used as of December 31, 2017 for those asset groups included in our evaluation would not result in a material change in long-lived asset impairment for fiscal 2017.
Self-Insurance Liabilities
We maintain self-insurance programs for our estimated commercial general liability risk and, in certain states, our estimated workers’ compensation liability risk. In addition, we have a self-insurance program for a portion of our employee medical benefits. Under these programs, we maintain insurance coverage for losses in excess of specified per-occurrence amounts. Estimated costs under the self-insured workers’ compensation and medical benefits programs, including incurred but not reported claims, are recorded as expense based upon historical experience, trends of paid and incurred claims, and other actuarial assumptions. If actual claims trends under these programs, including the severity or frequency of claims, differ from our estimates, our financial results may be significantly impacted. Our estimated self-insurance liabilities, which are reported gross of expected workers’ compensation insurance reimbursements, are classified in our balance sheet as accrued expenses or other long-term liabilities based upon whether they are expected to be paid during or beyond our normal operating cycle of 12 months from the date of our consolidated financial statements. As of December 31, 2017 and January 1, 2017, our self-insurance liabilities totaled $11.6 million and $11.6 million, respectively.
A 10% change in our estimated self-insurance liabilities estimate as of December 31, 2017, would result in a change in our liability of approximately $1.2 million and a change in pre-tax earnings by the same amount.
Goodwill
Goodwill represents the excess of purchase price over fair value of net assets acquired. Under ASC 350, Intangibles—Goodwill and Other, goodwill is not amortized but evaluated for impairment annually or whenever events or changes in circumstances indicate that the value may not be recoverable. We perform our annual impairment testing as of the end of each fiscal year, and we have one reporting unit for goodwill impairment testing purposes. In accordance with ASC 350, as amended by ASU 2017-04, Intangibles – Goodwill and Other (Topic 350): Simplifying the Test for Goodwill Impairment, we recognize goodwill impairment, if any, in the amount of the excess of the reporting unit’s carrying value over its fair value, not to exceed the total goodwill balance of the reporting unit. ASC 350 provides for a qualitative and quantitative assessment and the unconditional option to bypass the qualitative assessment and perform the quantitative goodwill impairment test.
36
We may perform a qualitative assessment that includes consideration of general economic conditions, industry and market conditions such as general product demand, weather-related impacts and increasing labor costs in our specific markets, overall financial performance, financial projections and changes in share price and market capitalization to determine whether it is more likely than not that the fair value of a reporting unit is less than its carrying value. If we determine it is more likely than not that the fair value of the reporting unit is less than its carrying value, we will perform the quantitative assessment.
The quantitative assessment includes consideration of both a market and income approach, which includes evaluation of control premiums of publicly-traded companies in similar lines of business, and employs a discounted cash flow model using estimated cash flows and an appropriate discount rate. The estimated cash flows contemplate projections of revenue growth, operating expenses including depreciation, capital expenditures and income taxes and incorporate a risk-adjusted discount rate that includes a weighted-average cost of capital based on both market-observable and entity-specific factors. We believe these assumptions are representative of assumptions that a market participant would use in valuing a reporting unit, but recognize that these assumptions are inherently uncertain.
After performing our annual impairment test as of December 31, 2017, we determined that the carrying value of the reporting unit exceeded its estimated fair value using the market and income approaches, as described above, by an amount that indicated a full impairment of the carrying value of goodwill. Consequently, we recorded a non-cash goodwill impairment charge of $4.4 million in the fourth quarter of fiscal 2017. We did not record goodwill impairment in fiscal 2016 or 2015.
Seasonality and Impact of Inflation
We experience seasonal fluctuations in our net sales and operating results. Seasonality in our net sales influences our buying patterns which directly impacts our merchandise and accounts payable levels and cash flows. We purchase merchandise for seasonal activities in advance of a season and supplement our merchandise assortment as necessary and when possible during the season. Our efforts to replenish products during a season are not always successful. In the fourth fiscal quarter, which includes the holiday selling season and the start of the winter selling season, we normally experience higher inventory purchase volumes and increased expense for staffing and advertising. If we miscalculate the consumer demand for our products generally or for our product mix in advance of a season, particularly the fourth quarter, our net sales can decline, which can harm our financial performance. A significant shortfall from expected net sales, particularly during the fourth quarter, can negatively impact our annual operating results.
In fiscal 2017, 2016 and 2015, the impact of inflation was minimal. We have evolved our product mix to include more branded merchandise that we believe gives us added flexibility to adjust selling prices for purchase cost increases. If we are unable to adjust our selling prices for purchase cost increases that might occur, then our merchandise margins will decline, which will adversely impact our operating results. We do not believe that inflation had a material impact on our operating results for the reporting periods.
Recently Issued Accounting Updates
See Note 2 to the consolidated financial statements included in Item 8, Financial Statements and Supplementary Data, of this Annual Report on Form 10-K.
37
This document includes certain “forward-looking statements” within the meaning of the Private Securities Litigation Reform Act of 1995. Such forward-looking statements relate to, among other things, our financial condition, our results of operations, our growth strategy and the business of our company generally. In some cases, you can identify such statements by terminology such as “may,” “could,” “project,” “estimate,” “potential,” “continue,” “should,” “expects,” “plans,” “anticipates,” “believes,” “intends” or other such terminology. These forward-looking statements involve known and unknown risks, uncertainties and other factors that may cause our actual results in future periods to differ materially from forecasted results. These risks and uncertainties include, among other things, changes in the consumer spending environment, fluctuations in consumer holiday spending patterns, increased competition from e-commerce retailers, breach of data security or other unauthorized disclosure of sensitive personal or confidential information, the competitive environment in the sporting goods industry in general and in our specific market areas, inflation, product availability and growth opportunities, changes in the current market for (or regulation of) firearm-related products, seasonal fluctuations, weather conditions, changes in cost of goods, operating expense fluctuations, increases in labor and benefit-related expense, changes in laws or regulations, including those related to tariffs and duties, lower-than-expected profitability of our e-commerce platform or cannibalization of sales from our existing store base which could occur as a result of operating our e-commerce platform, litigation risks, stockholder campaigns and proxy contests, disruption in product flow, changes in interest rates, credit availability, higher expense associated with sources of credit resulting from uncertainty in financial markets and economic conditions in general. Those and other risks and uncertainties are more fully described in Part I, Item 1A, Risk Factors, in this report. We caution that the risk factors set forth in this report are not exclusive. In addition, we conduct our business in a highly competitive and rapidly changing environment. Accordingly, new risk factors may arise. It is not possible for management to predict all such risk factors, nor to assess the impact of all such risk factors on our business or the extent to which any individual risk factor, or combination of factors, may cause results to differ materially from those contained in any forward-looking statement. We undertake no obligation to revise or update any forward-looking statement that may be made from time to time by us or on our behalf.
38
We are subject to risks resulting from interest rate fluctuations since interest on our borrowings under our Credit Facility is based on variable rates. We enter into borrowings under our Credit Facility principally for working capital, capital expenditures and general corporate purposes. We routinely evaluate the best use of our cash on hand and manage financial statement exposure to interest rate fluctuations by managing our level of indebtedness and the interest base rate options on such indebtedness. We do not utilize derivative instruments and do not engage in foreign currency transactions or hedging activities to manage our interest rate risk. If the interest rate on our debt was to change 1.0% as compared to the rate as of December 31, 2017, our interest expense would change approximately $0.5 million on an annual basis based on the outstanding balance of our borrowings under our Credit Facility as of December 31, 2017.
Inflationary factors and changes in foreign currency rates can increase the purchase cost of our products. We have evolved our product mix to include more branded merchandise, which we believe gives us added flexibility to adjust selling prices for purchase cost increases. If we are unable to adjust our selling prices for purchase cost increases that might occur then our merchandise margins will decline, which will adversely impact our operating results. All of our stores are located in the United States, and all imported merchandise is purchased in U.S. dollars. We do not believe that inflation had a material impact on our operating results for the reporting periods.
The financial statements and the supplementary financial information required by this Item and included in this Annual Report on Form 10-K are listed in the “Index to Consolidated Financial Statements” beginning on page F-1.
None.
39
Evaluation of Disclosure Controls and Procedures
We maintain a system of disclosure controls and procedures that are designed to provide reasonable assurance that information which is required to be timely disclosed is accumulated and communicated to our management, including our Chief Executive Officer (“CEO”) and Chief Financial Officer (“CFO”), in a timely fashion. We conducted an evaluation, under the supervision and with the participation of our CEO and CFO, of the effectiveness of the design and operation of our disclosure controls and procedures (as such term is defined in Rules 13a-15(e) and 15d-15(e) under the Securities Exchange Act of 1934, as amended (the “Exchange Act”)) as of December 31, 2017. Based on such evaluation, our CEO and CFO have concluded that, as of December 31, 2017, our disclosure controls and procedures are effective, at a reasonable assurance level, in recording, processing, summarizing and reporting, on a timely basis, information required to be disclosed by us in the reports that we file or submit under the Exchange Act and are effective in ensuring that information required to be disclosed by us in the reports that we file or submit under the Exchange Act is accumulated and communicated to our management, including our CEO and CFO, as appropriate to allow timely decisions regarding required disclosure.
Management’s Annual Report on Internal Control Over Financial Reporting
Management is responsible for establishing and maintaining adequate internal control over financial reporting as defined in Rule 13a-15(f) under the Exchange Act.
Our internal control over financial reporting includes policies and procedures that pertain to the maintenance of records that, in reasonable detail, accurately and fairly reflect transactions and disposition of assets; provide reasonable assurance that transactions are recorded as necessary to permit preparation of consolidated financial statements in accordance with accounting principles generally accepted in the United States of America (“GAAP”), and that receipts and expenditures are being made only in accordance with the authorization of our management and directors; and provide reasonable assurance regarding prevention or timely detection of unauthorized acquisition, use or disposition of our assets that could have a material effect on our consolidated financial statements.
Because of its inherent limitations, internal control over financial reporting may not prevent or detect misstatements. Also, projection of any evaluation of effectiveness to future periods is subject to the risk that controls may become inadequate because of changes in conditions, or that the degree of compliance with the policies or procedures may deteriorate.
Management conducted an assessment of the effectiveness of our internal control over financial reporting as of December 31, 2017, based upon the Internal Control—Integrated Framework (2013) issued by the Committee of Sponsoring Organizations of the Treadway Commission. Based on this assessment, management has concluded that, as of December 31, 2017, we maintained effective internal control over financial reporting. The attestation report issued by Deloitte & Touche LLP, our independent registered public accounting firm, on our internal control over financial reporting is included herein.
Changes in Internal Control Over Financial Reporting
There has been no change in our internal control over financial reporting (as defined in Rule 13a-15(f) under the Exchange Act) during the most recent fiscal quarter that has materially affected, or is reasonably likely to materially affect, our internal control over financial reporting.
40
REPORT OF INDEPENDENT REGISTERED PUBLIC ACCOUNTING FIRM
To the Stockholders and the Board of Directors of Big 5 Sporting Goods Corporation
El Segundo, California
Opinion on Internal Control over Financial Reporting
We have audited the internal control over financial reporting of Big 5 Sporting Goods Corporation and subsidiaries (the “Company”) as of December 31, 2017, based on criteria established in Internal Control — Integrated Framework (2013) issued by the Committee of Sponsoring Organizations of the Treadway Commission (COSO). In our opinion, the Company maintained, in all material respects, effective internal control over financial reporting as of December 31, 2017, based on criteria established in Internal Control — Integrated Framework (2013) issued by COSO.
We have also audited, in accordance with the standards of the Public Company Accounting Oversight Board (United States) (PCAOB), the consolidated financial statements as of and for the year ended December 31, 2017, of the Company and our report dated February 28, 2018, expressed an unqualified opinion on those financial statements.
Basis for Opinion
The Company’s management is responsible for maintaining effective internal control over financial reporting and for its assessment of the effectiveness of internal control over financial reporting, included in the accompanying Management’s Annual Report on Internal Control Over Financial Reporting. Our responsibility is to express an opinion on the Company’s internal control over financial reporting based on our audit. We are a public accounting firm registered with the PCAOB and are required to be independent with respect to the Company in accordance with the U.S. federal securities laws and the applicable rules and regulations of the Securities and Exchange Commission and the PCAOB.
We conducted our audit in accordance with the standards of the PCAOB. Those standards require that we plan and perform the audit to obtain reasonable assurance about whether effective internal control over financial reporting was maintained in all material respects. Our audit included obtaining an understanding of internal control over financial reporting, assessing the risk that a material weakness exists, testing and evaluating the design and operating effectiveness of internal control based on the assessed risk, and performing such other procedures as we considered necessary in the circumstances. We believe that our audit provides a reasonable basis for our opinion.
Definition and Limitations of Internal Control over Financial Reporting
A company’s internal control over financial reporting is a process designed to provide reasonable assurance regarding the reliability of financial reporting and the preparation of financial statements for external purposes in accordance with generally accepted accounting principles. A company’s internal control over financial reporting includes those policies and procedures that (1) pertain to the maintenance of records that, in reasonable detail, accurately and fairly reflect the transactions and dispositions of the assets of the company; (2) provide reasonable assurance that transactions are recorded as necessary to permit preparation of financial statements in accordance with generally accepted accounting principles, and that receipts and expenditures of the company are being made only in accordance with authorizations of management and directors of the company; and (3) provide reasonable assurance regarding prevention or timely detection of unauthorized acquisition, use, or disposition of the company’s assets that could have a material effect on the financial statements.
Because of its inherent limitations, internal control over financial reporting may not prevent or detect misstatements. Also, projections of any evaluation of effectiveness to future periods are subject to the risk that controls may become inadequate because of changes in conditions, or that the degree of compliance with the policies or procedures may deteriorate.
/s/ Deloitte & Touche LLP
Los Angeles, California
February 28, 2018
41
None.
42
The information required by this Item has been omitted and will be incorporated herein by reference, when filed, to our Proxy Statement, which is expected to be filed not later than 120 days after the end of our fiscal year ended December 31, 2017.
The information required by this Item has been omitted and will be incorporated herein by reference, when filed, to our Proxy Statement, which is expected to be filed not later than 120 days after the end of our fiscal year ended December 31, 2017.
|
ITEM 12. |
SECURITY OWNERSHIP OF CERTAIN BENEFICIAL OWNERS AND MANAGEMENT AND RELATED STOCKHOLDER MATTERS |
The information required by this Item has been omitted and will be incorporated herein by reference, when filed, to our Proxy Statement, which is expected to be filed not later than 120 days after the end of our fiscal year ended December 31, 2017.
The information required by this Item has been omitted and will be incorporated herein by reference, when filed, to our Proxy Statement, which is expected to be filed not later than 120 days after the end of our fiscal year ended December 31, 2017.
The information required by this Item has been omitted and will be incorporated herein by reference, when filed, to our Proxy Statement, which is expected to be filed not later than 120 days after the end of our fiscal year ended December 31, 2017.
43
|
(a) |
Documents filed as part of this report: |
|
|
(1) |
Financial Statements. |
See Index to Consolidated Financial Statements on page F-1 hereof.
|
|
(2) |
Financial Statement Schedule. |
See Index to Consolidated Financial Statements on page F-1 hereof.
|
|
(3) |
Exhibits. |
The exhibits listed in the Index to Exhibits shown beginning on the next page are filed as part of this Annual Report on Form 10-K, or are incorporated by reference from documents previously filed by the Company with the Securities and Exchange Commission as required by Item 601 of Regulation S-K.
44
BIG 5 SPORTING GOODS CORPORATION
|
Exhibit Number |
|
Exhibit Description |
|
|
|
|
|
3.1 |
|
Amended and Restated Certificate of Incorporation of Big 5 Sporting Goods Corporation. (1) |
|
|
|
|
|
3.2 |
|
|
|
|
|
|
|
4.1 |
|
|
|
|
|
|
|
10.1 |
|
|
|
|
|
|
|
10.2 |
|
|
|
|
|
|
|
10.3 |
|
|
|
|
|
|
|
10.4 |
|
|
|
|
|
|
|
10.5 |
|
|
|
|
|
|
|
10.6 |
|
|
|
|
|
|
|
10.7 |
|
|
|
|
|
|
|
10.8 |
|
|
|
|
|
|
|
10.9 |
|
|
|
|
|
|
|
10.10 |
|
|
|
|
|
|
|
10.11 |
|
|
|
|
|
|
|
10.12 |
|
|
|
|
|
|
|
10.13 |
|
|
|
|
|
|
|
10.14 |
|
Employment Offer Letter dated August 15, 2005 between Barry D. Emerson and Big 5 Corp. (10) |
|
|
|
|
|
10.15 |
|
Severance Agreement dated as of August 9, 2006 between Barry D. Emerson and Big 5 Corp. (11) |
|
|
|
|
|
10.16 |
|
|
|
|
|
|
|
10.17 |
|
|
|
|
|
|
|
10.18 |
|
|
|
|
|
|
|
10.19 |
|
45
|
Exhibit Number |
|
Exhibit Description |
|
|
|
|
|
10.20 |
|
|
|
|
|
|
|
10.21 |
|
|
|
|
|
|
|
10.22 |
|
|
|
|
|
|
|
10.23 |
|
|
|
|
|
|
|
10.24 |
|
Form of Change of Control Severance Agreement, dated as of August 5, 2015. (18) |
|
|
|
|
|
21.1 |
|
|
|
|
|
|
|
23.1 |
|
Consent of Independent Registered Public Accounting Firm, Deloitte & Touche LLP. (22) |
|
|
|
|
|
31.1 |
|
Rule 13a-14(a) Certification of Chief Executive Officer. (22) |
|
|
|
|
|
31.2 |
|
Rule 13a-14(a) Certification of Chief Financial Officer. (22) |
|
|
|
|
|
32.1 |
|
|
|
|
|
|
|
32.2 |
|
|
|
|
|
|
|
101.INS |
|
XBRL Instance Document. (22) |
|
|
|
|
|
101.SCH |
|
XBRL Taxonomy Extension Schema Document. (22) |
|
|
|
|
|
101.CAL |
|
XBRL Taxonomy Calculation Linkbase Document. (22) |
|
|
|
|
|
101.DEF |
|
XBRL Taxonomy Definition Linkbase Document. (22) |
|
|
|
|
|
101.LAB |
|
XBRL Taxonomy Label Linkbase Document. (22) |
|
|
|
|
|
101.PRE |
|
XBRL Taxonomy Presentation Linkbase Document. (22) |
|
(1) |
Incorporated by reference to the Annual Report on Form 10-K filed by Big 5 Sporting Goods Corporation on March 31, 2003. |
|
(2) |
Incorporated by reference to Amendment No. 4 to the Registration Statement on Form S-1 filed by Big 5 Sporting Goods Corporation on June 24, 2002. |
|
(3) |
Incorporated by reference to Amendment No. 2 to the Registration Statement on Form S-1 filed by Big 5 Sporting Goods Corporation on June 5, 2002. |
|
(4) |
Incorporated by reference to the Quarterly Report on Form 10-Q filed by Big 5 Sporting Goods Corporation on November 3, 2010. |
|
(5) |
Incorporated by reference to the Quarterly Report on Form 10-Q filed by Big 5 Sporting Goods Corporation on November 3, 2011. |
|
(6) |
Incorporated by reference to the Current Report on Form 8-K filed by Big 5 Sporting Goods Corporation on December 20, 2013. |
|
(7) |
Incorporated by reference to the Current Report on Form 8-K filed by Big 5 Sporting Goods Corporation on October 5, 2017. |
|
(8) |
Incorporated by reference to the Quarterly Report on Form 10-Q filed by Big 5 Sporting Goods Corporation on August 6, 2004. |
|
(9) |
Incorporated by reference to the Annual Report on Form 10-K filed by Big 5 Sporting Goods Corporation on September 6, 2005. |
|
(10) |
Incorporated by reference to the Annual Report on Form 10-K filed by Big 5 Sporting Goods Corporation on March 16, 2006. |
|
(11) |
Incorporated by reference to the Quarterly Report on Form 10-Q filed by Big 5 Sporting Goods Corporation on August 11, 2006. |
|
(12) |
Incorporated by reference to the Current Report on Form 8-K filed by Big 5 Sporting Goods Corporation on June 25, 2007. |
|
(13) |
Incorporated by reference to the Annual Report on Form 10-K filed by Big 5 Sporting Goods Corporation on March 10, 2008. |
|
(14) |
Incorporated by reference to the Current Report on Form 8-K filed by Big 5 Sporting Goods Corporation on January 6, 2009. |
|
(15) |
Incorporated by reference to the Current Report on Form 8-K filed by Big 5 Sporting Goods Corporation on June 20, 2011. |
|
(16) |
Incorporated by reference to the Current Report on Form 8-K filed by Big 5 Sporting Goods Corporation on May 1, 2015. |
46
|
(17) |
Incorporated by reference to the Current Report on Form 8-K filed by Big 5 Sporting Goods Corporation on July 10, 2015. |
|
(18) |
Incorporated by reference to the Quarterly Report on Form 10-Q filed by Big 5 Sporting Goods Corporation on October 28, 2015. |
|
(19) |
Incorporated by reference to the Current Report on Form 8-K filed by Big 5 Sporting Goods Corporation on March 7, 2016. |
|
(20) |
Incorporated by reference to the Current Report on Form 8-K filed by Big 5 Sporting Goods Corporation on June 14, 2016. |
|
(21) |
Incorporated by reference to the Current Report on Form 8-K filed by Big 5 Sporting Goods Corporation on October 11, 2016. |
|
(22) |
Filed herewith. |
47
Pursuant to the requirements of Section 13 or 15(d) of the Securities Exchange Act of 1934, the registrant has duly caused this report to be signed on its behalf by the undersigned, thereunto duly authorized.
|
|
BIG 5 SPORTING GOODS CORPORATION, |
|
|
|
a Delaware corporation |
|
|
|
|
|
|
Date: February 28, 2018 |
By: |
/s/ Steven G. Miller |
|
|
|
Steven G. Miller |
|
|
|
Chairman of the Board of Directors, President, Chief Executive Officer and Director of the Company |
Pursuant to the requirements of the Securities Exchange Act of 1934, this report has been signed below by the following persons on behalf of the registrant and in the capacities and on the dates indicated:
|
Signatures |
|
Title |
|
Date |
|
|
|
|
|
|
|
/s/ Steven G. Miller |
|
Chairman of the Board of Directors, |
|
February 28, 2018 |
|
Steven G. Miller |
|
President, Chief Executive Officer and |
|
|
|
|
|
Director of the Company |
|
|
|
|
|
(Principal Executive Officer) |
|
|
|
|
|
|
|
|
|
/s/ Barry D. Emerson |
|
Senior Vice President, |
|
February 28, 2018 |
|
Barry D. Emerson |
|
Chief Financial Officer and Treasurer |
|
|
|
|
|
(Principal Financial and |
|
|
|
|
|
Accounting Officer) |
|
|
|
|
|
|
|
|
|
/s/ Sandra N. Bane |
|
Director of the Company |
|
February 28, 2018 |
|
Sandra N. Bane |
|
|
|
|
|
|
|
|
|
|
|
/s/ Nicholas E. Donatiello, Jr. |
|
Director of the Company |
|
February 28, 2018 |
|
Nicholas E. Donatiello, Jr. |
|
|
|
|
|
|
|
|
|
|
|
/s/ Jennifer H. Dunbar |
|
Director of the Company |
|
February 28, 2018 |
|
Jennifer H. Dunbar |
|
|
|
|
|
|
|
|
|
|
|
/s/ Robert C. Galvin |
|
Director of the Company |
|
February 28, 2018 |
|
Robert C. Galvin |
|
|
|
|
|
|
|
|
|
|
|
/s/ Van B. Honeycutt |
|
Director of the Company |
|
February 28, 2018 |
|
Van B. Honeycutt |
|
|
|
|
|
|
|
|
|
|
|
/s/ David R. Jessick |
|
Director of the Company |
|
February 28, 2018 |
|
David R. Jessick |
|
|
|
|
48
BIG 5 SPORTING GOODS CORPORATION
INDEX TO CONSOLIDATED FINANCIAL STATEMENTS
|
F-1 |
||
|
|
|
|
|
F-2 |
||
|
|
|
|
|
Consolidated Balance Sheets at December 31, 2017 and January 1, 2017 |
F-3 |
|
|
|
|
|
|
F-4 |
||
|
|
|
|
|
F-5 |
||
|
|
|
|
|
F-6 |
||
|
|
|
|
|
F-7 |
||
|
|
|
|
|
Consolidated Financial Statement Schedule: |
Schedule |
|
|
|
|
|
|
Valuation and Qualifying Accounts as of December 31, 2017, January 1, 2017 and January 3, 2016 |
II |
|
F-1
Report of Independent Registered Public Accounting Firm
To the Stockholders and the Board of Directors of Big 5 Sporting Goods Corporation
El Segundo, California
Opinion on the Financial Statements
We have audited the accompanying consolidated balance sheets of Big 5 Sporting Goods Corporation and subsidiaries (the “Company”) as of December 31, 2017 and January 1, 2017, the related consolidated statements of operations, stockholders’ equity, and cash flows for the years ended December 31, 2017, January 1, 2017, and January 3, 2016, and the related notes and the schedule listed in the Index at Item 15(a)(2) (collectively referred to as the "financial statements"). In our opinion, the financial statements present fairly, in all material respects, the financial position of the Company as of December 31, 2017 and January 1, 2017, and the results of its operations and its cash flows for the years ended December 31, 2017, January 1, 2017, and January 3, 2016, in conformity with accounting principles generally accepted in the United States of America.
We have also audited, in accordance with the standards of the Public Company Accounting Oversight Board (United States) (PCAOB), the Company's internal control over financial reporting as of December 31, 2017, based on criteria established in Internal Control — Integrated Framework (2013) issued by the Committee of Sponsoring Organizations of the Treadway Commission and our report dated February 28, 2018, expressed an unqualified opinion on the Company's internal control over financial reporting.
Basis for Opinion
These financial statements are the responsibility of the Company's management. Our responsibility is to express an opinion on the Company's financial statements based on our audits. We are a public accounting firm registered with the PCAOB and are required to be independent with respect to the Company in accordance with the U.S. federal securities laws and the applicable rules and regulations of the Securities and Exchange Commission and the PCAOB.
We conducted our audits in accordance with the standards of the PCAOB. Those standards require that we plan and perform the audit to obtain reasonable assurance about whether the financial statements are free of material misstatement, whether due to error or fraud. Our audits included performing procedures to assess the risks of material misstatement of the financial statements, whether due to error or fraud, and performing procedures that respond to those risks. Such procedures included examining, on a test basis, evidence regarding the amounts and disclosures in the financial statements. Our audits also included evaluating the accounting principles used and significant estimates made by management, as well as evaluating the overall presentation of the financial statements. We believe that our audits provide a reasonable basis for our opinion.
/s/ Deloitte & Touche LLP
Los Angeles, California
February 28, 2018
We have served as the Company’s auditor since 2007.
F-2
BIG 5 SPORTING GOODS CORPORATION
(In thousands, except share amounts)
|
|
|
December 31, 2017 |
|
|
January 1, 2017 |
|
||
|
ASSETS |
|
|||||||
|
Current assets: |
|
|
|
|
|
|
|
|
|
Cash |
|
$ |
7,170 |
|
|
$ |
7,895 |
|
|
Accounts receivable, net of allowances of $79 and $42, respectively |
|
|
10,886 |
|
|
|
12,200 |
|
|
Merchandise inventories, net |
|
|
313,905 |
|
|
|
294,319 |
|
|
Prepaid expenses |
|
|
18,930 |
|
|
|
10,085 |
|
|
Total current assets |
|
|
350,891 |
|
|
|
324,499 |
|
|
Property and equipment, net |
|
|
77,265 |
|
|
|
78,420 |
|
|
Deferred income taxes |
|
|
14,172 |
|
|
|
23,699 |
|
|
Other assets, net of accumulated amortization of $1,575 and $1,420, respectively |
|
|
2,732 |
|
|
|
2,528 |
|
|
Goodwill |
|
|
- |
|
|
|
4,433 |
|
|
Total assets |
|
$ |
445,060 |
|
|
$ |
433,579 |
|
|
LIABILITIES AND STOCKHOLDERS' EQUITY |
|
|||||||
|
Current liabilities: |
|
|
|
|
|
|
|
|
|
Accounts payable |
|
$ |
113,740 |
|
|
$ |
109,314 |
|
|
Accrued expenses |
|
|
68,226 |
|
|
|
76,887 |
|
|
Current portion of capital lease obligations |
|
|
1,754 |
|
|
|
1,326 |
|
|
Total current liabilities |
|
|
183,720 |
|
|
|
187,527 |
|
|
Deferred rent, less current portion |
|
|
15,948 |
|
|
|
17,028 |
|
|
Capital lease obligations, less current portion |
|
|
2,800 |
|
|
|
1,999 |
|
|
Long-term debt |
|
|
45,000 |
|
|
|
10,000 |
|
|
Other long-term liabilities |
|
|
10,523 |
|
|
|
11,988 |
|
|
Total liabilities |
|
|
257,991 |
|
|
|
228,542 |
|
|
Commitments and contingencies |
|
|
|
|
|
|
|
|
|
Stockholders' equity: |
|
|
|
|
|
|
|
|
|
Common stock, $0.01 par value, authorized 50,000,000 shares; issued 24,919,624 and 24,784,367 shares, respectively; outstanding 21,345,159 and 22,012,651 shares, respectively |
|
|
249 |
|
|
|
248 |
|
|
Additional paid-in capital |
|
|
116,495 |
|
|
|
114,797 |
|
|
Retained earnings |
|
|
112,424 |
|
|
|
124,363 |
|
|
Less: Treasury stock, at cost; 3,574,465 and 2,771,716 shares, respectively |
|
|
(42,099 |
) |
|
|
(34,371 |
) |
|
Total stockholders' equity |
|
|
187,069 |
|
|
|
205,037 |
|
|
Total liabilities and stockholders' equity |
|
$ |
445,060 |
|
|
$ |
433,579 |
|
See accompanying notes to consolidated financial statements.
F-3
BIG 5 SPORTING GOODS CORPORATION
CONSOLIDATED STATEMENTS OF OPERATIONS
(In thousands, except per share data)
|
|
|
Year Ended |
|
|||||||||
|
|
|
December 31, 2017 |
|
|
January 1, 2017 |
|
|
January 3, 2016 |
|
|||
|
Net sales |
|
$ |
1,009,635 |
|
|
$ |
1,021,235 |
|
|
$ |
1,029,098 |
|
|
Cost of sales |
|
|
686,303 |
|
|
|
696,777 |
|
|
|
704,134 |
|
|
Gross profit |
|
|
323,332 |
|
|
|
324,458 |
|
|
|
324,964 |
|
|
Selling and administrative expense |
|
|
306,990 |
|
|
|
294,971 |
|
|
|
298,425 |
|
|
Operating income |
|
|
16,342 |
|
|
|
29,487 |
|
|
|
26,539 |
|
|
Interest expense |
|
|
1,644 |
|
|
|
1,551 |
|
|
|
1,791 |
|
|
Income before income taxes |
|
|
14,698 |
|
|
|
27,936 |
|
|
|
24,748 |
|
|
Income taxes |
|
|
13,594 |
|
|
|
11,050 |
|
|
|
9,451 |
|
|
Net income |
|
$ |
1,104 |
|
|
$ |
16,886 |
|
|
$ |
15,297 |
|
|
Earnings per share: |
|
|
|
|
|
|
|
|
|
|
|
|
|
Basic |
|
$ |
0.05 |
|
|
$ |
0.78 |
|
|
$ |
0.70 |
|
|
Diluted |
|
$ |
0.05 |
|
|
$ |
0.77 |
|
|
$ |
0.70 |
|
|
Dividends per share |
|
$ |
0.60 |
|
|
$ |
0.525 |
|
|
$ |
0.40 |
|
|
Weighted-average shares of common stock outstanding: |
|
|
|
|
|
|
|
|
|
|
|
|
|
Basic |
|
|
21,439 |
|
|
|
21,607 |
|
|
|
21,741 |
|
|
Diluted |
|
|
21,585 |
|
|
|
21,816 |
|
|
|
21,927 |
|
See accompanying notes to consolidated financial statements.
F-4
BIG 5 SPORTING GOODS CORPORATION
CONSOLIDATED STATEMENTS OF STOCKHOLDERS’ EQUITY
(In thousands, except share amounts)
|
|
|
|
|
|
|
|
|
|
|
Additional |
|
|
|
|
|
|
Treasury |
|
|
|
|
|
||
|
|
|
Common Stock |
|
|
Paid-In |
|
|
Retained |
|
|
Stock, |
|
|
|
|
|
||||||||
|
|
|
Shares |
|
|
Amount |
|
|
Capital |
|
|
Earnings |
|
|
At Cost |
|
|
Total |
|
||||||
|
Balance as of December 28, 2014 |
|
|
22,180,458 |
|
|
$ |
245 |
|
|
$ |
110,707 |
|
|
$ |
112,521 |
|
|
$ |
(28,469 |
) |
|
$ |
195,004 |
|
|
Net income |
|
|
— |
|
|
|
— |
|
|
|
— |
|
|
|
15,297 |
|
|
|
— |
|
|
|
15,297 |
|
|
Dividends on common stock ($0.40 per share) |
|
|
— |
|
|
|
— |
|
|
|
— |
|
|
|
(8,820 |
) |
|
|
— |
|
|
|
(8,820 |
) |
|
Issuance of nonvested share awards |
|
|
152,140 |
|
|
|
2 |
|
|
|
(2 |
) |
|
|
— |
|
|
|
— |
|
|
|
— |
|
|
Exercise of share option awards |
|
|
25,875 |
|
|
|
— |
|
|
|
147 |
|
|
|
— |
|
|
|
— |
|
|
|
147 |
|
|
Share-based compensation |
|
|
— |
|
|
|
— |
|
|
|
2,235 |
|
|
|
— |
|
|
|
— |
|
|
|
2,235 |
|
|
Tax deficiency from share-based awards activity |
|
|
— |
|
|
|
— |
|
|
|
(167 |
) |
|
|
— |
|
|
|
— |
|
|
|
(167 |
) |
|
Forfeiture of nonvested share awards |
|
|
(7,940 |
) |
|
|
— |
|
|
|
— |
|
|
|
— |
|
|
|
— |
|
|
|
— |
|
|
Retirement of common stock for payment of withholding tax |
|
|
(52,621 |
) |
|
|
(1 |
) |
|
|
(684 |
) |
|
|
— |
|
|
|
— |
|
|
|
(685 |
) |
|
Purchases of treasury stock |
|
|
(379,930 |
) |
|
|
— |
|
|
|
— |
|
|
|
— |
|
|
|
(4,180 |
) |
|
|
(4,180 |
) |
|
Balance as of January 3, 2016 |
|
|
21,917,982 |
|
|
|
246 |
|
|
|
112,236 |
|
|
|
118,998 |
|
|
|
(32,649 |
) |
|
|
198,831 |
|
|
|
|
|
|
|
|
|
|
|
|
|
|
|
|
|
|
|
|
|
|
|
|
|
|
|
|
Net income |
|
|
— |
|
|
|
— |
|
|
|
— |
|
|
|
16,886 |
|
|
|
— |
|
|
|
16,886 |
|
|
Dividends on common stock ($0.525 per share) |
|
|
— |
|
|
|
— |
|
|
|
— |
|
|
|
(11,521 |
) |
|
|
— |
|
|
|
(11,521 |
) |
|
Issuance of nonvested share awards |
|
|
166,980 |
|
|
|
2 |
|
|
|
(2 |
) |
|
|
— |
|
|
|
— |
|
|
|
— |
|
|
Exercise of share option awards |
|
|
137,161 |
|
|
|
1 |
|
|
|
1,078 |
|
|
|
— |
|
|
|
— |
|
|
|
1,079 |
|
|
Share-based compensation |
|
|
— |
|
|
|
— |
|
|
|
2,319 |
|
|
|
— |
|
|
|
— |
|
|
|
2,319 |
|
|
Tax deficiency from share-based awards activity |
|
|
— |
|
|
|
— |
|
|
|
(222 |
) |
|
|
— |
|
|
|
— |
|
|
|
(222 |
) |
|
Forfeiture of nonvested share awards |
|
|
(21,860 |
) |
|
|
— |
|
|
|
— |
|
|
|
— |
|
|
|
— |
|
|
|
— |
|
|
Retirement of common stock for payment of withholding tax |
|
|
(53,682 |
) |
|
|
(1 |
) |
|
|
(612 |
) |
|
|
— |
|
|
|
— |
|
|
|
(613 |
) |
|
Shares withheld for exercise of share option awards |
|
|
(7,031 |
) |
|
|
— |
|
|
|
— |
|
|
|
— |
|
|
|
(112 |
) |
|
|
(112 |
) |
|
Purchases of treasury stock |
|
|
(126,899 |
) |
|
|
— |
|
|
|
— |
|
|
|
— |
|
|
|
(1,610 |
) |
|
|
(1,610 |
) |
|
Balance as of January 1, 2017 |
|
|
22,012,651 |
|
|
|
248 |
|
|
|
114,797 |
|
|
|
124,363 |
|
|
|
(34,371 |
) |
|
|
205,037 |
|
|
|
|
|
|
|
|
|
|
|
|
|
|
|
|
|
|
|
|
|
|
|
|
|
|
|
|
Net income |
|
|
— |
|
|
|
— |
|
|
|
— |
|
|
|
1,104 |
|
|
|
— |
|
|
|
1,104 |
|
|
Dividends on common stock ($0.60 per share) |
|
|
— |
|
|
|
— |
|
|
|
— |
|
|
|
(13,043 |
) |
|
|
— |
|
|
|
(13,043 |
) |
|
Issuance of nonvested share awards |
|
|
203,112 |
|
|
|
2 |
|
|
|
(2 |
) |
|
|
— |
|
|
|
— |
|
|
|
— |
|
|
Exercise of share option awards |
|
|
11,086 |
|
|
|
— |
|
|
|
67 |
|
|
|
— |
|
|
|
— |
|
|
|
67 |
|
|
Share-based compensation |
|
|
— |
|
|
|
— |
|
|
|
2,301 |
|
|
|
— |
|
|
|
— |
|
|
|
2,301 |
|
|
Forfeiture of nonvested share awards |
|
|
(31,960 |
) |
|
|
— |
|
|
|
— |
|
|
|
— |
|
|
|
— |
|
|
|
— |
|
|
Retirement of common stock for payment of withholding tax |
|
|
(54,012 |
) |
|
|
(1 |
) |
|
|
(804 |
) |
|
|
— |
|
|
|
— |
|
|
|
(805 |
) |
|
Net disgorgement of stockholder's short-swing profits |
|
|
— |
|
|
|
— |
|
|
|
136 |
|
|
|
— |
|
|
|
— |
|
|
|
136 |
|
|
Purchases of treasury stock |
|
|
(795,718 |
) |
|
|
— |
|
|
|
— |
|
|
|
— |
|
|
|
(7,728 |
) |
|
|
(7,728 |
) |
|
Balance as of December 31, 2017 |
|
|
21,345,159 |
|
|
$ |
249 |
|
|
$ |
116,495 |
|
|
$ |
112,424 |
|
|
$ |
(42,099 |
) |
|
$ |
187,069 |
|
See accompanying notes to consolidated financial statements.
F-5
BIG 5 SPORTING GOODS CORPORATION
CONSOLIDATED STATEMENTS OF CASH FLOWS
(In thousands)
|
|
|
Year Ended |
|
|||||||||
|
|
|
December 31, 2017 |
|
|
January 1, 2017 |
|
|
January 3, 2016 |
|
|||
|
Cash flows from operating activities: |
|
|
|
|
|
|
|
|
|
|
|
|
|
Net income |
|
$ |
1,104 |
|
|
$ |
16,886 |
|
|
$ |
15,297 |
|
|
Adjustments to reconcile net income to net cash |
|
|
|
|
|
|
|
|
|
|
|
|
|
(used in) provided by operating activities: |
|
|
|
|
|
|
|
|
|
|
|
|
|
Depreciation and amortization |
|
|
19,222 |
|
|
|
19,130 |
|
|
|
21,410 |
|
|
Impairment of store assets |
|
|
602 |
|
|
|
— |
|
|
|
192 |
|
|
Impairment of goodwill |
|
|
4,433 |
|
|
|
— |
|
|
|
— |
|
|
Share-based compensation |
|
|
2,301 |
|
|
|
2,319 |
|
|
|
2,235 |
|
|
Excess tax benefit related to share-based awards |
|
|
— |
|
|
|
(429 |
) |
|
|
(137 |
) |
|
Amortization of debt issuance costs |
|
|
154 |
|
|
|
176 |
|
|
|
177 |
|
|
Deferred income taxes |
|
|
9,527 |
|
|
|
(297 |
) |
|
|
415 |
|
|
Changes in operating assets and liabilities: |
|
|
|
|
|
|
|
|
|
|
|
|
|
Accounts receivable, net |
|
|
1,314 |
|
|
|
1,980 |
|
|
|
1,500 |
|
|
Merchandise inventories, net |
|
|
(19,586 |
) |
|
|
5,127 |
|
|
|
10,642 |
|
|
Prepaid expenses and other assets |
|
|
(8,955 |
) |
|
|
1,624 |
|
|
|
(3,142 |
) |
|
Accounts payable |
|
|
(3,903 |
) |
|
|
18,995 |
|
|
|
(7,368 |
) |
|
Accrued expenses and other long-term liabilities |
|
|
(10,597 |
) |
|
|
8,160 |
|
|
|
(1,576 |
) |
|
Net cash (used in) provided by operating activities |
|
|
(4,384 |
) |
|
|
73,671 |
|
|
|
39,645 |
|
|
|
|
|
|
|
|
|
|
|
|
|
|
|
|
Cash flows from investing activities: |
|
|
|
|
|
|
|
|
|
|
|
|
|
Purchases of property and equipment |
|
|
(16,462 |
) |
|
|
(14,109 |
) |
|
|
(24,567 |
) |
|
Net cash used in investing activities |
|
|
(16,462 |
) |
|
|
(14,109 |
) |
|
|
(24,567 |
) |
|
|
|
|
|
|
|
|
|
|
|
|
|
|
|
Cash flows from financing activities: |
|
|
|
|
|
|
|
|
|
|
|
|
|
Principal borrowings under revolving credit facility |
|
|
252,459 |
|
|
|
207,303 |
|
|
|
202,218 |
|
|
Principal payments under revolving credit facility |
|
|
(217,459 |
) |
|
|
(252,149 |
) |
|
|
(213,684 |
) |
|
Changes in book overdraft |
|
|
8,367 |
|
|
|
(119 |
) |
|
|
6,992 |
|
|
Debt issuance costs |
|
|
(248 |
) |
|
|
— |
|
|
|
— |
|
|
Principal payments under capital lease obligations |
|
|
(1,683 |
) |
|
|
(1,516 |
) |
|
|
(1,599 |
) |
|
Proceeds from exercise of share option awards |
|
|
67 |
|
|
|
967 |
|
|
|
147 |
|
|
Proceeds from net disgorgement of stockholder's short-swing profits |
|
|
136 |
|
|
|
— |
|
|
|
— |
|
|
Excess tax benefit related to share-based awards |
|
|
— |
|
|
|
429 |
|
|
|
137 |
|
|
Purchases of treasury stock |
|
|
(7,728 |
) |
|
|
(1,610 |
) |
|
|
(4,180 |
) |
|
Tax withholding payments for share-based compensation |
|
|
(805 |
) |
|
|
(613 |
) |
|
|
(685 |
) |
|
Dividends paid |
|
|
(12,985 |
) |
|
|
(11,478 |
) |
|
|
(8,808 |
) |
|
Net cash provided by (used in) financing activities |
|
|
20,121 |
|
|
|
(58,786 |
) |
|
|
(19,462 |
) |
|
|
|
|
|
|
|
|
|
|
|
|
|
|
|
Net (decrease) increase in cash |
|
|
(725 |
) |
|
|
776 |
|
|
|
(4,384 |
) |
|
|
|
|
|
|
|
|
|
|
|
|
|
|
|
Cash at beginning of year |
|
|
7,895 |
|
|
|
7,119 |
|
|
|
11,503 |
|
|
|
|
|
|
|
|
|
|
|
|
|
|
|
|
Cash at end of year |
|
$ |
7,170 |
|
|
$ |
7,895 |
|
|
$ |
7,119 |
|
|
|
|
|
|
|
|
|
|
|
|
|
|
|
|
Supplemental disclosures of non-cash investing and financing activities: |
|
|
|
|
|
|
|
|
|
|
|
|
|
Property and equipment acquired under capital leases |
|
$ |
2,912 |
|
|
$ |
1,014 |
|
|
$ |
3,074 |
|
|
Property and equipment additions unpaid |
|
$ |
1,471 |
|
|
$ |
2,176 |
|
|
$ |
2,663 |
|
|
|
|
|
|
|
|
|
|
|
|
|
|
|
|
Supplemental disclosures of cash flow information: |
|
|
|
|
|
|
|
|
|
|
|
|
|
Interest paid |
|
$ |
1,193 |
|
|
$ |
1,333 |
|
|
$ |
1,691 |
|
|
Income taxes paid |
|
$ |
14,288 |
|
|
$ |
4,157 |
|
|
$ |
8,331 |
|
See accompanying notes to consolidated financial statements.
F-6
BIG 5 SPORTING GOODS CORPORATION
NOTES TO CONSOLIDATED FINANCIAL STATEMENTS
|
(1) |
Description of Business |
The accompanying consolidated financial statements as of December 31, 2017 and January 1, 2017 and for the years ended December 31, 2017 (“fiscal 2017”), January 1, 2017 (“fiscal 2016”) and January 3, 2016 (“fiscal 2015”) represent the financial position, results of operations and cash flows of Big 5 Sporting Goods Corporation (the “Company”) and its 100%-owned subsidiary, Big 5 Corp., and Big 5 Corp.’s 100%-owned subsidiary, Big 5 Services Corp. The Company is a leading sporting goods retailer in the western United States, operating 435 stores and an e-commerce platform as of December 31, 2017. The Company operates as one reportable segment under the “Big 5 Sporting Goods” name and provides a full-line product offering in a traditional sporting goods store format that averages approximately 11,000 square feet. The Company’s product mix includes athletic shoes, apparel and accessories, as well as a broad selection of outdoor and athletic equipment for team sports, fitness, camping, hunting, fishing, tennis, golf, winter and summer recreation and roller sports.
|
(2) |
Summary of Significant Accounting Policies |
Consolidation
The accompanying consolidated financial statements include the accounts of Big 5 Sporting Goods Corporation, Big 5 Corp. and Big 5 Services Corp. Intercompany balances and transactions have been eliminated in consolidation.
Reporting Period
The Company follows the concept of a 52-53 week fiscal year, which ends on the Sunday nearest December 31. Fiscal 2016 and 2017 each included 52 weeks and fiscal 2015 included 53 weeks.
Recently Adopted Accounting Updates
In March 2016, the Financial Accounting Standards Board (“FASB”) issued Accounting Standards Update (“ASU”) No. 2016-09, Compensation—Stock Compensation (Topic 718): Improvements to Employee Share-Based Payment Accounting, which includes multiple provisions intended to simplify various aspects of the accounting for share-based payments, including treatment of excess tax benefits and forfeitures, as well as consideration of minimum statutory tax withholding requirements. The ASU took effect for public companies for fiscal years, and interim periods within those fiscal years, beginning after December 15, 2016, with early application permitted as of the beginning of an interim or annual reporting period. The Company adopted this standard in the first quarter of fiscal 2017, coinciding with the standard’s effective date, and has applied the effects of the adoption from the beginning of fiscal 2017, as follows:
|
|
• |
Excess tax benefits or deficiencies are applied prospectively and recorded as a component of the income tax provision in the fiscal 2017 consolidated statement of operations. Such amounts were previously recognized in additional paid-in capital, to the extent that there was a sufficient additional paid-in capital pool related to previously-recognized tax benefits, on the Company’s consolidated balance sheets. No prior periods have been adjusted. |
|
|
• |
The Company had no unrecognized tax benefits related to its share-based payment awards at the adoption date. Therefore, no cumulative-effect adjustment to retained earnings was required as of the adoption date. |
|
|
• |
Earnings per share amounts presented in the fiscal 2017 consolidated statement of operations have been adjusted prospectively, and exclude the impact of assumed proceeds from tax benefits under the treasury stock method, since such amounts are now included as a component of the income tax provision and are no longer recognized in additional paid-in capital on the Company’s consolidated balance sheet. No prior periods have been adjusted. |
|
|
• |
Excess tax benefits no longer represent financing activities since they are recognized in the fiscal 2017 consolidated statement of operations; therefore, excess tax benefits have been classified as operating activities in the fiscal 2017 consolidated statement of cash flows. The ASU eliminated the requirement to reclassify excess tax benefits from operating activities to financing activities. The Company elected to apply the change in presentation prospectively, and no prior periods have been adjusted. |
|
|
• |
The Company elected to continue to estimate the total number of awards for which the service period will not be rendered, which resulted in no change to the Company’s consolidated financial statements. |
F-7
BIG 5 SPORTING GOODS CORPORATION
NOTES TO CONSOLIDATED FINANCIAL STATEMENTS
(continued)
The adoption of this standard did not have a material impact on the Company’s consolidated financial statements.
In January 2017, the FASB issued ASU No. 2017-04, Intangibles—Goodwill and Other (Topic 350): Simplifying the Test for Goodwill Impairment, which eliminates the second step of the goodwill impairment test. The new ASU requires application of a one-step quantitative test, and recognition of the amount of goodwill impairment as the excess of a reporting unit’s carrying amount over its fair value, not to exceed the total amount of goodwill allocated to the reporting unit. The new guidance does not amend the optional qualitative assessment of goodwill impairment. The ASU will take effect for public companies for fiscal years, and interim periods within those fiscal years, beginning after December 15, 2019, and shall be applied prospectively. Early adoption of ASU No. 2017-04 is permitted for interim or annual goodwill impairment tests performed on testing dates after January 1, 2017. The Company early-adopted this new standard in the fourth quarter of fiscal 2017. In performing the annual test of goodwill impairment as of December 31, 2017, management identified an impairment of goodwill and applied the guidance of ASU 2017-04, resulting in the full impairment of the carrying value of goodwill. See Note 4 to the Notes to Consolidated Financial Statements for a further discussion on goodwill.
Recently Issued Accounting Updates
In May 2014, the FASB issued ASU No. 2014-09, Revenue from Contracts with Customers (Topic 606), which was further clarified and amended in 2015 and 2016, and supersedes most preexisting revenue recognition guidance with a comprehensive new revenue recognition model. The core principle is that an entity recognizes revenue to depict the transfer of promised goods or services to customers in an amount that reflects the consideration to which the entity expects to be entitled in exchange for those goods or services. The guidance also requires disclosures regarding the nature, amount, timing, and uncertainty of revenue and cash flows arising from contracts with customers. ASU No. 2014-09 will become effective for annual reporting periods (including interim reporting periods within those periods) beginning after December 15, 2017, with early application permitted. The Company plans to adopt this standard using the modified retrospective method with the cumulative effect of initially applying this ASU recognized in the first quarter of fiscal 2018, coinciding with the standard’s effective date. The Company has determined that the new standard will primarily impact the following areas: gift card breakage will be recognized based on actual customer redemptions, rather than when redemption is considered remote, and the Company expects to record a net pre-tax increase to retained earnings of approximately $0.7 million in the first quarter of fiscal 2018 related to the cumulative effect of initially applying this ASU; recognize estimated merchandise inventory cost of $1.3 million related to sales returns will be recorded in merchandise inventory, with the sales return reserve grossed up by the same amount; and, revenues related to online sales will be recognized upon shipment rather than delivery to the customer, with the cumulative effect related to this change expected to be immaterial. When adopted, this ASU results in minor modifications to the Company’s current processes and internal controls over financial reporting with no system modifications. The Company continues to analyze the disclosure requirements which will be effective in the first quarter of fiscal 2018 upon adoption of this ASU.
In February 2016, the FASB issued ASU No. 2016-02, Leases (Topic 842), which requires lessees to recognize on the balance sheet assets and liabilities for leases with lease terms of more than 12 months. Consistent with accounting principles generally accepted in the United States of America (“GAAP”), the recognition, measurement, and presentation of expenses and cash flows arising from a lease by a lessee will depend primarily on its classification as a finance or operating lease. However, unlike current GAAP—which requires only capital leases to be recognized on the balance sheet—the new ASU will require both types of leases to be recognized on the balance sheet, along with enhanced qualitative and quantitative disclosures. The ASU will take effect for public companies for fiscal years, and interim periods within those fiscal years, beginning after December 15, 2018. This ASU shall be applied at the beginning of the earliest period presented using the modified retrospective approach, which includes a number of practical expedients that an entity may elect to apply. Early application of ASU No. 2016-02 is permitted. The Company plans to adopt this standard in the first quarter of fiscal 2019, coinciding with the standard’s effective date. While the Company is still evaluating this ASU, the Company has determined that the primary impact will be to recognize on the balance sheet all operating leases with lease terms greater than 12 months. It is expected that this standard will have a material impact on the Company’s consolidated financial statements. The Company has formed a project team that is evaluating the pronouncement along with the practical expedients offered in the ASU as well as the enhanced disclosures, developing requirements for a lease accounting system, selecting a lease accounting software vendor and evaluating existing contracts for lease elements, among other activities, to account for this standard upon adoption.
F-8
BIG 5 SPORTING GOODS CORPORATION
NOTES TO CONSOLIDATED FINANCIAL STATEMENTS
(continued)
Other recently issued accounting updates are not expected to have a material impact on the Company’s consolidated financial statements.
Use of Estimates
Management has made a number of estimates and assumptions relating to the reporting of assets, liabilities and stockholders’ equity and the disclosure of contingent assets and liabilities at the date of the consolidated financial statements and reported amounts of revenue and expense during the reporting period to prepare these consolidated financial statements in conformity with GAAP. Certain items subject to such estimates and assumptions include the carrying amount of merchandise inventories, property and equipment, and goodwill; valuation allowances for receivables, sales returns and deferred income tax assets; estimates related to gift card breakage and the valuation of share-based compensation awards; and obligations related to litigation, self-insurance liabilities and employee benefits. Actual results could differ significantly from these estimates under different assumptions and conditions.
Segment Reporting
The Company operates solely as a sporting goods retailer, which includes both retail stores and an e-commerce platform, that offers a broad range of products in the western United States and online, and whose Chief Operating Decision Maker (“CODM”) is the Chief Executive Officer. The CODM reviews financial information presented on a consolidated basis, for purposes of allocating resources and evaluating financial performance. The Company’s stores typically have similar square footage, with the stores and e-commerce platform offering a similar general product mix. The Company’s core customer demographic remains similar across all sales channels, as does the Company’s process for the procurement and marketing of its product mix. Furthermore, the Company distributes its product mix for both the stores and e-commerce platform from a single distribution center. Given the consolidated level of review by the CODM, the Company operates as one reportable segment as defined by Accounting Standards Codification (“ASC”) 280, Segment Reporting.
The approximate net sales attributable to hard goods, athletic and sport apparel, athletic and sport footwear and other for the periods presented are set forth as follows:
|
|
|
Fiscal Year |
|
|||||||||
|
|
|
2017 |
|
|
2016 |
|
|
2015 |
|
|||
|
|
|
(In thousands) |
|
|||||||||
|
Hard goods |
|
$ |
509,618 |
|
|
$ |
529,869 |
|
|
$ |
534,864 |
|
|
Athletic and sport apparel |
|
|
206,816 |
|
|
|
200,476 |
|
|
|
199,109 |
|
|
Athletic and sport footwear |
|
|
288,536 |
|
|
|
287,399 |
|
|
|
291,325 |
|
|
Other sales |
|
|
4,665 |
|
|
|
3,491 |
|
|
|
3,800 |
|
|
Net sales |
|
$ |
1,009,635 |
|
|
$ |
1,021,235 |
|
|
$ |
1,029,098 |
|
The Company launched its e-commerce platform in the fourth quarter of fiscal 2014 and e-commerce net sales for fiscal 2017, 2016 and 2015 were not material.
Earnings Per Share
The Company calculates earnings per share in accordance with ASC 260, Earnings Per Share, which requires a dual presentation of basic and diluted earnings per share. Basic earnings per share is calculated by dividing net income by the weighted-average shares of common stock outstanding, reduced by shares repurchased and held in treasury, during the period. Diluted earnings per share represents basic earnings per share adjusted to include the potentially dilutive effect of outstanding share option awards, nonvested share awards and nonvested share unit awards.
F-9
BIG 5 SPORTING GOODS CORPORATION
NOTES TO CONSOLIDATED FINANCIAL STATEMENTS
(continued)
The Company recognizes revenue from retail sales at the point of sale through its retail stores. For e-commerce sales, revenue is recognized when the merchandise is delivered to the customer. Shipping and handling fees, when billed to customers for e-commerce sales, are included in net sales and the related shipping and handling costs are included in cost of sales. Sublease income is recognized ratably into revenue over the remaining lease term. Allowances for sales returns are estimated based upon historical experience and recorded as a reduction in sales in the relevant period, and are included in accrued expenses in the accompanying consolidated balance sheets.
Cash received from the sale of gift cards is recorded as a liability, and revenue is recognized upon the redemption of the gift card or when it is determined that the likelihood of redemption is remote (“gift card breakage”) and no liability to relevant jurisdictions exists. The Company determines the gift card breakage rate based upon historical redemption patterns and recognizes gift card breakage on a straight-line basis over the estimated gift card redemption period (20 quarters as of the end of fiscal 2017). The Company recognized approximately $0.4 million of gift card breakage revenue in each fiscal year presented. The Company had outstanding gift card liabilities of $5.7 million and $5.3 million as of December 31, 2017 and January 1, 2017, respectively, which are included in accrued expenses in the accompanying consolidated balance sheets.
The Company records sales tax collected from its customers on a net basis, and therefore excludes it from revenue as defined in ASC 605, Revenue Recognition.
Cost of Sales
Cost of sales includes the cost of merchandise, net of discounts or allowances earned, freight (including e-commerce shipping and handling costs), inventory reserves, buying, distribution center expense, including depreciation, and store occupancy expense. Store occupancy expense includes rent, amortization of leasehold improvements, common area maintenance, property taxes and insurance.
Selling and Administrative Expense
Selling and administrative expense includes store-related expense, other than store occupancy expense, as well as advertising, depreciation and amortization, expense associated with operating the Company’s corporate headquarters and impairment charges, if any.
Vendor Allowances
The Company receives allowances for co-operative advertising and volume purchase rebates earned through programs with certain vendors. The Company records a receivable for these allowances which are earned but not yet received when it is determined the amounts are probable and reasonably estimable, in accordance with ASC 605. Amounts relating to the purchase of merchandise are treated as a reduction of inventory cost and reduce cost of goods sold as the merchandise is sold. Amounts that represent a reimbursement of costs incurred, such as advertising, are recorded as a reduction in selling and administrative expense. The Company performs detailed analyses to determine the appropriate amount of vendor allowances to be applied as a reduction of merchandise cost and selling and administrative expense.
Advertising Expense
Advertising is expensed when the advertising first occurs. Advertising expense, net of co-operative advertising allowances, amounted to $37.9 million, $38.2 million and $39.8 million for fiscal 2017, 2016 and 2015, respectively. Advertising expense is included in selling and administrative expense in the accompanying consolidated statements of operations. The Company receives co-operative advertising allowances from certain product vendors in order to subsidize qualifying advertising and similar promotional expenditures made relating to vendors’ products. These advertising allowances are recognized as a reduction to selling and administrative expense when the Company incurs the advertising expense eligible for the credit. Co-operative advertising allowances recognized as a reduction to selling and administrative expense amounted to $5.6 million, $5.9 million and $6.0 million for fiscal 2017, 2016 and 2015, respectively.
F-10
BIG 5 SPORTING GOODS CORPORATION
NOTES TO CONSOLIDATED FINANCIAL STATEMENTS
(continued)
The Company accounts for its share-based compensation in accordance with ASC 718, Compensation—Stock Compensation. The Company recognizes compensation expense on a straight-line basis over the requisite service period using the fair-value method for share option awards, nonvested share awards and nonvested share unit awards granted with service-only conditions. See Note 16 to the Notes to Consolidated Financial Statements for a further discussion on share-based compensation.
Pre-opening Costs
Pre-opening costs for new stores, which are not material, consist primarily of payroll and recruiting expense, training, marketing, rent, travel and supplies, and are expensed as incurred.
Cash
Cash consists of cash on hand, and the Company has no cash equivalents. Book overdrafts are classified as current liabilities.
Accounts Receivable
Accounts receivable consist primarily of third party purchasing card receivables, amounts due from inventory vendors for returned products, volume purchase rebates or co-operative advertising, amounts due from lessors for tenant improvement allowances and insurance recovery receivables. Accounts receivable have not historically resulted in any material credit losses. An allowance for doubtful accounts is provided when accounts are determined to be uncollectible.
Valuation of Merchandise Inventories, Net
The Company’s merchandise inventories are made up of finished goods and are valued at the lower of cost or net realizable value using the weighted-average cost method that approximates the first-in, first-out (“FIFO”) method. Average cost includes the direct purchase price of merchandise inventory, net of vendor allowances and cash discounts, in-bound freight-related expense and allocated overhead expense associated with the Company’s distribution center.
Management regularly reviews inventories and records valuation reserves for damaged and defective merchandise, merchandise items with slow-moving or obsolescence exposure and merchandise that has a carrying value that exceeds net realizable value. Because of its merchandise mix, the Company has not historically experienced significant occurrences of obsolescence.
Inventory shrinkage is accrued as a percentage of merchandise sales based on historical inventory shrinkage trends. The Company performs physical inventories of its stores at least once per year and cycle counts inventories at its distribution center throughout the year. The reserve for inventory shrinkage primarily represents an estimate for inventory shrinkage for each store since the last physical inventory date through the reporting date.
These reserves are estimates, which could vary significantly, either favorably or unfavorably, from actual results if future economic conditions, consumer demand and competitive environments differ from expectations.
Prepaid Expenses
Prepaid expenses include the prepayment of various operating expenses such as insurance, rent, income and property taxes, software maintenance and supplies, which are expensed when the operating cost is realized.
F-11
BIG 5 SPORTING GOODS CORPORATION
NOTES TO CONSOLIDATED FINANCIAL STATEMENTS
(continued)
Property and equipment are stated at cost and are being depreciated or amortized utilizing the straight-line method over the following estimated useful lives:
|
Leasehold improvements |
|
Shorter of estimated useful life or term of lease |
|
Furniture and equipment |
|
3 – 10 years |
|
Internal-use software |
|
3 – 7 years |
Maintenance and repairs are expensed as incurred.
The Company incurs costs to purchase and develop software for internal use. Costs related to the application development stage are capitalized and amortized over the estimated useful life of the software. Costs related to the design or maintenance of internal-use software are expensed as incurred.
Goodwill represents the excess of purchase price over fair value of net assets acquired. Under ASC 350, Intangibles—Goodwill and Other, goodwill is not amortized but evaluated for impairment annually or whenever events or changes in circumstances indicate that the value may not be recoverable.
The Company performed an annual impairment test as of the end of fiscal 2017, 2016 and 2015, and determined that goodwill was impaired in fiscal 2017. See Note 4 to the Notes to Consolidated Financial Statements for a further discussion on goodwill.
Valuation of Long-Lived Assets
The Company reviews long-lived assets for impairment whenever events or changes in circumstances indicate that the carrying amount of an asset may not be recoverable.
Long-lived assets are reviewed for recoverability at the lowest level in which there are identifiable cash flows (“asset group”), usually at the store level. Each store typically requires net investments of approximately $0.5 million in long-lived assets to be held and used, subject to recoverability testing. The carrying amount of an asset group is not considered recoverable if it exceeds the sum of the undiscounted cash flows expected to result from the use and eventual disposition of the asset group. If the asset group is determined not to be recoverable, then an impairment charge will be recognized in the amount by which the carrying amount of the asset group exceeds its fair value, determined using discounted cash flow valuation techniques, as defined in ASC 360, Property, Plant, and Equipment.
The Company determines the sum of the undiscounted cash flows expected to result from the asset group by projecting future revenue, gross margin and operating expense for each store under evaluation for impairment. The estimates of future cash flows involve management judgment and are based upon assumptions about expected future operating performance. Assumptions used in these forecasts are consistent with internal planning, and include assumptions about sales growth rates, gross margins and operating expense in relation to the current economic environment and future expectations, competitive factors in various markets and inflation. The actual cash flows could differ from management’s estimates due to changes in business conditions, operating performance and economic conditions.
In fiscal 2017 and 2015, the Company recognized non-cash impairment charges of $0.6 million and $0.2 million, respectively, related to certain underperforming stores. These impairment charges are included in selling and administrative expense in the consolidated statements of operations. In fiscal 2016, the Company did not recognize any impairment charges.
F-12
BIG 5 SPORTING GOODS CORPORATION
NOTES TO CONSOLIDATED FINANCIAL STATEMENTS
(continued)
The Company accounts for its leases under the provisions of ASC 840, Leases.
The Company evaluates and classifies its leases as either operating or capital leases for financial reporting purposes. Operating lease commitments consist principally of leases for the Company’s retail store facilities, distribution center, corporate office, information technology hardware and distribution center delivery tractors. Capital lease obligations consist principally of leases for some of the Company’s information technology systems hardware.
Certain of the leases for the Company’s retail store facilities provide for payments based on future sales volumes at the leased location, which are not measurable at the inception of the lease. These contingent rents are expensed as they accrue.
Deferred rent represents the difference between rent paid and the amounts expensed for operating leases. Certain leases have scheduled rent increases, and certain leases include an initial period of free or reduced rent as an inducement to enter into the lease agreement (“rent holidays”). The Company recognizes rent expense for rent increases and rent holidays on a straight-line basis over the term of the underlying leases, without regard to when rent payments are made. The calculation of straight-line rent begins on the possession date and extends through the “reasonably assured” lease term as defined in ASC 840 and may exceed the initial non-cancelable lease term.
Landlord allowances for tenant improvements, or lease incentives, are recorded as deferred rent and amortized on a straight-line basis over the “reasonably assured” lease term as a component of rent expense.
The Company evaluates its leases relative to asset retirement obligations, and determined these amounts to be immaterial.
Self-Insurance Liabilities
The Company maintains self-insurance programs for its commercial general liability risk and, in certain states, its estimated workers’ compensation liability risk. The Company also has a self-funded insurance program for a portion of its employee medical benefits. Under these programs, the Company maintains insurance coverage for losses in excess of specified per-occurrence amounts. Estimated expenses incurred under the self-insured workers’ compensation and medical benefits programs, including incurred but not reported claims, are recorded as expense based upon historical experience, trends of paid and incurred claims, and other actuarial assumptions. If actual claims trends under these programs, including the severity or frequency of claims, differ from the Company’s estimates, its financial results may be significantly impacted. The Company’s estimated self-insurance liabilities, which are reported gross of expected workers’ compensation insurance reimbursements, are classified on the balance sheet as accrued expenses or other long-term liabilities based upon whether they are expected to be paid during or beyond the normal operating cycle of 12 months from the date of the consolidated financial statements. Self-insurance liabilities totaled $11.6 million and $11.6 million as of December 31, 2017 and January 1, 2017, respectively, of which $4.6 million and $4.7 million were recorded as a component of accrued expenses as of December 31, 2017 and January 1, 2017, respectively, and $7.0 million and $6.9 million were recorded as a component of other long-term liabilities as of December 31, 2017 and January 1, 2017, respectively, in the accompanying consolidated balance sheets.
Income Taxes
Under the asset and liability method prescribed within ASC 740, Income Taxes, the Company recognizes deferred tax assets and liabilities for the future tax consequences attributable to differences between financial statement carrying amounts of assets and liabilities and their respective tax bases. Deferred tax assets and liabilities are measured using enacted tax rates expected to apply to taxable income in the years in which those temporary differences are expected to be realized or settled. The effect of a change in tax rates on deferred tax assets and liabilities is recognized in income in the period that includes the enactment date. The realizability of deferred tax assets is assessed throughout the year and a valuation allowance is recorded if necessary to reduce net deferred tax assets to the amount more likely than not to be realized. Certain prior period deferred tax disclosures were reclassified to conform with current period presentation.
ASC 740 provides that a tax benefit from an uncertain tax position may be recognized when it is more likely than not that the position will be sustained upon examination, including resolutions of any related appeals or litigation processes, based on the technical merits of the position. ASC 740 also provides guidance on measurement, derecognition, classification, interest and penalties, accounting in interim periods, disclosure and transition.
F-13
BIG 5 SPORTING GOODS CORPORATION
NOTES TO CONSOLIDATED FINANCIAL STATEMENTS
(continued)
The Company’s practice is to recognize interest accrued related to unrecognized tax benefits in interest expense and penalties in selling and administrative expense. As of December 31, 2017 and January 1, 2017, the Company had no accrued interest or penalties.
Concentration of Risk
The Company maintains its cash accounts in financial institutions, and accounts at these institutions are insured by the Federal Deposit Insurance Corporation up to $250,000.
The Company primarily operates traditional sporting goods retail stores located in the western United States. Because of this, the Company is subject to regional risks, such as the economy, including downturns in the housing market, state financial conditions, unemployment and gas prices. Other regional risks include weather conditions, fires, droughts, earthquakes, power outages and other natural disasters specific to the states in which the Company operates.
The Company relies on a single distribution center located in Riverside, California, which services all of its stores and e-commerce platform. Any natural disaster or other serious disruption to the distribution center due to fire, earthquake or any other cause could damage a significant portion of inventory and could materially impair the Company’s ability to adequately stock its stores and fulfill its e-commerce business.
A substantial amount of the Company’s inventory is manufactured abroad. From time to time, shipping ports experience capacity constraints, labor strikes, work stoppages or other disruptions that may delay the delivery of imported products. A contract dispute, such as the one the Company experienced in the Ports of Los Angeles and Long Beach in 2015, may lead to protracted delays in the movement of the Company’s products, which could further delay the delivery of products to the Company’s stores and impact net sales and profitability. In addition, other conditions outside of the Company’s control, such as adverse weather conditions or acts of terrorism, could significantly disrupt operations at shipping ports or otherwise impact transportation of the imported merchandise we sell.
The Company purchases merchandise from over 700 suppliers, and the Company’s 20 largest suppliers accounted for 40.9% of total purchases in fiscal 2017. One vendor represented greater than 5% of total purchases, at 11.0%, in fiscal 2017. A significant portion of the Company’s inventory is manufactured abroad in China and other countries. Foreign imports subject us to the risks of changes in, or the imposition of new, import tariffs, duties or quotas, new restrictions on imports, loss of “most favored nation” status with the United States for a particular foreign country, antidumping or countervailing duty orders, retaliatory actions in response to illegal trade practices, work stoppages, delays in shipment, freight expense increases, product cost increases due to foreign currency fluctuations or revaluations and economic uncertainties. If a disruption of trade were to occur from the countries in which the suppliers of the Company’s vendors are located, the Company may be unable to obtain sufficient quantities of products to satisfy its requirements, or the cost of obtaining products may increase.
The Company could be exposed to credit risk in the event of nonperformance by any lender under its revolving credit facility. Instability in the financial and capital markets could bring additional potential risks to the Company, including higher costs of credit, potential lender defaults, and potential commercial bank failures. The Company has received no indication that any such events will negatively impact the lenders under its current revolving credit facility; however, the possibility does exist.
F-14
BIG 5 SPORTING GOODS CORPORATION
NOTES TO CONSOLIDATED FINANCIAL STATEMENTS
(continued)
Property and equipment, net, consist of the following:
|
|
|
December 31, 2017 |
|
|
January 1, 2017 |
|
||
|
|
|
(In thousands) |
|
|||||
|
Furniture and equipment |
|
$ |
136,858 |
|
|
$ |
130,429 |
|
|
Leasehold improvements |
|
|
160,945 |
|
|
|
154,487 |
|
|
Internal-use software |
|
|
34,215 |
|
|
|
33,701 |
|
|
|
|
|
332,018 |
|
|
|
318,617 |
|
|
Accumulated depreciation and amortization (1) |
|
|
(256,005 |
) |
|
|
(240,926 |
) |
|
|
|
|
76,013 |
|
|
|
77,691 |
|
|
Assets not placed into service |
|
|
1,252 |
|
|
|
729 |
|
|
Property and equipment, net |
|
$ |
77,265 |
|
|
$ |
78,420 |
|
|
(1) |
Includes accumulated amortization for internal-use software development costs of $24.2 million and $21.6 million as of December 31, 2017 and January 1, 2017, respectively. |
Depreciation expense associated with property and equipment, including assets leased under capital leases, was $7.1 million, $7.8 million and $8.3 million for fiscal 2017, 2016 and 2015, respectively. Amortization expense for leasehold improvements was $9.6 million, $10.2 million and $11.6 million for fiscal 2017, 2016 and 2015, respectively. Amortization expense for internal-use software was $2.5 million, $1.1 million and $1.5 million for fiscal 2017, 2016 and 2015, respectively. The gross cost of equipment under capital leases, included above, was $11.9 million and $9.9 million as of December 31, 2017 and January 1, 2017, respectively. The accumulated depreciation related to these capital leases was $7.5 million and $6.6 million as of December 31, 2017 and January 1, 2017, respectively.
|
(4) |
Goodwill |
Goodwill represents the excess of purchase price over fair value of net assets acquired. Under ASC 350, goodwill is not amortized but evaluated for impairment annually or whenever events or changes in circumstances indicate that the value may not be recoverable. The Company performs its annual impairment testing as of the end of each fiscal year. The Company has one reporting unit for goodwill impairment testing purposes. As described in Note 2 to the Notes to Consolidated Financial Statements, in the fourth quarter of fiscal 2017 the Company early-adopted ASU No. 2017-04, Intangibles—Goodwill and Other (Topic 350): Simplifying the Test for Goodwill Impairment, which requires recognition of goodwill impairment in the amount of the excess of a reporting unit’s carrying value over its fair value, not to exceed the total goodwill balance of the reporting unit.
The Company performed a quarterly qualitative assessment of factors related to goodwill impairment testing, which included consideration of general economic conditions, industry and market conditions such as general product demand, weather-related impacts and increasing labor costs in Company-specific markets, overall financial performance, financial projections and changes in share price and market capitalization. Based on these evaluations at the end of each of the first three quarters of fiscal 2017, given the information available at the time of those assessments, the Company determined that there were no events or circumstances that indicated any impairment of goodwill. During the fourth quarter of fiscal 2017, the Company experienced a significant decline in fourth quarter revenues due to unseasonably dry and warm weather conditions in most of our major markets that had a significant negative effect on sales of cold-weather and snow-related products, which resulted in a decrease in market capitalization and financial projections. Based upon this fourth quarter evaluation, the Company determined that the carrying value of its reporting unit more likely than not exceeded its estimated fair value. As a result, the Company performed a quantitative assessment of goodwill impairment testing, and estimated the fair value of its reporting unit using both a market and income approach.
Using the market approach, the Company estimated the fair value of its reporting unit based upon an evaluation of control premiums of publicly-traded companies in similar lines of business, on the assumption that an acquiring entity would generally pay more for equity securities that give it a controlling interest than an investor would pay for an amount of equity securities representing less than a controlling interest.
F-15
BIG 5 SPORTING GOODS CORPORATION
NOTES TO CONSOLIDATED FINANCIAL STATEMENTS
(continued)
Using the income approach, the Company employed a discounted cash flow model, which required the estimation of cash flows and an appropriate discount rate. The Company projected cash flows expected to be generated by the reporting unit inclusive of an estimated terminal value and reflective of the conditions considered in the qualitative assessment discussed above. The cash flows contemplated projections of revenue growth, operating expenses including depreciation, capital expenditures and income taxes, which are considered Level 3 fair value measurements. The discount rate assumption contemplated a weighted-average cost of capital based on both market-observable and Company-specific factors. The discount rate was risk-adjusted to include any premiums related to equity price volatility, size, and projected capital structure of publicly-traded companies in similar lines of business. The Company believes these assumptions to be representative of assumptions that a market participant would use in valuing a reporting unit, but recognizes that these assumptions are inherently uncertain.
After performing its annual impairment test as of December 31, 2017, the Company determined that the carrying value of its reporting unit exceeded its estimated fair value using the market and income approaches, as described above, by an amount that indicated a full impairment of the carrying value of goodwill. Consequently, the Company recorded a non-cash goodwill impairment charge of $4.4 million in selling and administrative expense in the accompanying consolidated statement of operations in the fourth quarter of fiscal 2017. The Company did not record goodwill impairment in fiscal 2016 or 2015.
|
(5) |
Impairment of Long-Lived Assets |
Long-lived assets are reviewed for impairment whenever events or changes in circumstances indicate that the carrying amount of an asset may not be recoverable. In fiscal 2016, the Company did not recognize any impairment charges. In fiscal 2017 and 2015, the Company recognized non-cash impairment charges of $0.6 million and $0.2 million, respectively, related to certain underperforming stores. The lower-than-expected sales performance, coupled with future undiscounted cash flow projections, indicated that the carrying value of these stores’ assets exceeded their estimated fair values as determined by their future discounted cash flow projections. When projecting the stream of future cash flows associated with an individual store for purposes of determining long-lived asset recoverability, management considers local market conditions and makes assumptions about key store variables including sales growth rates, gross margin and operating expense. If economic conditions deteriorate in the markets in which the Company conducts business, or if other negative market conditions develop, the Company may experience additional impairment charges in the future for underperforming stores. These impairment charges are included in selling and administrative expense for fiscal 2017 and 2015 in the accompanying consolidated statements of operations.
|
(6) |
Store Closing Costs |
There were no closures of underperforming stores that resulted in material store closing costs during fiscal 2017 and 2015.
The Company closed five underperforming stores in fiscal 2016 which were not relocated. The store closing costs primarily included lease termination costs for leases that were set to expire in fiscal years 2017 through 2019, and the net reduction to store closing costs in fiscal 2017 reflects the early termination of two store leases that resulted in settlement of their lease obligations for less than the amounts originally recorded. The following table summarizes the activity for the Company’s store closing reserves:
|
|
Lease Termination Costs |
|
|
|
|
(In thousands) |
|
|
|
Balance at January 1, 2017 |
$ |
788 |
|
|
Store closing costs |
|
(137 |
) |
|
Payments |
|
(631 |
) |
|
Balance at December 31, 2017 |
$ |
20 |
|
The Company has incurred $1.1 million of net expense to date since initially recording store closing costs in the third quarter of fiscal 2016. This expense is reflected as part of selling and administrative expense in the accompanying consolidated statement of operations.
Accrued store closing costs is recorded in accrued expenses in the accompanying consolidated balance sheets.
F-16
BIG 5 SPORTING GOODS CORPORATION
NOTES TO CONSOLIDATED FINANCIAL STATEMENTS
(continued)
The carrying values of cash, accounts receivable, accounts payable and accrued expenses approximate the fair values of these instruments due to their short-term nature. The carrying amount for borrowings under the revolving credit facility approximates fair value because of the variable market interest rate charged to the Company for these borrowings. When the Company recognizes impairment on certain of its underperforming stores, the carrying values of these stores are reduced to their estimated fair values.
As of December 31, 2017 and January 1, 2017, the Company’s only significant assets or liabilities measured at fair value on a nonrecurring basis subsequent to their initial recognition were assets subject to long-lived asset impairment related to certain underperforming stores. As discussed in Note 5 to the Notes to Consolidated Financial Statements, the Company estimated the fair values of these long-lived assets based on the Company’s own judgments about the assumptions that market participants would use in pricing the asset and on observable market data, when available. The Company classified these fair value measurements as Level 3 inputs, which are unobservable inputs for which market data are not available and that are developed using the best information available about pricing assumptions used by market participants in accordance with ASC 820, Fair Value Measurement. After the impairment charges, the carrying values of the remaining assets of these stores were not material.
As discussed in Note 4 of the Notes to Consolidated Financial Statements, the Company recorded a goodwill impairment charge of $4.4 million in the fourth quarter of fiscal 2017. The fair value of the Company’s reporting unit was determined using level 3 inputs and valuation techniques discussed in Note 4. There were no goodwill impairment charges recorded in fiscal 2016 or 2015.
|
(8) |
Accrued Expenses |
The major components of accrued expenses are as follows:
|
|
|
December 31, 2017 |
|
|
January 1, 2017 |
|
||
|
|
|
(In thousands) |
|
|||||
|
Payroll and related expense |
|
$ |
23,670 |
|
|
$ |
24,224 |
|
|
Occupancy expense |
|
|
10,005 |
|
|
|
10,981 |
|
|
Sales tax |
|
|
9,674 |
|
|
|
11,376 |
|
|
Other |
|
|
24,877 |
|
|
|
30,306 |
|
|
Accrued expenses |
|
$ |
68,226 |
|
|
$ |
76,887 |
|
|
(9) |
Lease Commitments |
The Company currently leases stores, distribution and headquarters facilities under non-cancelable operating leases. The Company’s leases generally contain multiple renewal options for periods ranging from five to ten years and require the Company to pay all executory costs such as maintenance and insurance. Certain of the Company’s store leases provide for the payment of contingent rent based on a percentage of sales.
Rent expense for operating leases consisted of the following:
|
|
|
Year Ended |
|
|||||||||
|
|
|
December 31, 2017 |
|
|
January 1, 2017 |
|
|
January 3, 2016 |
|
|||
|
|
|
(In thousands) |
|
|||||||||
|
Rent expense |
|
$ |
75,250 |
|
|
$ |
72,631 |
|
|
$ |
71,541 |
|
|
Contingent rent |
|
|
393 |
|
|
|
513 |
|
|
|
654 |
|
|
Total rent expense |
|
$ |
75,643 |
|
|
$ |
73,144 |
|
|
$ |
72,195 |
|
F-17
BIG 5 SPORTING GOODS CORPORATION
NOTES TO CONSOLIDATED FINANCIAL STATEMENTS
(continued)
Future minimum lease payments under non-cancelable leases as of December 31, 2017 are as follows:
|
Year Ending: |
|
Capital Leases |
|
|
Operating Leases |
|
|
Total |
|
|||
|
|
|
(In thousands) |
|
|||||||||
|
2018 |
|
$ |
1,933 |
|
|
$ |
80,889 |
|
|
$ |
82,822 |
|
|
2019 |
|
|
1,526 |
|
|
|
71,192 |
|
|
|
72,718 |
|
|
2020 |
|
|
1,045 |
|
|
|
57,131 |
|
|
|
58,176 |
|
|
2021 |
|
|
361 |
|
|
|
41,143 |
|
|
|
41,504 |
|
|
2022 |
|
|
26 |
|
|
|
29,061 |
|
|
|
29,087 |
|
|
Thereafter |
|
|
— |
|
|
|
58,019 |
|
|
|
58,019 |
|
|
Total minimum lease payments (1) |
|
|
4,891 |
|
|
$ |
337,435 |
|
|
$ |
342,326 |
|
|
Imputed interest |
|
|
(337 |
) |
|
|
|
|
|
|
|
|
|
Present value of minimum lease payments |
|
$ |
4,554 |
|
|
|
|
|
|
|
|
|
|
(1) |
Minimum lease payments have not been reduced by sublease rentals of $0.7 million due in the future under non-cancelable subleases. |
In the fourth quarter of fiscal 2016, the Company entered into an assignment agreement for a certain store lease. In consideration for the assignment, the Company received an assignment fee of $4.3 million. The assignment is accounted for as a sublease arrangement and the assignment fee has been deferred into accrued expenses and other long-term liabilities in the accompanying consolidated balance sheets. The remaining balance of the deferred lease revenue as of the end of fiscal 2017 was $2.9 million, and $0.9 million per year will be recognized ratably into revenue over the remaining lease term of approximately three years.
|
(10) |
Long-Term Debt |
On October 18, 2010, the Company, Big 5 Corp. and Big 5 Services Corp. entered into a credit agreement with Wells Fargo Bank, National Association (“Wells Fargo”), as administrative agent, and a syndicate of other lenders, which was amended on October 31, 2011 and December 19, 2013 (as so amended, the “Credit Agreement”). On September 29, 2017, the parties amended certain provisions of the Credit Agreement (such amendment, the “Third Amendment”), as further discussed below. The amendment represented a modification and resulted in the payment and capitalization of $0.2 million in deferred financing fees.
The Credit Agreement provides for a revolving credit facility (the “Credit Facility”) with an aggregate committed availability of up to $140.0 million, which amount may be increased at the Company’s option up to a maximum of $165.0 million. The Company may also request additional increases in aggregate availability, up to a maximum of $200.0 million, in which case the existing lenders under the Credit Agreement will have the option to increase their commitments to accommodate the requested increase. If such existing lenders do not exercise that option, the Company may (with the consent of Wells Fargo, not to be unreasonably withheld) seek other lenders willing to provide such commitments. The Third Amendment includes a provision which permits the Company to elect to reduce the aggregate committed availability under the Credit Agreement to $100.0 million for a three-month period each calendar year. Prior to the Third Amendment, the Credit Facility included a $50.0 million sublimit for issuances of letters of credit. The Third Amendment reduced the letter of credit sublimit to $25.0 million. The Credit Facility includes a $20.0 million sublimit for swingline loans.
The Company may borrow under the Credit Facility from time to time, provided the amounts outstanding will not exceed the lesser of the then aggregate availability (as discussed above) and the Borrowing Base (such lesser amount being referred to as the “Loan Cap”). The “Borrowing Base” generally is comprised of the sum, at the time of calculation, of (a) 90.00% of eligible credit card receivables; plus (b) the cost of eligible inventory (other than eligible in-transit inventory), net of inventory reserves, multiplied by 90.00% of the appraised net orderly liquidation value of eligible inventory (expressed as a percentage of the cost of eligible inventory); plus (c) the lesser of (i) the cost of eligible in-transit inventory, net of inventory reserves, multiplied by 90.00% of the appraised net orderly liquidation value of eligible in-transit inventory (expressed as a percentage of the cost of eligible in-transit inventory), or (ii) $10.0 million, minus (d) certain reserves established by Wells Fargo in its role as the Administrative Agent in its reasonable discretion.
F-18
BIG 5 SPORTING GOODS CORPORATION
NOTES TO CONSOLIDATED FINANCIAL STATEMENTS
(continued)
Generally, the Company may designate specific borrowings under the Credit Facility as either base rate loans or LIBO rate loans. The applicable interest rate on the Company’s borrowings is a function of the daily average, over the preceding fiscal quarter, of the excess of the Loan Cap over amounts borrowed (such amount being referred to as the “Average Daily Availability”). Prior to the Third Amendment, those loans designated as LIBO rate loans bore interest at a rate equal to the then applicable LIBO rate plus an applicable margin as shown in the table below. Those loans designated as base rate loans bore interest at a rate equal to the applicable margin for base rate loans (as shown below) plus the highest of (a) the Federal funds rate, as in effect from time to time, plus one-half of one percent (0.50%), (b) the LIBO rate, as adjusted to account for statutory reserves, plus one percent (1.00%), or (c) the rate of interest in effect for such day as publicly announced from time to time by Wells Fargo as its “prime rate.” Prior to the Third Amendment, the applicable margin for all loans under the existing Credit Agreement was as set forth below as a function of Average Daily Availability for the preceding fiscal quarter.
|
Level |
|
Average Daily Availability |
|
LIBO Rate Applicable Margin |
|
Base Rate Applicable Margin |
|
I |
|
Greater than or equal to $100,000,000 |
|
1.25% |
|
0.25% |
|
II |
|
Less than $100,000,000 but greater than or equal to $40,000,000 |
|
1.50% |
|
0.50% |
|
III |
|
Less than $40,000,000 |
|
1.75% |
|
0.75% |
Prior to the Third Amendment, the commitment fee assessed on the unused portion of the Credit Facility was 0.25% per annum.
After giving effect to the Third Amendment, those loans designated as LIBO rate loans will bear interest at a rate equal to the then applicable adjusted LIBO rate plus an applicable margin as shown in the table below. Those loans designated as base rate loans bear interest at a rate equal to the applicable margin for base rate loans (as shown below) plus the highest of (a) the Federal funds rate, as in effect from time to time, plus one-half of one percent (0.50%), (b) the LIBO rate, plus one percentage point (1.00%), or (c) the rate of interest in effect for such day as announced from time to time within Wells Fargo as its “prime rate.” The applicable margin for all loans will be a function of Average Daily Availability for the preceding fiscal quarter as set forth below.
|
Level |
|
Average Daily Availability |
|
LIBO Rate Applicable Margin |
|
Base Rate Applicable Margin |
|
I |
|
Greater than or equal to $70,000,000 |
|
1.25% |
|
0.25% |
|
II |
|
Less than $70,000,000 |
|
1.375% |
|
0.50% |
After giving effect to the Third Amendment, the commitment fee assessed on the unused portion of the Credit Facility is 0.20% per annum.
Obligations under the Credit Facility are secured by a general lien and perfected security interest in substantially all of the Company’s assets. The Credit Agreement contains covenants that require the Company to maintain a fixed charge coverage ratio of not less than 1.0:1.0 in certain circumstances, and limit the ability to, among other things, incur liens, incur additional indebtedness, transfer or dispose of assets, change the nature of the business, guarantee obligations, pay dividends or make other distributions or repurchase stock, and make advances, loans or investments. The Company may declare or pay cash dividends or repurchase stock only if, among other things, no default or event of default then exists or would arise from such dividend or repurchase of stock and, after giving effect to such dividend or repurchase, certain availability and/or fixed charge coverage ratio requirements are satisfied. The Credit Agreement contains customary events of default, including, without limitation, failure to pay when due principal amounts with respect to the Credit Facility, failure to pay any interest or other amounts under the Credit Facility for five days after becoming due, failure to comply with certain agreements or covenants contained in the Credit Agreement, failure to satisfy certain judgments against the Company, failure to pay when due (or any other default which does or may lead to the acceleration of) certain other material indebtedness in principal amount in excess of $5.0 million, and certain insolvency and bankruptcy events.
F-19
BIG 5 SPORTING GOODS CORPORATION
NOTES TO CONSOLIDATED FINANCIAL STATEMENTS
(continued)
As of December 31, 2017 and January 1, 2017, the one-month LIBO rate was 1.6% and 0.8%, respectively, and the Wells Fargo Bank prime lending rate was 4.50% and 3.75%, respectively. The average interest rate on the Company’s revolving credit borrowings during fiscal 2017 and 2016 was 2.60% and 2.20%, respectively. As of December 31, 2017 and January 1, 2017, the Company had long-term revolving credit borrowings outstanding bearing interest at either LIBO or the prime lending rates as follows:
|
|
|
December 31, 2017 |
|
|
January 1, 2017 |
|
||
|
|
|
(In thousands) |
|
|||||
|
LIBO rate |
|
$ |
45,000 |
|
|
$ |
10,000 |
|
|
Prime rate |
|
|
— |
|
|
|
— |
|
|
Total borrowings |
|
$ |
45,000 |
|
|
$ |
10,000 |
|
The Third Amendment extended the maturity date of the Credit Agreement from December 19, 2018 to September 29, 2022. Total remaining borrowing availability, after subtracting letters of credit, was $94.5 million and $129.5 million as of December 31, 2017 and January 1, 2017, respectively, and letter of credit commitments were $0.5 million and $0.5 million as of December 31, 2017 and January 1, 2017, respectively.
|
(11) |
Income Taxes |
Total income tax expense (benefit) consists of the following:
|
|
|
Current |
|
|
Deferred |
|
|
Total |
|
|||
|
|
|
(In thousands) |
|
|||||||||
|
Fiscal 2017: |
|
|
|
|
|
|
|
|
|
|
|
|
|
Federal |
|
$ |
3,231 |
|
|
$ |
8,092 |
|
|
$ |
11,323 |
|
|
State |
|
|
836 |
|
|
|
1,435 |
|
|
|
2,271 |
|
|
|
|
$ |
4,067 |
|
|
$ |
9,527 |
|
|
$ |
13,594 |
|
|
Fiscal 2016: |
|
|
|
|
|
|
|
|
|
|
|
|
|
Federal |
|
$ |
9,635 |
|
|
$ |
(652 |
) |
|
$ |
8,983 |
|
|
State |
|
|
1,712 |
|
|
|
355 |
|
|
|
2,067 |
|
|
|
|
$ |
11,347 |
|
|
$ |
(297 |
) |
|
$ |
11,050 |
|
|
Fiscal 2015: |
|
|
|
|
|
|
|
|
|
|
|
|
|
Federal |
|
$ |
7,478 |
|
|
$ |
378 |
|
|
$ |
7,856 |
|
|
State |
|
|
1,558 |
|
|
|
37 |
|
|
|
1,595 |
|
|
|
|
$ |
9,036 |
|
|
$ |
415 |
|
|
$ |
9,451 |
|
The provision for income taxes differs from the amounts computed by applying the federal statutory tax rate of 35% to earnings before income taxes, as follows:
|
|
|
Year Ended |
|
|||||||||
|
|
|
December 31, 2017 |
|
|
January 1, 2017 |
|
|
January 3, 2016 |
|
|||
|
|
|
(In thousands) |
|
|||||||||
|
Tax expense at statutory rate |
|
$ |
5,144 |
|
|
$ |
9,778 |
|
|
$ |
8,662 |
|
|
State taxes, net of federal benefit |
|
|
658 |
|
|
|
1,244 |
|
|
|
1,118 |
|
|
Federal rate change and other |
|
|
7,792 |
|
|
|
28 |
|
|
|
(329 |
) |
|
|
|
$ |
13,594 |
|
|
$ |
11,050 |
|
|
$ |
9,451 |
|
F-20
BIG 5 SPORTING GOODS CORPORATION
NOTES TO CONSOLIDATED FINANCIAL STATEMENTS
(continued)
The provision for income taxes for fiscal 2017 reflects a charge of $5.5 million to revalue existing net deferred tax assets as a result of the enactment of the Tax Cuts and Jobs Act (“TCJA”) in December 2017, which will reduce the federal corporate income tax rate from 35.0% to 21.0%. Additionally, the provision for income taxes for fiscal 2017 includes a charge of $0.9 million, excluding the federal income tax benefit, to establish a valuation allowance related to unused California Enterprise Zone Tax Credits, as well as a provision of $1.7 million related to non-deductible goodwill impairment. See Note 4 to the Notes to Consolidated Financial Statements for a further discussion of goodwill.
The provision for income taxes for fiscal 2016 reflects the write-off of deferred tax assets related to share-based compensation of $0.5 million, partially offset by an increase in Work Opportunity Tax Credits.
Deferred tax assets and liabilities as of December 31, 2017 are tax-effected based on the 21.0% federal corporate income tax rate under the recently-enacted TCJA, while deferred tax assets and liabilities as of January 1, 2017 are tax-effected based on the previous 35.0% federal corporate income tax rate.
Deferred tax assets and liabilities consist of the following tax-effected temporary differences:
|
|
|
December 31, 2017 |
|
|
January 1, 2017 |
|
||
|
|
|
(In thousands) |
|
|||||
|
Deferred tax assets: |
|
|
|
|
|
|
|
|
|
Deferred rent |
|
$ |
5,076 |
|
|
$ |
8,389 |
|
|
Insurance liabilities |
|
|
2,762 |
|
|
|
4,365 |
|
|
Employee benefit-related liabilities |
|
|
2,726 |
|
|
|
4,044 |
|
|
Inventory |
|
|
1,635 |
|
|
|
3,174 |
|
|
California Enterprise Zone Tax Credits |
|
|
1,451 |
|
|
|
1,542 |
|
|
Gift card liability |
|
|
1,033 |
|
|
|
1,420 |
|
|
Share-based compensation |
|
|
891 |
|
|
|
1,512 |
|
|
Deferred lease revenue |
|
|
803 |
|
|
|
1,595 |
|
|
Allowance for sales returns |
|
|
294 |
|
|
|
558 |
|
|
Other |
|
|
491 |
|
|
|
1,572 |
|
|
Gross deferred tax assets |
|
|
17,162 |
|
|
|
28,171 |
|
|
Less: Valuation allowance |
|
|
(876 |
) |
|
|
— |
|
|
Deferred tax assets, net of valuation allowance |
|
|
16,286 |
|
|
|
28,171 |
|
|
Federal liability on state deferred tax assets |
|
|
(1,234 |
) |
|
|
(2,559 |
) |
|
Basis difference in fixed assets |
|
|
(476 |
) |
|
|
(1,913 |
) |
|
Prepaid expense |
|
|
(404 |
) |
|
|
— |
|
|
Deferred tax liabilities |
|
|
(2,114 |
) |
|
|
(4,472 |
) |
|
Net deferred tax assets |
|
$ |
14,172 |
|
|
$ |
23,699 |
|
In fiscal 2017, the Company established a valuation allowance of $0.9 million related to unused California Enterprise Zone Tax Credits, which the Company will no longer be able to carry forward beyond 2024 as a result of California’s termination of this program. The Company had no valuation allowance as of January 1, 2017. In assessing the realizability of deferred tax assets, management considers whether it is more likely than not that some portion or all of the deferred tax assets will be realized. The ultimate realization of deferred tax assets is dependent upon the generation of future taxable income during the periods in which those temporary differences become deductible. Management considers the scheduled reversals of deferred tax liabilities, projected future taxable income and tax planning strategies in making this assessment. Based upon the level of historical taxable income and projections of future taxable income over the periods during which the deferred tax assets are deductible, except as noted above, management believes it is more likely than not that the Company will realize the benefits of these deductible differences. The amount of the deferred tax asset considered realizable, however, could be reduced if estimates of future taxable income are reduced.
The Company files a consolidated federal income tax return and files tax returns in various state and local jurisdictions. The statutes of limitations for its consolidated federal income tax returns are open for fiscal years 2014 and after, and state and local income tax returns are open for fiscal years 2013 and after.
F-21
BIG 5 SPORTING GOODS CORPORATION
NOTES TO CONSOLIDATED FINANCIAL STATEMENTS
(continued)
As of December 31, 2017 and January 1, 2017, the Company had no unrecognized tax benefits that, if recognized, would affect the Company’s effective income tax rate over the next 12 months. The Company’s policy is to recognize interest accrued related to unrecognized tax benefits in interest expense and penalties in operating expense. As of December 31, 2017 and January 1, 2017, the Company had no accrued interest or penalties.
|
(12) |
Earnings Per Share |
The Company calculates earnings per share in accordance with ASC 260, Earnings Per Share, which requires a dual presentation of basic and diluted earnings per share. Basic earnings per share is calculated by dividing net income by the weighted-average shares of common stock outstanding, reduced by shares repurchased and held in treasury, during the period. Diluted earnings per share represents basic earnings per share adjusted to include the potentially dilutive effect of outstanding share option awards, nonvested share awards and nonvested share unit awards.
The following table sets forth the computation of basic and diluted earnings per common share:
|
|
|
Year Ended |
|
|||||||||
|
|
|
December 31, 2017 |
|
|
January 1, 2017 |
|
|
January 3, 2016 |
|
|||
|
|
|
(In thousands, except per share data) |
|
|||||||||
|
|
|
|
|
|
|
|
|
|
|
|
|
|
|
Net income |
|
$ |
1,104 |
|
|
$ |
16,886 |
|
|
$ |
15,297 |
|
|
Weighted-average shares of common stock outstanding: |
|
|
|
|
|
|
|
|
|
|
|
|
|
Basic |
|
|
21,439 |
|
|
|
21,607 |
|
|
|
21,741 |
|
|
Dilutive effect of common stock equivalents arising from share option, nonvested share and nonvested share unit awards |
|
|
146 |
|
|
|
209 |
|
|
|
186 |
|
|
Diluted |
|
|
21,585 |
|
|
|
21,816 |
|
|
|
21,927 |
|
|
Basic earnings per share |
|
$ |
0.05 |
|
|
$ |
0.78 |
|
|
$ |
0.70 |
|
|
Diluted earnings per share |
|
$ |
0.05 |
|
|
$ |
0.77 |
|
|
$ |
0.70 |
|
|
Antidilutive share option awards excluded from diluted calculation |
|
|
83 |
|
|
|
200 |
|
|
|
481 |
|
|
Antidilutive nonvested share and nonvested share unit awards excluded from diluted calculation |
|
|
145 |
|
|
|
— |
|
|
|
2 |
|
The computation of diluted earnings per share for fiscal 2017, 2016 and 2015 does not include share option awards that were outstanding and antidilutive (i.e., including such share option awards would result in higher earnings per share), since the exercise prices of these share option awards exceeded the average market price of the Company’s common shares. Additionally, the computation of diluted earnings per share for fiscal 2017 and 2015 does not include nonvested share awards and nonvested share unit awards that were outstanding and antidilutive, since the grant date fair values of these nonvested share awards and nonvested share unit awards exceeded the average market price of the Company’s common shares. No nonvested share awards or nonvested share unit awards were antidilutive for fiscal 2016.
|
(13) |
Employee Benefit Plans |
The Company has a 401(k) plan covering eligible employees. Employee contributions are supplemented by Company contributions subject to 401(k) plan terms. The Company recognized employer matching and profit-sharing contributions of $1.8 million, $1.8 million and $2.0 million for fiscal 2017, 2016 and 2015, respectively.
F-22
BIG 5 SPORTING GOODS CORPORATION
NOTES TO CONSOLIDATED FINANCIAL STATEMENTS
(continued)
G. Michael Brown, who retired from the Company’s Board of Directors in June 2015, is a partner of the law firm of Musick, Peeler & Garrett LLP. From time to time, the Company retains Musick, Peeler & Garrett LLP to handle various litigation matters. The Company received services from Musick, Peeler & Garrett LLP amounting to $0.7 million in fiscal 2015.
In the third quarter of fiscal 2017, the Company recorded approximately $0.1 million related to the net recovery of short-swing profits under Section 16(b) of the Securities Exchange Act of 1934, as amended. The Company recognized these related party proceeds, net of $0.2 million of related legal fees and taxes, as an increase to additional paid-in capital in the accompanying consolidated balance sheet as of December 31, 2017 and as cash provided by financing activities in the accompanying consolidated statement of cash flows for fiscal 2017.
Prior to his death in fiscal 2008, the Company had an employment agreement with Robert W. Miller (“Mr. Miller”), co-founder of the Company and the father of Steven G. Miller, Chairman of the Board, President, Chief Executive Officer and a director of the Company. The employment agreement provided for Mr. Miller to receive an annual base salary of $350,000. The employment agreement further provided that, following his death, the Company will pay his surviving wife $350,000 per year and provide her specified benefits for the remainder of her life. During each of fiscal 2017, 2016 and 2015, the Company made a payment of $350,000 to Mr. Miller’s wife. The Company recognized expense of $0.2 million, $0.2 million and $0.3 million in fiscal 2017, 2016 and 2015, respectively, to provide for a liability for the future obligations under this agreement. Based upon actuarial valuation estimates related to this agreement, the Company had a recorded liability of $1.2 million and $1.3 million as of December 31, 2017 and January 1, 2017, respectively. The short-term portion of this liability is recorded in accrued expenses and the long-term portion is recorded in other long-term liabilities of the accompanying consolidated balance sheets.
|
(15) |
Commitments and Contingencies |
In February 2008, the Company entered into a lease for a parcel of land with an existing building adjacent to its corporate headquarters location, including a parking lot currently used by the Company (the “premises”). The lease term commenced in 2009 and the primary term was originally scheduled to expire on February 28, 2019, subject to renewal for six successive periods of five years each. In accordance with terms of the lease agreement, the Company is committed to the construction of a new retail building on the premises before the primary term expires, regardless of whether or not any renewal options are exercised. In May 2017, the Company entered into an amendment to the lease to, among other things, extend the primary lease term, and consequently the construction deadline, to a date between February 29, 2020 and June 30, 2020. Such extension required a non-refundable payment of $40,000, which the Company made concurrently with execution of the amendment. In November 2017, the Company entered into an additional amendment to the lease concurrently with entering into a purchase and sale agreement. Pursuant to the purchase and sale agreement, the Company has the right to purchase the premises for $4.5 million, subject to a due diligence period expiring March 2, 2018. If the Company does not terminate the purchase and sale agreement during the due diligence period, then the Company shall pay $300,000 as an escrow deposit to purchase the property. The closing of the sale is scheduled to occur on or before November 27, 2018, subject to seller’s right to elect an earlier closing date. Pursuant to the amended lease, if consummation of the sale fails to occur by November 27, 2018, then the Company’s lease would remain in full force and effect, including the construction deadline, which would be the later of (a) February 29, 2020, or (b) the earlier of (i) two (2) years after the date that the purchase and sale agreement is terminated, or (ii) November 27, 2020. The Company is currently in the process of conducting due diligence to determine whether to proceed with the purchase.
The Company is involved in various claims and legal actions arising in the ordinary course of business. In the opinion of management, the ultimate disposition of these matters is not expected to have a material adverse effect on the Company’s results of operations or financial condition.
F-23
BIG 5 SPORTING GOODS CORPORATION
NOTES TO CONSOLIDATED FINANCIAL STATEMENTS
(continued)
2007 Equity and Performance Incentive Plan
In June 2007, the Company adopted the 2007 Equity and Performance Incentive Plan (“2007 Plan”) and terminated a previous stock incentive plan (“2002 Plan”). The aggregate amount of shares authorized for issuance under the 2007 Plan is 2,399,250 shares of common stock of the Company, plus any shares subject to awards granted under the 2002 Plan which are forfeited, expire or are cancelled after April 24, 2007 (the effective date of the 2007 Plan). This amount represents the amount of shares that remained available for grant under the 2002 Plan as of April 24, 2007. Awards under the 2007 Plan may consist of share option awards (both incentive share option awards and non-qualified share option awards), stock appreciation rights, nonvested share awards, other stock unit awards, performance awards, or dividend equivalents. Any shares that are subject to awards of options or stock appreciation rights shall be counted against this limit (i.e., shares available for grant) as one share for every one share granted, regardless of the number of shares actually delivered pursuant to the awards. Any shares that are subject to awards other than share option awards or stock appreciation rights (including shares delivered on the settlement of dividend equivalents) shall be counted against this limit (i.e., shares available for grant) as 2.5 shares for every one share granted. The aggregate number of shares available under the 2007 Plan and the number of shares subject to outstanding share option awards will be increased or decreased to reflect any changes in the outstanding common stock of the Company by reason of any recapitalization, spin-off, reorganization, reclassification, stock dividend, stock split, reverse stock split, or similar transaction. Share option awards granted under the 2007 Plan generally vest and become exercisable at the rate of 25% per year with a maximum life of ten years. Share option awards, nonvested share awards and nonvested share unit awards provide for accelerated vesting if there is a change in control. The exercise price of the share option awards is equal to the quoted market price of the Company’s common stock on the date of grant.
Amendments and Restatements of 2007 Plan
On June 14, 2011 and June 10, 2016, the Company’s shareholders approved amendments and restatements of the Company’s 2007 Equity and Performance Incentive Plan (the “2011 Amendment and Restatement” and the “2016 Amendment and Restatement,” respectively, and collectively as so amended and restated, the “Amended 2007 Plan”). Neither amendment and restatement resulted in modifications to the Company’s outstanding share-based payment awards.
Generally, following these amendments and restatements, the Amended 2007 Plan reflected these revisions:
|
|
• |
the maximum number of shares of the Company’s common stock that may be issued or subject to awards under the Amended 2007 Plan was increased by 3,250,000 from the number authorized by the 2007 Plan; |
|
|
• |
the term of the Amended 2007 Plan was extended through April 19, 2026; |
|
|
• |
approved the continuation of the terms of Article X of the Amended 2007 Plan for purposes of Section 162(m) of the Internal Revenue Code; and |
|
|
• |
implemented certain technical updates and enhancements. |
After giving effect to the 2016 Amendment and Restatement, the aggregate amount of shares authorized for issuance under the Amended 2007 Plan was 3,649,250 shares, plus any shares subject to awards granted under the 2002 Plan which are forfeited, expire or are cancelled after April 24, 2007 (the effective date of the 2007 Plan).
These principal features of the Amended 2007 Plan are not intended to be a complete discussion of all of the terms of the Amended 2007 Plan. Respective copies of the 2011 Amendment and Restatement and the 2016 Amendment and Restatement were filed in Current Reports on Form 8-K in the second quarter of fiscal 2011 and 2016.
In fiscal 2017, the Company granted 191,000 nonvested share awards and 21,000 nonvested share unit awards to directors and certain employees, as defined by ASC 718, Compensation—Stock Compensation, under the Amended 2007 Plan. No share option awards were granted in fiscal 2017. As of December 31, 2017, 2,090,250 shares remained available for future grant and 144,293 share option awards, 377,035 nonvested share awards and 23,250 nonvested share unit awards remained outstanding under the Amended 2007 Plan.
F-24
BIG 5 SPORTING GOODS CORPORATION
NOTES TO CONSOLIDATED FINANCIAL STATEMENTS
(continued)
The Company accounts for its share-based compensation in accordance with ASC 718 and recognizes compensation expense on a straight-line basis over the requisite service period, net of estimated forfeitures, using the fair-value method for share option awards, nonvested share awards and nonvested share unit awards granted with service-only conditions. The estimated forfeiture rate considers historical employee turnover rates stratified into employee pools in comparison with an overall employee turnover rate, as well as expectations about the future. The Company periodically revises the estimated forfeiture rate in subsequent periods if actual forfeitures differ from those estimates. Compensation expense recorded under this method for fiscal 2017, 2016 and 2015 was $2.3 million, $2.3 million and $2.2 million, respectively, which reduced operating income and income before income taxes by the same amount. Compensation expense recognized in cost of sales was $0.1 million, $0.1 million and $0.1 million in fiscal 2017, 2016 and 2015, respectively, and compensation expense recognized in selling and administrative expense was $2.2 million, $2.2 million and $2.1 million in fiscal 2017, 2016 and 2015, respectively. The recognized tax benefit related to compensation expense for fiscal 2017, 2016 and 2015 was $0.9 million, $0.9 million and $0.8 million, respectively. Net income for fiscal 2017, 2016 and 2015 was reduced by $1.4 million, $1.4 million and $1.4 million, respectively, or $0.06, $0.06 and $0.06 per basic and diluted share, respectively.
Share Option Awards
The fair value of each share option award on the date of grant was estimated using the Black-Scholes method based on the following weighted-average assumptions:
|
|
|
Year Ended |
|
|||||||||||
|
|
|
December 31, 2017 |
|
|
January 1, 2017 |
|
|
January 3, 2016 |
|
|||||
|
Risk-free interest rate |
|
|
— |
|
|
|
— |
|
|
|
1.8 |
% |
||
|
Expected term |
|
|
— |
|
|
|
— |
|
|
5.8 years |
|
|||
|
Expected volatility |
|
|
— |
|
|
|
— |
|
|
|
57.0 |
% |
||
|
Expected dividend yield |
|
|
— |
|
|
|
— |
|
|
|
2.8 |
% |
||
The risk-free interest rate is based on the U.S. Treasury yield curve in effect at the time of grant for periods corresponding with the expected term of the option award; the expected term represents the weighted-average period of time that option awards granted are expected to be outstanding giving consideration to vesting schedules and historical participant exercise behavior; the expected volatility is based upon historical volatility of the Company’s common stock; and the expected dividend yield is based upon the Company’s current dividend rate and future expectations.
No share option awards were granted in fiscal 2017 and 2016. The weighted-average grant-date fair value of share option awards granted for fiscal 2015 was $6.02 per share.
A summary of the status of the Company’s share option awards is presented below:
|
|
|
Shares |
|
|
Weighted- Average Exercise Price |
|
|
Weighted- Average Remaining Contractual Life (In Years) |
|
|
Aggregate Intrinsic Value |
|
||||
|
Outstanding at January 1, 2017 |
|
|
224,379 |
|
|
$ |
14.13 |
|
|
|
|
|
|
|
|
|
|
Granted |
|
|
— |
|
|
|
— |
|
|
|
|
|
|
|
|
|
|
Exercised |
|
|
(11,086 |
) |
|
|
6.07 |
|
|
|
|
|
|
|
|
|
|
Forfeited or Expired |
|
|
(69,000 |
) |
|
|
23.82 |
|
|
|
|
|
|
|
|
|
|
Outstanding at December 31, 2017 |
|
|
144,293 |
|
|
$ |
10.11 |
|
|
|
3.00 |
|
|
$ |
159,083 |
|
|
Exercisable at December 31, 2017 |
|
|
130,543 |
|
|
$ |
9.74 |
|
|
|
2.56 |
|
|
$ |
159,083 |
|
|
Vested and Expected to Vest at December 31, 2017 |
|
|
144,256 |
|
|
$ |
10.11 |
|
|
|
3.00 |
|
|
$ |
159,083 |
|
The aggregate intrinsic value in the preceding table represents the total pre-tax intrinsic value, based upon the Company’s closing stock price of $7.60 per share as of December 31, 2017, which would have been received by the share option award holders had all share option award holders exercised their share option awards as of that date.
F-25
BIG 5 SPORTING GOODS CORPORATION
NOTES TO CONSOLIDATED FINANCIAL STATEMENTS
(continued)
The total intrinsic value of share option awards exercised for fiscal 2017, 2016 and 2015 was approximately $0.1 million, $1.3 million and $0.2 million, respectively. The total cash received from employees as a result of employee share option award exercises for fiscal 2017, 2016 and 2015 was approximately $0.1 million, $1.0 million and $0.1 million, respectively. The value of shares withheld in connection with the exercise of share option awards for fiscal 2016 was approximately $0.1 million. The actual tax benefit realized for the tax deduction from share option award exercises in fiscal 2017, 2016 and 2015 totaled $31,000, $0.5 million and $0.1 million, respectively.
As of December 31, 2017, there was $0.1 million of total unrecognized compensation expense related to nonvested share option awards granted. That expense is expected to be recognized over a weighted-average period of 1.2 years.
Nonvested Share Awards and Nonvested Share Unit Awards
Nonvested share awards and nonvested share unit awards granted by the Company vest for employees from the date of grant in four equal annual installments of 25% per year. Nonvested share awards and nonvested share unit awards granted by the Company to non-employee directors for their service as directors, as defined by ASC 718, vest 100% on the first anniversary of the grant date.
Nonvested share awards are delivered to the recipient upon their vesting. With respect to nonvested share unit awards, vested shares will be delivered to the recipient on the tenth business day of January following the year in which the recipient’s service to the Company is terminated. The total fair value of nonvested share awards which vested during fiscal 2017, 2016 and 2015 was $2.0 million, $1.6 million and $1.7 million, respectively. The total fair value of nonvested share unit awards which vested during fiscal 2017, 2016 and 2015 was $0.3 million, $0.5 million and $0.1 million, respectively.
The following table details the Company’s nonvested share awards activity for fiscal 2017:
|
|
|
Shares |
|
|
Weighted- Average Grant- Date Fair Value |
|
||
|
Balance at January 1, 2017 |
|
|
355,130 |
|
|
$ |
12.86 |
|
|
Granted |
|
|
191,000 |
|
|
|
14.88 |
|
|
Vested |
|
|
(137,135 |
) |
|
|
13.46 |
|
|
Forfeited |
|
|
(31,960 |
) |
|
|
13.51 |
|
|
Balance at December 31, 2017 |
|
|
377,035 |
|
|
$ |
13.61 |
|
The following table details the Company’s nonvested share unit awards activity for fiscal 2017:
|
|
|
Units |
|
|
Weighted- Average Grant- Date Fair Value |
|
||
|
Balance at January 1, 2017 |
|
|
27,750 |
|
|
$ |
9.55 |
|
|
Granted |
|
|
21,000 |
|
|
|
13.90 |
|
|
Vested |
|
|
(25,500 |
) |
|
|
10.15 |
|
|
Forfeited |
|
|
— |
|
|
|
— |
|
|
Balance at December 31, 2017 |
|
|
23,250 |
|
|
$ |
12.82 |
|
The weighted-average grant-date fair value of nonvested share awards and nonvested share unit awards is the quoted market price of the Company’s common stock on the date of grant, as shown in the tables above. The weighted-average grant-date fair value of nonvested share awards granted in fiscal 2017, 2016 and 2015 was $14.88 per share, $11.35 per share and $13.06 per share, respectively. The weighted-average grant-date fair value per share of the Company’s nonvested share unit awards granted in fiscal 2017, 2016 and 2015 was $13.90 per share, $8.87 per share and $14.67 per share, respectively.
F-26
BIG 5 SPORTING GOODS CORPORATION
NOTES TO CONSOLIDATED FINANCIAL STATEMENTS
(continued)
As of December 31, 2017, there was $3.5 million and $0.1 million of total unrecognized compensation expense related to nonvested share awards and nonvested share unit awards, respectively. That expense is expected to be recognized over a weighted-average period of approximately 2.3 years and 0.4 years for nonvested share awards and nonvested share unit awards, respectively.
To satisfy employee minimum statutory tax withholding requirements for nonvested share awards that vest, the Company withholds and retires a portion of the vesting common shares, unless an employee elects to pay cash. In fiscal 2017, the Company withheld 54,012 common shares with a total value of $0.8 million. This amount is presented as a cash outflow from financing activities in the accompanying consolidated statements of cash flows.
As of December 31, 2017, dividends accrued but not paid related to nonvested share awards were $0.2 million.
|
(17) |
Selected Quarterly Financial Data (unaudited) |
Fiscal 2017
|
|
|
First |
|
|
Second |
|
|
Third |
|
|
Fourth |
|
||||
|
|
|
Quarter |
|
|
Quarter |
|
|
Quarter |
|
|
Quarter(1)(2)(3)(4) |
|
||||
|
|
|
(In thousands, except per share data) |
|
|||||||||||||
|
Net sales |
|
$ |
252,604 |
|
|
$ |
243,671 |
|
|
$ |
270,471 |
|
|
$ |
242,889 |
|
|
Gross profit |
|
$ |
83,622 |
|
|
$ |
79,308 |
|
|
$ |
87,548 |
|
|
$ |
72,854 |
|
|
Net income (loss) |
|
$ |
5,326 |
|
|
$ |
2,778 |
|
|
$ |
5,950 |
|
|
$ |
(12,950 |
) |
|
Basic earnings per share |
|
$ |
0.25 |
|
|
$ |
0.13 |
|
|
$ |
0.28 |
|
|
$ |
(0.62 |
) |
|
Diluted earnings per share |
|
$ |
0.24 |
|
|
$ |
0.13 |
|
|
$ |
0.28 |
|
|
$ |
(0.62 |
) |
Fiscal 2016
|
|
|
First |
|
|
Second |
|
|
Third |
|
|
Fourth |
|
||||
|
|
|
Quarter(4)(5) |
|
|
Quarter(5)(6) |
|
|
Quarter(6) |
|
|
Quarter(5) |
|
||||
|
|
|
(In thousands, except per share data) |
|
|||||||||||||
|
Net sales |
|
$ |
234,528 |
|
|
$ |
241,409 |
|
|
$ |
279,015 |
|
|
$ |
266,283 |
|
|
Gross profit |
|
$ |
70,965 |
|
|
$ |
76,257 |
|
|
$ |
89,889 |
|
|
$ |
87,347 |
|
|
Net (loss) income |
|
$ |
(1,119 |
) |
|
$ |
2,124 |
|
|
$ |
8,187 |
|
|
$ |
7,694 |
|
|
Basic earnings per share |
|
$ |
(0.05 |
) |
|
$ |
0.10 |
|
|
$ |
0.38 |
|
|
$ |
0.36 |
|
|
Diluted earnings per share |
|
$ |
(0.05 |
) |
|
$ |
0.10 |
|
|
$ |
0.38 |
|
|
$ |
0.35 |
|
|
(1) |
The Company recorded a charge of $5.5 million in the fourth quarter of fiscal 2017 to revalue existing net deferred tax assets resulting from the enactment of the Tax Cuts and Jobs Act in December 2017. This charge reduced net income by the same amount, or $0.26 per share. Additionally, in the fourth quarter of fiscal 2017, the Company recorded a charge of $0.6 million, net of the federal income tax benefit, to establish a valuation allowance related to unused California Enterprise Zone Tax Credits, which reduced net income in fiscal 2017 by the same amount, or $0.03 per share. |
|
(2) |
The Company recorded a pre-tax non-cash impairment charge of $0.6 million in the fourth quarter of fiscal 2017 related to certain underperforming stores. This charge reduced net income in the fourth quarter of fiscal 2017 by $0.4 million, or $0.02 per share. |
|
(3) |
The Company recorded a non-cash goodwill impairment charge of $4.4 million in the fourth quarter of fiscal 2017, which reduced net income in the fourth quarter of fiscal 2017 by the same amount, or $0.21 per share. |
|
(4) |
The Company excluded all potential share option awards, nonvested share awards and nonvested share unit awards from the computation of diluted earnings per share for the first quarter of fiscal 2016 and the fourth quarter of fiscal 2017, since the Company reported a net loss in each respective period and the effect of their inclusion would have been antidilutive. |
|
(5) |
The Company recorded write-offs (benefits) of $0.7 million, $0.2 million and $(0.4) million in the first quarter, second quarter and fourth quarter of fiscal 2016, respectively, related to share-based compensation. These amounts reduced (increased) net income by the same respective amounts, or $0.03, $0.01 and $(0.02) per diluted share, respectively. |
|
(6) |
The Company recorded pre-tax charges of $0.1 million and $1.1 million in the second quarter and third quarter of fiscal 2016, respectively, related to store closing costs. These charges were included in selling and administrative expense and reduced net income in the second quarter and third quarter of fiscal 2016 by $60,000, or $0.00 per diluted share, and $0.7 million, or $0.03 per diluted share, respectively. |
F-27
BIG 5 SPORTING GOODS CORPORATION
NOTES TO CONSOLIDATED FINANCIAL STATEMENTS
(continued)
|
(18) |
Subsequent Event |
In the first quarter of fiscal 2018, the Company’s Board of Directors declared a quarterly cash dividend of $0.15 per share of outstanding common stock, which will be paid on March 23, 2018 to stockholders of record as of March 9, 2018.
F-28
BIG 5 SPORTING GOODS CORPORATION
SCHEDULE II — VALUATION AND QUALIFYING ACCOUNTS
(In thousands)
|
|
|
Balance at Beginning of Period |
|
|
Charged to Costs and Expenses |
|
|
|
Deductions |
|
|
Balance at End of Period |
|
||||
|
December 31, 2017 |
|
|
|
|
|
|
|
|
|
|
|
|
|
|
|
|
|
|
Allowance for doubtful receivables |
|
$ |
42 |
|
|
$ |
60 |
|
|
|
$ |
(23 |
) |
|
$ |
79 |
|
|
Allowance for sales returns |
|
$ |
1,334 |
|
|
$ |
(278 |
) |
(1) |
|
$ |
— |
|
|
$ |
1,056 |
|
|
Inventory reserves |
|
$ |
5,680 |
|
|
$ |
4,819 |
|
|
|
$ |
(4,649 |
) |
|
$ |
5,850 |
|
|
|
|
|
|
|
|
|
|
|
|
|
|
|
|
|
|
|
|
|
January 1, 2017 |
|
|
|
|
|
|
|
|
|
|
|
|
|
|
|
|
|
|
Allowance for doubtful receivables |
|
$ |
61 |
|
|
$ |
28 |
|
|
|
$ |
(47 |
) |
|
$ |
42 |
|
|
Allowance for sales returns |
|
$ |
1,325 |
|
|
$ |
9 |
|
(1) |
|
$ |
— |
|
|
$ |
1,334 |
|
|
Inventory reserves |
|
$ |
6,254 |
|
|
$ |
4,553 |
|
|
|
$ |
(5,127 |
) |
|
$ |
5,680 |
|
|
|
|
|
|
|
|
|
|
|
|
|
|
|
|
|
|
|
|
|
January 3, 2016 |
|
|
|
|
|
|
|
|
|
|
|
|
|
|
|
|
|
|
Allowance for doubtful receivables |
|
$ |
110 |
|
|
$ |
50 |
|
|
|
$ |
(99 |
) |
|
$ |
61 |
|
|
Allowance for sales returns |
|
$ |
1,320 |
|
|
$ |
5 |
|
(1) |
|
$ |
— |
|
|
$ |
1,325 |
|
|
Inventory reserves |
|
$ |
5,349 |
|
|
$ |
6,556 |
|
|
|
$ |
(5,651 |
) |
|
$ |
6,254 |
|
|
(1) |
Represents an increase (decrease) in the required reserve based upon the Company’s evaluation of anticipated merchandise returns. |
II