Attached files
| file | filename |
|---|---|
| EX-32.2 - EXHIBIT 32.2 - BASIC ENERGY SERVICES, INC. | bas-20171231xex322.htm |
| EX-32.1 - EXHIBIT 32.1 - BASIC ENERGY SERVICES, INC. | bas-20171231xex321.htm |
| EX-31.2 - EXHIBIT 31.2 - BASIC ENERGY SERVICES, INC. | bas-20171231xex312.htm |
| EX-31.1 - EXHIBIT 31.1 - BASIC ENERGY SERVICES, INC. | bas-20171231xex311.htm |
| EX-23.1 - EXHIBIT 23.1 - BASIC ENERGY SERVICES, INC. | bas-20171231xex231.htm |
| EX-21.1 - EXHIBIT 21.1 - BASIC ENERGY SERVICES, INC. | bas-20171231xex211.htm |
| EX-12.1 - EXHIBIT 12.1 - BASIC ENERGY SERVICES, INC. | bas-20171231xex121.htm |
UNITED STATES SECURITIES AND EXCHANGE COMMISSION
Washington, D.C. 20549
Form 10-K
☑ANNUAL REPORT PURSUANT TO SECTION 13 OR 15(d)
OF THE SECURITIES EXCHANGE ACT OF 1934
For the fiscal year ended December 31, 2017
OR
☐TRANSITION REPORT PURSUANT TO SECTION 13 OR 15(d)
OF THE SECURITIES EXCHANGE ACT OF 1934
For the transition period from to
Commission file number 001-32693
Basic Energy Services, Inc.
(Exact name of registrant as specified in its charter)
Delaware | 54-2091194 |
(State or other jurisdiction of incorporation or organization) | (I.R.S. Employer Identification No.) |
801 Cherry Street, Suite 2100 | |
Fort Worth, Texas | 76102 |
(Address of principal executive offices) | (Zip code) |
Registrant’s telephone number, including area code:
(817) 334-4100
Securities registered pursuant to Section 12(b) of the Act:
Title of Class | Name of each exchange on which registered |
Common Stock, $0.01 par value per share | New York Stock Exchange |
Securities registered pursuant to Section 12(g) of the Act: Warrants, exercisable for one share of Common Stock, $0.01 par value per share
________________________________________________________________________________________________________________________
Indicate by check mark if the registrant is a well-known seasoned issuer, as defined in Rule 405 of the Securities Act. Yes ☐ No þ
Indicate by check mark if the registrant is not required to file reports pursuant to Section 13 or Section 15(d) of the Act. Yes ☐ No þ
Indicate by check mark whether the registrant (1) has filed all reports required to be filed by Section 13 or 15(d) of the Securities Exchange Act of 1934 during the preceding 12 months (or for such shorter period that the registrant was required to file such reports), and (2) has been subject to such filing requirements for the past 90 days. Yes þ No ☐
Indicate by check mark whether the registrant has submitted electronically and posted on its corporate Website, if any, every Interactive Data File required to be submitted and posted pursuant to Rule 405 of Regulation S-T during the preceding 12 months (or for such shorter period that the registrant was required to submit and post such files). Yes þ No ☐
Indicate by check mark if disclosure of delinquent filers pursuant to Item 405 of Regulation S-K is not contained herein, and will not be contained, to the best of registrant’s knowledge, in definitive proxy or information statements incorporated by reference in Part III of this Form 10-K or any amendment to this Form 10-K. þ
Indicate by check mark whether the registrant is a large accelerated filer, an accelerated filer, a non-accelerated filer, a smaller reporting company or an emerging growth company. See the definitions of “large accelerated filer,” “accelerated filer”, “smaller reporting company” and "emerging growth company" in Rule 12b-2 of the Exchange Act. (Check one):
Large Accelerated Filer ☐ | Accelerated Filer þ | |
Non-Accelerated filer ☐ (Do not check if a smaller reporting company) | Smaller reporting company ☐ | |
Emerging growth company ☐ | ||
If an emerging growth company, indicate by check mark if the registrant has elected not to use the extended transition period for complying with any new or revised financial accounting standards provided pursuant to Section 13(a) of the Exchange Act ☐
Indicate by check mark whether the registrant is a shell company (as defined in Rule 12b-2 of the Exchange Act). Yes ☐ No þ
The aggregate market value of the registrant’s common stock held by non-affiliates of the registrant was approximately $429,434,887 as of June 30, 2017, the last business day of the registrant’s most recently completed second fiscal quarter (based on a closing price of $24.90 per share and 17,246,381 shares held by non-affiliates).
Indicate by check mark whether the registrant has filed all documents and reports required to be filed by Section 12, 13 or 15(d) of the Securities Exchange Act of 1934 subsequent to the distribution of securities under a plan confirmed by a court. Yes þ No ¨☐
There were 26,416,209 shares of the registrant’s common stock outstanding as of February 28, 2018.
DOCUMENTS INCORPORATED BY REFERENCE
Portions of the proxy statement for the registrant’s Annual Meeting of Stockholders (to be filed within 120 days of the close of the registrant’s fiscal year) are incorporated by reference into Part III.
1
BASIC ENERGY SERVICES, INC.
Index to Form 10-K
2
CAUTIONARY STATEMENT
REGARDING FORWARD-LOOKING STATEMENTS
This annual report contains certain statements that are, or may be deemed to be, “forward-looking statements” within the meaning of Section 27A of the Securities Act of 1933, as amended, and Section 21E of the Securities Exchange Act of 1934, as amended, or the Exchange Act. We have based these forward-looking statements largely on our current expectations and projections about future events and financial trends affecting the financial condition of our business. These forward-looking statements are subject to a number of risks, uncertainties and assumptions, including, among other things, the risk factors discussed in Item 1A of this annual report and other factors, most of which are beyond our control.
The words “believe,” “estimate,” “expect,” “anticipate,” “project,” “intend,” “plan,” “seek,” “could,” “should,” “may,” “potential” and similar expressions are intended to identify forward-looking statements. All statements other than statements of current or historical fact contained in this annual report are forward-looking statements. Although we believe that the forward-looking statements contained in this annual report are based upon reasonable assumptions, the forward-looking events and circumstances discussed in this annual report may not occur and actual results could differ materially from those anticipated or implied in the forward-looking statements.
Important factors that may affect our expectations, estimates or projections include:
• | a decline in, or substantial volatility of, oil and natural gas prices, and any related changes in expenditures by our customers; |
•competition within our industry;
•the effects of future acquisitions on our business;
•our access to current or future financing arrangements;
•changes in customer requirements in markets or industries we serve;
•general economic and market conditions;
•our ability to replace or add workers at economic rates; and
•environmental and other governmental regulations.
Our forward-looking statements speak only as of the date of this annual report. Unless otherwise required by law, we undertake no obligation to publicly update or revise any forward-looking statements, whether as a result of new information, future events or otherwise.
This annual report includes market share data, industry data and forecasts that we obtained from internal company surveys (including estimates based on our knowledge and experience in the industry in which we operate), market research, consultant surveys, publicly available information, industry publications and surveys. These sources include Baker Hughes Incorporated, the Association of Energy Service Companies (“AESC”), and the Energy Information Administration of the U.S. Department of Energy (“EIA”). Industry surveys and publications, consultant surveys and forecasts generally state that the information contained therein has been obtained from sources believed to be reliable. Although we believe such information is accurate and reliable, we have not independently verified any of the data from third-party sources cited or used for our management’s industry estimates, nor have we ascertained the underlying economic assumptions relied upon therein. Statements as to our position relative to our competitors or as to market share refer to the most recent available data.
3
PART I
ITEMS 1. AND 2. BUSINESS AND PROPERTIES
General
We provide a wide range of well site services in the United States to oil and natural gas drilling and producing companies, including completion and remedial services, water logistics, well servicing and contract drilling. These services are fundamental to establishing and maintaining the flow of oil and natural gas throughout the productive life of a well. Our broad range of services enables us to meet multiple needs of our customers at the well site. We were organized in 1992 as Sierra Well Service, Inc., a Delaware corporation, and in 2000 we changed our name to Basic Energy Services, Inc. References to “Basic,” the “Company,” “we,” “us” or “our” in this report refer to Basic Energy Services, Inc., and, unless the context otherwise suggests, its wholly owned subsidiaries and its controlled subsidiaries.
Our operations are managed regionally and are concentrated in major United States onshore oil and natural gas producing regions located in Texas, New Mexico, Oklahoma, Arkansas, Kansas, Louisiana, Wyoming, North Dakota, California and the Rocky Mountain and Appalachian regions. Our operations are focused on liquids-rich basins that have historically exhibited strong drilling and production economics in recent years as well as natural gas-focused shale plays characterized by prolific reserves. Specifically, we have a significant presence in the Permian Basin and the Bakken, Eagle Ford, Haynesville, Denver-Julesburg and Marcellus shales. We provide our services to a diverse group of over 2,000 oil and gas companies.
Our current operating segments are Completion and Remedial Services, Well Servicing, Water Logistics, and Contract Drilling. These segments were selected based on management’s resource allocation and performance assessment in making decisions regarding the Company. The following is a description of our business segments:
• | Completion and Remedial Services. Our completion and remedial services segment (50% of our revenues in 2017) operates our fleet of pumping units, an array of specialized rental equipment and fishing tools, coiled tubing units, snubbing units, thru-tubing, air compressor packages specially configured for underbalanced drilling operations and nitrogen units. The largest portion of this business segment consists of pumping services focused on cementing, acidizing and fracturing services in niche markets. |
• | Well Servicing. Our well servicing segment (24% of our revenues in 2017) operates our fleet of 310 active well servicing rigs and related equipment. This business segment encompasses a full range of services performed with a mobile well servicing rig, including the installation and removal of downhole equipment and the completion of the well bore to initiate production of oil and natural gas. These services are performed to establish, maintain and improve production throughout the productive life of an oil and natural gas well and to plug and abandon a well at the end of its productive life. Our well servicing equipment and capabilities also facilitate most other services performed on a well. |
• | Water Logistics. Our water logistics segment (24% of our revenues in 2017) utilizes our fleet of 975 fluid service trucks and related assets, including specialized tank trucks, storage tanks, pipelines, water wells, disposal facilities, water treatment and construction and other related equipment. These assets provide, transport, store and dispose of a variety of fluids, as well as provide well site construction and maintenance services. These services are required in most workover, completion and remedial projects and are routinely used in daily producing well operations. |
• | Contract Drilling. Our contract drilling segment (2% of our revenues in 2017) operates our fleet of 11 drilling rigs and related equipment. We use these assets to penetrate the earth to a desired depth and initiate production from a well. |
Our Competitive Strengths
We believe that the following competitive strengths currently position us well within our industry:
Extensive Domestic Footprint in the Most Prolific Basins. Our operations are focused on liquids-rich basins located in the United States that have exhibited strong drilling and production economics in recent years as well as natural gas-focused shale plays characterized by prolific reserves. Specifically, we have a significant presence in the Permian Basin and the Bakken, Eagle Ford, Haynesville, Denver-Julesburg and Marcellus shales. We operate in states that accounted for approximately 99% of U.S. onshore oil and natural gas production. We believe our operations are located in the most active U.S. well services markets, as we currently focus our operations on onshore domestic oil and natural gas production areas that include both the highest concentration of existing oil and natural gas production activities and the largest prospective acreage
4
for new drilling activity. We believe our extensive footprint allows us to offer our suite of services to more than 2,000 customers who are active in those areas and allows us to redeploy equipment between markets as activity shifts, reducing the risk that a basin-specific slowdown will have a disproportionate impact on our cash flows and operational results.
Diversified Service Offering for Further Revenue Growth and Reduced Volatility. We believe our range of well site services provides us a competitive advantage over smaller companies that typically offer fewer services. Our experience, equipment and network of 138 area offices position us to market our full range of well site services to our existing customers. By utilizing a wider range of our services, our customers can use fewer service providers, which enables them to reduce their administrative costs and simplify their logistics. Furthermore, offering a broader range of services allows us to capitalize on our existing customer base and management structure to grow within existing markets, generate more business from existing customers, and increase our operating profits as we spread our overhead costs over a larger revenue base.
Significant Market Position. We maintain a leading market share for each of our lines of business within our core operating areas: the Permian Basin of West Texas and Southeast New Mexico; the Gulf Coast region of South Texas and Louisiana; the Central region of North Texas, Oklahoma, Arkansas, Louisiana and Kansas; California; and the Rocky Mountain and Appalachian regions. Our goal is to be one of the top two providers of the services we provide in each of our core operating areas. Our position in each of these markets allows us to expand the range of services performed on a well throughout its life, such as drilling, maintenance, workover, stimulation, completion and plugging and abandonment services.
Modern and Competitive Fleet. We operate a modern fleet matched to the needs of the local markets in each of our business segments. We are driven by a desire to maintain one of the most efficient, reliable and safest fleets of equipment in the country, and we have an established program to routinely monitor and evaluate the condition of our equipment. We selectively refurbish equipment to maintain the quality of our service and to provide a safe working environment for our personnel. We believe that by maintaining a modern and active asset base, we are better able to earn our customers’ business while reducing the risk of potential downtime.
Decentralized Experienced Management with Strong Corporate Infrastructure. Our corporate group is responsible for maintaining a unified infrastructure to support our diversified operations through standardized financial and accounting, safety, environmental and maintenance processes and controls. Below our corporate level, we operate a decentralized operational organization in which our nine regional or division managers are responsible for their operations, including asset management, cost control, policy compliance and training and other aspects of quality control. With the majority having over 30 years of industry experience, each regional manager has extensive knowledge of the customer base, job requirements and working conditions in each local market. Below our nine regional or division managers, our area managers are directly responsible for customer relationships, personnel management, accident prevention and equipment maintenance, the key drivers of our operating profitability. This management structure allows us to monitor operating performance on a daily basis, maintain financial, accounting and asset management controls, integrate acquisitions, prepare timely financial reports and manage contractual risk.
Our Business Strategy
The key components of our business strategy include:
Establishing and Maintaining Leadership Positions in Core Operating Areas. We strive to establish and maintain market leadership positions within our core operating areas. To achieve this goal, we maintain close customer relationships, seek to expand the breadth of our services and offer high quality services and equipment that meet the scope of customer specifications and requirements. In addition, our leading presence in our core operating areas facilitates employee retention and attraction, a key factor for success in our business and provides us with brand recognition that we intend to utilize in creating leading positions in new operating areas.
Selectively Expanding Within Our Regional Markets. We intend to continue strengthening our presence within our existing geographic footprint through internal growth and acquisitions of businesses with strong customer relationships, well-maintained equipment and experienced and skilled personnel. We typically enter into new markets through the acquisition of businesses with strong management teams that will allow us to expand within these markets. Management of acquired companies often remain with us and retain key positions within our organization, which enhances our attractiveness as an acquisition partner. We have a record of successfully implementing this strategy. By concentrating on targeted expansion in areas in which we already have a meaningful presence, we believe we maximize the returns on expansion capital while reducing downside risk.
Developing Additional Service Offerings Within the Well Servicing Market. We intend to continue broadening the portfolio of services we provide to our clients by utilizing our well servicing infrastructure. A customer typically begins a new completion, maintenance or workover project by securing access to a well servicing rig, which stays on site for the duration of the project. As a result, our rigs are often the first equipment to arrive at the well site and typically the last to leave, providing
5
us the opportunity to offer our customers other complementary services. We believe the fragmented nature of the well servicing market creates an opportunity to sell more services to our core customers and to expand our total service offering within each of our markets. We have expanded our suite of services available to our customers and increased our opportunities to cross-sell new services to our core well servicing customers through acquisitions and internal growth. We expect to continue to develop or selectively acquire capabilities to provide additional services to expand and further strengthen our customer relationships.
Pursuing Growth Through Selective Capital Deployment. We intend to continue growing our business through selective acquisitions, continuing a new build program and/or upgrading our existing assets. Our capital investment decisions are determined by an analysis of the projected return on capital employed of each of those alternatives. Acquisitions are evaluated for “fit” with our area and regional operations management and are reviewed by corporate level financial, equipment, safety and environmental specialists to ensure consideration is given to identified risks. We also evaluate the cost to acquire existing assets from a third party, the capital required to build new equipment and the point in the oil and natural gas commodity price cycle. Based on these factors, we make capital investment decisions that we believe will support our long-term growth strategy and these decisions may involve a combination of asset acquisitions and the purchase of new equipment.
General Industry Overview
Our business is influenced substantially by expenditures by oil and gas companies. Exploration and production spending is categorized as either an operating expenditure or a capital expenditure. Activities designed to add hydrocarbon reserves are classified as capital expenditures, while those associated with maintaining or accelerating production are categorized as operating expenditures.
Because existing oil and natural gas wells require ongoing spending to maintain production, expenditures by oil and gas companies for the maintenance of existing wells historically have been relatively stable and predictable. In contrast, capital expenditures by oil and gas companies for exploration and drilling are more directly influenced by current and expected oil and natural gas prices and generally reflect the volatility of commodity prices. We believe our focus on production and workover activity partially insulates our financial results from the volatility of the active drilling rig count. However, significantly lower commodity prices have impacted production and workover activities due to both customer cash liquidity limitations and well economics for these service activities.
Capital expenditures by oil and gas companies tend to be relatively sensitive to volatility in oil or natural gas prices because project decisions are tied to a return on investment spanning a number of years. As such, capital expenditure economics often require the use of commodity price forecasts which may prove inaccurate in the amount of time required to plan and execute a capital expenditure project (such as the drilling of a deep well). When commodity prices are depressed for even a short period of time, capital expenditure projects are routinely deferred until prices return to an acceptable level.
In contrast, both mandatory and discretionary operating expenditures are substantially more stable than exploration and drilling expenditures. Mandatory operating expenditure projects involve activities that cannot be avoided in the short term, such as regulatory compliance, safety, contractual obligations and projects to maintain the well and related infrastructure in operating condition (for example, repairs to a central tank battery, downhole pump, saltwater disposal system or gathering system). Discretionary operating expenditure projects may not be critical to the short-term viability of a lease or field, but these projects are relatively insensitive to commodity price volatility. Discretionary operating expenditure work is evaluated according to a simple short-term payout criterion that is far less dependent on commodity price forecasts.
Demand for services offered by our industry is a function of our customers’ willingness to make operating and capital expenditures to explore for, develop and produce hydrocarbons in the United States. Our customers’ expenditures are affected by both current and expected levels of oil and natural gas prices. Natural gas prices have remained at lower levels since 2009, which has resulted in low levels of activity in our natural gas-driven markets. Oil prices remained relatively stable from 2012 until the fourth quarter of 2014, when oil prices declined due to oversupply concerns worldwide and continued to decline to low levels throughout 2015 and 2016. Upon decisions by Saudi Arabia and OPEC to limit production, oil prices increased gradually in the fourth quarter of 2016, and continued to increase gradually throughout 2017.
The table below sets forth average closing prices for the Cushing WTI Spot Oil Price and the Henry Hub Natural Gas Spot Price and the corresponding rig count for oil and natural gas drilling rigs since 2013:
6
Cushing WTI Spot | Henry Hub Gas | Average Rig Count | ||||||||||||
Period | Oil Price ($/Bbl.) | Spot Price ($/Mcf.) | Oil | Natural Gas | ||||||||||
1/1/2013 | $ | 97.91 | $ | 3.73 | 1,373 | 383 | ||||||||
1/1/2014 | 93.26 | 4.39 | 1,527 | 333 | ||||||||||
1/1/2015 | 48.69 | 2.63 | 754 | 228 | ||||||||||
1/1/2016 | 43.14 | 2.52 | 408 | 100 | ||||||||||
1/1/2017 | 50.88 | 2.99 | 703 | 172 | ||||||||||
12/31/2017 | 60.46 | 3.69 | 747 | 182 | ||||||||||
Source: U.S. Department of Energy. Data for each of the foregoing rig counts are based on information from the Baker Hughes rig count.
Overview of Our Segments and Services
Completion and Remedial Services Segment
Our completion and remedial services segment provides oil and natural gas operators with a package of services that include the following:
•pumping services, such as cementing, acidizing, fracturing, nitrogen and pressure testing;
•rental and fishing tools;
•coiled tubing;
•snubbing services;
•thru-tubing; and
•underbalanced drilling in low pressure and fluid sensitive reservoirs.
This segment operates 310 pumping units, with approximately 523,000 horsepower of capacity, to conduct a variety of services designed to stimulate oil and natural gas production or to enable cement slurry to be placed in or circulated within a well. We also operate 36 air compressor packages, including foam circulation units, for underbalanced drilling, 36 snubbing units and 18 coiled tubing units for cased-hole measurement and pipe recovery services.
Because a well servicing rig is required to perform various operations over the life cycle of a well, there is a similar need for equipment capable of pumping fluids into the well under varying degrees of pressure. During the drilling and completion phase, the well bore is lined with large diameter steel pipe called casing. Casing is cemented into place by circulating slurry into the annulus created between the pipe and the rock wall of the well bore. The cement slurry is forced into the well by pumping equipment located on the surface. Cementing services are also utilized over the life of a well to repair leaks in the casing to close perforations that are no longer productive and ultimately to “plug” the well at the end of its productive life.
A hydrocarbon reservoir is essentially an interval of rock that is saturated with oil and/or natural gas. Three primary factors determine the productivity of a well that intersects a hydrocarbon reservoir: porosity (the percentage of the reservoir volume represented by pore space in which the hydrocarbons reside), permeability (the natural propensity for the flow of hydrocarbons toward the well bore), and “skin” (the degree to which the portion of the reservoir in close proximity to the well bore has experienced reduced permeability as a result of exposure to drilling fluids or other contaminants). Well productivity can be increased by artificially improving either permeability or "skin" through stimulation methods described below.
Permeability can be increased through the use of fracturing methods by which a reservoir is subjected to high pressure fluids pumped into it. This pressure creates stress in the reservoir and causes the rock to fracture, thereby creating additional channels through which hydrocarbons can flow. In most cases, sand or another form of proppant is pumped with the fluid as a means of holding open the newly created fractures.
The most common means of reducing near-well bore damage, or skin, is the injection of a highly reactive solvent (such as hydrochloric acid) solution into the area where the hydrocarbons enter the well. This solution has the effect of dissolving contaminants that have accumulated and are restricting the flow of hydrocarbons. This process is generically known as acidizing.
After a well is drilled and completed, the casing may develop leaks as a result of abrasions from production tubing, exposure to corrosive elements or inadequate support from the original attempt to cement the casing in place. When a leak develops, it is necessary to place specialized equipment into the well and to pump cement in such a way as to seal the leak, a process known as “squeeze” cementing.
7
The following table sets forth the type, number and location of the completion and remedial services equipment that we operated at December 31, 2017:
Market Area | |||||||||||||||||||||
Mid- | Rocky | Permian | |||||||||||||||||||
Ark-La-Tex | Continent | Gulf Coast | Mountain | Basin | Appalachia | Total | |||||||||||||||
Pumping Units | 22 | 150 | 5 | 59 | 74 | — | 310 | ||||||||||||||
Air/Foam Packages | — | 19 | — | 7 | 10 | — | 36 | ||||||||||||||
Snubbing Units | 6 | 19 | — | — | — | 11 | 36 | ||||||||||||||
Rental and Fishing Tool Stores | — | 6 | 1 | 1 | 8 | — | 16 | ||||||||||||||
Coiled Tubing Units | — | 2 | — | 13 | 3 | — | 18 | ||||||||||||||
Our pumping services business focuses primarily on lower horsepower cementing, acidizing and fracturing services markets. Currently, there are several pumping companies that provide their services on a national basis. For the most part, these companies have concentrated their assets in markets characterized by complex work with higher horsepower requirements. This has created an opportunity in the markets for pumping services in mature areas with less complex characteristics and lower horsepower requirements. We, along with a number of smaller, regional companies, have concentrated our efforts on these markets. This philosophy allows for better operating efficiency and longer lives for our equipment.
The level of activity of our pumping services business is tied to drilling and workover activity. The bulk of pumping work is associated with cementing casing in place as the well is drilled or pumping fluid that stimulates production from the well during the completion phase. Pumping service work is awarded based on a combination of price and expertise.
Our rental and fishing tool business provides a range of specialized services and equipment that is utilized on a non-routine basis for both drilling and well servicing operations. Drilling and well servicing rigs are equipped with an array of tools to complete routine operations under normal conditions for most projects in the geographic area in which they are employed. When downhole problems develop with drilling or servicing operations or conditions require non-routine equipment, our customers will usually rely on a provider of rental and fishing tools to augment equipment that is provided with a typical drilling or well servicing rig package.
The term “fishing” applies to a wide variety of downhole operations designed to correct a problem that has developed during the drilling or servicing of a well. The problem most commonly involves equipment that has become lodged in the well and cannot be removed without special equipment. Our technicians utilize tools that are specifically suited to retrieve, or “fish,” and remove the trapped equipment, allowing our customers to resume operations.
Coiled tubing services involve the use of a continuous metal pipe spooled on a large reel for oil and natural gas well interventions, including wellbore maintenance, nitrogen services, thru-tubing services, and formation stimulation using acid and other chemicals.
Our snubbing service business utilizes specialized equipment to run or remove pipe and other associated downhole tools into a wellbore. This process is accomplished with a wellbore having surface pressure or with the anticipation of surface pressure. Our snubbing services are utilized for both routine and non-routine workover, completion and remedial activities.
For further discussion of financial results for the Completion and Remedial Services segment, see Note 15, Business Segment Information of the notes to our consolidated financial statements included in this Annual Report on Form 10-K.
Well Servicing Segment
Our well servicing segment encompasses a full range of services performed with a mobile well servicing rig, also commonly referred to as a workover rig, and ancillary equipment. Our rigs and personnel provide the means for hoisting equipment and tools into and out of the well bore, and our well servicing equipment and capabilities also facilitate most other services performed on a well. Our well servicing segment services, which are performed to maintain and improve production throughout the productive life of an oil and natural gas well, include:
• | maintenance work involving removal, repair and replacement of down-hole equipment and returning the well to production after these operations are completed; |
• | hoisting tools and equipment required by the operation into and out of the well, or removing equipment from the well bore, to facilitate specialized production enhancement and well repair operations performed by other oilfield service companies; and |
8
•plugging and abandonment services when a well has reached the end of its productive life.
Our well servicing segment also includes the manufacturing and sale of new workover rigs through our wholly-owned subsidiary, Taylor Industries, LLC, which we formed in connection with an acquisition of a rig manufacturing business in 2010.
Regardless of the type of work being performed on the well, our personnel and rigs are often the first to arrive at the well site and the last to leave. We typically charge our customers an hourly rate for these services, which rate varies based on a number of considerations including market conditions in each region, the type of rig and ancillary equipment required, and the necessary personnel.
Our actively marketed fleet included 310 well servicing rigs as of December 31, 2017, including 233 new builds since October 2004 and 90 rebuilds since the beginning of 2010. Our well servicing equipment operates from facilities in Texas, Wyoming, Oklahoma, North Dakota, New Mexico, Louisiana, Colorado, California, Arkansas, Utah, Montana, Kansas, Kentucky, Pennsylvania and West Virginia. Our well servicing rigs are mobile units that normally operate within a radius of approximately 75 to 100 miles from their respective bases.
The following table sets forth the location, characteristics and number of the well servicing rigs that we operated at December 31, 2017. We categorize our rig fleet by the rated capacity of the mast, which indicates the maximum weight that the rig is capable of lifting. The maximum weight our rigs are capable of lifting is the limiting factor in our ability to provide these services.
Market Area | |||||||||||||||||||||||||||
Rated | Permian | Gulf | Mid - | Rocky | |||||||||||||||||||||||
Rig Type | Capacity | Basin | Coast | Ark-La-Tex | Continent | Mountain | California | Appalachia | Inactive | Total | |||||||||||||||||
Swab | N/A | — | — | 1 | 2 | 1 | — | — | — | 4 | |||||||||||||||||
Light Duty | < 90 tons | — | — | — | — | — | 2 | — | — | 2 | |||||||||||||||||
Medium Duty | > 90 <125 tons | 63 | 14 | 13 | 30 | 32 | 13 | 2 | 22 | 189 | |||||||||||||||||
Heavy Duty | > 125 tons | 72 | 19 | 2 | 5 | 12 | — | 3 | 2 | 115 | |||||||||||||||||
Total | 135 | 33 | 16 | 37 | 45 | 15 | 5 | 24 | 310 | ||||||||||||||||||
We operate a total of 310 well servicing rigs, one of the largest fleets in the United States. Based on the most recent publicly available information, five of our competitors operate more than 100 well servicing rigs: Key Energy Services, Inc., C&J Energy Services, Ltd., Superior Energy Services, Inc., Ranger Energy Services Inc., and Pioneer Energy Services Corp.
Maintenance. Regular maintenance is required throughout the life of a well to sustain optimal levels of oil and natural gas production. Regular maintenance currently comprises the largest portion of our work in this segment, and because ongoing maintenance spending is required to sustain production, we generally experience relatively stable demand for these services. We provide well service rigs, equipment and crews to our customers for these maintenance services. Maintenance services are often performed on a series of wells in proximity to each other and consist of routine mechanical repairs necessary to maintain production, such as repairing inoperable pumping equipment in an oil well or replacing defective tubing in a natural gas well, and removing debris such as sand and paraffin, from the well. Other services include pulling the rods, tubing, pumps and other downhole equipment out of the well bore to identify and repair a production problem. These downhole equipment failures are typically caused by the repetitive pumping action of an oil well. Corrosion, water cut, grade of oil, sand production and other factors can also result in frequent failures of downhole equipment.
The need for maintenance activity does not directly depend on the level of drilling activity, although it is somewhat impacted by short-term fluctuations in oil and natural gas prices. Demand for our maintenance services is driven primarily by the production requirements of local oil or natural gas fields and is therefore affected by changes in the total number of producing oil and natural gas wells in our geographic service areas.
Our regular well maintenance services involve relatively low-cost, short-duration jobs which are part of normal well operating costs. Well operators cannot delay all maintenance work without a significant impact on production. Operators may, however, choose to shut in producing wells temporarily when oil or natural gas prices are too low to justify additional expenditures, including maintenance.
New Well Completion. New well completion services involve the preparation of newly drilled wells for production. The completion process may involve selectively perforating the well casing in the productive zones to allow oil or natural gas to flow into the well bore, stimulating and testing these zones and installing the production string and other downhole
9
equipment. We provide well service rigs to assist in this completion process. Newly drilled wells are frequently completed by well servicing rigs to minimize the use of higher cost drilling rigs in the completion process. The completion process typically requires a few days to several weeks, depending on the nature and type of the completion, and require additional auxiliary equipment. Accordingly, completion services require less well-to-well mobilization of equipment and normally provide higher operating margins than regular maintenance work.
The demand for completion services is directly related to drilling activity levels, which are sensitive to expectations relating to and changes in oil and natural gas prices.
Workover. In addition to periodic maintenance, producing oil and natural gas wells occasionally require major repairs or modifications called workovers, which are typically more complex and more time consuming than maintenance operations. Workover services include extensions of existing wells to drain new formations either through perforating the well casing to expose additional productive zones not previously produced, deepening well bores to new zones or the drilling of lateral well bores to improve reservoir drainage patterns. Our workover rigs are also used to convert former producing wells to injection wells through which water or carbon dioxide is then pumped into the formation for enhanced oil recovery operations. Workovers also include major subsurface repairs such as repair or replacement of well casing, recovery or replacement of tubing and removal of foreign objects from the well bore. These extensive workover operations are normally performed by a workover rig with additional specialized auxiliary equipment, which may include rotary drilling equipment, mud pumps, mud tanks and fishing tools, depending upon the particular type of workover operation. Most of our well servicing rigs are designed to perform complex workover operations. A workover may require a few days to several weeks and additional auxiliary equipment. The demand for workover services is sensitive to oil and natural gas producers’ intermediate and long-term expectations for oil and natural gas prices. As oil and natural gas prices increase, the level of workover activity tends to increase as oil and natural gas producers seek to increase output by enhancing the efficiency of their wells.
Plugging and Abandonment. Well servicing rigs are also used in the process of permanently closing oil and natural gas wells no longer capable of producing in economic quantities. Plugging and abandonment work can be performed with a well servicing rig along with wireline and cementing equipment; however, this service is typically provided by companies that specialize in plugging and abandonment work. Many well operators bid this work on a “turnkey” basis, requiring the service company to perform the entire job, including the sale or disposal of equipment salvaged from the well as part of the compensation received, and comply with state regulatory requirements. Plugging and abandonment work can provide favorable operating margins and is less sensitive to oil and natural gas prices than drilling and workover activity since well operators must plug a well in accordance with state regulations when it is no longer productive. We perform plugging and abandonment work throughout our core areas of operation in conjunction with equipment provided by other service companies.
For further discussion of financial results for the Well Servicing segment, see Note 15, Business Segment Information of the notes to our consolidated financial statements included in this Annual Report on Form 10-K.
Water Logistics Segment
Our water logistics segment provides oilfield fluid supply, transportation, storage and construction services. These services are required in most workover, completion and remedial projects and are routinely used in daily producing well operations. These services include:
• | the transportation of fluids used in drilling, completion, workover, and flowback operations and of salt water produced as a by-product of oil and natural gas production either by truck or pipeline; |
• | the sale and transportation of fresh and brine water used in drilling and workover activities; |
• | the rental of portable fracturing tanks and test tanks used to store fluids on well sites; |
• | the recycling and treatment of wastewater, including produced water and flowback, to be reused in the completion and production process; |
• | the operation of company-owned fresh water and brine source wells and of non-hazardous wastewater disposal wells; and |
• | the preparation, construction and maintenance of access roads, drilling locations, and production facilities. |
This segment utilizes our fleet of fluid service trucks and related assets, including specialized tank trucks, portable storage tanks, water wells, disposal facilities and related equipment. The following table sets forth the type, number and location of the water logistics equipment that we operated at December 31, 2017:
10
Market Area | ||||||||||||||||||
Rocky | Permian | |||||||||||||||||
Mountain | Ark-La-Tex | Basin | Mid-Continent | Gulf Coast | Total | |||||||||||||
Fluid Service Trucks | 125 | 102 | 523 | 67 | 158 | 975 | ||||||||||||
Salt Water Disposal Wells | 5 | 24 | 31 | 13 | 12 | 85 | ||||||||||||
Fresh/Brine Water Stations | 2 | — | 42 | — | 7 | 51 | ||||||||||||
Fluid Storage Tanks | 620 | 750 | 1,154 | 296 | 398 | 3,218 | ||||||||||||
Requirements for minor or incidental water logistics are usually purchased on a “call out” basis and charged according to a published schedule of rates. Larger projects, such as servicing the requirements of a multi-well drilling program or fracturing program, generally involve a bidding process. We compete for both services on a call out basis and for multi-well contract projects.
We provide a full array of fluid sales, transportation, storage, treatment and disposal services required on most workover, completion and remedial projects. Our breadth of capabilities in this segment allows us to serve as a one-stop source of equipment and services for our customers. Many of our smaller competitors in this segment can provide some, but not all, of the equipment and services required by oil and gas operators, requiring them to use several companies to meet their requirements and increasing their administrative burden.
Our water logistics segment has a base level of business volume related to the regular maintenance of oil and natural gas wells. Most oil and natural gas fields produce residual salt water in conjunction with oil or natural gas. This residual water remains the legal property of the producer throughout the disposal process. We transport and dispose of this water using several different methods. Fluid service trucks pick up this fluid from tank batteries at the well site and transport it to a salt water disposal well for injection. Water can also be transported from the tank battery to the salt water disposal well by pipeline. Pipelining of water increased throughout the year, and represented approximately 21% of revenues in the fourth quarter of 2017. This type of regular maintenance work must be performed if a well is to remain active. Transportation and disposal of produced water is considered a low value service by most operators, and it is difficult for us to command a premium over rates charged by our competition. Our ability to outperform competitors in this segment depends on our ability to achieve significant economies relating to logistics, specifically the proximity between the areas where salt water is produced and the areas where our company-owned disposal wells are located. We operate salt water disposal wells in most of our markets, and our ownership of these disposal wells eliminates the need to pay third parties a fee for disposal.
Completion, workover, and remedial activities also provide the opportunity for higher operating margins from tank rentals and fluid sales. Drilling and workover jobs typically require fresh or brine water for drilling mud or circulating fluid used during the job. Completion and workover procedures often also require large volumes of water for fracturing operations, which involves stimulating a well hydraulically to increase production. Flowback fluids, spent mud, and fluids from drilling and completion activities are required to be transported from the well site to an approved disposal facility. Water treatment solutions are also utilized by customers to treat produced water and flowback, in order to be reused during the production and completion process.
Our competitors in the water logistics industry are mostly small, regionally focused companies. There are currently no companies that have a dominant position on a nationwide basis. The level of activity in the water logistics industry is comprised of a relatively stable demand for services related to the maintenance of producing wells and a highly variable demand for services used in the drilling and completion of new wells. As a result, the level of onshore drilling activity significantly affects the level of activity in the water logistics industry. While there are no industry-wide statistics, the Baker Hughes Land Drilling Rig Count is an indirect indication of demand for water logistics because it directly reflects the level of onshore drilling activity.
Water Logistics. At December 31, 2017, we owned and operated 975 fluid service trucks equipped with an average fluid hauling capacity of up to 150 bbls a piece. Each fluid service truck is equipped to pump fluids from or into wells, pits, tanks and other storage facilities. The majority of our fluid service trucks are also used to transport water to fill fracturing tanks on well locations, including fracturing tanks provided by us and others, to transport produced salt water to disposal wells, including injection wells owned and operated by us, and to transport drilling and completion fluids to and from well locations. In conjunction with the rental of our fracturing tanks, we mainly use our fluid service trucks to transport water for use in fracturing operations. Following completion of fracturing operations, our fluid service trucks are used to transport the flowback produced as a result of the fracturing operations from the well site to disposal wells. Fluid service trucks are usually provided to oilfield operators within a 50-mile radius of our nearest yard.
11
Salt Water Disposal Well Services. At December 31, 2017, we owned 85 salt water disposal facilities. Disposal wells are permitted to dispose of salt water and incidental non-hazardous oil and natural gas wastes. Our fluid service trucks frequently transport the fluids that are disposed of in these salt water disposal wells. Our disposal wells have an average permitted injection capacity of over 7,500 bbls per day per well and are strategically located in close proximity to our customers’ producing wells. Most oil and natural gas wells produce varying amounts of salt water throughout their productive lives. In the states in which we operate, oil and natural gas wastes and salt water produced from oil and natural gas wells are required by law to be disposed of in authorized facilities, including permitted salt water disposal wells. Injection wells are licensed by state authorities and are completed in permeable formations below the fresh water table. We maintain separators at most of our disposal wells, allowing us to salvage residual crude oil that we later sell for our account.
Fresh and Brine Water Stations. Our network of fresh and brine water stations, particularly in the Permian Basin where surface water is normally not available, is used to supply water necessary for the drilling and completion of oil and natural gas wells. Our strategic locations, in combination with our other fluid handling services, give us a competitive advantage over other service providers in those areas in which these other companies cannot provide these services.
Fluid Storage Tanks. Our fluid storage tanks can store up to 500 bbls of fluid and are used by oilfield operators to store various fluids at the well site, including fresh water, brine and acid for fracturing jobs, flowback, temporary production and mud storage. We transport the tanks on our trucks to well locations that are usually within a 50-mile radius of our nearest yard. Fracturing tanks are used during all phases of the life of a producing well. We typically rent fluid services tanks at daily rates for a minimum of three days.
Water Treatment Services. We utilize a number of water treatment methods in order to treat produced water and flowback that is transported to one of several treatment locations throughout our geographic footprint. Treated water is then sold to customers to be reused for fracturing or other oil and gas-related uses on wells. We typically charge for these services on a per-bbl basis.
Construction Services. We utilize a fleet of power units, including dozers, trenchers, motor graders, backhoes and other heavy equipment used in road construction. In addition, we own rock pits in some markets in our Rocky Mountain operations to ensure a reliable source of rock to support our construction activities. Contracts for well site construction services are normally awarded by our customers on the basis of competitive bidding and may range in scope from several days to several months in duration.
For further discussion of financial results for the Water Logistics segment, see Note 15, Business Segment Information of the notes to our consolidated financial statements included in this Annual Report on Form 10-K.
Contract Drilling Segment
Our contract drilling segment employs drilling rigs and related equipment to penetrate the earth to a desired depth and initiate production.
We own and operate 11 land drilling rigs, which are currently stationed in the Permian Basin of Texas and New Mexico. A land drilling rig consists of engines, a drawworks, a mast, pumps to circulate the drilling fluid (mud) under various pressures, blowout preventers, drill string and related equipment. The engines power the different pieces of equipment, including a rotary table or top drive that turns the drill string, causing the drill bit to bore through the subsurface rock layers. These jobs are typically bid by “daywork” contracts, in which an agreed upon rate per day is charged to the customer, or “footage” contracts, in which an agreed upon rate per the number of feet drilled is charged to the customer. The demand for drilling services is highly dependent on the availability of new drilling locations available to well operators, as well as sensitivity to expectations relating to and changes in oil and natural gas prices.
For further discussion of financial results for the Contract Drilling segment, see Note 15, Business Segment Information of the notes to our consolidated financial statements included in this Annual Report on Form 10-K.
Properties
Our principal executive offices are located at 801 Cherry Street, Suite 2100, Fort Worth, Texas 76102. We currently conduct our business from 138 area offices, 83 of which we own and 55 of which we lease. Each office typically includes a yard, administrative office and maintenance facility. Of our 138 area offices, 86 are located in Texas, ten are in New Mexico and Oklahoma, eight are in North Dakota and seven are in Colorado, six are in Wyoming, Louisiana, Kansas, Utah and California each have two, and Montana, Pennsylvania and Arkansas each have one.
12
Customers
We serve numerous major and independent oil and gas companies that are active in our core areas of operations. During 2017, no single customer comprised over 10% of our total revenues. The majority of our business is with independent oil and gas companies. In the current market conditions, the loss of any current material customers could have an adverse effect on our business operations until the equipment is redeployed.
Operating Risks and Insurance
Our operations are subject to hazards inherent in the oil and natural gas industry, such as accidents, blowouts, explosions, craters, fires and oil spills that can cause:
•personal injury or loss of life;
•damage to or destruction of property, equipment and the environment; and
•suspension of operations.
In addition, claims for loss of oil and natural gas production and damage to formations can occur in the well services industry. If a serious accident were to occur at a location where our equipment and services are being used, it could result in our being named as a defendant in lawsuits asserting large claims.
Because our business involves the transportation of heavy equipment and materials, we may also experience traffic accidents which may result in spills, property damage and personal injury.
Despite our efforts to maintain high safety standards, we from time to time have suffered accidents in the past and anticipate that we could experience accidents in the future. In addition to the property and personal losses from these accidents, the frequency and severity of these incidents affect our operating costs and insurability and our relationships with customers, employees and regulatory agencies. Any significant increase in the frequency or severity of these incidents, or the general level of damage awards, could adversely affect the cost of, or our ability to obtain, workers’ compensation and other forms of insurance, and could have other material adverse effects on our financial condition and results of operations.
Although we maintain insurance coverage of types and amounts that we believe to be customary in the industry, we are not fully insured against all risks, either because insurance is not available or because of the high premium costs. We do maintain employer’s liability, pollution, cargo, umbrella, comprehensive commercial general liability, workers’ compensation and limited physical damage insurance. There can be no assurance, however, that any insurance obtained by us will be adequate to cover any losses or liabilities, or that this insurance will continue to be available or available on terms which are acceptable to us. Liabilities for which we are not insured, or which exceed the policy limits of our applicable insurance, could have a material adverse effect on us.
Competition
Our competition includes small regional contractors as well as larger companies with international operations. We believe our largest well servicing competitors are Key Energy Services, Inc., Superior Energy Services Inc., C&J Energy Services, Ltd., Ranger Energy Services Inc., and Pioneer Energy Services Corp. All five are public companies that operate in most of the large oil and natural gas producing regions in the United States. They each have centralized management teams that direct their operations and decision-making primarily from corporate and regional headquarters. In addition, because of their size, they market a large portion of their work to the major oil and gas companies.
We differentiate ourselves from our major competition by our operating philosophy. We operate a decentralized organization, where local, experienced management teams are largely responsible for sales and operations and developing stronger relationships with our customers at the field level. We target areas that are attractive to independent oil and gas operators who in our opinion tend to be more aggressive in spending, less focused on price and more likely to award work based on performance. We concentrate on providing services to a diverse group of large and small independent oil and gas companies. These independents typically are relationship driven, make decisions at the local level and are willing to pay higher rates for services. We have been successful using this business model and believe it will enable us to continue to grow our business.
Safety Program
Our business involves the operation of heavy and powerful equipment which can result in serious injuries to our employees and third parties and substantial damage to property. We have comprehensive safety and training programs designed to minimize accidents in the workplace and improve the efficiency of our operations. In addition, many of our larger customers now place greater emphasis on safety and quality management programs of their contractors. We believe that these factors will
13
gain further importance in the future. We have directed substantial resources toward employee safety and quality management training programs as well as our employee review process. While our efforts in these areas are not unique, we believe many competitors, and particularly smaller contractors, have not undertaken similar training programs for their employees.
We believe our approach to safety management is consistent with our decentralized management structure. Company-mandated policies and procedures provide the overall framework to ensure our operations minimize the hazards inherent in our work and are intended to meet regulatory requirements, while allowing our operations to satisfy customer-mandated policies and local needs and practices.
Environmental Regulation and Climate Change
Environment, Health and Safety Regulation, Including Climate Change
Our operations are subject to stringent federal, state and local laws regulating the discharge of materials into the environment or otherwise relating to health and safety or the protection of the environment. Numerous governmental agencies, such as the EPA and analogous state agencies issue regulations to implement and enforce these laws, which often require stringent and costly compliance measures. These laws and regulations may, among other things, require the acquisition of permits; govern the amounts and types of substances that may be released into the environment in connection with oil and gas drilling; restrict the way we handle or dispose of our materials and wastes; limit or prohibit construction or drilling activities in sensitive areas such as wetlands, wilderness areas or areas inhabited by endangered or threatened species; or require investigatory and remedial actions to mitigate pollution conditions. Failure to comply with these laws and regulations may result in the assessment of substantial administrative, civil and criminal penalties, as well as the possible issuance of injunctions limiting or prohibiting our activities. In addition, some laws and regulations relating to protection of the environment may, in certain circumstances, impose liability for environmental damages and cleanup costs without regard to negligence or fault. Strict adherence with these regulatory requirements increases our cost of doing business and consequently affects our profitability. Historically, our environmental compliance costs have not had a material adverse effect on our results of operations; however, there can be no assurance that such costs will not be material in the future or that such future compliance will not have a material adverse effect on our business and operating results. Moreover, environmental laws and regulations have been subject to frequent changes over the years, and the imposition of more stringent requirements could have a material adverse effect upon our capital expenditures, earnings or our competitive position. Below is a discussion of the principal environmental laws and regulations, as amended from time to time that relate to our business.
The Comprehensive Environmental Response, Compensation and Liability Act, referred to as “CERCLA” or the Superfund law, and comparable state laws impose liability, potentially without regard to fault or legality of the activity at the time, on certain classes of persons that are considered to be responsible for the release of a hazardous substance into the environment. These persons include the current or former owner or operator of the disposal site or sites where the release occurred and companies that disposed or arranged for the disposal of hazardous substances that have been released at the site. Under CERCLA, these persons may be subject to joint and several liabilities for the costs of investigating and cleaning up hazardous substances that have been released into the environment, for damages to natural resources and for the costs of some health studies. In addition, neighboring landowners and other third parties may file claims for personal injury and property damage allegedly caused by hazardous substances or other pollutants released into the environment.
The federal Solid Waste Disposal Act, as amended by the Resource Conservation and Recovery Act of 1976, referred to as “RCRA,” regulates the management and disposal of solid and hazardous waste. Some wastes associated with the exploration and production of oil and natural gas are exempted from the most stringent regulation in certain circumstances, such as drilling fluids, produced waters and other wastes associated with the exploration, development or production of oil and natural gas. However, this exemption for drilling fluids, produced waters and other wastes is subject to being limited or lost. For example, the EPA and certain non-governmental environmental groups that were contesting the EPA’s alleged failure to timely assess its RCRA Subtitle D criteria regulations for oil and natural gas wastes entered into an agreement that was finalized in a consent decree issued by the U.S. District Court for the District of Columbia in December 2016. Under the decree, the EPA is required to propose no later than March 15, 2019, a rulemaking for revision of certain Subtitle D criteria regulations pertaining to oil and natural gas wastes or sign a determination that revision of the regulations is not necessary. If the EPA proposes a rulemaking for revised oil and natural gas waste regulations, the consent decree requires that the EPA take final action following notice and comment rulemaking no later than July 15, 2021. A loss of the RCRA exemption for drilling fluids, produced waters and related wastes could result in an increase in customers’ drilling programs’ costs to manage and dispose of wastes they generate, which development could have a material adverse effect on the drilling program’s operations and reduce the demand for our services. Moreover, these wastes and other wastes may be otherwise regulated by the EPA or state agencies. In the ordinary course of our operations, industrial wastes such as paint wastes and waste solvents may be regulated as hazardous waste under RCRA or considered hazardous substances under CERCLA.
14
We currently own or lease, and have in the past owned or leased, a number of properties that have been used as service yards in support of oil and natural gas exploration and production activities. Although we have utilized operating and disposal practices that we considered standard in the industry at the time, there is the possibility that repair and maintenance activities on rigs and equipment stored in these service yards, as well as fluids stored at these yards, may have resulted in the disposal or release of hydrocarbons or other wastes on or under these yards or other locations where these wastes have been taken for disposal. In addition, we own or lease properties that in the past were operated by third parties whose operations were not under our control. These properties and the hydrocarbons or wastes disposed thereon may be subject to CERCLA, RCRA and analogous state laws. Under these laws, we could be required to remove or remediate previously disposed wastes or property contamination.
In the course of our operations, some of our equipment may be exposed to naturally occurring radiation associated with oil and natural gas deposits, and this exposure may result in the generation of wastes containing naturally occurring radioactive materials, or “NORM.” NORM wastes exhibiting trace levels of naturally occurring radiation in excess of established state standards are subject to special handling and disposal requirements, and any storage vessels, piping and work area affected by NORM may be subject to remediation or restoration requirements. Because many of the properties presently or previously owned, operated or occupied by us or our customers have been used for oil and natural gas production operations for many years, it is possible that we may incur costs or liabilities associated with elevated levels of NORM.
Our operations are also subject to the federal Clean Water Act and analogous state laws. Under these laws, permits must be obtained to discharge pollutants into regulated surface or subsurface waters. Spill prevention, control and countermeasure requirements under federal law require appropriate operating protocols, including containment berms and similar structures, to help prevent the contamination of regulated waters in the event of a petroleum hydrocarbon spill, rupture or leak. In addition, the Clean Water Act and analogous state laws require individual permits or coverage under general permits for discharges of storm water runoff from certain types of facilities or during construction activities. This program requires covered facilities to obtain individual permits, or seek coverage under a general permit. Additionally, permits for discharges of storm water runoff may be required for certain of our properties. The Clean Water Act also prohibits the discharge of dredge and fill material in regulated waters, including wetlands, unless authorized by permit. In June 2015, the EPA and the U.S. Army Corps of Engineers (“Corps”) released a final rule that attempted to clarify federal jurisdiction under the Clean Water Act over waters of the United States, including wetlands, but legal challenges to this rule followed. The 2015 rule was stayed nationwide to determine whether federal district or appellate courts had jurisdiction to hear cases in the matter and, in January 2017, the U.S. Supreme Court agreed to hear the case. Recently, on January 22, 2018, the U.S. Supreme Court issued a decision finding that jurisdiction resides with the federal district courts The EPA and Corps proposed a rulemaking in June 2017 to repeal the June 2015 rule, announced their intent to issue a new rule defining the Clean Water Act’s jurisdiction, and published a final rule on February 6, 2018 specifying that the contested June 2015 rule would not take effect until February 6, 2020. As a result of these recent developments, future implementation of the June 2015 rule is uncertain at this time.
The federal Clean Water Act and the federal Oil Pollution Act of 1990 contain numerous requirements relating to the prevention of and response to oil spills into regulated waters, and require some owners or operators of facilities that store or otherwise handle oil to prepare and implement spill prevention, control and countermeasure plans, also referred to as “SPCC plans,” relating to the possible discharge of oil into regulated waters.
Our underground injection operations are subject to SDWA as well as analogous state and local laws and regulations including the UIC program, which includes requirements for permitting, testing, monitoring, record keeping and reporting of injection well activities. The federal Energy Policy Act of 2005 amended the UIC provisions to exclude certain hydraulic fracturing activities from the definition of “underground injection” under certain circumstances. However, the repeal of this exclusion has been advocated by certain advocacy organizations and others in the public. Legislation regulating underground injection has been introduced at the state level. For example, at the state level, several states in which we operate, including Wyoming, Texas, Colorado and Oklahoma, have adopted regulations requiring operators to disclose certain information regarding hydraulic fracturing fluids. In addition, public concerns have recently been raised regarding the disposal of hydraulic fluid in injection wells. Partly in response to public concerns, the Texas Railroad Commission, referred to as (“RRC”), amended its existing oil and gas disposal well regulations to require seismic activity data in permit applications and provisions to authorize the imposition of certain limitations on existing wells if seismic activity increases in the area of an injection well, including a temporary injection ban. Our operations employ hydraulic fracturing techniques to stimulate natural gas production from unconventional geological formations, which entails the injection of pressurized fracturing fluids (consisting of water, sand and certain chemicals) into a well bore. Our hydraulic fracturing activities are principally in Texas, Oklahoma, Kansas and Colorado. Our operations also involve the disposal of produced salt water by underground injection. The substantial majority of our saltwater disposal wells are located in Texas and are regulated by the RRC. We also operate salt water disposal wells in New Mexico, Oklahoma, Arkansas, Louisiana and North Dakota and are subject to similar regulatory controls in those states. In addition, in response to reports tying the increase in seismic activity in Oklahoma to the injection of
15
produced water, the OCC has implemented a variety of measures, including the adoption of the National Academy of Science’s “traffic light system”, pursuant to which the agency reviews new disposal well applications and may restrict operations at existing wells. Beginning in 2013, the OCC has ordered the reduction of disposal volumes into the Arbuckle formation. More recently, the OCC directed the shut in of a number of disposal wells due to increased earthquake activity in the Arbuckle formation and imposed further disposal well volume reductions in the Edmond area. To date, none of our wells have been restricted. Regulations in the states in which we operate require us to obtain a permit from the applicable regulatory agencies to operate each of our underground salt water disposal wells. We believe that we have obtained the necessary permits from these agencies for each of our underground injection wells and that we are in substantial compliance with permit conditions and commission rules. Nevertheless, these regulatory agencies have the general authority to suspend or modify one or more of these permits if continued operation of one of our underground injection wells is likely to result in pollution of freshwater, substantial violation of permit conditions or applicable rules, or leaks to the environment or other conditions such as earthquakes. Although we monitor the injection process of our wells, any leakage from the subsurface portions of the injection wells could cause degradation of fresh groundwater resources, potentially resulting in cancellation of operations of a well, issuance of fines and penalties from governmental agencies, incurrence of expenditures for remediation of the affected resource and imposition of liability by third parties for property damages and personal injuries. In addition, our sales of residual crude oil collected as part of the saltwater injection process could impose liability on us in the event that the entity to which the oil was transferred fails to manage the residual crude oil in accordance with applicable environmental health and safety laws.
We maintain insurance against some risks associated with environmental liabilities that may occur as a result of well service activities. However, there can be no assurance this insurance will cover all potential losses, that insurance will continue to be commercially available or this insurance will be available at premium levels that justify its purchase by us. The occurrence of a significant event that is not fully insured or indemnified against could have a material adverse effect on our financial condition and operations.
We are also subject to the requirements of the federal Occupational Safety and Health Act, known as (“OSHA,”) and comparable state statutes that regulate the protection of the health and safety of workers. In addition, the U.S. Occupational Safety and Health Administration’s hazard communication standard the EPA’s community right-to-know regulations under Title III of the federal Superfund Amendment and Reauthorization Act, and comparable state statues require that information be maintained about hazardous materials used or produced in operations and that this information be provided to employees, state and local government authorities and the public.
We are also subject to the requirements of the Federal Motor Carrier Safety Regulations (“DOT – FMCSA”) of the U.S. Department of Transportation (“DOT”) and comparable state statutes that regulate commercial motor vehicle operations. In addition, we are also subject to the Pipeline and Hazardous Materials Safety Administration “DOT-PHMSA” and comparable state statutes that regulate hazardous materials shipments.
The federal Clean Air Act (“CAA”) and comparable state laws and regulations restrict the emission of various air pollutants from many sources through air emissions standards, construction and operating permitting programs, and the imposition of other monitoring and reporting requirements. These laws and regulations may require us to obtain pre-approval for the construction or modification of certain projects or facilities expected to produce or significantly increase air emissions, obtain and strictly comply with stringent air permit requirements or utilize specific equipment or technologies to control emissions of certain pollutants. Obtaining permits has the potential to delay the development of oil and natural gas projects. Over the next several years, we and our customers may be required to incur certain capital expenditures for air pollution control equipment or other air emissions-related issues. For example, in October 2015, the EPA issued a final rule under the CAA, lowering the National Ambient Air Quality Standard for ground-level ozone to 70 parts per billion under both the primary and secondary standards. The EPA published a final rule in November 2017 that issued area designations with respect to ground-level ozone for approximately 85% of the U.S. counties as either “attainment/unclassifiable” or “unclassifiable” and is expected to issue attainment or non-attainment designations for the remaining areas of the U.S. not addressed under the November 2017 final rule in the first half of 2018. Additionally, state implementation of these revised standards could result in stricter permitting requirements, delay or prohibit our ability to obtain such permits, and result in increased expenditures for pollution control equipment, the costs of which could be significant. Compliance with this final rule or any other new legal requirements could, among other things, require us or our customers to install new emission controls on some equipment and to incur longer permitting timelines or significantly increased capital expenditures and operating costs. Additionally, if such compliance reduces demand for the oil and natural gas that our customers produce, we could also incur reduced demand for our services, which one or more developments could adversely impact our business.
Responding to scientific studies that have suggested that emissions of gases, commonly referred to as “greenhouse gases,” including gases associated with the oil and gas sector such as carbon dioxide, methane, and nitrous oxide among others, may be contributing to global warming and other environmental effects, the EPA has begun to adopt regulations to reduce emissions of greenhouse gases. Any such regulations may have the potential to affect our business, customers or the energy
16
sector generally. In addition, the United States has been involved in international negotiations regarding greenhouse gas reductions under the United Nations Framework Convention on Climate Change (“UNFCCC”). The U.S. was among approximately 195 nations that signed an international accord in December 2015, the so-called Paris Agreement, which became effective in 2016, with the objective of limiting greenhouse gas emissions. However, in August 2017, the U.S. State Department informed the United Nations of its intent to withdraw from the Paris Agreement.
A number of states, individually or in regional cooperation, have also imposed restrictions on greenhouse gas emissions under various policies and approaches, including establishing a cap on emissions, requiring efficiency measures, or providing incentives for pollution reduction, use of renewable energy, or use of fuels with lower carbon content.
These federal, regional and state measures generally apply to industrial sources, including facilities in the oil and gas sector, and could increase the operating and compliance costs of our services and facilities. International accords such as the Paris Agreement may result in additional regulations to control greenhouse gas emissions. These regulations could also adversely affect market demand or pricing for our services, by affecting the price of, or reducing the demand for, fossil fuels or providing competitive advantages to competing fuels and energy sources. The potential increase in the costs of our operations could include costs to operate and maintain our equipment or facilities install new emission controls on our equipment or facilities, acquire allowances to authorize our greenhouse gas emissions, pay taxes related to our greenhouse gas emissions, or administer and manage a greenhouse gas emissions program. While we may be able to include some or all of such increased costs in the rates charged for our services, such recovery of costs is uncertain and may depend on events beyond our control, including the provisions of any final regulations. In addition, changes in regulatory policies that result in a reduction in the demand for hydrocarbon products that are deemed to contribute to greenhouse gases, or restrictions on their use, may reduce demand for our services.
There is considerable debate as to global warming and the environmental effects of greenhouse gas emissions and associated consequences affecting global climate, oceans, and ecosystems. As a commercial enterprise, we are not in a position to validate or repudiate the existence of global warming or various aspects of the scientific debate. However, if global warming is occurring, it could have an impact on our operations. For example, our operations in low lying areas such as the coastal regions of Louisiana and Texas may be at increased risk due to flooding, rising sea levels or disruption of operations from more frequent and severe weather events. Facilities in areas with limited water availability may be impacted if droughts become more frequent or severe. Changes in climate or weather may hinder exploration and production activities or increase or decrease the cost of production of oil and natural gas resources and consequently affect demand for our field services. Changes in climate or weather may also affect consumer demand for energy or alter the overall energy mix. However, we are not in a position to predict the precise effects of global warming on energy markets or the physical effects of global warming. We are providing this disclosure based on publicly available information on the matter.
Finally, it should be noted that, recently, activists concerned about the potential effects of climate change have directed their attention at sources of funding for fossil-fuel energy companies, which has resulted in certain financial institutions, funds and other sources of capital restricting or eliminating their investment in oil and natural gas activities. Ultimately, this could make it more difficult for our customers to secure funding for exploration and production activities, which could reduce demand for our services. Notwithstanding potential risks related to climate change, the International Energy Agency estimates that global energy demand will continue to rise and will not peak until after 2040 and that oil and natural gas will continue to represent a substantial percentage of global energy use over that time.
Employees
As of December 31, 2017, we employed approximately 4,100 people, with approximately 82% employed on an hourly basis. Our future success will depend partially on our ability to attract, retain and motivate qualified personnel. We are not a party to any collective bargaining agreements, and we consider our relations with our employees to be satisfactory.
17
Executive Officers of the Registrant
Our executive officers as of February 28, 2018 and their respective ages and positions are as follows:
Name | Age | Position | ||
T. M. “Roe” Patterson | 43 | President, Chief Executive Officer and Director | ||
Alan Krenek | 62 | Senior Vice President, Chief Financial Officer, Treasurer and Secretary | ||
James F. Newman | 53 | Senior Vice President — Region Operations | ||
William T. Dame | 57 | Vice President — Pumping Services | ||
Douglas B. Rogers | 54 | Vice President — Marketing | ||
Eric Lannen | 52 | Vice President — Human Resources | ||
Lanny T. Poldrack | 50 | Vice President — Central Region and Tubular Division | ||
John Cody Bissett | 43 | Vice President, Controller and Chief Accounting Officer | ||
Brett J. Taylor | 45 | Vice President — Equipment and Manufacturing | ||
Set forth below is the description of the backgrounds of our executive officers.
T. M. “Roe” Patterson (President, Chief Executive Officer and Director) has 23 years of related industry experience. He was named our President and Chief Executive Officer and appointed as a Director in September 2013. Since joining Basic in 2006, he served in positions of increasing responsibility: as our Senior Vice President and Chief Operating Officer from April 2011 until September 2013, as a Senior Vice President from September 2008 until April 2011 and as a Vice President of various groups within Basic from February 2006 until September 2008. Prior to joining Basic, he was president of his own manufacturing and oilfield service company, TMP Companies, Inc., from 2000 to 2006. He was a Contracts/Sales Manager for the Permian Division of Patterson Drilling Company from 1996 to 2000. He was an Engine Sales Manager for West Texas Caterpillar from 1995 to 1996. Mr. Patterson graduated with a B.S. degree in Biology from Texas Tech University.
Alan Krenek (Senior Vice President, Chief Financial Officer, Treasurer and Secretary) has 30 years of related industry experience. He has been our Vice President, Chief Financial Officer and Treasurer since January 2005. He became Senior Vice President and Secretary in May 2006. Prior to joining Basic, he held various financial management positions at Landmark Graphics Corp., Noble Corporation and Pool Energy Services Company. Mr. Krenek graduated with a B.B.A. degree in Accounting from Texas A&M University and is a Certified Public Accountant.
James F. Newman (Senior Vice President — Regional Operations) has 33 years of related industry experience and has been our Senior Vice President, Region Operations since November 2013. He previously served as our Group Vice President — Permian Business Unit from April 2011 until September 2013 and has been a Group Vice President since September 2008. Prior to joining Basic, he co-founded Triple N Services in 1986 and served as its President through May 2008. He initially served Basic as an Area Manager in the plugging and abandonment operations. Mr. Newman is a registered Professional Engineer and is active in the Society of Petroleum Engineers. Mr. Newman graduated with a B.S. in Petroleum Engineering from Colorado School of Mines.
William T. Dame (Vice President — Pumping Services) has 37 years of related industry experience. Mr. Dame joined Basic in 2003 and has served as our Vice President — Pumping Services since 2006. He previously served as our Vice President — PPW and RAFT Divisions from 2005 to 2006 and as a regional vice president from 2004 through 2005. Mr. Dame began his career in 1981 with Halliburton. From 1987 to 1997, he served as a vice president of Fleet Cementers, Inc., and from 1997 to 2003, he worked in various operational management positions at Plains Energy, Precision Drilling and New Force Energy Services. Mr. Dame attended Tarleton State University.
Douglas B. Rogers (Vice President — Marketing) has 35 years of related industry experience. He joined Basic in 2007 and serves as Vice President — Marketing after serving as Vice President-Contracts for the Drilling Division. Mr. Rogers was Vice President- Rocky Mountain Division for Patterson - UTI Drilling Company from March 2003 to June 2007. He also served as Western Division Sales Manager for Ambar Lonestar Fluid Services, a division of Patterson - UTI Drilling Company, from 1998 to 2003. He began his career in 1983 with Permian Servicing Company, where he managed well servicing operations. He continued in that capacity through Permian Servicing Company’s mergers with Xpert Well Service and Pride Petroleum Service until joining Zia Drill/Nova Mud in March 1997. Mr. Rogers graduated with a B.A. degree from Eastern New Mexico University.
Eric Lannen (Vice President — Human Resources) has been a Vice President since August 2015. Eric Lannen has more than 26 years of Human Resources experience in the oil & gas, engineering & construction, defense & government
18
services and the technology industries, as well as more than 16 years of experience in HR leadership roles. Prior to joining Basic, Mr. Lannen served as Senior Vice President, Human Resources for Dyncorp International and Vice President of Human Resources at McDermott International. Mr. Lannen’s prior experience includes: talent acquisition leader for IBM growth markets across five continents; leading Human Resources for the Government Services Division of Kellogg Brown & Root (KBR); and several HR positions at Halliburton Company. Mr. Lannen graduated from Texas A&M University with a Bachelor of Science degree.
Lanny T. Poldrack (Vice President — Central Region and Tubular Division) has 31 years of related industry experience and has served as our Vice President - Central Region and Tubular Division since October 2015. He previously served as our Vice President - Safety and Operations Support since April 2011. From April 2009 to April 2011, he served as a Corporate Marketing Representative based in Houston, Texas. Prior to joining Basic, he spent 13 years at Cudd Energy Services where he held various technical sales and sales management positions for both well intervention and live well service divisions, the last 4 years of which he served as Business Development Manager for Cudd Well Control for both domestic and international operations in U.S., Canadian, Latin America, European, Middle Eastern and South East Asian markets. He began his oilfield career in West Texas as a technical field representative for Weatherford International, specializing in fishing and rental tools and hydraulic BOP systems. Mr. Poldrack graduated with an applied science degree from Odessa Junior College.
John Cody Bissett (Vice President, Controller and Chief Accounting Officer) has 19 years of related industry experience. He was appointed Basic’s Vice President, Controller and Chief Accounting Officer in March 2012. Mr. Bissett previously served as Basic’s Corporate Controller from July 2008 to March 2012 and as the Director of Financial Reporting from December 2007 to July 2008. Prior to joining Basic, Mr. Bissett was the Controller of Cap Rock Energy from November 2006 through December 2007, and previously held various roles in the accounting and finance function of Sirius Computer Solutions and the audit practice of KPMG LLP. Mr. Bissett graduated with an M.B.A. and a B.B.A. in Accounting from Angelo State University and is a Certified Public Accountant.
Brett J. Taylor (Vice President — Manufacturing and Equipment) has 25 years of related industry experience. He has been our Vice President of Manufacturing and Equipment since June 2013. Prior to joining Basic, he was President of Taylor Industries, LLC in Tulsa, Oklahoma from 2010 to 2013. From 2009 to 2010, he served as Executive Vice President of Sales and Marketing at Serva Group Manufacturing. Before that, Mr. Taylor held positions of increasing responsibilities at Taylor Industries over an 11-year span. His tenure at Taylor included the role of Consultant, President of Sales from 2008 to 2009, President of Taylor from 2003 to 2008, General Manager & Vice President of Business Development from 2001 to 2003, and Sales and Marketing Manager from 1997 to 1999. Mr. Taylor graduated with a Bachelor of Business Administration Degree from the University of Oklahoma.
Additional Information
We make available free of charge on our website, www.basicenergyservices.com, our annual reports on Form 10-K, quarterly reports on Form 10-Q, current reports on Form 8-K and amendments to those reports filed or furnished pursuant to the Exchange Act, as soon as reasonably practicable after we electronically file such information with, or furnish it to, the SEC. These documents are also available on the SEC’s website at www.sec.gov, or you may read and copy any materials that we file with or furnish to the SEC at the SEC’s Public Reference Room at 100 F Street, N.E., Washington D.C. 20549. The information on our website is not, and shall not be deemed to be, a part of this Annual Report on Form 10-K or incorporated into any of our other filings with the SEC.
We have a Code of Conduct that applies to all of our directors, officers and employees. The Code of Conduct is available publicly on our website at www.basicenergyservices.com. Any waivers granted to directors or executive officers and any material amendments to our Code of Ethics will be posted promptly on our website and/or disclosed in a current report on Form 8-K.
The certifications by our Chief Executive Officer and Chief Financial Officer pursuant to Section 302 of the Sarbanes-Oxley Act of 2002 are filed as exhibits to this Annual Report on Form 10-K. We have also filed with the New York Stock Exchange the most recent Annual CEO Certification as required by Section 303A.12(a) of the New York Stock Exchange Listed Company Manual.
ITEM 1A. RISK FACTORS
The following are some of the important factors that could affect our financial performance or could cause actual results to differ materially from estimates contained in our forward-looking statements. We may encounter risks in addition to those described below. Additional risks and uncertainties not currently known to us, or that we currently deem to be immaterial, may also impair or adversely affect our business, results of operation, financial condition and prospects.
19
Risks Relating to Our Business
Our business depends on domestic spending by the oil and natural gas industry, and this spending and our business has been in the past, and may in the future be, adversely affected by industry and financial market conditions that are beyond our control.
We depend on our customers’ willingness to make operating and capital expenditures to explore for, develop and produce oil and natural gas in the United States. Customers’ expectations for lower market prices for oil and natural gas, as well as the availability of capital for operating and capital expenditures, may cause them to curtail spending, thereby reducing demand for our services and equipment.
Industry conditions are influenced by numerous factors over which we have no control, such as the supply of and demand for oil and natural gas, domestic and worldwide economic conditions, political instability in oil and natural gas producing countries and merger, acquisition and divestiture activity among oil and gas producers. Activities by non-governmental organizations to limit certain sources of funding for the energy sector or to restrict the exploration, development and production of oil and natural gas may adversely affect the ability of certain of our customers to conduct operations. The volatility of the oil and natural gas industry; environmental and other governmental regulations regarding the exploration for and production and development of oil and natural gas reserves, and the consequent impact on exploration and production activity could adversely impact the level of drilling and workover activity by some of our customers. This reduction may cause a decline in the demand for our services or adversely affect the price of our services. In addition, reduced discovery rates of new oil and natural gas reserves in our market areas also may have a negative long-term impact on our business, even in an environment of stronger oil and natural gas prices, to the extent existing production is not replaced and the number of producing wells for us to service declines.
Oil and gas industry pricing remained relatively stable through the middle of 2014. However, beginning in the second half of 2014, oil prices declined substantially from historical highs and continued to decline through the first half of 2016. Prices gradually increased in late 2016 and throughout 2017, but remain significantly lower than the peak of prices in 2014. Oil and gas prices may remain at lower and more stable levels for the foreseeable future.
Limitations on the availability of capital, or higher costs of capital, for financing expenditures may cause oil and natural gas producers to make further reductions to capital budgets in the future even if oil or natural gas prices increase from current levels. Any such cuts in spending will curtail drilling programs as well as discretionary spending on well services, which may result in a reduction in the demand for our services, the rates we can charge and our utilization. In addition, certain of our customers could become unable to pay their suppliers, including us. Any of these conditions or events could adversely affect our operating results.
If oil and natural gas prices remain volatile, or if oil or natural gas prices remain low or decline further, the demand for our services could be adversely affected.
The demand for our services is primarily determined by current and anticipated oil and natural gas prices and the related general production spending and level of drilling activity in the areas in which we have operations. Volatility or weakness in oil or natural gas prices (or the perception that oil or natural gas prices will decrease) affects the spending patterns of our customers and may result in the drilling of fewer new wells or lower production spending on existing wells. This, in turn, could result in lower demand for our services and may cause lower rates and lower utilization of our well service equipment. If oil or natural gas prices continue to remain low or decline further, or if there is a reduction in drilling activities, the demand for our services and our results of operations could be materially and adversely affected.
Prices for oil and natural gas historically have been extremely volatile and are expected to continue to be volatile. The Cushing WTI Spot Oil Price averaged $48.69, $43.14 and $50.88 per bbl in 2015, 2016 and 2017, respectively. The Cushing WTI oil prices have declined from over $107 per bbl in June 2014 to $60 per bbl on December 29, 2017. The Henry Hub Natural Gas Spot Price averaged $2.63, $2.52 and $2.99 per Mcf for 2015, 2016 and 2017, respectively.
Competition within the well services industry may adversely affect our ability to market our services.
The well services industry is highly competitive and fragmented and includes numerous small companies capable of competing effectively in our markets on a local basis, as well as several large companies that possess substantially greater financial and other resources than we do. Our larger competitors’ greater resources could allow those competitors to compete more effectively than we can. The amount of equipment available may exceed demand, which could result in active price competition. Many contracts are awarded on a bid basis, which may further increase competition based primarily on price. In addition, adverse market conditions lower demand for well servicing equipment, which results in excess equipment and lower utilization rates. If adverse oil and natural gas market conditions persist or deteriorate further, our utilization rates may decline.
20
We may require additional capital in the future. We cannot assure you that we will be able to generate sufficient cash internally or obtain alternative sources of capital on favorable terms, if at all. If we are unable to fund capital expenditures, our business may be adversely affected.
We anticipate we will need to make substantial capital investments in the future to purchase additional equipment to expand our services, refurbish our well servicing rigs and replace existing equipment including idled equipment brought back into service as activity levels improved. For the year ended December 31, 2016, we invested approximately $32.7 million in cash for capital expenditures. For the year ended December 31, 2017, we invested approximately $63.4 million in cash for capital expenditures and $67.5 million of capital leases. For 2018, we have currently budgeted $95.0 million for capital expenditures, including $40.0 million for capital leases, excluding acquisitions. Historically, we have financed these investments through internally generated funds, debt and equity offerings, our capital lease program and borrowings under the credit facilities. Please read Item 7. “Management’s Discussion and Analysis of Financial Condition and Results of Operation - Liquidity and Capital Resources” for more information.
Our significant capital investments require cash that we could otherwise apply to other business needs. However, if we do not incur these expenditures while our competitors make substantial fleet investments, our market share may decline and our business may be adversely affected. In addition, if we are unable to generate sufficient cash internally or obtain alternative sources of capital to fund our proposed capital expenditures and acquisitions, take advantage of business opportunities or respond to competitive pressures, it could materially and adversely affect our results of operations, financial condition and growth. If we raise additional funds by issuing equity securities, dilution to existing stockholders may result. Adverse changes in the capital markets could make it difficult to obtain additional capital or obtain it at attractive rates.
Our future financial results could be adversely impacted by asset impairments or other charges.
We have recorded goodwill impairment charges and asset impairment charges in the past. We periodically evaluate our long-lived assets, including our property and equipment, and intangible assets. In performing these assessments, we project future cash flows on an undiscounted basis for other long-lived assets, and compare these cash flows to the carrying amount of the related assets. These cash flow projections are based on our current operating plans, estimates and judgmental assumptions. We perform the assessment of potential impairment for our long-lived assets whenever facts and circumstances indicate that the carrying value of those assets may not be recoverable due to various external or internal factors. If we determine that our estimates of future cash flows were inaccurate or our actual results are materially different from what we have predicted, we could record additional impairment charges in future periods, which could have a material adverse effect on our financial position and results of operations.
We have operated at a loss in the past, and there is no assurance of our profitability in the future.
Historically, we have experienced periods of low demand for our services and have incurred operating losses. In the future, we may not be able to reduce our costs, increase our revenues, or reduce our debt service obligations sufficient to achieve or maintain profitability and generate positive operating income. Under such circumstances, we may incur further operating losses and experience negative operating cash flow.
Our indebtedness could restrict our operations and make us more vulnerable to adverse economic conditions.
On September 29, 2017, Basic and certain of its subsidiaries entered into a $100.0 million revolving credit facility, which was subsequently increased to $120.0 million (the "Credit Facility"). As of December 31, 2017, we had $64.0 million of borrowings of which $45.2 million is held in restricted cash to secure letters of credit. As of December 31, 2017, we had $11.5 million of available borrowing capacity under our Credit Facility. Also as of December 31, 2017, the aggregate principal amounts of the loan under our term loan agreement (the "Term Loan Agreement") was $162.5 million. For the year ended December 31, 2017, we made cash interest payments totaling $25.6 million.
Our current and future indebtedness could have important consequences. For example, it could:
• | impair our ability to make investments and obtain additional financing for working capital, capital expenditures, acquisitions or other general corporate purposes; |
• | limit our ability to use operating cash flow in other areas of our business because we must dedicate a substantial portion of these funds to make principal and interest payments on our indebtedness; |
• | make us more vulnerable to a downturn in our business, our industry or the economy in general as a substantial portion of our operating cash flow will be required to make principal and interest payments on our indebtedness, making it more difficult to react to changes in our business and in industry and market conditions; |
21
•limit our ability to obtain additional financing that may be necessary to operate or expand our business;
•put us at a competitive disadvantage to competitors that have less debt; and
•increase our vulnerability to interest rate increases to the extent that we incur variable rate indebtedness.
If we are unable to generate sufficient cash flow or are otherwise unable to obtain the funds required to make principal and interest payments on our indebtedness, or if we otherwise fail to comply with the various covenants in instruments governing any existing or future indebtedness, we could be in default under the terms of such instruments. In the event of a default, the holders of our indebtedness could elect to declare all the funds borrowed under those instruments to be due and payable together with accrued and unpaid interest, secured lenders could foreclose on any of our assets securing their loans and we or one or more of our subsidiaries could be forced into bankruptcy or liquidation. If our indebtedness is accelerated, or we enter into bankruptcy, we may be unable to pay all of our indebtedness in full. Any of the foregoing consequences could restrict our ability to grow our business and cause the value of our common stock to decline.
Our Credit Agreements impose restrictions on us that may affect our ability to successfully operate our business.
Our Credit Agreements impose limitations on our ability to take various actions, such as:
•limitations on the incurrence of additional indebtedness;
•restrictions on mergers, sales or transfers of assets without the lenders’ consent; and
•limitations on dividends and distributions.
In addition, our Credit Agreements require us to maintain certain financial ratios and to satisfy certain financial conditions, some of which become more restrictive over time and may require us to reduce our debt or take some other action in order to comply with them. The failure to comply with any of these financial conditions, including the financial ratios or covenants, would cause a default under our Credit Agreements. A default under any of our indebtedness, if not waived, could result in the acceleration of such indebtedness or other indebtedness, in which case the debt would become immediately due and payable. In addition, a default or acceleration of any of our indebtedness under our Credit Agreements could result in a default under or acceleration of other indebtedness with cross-default or cross-acceleration provisions. In the event of any acceleration of our indebtedness, we may not be able to pay our debt or borrow sufficient funds to refinance it, and any holders of secured indebtedness may seek to foreclose on the assets securing such indebtedness. Even if new financing is available, it may not be available on terms that are acceptable to us. These restrictions could also limit our ability to obtain future financings, make needed capital expenditures, withstand a downturn in our business or the economy in general, or otherwise conduct necessary corporate activities. We also may be prevented from taking advantage of business opportunities that arise because of the limitations imposed on us by the restrictive covenants under our Credit Agreements or existing limitations on the incurrence of additional indebtedness, including in connection with acquisitions. Please read Item 7. “Management’s Discussion and Analysis of Financial Condition and Results of Operations — Liquidity and Capital Resources — Credit Facility” for a discussion of our Credit Agreements.
Variable rate indebtedness subjects us to interest rate risk, which could cause our debt service obligations to increase significantly.
Borrowings under our Credit Facility bear interest at variable rates, exposing us to interest rate risk. If the interest rates increase, our debt service obligations on the variable rate indebtedness would increase even though the amount borrowed would remain the same, and our results of operations and cash flows for servicing our indebtedness would decrease.
Our actual financial results after emergence from our Chapter 11 Cases may not be comparable to our projections filed with the Bankruptcy Court in the course of our Chapter 11 Cases, and will not be comparable to our historical financial results as a result of the implementation of our Prepackaged Plan and the transactions contemplated thereby, as well as our adoption of fresh start accounting following emergence.
In 2016, we filed with the Bankruptcy Court projected financial information to demonstrate to the Bankruptcy Court the feasibility of our Prepackaged Plan and our ability to continue operations following our emergence from the Chapter 11 Cases. Those projections were prepared solely for the purpose of the Chapter 11 Cases and have not been, and will not be, updated on an ongoing basis and should not be relied upon by investors. At the time they were prepared, the projections reflected numerous assumptions concerning our anticipated future performance with respect to then prevailing and anticipated market and economic conditions that were and remain beyond our control and that may not materialize. Projections are inherently subject to substantial and numerous uncertainties and to a wide variety of significant business, economic and competitive risks and the assumptions underlying the projections and/or valuation estimates may prove to be wrong in material respects. Actual results will likely vary significantly from those contemplated by the projections. As a result, investors should not rely on those projections.
22
Additionally, in accordance with the provisions of Financial Accounting Standards Board Accounting Standards Codification No. 852 - Reorganizations, we applied fresh start accounting in our financial statements which commenced with our financial statements as of and for the year ended December 31, 2016. This materially impacted our 2016 operating results, as certain pre-bankruptcy debts were discharged in accordance with the Prepackaged Plan immediately prior to our emergence from bankruptcy, and our assets and liabilities were adjusted to their fair values upon emergence. As a result, our financial information subsequent to our emergence from bankruptcy is not comparable to our financial statements prior to emergence
Our operations are subject to inherent risks, including operational hazards and cyber-attacks. These risks may be self-insured, or may not be fully covered under our insurance policies.
Our operations are subject to hazards inherent in the oil and natural gas industry, such as, but not limited to, accidents, blowouts, explosions, craters, fires and oil spills. These conditions can cause:
•personal injury or loss of life;
•damage to or destruction of property, equipment and the environment; and
•suspension of operations.
The occurrence of a significant event or adverse claim in excess of the insurance coverage that we maintain or that is not covered by insurance could have a material adverse effect on our financial condition and results of operations. In addition, claims for loss of oil and natural gas production and damage to formations can occur in the well services industry. Litigation arising from a catastrophic occurrence at a location where our equipment and services are being used may result in our being named as a defendant in lawsuits asserting large claims.
As is customary in our industry, our service contracts generally provide that we will indemnify and hold harmless our customers from any claims arising from personal injury or death of our employees, damage to or loss of our equipment, and pollution emanating from our equipment and services. Similarly, our customers agree to indemnify and hold us harmless from any claims arising from personal injury or death of their employees, damage to or loss of their equipment, and pollution caused from their equipment or the well reservoir (including uncontained oil flow from a reservoir). Our indemnification arrangements may not protect us in every case. For example, from time to time we may enter into contracts with less favorable indemnities or perform work without a contract that protects us. In addition, our indemnification rights may not fully protect us if the customer is insolvent or becomes bankrupt, does not maintain adequate insurance or otherwise does not possess sufficient resources to indemnify us. In addition, our indemnification rights may be held unenforceable in some jurisdictions. Our inability to fully realize the benefits of our contractual indemnification protections could result in significant liabilities and could adversely affect our financial condition, results of operations and cash flows.
Our operations are also subject to the risk of cyber-attacks. If our systems for protecting against cyber security risks prove to be insufficient, we could be adversely affected by, among other things, loss or damage of intellectual property, proprietary information, or customer data, having our business operations interrupted, and increased costs to prevent, respond to, or mitigate cyber-attacks. These risks could have a material adverse effect on our business, consolidated results of operations, and consolidated financial condition.
We maintain insurance coverage that we believe to be customary in the industry against many of these hazards. However, we do not have insurance against all foreseeable risks, either because insurance is not available or because of the high premium costs. As such, not all of our property is insured. We are also self-insured up to retention limits with regard to workers’ compensation, general liability, and medical and dental coverage. We maintain accruals in our consolidated balance sheets related to self-insurance retentions by using third-party data and historical claims history. The occurrence of an event not fully insured against, or the failure of an insurer to meet its insurance obligations, could result in substantial losses. In addition, we may not be able to maintain adequate insurance in the future at rates we consider reasonable. Insurance may not be available to cover any or all of the risks to which we are subject, or, even if available, it may be inadequate, or insurance premiums or other costs could rise significantly in the future so as to make such insurance prohibitively expensive. It is likely that, in our insurance renewals, our premiums and deductibles will be higher, and certain insurance coverage either will be unavailable or considerably more expensive than it has been in the recent past. In addition, our insurance is subject to coverage limits, and some policies exclude coverage for damages resulting from environmental contamination.
We are subject to environmental, health and safety laws and regulations that may expose us to significant liabilities for penalties, damages or costs of remediation or compliance.
Our operations are subject to federal, regional, state and local laws and regulations relating to protection of natural resources and the environment, health and safety aspects of our operations and waste management, including the transportation and disposal of waste and other materials. These laws and regulations may impose numerous obligations on our operations, including the acquisition of permits to conduct regulated activities, the incurrence of capital expenditures to mitigate or prevent
23
releases of materials from our facilities, the imposition of substantial liabilities for pollution resulting from our operations and the application of specific health and safety criteria addressing worker protection. Regulations concerning equipment certification also create an ongoing need for regular maintenance. Failure to comply with these laws and regulations could result in investigations, restrictions or orders suspending well operations, the assessment of administrative, civil and criminal penalties, the revocation of permits and the issuance of corrective action orders, any of which could have a material adverse effect on our business, results of operations and financial condition.
There is inherent risk of environmental costs and liabilities in our business as a result of our handling of petroleum hydrocarbons and oilfield and industrial wastes, air emissions and wastewater discharges related to our operations, and historical industry operations and waste disposal practices. Our water logistics segment includes disposal operations into injection wells that pose risks of environmental liability, including leakage from the wells to surface or subsurface soils, surface water or groundwater. Some environmental laws and regulations may impose strict liability, which means that in some situations, we could be exposed to liability as a result of our conduct that was without fault or lawful at the time it occurred or as a result of the conduct of, or conditions caused by, prior operators or other third parties. Clean-up costs and other damages arising as a result of environmental laws and costs associated with changes in environmental laws and regulations could be substantial and could have a material adverse effect on our financial condition and results of operations.
We operate as a motor carrier and therefore are subject to regulation by the DOT and by other various state agencies. These regulatory authorities exercise broad powers, governing activities such as the authorization to engage in motor carrier operations and regulatory safety and hazardous materials labeling, placarding and marking. There are additional regulations specifically relating to the trucking industry, including testing and specification of equipment and product handling requirements. In addition, the trucking industry is subject to possible regulatory and legislative changes that may affect the economics of the industry by requiring changes in operating practices or by changing the demand for common or contract carrier services or the cost of providing truckload services. Some of these possible changes include increasingly stringent environmental regulations, changes in the hours of service regulations which govern the amount of time a driver may drive in any specific period, require on board black box recorder devices or limits on vehicle weight and size.
Laws protecting the environment generally have become more stringent over time and could continue to do so, which could lead to material increases in costs for future environmental compliance and remediation. The modification or interpretation of existing laws or regulations, or the adoption of new laws or regulations, could curtail exploratory or developmental drilling for oil and natural gas and could limit well servicing opportunities. We may not be able to recover some or any of our costs of compliance with these laws and regulations from insurance.
Please read Items 1 and 2. “Business and Properties — Environmental Regulation and Climate Change” for more information on the environmental laws and government regulations that are applicable to us.
We may not be able to grow successfully through future acquisitions or successfully manage future growth, and we may not be able to effectively integrate the businesses we do acquire.
Our business strategy includes growth through the acquisitions of other businesses. We may not be able to continue to identify attractive acquisition opportunities or successfully acquire identified targets. In addition, we may not be successful in integrating our current or future acquisitions into our existing operations, which may result in unforeseen operational difficulties or diminished financial performance or require a disproportionate amount of our management’s attention. Even if we are successful in integrating our current or future acquisitions into our existing operations, we may not derive the benefits, such as operational or administrative synergies, that we expected from such acquisitions, which may result in the commitment of our capital resources without the expected returns on such capital. Furthermore, competition for acquisition opportunities may escalate, increasing our cost of making further acquisitions or causing us to refrain from making additional acquisitions. We may also be limited in our ability to incur additional indebtedness in connection with or to fund future acquisitions under our credit agreements.
Whether we realize the anticipated benefits from an acquisition depends, in part, upon our ability to integrate the operations of the acquired business, the performance of the underlying product and service portfolio, and the performance of the management team and other personnel of the acquired operations. Accordingly, our financial results could be adversely affected from unanticipated performance issues, legacy liabilities, transaction-related charges, amortization of expenses related to intangibles, charges for impairment of long-term assets, credit guarantees, partner performance and indemnifications. While we believe that we have established appropriate and adequate procedures and processes to mitigate these risks, there is no assurance that these transactions will be successful.
24
We depend on several significant customers, and a loss of one or more significant customers could adversely affect our results of operations.
Our customers consist primarily of major and independent oil and gas companies. During each of 2017 and 2016, our top five customers accounted for approximately 25% of our revenues. However, no individual customer composed greater than 10% of our revenues in either year. The loss of any one of our largest customers or a sustained decrease in demand by any of such customers could result in a substantial loss of revenues and could have a material adverse effect on our results of operations.
If our customers delay paying or fail to pay a significant amount of our outstanding receivables, it could have a material adverse effect on our liquidity, consolidated results of operations, and consolidated financial condition.
In most cases, we bill our customers for our services in arrears and are, therefore, subject to our customers delaying or failing to pay our invoices. In weak economic environments, we may experience increased delays and failures due to, among other reasons, a reduction in our customers’ cash flow from operations and their access to the credit markets. If our customers delay paying or fail to pay us a significant amount of our outstanding receivables, it could have a material adverse effect on our liquidity, consolidated results of operations, and consolidated financial condition.
Our industry has experienced a high rate of employee turnover. Any difficulty we experience replacing or adding personnel could adversely affect our business.
We may not be able to find enough skilled labor to meet our needs, which could limit our growth. Our business activity historically decreases or increases with the prices of oil and natural gas. We may have problems finding enough skilled and unskilled laborers in the future if the demand for our services increases. If we are not able to increase our service rates sufficiently to compensate for wage rate increases, our operating results may be adversely affected.
Other factors may also inhibit our ability to find enough workers to meet our employment needs. Our services require skilled workers who can perform physically demanding work. As a result of our industry volatility and the demanding nature of the work, workers may choose to pursue employment in fields that offer a more desirable work environment at wage rates that are competitive with ours. We believe that our success is dependent upon our ability to continue to employ and retain skilled technical personnel. Our inability to employ or retain skilled technical personnel generally could have a material adverse effect on our operations.
Our success depends on key members of our management, the loss of any of whom could disrupt our business operations.
We depend to a large extent on the services of some of our executive officers. The loss of the services of T. M. “Roe” Patterson, our President and Chief Executive Officer, or other key personnel could disrupt our operations. Although we have entered into employment agreements with Mr. Patterson and our other executive officers that contain, among other provisions, non-compete agreements, we may not be able to enforce the non-compete provisions in the employment agreements.
Adverse weather conditions may affect our operations.
Our operations may be materially affected by severe weather conditions in areas where we operate. Severe weather, such as blizzards, extreme temperatures and hurricanes may cause evacuation of personnel, curtailment of services and suspension of operations, and loss of or damage to equipment and facilities. Damage from any adverse weather conditions could adversely affect our financial condition, results of operations and cash flows.
Weather conditions may also affect the price of crude oil and natural gas, and related demand for our services. Please read the risk factor above, “If oil and natural gas prices remain volatile, or if oil or natural gas prices remain low or decline further, the demand for our services could be adversely affected.”
Climate change legislation or regulations restricting or regulating emissions of greenhouse gases could result in increased operating costs and reduced demand for our field services.
In response to studies finding that emissions of carbon dioxide, methane and other greenhouse gases from industrial and energy sources contribute to increases of carbon dioxide levels in the earth’s atmosphere and oceans and contribute to global warming and other environmental effects, the U.S. Environmental Protection Agency (“EPA”) has adopted various regulations under the federal Clean Air Act addressing emissions of greenhouse gases that may affect the oil and gas industry. In 2012 the EPA published a final rule that includes standards to reduce volatile organic compound (“VOC”) emissions associated with oil and natural gas production.. The EPA published a final rule to reduce methane and additional VOC
25
emissions from new oil and natural gas facilities in June 2016. More recently, the EPA announced that it will reconsider the standards and in June 2017, the EPA published a proposed rule to stay certain portions of the 2016 rules. The EPA has not yet published a final rule as, as a result EPA’s 2016 standards are currently in effect, but, future implementation of the 2016 standards is uncertain at this time. Federal changes will affect state air permitting programs in states that administer the federal Clean Air Act under a delegation of authority, including states in which we have operations. Numerous legislative measures have been introduced in the past that would have imposed restrictions or costs on greenhouse gas emissions, including from the oil and gas industry. In addition, the United States has been involved in international negotiations regarding greenhouse gas reductions under the United Nations Framework Convention on Climate Change which led to the signing of the Paris Agreement in December 2015, which became effective in November 2016. However, in August 2017, the U.S. State Department informed the United Nations of its intent to withdraw from the Paris Agreement. Additionally, certain U.S. states or regional coalitions of states have adopted measures regulating or limiting greenhouse gases from certain sources or have adopted policies seeking to reduce overall emissions of greenhouse gases. The adoption and implementation of any international treaty or of any federal or state legislation or regulations imposing reporting obligations on, or limiting emissions of greenhouse gases from, our equipment and operations could require us to incur costs to comply with such requirements and possibly require the reduction or limitation of emissions of greenhouse gases associated with our operations and other sources within the industrial or energy sectors. Such legislation or regulations could adversely affect demand for the production of oil and natural gas and thus reduce demand for the services we provide to oil and natural gas producers as well as increase our operating costs by requiring additional costs to operate and maintain equipment and facilities, install emissions controls, acquire allowances or pay taxes and fees relating to emissions, which could adversely affect our results of operations. Recently, activists concerned about the potential effects of climate change have directed their attention at sources of funding for fossil-fuel energy companies, which has resulted in certain financial institutions, funds and other sources of capital restricting or eliminating their investment in oil and natural gas activities. Ultimately, this could make it more difficult for our customers to secure funding for exploration and production activities, which could reduce demand for our services. Notwithstanding potential risks related to climate change, the International Energy Agency estimates that global energy demand will continue to rise and will not peak until after 2040 and that oil and natural gas will continue to represent a substantial percentage of global energy use over that time. Finally, it should be noted that some scientists have concluded that increasing concentrations of greenhouse gases may produce changes in climate or weather, such as increased frequency and severity of storms, floods and other climatic events, which if any such effects were to occur, could have adverse physical effects on our operations, physical assets and field services to exploration and production operators.
Federal and state legislative and regulatory initiatives related to hydraulic fracturing could result in operating restrictions or delays in the completion of oil and natural gas wells that may reduce demand for our well servicing activities and could adversely affect our financial position, results of operations and cash flows.
We provide hydraulic fracturing and fluid handling services to our customers. Hydraulic fracturing is a commonly used process that involves injection of water, sand, and certain chemicals to fracture the hydrocarbon-bearing rock formation to allow flow of hydrocarbons into the wellbore. The federal Energy Policy Act of 2005 amended the Underground Injection Control (“UIC”) provisions of the federal Safe Drinking Water Act (“SDWA”) to expressly exclude certain hydraulic fracturing practices from the definition of “underground injection.” The EPA has asserted regulatory authority over certain hydraulic fracturing activities involving diesel fuel and published proposed guidance relating to such practices. At the state level, several states in which we operate have adopted regulations requiring the disclosure of certain information regarding hydraulic fracturing fluids.
Scrutiny of hydraulic fracturing activities continues in other ways, as the EPA released its report on environmental impacts of hydraulic fracturing in December 2016, concluding that hydraulic fracturing could impact drinking water resources. The federal Bureau of Land Management (“BLM”), an agency of the U.S. Department of the Interior published a final rule in March 2015 relating to the use of hydraulic fracturing techniques on public lands and disclosure of fracturing fluid constituents. However, in June 2016, a Wyoming federal judge struck down this final rule, finding that the BLM lacked authority to promulgate the rule, the BLM appealed the decision to the U.S. Court of Appeals for the Tenth Circuit in July 2016, the appellate court issued a ruling in September 2017 to vacate the Wyoming trial court decision and dismiss the lawsuit challenging the 2015 rule in response to the BLM’s issuance of a proposed rulemaking to rescind the 2015 rule and, in December 2017, the BLM published a final rule rescinding the March 2015 rule. However, in January 2018, litigation challenging the BLM’s rescission of the 2015 rule was brought in federal court. The EPA issued effluent limitations for the treatment of discharge of wastewater resulting from hydraulic fracturing activities in June 2016. In addition, some states and localities have adopted, and others are considering adopting, regulations or ordinances that could restrict hydraulic fracturing in certain circumstances, that would require, with some exceptions, disclosure of constituents of hydraulic fracturing fluids, or that would impose higher taxes, fees or royalties on natural gas production. Recent research has linked disposal of produced water into disposal wells to an increase in earthquakes across the South and Midwest. Certain state agencies, including those in Texas and Oklahoma, have implemented regulations authorizing the imposition of certain limitations on existing wells if
26
seismic activity increases in the area of an injection well, including a temporary injection ban. For example, in Oklahoma, the Oklahoma Corporation Commission (“OCC”) has implemented a variety of measures, including the adoption of the National Academy of Science’s “traffic light system”, pursuant to which the agency reviews new disposal well applications and may restrict operations at existing wells. Beginning in 2013, the OCC has ordered the reduction of disposal volumes into the Arbuckle formation. More recently, the OCC directed the shut in of a number of disposal wells due to increased earthquake activity in the Arbuckle formation and imposed further disposal well volume reductions in the Edmond area. Moreover, public debate over hydraulic fracturing and shale gas production has been increasing, and has resulted in delays of well permits in some areas.
Increased regulation and attention given to the hydraulic fracturing process could lead to greater opposition, including litigation, to oil and gas production activities using hydraulic fracturing techniques. Additional legislation or regulation could also lead to operational delays or increased operating costs in the production of oil and natural gas, including from the developing shale plays, incurred by our customers or could make it more difficult to perform hydraulic fracturing. The adoption of any federal, state or local laws or the implementation of regulations or ordinances restricting or increasing the costs of hydraulic fracturing could potentially increase our costs of operations and cause a decrease in the completion of new oil and natural gas wells and an associated decrease in demand for our well servicing activities, any or all of which could adversely affect our financial position, results of operations and cash flows.
Potential listing of species as “endangered” under the federal Endangered Species Act could result in increased costs and new operating restrictions or delays on our oil and natural gas exploration and production customers, which could adversely reduce the amount of contract drilling services that we provide to such customers.
The federal Endangered Species Act, referred to as the “ESA,” and analogous state laws regulate a variety of activities, including oil and gas development, which could have an adverse effect on species listed as threatened or endangered under the ESA or their habitats. The designation of previously unidentified endangered or threatened species could cause oil and natural gas exploration and production operators to incur additional costs or become subject to operating delays, restrictions or bans in affected areas, which impacts could adversely reduce the amount of drilling activities in affected areas, including support services that we provide to such operators under our contract drilling services segment. Numerous species have been listed or proposed for protected status in areas in which we provide or could in the future provide field services. Certain wildflower species, among others, are also species that have been or are being considered for protected status under the ESA and whose range can coincide with oil and natural gas production activities. The presence of protected species in areas where operators whom we provide contract drilling services conduct exploration and production operations could impair such operators’ ability to timely complete well drilling and development and, consequently, adversely affect the amount of contract drilling or other field services that we provided to such operators, which reduction of services could have a significant adverse effect on our results of operations and financial position.
Our ability to use net operating losses and credit carry-forwards to offset future taxable income for U.S. federal income tax purposes may be limited as a result of issuances of equity or other transactions.
In general, under Sections 382 and 383 of the Internal Revenue Code of 1986, as amended (the “Code”), a corporation that undergoes an “ownership change” is subject to limitations on its ability to utilize its pre-change net operating losses (“NOLs”) and certain tax credits, to offset future taxable income and tax. In general, an ownership change occurs if the aggregate stock ownership of certain stockholders changes by more than 50 percentage points over such stockholders’ lowest percentage ownership during the testing period (generally three years).
In connection with our emergence from our Chapter 11 Cases, we experienced an ownership change for the purposes of Section 382 of the Code. The ownership changes have not resulted in the expiration of any NOLs generated prior to the emergence date. However, any subsequent ownership changes under the provisions of Section 382 could adversely affect the use of NOLs in future periods. The amount of consolidated Federal NOLs available as of December 31, 2017 is approximately $664.8 million.
Recently enacted U.S. tax legislation, as well as future U.S. tax legislation, may adversely affect our business, results of operations, financial condition and cash flow.
The Tax Cuts and Jobs Act (the “Tax Act”) was enacted on December 22, 2017, which made significant changes to U.S. federal income tax laws. The Tax Act made broad and complex changes to the U.S. tax code which impact 2017 and 2018 and includes, among other things, reducing the U.S. corporate income tax rate to 21%, partially limits the deductibility of business interest expense and net operating losses, limits the deductibility for certain types of executive compensation, and allows the immediate deduction of certain new investments instead of deductions for depreciation expense over time. Although we have estimated the impact of the newly enacted tax legislation by incorporating assumptions based upon our current
27
interpretation and analysis to date, the Tax Act is complex and far-reaching and we have not completed our analysis of the actual impact of its enactment on us. The provisional estimates may be impacted by the need for further analysis of the Tax Act which could have an adverse effect on our business, results of operations, financial condition and cash flow.
Risks Relating to Ownership of Our Common Stock or Warrants
Our certificate of incorporation and bylaws, as well as Delaware law, contain provisions that could discourage acquisition bids or merger proposals, which may adversely affect the market price of our common stock.
Our certificate of incorporation authorizes our board of directors to issue preferred stock without stockholder approval. If our board of directors elects to issue preferred stock, it could be more difficult for a third party to acquire us. In addition, some provisions in our certificate of incorporation and bylaws could make it more difficult for a third party to acquire control of us, even if the change of control would be beneficial to our stockholders, including:
•a classified board of directors, so that only approximately one third of our directors are elected each year;
•limitations on the removal of directors;
•the prohibition of stockholder action by written consent;
•limitations on the ability of our stockholders to call special meetings; and
• | advance notice provisions for stockholder proposals and nominations for elections to the board of directors to be acted upon at meetings of stockholders. |
Delaware law prohibits us from engaging in any business combination with any “interested stockholder,” meaning generally that a stockholder who beneficially owns more than 15% of our stock cannot acquire us for a period of three years from the date this person became an interested stockholder, unless various conditions are met, such as approval of the transaction by our board of directors.
Because we have no plans to pay dividends on our common stock, investors must look solely to stock appreciation for a return on their investment in us.
We do not anticipate paying any cash dividends on our common stock in the foreseeable future. We currently intend to retain all future earnings to fund the development and growth of our business. Any payment of future dividends will be at the discretion of our board of directors and will depend on, among other things, our earnings, financial condition, capital requirements, level of indebtedness, statutory and contractual restrictions applying to the payment of dividends and other considerations that the board of directors deems relevant. Investors must rely on sales of their common stock after price appreciation, which may never occur, as the only way to realize a return on their investment. Investors seeking cash dividends should not purchase our common stock.
Our outstanding warrants are exercisable for shares of our common stock. The exercise of such equity instruments could have a dilutive effect to stockholders of the Company.
We currently have outstanding warrants that are exercisable into 2,066,627 shares of our common stock at an initial exercise price of $55.25 per warrant. The exercise of these warrants into our common stock could have a dilutive effect to the holdings of our existing stockholders. The warrants will not expire until December 23, 2023 and may create an overhang on the market for, and have a negative effect on the market price of, our common stock.
There is no guarantee that our outstanding warrants will become in the money, and unexercised warrants may expire worthless. Further, the terms of such warrants may be amended.
As long as our stock price is below $55.25 per share, the warrants will have limited economic value, and they may expire worthless. In addition, the warrant agreement provides that the terms of the warrants may be amended without the consent of any holder to cure any ambiguity or correct any defective provision, but requires the approval by the holders of at least a certain percentage of the then-outstanding warrants originally issued to make any change that adversely affects the interests of the holders. Accordingly, we may amend the terms of the warrants in a manner adverse to a holder if holders of at least a certain percentage of the then outstanding warrants approve of such amendment.
Future sales or the availability for sale of substantial amounts of our common stock, or the perception that these sales may occur, could adversely affect the trading price of our common stock and could impair our ability to raise capital through future sales of equity securities.
Our Second Amended and Restated Certificate of Incorporation authorizes us to issue 80,000,000 shares of common stock, of which an estimated 26,416,209 shares of common stock were outstanding as of February 28, 2018. This number
28
includes shares issued in connection with our emergence from bankruptcy, almost all of which are freely transferable without restriction or further registration pursuant to Section 1145 of the Bankruptcy Code. We also have 2,428,255 shares of common stock authorized for issuance as equity awards under the Basic Energy Services, Inc. Management Incentive Plan and Non-Employee Director Incentive Plan, respectively. As of February 28, 2018, 654,016 shares are issuable pursuant to outstanding options and 282,190 shares are issuable pursuant to outstanding restricted stock and restricted stock unit awards.
A large percentage of our shares of common stock are held by a relatively small number of investors. We entered into a registration rights agreement, (the “Registration Rights Agreement”) with certain of those investors pursuant to which we filed a registration statement with the SEC to facilitate potential future sales of such shares by them. Sales of a substantial number of shares of our common stock in the public markets, or even the perception that these sales might occur, could impair our ability to raise capital through a future sale of, or pay for acquisitions using, our equity securities and may adversely affect the trading price of our common stock.
We may issue shares of our common stock or other securities from time to time as consideration for future acquisitions and investments. If any such acquisition or investment is significant, the number of shares of our common stock, or the number or aggregate principal amount, as the case may be, of other securities that we may issue may in turn be substantial. We may also grant registration rights covering those shares of our common stock or other securities in connection with any such acquisitions and investments.
We cannot predict the effect that future sales of our common stock will have on the price at which our common stock trades or the size of future issuances of our common stock or the effect, if any, that future issuances will have on the market price of our common stock. Sales of substantial amounts of our common stock, or the perception that such sales could occur, may adversely affect the trading price of our common stock.
ITEM 1B. UNRESOLVED STAFF COMMENTS
None.
ITEM 3. LEGAL PROCEEDINGS
From time to time, Basic is a party to litigation or other legal proceedings that Basic considers to be a part of the ordinary course of business. Basic is not currently involved in any legal proceedings that it considers probable or reasonably possible, individually or in the aggregate, to result in a material adverse effect on its financial condition, results of operations or liquidity. The information regarding litigation and environmental matters described in Note 7. Commitments and Contingencies, of the notes to our audited consolidated financial statements included in this Annual Report on Form 10-K is incorporated herein by reference.
ITEM 4. MINE SAFETY DISCLOSURES
Not applicable.
PART II
ITEM 5. MARKET FOR REGISTRANT’S COMMON EQUITY, RELATED STOCKHOLDER MATTERS AND ISSUER PURCHASES OF EQUITY SECURITIES
Market Price for Registrant’s Common Equity
On October 25, 2016, Basic filed voluntary petitions for relief under Chapter 11 of the U.S. Bankruptcy Code in the United States Bankruptcy. Basic emerged from Chapter 11 on December 23, 2016 (the “Effective Date”). On the Effective Date, all of the outstanding common stock (“Predecessor Common Stock”) and all other outstanding equity securities of Basic, including all options, were cancelled pursuant to the terms of the Prepackaged Plan and Basic issued 26,095,431 shares of new common stock (“Common Stock”) to unsecured holders of debt, holders of equity interests, and certain members of management, subject to the bankruptcy proceedings. At February 28, 2018, 26,416,209 shares were outstanding. Because the value of one share of Common Stock bears no relation to the value of one share of Predecessor Common Stock (a new equity value was established upon emergence) the following discussions contain information regarding Common Stock.
Market Information - Our Common Stock trades on the New York Stock Exchange (“NYSE”) under the symbol “BAS.” The stock began trading on the NYSE on December 27, 2016, in conjunction with our emergence from Chapter 11 proceedings.
29
High | Low | |||||||
Predecessor common stock: | ||||||||
2016: | ||||||||
First Quarter | $ | 3.59 | $ | 1.63 | ||||
Second Quarter | $ | 3.20 | $ | 1.46 | ||||
Third Quarter | $ | 1.67 | $ | 0.37 | ||||
Fourth Quarter October 1 - December 23 | $ | 0.83 | $ | 0.32 | ||||
Successor common stock: | ||||||||
Fourth Quarter December 24 - December 31 | $ | 44.75 | $ | 29.36 | ||||
2017: | ||||||||
First Quarter | $ | 44.50 | $ | 30.31 | ||||
Second Quarter | $ | 34.93 | $ | 20.66 | ||||
Third Quarter | $ | 29.01 | $ | 14.19 | ||||
Fourth Quarter | $ | 25.22 | $ | 15.71 | ||||
As of February 28, 2018, we had 26,416,209 shares of common stock outstanding held by approximately 124 record holders.
We have not declared or paid any cash dividends on our common stock, and we do not currently anticipate paying any cash dividends on our common stock in the foreseeable future. We currently intend to retain all future earnings to fund the development and growth of our business. Any future determination relating to our dividend policy will be at the discretion of our board of directors and will depend on our results of operations, financial condition, capital requirements and other factors deemed relevant by our board.
Securities Authorized for Issuance under Equity Compensation Plans
The following table provides information regarding options or warrants and rights authorized for issuance under our equity compensation plans as of December 31, 2017:
Plan Category | Number of Securities to be Issued upon Exercise of Outstanding Options, Warrants and Rights (a) (2) | Weighted Average Exercise Price of Outstanding Options Warrants and Rights (b)(3) | Number of Securities Remaining Available for Future Issuance Under Equity Compensation Plans (excluding Securities Reflected in Column (a)) (c)(4) | |||||||
Equity compensation plans approved by security holders (1) | 1,644,705 | $ | 36.55 | 1,326,156 | ||||||
Equity compensation plans not approved by security holders | — | — | — | |||||||
Total | 1,644,705 | $ | 36.55 | 1,326,156 | ||||||
(1) Represent shares of Common Stock issuable under the Basic Energy Services, Inc. Management Incentive Plan (the “MIP”), effective as of December 23, 2016.
(2) Includes 544,997 shares of Common Stock that may be issued upon the vesting of stock options and 1,099,708 shares that may be issued upon vesting of restricted stock units (“RSUs”).
(3) RSUs do not have an exercise price; accordingly, RSUs are excluded from the weighted average exercise price of outstanding awards.
(4) Represents the number of shares of Common Stock remaining available for grant under the MIP as of December 31, 2017. If any Common Stock underlying an unvested award is cancelled, forfeited or is otherwise terminated without delivery of shares, then such shares will again be available for issuance under the MIP.
30
Issuer Purchases of Equity Securities
The following table provides information relating to our repurchase of shares of common stock during the three months ended December 31, 2017 (dollars in thousands, except average price paid per share):
Issuer Purchases of Equity Securities | |||||
Total Number of | Average Price Paid | ||||
Period | Shares Purchased (1) | Per Share | |||
2016 | |||||
December 24 — December 31 (1) | 96,587 | $ | 36.00 | ||
Total | 96,587 | $ | 36.00 | ||
2017 | |||||
October 1 - October 31 | — | $ | — | ||
November 1 - November 30 | — | $ | — | ||
December 1 - December 31 (1) | 84,222 | $ | 23.71 | ||
Total | 84,222 | $ | 23.71 | ||
(1) “Total Number of Shares Purchased” were repurchased from various employees to provide such employees the cash amounts necessary to pay certain tax liabilities associated with the vesting of restricted shares and RSUs owned by them. The shares were repurchased on various dates based on the closing price per share on the date of repurchase. The repurchased shares were issued under the Basic Energy Services, Inc. Management Incentive Plan, effective as of December 23, 2016.
Performance Data
The following is a line graph comparing cumulative, total shareholder return for Common Stock for the period from December 31, 2016 to December 31, 2017 with (i) a general market index (the Russell 2000 Index) and (ii) a group of peers selected by the Company in the same line of business or industry as the Company. The peer group is comprised of the following companies: Key Energy Services, Inc., Nabors Industries Ltd. and Pioneer Energy Services Corp.
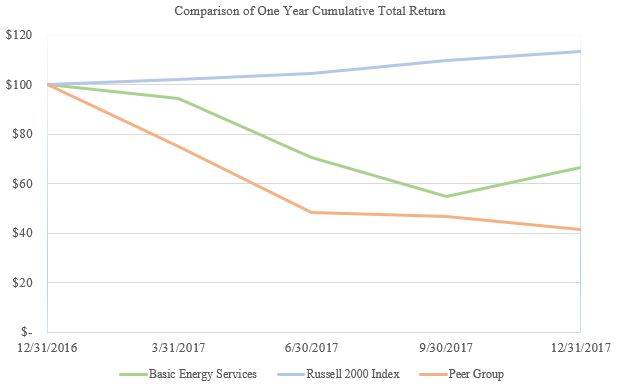
31
Value of $100 Invested at December 31, 2016, March 31, 2017,
June 30, 2017, September 30, 2017 and December 31, 2017
T
Basic Energy Services | Russell 2000 Index | Peer Group | ||||||||||
December 31, 2016 | $ | 100.00 | $ | 100.00 | $ | 100.00 | ||||||
March 31, 2017 | $ | 94.37 | $ | 102.12 | $ | 75.03 | ||||||
June 30, 2017 | $ | 70.44 | $ | 104.29 | $ | 48.24 | ||||||
September 30, 2017 | $ | 54.60 | $ | 109.85 | $ | 46.82 | ||||||
December 31, 2017 | $ | 66.39 | $ | 113.14 | $ | 41.36 | ||||||
The foregoing table is based on historical data and is not necessarily indicative of future performance. This graph shall not be deemed to be "soliciting material" or to be "filed" with the SEC or subject to the Regulations 14A or 14C under the Securities Exchange Act of 1934, as amended, or to the liabilities of Section 18 under such Act.
32
ITEM 6. SELECTED FINANCIAL DATA
The following table sets forth selected consolidated financial information regarding our results of operations, balance sheets and certain ratios. As detailed in Item 7. Management’s Discussion and Analysis of Financial Condition and Results of Operations, upon emergence from bankruptcy on the Effective Date of December 23, 2016, Basic adopted fresh start accounting, which results in data subsequent to adoption not being comparable to data in periods prior to the Effective Date. Therefore, balances for Basic at December 31, 2016 are presented separately. Operating data for the years ended December 31, 2016 through 2013 represent amounts for Predecessor Basic. The data presented below is explained further in, and should be read in conjunction with, Item 7. Management’s Discussion and Analysis of Financial Condition and Results of Operations and Item 7A. Quantitative and Qualitative Disclosures about Market Risk and Item 8. Financial Statements and Supplementary Data.
33
Successor | Predecessor | ||||||||||||||||||||
Year Ended December 31, | |||||||||||||||||||||
2017 | 2016 | 2015 | 2014 | 2013 | |||||||||||||||||
(Dollars in thousands, except per share data) | |||||||||||||||||||||
Statement of Operations Data: | |||||||||||||||||||||
Revenues: | |||||||||||||||||||||
Completion and remedial services | $ | 433,450 | $ | 184,567 | $ | 307,550 | $ | 698,917 | $ | 501,137 | |||||||||||
Well servicing | 210,811 | 163,966 | 217,245 | 361,683 | 363,386 | ||||||||||||||||
Fluid services | 208,784 | 191,725 | 258,597 | 369,774 | 343,863 | ||||||||||||||||
Contract drilling | 10,996 | 7,239 | 22,207 | 60,910 | 54,518 | ||||||||||||||||
Total revenues | 864,041 | 547,497 | 805,599 | 1,491,284 | 1,262,904 | ||||||||||||||||
Expenses: | |||||||||||||||||||||
Completion and remedial services | 318,191 | 158,762 | 245,069 | 434,457 | 327,540 | ||||||||||||||||
Well servicing | 169,905 | 140,274 | 184,952 | 270,344 | 265,058 | ||||||||||||||||
Fluid services | 168,621 | 161,535 | 196,155 | 265,105 | 239,154 | ||||||||||||||||
Contract drilling | 9,733 | 7,079 | 16,680 | 41,513 | 36,336 | ||||||||||||||||
General and administrative (a) | 146,458 | 135,331 | 143,458 | 167,301 | 171,439 | ||||||||||||||||
Depreciation and amortization | 112,209 | 218,205 | 241,471 | 217,480 | 209,747 | ||||||||||||||||
Loss on disposal of assets | 274 | 1,014 | 1,602 | 1,974 | 2,873 | ||||||||||||||||
Restructuring Costs | — | 20,743 | — | — | — | ||||||||||||||||
Goodwill impairment | — | 646 | 81,877 | 34,703 | — | ||||||||||||||||
Total expenses | 925,391 | 843,589 | 1,111,264 | 1,432,877 | 1,252,147 | ||||||||||||||||
Operating (loss) income | (61,350 | ) | (296,092 | ) | (305,665 | ) | 58,407 | 10,757 | |||||||||||||
Reorganization items, net | — | 264,306 | — | — | — | ||||||||||||||||
Net interest expense | (37,421 | ) | (96,599 | ) | (67,938 | ) | (67,002 | ) | (67,154 | ) | |||||||||||
Bargain purchase gain | — | 662 | — | — | — | ||||||||||||||||
Other income | 419 | 467 | 528 | 775 | 743 | ||||||||||||||||
Loss before income taxes | (98,352 | ) | (127,256 | ) | (373,075 | ) | (7,820 | ) | (55,654 | ) | |||||||||||
Income tax benefit (expense) | 1,678 | 3,883 | 131,330 | (521 | ) | 19,725 | |||||||||||||||
Net Loss | $ | (96,674 | ) | $ | (123,373 | ) | $ | (241,745 | ) | $ | (8,341 | ) | (35,929 | ) | |||||||
Basic loss per share of common stock: | $ | (3.72 | ) | $ | (2.94 | ) | $ | (5.97 | ) | $ | (0.20 | ) | $ | (0.89 | ) | ||||||
Diluted loss per share of common stock: | $ | (3.72 | ) | $ | (2.94 | ) | $ | (5.97 | ) | $ | (0.20 | ) | $ | (0.89 | ) | ||||||
Other Financial Data: | |||||||||||||||||||||
Cash flows provided by (used in) operating activities | $ | 25,947 | $ | (151,489 | ) | $ | 95,539 | $ | 224,536 | $ | 165,588 | ||||||||||
Cash flows used in investing activities | (53,547 | ) | (29,405 | ) | (62,489 | ) | (213,429 | ) | (139,686 | ) | |||||||||||
Cash flows provided by (used in) financing activities | (32,755 | ) | 233,037 | (66,233 | ) | (42,724 | ) | (48,935 | ) | ||||||||||||
Capital expenditures: | |||||||||||||||||||||
Acquisitions, net of cash acquired | — | — | 7,914 | 16,090 | 21,467 | ||||||||||||||||
Property and equipment, excluding capital leases | (63,361 | ) | 32,689 | 53,868 | 236,295 | 136,950 | |||||||||||||||
(a) Includes approximately $22,954, $17,675, $13,728, $14,714, and $11,830 of non-cash stock compensation expense for the years ended December 31, 2017, 2016, 2015, 2014, and 2013, respectively. | |||||||||||||||||||||
Successor | Predecessor | ||||||||||||||||||||
As of December 31, | As of December 31, | ||||||||||||||||||||
2017 | 2016 | 2015 | 2014 | 2013 | |||||||||||||||||
Balance Sheet Data: | |||||||||||||||||||||
Cash and cash equivalents | $ | 38,520 | $ | 98,875 | $ | 46,732 | $ | 79,915 | $ | 111,532 | |||||||||||
Property and equipment, net | 502,579 | 488,848 | 846,290 | 1,007,969 | 928,037 | ||||||||||||||||
Total assets | 820,480 | 768,160 | 1,161,369 | 1,597,177 | 1,543,339 | ||||||||||||||||
Long-term debt | 259,242 | 184,752 | 838,368 | 882,572 | 846,691 | ||||||||||||||||
Stockholders' equity | 338,653 | 414,408 | 106,338 | 342,653 | 345,287 | ||||||||||||||||
34
ITEM 7. MANAGEMENT’S DISCUSSION AND ANALYSIS OF FINANCIAL CONDITION AND RESULTS OF OPERATIONS
Management’s Overview
We provide a wide range of well site services to oil and natural gas drilling and producing companies, including completion and remedial services, well servicing, water logistics and contract drilling. Our emergence from bankruptcy, and various market fluctuations, may make our revenues, expenses and income not directly comparable between periods. Our hydraulic horsepower capacity for pumping services increased from 443,000 at January 1, 2015 to 523,000 at December 31, 2017. Our weighted average number of fluid service trucks decreased from 1,046 in the first quarter of 2015 to 967 in the fourth quarter of 2017. Our weighted average number of well servicing rigs remained constant at 421 from the first quarter of 2015 to the fourth quarter of 2017, and totaled 310 as of December 31, 2017, as we retired 111 rigs in the fourth quarter. Our weighted average number of drilling rigs decreased from 12 in the first quarter of 2015 to 11 in the fourth quarter of 2017.
Our operating revenues from each of our segments, and their relative percentages of our total revenues, consisted of the following (dollars in millions):
Year Ended December 31, | |||||||||||||||||||||
2017 | 2016 | 2015 | |||||||||||||||||||
Revenues: | |||||||||||||||||||||
Completion and remedial services | $ | 433.5 | 50 | % | $ | 184.6 | 34 | % | $ | 307.6 | 38 | % | |||||||||
Well servicing | 210.8 | 24 | % | 164.0 | 30 | % | 217.2 | 27 | % | ||||||||||||
Water logistics | 208.8 | 24 | % | 191.7 | 35 | % | 258.6 | 32 | % | ||||||||||||
Contract drilling | 11.0 | 2 | % | 7.2 | 1 | % | 22.2 | 3 | % | ||||||||||||
Total revenues | $ | 864.1 | 100 | % | $ | 547.5 | 100 | % | $ | 805.6 | 100 | % | |||||||||
Our core businesses depend on our customers’ willingness to make expenditures to produce, develop and explore for oil and natural gas in the United States. Industry conditions are influenced by numerous factors, such as the supply of and demand for oil and natural gas, domestic and worldwide economic conditions, political instability in oil producing countries and merger and divestiture activity among oil and natural gas producers. The volatility of the oil and natural gas industry, and the consequent impact on exploration and production activity, has adversely impacted the level of drilling and workover activity by some of our customers, and in turn, the market for our services. In addition, the discovery rate of new oil and natural gas reserves in our market areas also may have an impact on our business, even in an environment of stronger oil and natural gas prices. For a more comprehensive discussion of our industry trends, see “General Industry Overview” included in Items 1 and 2, Business and Properties, of this Annual Report on Form 10-K.
We derive a majority of our revenues from services supporting production from existing oil and natural gas operations. Demand for these production-related services, including well servicing and water logistics, tends to remain relatively stable, even in moderate oil and natural gas price environments, as ongoing maintenance spending is required to sustain production. As oil and natural gas prices reach higher levels, demand for all of our services generally increases as our customers engage in more well servicing activities relating to existing wells to maintain or increase oil and natural gas production from those wells. Because our services are required to support drilling and workover activities, our revenues will vary based on changes in capital spending by our customers as oil and natural gas prices increase or decrease.
Oil prices dropped off in the fourth quarter of 2014 and continued to decline throughout 2015 and stayed low all throughout 2016. Oil prices increased gradually in the fourth quarter of 2016 and throughout 2017, upon decisions by Saudi Arabia and OPEC to limit production. We anticipate our customer base to gradually increase their 2018 capital programs and, as a result, expect higher activity levels and pricing in 2018.
We will continue to evaluate opportunities to expand our business through selective acquisitions and internal growth initiatives. Our capital investment decisions are determined by an analysis of the projected return on capital employed of each of those alternatives, which is substantially driven by the cost to acquire existing assets from a third party, the capital required to build new equipment and the point in the oil and natural gas commodity price cycle. Based on these factors, we make capital investment decisions that we believe will support our long-term growth strategy. While we believe our costs of integration for prior acquisitions have been reflected in our historical results of operations, integration of acquisitions may result in unforeseen operational difficulties or require a disproportionate amount of our management’s attention.
We believe the most important performance measures for our business segments are as follows:
35
•Completion and Remedial Services — segment profits as a percent of revenues;
• | Well Servicing — rig hours, rig utilization rate, revenue per rig hour, profits per rig hour and segment profits as a percent of revenues; |
• | Water Logistics — trucking hours, revenue per truck, segment profits per truck and segment profits as a percent of revenues; and |
• | Contract Drilling — rig operating days, revenue per drilling day, profits per drilling day and segment profits as a percent of revenues. |
Segment profits are computed as segment operating revenues less direct operating costs. These measurements provide important information to us about the activity and profitability of our lines of business. For a detailed analysis of these indicators for our company, see “Segment Overview” below.
Recent Strategic Acquisitions and Expansions
During the period from 2015 through 2017, we grew through acquisitions and capital expenditures. We completed three acquisitions in 2015 none of which were considered significant.
Segment Overview
Completion and Remedial Services
In 2017, our completion and remedial services segment represented 50% of our revenues. Revenues from our completion and remedial services segment are derived from a variety of services designed to stimulate oil and natural gas production or place cement slurry within the wellbores. Our completion and remedial services segment includes pumping services, rental and fishing tool operations, coiled tubing services, nitrogen services, snubbing and underbalanced drilling.
Our pumping services concentrate on providing single truck, lower-horsepower cementing and acidizing services, as well as various fracturing services in selected markets. Our total hydraulic horsepower capacity for our pumping services was approximately 523,000 horsepower at December 31, 2017 and 444,000 horsepower at December 31, 2016.
Our rental and fishing tool business operates 16 rental and fishing tool stores in selected markets as of December 31, 2017.
Our snubbing services operate 36 units throughout our geographic footprint as of December 31, 2017.
We have operations in the wireline, coiled tubing services, nitrogen services, water treatment and the underbalanced drilling services businesses. For a description of our wireline, coiled tubing services, nitrogen services, water treatment, and snubbing operations, please read “Overview of Our Segments and Services — Completion and Remedial Services Segment” included in Items 1 and 2, Business and Properties, of this Annual Report on Form 10-K.
In this segment, we derive our revenues on a project-by-project basis in a competitive bidding process. Our bids are based on the amount and type of equipment and personnel required, with the materials consumed billed separately. During periods of decreased spending by oil and gas companies, we may be required to discount our rates to remain competitive, which would cause lower segment profits.
36
The following is an analysis of our completion and remedial services segment for each of the quarters and years in the years ended December 31, 2017, 2016 and 2015 (dollars in thousands):
Total | Frac | Segment | ||||||
Completion & Remedial | HHP | HHP | Revenues | Profits % | ||||
2015 (Predecessor): | ||||||||
First Quarter | 441,145 | 360,350 | $112,775 | 28% | ||||
Second Quarter | 442,165 | 360,350 | $69,055 | 17% | ||||
Third Quarter | 443,465 | 357,650 | $67,240 | 16% | ||||
Fourth Quarter | 443,465 | 357,650 | $58,479 | 15% | ||||
Full Year | 443,465 | 357,650 | $307,550 | 20% | ||||
2016 (Predecessor): | ||||||||
First Quarter | 443,645 | 357,650 | $39,696 | 12% | ||||
Second Quarter | 443,645 | 357,650 | $36,228 | 9% | ||||
Third Quarter | 443,320 | 356,900 | $49,424 | 18% | ||||
Fourth Quarter | 443,320 | 356,900 | $59,219 | 14% | ||||
Full Year | 443,320 | 356,900 | $184,567 | 14% | ||||
2017 (Successor): | ||||||||
First Quarter | 443,320 | 356,900 | $80,431 | 16% | ||||
Second Quarter | 518,365 | 381,850 | $107,386 | 24% | ||||
Third Quarter | 522,565 | 413,300 | $123,650 | 32% | ||||
Fourth Quarter | 522,565 | 413,300 | $121,983 | 30% | ||||
Full Year | 522,565 | 413,300 | $433,450 | 27% | ||||
We gauge the performance of our completion and remedial services segment based on the segment’s total horsepower, frac horsepower, operating revenues and segment profits as a percent of revenues.
Well Servicing
In 2017, our well servicing segment represented 24% of our revenues. Revenue in our well servicing segment is derived from maintenance, workover, completion and plugging and abandonment services, as well as rig manufacturing operations. We provide maintenance-related services as part of the normal, periodic upkeep of producing oil and natural gas wells. Maintenance-related services represent a relatively consistent component of our business. Workover and completion services generate more revenue per hour than maintenance work due to the use of auxiliary equipment, but demand for workover and completion services fluctuates more with the overall activity level in the industry.
We typically charge our well servicing rig customers for services on an hourly basis at rates that are determined by the type of service and equipment required, market conditions in the region in which the rig operates, the ancillary equipment provided on the rig and the necessary personnel. We measure the activity level of our well servicing rigs on a weekly basis by calculating a rig utilization rate based on a 55-hour work week per rig.
We acquired our rig manufacturing business in May 2010. We manufacture workover rigs for internal purposes as well as to sell to outside companies. Our rig manufacturing operation also performs large scale refurbishments and maintenance services to used workover rigs.
37
The following is an analysis of our well servicing segment for each of the quarters and years in the years ended December 31, 2017, 2016 and 2015. The revenue per rig hour does not include revenues associated with rig manufacturing operations:
Weighted Average | Rig | Revenue | Profits | ||||||||||
Number of | Rig | Utilization | Per Rig | Per Rig | Segment | ||||||||
Well Service | Rigs | Hours | Rate | Hour | Hour | Profits % | |||||||
2015 (Predecessor): | |||||||||||||
First Quarter | 421 | 163,900 | 55% | $377 | $69 | 18% | |||||||
Second Quarter | 421 | 154,700 | 51% | $351 | $61 | 17% | |||||||
Third Quarter | 421 | 154,100 | 50% | $334 | $50 | 14% | |||||||
Fourth Quarter | 421 | 120,000 | 39% | $324 | $33 | 9% | |||||||
Full Year | 421 | 592,700 | 49% | $348 | $54 | 15% | |||||||
2016 (Predecessor): | |||||||||||||
First Quarter | 421 | 108,400 | 36% | $321 | $44 | 11% | |||||||
Second Quarter | 421 | 113,700 | 38% | $308 | $44 | 14% | |||||||
Third Quarter | 421 | 136,600 | 45% | $313 | $60 | 19% | |||||||
Fourth Quarter | 421 | 146,200 | 49% | $300 | $43 | 14% | |||||||
Full Year | 421 | 504,900 | 42% | $310 | $47 | 14% | |||||||
2017 (Successor): | |||||||||||||
First Quarter | 421 | 157,600 | 52% | $307 | $49 | 16% | |||||||
Second Quarter | 421 | 162,300 | 54% | $321 | $69 | 21% | |||||||
Third Quarter | 421 | 165,200 | 55% | $329 | $69 | 21% | |||||||
Fourth Quarter | 421 | 159,500 | 53% | $339 | $63 | 19% | |||||||
Full Year | 421 | 644,600 | 54% | $324 | $63 | 19% | |||||||
On December 31, 2017, we classified 111 rigs from our current fleet as "cold-stacked", reducing our total active rig fleet to 310 rigs, and removed these rigs from the active rig count. these cold-stacked rigs will ultimately be retired and disposed of in an orderly fashion.
We gauge activity levels and profitability in our well servicing rig operations based on rig hours, rig utilization rate, revenue per rig hour, profits per rig hour and segment profits as a percent of revenues.
Water Logistics
In 2017, our water logistics segment represented 24% of our revenues. Revenues in our water logistics segment are earned from the sale, transportation, pipelining, storage and disposal of fluids used in the drilling, production and maintenance of oil and natural gas wells. Revenues also include water treatment, well site construction and maintenance services. The water logistics segment has a base level of business consisting of transporting and disposing of salt water produced as a by-product of the production of oil and natural gas. These services are necessary for our customers and have a stable demand but typically produce lower relative segment profits than other parts of our water logistics segment. Water logistics for completion and workover projects typically require fresh or brine water for making drilling mud, circulating fluids or fracturing fluids used during a job, and all of these fluids require storage tanks and hauling and disposal. Because we can provide a full complement of fluid sales, trucking, storage and disposal required on most drilling and workover projects, the add-on services associated with drilling and workover activity enable us to generate higher segment profits. The higher segment profits are due to the relatively small incremental labor costs associated with providing these services in addition to our base water logistics operations. Revenues from our well site construction services are derived primarily from preparing and maintaining access roads and well locations, installing small diameter gathering lines and pipelines, constructing foundations to support drilling rigs and providing maintenance services for oil and natural gas facilities. Revenue from water treatment services results from the treatment and reselling of produced water and flowback to customers for the purposes of reusing as fracturing water. We typically price fluid services by the job, by the hour or by the quantities sold, disposed of or hauled.
38
The following is an analysis of our water logistics segment for each of the quarters and years in the years ended December 31, 2017, 2016 and 2015 (dollars in thousands):
Weighted Average | Revenue Per | Segment Profits | ||||||||
Number of Fluid | Fluid Service | Per Fluid | Segment | |||||||
Water Logistics | Service Trucks | Truck Hours | Truck | Service Truck | Profits % | |||||
2015 (Predecessor): | ||||||||||
First Quarter | 1,046 | 595,100 | $71 | $19 | 27% | |||||
Second Quarter | 1,011 | 573,700 | $63 | $15 | 24% | |||||
Third Quarter | 1,012 | 565,400 | $62 | $15 | 24% | |||||
Fourth Quarter | 1,002 | 557,000 | $58 | $12 | 21% | |||||
Full Year | 1,018 | 2,291,200 | $254 | $61 | 24% | |||||
2016 (Predecessor): | ||||||||||
First Quarter | 985 | 521,500 | $51 | $10 | 18% | |||||
Second Quarter | 976 | 474,400 | $47 | $7 | 15% | |||||
Third Quarter | 962 | 499,900 | $49 | $8 | 17% | |||||
Fourth Quarter | 944 | 503,200 | $52 | $7 | 13% | |||||
Full Year | 966 | 1,999,000 | $199 | $31 | 16% | |||||
2017 (Successor): | ||||||||||
First Quarter | 935 | 484,300 | $54 | $9 | 17% | |||||
Second Quarter | 943 | 473,500 | $54 | $10 | 18% | |||||
Third Quarter | 947 | 483,300 | $55 | $12 | 21% | |||||
Fourth Quarter | 967 | 492,800 | $57 | $12 | 20% | |||||
Full Year | 948 | 1,933,900 | $220 | $42 | 19% | |||||
We gauge activity levels and profitability in our water logistics segment based on trucking hours, revenue per fluid service truck, segment profits per fluid service truck and segment profits as a percent of revenues.
Contract Drilling
In 2017, our contract drilling segment represented 2% of our revenues. Revenues from our contract drilling segment are derived primarily from the drilling of new wells.
Within this segment, we typically charge our drilling rig customers a daily rate or a rate based on footage at an established rate per number of feet drilled. Depending on the type of job, we may also charge by the project. We measure the activity level of our drilling rigs on a weekly basis by calculating a rig utilization rate based on a seven-day work week per rig.
39
The following is an analysis of our contract drilling segment for each of the quarters and years in the years ended December 31, 2017, 2016 and 2015:
Weighted Average | Rig | Profits | ||||||||
Number | Operating | Revenue | (Loss) | Segment | ||||||
Contract Drilling | of Rigs | Days | Per Day | Per Day | Profits % | |||||
2015 (Predecessor): | ||||||||||
First Quarter | 12 | 674 | $17,000 | $5,900 | 34% | |||||
Second Quarter | 12 | 280 | $15,500 | $3,000 | 20% | |||||
Third Quarter | 12 | 252 | $15,300 | $2,600 | 17% | |||||
Fourth Quarter | 12 | 155 | $16,500 | $400 | 3% | |||||
Full Year | 12 | 1,361 | $16,300 | $4,000 | 25% | |||||
2016 (Predecessor): | ||||||||||
First Quarter | 12 | 91 | $16,500 | ($600) | (4)% | |||||
Second Quarter | 12 | 91 | $16,100 | $1,000 | 6% | |||||
Third Quarter | 12 | 92 | $20,100 | $1,800 | 9% | |||||
Fourth Quarter | 12 | 139 | $17,500 | $800 | (2)% | |||||
Full Year | 12 | 413 | $17,500 | $800 | 2% | |||||
2017 (Successor): | ||||||||||
First Quarter | 12 | 135 | $20,500 | $2,600 | 12% | |||||
Second Quarter | 11 | 91 | $23,300 | $2,800 | 12% | |||||
Third Quarter | 11 | 92 | $31,000 | $3,300 | 11% | |||||
Fourth Quarter | 11 | 139 | $23,500 | $2,500 | 11% | |||||
Full Year | 11 | 457 | $24,100 | $2,800 | 11% | |||||
We gauge activity levels and profitability in our drilling operations based on rig operating days, revenue per drilling day, profits per drilling day and segment profits as a percent of revenues.
Operating Cost Overview
Our operating costs are comprised primarily of labor costs, including workers’ compensation and health insurance, repair and maintenance, fuel and insurance. A majority of our employees are paid on an hourly basis. We also employ personnel to supervise our activities, sell our services and perform maintenance on our fleet. These costs are not directly tied to our level of business activity. Repair and maintenance is performed by our crews, company maintenance personnel and outside service providers. Insurance is generally a fixed cost regardless of utilization and can vary depending on the number of rigs, trucks and other equipment in our fleet, as well as employee payroll, and our safety record. Compensation for administrative personnel in local operating yards and our corporate office is accounted for as general and administrative expenses.
Critical Accounting Policies and Estimates
Our consolidated financial statements are impacted by the accounting policies used and the estimates and assumptions made by management during their preparation. We have identified below accounting policies that are of particular importance in the presentation of our financial position, results of operations and cash flows and which require the application of significant judgment by management. A complete summary of these policies is included in Note 3. Summary of Significant Accounting Policies of the notes to our consolidated financial statements.
Critical Accounting Policies
Property and Equipment. Property and equipment are stated at cost, or at estimated fair value at acquisition date if acquired in a business combination. Expenditures for repairs and maintenance are charged to expense as incurred. We also review the capitalization of refurbishment of workover rigs as described in Note 3. Summary of Significant Accounting Policies of the notes to our consolidated financial statements.
Impairments. We review our assets including tangible assets, intangible assets and goodwill, for impairment when, in management’s judgment, events or changes in circumstances indicate that the carrying amount of a long-lived asset may not be recovered over its remaining service life. Impairment is indicated when the sum of the estimated future cash flows, on an
40
undiscounted basis, is less than the asset’s carrying amount. When impairment is identified and fair value is less than carrying value, an impairment charge is recorded to income based on an estimate of future cash flows on a discounted basis.
Self-Insured Risk Accruals. We are self-insured up to retention limits with regard to workers’ compensation, general liability claims, and medical and dental coverage of our employees. We generally maintain no physical property damage coverage on our rig fleet, with the exception of certain rigs, newly manufactured rigs and pumping services equipment. We have deductibles per occurrence for workers’ compensation, auto & general liability claims, and medical and dental coverage of $5 million, $1 million, and $0.4 million, respectively. We maintain accruals in our consolidated balance sheets related to self-insurance retentions by using third-party actuarial data and claims history.
Revenue Recognition. We recognize revenues when the services are performed, collection of the relevant receivables is probable, persuasive evidence of the arrangement exists and the price is fixed and determinable. Rig manufacturing revenue is recognized by individual rig based on the completed contract method.
Income Taxes. We recognize deferred tax assets and liabilities for the future tax consequences attributable to differences between the financial statement carrying amounts of existing assets and liabilities and their respective tax bases. Deferred tax assets and liabilities are measured using statutory tax rates expected to apply to taxable income in the years in which those temporary differences are expected to be recovered or settled. The effect on deferred tax assets and liabilities of a change in tax rate is recognized in the period that includes the statutory enactment date. A valuation allowance for deferred tax assets is recognized when it is more likely than not that the benefit of deferred tax assets will not be realized.
We record net deferred tax assets to the extent we believe these assets will be more likely more than not be realized. In making such determination, we consider all available positive and negative evidence, including future reversals of existing taxable temporary differences, projected future taxable income, tax planning strategies and recent financial operations. Based on this evaluation, as of December 31, 2017, a valuation allowance of approximately $146.3 million has been recorded on the net deferred tax assets for all federal and state tax jurisdictions in order to measure only the portion of the deferred tax asset that more likely than not will be realized. The valuation allowance is recognized as a result of the Company being in a cumulative three-year pre-tax book loss position and absence of other objectively verifiable positive evidence including reversal of existing taxable temporary differences in federal and state tax jurisdictions.
Critical Accounting Estimates
The preparation of our consolidated financial statements in conformity with accounting principles generally accepted in the United States of America (GAAP) requires management to make certain estimates and assumptions. These estimates and assumptions affect the reported amounts of assets and liabilities, the disclosure of contingent assets and liabilities at the balance sheet date and the amounts of revenues and expenses recognized during the reporting period. We analyze our estimates based on experience and various other assumptions that we believe to be reasonable under the circumstances. However, actual results could differ from such estimates. The following is a discussion of our critical accounting estimates.
Litigation and Self-Insured Risk Reserves. We estimate our reserves related to litigation and self-insured risk based on the facts and circumstances specific to the litigation and self-insured risk claims and our past experience with similar claims. The actual outcome of litigation and insured claims could differ significantly from estimated amounts. As discussed in “Self-Insured Risk Accruals” above with respect to our critical accounting policies, we maintain accruals on our balance sheet to cover self-insured retentions. These accruals are based on a third-party analysis developed using historical data to project future losses. Loss estimates in the calculation of these accruals are adjusted based upon reported claims and actual claim settlements.
Results of Operations
The results of operations between periods may not be comparable, primarily due to fluctuations in the oil and natural gas industry throughout 2017, 2016 and 2015 and to our adoption of fresh start accounting upon emergence from bankruptcy.
Year Ended December 31, 2017 Compared to Year Ended December 31, 2016
Revenues. Revenues increased by 58% to $864.0 million in 2017 from $547.5 million in 2016. This increase was primarily due to an increase in crude oil prices resulting in higher demand for our services by our customers, particularly from our completion and remedial services segment.
Completion and remedial services revenue increased by 135% to $433.5 million in 2017 as compared to $184.6 million in 2016. The increase in revenue between these periods was primarily due to improved coil tubing and fracturing
41
revenues driven by the overall increase in new well completion activity, as well as pricing improvements. Total hydraulic horsepower was approximately 523,000 at December 31, 2017 and 444,000 at December 31, 2016.
Well servicing revenues increased by 29% to $210.8 million in 2017 compared to $164.0 million in 2016. Rig utilization increased to 54% in 2017 from 42% during 2016, reflecting higher activity levels and the pricing improvements in oil-dominated operating areas. Our weighted average number of well servicing rigs remained constant at 421 during 2017 and 2016. We experienced an increase of 5% in revenue per rig hour to $324 during 2017 from $310 during 2016, due to pricing improvements driven by increased activity levels.
Water logistics revenue increased by 9% to $208.8 million in 2017 compared to $191.7 million in 2016. This increase was mainly due to an increase in utilization and pricing for our services. Revenue per fluid service truck increased 11% to $220,000 in 2017 compared to $199,000 in 2016, due to increased disposal activities and improved pricing. Our weighted average number of fluid service trucks decreased to 948 in 2017 from 966 in 2016.
Contract drilling revenues increased by 52% to $11.0 million in 2017 compared to $7.2 million in 2016. The increase was driven mainly by an increase in drilling activity, which caused an increase in rig operating days. The number of rig operating days increased to 457 in 2017 compared to 413 in 2016. The average revenue per rig day increased to $24,100 in 2017 from $17,500 in 2016, due to improved pricing and demand in 2017.
Direct Operating Expenses. Direct operating expenses, which primarily consist of labor costs, including workers’ compensation and health insurance, and maintenance and repair costs, increased by 43% to $666.5 million in 2017 from $467.7 million in 2016. This increase was due to the improved activity levels in all our segments.
Direct operating expenses for the completion and remedial services segment increased by 100% to $318.2 million in 2017 as compared to $158.8 million in 2016, due primarily to increased activity levels and headcount. Segment profits increased to 27% of revenues in 2017 compared to 14% in 2016, due to incremental margins on a higher revenue base in all operating areas as well as significant pricing improvements for our pressure pumping services.
Direct operating expenses for the well servicing segment increased by 21% to $169.9 million in 2017 as compared to $140.3 million in 2016, due primarily to increased personnel costs and improved demand for our services. Segment profits increased to 19% of revenues in 2017 from 14% in 2016, with pricing improvements and the impact of incremental margins on a higher revenue base in 2017.
Direct operating expenses for the water logistics segment increased by 4% to $168.6 million in 2017 as compared to $161.5 million in 2016. Segment profits were 19% of revenues in 2017 and 16% of revenues in 2016, due to increases in trucking activity across all regions and higher skim oil sales and disposal activity.
Direct operating expenses for the contract drilling segment increased by 37% to $9.7 million in 2017 as compared to $7.1 million in 2016, due to a significant increase in the North American on-shore drilling rig count. Segment profits were 11% of revenues in 2017 compared to 2% in 2016, due to an overall increase in drilling activity.
General and Administrative Expenses. General and administrative expenses increased by 8% to $146.5 million in 2017 from $135.3 million in 2016. The increase was primarily due to higher payroll and incentive compensation costs due to an increase in workforce in 2017. G&A expense included $23.0 million and $17.7 million of stock-based compensation expense in 2017 and 2016, respectively. G&A expense in 2017 also included legal and professional fees related to due diligence on corporate development activities of $4.2 million.
Restructuring Costs. Restructuring costs were $0.7 million in 2017 and $20.7 million in 2016 related to pre-petition reorganization and bankruptcy related expenses including legal, accounting, and consulting fees. Restructuring costs of $0.7 million in 2017 were included in General and Administrative Expenses.
Reorganization Items, Net. Reorganization Items, net were $264.3 million in 2016. Reorganization items primarily consist of $540.3 million gain on debt discharge partially offset by $220.5 million loss on fresh start accounting revaluations, $23.3 million write-off of deferred financing costs and debt premiums and discounts, and $19.7 million of post-petition professional fees incurred in connection with our emergence from voluntary reorganization, $8.5 million fair value of warrants issued, $1.4 million in Successor equity to Predecessor equity holders, and $2.8 million in other costs.
Depreciation and Amortization Expenses. Depreciation and amortization expenses were $112.2 million in 2017, as compared to $218.2 million in 2016. The decrease in depreciation and amortization expense is due to the revaluation of our asset base as of December 31, 2016 as part of the adoption of the fresh start accounting associated with our emergence from bankruptcy. During 2017, we invested $64.4 million for cash capital expenditures and $67.5 million for capital leases.
42
Interest Expense. Interest expense decreased to $37.5 million in 2017 compared to $96.6 million in 2016. The decrease in interest expense in 2017 was primarily due to the cancellation of our unsecured notes as part of our emergence from bankruptcy.
Income Tax Benefit. Income tax benefit was $1.7 million and $3.9 million in 2017 and 2016 respectively. Our effective tax benefit rate was approximately 1.7% in 2017 compared to an effective tax benefit rate of 3.1% in 2016.
Year Ended December 31, 2016 Compared to Year Ended December 31, 2015
Revenues. Revenues decreased by 32% to $547.5 million in 2016 from $805.6 million in 2015. This decrease was primarily due to a significant decrease in crude oil prices resulting in lower demand for our services by our customers, particularly from our completion and remedial services and contract drilling segments.
Completion and remedial services revenue decreased by 40% to $184.6 million in 2016 as compared to $307.6 million in 2015. The decrease in revenue between these periods was primarily due to lower pumping and fracturing revenues driven by the overall decrease in new well completion activity, as well as pricing concessions given to customers. Total hydraulic horsepower was approximately 444,000 at December 31, 2016 and December 31, 2015.
Well servicing revenues decreased by 25% to $164.0 million in 2016 compared to $217.2 million in 2015. Rig utilization decreased to 42% in 2016 from 49% during 2015, reflecting lower activity levels and the competitive market in oil-dominated areas. Our weighted average number of well servicing rigs remained constant at 421 during 2016 and 2015. We experienced a decrease of 11% in revenue per rig hour to $310 during 2016 from $348 during 2015, due to pricing competition, especially from smaller service companies.
Water logistics revenue decreased by 26% to $191.7 million in 2016 compared to $258.6 million in 2015. This decrease was mainly due to a decrease in trucking hours and lower pricing for our services. Revenue per fluid service truck decreased 22% to $199,000 in 2016 compared to $254,000 in 2015, due to decreased disposal activities and lower pricing. Our weighted average number of fluid service trucks decreased to 966 in 2016 from 966 in 2015.
Contract drilling revenues decreased by 67% to $7.2 million in 2016 compared to $22.2 million in 2015. The decrease was driven mainly by a decrease in drilling activity, which caused a decline in rig operating days. The number of rig operating days decreased to 413 in 2016 compared to 1,361 in 2015. The average revenue per rig day increased to $17,500 in 2016 from $16,300 in 2015, due to improved utilization in the second half of 2016.
Direct Operating Expenses. Direct operating expenses, which primarily consist of labor costs, including workers’ compensation and health insurance, and maintenance and repair costs, decreased by 27% to $467.7 million in 2016 from $642.9 million in 2015. This decrease was due to the lower activity levels in all our segments.
Direct operating expenses for the completion and remedial services segment decreased by 35% to $158.8 million in 2016 as compared to $245.1 million in 2015, due primarily to decreased activity levels and reduction in headcount. Segment profits decreased to 14% of revenues in 2016 compared to 20% in 2015, due to decremental margins on a lower revenue base in all operating areas as well as significant pricing discounts for our pumping services.
Direct operating expenses for the well servicing segment decreased by 24% to $140.3 million in 2016 as compared to $185.0 million in 2015, due primarily to decreased personnel costs and reduced demand for our services. Segment profits remained constant at 14% of revenues in 2016 and 2015, with competitive pricing pressures and the impact of decremental margins on a lower revenue base impacting both years.
Direct operating expenses for the water logistics segment decreased by 18% to $161.5 million in 2016 as compared to $196.2 million in 2015. Segment profits were 16% of revenues in 2016 and 24% of revenues in 2015, due to high levels of competition for trucking services and lower skim oil sales and disposal activity.
Direct operating expenses for the contract drilling segment decreased by 58% to $7.1 million in 2016 as compared to $16.7 million in 2015, due to a significant decrease in the North American on-shore drilling rig count. Segment profits were 2% of revenues in 2016 compared to 25% in 2015, due to an overall decline in drilling activity.
General and Administrative Expenses. General and administrative expenses decreased by 5.7% to $135.3 million in 2016 from $143.5 million in 2015. The decrease was primarily due to lower payroll and incentive compensation costs due to a reduction in workforce in 2015, plus additional cost saving initiatives implemented in late 2014 and 2015. G&A expense included $17.7 million and $13.7 million of stock-based compensation expense in 2016 and 2015, respectively.
43
Restructuring Costs. Restructuring costs consist of $20.7 million in 2016 related to pre-petition restructuring and bankruptcy related expenses including legal, accounting, and consulting fees. We had no Restructuring costs in 2015.
Reorganization Items, Net. Reorganization Items, net were $264.3 million in 2016. Reorganization items primarily consist of $540.3 million gain on debt discharge partially offset by $220.5 million loss on fresh start accounting revaluations, $23.3 million write-off of deferred financing costs and debt premiums and discounts, and $19.7 million of post-petition professional fees incurred in connection with our emergence from voluntary reorganization, $8.5 million fair value of warrants issued, $1.4 million in Successor equity to Predecessor equity holders, and $2.8 million in other costs.
Depreciation and Amortization Expenses. Depreciation and amortization expenses were $218.2 million in 2016, as compared to $241.5 million in 2015. During 2016, we invested $32.7 million for cash capital expenditures and $5.7 million for capital leases.
Goodwill Impairment. In the third quarter of 2016, we recorded a non-cash charge totaling $0.6 million for impairment of all of the goodwill associated with our 2015 acquisitions.
Interest Expense. Interest expense increased to $96.6 million in 2016 compared to $68.0 million in 2015. The increase in interest expense in 2016 was primarily due to our new term and debtor-in-possession loan facilities.
Income Tax Benefit. Income tax benefit was $3.9 million and $131.3 million in 2016 and 2015, respectively. Our effective tax benefit rate was approximately 3.1% in 2016 compared to an effective tax benefit rate of 35.2% in 2015. The change in the effective tax rate is due to the recording of a valuation allowance against the Company's net deferred tax assets in 2016.
Liquidity and Capital Resources
As of December 31, 2017, our primary capital resources were cash flows from operations, utilization of capital leases and borrowings under our $120 million accounts receivable securitization facility (the “Credit Facility”). As of December 31, 2017, we had $64.0 million in borrowings under the Credit Facility. At December 31, 2017, we had unrestricted cash and cash equivalents of $38.5 million compared to $98.9 million as of December 31, 2016. An additional amount of $47.7 million is classified as restricted cash. Including the availability under the Credit Facility, we currently have $50.0 million in total liquidity.
On October 27, 2017, the Company entered into Amendment No. 1 (“Amendment No. 1”) to the Credit Facility. Among other things, Amendment No. 1 (i) increased the aggregate commitments under the Credit Agreement from $100 million to $120 million, (ii) appointed CIT Bank, N.A. to serve as syndication agent and (iii) added new lenders and amended the commitment schedule to the Credit Agreement.
We have utilized, and expect to utilize in the future, bank and capital lease financing and sales of equity to obtain capital resources. When appropriate, we will consider public or private debt and equity offerings and non-recourse transactions to meet our liquidity needs. The accompanying consolidated financial statements have been prepared assuming the Company will continue as a going concern. This assumes the Company will be able to realize its assets and discharge its liabilities in the normal course of business.
Cancellation of Indebtedness in 2016
On February 15, 2011, we issued $275.0 million aggregated principal amount of 7.75% Senior Notes due 2019 (the “2019 Notes”). On June 13, 2011, we issued an additional $200.0 million aggregate principal amount of 2019 Notes, resulting in outstanding 2019 Notes with an aggregate principal amount of $475.0 million. On October 16, 2012, we issued $300.0 million aggregate principal amount of 7.75% Senior Notes due 2022 (the “2022 Notes,” and together with the 2019 Notes, the “Unsecured Notes”). On the Effective Date, all of the Unsecured Notes were cancelled and discharged, along with associated accrued interest amounts pursuant to the Prepackaged Plan.
Net Cash Provided by Operating Activities
Cash flow provided in operating activities was $25.9 million for the year ended December 31, 2017, as compared to cash used in operations of $151.5 million in 2016, and cash provided by operations of $95.5 million in 2015. The increase in 2017 was due primarily to stronger operating results and working capital levels. The decrease in 2016 was due to a decrease in operating income offset by an increase in working capital.
44
Capital Expenditures
Capital expenditures are the main component of our investing activities. Cash capital expenditures for 2017 were $63.4 million, with an additional $7.0 million of accrued capital expenditures as compared to $32.7 million in 2016, and $53.9 million in 2015. Cash capital expenditures increased in 2017 from 2016 due to an increase in expansionary capital expenditures to $17.1 million in 2017 from $5.0 million in 2016. Through our capital lease program, we also added assets of approximately $67.5 million, $5.7 million and $16.0 million in 2017, 2016 and 2015, respectively.
In 2018, we have currently planned capital expenditures of approximately $95.0 million including capital leases of $40.0 million. We do not budget acquisitions in the normal course of business, and we regularly engage in discussions related to potential acquisitions related to the well services industry.
Capital Resources and Financing
Our current primary capital resources are cash flow from our operations, availability under our $120.0 million Credit Facility, the ability to enter into capital leases, the ability to incur additional secured indebtedness, and a cash balance of $38.5 million at December 31, 2017. We had borrowings of $64.0 million under our Credit Facility, of which $45.2 million is held as restricted cash to secure letters of credit. We had $11.5 million of available borrowing capacity at December 31, 2017. We financed activities in excess of cash flow from operations primarily through the use of bank debt and capital leases. The Amended and Restated Term Loan Agreement had $162.5 million aggregate outstanding principal amount of loans as of December 31, 2017 and no additional borrowing capacity. See “Credit Facility” and “-Term Loan Agreement” below.
Contractual Obligations
We have significant contractual obligations in the future that will require capital resources. The following table outlines our contractual obligations as of December 31, 2017 (in thousands):
Obligations Due in | ||||||||||||||||||||
Periods Ended December 31, | ||||||||||||||||||||
Contractual Obligations | Total | 2018 | 2019-2020 | 2021-2022 | Thereafter | |||||||||||||||
Long-term debt | $ | 226,525 | $ | 1,650 | $ | 3,300 | $ | 221,575 | $ | — | ||||||||||
Interest on long-term debt | 122,280 | 24,895 | 49,131 | 48,254 | — | |||||||||||||||
Capital Leases | 100,615 | 56,004 | 38,438 | 6,103 | 70 | |||||||||||||||
Operating leases | 17,251 | 4,969 | 7,394 | 4,752 | 136 | |||||||||||||||
Asset retirement obligation | 2,506 | 748 | 638 | 248 | 872 | |||||||||||||||
Total | $ | 469,177 | $ | 88,266 | $ | 98,901 | $ | 280,932 | $ | 1,078 | ||||||||||
Our long-term debt and interest on long-term debt as of December 31, 2017, relate to $162.5 million under our Amended and Restated Term Loan Agreement and $64.0 million under our Credit Facility. Our capital leases relate primarily to light-duty and heavy-duty vehicles and trailers. Our operating leases relate primarily to real estate. Our asset retirement obligation relates to disposal wells.
Our ability to access additional sources of financing will be dependent on our operating cash flows and demand for our services, which could be negatively impacted due to the extreme volatility of commodity prices.
Credit Facility
On September 29, 2017, Basic entered into the Credit Facility pursuant to (i) a Receivables Transfer Agreement (the “Transfer Agreement”) entered into by and among Basic Energy Services, L.P. (“BES LP”), as the initial originator and Basic Energy Receivables, LLC (the “SPE”), as the transferee and (ii) the Credit Agreement.
Under the Transfer Agreement, BES LP will sell or contribute, on an ongoing basis, its accounts receivable and related security and interests in the proceeds thereof (the “Transferred Receivables”) to the SPE. The SPE will finance a portion of its purchase of the accounts receivable through borrowings, on a revolving basis, of up to $100 million (with the ability to request an increase in the size of the Credit Facility by $50 million) under the Credit Agreement, and such borrowings will be secured by the accounts receivable. The SPE will finance its purchase of the remaining portion of the accounts receivable by issuing subordinated promissory notes to BES LP and/or by contributing the remaining portion of the accounts receivables in exchange for equity in the SPE in the amount of the purchase price of the receivable not paid in cash. BES LP will be responsible for the servicing, administration and collection of the accounts receivable, with all collections going into lockbox accounts. The Company has provided a customary guaranty of performance to the administrative agent with respect to certain obligations of
45
BES LP and any successor servicer under the Credit Facility. In connection with entering into the Credit Facility, on September 29, 2017, the Company amended the Term Loan Agreement to permit, among other things, (i) the acquisition of the Transferred Receivables by the SPE pursuant to the Transfer Agreement, free and clear of the liens under the Term Loan Agreement and (ii) the transactions contemplated under each of the Transfer Agreement and Credit Agreement. The Company consolidates the foregoing entities, and all intercompany activity is eliminated upon consolidation.
Loans under our Credit Facility bear interest at a fluctuating rate that is (a) the Alternate Base Rate plus 2.25% with respect to ABR Loans or (b) the Adjusted LIBO Rate plus 3.25% with respect to Eurodollar Loans (each as defined in the credit Agreement). A commitment fee equal to 0.375% per annum will be payable on the unused commitments under the Credit Agreement. The loans made pursuant to the Credit Agreement will mature on September 29, 2021. The interest rate was 4.63% at December 31, 2017.
On October 27, 2017, the Company entered into Amendment No. 1. Among other things, Amendment No. 1 (i) increased the aggregate commitments under the Credit Agreement from $100 million to $120 million, (ii) appointed CIT Bank, N.A. to serve as syndication agent and (iii) added new lenders and amended the commitment schedule to the Credit Agreement.
As of December 31, 2017, Basic had $45.2 million of letters of credit outstanding secured by restricted cash borrowed under the Credit Facility. Basic had borrowings under the Credit Facility of $64.0 million as of December 31, 2017, giving Basic $11.5 million of available borrowing capacity under the Credit Facility.
Second Amended and Restated Revolving Credit Facility
On December 23, 2016, the Company entered into a Second Amended and Restated ABL Credit Agreement (the "Second A&R Credit Agreement") with Bank of America, N.A., as administrative agent for the lenders (the “Credit Facility Administrative Agent”), a collateral management agent, the swing line lender and a letters of credit issuer, Wells Fargo Bank, National Association, as a collateral management agent and syndication agent, and the financial institutions party thereto, as lenders. Basic terminated this facility on September 29, 2017.
The Second A&R Credit Agreement provided for a $75 million revolving credit loan facility with a $65 million letter of credit sublimit and $10 million swing line sublimit. The obligations under the Second A&R Credit Agreement were guaranteed on a joint and several basis by each of our current subsidiaries, other than our immaterial subsidiaries, and were secured by substantially all of our and our guarantors' assets as collateral.
Loans under the Second A&R Credit Agreement bore interest, at the Company’s option, at a rate equal to either (i) the London interbank offered rate (the “Eurodollar Rate”) plus a rate of 2.5% to 4.5% depending on the consolidated leverage ratio at the time of the determination or (ii) a base rate equal to the highest of (a) the federal funds rate, plus 0.50%, (b) the prime rate then in effect publicly announced by Bank of America and (c) the Eurodollar Rate plus 1.0%, the highest is then is added to a rate ranging from 1.5% to 3.5% depending on the consolidated leverage ratio at the time of the determination.
Amended and Restated Term Loan Agreement
On the Effective Date, we entered into an Amended and Restated Term Loan Credit Agreement (the “Amended and Restated Term Loan Agreement") with a syndicate of lenders and U.S. Bank National Association, as administrative agent for the lenders (the “Term Loan Administrative Agent”). Under the Amended and Restated Term Loan Agreement, on the Effective Date, (i) the outstanding principal amount of pre-petition term loans of each pre-petition term lender were exchanged for loans under the Amended and Restated Term Loan Agreement in an amount equal to such pre-petition term lender’s aggregate outstanding principal amount of pre-petition term loans as of the Effective Date, as determined immediately prior to such exchange and (ii) all accrued and unpaid interest on such pre-petition term loans as of the Effective Date are deemed to be accrued and unpaid interest on the loans. Following such exchange, the aggregate outstanding principal amount of the loans under the Amended and Restated Term Loan Agreement was $164.2 million.
Borrowings under the Amended and Restated Term Loan Agreement will mature on February 26, 2021. We may voluntarily prepay the loans under the Amended and Restated Term Loan Agreement in whole or in part without premium or penalty, provided that certain conditions set forth therein are met. We are required to prepay the Amended and Restated Term Loan Agreement in the case of a change of control, certain sales of our assets, certain issuances of indebtedness and under certain other circumstances, in which case such prepayment may be subject to an applicable premium.
Each loan shall bear interest on the outstanding principal amount thereof from the applicable borrowing date at a rate per annum equal to 13.50%. In addition, we were responsible for the applicable lenders’ fees, including a closing payment equal to 7.00% of the aggregate principal amount of commitments of each lender under the Amended and Restated Term Loan Agreement as of the Effective Date, and administrative agent fees.
46
The Amended and Restated Term Loan Agreement contains various covenants that, subject to agreed upon exceptions, limit Basic’s ability and the ability of certain of our subsidiaries to:
•incur indebtedness;
•grant liens;
•enter into sale and leaseback transactions;
•make loans, capital expenditures, acquisitions and investments;
•change the nature of business;
•acquire or sell assets or consolidate or merge with or into other companies;
•declare or pay dividends;
•enter into transactions with affiliates;
•enter into burdensome agreements;
•prepay, redeem or modify or terminate other indebtedness;
•change accounting policies and reporting practices;
•amend organizational documents; and
•use proceeds to fund any activities of or business with any person that is the subject of governmental sanctions.
If an event of default occurs under the Amended and Restated Term Loan Agreement, then the term loan administrative agent may, with the consent of the required lenders, or shall, at the direction of the required lenders (i) declare any outstanding loans under the Amended and Restated Term Loan Agreement to be immediately due and payable and (ii) exercise on behalf of itself and the lenders all rights and remedies available to it and the lenders under the applicable loan documents or applicable law or equity. The default rate under the Amended and Restated Term Loan Agreement is 16.50% per annum. There is a minimum liquidity covenant requiring unrestricted cash and cash equivalents balances to be at or above $25.0 million. At December 31, 2017, Basic was in compliance with this covenant.
Other Debt
Basic has a variety of other capital leases and notes payable outstanding, which are generally customary in Basic’s business. None of these debt instruments are material individually.
Preferred Stock
At December 31, 2017 and December 31, 2016, we had 5,000,000 shares of $.01 par value preferred stock authorized, of which none was designated, issued or outstanding.
Other Matters
Off-Balance Sheet Arrangements
We have no off-balance sheet arrangements that have or are reasonably likely to have a current or future effect on our financial condition, changes in financial condition, revenues or expenses, results of operations, liquidity, capital expenditures or capital resources that is material to investors.
Net Operating Losses
As of December 31, 2017, we had approximately $664.8 million of federal net operating loss carryforwards. Based on the weight of all available evidence including the future reversal of existing U.S. taxable temporary differences as of December 31, 2017, we believe that it is more likely than not that the benefit from certain federal and state net operating loss carryforwards and other deductible temporary differences will not be realized. In recognition of this risk, we have provided a full valuation allowance on our loss carryforwards as a result of the company being in a cumulative three-year pre-tax book loss position and absence of other objectively verifiable positive evidence.
Recent Accounting Pronouncements
See Part II, Item 8, “Financial Statements and Supplementary Data, Note 3 — Summary of Significant Accounting Policies,” to the Consolidated Financial Statements for a description of the recent accounting pronouncements.
Impact of Inflation on Operations
Inflation in the United States has been relatively low in recent years and did not have a material impact on our results of operations for the years ended December 31, 2017, 2016 and 2015. Although the impact of inflation has been insignificant
47
in recent years, it is still a factor in the U.S. economy, and we tend to experience inflationary pressure on the cost of our equipment, materials and supplies as increasing oil and natural gas prices also increase activity in our areas of operations.
ITEM 7A. QUANTITATIVE AND QUALITATIVE DISCLOSURES ABOUT MARKET RISK
We are exposed to changes in interest rates as incremental amounts are borrowed under our Credit Facility. As of December 31, 2017, our outstanding borrowings under our Credit Facility was $64.0 million.
48
ITEM 8. FINANCIAL STATEMENTS AND SUPPLEMENTARY DATA
Basic Energy Services, Inc.
INDEX TO CONSOLIDATED FINANCIAL STATEMENTS
49
MANAGEMENT’S REPORT ON
INTERNAL CONTROL OVER FINANCIAL REPORTING
Management of Basic Energy Services, Inc. (“Basic” or the “Company”) is responsible for establishing and maintaining adequate internal control over financial reporting and for the assessment of the effectiveness of internal control over financial reporting for the Company. As defined by the Securities and Exchange Commission (Rule 13a-15(f) under the Exchange Act of 1934, as amended), internal control over financial reporting is a process designed by, or under the supervision of Basic’s principal executive and principal financial officers and effected by its Board of Directors, management and other personnel, to provide reasonable assurance regarding the reliability of financial reporting and the preparation of the consolidated financial statements in accordance with U.S. generally accepted accounting principles.
The Company’s internal control over financial reporting is supported by written policies and procedures that (1) pertain to the maintenance of records that, in reasonable detail, accurately and fairly reflect the Company’s transactions and dispositions of the Company’s assets; (2) provide reasonable assurance that transactions are recorded as necessary to permit preparation of the consolidated financial statements in accordance with U.S. generally accepted accounting principles, and that receipts and expenditures of the Company are being made only in accordance with authorization of the Company’s management and directors; and (3) provide reasonable assurance regarding prevention or timely detection of unauthorized acquisition, use or disposition of the Company’s assets that could have a material effect on the consolidated financial statements.
Because of its inherent limitations, internal control over financial reporting may not prevent or detect misstatements. Also, projections of any evaluation of effectiveness to future periods are subject to the risk that controls may become inadequate because of changes in conditions, or that the degree of compliance with the policies or procedures may deteriorate.
In connection with the preparation of the Company’s annual consolidated financial statements, management has undertaken an assessment of the effectiveness of the Company’s internal control over financial reporting as of December 31, 2017, based on criteria established in Internal Control — Integrated Framework (2013) issued by the Committee of Sponsoring Organizations of the Treadway Commission (the COSO Framework). Management’s assessment included an evaluation of the design of the Company’s internal control over financial reporting and testing of the operational effectiveness of those controls.
Based on this assessment, management has concluded that as of December 31, 2017, the Company’s internal control over financial reporting was effective to provide reasonable assurance regarding the reliability of financial reporting and the preparation of financial statements for external purposes in accordance with U.S. generally accepted accounting principles.
KPMG LLP, the independent registered public accounting firm that audited the Company’s consolidated financial statements included in this report, has issued an attestation report on the effectiveness of internal control over financial reporting.
/s/ T. M. “Roe” Patterson | /s/ Alan Krenek | |
T. M. “Roe” Patterson | Alan Krenek | |
Chief Executive Officer | Chief Financial Officer | |
50
Report of Independent Registered Public Accounting Firm
To the Stockholders and Board of Directors
Basic Energy Services, Inc.:
Opinion on Internal Control Over Financial Reporting
We have audited Basic Energy Services, Inc.’s and subsidiaries’ (the Company) internal control over financial reporting as of December 31, 2017, based on criteria established in Internal Control - Integrated Framework (2013) issued by the Committee of Sponsoring Organizations of the Treadway Commission. In our opinion, the Company maintained, in all material respects, effective internal control over financial reporting as of December 31, 2017, based on criteria established in Internal Control - Integrated Framework (2013) issued by the Committee of Sponsoring Organizations of the Treadway Commission.
We also have audited, in accordance with the standards of the Public Company Accounting Oversight Board (United States) (PCAOB), the consolidated balance sheets of the Company as of December 31, 2017 and 2016, the related consolidated statements of operations, stockholders’ equity, and cash flows for the year ended December 31, 2017 (Successor) and the two years ended December 31, 2016 (Predecessor), and the related notes and financial statement schedule II (collectively, the consolidated financial statements), and our report dated February 28, 2018 expressed an unqualified opinion on those consolidated financial statements.
Basis for Opinion
The Company’s management is responsible for maintaining effective internal control over financial reporting and for its assessment of the effectiveness of internal control over financial reporting, included in the accompanying Management’s Report on Internal Control over Financial Reporting. Our responsibility is to express an opinion on the Company’s internal control over financial reporting based on our audit. We are a public accounting firm registered with the PCAOB and are required to be independent with respect to the Company in accordance with the U.S. federal securities laws and the applicable rules and regulations of the Securities and Exchange Commission and the PCAOB.
We conducted our audit in accordance with the standards of the PCAOB. Those standards require that we plan and perform the audit to obtain reasonable assurance about whether effective internal control over financial reporting was maintained in all material respects. Our audit of internal control over financial reporting included obtaining an understanding of internal control over financial reporting, assessing the risk that a material weakness exists, and testing and evaluating the design and operating effectiveness of internal control based on the assessed risk. Our audit also included performing such other procedures as we considered necessary in the circumstances. We believe that our audit provides a reasonable basis for our opinion.
Definition and Limitations of Internal Control Over Financial Reporting
A company’s internal control over financial reporting is a process designed to provide reasonable assurance regarding the reliability of financial reporting and the preparation of financial statements for external purposes in accordance with generally accepted accounting principles. A company’s internal control over financial reporting includes those policies and procedures that (1) pertain to the maintenance of records that, in reasonable detail, accurately and fairly reflect the transactions and dispositions of the assets of the company; (2) provide reasonable assurance that transactions are recorded as necessary to permit preparation of financial statements in accordance with generally accepted accounting principles, and that receipts and expenditures of the company are being made only in accordance with authorizations of management and directors of the company; and (3) provide reasonable assurance regarding prevention or timely detection of unauthorized acquisition, use, or disposition of the company’s assets that could have a material effect on the financial statements.
Because of its inherent limitations, internal control over financial reporting may not prevent or detect misstatements. Also, projections of any evaluation of effectiveness to future periods are subject to the risk that controls may become inadequate because of changes in conditions, or that the degree of compliance with the policies or procedures may deteriorate.
KPMG LLP
Fort Worth, Texas
February 28, 2018
51
Report of Independent Registered Public Accounting Firm
To the Stockholders and Board of Directors
Basic Energy Services, Inc.:
Opinion on the Consolidated Financial Statements
We have audited the accompanying consolidated balance sheets of Basic Energy Services, Inc. and subsidiaries (the “Company”) as of December 31, 2017 and 2016, the related consolidated statements of operations, stockholders’ equity, and cash flows for the year ended December 31, 2017 (Successor) and the two years ended December 31, 2016 (Predecessor), and the related notes and financial statement schedule II, (collectively, the consolidated financial statements). In our opinion, the consolidated financial statements present fairly, in all material respects, the financial position of the Company as of December 31, 2017 and 2016, and the results of its operations and its cash flows for each of the year ended December 31, 2017 (Successor) and the two years ended December 31, 2016 (Predecessor), in conformity with U.S. generally accepted accounting principles.
As described in Note 1 to the consolidated financial statements, the Company filed a petition for reorganization under Chapter 11 of the United States Bankruptcy Code on October 26, 2016. The Company's plan of reorganization became effective and the Company emerged from bankruptcy protection on December 23, 2016. In connection with its emergence from bankruptcy, the Company adopted the guidance for fresh start accounting in conformity with FASB ASC Topic 852, Reorganizations. Accordingly, the Company's consolidated financial statements prior to December 31, 2016 are not comparable to its consolidated financial statements for periods after December 31, 2016.
We also have audited, in accordance with the standards of the Public Company Accounting Oversight Board (United States) (“PCAOB”), the Company’s internal control over financial reporting as of December 31, 2017, based on criteria established in Internal Control - Integrated Framework (2013) issued by the Committee of Sponsoring Organizations of the Treadway Commission, and our report dated February 28, 2018, expressed an unqualified opinion on the effectiveness of the Company’s internal control over financial reporting.
Basis for Opinion
These consolidated financial statements are the responsibility of the Company’s management. Our responsibility is to express an opinion on these consolidated financial statements based on our audits. We are a public accounting firm registered with the PCAOB and are required to be independent with respect to the Company in accordance with the U.S. federal securities laws and the applicable rules and regulations of the Securities and Exchange Commission and the PCAOB.
We conducted our audits in accordance with the standards of the PCAOB. Those standards require that we plan and perform the audit to obtain reasonable assurance about whether the consolidated financial statements are free of material misstatement, whether due to error or fraud. Our audits included performing procedures to assess the risks of material misstatement of the consolidated financial statements, whether due to error or fraud, and performing procedures that respond to those risks. Such procedures included examining, on a test basis, evidence regarding the amounts and disclosures in the consolidated financial statements. Our audits also included evaluating the accounting principles used and significant estimates made by management, as well as evaluating the overall presentation of the consolidated financial statements. We believe that our audits provide a reasonable basis for our opinion.
KPMG LLP
Dallas, Texas
February 28, 2018
52
Basic Energy Services, Inc.
Consolidated Balance Sheets
(in thousands, except share and per share data)
Successor | |||||||||
December 31, 2017 | December 31, 2016 | ||||||||
ASSETS | |||||||||
Current assets: | |||||||||
Cash and cash equivalents | $ | 38,520 | $ | 98,875 | |||||
Restricted cash | 47,703 | 2,429 | |||||||
Trade accounts receivable, net of allowance of $1,523 and $0 | 148,444 | 108,655 | |||||||
Accounts receivable - related parties | 22 | 31 | |||||||
Income tax receivable | 1,878 | 1,271 | |||||||
Inventories | 36,403 | 35,691 | |||||||
Prepaid expenses | 22,353 | 15,575 | |||||||
Other current assets | 4,292 | 2,003 | |||||||
Total current assets | 299,615 | 264,530 | |||||||
Property and equipment, net | 502,579 | 488,848 | |||||||
Deferred debt costs, net of amortization | 2,497 | — | |||||||
Other intangible assets, net of amortization | 3,221 | 3,458 | |||||||
Other assets | 12,568 | 11,324 | |||||||
Total assets | $ | 820,480 | $ | 768,160 | |||||
LIABILITIES AND STOCKHOLDERS' EQUITY | |||||||||
Current liabilities: | |||||||||
Accounts payable | $ | 80,518 | $ | 47,959 | |||||
Accrued expenses | 51,973 | 51,329 | |||||||
Current portion of long-term debt, net of $1,657 discount at December 31, 2017 | 55,997 | 38,468 | |||||||
Other current liabilities | 2,469 | 2,065 | |||||||
Total current liabilities | 190,957 | 139,821 | |||||||
Long-term debt, net of discounts and deferred debt costs of $10,244 and $17,344 at December 31, 2017 and 2016 respectively | 259,242 | 184,752 | |||||||
Deferred tax liabilities | 78 | — | |||||||
Other long-term liabilities | 31,550 | 29,179 | |||||||
Total liabilities | 481,827 | 353,752 | |||||||
Stockholders' equity: | |||||||||
Preferred stock, $0.01 par value: 5,000,000 shares authorized; zero outstanding at December 31, 2017 and 2016 | — | — | |||||||
Common stock, $0.01 par value: 80,000,000 shares authorized 26,371,572 and 26,095,431 shares issued and 26,219,129 and 25,998,844 shares outstanding at December 31, 2017 and 2016, respectively | 264 | 261 | |||||||
Additional paid-in capital | 439,517 | 417,624 | |||||||
Retained deficit | (96,674 | ) | — | ||||||
Treasury stock, at cost 152,443 and 96,587 shares at December 31, 2017 and 2016 | (4,454 | ) | (3,477 | ) | |||||
Total stockholders' equity | 338,653 | 414,408 | |||||||
Total liabilities and stockholder's equity | $ | 820,480 | $ | 768,160 | |||||
See accompanying notes to consolidated financial statements.
53
Basic Energy Services, Inc.
Consolidated Statements of Operations
(Dollars in thousands, except per share amounts)
Successor | Predecessor | Predecessor | |||||||||||
Years ended December 31, | |||||||||||||
2017 | 2016 | 2015 | |||||||||||
Revenues: | |||||||||||||
Completion and remedial services | $ | 433,450 | $ | 184,567 | $ | 307,550 | |||||||
Well servicing | 210,811 | 163,966 | 217,245 | ||||||||||
Water logistics | 208,784 | 191,725 | 258,597 | ||||||||||
Contract drilling | 10,996 | 7,239 | 22,207 | ||||||||||
Total revenues | 864,041 | 547,497 | 805,599 | ||||||||||
Expenses: | |||||||||||||
Completion and remedial services | 318,191 | 158,762 | 245,069 | ||||||||||
Well servicing | 169,905 | 140,274 | 184,952 | ||||||||||
Water logistics | 168,621 | 161,535 | 196,155 | ||||||||||
Contract drilling | 9,733 | 7,079 | 16,680 | ||||||||||
General and administrative, including stock-based compensation of $22,954, $17,675, and $13,728, in 2017, 2016 and 2015, respectively | 146,458 | 135,331 | 143,458 | ||||||||||
Depreciation and amortization | 112,209 | 218,205 | 241,471 | ||||||||||
Restructuring costs | — | 20,743 | — | ||||||||||
Loss on disposal of assets | 274 | 1,014 | 1,602 | ||||||||||
Goodwill impairment | — | 646 | 81,877 | ||||||||||
Total expenses | 925,391 | 843,589 | 1,111,264 | ||||||||||
Operating loss | (61,350 | ) | (296,092 | ) | (305,665 | ) | |||||||
Other income (expense): | |||||||||||||
Reorganization items, net | — | 264,306 | — | ||||||||||
Interest expense | (37,472 | ) | (96,625 | ) | (67,964 | ) | |||||||
Interest income | 51 | 26 | 26 | ||||||||||
Bargain purchase gain on acquisition | — | 662 | — | ||||||||||
Other income | 419 | 467 | 528 | ||||||||||
Loss before income taxes | (98,352 | ) | (127,256 | ) | (373,075 | ) | |||||||
Income tax benefit | 1,678 | 3,883 | 131,330 | ||||||||||
Net loss | $ | (96,674 | ) | $ | (123,373 | ) | $ | (241,745 | ) | ||||
Net loss available to common stockholders | $ | (96,674 | ) | $ | (123,373 | ) | $ | (241,745 | ) | ||||
Loss per share of common stock: | |||||||||||||
Basic | $ | (3.72 | ) | $ | (2.94 | ) | $ | (5.97 | ) | ||||
Diluted | $ | (3.72 | ) | $ | (2.94 | ) | $ | (5.97 | ) | ||||
See accompanying notes to consolidated financial statements.
54
Basic Energy Services, Inc.
Consolidated Statements of Stockholders’ Equity
(in thousands, except share data)
Additional | Retained | Total | |||||||||||||||
Common Stock | Paid-In | Treasury | Earnings | Stockholders' | |||||||||||||
Shares | Amount | Capital | Stock | (Deficit) | Equity | ||||||||||||
December 31, 2014 (Predecessor) | 43,500,032 | 435 | 369,920 | (12,635 | ) | (15,067 | ) | 342,653 | |||||||||
Issuances of restricted stock | — | — | (3,779 | ) | 3,779 | — | — | ||||||||||
Amortization of share based compensation | — | — | 13,728 | — | — | 13,728 | |||||||||||
Purchase of treasury stock | — | — | — | (5,742 | ) | — | (5,742 | ) | |||||||||
Exercise of stock options / vesting of restricted stock | — | — | (5,140 | ) | 2,584 | — | (2,556 | ) | |||||||||
Net loss | — | — | — | — | (241,745 | ) | (241,745 | ) | |||||||||
December 31, 2015 (Predecessor) | 43,500,032 | 435 | 374,729 | (12,014 | ) | (256,812 | ) | 106,338 | |||||||||
Issuances of restricted stock | — | — | (5,135 | ) | 5,135 | — | — | ||||||||||
Amortization of share based compensation | — | — | 17,675 | — | — | 17,675 | |||||||||||
Purchase of treasury stock | — | — | — | (640 | ) | — | (640 | ) | |||||||||
Net loss | — | — | — | — | (123,373 | ) | (123,373 | ) | |||||||||
Implementation of Prepackaged Plan and Application of Fresh Start Accounting: | |||||||||||||||||
Cancellation of Predecessor equity | (43,500,032 | ) | (435 | ) | (387,269 | ) | 7,519 | 380,185 | — | ||||||||
Issuances of Successor common stock and warrants | 26,095,431 | 261 | 417,624 | (3,477 | ) | — | 414,408 | ||||||||||
Balance - December 31, 2016 (Successor) | 26,095,431 | $ | 261 | $ | 417,624 | $ | (3,477 | ) | $ | — | $ | 414,408 | |||||
Issuances of restricted stock | 276,141 | 3 | (3 | ) | — | — | — | ||||||||||
Amortization of share based compensation | — | — | 22,954 | — | — | 22,954 | |||||||||||
Purchase of treasury stock | — | — | (1,058 | ) | (977 | ) | — | (2,035 | ) | ||||||||
Net loss | — | — | — | — | (96,674 | ) | (96,674 | ) | |||||||||
December 31, 2017 (Successor) | 26,371,572 | $ | 264 | $ | 439,517 | $ | (4,454 | ) | (96,674 | ) | $ | 338,653 | |||||
See accompanying notes to consolidated financial statements.
55
Basic Energy Services, Inc.
Consolidated Statements of Cash Flows
(in thousands)
Successor | Predecessor | Predecessor | |||||||||
2017 | 2016 | 2015 | |||||||||
Cash flows from operating activities: | |||||||||||
Net loss | $ | (96,674 | ) | (123,373 | ) | (241,745 | ) | ||||
Adjustments to reconcile net loss to net cash (used in) provided by operating activities | |||||||||||
Depreciation and amortization | 112,209 | 218,205 | 241,471 | ||||||||
Goodwill impairment | — | 646 | 81,877 | ||||||||
Bargain purchase gain | — | (662 | ) | — | |||||||
Accretion on asset retirement obligation | 160 | 147 | 134 | ||||||||
Change in allowance for doubtful accounts | 1,523 | (812 | ) | 638 | |||||||
Amortization of deferred financing costs | 194 | 7,952 | 3,622 | ||||||||
Amortization of debt discounts (premiums) | 7,264 | (257 | ) | (261 | ) | ||||||
Non-cash compensation | 22,954 | 27,723 | 13,728 | ||||||||
Loss on disposal of assets | 274 | 1,014 | 1,602 | ||||||||
Deferred income taxes | 78 | (4,403 | ) | (131,171 | ) | ||||||
Reorganization items, non-cash | — | (332,854 | ) | — | |||||||
Changes in operating assets and liabilities, net of acquisitions: | |||||||||||
Accounts receivable | (41,303 | ) | (5,712 | ) | 144,430 | ||||||
Inventories | (712 | ) | 2,112 | 7,846 | |||||||
Prepaid expenses and other current assets | (7,065 | ) | (239 | ) | (740 | ) | |||||
Other assets | (1,244 | ) | (1,094 | ) | (767 | ) | |||||
Accounts payable | 25,548 | (6,563 | ) | 3,903 | |||||||
Income tax receivable | (607 | ) | 557 | 1,293 | |||||||
Other liabilities | 2,704 | (4,449 | ) | 1,109 | |||||||
Accrued expenses | 644 | 70,573 | (31,430 | ) | |||||||
Net cash provided by (used in) operating activities | 25,947 | (151,489 | ) | 95,539 | |||||||
Cash flows from investing activities: | |||||||||||
Purchase of property and equipment | (63,361 | ) | (32,689 | ) | (53,868 | ) | |||||
Proceeds from sale of assets | 9,814 | 3,284 | 8,109 | ||||||||
Payments for businesses, net of cash acquired | — | — | (16,730 | ) | |||||||
Net cash used in investing activities | (53,547 | ) | (29,405 | ) | (62,489 | ) | |||||
Cash flows from financing activities: | |||||||||||
Proceeds from debt | 64,000 | 165,000 | 8,816 | ||||||||
Proceeds from Debtor-in-Possession financing | — | 38,390 | — | ||||||||
Payments of debt | (46,589 | ) | (84,881 | ) | (68,635 | ) | |||||
Change in restricted cash | (45,274 | ) | (2,429 | ) | — | ||||||
Proceeds from rights offering | — | 125,000 | — | ||||||||
Change in treasury stock | (2,035 | ) | 2,837 | (5,742 | ) | ||||||
Tax withholding from exercise of stock options | — | — | (3 | ) | |||||||
Exercise of employee stock options | — | — | 727 | ||||||||
Deferred loan costs and other financing activities | (2,857 | ) | (10,880 | ) | (1,396 | ) | |||||
Net cash (used in) provided by financing activities | (32,755 | ) | 233,037 | (66,233 | ) | ||||||
Net (decrease) increase in cash and equivalents | (60,355 | ) | 52,143 | (33,183 | ) | ||||||
Cash and cash equivalents - beginning of year | 98,875 | 46,732 | 79,915 | ||||||||
Cash and cash equivalents - end of year (2017 and 2016: Successor; and 2015: Predecessor) | $ | 38,520 | 98,875 | 46,732 | |||||||
See accompanying notes to consolidated financial statements.
56
BASIC ENERGY SERVICES, INC.
Notes to Consolidated Financial Statements
December 31, 2017, 2016, and 2015
1. Basis of Presentation and Nature of Operations
Basic Energy Services, Inc. (“Basic” or the “Company”) provides a wide range of well site services to oil and natural gas drilling and producing companies, including completion and remedial services, water logistics, well servicing and contract drilling. These services are primarily provided by Basic’s fleet of equipment. Basic’s operations are concentrated in major United States onshore oil and natural gas producing regions located in Texas, New Mexico, Oklahoma, Kansas, Arkansas, Louisiana, Pennsylvania, West Virginia, Ohio, Wyoming, North Dakota, Colorado, California, Utah, Montana, and Kentucky. Basic’s reportable business segments are Completion and Remedial Services, water logistics, Well Servicing, and Contract Drilling. These segments are based on management’s resource allocation and performance assessment in making decisions regarding the Company.
Voluntary Petitions Under Chapter 11 of the Bankruptcy Code
On October 25, 2016, Basic and certain of its subsidiaries (collectively with Basic, the “Debtors”) filed voluntary petitions (the cases commenced thereby, the “Chapter 11 Cases”) under chapter 11 of title 11 of the United States Code (the “Bankruptcy Code”) on October 25, 2016 in the United States Bankruptcy Court for the District of Delaware (the “Court”). On December 9, 2016, the Court entered an order (the “Confirmation Order”) approving the First Amended Joint Prepackaged Chapter 11 Plan of Basic Energy Services, Inc. and its Affiliated Debtors (as confirmed, the “Prepackaged Plan”). On December 23, 2016 (the “Effective Date”), the Prepackaged Plan became effective pursuant to its terms and the Debtors emerged from their Chapter 11 Cases.
2. Emergence from Chapter 11 and Fresh Start Accounting in 2016
In connection with the Company’s emergence from Chapter 11, on the Effective Date, the Company applied the provisions of fresh start accounting, pursuant to Financial Accounting Standards Board (“FASB”) Accounting Standards Codification (“ASC”) 852, Reorganizations, (“ASC 852”), to its consolidated financial statements. We evaluated the events between December 23, 2016 and December 31, 2016 and concluded that the use of an accounting convenience date of December 31, 2016 (the “Convenience Date”) would not have a material impact on our results of operations or financial position. As such, the application of fresh start accounting was reflected in our Consolidated Balance Sheet as of December 31, 2016 and fresh start accounting adjustments related thereto were included in our Consolidated Statements of Operations for the year ended December 31, 2016.
The implementation of the Prepackaged Plan and the application of fresh start accounting materially changed the carrying amounts and classifications reported in our consolidated financial statements and resulted in the Company becoming a new entity for financial reporting purposes. Accordingly, our consolidated financial statements for periods prior to December 31, 2016 are not comparable to our consolidated financial statements as of December 31, 2016 or for periods subsequent to December 31, 2016. References to “Successor” or “Successor Company” refer to the Company on or after December 31, 2016, after giving effect to the implementation of the Prepackaged Plan and the application of fresh start accounting. References to “Predecessor” or “Predecessor Company” refer to the Company prior to December 31, 2016. Additionally, references to periods on or after December 31, 2016 refer to the Successor and references to periods prior to December 31, 2016 refer to the Predecessor.
3. Summary of Significant Accounting Policies
Principles of Consolidation
The accompanying consolidated financial statements include the accounts of Basic, our wholly-owned subsidiaries and our variable interest entity, for which we hold a majority voting interest. All intercompany transactions and balances have been eliminated.
Fresh start accounting
As discussed in Note 2, “Emergence from Chapter 11 and Fresh Start Accounting in 2016,” we applied fresh start accounting as of the Convenience Date. Under fresh start accounting, the reorganization value, as derived from the enterprise value established in the Prepackaged Plan, was allocated to our assets and liabilities based on their fair values in accordance with FASB ASC 805. The amount of deferred income taxes recorded was determined in accordance with FASB ASC 740, “Income Taxes” (“FASB ASC 740”). Therefore, all assets and liabilities reflected in the consolidated Balance Sheet of the
57
Successor Company were recorded at fair value or, for deferred income taxes, in accordance with the respective accounting policy described below.
Estimates, Risks and Uncertainties
Preparation of the accompanying consolidated financial statements in conformity with accounting principles generally accepted in the United States of America requires management to make estimates and assumptions that affect the reported amount of assets and liabilities and disclosures of contingent liabilities at the date of the consolidated financial statements and the reported amounts of revenues and expenses during the reporting period. Management uses historical and other pertinent information to determine these estimates. Actual results could differ from those estimates. Areas where critical accounting estimates are made by management include litigation and self-insured risk reserves.
Revenue Recognition
Completion and Remedial Services — Completion and remedial services consists primarily of pumping services focused on cementing, acidizing and fracturing, nitrogen units, coiled tubing units, snubbing units, thru-tubing and rental and fishing tools. Basic recognizes revenue when services are performed, collection of the relevant receivables is probable, persuasive evidence of an arrangement exists and the price is fixed or determinable. Basic prices completion and remedial services by the hour, day or project depending on the type of service performed. When Basic provides multiple services to a customer, revenue is allocated to the services performed on a per service basis.
Well Servicing — Well servicing consists primarily of maintenance services, workover services, completion services, plugging and abandonment services and rig manufacturing and servicing. Basic recognizes revenue when services are performed, collection of the relevant receivables is probable, persuasive evidence of an arrangement exists and the price is fixed or determinable. Basic prices well servicing by the hour or by the day of service performed. Rig manufacturing revenue is recognized when the rig is accepted by the customer, based on the completed contract method by individual rig.
Water Logistics — Water logistics consists primarily of the sale, transportation, treatment, storage and disposal of fluids used in the drilling, production, pipelining and maintenance of oil and natural gas wells, and well site construction and maintenance services. Basic recognizes revenue when services are performed, collection of the relevant receivables is probable, persuasive evidence of an arrangement exists and the price is fixed or determinable. Basic prices water logistics by the job, by the hour or by the quantities sold, disposed of or hauled.
Contract Drilling — Contract drilling consists primarily of drilling wells to a specified depth using drilling rigs. Basic recognizes revenues based on either a “daywork” contract, in which an agreed upon rate per day is charged to the customer, a “footage” contract, in which an agreed upon rate is charged per the number of feet drilled, or a “turnkey” contract, in which an agreed upon single rate is charged for a drilled well.
Taxes assessed on sales transactions are presented on a net basis and are not included in revenue.
Cash and Cash Equivalents
Basic considers all highly liquid instruments purchased with a maturity of three months or less to be cash equivalents. Basic maintains its excess cash in various financial institutions, where deposits may exceed federally insured amounts at times.
Fair Value of Financial Instruments
Fair value is defined as the amount that would be received to sell an asset or paid to transfer a liability in an orderly transaction between market participants at the measurement date. The carrying amounts of cash and cash equivalents, trade accounts receivable, accounts receivable-related parties, accounts payable and accrued expenses approximate fair value because of the short maturities of these instruments. The carrying amount of our revolving credit facility recorded as long-term debt also approximates fair value due to its variable-rate characteristics. The following is a summary of the carrying amounts and estimated fair values of our financial instruments as of December 31, 2017 and 2016 (in thousands):
Fair Value | December 31, 2017 | December 31, 2016 | |||||||||||
Hierarchy Level | Carrying Amount | Fair Value | Carrying Amount | Fair Value | |||||||||
Term Loan | 3 | 153,338 | 162,052 | 152,838 | 152,838 | ||||||||
The fair value of the Term Loan Agreement is based upon our discounted cash flows model using a third-party discount rate. The carrying amount of our Credit Facility approximates fair value due to its variable-rate characteristics.
58
The carrying amounts of cash and cash equivalents, trade accounts receivable, accounts receivable-related parties, capital leases, accounts payable and accrued expenses approximate fair value due to the short maturities of these instruments.
Inventories
For rental and fishing tools, inventories consisting mainly of grapples, controls and drill bits are stated at the lower of cost or market, with cost being determined on the average cost method. Other inventories, consisting mainly of manufacturing raw materials, rig components, repair parts, drilling and completion materials and gravel, are held for use in the operations of Basic and are stated at the lower of cost or net realizable value, with cost being determined on the first-in, first-out (“FIFO”) method.
Property and Equipment
Property and equipment are stated at cost or at estimated fair value at acquisition date if acquired in a business combination. Expenditures for repairs and maintenance are charged to expense as incurred and additions and improvements that significantly extend the lives of the assets are capitalized. Upon sale or other retirement of depreciable property, the cost and accumulated depreciation and amortization are removed from the related accounts and any gain or loss is reflected in operations. All property and equipment are depreciated or amortized (to the extent of estimated salvage values) on the straight-line method and the estimated useful lives of the assets are as follows:
Buildings and improvements | 20-30 years |
Well service units and equipment | 3-15 years |
Fluid services equipment | 5-10 years |
Brine and fresh water stations | 15 years |
Fracturing/test tanks | 10 years |
Pumping equipment | 5-10 years |
Construction equipment | 3-10 years |
Contract drilling equipment | 3-10 years |
Disposal facilities | 10-15 years |
Vehicles | 3-7 years |
Rental equipment | 2-15 years |
Software and computers | 3 years |
The components of a well servicing rig generally require replacement or refurbishment during the well servicing rig’s life and are depreciated over their estimated useful lives, which ranges from 3 to 15 years. The costs of the original components of a purchased or acquired well servicing rig are not maintained separately from the base rig.
Impairments
Long-lived assets, which include property, plant and equipment, and purchased intangibles subject to amortization with finite lives, are evaluated whenever events or changes in circumstances (“triggering events”) indicate that the carrying value of certain long-lived assets may not be recoverable. An impairment loss is recorded in the period in which it is determined that the carrying amount of a long-lived asset is not recoverable. The determination of recoverability is made based upon the estimated undiscounted future net cash flows of assets grouped at the lowest level for which there are identifiable cash flows independent of the cash flows of other groups of assets with such cash flows to be realized over the estimated remaining useful life of the primary asset within the asset group, excluding interest expense. The Company determined the lowest level of identifiable cash flows that are independent of other asset groups to be at the reporting unit level, which consists of the well servicing, fluid servicing, completion and remedial services and contract drilling. If the estimated undiscounted future net cash flows are less than the carrying amount of the related assets, an impairment loss is determined by comparing the fair value with the carrying value of the related assets.
Debt Issuance Costs
Basic capitalizes certain issuance costs associated with borrowing, such as lender’s and attorney’s fees. Debt issuance costs related to our Credit Facility are presented net of amortization as a non-current asset. Our Term Loan is presented net of the amortized debt issuance costs. These costs are amortized over the life of the related debt and included in interest expense using the effective interest method. Amortized debt issuance costs included in interest expense totaled $0.3 million, $6.0 million, and $3.1 million, in 2017, 2016, and 2015, respectively.
Intangible Assets
59
Basic’s intangible assets subject to amortization were as follows (in thousands):
Successor | |||||||||
December 31, 2017 | December 31, 2016 | ||||||||
Trade names | 3,410 | 3,410 | |||||||
Other intangible assets | 48 | 48 | |||||||
3,458 | 3,458 | ||||||||
Less accumulated amortization | 237 | — | |||||||
Intangible assets subject to amortization, net | $ | 3,221 | $ | 3,458 | |||||
Amortization expense for the years ended December 31, 2017, 2016 and 2015 was approximately $0.2 million, $8.5 million, and $8.9 million, respectively.
Amortization expense for the next five succeeding years is expected to be as follows (in thousands):
Amortization | |||
Expense | |||
2018 | $ | 237 | |
2019 | 237 | ||
2020 | 237 | ||
2021 | 237 | ||
2022 | 227 | ||
Thereafter | 2,046 | ||
$ | 3,221 | ||
Developed technology are amortized over a 5-year life. Trade names are amortized over 15-year life.
Stock-Based Compensation
Basic has historically compensated our directors, executives and employees through the awarding of stock options and restricted stock and restricted stock units. Basic accounted for stock option and restricted stock awards in 2017, 2016, and 2015 using a grant date fair-value based method, resulting in compensation expense for stock-based awards being recorded in our consolidated statements of operations. For performance based restricted stock awards, compensation expense is recognized in the Company's financial statements based on their grant date fair value. Basic utilizes (i) the closing stock price on the date of grant to determine the fair value of vesting restricted stock awards and (ii) a Monte Carlo simulation to determine the fair value of restricted stock awards with a combination of market and service vesting criteria. The Monte Carlo simulation model utilizes multiple input variables that determine the probability of satisfying the market condition stipulated in the award grant and calculates the fair value of the award. The expected volatility utilized in the model was estimated using the historical volatility of the Company and our peer companies. The risk-free interest rate was based on the U.S. treasury rate for a term commensurate with the expected life of the grant, and judgment is required in estimating the amount of stock-based awards that are expected to be forfeited. Stock options issued are valued on the grant date using the Black-Scholes-Merton option pricing model and restricted stock issued is valued based on the fair value of Basic’s common stock at the grant date. Because the determination of these various assumptions is subject to significant management judgment and different assumptions could result in material differences in amounts recorded in Basic’s consolidated financial statements, management believes that accounting estimates related to the valuation of stock options are critical.
Income Taxes
We record net deferred tax assets to the extent we believe these assets will more likely than not be realized. In making such determination, we consider all available positive and negative evidence, including future reversals of existing taxable temporary differences, projected future taxable income, tax planning strategies and recent financial operations. In the event we were to determine that we would be able to realize our deferred income tax assets in the future in excess of their net recorded amount, we would make an adjustment to the valuation allowance which would reduce the provision for income taxes.
Accounts Receivable
60
Basic estimates its allowance for losses on accounts receivable based on past collections and expectations for future collections. Basic regularly reviews accounts for collectability. After all collection efforts are exhausted, if the balance is still determined to be uncollectable, the balance is written off. Expense related to the write off of uncollected accounts is recorded in general and administrative expense. Realized losses have been within management’s expectations.
Concentrations of Credit Risk
Financial instruments, which potentially subject Basic to concentration of credit risk, consist primarily of temporary cash investments and trade receivables. Basic restricts investment of temporary cash investments to financial institutions with high credit standing. Basic’s customer base consists primarily of multi-national and independent oil and natural gas producers. It performs ongoing credit evaluations of its customers but generally does not require collateral on its trade receivables. Credit risk is considered by management to be limited due to the large number of customers comprising its customer base. Basic maintains an allowance for potential credit losses on its trade receivables, and such losses have been within management’s expectations.
Basic did not have any one customer which represented 10% or more of consolidated revenue for 2017, 2016 or 2015.
Asset Retirement Obligations
Basic is required to record the fair value of an asset retirement obligation as a liability in the period in which it incurs a legal obligation associated with the retirement of tangible long-lived assets and capitalize an equal amount as a cost of the asset depreciating it over the life of the asset. Subsequent to the initial measurement of the asset retirement obligation, the obligation is adjusted at the end of each quarter to reflect the passage of time, changes in the estimated future cash flows underlying the obligation, acquisition or construction of assets, and settlements of obligations.
Environmental
Basic is subject to extensive federal, state and local environmental laws and regulations. These laws, which are constantly changing, regulate the discharge of materials into the environment and may require Basic to remove or mitigate the adverse environmental effects of disposal or release of petroleum, chemical and other substances at various sites. Environmental expenditures are expensed or capitalized depending on the future economic benefit. Expenditures that relate to an existing condition caused by past operations and that have no future economic benefits are expensed. Liabilities for expenditures of a non-capital nature are recorded when environmental assessment and/or remediation is probable and the costs can be reasonably estimated.
Litigation and Self-Insured Risk Reserves
Basic estimates its reserves related to litigation and self-insured risks based on the facts and circumstances specific to the litigation and self-insured claims and its past experience with similar claims. Basic maintains accruals in the consolidated balance sheets to cover self-insurance retentions. Please see Note 7. Commitments and Contingencies for further discussion.
Recent Accounting Pronouncements
ASU 2014-09 - “Revenue from Contracts with Customers (Topic 606)" represents a comprehensive revenue recognition standard to supersede existing revenue recognition guidance and align GAAP more closely with International Financial Reporting Standards (IFRS).
The core principle of the new guidance is that a company should recognize revenue at an amount that reflects the consideration to which the Company expects to be entitled in exchange for transferring goods or services to a customer. The new standard also requires significantly expanded disclosures regarding the qualitative and quantitative information of revenue and cash flows arising from contracts with customers.
The new standard requires companies to identify contractual performance obligations and determine whether revenue should be recognized at a point in time or over time, based on when control of goods and services transfer to a customer. The substantial majority of our services are performed at over time, with revenue being recognized at the time of performance, and this is expected remain unchanged. As such, the effect of applying the new guidance to our existing book of contracts will not result in material modifications to our current revenue recognition, or effect earnings in 2018 (and comparative periods previously reported) and in the early years after adoption. We do not incur significant contract costs, which would be required to be amortized over the life of a contract under the new rules.
The standard allows for two transition methods: (a) a full retrospective adoption in which the standard is applied to all
61
of the periods presented subject to certain practical expedients, or (b) a modified retrospective adoption in which the standard is applied only to the most current period presented in the financial statements, and which includes additional disclosures regarding the change in accounting principle in the current period. We have adopted the standard effective January 1, 2018 using the modified retrospective method. Other than additional required disclosures, we do not expect the adoption of the new standard to have a significant impact on our consolidated financial statements.
In February 2016, the FASB issued ASU 2016-02 - “Leases (Topic 842).” The purpose of this update is to increase transparency and comparability among organizations by recognizing lease assets and lease liabilities on the balance sheet and disclosing key information about leasing arrangements. This update is effective for Basic in annual periods beginning after December 15, 2018, including interim periods within those fiscal years. Basic expects to recognize additional right-of-use assets and liabilities related to operating leases with terms longer than one year. At December 31, 2017, Basic had operating leases with terms longer than one year of $12.3 million.
In August 2016, the FASB issued ASU 2016-15-"Statement of Cash Flows (Topic 230): Classification of Certain Cash Receipts and Cash Payments." This standard is effective for Basic for fiscal years beginning after December 15, 2017. The amendments in this update are intended to clarify cash flow treatment of certain cash flows with the objective of reducing diversity in practice. Basic adopted this standard as of January 1, 2018, and did not have significant changes to the cash flow statement as a result.
In November 2016 the FASB issued ASU 2016-18- "Statement of Cash Flows (Topic 230): Restricted Cash," which clarifies the treatment of cash inflows into and cash payments from restricted cash. Restricted cash and restricted cash equivalents should be included with cash and cash equivalents when reconciling the beginning-of-period and end-of-period amounts shown on the statements of cash flows. The amendments of this ASU should be applied using a retrospective transition method and are effective for reporting periods beginning after December 15, 2017. Basic adopted this standard as of January 1, 2018, and it did not have significant changes to the cash flow statement as a result.
4. Property and Equipment
The following table summarizes the components of property and equipment (in thousands):
December 31, | December 31, | ||||||||
2017 | 2016 | ||||||||
Land | $ | 21,217 | $ | 21,010 | |||||
Buildings and improvements | 40,043 | 39,588 | |||||||
Well service units and equipment | 113,657 | 96,365 | |||||||
Fracturing/test tanks | 111,172 | 75,506 | |||||||
Pumping equipment | 116,127 | 85,247 | |||||||
Fluid services equipment | 79,711 | 57,359 | |||||||
Disposal facilities | 51,363 | 47,507 | |||||||
Contract drilling equipment | 10,967 | 12,257 | |||||||
Rental equipment | 34,643 | 32,582 | |||||||
Light vehicles | 19,869 | 12,722 | |||||||
Software | 817 | 641 | |||||||
Other | 4,092 | 3,885 | |||||||
Construction equipment | 2,338 | 1,485 | |||||||
Brine and fresh water stations | 2,704 | 2,694 | |||||||
608,720 | 488,848 | ||||||||
Less accumulated depreciation and amortization | (106,141 | ) | — | ||||||
Property and equipment, net | $ | 502,579 | $ | 488,848 | |||||
Basic is obligated under various capital leases for certain vehicles and equipment that expire at various dates during the next five years. The table below summarizes the gross amount of property and equipment and related accumulated amortization recorded under capital leases and included above (in thousands):
62
December 31, | December 31, | ||||||||
2017 | 2016 | ||||||||
Fluid services equipment | $ | 40,097 | $ | 29,372 | |||||
Pumping equipment | 56,225 | 12,806 | |||||||
Light vehicles | 12,160 | 5,729 | |||||||
Contract drilling equipment | 783 | 999 | |||||||
Well service units and equipment | 262 | — | |||||||
Construction equipment | 378 | 28 | |||||||
109,905 | 48,934 | ||||||||
Less accumulated amortization | (18,445 | ) | — | ||||||
$ | 91,460 | $ | 48,934 | ||||||
Amortization of assets held under capital leases of approximately $20.4 million, $35.5 million and $41.9 million for the years ended December 31, 2017, 2016 and 2015, respectively, is included in depreciation and amortization expense in the consolidated statements of operations.
5. Long-Term Debt
Long-term debt consists of the following (in thousands):
Successor | |||||||||
December 31, | December 31, | ||||||||
2017 | 2016 | ||||||||
Credit Facilities: | |||||||||
Term Loan | $ | 162,525 | $ | 164,175 | |||||
Credit Facility | 64,000 | — | |||||||
Capital leases and other notes | 100,615 | 78,046 | |||||||
Unamortized discount and deferred debt costs | (11,901 | ) | (19,001 | ) | |||||
315,239 | 223,220 | ||||||||
Less current portion | 55,997 | 38,468 | |||||||
Long-term debt | $ | 259,242 | $ | 184,752 | |||||
Debt Discounts
The following discounts on debt represent the unamortized discount to fair value of our Amended and Restated Term Loan Credit Agreement and the short-term and long-term portions of the fair value discount of capital leases (in thousands):
December 31, 2017 | December 31, 2016 | |||||||
Unamortized discount on Term Loan | $ | 9,187 | $ | 11,401 | ||||
Unamortized discount on Capital Leases - short-term | 1,657 | 1,600 | ||||||
Unamortized discount on Capital Leases - long-term | 891 | 6,000 | ||||||
Unamortized term loan issuance costs | 166 | — | ||||||
$ | 11,901 | $ | 19,001 | |||||
Credit Facility
On September 29, 2017, Basic entered into the Credit Facility pursuant to (i) a Receivables Transfer Agreement (the “Transfer Agreement”) entered into by and among Basic Energy Services, L.P. (“BES LP”), as the initial originator and Basic Energy Receivables, LLC (the “SPE”), as the transferee and (ii) the Credit Agreement.
Under the Transfer Agreement, BES LP will sell or contribute, on an ongoing basis, its accounts receivable and related security and interests in the proceeds thereof (the “Transferred Receivables”) to the SPE. The SPE will finance a portion of its purchase of the accounts receivable through borrowings, on a revolving basis, of up to $100 million (with the ability to request an increase in the size of the Credit Facility by $50 million) under the Credit Agreement, and such borrowings will be secured by the accounts receivable. The SPE will finance its purchase of the remaining portion of the accounts receivable by issuing
63
subordinated promissory notes to BES LP and/or by contributing the remaining portion of the accounts receivables in exchange for equity in the SPE in the amount of the purchase price of the receivable not paid in cash. BES LP will be responsible for the servicing, administration and collection of the accounts receivable, with all collections going into lockbox accounts. The Company has provided a customary guaranty of performance to the administrative agent with respect to certain obligations of BES LP and any successor servicer under the Credit Facility. In connection with entering into the Credit Facility, on September 29, 2017, the Company amended the Term Loan Agreement to permit, among other things, (i) the acquisition of the Transferred Receivables by the SPE pursuant to the Transfer Agreement, free and clear of the liens under the Term Loan Agreement and (ii) the transactions contemplated under each of the Transfer Agreement and Credit Agreement. The Company consolidates the SPE, which the Company determined to be a variable interest entity ("VIE"), and all intercompany activity is eliminated upon consolidation. In concluding the SPE is a VIE, the Company determined it is the primary beneficiary of the SPE, as all activities of SPE are for the benefit of the Company. The accounts receivable held at the SPE are used solely to settle the debt obligations of the SPE. The consolidated financial statements include approximately $148.4 million of SPE accounts receivable and $64.0 million of SPE debt.
Loans under our Credit Facility bear interest at a fluctuating rate that is (a) the Alternate Base Rate plus 2.25% with respect to ABR Loans or (b) the Adjusted LIBO Rate plus 3.25% with respect to Eurodollar Loans (each as defined in the Credit Agreement). A commitment fee equal to 0.375% per annum will be payable on the unused commitments under the Credit Agreement. The loans made pursuant to the Credit Agreement will mature on September 29, 2021. The interest rate was 4.63% at December 31, 2017.
On October 27, 2017, the Company entered into Amendment No. 1. Among other things, Amendment No. 1 (i) increased the aggregate commitments under the Credit Agreement from $100 million to $120 million, (ii) appointed CIT Bank, N.A. to serve as syndication agent and (iii) added new lenders and amended the commitment schedule to the Credit Agreement.
As of December 31, 2017, Basic had $45.2 million of letters of credit outstanding secured by restricted cash borrowed under the Credit Facility. Basic had borrowings under the Credit Facility of $64.0 million as of December 31, 2017, giving Basic $11.5 million of available borrowing capacity under the Credit Facility.
Second Amended and Restated Revolving Credit Facility
On December 23, 2016, the Company entered into a Second Amended and Restated ABL Credit Agreement (the "Second A&R Credit Agreement") with Bank of America, N.A., as administrative agent for the lenders (the “Credit Facility Administrative Agent”), a collateral management agent, the swing line lender and a letters of credit issuer, Wells Fargo Bank, National Association, as a collateral management agent and syndication agent, and the financial institutions party thereto, as lenders. Basic terminated this facility on September 29, 2017.
The Second A&R Credit Agreement provides for a $75 million revolving credit loan facility with a $65 million letter of credit sublimit and $10 million swing line sublimit. The obligations under the Second A&R Credit Agreement are guaranteed on a joint and several basis by each of our current subsidiaries, other than our immaterial subsidiaries, and are secured by substantially all of our and our guarantors' assets as collateral under the Third Amended and Restated Security Agreement dated as of the Effective Date (described below).
Loans under the Second A&R Credit Agreement bore interest, at the Company’s option, at a rate equal to either (i) the London interbank offered rate (the “Eurodollar Rate”) plus a rate of 2.5% to 4.5% depending on the consolidated leverage ratio at the time of the determination or (ii) a base rate equal to the highest of (a) the federal funds rate, plus 0.50%, (b) the prime rate then in effect publicly announced by Bank of America and (c) the Eurodollar Rate plus 1.0%, the highest is then is added to a rate ranging from 1.5% to 3.5% depending on the consolidated leverage ratio at the time of the determination.
Amended and Restated Term Loan Agreement
On the Effective Date, we entered into an Amended and Restated Term Loan Credit Agreement (the “Amended and Restated Term Loan Agreement) with a syndicate of lenders and U.S. Bank National Association, as administrative agent for the lenders (the “Term Loan Administrative Agent”). Under the Amended and Restated Term Loan Agreement, on the Effective Date, (i) the outstanding principal amount of pre-petition term loans of each pre-petition term lender were exchanged for loans under the Amended and Restated Term Loan Agreement in an amount equal to such pre-petition term lender’s aggregate outstanding principal amount of pre-petition term loans as of the Effective Date, as determined immediately prior to such exchange and (ii) all accrued and unpaid interest on such pre-petition term loans as of the Effective Date are deemed to be accrued and unpaid interest on the loans. Following such exchange, the aggregate outstanding principal amount of the loans under the Amended and Restated Term Loan Agreement was $164.2 million.
64
Borrowings under the Amended and Restated Term Loan Agreement will mature on February 26, 2021. We may voluntarily prepay the loans under the Amended and Restated Term Loan Agreement in whole or in part without premium or penalty, provided that certain conditions set forth therein are met. We are required to prepay the Amended and Restated Term Loan Agreement in the case of a change of control, certain sales of our assets, certain issuances of indebtedness and under certain other circumstances, in which case such prepayment may be subject to an applicable premium.
Each loan shall bear interest on the outstanding principal amount thereof from the applicable borrowing date at a rate per annum equal to 13.50%. In addition, we will be responsible for the applicable lenders’ fees, including a closing payment equal to 7.00% of the aggregate principal amount of commitments of each lender under the Amended and Restated Term Loan Agreement as of the effective date, and administrative agent fees.
Other Debt
Basic has a variety of other capital leases and notes payable outstanding, which are generally customary in Basic’s business. None of these debt instruments are material individually. There is a minimum liquidity covenant requiring unrestricted cash and cash equivalents balances to be at or above $25.0 million. At December 31, 2017, Basic was in compliance with this covenant.
As of December 31, 2017 the aggregate maturities of debt, including capital leases, for the next five years and thereafter are as follows (in thousands):
Debt | Capital Leases | |||||||
2018 | 1,650 | 56,004 | ||||||
2019 | 1,650 | 24,163 | ||||||
2020 | 1,650 | 14,275 | ||||||
2021 | 221,575 | 5,974 | ||||||
Thereafter | — | 199 | ||||||
$ | 226,525 | $ | 100,615 | |||||
Basic’s interest expense consisted of the following (in thousands):
Successor | Predecessor | ||||||||||
Years ended December 31, | |||||||||||
2017 | 2016 | 2015 | |||||||||
Cash payments for interest | $ | 25,616 | $ | 49,621 | $ | 61,587 | |||||
Commitment and other fees paid | 442 | 2,898 | 2,484 | ||||||||
Amortization of discount on term loan and capital leases, and debt issuance costs | 7,527 | 9,295 | 3,362 | ||||||||
Change in accrued interest | 4,440 | 34,719 | 563 | ||||||||
Capitalized interest | (660 | ) | — | (139 | ) | ||||||
Other | 107 | 92 | 107 | ||||||||
Total interest expense | $ | 37,472 | $ | 96,625 | $ | 67,964 | |||||
6. Fair Value Measurements
Recurring fair value measurements
Fair value is the price that would be received to sell an asset or the amount paid to transfer a liability in an orderly transaction between market participants (an exit price) at the measurement date. Fair value is a market based measurement considered from the perspective of a market participant. The Company uses market data or assumptions that market participants would use in pricing the asset or liability, including assumptions about risk and the risks inherent in the inputs to the valuation. These inputs can be readily observable, market corroborated, or unobservable. If observable prices or inputs are not available, unobservable prices or inputs are used to estimate the current fair value, often using an internal valuation model. These valuation techniques involve some level of management estimation and judgment, the degree of which is dependent on the item being valued. The Company primarily applies a market approach for recurring fair value measurements using the best available information while utilizing valuation techniques that maximize the use of observable inputs and minimize the use of unobservable inputs.
65
The Company also follows the provisions of ASC Topic 820, Fair Value Measurement, for non-financial assets and liabilities measured at fair value on a non-recurring basis. As it relates to Basic, ASC Topic 820 applies to certain non-financial assets and liabilities as may be acquired in a business combination and thereby measured at fair value; measurements of the fair value of goodwill and measurements of property impairments.
There is a fair value hierarchy that prioritizes the inputs used to measure fair value. The hierarchy gives the highest priority to quoted prices in active markets for identical assets or liabilities (Level 1 measurement) and the lowest priority to unobservable inputs (Level 3 measurement). The Company classifies fair value balances based on the observability of those inputs. The three levels of the fair value hierarchy are as follows:
Level 1 — Quoted prices in active markets for identical assets or liabilities that the Company has the ability to access. Active markets are those in which transactions for the asset or liability occur in sufficient frequency and volume to provide pricing information on an ongoing basis.
Level 2 — Inputs are other than quoted prices in active markets included in Level 1, which are either directly or indirectly observable. These inputs are either directly observable in the marketplace or indirectly observable through corroboration with market data for substantially the full contractual term of the asset or liability being measured.
Level 3 — Inputs reflect management’s best estimate of what market participants would use in pricing the asset or liability at the measurement date. Consideration is given to the risk inherent in the valuation technique and the risk inherent in the inputs to the model.
Basic did not have any assets or liabilities that were measured at fair value on a recurring basis at December 31, 2017 and 2016.
7. Commitments and Contingencies
Environmental
Basic is subject to various federal, state and local environmental laws and regulations that establish standards and requirements for protection of the environment. Basic cannot predict the future impact of such standards and requirements which are subject to change and can have retroactive effectiveness. Basic continues to monitor the status of these laws and regulations. Management believes the likelihood of new environmental regulations resulting in a material adverse impact to Basic’s financial position, liquidity, capital resources or future results of operations is unlikely.
Currently, Basic has not been fined, cited or notified of any environmental violations that would have a material adverse effect upon its financial position, liquidity or capital resources other than the situation noted below. However, management does recognize that by the very nature of its business, material costs could be incurred in the near term to maintain compliance. The amount of such future expenditures is not determinable due to several factors, including the unknown magnitude of possible regulation or liabilities, the unknown timing and extent of the corrective actions which may be required, the determination of Basic’s liability in proportion to other responsible parties and the extent to which such expenditures are recoverable from insurance or indemnification.
Litigation
From time to time, Basic is a party to litigation or other legal proceedings that Basic considers to be a part of the ordinary course of business. Basic is not currently involved in any legal proceedings that it considers probable or reasonably possible, individually or in the aggregate, to result in a material adverse effect on its financial condition, results of operations or liquidity.
Operating Leases
Basic leases certain property and equipment under non-cancelable operating leases. The terms of the operating leases generally range from 12 to 60 months with varying payment dates throughout each month.
66
As of December 31, 2017, the future minimum lease payments under non-cancelable operating leases are as follows (in thousands):
Year ended | |||
December 31, 2017 | |||
2018 | 4,969 | ||
2019 | 4,050 | ||
2020 | 3,345 | ||
2021 | 2,990 | ||
2022 | 1,762 | ||
Thereafter | 135 | ||
Total | $ | 17,251 | |
Rent expense approximated $16.8 million, $11.7 million and $13.9 million for 2017, 2016 and 2015, respectively.
Basic leases rights for the use of various brine and fresh water wells and disposal wells ranging in terms from month-to-month up to 99 years. The above table reflects the future minimum lease payments if the lease contains a periodic rental. However, the majority of these leases require payments based on a royalty percentage or a volume usage.
Employment Agreements
Under the Amended and Restated Employment Agreement with T. M. “Roe” Patterson, Chief Executive Officer and President of Basic, initially effective through December 31, 2017, Mr. Patterson was entitled to an annual salary of $665,000, to be adjusted subject to review by the Compensation Committee of the Board. Mr. Patterson's agreement was reconfirmed and extended through 2018. Under this employment agreement, Mr. Patterson is eligible from time to time to receive grants of stock options and other long-term equity incentive compensation under the terms of Basic’s equity compensation plans. In addition, upon a qualified termination of employment, Mr. Patterson would be entitled to three times his annual base salary plus his current annual incentive target bonus for the full year in which the termination of employment occurred. If employment is terminated for certain reasons within the six months preceding or the twelve months following the change of control of the Company, Mr. Patterson would be entitled to a lump sum severance payment equal to three times the sum of his annual base salary plus the higher of (i) his current incentive target bonus for the full year in which the termination of employment occurred or (ii) the highest annual incentive bonus received by him for any of the last three fiscal years.
Basic also has entered into employment agreements with various other executive officers. Under these agreements, if the officer’s employment is terminated for certain reasons, he would be entitled to a lump sum severance payment equal to either 0.75 times to 1.5 times the sum of his annual base salary plus his current annual incentive target bonus for the full year in which the termination occurred. If employment is terminated for certain reasons within the six months preceding or the twelve months following the change of control of the Company, he would be entitled to a lump sum severance payment equal to either 1.0 or 2.0 times the sum of his annual base salary plus the higher of (i) his current incentive target bonus for the full year in which the termination of employment occurred or (ii) the highest annual incentive bonus received by him for any of the last three fiscal years.
Self-Insured Risk Accruals
Basic is self-insured up to retention limits as it relates to workers’ compensation, general liability claims, and medical and dental coverage of its employees. Basic generally maintains no physical property damage coverage on its rig fleet, with the exception of certain of its 24-hour workover rigs, newly manufactured rigs and pumping services equipment. Basic has deductibles per occurrence for workers’ compensation, general liability claims, and medical and dental coverage of $5.0 million, $1.0 million and $400,000, respectively. Basic has a $1.0 million deductible per occurrence for automobile liability. Basic maintains accruals in the accompanying consolidated balance sheets related to self-insurance retentions by using third-party data and claims history. At December 31, 2017, short-term and long-term self-insured risk reserves were $15.9 million each, respectively. At December 31, 2016, short-term and long-term self-insured risk reserves were $14.8 million and $15.6 million, respectively.
At December 31, 2017 and December 31, 2016, self-insured risk accruals totaled approximately $30.3 million, net of $1.5 million receivable for medical and dental coverage, and $35.0 million, net of $19,000 receivable for medical and dental coverage, respectively.
67
8. Accrued Expenses
The accrued expenses are as follows (in thousands):
Successor | |||||||||
December 31, 2017 | December 31, 2016 | ||||||||
Compensation related | $ | 20,479 | $ | 18,744 | |||||
Workers' compensation self-insured risk reserve | 6,528 | 6,956 | |||||||
Health self-insured risk reserve | 3,976 | 3,753 | |||||||
Accrual for receipts | 2,391 | 4,178 | |||||||
Ad valorem taxes | 2,081 | 2,626 | |||||||
Sales tax | 1,873 | 1,652 | |||||||
Insurance obligations | 5,695 | 9,576 | |||||||
Professional fee accrual | 1,581 | 946 | |||||||
Fuel accrual | 989 | 958 | |||||||
Accrued interest | 6,380 | 1,940 | |||||||
$ | 51,973 | $ | 51,329 | ||||||
9. Stockholders' Equity
Common Stock
Basic had 80,000,000 shares of Basic’s common stock, par value $.01 per share, authorized, 26,371,572 shares issued and 26,219,129 shares outstanding at December 31, 2017.
In February 2017, Basic granted certain members of management 801,322 performance-based restricted stock units and 320,532 performance-based stock option awards, which each vest over a three-year period. In May 2017, Basic granted 26,700 shares of restricted stock to each of its Directors. In August 2017, Basic granted certain members of management 6,476 stock options, 16,190 restricted stock units, 6,476 performance-based stock options and 16,190 performance-based restricted stock units.
On December 23, 2016, Basic granted certain members of management 809,416 restricted common stock units, one third of which immediately vested on the Effective Date with the remainder vesting over a two-year period in equal installments.
Treasury Stock
Basic acquired treasury shares through net share settlements for payment of payroll taxes upon the vesting of restricted stock unit awards. Basic repurchased a total of 152,443 and 96,587 common shares through net share settlements for the years ended December 31, 2017 and 2016 respectively.
Preferred Stock
At December 31, 2017 Basic had 5,000,000 shares of preferred stock, par value $.01 per share, authorized, of which none was designated, issued or outstanding.
10. Incentive Plan
Incentive Plan
On the Effective Date, the Basic Energy Services, Inc. Management Incentive Plan (the “MIP”) became effective pursuant to the Prepackaged Plan. The MIP provides for the issuance of incentive awards in the form of stock options, restricted stock, restricted stock units and performance awards denominated in our common stock. The MIP provides for the issuance of up to 3,237,671 shares of common stock. Of these authorized shares, approximately 1,326,156 shares were available for grant as of December 31, 2017. The board of directors of the Company (the “Board”) or the Compensation Committee of the Board (the “Compensation Committee”) administers the MIP. The number of shares of common stock authorized under the MIP and the number of shares subject to an award under the MIP, are subject to adjustment in the event of certain recapitalization, reclassification, stock dividend, extraordinary dividend, stock split, reverse stock split or other distribution with respect to our common stock or any merger, reorganization, consolidation, combination, spin-off or other similar corporate change or any other change affecting the common stock.
68
During the years ended December 31, 2017 and 2016, compensation expense related to share-based arrangements under the MIP, including restricted stock, restricted stock units and stock option awards, was approximately $23.0 million and $10.1 million respectively. For compensation expense recognized during the year ended December 31, 2017 and 2016, Basic did not recognize a tax benefit.
As of December 31, 2017, there was $39.7 million unrecognized compensation related to non-vested share-based compensation arrangements granted under the MIP. That cost is expected to be recognized over a weighted average period of 1.89 years.
The total fair value of share-based awards vested during the years ended December 31, 2017 and 2016, was approximately $7.3 million and $9.7 million, respectively. During 2017 and 2016, there was no excess tax benefit.
Stock Option Awards
The fair value of each option award is estimated on the date of grant using the Black-Scholes-Merton option-pricing model. Options granted under the MIP expire 10 years from the date they are granted, and generally vest over a period of three years.
The following table reflects the summary of stock options outstanding at December 31, 2017:
Weighted | |||||||||||
Weighted | Average | Aggregate | |||||||||
Number of | Average | Remaining | Intrinsic | ||||||||
Options | Exercise | Contractual | Value | ||||||||
Granted | Price | Term (Years) | (000's) | ||||||||
Non-statutory stock options: | |||||||||||
Outstanding, beginning of period | 323,770 | $ | 36.55 | ||||||||
Options granted | 333,484 | 41.80 | |||||||||
Options forfeited | (2,158 | ) | $ | 36.55 | |||||||
Options exercised | — | $ | — | ||||||||
Options expired | (1,080 | ) | $ | 36.55 | |||||||
Outstanding, end of period | 654,016 | $ | 39.23 | 9.07 | — | ||||||
Exercisable, end of period | 109,019 | $ | 36.55 | 8.98 | — | ||||||
Vested or expected to vest, end of period | 544,997 | $ | 39.76 | 9.09 | — | ||||||
Restricted Stock Unit Awards
A summary of the status of Basic’s non-vested RSU grants at December 31, 2017 and changes during the year ended December 31, 2017 is presented in the following table:
Weighted Average | |||||||
Number of | Grant Date Fair | ||||||
Units | Value Per Unit | ||||||
Nonvested at beginning of period | 539,606 | $ | 36.55 | ||||
Granted during period | 860,402 | 41.37 | |||||
Vested during period | (300,300 | ) | 35.93 | ||||
Forfeited during period | (2,698 | ) | 36.55 | ||||
Nonvested at end of period | 1,097,010 | $ | 40.50 | ||||
Warrant Agreement
On the Effective Date, the Company entered into a warrant agreement (the “Warrant Agreement”) with American Stock Transfer & Trust Company, LLC, as warrant agent. Pursuant to the terms of the Prepackaged Plan, the Company issued warrants (the “Warrants,” and holders thereof “Warrantholders”), which in the aggregate, are exercisable to purchase up to approximately 2,066,627 shares of common stock. In accordance with the Prepackaged Plan, the Company issued Warrants to
69
the holders of the Predecessor common stock, totaling approximately 2,066,627 Warrants outstanding, exercisable until December 23, 2023, to purchase up to an aggregate of approximately 2,066,627 shares of common stock at an initial exercise price of $55.25 per share, subject to adjustment as provided in the Warrant Agreement. At issuance, the warrants were recorded at fair value, which was determined using the Black-Scholes option pricing model. The warrants are equity classified and, at issuance, were recorded as an increase to additional paid-in capital in the amount of $8.4 million. All unexercised Warrants will expire, and the rights of the Warrantholder to purchase common stock will terminate on December 23, 2023, which is the seventh anniversary of the Effective Date.
11. Deferred Compensation Plan
In April 2005, Basic established a deferred compensation plan for certain employees. Participants may defer up to 50% of their salary and 100% of any cash bonuses. Basic may make contributions of 100% of the first 3% of the participants’ deferred pay and 50% of the next 2% of the participants’ deferred pay to a maximum match of $10,000 per year. Employer matching contributions and earnings thereon are subject to a five-year vesting schedule with full vesting occurring after five years of service. Basic elected to suspend matching for this plan during 2016. Increases in the market value of the deferred employee contributions represented an expense to Basic of $1.1 million, $0.5 million and $0.2 million in 2017, 2016 and 2015, respectively.
12. Employee 401 (k) Plan
Basic has a 401(k) profit sharing plan that covers substantially all employees. Employees may contribute up to their base salary not to exceed the annual Federal maximum allowed for such plans. At management’s discretion, Basic may make a matching contribution proportional to each employee’s contribution. Employee contributions are fully vested at all times. Employer matching contributions vest incrementally, with full vesting occurring after five years of service. Employer contributions to the 401(k) plan approximated, $0.4 million in 2015, and have been suspended since 2016.
13. Net Earnings (Loss) Per Share
Basic loss per common share are determined by dividing net loss applicable to common stock by the weighted average number of common shares actually outstanding during the year. Diluted loss per common share is based on the increased number of shares that would be outstanding assuming conversion of dilutive outstanding securities using the “as if converted” method. The following table sets forth the computation of basic and diluted loss per share (in thousands, except share data):
Successor | Predecessor | ||||||||||||
Years ended December 31, | |||||||||||||
2017 | 2016 | 2015 | |||||||||||
Numerator (both basic and diluted): | |||||||||||||
Net loss available to common stockholders | $ | (96,674 | ) | $ | (123,373 | ) | $ | (241,745 | ) | ||||
Denominator: | |||||||||||||
Denominator for basic earnings per share | 26,005,870 | 41,998,669 | 40,505,429 | ||||||||||
Denominator for diluted earnings per share | 26,005,870 | 41,998,669 | 40,505,429 | ||||||||||
Basic loss per common share: | $ | (3.72 | ) | $ | (2.94 | ) | $ | (5.97 | ) | ||||
Diluted loss per common share: | $ | (3.72 | ) | $ | (2.94 | ) | $ | (5.97 | ) | ||||
The Company has issued potentially dilutive instruments such as unvested restricted stock and common stock options. However, the Company did not include these instruments in its calculation of diluted loss per share during the periods presented, because to include them would be anti-dilutive.
70
The following shows potentially dilutive instruments:
Successor | Predecessor | |||||||||
Years ended December 31, | ||||||||||
2017 | 2016 | 2015 | ||||||||
Stock options | 654,016 | — | 26,527 | |||||||
Warrants | 2,066,624 | — | — | |||||||
Unvested restricted stock units | 16,114 | 211,363 | 643,351 | |||||||
2,736,754 | 211,363 | 669,878 | ||||||||
14. Supplemental Schedule of Cash Flow Information
The following table reflects non-cash activity:
Successor | Predecessor | Predecessor | |||||||||||
Year ended December 31, | |||||||||||||
2017 | 2016 | 2015 | |||||||||||
(In thousands) | |||||||||||||
Capital leases issued for equipment | $ | 67,510 | $ | 5,652 | $ | 24,768 | |||||||
Change in accrued property and equipment | 7,011 | — | — | ||||||||||
During the years ended December 31, 2017 and December 31, 2016, Basic did not pay any income taxes. Basic received federal and state tax refunds of $1.1 million during the year ended December 31, 2017, and $0.5 million during the year ended December 31, 2015.
15. Business Segment Information
Basic’s reportable business segments are Completion and Remedial Services, Water Logistics, Well Servicing, and Contract Drilling. These segments have been selected based on changes in management’s resource allocation and performance assessment in making decisions regarding the Company. The following is a description of the segments:
Completion and Remedial Services: This segment utilizes a fleet of pumping units, air compressor packages specially configured for underbalanced drilling operations, coiled tubing services, nitrogen services, cased-hole wireline units, an array of specialized rental equipment and fishing tools, thru-tubing and snubbing units. The largest portion of this business consists of pumping services focused on cementing, acidizing and fracturing services in niche markets.
Water Logistics: This segment utilizes a fleet of trucks and related assets, including specialized tank trucks, storage tanks, water wells, disposal facilities water treatment and related equipment. Basic employs these assets to provide, transport, store and dispose of a variety of fluids. These services are required in most workover, completion and remedial projects as well as part of daily producing well operations. Also included in this segment are our construction services which provide services for the construction and maintenance of oil and natural gas production infrastructures.
Well Servicing: This segment encompasses a full range of services performed with a mobile well servicing rig, including the installation and removal of downhole equipment and elimination of obstructions in the well bore to facilitate the flow of oil and natural gas. These services are performed to establish, maintain and improve production throughout the productive life of an oil and natural gas well and to plug and abandon a well at the end of its productive life. Basic’s well servicing equipment and capabilities also facilitate most other services performed on a well. This segment also includes the manufacture and servicing of mobile well servicing rigs.
Contract Drilling: This segment utilizes shallow and medium depth rigs and associated equipment for drilling wells to a specified depth for customers on a contract basis.
Basic’s management evaluates the performance of its operating segments based on operating revenues and segment profits. Corporate expenses include general corporate expenses associated with managing all reportable operating segments. Corporate assets consist principally of working capital and debt financing costs.
71
The following table sets forth certain financial information with respect to Basic’s reportable segments (in thousands):
Completion and | ||||||||||||||||||||||||
Remedial | Well | Water | Contract | Corporate | ||||||||||||||||||||
Services | Servicing | Logistics | Drilling | and Other | Total | |||||||||||||||||||
Successor Year ended December 31, 2017 | ||||||||||||||||||||||||
Operating revenues | $ | 433,450 | $ | 210,811 | $ | 208,784 | $ | 10,996 | $ | — | $ | 864,041 | ||||||||||||
Direct operating costs | (318,191 | ) | (169,905 | ) | (168,621 | ) | (9,733 | ) | — | (666,450 | ) | |||||||||||||
Segment profits | $ | 115,259 | $ | 40,906 | $ | 40,163 | $ | 1,263 | $ | — | $ | 197,591 | ||||||||||||
Depreciation and amortization | $ | 52,648 | $ | 20,911 | $ | 29,210 | $ | 1,654 | $ | 7,786 | $ | 112,209 | ||||||||||||
Capital expenditures | $ | 77,514 | $ | 25,077 | $ | 32,565 | $ | 159 | $ | 2,572 | $ | 137,887 | ||||||||||||
Successor identifiable assets | $ | 258,711 | $ | 109,138 | $ | 129,601 | $ | 7,205 | $ | 315,825 | $ | 820,480 | ||||||||||||
Predecessor Year ended December 31, 2016 | ||||||||||||||||||||||||
Operating revenues | $ | 184,567 | $ | 163,966 | $ | 191,725 | $ | 7,239 | $ | — | $ | 547,497 | ||||||||||||
Direct operating costs | (158,762 | ) | (140,274 | ) | (161,535 | ) | (7,079 | ) | — | (467,650 | ) | |||||||||||||
Segment profits | $ | 25,805 | $ | 23,692 | $ | 30,190 | $ | 160 | $ | — | $ | 79,847 | ||||||||||||
Depreciation and amortization | $ | 87,736 | $ | 48,703 | $ | 57,119 | $ | 6,304 | $ | 18,343 | $ | 218,205 | ||||||||||||
Capital expenditures | $ | 8,315 | $ | 8,727 | $ | 17,324 | $ | 276 | $ | 3,698 | $ | 38,340 | ||||||||||||
Predecessor identifiable assets | $ | 215,034 | $ | 125,474 | $ | 128,725 | $ | 14,121 | $ | 284,806 | $ | 768,160 | ||||||||||||
Predecessor Year ended December 31, 2015 | ||||||||||||||||||||||||
Operating revenues | $ | 307,550 | $ | 217,245 | $ | 258,597 | $ | 22,207 | $ | — | $ | 805,599 | ||||||||||||
Direct operating costs | (245,069 | ) | (184,952 | ) | (196,155 | ) | (16,680 | ) | — | (642,856 | ) | |||||||||||||
Segment profits | $ | 62,481 | $ | 32,293 | $ | 62,442 | $ | 5,527 | $ | — | $ | 162,743 | ||||||||||||
Depreciation and amortization | $ | 83,882 | $ | 60,466 | $ | 71,280 | $ | 14,083 | $ | 11,760 | $ | 241,471 | ||||||||||||
Capital expenditures, (excluding acquisitions) | $ | 22,384 | $ | 18,732 | $ | 19,950 | $ | 2,431 | $ | 6,323 | $ | 69,820 | ||||||||||||
Predecessor identifiable assets | $ | 365,574 | $ | 233,293 | $ | 257,036 | $ | 51,930 | $ | 230,348 | $ | 1,138,181 | ||||||||||||
The following table reconciles the segment profits reported above to the operating income as reported in the consolidated statements of operations (in thousands):
Successor | Predecessor | Predecessor | |||||||||||
Year ended December 31, | |||||||||||||
2017 | 2016 | 2015 | |||||||||||
Segment profits | $ | 197,591 | $ | 79,847 | $ | 162,743 | |||||||
General and administrative expenses | (146,458 | ) | (135,331 | ) | (143,458 | ) | |||||||
Depreciation and amortization | (112,209 | ) | (218,205 | ) | (241,471 | ) | |||||||
Loss on disposal of assets | (274 | ) | (1,014 | ) | (1,602 | ) | |||||||
Restructuring costs | — | (20,743 | ) | — | |||||||||
Goodwill impairment | — | (646 | ) | (81,877 | ) | ||||||||
Operating loss | $ | (61,350 | ) | $ | (296,092 | ) | $ | (305,665 | ) | ||||
72
16. Quarterly Financial Data (Unaudited)
The following table summarizes results for each of the four quarters in the years ended December 31, 2016 and 2015 (in thousands, except earnings per share data):
Successor | ||||||||||||||||||||
First | Second | Third | Fourth | |||||||||||||||||
Quarter | Quarter | Quarter | Quarter | Year | ||||||||||||||||
Year ended December 31, 2017: | ||||||||||||||||||||
Total revenues | $ | 182,019 | $ | 213,296 | $ | 233,460 | $ | 235,266 | $ | 864,041 | ||||||||||
Segment profits | $ | 29,905 | $ | 46,858 | $ | 61,932 | $ | 58,896 | $ | 197,591 | ||||||||||
Net loss | $ | (38,626 | ) | $ | (23,941 | ) | $ | (13,845 | ) | $ | (20,262 | ) | $ | (96,674 | ) | |||||
Loss per share of common stock (a): | ||||||||||||||||||||
Basic | $ | (1.49 | ) | $ | (0.92 | ) | $ | (0.53 | ) | $ | (0.78 | ) | $ | (3.72 | ) | |||||
Diluted | $ | (1.49 | ) | $ | (0.92 | ) | $ | (0.53 | ) | $ | (0.78 | ) | $ | (3.72 | ) | |||||
Weighted average common shares outstanding: | ||||||||||||||||||||
Basic | 25,999 | 26,011 | 26,001 | 26,049 | 26,006 | |||||||||||||||
Diluted | 25,999 | 26,011 | 26,001 | 26,049 | 26,006 | |||||||||||||||
Year ended December 31, 2016: | Predecessor | |||||||||||||||||||
Total revenues | $ | 130,356 | $ | 120,004 | $ | 141,610 | $ | 155,527 | $ | 547,497 | ||||||||||
Segment profits | $ | 18,370 | $ | 15,310 | $ | 25,339 | $ | 20,828 | $ | 79,847 | ||||||||||
Net income (loss) (i) | $ | (83,339 | ) | $ | (89,883 | ) | $ | (92,097 | ) | $ | 141,946 | $ | (123,373 | ) | ||||||
Income (Loss) per share of common stock (a): | ||||||||||||||||||||
Basic | $ | (2.00 | ) | $ | (2.11 | ) | $ | (2.16 | ) | $ | 3.32 | $ | (2.94 | ) | ||||||
Diluted | $ | (2.00 | ) | $ | (2.11 | ) | $ | (2.16 | ) | $ | 3.32 | $ | (2.94 | ) | ||||||
Weighted average common shares outstanding: | ||||||||||||||||||||
Basic | 41,609 | 42,602 | 42,690 | 42,691 | 41,999 | |||||||||||||||
Diluted | 41,609 | 42,602 | 42,690 | 42,691 | 41,999 | |||||||||||||||
(a) The sum of individual quarterly net income per share may not agree to the total for the year due to each period's computation being based on the weighted average number of common shares outstanding during each period. | ||||||||||||||||||||
(i) The third and fourth quarter 2016 loss included reorganization costs of $10.5 and $10.2 million respectively. The third quarter of 2016 loss included goodwill impairment of $0.6 million. | ||||||||||||||||||||
17. Income Taxes
On December 22, 2017, the Tax Reform Act was signed into law. The legislation significantly changes U.S. tax law by, among other things, lowering the U.S. corporate income tax rate from a maximum of 35% to a flat 21% rate, effective January 1, 2018. As a result of the decrease in the corporate income tax rate, we revalued our ending net deferred tax assets at December 31, 2017, but did not recognize any incremental income tax expense in 2017 due to the revaluation of the valuation allowance.
On December 22, 2017, the SEC staff issued Staff Accounting Bulletin No. 118 (“SAB 118”) to address the application of U.S. GAAP in situations when a registrant does not have the necessary information available, prepared, or analyzed (including computations) in reasonable detail to complete the accounting for certain income tax effects of the Tax Reform Act. We have provisionally recognized the incremental tax impacts related to the revaluation of deferred tax assets and liabilities and our reassessment of uncertain tax positions and valuation allowances and included these amounts in our Consolidated Financial Statements for the year ended December 31, 2017. The ultimate impact may differ from these provisional amounts, possibly materially, due to, among other things, additional technical analysis including changes in interpretations and assumptions we have made with respect to the Tax Act. The accounting is expected to be complete by the fourth quarter of 2018.
73
Income tax expense (benefit) consists of the following (in thousands):
Successor | Predecessor | ||||||||||||
Years ended December 31, | |||||||||||||
2017 | 2016 | 2015 | |||||||||||
Current: | |||||||||||||
Federal | $ | (1,740 | ) | $ | — | $ | (151 | ) | |||||
State | (16 | ) | 521 | (9 | ) | ||||||||
Total | (1,756 | ) | 521 | (160 | ) | ||||||||
Deferred: | |||||||||||||
Federal | 74 | (4,486 | ) | (127,482 | ) | ||||||||
State | 4 | 82 | (3,688 | ) | |||||||||
Total | 78 | (4,404 | ) | (131,170 | ) | ||||||||
Total income tax expense (benefit) | $ | (1,678 | ) | $ | (3,883 | ) | $ | (131,330 | ) | ||||
Basic paid no federal income taxes during the years 2017, 2016 and 2015. Basic received federal and state tax refunds of $1.1 million during the year ended December 31, 2017, as a result of electing to monetize alternative minimum tax credit carryforwards in lieu of accelerated tax depreciation.
Reconciliation between the amount determined by applying the federal statutory rate of 35% to loss before income taxes to income (benefit) expense is as follows (in thousands):
Successor | Predecessor | |||||||||||||
Years ended December 31, | ||||||||||||||
2017 | 2016 | 2015 | ||||||||||||
Statutory federal income tax | $ | (34,423 | ) | $ | (44,540 | ) | $ | (130,576 | ) | |||||
Meals and entertainment | 706 | 522 | 684 | |||||||||||
State taxes, net of federal benefit | (1,662 | ) | (6,778 | ) | (3,698 | ) | ||||||||
Valuation allowance | (54,418 | ) | 188,970 | — | — | |||||||||
Remeasurement of Federal Deferred Taxes | 87,227 | — | — | |||||||||||
Cancellation of debt income | — | (178,017 | ) | — | — | |||||||||
Bankruptcy transaction costs | — | 9,783 | — | — | ||||||||||
Tax basis adjustments | (862 | ) | 17,981 | — | — | |||||||||
Goodwill impairment | — | — | 2,833 | |||||||||||
Changes in estimates and other | 1,754 | 8,196 | (573 | ) | ||||||||||
$ | (1,678 | ) | $ | (3,883 | ) | $ | (131,330 | ) | ||||||
74
The tax effects of temporary differences that give rise to significant portions of the deferred tax assets and deferred tax liabilities are as follows (in thousands):
Successor | Predecessor | ||||||||
December 31, 2017 | December 31, 2016 | ||||||||
Deferred tax assets: | |||||||||
Operating loss carryforward | $ | 151,468 | $ | 208,973 | |||||
Goodwill and intangibles | 26,717 | 49,380 | |||||||
Accrued liabilities | 9,418 | 12,351 | |||||||
Deferred debt costs | 2,432 | 5,158 | |||||||
Deferred compensation | 2,902 | 79 | |||||||
Receivables allowance | 348 | 680 | |||||||
Asset retirement obligation | 573 | 859 | |||||||
Inventory | 105 | 167 | |||||||
Valuation Allowances | (146,330 | ) | (189,185 | ) | |||||
Total deferred tax assets | $ | 47,633 | $ | 88,462 | |||||
Deferred tax liabilities: | |||||||||
Property and equipment | (46,881 | ) | (88,450 | ) | |||||
Prepaid expenses | (830 | ) | (12 | ) | |||||
Total deferred tax liabilities | $ | (47,711 | ) | $ | (88,462 | ) | |||
Net deferred tax liability | $ | (78 | ) | $ | — | ||||
Recognized as: | |||||||||
Deferred tax liabilities - non-current | (78 | ) | — | ||||||
Net deferred tax liabilities | $ | (78 | ) | $ | — | ||||
Under the Prepackaged Plan, a substantial portion of the Company’s pre-petition debt securities were extinguished. Absent an exception, a debtor recognizes cancellation of indebtedness income (“CODI”) upon discharge of its outstanding indebtedness for an amount of consideration that is less than its adjusted issue price. The Internal Revenue Code of 1986, as amended (“IRC”), provides that a debtor in a bankruptcy case may exclude CODI from taxable income but must reduce certain of its tax attributes by the amount of any CODI realized as a result of the consummation of a plan of reorganization. The amount of CODI realized by a taxpayer is the adjusted issue price of any indebtedness discharged less the sum of (i) the amount of cash paid, (ii) the issue price of any new indebtedness issued and (iii) the fair market value of any other consideration, including equity, issued. As a result of the market value of equity upon emergence from Chapter 11 bankruptcy proceedings, the estimated amount of U.S. CODI was approximately $31.7 million, which reduced the value of the Company’s U.S. net operating losses.
IRC Sections 382 and 383 provide an annual limitation with respect to the ability of a corporation to utilize its tax attributes against future U.S. taxable income in the event of a change in ownership. We believe the Debtors’ emergence from Chapter 11 bankruptcy proceedings is considered a change in ownership for purposes of IRC Section 382. The limitation under the IRC is based on the value of the corporation as of the emergence date. The ownership changes, and resulting annual limitation, is not expected to result in the expiration of any net operating losses generated prior to the emergence date.
Basic provides a valuation allowance when it is more likely than not that some portion of the deferred tax assets will not be realized. Management assesses the available positive and negative evidence to estimate if sufficient future taxable income will be generated to utilize the existing deferred tax assets. Based on this evaluation, as of December 31, 2017, a valuation allowance of approximately $146.3 million has been recorded on the net deferred tax assets for all federal and state tax jurisdictions in order to measure only the portion of the deferred tax asset that more likely than not will be realized. As of December 31, 2016, a valuation allowance of $189.2 million was recorded against the net deferred tax assets not expected to be realized.
Interest is recorded in interest expense and penalties are recorded in income tax expense. Basic had no interest or penalties related to an uncertain tax positions during 2017. Basic files federal income tax returns and state income tax returns in Texas and other state tax jurisdictions.
75
As of December 31, 2017, Basic had approximately $664.8 million of net operating loss carryforwards ("NOL"), for federal income tax purposes, which begin to expire in 2031 and $246.8 million of net operating loss carryforwards for state income tax purposes which begin to expire in 2018.
18. Emergence from Chapter 11 and Fresh Start Accounting
In connection with the Company’s emergence from Chapter 11, the Company qualified for fresh start accounting because (i) the holders of existing voting shares of the Predecessor Company received less than 50% of the voting shares of the Successor Company and (ii) the reorganization value of the Company's assets immediately prior to confirmation was less than the post-petition liabilities and allowed claims. FASB ASC 852 requires that fresh start accounting be applied as of the date the Prepackaged Plan was approved, or as of a later date when all material conditions precedent to effectiveness of the Prepackaged Plan are resolved, which occurred on December 23, 2016. We elected to apply fresh start accounting effective December 31, 2016, to coincide with the timing of our normal December accounting period close. We evaluated the events between December 23, 2016 and December 31, 2016 and concluded that the use of an accounting convenience date of December 31, 2016 did not have a material impact on our results of operations or financial position. As such, the application of fresh start accounting was reflected in our Consolidated Balance Sheet as of December 31, 2016 and fresh start accounting adjustments related thereto were included in our Consolidated Statements of Operations for the year ended December 31, 2016.
Upon the application of fresh start accounting, the Company allocated the reorganization value to its individual assets and liabilities in conformity with ASC 805, Business Combinations (“ASC 805”). Reorganization value represents the fair value of the Successor Company’s assets before considering liabilities. The excess reorganization value over the fair value of identified tangible and intangible assets, if present, is reported as goodwill.
Under ASC 852, the Successor Company must determine a value to be assigned to the equity of the emerging company as of the date of adoption of fresh start accounting. To facilitate this calculation, the Company estimated the enterprise value of the Successor Company by using a discounted cash flow (“DCF”) analysis under the income approach. The Company also considered the guideline public company and guideline transactions methods under the market approach as reasonableness checks to the indications from the income approach.
Enterprise value represents the fair value of an entity’s interest-bearing debt and stockholders’ equity. In the disclosure statement associated with the Prepackaged Plan, which was confirmed by the Bankruptcy Court, the Company estimated a range of enterprise values between $425 million and $625 million, with a midpoint of $525 million. The Company deemed it appropriate to use the midpoint between the low end and high end of the range to determine the final enterprise value of $525 million utilized for fresh-start accounting.
To estimate enterprise value utilizing the DCF method, the Company established an estimate of future cash flows for the period ranging from 2017 to 2025 and discounted the estimated future cash flows to present value. The expected cash flows for the period 2017 to 2025 were based on the financial projections and assumptions utilized in the disclosure statement. The expected cash flows for the period 2017 to 2025 were derived from earnings forecasts and assumptions regarding growth and margin projections, as applicable, and an effective tax rate of 38.5%. A terminal value was included, based on the cash flows of the final year of the forecast period.
The discount rate of 17.0% was estimated based on an after-tax weighted average cost of capital (“WACC”) reflecting the rate of return that would be expected by a market participant. The WACC also takes into consideration a company specific risk premium reflecting the risk associated with the overall uncertainty of the financial projections used to estimate future cash flows.
The guideline public company and guideline transaction analysis identified a group of comparable companies and transactions that have operating and financial characteristics comparable in certain respects to the Company, including, for example, comparable lines of business, business risks and market presence. Under these methodologies, certain financial multiples and ratios that measure financial performance and value are calculated for each selected company or transactions and then compared to the implied multiples from the DCF analysis. The Company considered enterprise value as a multiple of each selected company and transactions publicly available earnings before interest, taxes, depreciation and amortization (“EBITDA”).
The estimated enterprise value and the equity value are highly dependent on the achievement of the future financial results contemplated in the projections that were set forth in the Prepackaged Plan. The estimates and assumptions made in the valuation are inherently subject to significant uncertainties. The primary assumptions for which there is a reasonable possibility of the occurrence of a variation that would have significantly affected the reorganization value include the assumptions regarding revenue growth, operating expenses, the amount and timing of capital expenditures and the discount rate utilized.
Fresh start accounting reflects the value of the Successor Company as determined in the confirmed Prepackaged Plan. Under fresh start accounting, asset values are remeasured and allocated based on their respective fair values in conformity with
76
the acquisition method of accounting for business combinations in ASC 805. Liabilities existing as of the Effective Date, other than deferred taxes were recorded at the present value of amounts expected to be paid using appropriate risk adjusted interest rates. Deferred taxes were determined in conformity with applicable accounting standards. Predecessor accumulated depreciation, accumulated amortization and retained deficit were eliminated.
Machinery and Equipment
To estimate the fair value of machinery and equipment, the Company considered the income approach, the cost approach, and the sales comparison (market) approach for each individual asset. The primary approaches that were relied upon to value these assets were the cost approach and the market approach. Although the income approach was not applied to value the machinery and equipment assets individually, the Company did consider the earnings of the enterprise of which these assets are a part. When more than one approach is used to develop a valuation, the various approaches are reconciled to determine a final value conclusion.
The typical starting point or basis of the valuation estimate is replacement cost new (RCN), reproduction cost new (CRN), or a combination of both. Once the RCN and CRN estimates are adjusted for physical and functional conditions, they are then compared to market data and other indications of value, where available, to confirm results obtained by the cost approach.
Where direct RCN estimates were not available or deemed inappropriate, the CRN for machinery and equipment was estimated using the indirect (trending) method, in which percentage changes in applicable price indices are applied to historical costs to convert them into indications of current costs. To estimate the CRN amounts, inflation indices from established external sources were then applied to historical costs to estimate the CRN for each asset.
The market approach measures the value of an asset through an analysis of recent sales or offerings of comparable property, and takes into account physical, functional and economic conditions. Where direct or comparable matches could not be reasonably obtained, the Company utilized the percent of cost technique of the market approach. This technique looks at general sales, sales listings, and auction data for each major asset category. This information is then used in conjunction with each asset’s effective age to develop ratios between the sales price and RCN or CRN of similar asset types. A market-based depreciation curve was developed and applied to asset categories where sufficient sales and auction information existed.
Where market information was not available or a market approach was deemed inappropriate, the Company developed a cost approach. In doing so, an indicated value is derived by deducting physical deterioration from the RCN or CRN of each identifiable asset or group of assets. Physical deterioration is the loss in value or usefulness of a property due to the using up or expiration of its useful life caused by wear and tear, deterioration, exposure to various elements, physical stresses, and similar factors.
Functional and economic obsolescence related to these was also considered. Functional obsolescence due to excess capital costs was eliminated through the direct method of the cost approach to estimate the RCN. Functional obsolescence was applied in the form of a cost-to-cure penalty to certain personal property assets needing significant capital repairs. Economic obsolescence was also applied to stacked and underutilized assets based on the status of the asset. Economic obsolescence was also considered in situations in which the earnings of the applicable business segment in which the assets are employed suggest economic obsolescence. When penalizing assets for economic obsolescence, an additional economic obsolescence penalty was levied, while considering scrap value to be the floor value for an asset.
Land and Buildings
In establishing the fair value of the real property assets, each of the three traditional approaches to value: the income approach, the market approach and the cost approach was considered. The Company primarily relied on the market and cost approaches.
Land - In valuing the fee simple interest in the land, the Company utilized the sales comparison approach (market approach). The sales comparison approach estimates value based on what other purchasers and sellers in the market have agreed to as the price for comparable properties. This approach is based on the principle of substitution, which states that the limits of prices, rents and rates tend to be set by the prevailing prices, rents and rates of equally desirable substitutes. In conducting the sales comparison approach, data was gathered on comparable properties and adjustments were made for factors including market conditions, size, access/frontage, zoning, location, and conditions of sale. Greatest weight was typically given to the comparable sales in proximity and similar in size to each of the owned sites. In some cases, market participants were contacted to augment the analysis and to confirm the conclusions of value.
Building & Site Improvements - In valuing the fee simple interest in the real property improvements, the Company utilized the direct and indirect methods of the cost approach. For the direct method cost approach analysis, the starting point or basis of the cost approach is the RCN. In order to estimate the RCN of the buildings and site improvements, various factors were considered including building size, year built, number of stories, and the breakout of the space, property history, and
77
maintenance history. The Company used the data collected to calculate the RCN of the buildings using recognized estimating sources for developing replacement, reproduction, and insurable value costs.
In the application of the indirect method cost approach, the first step is to estimate a CRN for each improvement via the indirect (trending) method of the cost approach. To estimate the CRN amounts, the Company applied published inflation indices obtained from third party sources to each asset’s historical cost to convert the known cost into an indication of current cost. As historical cost was used as the starting point for estimating RCN, we only considered this approach for assets with historical records.
Once the RCN and CRN of the improvements was computed, the Company estimated an allowance for physical depreciation for the buildings and land improvements based upon its respective age.
Intangible Assets
The financial information used to estimate the fair values of intangible assets was consistent with the information used in estimating the Company’s enterprise value. Tradenames were valued primarily utilizing the relief from royalty method of the income approach. Significant inputs and assumptions included remaining useful lives, the forecasted revenue streams, applicable royalty rates, tax rates, and applicable discount rates. Customer relationships were considered in the analysis, but based on the valuation under the excess earnings methodology, no value was attributed to customer relationships.
The following table reconciles the enterprise value to the estimated fair value of Successor common stock par value $0.01 per share (“Successor Common Stock”), as of the Effective Date (in thousands, except share and per share value):
Enterprise value | $ | 525,000 | |
Plus: Cash and cash equivalents and restricted cash | 101,304 | ||
Plus: Non-operating assets | 11,324 | ||
Fair value of invested capital | 637,628 | ||
Less: Fair value of Term Loan | (152,838 | ) | |
Less: Fair value of Capital Leases | (70,382 | ) | |
Stockholders' equity at December 31, 2016 | $ | 414,408 | |
Shares outstanding at December 31, 2016 | 25,998,844 | ||
Per share value | $ | 15.94 | |
In connection with fresh start accounting, the Company’s Term Loan and capital leases were recorded at fair value of $223.2 million as determined using a market approach. The difference between the $242.2 million principal amount and the fair value recorded in fresh start accounting is being amortized over the life of the debt using the effective interest rate method.
The fair values of the Warrants was estimated to be $4.04. The fair value of the Warrants was estimated using a Black-Scholes pricing model with the following assumptions:
Stock price | $14.66 | |
Strike price | $55.25 | |
Expected volatility | 55.7 | % |
Expected dividend rate | — | |
Risk free interest rate | 2.35 | % |
Expiration date | December 23, 2023 | |
The fair value of these Warrants was estimated using Level 2 inputs.
78
The following table reconciles the enterprise value to the estimated reorganization value as of the Effective Date (in thousands):
Enterprise Value | $ | 525,000 | |
Plus: Cash and cash equivalents and restricted cash | 101,304 | ||
Plus: Other non-operating assets | 11,324 | ||
Fair Value of Invested Capital | 637,628 | ||
Plus: Current liabilities, excluding current portion of long-term debt | 101,353 | ||
Plus: Non-current liabilities | 29,179 | ||
Reorganization Value of Successor Assets | $ | 768,160 | |
In determining reorganization value, the Company estimated fair value for property and equipment using significant unobservable inputs based on market and income approaches. Basic commissioned third-party appraisal services to estimate the fair value of its revenue-generating fixed assets and considered current market conditions and management’s judgment to estimate the fair value of non-revenue-generating assets.
79
Consolidated Balance Sheet
The adjustments set forth in the following consolidated balance sheet reflect the effect of the consummation of the transactions contemplated by the Plan (reflected in the column “Reorganization Adjustments”) as well as estimated fair value adjustments as a result of the adoption of fresh start accounting (reflected in the column “Fresh Start Adjustments”). The explanatory notes highlight methods used to determine estimated fair values or other amounts of assets and liabilities, as well as significant assumptions.
As of December 31, 2016 | ||||||||||||||||||
Predecessor Company | Reorganization Adjustments | Fresh Start Adjustments | Successor Company | |||||||||||||||
(in thousands, except share amounts) | ||||||||||||||||||
ASSETS | ||||||||||||||||||
Current assets: | ||||||||||||||||||
Cash and cash equivalents | $ | 27,308 | $ | 71,567 | A | $ | — | $ | 98,875 | |||||||||
Restricted cash | 8,391 | (5,962 | ) | B | — | 2,429 | ||||||||||||
Trade accounts receivable | 108,655 | — | — | 108,655 | ||||||||||||||
Accounts receivable - related parties | 31 | — | — | 31 | ||||||||||||||
Income tax receivable | 1,271 | — | — | 1,271 | ||||||||||||||
Inventories | 35,691 | — | — | 35,691 | ||||||||||||||
Prepaid expenses | 15,575 | — | — | 15,575 | ||||||||||||||
Other current assets | 8,506 | — | (6,503 | ) | M | 2,003 | ||||||||||||
Total current assets | 205,428 | 65,605 | (6,503 | ) | 264,530 | |||||||||||||
Property and equipment, net | 667,239 | — | (178,391 | ) | N | 488,848 | ||||||||||||
Deferred debt costs, net of amortization | 1,249 | 66 | C | (1,315 | ) | O | — | |||||||||||
Other intangible assets, net of amortization | 57,227 | — | (53,769 | ) | P | 3,458 | ||||||||||||
Other assets | 11,324 | — | — | 11,324 | ||||||||||||||
Total assets | $ | 942,467 | $ | 65,671 | $ | (239,978 | ) | $ | 768,160 | |||||||||
LIABILITIES AND STOCKHOLDERS' EQUITY | ||||||||||||||||||
Current liabilities not subject to compromise: | ||||||||||||||||||
Accounts payable | $ | 47,932 | $ | 27 | D | $ | — | $ | 47,959 | |||||||||
Accrued expenses | 65,056 | (13,879 | ) | E | 152 | 51,329 | ||||||||||||
Current portion of long-term debt | 76,865 | (36,740 | ) | F | (1,657 | ) | Q | 38,468 | ||||||||||
Other current liabilities | 2,065 | — | — | 2,065 | ||||||||||||||
Total current liabilities | 191,918 | (50,592 | ) | (1,505 | ) | 139,821 | ||||||||||||
Long-term liabilities not subject to compromise: | ||||||||||||||||||
Long-term debt | 39,570 | 162,525 | G | (17,343 | ) | R | 184,752 | |||||||||||
Deferred tax liabilities | 663 | — | (663 | ) | S | — | ||||||||||||
Other long-term liabilities | 29,179 | — | — | 29,179 | ||||||||||||||
Total liabilities not subject to compromise | 261,330 | 111,933 | (19,511 | ) | 353,752 | |||||||||||||
Liabilities subject to compromise | 979,437 | (979,437 | ) | H | — | — | ||||||||||||
Total liabilities | 1,240,767 | (867,504 | ) | (19,511 | ) | 353,752 | ||||||||||||
Stockholders' equity: | ||||||||||||||||||
Predecessor common stock, $0.01 par value: | 435 | (435 | ) | I | — | — | ||||||||||||
Predecessor paid-in capital | 387,269 | — | (387,269 | ) | J | — | ||||||||||||
Predecessor treasury stock | (7,519 | ) | 7,519 | L | — | — | ||||||||||||
Successor preferred stock, $0.01 par value: | — | — | — | — | ||||||||||||||
Successor common stock; $0.01 par value; | — | 261 | I | — | 261 | |||||||||||||
Successor additional paid-in capital | — | 410,540 | J | 7,084 | J | 417,624 | ||||||||||||
Retained deficit | (678,485 | ) | 518,767 | K | 159,718 | T | — | |||||||||||
Successor treasury stock | — | (3,477 | ) | L | — | (3,477 | ) | |||||||||||
Total stockholders' equity | $ | (298,300 | ) | $ | 933,175 | $ | (220,467 | ) | $ | 414,408 | ||||||||
Total liabilities and stockholder's equity | $ | 942,467 | $ | 65,671 | $ | (239,978 | ) | $ | 768,160 | |||||||||
80
Reorganization Adjustments
A. Reflects the cash receipts (payments) from implementation of the Prepackaged Plan (in thousands):
Record receipt of $125 million under the Rights Offering for New Convertible Notes deemed to have been converted to Successor Common Stock | $ | 125,000 | |
Capital Lease Fees & Expenses | (62 | ) | |
Creditors' professional fees transferred to Fee Escrow Account | (6,630 | ) | |
Debtors' professional fees transferred to Fee Escrow Account | (9,526 | ) | |
Fees for establishing the Fee Escrow Account | (5 | ) | |
Payment of ABL Facility Claims on account of fees, charges, or other amounts payable under the ABL Credit Agreement. | (66 | ) | |
Payment of ABL Facility Claims on account of interest payable under the ABL Credit Agreement. | (618 | ) | |
Payment of Allowed Term Loan Claim on account of fees, charges, or other amounts payable under the Term Loan Agreement | (41 | ) | |
Payment of closing fees & expenses for the Amended and Restated ABL Credit Agreement | (1,610 | ) | |
Payment of Debtor in Possession Facility Claims, Fees and Accrued Interest | (40,296 | ) | |
Payment of Fees and Expenses under Debtor in Possession Facility Order | (452 | ) | |
Payments to 2019 & 2022 Notes Indenture Trustees | (89 | ) | |
Release of restricted cash to unrestricted cash | 5,962 | ||
Net Cash Receipts | $ | 71,567 | |
B. Reflects the release of restricted cash to unrestricted cash.
C. Reflects the fees to reinstate the Asset Based Loan under the Prepackaged Plan.
D. Rights offering expense for filing with the SEC.
E. Reflects payment (receipts) of expenses incurred as part of the reorganization and paid in accordance with the Prepackaged Plan upon emergence (in thousands).
Debtors' professional fees transferred to Fee Escrow Account | $ | 9,526 | |
Creditors' professional fees transferred to Fee Escrow Account | 6,630 | ||
Payment of Debtor in Possession Facility Claims | 1,907 | ||
Payment of ABL Facility Claims on account of interest payable under the ABL Credit Agreement. | 618 | ||
Payment of Fees and Expenses under Debtor in Possession Facility Order | 452 | ||
Payments to 2019 & 2022 Notes Indenture Trustees | 89 | ||
Income tax withholding | (3,477 | ) | |
To reinstate claim deemed to be accrued and unpaid interest under the Amended and Restated Term Loan. | (1,866 | ) | |
Net Payment of Accrued Expenses | $ | 13,879 | |
F. Repayment of the Debtor in Possession Financing of $38.4 million partially offset by the reinstatement of short-term portion of the Term Loan debt of $1.6 million in accordance with the Prepackaged Plan
G. Reinstatement of long-term debt in accordance with the Prepackaged Plan.
81
H. Liabilities subject to compromise were settled as follows in accordance with the Prepackaged Plan (in thousands):
Outstanding principal amount of Term Loan | $ | 164,175 | |
Accrued interest on Term Loan | 1,866 | ||
Outstanding Unsecured Notes | 775,000 | ||
Accrued interest on Unsecured Notes | 38,396 | ||
Balance of Liabilities Subject to Compromise | 979,437 | ||
To reinstate the outstanding principal amount of Term Loan under the Amended and Restated Term Loan Facility. | $ | (164,175 | ) |
To reinstate claim deemed to be accrued and unpaid interest under the Amended and Restated Term Loan. | (1,866 | ) | |
Record issuance of equity to holders of Unsecured Notes | (273,103 | ) | |
Recoveries pursuant to the Prepackaged Plan | (439,144 | ) | |
Net Gain on Debt Discharge | $ | 540,293 | |
I. Cancellation of Predecessor equity to additional paid-in capital and distribution of 26,095,431 shares of Successor Common Stock at par value of $0.01 per share.
Shares Issued | |||||
Rights Offering | 10,825,620 | ||||
Stock to Predecessor shareholders | 75,001 | ||||
Management Incentive Plan (MIP) | 269,810 | ||||
Stock to Senior Note claimants | 14,925,000 | ||||
Total Successor Shares Issued | 26,095,431 | ||||
J. Record additional paid-in capital adjustments on elimination of Predecessor equity and issuance of shares of Successor Common Stock.
K. Reflects the cumulative impact of the reorganization adjustments on retained deficits discussed above (in thousands):
Net Gain on Debt discharge | $ | 540,293 | ||
Capital lease fees and expenses | (62 | ) | ||
Fees for establishing the fee escrow account | (5 | ) | ||
Issuance of warrants per terms of the Plan and the Warrant Agreement | (8,358 | ) | ||
Payment of Allowed Term Loan Claim on account of fees, charges, or other amounts payable under the Term Loan Agreement | (42 | ) | ||
Payment of closing fees and expenses for the Amended and Restated ABL Credit Agreement | (1,610 | ) | ||
Record distribution of 0.5% of the 15 million shares of Successor Common Stock (subject to dilution) to holders of Existing Equity Interests. | (1,372 | ) | ||
Restricted stock amortization expense | (216 | ) | ||
Record issuance of shares for initially vested RSUs under MIP | (9,861 | ) | ||
Net retained earnings impact resulting from implementation of the Prepackaged Plan | $ | 518,767 | ||
L. Elimination of Predecessor Treasury Stock and withholding on shares issued under MIP.
Fresh Start Adjustments
M. Impairment of assets held for sale.
N. Reflects a $178.4 million reduction in the net book value of property and equipment to estimated fair value.
82
The following table summarizes the components of property and equipment, net of the Predecessor Company and Successor Company (in thousands):
Successor | Predecessor | |||||
Land | $ | 21,010 | $ | 22,135 | ||
Buildings and improvements | 39,588 | 74,263 | ||||
Well service units and equipment | 96,365 | 349,001 | ||||
Fracturing/test tanks | 75,506 | 354,398 | ||||
Pumping equipment | 85,247 | 345,991 | ||||
Fluid services equipment | 57,359 | 265,599 | ||||
Disposal facilities | 47,507 | 161,220 | ||||
Contract drilling equipment | 12,257 | 112,289 | ||||
Rental equipment | 32,582 | 96,724 | ||||
Light vehicles | 12,722 | 65,434 | ||||
Software | 641 | 21,914 | ||||
Other | 3,885 | 13,533 | ||||
Construction equipment | 1,485 | 15,223 | ||||
Brine and fresh water stations | 2,694 | 16,035 | ||||
488,848 | 1,913,759 | |||||
Less accumulated depreciation and amortization | — | 1,246,520 | ||||
Total | $ | 488,848 | $ | 667,239 | ||
O. Elimination of deferred debt costs.
P. Reflects a $53.8 million reduction of the net book value of intangible assets.
Q. Discount to fair market value of current portion of capital leases of $1.7 million, and increase in the fair market value of operating leases of $0.2 million.
R. Discount to fair market value of Term Loan of $11.4 million and long-term portion of capital leases of $6 million.
S. Elimination of deferred tax liabilities.
T. Reflects the cumulative impact of fresh start adjustments as discussed above (in thousands):
Retained Deficit Adjustments | ||||
Eliminate historical loss from Predecessor | $ | (678,485 | ) | |
Eliminate retained deficit due to Prepackaged Plan Effects upon emergence | 518,767 | |||
Net retained deficit impact of fresh start accounting | $ | (159,718 | ) | |
Schedule II — Valuation and Qualifying Accounts
83
Additions | ||||||||||||||||||||
Balance at | Charged to | Charged to | Balance at | |||||||||||||||||
Beginning of | Costs and | Other | Deductions | End of | ||||||||||||||||
Description | Period | Expenses (a) | Accounts (b) | (c) | Period | |||||||||||||||
(in thousands) | ||||||||||||||||||||
Successor Year Ended December 31, 2017 | ||||||||||||||||||||
Allowance for Bad Debt | $ | — | $ | 369 | $ | 1,858 | $ | (704 | ) | $ | 1,523 | |||||||||
Successor Year Ended December 31, 2016 | ||||||||||||||||||||
Allowance for Bad Debt | $ | 2,670 | $ | 1,099 | $ | (1,858 | ) | $ | (1,911 | ) | $ | — | ||||||||
Predecessor Year Ended December 31, 2015 | ||||||||||||||||||||
Allowance for Bad Debt | $ | 2,032 | $ | 2,850 | — | $ | (2,212 | ) | $ | 2,670 | ||||||||||
(a)Charges relate to provisions for doubtful accounts
(b)Reflects the impact of reorganization and recording accounts receivable at fair value
(c)Deductions relate to the write-off of accounts receivable deemed uncollectible
84
ITEM 9. CHANGES IN AND DISAGREEMENTS WITH ACCOUNTANTS ON ACCOUNTING AND FINANCIAL DISCLOSURE
None.
ITEM 9A. CONTROLS AND PROCEDURES
Disclosure Controls and Procedures
Based on their evaluation as of the end of the fiscal year ended December 31, 2017, our principal executive officer and principal financial officer have concluded that our disclosure controls and procedures (as defined in Rules 13a-15(e) and 15d-15(e) under the Exchange Act) are effective to ensure that information required to be disclosed in reports that we file or submit under the Exchange Act are recorded, processed, summarized and reported within the time periods specified in the SEC’s rules and forms and effective to ensure that information required to be disclosed in such reports is accumulated and communicated to our management, including our principal executive officer and principal financial officer, to allow timely decisions regarding required disclosure.
Changes in Internal Control over Financial Reporting
During the most recent fiscal quarter, there have been no changes in our internal control over financial reporting that have materially affected, or are reasonably likely to materially affect, our internal control over financial reporting.
Design and Evaluation of Internal Control over Financial Reporting
Management’s Report on Internal Control over Financial Reporting and the Report of the Independent Registered Public Accounting Firm are set forth in Part II, Item 8 of this report and are incorporated herein by reference.
ITEM 9B. OTHER INFORMATION
None.
PART III
Pursuant to paragraph 3 of General Instruction G to Form 10-K, the information required by Item 10, to the extent not set forth in “Executive Officers of the Registrant” in Part I, Items 1 and 2 above, and Items 11 through 14 of Part III of this Report is incorporated by reference from our proxy statement involving the election of directors and the approval of independent auditors, which is to be filed pursuant to Regulation 14A within 120 days after the end of our fiscal year ended December 31, 2017.
85
PART IV
ITEM 15. EXHIBITS, FINANCIAL STATEMENT SCHEDULES
(a) Financial Statements, Schedules and Exhibits
(1) Financial Statements — Basic Energy Services, Inc. and Subsidiaries:
The Financial Statements listed in the Index to Consolidated Financial Statements are filed as part of this report on Form 10-K (see Part II, Item 8, Financial Statements and Supplementary Data).
(2) Financial Statement Schedules
With the exception of Schedule II — Valuation and Qualifying Accounts, all other consolidated financial statement schedules have been omitted because they are not required, are not applicable, or the required information has been included elsewhere within this Form 10-K.
(3) Exhibits
The information required by this Section (a)(3) of Item 15 is set forth on the exhibit index following this page.
ITEM 16. FORM 10-K SUMMARY
Not applicable.
86
Exhibit No. | Description | |
2.1* | ||
2.2* | ||
3.1* | ||
3.2* | ||
4.1* | ||
4.2* | ||
4.3* | ||
10.1* † | ||
10.2* † | ||
10.3* † | ||
10.4* † | ||
10.5* † | ||
10.6* † | ||
10.7* † | ||
10.8* † | ||
10.9* † | ||
10.10* † | ||
10.11* † | ||
10.12* † | ||
10.13* † | ||
10.14* † | ||
87
10.15* † | ||
10.16* † | ||
10.17* † | ||
10.18* † | ||
10.19* † | ||
10.20* | ||
10.21* | ||
10.22* | ||
10.23* | ||
10.24* | ||
10.25* | ||
10.26* | ||
10.27* | ||
10.28* | ||
10.29* | ||
10.30* | ||
88
10.31* | ||
10.32* | ||
10.33* | ||
10.34* | ||
10.35* | ||
10.36* | ||
10.37* | ||
10.38* | ||
10.39* | ||
10.40* | ||
10.41* | ||
10.42* | ||
10.43* | ||
10.44* | ||
10.45* | ||
10.46* | ||
10.47* | ||
89
12.1 | |||
21.1 | |||
23.1 | |||
31.1 | |||
31.2 | |||
32.1 | |||
32.2 | |||
101.INS | XBRL Instance Document | ||
101.SCH | XBRL Taxonomy Extension Schema Document | ||
101.CAL | XBRL Taxonomy Extension Calculation Linkbase Document | ||
101.LAB | XBRL Taxonomy Extension Label Linkbase Document | ||
101.PRE | XBRL Taxonomy Extension Presentation Linkbase Document | ||
101.DEF | XBRL Taxonomy Extension Definition Linkbase Document | ||
* | Incorporated by reference | ||
† | Management contract or compensatory plan or arrangement | ||
90
SIGNATURES
Pursuant to the requirements of Section 13 or 15(d) of the Securities Exchange Act of 1934, the registrant has duly caused this report to be signed on its behalf by the undersigned, thereunto duly authorized.
BASIC ENERGY SERVICES, INC. | |
By: | /s/ T. M. “Roe” Patterson |
Name: T. M. “Roe” Patterson | |
Title: President, Chief Executive Officer and | |
Director | |
Date: February 28, 2018
Pursuant to the requirements of the Securities Exchange Act of 1934, this report has been signed below by the following persons on behalf of the registrant and in the capacities and on the dates indicated.
Signature | Title | Date | ||
/s/ T. M. "Roe" Patterson | President, Chief Executive Officer and | February 28, 2018 | ||
T.M. "Roe" Patterson | Director (Principal Executive Officer) | |||
/s/ Alan Krenek | Senior Vice President, | February 28, 2018 | ||
Alan Krenek | Chief Financial Officer, | |||
Treasurer and Secretary | ||||
(Principal Financial Officer) | ||||
/s/ John Cody Bissett | Vice President, Controller and | February 28, 2018 | ||
John Cody Bissett | Chief Accounting Officer | |||
(Principal Accounting Officer) | ||||
/s/ Timothy H. Day | Chairman of the Board | February 28, 2018 | ||
Timothy H. Day | ||||
s/ John Jackson | Director | February 28, 2018 | ||
John Jackson | ||||
/s/ James D. Kern | Director | February 28, 2018 | ||
James D. Kern | ||||
/s/ Samuel E. Langford | Director | February 28, 2018 | ||
Samuel E. Langford | ||||
/s/ Julio Quintana | Director | February 28, 2018 | ||
Julio Quintana | ||||
/s/ Anthony J. DiNello | Director | February 28, 2018 | ||
Anthony J. DiNello | ||||
91