Attached files
| file | filename |
|---|---|
| EX-32.2 - EXHIBIT 32.2 - Advanced Disposal Services, Inc. | ads20171231ex322.htm |
| EX-32.1 - EXHIBIT 32.1 - Advanced Disposal Services, Inc. | ads20171231ex321.htm |
| EX-31.2 - EXHIBIT 31.2 - Advanced Disposal Services, Inc. | ads20171231ex312.htm |
| EX-31.1 - EXHIBIT 31.1 - Advanced Disposal Services, Inc. | ads20171231ex311.htm |
| EX-23.1 - EXHIBIT 23.1 - Advanced Disposal Services, Inc. | ads20171231ex231.htm |
| EX-21.1 - EXHIBIT 21.1 - Advanced Disposal Services, Inc. | ads20171231ex211.htm |
| EX-10.31 - EXHIBIT 10.31 - Advanced Disposal Services, Inc. | ads20171231ex1031.htm |
| EX-10.6 - EXHIBIT 10.6 - Advanced Disposal Services, Inc. | ads20171231ex106.htm |
| EX-4.2 - EXHIBIT 4.2 - Advanced Disposal Services, Inc. | ads20171231ex42.htm |
UNITED STATES
SECURITIES AND EXCHANGE COMMISSION
WASHINGTON, D.C. 20549
FORM 10-K
(Mark One)
ý | ANNUAL REPORT PURSUANT TO SECTION 13 OR 15(d) OF THE SECURITIES EXCHANGE ACT OF 1934 |
For the fiscal year ended December 31, 2017
OR
¨ | TRANSITION REPORT PURSUANT TO SECTION 13 OR 15(d) OF THE SECURITIES EXCHANGE ACT OF 1934 |
For the transition period from to
Commission file no: 001-37904
Advanced Disposal Services, Inc.
(Exact name of registrant as specified in its charter)
Delaware | 90-0875845 | |
(State or other jurisdiction of incorporation) | (IRS Employer Identification No.) | |
90 Fort Wade Road
Ponte Vedra, Florida 32081
(Address of principal executive offices) (Zip Code)
Registrant’s telephone number, including area code: (904) 737-7900
Securities registered pursuant to Section 12(b) of the Act:
Title of Each Class Common Stock, $0.01 par value | Name of Exchange on Which Registered New York Stock Exchange | |
Indicate by check mark if the registrant is a well-known seasoned issuer, as defined in Rule 405 of the Securities Act. Yes ý No ¨
Indicate by check mark if the registrant is not required to file reports pursuant to Section 13 or Section 15(d) of the Exchange Act. Yes ¨ No ý
Indicate by check mark whether the registrant (1) has filed all reports required to be filed by Section 13 or 15(d) of the Securities Exchange Act of 1934 during the preceding 12 months (or for such shorter period that the registrant was required to file such reports), and (2) has been subject to such filing requirements for the past 90 days. Yes ý No ¨
Indicate by check mark whether the registrant has submitted electronically and posted on its corporate web site, if any, every Interactive Data File required to be submitted and posted pursuant to Rule 405 of Regulation S-T (§232.405 of this chapter) during the preceding 12 months (or for such shorter period that the registrant was required to submit and post such files). Yes ý No ¨
Indicate by check mark if disclosure of delinquent filers pursuant to Item 405 of Regulation S-K (§229.405 of this chapter) is not contained herein, and will not be contained, to the best of registrant’s knowledge, in definitive proxy or information statements incorporated by reference in Part III of this Form 10-K or any amendment to this Form 10-K. ý
Indicate by check mark whether the registrant is a large accelerated filer, an accelerated filer, a non-accelerated filer, a smaller reporting company or an emerging growth company. See the definitions of “large accelerated filer,” “accelerated filer,” “smaller reporting company” and “emerging growth company” in Rule 12b-2 of the Exchange Act. (Check one):
Large accelerated filer | ý | Accelerated filer | ¨ | |||||
Non-accelerated filer | ¨ | (Do not check if a smaller reporting company) | Smaller reporting company | ¨ | ||||
Emerging growth company | ¨ | |||||||
If an emerging growth company, indicate by check mark if the registrant has elected not to use the extended transition period for complying with any new or revised financial accounting standards provided pursuant to Section 13(a) of the Exchange Act.
Indicate by check mark whether the registrant is a shell company (as defined in Rule 12b-2 of the Exchange Act). Yes ¨ No ý
The aggregate market value of the voting stock held by non-affiliates of the registrant at June 30, 2017 was approximately $972.8 million. The aggregate market value was computed by using the closing price of the common stock as of that date on the New York Stock Exchange (“NYSE”). (For purposes of calculating this amount only, all directors and executive officers of the registrant have been treated as affiliates.)
The number of shares of Common Stock, $0.01 par value, of the registrant outstanding at February 9, 2018 was 88,508,468 shares.
Documents Incorporated by Reference:
Document Proxy Statement for the 2018 Annual Shareholders Meeting | Incorporated as to Part III | |
Advanced Disposal Services, Inc.
Form 10-K
For the Fiscal Year Ended December 31, 2017
Table of Contents
Page | |
2
PART I
DISCLOSURE REGARDING FORWARD-LOOKING STATEMENTS
This report contains forward-looking statements within the meaning of the U.S. federal securities laws. All statements other than statements of historical facts in this document, including, without limitation, those regarding our business strategy, financial position, results of operations, plans, prospects and objectives of management for future operations (including development plans and objectives relating to our activities), are forward-looking statements. Many, but not all, of these statements can be found by looking for words like “expect,” “anticipate,” “goal,” “project,” “plan,” “believe,” “seek,” “will,” “may,” “forecast,” “estimate,” “intend,” “future” and similar words. Statements that address activities, events or developments that we intend, expect or believe may occur in the future are forward-looking statements within the meaning of Section 27A of the Securities Act of 1933, as amended, and section 21E of the Securities Exchange Act of 1934, as amended and are subject to safe harbor created by those sections. Forward-looking statements do not guarantee future performance and may involve risks, uncertainties and other factors which could cause our actual results, performance or achievements to differ materially from the future results, performance or achievements expressed or implied in those forward-looking statements.
Examples of these risks, uncertainties and other factors include, but are not limited to:
• | our ability to achieve future profitability will depend on us executing our strategy and controlling costs; |
• | future results may be impacted by the expiration of net operating losses (NOLs); |
• | our tax position may be affected by recent changes in U.S. tax law; |
• | we operate in a highly competitive industry and the inability to compete effectively with larger and better capitalized companies and governmental service providers; |
• | our results are vulnerable to economic conditions; |
• | we may lose contracts through competitive bidding, early termination or governmental action; |
• | some of our customers, including governmental entities, have suffered financial difficulties affecting their credit risk, which could negatively impact our operating results; |
• | our financial and operating performance may be affected by the inability in some instances to renew or expand existing landfill permits or acquire new landfills. Further, the cost of operation and/or future construction of our existing landfills may become economically unfeasible causing us to abandon or cease operations; |
• | we could be precluded from maintaining permits or entering into certain contracts if we are unable to obtain sufficient third-party financial assurance or adequate insurance coverage; |
• | our accruals for our landfill site closure, post-closure and contamination related costs may be inadequate; |
• | our cash flow may not be sufficient to finance our high level of capital expenditures; |
• | our acquisitions, including our ability to integrate acquired businesses, or that the acquired businesses may have unexpected risks or liabilities; |
• | the seasonal nature of our business and "event-driven" waste projects that could cause our results to fluctuate; |
• | adverse and destructive weather conditions that could result in higher fuel costs, higher labor costs, reduced municipal contract productivity and higher disposal costs; |
• | we may be subject in the normal course of business to judicial, administrative or other third-party proceedings that could interrupt or limit our operations, result in adverse judgments, settlements or fines and create negative publicity; |
3
• | fuel supply and prices may fluctuate significantly and we may not be able to pass on cost increases to our customers; |
• | fluctuations in the prices of commodities may adversely affect our financial condition, results of operations and cash flows; |
• | increases in labor and disposal costs and related transportation costs could adversely impact our financial results; |
• | efforts by labor unions could divert management attention and adversely affect operating results; |
• | we depend significantly on the services of the members of our senior, regional and local management teams, and the departure of any of those persons could cause our operating results to suffer; |
• | we are increasingly dependent on technology in our operations and, if our technology fails, our business could be adversely affected; |
• | a cybersecurity incident could negatively impact our business and our relationships with customers; |
• | operational and safety risks, including the risk of personal injury to employees and others; |
• | we are subject to substantial governmental regulation and failure to comply with these requirements, as well as enforcement actions and litigation arising from an actual or perceived breach of such requirements, could subject us to fines, penalties and judgments, and impose limits on our ability to operate and expand; |
• | our operations being subject to environmental, health and safety laws and regulations, as well as contractual obligations that may result in significant liabilities; |
• | future changes in laws or renewed enforcement of laws regulating the flow of solid waste in interstate commerce could adversely affect our operating results; |
• | fundamental change in the waste management industry as traditional waste streams are increasingly viewed as renewable resources and changes in laws and environmental policies may limit the items that enter the waste stream, any of which may adversely impact volumes and tipping fees at our landfills. Alternatives to landfill disposal may cause our revenues and operating results to decline; |
• | risks associated with our substantial indebtedness and working capital deficit; |
• | risks associated with our ability to implement our growth strategy as and when planned; and |
• | the other risks described in "Risk Factors." |
The above examples are not exhaustive and new risks may emerge from time to time. Except as required by law, we undertake no obligation to publicly update or revise any forward-looking statements, whether as a result of new information, future events or otherwise. Such forward-looking statements are based on our current beliefs, assumptions, expectations, estimates and projections regarding our present and future business strategies and the environment in which we will operate in the future. These forward-looking statements speak only as of the date of this report. We expressly disclaim any obligation or undertaking to release publicly any updates or revisions to any forward-looking statement contained herein to reflect any change in our expectations with regard thereto or any change of events, conditions or circumstances on which any such statement was based.
4
ITEM 1. BUSINESS
(All dollar amounts are presented in millions, unless otherwise noted)
Advanced Disposal Services, Inc. (hereafter referred to as the "Company") is a leading integrated provider of non-hazardous solid waste collection, transfer, recycling and disposal services operating primarily in secondary markets or under exclusive arrangements. We have a presence in 16 states across the Midwest, South and East regions of the United States as well as in the Commonwealth of the Bahamas, serving approximately 2.8 million residential customers and over 200,000 commercial and industrial ("C&I") customers through our extensive network of 93 collection operations, 73 transfer stations, 22 owned or operated recycling facilities and 40 owned or operated active landfills. Our headquarters are located in Ponte Vedra, Florida.
Our Strategy
We seek to drive financial performance in markets in which we own or operate a landfill or in certain disposal-neutral markets, where the landfill is owned by a municipality. In markets in which we own or operate a landfill, we aim to create and maintain vertically integrated operations through which we manage a majority of our customers' waste from the point of collection through the point of disposal, a process we refer to as internalization. By internalizing a majority of the waste in these markets, we are able to deliver high quality customer service while also ensuring a stable revenue stream and maximizing profitability and cash flow from operations. In disposal-neutral markets, we focus selectively on opportunities where we can negotiate exclusive arrangements with a municipal owned disposal site, facilitating highly-efficient and profitable collection operations with lower capital requirements. Geographically, we focus our business principally in secondary, or less densely populated non-urban, markets where the presence of large national providers is generally more limited. We also compete selectively in primary, or densely populated urban, markets where we can capitalize on opportunities for vertical integration through our high-quality transfer and disposal infrastructure and where we can benefit from highly-efficient collection route density.
Operations
Our vertically integrated environmental services operations can be broadly classified into three lines of business: (i) collection services; (ii) disposal services, which include transfer stations and landfills; and (iii) recycling services. The solid waste management business is locally executed where the geographic footprint, density of collection routes, degree of vertical integration, and regional demographic trends drive success. We serve both primary (densely populated) and secondary (less populated) markets. While primary markets typically offer highly efficient route densities, secondary markets provide other important advantages, such as less large national provider presence, greater opportunities to gain market share through new business and consolidation, and generally higher and more stable pricing.
Our operations are managed through three regional offices located in the South, Midwest and East regions of the United States. Each of the regions has a diversified portfolio of collection, transfer, landfill and recycling operations. The collection, transfer, landfill, and recycling operations within each of these operating regions are supervised by regional vice presidents with extensive experience in growing, operating and managing solid waste management companies within their local markets. Each regional vice president works with and supervises several district and general managers who manage facilities and operations.
The services we provide include non-hazardous solid waste collection, transfer, recycling and disposal services for residential, commercial and industrial customers, as described below. The following table shows revenues contributed by these services for each of the three years presented:
Year ended December 31, | ||||||||||||||||||||
2017 | 2016 | 2015 | ||||||||||||||||||
Collection | $ | 1,017.4 | 67.5 | % | $ | 977.4 | 69.6 | % | $ | 971.4 | 69.6 | % | ||||||||
Disposal | 542.5 | 36.0 | % | 517.9 | 36.9 | % | 499.0 | 35.7 | % | |||||||||||
Sale of recyclables | 33.2 | 2.2 | % | 22.6 | 1.6 | % | 24.8 | 1.8 | % | |||||||||||
Fuel and environmental charges | 103.9 | 6.9 | % | 88.5 | 6.3 | % | 85.8 | 6.1 | % | |||||||||||
Other | 104.4 | 6.9 | % | 74.7 | 5.3 | % | 82.2 | 5.9 | % | |||||||||||
Intercompany eliminations | (293.8 | ) | (19.5 | )% | (276.5 | ) | (19.7 | )% | (266.8 | ) | (19.1 | )% | ||||||||
Total | $ | 1,507.6 | 100.0 | % | $ | 1,404.6 | 100.0 | % | $ | 1,396.4 | 100.0 | % | ||||||||
5
Collection Services
We serve approximately 2.8 million residential customers, over 200,000 C&I customers and over 800 municipalities through our 93 collection operations. We internalized 63% of the waste collected into our own landfills for the year ended December 31, 2017. A total of 18% of our routed fleet uses compressed natural gas ("CNG"), which significantly reduces carbon emissions compared to diesel-fueled collection trucks. A total of 57% of our routed residential collection fleet uses automated side load trucks, which helps to reduce employee injuries. Collection revenue represents approximately 68% of our overall revenue.
Our residential collection operations consist of curbside collection of residential refuse from small carts or containers into collection vehicles for transport to a disposal/recycling site. These services are typically performed either under long-term contracts with local government entities or on a subscription basis, whereby individual households contract directly with us for our collection services. Our municipal residential contracts generally allow for annual rate increases.
We generally secure our contracts with municipalities through a competitive bid process and such contracts give us exclusive rights to service all or a portion of the homes in the respective municipalities. These contracts generally range in term from three to ten years. Municipal contracts can be designed as either mandatory or non-mandatory franchises. Mandatory franchises allow us to become the exclusive provider of waste management services for the areas of the municipality included in the contract, which requires all residential customers within those areas to use our services for solid waste collection and disposal. Non-mandatory franchises allow us to retain the exclusive right to service the specified areas of the municipality, with no competitor permitted to offer services to residential customers, but residential customers may choose not to use our services.
The fees that we receive for residential collection on an individual subscription basis are based primarily on market factors, frequency and type of service, the distance to the disposal facility and the cost of disposal. In general, subscription residential collection fees are paid quarterly or monthly in advance by the residential customers receiving the service and other residential services are paid in arrears. Residential revenue represents approximately 39% of our collection revenue.
For C&I operations, we supply our customers with waste containers suitable for their needs and rent or sell compactors to large waste generators. Standard service agreements with C&I customers are typically three to five years in length with pricing based on estimated disposal weight and time required to service the account. We generally bill commercial customers monthly in advance. Industrial customers are generally billed in arrears for our services. The customer generally may not cancel C&I standard service agreements for a period of five years from the start of service without incurring a cancellation penalty. In addition, contracts typically are renewed automatically unless the customer specifically requests cancellation. Our standard C&I service contracts generally allow for rate increases and represent approximately 37% of our overall collection revenue.
Our construction and demolition ("C&D") waste services provide C&D sites with rolloff containers and waste collection, transportation and disposal services. C&D services are typically provided pursuant to arrangements in which the customer provides 24-hour advance notice of its disposal needs and is billed on a "per pull" plus disposal basis. While the majority of our rolloff services are provided to customers under long-term contracts, we generally do not enter into contracts with our C&D customers that utilize temporary rolloff containers due to the relatively short-term nature of most C&D projects. Our temporary rolloff customers pay us in arrears for our services. Our construction and demolition ("C&D") waste services represent approximately 24% of our overall collection revenue.
Disposal Services
Landfill disposal services represent the final stage in our vertically integrated waste collection and disposal services solution. We own or operate 33 active municipal solid waste ("MSW") landfills, and 7 active C&D landfills as of December 31, 2017, enabling us to offer comprehensive service to our customers. For the year ended December 31, 2017, our landfills accepted 16.8 million tons of waste. We charge tipping fees to third parties. Third party disposal revenue represents approximately 18% of our overall revenue.
As of December 31, 2017, our landfills had approximately 351.3 million cubic yards of utilized airspace and total permitted and deemed permitted airspace of approximately 990.9 million cubic yards. Our active landfills that are currently accepting waste have an average of 36.7 years of aggregate remaining permitted and deemed permitted life. The in-place capacity of our landfills is subject to change based on engineering factors, requirements of regulatory authorities, our ability to continue to operate our landfills in compliance with applicable regulations and our ability to successfully renew operating permits and obtain expansion permits at our sites. Some of our landfills accept non-hazardous special waste, including utility ash, asbestos and contaminated soils.
6
We monitor the availability of permitted disposal capacity at each of our landfills and evaluate whether to pursue an expansion at a given landfill based on estimated future waste volumes and prices, market needs, remaining capacity and the likelihood of obtaining an expansion. To satisfy future disposal demand, we are currently seeking to expand permitted capacity at 15 of our landfills and we may seek expanded permitted capacity at other landfills in the future. However, we cannot assure you that all proposed or future expansions will be permitted as designed.
We also have responsibility for 3 C&D and 2 MSW closed landfills, for which we have associated closure and post-closure obligations. The post-closure period generally runs for 30 years after final site closure for landfills.
As part of our vertically integrated solid waste disposal services, we operate 73 transfer stations. Transfer stations receive, consolidate and transfer solid waste to landfills and recycling facilities. Transfer stations enable us to:
• | increase the operational reach of our landfill operations; |
• | increase the volume of disposal revenue at our landfills; |
• | achieve greater leverage in negotiating more favorable disposal rates at landfills that we do not operate; |
• | improve efficiency of collection, personnel and equipment; and |
• | build relationships with municipalities and other operators that deliver waste to our transfer stations, leading to additional growth and acquisition opportunities. |
Revenue at transfer stations is primarily generated by charging tipping or disposal fees. Our collection operations deposit waste at these transfer stations, as do other private and municipal haulers, for compaction and transfer to disposal sites or material recycling facilities ("MRFs"). Transfer stations provide collection operations with a cost-effective means to consolidate waste and reduce transportation costs while providing our landfill sites with an additional “gate” to extend the geographic reach of a particular landfill site with the goal of increased internalization.
Recycling Services
We are focused on opportunistically developing our base of recycling facilities. There has been a growing interest in recycling, which is driven by public and private markets that are placing environmental stewardship as a top priority. This is evidenced by requests for proposals that incorporate alternate methods to manage the collection, processing and disposal of waste.
We have a network of 22 recycling facilities that we manage or operate. These facilities generate revenue through the collection, processing and sale of old corrugated cardboard, old newspaper, mixed paper, aluminum, glass and other materials. These recyclable materials are internally collected by our residential, commercial and industrial collection operations as well as third-party haulers.
Fuel and Environmental Charges
The amounts charged for collection, disposal, transfer, and recycling services may include fuel charges and environmental charges. Fuel charges and environmental charges are not designed to be specific to the direct costs to service an individual customer’s account, but rather are designed to help recover changes in our overall cost structure and to achieve an acceptable operating margin.
Other Services
Other revenue is comprised of ancillary revenue-generating activities, such as landfill gas-to-energy operations at MSW landfills, management of third-party owned landfills, customer service charges relating to overdue payments and customer administrative fees relating to customers who request paper copies of invoices rather than opting for electronic invoices, and broker revenue.
Customers
We provide services to a broad base of commercial, industrial, municipal and residential customers. No single customer individually accounted for more than 2% of our consolidated revenue in fiscal 2017.
Competition
Although we operate in a highly competitive industry, entry into our business and the ability to operate profitably requires substantial amounts of capital and managerial experience. Competition in the non-hazardous solid waste industry comes from a few large, national publicly owned companies, several regional publicly and privately owned solid waste companies, and thousands of small privately owned companies. In any given market, competitors may have larger operations and greater resources. In addition to national and regional firms and numerous local companies, we compete with municipalities that maintain waste collection or disposal operations. These municipalities may have financial advantages due to the availability of tax revenue and tax-exempt financing.
7
We compete for collection accounts primarily on the basis of price and the quality of our services. From time to time, our competitors reduce the price of their services in an effort to expand market share or to win a competitively bid municipal contract. Our ability to maintain and increase prices in certain markets may be impacted by our competitors’ pricing policies. This may have an impact on our future revenue and profitability.
Seasonality and Severe Weather
Based on historic trends, we expect our operating results to vary seasonally, with revenues typically lowest in the first quarter, higher in the second and third quarters, and lower in the fourth quarter than in the second and third quarters. This seasonality reflects the lower volume of solid waste generated during the late fall, winter and early spring because of decreased construction and demolition activities during the winter months in the U.S. and reduced drilling activity during harsh weather conditions. Conversely, mild winter weather conditions may reduce demand for oil and natural gas, which may cause some of our mining and exploration customers to curtail their drilling programs, which could result in production of lower volumes of waste.
Adverse winter weather conditions slow waste collection activities, resulting in higher labor and operational costs. Greater precipitation in the winter increases the weight of collected waste, resulting in higher disposal costs, which are calculated on a per ton basis and increased leachate disposal costs. Certain destructive weather conditions that tend to occur during the second half of the year, such as hurricanes that most often impact the South region, can increase the Company’s revenues in the areas affected. While weather-related and other occurrences can boost revenues through additional work, the earnings generated can be moderated as a result of higher labor costs and other factors, resulting in earnings at comparatively lower margins. These destructive weather conditions can result in higher fuel costs, higher labor costs, reduced municipal contract productivity and higher disposal costs in disposal neutral markets. These factors impact period-to-period comparisons of financial results.
Regulation
Our facilities and operations are subject to a variety of federal, state and local requirements that regulate the environment, public health, safety, zoning and land use. Operating and other permits, licenses and other approvals are required for landfills and transfer stations, recycling facilities, certain solid waste collection vehicles, fuel storage tanks and other facilities that we own or operate. These permits are subject to denial, revocation, suspension, modification and renewal in certain circumstances. Federal, state and local laws and regulations vary, but generally govern wastewater or storm water discharges, air emissions, the handling, transportation, treatment, storage and disposal of hazardous and non-hazardous waste, and the remediation of contamination associated with the release or threatened release of hazardous substances. These laws and regulations provide governmental authorities with strict powers of enforcement, which include the ability to revoke or decline to renew environmental or other permits, obtain injunctions, or impose fines or penalties in the event of violations, including criminal penalties. The United States Environmental Protection Agency (the “EPA”) and various other federal, state and local authorities administer these regulations.
We strive to conduct our operations in compliance with applicable laws, regulations and permits. However, from time to time we have been issued notices and citations from governmental authorities that have resulted in fines, penalties, the need to expend funds for compliance with environmental laws and regulations, remedial work and related activities at various landfills and other facilities. We cannot assure you that citations and notices will not be issued in the future or that any such notice or citation will not have a material effect on our operations or results.
Federal Regulation
The following summarizes the primary federal environmental and occupational health and safety-related statutes that affect our facilities and operations:
The Resource Conservation and Recovery Act ("RCRA"), as amended, regulates handling, transporting and disposing of hazardous and non-hazardous waste and delegates authority to states to develop programs to ensure the safe disposal of solid waste. In 1991, the EPA issued its final regulations under Subtitle D of RCRA, which set forth minimum federal performance and design criteria for solid waste landfills. These regulations are typically implemented by the states, although states can impose requirements that are more stringent than the Subtitle D standards. Occasionally, the condensates or other materials generated during our operations may be classified as a "regulated hazardous waste," and require special handling, transport and treatment. As a result, some of our operations are subject to RCRA, and comparable state laws, which impose requirements for the handling, storage, treatment and disposal of hazardous waste. Owners and operators of facilities that generate hazardous waste must obtain an EPA ID number and comply with generator requirements, including proper containerization, storage, handling, transportation and disposal. RCRA also imposes extensive recordkeeping and reporting obligations. We incur costs in complying with these standards in the ordinary course of our operations.
8
The Comprehensive Environmental Response, Compensation and Liability Act of 1980, as amended, ("CERCLA") which is also known as Superfund, provides for authorized federal authorities to respond directly to releases or threatened releases of hazardous substances into the environment that have created actual or potential environmental hazards. CERCLA's primary means for addressing such releases is to impose strict liability for cleanup of certain contaminated or disposal sites upon current and former site owners and operators, generators of the hazardous substances at the site and transporters who selected the disposal site and transported substances thereto. Liability under CERCLA is strict, joint and several and not dependent on the intentional release of hazardous substances; it can be based upon the release or threatened release, even as a result of lawful, unintentional and non-negligent action, of hazardous substances as the term is defined by CERCLA and other applicable statutes and regulations. The EPA may issue orders requiring responsible parties to perform response actions at sites, or the EPA may seek recovery of funds expended or to be expended in the future at sites. Liability may include contribution for cleanup costs incurred by a defendant in a CERCLA civil action or by an entity that has previously resolved its liability to federal or state regulators in an administrative or judicially-approved settlement. Liability under CERCLA could also include obligations to a potentially responsible party that voluntarily expends site clean-up costs. Further, liability for damage to publicly-owned natural resources may also be imposed. We are subject to potential liability under CERCLA as an owner or operator of facilities at which hazardous substances have been disposed and as an arranger, generator or transporter of hazardous substances disposed of at other locations.
The Federal Water Pollution Control Act of 1972, as amended, known as the Clean Water Act, regulates the discharge of pollutants into streams, rivers, groundwater, or other surface waters from a variety of sources, including solid and hazardous waste disposal sites. If run-off from our operations may be discharged into surface waters, the Clean Water Act requires us to apply for and obtain discharge permits, conduct sampling and monitoring, and, under certain circumstances, reduce the quantity of pollutants in those discharges. In 1990, the EPA issued additional standards for management of storm water runoff that require landfills and other waste-handling facilities to obtain storm water discharge permits. In addition, if a landfill or other facility discharges wastewater through a sewage system to a publicly-owned treatment works, the facility must comply with discharge limits imposed by the treatment works. Also, before the development or expansion of a landfill can alter or affect wetlands, a permit may have to be obtained providing for mitigation or replacement wetlands. The Clean Water Act provides for civil, criminal and administrative penalties for violations of its provisions.
The Clean Air Act provides for increased federal, state and local regulation of the emission of air pollutants. Certain of our operations are subject to the requirements of the Clean Air Act, including large MSW landfills and landfill gas-to-energy facilities. In 1996 the EPA issued new source performance standards (“NSPS”) and emission guidelines (“EG”) controlling landfill gases from new and existing large landfills. In January 2003, the EPA issued Maximum Achievable Control Technology (“MACT”) standards for MSW landfills subject to the NSPS. These regulations impose limits on air emissions from large MSW landfills, subject most of our large MSW landfills to certain operating permit requirements under Title V of the Clean Air Act and, in many instances, require installation of landfill gas collection and control systems to control emissions or to treat and utilize landfill gas on- or off-site. The EPA entered into a settlement agreement with the Environmental Defense Fund to evaluate the 1996 NSPS for new landfills as required by the Clean Air Act every eight years and revise them if deemed necessary. The EPA issued a new NSPS rule in fiscal 2016. In May 2017, EPA issued a 90-day administrative stay of these new NSPS rules, but after environmental groups challenged the stay in the D.C. Court of Appeals, EPA decided not to further extend the stay. The new NSPS rule applies to landfills constructed or modified after July 17, 2014, and imposes requirements on independent operators of landfill gas and renewable natural gas facilities. We assessed the capital and operating cost impact to our operations of the new NSPS rule. The regulatory changes did not have a material adverse impact on our business as a whole.
In 2010, the EPA issued the Prevention of Significant Deterioration (“PSD”) and Title V Green House Gases (“GHG”) Tailoring Rule, which expanded the EPA’s federal air permitting authority to include the six GHGs, including methane and carbon dioxide. The rule sets new thresholds for GHG emissions that define when Clean Air Act permits are required. The requirements of these rules have not significantly affected our operations or cash flows, due to the tailored thresholds and exclusions of certain emissions from regulation.
In June 2014, however, the U.S. Supreme Court issued a decision that significantly limited the applicability and scope of EPA permitting requirements for GHGs from stationary sources, concluding that the EPA may not treat GHGs as an air pollutant for purposes of determining whether a source is required to obtain a PSD or Title V permit, although the court also concluded that the EPA can continue to require that PSD permits, which are otherwise required based on emissions of conventional pollutants, contain limitations on GHG emissions based on Best Available Control Technology. In November 2014, the EPA issued a policy memorandum advising that it intends to propose exempting biogenic carbon dioxide emissions from waste-derived feedstocks (MSW and landfill gas) from PSD and Title V air permitting. The EPA based this proposal on the rationale that those emissions are likely to have minimal or no net atmospheric contributions, or even reduce such impacts, when compared to an alternate method of disposal. In August 2017, EPA’s Science Advisory Board announced in the Federal Register a public meeting to discuss a draft report on the November 2014 policy memorandum. As a result of this U.S. Supreme Court ruling and EPA
9
policy action, the anticipated impact of the PSD and Title V GHG Tailoring Rule on our air permits, compliance and results of operations is not expected to have a material impact on our operations or results.
On August 3, 2015, the EPA published the final Clean Power Plan setting C02 emission performance standards for affected electric generating units and requiring states to submit State Implementation Plans for reducing GHG emissions from affected sources and for meeting their C02 emission reduction goals. At the time, the Clean Power Plan contemplated that states may choose to meet their emission reduction obligations through a variety of measures including landfill gas. The final Clean Power Plan and the Proposed Federal Implementation Plan notes that states may choose to rely on waste derived biogenic feedstocks in their future proposed compliance plans, which, if it went forward, could create new or expanded opportunities for renewable energy projects.
There is a great deal of uncertainty, however, regarding the fate of the Clean Power Plan and, more broadly, the future of the regulation of GHG emissions from electric generating units. On February 10, 2016, the Supreme Court granted a petition to stay the plan pending the resolution of challenges being heard in the D.C. Circuit Court of Appeals. On March 28, 2017, President Trump signed an executive order that called for the review of the plan. In October 2017, the EPA took the first administrative steps to repeal the plan, and, in December 2017, the EPA announced it would also replace the plan. It is anticipated that the EPA’s efforts to repeal and replace the Clean Power Plan will be challenged by various states and environmental groups. At this time, it is unclear to us whether the Clean Power Plan will be implemented or effectively repealed and replaced, what the provisions of any replacement might require, and how any replacement might treat waste derived biogenic feedstocks or otherwise impact our business.
Other recent final and proposed rules to increase the stringency of certain National Ambient Air Quality Standards, such as the Ozone rule promulgated in October 2015, and related PSD increment/significance thresholds could affect the cost, timeliness and availability of air permits for new and modified large MSW landfills and landfill gas to energy facilities. In general, controlling emissions involves installing collection wells in a landfill and routing the gas to a suitable energy recovery system or combustion device. As of December 31, 2017, we owned five landfill gas to energy facilities and we had eleven active projects at solid waste landfills where landfill gas is captured and utilized for its renewable energy value rather than flared. Efforts to curtail the emission of GHGs and to ameliorate the effect of climate change may require our landfills to deploy more stringent emission controls, with associated capital or operating costs; however, we do not believe that such regulations will have a material adverse impact on our business as a whole. The adoption of climate change legislation or regulations restricting emissions of GHGs could increase our costs to operate.
Potential climate change and GHG regulatory initiatives have influenced our business strategy to provide low-carbon services to our customers, and we increasingly view our ability to offer lower carbon services as a key component of our business growth. If the U.S. were to impose a carbon tax or other form of GHG regulation increasing demand for low-carbon service offerings in the future, the services we are developing will be increasingly valuable.
In 2011, the EPA published the Non-Hazardous Secondary Materials (“NHSM”) Rule, which provides the standards and procedures for identifying whether NHSM are solid waste under RCRA when used as fuels or ingredients in combustion units. The EPA published clarifications and amendments to these rules in February 2013, and then issued a further amendment in February 2016, adding three additional categories of non-waste fuels. In 2011, the EPA also published NSPS and EGS for commercial and industrial solid waste incineration units (CISWI), and MACT Standards for commercial and industrial boilers. As a result of litigation surrounding the CISWI rules, EPA took additional regulatory actions in 2013 and 2016. Although the recently published amendments are generally favorable to our industry, some of the potential regulatory interpretations are undergoing review and other regulatory outcomes may be dependent on case-by-case administrative determinations. These could have a significant impact on some of our projects in which we are seeking to convert biomass or other secondary materials into products, fuels or energy. Therefore, it is not possible to quantify the financial impact of these rulemakings or pending administrative determinations at the present time. However, we believe the rules and administrative determinations will not have a material adverse impact on our business as a whole and are more likely to facilitate our efforts to reuse or recover energy value from secondary material streams.
In April 2015, the EPA issued a final rule regulating the disposal and beneficial use of coal and combustion residuals (“CCR”) as a solid waste (as opposed to a hazardous waste) under the Resource Conservations and Recovery Act. Then, in July 2016, EPA issued a related direct final rule on CCR. In September 2017, EPA announced it would reconsider parts of the rule and litigation is currently pending in the D.C. Court of Appeals as a result of lawsuits brought by both industry and environmental groups. The regulations encourage beneficial use of CCR in encapsulated uses (e.g. used in cement or wallboard), and use according to established industry standards (e.g. application of sludge for agricultural enrichment). The EPA also deemed disposal and beneficial use of CCR at permitted MSW landfills exempt from the new regulations because the RCRA Subtitle D standards applicable at MSW landfills provide at least equivalent protection. The new standards are consistent with our approach to handling CCR at our sites currently, and we believe the new standards will provide a potential growth opportunity for us. States may impose standards more stringent than the federal program, and we will be monitoring state implementation to determine impact.
10
Additionally, emission and fuel economy standards have been imposed on manufacturers of transportation vehicles (including waste collection vehicles). The EPA continues to evaluate and develop regulations to increase fuel economy standards and reduce vehicle emissions. Such regulations could increase the costs of operating our fleet, but we do not believe any such regulations would have a material adverse impact on our business as a whole.
The Occupational Safety and Health Act of 1970, as amended, establishes certain employer responsibilities, including maintenance of a workplace free of recognized hazards likely to cause death or serious injury, compliance with standards promulgated by the Occupational Safety and Health Administration (“OSHA”), and various reporting and record keeping obligations as well as disclosure and procedural requirements. Various standards for notices of hazards, safety in excavation and demolition work and the handling of asbestos, may apply to our operations. The Department of Transportation and OSHA, along with other federal agencies, have jurisdiction over certain aspects of hazardous materials and hazardous waste, including safety, movement and disposal. Various state and local agencies with jurisdiction over disposal of hazardous waste may seek to regulate movement of hazardous materials in areas not otherwise preempted by federal law.
State and Local Regulation
Each state in which we operate has its own laws and regulations governing solid waste disposal, water and air pollution, and, in most cases, releases and cleanup of hazardous substances and liabilities for such matters. States also have adopted regulations governing the design, operation, maintenance and closure of landfills and transfer stations. Some counties, municipalities and other local governments have adopted similar laws and regulations. In addition, our operations may be affected by the trend in many states toward requiring solid waste reduction and recycling programs. For example, several states have enacted laws that require counties or municipalities to adopt comprehensive plans to reduce, through solid waste planning, composting, recycling or other programs, the volume of solid waste deposited in landfills. Additionally, laws and regulations restricting the disposal of certain waste in solid waste landfills, including yard waste, newspapers, beverage containers, unshredded tires, lead-acid batteries, electronic wastes and household appliances, have been adopted in several states and are being considered in others. Legislative and regulatory measures to mandate or encourage waste reduction at the source and waste recycling also have been or are under consideration by the U.S. Congress and the EPA.
To construct, operate and expand a landfill, we must obtain one or more construction or operating permits, as well as zoning and land use approvals. These permits and approvals may be burdensome to obtain and to comply with, are often opposed by neighboring landowners and citizens’ and environmental groups, may be subject to periodic renewal, and are subject to denial, modification, non-renewal and revocation by the issuing agency. Significant compliance disclosure obligations often accompany these processes. In connection with our acquisition of existing landfills, we may be required to spend considerable time, effort and money to bring the acquired facilities into compliance with applicable requirements and to obtain the permits and approvals necessary to increase their capacity. While we typically take into account the costs to bring an asset into compliance with applicable requirements during the acquisition process, we may incur costs beyond those estimated in the pre-acquisition stage.
Other Regulations
Many of our facilities own and operate above ground or underground storage tanks that are generally used to store petroleum-based products. These tanks are subject to federal, state and local laws and regulations that mandate their periodic testing, upgrading, closure and removal. In the event of leaks or releases from these tanks, these regulations require that polluted groundwater and soils be remediated. While we believe that all of our underground storage tanks currently meet applicable regulatory requirements in all material respects, there can be no guarantee that some tanks will not fail to meet such requirements in the future. We maintain a storage tank liability policy which, subject to limitations and exclusions, provides coverage for first-party remediation and third-party claims.
With regard to our solid waste transportation operations, we are subject to the jurisdiction of the Surface Transportation Board and are regulated by the Federal Highway Administration, Office of Motor Carriers, and by regulatory agencies in states that regulate such matters. Various state and local government authorities have adopted, or are considering adopting, laws and regulations that would restrict the transportation of solid waste across state, county, or other jurisdiction lines. In 1978, the U.S. Supreme Court ruled that a law that restricts the importation of out-of-state solid waste is unconstitutional; however, states have attempted to distinguish proposed laws from those involved in and implicated by that ruling. In 1994, the U.S. Supreme Court ruled that a flow control law, which attempted to restrict solid waste from leaving its place of generation, imposes an impermissible burden upon interstate commerce and is unconstitutional. However, in 2007, the U.S. Supreme Court upheld the right of a local government to direct the flow of solid waste to a publicly owned and publicly operated waste facility. A number of county and other local jurisdictions have enacted ordinances or other regulations restricting the free movement of solid waste across jurisdictional boundaries. Other governments may enact similar regulations in the future. These regulations may, in some cases, cause a decline in volumes of waste delivered to our landfills or transfer stations and may increase our costs of disposal.
11
Emissions from Natural Gas Fueling and Infrastructure
We operate a fleet of 444 CNG vehicles and we plan to continue to transition a portion of our collection fleet from diesel fuel to CNG, in locations where it is cost beneficial. We have constructed and operate natural gas fueling stations. Concerns have been raised about the potential for emissions from the fueling stations and infrastructure that serve natural gas-fueled vehicles. Additional regulation of, or restrictions on, CNG fueling infrastructure could increase our operating costs. We are not yet able to evaluate potential operating changes or costs associated with such regulations, but we do not anticipate that such regulations would have a material adverse impact on our business as a whole or our current plan to continue transitioning to CNG vehicles.
Liabilities Established for Landfill and Environmental Costs
We have established reserves for landfill and environmental costs, which include landfill site final capping, closure and post-closure costs and costs for contamination-related obligations. We periodically reassess such costs based on various methods and assumptions regarding landfill airspace and the technical requirements of Subtitle D of RCRA, and we adjust our rates used to expense final capping, closure and post-closure costs accordingly. Based on current information and regulatory requirements, we believe that our recorded reserves for such landfill and environmental expenditures are adequate. However, environmental laws and regulations may change, and we cannot assure you that our recorded reserves will be adequate to cover requirements under existing or new environmental laws and regulations, future changes or interpretations of existing laws and regulations, or adverse environmental conditions previously unknown to us.
Liability Insurance and Bonding
The nature of our business exposes us to the risk of liabilities arising out of our operations, including possible damages to the environment. Such potential liabilities could involve, for example, claims for remediation costs, personal injury, property damage and damage to the environment, claims of employees, customers or third parties for personal injury or property damage occurring in the course of our operations, or claims alleging negligence or other wrongdoing in the planning or performance of work. We also could be subject to fines and civil and criminal penalties in connection with alleged violations of regulatory requirements which could be significant. Our solid waste operations have third-party environmental liability insurance with limits in excess of those required by permit regulations, subject to certain limitations and exclusions. However, we cannot assure you that our environmental liability insurance would be adequate, in scope or amount, in the event of a major loss, nor can we assure you that we would continue to carry excess environmental liability insurance should market conditions in the insurance industry make such coverage costs prohibitive.
We maintain general liability, vehicle liability, employment practices liability, fiduciary liability, pollution liability, directors and officers’ liability, workers’ compensation and employer’s liability coverage, as well as umbrella liability policies to provide excess coverage over the underlying limits contained in these primary policies. We also carry property insurance. Although we try to operate safely and prudently and we have, subject to limitations and exclusions, substantial liability insurance, we cannot assure you that we will not be exposed to uninsured liabilities that could have a material adverse effect on our consolidated financial condition, results of operations and cash flows.
Our insurance programs for workers’ compensation, general liability, vehicle liability and employee-related health care benefits are effectively self-insured. Claims in excess of self-insurance levels are insured subject to the excess policy limits and exclusions. Accruals are based on claims filed and actuarial estimates of claims development and claims incurred but not reported ("IBNR"). Due to the variable condition of the insurance market, we have experienced, and may experience in the future, increased self-insurance retention levels and increased premiums. As we assume more risk for self-insurance through higher retention levels, we may experience more variability in our self-insurance reserves and expense.
In the normal course of business, we post performance bonds, insurance policies, letters of credit, or cash or marketable securities deposits in connection with municipal residential collection contracts, closure and post-closure of landfills, environmental remediation, environmental permits and business licenses and permits as a financial guarantee of our performance. To date, we have satisfied financial responsibility requirements by making cash or marketable securities deposits or by obtaining bank letters of credit, insurance policies or surety bonds. The amount of surety bonds issued by third parties at December 31, 2017 was $749.2 and our outstanding letters of credit amounted to $39.3.
Employees
As of December 31, 2017, we had approximately 5,939 employees, approximately 14% of whom were covered by collective bargaining agreements. From time to time, our operating locations may experience union organizing efforts. We have not historically experienced any significant work stoppages. We currently have no disputes or bargaining circumstances that we believe could cause significant disruptions in our business. Our management believes we have good relations with our employees.
12
AVAILABLE INFORMATION
We were incorporated in fiscal 2012 in the state of Delaware. Our corporate website address is http://www.advanceddisposal.com. The information on our website is not incorporated by reference in this annual report on Form 10-K. We make our reports on Forms 10-K, 10-Q and 8-K and any amendments to such reports available on our website free of charge as soon as reasonably practicable after we file them with or furnish them to the Securities and Exchange Commission ("SEC"). The public may read and copy any materials we file with the SEC at the SEC’s Public Reference Room at 100 F Street, NE, Washington, DC, 20549. The public may obtain information on the operation of the Public Reference Room by calling the SEC at 1-800-SEC-0330. The SEC maintains an internet website at http://www.sec.gov that contains reports, proxy and information statements, and other information regarding issuers that file electronically with the SEC.
ITEM 1A. RISK FACTORS
Our ability to achieve future profitability will depend on us executing on our strategy and controlling costs; future results may be impacted by expiration of NOLs.
Although our business generates significant Adjusted EBITDA and free cash flow, we have significant non-cash expenses, such as depreciation, depletion and amortization, that are common in waste management businesses and can be increased substantially by acquisitions. These non-cash expense items have had, and may continue to have, a significant impact on our reported pre-tax and after-tax profit or loss. In addition, our ability to continue to achieve profitability will depend on our successfully executing on our strategy of developing vertically integrated geographic operations while maintaining a consistent operational focus on prudent cost management and pricing discipline. If we fail to achieve and maintain profitability, we may be unable to utilize all of our net operating losses prior to expiration, which may affect after-tax results in subsequent periods.
Our tax position may be affected by recent changes in U.S. tax law.
On December 22, 2017, the Tax Cuts and Jobs Act of 2017 (the “TCJA” or the “Act”) was signed into law making significant changes to the Internal Revenue Code. These changes include, but are not limited to, reducing the U.S. corporate income tax rate from 35% to 21% for tax years beginning after December 31, 2017, allowing an immediate expensing of certain tangible assets placed in service before 2023, limiting the deduction for net interest expense, limiting the use of newly-generated net operating losses to offset 80% of future taxable income, repealing the corporate alternative minimum tax, providing for the refund of Alternative Minimum Tax Credits, and making substantial changes to the U.S. taxation of foreign operations. The limitations on deductions for net interest expense and net operating loss utilization could cause us to have higher taxable income in subsequent years.
In response to the TCJA, the states in which we are subject to income tax may enact changes to their tax law. Any state tax law changes may materially impact our provision for income taxes in the periods in which the changes are enacted.
We operate in a highly competitive industry and may not be able to compete effectively with larger and better capitalized companies and governmental service providers.
Our industry is highly competitive and requires substantial labor and capital resources. Some of the markets in which we compete or plan to compete are served by one or more large, national companies, as well as by regional and local companies of varying sizes and resources, some of which may have accumulated substantial goodwill in their markets. Some of our competitors may also be better capitalized than we are, have greater name recognition than we do or be able to provide or be willing to bid their services at a lower price than we may be willing to offer. Our inability to compete effectively could hinder our growth or adversely impact our operating results.
We also compete with counties, municipalities and solid waste districts that maintain or could in the future choose to maintain their own waste collection and disposal operations, including through the implementation of flow control ordinances or similar legislation. These operators may have financial advantages over us because of their access to user fees and similar charges, tax revenues, tax-exempt financing or government subsidies
We may lose contracts through competitive bidding, early termination or governmental action.
We derive a significant portion of our revenues from markets in which we have exclusive arrangements, including municipal contracts. Our municipal contracts are for a specified term and are or will be subject to competitive bidding in the future. Although we intend to bid on additional municipal contracts in our target markets, we may not always, or ever, be the successful bidder. In addition, some or all of our customers, including municipalities, may terminate their contracts with us prior to their scheduled expiration dates. Similar risks may affect contracts that we are awarded to operate municipally owned assets, such as landfills.
13
Governmental action may also affect our exclusive arrangements. Municipalities may annex unincorporated areas within counties where we provide collection services. As a result, our customers in such annexed areas may be required to obtain services from competitors that have been franchised by the annexing municipalities to provide those services. In addition, municipalities in which we provide services on a competitive basis may elect to franchise those services. Unless we are
awarded franchises by these municipalities, we will lose customers. Municipalities may also decide to directly provide services to their residents, on an optional or mandatory basis, which may cause us to lose customers. If we are not able to replace lost revenues resulting from unsuccessful competitive bidding, early termination or the renegotiation of existing contracts with other revenues within a reasonable time period, our results of operations and financial condition could be adversely affected. Additionally, the loss of municipal contracts through competitive bidding, early termination or governmental action could cause long lived tangible and intangible assets to be impaired and require a charge against earnings.
Our results are vulnerable to economic conditions.
Our business and financial results would be harmed by downturns in the general economy, or in the economy of the regions in which we operate as well as other factors affecting those regions. In an economic slowdown, we experience the negative effects of decreased waste generation, increased competitive pricing pressure, customer turnover, reductions in customer service requirements, and customer business closings and bankruptcies. Two lines of business that could see a more immediate impact would be 1) construction and demolition waste collection and disposal and 2) special waste disposal. In addition, a weaker economy may result in declines in recycled commodity prices. Worsening economic conditions or a prolonged or recurring economic recession could adversely affect our operating results and expected seasonal fluctuations. Further, we cannot assure you that any improvement in economic conditions after such a downturn will result in positive improvement in our operating results or cash flows.
Some of our customers, including governmental entities, have suffered financial difficulties affecting their credit risk, which could negatively impact our operating results.
We provide service to a number of governmental entities and municipalities, some of which have suffered significant financial difficulties due to the downturn in the economy, reduced tax revenue and/or high cost structures. Some of these entities could be unable to pay amounts owed to us or renew contracts with us at previous or increased rates. Many non-governmental customers have also suffered serious financial difficulties, including bankruptcy in some cases. Purchasers of our recyclable commodities can be particularly vulnerable to financial difficulties in times of commodity price volatility. The inability of our customers to pay us in a timely manner or to pay increased rates, particularly large national accounts, could negatively affect our operating results.
Our financial and operating performance may be affected by the inability in some instances to renew or expand existing landfill permits or acquire new landfills. Further, the cost of operation and/or future construction of our existing landfills may become economically unfeasible causing us to abandon or cease operations.
We currently own or operate 40 active landfills. Our ability to meet our financial and operating objectives may depend in part on our ability to acquire, lease or renew landfill permits, expand existing landfills and develop new landfill sites. It has become increasingly difficult and expensive to obtain required permits and approvals to build, operate and expand solid waste management facilities, including landfills and transfer stations. Operating permits for landfills in states where we operate generally must be renewed periodically (typically, every five to ten years). These operating permits often must be renewed several times during the permitted life of a landfill pursuant to a process that is often time-consuming, requires numerous hearings and compliance with zoning, environmental and other requirements, is frequently challenged by special interest and other groups and may result in the denial of a permit or renewal, the award of a permit or renewal for a shorter duration than we believed was otherwise required by law or the imposition of burdensome terms and conditions that may adversely affect our results of operations. We may not be able to obtain new landfill sites in order to expand into new, non-exclusive markets or expand existing landfill sites in order to support acquisitions and internal growth in our existing markets because increased volumes would further shorten the lives of these landfills. It is also possible that the operation or expansion of existing landfills may become economically infeasible based on management's assessment of permitting issues, acceptable waste streams, available volumes and operating costs, in which case we may abandon expansion plans or abandon or cease operations entirely at a particular landfill. Any such decision could result in impairment charges as well as ongoing costs for closure and site remediation. See ‘‘Management’s Discussion and Analysis of Financial Condition and Results of Operations—Critical Accounting Policies and Estimates—Landfill Accounting—Amortization of Landfill Assets.’’
We could be precluded from entering into or maintaining permits or certain contracts if we are unable to obtain sufficient third-party financial assurance or adequate insurance coverage.
Public solid waste collection, recycling and disposal contracts, and obligations associated with landfill closure and post-closure monitoring typically require us to obtain performance or surety bonds, letters of credit or other means of financial assurance to secure our contractual performance. We currently obtain performance and surety bonds from multiple financial institutions. However, if we are unable to obtain financial assurance in the future in sufficient amounts from appropriately rated sureties or
14
at acceptable rates, we could be precluded from entering into additional municipal contracts or from obtaining or retaining landfill management contracts or operating permits. Any future difficulty in obtaining insurance could also impair our ability to secure future contracts conditioned upon having adequate insurance coverage.
Our accruals for our landfill site closure and post-closure costs and contamination-related costs may be inadequate.
We are required to pay capping, closure and post-closure maintenance costs for all of our landfill sites. Our obligations to pay closure or post-closure costs or other contamination-related costs may exceed the amount we have accrued and reserved, amounts we can recover from compensating price adjustments and other amounts available from funds or reserves established to pay such costs. In addition, subsequent to the completion or closure of a landfill site, we may be liable for unforeseen environmental issues, which could result in our payment of substantial remediation costs that could adversely affect our financial condition or operating results. See ‘‘Management’s Discussion and Analysis of Financial Condition and Results of Operations—Critical Accounting Policies and Estimates—Landfill Accounting—Amortization of Landfill Assets.’’
Our business requires a high level of capital expenditures.
Our business is capital-intensive. We must use a substantial portion of our cash flows from operating activities toward capital expenditures, which reduces our flexibility to use such cash flows for other purposes, such as reducing our indebtedness. Our capital expenditures could increase if we make acquisitions or further expand our operations or as a result of factors beyond our control, such as changes in federal, state, local or non-U.S. governmental requirements. The amount that we spend on capital expenditures may exceed current expectations, which may require us to obtain additional funding for our operations or impair our ability to grow our business.
We may engage in strategic acquisitions in the future, which may pose significant risks and could have an adverse effect on our operations.
We seek to grow through strategic acquisitions in addition to organic growth. We may engage in acquisitions in order to acquire or develop additional disposal capacity or businesses that are complementary to our core business strategy. We expect that increased consolidation in the solid waste services industry will continue to reduce the number of attractive acquisition candidates. If we identify suitable acquisition candidates, we may be unable to negotiate successfully their acquisition at a price or on terms and conditions acceptable to us, including as a result of the limitations imposed by our debt obligations. We may have to borrow money or incur liabilities in order to finance any future obligations and we may not be able to do so on terms favorable to us or at all. In addition, we may be unable to obtain the necessary regulatory approvals to complete potential acquisitions. The integration of acquired businesses and other assets may require significant management time and resources that would otherwise be available for the ongoing management of our existing operations. Furthermore, acquired assets may be subject to liabilities and risks that were not identified at the time they were acquired.
A portion of our growth and future financial performance depends on our ability to integrate acquired businesses and the success of our acquisitions.
One component of our growth strategy involves achieving economies of scale and operating efficiencies by growing through acquisitions. We may not achieve these goals unless we are able to effectively combine the operations of acquired businesses with our existing operations. Similar risks may affect contracts that we are awarded to operate municipally-owned assets, such as landfills. In addition, we are not always able to control the timing of our acquisitions. Our inability to complete acquisitions within the time frames that we expect may cause our operating results to be less favorable than expected.
Even if we are able to make acquisitions on advantageous terms and are able to integrate them successfully into our operations and organization, some acquisitions may not fulfill our anticipated financial or strategic objectives in a given market due to factors that we cannot control, such as the price of crude oil, market position, competition, customer base, loss of key employees, third-party legal challenges or governmental actions. In addition, we may change our strategy with respect to a market or acquired businesses and decide to sell such operations at a loss, or keep those operations and recognize an impairment of goodwill and/or intangible assets. Additionally, the loss of municipal contracts through competitive bidding, early termination or governmental action could cause long lived tangible and intangible assets to be impaired and require a charge against earnings. Similar risks may affect contracts that we are awarded to operate municipally owned assets, such as landfills.
Each business that we acquire or have acquired may have liabilities or risks that we fail or are unable to discover, or that become more adverse to our business than we anticipated at the time of acquisition.
It is possible that the operations or sites we have acquired in the past, or which we may acquire in the future, have liabilities or risks with respect to former or existing operations or properties, or otherwise, which we have not been able to identify and assess through our due diligence investigations. As a successor owner, we may be legally responsible for those liabilities that arise from businesses that we acquire. Even if we obtain legally enforceable representations, warranties and indemnities from the sellers of such businesses, they may not cover the liabilities fully or the sellers may not have sufficient funds to perform
15
their obligations. Some environmental liabilities, even if we do not expressly assume them, may be imposed on us under various regulatory schemes and other applicable laws regardless of whether we caused or contributed to any conditions that result in such liabilities. In addition, our insurance program may not cover such sites and will not cover liabilities associated with some environmental issues that may have existed prior to attachment of coverage. A successful uninsured claim against us could harm our financial condition or operating results. Furthermore, risks or liabilities of which we are unaware or we judge to be not material or remote at the time of acquisition may develop into more serious risks to our business. Any adverse outcome resulting from such risks or liabilities could harm our operations and financial results and create negative publicity, which could damage our reputation and competitive position.
The seasonal nature of our business and "event-driven" waste projects cause our results to fluctuate.
Based on historic trends, we expect our operating results to vary seasonally, with revenues typically lowest in the first quarter, higher in the second and third quarters, and lower in the fourth quarter than in the second and third quarters. This seasonality reflects the lower volume of solid waste generated during the late fall, winter and early spring because of decreased construction and demolition activities during the winter months in the U.S. and reduced drilling activity during harsh weather conditions. Conversely, mild winter weather conditions may reduce demand for oil and natural gas, which may cause our customers to curtail their drilling programs, which could result in production of lower volumes of waste.
Our business is located mainly in the Southern, Midwestern and Eastern United States. Therefore, our business, financial condition and results of operations are susceptible to downturns in the general economy in these geographic regions and other factors affecting the regions, such as state regulations and severe weather conditions.
Adverse winter weather conditions slow waste collection activities, resulting in higher labor and operational costs. Greater precipitation in the winter increases the weight of collected waste, resulting in higher disposal costs, which are calculated on a per ton basis and increased leachate disposal costs. Certain destructive weather conditions that tend to occur during the second half of the year, such as hurricanes that most often impact the South region, can increase the Company’s revenues in the areas affected. While weather-related and other occurrences can boost revenues through additional work, the earnings generated can be moderated as a result of significant start-up costs and other factors, resulting in earnings at comparatively lower margins. These destructive weather conditions can result in higher fuel costs, higher labor costs, reduced municipal contract productivity and higher disposal costs in disposal neutral markets. These factors impact period-to-period comparisons of financial results.
We may be subject in the normal course of business to judicial, administrative or other third-party proceedings that could interrupt or limit our operations, result in adverse judgments, settlements or fines and create negative publicity.
Individuals, citizens groups, trade associations, community groups or environmental activists may bring actions against us in connection with our operations that could interrupt or limit the scope of our business. Many of these matters raise difficult and complicated factual and legal issues and are subject to uncertainties and complexities. The timing of the final resolutions to lawsuits, regulatory inquiries, and governmental and other legal proceedings is uncertain. Additionally, the possible outcomes or resolutions to these matters could include adverse judgments or settlements, either of which could require substantial payments or other financial obligations. Any adverse outcome in such proceedings could harm our operations and financial results and create negative publicity, which could damage our reputation and competitive position.
Fuel supply and prices may fluctuate significantly and we may not be able to pass on cost increases to our customers.
The price and supply of fuel can fluctuate significantly based on international, political and economic circumstances, as well as other factors outside our control, such as actions by the Organization of the Petroleum Exporting Countries and other gas producers, regional production patterns, weather conditions, political instability in oil and gas producing regions and environmental concerns. We rely on fuel to run our collection and transfer trucks and our equipment used in our transfer stations and landfill operations. Supply shortages could substantially increase our operating expenses. Additionally, as fuel prices increase, our direct and indirect operating expenses increase and many of our vendors raise their prices as a means to offset their own rising costs.
Over the last several years, regulations have been adopted mandating changes in the composition of fuels for motor vehicles. The renewable fuel standards that the EPA sets annually affect the type of fuel our motor vehicle fleet uses. Pursuant to the Energy Independence and Security Act of 2007, the EPA establishes annual renewable fuel volume requirements and separate volume requirements for four different categories of renewable fuels (renewable fuel, advanced biofuel, cellulosic biofuel and biomass-based diesel). These volume requirements set standards for the proportion of refiners' or importers' total fuel volume that must be renewable and must take into account the fuels' impact on GHG emissions. These regulations are one of many factors that may affect the cost of the fuel we use.
Our operations also require the use of products (such as liners at our landfills), the costs of which may vary with the price of petrochemicals. An increase in the price of petrochemicals could increase the cost of those products, which would increase our operating and capital costs. We are also susceptible to increases in indirect fuel surcharges from our vendors.
16
We are expanding our CNG truck fleet, which makes us increasingly dependent on the availability of CNG and CNG fueling infrastructure and vulnerable to CNG prices.
We currently operate CNG trucks which make up a portion of our fleet. We plan to continue to transition an additional portion of our collection fleet from diesel fuel to CNG. However, CNG is not yet broadly available in North America; as a result, we have constructed and operate natural gas fueling stations, some of which also serve the public or pre-approved third parties. Until the public and third parties in North America broadly adopt CNG, which may not be on the timetable we anticipate, it will remain necessary for us to invest capital in CNG fueling infrastructure in order to power our CNG fleet. Concerns have been raised about the potential for emissions from fueling infrastructure that serve natural gas-fueled vehicles. New regulation of, or restrictions on, CNG fueling infrastructure or reductions in associated tax incentives could increase our operating costs.
Additionally, fluctuations in the price and supply of CNG could substantially increase our operating expenses, and a reduction in the existing cost differential between CNG and diesel fuel could materially reduce the benefits we anticipate from our investment in CNG vehicles.
Fluctuations in the prices of commodities may adversely affect our financial condition, results of operations and cash flows.
We collect and process recyclable materials such as paper, cardboard, plastics, aluminum and other metals for sale to third parties. Our results of operations may be affected by changing prices or market requirements for recyclable materials. The resale and purchase prices of, and market demand for, recyclable materials fluctuate due to changes in economic conditions and numerous other factors beyond our control. These fluctuations may affect our financial condition, results of operations and cash flows.
Increases in labor and disposal and related transportation costs could impact our financial results.
Our continued success will depend on our ability to attract and retain qualified personnel. We compete with other businesses in our markets for qualified employees. From time to time, the labor supply is tight in some of our markets. A shortage of qualified employees, such as truck drivers or mechanics, would require us to enhance our wage and benefits packages to compete more effectively for employees, to hire more expensive temporary employees or to contract for services with more expensive third-party vendors. Labor is one of our highest costs and relatively small increases in labor costs per employee could materially affect our cost structure. If we fail to attract and retain qualified employees, control our labor costs during periods of declining volumes or recover any increased labor costs through increased prices we charge for our services or otherwise offset such increases with cost savings in other areas, our operating margins could suffer. Disposal and related transportation costs are a significant cost category for us. If we incur increased disposal and related transportation costs to dispose of solid waste and if we are unable to pass these costs on to our customers, our operating results would suffer.
Efforts by labor unions could divert management attention and adversely affect operating results.
From time to time, labor unions attempt to organize our employees. Some groups of our employees are represented by unions, and we have negotiated collective bargaining agreements with most of these groups. We are currently engaged in negotiations with other groups of employees represented by unions. Additional groups of employees may seek union representation in the future. From time to time, we are subject to unfair labor practice charges, complaints and other legal, administrative and arbitration proceedings initiated against us by unions, the National Labor Relations Board or our employees, which could negatively impact our operating results. Negotiating collective bargaining agreements could divert management attention, which could also adversely affect operating results. If we are unable to negotiate acceptable collective bargaining agreements, we may be subject to labor disruptions, such as union-initiated work stoppages, including strikes. Depending on the type and duration of any labor disruptions, our operating expenses could increase significantly, which could adversely affect our financial condition, results of operations and cash flows.
We could face significant withdrawal liability if we withdraw either individually or as part of a mass withdrawal from participation in any underfunded multiemployer pension plans in which we participate.
We participate in a number of "multiemployer" pension plans administered by employer and employee trustees. We make periodic contributions to these plans pursuant to our various contractual obligations to do so. In the event that we withdraw from participation in or otherwise cease our contributions to one of these plans, then applicable law regarding withdrawal liability could require us to make additional contributions to the plan if it is underfunded, and we would have to reflect that as an expense in our consolidated statement of operations and as a liability on our consolidated balance sheet. Our withdrawal liability that would be paid to any multiemployer plan would depend on the extent of the plan's funding of vested benefits. In the ordinary course of our renegotiation of collective bargaining agreements with labor unions that participate in these plans, we may decide to discontinue participation in a plan, and in that event, we could face a withdrawal liability. Some multiemployer plans in which we participate may from time to time have significant underfunded liabilities. Such underfunding could increase the size of our potential withdrawal liability.
17
Increases in insurance costs and the amount that we self-insure for various risks could reduce our operating margins and reported earnings.
We maintain high deductible insurance policies for automobile, general, employer's, environmental, directors' and officers', employment practices and fiduciary liability as well as for employee group health insurance, property insurance and workers' compensation. We carry umbrella policies for certain types of claims to provide excess coverage over the underlying policies and per incident deductibles. The amounts that we self-insure could cause significant volatility in our operating margins and reported earnings based on the occurrence and claim costs of incidents, accidents, injuries and adverse judgments. Our insurance accruals are based on claims filed and estimates of claims incurred but not reported and are developed by our management with assistance from our third-party actuary and our third-party claims administrator. To the extent these estimates are inaccurate, we may recognize substantial additional expenses in future periods that would reduce operating margins and reported earnings. From time to time, actions filed against us include claims for punitive damages, which are generally excluded from coverage under all of our liability insurance policies. A punitive damage award could have an adverse effect on our reported earnings in the period in which it occurs. Significant increases in premiums on insurance that we retain also could reduce our margins.
We may record material charges against our earnings due to any number of events that could cause impairments to our assets.
In accordance with Generally Accepted Accounting Principles ("GAAP"), we capitalize certain expenditures and advances relating to disposal site development, expansion projects, acquisitions, software development costs and other projects. Additionally, we record long term tangible and intangible assets in relation to businesses we acquire. Events that could, in some circumstances, lead to an impairment of these assets include, but are not limited to, shutting down a facility or operation, abandoning a development project, the denial of an expansion permit or the loss of a municipal contract through the competitive bidding process, early termination or government action. Additionally, declining waste volumes and development of, and customer preference for, alternatives to traditional waste disposal could warrant asset impairments. If we determine an asset or expansion project is impaired, we will charge against earnings any unamortized capitalized expenditures and advances relating to such asset or project reduced by any portion of the capitalized costs that we estimate will be recoverable, through sale or otherwise. We also carry a significant amount of goodwill on our Consolidated Balance Sheet, which is required to be assessed for impairment annually, and more frequently in the case of certain triggering events. We may be required to incur charges against earnings if such impairment tests indicate that the fair value of a reporting unit is below its carrying value. Any such charges could have a material adverse effect on our results of operations.
We depend significantly on the services of the members of our senior, regional and local management teams, and the departure of any of those persons could cause our operating results to suffer.
Our success depends significantly on the continued individual and collective contributions of our senior, regional and local management teams. The loss of the services of any member of our senior, regional or local management or the inability to hire and retain experienced management personnel could have a material adverse effect on us.
If we are not able to develop new service offerings or if a competitor develops or obtains exclusive rights to a breakthrough technology, our financial results may suffer.
Our existing and proposed service offerings to customers may require that we invest in, develop or license, and protect, new technologies. We may experience difficulties or delays in the research, development, production or marketing of new services, which may negatively impact our operating results and prevent us from recouping or realizing a return on the investments required to bring new services to market. We and others in the industry are increasingly focusing on new technologies that provide alternatives to traditional disposal and maximize the resource value of waste. If a competitor develops or obtains exclusive rights to a breakthrough technology that provides a revolutionary change in traditional waste management, our financial results may suffer.
Our business is subject to operational and safety risks, including the risk of personal injury to employees and others.
Provision of environmental and waste management services involves risks such as truck accidents, equipment defects, malfunctions and failures, structural landfill failures, fires and natural disasters, which could potentially result in releases of hazardous materials, injury or death of employees and others or a need to shut down or reduce operation of our facilities while remedial actions are undertaken. These risks expose us to potential liability for pollution and other environmental damages, personal injury, loss of life, business interruption and property damage or destruction.
While we seek to minimize our exposure to such risks through comprehensive training and compliance programs, as well as vehicle and equipment maintenance programs, if we were to incur substantial liabilities in excess of any applicable insurance, our business, results of operations and financial condition could be adversely affected.
18
The adoption of new accounting standards or interpretations could adversely affect our financial results.
Our implementation of and compliance with changes in accounting rules and interpretations could adversely affect our operating results or cause unanticipated fluctuations in our results in future periods. The accounting rules and regulations that we must comply with are complex and continually changing. Recent actions and public comments from the SEC have focused on the integrity of financial reporting. The Financial Accounting Standards Board (the "FASB") has recently introduced several new or proposed accounting standards, or is developing new proposed standards, which would represent a significant change from current industry practice. In addition, many companies' accounting policies are being subjected to heightened scrutiny by regulators and the public. While our financial statements have been prepared in accordance with GAAP, we cannot predict the impact of future changes to accounting principles or our accounting policies on our financial statements in the future.
We are subject to substantial governmental regulation and failure to comply with these requirements, as well as enforcement actions and litigation arising from an actual or perceived breach of such requirements, could subject us to fines, penalties and judgments, and impose limits on our ability to operate and expand.
We are subject to potential liability and restrictions under environmental laws and regulations, including those relating to the transportation, recycling, treatment, storage and disposal of wastes, discharges of pollutants to air and water, and the remediation of contaminated soil, surface water and groundwater. The waste management industry has been and will continue to be subject to regulation, including permitting and related financial assurance requirements, as well as attempts to further regulate the industry, including efforts to regulate the emission of GHG. Our operations are subject to a wide range of federal, state and, in some cases, local environmental, odor and noise and land use restrictions. Further restrictions could include:
• | limitations on siting and constructing new waste disposal, transfer, recycling or processing facilities or on expanding existing facilities; |
• | regulations or levies on collection and disposal prices, rates and volumes; |
• | limitations or bans on disposal or transportation of out-of-state waste or certain categories of waste; |
• | mandates regarding the management of solid waste, including requirements to recycle, divert or otherwise process certain waste, recycling and other streams; or |
• | limitations or restrictions on the recycling, processing or transformation of waste, recycling and other streams. |
Regulations affecting the siting, design and closure of landfills could require us to undertake investigatory or remedial activities, curtail operations or close landfills temporarily or permanently. Future changes in these regulations may require us to modify, supplement or replace equipment or facilities. The costs of complying with these regulations could be substantial. In order to develop, expand or operate a landfill or other waste management facility, we must have various facility permits and other governmental approvals, including those relating to zoning, environmental protection and land use. These permits and approvals are often difficult, time consuming and costly to obtain and could contain conditions that limit our operations.
We also have significant financial obligations relating to final capping, closure, post-closure and environmental remediation at our existing landfills. We establish accruals for these estimated costs, but we could underestimate such accruals. Environmental regulatory changes could accelerate or increase capping, closure, post-closure and remediation costs, requiring our expenditures to materially exceed our current accruals.
Legislation allowing restrictions on interstate transportation of out-of-state or out-of-jurisdiction waste and certain types of flow control, or judicial interpretations of interstate waste and flow control legislation, could adversely affect our solid and hazardous waste management services.
Additionally, regulations establishing extended producer responsibility ("EPR") are being considered or implemented in many places around the world, including in the U.S. EPR regulations are designed to place either partial or total responsibility on producers to fund the post-use life cycle of the products they create. Along with the funding responsibility, producers may be required to take over management of local recycling programs by taking back their products from end users or managing the collection operations and recycling processing infrastructure. There is no federal law establishing EPR in the U.S.; however, state and local governments could, and in some cases have, taken steps to implement EPR regulations. If wide-ranging EPR regulations were adopted, they could have a fundamental impact on the waste streams we manage and how we operate our business, including contract terms and pricing. A significant reduction in the waste, recycling and other streams we manage could have a material adverse effect on our financial condition, results of operations and cash flows.
Enforcement or implementation of foreign regulations can affect our ability to export products. In 2013, the Chinese government began to strictly enforce regulations that establish limits on moisture and non-conforming materials that may be contained in imported recycled paper and plastics. The higher quality expectations resulting from initiatives such as Operation
19
Green Fence can drive up operating costs in the recycling industry, particularly for single stream MRFs. Single stream MRFs process a wide range of commingled materials and tend to receive a higher percentage of non-recyclables, which results in increased processing and residual disposal costs. If Operation Green Fence or other similar initiatives or new regulations increase our operating costs in the future, and we are not able to recapture those costs from our customers, such regulations could have a material adverse effect on our results of operations.
If we are not able to comply with the requirements that apply to a particular facility or if we operate without the necessary approvals or permits, we could be subject to administrative or civil, and possibly criminal, fines and penalties, and we may be required to spend substantial capital to bring an operation into compliance, to temporarily or permanently discontinue activities and/or take corrective actions, possibly including the removal or relocation of landfilled materials. We may be liable for any environmental damage that our current or former facilities cause, including damage to neighboring landowners or residents, particularly as a result of the contamination of soil, groundwater or surface water, and especially drinking water, or to natural resources. We may also be liable for any on-site environmental contamination caused by pollutants or hazardous substances whose transportation, treatment or disposal we or our predecessors arranged or conducted. Those costs or actions could be significant to us and impact our results of operations, cash flows and available capital. We may not have sufficient insurance coverage for our environmental liabilities, such coverage may not cover all of the potential liabilities to which we may be subject and we may not be able to obtain insurance coverage in the future at reasonable expense or at all.
We may make additional acquisitions from time to time in the future, and we have tried and will continue to try to evaluate and limit environmental risks and liabilities presented by businesses to be acquired prior to the acquisition. It is possible that some liabilities, including ones that may exist only because of the past operations of an acquired business, may prove to be more difficult or costly to address than we anticipate.
It is also possible that government officials responsible for enforcing environmental laws and regulations may believe an issue is more serious than we expect, or that we will fail to identify or fully appreciate an existing liability before we become legally responsible for addressing it. Some of the legal sanctions to which we could become subject could cause the suspension or revocation of a needed permit, prevent us from, or delay us in, obtaining or renewing permits to operate or expand our facilities, or harm our reputation.
Future changes in regulations applicable to oil and gas drilling and production could adversely affect our energy services business.
Our energy services business may be adversely affected if drilling activity slows due to industry conditions beyond our control, in addition to changes in oil and gas prices. Changes in laws or government regulations regarding GHG emissions from oil and gas operations and/or hydraulic fracturing could increase our customer's costs of doing business and reduce oil and gas exploration and production by customers. Recently, there has been increased attention from the public, some states and the EPA to the alleged potential for hydraulic fracturing to impact drinking water supplies. There is also heightened regulatory focus on emissions of methane that occur during drilling and transportation of natural gas, as well as protective disposal of drilling residuals. Increased regulation of oil and gas exploration and production and new rules regarding the treatment and disposal of wastes associated with exploration and production operations could increase our costs to provide oilfield services, decrease demand for our energy services business and reduce our margins and revenue from such services.
Our operations are subject to environmental, health and safety laws and regulations, as well as contractual obligations that may result in significant liabilities.
There is risk of incurring significant environmental, health and safety liabilities in the use, treatment, storage, transfer and disposal of waste materials. Under applicable environmental laws and regulations, we could be liable if our operations have a negative impact on human health or cause environmental damage to our properties or to the property of other landowners, particularly as a result of the contamination of air, drinking water or soil. Under current law, we could also be held liable for damage caused by conditions that existed before we acquired the assets or operations involved. This risk is of particular concern as we execute our growth strategy, partially through acquisitions, because we may be unsuccessful in identifying and assessing potential liabilities during our due diligence investigations. Further, the counterparties in such transactions may be unable to perform their indemnification obligations owed to us. Our operations include the hauling of medical waste and the hauling and disposal of asbestos. If, notwithstanding our efforts, we inadvertently arrange for the transportation, disposal or treatment of hazardous substances that cause environmental contamination, or if a predecessor owner made such arrangements and, under applicable law, we are treated as a successor to the prior owner, we could be held liable. Any substantial liability for environmental damage or violations of health and safety laws and regulations could have a material adverse effect on our financial condition, results of operations and cash flows.
In the ordinary course of our business, we have in the past, we are currently, and we may in the future, become involved in legal and administrative proceedings relating to land use and environmental laws and regulations. These include proceedings in which:
20
• | agencies of federal, state, local or foreign governments seek to impose liability on us under applicable statutes, sometimes involving civil or criminal penalties for violations, or to revoke or deny renewal of a permit we need; |
• | local communities, citizen groups, landowners or governmental agencies oppose the issuance of a permit or approval we need, allege violations of the permits under which we operate or laws or regulations to which we are subject or seek to impose liability on us for environmental damage. |
We generally seek to work with the authorities or other persons involved in these proceedings to resolve any issues raised. If we are not successful, the adverse outcome of one or more of these proceedings could result in, among other things, material increases in our costs or liabilities as well as material charges for asset impairments.
The adoption of climate change legislation or regulations restricting emissions of GHGs could increase our costs to operate.
Our landfill operations emit methane, which is identified as a GHG. There are a number of legislative and regulatory efforts at the state, regional and federal levels to curtail the emission of GHGs to ameliorate the effect of climate change, though the Trump administration has pulled back from these initiatives on a federal level. In 2010, the EPA published a PSD and Title V GHG Tailoring Rule, which expanded the EPA’s federal air permitting authority to include the six GHGs. The rule set new thresholds for GHG emissions that define when the Clean Air Act of 1970, as amended (the “Clean Air Act”), permits are required. The U.S. Supreme Court, however, in June 2014, issued a decision limiting the applicability and scope of EPA permitting requirements for GHGs from stationary sources. On August 3, 2015, the EPA finalized the Clean Power Plan rule, which regulates C02 emissions from existing power plants, and the Carbon Pollution Standards for new, modified, and reconstructed power plants. The implementation of the Clean Power Plan, however, has been stayed by the U.S. Supreme Court, and the EPA has proposed repealing and replacing the plan. On July 15, 2016, the EPA published updates to its 1996 Emission Guidelines for existing MSW landfills that further reduce methane emissions. In a simultaneous rulemaking, the EPA published updated requirements for reducing methane emissions from new and modified landfills. In 2017, under the Trump Administration, the EPA announced a 90-day administrative stay delaying the implementation of the methane rules. In January 2018, the EPA decided not to extend the stay, but it is also not currently imposing any compliance deadlines.
Moreover, in August 2016, the EPA and the Department of Transportation’s National Highway Traffic Safety Administration (“NHTSA”) finalized a national program that would establish the next phase of GHG emissions and fuel efficiency standards for medium and heavy-duty vehicles. Industry groups have filed legal challenges to the rulemaking before the D.C. Circuit Court of Appeals. On May 8, 2017, the D.C. Circuit Court of Appeals granted a motion by the EPA and the NHTSA to hold the litigation challenging the rule in abeyance while the agencies evaluate a petition to reconsider the rule filed by one of the rule’s challengers. The current requirements of these rules have not significantly affected our operations or cash flows, due to the tailored thresholds and exclusions of certain emissions from regulation. However, if certain changes to these regulations were enacted, such as lowering the thresholds or the inclusion of biogenic emissions, then the amendments could have an adverse effect on our operating costs. More broadly, comprehensive federal climate change legislation could impose costs on our operations that might not be offset by the revenue increases associated with our lower-carbon service options, the materiality of which we cannot predict.
Future changes in laws or renewed enforcement of laws regulating the flow of solid waste in interstate commerce could adversely affect our operating results.
Various state and local governments have enacted, or are considering enacting, laws and regulations that restrict the disposal within the jurisdiction of solid waste generated outside the jurisdiction. In addition, some state and local governments have promulgated, or are considering promulgating, laws and regulations which govern the flow of waste generated within their respective jurisdictions. These "flow control" laws and regulations typically require that waste generated within the jurisdiction be directed to specified facilities for disposal or processing, which could limit or prohibit the disposal or processing of waste in our transfer stations and landfills. Such flow control laws and regulations could also require us to deliver waste collected by us within a particular jurisdiction to facilities not owned or controlled by us, which could increase our costs and reduce our revenues. In addition, such laws and regulations could require us to obtain additional costly licenses or authorizations to be deemed an authorized hauler or disposal facility.
The waste management industry is undergoing fundamental change as traditional waste streams are increasingly viewed as renewable resources and changes in laws and environmental policies may limit the items that enter the waste stream, any of which may adversely impact volumes and tipping fees at our landfills. Alternatives to landfill disposal may cause our revenues and operating results to decline.
As we have continued to develop our landfill capacity, the waste management industry has increasingly recognized the value of the waste stream as a renewable resource and new alternatives to landfilling are being developed that seek to maximize the renewable energy and other resource benefits of waste. We are increasingly competing with companies that seek to use parts of the waste stream as feedstock for renewable energy supplies. In addition, environmental initiatives, such as product stewardship
21
and EPR, which hold manufacturers or other actors in the product life cycle responsible for the disposal of manufactured goods, may reduce the volume of products that enter the waste stream. Further, there may be changes in the laws that reclassify items in the waste stream as hazardous or that prohibit the disposal of certain wastes in our landfills. These alternatives and changes in laws may impact the demand for landfill space, which may affect our ability to operate our landfills at full capacity, as well as the tipping fees and prices that we can charge for utilization of landfill space. As a result, our revenues and operating margins could be adversely affected.
Counties and municipalities in which we own and operate landfills may be required to formulate and implement comprehensive plans to reduce the volume of solid waste deposited in landfills through waste planning, composting, recycling or other programs. Some state and local governments prohibit the disposal of certain types of wastes, such as yard waste, at landfills. Such actions have reduced and may in the future further reduce the volume of waste going to landfills in certain areas, which may affect our ability to operate our landfills at full capacity and could adversely affect our operating results.
We rely on computer systems to run our business and security breaches could disrupt or damage our internal operations, information technology systems or reputation and expose us to litigation risk.
We may experience problems with the operation of our current information technology systems or the technology systems of third parties on which we rely, as well as the development and deployment of new information technology systems, that could adversely affect, or even temporarily disrupt, all or a portion of our operations until resolved. Inabilities and delays in implementing new systems can also affect our ability to realize projected or expected cost savings.
We use computers in substantially all aspects of our business operations. We also use mobile devices, social networking and other online activities to connect with our employees and our customers. Such uses give rise to cyber security risks, including security breach, espionage, system disruption, hacking, cyber-attack, theft and inadvertent release of information. Our business involves the storage and transmission of numerous classes of sensitive and/or confidential information and intellectual property, including customers' personal information, private information about employees, and our financial and strategic information. Further, as we pursue our strategy to grow through strategic acquisitions in addition to internal growth, our technological presence and corresponding exposure to cyber security risk will increase. If we fail to assess and identify cyber security risks associated with acquisitions and new initiatives, we may become increasingly vulnerable to such risks.
Despite our implementation of network security measures, computer programmers and hackers, or even internal users, may be able to penetrate, create systems disruptions or cause shutdowns of our network security or that of third-party companies with which we have contracted. As a result, we could experience significant disruptions of our operations and incur significant expenses addressing problems created by these breaches. Such unauthorized access could disrupt our business and could result in a loss of revenue or assets and any compromise of customer information could subject us to customer or government litigation and harm our reputation, which could adversely affect our business and growth.
Many states have adopted breach of data security statutes or regulations that require notification to consumers if the security of their personal information is breached. Governmental focus on data security may lead to additional legislative action, and the increased emphasis on information security may lead customers to request that we take additional measures to enhance security. As a result, we may have to modify our business with the goal of further improving data security, which would result in increased expenses and operating complexity.
Risks Related to Our Indebtedness
Our indebtedness could adversely affect our financial condition and limit our financial flexibility.
As of December 31, 2017, we had approximately $1,989.7 of indebtedness outstanding and made cash interest payments of $86.2 for fiscal 2017. We may incur additional debt in the future. This amount of our indebtedness could:
• | increase our vulnerability to general adverse economic and industry conditions or increases in interest rates; |
• | limit our ability to obtain additional financing or refinancing at attractive rates; |
• | require the dedication of a substantial portion of our cash flow from operations to the payment of principal of, and interest on, our indebtedness, thereby reducing the availability of such cash flow to fund our growth strategy, working capital, capital expenditures, dividends, share repurchases and other general corporate purposes; |
• | limit our flexibility in planning for, or reacting to, changes in our business and the industry; and |
• | place us at a competitive disadvantage relative to our competitors with less debt. |
22
Further, our outstanding indebtedness is subject to financial and other covenants, which may be affected by changes in economic or business conditions or other events that are beyond our control. If we fail to comply with the covenants under any of our indebtedness, we may be in default under the documents governing such indebtedness, which may entitle the lenders thereunder to accelerate the debt obligations. A default under any of our indebtedness could result in cross-defaults under our other indebtedness. In order to avoid defaulting on our indebtedness, we may be required to take actions such as reducing or delaying capital expenditures, reducing or eliminating dividends or stock repurchases, selling assets, restructuring or refinancing all or part of our existing debt or seeking additional equity capital, any of which may not be available on terms that are favorable to us, if at all.
Despite our high indebtedness level, we and our subsidiaries may still be able to incur significant additional amounts of debt, which could further exacerbate the risks associated with our substantial indebtedness.
We and our subsidiaries may be able to incur substantial additional indebtedness in the future. Although the agreements governing our indebtedness contain restrictions on incurring additional indebtedness, these restrictions are subject to a number of significant qualifications and exceptions and, under certain circumstances, the amount of indebtedness that could be incurred in compliance with these restrictions could be substantial.
Our debt agreements contain restrictions that limit our flexibility in operating our business.
The agreements governing our outstanding indebtedness and our existing Senior Secured Credit Facilities contain various covenants that limit our ability to engage in specified types of transactions. These covenants may limit our ability and the ability of our restricted subsidiaries, under certain circumstances, to, among other things:
• | incur additional indebtedness and issue certain preferred stock; |
• | pay dividends on, repurchase or make distributions in respect of capital stock or make other restricted payments; |
• | place limitations on distributions from restricted subsidiaries; |
• | issue or sell capital stock of restricted subsidiaries; |
• | guarantee certain indebtedness; |
• | make certain investments; |
• | sell or exchange assets; |
• | enter into transactions with affiliates; |
• | create certain liens; and |
• | consolidate, merge or transfer all or substantially all of our assets and the assets of our subsidiaries on a consolidated basis. |
A breach of any of these covenants could result in a default under one or more of these agreements, including as a result of cross default provisions, and, in the case of our existing revolving credit facility, permit the lenders to call the loans or cease making loans to us.
We may utilize derivative financial instruments to reduce our exposure to market risks from changes in interest rates on our variable rate indebtedness and we will be exposed to risks related to counterparty credit worthiness or non-performance of these instruments.
We may enter into interest rate caps to limit our exposure to changes in variable interest rates. Such instruments will result in economic losses should interest rates not rise above the strike price in the derivative contracts. We will be exposed to credit-related losses which could impact the results of operations in the event of fluctuations in the fair value of the interest rate caps due to a change in the credit worthiness or non-performance by the counterparties to the interest rate caps. See Note 7, Derivative Instruments and Hedging Activities, to our audited consolidated financial statements included elsewhere in this Form 10-K.
23
Risks Related to Ownership of Our Common Stock
Because we have no current plans to pay cash dividends on our common stock for the foreseeable future, you may not receive any return on investment unless you sell your common stock for a price greater than what you paid for it.
We intend to retain future earnings, if any, for future operations, expansion and debt repayment and have no current plans to pay any cash dividends for the foreseeable future. The declaration, amount and payment of any future dividends on shares of common stock will be at the sole discretion of our board of directors. Our board of directors may take into account general and economic conditions, our financial condition and results of operations, our available cash and current and anticipated cash needs, capital requirements, contractual, legal, tax and regulatory restrictions and implications on the payment of dividends by us to our stockholders or by our subsidiaries to us and such other factors as our board of directors may deem relevant. In addition, our ability to pay dividends is limited by covenants contained in our existing indebtedness and may be limited by covenants contained in any future indebtedness we or our subsidiaries incur. As a result, you may not receive any return on an investment in our common stock unless you sell our common stock for a price greater than what you paid for it.
If securities analysts do not publish research or reports about our business or if they downgrade our stock or our sector, our stock price and trading volume could decline.
The trading market for our common stock relies in part on the research and reports that industry or financial analysts publish about us or our business. We do not control these analysts. Furthermore, if one or more of the analysts who do cover us downgrade our stock or our industry, or the stock of any of our competitors, or publish inaccurate or unfavorable research about our business, the price of our stock could decline. If one or more of these analysts ceases coverage of us or fail to publish reports on us regularly, we could lose visibility in the market, which in turn could cause our stock price or trading volume to decline.
Future sales, or the perception of future sales, by us or our existing stockholders in the public market could cause the market price for our common stock to decline.
The sale of substantial amounts of shares of our common stock in the public market, or the perception that such sales could occur, could harm the prevailing market price of shares of our common stock. These sales, or the possibility that these sales may occur, also might make it more difficult for us to sell equity securities in the future at a time and at a price that we deem appropriate.
Anti-takeover provisions in our organizational documents could delay or prevent a change of control.
Certain provisions of our certificate of incorporation and bylaws may have an anti-takeover effect and may delay, defer or prevent a merger, acquisition, tender offer, takeover attempt or other change of control transaction that a stockholder might consider in its best interest, including those attempts that might result in a premium over the market price for the shares held by our stockholders.
These provisions will provide for, among other things:
• | a classified board of directors with staggered three-year terms; |
• | the ability of our board of directors to issue one or more series of preferred stock; |
• | advance notice for nominations of directors by stockholders and for stockholders to include matters to be considered at our annual meetings; |
• | certain limitations on convening special stockholder meetings; |
• | the removal of directors for cause and only upon the affirmative vote of holders of a majority of the shares of common stock entitled to vote in the election of directors; and |
• | that certain provisions may be amended only by the affirmative vote of at least 66 2/3% of the shares of common stock entitled to vote. |
These anti-takeover provisions could make it more difficult for a third party to acquire us, even if the third-party's offer may be considered beneficial by many of our stockholders. As a result, our stockholders may be limited in their ability to obtain a premium for their shares.
24
A few significant shareholders may influence our policies and decisions and their interests may conflict with ours or yours in the future.
A few significant shareholders who, while they do not act as a group, may influence or control the direction of our business. If the ownership of our shares continues to be highly concentrated, it may limit your ability and the ability of other shareholders to influence significant corporate decisions.
ITEM 1B. UNRESOLVED STAFF COMMENTS
None.
ITEM 2. PROPERTIES
Our corporate headquarters is located at 90 Fort Wade Rd, Ponte Vedra, Florida 32081, where we currently lease approximately 63,000 square feet of office space under a lease expiring through 2020. We also maintain regional administrative offices in North Carolina, Georgia and Illinois.
Our principal property and equipment consists of land, landfills, buildings, vehicles and equipment. We own or lease real property in the states in which we conduct operations. At December 31, 2017, we owned or operated 93 collection operations, 73 transfer stations, 40 active solid waste landfills and 22 recycling facilities in 16 states and the Bahamas. In aggregate, our active solid waste landfills total approximately 20,100 acres, including approximately 11,600 permitted and expansion acres. “Expansion acreage” consists of unpermitted acreage where the related expansion efforts meet our criteria to be included as expansion airspace. A discussion of the related criteria is included within the Management’s Discussion and Analysis of Financial Condition and Results of Operations—Critical Accounting Estimates and Assumptions section included herein. We also own or have responsibilities for five closed landfills. We believe that our property and equipment are adequate for our current needs.
ITEM 3. LEGAL PROCEEDINGS
Information regarding our legal proceedings can be found under the “Commitments and Contingencies” section of Note 19 of our consolidated financial statements included in Item 8 of this report and is incorporated herein by reference.
ITEM 4. MINE SAFETY DISCLOSURE
Not applicable.
25
PART II
ITEM 5. MARKET FOR REGISTRANT’S COMMON EQUITY, RELATED STOCKHOLDER MATTERS AND ISSUER PURCHASES OF EQUITY SECURITIES
Our common stock is traded on the New York Stock Exchange (“NYSE”) under the symbol “ADSW.” The following table sets forth the range of the high and low per share sales prices for our common stock as reported on the NYSE:
High | Low | ||||||
2016 | |||||||
Fourth Quarter | $ | 22.42 | $ | 18.32 | |||
2017 | |||||||
First Quarter | $ | 24.10 | $ | 21.17 | |||
Second Quarter | $ | 24.07 | $ | 20.94 | |||
Third Quarter | $ | 25.38 | $ | 22.35 | |||
Fourth Quarter | $ | 25.71 | $ | 22.06 | |||
2018 | |||||||
First Quarter (through February 9, 2018) | $ | 24.81 | $ | 22.65 | |||
On February 9, 2018, the closing sales price as reported on the NYSE was $23.21 per share. The number of holders of record of our common stock on February 9, 2018 was 9. The number of beneficial owners of our common stock is substantially greater than the number of record holders, because a large portion of our common stock is held in "street name" by banks and brokers.
26
The graph below shows the relative investment performance of Advanced Disposal Services, Inc. common stock, the S&P 500 Index and the Dow Jones Waste & Disposal Services Index since the close of trading on the first day subsequent to our initial public offering. The initial public offering price of our common stock was $18 compared to the closing price on the first day of trading subsequent to our initial public offering of $20. No dividends have been paid on our common stock. The graph is presented pursuant to SEC rules and is not meant to be an indication of our future performance.
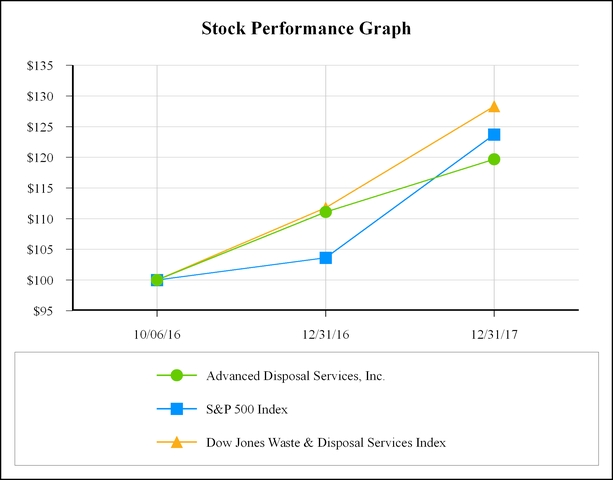
10/6/2016 | 12/31/2016 | 12/31/2017 | |||||||
Advanced Disposal Services, Inc. | $ | 100.00 | $ | 111.10 | $ | 119.70 | |||
S&P 500 Index | $ | 100.00 | $ | 103.61 | $ | 123.73 | |||
Dow Jones Waste & Disposal Services Index | $ | 100.00 | $ | 111.76 | $ | 128.34 | |||
No dividends have been paid on our common stock and we do not currently have any future plans to pay dividends on our common stock. Any decision to declare and pay dividends in the future will be made at the sole discretion of our board of directors and will depend on, among other things, our results of operations, cash requirements, financial condition, contractual restrictions and other factors that our board of directors may deem relevant. Because we are a holding company and have no direct operations, we will only be able to pay dividends from funds we receive from our subsidiaries. In addition, our ability to pay dividends will be limited by covenants in our existing indebtedness and may be limited by the agreements governing other indebtedness we or our subsidiaries incur in the future. We have not adopted any plans to repurchase shares of our common stock and we do not currently have any future plans to repurchase shares of our common stock. Our ability to repurchase any shares of our common stock will be limited by covenants in our existing indebtedness and may be limited by the agreements governing other indebtedness we or our subsidiaries incur in the future.
27
ITEM 6. SELECTED FINANCIAL DATA
The information below was derived from the audited Consolidated Financial Statements included in this report and in previous reports we filed with the SEC. This information should be read together with those Consolidated Financial Statements and the notes thereto. The adoption of new accounting pronouncements, changes in certain accounting policies and certain reclassifications impact the comparability of the financial information presented below. These historical results are not necessarily indicative of the results to be expected in the future.
(In millions of dollars)
For the Year Ended December 31, | |||||||||||||||||||
2017 | 2016 | 2015 | 2014 | 2013 | |||||||||||||||
Consolidated Statement of Operations Data: | |||||||||||||||||||
Service revenues | $ | 1,507.6 | $ | 1,404.6 | $ | 1,396.4 | $ | 1,403.0 | $ | 1,319.1 | |||||||||
Costs and expenses: | |||||||||||||||||||
Operating | 962.1 | 865.5 | 866.6 | 896.1 | 832.8 | ||||||||||||||
Selling, general and administrative | 169.5 | 157.0 | 152.6 | 154.9 | 170.9 | ||||||||||||||
Depreciation and amortization | 269.8 | 246.9 | 259.1 | 271.4 | 278.9 | ||||||||||||||
Acquisition and development costs | 1.3 | 0.7 | 1.4 | 0.1 | 1.2 | ||||||||||||||
Loss on disposal of assets and asset impairments (a) | 11.4 | 1.8 | 21.6 | 6.5 | 3.2 | ||||||||||||||
Restructuring | 3.4 | 0.8 | — | 4.6 | 10.0 | ||||||||||||||
1,417.5 | 1,272.7 | 1,301.3 | 1,333.6 | 1,297.0 | |||||||||||||||
Operating income | 90.1 | 131.9 | 95.1 | 69.4 | 22.1 | ||||||||||||||
Interest expense | (93.0 | ) | (130.2 | ) | (138.0 | ) | (141.5 | ) | (163.1 | ) | |||||||||
Loss on debt extinguishments and modifications | (3.7 | ) | (64.7 | ) | — | — | — | ||||||||||||
Other income (expense), net (b) | 3.7 | 6.9 | (10.1 | ) | (25.9 | ) | 0.3 | ||||||||||||
Loss before income taxes | (2.9 | ) | (56.1 | ) | (53.0 | ) | (98.0 | ) | (140.7 | ) | |||||||||
Benefit from income taxes (c) | (41.2 | ) | (25.7 | ) | (19.4 | ) | (80.6 | ) | (45.4 | ) | |||||||||
Net income (loss) from continuing operations | 38.3 | (30.4 | ) | (33.6 | ) | (17.4 | ) | (95.3 | ) | ||||||||||
Income (loss) from discontinued operations, net of tax | — | — | — | 0.3 | (22.5 | ) | |||||||||||||
Net income (loss) from continuing operations | 38.3 | (30.4 | ) | (33.6 | ) | (17.1 | ) | (117.8 | ) | ||||||||||
Basic income (loss) per share from continuing operations | $ | 0.43 | $ | (0.44 | ) | $ | (0.52 | ) | $ | (0.27 | ) | $ | (1.48 | ) | |||||
Diluted income (loss) per share from continuing operations | $ | 0.43 | $ | (0.44 | ) | $ | (0.52 | ) | $ | (0.27 | ) | $ | (1.48 | ) | |||||
Consolidated Statement of Cash Flows Data: | |||||||||||||||||||
Net cash provided by operating activities | $ | 308.8 | $ | 237.0 | $ | 244.5 | $ | 243.2 | $ | 180.3 | |||||||||
Net cash used in investing activities | $ | (287.6 | ) | $ | (170.6 | ) | $ | (197.4 | ) | $ | (201.2 | ) | $ | (154.8 | ) | ||||
Net cash used in financing activities | $ | (15.6 | ) | $ | (65.8 | ) | $ | (47.5 | ) | $ | (53.0 | ) | $ | (32.3 | ) | ||||
Consolidated Balance Sheet Data: | |||||||||||||||||||
Total assets | $ | 3,493.3 | $ | 3,369.9 | $ | 3,422.3 | $ | 3,489.5 | $ | 3,554.2 | |||||||||
Debt, including current portion | $ | 1,958.3 | $ | 1,923.5 | $ | 2,247.1 | $ | 2,243.0 | $ | 2,259.3 | |||||||||
Total stockholders’ equity | $ | 884.6 | $ | 829.5 | $ | 489.8 | $ | 528.9 | $ | 551.5 | |||||||||
(a) | We have collection operations in South Carolina which operate in a competitor-owned disposal market that does not align with our long-term market strategy of vertically integrated operations with Company-owned disposal sites or marketplace neutral disposal sites. During April of 2017, changes in facts and circumstances led us to re-evaluate the expected cash flows provided by this market and we determined it appropriate to impair $13.0 of certain intangible assets that were recorded as part of the purchase accounting when these entities were acquired. We disposed of certain businesses in the South segment for strategic reasons in June 2015 and recorded a loss on disposal of $10.9 for the twelve months ending December 31, 2015. Additionally, we recorded an impairment of $6.4 in fiscal 2015 in connection with the strategic decision to divest certain businesses in the South segment and the decision not to pursue a landfill permit. In fiscal 2014, we recorded an impairment charge of $5.3 in connection with the decision to divest a small brokerage business. |
(b) | Amounts included in other income (expense) net for fiscal 2017, 2016, 2015 and 2014 contain unrealized and realized gains/losses related to derivative instruments including a loss of $0.5, a gain of $3.5, a loss of $15.4 and a loss of $27.3, respectively. A gain on the sale of a debt investment security of $2.5 is included in other income (expense) net for fiscal 2015. |
(c) | Due to the enactment of the Tax Cuts and Jobs Act (the "Act") in the fourth quarter of fiscal 2017, our 2017 financial results included a $40.5 non-cash tax benefit, primarily resulting from revaluing our net deferred tax assets, liabilities, and certain associated valuation allowances to reflect the recently enacted 21% federal corporate tax rate. Due to the Act's taxation of deemed repatriation on foreign earnings, we expect to pay a one-time tax of $0.1 related to our Bahamas operations. We completed a legal entity reorganization to achieve administrative efficiencies and as such recorded a valuation allowance release of $0.9 and $51.4 for fiscal 2015 and fiscal 2014, respectively, related to certain NOLs that are more likely than not to be utilized. |
28
ITEM 7. MANAGEMENT’S DISCUSSION AND ANALYSIS OF FINANCIAL CONDITION AND RESULTS OF OPERATIONS
The following discussion should be read in conjunction with the “Selected Financial Data” included in Item 6 of this Annual Report on Form 10-K, our consolidated financial statements and the related notes included elsewhere in this report.
Overview
We are a leading integrated provider of non-hazardous solid waste collection, transfer, recycling and disposal services, operating primarily in secondary markets or under exclusive municipal arrangements. We have a presence in 16 states across the Midwest, South and East regions of the United States, serving approximately 2.8 million residential customers and over 200,000 C&I customers through our extensive network of 93 collection operations, 73 transfer stations, 22 owned or operated recycling facilities and 40 owned or operated active landfills. We seek to drive financial performance in markets in which we own or operate a landfill or in certain disposal-neutral markets, where the landfill is owned by our municipal customer. In markets in which we own or operate a landfill, we aim to create and maintain vertically integrated operations through which we manage a majority of our customers' waste from the point of collection through the point of disposal, a process we refer to as internalization. By internalizing a majority of the waste in these markets, we are able to deliver high quality customer service while also ensuring a stable revenue stream and maximizing profitability and cash flow from operations. In disposal-neutral markets, we focus selectively on opportunities where we can negotiate exclusive arrangements with our municipal customers, facilitating highly-efficient and profitable collection operations with lower capital requirements.
Geographically, we focus our business principally in secondary, or less densely populated non-urban, markets where the presence of large national providers is generally more limited. We also compete selectively in primary, or densely populated urban, markets where we can capitalize on opportunities for vertical integration through our high-quality transfer and disposal infrastructure and where we can benefit from highly-efficient collection route density. We maintain an attractive mix of revenue from varying sources, including residential collections, C&I collections, landfill gas and special waste streams, and fees charged to third parties for disposal in our network of transfer stations and landfills, with limited exposure to commodity sales. We also benefit from a high degree of customer diversification, with no single customer accounting for more than 2% of revenue for the year ended December 31, 2017. Our business mix and large and diverse customer base, combined with our long term contracts and historically high renewal rates, provide us with significant revenue and earnings stability and visibility.
We intend to grow our business and expand the scope of our operations by adding new C&I customers, securing additional exclusive municipal contracts and executing value enhancing, tuck-in acquisitions, while maintaining a relentless focus on prudent cost management and pricing discipline. To this end, we are committed to investing in strategic infrastructure including the development and enhancement of our landfills, the conversion of our residential collection fleet to automated vehicles and the conversion of our collection fleet to CNG-fueled vehicles in certain markets in which we can achieve an attractive return on our investment. In addition to our focus on growing revenues and enhancing profitability, we remain financially disciplined through our careful management of returns on equity and capital deployed.
Our fiscal year ends December 31 of each year and we refer to the fiscal year ended December 31, 2017 as "fiscal 2017," the fiscal year ended December 31, 2016 as "fiscal 2016" and the fiscal year ended December 31, 2015 as "fiscal 2015".
How We Generate Revenue
Through our subsidiaries, we generate revenue primarily by providing collection and disposal services to commercial, industrial, municipal and residential customers. Our remaining revenue is generated from recycling, fuel surcharges and environmental charges, landfill gas-to-energy operations and other ancillary revenue-generating activities. Revenues from our collection operations consist of fees we receive from municipal, subscription, residential and C&I customers and are influenced by factors such as collection frequency, type of collection equipment furnished, type and volume or weight of the waste collected, distance to the recycling, transfer station or disposal facilities and our disposal costs. Our standard C&I service agreement is a five-year renewable agreement. Management believes we maintain strong relationships with our C&I customers. Our municipal customer relationships are generally supported by exclusive contracts ranging from three to ten years in initial duration, with subsequent renewal periods, and we have historically achieved a renewal rate of approximately 80% to 85% with these customers. Certain of our municipal contracts have annual price escalation clauses that are tied to changes in an underlying base index such as the consumer price index. We provide commercial front load and temporary and permanent rolloff service offerings to our customers. While the majority of our rolloff services are provided to customers under long-term service agreements, we generally do not enter into contracts with our temporary rolloff customers due to the relatively short-term nature of most C&D projects.
29
Our transfer stations and landfills generate revenue from disposal or tipping fees. Revenues from our landfill operations consist of fees which are generally based on the type and weight or volume of waste being disposed at our disposal facilities. Fees charged at transfer stations are generally based on the weight or volume of waste deposited, taking into account our cost of loading, transporting and disposing of the solid waste at a disposal site. Recycling facility revenue consists of disposal or tipping fees and proceeds from the sale of recyclable commodities to third parties.
The amounts charged for collection, disposal, and recycling services may include fuel charges and environmental charges. Fuel charges and environmental charges are not designed to be specific to the direct costs and expenses to service an individual customer's account, but rather are designed to address and to help recover for changes in our overall cost structure and to achieve an operating margin acceptable to us.
Other revenue is comprised of ancillary revenue-generating activities, such as trucking, landfill gas-to-energy operations at MSW landfills, management of third-party owned landfills, brokerage revenue, customer service charges relating to overdue payments and customer administrative fees relating to customers who request paper copies of invoices rather than opting for electronic invoices.
Key Factors Affecting Our Results of Operations
Our results of operations are affected by our ability to complete tuck-in acquisitions and retain existing and win new municipal contracts at favorable margins. When we determine to pursue a new acquisition or contract, we focus particularly on operational efficiencies, including route optimization and our ability to leverage our network of landfills and transfer stations. We also seek to divest lower margin businesses that do not conform to our strategic operations model which may result in impairment charges in the period of sale but benefit us by allowing us to redeploy capital to higher margin businesses.
Our results of operations are also affected by the strength of the economy and the level of C&I activity near our collection operations. Economic conditions have a direct effect on construction, demolition, new business formations and roll-off activity which impacts volumes of C&I waste. Residential waste volumes are also impacted by economic conditions, although to a lesser extent. Special waste volume, such as coal ash, energy waste, soil projects and other industrial process waste, which is driven by C&I projects and other general economic conditions, can vary substantially year to year based on economic and industrial conditions as well as the timing and size of projects in proximity to our collection or disposal operations. During periods of strong GDP growth, our business is fueled by increases in the C&D business, new business formations and new residential housing.
Our ability to maintain or increase the price of our services has a significant effect on our results of operations. Our focus on secondary markets enhances our ability to maintain or increase prices. We also intend to enter into contracts or service agreements that permit rate increases and contain favorable pricing structures.
We maintain a focus on prudent cost management and efficiency. We have implemented programs to increase sales productivity and pricing effectiveness, driver productivity, route optimization, maintenance efficiency and effective purchasing. Our ability to manage costs is a significant driver of our results.
Fuel costs represent a significant operating expense. When available, we implement a fuel surcharge that is designed to recover a portion of our direct and indirect increases in fuel costs. Furthermore, we seek to minimize fuel costs through route optimization and the adoption of more CNG vehicles in our fleet. See "Quantitative and Qualitative Disclosures About Market Risk-Fuel Price Risk."
Seasonality and Severe Weather
Based on historic trends, we expect our operating results to vary seasonally, with revenues typically lowest in the first quarter, higher in the second and third quarters, and lower in the fourth quarter than in the second and third quarters. This seasonality reflects the lower volume of solid waste generated during the late fall, winter and early spring because of decreased construction and demolition activities during the winter months in the U.S., and lower volumes of energy waste due to reduced drilling activity during harsh weather conditions. Conversely, mild winter weather conditions may reduce demand for oil and natural gas, which may cause some of our mining and exploration customers to curtail their drilling programs, which could result in production of lower volumes of waste.
Adverse winter weather conditions slow waste collection activities, resulting in higher labor and operational costs. Greater precipitation in the winter increases the weight of collected waste, resulting in higher disposal costs, which are calculated on a per ton basis and increased leachate disposal costs. Certain destructive weather conditions that tend to occur during the second
30
half of the year primarily impacting the South region, such as hurricanes, can increase the Company’s revenues in the areas affected. While weather-related and other occurrences can boost revenues through additional work, the earnings generated can be moderated as a result of significant start-up costs and other factors, resulting in earnings at comparatively lower margins. These destructive weather conditions can result in higher fuel costs, higher labor costs, reduced municipal contract productivity and higher disposal costs in disposal neutral markets. These factors impact period-to-period comparisons of financial results.
Results of Operations
The following table sets forth for the periods indicated our consolidated results of operations and the percentage relationship that certain items from our consolidated financial statements bear to revenue (in millions and as a percentage of our revenue).
Year ended December 31, | ||||||||||||||||||||
2017 | 2016 | 2015 | ||||||||||||||||||
Service revenues | $ | 1,507.6 | 100.0 | % | $ | 1,404.6 | 100.0 | % | $ | 1,396.4 | 100.0 | % | ||||||||
Operating costs and expenses | ||||||||||||||||||||
Operating | 962.1 | 63.8 | % | 865.5 | 61.6 | % | 866.6 | 62.1 | % | |||||||||||
Selling, general and administrative | 169.5 | 11.2 | % | 157.0 | 11.2 | % | 152.6 | 10.9 | % | |||||||||||
Depreciation and amortization | 269.8 | 17.9 | % | 246.9 | 17.6 | % | 259.1 | 18.6 | % | |||||||||||
Acquisition and development costs | 1.3 | 0.1 | % | 0.7 | — | % | 1.4 | 0.1 | % | |||||||||||
Loss on disposal of assets and asset impairments | 11.4 | 0.8 | % | 1.8 | 0.1 | % | 21.6 | 1.5 | % | |||||||||||
Restructuring charges | 3.4 | 0.2 | % | 0.8 | 0.1 | % | — | — | % | |||||||||||
Total operating costs and expenses | 1,417.5 | 94.0 | % | 1,272.7 | 90.6 | % | 1,301.3 | 93.2 | % | |||||||||||
Operating income | $ | 90.1 | 6.0 | % | $ | 131.9 | 9.4 | % | $ | 95.1 | 6.8 | % | ||||||||
Fiscal Year Ended December 31, 2017 compared to 2016
Operating income decreased $41.8 or 31.7% in fiscal 2017 from fiscal 2016. The variance was primarily the result of the following:
• | As discussed in Note 1 to the audited consolidated financial statements, we recorded an intangible asset impairment charge of $13.0 during fiscal 2017; |
• | As discussed in Note 19 to the audited consolidated financial statements, we recorded charges in operating expenses of $11.1 related to the Greentree landfill waste slide that occurred in the first quarter of fiscal 2017; |
• | As discussed in Note 14 to the audited consolidated financial statements, stock based compensation expense increased by $4.3 primarily due to the impact of initial public offering related awards and a larger portion of the Company's compensation structure shifting to stock based awards; |
• | As discussed in Note 20 to the audited consolidated financial statements, we recorded restructuring charges of $3.4 during fiscal 2017 due to the elimination of positions at the corporate office. Of the $3.4 of restructuring charges, $2.1 relates to the acceleration of stock based compensation expense and $1.3 relates to severance expense. |
Operating income, net of the items above, decreased $10.0 or 7.6% to $121.9 for fiscal 2017. The decrease was primarily the result of the following:
• | An increase in operating costs of $85.5, net of the $11.1 in costs associated with the Greentree landfill waste slide, which includes the following: an increase in salary and wage expense of $16.8 due to merit increases, acquisition activity, higher workers' compensation cost due to less favorable actuarial development and higher temporary labor costs as we transitioned to new customer service call centers in fiscal 2017; an increase in transfer and disposal costs of $16.1 to support the increase in our service revenue and higher container weights; an increase in fuel expense of $13.1 impacted by an increase in diesel fuel prices and the expiration of CNG credits; an increase in maintenance and repairs expense of $9.9 primarily due to acquisition activity; an increase in maintenance costs of $5.5 for landfill gas control, leachate and sulfate treatment; an increase in facility maintenance costs of $5.4 due to acquisition activity and site repairs at certain landfills; an |
31
increase in insurance expenses of $4.7 primarily due to higher automobile and property insurance costs and the favorable settlement of legacy claims in fiscal 2016 that did not recur in fiscal 2017; an increase in healthcare costs of $4.0 due to an increase in the severity and frequency of medical claims; an increase in accretion expense of $2.5 due to the assumption of post-closure liabilities of a closed portion of a landfill during the first quarter of fiscal 2017; an increase in franchise fees and taxes of $2.6 to support the increase in our service revenue; an increase in material costs of $2.3 to support an acquired aggregate and asphalt operation; and an increase in vehicle operating expense of $1.7 due to acquisition activity and hurricane related costs in the South segment;
• | An increase in depreciation and amortization expense of $22.9 as a result of acquisition activity, higher disposal volumes and unfavorable adjustments in fiscal 2017 as a result of our annual landfill life of site analysis; |
• | An increase in selling, general and administrative expenses of $8.2, net of the $4.3 increase in stock based compensation expense, primarily due to the following: an increase in wages and benefits of $5.4 as a result of merit increases, hiring additional sales representatives, higher severance expense and higher healthcare costs; an increase in bad debt expense of $1.5 due to the impact of acquired businesses on collection activities; and an increase in insurance costs of $0.7 as a result of being a publicly traded company. |
The increase in operating costs and expenses for fiscal 2017 was largely offset by the following:
• | An increase in service revenues of $103.0 as detailed further in the "Revenue" section below. |
Fiscal Year Ended December 31, 2016 compared to 2015
Operating income increased $36.8 or 38.7% in fiscal 2016 from fiscal 2015. The variance was primarily the result of the following:
• | A decrease in losses on disposal of assets and asset impairments primarily due to $17.3 recorded in fiscal 2015 relating to strategic decisions regarding divestitures in our South segment and discontinuing the pursuit of permitting at one landfill site in our East segment; |
• | Higher revenue of $8.2 primarily due to an increase in average yield and revenue from prior year acquisitions partially offset by lower fuel surcharge revenue, a decrease in organic volume and lower revenue due to divestitures; |
• | Lower depreciation and amortization of $12.2 primarily due to a reduction in landfill depletion and amortization as a result of an increase in deemed permitted expansion airspace at several of our landfills and favorable adjustments of $5.3 that were recognized in the fourth quarter of 2016 relative to asset retirement obligations, compared to favorable adjustments of $1.4 in the fourth quarter of 2015; |
• | Higher expenses of $7.1 related to the launch of the February 2016 initial public offering process. |
Revenue
The following table sets forth our consolidated revenues for the periods indicated (in millions and as a percentage of our total revenue).
Year ended December 31, | ||||||||||||||||||||
2017 | 2016 | 2015 | ||||||||||||||||||
Collection | $ | 1,017.4 | 67.5 | % | $ | 977.4 | 69.6 | % | $ | 971.4 | 69.6 | % | ||||||||
Disposal | 542.5 | 36.0 | % | 517.9 | 36.9 | % | 499.0 | 35.7 | % | |||||||||||
Sale of recyclables | 33.2 | 2.2 | % | 22.6 | 1.6 | % | 24.8 | 1.8 | % | |||||||||||
Fuel and environmental charges | 103.9 | 6.9 | % | 88.5 | 6.3 | % | 85.8 | 6.1 | % | |||||||||||
Other | 104.4 | 6.9 | % | 74.7 | 5.3 | % | 82.2 | 5.9 | % | |||||||||||
Intercompany eliminations | (293.8 | ) | (19.5 | )% | (276.5 | ) | (19.7 | )% | (266.8 | ) | (19.1 | )% | ||||||||
Total | $ | 1,507.6 | 100.0 | % | $ | 1,404.6 | 100.0 | % | $ | 1,396.4 | 100.0 | % | ||||||||
32
The following table reflects changes in components of our revenue, as a percentage of total revenue, for fiscal 2017, 2016 and 2015:
Year Ended December 31, | ||||||||
2017 | 2016 | 2015 | ||||||
Average yield | 1.2 | % | 2.2 | % | 2.2 | % | ||
Recycling | 0.8 | % | 0.1 | % | (0.5 | )% | ||
Fuel charge revenue | 0.4 | % | (0.7 | )% | (1.3 | )% | ||
Total yield | 2.4 | % | 1.6 | % | 0.4 | % | ||
Organic volume | 1.4 | % | (1.7 | )% | (0.8 | )% | ||
Acquisitions | 3.9 | % | 1.8 | % | 1.2 | % | ||
Divestitures | (0.4 | )% | (1.1 | )% | (1.3 | )% | ||
Total revenue growth | 7.3 | % | 0.6 | % | (0.5 | )% | ||
Average yield is defined as aggregate contribution of price changes excluding recycled commodities and fuel surcharge revenue.
Fiscal Year Ended December 31, 2017 compared to 2016
During fiscal 2017, we experienced the following changes in components of our revenue as compared to the same period in fiscal 2016:
• | Average yield increased revenue by 1.2% driven by higher price yield in our municipal residential collection business due to the positive impact of higher CPI contract resets and a higher open market price yield as we continue to focus on disciplined pricing. The increase in average yield was partially offset by the mix of business due to increases in special waste and project based C&D volumes which generally price at a lower rate per ton than other waste streams; |
• | Recycling revenue increased revenue by 0.8% due to an increase in recycled commodity prices; |
• | Fuel surcharge revenue increased revenue by 0.4%. These charges fluctuate in response to changes in prices for diesel fuel on which the surcharge is based and, consequently, any increase in fuel prices results in an increase in our revenue. Our fuel surcharges reset on a monthly basis, therefore an increase in our fuel surcharge revenue is delayed in comparison to the increase in our fuel expense when diesel fuel prices increase; |
• | Organic volume increased revenue by 1.4% primarily due to an increase in MSW, C&D and special waste landfill disposal volumes, an increase in third party trucking revenue due to special waste and C&D project activity and an increase related to a volume commitment settlement associated with a landfill gas contract. Volumes in the commercial and rolloff collection businesses increased slightly with residential volume decreasing as we continue to cycle through certain municipal contract losses. Organic volume was negatively impacted by one less work day in fiscal 2017 compared to fiscal 2016; |
• | Acquisitions increased revenue by 3.9% due to our execution of acquisition opportunities that further enhance our vertical integration strategy; |
• | Divestitures decreased revenue by 0.4% due to our strategic decision to divest of our Charlotte collection operations in the second quarter of fiscal 2017. |
Fiscal Year Ended December 31, 2016 compared to 2015
During fiscal 2016, we experienced the following changes in components of our revenue as compared to the same period in fiscal 2015:
• | Average yield increased revenue by 2.2% for fiscal 2016 primarily due to positive pricing in our commercial collection business, rolloff collection business, MSW disposal business and special waste disposal business. Additionally, our environmental charge contributed to the increase due to rate increases that went into effect in July 2015 and July 2016. |
• | Fuel surcharge revenue decreased by 0.7% during fiscal 2016. These charges fluctuate in response to changes in prices for diesel fuel on which the surcharge is based and, consequently, any decrease in fuel prices results in a decrease in our revenue. Lower fuel surcharge revenue for fiscal 2016 resulted from a decrease in diesel fuel prices. |
33
• | Organic volume decreased revenue by 1.7% during fiscal 2016 primarily due to the loss of residential contracts in our Midwest segment and lower shale volumes in our East segment partially offset by increased disposal volume across our MSW and C&D waste streams, most notably in our South and East segments. |
• | Acquisitions increased revenue by 1.8% during fiscal 2016 due to our execution of acquisition opportunities that further enhance our vertical integration strategy. |
• | Divestitures decreased revenue by 1.1% during fiscal 2016 due to our strategic decisions to divest low margin businesses. |
Operating Expenses
The following table summarizes our operating expenses (in millions and as a percentage of our revenue).
Year ended December 31, | ||||||||||||||||||||
2017 | 2016 | 2015 | ||||||||||||||||||
Operating | $ | 946.7 | 62.8 | % | $ | 852.5 | 60.7 | % | $ | 853.5 | 61.1 | % | ||||||||
Accretion of landfill retirement obligations | 15.4 | 1.0 | % | 13.0 | 0.9 | % | 13.1 | 0.9 | % | |||||||||||
Operating expenses | $ | 962.1 | 63.8 | % | $ | 865.5 | 61.6 | % | $ | 866.6 | 62.0 | % | ||||||||
Our operating expenses include the following:
• | Labor and related benefits consist of salaries and wages, health and welfare benefits, incentive compensation and payroll taxes; |
• | Transfer and disposal costs include tipping fees paid to third-party disposal facilities and transfer stations and transportation and subcontractor costs (which include costs for independent haulers who transport waste from transfer stations to our disposal facilities); |
• | Maintenance and repairs expenses include labor, maintenance and repairs to our vehicles, equipment and containers. |
• | Fuel costs, which include the direct cost of fuel used by our vehicles, net of fuel tax credits. We also incur certain indirect fuel costs in our operations; |
• | Franchise fees and taxes, which consist of municipal franchise fees, host community fees and royalties; |
• | Risk management expenses, which include casualty insurance premiums and claim payments and estimates for claims incurred but not reported; |
• | Other expenses, which include expenses such as facility operating costs, equipment rent, leachate treatment and disposal, and other landfill maintenance costs; |
• | Accretion expense related to landfill capping, closure and post-closure is included in “Operating Expenses” in our consolidated income statements, however, it is excluded from the table below (refer to discussion below “Accretion of Landfill Retirement Obligations” for a detailed discussion of the changes in amounts). |
34
The following table summarizes the major components of our operating expenses, excluding accretion expense on our landfill retirement obligations (in millions and as a percentage of our revenue):
Year ended December 31, | ||||||||||||||||||||
2017 | 2016 | 2015 | ||||||||||||||||||
Labor and related benefits | $ | 313.2 | 20.8 | % | $ | 292.4 | 20.8 | % | $ | 286.7 | 20.5 | % | ||||||||
Transfer and disposal costs | 205.0 | 13.6 | % | 188.9 | 13.4 | % | 195.2 | 14.0 | % | |||||||||||
Maintenance and repairs | 139.3 | 9.2 | % | 129.4 | 9.2 | % | 123.7 | 8.9 | % | |||||||||||
Fuel | 68.3 | 4.5 | % | 55.2 | 3.9 | % | 66.6 | 4.8 | % | |||||||||||
Franchise fees and taxes | 67.8 | 4.5 | % | 65.2 | 4.6 | % | 67.1 | 4.8 | % | |||||||||||
Risk management | 33.8 | 2.2 | % | 28.7 | 2.1 | % | 25.9 | 1.9 | % | |||||||||||
Other | 108.2 | 7.3 | % | 92.7 | 6.7 | % | 88.3 | 6.3 | % | |||||||||||
Subtotal | $ | 935.6 | 62.1 | % | $ | 852.5 | 60.7 | % | $ | 853.5 | 61.1 | % | ||||||||
Greentree expenses, net of estimated insurance recoveries | 11.1 | 0.7 | % | — | — | — | — | |||||||||||||
Total operating expenses, excluding accretion expense | $ | 946.7 | 62.8 | % | $ | 852.5 | 60.7 | % | $ | 853.5 | 61.1 | % | ||||||||
The cost categories shown above may not be comparable to similarly titled categories used by other companies.
Fiscal Year Ended December 31, 2017 compared to 2016
Operating expenses increased by $94.2, or 11.0%, to $946.7 for fiscal 2017 from $852.5 in fiscal 2016. Operating expenses, net of the Greentree waste slide expenses, increased $83.1, or 9.7% to $935.6 for fiscal 2017 from $852.5 in fiscal 2016. The change was due to the following:
• | Labor and related benefits increased by $20.8, or 7.1%, to $313.2, however remained consistent with fiscal 2016 at 20.8% of revenue. The increase was primarily attributable to merit increases, acquisition activity, higher health care costs due to an increase in the severity and frequency of medical claims, higher workers' compensation costs due to less favorable actuarial development and higher temporary labor costs as we transitioned to new customer service call centers in fiscal 2017; |
• | Transfer and disposal costs increased by $16.1, or 8.5%, to $205.0, which was a 20 basis point increase as a percent of revenue from fiscal 2016. The increase was due to increased disposal volumes and container weights, acquisition activity, increased third party trucking costs and higher recycling rebates due to the increase in recycled commodity prices; |
• | Maintenance and repairs expense increased by $9.9, or 7.7%, to $139.3, however remained consistent with fiscal 2016 at 9.2% of revenue. The increase was driven by increased labor costs primarily attributable to merit increases, acquisition activity and higher health care costs as well as an increase in maintenance and repair material costs partially due to deferred maintenance related to acquired entities; |
• | Fuel costs increased $13.1, or 23.7%, to $68.3, which was a 60 basis point increase as a percent of revenue from fiscal 2016. The increase was primarily resulting from acquisition activity, the expiration of CNG tax credits as of December 31, 2016 and increases in diesel fuel prices, partially due to hurricane related supply disruptions; |
• | Franchise fees and taxes increased $2.6, or 4.0%, to $67.8 which was a 10 basis point decrease as a percent of revenue from fiscal 2016. The increase was primarily due to increased disposal volumes and acquisition activity; |
• | Risk management expenses increased $5.1, or 17.8%, to $33.8, which was a 10 basis point increase as a percent of revenue from fiscal 2016. The increase was primarily due to higher automobile and property insurance costs, the favorable settlement of legacy claims in fiscal 2016 that did not recur in fiscal 2017, less favorable actuarial development in fiscal 2017 compared to fiscal 2016 and property damage in the South segment from a tornado and a hurricane; |
• | Other operating costs increased $15.5, or 16.7%, to $108.2, which was a 60 basis points increase as a percent of revenue from fiscal 2016. The increase was primarily due to an increase in maintenance costs related to landfill gas control, leachate and sulfate treatment, an increase in vehicle and facility operating costs due to acquisition activity and site repairs at certain landfills and increased costs to operate an asphalt plant associated with a recent acquisition; |
35
Fiscal Year Ended December 31, 2016 compared to 2015
Operating expenses decreased by $1.0, or 0.1%, to $852.5 for fiscal 2016 from $853.5 in fiscal 2015. Operating expenses, as a percentage of revenue, decreased by 40 basis points in fiscal 2016 from fiscal 2015. The change was due to the following:
• | Labor and related benefits increased by $5.7, or 2.0%, to $292.4, which was primarily attributable to merit increases, acquisition activity and startup costs for new municipal contracts and acquisitions. The increases were partially offset by disposals of certain businesses and a reduction in workers compensation costs; |
• | Transfer and disposal costs decreased by $6.3, or 3.2%, to $188.9 due to the sale of a small brokerage business in April 2015, the divestiture of three transfer stations in April 2016 and lower costs due to decreased shale related disposal activity; |
• | Maintenance and repairs expense increased by $5.7, or 4.6%, to $129.4. The increase was driven primarily by the implementation of a standardized maintenance plan on our collection fleet and landfill equipment which resulted in increased labor and material costs. Additionally, costs increased as a result of start up costs for new municipal contracts and acquisitions; |
• | Fuel costs decreased $11.4, or 17.1%, to $55.2 primarily resulting from decreases in fuel prices and converting trucks to compressed natural gas fuel, which is less expensive than diesel fuel; |
• | Franchise fees and taxes decreased $1.9, or 2.8%, to $65.2 in 2016 primarily due to changes in the mix of waste in the Midwest and East segments, partially offset by higher costs in our South segment due mainly to increased volumes; |
• | Risk management expenses increased $2.8, or 10.8%, to $28.7. Fiscal 2015 benefited from the favorable settlement of legacy claims and favorable actuarial development in our vehicle liability insurance programs which did not reoccur at the same level in fiscal 2016; |
• | Other operating costs increased $4.4, or 5.0%, to $92.7 in 2016 primarily due to increased landfill site and other facility maintenance costs and increased costs related to leachate treatment and disposal due to wet weather. |
Accretion of Landfill Retirement Obligations
Accretion expense was $15.4, $13.0 and $13.1 for fiscal 2017, 2016 and 2015, respectively. Accretion expense increased by $2.4 in fiscal 2017 from fiscal 2016 which was primarily attributable to the assumption of post-closure responsibility at one of our landfills during the first quarter of fiscal 2017 and the acquisition of a landfill during the first quarter of fiscal 2017. Accretion expense decreased by $0.1 in fiscal 2016 from fiscal 2015 primarily due to the timing of certain capping obligations.
Selling, General and Administrative
Selling, general and administrative expenses include salaries, legal and professional fees, rebranding and integration costs and other expenses. Salaries expenses include salaries and wages, health and welfare benefits and incentive compensation for corporate and field general management, field support functions, sales force, accounting and finance, legal, management information systems, and clerical and administrative departments. Other expenses include rent and office costs, fees for professional services provided by third parties, marketing, directors’ and officers’ insurance, general employee relocation, travel, entertainment and bank charges, but excludes any such amounts recorded as restructuring charges.
The following table provides the components of our selling, general and administrative expenses for the periods indicated (in millions and as a percentage of our revenue):
Year ended December 31, | ||||||||||||||||||||
2017 | 2016 | 2015 | ||||||||||||||||||
Salaries | $ | 105.5 | 7.0 | % | $ | 95.8 | 6.8 | % | $ | 92.7 | 6.6 | % | ||||||||
Legal and professional | 13.9 | 0.9 | % | 16.2 | 1.2 | % | 15.1 | 1.1 | % | |||||||||||
Other | 50.1 | 3.3 | % | 45.0 | 3.2 | % | 44.8 | 3.2 | % | |||||||||||
Total selling, general and administrative expenses | $ | 169.5 | 11.2 | % | $ | 157.0 | 11.2 | % | $ | 152.6 | 10.9 | % | ||||||||
36
Fiscal Year Ended December 31, 2017 compared to 2016
• | Salaries expenses increased by $9.7, or 10.1%, primarily due to the following: an increase in wages and benefits of $5.4 as a result of merit increases, hiring additional sales representatives, higher severance expense and higher healthcare costs; and a $4.3 increase in stock based compensation expense due to the impact of initial public offering related awards and a larger portion of the Company's compensation structure shifting to stock based awards. |
• | Legal and professional fees decreased by $2.3, or 14.2%, primarily due to $7.1 of expenses incurred during fiscal 2016 related to the February launch of the initial public offering process that was not completed that did not recur in fiscal 2017. This decrease was partially offset by $2.2 of costs associated with new accounting standard implementation and higher Sarbanes-Oxley costs, $1.7 of increased costs associated with being a public company and an increase in legal fees of $1.0 primarily due to litigation associated with the fuel, environmental and administrative charge cases as discussed in Note 19 to the audited consolidated financial statements. |
• | Other selling, general and administrative expenses increased by $5.1, or 11.3% primarily due to increased bad debt expense due to the impact of acquired businesses on collection activities, increased software maintenance cost and increased insurance costs as a result of being a publicly traded company. |
Fiscal Year Ended December 31, 2016 compared to 2015
• | Salaries expenses increased by $3.1, or 3.3%, in fiscal 2016 compared to fiscal 2015 primarily attributable to higher stock based compensation expense of $2.4 as a result of a larger portion of our compensation structure shifting to stock based awards. The remainder of the variance is primarily due to merit increases and acquisition activity, partially offset by lower severance and incentive compensation expense. |
• | Legal and professional fees increased by $1.1, or 7.3%, in fiscal 2016 compared to fiscal 2015 which was primarily the result of expenses related to the February 2016 launch of the initial public offering process partially offset by a reduction in consulting fees associated with internal control evaluation and implementation and a decrease in legal fees due to reduced legal claim activity. |
• | Other selling, general and administrative expenses increased by $0.2, or 0.4% which is relatively consistent with fiscal 2015. |
Depreciation and Amortization
The following table summarizes the components of depreciation and amortization expense by asset type (in millions and as a percentage of our revenue). For a detailed discussion of depreciation and amortization by asset type refer to the discussion included in the following two sections herein.
Year ended December 31, | ||||||||||||||||||||
2017 | 2016 | 2015 | ||||||||||||||||||
Depreciation, amortization and depletion of property and equipment | $ | 228.2 | 15.1 | % | $ | 204.3 | 14.5 | % | $ | 216.3 | 15.5 | % | ||||||||
Amortization of other intangible assets and other assets | 41.6 | 2.8 | % | 42.6 | 3.1 | % | 42.8 | 3.1 | % | |||||||||||
Depreciation and amortization | $ | 269.8 | 17.9 | % | $ | 246.9 | 17.6 | % | $ | 259.1 | 18.6 | % | ||||||||
Depreciation, Amortization and Depletion of Property and Equipment
Depreciation, amortization and depletion expense includes depreciation of fixed assets over the estimated useful life of the assets using the straight-line method, and amortization and depletion of landfill airspace assets under the units-of-consumption method. We depreciate all fixed assets to a zero net book value, and do not apply salvage values.
37
The following table summarizes depreciation, amortization and depletion of property and equipment for the periods indicated (in millions and as a percentage of our revenue):
Year ended December 31, | ||||||||||||||||||||
2017 | 2016 | 2015 | ||||||||||||||||||
Depreciation and amortization of property and equipment | $ | 135.6 | 9.0 | % | $ | 127.7 | 9.1 | % | $ | 127.5 | 9.1 | % | ||||||||
Landfill depletion and amortization | 92.6 | 6.1 | % | 76.6 | 5.4 | % | 88.8 | 6.4 | % | |||||||||||
Depreciation, amortization and depletion of property and equipment | $ | 228.2 | 15.1 | % | $ | 204.3 | 14.5 | % | $ | 216.3 | 15.5 | % | ||||||||
Fiscal Year Ended December 31, 2017 compared to 2016
• | Depreciation and amortization of property and equipment increased by $7.9, or 6.2%, for fiscal 2017 to $135.6, due mainly to acquisition activity. |
• | Landfill depletion and amortization increased by $16.0, or 20.9%, for fiscal 2017 as compared to fiscal 2016 primarily due to acquisition activity, increased disposal volumes, unfavorable adjustments in fiscal 2017 of $6.0 as a result of our annual landfill life of site analysis and favorable adjustments of $5.3 that were recognized in the fourth quarter of 2016 relative to asset retirement obligations compared to favorable adjustments of only $1.9 in the fourth quarter of 2017. |
Fiscal Year Ended December 31, 2016 compared to 2015
• | Depreciation and amortization of property and equipment increased by $0.2, or 0.2%, for fiscal 2016 to $127.7, which is relatively consistent with fiscal 2015. |
• | Landfill depletion and amortization decreased by $12.2, or 13.7%, for fiscal 2016 as compared to fiscal 2015 primarily due to an increase in deemed permitted expansion airspace at several of our landfills and favorable adjustments of $5.3 that were recognized in the fourth quarter of 2016 relative to asset retirement obligations compared to favorable adjustments of $1.4 in the fourth quarter of 2015. |
Amortization of Other Intangible Assets and Other Assets
Amortization of other intangibles and other assets was $41.6, $42.6 and $42.8 for fiscal 2017, 2016 and 2015, respectively, or as a percentage of revenue, 2.8% to 3.1% for all years presented. The decrease in amortization expense in fiscal 2017 is attributable to certain intangible assets becoming fully amortized partially offset by increased acquisition activity. Our other intangible assets and other assets primarily relate to customer lists, municipal and customer contracts, operating permits and non-compete agreements.
Acquisitions
We completed fourteen acquisitions during fiscal 2017 for aggregate consideration, net of cash acquired, of $115.9, of which$4.0 will be paid in years subsequent to fiscal 2017. Transaction costs related to these acquisitions were not significant for fiscal 2017.
In fiscal 2016, we completed the acquisitions of eight collection companies for aggregate consideration of approximately $5.4, of which $0.1 will be paid in years subsequent to fiscal 2017. Transaction costs related to these acquisitions were not significant for fiscal 2016. Purchase price adjustments related to acquisitions in prior years amounted to approximately $0.1 for fiscal 2016.
In fiscal 2015, we completed the acquisitions of twelve collection companies for aggregate consideration of approximately $56.3, of which $6.6 was paid in years subsequent to fiscal 2015. Transaction costs related to these acquisitions were not significant for fiscal 2015. Purchase price adjustments related to acquisitions in prior years amounted to approximately $0.3 for fiscal 2015.
38
The amount of goodwill deductible for tax purposes was $79.7, $88.9 and $100.8 at December 31, 2017, 2016 and 2015, respectively.
Asset Impairments and Divestitures
From time to time, we may divest certain components of our business. Such divestitures may be undertaken for a number of reasons, including as a result of a determination that a specified asset will no longer provide adequate returns to us or will no longer serve a strategic purpose in connection with our business.
During fiscal 2017, we divested of our non-integrated collection services operation in Charlotte, North Carolina for consideration received of $8.7. A $1.4 gain on the sale of that business is included in our consolidated statements of operations for fiscal 2017.
We also have non-integrated collection operations in South Carolina which operate in a competitor-owned disposal market that does not align with our long-term market strategy of vertically integrated operations with Company owned disposal sites or marketplace neutral disposal sites. During April of fiscal 2017, changes in facts and circumstances led us to evaluate the long-term market for South Carolina collection operations and re-evaluate the expected cash flows provided by this market. We determined it appropriate to impair certain intangible assets that were recorded as part of the purchase accounting when these entities were acquired. Based on our evaluation, we recorded an intangible asset impairment of $13.0 during fiscal 2017.
We disposed of certain businesses in June 2015 and recorded a loss on disposal of $10.9 for fiscal 2015. In connection with the sale in June 2015, we impaired certain assets in the amount of $4.3. Further, we strategically allowed an inactive landfill permit to lapse and in connection with the permit lapse recorded a non-cash impairment charge of $2.1 primarily for permitting costs in fiscal 2015.
Restructuring Charges
For fiscal 2017, we incurred restructuring charges of $3.4 due to the elimination of positions at the corporate office. Of the $3.4 of restructuring charges, $2.1 relates to the acceleration of stock based compensation expense and $1.3 relates to severance expense.
For fiscal 2016, we incurred $0.8 of restructuring costs related to the consolidation of districts in the Midwest region and the resignation of one corporate executive.
For fiscal 2015, no new restructuring plans were adopted and no restructuring costs were incurred.
Interest Expense
The following table provides the components of interest expense for the periods indicated (in millions and as a percentage of our revenue):
Year ended December 31, | ||||||||||||||||||||
2017 | 2016 | 2015 | ||||||||||||||||||
Interest expense on debt and capital lease obligations | $ | 87.5 | 5.8 | % | $ | 113.5 | 8.1 | % | $ | 119.4 | 8.6 | % | ||||||||
Accretion of original issue discounts and loan costs | 6.3 | 0.4 | % | 17.5 | 1.2 | % | 19.5 | 1.4 | % | |||||||||||
Less: Capitalized interest | (0.8 | ) | (0.1 | )% | (0.8 | ) | (0.1 | )% | (0.9 | ) | (0.1 | )% | ||||||||
Total Interest Expense | $ | 93.0 | 6.1 | % | $ | 130.2 | 9.2 | % | $ | 138.0 | 9.9 | % | ||||||||
Interest expense decreased in fiscal 2017 from fiscal 2016 due to the benefit from lower debt levels as a result of paying down debt with our initial public offering proceeds in the fourth quarter of fiscal 2016 and lower interest rates due to refinancing our debt structure in November 2016. Additionally, we further lowered our interest rate on the Term Loan B due to a repricing in November of fiscal 2017. See Note 12, Long-Term Debt, to our audited consolidated financial statements included elsewhere in this Form 10-K for further details on our debt refinancing. Interest expense decreased in fiscal 2016 from fiscal 2015 due to the benefit from lower debt levels as a result of paying down debt with our initial public offering proceeds in the fourth quarter of fiscal 2016 and lower interest rates due to refinancing our debt structure in November 2016.
39
Loss on Debt Extinguishments and Modifications
In November 2017, we repriced our Term Loan B under the existing credit agreement ("Existing Term Loan B") and as a result, we recorded $3.7 of losses on extinguishments and modifications of debt. See Debt Modifications and Extinguishments section below for further details.
In October 2016, we prepaid approximately $326.0 of our existing Term Loan B with our initial public offering proceeds and in November 2016, we refinanced our Term Loan B and Senior Notes. As a result, we recorded $64.7 of losses on extinguishments and modifications of debt. See Debt Modifications and Extinguishments section below for further details.
Other, Net
Changes in the fair value and settlements of fuel derivative instruments and our 2016 interest rate caps are recorded in other income (expense), net in the audited consolidated statements of operations and amounted to expense of $0.5, income of $3.5 and expense of $15.4 for fiscal 2017, 2016 and 2015, respectively. The expense in fiscal 2017 was driven by premium payments associated with the 2016 interest rate caps partially offset by the impact of increasing interest rates. The income in fiscal 2016 was driven by the increase in interest rates and moderate increase in diesel fuel prices. The expense in fiscal 2015 was driven by a reduction in diesel fuel prices. Income from equity investee for fiscal 2017, 2016 and 2015 was $1.6, $1.8 and $1.3, respectively. We realized a gain on sale of $2.5 from the disposition of an investment security in fiscal 2015.
Debt Extinguishments and Modifications
Fiscal 2017
When we repriced our Term Loan B facility in November 2017, 93% was accounted for as a modification and 7% was accounted for as an extinguishment based on an analysis of the participation of each lender in the syndicate before and after the repricing. As a result of the 7% that was accounted for as an extinguishment, $1.9 of the unamortized original issue discount and deferred debt issuance costs were recorded as a loss on extinguishment of debt. In relation to the modification, we incurred $1.8 of third party fees which were recorded as a loss on modification of debt. We incurred $0.1 of third party fees related to new lenders in the syndicate which were recorded as a reduction to the carrying value of debt which is being amortized to interest expense using the effective interest method.
Fiscal 2016
In fiscal 2016, the Company recorded $64.7 of losses on extinguishments and modifications of debt as follows:
In October of fiscal 2016, we prepaid $326.0 of our Existing Term Loan B with our initial public offering proceeds and recorded a loss on extinguishment of debt of $8.3 for unamortized original issue discount and debt issuance costs.
When we refinanced our Term Loan B facility in November 2016, 95% was accounted for as a modification and 5% was accounted for as an extinguishment based on an analysis of the participation of each lender in the syndicate before and after the refinancing. As a result of the 5% that was accounted for as an extinguishment, $1.5 of the unamortized original issue discount and deferred debt issuance costs were recorded as a loss on extinguishment of debt. In relation to the modification, we incurred $15.2 of third party fees which were recorded as a loss on modification of debt. We incurred $1.3 of third party fees related to new lenders in the syndicate which were recorded as a reduction to the carrying value of debt and will be amortized to interest expense using the effective interest method. Additionally, we recorded $3.8 of original issue discount as a reduction to the carrying value of debt which is being amortized to interest expense using the effective interest method.
When we amended our Revolving Credit Facility ("Revolver") in November 2016, we incurred $0.3 in third party financing fees which were recorded as an other long term asset and will be amortized to interest expense on a straight line basis over the term of the Revolver.
When we redeemed our $550.0 of 8.25% Senior Notes during the fourth quarter of fiscal 2016, we paid call premiums totaling $24.0. We recorded the call premium as a loss on extinguishment of debt during the fourth quarter of fiscal 2016. Additionally, we recorded $15.3 of loss on extinguishment of debt related to unamortized original issue discount and deferred debt issuance costs.
In November of fiscal 2016 when we issued $425.0 of 5.625% Senior Notes due 2024, we incurred $6.5 in debt issuance costs which were recorded as a reduction to the carrying value of debt and will be amortized to interest expense using the effective interest method.
In December of fiscal 2016, we prepaid $20.0 of our new Term Loan B and recorded a loss on extinguishment of debt of $0.4.
40
Income Taxes
Our benefit for income taxes was $41.2, $25.7 and $19.4, for fiscal 2017, 2016, and 2015, respectively. Our effective income tax rate was 1,420.7%, 45.8%, and 36.6% for fiscal 2017, 2016 and 2015, respectively. We expect our effective income tax rate for fiscal 2018 to be 27% based on current tax laws and regulations as modified by the Tax Cuts and Jobs Act. Our tax rate is affected by recurring items, such as differences in tax rates in state jurisdictions and the relative amount of income we earn in each jurisdiction, which we expect to be fairly consistent in the near term. It is also affected by discrete items that may occur in any given year, but are not consistent from year to year. In addition to state income taxes, the following items had the most significant impact on the difference between our statutory U.S. federal income tax rate and our effective tax rate:
2017:
Our effective income tax rate for fiscal 2017 was significantly higher than the enacted statutory rate primarily due to the enactment of the Tax Cuts and Jobs Act during the fourth quarter of fiscal 2017. Our financial results included a $40.5 non-cash tax benefit, primarily resulting from revaluing the Company's net deferred tax assets, liabilities, and certain associated valuation allowances to reflect the recently enacted 21% federal corporate tax rate. Due to the Act's taxation of deemed repatriation on foreign earnings, the Company expects to pay a one-time tax of $0.1 related to our Bahamas operations. Our effective income tax rate for fiscal 2017 is further disproportionate to the statutory rate in effect for fiscal 2017 of 35% due to the level of our pre-tax loss.
2016:
Our effective income tax rate for fiscal 2016 was higher than the enacted statutory rate primarily due to the favorable impact of state and local taxes and the benefit from stock option exercises. The increase in our effective tax rate was partially offset by an increase to our valuation allowance for certain state tax NOLs.
2015:
Our effective income tax rate for fiscal 2015 was higher than the enacted statutory rate due to the favorable impact of state and local taxes. Additionally, the favorable impact of a $0.9 release in recorded valuation allowance was recognized as we continued our plan of legal entity restructuring, designed to drive administrative and legal efficiencies. These favorable benefits were partially offset by the unfavorable impact of changes in state tax rates and non deductible transaction costs.
For additional discussion and detail regarding our income taxes, see Note 17, Income Taxes, to our consolidated financial statements.
41
Reportable Segments
Our operations are managed through three geographic regions (South, East and Midwest) that we designate as our reportable segments. During the fourth quarter of fiscal 2016, the Company reorganized its internal organizational structure by moving two business units from the East segment to the South segment. Segment revenue, operating income and depreciation and amortization below for fiscal 2015 has been reclassified to reflect the changes to our operating segments in fiscal 2016.
Revenues and operating income (loss) for our reportable segments for the periods indicated, is shown in the following tables (in millions):
Services Revenues | Operating Income (Loss) | Depreciation and Amortization | |||||||||
For the Year Ended December 31, | |||||||||||
2017 | |||||||||||
South | $ | 570.5 | $ | 89.8 | $ | 85.0 | |||||
East | 380.2 | (1.5 | ) | 76.8 | |||||||
Midwest | 556.9 | 71.7 | 98.9 | ||||||||
Corporate | — | (69.9 | ) | 9.1 | |||||||
$ | 1,507.6 | $ | 90.1 | $ | 269.8 | ||||||
For the Year Ended December 31, | |||||||||||
2016 | |||||||||||
South | $ | 522.3 | $ | 91.7 | $ | 75.2 | |||||
East | 347.7 | 25.8 | 71.7 | ||||||||
Midwest | 534.6 | 78.3 | 91.5 | ||||||||
Corporate | — | (63.9 | ) | 8.5 | |||||||
$ | 1,404.6 | $ | 131.9 | $ | 246.9 | ||||||
For the Year Ended December 31, | |||||||||||
2015 | |||||||||||
South | $ | 510.2 | $ | 69.4 | $ | 75.9 | |||||
East | 344.7 | 22.5 | 71.3 | ||||||||
Midwest | 541.6 | 61.1 | 103.8 | ||||||||
Corporate | (0.1 | ) | (57.9 | ) | 8.1 | ||||||
$ | 1,396.4 | $ | 95.1 | $ | 259.1 | ||||||
Comparison of Reportable Segments—Fiscal 2017 compared to Fiscal 2016
South Segment
Revenue for fiscal 2017 increased $48.2 or 9.2% from fiscal 2016. The increase in revenue was due to the following: an increase in acquisition related revenue of $19.9; an increase in residential, commercial and rolloff collection pricing of $9.7; an increase in revenue from transfer station disposal operations of $5.0; an increase in MSW and C&D disposal volume of $4.7; an increase in environmental charges of $3.3 due to rate increases that went into effect in July of 2016 and August 2017; an increase in sale of recyclable pricing of $2.5 due to an increase in commodity prices; an increase in commercial collection volume of $2.2; an increase in fuel surcharge revenue of $1.9 due to the increase in diesel fuel prices; and an increase in MSW, C&D and special waste landfill disposal pricing of $1.7. The increases were partially offset by a reduction in rolloff collection volume of $2.2 and a reduction in sale of recyclable volume of $1.9 due to the loss of a high volume customer.
Operating income from our South Segment decreased by $1.9 or 2.1% from fiscal 2016. The decrease was primarily due to the following: an increase in salary and wages of $11.2 due to merit increases, acquisition activity, higher healthcare costs, higher workers' compensation costs due to less favorable actuarial development and higher temporary labor costs as we transitioned to new customer service call centers in fiscal 2017; disposal and transportation costs of $9.2 to support the increase in our service revenue; an increase in depletion expense of $8.6 due to unfavorable adjustments in fiscal 2017 as a result of our annual landfill life of site analysis and an increase in disposal volumes; an increase in fuel costs of $5.9 impacted by the increase in diesel fuel
42
prices, partially due to hurricane related supply disruptions and the expiration of CNG credits; an increase in maintenance and repairs expense of $5.4 due mainly to acquisition activity; an increase in vehicle and facility maintenance costs of $4.5 due to acquisition activity and site repairs at certain landfills; an increase in various general and administrative expenses of $3.0; higher automobile and property insurance costs of $2.1 partially due to tornado and hurricane impact in the third quarter of fiscal 2017; and an increase in franchise fees of $0.9 to support the increase in our service revenue. The decrease was largely offset by the increase in revenue as described above.
East Segment
Revenue for fiscal 2017 increased $32.5, or 9.3% from fiscal 2016. The increase was primarily due to the following: an increase in acquisition related revenue of $31.6; an increase in third party trucking revenue of $5.4 due to special waste project activity; an increase in C&D and special waste disposal volume of $3.1; an increase in rolloff collection volume of $2.2; an increase in the sale of landfill gas of $2.2 primarily due to acquiring the gas rights from a third party at one of our landfills; an increase in broker related revenue of $1.8 associated with a recent acquisition; an increase in fuel surcharge revenue of $1.4 due to the increase in diesel fuel prices; an increase in environmental charges of $1.3 due to rate increases that went into effect in July of 2016 and August 2017; and an increase in sale of recyclable pricing of $1.0 due to an increase in commodity prices. These increases were partially offset by decreases in the following: a decrease in revenue from divestitures of $5.5; a decrease in shale related revenue of $5.4; a decrease in residential and rolloff collection pricing of $2.5; a decrease in special waste disposal pricing of $1.5; a decrease in residential collection volume of $1.4; and a decrease in MSW disposal volume of $1.4.
Operating income from our East Segment decreased by $27.3 for fiscal 2017 compared to fiscal 2016. Operating income from our East Segment, net of the $13.0 South Carolina intangible asset impairment and $11.1 of costs associated with the Greentree landfill waste slide, decreased $3.2 or 12.4% for fiscal 2017 compared to fiscal 2016. The decrease was primarily due to the following: an increase in salary and wages of $7.0 due to acquisition activity, merit increases, higher healthcare costs, higher workers' compensation costs due to less favorable actuarial development and higher temporary labor costs as we transitioned to new customer service call centers in fiscal 2017; an increase in depreciation and amortization expense of $5.1 due to acquisition activity; an increase in general and administrative expenses of $4.5 due to acquisition activity and increased bad debt expense due to the impact of acquired businesses on collection activities; an increase in fuel costs of $4.1 due to the increase in diesel fuel prices and the expiration of CNG credits; an increase in maintenance and repairs expense of $2.8 due to acquisition activity; an increase in maintenance costs for landfill gas control, leachate and sulfate treatment of $2.6; an increase in costs of $2.4 to operate an asphalt plant associated with a recent acquisition; an increase in disposal and transportation costs of $2.3 due to increased container weights; an increase in accretion expense of $1.9 attributable to the assumption of postclosure responsibility at one of our landfills during the first quarter of fiscal 2017 and the acquisition of a landfill during the first quarter of fiscal 2017; an increase in vehicle and facility maintenance costs of $1.7 due to acquisition activity; and higher automobile and property insurance costs of $1.1. The decreases were largely offset by the increase in revenue as described above.
Midwest Segment
Revenue for fiscal 2017 increased $22.3 or 4.2% from fiscal 2016. The increase was primarily due to the following: an increase in MSW, C&D and special waste landfill disposal volumes of $8.4; an increase in sale of recyclables of $8.2 due to an increase in commodity prices; higher pricing in our residential and rolloff collection operations of $5.3; an increase in environmental charges of $4.5 due to rate increases that went into effect in July of fiscal 2016 and August of fiscal 2017; an increase in acquisition related revenue of $3.3; higher rolloff collection volumes of $2.9; an increase in fuel surcharge revenue of $2.4 due to the increase in diesel fuel prices; and an increase of $1.9 primarily related to a volume commitment settlement associated with a landfill gas contract. The increases were partially offset by a reduction in residential revenue of $8.9 due to the loss of municipal contracts in fiscal 2016, a reduction in commercial collection pricing of $3.1 and a decrease in C&D and special waste disposal pricing of $1.9.
Operating income for 2017 decreased $6.6 or 8.4% from fiscal 2016. The decrease was primarily due to the following: an increase in depletion expense of $6.6 due to favorable adjustments that were recognized in the fourth quarter of 2016 relative to asset retirement obligations that did not recur in fiscal 2017, higher disposal and transportation cost of $4.5 to support the increase in our service revenue; an increase in fuel expense of $3.2 due to the increase in diesel fuel prices and the expiration of CNG credits; higher salary and wages of $3.0 due to merit increases, higher healthcare costs, higher workers' compensation costs due to less favorable actuarial development and higher temporary labor costs as we transitioned to new customer service call centers in fiscal 2017; an increase in maintenance costs of $2.8 related to landfill gas control, leachate and sulfate treatment; an increase in maintenance and repair expense of $1.9 due to increased labor costs; an increase in sales and marketing expense of $1.3 due to hiring additional sales representatives; an increase in vehicle and facility maintenance costs
43
of $1.3; higher automobile and property insurance costs of $1.3; and an increase in franchise fees of $1.1 as a result of higher disposal volumes. The decreases were largely offset by the increase in revenue as described above.
Corporate Segment
Operating loss increased by $6.0, or 9.4%, to a loss of $69.9 in fiscal 2017 primarily due to the following: an increase in stock based compensation expense of $4.3 due to the impact of initial public offering related awards and a larger portion of the Company's compensation structure shifting to stock based awards; an increase in professional fees of $3.3 which includes higher Sarbanes-Oxley costs, new accounting standard implementation costs, costs associated with being a public company and higher legal fees; an increase in salary and wage expense of $3.0 due to merit increases, higher healthcare costs and higher severance expense; and an increase in restructuring expense of $2.6 due to the elimination of positions at the corporate office in fiscal 2017. The increase in operating loss was partially offset by expenses incurred of $7.1 during fiscal 2016 related to the February launch of the initial public offering process that was not completed that did not recur in fiscal 2017.
Comparison of Reportable Segments—Fiscal 2016 compared to Fiscal 2015
South Segment
Revenue for fiscal 2016 increased $12.1 or 2.4% from fiscal 2015. The increase was primarily due to the impact of prior year acquisitions across all lines of business of $12.8, higher prices and volume for our MSW and special waste streams of $8.6, higher commercial collection and rolloff revenue due to higher prices and volume of $7.7 and higher environmental charges of $3.5. The increase was partially offset by decreases in revenue related to prior year divestitures of $11.5, lower residential collection revenue due to lower prices and volume of $4.4, lower fuel surcharge revenue of $2.3 due to the decrease in diesel fuel prices and lower trucking revenue of $1.6 due to lower volume of special waste projects.
Operating income from our South Segment increased by $22.3 or 32.1% from fiscal 2015. The increase was primarily due to lower losses on disposal of assets and asset impairments of $15.2 recorded in fiscal 2015 related to strategic divestitures which did not recur in 2016, higher revenue of $12.1 as described above and lower subcontract costs of $5.1 impacted by a prior year divestiture. The increase was partially offset by higher labor costs due to increased headcount, merit increases, and start up costs related to acquisitions and new municipal contracts of $6.0 and higher repairs and maintenance expense of $3.9 due to start up costs for new municipal contracts and acquisitions and the implementation of a standardized preventative maintenance plan on our collection fleet and landfill equipment.
East Segment
Revenue for fiscal 2016 increased $3.0, or 0.9% from fiscal 2015. The increase was primarily due to the impact of prior year acquisitions across all lines of business of $8.5, higher pricing across all collection lines of business of $4.3 and increased volume in our MSW and C&D disposal waste streams of $4.0. The increase was partially offset by lower volume in our commercial and rolloff collection businesses of $2.7, lower revenue associated to shale volumes of $6.5 and lower revenue due to prior year divestitures of $3.5.
Operating income from our East Segment increased by $3.3, or 14.7%, from fiscal 2015 to $25.8 in fiscal 2016. The increase was due to higher revenue of $3.0 as described above and lower fuel expense of $2.5 due to the decrease in diesel fuel prices. The increase was partially offset by higher labor costs due to merit increases and prior year acquisitions of $3.0.
Midwest Segment
Revenue for fiscal 2016 decreased $7.0 or 1.3% from fiscal 2015. The decrease was primarily due to lower revenue of $17.2 from reduced volumes in all of our collections lines of business and lower fuel surcharge revenue of $6.3 due to the decrease in diesel fuel prices. The decrease was partially offset by positive pricing in our commercial and residential collections lines of business of $5.2, positive pricing in our MSW disposal waste stream of $2.9, higher environmental charges of $6.6 and higher revenue due to prior year acquisitions of $3.6.
Operating income for 2016 increased $17.2 or 28.2% from fiscal 2015. The increase was primarily due to a reduction in landfill depletion and amortization of $11.7 as a result of an increase in deemed permitted expansion airspace at several of our landfills, lower fuel expense of $4.9 due to the decrease in diesel fuel prices and lower MSW disposal costs of $6.2 due to reduced volumes. The increase was partially offset by lower revenue of $7.0 as described above.
44
Corporate Segment
Operating loss increased by $6.0, or 10.4%, to a loss of $63.9 in fiscal 2016 primarily due to $7.1 in expenses related to the February launch of the initial public offering process and the evaluation of strategic alternatives.
Liquidity and Capital Resources
Our primary sources of cash are cash flows from operations, bank borrowings, debt offerings and equity offerings. We intend to use excess cash on hand and cash from operating activities, together with bank borrowings, to fund purchases of equipment, working capital and acquisitions. Excess cash from operating activities is also used to make debt repayments. Actual debt repayments may include purchases of our outstanding indebtedness in the secondary market or otherwise. We believe that our excess cash, cash from operating activities and funds available under our Revolving Credit Facility will provide us with sufficient financial resources to meet our anticipated capital requirements and maturing obligations as they come due. Prior to our initial public offering, we made certain distributions to our former parent company. For fiscal 2016 and 2015, those payments totaled approximately $21.8 and $7.5, respectively. At December 31, 2017, we had negative working capital which was driven by cash used for acquisitions during fiscal 2017. At December 31, 2016, we had negative working capital which was driven by repayments on the Term Loan B Facility and cash used for initial public offering costs. We expect to have a working capital deficit for the foreseeable future as excess cash flows from operations are utilized to either complete acquisitions or pay additional amounts on our Term Loan B Facility.
We have more than adequate availability under our Revolving Credit Facility, which was $231.7, $257.9 and $222.1 at December 31, 2017, 2016 and 2015, respectively, to fund short term working capital requirements.
Summary of Cash and Cash Equivalents and Debt Obligations
The table below presents a summary of our cash and cash equivalents and debt balances as of December 31, 2017 and 2016 (in millions):
December 31, | |||||||
2017 | 2016 | ||||||
Cash and cash equivalents | $ | 6.8 | $ | 1.2 | |||
Debt: | |||||||
Current portion | $ | 74.1 | $ | 36.5 | |||
Long-term portion | 1,884.2 | 1,887.0 | |||||
Total debt | $ | 1,958.3 | $ | 1,923.5 | |||
Cash and cash equivalents increased due to the timing of cash receipts and cash disbursements. The current portion of debt increased due to an increase in borrowings on the Revolving Credit Facility of $29.0 and an $9.4 increase in the short term portion of capital lease obligations. Long-term debt decreased slightly due to $20.0 in principal payments made on the Term Loan B largely offset by amortization of deferred financing fees and original issue discount in fiscal 2017 and an increase of $12.1 in long term capital lease obligations.
Summary of Cash Flow Activity
The following table sets forth for the periods indicated a summary of our cash flows (in millions):
For the Years Ended December 31, | |||||||||||
2017 | 2016 | 2015 | |||||||||
Net cash provided by operating activities | $ | 308.8 | $ | 237.0 | $ | 244.5 | |||||
Net cash used in investing activities | $ | (287.6 | ) | $ | (170.6 | ) | $ | (197.4 | ) | ||
Net cash used in financing activities | $ | (15.6 | ) | $ | (65.8 | ) | $ | (47.5 | ) | ||
45
Cash Flows Provided by Operating Activities
In fiscal 2017, we generated $308.8 of cash flows from operating activities compared to $237.0 in fiscal 2016, representing a increase of $71.8. The increase is primarily the result of the following:
• | A decrease in cash paid for interest of $33.2 due to the benefit from lower debt levels as a result of paying down debt with our initial public offering proceeds and lower interest rates due to refinancing our debt structure in November of fiscal 2016; |
• | During fiscal 2017, we entered into an Asset Transfer and Liability Assumption Agreement with BFI Waste Systems of North America, LLC. We received a cash payment of $24.0 which was recorded as an operating cash flow. In exchange for this payment, we assumed certain post-closure liabilities of a closed portion of a landfill and became responsible for expenditures related to a gas infrastructure system. The present value of the assumed post-closure liabilities and expenditures related to the gas infrastructure system over the life of the landfill approximate the amount of the cash payment. The Company paid $4.0 million of these costs during fiscal 2017. The remaining payments related to the assumed post-closure liabilities and gas infrastructure system expenditures will be made in future periods; |
• | A decrease in cash payments related to derivative instruments of $13.0; |
• | A reduction in capital market costs of $6.1 primarily due to costs incurred during fiscal 2016 related to the February 2016 launch of the initial public offering process that was not completed that did not recur in fiscal 2017; |
• | An increase in the change in accounts payable of $5.0 mainly due to the timing of payments. |
The increase in cash flows provided by operating activities for fiscal 2017 was partially offset by the following:
• | An increase in the change in accounts receivable of $8.9 due primarily to an increase in revenue and the timing of payments related to special waste projects; |
• | Net cash payments related to remediation of the Greentree landfill waste slide of $5.7. |
Cash flows from operating activities are used to fund capital expenditures, acquisitions, interest payments and debt.
In fiscal 2016, we generated $237.0 of cash flows from operating activities compared to $244.5 in fiscal 2015, representing a decrease of $7.5. The decrease is primarily the result of the impact on accounts receivable from emphasis placed on collection activities in late fiscal 2014 that resulted in significant improvements in days sales outstanding throughout fiscal 2015, higher bonus payments made in fiscal 2016 for the fiscal 2015 management incentive plan compared to fiscal 2015 for the fiscal 2014 management incentive plan and higher cash paid for interest in fiscal 2016 compared to fiscal 2015 due to the timing of payments as a result of the debt refinancing in the fourth quarter of fiscal 2016. The decrease was partially offset by lower realized losses on fuel derivatives and a lower net loss.
Cash Flows Used in Investing Activities
We used $287.6 of cash in fiscal 2017 for investing activities, of which $186.6 was utilized to acquire property and equipment and for landfill cell construction and development and $111.9 was utilized for acquisitions. We received $10.9 in proceeds from the sale of property and equipment and businesses. Purchases of property and equipment and cash used for landfill construction and development in fiscal 2017 was impacted by the acquisition of a facility related to a municipal contract of $8.7 and land purchased for future airspace at one of our landfills of $3.1.
We used $170.6 of cash in fiscal 2016 for investing activities, of which $171.0 was utilized to acquire property and equipment and for landfill cell construction and development and $5.4 was utilized for acquisitions. We received $5.8 in proceeds from the sale of property and equipment and businesses.
We used $197.4 of cash in fiscal 2015 for investing activities, of which $179.7 was utilized to acquire property and equipment and for landfill cell construction and development and $50.0 was utilized for acquisitions. Further, we divested certain businesses and received $14.7 in cash and we redeemed an investment and received $15.0 in proceeds.
46
A breakdown of our capital expenditures to acquire property and equipment and for landfill cell construction and development are as follows:
For the Years Ended December 31, | |||||||||||
2017 | 2016 | 2015 | |||||||||
Infrastructure | $ | 39.1 | $ | 28.8 | $ | 17.1 | |||||
Replacement | 122.1 | 120.7 | 144.9 | ||||||||
Growth | 25.4 | 21.5 | 17.7 | ||||||||
Total Capital Expenditures | $ | 186.6 | $ | 171.0 | $ | 179.7 | |||||
Cash Flows Used in Financing Activities
Cash flows used in financing activities in fiscal 2017 were $15.6, as compared to $65.8 in fiscal 2016. We made payments on our Revolving Credit Facility and long-term debt obligations in the amount of $347.0 and borrowed approximately $326.2 in fiscal 2017. We received proceeds from the exercise of stock options of $7.0. We incurred $1.8 of costs in relation to refinancing our Term Loan B.
Cash flows used in financing activities in fiscal 2016 were $65.8, as compared to $47.5 in fiscal 2015. We made payments on our Revolving Credit Facility and long-term debt obligations in the amount of $1,164.4 and borrowed approximately $782.8 in fiscal 2016. We received proceeds from our initial public offering of $375.6 and proceeds from the exercise of stock options of $17.4. We incurred $50.9 of costs in relation to refinancing our debt structure and returned capital to our former parent of $21.8 prior to our initial public offering.
Cash flows used in financing activities in fiscal 2015 were $47.5, as compared to $53.0 in fiscal 2014. We made payments on our Revolving Credit Facility and long-term debt obligations in the amount of $153.4 and borrowed approximately $114.0 in fiscal 2015. Borrowings on the Revolving Credit Facility were utilized to fund working capital, acquisition of businesses and for interest payments on debt. Additionally, $7.5 of capital was returned to our former parent during fiscal 2015.
Senior Secured Credit Facilities
On November 21, 2017, we entered into Amendment No. 1 (the “Amendment”) to our Credit Agreement, dated as of October 9, 2012 (as amended and restated as of November 10, 2016, the “Amended and Restated Credit Agreement”) among the Company, the lenders party thereto and Deutsche Bank AG New York Branch, as administrative agent and as collateral agent. The Amendment reduces our applicable margin on the Term Loan B by 0.50% per annum.
On November 10, 2016, we entered into the Amended and Restated Credit Agreement by and among the Company, the guarantors party thereto, the lenders party thereto (the “Lenders”) and Deutsche Bank AG New York Branch, as administrative agent and collateral agent (respectively, the “Administrative Agent” and the “Collateral Agent”), to the Credit Agreement, by and among the Company, the lenders party thereto, the Administrative Agent and the Collateral Agent, dated as of October 9, 2012 (as amended, supplemented or modified from time to time prior to the date hereof, the “Existing Credit Agreement” and as amended and restated in accordance with the Amended and Restated Credit Agreement).
The Amended and Restated Credit Agreement includes a $1.5 billion Term Loan B facility maturing 2023, and a $300.0 Revolving Credit Facility maturing 2021 (together our "Senior Secured Credit Facilities"). The Revolving Credit Facility allows for up to $100.0 million of letters of credit outstanding. The proceeds were used to repay borrowings under the Existing Credit Agreement and to call a portion of our 8.25% Senior Notes due 2020. All outstanding borrowings under the Existing Credit Agreement were either repaid in full or converted to the new Senior Secured Credit Facility. At the Company’s option, borrowings under the Amended and Restated Credit Agreement will bear interest at an alternate base rate or adjusted LIBOR rate in each case plus an applicable margin. The alternate base rate is defined as the greater of the prime rate, the federal funds rate plus 50 basis points, or the adjusted LIBOR rate plus 100 basis points. The LIBOR base rate is subject to a 0.75% floor.
In the case of the Term Loan B, the applicable margin, as amended, is 1.25% per annum for ABR Loans and 2.25% per annum for Eurodollar Loans. In the case of the Revolving Credit Facility, the applicable margin is 1.75% per annum for ABR Loans and 2.75% per annum for Eurodollar Loans if our total net leverage ratio is greater than 4.0:1.0. If our total net leverage ratio is less than 4.0:1.0, the applicable margin on the Revolving Credit Facility is 1.25% per annum for ABR Loans and 2.25% per annum for Eurodollar Loans.
47
Obligations under the Amended and Restated Credit Agreement are guaranteed by our existing and future domestic restricted subsidiaries (subject to certain exceptions) and are secured by a first-priority security interest in substantially all our personal property assets, and certain real property assets, including all or a portion of the equity interests of certain of our domestic subsidiaries (in each cases, subject to certain limited exceptions).
Borrowings under the Amended and Restated Credit Agreement may be prepaid at any time without premium. The Amended and Restated Credit Agreement contains usual and customary representations and warranties, and usual and customary affirmative and negative covenants, including limitations on liens, additional indebtedness, investments, restricted payments, asset sales, mergers, affiliate transactions and other customary limitations, as well as a total net leverage ratio financial covenant (for the benefit of lenders under the revolving credit facility only). The Amended and Restated Credit Agreement also contains usual and customary events of default, including non-payment of principal, interest, fees and other amounts, material breach of a representation or warranty, nonperformance of covenants and obligations, default on other material debt, bankruptcy or insolvency, material judgments, incurrence of certain material ERISA liabilities, impairment of loan documentation or security and change of control. Compliance with these covenants is a condition to any incremental borrowings under our Senior Secured Credit Facilities and failure to meet these covenants would enable the lenders to require repayment of any outstanding loans (which would adversely affect our liquidity).
The Term Loan B has payments due quarterly of $3.75 with mandatory prepayments due to the extent net cash proceeds from the sale of assets exceed $25.0 in any fiscal year and are not reinvested in the business within 365 days from the date of sale, upon notification of our intent to take such action or in accordance with excess cash flow, as defined. Further prepayments are due when there is excess cash flow, as defined.
Borrowings under our Senior Secured Credit Facilities can be used for working capital, capital expenditures, acquisitions and other general corporate purposes. As of December 31, 2017 and 2016, we had $29.0 and $0.0 in borrowings outstanding under our Revolving Credit Facility. As of December 31, 2017 and 2016, we had an aggregate of approximately $39.3 and $42.1 of letters of credit outstanding under our Senior Secured Credit Facilities. As of December 31, 2017 and 2016, we had remaining capacity under our Revolving Credit Facility of $231.7 and $257.9, respectively. As of December 31, 2017, we were in compliance with the covenants under the Senior Secured Credit Facilities. Our ability to maintain compliance with our covenants will be highly dependent on our results of operations and, to the extent necessary, our ability to implement remedial measures such as reductions in operating costs. The Revolving Credit Facility has an annual commitment fee equal to 0.50% per annum if the total net leverage ratio is greater than 4.0:1.0, or if otherwise, 0.375% per annum. The amount of commitment fees for 2017, 2016 and 2015 were not significant.
We are subject to a maximum total net leverage ratio of 6.8:1.0. The actual total net leverage ratio at December 31, 2017 and 2016 was 4.7:1.0 and 4.8:1.0, respectively.
5.625% Senior Notes due 2024
On November 10, 2016, we closed a 144A offering (the “Notes Offering”) exempt from registration under the Securities Act of 1933, as amended (the “Securities Act”), of $425.0 aggregate principal amount of 5.625% senior notes due 2024 (the “Notes”).
We issued the Notes under an indenture dated November 10, 2016 (the “Indenture”) among the Company, the guarantors party thereto, and Wells Fargo Bank, National Association, as trustee (the “Trustee”). The Notes will bear interest at the rate of 5.625% per year. Interest on the Notes is payable on May 15 and November 15 of each year, beginning on May 15, 2017. The Notes will mature on November 15, 2024. Before November 15, 2019, we may redeem the Notes, in whole or in part, at a redemption price equal to 100% of their principal amount plus a make-whole premium and accrued and unpaid interest to the date of redemption. At any time on or after November 15, 2019, we may redeem the Notes, in whole or in part, at the applicable redemption prices set forth in the Indenture, plus accrued interest. In addition, before November 15, 2019, we may, from time to time, redeem up to 40% of the aggregate principal amount of the Notes with the net cash proceeds of certain equity offerings at a redemption price equal to 105.625% of the principal amount thereof, plus accrued and unpaid interest to the redemption date. The redemption prices set forth in the indenture for the twelve month periods beginning on November 15 of the years indicated below are as follows:
48
Year | Percentage | |
2019 | 104.219 | % |
2020 | 102.813 | % |
2021 | 101.406 | % |
2022 and thereafter | 100.000 | % |
The Indenture contains covenants that, among other things, restrict our ability to incur additional debt or issue certain preferred stock; pay dividends (subject to certain exceptions) or make certain redemptions, repurchases or distributions or make certain other restricted payments or investments; create liens; enter into transactions with affiliates; merge, consolidate or sell, transfer or otherwise dispose of all or substantially all of our assets; transfer and sell assets; and create restrictions on dividends or other payments by our restricted subsidiaries. Certain covenants will cease to apply to the Notes for so long as the Notes have investment grade ratings. The Notes will be unconditionally guaranteed, jointly and severally, on a senior unsecured basis by all of our current and future U.S. subsidiaries that guarantee the Amended and Restated Credit Agreement. As of December 31, 2017, we were in compliance with the covenants under the Indenture.
8.25% Senior Notes due 2020
On October 9, 2012, we issued $550.0 aggregate principal amount of 8.25% Senior Notes, which were scheduled to mature in October 2020. The 8.25% Senior Notes were redeemed and repaid in full during the fourth quarter of fiscal 2016 with funds obtained from the new Term Loan B and the issuance of the 5.625% Senior Notes.
Off-Balance Sheet Arrangements
As of December 31, 2017, we had no off-balance sheet debt or similar obligations, other than financial assurance instruments and operating leases, which are not classified as debt. We do not guarantee any third-party debt.
Liquidity Impacts of Income Tax Items
Uncertain Tax Positions - As of December 31, 2017, we have $27.5 of liabilities associated with unrecognized tax benefits.
These liabilities are included as components of other liabilities and deferred income taxes in the Company's consolidated balance sheet because we generally do not anticipate that settlement of the liabilities will require payment of cash within the next 12 months. We are not able to reasonably estimate when we would make any cash payments required to settle these liabilities, but we do not believe that the ultimate settlement of our obligations will materially affect our liquidity.
Changes made by the Tax Cuts and Jobs Act
The Tax Cuts and Jobs Act, signed into law in fiscal 2017, makes significant changes to the U.S. federal income tax rules. These changes include reducing the U.S. corporate income tax rate from 35% to 21%, allowing an immediate expensing of certain tangible assets placed in service before 2023, limiting the deduction for net interest expense, limiting the use of newly-generated net operating losses to offset 80% of future taxable income and substantial changes to the U.S. taxation of foreign operations. While we continue to monitor the impact of these changes on the Company, we do not anticipate that these changes will materially affect our liquidity.
Financial Assurance
We must provide financial assurance to governmental agencies and a variety of other entities under applicable environmental regulations relating to our landfill operations for capping, closure and post-closure costs, and related to our performance under certain collection, landfill and transfer station contracts. We satisfy these financial assurance requirements by providing surety bonds, letters of credit or trust deposits, which are included in restricted cash and marketable securities. The amount of the financial assurance requirements for capping, closure and post-closure costs is determined by applicable state environmental regulations. The financial assurance requirements for capping, closure and post-closure costs may be associated with a portion of the landfill or the entire landfill. Generally, states require a third-party engineering specialist to determine the estimated capping, closure and post-closure costs that are used to determine the required amount of financial assurance for a landfill. The amount of financial assurance required can, and generally will, differ from the obligation determined and recorded under GAAP. The amount of the financial assurance requirements related to contract performance varies by contract. Additionally, we must provide financial assurance for our insurance program and collateral for certain performance obligations. We do not
49
expect a material increase in financial assurance requirements in the foreseeable future, although the mix of financial assurance instruments may change.
These financial instruments are issued in the normal course of business and are not considered company indebtedness. Because we currently have no liability for these financial assurance instruments, they are not reflected in our consolidated balance sheets. However, we record capping, closure and post-closure liabilities and self-insurance liabilities as they are incurred. The underlying obligations of the financial assurance instruments, in excess of those already reflected in our consolidated balance sheets, would be recorded if it is probable that we would be unable to fulfill our related obligations. We do not expect this to occur.
Contractual Commitments
We have various contractual obligations in the normal course of our operations and financing activities. The following table summarizes our contractual cash obligations as of December 31, 2017 (in millions):
Operating Leases | Final Capping, Closure and Post-Closure (a) | Debt Payments (b) (c) | Scheduled Interest Payment Obligations (d) | Unconditional Purchase Commitments (e) | Total | ||||||||||||||||||
2018 | $ | 6.3 | $ | 20.2 | $ | 45.1 | $ | 80.1 | $ | 26.9 | $ | 178.6 | |||||||||||
2019 | 5.2 | 36.1 | 37.3 | 78.5 | 7.4 | 164.5 | |||||||||||||||||
2020 | 4.4 | 28.4 | 27.4 | 77.2 | 6.7 | 144.1 | |||||||||||||||||
2021 | 3.0 | 28.5 | 17.5 | 76.4 | 6.1 | 131.5 | |||||||||||||||||
2022 | 2.4 | 28.0 | 18.3 | 75.8 | 4.3 | 128.8 | |||||||||||||||||
Thereafter | 21.8 | 282.6 | 1,844.1 | 61.6 | 59.8 | 2,269.9 | |||||||||||||||||
Total | $ | 43.1 | $ | 423.8 | $ | 1,989.7 | $ | 449.6 | $ | 111.2 | $ | 3,017.4 | |||||||||||
(a) | The estimated remaining final capping, closure and post-closure expenditures presented above are not inflated or discounted and reflect the estimated future payments for liabilities incurred and recorded as of December 31, 2017. |
(b) | Debt payments include principal payments on debt and capital lease obligations. |
(c) | Our recorded debt obligations include non-cash adjustments associated with discounts and deferred loan costs. These amounts have been excluded as they will not impact our liquidity in future periods. |
(d) | Interest on variable rate debt was calculated at 3.7%, which is the 1 week LIBOR rate plus applicable margin in effect as of December 31, 2017. |
(e) | Unconditional purchase commitments consist of disposal related agreements that include fixed or minimum royalty payments, disposal related host agreements, capital expenditure commitments, payments for premiums on interest rate caps and waste relocation obligations. |
Critical Accounting Policies and Estimates
General
The preparation of consolidated financial statements in conformity with GAAP requires management to make estimates and assumptions that affect the amounts reported in the financial statements and the accompanying notes. Actual results could differ from those estimates. We believe the following accounting policies and estimates are the most critical and could have the most impact on our results of operations. For a discussion of these and other accounting policies, see the notes to the Consolidated Financial Statements included elsewhere in this Form 10-K.
We have noted examples of the residual accounting and business risks inherent in the accounting for these areas. Residual accounting and business risks are defined as the inherent risks that we face after the application of our policies and processes that are generally outside of our control or ability to forecast.
Revenue Recognition
Revenues are generally recognized as the services are provided. Revenue is recognized as waste is collected, as tons are received at the landfill or transfer stations, as recycled commodities are delivered to a customer or as services are rendered to
50
customers. Certain customers are billed in advance and, accordingly, recognition of the related revenues is deferred until the services are provided. Revenues are reported net of state landfill taxes. No single customer individually accounted for more than 2% of our consolidated revenue for the year ending December 31, 2017.
Landfill Accounting
Costs Basis of Landfill Assets
Landfills are typically developed in a series of cells, each of which is constructed, filled and capped in sequence over the operating life of the landfill. When the final cell is filled and the operating life of the landfill is completed, the cell must be capped and then closed and post-closure care and monitoring activities begin. Capitalized landfill costs include expenditures for land (which includes the land of the landfill footprint and landfill buffer property and setbacks) and related airspace associated with the permitting, development and construction of new landfills, expansions at existing landfills, landfill gas systems and landfill cell development. Landfill permitting, development and construction costs represent direct costs related to these activities, including land acquisition, engineering, legal and construction. These costs are deferred until all permits are obtained and operations have commenced at which point they are capitalized and amortized. If necessary permits are not obtained, costs are charged to operations. The cost basis of our landfill assets also includes asset retirement costs, which represent estimates of future costs associated with landfill final capping, closure and post-closure activities.
Final Capping, Closure and Post-Closure Costs
The following is a description of our asset retirement activities and related accounting:
Final Capping
Includes installing flexible membrane and geosynthetic clay liners, drainage and compact soil layers, and topsoil, and is constructed over an area of the landfill where total airspace capacity has been consumed and waste disposal operations have ceased. These final capping activities occur in phases as needed throughout the operating life of a landfill as specific areas are filled to capacity and the final elevation for that specific area is reached in accordance with the provisions of the operating permit. Final capping asset retirement obligations are recorded on a units-of-consumption basis as airspace is consumed related to the specific final capping event with a corresponding increase in the landfill asset. Each final capping event is accounted for as a discrete obligation and recorded as an asset and a liability based on estimates of the discounted cash flows and capacity associated with each final capping event.
Closure and post-closure
These activities involve methane gas control, leachate management and groundwater monitoring, surface water monitoring and control, and other operational and maintenance activities that occur after the site ceases to accept waste. The post-closure period generally runs for 30 years after final site closure for landfills. Landfill costs related to closure and post-closure are recorded as an asset retirement obligation as airspace is consumed over the life of the landfill with a corresponding increase in the landfill asset. Obligations are recorded over the life of the landfill based on estimates of the discounted cash flows associated with performing closing and post-closure activities.
Annually we update our estimates for these obligations considering the respective State regulatory requirements, input from our internal engineers, operations, and accounting personnel and external consulting engineers. The closure and post-closure requirements are established under the standards of the EPA’s Subtitle D regulations as implemented and applied on a state-by-state basis. These estimates involve projections of costs that will be incurred as portions of the landfill are closed and during the post-closure monitoring period.
Capping, closure and post-closure costs are estimated assuming such costs would be incurred by a third party contractor in present day dollars and are inflated by 2.5% (an estimate based on the 25-year average change in the historical Consumer Price Index from 1992 to 2017) to the time periods within which it is estimated the capping, closure and post-closure costs will be expended. We discount these costs to present value using the credit-adjusted, risk-free rate effective at the time an obligation is incurred, consistent with the expected cash flow approach. Any change that results in an upward revision to the estimated cash flows are treated as a new liability and discounted at the current rate while downward revisions are discounted at the historical weighted-average rate of the recorded obligation. As a result, the credit-adjusted, risk-free discount rate used to calculate the present value of an obligation is specific to each individual asset retirement obligation. The range of rates utilized within the calculation of our asset retirement obligations at December 31, 2017 is between 4.9% and 10.5%.
We record the estimated fair value of the final capping, closure and post-closure liabilities for our landfills based on the capacity consumed in the current period. The fair value of the final capping obligations is developed based on our estimates of
51
the airspace consumed to date for each final capping event and the expected timing of each final capping event. The fair value of closure and post-closure obligations is developed based on our estimates of the airspace consumed to date for the entire landfill and the expected timing of each closure and post-closure activity. Because these obligations are measured at estimated fair value using present value techniques, changes in the estimated cost or timing of future final capping, closure and post-closure activities could result in a material change in these liabilities, related assets and results of operations. We assess the appropriateness of the estimates used to develop our recorded balances annually, or more often if significant facts change.
Changes in inflation rates or the estimated costs, timing or extent of future final capping, closure and post-closure activities typically result in both (i) a current adjustment to the recorded liability and landfill asset; and (ii) a change in liability and asset amounts to be recorded prospectively over either the remaining capacity of the related discrete final capping event or the remaining permitted and expansion airspace (as defined below) of the landfill. Any changes related to the capitalized and future cost of the landfill assets are then recognized in accordance with our amortization policy, which would generally result in amortization expense being recognized prospectively over the remaining capacity of the final capping event or the remaining permitted and expansion airspace of the landfill, as appropriate. Changes in such estimates associated with airspace that has been fully utilized result in an adjustment to the recorded liability and landfill assets with an immediate corresponding adjustment to landfill airspace amortization expense.
Interest accretion on final capping, closure and post-closure liabilities is recorded using the effective interest method and is recorded in operating expenses in the consolidated statements of operations.
Amortization of Landfill Assets
The amortizable basis of a landfill includes (i) amounts previously expended and capitalized; (ii) capitalized and projected landfill final capping, closure and post-closure costs; (iii) projections of future acquisition and development costs required to develop the landfill site to its remaining permitted and expansion capacity; and (iv) land underlying both the footprint of the landfill and the surrounding required setbacks and buffer land.
Amortization is recorded on a units-of-consumption basis, applying expense at a rate per ton. The rate per ton is calculated by dividing each component of the amortizable basis of a landfill by the number of tons needed to fill the corresponding asset’s airspace. For landfills that we do not own, but operate through operating or lease arrangements, the rate per ton is calculated based on expected capacity to be utilized over the lesser of the contractual term of the underlying agreement or the life of the landfill.
Landfill site costs are depleted to zero upon final closure of a landfill. We develop our estimates of the obligations using input from our operations personnel, engineers and accountants and the obligations are based upon interpretation of current requirements and proposed regulatory changes and are intended to approximate fair value. The estimate of fair value is based upon present value techniques using historical experience and, where available, quoted or actual market prices paid for similar work.
The determination of airspace usage and remaining airspace is an essential component in the calculation of landfill asset depletion. This estimation is performed by conducting periodic topographic surveys, using aerial survey techniques, of our landfill facilities to determine remaining airspace in each landfill. The surveys are reviewed by our external consulting engineers, internal operating staff, management, and financial and accounting staff.
Remaining airspace includes additional “deemed permitted” or unpermitted expansion airspace if the following criteria are met:
(1) | The company must either own the property for the expansion or have a legal right to use or obtain property to be included in the expansion plan; |
(2) | Conceptual design of the expansion must have been completed; |
(3) | Personnel are actively working to obtain land use and local and state approvals for an expansion of an existing landfill and the application for expansion must reasonably be expected to be received within the normal application and processing time periods for approvals in the jurisdiction in which the landfill is located; |
(4) | There are no known significant technical, community, business, or political restrictions or similar issues that would likely impair the success of the expansion; and |
(5) | Financial analysis has been completed and the results demonstrate that the expansion has a positive financial and operational impact. |
52
Senior management must have reviewed and approved all of the above. Of our 40 active landfills, fifteen included deemed permitted airspace at December 31, 2017.
Upon successfully meeting the preceding criteria, the costs associated with developing, constructing, closing and monitoring the total additional future capacity are considered in the calculation of the amortization and closure and post-closure rates.
Once expansion airspace meets these criteria for inclusion in our calculation of total available disposal capacity, management continuously monitors each site’s progress in obtaining the expansion permit. If at any point it is determined that an expansion area no longer meets the required criteria, the probable expansion airspace is removed from the landfill’s total available capacity, and the rates used at the landfill to amortize costs to acquire, construct, close and monitor the site during the post-closure period are adjusted prospectively. In addition, any amounts related to the probable expansion are charged to expense in the period in which it is determined that the criteria are no longer met.
Once the remaining permitted and expansion airspace is determined in cubic yards, an airspace utilization factor (“AUF”) is established to calculate the remaining permitted and expansion capacity in tons. The AUF is established using the measured density obtained from previous annual surveys and is then adjusted to account for future settlement. The amount of settlement that is forecasted will take into account several site-specific factors including: current and projected mix of waste type, initial and projected waste density, estimated number of years of life remaining, depth of underlying waste, anticipated access to moisture through precipitation or recirculation of landfill leachate and operating practices. In addition, the initial selection of the AUF is subject to a subsequent multi-level review by our engineering group, and the AUF used is reviewed on a periodic basis and revised as necessary. Our historical experience generally indicates that the impact of settlement at a landfill is greater later in the life of the landfill when the waste placed at the landfill approaches its highest point under the permit requirements.
After determining the costs and remaining permitted and expansion capacity at each of our landfills, we determine the per ton rates that will be expensed as waste is received and deposited at the landfill by dividing the costs by the corresponding number of tons. We calculate per ton amortization rates for each landfill for assets associated with each final capping event, for assets related to closure and post-closure activities and for all other costs capitalized or to be capitalized in the future. These rates per ton are updated annually, or more often, as significant facts change.
It is possible that our estimates or assumptions could ultimately be significantly different from actual results. In some cases we may be unsuccessful in obtaining an expansion permit or we may determine that an expansion permit that we previously thought was probable has become unlikely. To the extent that such estimates, or the assumptions used to make those estimates, prove to be significantly different than actual results, or the belief that we will receive an expansion permit changes adversely in a significant manner, the costs of the landfill, including the costs incurred in the pursuit of the expansion, may be subject to impairment testing and lower profitability may be experienced due to higher amortization rates, higher capping, closure and post-closure rates, and higher expenses or asset impairments related to the removal of previously included expansion airspace.
The assessment of impairment indicators and the recoverability of our capitalized costs associated with landfills and related expansion projects require significant judgment due to the unique nature of the waste industry, the highly regulated permitting process and the estimates involved. During the review of a landfill expansion application, a regulator may initially deny the expansion application although the permit is ultimately granted. In addition, management may periodically divert waste from one landfill to another to conserve remaining permitted landfill airspace, or a landfill may be required to cease accepting waste, prior to receipt of the expansion permit. However, such events occur in the ordinary course of business in the waste industry and do not necessarily result in an impairment of our landfill assets because, after consideration of all facts, such events may not affect our belief that we will ultimately obtain the expansion permit. As a result, our tests of recoverability, which generally make use of a cash flow estimation approach, may indicate that no impairment loss should be recorded. No landfill impairments were recorded for fiscal 2017, 2016 and 2015.
Self-Insurance Reserves and Related Costs
Our insurance programs for workers’ compensation, general liability, vehicle liability and employee-related health care benefits are effectively self-insured. Accruals for self-insurance reserves are based on claims filed and estimates of claims incurred but not reported. We maintain high deductibles for commercial general liability, vehicle liability and workers’ compensation coverage at $0.5, $1.0 and $0.8, respectively as of December 31, 2017.
Accruals for self-insurance reserves are based on claims filed and estimate of claims incurred but not reported and are recorded gross of expected recoveries. The accruals for these liabilities could be revised if future occurrences of loss development differ significantly from our assumptions.
53
Loss Contingencies
We are subject to various legal proceedings, claims and regulatory matters, the outcomes of which are subject to significant uncertainty. We determine whether to disclose or accrue for loss contingencies based on an assessment of whether the risk of loss is remote, reasonably possible or probable, and whether it can be reasonably estimated. We analyze our litigation and regulatory matters based on available information to assess the potential liabilities. Management’s assessment is developed based on an analysis of possible outcomes under various strategies. We record and disclose loss contingencies pursuant to the applicable accounting guidance for such matters.
We record losses related to contingencies in cost of operations or selling, general and administrative expenses, depending on the nature of the underlying transaction leading to the loss contingency.
Asset Impairment
We monitor the carrying value of our long-lived assets for potential impairment and test the recoverability of such assets whenever events or changes in circumstances indicate that their carrying amounts may not be recoverable. These events or changes in circumstances, including management decisions pertaining to such assets, are referred to as impairment indicators. Typical indicators that an asset may be impaired include (i) a significant adverse change in legal factors in the business climate, (ii) an adverse action or assessment by a regulator, and (iii) a significant adverse change in the extent or manner in which a long-lived asset is being utilized or in its physical condition. If an impairment indicator occurs, we perform a test of recoverability by comparing the carrying value of the asset or asset group to its undiscounted expected future cash flows. If cash flows cannot be separately and independently identified for a single asset, we will determine whether an impairment has occurred for the asset group for which we can identify the projected cash flows. If the carrying values are in excess of undiscounted expected future cash flows, we measure any impairment by comparing the fair value of the asset or asset group to its carrying value. Fair value is generally determined by considering: (i) an internally developed discounted projected cash flow analysis of the asset or asset group; (ii) third-party valuations; and/or (iii) information available regarding the current market for similar assets. If such assets are considered to be impaired, the impairment to be recognized is measured as the amount by which the carrying value exceeds the fair value of the asset.
Goodwill
Goodwill is the excess of the purchase price over the fair value of the net identifiable assets of acquired businesses. We do not amortize goodwill. We assess whether a goodwill impairment exists using both qualitative and quantitative assessments. Our reporting units are equivalent to our operating segments and when an individual business within an integrated operating segment is divested, goodwill is allocated to that business based on its fair value relative to the fair value of its operating segment. During fiscal 2017, $0.9 of goodwill was disposed of related to the divestiture of our Charlotte, North Carolina operations in the East segment.
Our qualitative assessment involves determining whether events or circumstances exist that indicate it is more likely than not that the fair value of a reporting unit is less than its carrying amount, including goodwill. If based on this qualitative assessment we determine it is not more likely than not that the fair value of a reporting unit is less than its carrying amount, we will not perform a quantitative assessment. Regardless of the results of our qualitative assessments, we perform a quantitative assessment at least every three years.
When we perform a quantitative assessment, we determine whether goodwill is impaired at the reporting unit level. We compare the fair value with its carrying amount to determine if there is an impairment of goodwill. Fair value is estimated using an income approach based on forecasted cash flows. Fair value computed via this method is arrived at using a number of factors, including projected future operating results, economic projections, anticipated future cash flows and comparable marketplace data. There are inherent uncertainties related to these factors and to our judgment in applying them to this analysis. However, we believe that this method provides a reasonable approach to estimating the fair value of its reporting units.
We perform our annual assessment as of December 31 of each year. The Company performed a qualitative assessment in fiscal 2017 and the last time a quantitative assessment was performed was in fiscal 2015. The impairment test as of December 31, 2017 determined that no events or circumstances exist that indicate it is more likely than not that the fair value of any reporting unit is less than its carrying amount. If we do not achieve our anticipated disposal volumes in future periods, our collection or disposal rates decline, our costs or capital expenditures exceed our forecasts, costs of capital increase, or we do not receive landfill expansions, the estimated fair value could decrease and potentially result in an impairment charge. We recorded no goodwill impairment charges for fiscal 2017, 2016 and 2015 in connection with our assessments.
54
Income Taxes
Deferred tax assets and liabilities are determined based on differences between the financial reporting and income tax basis of assets (other than non-deductible goodwill) and liabilities. Deferred tax assets and liabilities are measured using the income tax rate in effect during the year in which the differences are expected to reverse.
We record net deferred tax assets to the extent we believe these assets will more likely than not be realized. In making this determination, we consider all available positive and negative evidence, including scheduled reversals of deferred tax liabilities, projected future taxable income, tax planning strategies and recent financial operations. In the event we determine that we would be able to realize our deferred income tax assets in the future in excess of their net recorded amount, we will make an adjustment to the valuation allowance which would reduce our provision for income taxes.
Our income tax expense, deferred tax assets and liabilities and reserves for unrecognized tax benefits reflect management’s best assessment of estimated future taxes to be paid. We are subject to U.S. federal income taxes and numerous state jurisdictions. Significant judgments and estimates are required in determining the combined income tax expense.
Regarding the accounting for uncertainty in income taxes recognized in the financial statements, we record a tax benefit from an uncertain tax position when it is more likely than not that the position will be sustained upon examination, including resolutions of any related appeals or litigation processes, based on the technical merits. We recognize interest and penalties related to uncertain tax positions within the provision for income taxes in our consolidated statements of income. Accrued interest and penalties are included within other accrued liabilities and deferred income taxes and other long-term tax liabilities in our consolidated balance sheets. Refer to Note 17 "Income Taxes" for details regarding adjustments to our valuation allowance.
In January 2018, the FASB released guidance on the accounting for tax on the global intangible low-taxed income (“GILTI”) provision of the Tax Cuts and Jobs Act. The GILTI provision impose a tax on foreign income in excess of a deemed return on tangible assets of foreign corporations. The guidance indicates that either accounting for deferred taxes related to GILTI inclusions or to treat any taxes on GILTI inclusions as period costs are both acceptable methods subject to an accounting policy election. Effective the first quarter of 2018, we will elect to treat any potential GILTI inclusions as a period cost as we are not projecting any material impact from GILTI inclusions and any deferred taxes related to any inclusion are expected to be immaterial.
Recently Issued and Proposed Accounting Standards
In August 2017, the FASB issued ASU 2017-12 which intends to address concerns through changes to hedge accounting guidance which will accomplish the following: a) Expand hedge accounting for nonfinancial and financial risk components and amend measurement methodologies to more closely align hedge accounting with a company's risk management activities; b) Decrease the complexity of preparing and understanding hedge results through eliminating the separate measurement and reporting of hedge ineffectiveness; c) Enhance transparency, comparability and understandability of hedge results through enhanced disclosures and changing the presentation of hedge results to align the effects of the hedging instrument and the hedged item; and d) Reduce the cost and complexity of applying hedge accounting by simplifying the manner in which assessments of hedge effectiveness may be performed. ASU 2017-12 is effective for fiscal years beginning after December 15, 2018 and interim periods within those fiscal years. Early adoption is permitted in any interim period following the issuance date. We are currently assessing the effect this guidance may have on our consolidated financial statements.
In January 2017, the Financial Accounting Standards Board ("FASB") issued Accounting Standards Update ("ASU") 2017-04 which simplifies the goodwill impairment test by eliminating step 2 of the quantitative assessment. Under the guidance, when a quantitative assessment is required, an entity will perform a goodwill impairment test by comparing the fair value of a reporting unit with its carrying amount. An impairment charge will be measured as the amount by which the carrying amount exceeds the reporting unit's fair value, not to exceed the total amount of goodwill allocated to that reporting unit. Additionally, entities should consider income tax effects from any tax deductible goodwill on the carrying amount of the reporting unit when measuring the goodwill impairment loss, if applicable. The new update is effective for annual periods beginning after December 15, 2019 with early adoption permitted. Our early adoption on January 1, 2017 did not have an impact on our consolidated financial statements.
In January 2017, the FASB issued ASU 2017-01 which clarifies the definition of a business with the objective of adding guidance to assist entities with evaluating whether transactions should be accounted for as acquisitions (or disposals) of assets or businesses. The amendments provide a screen to determine when a set of assets and activities is not a business. If the screen is not met, the amendments require further consideration of inputs, substantive processes and outputs to determine whether the
55
transaction is an acquisition of a business. The new update is effective for annual periods beginning after December 15, 2017 with early adoption permitted. Our early adoption on January 1, 2017 did not have an impact on our consolidated financial statements.
In February 2016, the FASB issued ASU 2016-02, Leases, which will require lessees to recognize most leases on their balance sheets as a right-of-use asset with a corresponding lease liability, and lessors to recognize a net lease investment. Additional qualitative and quantitative disclosures will also be required to increase transparency and comparability among organizations. This standard is effective for fiscal years beginning after December 15, 2018, including interim periods within those fiscal years. Early adoption of the standard is permitted; however, we do not expect to early adopt the ASU. Lessees and lessors are required to recognize and measure leases at the beginning of the earliest period presented. We are currently evaluating the expected impact of this standard update on disclosures, but we do not anticipate any material changes to operating results or liquidity.
In May 2014, the FASB issued ASU 2014-09, Revenue from Contracts with Customers, which supersedes previous revenue recognition guidance. The new standard requires that a company recognize revenue when it transfers promised goods or services to customers in an amount that reflects the consideration the company expects to receive in exchange for those goods or services. Companies will need to use more judgment and estimates than under the guidance currently in effect, including estimating the amount of variable revenue to recognize over each identified performance obligation. Additional disclosures will be required to help users of financial statements understand the nature, amount and timing of revenue and cash flows arising from contracts. This standard will become effective for us beginning with the first quarter 2018 and can be adopted either retrospectively to each prior reporting period presented or as a cumulative effect adjustment as of the date of adoption. We will adopt the standard as a cumulative effect adjustment as of the date of adoption.
We completed an impact assessment of the guidance changes affecting the Company and developed an approach to address each change. We completed a process of sampling contracts based on specifically identified contract characteristics. We completed a review of our municipal contracts, commercial collection contracts, roll-off collection contracts, disposal contracts, sale of recyclable contracts, landfill gas contracts, trucking contracts, managed landfill contracts and sale of aggregates contracts. We evaluated key contract terms for each of these contracts and evaluated areas impacted by the amended guidance. Changes to processes and internal controls have been evaluated to meet the standard’s reporting and disclosure requirements.
Based on our work to date, we believe we have identified material contract types and costs that may be impacted by this amended guidance. Under the amended guidance, certain sales commissions will be capitalized and amortized to selling, general and administrative expense over the expected life of the customer relationship. We do not expect a material change to the amount of selling, general and administrative expense recognized on an annual basis, nor do we expect to recognize a material cumulative effect adjustment to accumulated deficit as of January 1, 2018. Additionally, while we do not expect a significant change to the timing or pattern of revenue recognition under the amended guidance, we anticipate recognizing certain consideration payable to customers as a reduction in operating revenues, which is currently recorded as operating expenses.
56
ITEM 7A. QUANTITATIVE AND QUALITATIVE DISCLOSURES ABOUT MARKET RISK
Market Risk
We are exposed to various types of market risk in the normal course of business, including the impact of interest rate changes and changes in the prices of fuel and commodities. We employ risk management strategies that may include the use of derivatives, such as interest rate cap agreements and fuel derivative contracts, to manage these exposures. We do not enter into derivatives for trading purposes. While we are exposed to credit risk in the event of non-performance by counterparties to our derivative agreements, in all cases such counterparties are highly rated financial institutions and we do not anticipate non-performance. We monitor our derivative positions by regularly evaluating the positions at market and by performing sensitivity analysis over the fuel and variable rate debt exposures.
Interest Rate Risk
Our major market risk exposure of our financial instruments is changing interest rates in the United States and fluctuations in LIBOR. The interest rate on borrowings under our Senior Secured Credit Facilities varies depending on prevailing interest rates from time to time. We manage interest rate risk through the use of a combination of fixed and floating rate debt. The fair value of our debt is determined as of the balance sheet date and is subject to change. The Term Loan B Facility and the Revolving Credit Facility each bear interest at a base or LIBOR rate plus an applicable margin. The base rate is defined as the greater of the prime rate, federal funds rate plus 50 basis points or the adjusted LIBOR rate plus 100 basis points. The LIBOR base rate is subject to a 0.75% floor. A 100 basis point change in the Term Loan B Facility interest rate would result in a $14.5 change in interest expense.
We use the 2016 interest rate caps to manage a portion of our debt obligations at a fixed interest rate, which are not treated as hedges for accounting purposes. We use the 2017 interest rate caps to manage a portion of our debt obligations at a fixed interest rate, which are treated as hedges for accounting purposes.
Fuel Price Risk
Fuel costs represent a significant operating expense. When economically practical, we may enter into new or renew contracts, or engage in other strategies to mitigate market risk. Where appropriate, we have implemented a fuel surcharge that is designed to recover a portion of our direct and indirect increases in our fuel costs. While we charge fuel surcharges to many of our customers, we are unable to charge fuel surcharges to all customers. Consequently, an increase in fuel costs results in (1) an increase in our cost of operations, (2) a smaller increase in our revenue (from the fuel surcharge) and (3) a decrease in our operating margin percentage, because the increase in revenue is more than offset by the increase in cost. Conversely, a decrease in fuel costs results in (1) a decrease in our cost of operations, (2) a smaller decrease in our revenue and (3) an increase in our operating margin percentage.
Because energy prices can fluctuate significantly in a relatively short amount of time, we must also continually monitor and adjust our risk management strategies to address not only fuel price increases, but also fuel price volatility. As evidenced by the extreme decline in diesel fuel prices during the fourth quarter of fiscal 2014, diesel fuel prices are subject to significant volatility based on a variety of factors. In addition, the cost of these risk management tools generally increases with sustained high potential for volatility in the fuel market. For fiscal 2016 and fiscal 2015, we utilized fuel derivative contracts to manage our exposure to fluctuations in fuel pricing, however, all of these contracts expired as of December 31, 2016.
Settlements on fuel derivatives which resulted in cash payments amounted to $14.9 and $26.5 for fiscal 2016 and 2015, respectively.
Over the last several years, regulations have been adopted mandating changes in the composition of fuels for motor vehicles. The renewable fuel standards that the EPA sets annually affect the type of fuel our motor vehicle fleet uses. Pursuant to the Energy Independence and Security Act of 2007, the EPA establishes annual renewable fuel volume requirements and separate volume requirements for four different categories of renewable fuels (renewable fuel, advanced biofuel, cellulosic biofuel and biomass-based diesel). These volume requirements set standards for the proportion of refiners' or importers' total fuel volume that must be renewable and must take into account the fuels' impact on reducing GHG emissions. These regulations are one of many factors that may affect the cost of the fuel we use.
At our current consumption levels, a one-cent per gallon change in the price of diesel fuel changes our direct fuel costs by approximately $0.3 on an annual basis, which would be partially offset by a smaller change in the fuel surcharge charged to our
57
customers. Accordingly, a substantial rise or drop in fuel costs could have a material effect on our revenue, cost of operations and operating margin.
Our operations also require the use of certain petrochemical-based products (such as liners at our landfills) whose costs may vary with the price of petrochemicals. An increase in the price of petrochemicals could increase the cost of those products, which would increase our operating and capital costs. We also are susceptible to (1) fuel surcharges charged by our vendors, and (2) other pricing from our vendors due to their increases in indirect fuel costs.
Commodities Prices
We market recycled products such as cardboard and newspaper from our materials recovery facilities. Market demand for recyclable materials causes volatility in commodity prices. At current volumes, we believe a ten dollar per ton change in the price of recyclable fiber will change revenue and operating income by approximately $2.1 and $1.6, respectively, on an annual basis.
Inflation and Prevailing Economic Conditions
To date, inflation has not had a significant impact on our operations. Consistent with industry practice, most of our contracts allow us to recover certain costs, including increases in landfill tipping fees and, in some cases, costs. Competitive factors may require us to absorb at least a portion of these cost increases, particularly during periods of high inflation. Our business is located mainly in the Southern, Midwestern and Eastern United States. Therefore, our business, financial condition and results of operations are susceptible to downturns in the general economy in these geographic regions and other factors affecting the regions, such as state regulations and severe weather conditions. We are unable to forecast or determine the timing and/or the future impact of a sustained economic slowdown.
58
ITEM 8. FINANCIAL STATEMENTS AND SUPPLEMENTARY DATA
Index to Consolidated Financial Statements
Page | |
59
Management's Report on Internal Control Over Financial Reporting
Management of the Company, including the principal executive and financial officers, is responsible for establishing and maintaining adequate internal control over financial reporting, as defined in Rules 13a-15(f) and 15d-15(f) of the Securities Exchange Act of 1934, as amended. Our internal controls are designed to provide reasonable assurance as to the reliability of our financial reporting and the preparation of the consolidated financial statements for external purposes in accordance with accounting principles generally accepted in the United States and includes those policies and procedures that:
i. pertain to the maintenance of records that in reasonable detail accurately and fairly reflect the transactions and dispositions of the assets of the issuer;
ii. provide reasonable assurance that transactions are recorded as necessary to permit preparation of financial statements in accordance with generally accepted accounting principles, and that receipts and expenditures of the issuer are being made only in accordance with authorizations of management and directors of the issuer; and
iii. provide reasonable assurance regarding prevention or timely detection of unauthorized acquisition, use or disposition of the issuer's assets that could have a material effect on the financial statements.
Because of its inherent limitations, internal control over financial reporting may not prevent or detect misstatements. Also, projections of any evaluation of effectiveness to future periods are subject to risk that controls may become inadequate because of changes in conditions, or that the degree of compliance with the policies or procedures may deteriorate.
Management of the Company assessed the effectiveness of our internal control over financial reporting as of December 31, 2017 based on the Internal Control - Integrated Framework issued by the Committee of Sponsoring Organizations of the Treadway Commission (2013 framework). Based on its assessment, management has concluded that our internal control over financial reporting was effective as of December 31, 2017.
The effectiveness of the Company’s internal control over financial reporting as of December 31, 2017 has been audited by Ernst & Young LLP, our independent registered public accounting firm, who also audited our Consolidated Financial Statements included in this Annual Report on Form 10-K, as stated in their report which appears with our accompanying Consolidated Financial Statements.
60
REPORT OF INDEPENDENT REGISTERED PUBLIC ACCOUNTING FIRM
To the Shareholders and the Board of Directors of Advanced Disposal Services, Inc. and Subsidiaries
Opinion on Internal Control over Financial Reporting
We have audited Advanced Disposal Services, Inc. and Subsidiaries’ internal control over financial reporting as of December 31, 2017, based on criteria established in Internal Control-Integrated Framework issued by the Committee of Sponsoring Organizations of the Treadway Commission (2013 framework) (the COSO criteria). In our opinion, Advanced Disposal Services, Inc. and Subsidiaries (the Company) maintained, in all material respects, effective internal control over financial reporting as of December 31, 2017, based on the COSO criteria.
We also have audited, in accordance with the standards of the Public Company Accounting Oversight Board (United States) (PCAOB), the consolidated balance sheets of Advanced Disposal Services, Inc. and Subsidiaries as of December 31, 2017 and 2016, the related consolidated statements of operations, comprehensive income (loss), stockholder’s equity and cash flows for each of the three years in the period ended December 31, 2017, and the related notes and our report dated February 28, 2018 expressed an unqualified opinion thereon.
Basis for Opinion
The Company’s management is responsible for maintaining effective internal control over financial reporting and for its assessment of the effectiveness of internal control over financial reporting included in the accompanying Management’s Report on Internal Control Over Financial Reporting. Our responsibility is to express an opinion on the Company’s internal control over financial reporting based on our audit. We are a public accounting firm registered with the PCAOB and are required to be independent with respect to the Company in accordance with the U.S. federal securities laws and the applicable rules and regulations of the Securities and Exchange Commission and the PCAOB.
We conducted our audit in accordance with the standards of the PCAOB. Those standards require that we plan and perform the audit to obtain reasonable assurance about whether effective internal control over financial reporting was maintained in all material respects.
Our audit included obtaining an understanding of internal control over financial reporting, assessing the risk that a material weakness exists, testing and evaluating the design and operating effectiveness of internal control based on the assessed risk, and performing such other procedures as we considered necessary in the circumstances. We believe that our audit provides a reasonable basis for our opinion.
Definition and Limitations of Internal Control Over Financial Reporting
A company’s internal control over financial reporting is a process designed to provide reasonable assurance regarding the reliability of financial reporting and the preparation of financial statements for external purposes in accordance with generally accepted accounting principles. A company’s internal control over financial reporting includes those policies and procedures that (1) pertain to the maintenance of records that, in reasonable detail, accurately and fairly reflect the transactions and dispositions of the assets of the company; (2) provide reasonable assurance that transactions are recorded as necessary to permit preparation of financial statements in accordance with generally accepted accounting principles, and that receipts and expenditures of the company are being made only in accordance with authorizations of management and directors of the company; and (3) provide reasonable assurance regarding prevention or timely detection of unauthorized acquisition, use, or disposition of the company’s assets that could have a material effect on the financial statements.
Because of its inherent limitations, internal control over financial reporting may not prevent or detect misstatements. Also, projections of any evaluation of effectiveness to future periods are subject to the risk that controls may become inadequate because of changes in conditions, or that the degree of compliance with the policies or procedures may deteriorate.
/s/ Ernst & Young LLP
Certified Public Accountants
Jacksonville, Florida
February 28, 2018
61
REPORT OF INDEPENDENT REGISTERED PUBLIC ACCOUNTING FIRM
To the Shareholders and the Board of Directors of Advanced Disposal Services, Inc. and Subsidiaries
Opinion on the Financial Statements
We have audited the accompanying consolidated balance sheets of Advanced Disposal Services, Inc. and Subsidiaries (the Company) as of December 31, 2017 and 2016, the related consolidated statements of operations, comprehensive income (loss), stockholder’s equity and cash flows for each of the three years in the period ended December 31, 2017, and the related notes (collectively referred to as the “consolidated financial statements”). In our opinion, the consolidated financial statements present fairly, in all material respects, the financial position of the Company at December 31, 2017 and 2016, and the results of its operations and its cash flows for each of the three years in the period ended December 31, 2017, in conformity with U.S. generally accepted accounting principles.
We also have audited, in accordance with standards of the Public Company Accounting Oversight Board (United States) (PCAOB), the Company’s internal control over financial reporting as of December 31, 2017, based on criteria established in Internal Control-Integrated Framework issued by the Committee of Sponsoring Organizations of the Treadway Commission (2013 framework) and our report dated February 28, 2018 expressed an unqualified opinion thereon.
Basis for Opinion
These financial statements are the responsibility of the Company's management. Our responsibility is to express an opinion on the Company’s financial statements based on our audits. We are a public accounting firm registered with the PCAOB and are required to be independent with respect to the Company in accordance with the U.S. federal securities laws and the applicable rules and regulations of the Securities and Exchange Commission and the
PCAOB.
We conducted our audits in accordance with the standards of the PCAOB. Those standards require that we plan and perform the audit to obtain reasonable assurance about whether the financial statements are free of material misstatement, whether due to error or fraud. Our audits included performing procedures to assess the risks of material misstatement of the financial statements, whether due to error or fraud, and performing procedures that respond to those risks. Such procedures included examining, on a test basis, evidence regarding the amounts and disclosures in the financial statements. Our audits also included evaluating the accounting principles used and significant estimates made by management, as well as evaluating the overall presentation of the financial statements. We believe that our audits provide a reasonable basis for our opinion.
/s/ Ernst & Young LLP
Certified Public Accountants
We have served as the Company’s auditor since 2012.
Jacksonville, Florida
February 28, 2018
62
Consolidated Financial Statements
Advanced Disposal Services, Inc. and Subsidiaries
Consolidated Balance Sheets
(In millions of dollars, except shares)
December 31, | |||||||
2017 | 2016 | ||||||
Assets | |||||||
Current assets | |||||||
Cash and cash equivalents | $ | 6.8 | $ | 1.2 | |||
Accounts receivable, net of allowance for doubtful accounts of $5.4 and $4.0, respectively | 199.9 | 183.2 | |||||
Prepaid expenses and other current assets | 37.9 | 30.3 | |||||
Total current assets | 244.6 | 214.7 | |||||
Other assets | 23.0 | 23.3 | |||||
Property and equipment, net of accumulated depreciation of $1,355.5 and $1,163.0, respectively | 1,728.8 | 1,633.4 | |||||
Goodwill | 1,208.2 | 1,173.9 | |||||
Other intangible assets, net of accumulated amortization of $247.6 and $210.7, respectively | 288.7 | 324.6 | |||||
Total assets | $ | 3,493.3 | $ | 3,369.9 | |||
Liabilities and Stockholders’ Equity | |||||||
Current liabilities | |||||||
Accounts payable | $ | 92.3 | $ | 86.5 | |||
Accrued expenses | 113.0 | 109.8 | |||||
Deferred revenue | 69.1 | 62.5 | |||||
Current maturities of landfill retirement obligations | 20.2 | 29.3 | |||||
Current maturities of long-term debt | 74.1 | 36.5 | |||||
Total current liabilities | 368.7 | 324.6 | |||||
Other long-term liabilities | 61.5 | 54.2 | |||||
Long-term debt, less current maturities | 1,884.2 | 1,887.0 | |||||
Accrued landfill retirement obligations, less current maturities | 205.7 | 161.8 | |||||
Deferred income taxes | 88.6 | 112.8 | |||||
Total liabilities | 2,608.7 | 2,540.4 | |||||
Commitments and contingencies | |||||||
Equity | |||||||
Common stock: $.01 par value, 1,000,000,000 shares authorized, 88,491,194 and 88,034,813 shares outstanding, respectively | 0.9 | 0.8 | |||||
Additional paid-in capital | 1,487.4 | 1,470.3 | |||||
Accumulated other comprehensive loss | (0.4 | ) | — | ||||
Accumulated deficit | (603.3 | ) | (641.6 | ) | |||
Treasury stock at cost, 2,274 and 0 shares, respectively | — | — | |||||
Total stockholders’ equity | 884.6 | 829.5 | |||||
Total liabilities and stockholders’ equity | $ | 3,493.3 | $ | 3,369.9 | |||
The accompanying notes are an integral part of these consolidated financial statements.
63
Advanced Disposal Services, Inc. and Subsidiaries
Consolidated Statements of Operations
(In millions of dollars, except shares and per share data)
Year Ended December 31, | |||||||||||
2017 | 2016 | 2015 | |||||||||
Service revenues | $ | 1,507.6 | $ | 1,404.6 | $ | 1,396.4 | |||||
Operating costs and expenses | |||||||||||
Operating (exclusive of items shown separately below) | 962.1 | 865.5 | 866.6 | ||||||||
Selling, general and administrative | 169.5 | 157.0 | 152.6 | ||||||||
Depreciation and amortization | 269.8 | 246.9 | 259.1 | ||||||||
Acquisition and development costs | 1.3 | 0.7 | 1.4 | ||||||||
Loss on disposal of assets and asset impairments | 11.4 | 1.8 | 21.6 | ||||||||
Restructuring charges | 3.4 | 0.8 | — | ||||||||
Total operating costs and expenses | 1,417.5 | 1,272.7 | 1,301.3 | ||||||||
Operating income | 90.1 | 131.9 | 95.1 | ||||||||
Other (expense) income | |||||||||||
Interest expense | (93.0 | ) | (130.2 | ) | (138.0 | ) | |||||
Loss on debt extinguishments and modifications | (3.7 | ) | (64.7 | ) | — | ||||||
Other income (expense), net | 3.7 | 6.9 | (10.1 | ) | |||||||
Total other expense | (93.0 | ) | (188.0 | ) | (148.1 | ) | |||||
Loss before income taxes | (2.9 | ) | (56.1 | ) | (53.0 | ) | |||||
Income tax benefit | (41.2 | ) | (25.7 | ) | (19.4 | ) | |||||
Net income (loss) | $ | 38.3 | $ | (30.4 | ) | $ | (33.6 | ) | |||
Net income (loss) attributable to common stockholders per share | |||||||||||
Basic income (loss) per share | $ | 0.43 | $ | (0.44 | ) | $ | (0.52 | ) | |||
Diluted income (loss) per share | $ | 0.43 | $ | (0.44 | ) | $ | (0.52 | ) | |||
Basic average shares outstanding | 88,323,213 | 69,462,798 | 64,493,536 | ||||||||
Diluted average shares outstanding | 88,887,812 | 69,462,798 | 64,493,536 | ||||||||
The accompanying notes are an integral part of these consolidated financial statements.
64
Advanced Disposal Services, Inc. and Subsidiaries
Consolidated Statements of Comprehensive Income (Loss)
(In millions of dollars)
Year Ended December 31, | |||||||||||
2017 | 2016 | 2015 | |||||||||
Net income (loss) | $ | 38.3 | $ | (30.4 | ) | $ | (33.6 | ) | |||
Other comprehensive loss, net of tax | (0.4 | ) | — | (1.5 | ) | ||||||
Other comprehensive loss | (0.4 | ) | — | (1.5 | ) | ||||||
Comprehensive income (loss) | $ | 37.9 | $ | (30.4 | ) | $ | (35.1 | ) | |||
The accompanying notes are an integral part of these consolidated financial statements.
65
Advanced Disposal Services, Inc. and Subsidiaries
Consolidated Statements of Stockholders' Equity
(In millions of dollars, except shares)
Common Stock | Treasury Stock | Additional Paid-In | Accumulated | Accumulated Other Comprehensive Income | Total Stockholders' | ||||||||||||||||||||||||
Shares | Amount | Shares | Amount | Capital | Deficit | (Loss) | Equity | ||||||||||||||||||||||
Balance at December 31, 2014 | 64,493,536 | $ | 0.6 | — | $ | — | $ | 1,104.4 | $ | (577.6 | ) | $ | 1.5 | $ | 528.9 | ||||||||||||||
Net loss | — | — | — | — | — | (33.6 | ) | — | (33.6 | ) | |||||||||||||||||||
Realized loss resulting from change in fair value of derivative instruments, net of tax | — | — | — | — | — | — | (1.5 | ) | (1.5 | ) | |||||||||||||||||||
Stock based compensation expense | — | — | — | — | 3.1 | — | — | 3.1 | |||||||||||||||||||||
Capital contribution from former parent | — | — | — | — | 0.4 | — | — | 0.4 | |||||||||||||||||||||
Return of capital to former parent | — | — | — | — | (7.5 | ) | — | — | (7.5 | ) | |||||||||||||||||||
Balance at December 31, 2015 | 64,493,536 | 0.6 | — | — | 1,100.4 | (611.2 | ) | — | 489.8 | ||||||||||||||||||||
Net loss | — | — | — | — | — | (30.4 | ) | — | (30.4 | ) | |||||||||||||||||||
Stock based compensation expense | — | — | — | 6.3 | — | — | 6.3 | ||||||||||||||||||||||
Return of capital to former parent | — | — | — | — | (21.8 | ) | — | — | (21.8 | ) | |||||||||||||||||||
Assumed liabilities from merger with former parent | — | — | — | — | (5.5 | ) | — | — | (5.5 | ) | |||||||||||||||||||
Initial public offering proceeds, net | 22,137,500 | 0.2 | — | — | 373.5 | — | — | 373.7 | |||||||||||||||||||||
Stock option exercises and other | 1,403,777 | — | — | — | 17.4 | — | — | 17.4 | |||||||||||||||||||||
Balance at December 31, 2016 | 88,034,813 | 0.8 | — | — | 1,470.3 | (641.6 | ) | — | 829.5 | ||||||||||||||||||||
Net income | — | — | — | — | — | 38.3 | — | 38.3 | |||||||||||||||||||||
Stock based compensation expense | 53,177 | — | — | — | 10.2 | — | — | 10.2 | |||||||||||||||||||||
Stock option exercises and other | 405,478 | 0.1 | 2,274 | — | 6.9 | — | — | 7.0 | |||||||||||||||||||||
Unrealized loss resulting from change in fair value of derivative instruments, net of tax | — | — | — | — | — | — | (0.4 | ) | (0.4 | ) | |||||||||||||||||||
Balance at December 31, 2017 | 88,493,468 | $ | 0.9 | 2,274 | $ | — | $ | 1,487.4 | $ | (603.3 | ) | $ | (0.4 | ) | $ | 884.6 | |||||||||||||
The accompanying notes are an integral part of these consolidated financial statements.
66
Advanced Disposal Services, Inc. and Subsidiaries
Consolidated Statements of Cash Flows
(In millions of dollars)
Year Ended December 31, | |||||||||||
2017 | 2016 | 2015 | |||||||||
Net income (loss) | $ | 38.3 | $ | (30.4 | ) | $ | (33.6 | ) | |||
Adjustments to reconcile net income (loss) to net cash provided by operating activities | |||||||||||
Depreciation and amortization | 269.8 | 246.9 | 259.1 | ||||||||
Change in fair value of derivative instruments | (1.5 | ) | (18.5 | ) | (11.1 | ) | |||||
Amortization of debt issuance costs and original issue discount | 6.3 | 17.5 | 19.5 | ||||||||
Loss on debt extinguishments and modifications | 3.7 | 64.7 | — | ||||||||
Accretion on landfill retirement obligations | 15.4 | 13.0 | 13.1 | ||||||||
Other accretion and amortization | 3.5 | 4.0 | 4.2 | ||||||||
Provision for doubtful accounts | 5.4 | 3.7 | 4.0 | ||||||||
Loss on disposition of property and equipment | 1.6 | 3.5 | 4.7 | ||||||||
Gain on redemption of security | — | — | (2.5 | ) | |||||||
Impairment of assets | 13.0 | — | 6.4 | ||||||||
(Gain) loss on disposition of business | (2.8 | ) | (1.7 | ) | 10.5 | ||||||
Stock based compensation | 10.2 | 6.3 | 3.1 | ||||||||
Deferred tax benefit | (41.3 | ) | (26.5 | ) | (21.6 | ) | |||||
Earnings in equity investee | (1.6 | ) | (1.8 | ) | (1.3 | ) | |||||
Changes in operating assets and liabilities, net of businesses acquired | |||||||||||
(Increase) decrease in accounts receivable | (17.7 | ) | (8.8 | ) | 8.3 | ||||||
(Increase) decrease in prepaid expenses and other current assets | (5.9 | ) | 2.8 | 1.1 | |||||||
Decrease in other assets | 2.4 | 1.8 | 3.9 | ||||||||
Increase (decrease) in accounts payable | 4.1 | (0.9 | ) | (2.8 | ) | ||||||
(Decrease) increase in accrued expenses | (2.6 | ) | (14.3 | ) | 3.9 | ||||||
Increase (decrease) in deferred revenue | 2.2 | (1.0 | ) | (0.5 | ) | ||||||
Increase (decrease) in other long-term liabilities | 0.6 | (3.4 | ) | (3.5 | ) | ||||||
Capping, closure and post-closure expenditures | (18.3 | ) | (19.9 | ) | (20.4 | ) | |||||
Assumption of long-term care and closure reserve | 24.0 | — | — | ||||||||
Net cash provided by operating activities | 308.8 | 237.0 | 244.5 | ||||||||
Cash flows from investing activities | |||||||||||
Purchases of property and equipment and construction and development | (186.6 | ) | (171.0 | ) | (179.7 | ) | |||||
Proceeds from sale of property and equipment | 2.2 | 3.3 | 2.6 | ||||||||
Proceeds from redemption of securities | — | — | 15.0 | ||||||||
Acquisition of businesses, net of cash acquired | (111.9 | ) | (5.4 | ) | (50.0 | ) | |||||
Proceeds from sale of businesses | 8.7 | 2.5 | 14.7 | ||||||||
Net cash used in investing activities | (287.6 | ) | (170.6 | ) | (197.4 | ) | |||||
Cash flows from financing activities | |||||||||||
Proceeds from borrowings on debt instruments | 326.2 | 782.8 | 114.0 | ||||||||
Repayments on debt instruments including capital leases | (347.0 | ) | (1,164.4 | ) | (153.4 | ) | |||||
Bank overdraft | — | (2.6 | ) | 1.2 | |||||||
Proceeds from issuance of common stock | — | 375.6 | — | ||||||||
Costs associated with issuance of common stock | — | (1.9 | ) | — | |||||||
Costs associated with debt extinguishments and modifications | (1.8 | ) | (50.9 | ) | (0.2 | ) | |||||
Proceeds from stock option exercises and other | 7.0 | 17.4 | — | ||||||||
Return of capital to former parent | — | (21.8 | ) | (7.1 | ) | ||||||
Other financing activities | — | — | (2.0 | ) | |||||||
Net cash used in financing activities | (15.6 | ) | (65.8 | ) | (47.5 | ) | |||||
Net increase (decrease) in cash and cash equivalents | 5.6 | 0.6 | (0.4 | ) | |||||||
Cash and cash equivalents, beginning of year | 1.2 | 0.6 | 1.0 | ||||||||
Cash and cash equivalents, end of year | $ | 6.8 | $ | 1.2 | $ | 0.6 | |||||
The accompanying notes are an integral part of these consolidated financial statements.
67
Advanced Disposal Services, Inc. and Subsidiaries
Notes to Consolidated Financial Statements
1. Business Operations
Advanced Disposal Services, Inc. together with its consolidated subsidiaries, as a consolidated entity, is a regional environmental services company providing nonhazardous solid waste collection, transfer, recycling and disposal services to customers in the Southeast, Midwest and Eastern regions of the United States, as well as in the Commonwealth of the Bahamas.
The Company currently manages and evaluates its principal operations through three reportable operating segments on a regional basis. Those operating segments are the South, East and Midwest regions which provide collection, transfer, disposal (in both solid waste and non-hazardous waste landfills), recycling services and billing services. Additional information related to the Company's segments can be found in Note 21.
In fiscal 2017, the Company completed the acquisitions of fourteen companies. Consideration transferred, net of cash acquired, amounted to approximately $115.9 for these acquisitions, of which $4.0 will be paid in subsequent years. The results of operations of each acquisition are included in the Company's consolidated statements of operations subsequent to the closing date of each acquisition.
During fiscal 2017, the Company divested of its non-integrated collection services operation in Charlotte, North Carolina for consideration received of $8.7. A $1.4 gain on the sale of that business is included in the Company's consolidated statements of operations for fiscal 2017. Goodwill of $0.9 was disposed of related to this divestiture.
The Company also has non-integrated collection operations in South Carolina, included in the East segment, which operate in a competitor-owned disposal market that does not align with the Company's long-term market strategy of vertically integrated operations with Company owned disposal sites or marketplace neutral disposal sites. During April of fiscal 2017, changes in facts and circumstances led the Company to evaluate the long-term market for South Carolina collection operations and re-evaluate the expected cash flows provided by this market. The Company compared the carrying value of the South Carolina assets to their fair value and determined it appropriate to impair certain intangible assets that were recorded as part of the purchase accounting when these entities were acquired. Based on the Company's evaluation, an intangible asset impairment of $13.0 was recorded during fiscal 2017.
The Company disposed of certain businesses in the South segment for strategic reasons in June 2015 and recorded a loss on disposal of $10.9 for fiscal 2015. In connection with the sale, the Company impaired property and equipment and intangible assets in the amount of $4.3 for fiscal 2015. Further, the Company strategically concluded not to pursue permitting on a landfill site and therefore recorded a non-cash impairment charge of $2.1 primarily for permitting costs in fiscal 2015.
2. Summary of Significant Accounting Policies
Basis of Presentation
The Company’s consolidated financial statements include its wholly-owned subsidiaries and their respective subsidiaries. All intercompany accounts and transactions have been eliminated in consolidation.
Use of Estimates
In preparing its financial statements that conform with accounting principles generally accepted in the United s of America, the Company uses estimates and assumptions that affect the amounts reported in these financial statements and accompanying notes. The Company must make these estimates and assumptions because certain information is dependent on future events, cannot be calculated with a high degree of precision from data available or simply cannot be readily calculated based on generally accepted methodologies. In preparing its financial statements, the more subjective areas that deal with the greatest amount of uncertainty relate to accounting for long-lived assets, including recoverability, landfill development costs, and final capping, closure and post-closure costs, valuation allowances for accounts receivable and deferred tax assets, liabilities for potential litigation, claims and assessments, liabilities for environmental remediation, stock compensation, accounting for goodwill and intangible asset impairments, deferred taxes, uncertain tax positions, self-insurance reserves, and estimates of the fair values of assets acquired and liabilities assumed in acquisitions. Each of these items is discussed in more detail elsewhere
68
Advanced Disposal Services, Inc. and Subsidiaries
Notes to Consolidated Financial Statements
in these Notes to the Consolidated Financial Statements. The Company's actual results may differ significantly from our estimates.
Cash and Cash Equivalents
For purposes of reporting cash flows, cash and cash equivalents includes cash on hand, bank demand deposit accounts, and overnight sweep accounts. Cash equivalents include highly liquid investments with original maturities of three months or less when purchased.
Revenue Recognition
The Company recognizes revenues as the services are provided. Revenue is recognized as waste is collected, as tons are received at the landfill or transfer stations, as recycled commodities are delivered to a customer, or as services are rendered to customers. Certain customers are billed and pay in advance and, accordingly, recognition of the related revenues is deferred until the services are provided. Revenues are reported net of applicable state landfill taxes.
Trade Receivables
The Company records trade receivables when billed or when services are performed, as they represent claims against third parties that will generally be settled in cash. The carrying value of receivables, net of the allowance for doubtful accounts, represents the estimated net realizable value. The Company estimates losses for uncollectible accounts based on an evaluation of the aged accounts receivable and the likelihood of collection of the receivable based on historical collection data and existing economic conditions. If events or changes in circumstances indicate that specific receivable balances may be impaired, further consideration is given to the collectability of those balances.
Insurance Reserves
The Company uses a combination of insurance with high deductibles and self-insurance for various risks including workers compensation, vehicle liability, general liability and employee group health claims. The exposure for unpaid claims and associated expenses, including incurred but not reported losses, is estimated by factoring in pending claims and historical trends data and other actuarial assumptions. In estimating its claims liability, the Company analyzes its historical trends, including loss development and applies appropriate loss development factors to the incurred costs associated with the claims. The discounted estimated liability associated with settling unpaid claims is included in accrued expenses and other long-term liabilities in the consolidated balance sheets.
Concentrations of Credit Risk
Financial instruments that potentially subject the Company to concentrations of credit risk consist primarily of cash, accounts receivable and derivative instruments. The Company maintains cash and cash equivalents with banks that at times exceed applicable insurance limits. The Company reduces its exposure to credit risk by maintaining such deposits with high quality financial institutions. The Company has not experienced any losses in such accounts. The maximum loss the Company would incur related to credit risk is the asset balances recorded in the balance sheets.
The Company generally does not require collateral on its trade receivables. Credit risk on accounts receivable is minimized as a result of the large and diverse nature of the Company’s customer base and its ability to discontinue service, to the extent allowable, to non-paying customers. No single customer represented greater than 5% of total accounts receivable at December 31, 2017 and 2016, respectively.
Asset Impairments
The Company monitors the carrying value of its long-lived assets for potential impairment and test the recoverability of such assets whenever events or changes in circumstances indicate that the carrying amounts may not be recoverable. These events or changes in circumstances, including management decisions pertaining to such assets, are referred to as impairment indicators. Typical indicators that an asset may be impaired include (i) a significant adverse change in legal factors in the business climate, (ii) an adverse action or assessment by a regulator, and (iii) a significant adverse change in the extent or manner in which a long-lived asset is being utilized or in its physical condition. If an impairment indicator occurs, the Company performs a test of recoverability by comparing the carrying value of the asset or asset group to its undiscounted expected future cash flows. If cash flows cannot be separately and independently identified for a single asset, the Company will determine whether an impairment has occurred for the asset group for which it can identify the projected cash flows. If the carrying values are in excess of undiscounted expected future cash flows, the Company measures any impairment by comparing the fair value of the
69
Advanced Disposal Services, Inc. and Subsidiaries
Notes to Consolidated Financial Statements
asset or asset group to its carrying value. Fair value is generally determined by considering (i) internally developed discounted projected cash flow analysis of the asset or asset group; (ii) third-party valuations; and/or (iii) information available regarding the current market for similar assets. If such assets are considered to be impaired, the impairment to be recognized is measured as the amount by which the carrying value exceeds the fair value of the asset.
Property and Equipment, Net
Property and equipment are recorded at cost, less accumulated depreciation. Expenditures for major additions and improvements are capitalized and maintenance activities are expensed as incurred. When property and equipment are retired, sold, or otherwise disposed of, the cost and accumulated depreciation are removed from the accounts, and any resulting gain or loss is included in the results of operations. Long-lived assets are reviewed for impairment whenever events or changes in circumstances indicate that the carrying amount of an asset may not be recoverable. Assets to be disposed of are reported at the lower of the carrying amount or fair value less cost to sell. Depreciation expense is calculated using the straight-line method over the estimated useful lives or the expected lease term, whichever is shorter. Estimated useful lives are as follows:
Years | |
Vehicles | 5–10 |
Machinery and equipment | 3–10 |
Containers | 5–15 |
Furniture and fixtures | 5–7 |
Building and improvements | 5–39 |
Leases
The Company leases property and equipment in the ordinary course of its business. The most significant lease obligations are for property and equipment specific to the waste industry, including real property operated as landfills and transfer stations. The Company's leases have varying terms. Some may include renewal or purchase options, escalation clauses, restrictions, penalties or other obligations that are considered in determining minimum lease payments. The leases are classified as either operating leases or capital leases, as appropriate.
The classification of the Company's operating leases can be attributed to either (i) relatively low fixed minimum lease payments as a result of real property lease obligations that vary based on the volume of waste we receive or process or (ii) minimum lease terms that are much shorter than the assets’ economic useful lives. The Company expects that in the normal course of business, its operating leases will be renewed, replaced by other leases, or replaced with fixed asset expenditures. The Company's rent expense during each of the last three years and its future minimum operating lease payments for each of the next five years for which it is contractually obligated as of December 31, 2017 is disclosed in Note 13.
Assets under capital leases are capitalized using interest rates determined at the inception of each lease and are amortized over the lesser of the useful life of the asset or the lease term, as appropriate, on a straight-line basis. The present value of the related lease payments is recorded as a debt obligation.
Landfill Accounting
Costs Basis of Landfill Assets
Landfills are typically developed in a series of cells, each of which is constructed, filled and capped in sequence over the operating life of the landfill. When the final cell is filled and the operating life of the landfill is completed, the cell must be capped and then closed and post-closure care and monitoring activities begin. Capitalized landfill costs include expenditures for land (which includes the land of the landfill footprint and landfill buffer property and setbacks) and related airspace associated with the permitting, development and construction of new landfills, expansions at existing landfills, landfill gas systems and landfill cell development. Landfill permitting, development and construction costs represent direct costs related to these activities, including land acquisition, engineering, legal and construction. These costs are deferred until all permits are obtained and operations have commenced at which point they are capitalized and amortized. If necessary permits are not obtained, costs are charged to operations. The cost basis of our landfill assets also includes asset retirement costs, which represent estimates of future costs associated with landfill final capping, closure and post-closure activities.
70
Advanced Disposal Services, Inc. and Subsidiaries
Notes to Consolidated Financial Statements
Final Capping, Closure and Post-Closure Costs
The following is a description of the Company's asset retirement activities and related accounting:
Final Capping
Includes installing flexible membrane and geosynthetic clay liners, drainage and compact soil layers, and topsoil, and is constructed over an area of the landfill where total airspace capacity has been consumed and waste disposal operations have ceased. These final capping activities occur in phases as needed throughout the operating life of a landfill as specific areas are filled to capacity and the final elevation for that specific area is reached in accordance with the provisions of the operating permit. Final capping asset retirement obligations are recorded on a units-of-consumption basis as airspace is consumed related to the specific final capping event with a corresponding increase in the landfill asset. Each final capping event is accounted for as a discrete obligation and recorded as an asset and a liability based on estimates of the discounted cash flows and capacity associated with each final capping event.
Closure and post-closure
These activities involve methane gas control, leachate management and groundwater monitoring, surface water monitoring and control, and other operational and maintenance activities that occur after the site ceases to accept waste. The post-closure period generally runs for 30 years or longer after final site closure for landfills. Landfill costs related to closure and post-closure are recorded as an asset retirement obligation as airspace is consumed over the life of the landfill with a corresponding increase in the landfill asset. Obligations are recorded over the life of the landfill based on estimates of the discounted cash flows associated with performing the closure and post-closure activities.
The Company annually updates its estimates for these obligations considering the respective State regulatory requirements, input from our internal engineers, operations, accounting personnel and external consulting engineers. The closure and post-closure requirements are established under the standards of the U.S. Environmental Protection Agency’s Subtitle D regulations as implemented and applied on a state-by-state basis. These estimates involve projections of costs that will be incurred as portions of the landfill are closed and during the post-closure monitoring period.
Capping, closure and post-closure costs are estimated assuming such costs would be incurred by a third party contractor in present day dollars and are inflated by 2.5% (an estimate based on the 25-year average change in the historical Consumer Price Index from 1992 to 2017) to the time periods within which it is estimated the capping, closure and post-closure costs will be expended. The Company discounts these costs to present value using the credit-adjusted, risk-free rate effective at the time an obligation is incurred, consistent with the expected cash flow approach. Any change that results in an upward revision to the estimated cash flows are treated as a new liability and discounted at the current rate while downward revisions are discounted at the historical weighted-average rate of the recorded obligation. As a result, the credit-adjusted, risk-free discount rate used to calculate the present value of an obligation is specific to each individual asset retirement obligation. The range of rates utilized within the calculation of the asset retirement obligations at December 31, 2017 is between 4.9% and 10.5%.
The Company records the estimated fair value of the final capping, closure and post-closure liabilities for its landfills based on the capacity consumed in the current period. The fair value of the final capping obligations is developed based on the Company’s estimates of the airspace consumed to date for each final capping event and the expected timing of each final capping event. The fair value of closure and post-closure obligations is developed based on the Company’s estimates of the airspace consumed to date for the entire landfill and the expected timing of each closure and post-closure activity. Because these obligations are measured at estimated fair value using present value techniques, changes in the estimated cost or timing of future final capping, closure and post-closure activities could result in a material change in these liabilities, related assets and results of operations. The Company assesses the appropriateness of the estimates used to develop its recorded balances annually, or more often if significant facts change.
Changes in inflation rates or the estimated costs, timing or extent of future final capping, closure and post-closure activities typically result in both (i) a current adjustment to the recorded liability and landfill asset; and (ii) a change in liability and asset amounts to be recorded prospectively over either the remaining capacity of the related discrete final capping event or the remaining permitted and expansion airspace (as defined below) of the landfill. Any changes related to the capitalized and future cost of the landfill assets are then recognized in accordance with the Company's amortization policy, which would generally result in amortization expense being recognized prospectively over the remaining capacity of the final capping event or the
71
Advanced Disposal Services, Inc. and Subsidiaries
Notes to Consolidated Financial Statements
remaining permitted and expansion airspace of the landfill, as appropriate. Changes in such estimates associated with airspace that has been fully utilized result in an adjustment to the recorded liability and landfill assets with an immediate corresponding adjustment to landfill airspace amortization expense.
Interest accretion on final capping, closure and post-closure liabilities is recorded using the effective interest method and is recorded in operating expenses in the consolidated statements of operations.
Amortization of Landfill Assets
The amortizable basis of a landfill includes (i) amounts previously expended and capitalized; (ii) capitalized and projected landfill final capping, closure and post-closure costs; (iii) projections of future acquisition and development costs required to develop the landfill site to its remaining permitted and expansion capacity; and (iv) land underlying both the footprint of the landfill and the surrounding required setbacks and buffer land.
Amortization is recorded on a units-of-consumption basis, applying expense as a rate per ton. The rate per ton is calculated by dividing each component of the amortizable basis of a landfill by the number of tons needed to fill the corresponding asset’s airspace. For landfills that the Company does not own, but operates through operating or lease arrangements, the rate per ton is calculated based on expected capacity to be utilized over the lesser of the contractual term of the underlying agreement or the life of the landfill.
Landfill site costs are depleted to zero upon final closure of a landfill. The Company develops its estimates of the obligations using input from its operations personnel, engineers and accountants. The obligations are based upon interpretation of current requirements and proposed regulatory changes and are intended to approximate fair value. The estimate of fair value is based upon present value techniques using historical experience and, where available, quoted or actual market prices paid for similar work.
The determination of airspace usage and remaining airspace is an essential component in the calculation of landfill asset depletion. This estimation is performed by conducting periodic topographic surveys, using aerial survey techniques, of the Company’s landfill facilities to determine remaining airspace in each landfill. The surveys are reviewed by the Company’s external consulting engineers, internal operating staff, and its management, financial and accounting staff.
Remaining airspace will include additional “deemed permitted” or unpermitted expansion airspace if the following criteria are met:
(1) | The Company must either own the property for the expansion or have a legal right to use or obtain property to be included in the expansion plan; |
(2) | Conceptual design of the expansion must have been completed; |
(3) | Personnel are actively working to obtain land use and local and state approvals for an expansion of an existing landfill and the application for expansion must reasonably be expected to be received within the normal application and processing time periods for approvals in the jurisdiction in which the landfill is located; |
(4) | There are no known significant technical, community, business, or political restrictions or similar issues that would likely impair the success of the expansion; and |
(5) | Financial analysis has been completed and the results demonstrate that the expansion has a positive financial and operational impact. |
Senior management must have reviewed and approved all of the above. Of the Company's 40 active landfills, fifteen include deemed permitted airspace at December 31, 2017.
Upon successful meeting of the preceding criteria, the costs associated with developing, constructing, closing and monitoring the total additional future capacity are considered in the calculation of the amortization and closure and post-closure rates.
Once expansion airspace meets these criteria for inclusion in the Company’s calculation of total available disposal capacity, management continuously monitors each site’s progress in obtaining the expansion permit. If at any point it is determined that
72
Advanced Disposal Services, Inc. and Subsidiaries
Notes to Consolidated Financial Statements
an expansion area no longer meets the required criteria, the deemed expansion airspace is removed from the landfill’s total available capacity, and the rates used at the landfill to amortize costs to acquire, construct, close and monitor the site during the post-closure period are adjusted prospectively. In addition, any amounts related to the probable expansion are charged to expense in the period in which it is determined that the criteria are no longer met.
Once the remaining permitted and expansion airspace is determined in cubic yards, an airspace utilization factor (“AUF”) is established to calculate the remaining permitted and expansion capacity in tons. The AUF is established using the measured density obtained from previous annual surveys and is then adjusted to account for future settlement. The amount of settlement that is forecasted will take into account several site-specific factors including: current and projected mix of waste type, initial and projected waste density, estimated number of years of life remaining, depth of underlying waste, anticipated access to moisture through precipitation or recirculation of landfill leachate and operating practices. In addition, the initial selection of the AUF is subject to a subsequent multi-level review by the Company's engineering group, and the AUF used is reviewed on a periodic basis and revised as necessary. The Company's historical experience generally indicates that the impact of settlement at a landfill is greater later in the life of the landfill when the waste placed at the landfill approaches its highest point under the permit requirements.
After determining the costs and remaining permitted and expansion capacity at each of its landfills, the Company determines the per ton rates that will be expensed as waste is received and deposited at the landfill by dividing the costs by the corresponding number of tons. The Company calculates per ton amortization rates for each landfill for assets associated with each final capping event, for assets related to closure and post-closure activities and for all other costs capitalized or to be capitalized in the future. These rates per ton are updated annually, or more often, as significant facts change.
It is possible that the Company’s estimates or assumptions could ultimately be significantly different from actual results. In some cases the Company may be unsuccessful in obtaining an expansion permit or the Company may determine that an expansion permit that it previously thought was probable has become unlikely. To the extent that such estimates, or the assumptions used to make those estimates, prove to be significantly different than actual results, or the belief that the Company will receive an expansion permit changes adversely in a significant manner, the costs of the landfill, including the costs incurred in the pursuit of the expansion, may be subject to impairment testing and lower profitability may be experienced due to higher amortization rates, higher capping, closure and post-closure rates, and higher expenses or asset impairments related to the removal of previously included expansion airspace.
The assessment of impairment indicators and the recoverability of the Company's capitalized costs associated with landfills and related expansion projects require significant judgment due to the unique nature of the waste industry, the highly regulated permitting process and the estimates involved. During the review of a landfill expansion application, a regulator may initially deny the expansion application although the permit is ultimately granted. In addition, the Company may periodically divert waste from one landfill to another to conserve remaining permitted landfill airspace, or a landfill may be required to cease accepting waste, prior to receipt of the expansion permit. However, such events occur in the ordinary course of business in the waste industry and do not necessarily result in an impairment of the landfill assets because, after consideration of all facts, such events may not affect the belief that the Company will ultimately obtain the expansion permit. As a result, the Company's tests of recoverability, which generally make use of a cash flow estimation approach, may indicate that no impairment loss should be recorded. No landfill impairments were recorded for the years ended December 31, 2017, 2016 and 2015.
Derivative Financial Instruments
The Company uses interest rate caps to manage interest rate risk on its variable rate debt. The Company may use commodity futures contracts as an economic hedge to reduce the exposure of changes in diesel fuel and natural gas prices. The 2017 interest rate caps qualify for hedge accounting treatment and have been designated as cash flow hedges for accounting purposes with changes in fair value, to the extent effective, recognized in accumulated other comprehensive income within the equity section of the consolidated balance sheets. Amounts are reclassified into earnings when the forecasted transaction affects earnings. The commodity futures contracts and the 2016 interest rate caps do not qualify for hedge accounting and as such changes in fair value are recognized in other income (expense), net in the consolidated statements of operations. The fair values of the derivatives are included in other current or long-term assets or other current or long term liabilities as appropriate. The Company obtains current valuations of its commodity futures contracts and interest rate caps based on quotes received from financial institutions that trade these contracts and a current forward fixed price swap curve, respectively.
73
Advanced Disposal Services, Inc. and Subsidiaries
Notes to Consolidated Financial Statements
Original Issue Discount and Debt Issuance Costs
Original issue discount and debt issuance costs related to the issuance of debt are deferred and recorded as a reduction to the carrying value of debt and amortized to interest expense using the effective interest method. Previously recorded original issue discount and debt issuance costs are expensed when debt is extinguished prior to maturity.
Third party costs incurred in relation to a modification of debt are expensed as incurred. For modifications of debt, previously recorded original issue discount and debt issuance costs are amortized over the life of the modified debt instrument using the effective interest method.
Acquisitions
The Company recognizes assets acquired and liabilities assumed in business combinations, including contingent assets and liabilities, based on fair values as of the date of acquisition. Any excess of purchase price over the fair value of the net assets acquired is recorded as goodwill.
In certain acquisitions, the Company agrees to pay additional amounts to sellers contingent upon achievement by the acquired businesses of certain negotiated goals, such as targeted revenue levels, targeted disposal volumes or the issuance of permits for expanded landfill airspace. The Company has recognized liabilities for these contingent obligations based on their estimated fair value at the date of acquisition with any differences between the acquisition date fair value and the ultimate settlement of the obligations being recognized as an adjustment to income from operations.
Assets and liabilities arising from contingencies such as pre-acquisition environmental matters and litigation are recognized at their acquisition date fair value when their respective fair values can be determined. If the fair values of such contingencies cannot be determined, the Company reports provisional amounts for which the accounting is incomplete.
Acquisition date fair value estimates are revised as necessary and accounted for as an adjustment to the purchase accounting balances prior to the close of the purchase accounting window. If the purchase accounting window has closed, these estimates are accounted for as adjustments to income from operations if, and when, additional information becomes available to further define and quantify assets acquired and liabilities assumed. All acquisition-related transaction costs have been expensed as incurred.
Goodwill
Goodwill is the excess of the purchase price over the fair value of the net identifiable assets of acquired businesses. The Company does not amortize goodwill. The Company assesses whether a goodwill impairment exists using both qualitative and quantitative assessments. The Company's reporting units are equivalent to its operating segments and when an individual business within an integrated operating segment is divested, goodwill is allocated to that business based on its fair value relative to the fair value of its operating segment. The Company's qualitative assessment involves determining whether events or circumstances exist that indicate it is more likely than not that the fair value of a reporting unit is less than its carrying amount, including goodwill. If based on this qualitative assessment, the Company determines it is not more likely than not that the fair value of a reporting unit is less than its carrying amount, the Company will not perform a quantitative assessment. Regardless of the results of its qualitative assessments, the Company performs a quantitative assessment at least every three years.
When the Company performs a quantitative assessment, the Company determines whether goodwill is impaired at the reporting unit level. The Company compares the fair value with its carrying amount to determine if there is an impairment of goodwill. Fair value is estimated using an income approach based on forecasted cash flows. Fair value computed via this method is arrived at using a number of factors, including projected future operating results, economic projections, anticipated future cash flows and comparable marketplace data. There are inherent uncertainties related to these factors and to the Company's judgment in applying them to this analysis. However, the Company believes that this method provides a reasonable approach to estimating the fair value of its reporting units.
The Company performs its annual assessment as of December 31 of each year. The Company performed a qualitative assessment in fiscal 2017 and the last time a quantitative assessment was performed was in fiscal 2015. The impairment test as of December 31, 2017 determined that no events or circumstances exist that indicate it is more likely than not that the fair value of any reporting unit is less than its carrying amount. If the Company does not achieve its anticipated disposal volumes, our collection or disposal rates decline, costs or capital expenditures exceed forecasts, costs of capital increase, or the Company
74
Advanced Disposal Services, Inc. and Subsidiaries
Notes to Consolidated Financial Statements
does not receive landfill expansions, the estimated fair value could decrease and potentially result in an impairment charge in the future. The Company recorded no goodwill impairment charges for fiscal 2017, 2016 and 2015 in connection with the assessments.
Intangible Assets, Net
Definite lived intangible assets are stated at cost less accumulated amortization and consist of noncompete agreements, tradenames, customer contracts and customer lists and are amortized over their estimated useful lives. Definite lived intangible assets are reviewed for impairment whenever events or changes in circumstances indicate that the carrying amount of the asset may not be recoverable. If the carrying value of a definite lived intangible is not recoverable and exceeds its estimated fair value, an impairment charge would be recognized in the amount of the excess. Fair value is typically estimated using an income approach for the respective asset, as described above.
Income Taxes
The Company is subject to income tax in the United States. Current tax obligations associated with the provision for income taxes are reflected in the accompanying consolidated balance sheets as a component of accrued expenses and the deferred tax obligations are reflected in deferred income tax asset or liability. Deferred income taxes arise from temporary differences resulting from income and expense items reported for financial accounting and tax purposes in different periods. Deferred income taxes are classified as noncurrent in accordance with current accounting guidance. Significant judgment is required in assessing the timing and amounts of deductible and taxable items. The Company establishes reserves for uncertain tax positions, when despite its belief that its tax return positions are fully supportable, the Company believes that certain positions may be challenged and potentially disallowed. When facts and circumstances change, the Company adjusts these reserves through its provision for income taxes. To the extent interest and penalties may be assessed by taxing authorities on any underpayment of income tax, such amounts have been accrued and are classified as a component of tax expense in the consolidated statements of operations.
The Company monitors changes in tax legislation and accounting developments which could impact the timing and amounts of deductible or taxable items. In connection with the implementation of the Tax Cuts and Jobs Act, the Company recognized the estimated impact of this legislation as a component of the benefit for income taxes. Refer to Note 17. Income Taxes.
Contingencies
The Company is subject to various legal proceedings, claims and regulatory matters, the outcomes of which are subject to significant uncertainty. In general, the Company determines whether to disclose or accrue for loss contingencies based on an assessment of whether the risk of loss is remote, reasonably possible or probable, and whether it can be reasonably estimated. The Company assesses its potential liability relating to litigation and regulatory matters based on information available. The Company develops its assessment based on an analysis of possible outcomes under various strategies. The Company accrues for loss contingencies when such amounts are probable and reasonably estimable. If a contingent liability is only reasonably possible, the Company discloses the potential range of the loss, if estimable.
Equity Method Investments
The Company’s investments where it can exert significant influence on the investee, but does not have effective control over the investee, are accounted for using the equity method of accounting. The Company’s equity in the net income from equity method investments is recorded as other income with a corresponding increase in other assets. Distributions received from the equity investee reduces other assets. Distributions from equity investees representing the Company's share of the equity investee's earnings are treated as cash proceeds from operations while distributions in excess of the equity investee's earnings are considered a return of capital and treated as cash proceeds from investing activities in the Company's consolidated statement of cash flows.
New Accounting Standards Adopted
In January 2017, the Financial Accounting Standards Board ("FASB") issued Accounting Standards Update ("ASU") 2017-04 which simplifies the goodwill impairment test by eliminating step 2 of the quantitative assessment. Under the guidance, when a quantitative assessment is required, an entity will perform a goodwill impairment test by comparing the fair value of a reporting unit with its carrying amount. An impairment charge will be measured as the amount by which the carrying amount exceeds the reporting unit's fair value, not to exceed the total amount of goodwill allocated to that reporting unit. Additionally, entities should consider income tax effects from any tax deductible goodwill on the carrying amount of the reporting unit when
75
Advanced Disposal Services, Inc. and Subsidiaries
Notes to Consolidated Financial Statements
measuring the goodwill impairment loss, if applicable. The new update is effective for annual periods beginning after December 15, 2019 with early adoption permitted. The Company's early adoption on January 1, 2017 did not have an impact on the Company's consolidated financial statements.
In January 2017, the FASB issued ASU 2017-01 which clarifies the definition of a business with the objective of adding guidance to assist entities with evaluating whether transactions should be accounted for as acquisitions (or disposals) of assets or businesses. The amendments provide a screen to determine when a set of assets and activities is not a business. If the screen is not met, the amendments require further consideration of inputs, substantive processes and outputs to determine whether the transaction is an acquisition of a business. The new update is effective for annual periods beginning after December 15, 2017 with early adoption permitted. The Company's early adoption on January 1, 2017 did not have an impact on the Company's consolidated financial statements.
3. Acquisitions
In fiscal 2017, the Company completed the acquisitions of fourteen companies. Consideration transferred, net of cash acquired, amounted to approximately $115.9 for these acquisitions, of which $4.0 will be paid in subsequent years. The amount to be paid in subsequent years is contingent on net working capital adjustments and other commitments, which are expected to be completed within approximately one year. The goodwill recognized of $35.2 represents synergies from the combined operations of the acquired entities and the Company. The Company is still reviewing information surrounding property and equipment, intangible assets and current liabilities resulting from the acquisitions, which may result in changes to the Company’s preliminary purchase price allocation during fiscal 2018. Transaction costs related to these acquisitions were not significant for fiscal 2017.
In fiscal 2016, the Company completed the acquisitions of eight collection companies. Consideration transferred amounted to approximately $5.4 for these acquisitions, of which $0.1 will be paid in subsequent years. The Company recorded a reduction to the purchase price of prior year acquisitions during fiscal 2016 in the amount of $0.1. The goodwill recognized of $0.4 represents synergies from the combined operations of the acquired entities and the Company. Transaction costs related to these acquisitions were not significant for fiscal 2016.
In fiscal 2015, the Company completed the acquisitions of twelve collection companies. Consideration transferred amounted to approximately $56.3 for these acquisitions, of which $6.6 was paid in years subsequent to fiscal 2015. Transaction costs related to these acquisitions were not significant for fiscal 2015. Purchase price adjustments related to acquisitions in prior years amounted to approximately $0.3 for fiscal 2015.
The results of operations of each acquisition are included in the consolidated statements of operations of the Company subsequent to the closing date of each acquisition.
The following table summarizes the estimated fair values of the assets acquired by year of acquisition:
2017 | 2016 | ||||||
Current assets | $ | 5.9 | $ | 0.3 | |||
Property and equipment | 89.8 | 2.3 | |||||
Goodwill | 35.2 | 0.4 | |||||
Other intangible assets | 18.8 | 2.6 | |||||
Total assets acquired | 149.7 | 5.6 | |||||
Current liabilities | 6.9 | 0.2 | |||||
Total liabilities assumed | 33.8 | 0.2 | |||||
Net assets acquired | $ | 115.9 | $ | 5.4 | |||
76
Advanced Disposal Services, Inc. and Subsidiaries
Notes to Consolidated Financial Statements
The following table presents the allocation of the purchase price to other intangible assets:
2017 | 2016 | ||||||
Customer lists and contracts | $ | 17.0 | $ | 2.3 | |||
Noncompete | 1.2 | 0.1 | |||||
Other | 0.6 | 0.2 | |||||
$ | 18.8 | $ | 2.6 | ||||
The amount of goodwill recorded related to 2017 acquisitions for the South Segment, East Segment, and Midwest Segment was $8.9, $25.7, and $0.6, respectively. The amount of goodwill deductible for tax purposes related to acquisitions in fiscal 2017 and fiscal 2016 was $4.4 and $0.4, respectively. The total amount of consolidated goodwill deductible for tax purposes was $79.7 and $88.9 at December 31, 2017 and 2016, respectively.
The weighted average life of other intangible assets in years is as follows:
Customer lists and contracts | 17 |
Noncompete | 7 |
Goodwill and intangible assets increased by $0.0, $0.1 and $0.1, for the years ended December 31, 2017, 2016 and 2015, respectively, as a result of purchase price adjustments of acquisitions from the previous year. The increases were primarily related to working capital adjustments as a result of finalizing the purchase accounting for the acquisitions.
4. Income (loss) Per Share
The following table sets forth the computation of basic income (loss) per share and income (loss) per share, assuming dilution for the following years:
2017 | 2016 | 2015 | |||||||||||
Numerator: (Dollars in millions) | |||||||||||||
Net income (loss) | $ | 38.3 | $ | (30.4 | ) | $ | (33.6 | ) | |||||
Denominator: | |||||||||||||
Average common shares outstanding | 88,323,213 | 69,462,798 | 64,493,536 | ||||||||||
Other potentially dilutive common shares | 564,599 | — | — | ||||||||||
Average common shares outstanding, assuming dilution | 88,887,812 | 69,462,798 | 64,493,536 | ||||||||||
Net income (loss) per share, basic | $ | 0.43 | $ | (0.44 | ) | $ | (0.52 | ) | |||||
Net income (loss) per share, assuming dilution | $ | 0.43 | $ | (0.44 | ) | $ | (0.52 | ) | |||||
Basic net income (loss) per share is based on the weighted-average number of shares of common stock outstanding for each of the periods presented. Net income (loss) per share, assuming dilution, is based on the weighted-average number of shares of common stock equivalents outstanding adjusted for the effects of common stock that may be issued as a result of potentially dilutive instruments. The Company's potentially dilutive instruments are made up of equity awards, which include stock options, restricted stock awards, and performance stock awards. All potentially dilutive common shares were excluded from the diluted earnings per share calculations for fiscal 2016 and fiscal 2015 because the Company was in a net loss position and their effect would have been antidilutive
When calculating diluted net income per share, the ASC requires the Company to include the potential shares that would be outstanding if all outstanding stock options were exercised. This number would be different from outstanding stock options because it is offset by shares the Company could repurchase using the proceeds from these hypothetical exercises to obtain the common stock equivalent.
77
Advanced Disposal Services, Inc. and Subsidiaries
Notes to Consolidated Financial Statements
Approximately 1.7 million, 4.3 million and 3.9 million of outstanding stock awards for fiscal 2017, 2016 and 2015, respectively, were excluded from the diluted income (loss) per share calculation because their effect was antidilutive.
5. Allowance for Doubtful Accounts
Allowance for doubtful accounts consists of the following at December 31:
2017 | 2016 | 2015 | |||||||||
Beginning balance | $ | 4.0 | $ | 4.4 | $ | 5.0 | |||||
Provision for doubtful accounts | 5.4 | 3.7 | 4.0 | ||||||||
Write-offs of bad debt | (4.6 | ) | (4.1 | ) | (4.8 | ) | |||||
Other | 0.6 | — | 0.2 | ||||||||
Balance at December 31, | $ | 5.4 | $ | 4.0 | $ | 4.4 | |||||
Refer to Note 17. Income Taxes for information regarding the amount of recorded deferred tax asset valuation allowance.
6. Prepaid Expenses and Other Current Assets
Prepaid expenses and other current assets consist of the following at December 31:
2017 | 2016 | |||||||
Prepaid insurance | $ | 5.9 | $ | 6.6 | ||||
Prepaid expenses | 16.4 | 14.2 | ||||||
Other receivables and current assets | 6.8 | 1.7 | ||||||
Parts and supplies inventory | 8.8 | 7.8 | ||||||
$ | 37.9 | $ | 30.3 | |||||
7. Derivative Instruments and Hedging Activities
The following table summarizes the fair value of derivative instruments recorded in our consolidated balance sheets at December 31:
Balance Sheet Location | 2017 | 2016 | |||||||
Derivatives Designated as Hedging Instruments | |||||||||
2017 interest rate caps | Other long-term liabilities | $ | (0.4 | ) | $ | — | |||
Derivatives Not Designated as Hedging Instruments | |||||||||
2016 interest rate caps | Prepaid expenses and other current assets | 0.9 | — | ||||||
2016 interest rate caps | Other assets | $ | 2.8 | $ | 2.3 | ||||
Total derivatives | $ | 3.3 | $ | 2.3 | |||||
The Company has not offset fair value amounts recognized for its derivative instruments.
Interest Rate Caps
In November 2017, the Company entered into two interest rate cap agreements to hedge the risk of a rise in interest rates and associated cash flows on its variable rate debt. The Company has applied hedge accounting to the interest rate caps; therefore, changes in the fair value of the interest rate caps are recorded in other comprehensive loss, net of tax in the consolidated statements of comprehensive income (loss). The interest rate caps commence in 2019 and expire in 2021. The Company will pay the $4.9 premium on the caps in monthly installments beginning in October 2019. The notional value of the contracts aggregated were $600.0 as of December 31, 2017 and will remain constant through maturity in 2021.
78
Advanced Disposal Services, Inc. and Subsidiaries
Notes to Consolidated Financial Statements
In May 2016, the Company entered into three interest rate cap agreements as economic hedges against the risk of a rise in interest rates and the associated cash flows on its variable rate debt. The Company began paying the $5.5 premium of the caps equally over eleven quarters beginning on March 31, 2017. The Company elected not to apply hedge accounting to these interest rate caps therefore changes in the fair value of the interest rate caps are recorded in other income (expense), net in the consolidated statements of operations. The fair value of the 2016 interest rate caps were $3.7 and $2.3 as of December 31, 2017 and 2016, respectively. The notional value of the contracts aggregated were $800.0 as of December 31, 2017 and will remain constant through maturity in September 2019.
In December 2012, the Company entered into four interest rate cap agreements to hedge the risk of a rise in interest rates and associated cash flows on its variable rate debt. The interest rate caps expired in various tranches through 2016. The Company recorded the premium of $5.0 in other assets in the consolidated balance sheet and amortized the premium to interest expense based upon decreases in time value of the caps. Amortization expense was approximately $0.2 and $1.5 for fiscal 2016 and 2015, respectively. The contracts were expired as of December 31, 2016.
Commodity Futures Contracts
The Company has utilized fuel derivative instruments (commodity futures contracts) as economic hedges of the risk that fuel prices will fluctuate. The Company has used financial derivative instruments for both short-term and long-term time frames and utilized fixed swap price agreements to manage the identified risk. The Company does not enter into derivative financial instruments for trading or speculative purposes. The Company has not entered into any commodity futures contracts during fiscal 2017.
Changes in the fair value and settlements of the fuel derivative instruments are recorded in other income (expense), net in the consolidated statements of operations. The market price of diesel fuel is unpredictable and can fluctuate significantly. Significant volatility in the price of fuel could adversely affect the business and reduce the Company’s operating margins. To manage a portion of that risk, the Company entered into commodity swap agreements in fiscal 2014 that matured in fiscal 2015 for 23.8 gallons at weighted average prices per gallon that ranged from $2.20 to $2.84 per gallon. The Company entered into commodity swap agreements in fiscal 2014 that matured in fiscal 2016 for 13.4 gallons at weighted average prices per gallon that ranged from $2.20 to $2.64 per gallon. If the mean price of the high and the low of the calculation period for Gulf Coast Ultra Low Sulfur diesel pipeline platts for a gallon of diesel fuel exceeded the contract price per gallon, the Company received the difference between the average price and the contract price (multiplied by the notional gallons) from the counterparty. If the average price was less than the contract price per gallon, the Company paid the difference to the counterparty. The gain or loss on the Company's fuel derivative contracts recorded in the consolidated statements of operations during fiscal 2016 and 2015 was a gain of $1.2 and a loss of $15.4, respectively.
8. Property and Equipment, Net
Property and equipment, net consist of the following at December 31:
2017 | 2016 | ||||||
Land | $ | 209.1 | $ | 193.3 | |||
Landfill site costs | 1,465.7 | 1,358.1 | |||||
Vehicles | 680.3 | 595.7 | |||||
Containers | 294.4 | 271.5 | |||||
Machinery and equipment | 185.4 | 156.2 | |||||
Furniture and fixtures | 30.1 | 25.9 | |||||
Building and improvements | 188.7 | 170.1 | |||||
Construction in process | 30.6 | 25.6 | |||||
3,084.3 | 2,796.4 | ||||||
Less: Accumulated depreciation on property and equipment | (679.3 | ) | (579.3 | ) | |||
Less: Accumulated landfill airspace amortization | (676.2 | ) | (583.7 | ) | |||
$ | 1,728.8 | $ | 1,633.4 | ||||
79
Gross assets under capital lease amount to approximately $108.1 and $63.0 at December 31, 2017 and 2016, respectively. Accumulated amortization for capital leases at December 31, 2017 and 2016 was $26.2 and $15.6, respectively. Amortization expense of assets under capital lease was $11.6, $7.3 and $4.1 for fiscal 2017, 2016 and 2015, respectively.
Depreciation, landfill amortization and depletion expense was $228.2, $204.3 and $216.3 for fiscal 2017, 2016 and 2015, respectively.
9. Landfill Accounting
Liabilities for final closure and post-closure costs consist of the following for the years ended December 31:
2017 | 2016 | ||||||
Balance at January 1 | $ | 191.1 | $ | 193.7 | |||
Increase in retirement obligation | 9.7 | 9.3 | |||||
Accretion of closure and post-closure costs | 15.4 | 13.0 | |||||
Acquisition | 28.3 | — | |||||
Change in estimate | 2.1 | (7.4 | ) | ||||
Costs incurred | (20.7 | ) | (17.5 | ) | |||
225.9 | 191.1 | ||||||
Less: Current portion | (20.2 | ) | (29.3 | ) | |||
Balance at December 31 | $ | 205.7 | $ | 161.8 | |||
10. Other Intangible Assets, Net and Goodwill
Intangible assets, net consist of the following at December 31:
2017 | ||||||||||||||||||
Gross Carrying Value | Accumulated Amortization | Impairment | Net Carrying Value | Weighted Average Remaining Life (Years) | ||||||||||||||
Noncompete agreements | $ | 5.4 | $ | (2.6 | ) | $ | — | $ | 2.8 | 2.3 | ||||||||
Tradenames | 15.5 | (6.9 | ) | — | 8.6 | 12.9 | ||||||||||||
Customer lists and contracts | 525.5 | (238.0 | ) | (13.0 | ) | 274.5 | 12.8 | |||||||||||
Operating permits | 2.5 | — | — | 2.5 | N/A | |||||||||||||
Above/below market leases | 0.4 | (0.1 | ) | — | 0.3 | 8.6 | ||||||||||||
$ | 549.3 | $ | (247.6 | ) | $ | (13.0 | ) | $ | 288.7 | |||||||||
2016 | ||||||||||||||||||
Gross Carrying Value | Accumulated Amortization | Impairment | Net Carrying Value | Weighted Average Remaining Life (Years) | ||||||||||||||
Noncompete agreements | $ | 4.3 | $ | (1.7 | ) | $ | — | $ | 2.6 | 3.6 | ||||||||
Tradenames | 14.9 | (6.2 | ) | — | 8.7 | 14.7 | ||||||||||||
Customer lists and contracts | 513.4 | (202.7 | ) | — | 310.7 | 13.8 | ||||||||||||
Operating permits | 2.3 | — | — | 2.3 | N/A | |||||||||||||
Above/below market leases | 0.4 | (0.1 | ) | — | 0.3 | 9.6 | ||||||||||||
$ | 535.3 | $ | (210.7 | ) | $ | — | $ | 324.6 | ||||||||||
Amortization expense recorded on intangible assets for the years ended December 31, 2017, 2016 and 2015 was $41.6, $42.6 and $42.8, respectively.
80
Advanced Disposal Services, Inc. and Subsidiaries
Notes to Consolidated Financial Statements
Future amortization expense for intangible assets for the year ending December 31 is estimated to be:
2018 | $ | 47.1 | |
2019 | 32.1 | ||
2020 | 31.3 | ||
2021 | 30.1 | ||
2022 | 26.8 | ||
Thereafter | 121.3 | ||
$ | 288.7 | ||
The changes in the carrying amount of goodwill for the years ended December 31, 2017 and 2016 are as follows:
Goodwill | Accumulated Impairment | Goodwill, Net | |||||||||
December 31, 2015 | $ | 1,267.2 | $ | (93.7 | ) | $ | 1,173.5 | ||||
Acquisition | 0.4 | — | 0.4 | ||||||||
December 31, 2016 | 1,267.6 | (93.7 | ) | 1,173.9 | |||||||
Acquisition | 35.2 | — | 35.2 | ||||||||
Disposition of businesses | (0.9 | ) | — | (0.9 | ) | ||||||
December 31, 2017 | $ | 1,301.9 | $ | (93.7 | ) | $ | 1,208.2 | ||||
11. Accrued Expenses
Accrued expenses consist of the following at December 31:
2017 | 2016 | ||||||
Accrued compensation and benefits | $ | 30.9 | $ | 32.5 | |||
Accrued waste disposal costs | 42.1 | 40.1 | |||||
Accrued insurance and self-insurance reserves | 13.2 | 14.5 | |||||
Accrued severance | 1.5 | 0.5 | |||||
Other accrued expenses | 25.3 | 22.2 | |||||
$ | 113.0 | $ | 109.8 | ||||
81
Advanced Disposal Services, Inc. and Subsidiaries
Notes to Consolidated Financial Statements
12. Long-Term Debt
Long-term debt consists of the following at December 31:
2017 | 2016 | |||||
Revolving line of credit with lenders, interest at base rate plus margin, as defined (6.25% and 4.49% at December 31, 2017 and 2016, respectively) due quarterly; balance due at maturity in 2021 | $ | 29.0 | $ | — | ||
Term loans; quarterly principal payments commencing March 31, 2017 through September 30, 2023 with final payment due November 10, 2023; interest at an alternate base rate or adjusted LIBOR rate with a 0.75% floor plus an applicable margin | 1,460.0 | 1,480.0 | ||||
Senior notes payable; interest at 5.625% payable in arrears semi-annually commencing May 15, 2017; maturing on November 15, 2024. | 425.0 | 425.0 | ||||
Capital lease obligations, interest rates between 3.70% and 7.73%, maturing through 2024 | 63.9 | 42.5 | ||||
Other debt | 11.8 | 15.1 | ||||
1,989.7 | 1,962.6 | |||||
Less: Original issue discount and debt issuance costs classified as a reduction to long-term debt | (31.4 | ) | (39.1 | ) | ||
Less: Current portion | (74.1 | ) | (36.5 | ) | ||
$ | 1,884.2 | $ | 1,887.0 | |||
Annual aggregate principal maturities at December 31, 2017 are as follows:
2018 | $ | 45.1 | |
2019 | 37.3 | ||
2020 | 27.4 | ||
2021 | 17.5 | ||
2022 | 18.3 | ||
Thereafter | 1,844.1 | ||
$ | 1,989.7 | ||
Senior Secured Credit Facilities
On November 21, 2017, the Company entered into Amendment No. 1 (the “Amendment”) to its Credit Agreement, dated as of October 9, 2012 (as amended and restated as of November 10, 2016, the “Amended and Restated Credit Agreement”) among the Company, the lenders party thereto and Deutsche Bank AG New York Branch, as administrative agent and as collateral agent. The Amendment reduces the Company’s applicable margin on its Term Loan B by 0.50% per annum.
On November 10, 2016, the Company entered into the Amended and Restated Credit Agreement by and among the Company, the guarantors party thereto, the lenders party thereto (the “Lenders”) and Deutsche Bank AG New York Branch, as administrative agent and collateral agent (respectively, the “Administrative Agent” and the “Collateral Agent”), to the Credit Agreement, by and among the Company, the lenders party thereto, the Administrative Agent and the Collateral Agent, dated as of October 9, 2012 (as amended, supplemented or modified from time to time prior to the date hereof, the “Existing Credit Agreement” and as amended and restated in accordance with the Amended and Restated Credit Agreement).
The Amended and Restated Credit Agreement includes a $1.5 billion Term Loan B facility maturing 2023, and a $300 million Revolving Credit Facility maturing 2021 (together "Senior Secured Credit Facilities"). The Revolving Credit Facility allows for up to $100.0 of letters of credit outstanding. The proceeds were used to repay borrowings under the Existing Credit Agreement and to call the Company's 8.25% Senior Notes due 2020. All outstanding borrowings under the Existing Credit Agreement were either repaid in full or converted to the new Senior Secured Credit Facility. At the Company’s option, borrowings under the Amended and Restated Credit Agreement will bear interest at an alternate base rate or adjusted LIBOR rate in each case plus an
82
Advanced Disposal Services, Inc. and Subsidiaries
Notes to Consolidated Financial Statements
applicable margin. The alternate base rate is defined as the greater of the prime rate, the federal funds rate plus 50 basis points, or the adjusted LIBOR rate plus 100 basis points. The LIBOR base rate is subject to a 0.75% floor.
In the case of the Term Loan B, the applicable margin, as amended, is 1.25% per annum for ABR Loans and 2.25% per annum for Eurodollar Loans. In the case of the Revolving Credit Facility, the applicable margin is 1.75% per annum for ABR Loans and 2.75% per annum for Eurodollar Loans if the Company's total net leverage ratio is greater than 4.0:1.0. If the Company's total net leverage ratio is less than 4.0:1.0, the applicable margin on the Revolving Credit Facility is 1.25% per annum for ABR Loans and 2.25% per annum for Eurodollar Loans.
Obligations under the Amended and Restated Credit Agreement are guaranteed by the Company’s existing and future domestic restricted subsidiaries (subject to certain exceptions) and are secured by a first-priority security interest in substantially all the personal property assets, and certain real property assets, of the Company and the guarantors, including all or a portion of the equity interests of certain of the Company’s domestic subsidiaries (in each cases, subject to certain limited exceptions).
Borrowings under the Amended and Restated Credit Agreement may be prepaid at any time without premium. The Amended and Restated Credit Agreement contains usual and customary representations and warranties, and usual and customary affirmative and negative covenants, including limitations on liens, additional indebtedness, investments, restricted payments, asset sales, mergers, affiliate transactions and other customary limitations, as well as a total net leverage ratio financial covenant (for the benefit of lenders under the revolving credit facility only). The Amended and Restated Credit Agreement also contains usual and customary events of default, including non-payment of principal, interest, fees and other amounts, material breach of a representation or warranty, nonperformance of covenants and obligations, default on other material debt, bankruptcy or insolvency, material judgments, incurrence of certain material ERISA liabilities, impairment of loan documentation or security and change of control. Compliance with these covenants is a condition to any incremental borrowings under our Senior Secured Credit Facilities and failure to meet these covenants would enable the lenders to require repayment of any outstanding loans (which would adversely affect our liquidity).
The Term Loan B has payments due quarterly of $3.75 with mandatory prepayments due to the extent net cash proceeds from the sale of assets exceed $25.0 in any fiscal year and are not reinvested in the business within 365 days from the date of sale, upon notification of the Company’s intent to take such action or in accordance with excess cash flow, as defined. Further prepayments are due when there is excess cash flow, as defined.
Borrowings under the Company's Senior Secured Credit Facilities can be used for working capital, capital expenditures, acquisitions and other general corporate purposes. As of December 31, 2017 and 2016, the Company had $29.0 and $0.0 in borrowings outstanding under its Revolving Credit Facility. As of December 31, 2017 and 2016, the Company had an aggregate of approximately $39.3 and $42.1 of letters of credit outstanding under its Senior Secured Credit Facilities. As of December 31, 2017 and 2016, the Company had remaining capacity under its Revolving Credit Facility of $231.7 and $257.9, respectively. As of December 31, 2017, the Company was in compliance with the covenants under the Senior Secured Credit Facilities. The Company's ability to maintain compliance with its covenants will be highly dependent on results of operations and, to the extent necessary, its ability to implement remedial measures such as reductions in operating costs. The Revolving Credit Facility has an annual commitment fee equal to 0.50% per annum if the total net leverage ratio is greater than 4.0:1.0, or if otherwise, 0.375% per annum. The amount of fees for 2017, 2016 and 2015 were not significant. The Company is subject to a maximum total net leverage ratio of 6.8:1.0.
5.625% Senior Notes due 2024
On November 10, 2016, the Company closed a 144A offering (the “Notes Offering”) exempt from registration under the Securities Act of 1933, as amended (the “Securities Act”), of $425.0 aggregate principal amount of 5.625% senior notes due 2024 (the “Notes”).
The Company issued the Notes under an indenture dated November 10, 2016 (the “Indenture”) among the Company, the guarantors party thereto, and Wells Fargo Bank, National Association, as trustee (the “Trustee”). The Notes will bear interest at the rate of 5.625% per year. Interest on the Notes is payable on May 15 and November 15 of each year, beginning on May 15, 2017. The Notes will mature on November 15, 2024. Before November 15, 2019, the Company may redeem the Notes, in
83
Advanced Disposal Services, Inc. and Subsidiaries
Notes to Consolidated Financial Statements
whole or in part, at a redemption price equal to 100% of their principal amount plus a make-whole premium and accrued and unpaid interest to the date of redemption. At any time on or after November 15, 2019, the Company may redeem the Notes, in whole or in part, at the applicable redemption prices set forth in the Indenture, plus accrued interest. In addition, before November 15, 2019, the Company may, from time to time, redeem up to 40% of the aggregate principal amount of the Notes with the net cash proceeds of certain equity offerings at a redemption price equal to 105.625% of the principal amount thereof, plus accrued and unpaid interest to the redemption date. The redemption prices set forth in the indenture for the twelve month periods beginning on November 15 of the years indicated below are as follows:
Year | Percentage | |
2019 | 104.219 | % |
2020 | 102.813 | % |
2021 | 101.406 | % |
2022 and thereafter | 100.000 | % |
The Indenture contains covenants that, among other things, restrict the ability of the Company and its restricted subsidiaries to incur additional debt or issue certain preferred stock; pay dividends (subject to certain exceptions) or make certain redemptions, repurchases or distributions or make certain other restricted payments or investments; create liens; enter into transactions with affiliates; merge, consolidate or sell, transfer or otherwise dispose of all or substantially all of the Company’s assets; transfer and sell assets; and create restrictions on dividends or other payments by the Company’s restricted subsidiaries. Certain covenants will cease to apply to the Notes for so long as the Notes have investment grade ratings. The Notes will be unconditionally guaranteed, jointly and severally, on a senior unsecured basis by all of the Company’s current and future U.S. subsidiaries that guarantee the Amended and Restated Credit Agreement. As of December 31, 2017, the Company was in compliance with the covenants under the Indenture.
8.25% Senior Notes due 2020
On October 9, 2012, the Company issued $550.0 aggregate principal amount of 8.25% Senior Notes, which were scheduled to mature in October 2020. The 8.25% Senior Notes were redeemed and repaid in full during the fourth quarter of fiscal 2016 with funds obtained from the new Term Loan B and the issuance of the 5.625% Senior Notes.
Original Issue Discount and Debt Issuance Costs
In November 2017, the Company repriced its Term Loan B and as a result, recorded $3.7 of losses on extinguishments and modifications of debt.
When the Company refinanced the Term Loan B facility in November 2017, 93% was accounted for as a modification and 7% was accounted for as an extinguishment based on an analysis of the participation of each lender in the syndicate before and after the repricing. As a result of the 7% that was accounted for as an extinguishment, $1.9 of the unamortized original issue discount and deferred debt issuance costs were recorded as a loss on extinguishment of debt. In relation to the modification, the Company incurred $1.8 of third party fees which were recorded as a loss on modification of debt. the Company incurred $0.1 of third party fees related to new lenders in the syndicate which were recorded as a reduction to the carrying value of debt and will be amortized to interest expense using the effective interest method.
In fiscal 2016, the Company recorded $64.7 of losses on extinguishments and modifications of debt as follows:
In October of fiscal 2016, The Company prepaid $326.0 of its Existing Term Loan B with its initial public offering proceeds and recorded a loss on extinguishment of debt of $8.3 for unamortized original issue discount and debt issuance costs.
When the Company refinanced its Term Loan B facility in November 2016, 95% was accounted for as a modification and 5% was accounted for as an extinguishment based on an analysis of the participation of each lender in the syndicate before and after the refinancing. As a result of the 5% that was accounted for as an extinguishment, $1.5 of the unamortized original issue discount and deferred debt issuance costs were recorded as a loss on extinguishment of debt. In relation to the modification, the Company incurred $15.2 of third party fees which were recorded as a loss on modification of debt. The Company incurred $1.3 of third party fees related to new lenders in the syndicate which were recorded as a reduction to the carrying value of debt and
84
Advanced Disposal Services, Inc. and Subsidiaries
Notes to Consolidated Financial Statements
will be amortized to interest expense using the effective interest method. Additionally, the Company recorded $3.8 of original issue discount as a reduction to the carrying value of debt and it will be amortized to interest expense using the effective interest method.
When the Company amended its Revolver in November 2016, the Company incurred $0.3 in third party financing fees which were recorded as an other long term asset and will be amortized to interest expense on a straight line basis over the term of the Revolver.
When the Company redeemed its $550.0 8.25% Senior Notes during the fourth quarter of fiscal 2016, the Company paid a call premium of $24.0. The Company recorded the call premium as a loss on extinguishment of debt during the fourth quarter of fiscal 2016. Additionally, the Company recorded $15.3 of loss on extinguishment of debt related to unamortized original issue discount and deferred debt issuance costs.
In November of fiscal 2016 when the Company issued $425.0 of 5.625% Senior Notes due 2024, the Company incurred $6.5 in debt issuance costs which were recorded as a reduction to the carrying value of debt and will be amortized to interest expense using the effective interest method.
In December of fiscal 2016, the Company prepaid $20.0 of its new Term Loan B and recorded a loss on extinguishment of debt of $0.4.
Fair Value of Debt
The fair value of the Company’s debt is estimated using discounted cash flow analysis, based on rates the Company would currently pay for similar types of instruments (Level 2 inputs). Although the Company has determined the estimated fair value amounts using available market information and commonly accepted valuation methodologies, considerable judgment is required in interpreting the information and in developing the estimated fair values. Therefore, these estimates are not necessarily indicative of the amounts that the Company, or holders of the instruments, could realize in a current market exchange. The fair value estimates are based on information available as of December 31, 2017 and 2016 respectively.
The estimated fair value of the Company's debt is as follows at December 31:
2017 | 2016 | |||||||
Revolving Credit Facility | $ | 29.0 | $ | — | ||||
Senior Notes | 435.1 | 425.5 | ||||||
Term Loan B Facility | 1,467.3 | 1,495.7 | ||||||
$ | 1,931.4 | $ | 1,921.2 | |||||
The carrying value of the debt at December 31, 2017 is approximately $1,914.0 compared to $1,905.0 at December 31, 2016.
Unconditional Purchase Commitments
The Company has unconditional purchase commitments not recorded on the balance sheet which consist of disposal related agreements that include fixed or minimum royalty payments, disposal related host agreements, capital expenditure commitments and payments for premiums on interest rate caps. The Company has unconditional purchase commitments recorded on the balance sheet which consist of waste relocation obligations. The amounts purchased under these commitments during fiscal 2017, 2016 and 2015 were $8.3, $15.9 and $20.9, respectively.
The following table summarizes the Company's unconditional purchase commitments as of December 31, 2017:
2018 | $ | 26.9 | |
2019 | 7.4 | ||
2020 | 6.7 | ||
2021 | 6.1 | ||
2022 | 4.3 | ||
Thereafter | 59.8 | ||
$ | 111.2 | ||
85
Advanced Disposal Services, Inc. and Subsidiaries
Notes to Consolidated Financial Statements
13. Leases
The Company leases certain facilities under operating lease agreements. Future minimum lease payments as of December 31, 2017 for noncancelable operating leases that have initial or remaining terms in excess of one year are as follows:
2018 | $ | 6.3 | |
2019 | 5.2 | ||
2020 | 4.4 | ||
2021 | 3.0 | ||
2022 | 2.4 | ||
Thereafter | 21.8 | ||
$ | 43.1 | ||
The total rental expense for all operating leases for the years ended December 31, 2017, 2016 and 2015 was $10.9, $9.4 and $9.3, respectively.
Direct rental expense, consisting of rental expense at operating locations, is included in operating expenses, and rental expense for corporate offices is included in selling, general and administrative expenses in the consolidated statements of operations.
14. Stockholders' Equity and Stock Awards
(Share and per share amounts not in millions)
2012 Plan
In October 2012, the former Parent’s Board of Directors adopted the 2012 Stock Incentive Plan (the “ 2012 Plan”) under which an aggregate of 7,154,711 shares of the former Parent’s common stock was reserved for issuance. The 2012 Plan provided for employees of the Company to participate in the plan and provided that the options or stock purchase rights have a term of ten years and vest equally over four years at a rate of 20% with 20% of the options being vested at the date of grant for all options except the Strategic grants which vest 100% after five years. All options of the Strategic Plan issued prior to 2010 vested upon a change of control.
During fiscal 2016, the Board of Directors of the FormeParent amended the 2012 Plan to allow for the grant of performance shares, restricted shares, restricted share units, and other equity awards in addition to stock options and stock purchase rights as originally provided for under the 2012 Plan. Upon completion of the Company's initial public offering during the fourth quarter of fiscal 2016, no further awards will be issued under the 2012 Plan.
2016 Plan
The Company's board of directors adopted the Advanced Disposal Services, Inc. 2016 Omnibus Equity Plan (the "2016 Plan") on January 29, 2016 under which an aggregate of 5,030,000 shares of common stock was reserved for issuance. The 2016 Plan became effective on October 4, 2016 and will terminate on the tenth anniversary of the 2016 Plan effective date, unless sooner terminated by the Company's board of directors. Awards under the 2016 Plan may consist of stock options, restricted shares, restricted share units, stock appreciation rights, performance stock, performance stock units, cash performance units and other awards. The Compensation Committee shall set the vesting criteria applicable to each award, which will determine the extent to which the award becomes exercisable. The terms and conditions of each award shall be set forth in an award document in a form approved by the Compensation Committee for such Award.
86
Advanced Disposal Services, Inc. and Subsidiaries
Notes to Consolidated Financial Statements
Stock Option Grants
The fair value of the options granted is estimated using the Black-Scholes option pricing model using the following assumptions:
2017 | 2016 | 2015 | |||
Average expected term (years) | 6.2 | 6.3 | 6.9 | ||
Risk-free interest rate | 1.93% - 2.16% | 1.22% - 1.47% | 1.76% - 1.93% | ||
Expected volatility | 18.0% - 19.0% | 30.0% | 30.0% | ||
Since the Company does not have enough historical exercise data that is indicative of expected future exercise performance, it has elected to use the “simplified method” to estimate the options expected term by taking the average of each vesting-tranche and the contractual term. The Company used the average ten day historical volatility for public companies in the solid waste sector to estimate historical volatility used in the Black-Scholes model. The risk-free rate used was based on the US Treasury security rate estimated for the expected term of the option at the date of grant. No dividends are expected to be issued. The company estimates stock option forfeitures based on historical experience. The Company issues new shares when stock options are exercised.
Stock Option Grants
During the first quarter of fiscal 2017, there were 788,500 annual options granted under the 2016 Plan for employees other than the Named Executive Officers ("NEOs"). Each option had an estimated fair value of $5.32 per option on the date of grant and each option had an exercise price of $22.00. The options will vest 20% on date of grant and 20% in four equal installments over each of the first four anniversaries of the date of the grant. The contractual term of each option is ten years.
During the first quarter of fiscal 2017, there were 213,507 NEO options granted under the 2016 Plan. Each option had an estimated fair value of $5.20 per option on the date of grant and each option had an exercise price of $22.00. The options will vest in three equal installments over each of the first three anniversaries of the date of the grant. The contractual term of each option is ten years.
During the first quarter of fiscal 2017, 118,217 performance options were granted to the Company's Chief Executive Officer based on fiscal 2016 performance criteria. Each option had an estimated fair value of $5.86 per option on the date of grant and each option had an exercise price of $23.30. The options will vest in full on the third anniversary of the date of the grant. The contractual term of each option is ten years.
During the third quarter of fiscal 2017, there were 36,000 options granted under the 2016 Plan for employees other than the NEOs. Each option had an estimated fair value of $5.27 per option on the date of grant and each option had an exercise price of $22.85. The options will vest 20% on date of grant and 20% in four equal installments over each of the first four anniversaries of the date of the grant. The contractual term of each option is ten years.
87
Advanced Disposal Services, Inc. and Subsidiaries
Notes to Consolidated Financial Statements
Stock Options Outstanding
A summary of the stock options outstanding for the year ended December 31, 2017 (in millions, except share and per share amounts) is as follows:
Number of Shares | Weighted - Average Exercise Price | Weighted - Average Remaining Contractual Term | ||||||
Outstanding at January 1, 2017 | 3,276,239 | $ | 18.58 | |||||
Granted | 1,156,224 | 22.16 | ||||||
Exercised | (533,450 | ) | 14.96 | |||||
Expired or forfeited | (160,104 | ) | 21.65 | |||||
Outstanding at December 31, 2017 | 3,738,909 | 20.10 | 7.71 | |||||
Exercisable at December 31, 2017 | 1,562,839 | $ | 19.00 | 6.27 | ||||
The weighted-average grant-date fair value of options granted per share was $5.35, $6.57 and $6.10 during 2017, 2016, and 2015, respectively. The total fair value of options vested was $5.1, $3.6 and $1.0 during fiscal 2017, 2016, and 2015, respectively. The intrinsic value of the options outstanding at December 31, 2017 was approximately $14.6. The intrinsic value of options exercised during fiscal 2017 was $3.0. The intrinsic value of exercisable options at December 31, 2017 was approximately $7.8.
Restricted Stock Grants
During fiscal 2017, there were 17,193 restricted stock awards granted under the 2016 Plan to non-employee directors with a weighted average grant date fair value $23.26 per share. The restricted stock awards will vest in full on the third anniversary of the date of the grant.
A summary of the status of non-vested restricted stock awards as of December 31, 2017, including changes during fiscal 2017 is presented below:
Number of Shares | Weighted - Average Grant Price | |||||
Nonvested at January 1, 2017 | 35,940 | $ | 23.31 | |||
Granted | 17,193 | 23.26 | ||||
Vested | — | — | ||||
Forfeited | — | — | ||||
Nonvested at December 31, 2017 | 53,133 | $ | 23.30 | |||
88
Advanced Disposal Services, Inc. and Subsidiaries
Notes to Consolidated Financial Statements
Restricted Stock Unit Grants
During fiscal 2017, there were 50,464 NEO restricted stock units granted under the 2016 Plan with a fair value of $22.00 per share. The restricted stock units will vest in full on the third anniversary of the date of the grant.
A summary of the status of non-vested restricted stock units as of December 31, 2017, including changes during fiscal 2017 is presented below:
Number of Units | Weighted - Average Grant Price | |||||
Nonvested at January 1, 2017 | 300,001 | $ | 18.00 | |||
Granted | 50,464 | 22.00 | ||||
Vested | — | — | ||||
Forfeited | — | — | ||||
Nonvested at December 31, 2017 | 350,465 | $ | 18.58 | |||
Performance Stock Unit Grants
During fiscal 2017, there were 100,930 NEO performance stock units (PSUs) granted under the 2016 Plan with a fair value of $22.00 per share. The PSUs will vest in full on the third anniversary of the date of the grant. The PSUs shall be measured based on the Company's budget and are weighted as follows: Adjusted EBITDA: 50%; Adjusted EBITDA less capital expenditures: 30%; and Revenue: 20%. The measurement criteria begins with an attainment of 90% of the budget which results in vesting of 25% of the shares underlying the PSUs granted and ends with an attainment of 110% of the budget which results in vesting of 175% of the shares underlying the PSUs granted. Performance will be measured separately for each of the three years in the performance period and the total number of PSUs earned at the conclusion of the three-year performance period will be the sum of the PSUs earned with respect to each individual year.
A summary of the status of non-vested performance stock units as of December 31, 2017, including changes during fiscal 2017 is presented below:
Number of Units | Weighted - Average Grant Price | |||||
Nonvested at January 1, 2017 | 54,830 | $ | 24.28 | |||
Granted | 100,930 | 22.00 | ||||
Vested | — | — | ||||
Forfeited | (33,710 | ) | 22.75 | |||
Nonvested at December 31, 2017 | 122,050 | $ | 22.82 | |||
Compensation Expense
Compensation expense is recognized ratably over the vesting period for those awards that vest. For fiscal 2017, 2016 and 2015, the Company recognized share-based compensation expense as a component of selling, general and administrative expenses of $9.7, $5.5 and $3.1, respectively. As of December 31, 2017, the Company estimates that a total of approximately $13.4 of currently unrecognized compensation expense will be recognized over a weighted average period of approximately 2.08 years for unvested awards issued and outstanding.
Payment to Former Director
During fiscal 2017, we made the final payment to a former director under an equity compensation arrangement in the amount of $6.2.
89
Advanced Disposal Services, Inc. and Subsidiaries
Notes to Consolidated Financial Statements
15. Insurance
The Company carries insurance coverage for protection of its assets and operations from certain risks including automobile liability, general liability, real and personal property damage, workers’ compensation claims, directors’ and officers’ liability, pollution liability, employee group health claims and other coverages that are customary in the industry. The Company’s exposure to loss for insurance claims is generally limited to the per incident deductible under the related insurance policy. As of December 31, 2017, the Company’s insurance programs carried self-insurance exposures of up to $0.5, $1.0 and $0.8 per incident for general liability, automobile and workers’ compensation, respectively. Certain self-insurance claims reserves are recorded at present value using a 1.98% and a 1.47% discount rate as of December 31, 2017 and 2016, respectively.
The Company has a partially self-insured employee group health insurance program that carries an aggregate stop loss amount. The amount recorded for the health insurance liability at December 31, 2017 and 2016 for unpaid claims, including an estimate for IBNR claims, was $3.5 and $3.8, respectively. Liabilities are recorded gross of expected recoveries.
The self-insured portion of workers’ compensation liability for unpaid claims and associated expenses, including IBNR claims, is based on an actuarial valuation and internal estimates. The amount recorded for workers’ compensation liability at December 31, 2017 and 2016 for unpaid claims, including an estimate for IBNR claims, is $21.8 and $23.5, respectively.
The self-insured portion of general liability and automobile liability for unpaid claims and associated expenses, including IBNR claims, is based on an actuarial valuation and internal estimates. The amount recorded for general and automobile liability at December 31, 2017 and 2016 for unpaid claims, including an estimate for IBNR claims, was $20.7 and $17.2, respectively.
Of the above amounts, $16.7 and $18.3 is included in accrued expenses and the remainder is included in other long-term liabilities at December 31, 2017 and 2016, respectively.
16. Benefit Plans
The Company has 401(k) Savings Plans (“401(k) Plan”) for the benefit of qualifying full-time employees who have more than 90 days of service and are over 21 years of age. Employees make pre-tax contributions to the 401(k) Plan with a partial matching contribution made by the Company. The Company’s matching contributions to the 401(k) Plan were $3.5, $3.5 and $3.2 for fiscal 2017, 2016 and 2015, respectively. Contributions by the Company are included in operating costs and expenses in the accompanying consolidated statements of operations.
The Company is a participating employer in a number of trustee-managed multiemployer, defined benefit pension plans for employees who participate in collective bargaining agreements. Approximately 14% of the Company’s workforce is subject to a collective bargaining agreement and four of the collective bargaining agreements expire within one year. The risks of participating in the multiemployer plans are different from single-employer plans in that (i) assets contributed to the multiemployer plan by one employer may be used to provide benefits to employees of other participating employers; (ii) if a participating employer stops contributing to the plan, the unfunded obligations of the plan may be required to be assumed by the remaining participating employers; and (iii) if the Company chooses to stop participating in any of the multiemployer plans, it may be required to pay those plans a withdrawal amount based on the underfunded status of the plan. The total contributions made to all plans for fiscal 2017 was $4.9, of which $0.2 is related to plans that are not individually significant.
90
Advanced Disposal Services, Inc. and Subsidiaries
Notes to Consolidated Financial Statements
The following table outlines the Company's participation in multiemployer plans considered to be individually significant:
Pension Fund | EIN/Pension Plan Number | Pension Protection Act Zone Status | FIP/RP Status Pending/ Implemented (B) | Contributions | Expiration Date of Collective- Bargaining Agreement | ||||||||||||||||
2016 | 2015 | 2017 | 2016 | 2015 | |||||||||||||||||
Suburban Teamsters of Northern IL Pension Fund | 36-6155778-001 | Endangered as of 1/1/2016 | Endangered as of 1/1/2015 | Implemented | $ | 0.6 | $ | 0.7 | $ | 0.6 | 1/31/2019 | ||||||||||
Pension Fund of Automobile Mechanics Local No. 701 | 36-6042061-001 | Endangered as of 1/1/2016 | Endangered as of 1/1/2015 | Implemented | $ | 0.2 | $ | 0.2 | $ | 0.2 | 12/31/2018 | ||||||||||
Local 731 Private Scavengers and Garage Attendants Pension Fund (A) | 36-6513567-001 | Not Endangered or Critical as of 10/1/2016 | Not Endangered or Critical as of 10/1/2015 | Implemented | $ | 1.8 | $ | 1.8 | $ | 1.8 | 9/30/2018 | ||||||||||
Midwest Operating Engineers Pension Fund | 36-6140097-001 | Endangered as of 4/1/2016 | Endangered as of 4/1/2015 | Implemented | $ | 0.7 | $ | 0.7 | $ | 0.6 | 9/30/2019 | ||||||||||
Teamsters Local Union No. 301 Union Pension Fund (A) | 36-6492992-001 | Not Endangered or Critical as of 1/1/2016 | Not Endangered or Critical as of 1/1/2015 | No | $ | 1.0 | $ | 1.0 | $ | 0.9 | 9/30/2018 | ||||||||||
Central States Southeast and Southwest Areas Pension Fund | 36-6064560-001 | Critical and Declining Status as of 1/1/2016 | Critical and Declining Status as of 1/1/2015 | Implemented | $ | 0.2 | $ | 0.2 | $ | 0.2 | 1/31/2019 | ||||||||||
Local 705 Int’l Brotherhood of Teamsters Pension TR. FD. | 36-6492502-001 | Critical as of 1/1/2016 | Critical as of 1/1/2015 | Implemented | $ | 0.2 | $ | 0.2 | $ | 0.2 | 9/30/2018 | ||||||||||
(A) | The employers' contributions to the plan represent greater than 5% of the total contributions to the plan for the most recent plan year available. |
(B) | A multi-employer defined benefit pension plan that has been certified as endangered, seriously endangered, or critical may begin to levy a statutory surcharge on contribution rates. Once authorized, the surcharge is at the rate of 5% for the first 12 months and 10% for any periods thereafter. Contributing employers, however, may eliminate the surcharge by entering into a collective bargaining agreement that meets the requirements of the applicable funding improvement plan or rehabilitation plan. |
17. Income Taxes
The components of the benefit from income taxes are comprised of the following for the years ended December 31:
2017 | 2016 | 2015 | |||||||||
Current | |||||||||||
Federal | $ | (1.1 | ) | $ | (0.1 | ) | $ | 0.4 | |||
State | 1.2 | 0.5 | 1.8 | ||||||||
0.1 | 0.4 | 2.2 | |||||||||
Deferred | |||||||||||
Federal | (44.8 | ) | (23.4 | ) | (17.4 | ) | |||||
State | 3.5 | (2.7 | ) | (4.2 | ) | ||||||
(41.3 | ) | (26.1 | ) | (21.6 | ) | ||||||
Benefit from income taxes | $ | (41.2 | ) | $ | (25.7 | ) | $ | (19.4 | ) | ||
91
Advanced Disposal Services, Inc. and Subsidiaries
Notes to Consolidated Financial Statements
For fiscal 2017, 2016 and 2015, the federal statutory rate in effect was 35%. A reconciliation between the benefit from income taxes and the expected tax benefit using the federal statutory rate in effect for the years ended December 31 is as follows:
2017 | 2016 | 2015 | |||||||||
Amount computed using statutory rates | $ | (1.0 | ) | $ | (19.6 | ) | $ | (18.6 | ) | ||
State income taxes, net of federal benefit | (3.3 | ) | (6.0 | ) | (5.1 | ) | |||||
Benefit from stock option exercises | — | (4.3 | ) | — | |||||||
Net effect of changes in tax rates | (0.3 | ) | (0.7 | ) | 1.7 | ||||||
Uncertain tax positions and interest | 0.5 | 0.4 | 1.0 | ||||||||
Nondeductible expenses | 1.5 | 1.2 | 1.8 | ||||||||
Net effect of change in U.S. Tax Law | (40.4 | ) | — | — | |||||||
Other | 0.6 | (0.2 | ) | 0.7 | |||||||
Valuation allowance | 1.2 | 3.5 | (0.9 | ) | |||||||
Benefit from income taxes | $ | (41.2 | ) | $ | (25.7 | ) | $ | (19.4 | ) | ||
The Company’s deferred tax assets and liabilities relate to the following sources and differences between financial accounting and the tax basis of the Company’s assets and liabilities at December 31:
2017 | 2016 | ||||||
Deferred tax assets | |||||||
Allowance for doubtful accounts | $ | 1.4 | $ | 1.6 | |||
Insurance reserve | 11.8 | 16.2 | |||||
Net operating loss | 103.4 | 203.3 | |||||
Capital loss carryforward | 42.8 | 68.9 | |||||
Accrued bonus and vacation | 4.5 | 7.3 | |||||
Stock compensation | 3.7 | 2.0 | |||||
Tax credits | 3.1 | 7.2 | |||||
Other | 11.9 | 12.5 | |||||
Total deferred tax assets | 182.6 | 319.0 | |||||
Valuation allowance | (60.0 | ) | (98.7 | ) | |||
Deferred tax assets less valuation allowance | 122.6 | 220.3 | |||||
Deferred tax liabilities | |||||||
Fixed asset basis | (66.4 | ) | (106.8 | ) | |||
Intangible basis | (73.9 | ) | (117.2 | ) | |||
Landfill and environmental remediation liabilities | (62.0 | ) | (100.5 | ) | |||
Other | (8.9 | ) | (8.6 | ) | |||
Deferred tax liabilities | (211.2 | ) | (333.1 | ) | |||
Net deferred tax liability | $ | (88.6 | ) | $ | (112.8 | ) | |
On December 22, 2017, the Tax Cuts and Jobs Act of 2017 (the "TCJA" or the "Act") was signed into law making significant changes to the Internal Revenue Code. These changes include, but are not limited to, reducing the U.S. corporate income tax rate from 35% to 21% for tax years beginning after December 31, 2017, allowing an immediate expensing of certain tangible assets placed in service before 2023, limiting the deduction of net interest expense, limiting the use of newly-generating net operating losses to offset 80% of future taxable income, repealing the corporate Alternative Minimum Tax ("AMT"), providing for the refund of AMT Credits and making substantial changes to the U.S. taxation of foreign operations.
92
Advanced Disposal Services, Inc. and Subsidiaries
Notes to Consolidated Financial Statements
The SEC staff issued Staff Accounting Bulletin ("SAB") 118, which provides clarifying guidance on accounting for the tax effects of the TCJA. SAB 118 allows for a measurement period, not to extend beyond one year from the enactment date, for companies to complete the accounting for the provision of the Act under ASC 740. In accordance with SAB 118, to the extent a company has not completed its analysis of the Act but can provide a reasonable estimate, it must record a provisional estimate in its financial statements.
The Company has calculated its best estimate of the impact of the Act in its year end income tax provision in accordance with its understanding of the Act and guidance available as of the date of this filing. The Company's 2017 financial results include a $40.5 non-cash tax benefit, primarily from revaluing the Company's net deferred tax assets, liabilities, and certain associated valuation allowances to reflect the recently enacted 21% federal corporate tax rate. Due to the Act's taxation of deemed repatriation on foreign earnings, the Company expects to pay a one-time tax of $0.1 related to its Bahamas operations.
The TCJA provides for the refund of AMT Credits in tax years 2018-2021. The Company has $3.1 of recognized AMT Credits which are included in the noncurrent deferred income tax accounts.
The Company's provisional estimate of the impacts of the TCJA may be impacted by future guidance issued by the U.S. Treasury Department, Internal Revenue Services, Financial Standards Accounting Board and other standard setting bodies. The Company is still analyzing certain aspects of the Act and is refining its calculations, which could potentially affect the provisional measurement of these balances. The completion of the Company's 2017 income tax returns by the third quarter 2018 may also impact the provisional amounts that have been recorded.
Effective for the fourth quarter of 2016, the Company adopted Accounting Standards Update (ASU) 2016-09, Improvements to Employee Share-Based Payment Accounting. This standard requires the Company to account for all of the tax effects related to share-based compensation through the statement of operations. For fiscal 2016, the adoption of this standard caused $4.7 to be recognized as a component of the benefit from income taxes.
The amounts recorded as deferred tax assets as of December 31, 2017 and 2016 represent the amounts of tax benefits of existing deductible temporary differences or net operating and capital loss carryforwards. Realization of deferred tax assets is dependent upon the generation of sufficient taxable income prior to expiration of any loss carryforwards. A valuation allowance has been recorded against deferred tax assets as of December 31, 2017 in the amount of $60.0. The valuation allowance for the year ended December 31, 2016 was $98.7. The valuation allowance decreased by $38.7 in 2017 primarily as a result of tax reform and unrecognized tax benefits. The Company has established valuation allowances for uncertainties in realizing the benefit of certain tax loss and credit carryforwards. While the Company expects to realize the deferred tax assets, net of the valuation allowances, changes in estimates of future taxable income or in tax laws may alter this expectation.
The Company had available federal net operating loss ("NOL") carryforwards from continuing operations of approximately $344.1 and $476.6 at December 31, 2017 and 2016 respectively. The Company’s federal net operating losses have expiration dates beginning in the year 2021 through 2036 if not utilized against taxable income. The capital loss of $175.9 expires in 2018, if not utilized against capital gains.
With the completion of the initial public offering in the fourth quarter of 2016, the Company experienced an ownership change pursuant to Section 382 of the Internal Revenue Code ("IRC"). This limitation is not expected to have an impact on the Company's ability to fully utilize its NOLs before expiration. Additionally, the Company has grown through a series of acquisitions and mergers and has had change of control events that resulted in limitations on the utilization of NOLs pursuant to Section 382 of the IRC. Approximately $58.8 of the NOLs from continuing operations are limited under the SRLY rules of the IRC. These NOLs are only available to be utilized against taxable income of the HWStar Waste Holdings, Corp. and subsidiaries thereof, a wholly-owned subsidiary of the Company. At this time, the Company expects to fully utilize these NOLs.
A predecessor of the Company had a transaction on November 1, 2005 that was treated as a reorganization. The Company estimates that it is subject to an annual limitation of approximately $4.2 on NOLs of approximately $29.1 originating prior to November 1, 2005.
93
Advanced Disposal Services, Inc. and Subsidiaries
Notes to Consolidated Financial Statements
A reconciliation of the beginning and ending amount of gross unrecognized tax benefits for fiscal 2017, 2016 and 2015 is as follows:
2017 | 2016 | 2015 | |||||||||
Balance at January 1, | $ | 7.5 | $ | 7.3 | $ | 6.2 | |||||
Additions based on tax positions of prior years | 20.4 | 0.1 | 0.5 | ||||||||
Change to prior tax positions due to tax rate changes | (0.4 | ) | — | — | |||||||
Additions based on tax positions of current year | — | 0.1 | 0.6 | ||||||||
Balance at December 31, | $ | 27.5 | $ | 7.5 | $ | 7.3 | |||||
These liabilities are included as a component of other liabilities and deferred income taxes in the Company's consolidated balance sheet. The Company does not anticipate that settlement of the liabilities will require payment of cash within the next twelve months. As of December 31, 2017, $25.1 of the net unrecognized benefit, if recognized in future periods, would impact the Company's effective rate.
The Company recognizes interest expense related to unrecognized tax benefits in tax expense. During the tax years ended December 31, 2017, 2016 and 2015, respectively, the Company recognized approximately $0.5, $0.2, and $0.2, respectively, of such interest expense as a component of the “Provision for Income Taxes”.
The Company had approximately $2.8 and $2.5 of accrued interest and $0.5 and $0.4 of accrued penalties in its balance sheet as of December 31, 2017 and 2016, respectively.
The Company and its subsidiaries are subject to income tax in the United States at the federal, state, and local jurisdictional levels. The company has open tax years dating back to 2003. There were no settlements of federal or state audits during 2017. Prior to the acquisition in fiscal 2012, Veolia ES Solid Waste division was part of a consolidated group and is still subject to IRS and state examinations dating back to 2004. Pursuant to the terms of the acquisition of Veolia ES Solid Waste, Inc., the Company is entitled to certain indemnifications for Veolia ES Solid Waste Division's pre-acquisition tax liabilities.
18. Fair Value of Financial Instruments
As a basis for considering assumptions, the fair value guidance establishes a three-tier fair value hierarchy, which prioritizes the inputs used in measuring fair value as follows:
Level 1 | Observable inputs such as quoted prices in active markets; | |
Level 2 | Inputs, other than the quoted prices in active markets, that are observable either directly or indirectly; and | |
Level 3 | Unobservable inputs in which there is little or no market data, which require the reporting entity to develop its own assumptions. | |
Assets and liabilities measured at fair value are based on one or more of three valuation techniques noted in the guidance. The three valuation techniques are as follows:
Market approach
Prices and other relevant information generated by market transactions involving identical or comparable assets and liabilities;
Cost approach
Amount that would be required to replace the service capacity of an asset (i.e., replacement cost); and
Income approach
Techniques to convert future amounts to a single present amount are based on market expectations (including present value techniques, option-pricing models, and lattice models).
94
Advanced Disposal Services, Inc. and Subsidiaries
Notes to Consolidated Financial Statements
The Company’s financial assets and liabilities recorded at fair value on a recurring basis include derivative instruments and certain investments included in cash equivalent money market funds. The Company’s interest rate caps are recorded at their estimated fair values based on a current forward fixed price swap curve.
All instruments were valued using the market approach. The Company's interest rate caps are valued using a third-party pricing model that incorporates information about LIBOR yield curves, which is considered observable market data, for each instrument’s respective term. Counterparties to the Company's interest rate caps are highly rated financial institutions. Valuations of those interest rate caps may fluctuate significantly from period to period due to volatility in the valuation of interest rates which are driven by market conditions and the scheduled maturities of the caps.
The Company’s assets and liabilities that are measured at fair value on a recurring basis approximate the following:
Fair Value Measurement at December 31, 2017 Reporting Date Using | |||||||||||||||||||||||
Total | Quoted Prices in Active Markets for Identical Assets (Level 1) | Significant Other Observable Inputs (Level 2) | Significant Unobservable Inputs (Level 3) | Total Gains (Losses) | Carrying Value | ||||||||||||||||||
Recurring fair value measurements | |||||||||||||||||||||||
Cash and cash equivalents | $ | 6.8 | $ | 6.8 | $ | — | $ | — | $ | — | $ | 6.8 | |||||||||||
Derivative instruments - Asset position | 3.7 | — | 3.7 | — | — | 3.7 | |||||||||||||||||
Derivative instruments - Liability position | (0.4 | ) | $ | — | (0.4 | ) | — | — | (0.4 | ) | |||||||||||||
Total recurring fair value measurements | $ | 10.1 | $ | 6.8 | $ | 3.3 | $ | — | $ | — | $ | 10.1 | |||||||||||
Fair Value Measurement at December 31, 2016 Reporting Date Using | |||||||||||||||||||||||
Total | Quoted Prices in Active Markets for Identical Assets (Level 1) | Significant Other Observable Inputs (Level 2) | Significant Unobservable Inputs (Level 3) | Total Gains (Losses) | Carrying Value | ||||||||||||||||||
Recurring fair value measurements | |||||||||||||||||||||||
Cash and cash equivalents | $ | 1.2 | $ | 1.2 | $ | — | $ | — | $ | — | $ | 1.2 | |||||||||||
Derivative instruments - Asset position | 2.3 | — | 2.3 | — | — | 2.3 | |||||||||||||||||
Total recurring fair value measurements | $ | 3.5 | $ | 1.2 | $ | 2.3 | $ | — | $ | — | $ | 3.5 | |||||||||||
Refer to Note 12 for disclosures regarding the fair value of long-term debt.
95
Advanced Disposal Services, Inc. and Subsidiaries
Notes to Consolidated Financial Statements
19. Commitments and Contingencies
Municipal solid waste service and other service contracts, permits and licenses to operate transfer stations, landfills and recycling facilities may require performance or surety bonds, letters of credit or other means of financial assurance to secure contractual performance. To secure its obligations, the Company has provided customers, various regulatory authorities and the Company’s insurer with such bonds totaling to approximately $749.2 and $715.5 as of December 31, 2017 and 2016, respectively. The majority of these obligations expire each year and are automatically renewed. Additionally, letters of credit have been issued to fulfill such obligations and are included in the total letters of credit outstanding disclosed in Note 12 "Long Term Debt" in the notes to the consolidated financial statements herein. The Company has an obligation as part of the purchase of one of its C&D landfills for payments of 6% of net revenue that began at the commencement of landfill operations and continues through the life of the landfill.
In February 2009, the Company and certain of its subsidiaries were named as defendants in a purported class action suit in the Circuit Court of Macon County, Alabama. Similar class action complaints were brought against the Company and certain of its subsidiaries in 2011 in Duval County, Florida and in 2013 in Quitman County, Georgia and Barbour County, Alabama, and in 2014 in Chester County, Pennsylvania. The 2013 Georgia complaint was dismissed in March 2014. In late 2015 in Gwinnett County, Georgia, another purported class action suit was filed. The plaintiffs in those cases primarily allege that the defendants charged improper fees (fuel, administrative and environmental charges) that were in breach of the plaintiffs' service agreements with the Company and seek damages in an unspecified amount. The Company believes that it has meritorious defenses against these purported class actions, which it will vigorously pursue. Given the inherent uncertainties of litigation, including the early stage of these cases, the unknown size of any potential class, and legal and factual issues in dispute, the outcome of these cases cannot be predicted and a range of loss, if any, cannot currently be estimated.
In November 2014, the Attorney General of the State of Vermont filed a complaint against the Company relating to the Moretown, Vermont landfill regarding alleged odor and other environmental-related noncompliances with environmental laws and regulations and environmental permits. In the complaint, the Attorney General requested that the State of Vermont Superior Court find the Company liable for the alleged noncompliances, issue related civil penalties, and order the Company to reimburse the State of Vermont for enforcement costs. The Company signed a consent and final judgment order during the first quarter of fiscal 2018 related to this matter and agreed to pay a civil penalty of $0.2.
In February 2017, a waste slide occurred in one cell at the Company's Greentree Landfill in Kersey, Pennsylvania. During fiscal 2017, the Company recorded a charge to operating expenses of $11.1, representing the Company's current estimate of probable costs to relocate displaced material and restore infrastructure, net of estimated insurance recoveries; this amount could increase or decrease as a result of actual costs incurred to completion and insurance recoveries. The Company has paid $9.4 as of December 31, 2017, which included a fine of $0.6 paid to the Pennsylvania Department of Environmental Protection.
The Company is subject to various other proceedings, lawsuits, disputes and claims and regulatory investigations arising in the ordinary course of its business. Many of these actions raise complex factual and legal issues and are subject to uncertainties. Actions filed against the Company include commercial, customer, and employment-related claims. The plaintiffs in some actions seek unspecified damages or injunctive relief, or both. These actions are in various procedural stages, and some are covered in part by insurance. Although the Company cannot predict the ultimate outcome and the range of loss cannot be currently estimated, the Company does not believe that the eventual outcome of any such action could have a material adverse effect on its business, financial condition, results of operations or cash flows.
20. Restructuring
For fiscal 2017, the Company incurred $3.4 of restructuring costs related to elimination of positions at the corporate office. Of the $3.4 of restructuring charges, $2.1 relates to the acceleration of stock-based compensation and $1.3 relates to severance expense.
For fiscal 2016, the Company incurred $0.8 of restructuring costs related to the consolidation of districts in the Midwest region and the resignation of one corporate executive.
For fiscal 2015, no new restructuring plans were adopted and no restructuring costs were incurred.
96
Advanced Disposal Services, Inc. and Subsidiaries
Notes to Consolidated Financial Statements
The costs associated with the actions described above are included in accrued expenses in the accompanying consolidated financial statements and include the amounts as follows:
2017 | 2016 | 2015 | |||||||||
Beginning balance | $ | 1.0 | $ | 2.2 | $ | 5.4 | |||||
Expense | 3.4 | 0.8 | — | ||||||||
Cash expenditures | |||||||||||
Severance and relocation | (0.7 | ) | (1.4 | ) | (2.7 | ) | |||||
Other | (0.1 | ) | (0.6 | ) | (0.5 | ) | |||||
Non-cash acceleration of options | (2.1 | ) | $ | — | — | ||||||
Ending balance | $ | 1.5 | $ | 1.0 | $ | 2.2 | |||||
21. Segment and Related Information
During the fourth quarter of fiscal 2016, the Company reorganized its internal organizational structure by moving two business units from the East segment to the South segment. Segment revenue, operating income, depreciation and amortization, capital expenditures and total assets for fiscal 2015 have been reclassified to reflect the changes to the Company's operating segments in fiscal 2016.
The Company's operations are managed through three operating segments: South, East and Midwest regions. These three operating segments and corporate entities are presented below as its reportable segments. The historical results, discussion and presentation of the Company's reportable segments are the result of its integrated waste management services consisting of collection, transfer, recycling and disposal of non-hazardous solid waste.
Summarized financial information concerning the Company's reportable segments for fiscal 2017, 2016 and 2015 is shown in the following table:
Services Revenues | Operating Income (Loss) | Depreciation and Amortization | Capital Expenditures | Total Assets | |||||||||||||||
2017 | |||||||||||||||||||
South | $ | 570.5 | $ | 89.8 | $ | 85.0 | $ | 65.0 | $ | 1,219.7 | |||||||||
East | 380.2 | (1.5 | ) | 76.8 | 57.0 | 837.6 | |||||||||||||
Midwest | 556.9 | 71.7 | 98.9 | 62.7 | 1,400.2 | ||||||||||||||
Corporate | — | (69.9 | ) | 9.1 | 1.9 | 35.8 | |||||||||||||
$ | 1,507.6 | $ | 90.1 | $ | 269.8 | $ | 186.6 | $ | 3,493.3 | ||||||||||
2016 | |||||||||||||||||||
South | $ | 522.3 | $ | 91.7 | $ | 75.2 | $ | 64.5 | $ | 1,172.8 | |||||||||
East | 347.7 | 25.8 | 71.7 | 46.8 | 751.4 | ||||||||||||||
Midwest | 534.6 | 78.3 | 91.5 | 55.8 | 1,415.0 | ||||||||||||||
Corporate | — | (63.9 | ) | 8.5 | 3.9 | 30.7 | |||||||||||||
$ | 1,404.6 | $ | 131.9 | $ | 246.9 | $ | 171.0 | $ | 3,369.9 | ||||||||||
2015 | |||||||||||||||||||
South | $ | 510.2 | $ | 69.4 | $ | 75.9 | $ | 52.8 | $ | 1,170.1 | |||||||||
East | 344.7 | 22.5 | 71.3 | 45.7 | 773.3 | ||||||||||||||
Midwest | 541.6 | 61.1 | 103.8 | 76.2 | 1,447.3 | ||||||||||||||
Corporate | (0.1 | ) | (57.9 | ) | 8.1 | 5.0 | 31.6 | ||||||||||||
$ | 1,396.4 | $ | 95.1 | $ | 259.1 | $ | 179.7 | $ | 3,422.3 | ||||||||||
97
Advanced Disposal Services, Inc. and Subsidiaries
Notes to Consolidated Financial Statements
22. Supplemental Cash Flow Information
Supplemental cash flow information for the years ended December 31 is as follows:
2017 | 2016 | 2015 | |||||||||
Cash paid for interest | $ | 86.2 | $ | 119.4 | $ | 116.4 | |||||
Cash paid for taxes | $ | 1.4 | $ | 1.5 | $ | 2.4 | |||||
Assets acquired under capital lease | $ | 45.2 | $ | 26.6 | $ | 10.2 | |||||
23. Accumulated Other Comprehensive Income (Loss)
The changes in the balances of each component of accumulated other comprehensive income (loss), net of tax, which is included as a component of stockholders' equity, are as follows:
Gains and (Losses) on Derivative Instruments | |||
Balance, December 31, 2014 | $ | 1.5 | |
Other comprehensive loss before reclassifications, net of tax | (1.5 | ) | |
Net current period other comprehensive loss | (1.5 | ) | |
Balance, December 31, 2015 | — | ||
Other comprehensive income before reclassifications, net of tax | — | ||
Net current period other comprehensive income | — | ||
Balance, December 31, 2016 | — | ||
Other comprehensive loss before reclassifications, net of tax | (0.4 | ) | |
Net current period other comprehensive loss | (0.4 | ) | |
Balance, December 31, 2017 | $ | (0.4 | ) |
The significant amounts either added to or reclassified out of each component of accumulated other comprehensive income (loss) are included in the tables below:
Amount of Derivative Loss Recognized in OCI – Effective for the Years Ended December 31, | |||||||||||
2017 | 2016 | 2015 | |||||||||
Derivatives Designated as Cash Flow Hedges | |||||||||||
Interest rate caps | $ | (0.4 | ) | $ | — | $ | (2.0 | ) | |||
Total before tax | (0.4 | ) | — | (2.0 | ) | ||||||
Tax benefit | — | — | 0.5 | ||||||||
Net of tax | $ | (0.4 | ) | $ | — | $ | (1.5 | ) | |||
24. Equity Method Investment
On November 20, 2012, in connection with a larger acquisition, ADS acquired a 50% equity stake in Sanitation Services Company Limited (“SS”) for approximately $9.5 million. SS is a Bahamas-based oil pumping, landscaping, garbage collection, janitorial, excavation and container rental services company. The Company uses the equity method to account for its 50% financial interest in SS. Equity in earnings was $1.6 million and $1.8 million for the years ended December 31, 2017 and 2016, respectively, and is recorded in Other Income (Expense), net on the Consolidated Statements of Operations. The investment
98
Advanced Disposal Services, Inc. and Subsidiaries
Notes to Consolidated Financial Statements
balance was $9.5 and $9.8 as of December 31, 2017 and 2016, respectively and is recorded in Other Assets on the Consolidated Balance Sheets.
Summarized balance sheet information for SS consists of the following at December 31:
(in millions) | 2017 | 2016 | |||||
Current assets | $ | 3.2 | $ | 3.9 | |||
Noncurrent assets | 5.1 | 4.8 | |||||
Current liabilities | 0.8 | 0.8 | |||||
Noncurrent liabilities | $ | 4.4 | $ | 4.2 | |||
Summarized statement of operations information for SS consists of the following for the year ended:
(in millions) | 2017 | 2016 | |||||
Service revenue | $ | 12.3 | $ | 13.9 | |||
Operating income | 3.4 | 3.6 | |||||
Income before income taxes | 3.3 | 3.4 | |||||
Net income | $ | 3.3 | $ | 3.4 | |||
25. Quarterly Financial Data (Unaudited)
The following table summarizes the unaudited quarterly results of operations for the respective quarters:
First Quarter | Second Quarter | Third Quarter | Fourth Quarter | ||||||||||||
2017 | |||||||||||||||
Operating revenues | $ | 347.4 | $ | 383.1 | $ | 392.7 | $ | 384.4 | |||||||
Income from operations | $ | 11.3 | $ | 24.1 | $ | 29.7 | $ | 25.0 | |||||||
Consolidated net (loss) income (a) (b) | $ | (7.0 | ) | $ | (0.2 | ) | $ | 3.5 | $ | 42.0 | |||||
Basic (loss) income per share | $ | (0.08 | ) | $ | — | $ | 0.04 | $ | 0.47 | ||||||
Diluted (loss) income per share | $ | (0.08 | ) | $ | — | $ | 0.04 | $ | 0.47 | ||||||
2016 | |||||||||||||||
Operating revenues | $ | 333.8 | $ | 358.2 | $ | 360.6 | $ | 352.0 | |||||||
Income (loss) from operations | $ | 13.0 | $ | 36.1 | $ | 39.6 | $ | 43.2 | |||||||
Consolidated net (loss) income (a) | $ | (14.3 | ) | $ | 0.2 | $ | 3.8 | $ | (20.1 | ) | |||||
Basic loss (income) per share | $ | (0.22 | ) | $ | — | $ | 0.06 | $ | (0.24 | ) | |||||
Diluted (loss) income per share | $ | (0.22 | ) | $ | — | $ | 0.06 | $ | (0.24 | ) | |||||
(a) Consolidated net income (loss) for the fourth quarter of fiscal 2017 and 2016 includes a loss on debt extinguishments and modifications of $3.7 and $64.7, respectively.
(b) Due to the enactment of the Tax Cuts and Jobs Act (the "Act") in the fourth quarter of fiscal 2017, the Company's fourth quarter financial results included a $40.5 non-cash tax benefit, primarily resulting from revaluing its net deferred tax assets, liabilities, and certain associated valuation allowances to reflect the recently enacted 21% federal corporate tax rate. Due to the Act's taxation of deemed repatriation on foreign earnings, the Company expects to pay a one-time tax of $0.1 related to its Bahamas operations.
26. New Accounting Standards Pending Adoption
In August 2017, the FASB issued ASU 2017-12 which intends to address concerns through changes to hedge accounting guidance which will accomplish the following: a) Expand hedge accounting for nonfinancial and financial risk components and amend measurement methodologies to more closely align hedge accounting with a company's risk management activities; b) Decrease the complexity of preparing and understanding hedge results through eliminating the separate measurement and reporting of hedge ineffectiveness; c) Enhance transparency, comparability and understandability of hedge results through enhanced disclosures and changing the presentation of hedge results to align the effects of the hedging instrument and the
99
hedged item; and d) Reduce the cost and complexity of applying hedge accounting by simplifying the manner in which assessments of hedge effectiveness may be performed. ASU 2017-12 is effective for fiscal years beginning after December 15, 2018 and interim periods within those fiscal years. Early adoption is permitted in any interim period following the issuance date. The Company is currently assessing the effect this guidance may have on its consolidated financial statements.
In February 2016, the FASB issued ASU 2016-02, Leases, which will require lessees to recognize most leases on their balance sheets as a right-of-use asset with a corresponding lease liability, and lessors to recognize a net lease investment. Additional qualitative and quantitative disclosures will also be required to increase transparency and comparability among organizations. This standard is effective for fiscal years beginning after December 15, 2018, including interim periods within those fiscal years. Early adoption of the standard is permitted; however, the Company does not expect to early adopt the ASU. Lessees and lessors are required to recognize and measure leases at the beginning of the earliest period presented. The Company is currently evaluating the expected impact of this standard update on disclosures, but does not anticipate any material changes to operating results or liquidity.
In May 2014, the FASB issued ASU 2014-09, Revenue from Contracts with Customers, which supersedes previous revenue recognition guidance. The new standard requires that a company recognize revenue when it transfers promised goods or services to customers in an amount that reflects the consideration the company expects to receive in exchange for those goods or services. Companies will need to use more judgment and estimates than under the guidance currently in effect, including estimating the amount of variable revenue to recognize over each identified performance obligation. Additional disclosures will be required to help users of financial statements understand the nature, amount and timing of revenue and cash flows arising from contracts. This standard will become effective for the Company beginning with the first quarter 2018 and can be adopted either retrospectively to each prior reporting period presented or as a cumulative effect adjustment as of the date of adoption. The Company will adopt the standard as a cumulative effect adjustment as of the date of adoption.
The Company completed an impact assessment of the guidance changes affecting the Company and developed an approach to address each change. The Company completed a process of sampling contracts based on specifically identified contract characteristics. The Company reviewed its municipal contracts, commercial collection contracts, roll-off collection contracts, disposal contracts, sale of recyclable contracts, landfill gas contracts, trucking contracts, managed landfill contracts and sale of aggregates contracts. The Company evaluated key contract terms for its contracts and evaluated areas impacted by the amended guidance. Applicable changes to processes and internal controls have been evaluated to meet the standard’s reporting and disclosure requirements.
Based on the Company's work to date, the Company believes it has identified material contract types and costs that may be impacted by this amended guidance. Under the amended guidance, certain sales commissions will be capitalized and amortized to selling, general and administrative expense over the expected life of the customer relationship. The Company does not expect a material change to the amount of selling, general and administrative expense recognized on an annual basis, nor does it expect to recognize a material cumulative effect adjustment to accumulated deficit as of January 1, 2018. Additionally, while the Company does not expect a significant change to the timing or pattern of revenue recognition under the amended guidance, the Company anticipates recognizing certain consideration payable to customers as a reduction in operating revenues, which is currently recorded as operating expenses.
100
ITEM 9. CHANGES IN AND DISAGREEMENTS WITH ACCOUNTANTS ON ACCOUNTING AND FINANCIAL DISCLOSURE
Not applicable.
ITEM 9A. CONTROLS AND PROCEDURES
Disclosure Controls and Procedures
Our management, with the participation of our principal executive and financial officers, has evaluated the effectiveness of our disclosure controls and procedures in ensuring that the information required to be disclosed in reports that we file or submit under the Securities Exchange Act of 1934, as amended, is recorded, processed, summarized and reported within the time periods specified in the SEC's rules and forms, including ensuring that such information is accumulated and communicated to management (including the principal executive and financial officers) as appropriate to allow timely decisions regarding required disclosure. Based on such evaluation, our principal executive and financial officers have concluded that such disclosure controls and procedures were effective as of December 31, 2017 (the end of the period covered by this Annual Report on Form 10-K).
Management's Report on Internal Control Over Financial Reporting
Management's report on our internal control over financial reporting can be found in Item 8, Financial Statements and Supplementary Data, of this report.
Changes in Internal Control over Financial Reporting
In connection with our fiscal 2017 acquisitions, we began implementing standards and procedures, including establishing controls over accounting systems and establishing controls over the preparation of financial statements in accordance with generally accepted accounting principles to ensure that we have in place appropriate internal control over financial reporting. We are continuing to integrate acquired operations into our overall internal control over financial reporting process.
Management, together with our CEO and CFO, evaluated the changes in our internal control over financial reporting during the quarter ended December 31, 2017. We determined that there were no changes in our internal control over financial reporting during the quarter ended December 31, 2017 that have materially affected, or are reasonably likely to materially affect, our internal control over financial reporting.
ITEM 9B. OTHER INFORMATION
None.
101
PART III
ITEM 10. DIRECTORS, EXECUTIVE OFFICERS AND CORPORATE GOVERNANCE
The information required by this Item is incorporated by reference to the sections entitled "Election of Directors" and "Executive Officers" in the Company’s definitive Proxy Statement for its 2018 Annual Meeting of Stockholders (the “Proxy Statement”), to be held May 23, 2018. The Proxy Statement will be filed with the SEC within 120 days of the end of our fiscal year.
ITEM 11. EXECUTIVE COMPENSATION
The information required by this Item is incorporated herein by reference to the section entitled “Executive Compensation” in the Proxy Statement.
ITEM 12. SECURITY OWNERSHIP OF CERTAIN BENEFICIAL OWNERS AND MANAGEMENT AND RELATED STOCKHOLDER MATTERS
The information required by this Item is incorporated herein by reference to the sections entitled “Security Ownership of Certain Beneficial Owners" and "Director and Officer Stock Ownership" in the Proxy Statement.
ITEM 13. CERTAIN RELATIONSHIPS AND RELATED TRANSACTIONS, AND DIRECTOR INDEPENDENCE
The information required by this Item is incorporated herein by reference to the sections entitled "Related Party Transactions" and "Independence of Directors" in the Proxy Statement.
ITEM 14. PRINCIPAL ACCOUNTING FEES AND SERVICES
The information required by this Item is incorporated herein by reference to the section entitled “Ratification of Independent Registered Public Accounting Firm” in the Proxy Statement.
PART IV
ITEM 15. EXHIBITS AND FINANCIAL STATEMENT SCHEDULES
(a) | Financial Statements and Financial Statement Schedules |
(1) | Consolidated Financial Statements. |
Consolidated Financial Statements are listed in the Index to Consolidated Financial Statements on page 60 of this report.
(2) | Consolidated Financial Statement Schedules. |
No financial statement schedules are included because they are not applicable, are not required, or because required information is included in the financial statements or the notes thereto.
(b) | See Exhibit Index below |
102
Exhibit Number | Description of Exhibits | |
2.1 | (Incorporated by reference to Exhibit 2.1 of the Company’s Current Report on Form 8-K, file number 001-37904, filed with the Securities and Exchange Commission on October 12, 2016) | |
3.1 | (Incorporated by reference to Exhibit 3.1 of the Company’s Current Report on Form 8-K, file number 001-37904, filed with the Securities and Exchange Commission on October 12, 2016) | |
3.2 | (Incorporated by reference to Exhibit 3.2 of the Company’s Current Report on Form 8-K, file number 001-37904, filed with the Securities and Exchange Commission on October 12, 2016) | |
4.1 | (Incorporated by reference to Exhibit 4.1 of the Company’s Current Report on Form 8-K, file number 001-37904, filed with the Securities and Exchange Commission on November 14, 2016) | |
4.2 | ||
10.1 | (Incorporated by reference to Exhibit 10.1 of the Company’s Current Report on Form 8-K, file number 001-37904, filed with the Securities and Exchange Commission on November 14, 2016) | |
10.2 | (Incorporated by reference to Exhibit 10.1 of the Company’s Current Report on Form 8-K, file number 001-37904, filed with the Securities and Exchange Commission on November 21, 2017) | |
10.3* | Form of Indemnity Agreement for Directors and Executive Officers of Advanced Disposal Services, Inc. (Incorporated by reference to Exhibit 10.7 of Amendment No. 5 to the Company’s Registration Statement on Form S-1, file number 333-206508, filed with the Securities and Exchange Commission on August 11, 2016) | |
10.4* | (Incorporated by reference to Exhibit 10.7 of the Company’s Registration Statement on Form S-4, file number 333-191109, filed with the Securities and Exchange Commission on September 12, 2013) | |
10.4a* | (Incorporated by reference to Exhibit 10.1 of the Company's Current Report on Form 8-K, file number 333-191109, filed with the Securities and Exchange Commission on July 23, 2014) | |
10.4b* | (Incorporated by reference to Exhibit 10.6 of the Company's Current Report on Form 8-K, file number 333-191109, filed with the Securities and Exchange Commission on June 30, 2016) | |
10.5* | (Incorporated by reference to Exhibit 10.24 of the Company’s Amendment No. 3 to the Registration Statement on Form S-1, file number 333-206508, filed with the Securities and Exchange Commission on January 20, 2016) | |
10.6* | ||
10.7* | (Incorporated by reference to Exhibit 10.9 of the Company’s Registration Statement on Form S-4, file number 333-191109, filed with the Securities and Exchange Commission on September 12, 2013) | |
10.8* | (Incorporated by reference to Exhibit 10.12 of the Company’s Annual Report on Form 10-K, file number 333-191109, filed with the Securities and Exchange Commission on March 10, 2015) | |
10.9* | (Incorporated by reference to Exhibit 10.12 of the Company’s Registration Statement on Form S-4, file number 333-191109, filed with the Securities and Exchange Commission on September 12, 2013) | |
10.10* | (Incorporated by reference to Exhibit 10.13 of the Company’s Registration Statement on Form S-4, file number 333-191109, filed with the Securities and Exchange Commission on September 12, 2013) | |
10.11* | (Incorporated by reference to Exhibit 10.14 of Amendment No. 2 to the Company’s Registration Statement on Form S-1, file number 333-206508, filed with the Securities and Exchange Commission on November 5, 2015) | |
10.12* | (Incorporated by reference to Exhibit 10.15 of Amendment No. 2 to the Company’s Registration Statement on Form S-1, file number 333-206508, filed with the Securities and Exchange Commission on November 5, 2015) | |
10.13* | (Incorporated by reference to Exhibit 10.14 of the Company’s Registration Statement on Form S-4, file number 333-191109, filed with the Securities and Exchange Commission on September 12, 2013) | |
10.14* | (Incorporated by reference to Exhibit 10.15 of the Company’s Registration Statement on Form S-4, file number 333-191109, filed with the Securities and Exchange Commission on September 12, 2013) | |
10.15* | (Incorporated by reference to Exhibit 10.16 of the Company’s Registration Statement on Form S-4, file number 333-191109, filed with the Securities and Exchange Commission on September 12, 2013) | |
10.16* | (Incorporated by reference to Exhibit 10.17 of the Company’s Registration Statement on Form S-4, file number 333-191109, filed with the Securities and Exchange Commission on September 12, 2013) | |
10.17* | (Incorporated by reference to Exhibit 10.18 of the Company’s Registration Statement on Form S-4, file number 333-191109, filed with the Securities and Exchange Commission on September 12, 2013) | |
10.18* | (Incorporated by reference to Exhibit 10.19 of the Company’s Registration Statement on Form S-4, file number 333-191109, filed with the Securities and Exchange Commission on September 12, 2013) | |
10.19* | (Incorporated by reference to Exhibit 10.20 of the Company’s Registration Statement on Form S-4, file number 333-191109, filed with the Securities and Exchange Commission on September 12, 2013) | |
10.20* | (Incorporated by reference to Exhibit 10.2 of the Company's Current Report on Form 8-K, file number 333-191109, filed with the Securities and Exchange Commission on June 30, 2016) | |
10.21* | (Incorporated by reference to Exhibit 10.3 of the Company's Current Report on Form 8-K, file number 333-191109, filed with the Securities and Exchange Commission on June 30, 2016) | |
10.22* | (Incorporated by reference to Exhibit 10.4 of the Company's Current Report on Form 8-K, file number 333-191109, filed with the Securities and Exchange Commission on June 30, 2016) | |
10.23* | (Incorporated by reference to Exhibit 10.5 of the Company's Current Report on Form 8-K, file number 333-191109, filed with the Securities and Exchange Commission on June 30, 2016) | |
10.24* | (Incorporated by reference to Exhibit 4.5 of the Company’s Registration Statement on Form S-8, file number 333-214072, filed with the Securities and Exchange Commission on October 12, 2016) | |
10.25* | (Incorporated by reference to Exhibit 10.27 of the Company’s Amendment No. 3 to the Registration Statement on Form S-1, file number 333-206508, filed with the Securities and Exchange Commission on January 20, 2016) | |
10.26* | (Incorporated by reference to Exhibit 10.28 of the Company’s Amendment No. 4 to the Registration Statement on Form S-1, file number 333-206508, filed with the Securities and Exchange Commission on February 1, 2016) | |
10.27* | (Incorporated by reference to Exhibit 10.29 of the Company’s Amendment No. 4 to the Registration Statement on Form S-1, file number 333-206508, filed with the Securities and Exchange Commission on February 1, 2016) | |
10.28* | (Incorporated by reference to Exhibit 10.30 of the Company’s Amendment No. 4 to the Registration Statement on Form S-1, file number 333-206508, filed with the Securities and Exchange Commission on February 1, 2016) | |
10.29* | (Incorporated by reference to Exhibit 10.31 of the Company’s Amendment No. 3 to the Registration Statement on Form S-1, file number 333-206508, filed with the Securities and Exchange Commission on January 20, 2016) | |
10.30* | (Incorporated by reference to Exhibit 10.32 of the Company’s Amendment No. 3 to the Registration Statement on Form S-1, file number 333-206508, filed with the Securities and Exchange Commission on January 20, 2016) | |
10.31* | ||
10.32 | (Incorporated by reference to Exhibit 10.1 of the Company’s Current Report on Form 8-K, file number 333-37904, filed with the Securities and Exchange Commission on October 12, 2016) | |
10.33 | (Incorporated by reference to Exhibit 10.2 of the Company’s Current Report on Form 8-K, file number 333-37904, filed with the Securities and Exchange Commission on October 12, 2016) | |
14.1 | (Incorporated by reference to Exhibit 14.a of the Company’s Current Report on Form 8-K, file number 333-191109, filed with the Securities and Exchange Commission on December 2, 2015) | |
21.1 | ||
23.1 | ||
24.1 | ||
31.1 | ||
31.2 | ||
32.1 | ||
32.2 | ||
101.INS | XBRL Instance Document | |
101.SCH | XBRL Extension Schema Document | |
101.CAL | XBRL Taxonomy Extension Calculation Linkbase Document | |
101.DEF | XBRL Taxonomy Extension Definition Linkbase Document | |
101.LAB | XBRL Taxonomy Extension Label Linkbase Document | |
101.PRE | XBRL Taxonomy Extension Presentation Linkbase Document | |
* Management contracts and compensatory plans and arrangements required to be filed as exhibits pursuant to Item 15(b) of this report
SIGNATURES
Pursuant to the requirements of Section 13 or 15(d) of the Securities Exchange Act of 1934, the Registrant has duly caused this report to be signed on its behalf by the undersigned, thereunto duly authorized.
Advanced Disposal Services, Inc. | ||
By: | /s/ Richard Burke | |
Richard Burke | ||
Chief Executive Officer and Director | ||
Date: February 28, 2018
Pursuant to the requirements of the Securities Exchange Act of 1934, this report has been signed below by the following persons on behalf of the Registrant and in the capacities and on the date indicated.
Each person signing below also hereby appoints Steven R. Carn, Matthew Gunnelson, Michael Slattery, and Richard Burke, and each of them singly, his or her lawful attorney-in-fact with full power to execute and file any and all amendments to this report together with exhibits thereto and generally to do all such things as such attorney-in-fact may deem appropriate to enable Advanced Disposal Services, Inc. to comply with the provisions of the Securities Exchange Act of 1934 and all requirements of the Securities and Exchange Commission.
Signature | Title | Date | ||
/s/ Richard Burke | Chief Executive Officer and Director (Principal Executive Officer) | February 28, 2018 | ||
Richard Burke | ||||
/s/ Steven R. Carn | Chief Financial Officer, Treasurer (Principal Financial Officer) | February 28, 2018 | ||
Steven R. Carn | ||||
/s/ Matthew Gunnelson | Chief Accounting Officer, Assistant Treasurer (Principal Accounting Officer) | February 28, 2018 | ||
Matthew Gunnelson | ||||
/s/ Michael Koen | Director | February 28, 2018 | ||
Michael Koen | ||||
/s/ Tanuja Dehne | Director | February 28, 2018 | ||
Tanuja Dehne | ||||
/s/ Bret Budenbender | Director | February 28, 2018 | ||
Bret Budenbender | ||||
/s/ Jared Parker | Director | February 28, 2018 | ||
Jared Parker | ||||
/s/ Renae Conley | Director | February 28, 2018 | ||
Renae Conley | ||||
/s/ B. Clyde Preslar | Director | February 28, 2018 | ||
B. Clyde Preslar | ||||
/s/ Michael Hoffman | Director | February 28, 2018 | ||
Michael Hoffman | ||||
103