Attached files
| file | filename |
|---|---|
| EX-31.1 - EXHIBIT 31.1 - WERNER ENTERPRISES INC | wern-20171231ex311.htm |
| EX-21 - EXHIBIT 21 - WERNER ENTERPRISES INC | wern-20171231ex21.htm |
| EX-32.2 - EXHIBIT 32.2 - WERNER ENTERPRISES INC | wern-20171231ex322.htm |
| EX-32.1 - EXHIBIT 32.1 - WERNER ENTERPRISES INC | wern-20171231ex321.htm |
| EX-31.2 - EXHIBIT 31.2 - WERNER ENTERPRISES INC | wern-20171231ex312.htm |
| EX-23.1 - EXHIBIT 23.1 - WERNER ENTERPRISES INC | wern-20171231ex231.htm |
| EX-10.3 - EXHIBIT 10.3 - WERNER ENTERPRISES INC | wern-20171231ex103.htm |
UNITED STATES SECURITIES AND EXCHANGE COMMISSION
WASHINGTON, D.C. 20549
FORM 10-K
[Mark one] |
ý ANNUAL REPORT PURSUANT TO SECTION 13 OR 15(d) OF THE SECURITIES EXCHANGE ACT OF 1934 |
For the fiscal year ended December 31, 2017
OR
¨ TRANSITION REPORT PURSUANT TO SECTION 13 OR 15(d) OF THE SECURITIES EXCHANGE ACT OF 1934 |
For the transition period from ___________ to __________
Commission File Number: 0-14690
WERNER ENTERPRISES, INC.
(Exact name of registrant as specified in its charter)
NEBRASKA | 47-0648386 | |
(State or other jurisdiction of incorporation or organization) | (I.R.S. Employer Identification No.) | |
14507 FRONTIER ROAD POST OFFICE BOX 45308 OMAHA, NEBRASKA | 68145-0308 | |
(Address of principal executive offices) | (Zip Code) | |
(402) 895-6640
(Registrant’s telephone number, including area code)
Securities registered pursuant to Section 12(b) of the Act:
Title of Each Class | Name of Each Exchange on Which Registered | |
Common Stock, $0.01 Par Value | The NASDAQ Stock Market LLC | |
Securities registered pursuant to Section 12(g) of the Act: NONE
Indicate by check mark if the registrant is a well-known seasoned issuer, as defined in Rule 405 of the Securities Act. Yes ý No ¨
Indicate by check mark if the registrant is not required to file reports pursuant to Section 13 or Section 15(d) of the Act. Yes ¨ No ý
Indicate by check mark whether the registrant (1) has filed all reports required to be filed by Section 13 or 15(d) of the Securities Exchange Act of 1934 during the preceding 12 months (or for such shorter period that the registrant was required to file such reports), and (2) has been subject to such filing requirements for the past 90 days. Yes ý No ¨
Indicate by check mark whether the registrant has submitted electronically and posted on its corporate Web site, if any, every Interactive Data File required to be submitted and posted pursuant to Rule 405 of Regulation S-T (§232.405 of this chapter) during the preceding 12 months (or for such shorter period that the registrant was required to submit and post such files). Yes ý No ¨
Indicate by check mark if disclosure of delinquent filers pursuant to Item 405 of Regulation S-K is not contained herein, and will not be contained, to the best of the registrant’s knowledge, in definitive proxy or information statements incorporated by reference in Part III of this Form 10-K or any amendment to this Form 10-K. ý
Indicate by check mark whether the registrant is a large accelerated filer, an accelerated filer, a non-accelerated filer, a smaller reporting company, or emerging growth company. See the definitions of “large accelerated filer,” “accelerated filer,” “smaller reporting company,” and “emerging growth company” in Rule 12b-2 of the Exchange Act.
Large accelerated filer | ý | Accelerated filer | o | Non-accelerated filer | o | Smaller reporting company | o | Emerging growth company | o | ||||
(Do not check if a smaller reporting company) | |||||||||||||
If an emerging growth company, indicate by check mark if the registrant has elected not to use the extended transition period for complying with any new or revised financial accounting standards provided pursuant to Section 13(a) of the Exchange Act. o
Indicate by check mark whether the registrant is a shell company (as defined in Rule 12b-2 of the Exchange Act). Yes ¨ No ý
The aggregate market value of the common equity held by non-affiliates of the Registrant (assuming for these purposes that all executive officers and Directors are “affiliates” of the Registrant) as of June 30, 2017, the last business day of the Registrant’s most recently completed second fiscal quarter, was approximately $1.385 billion (based on the closing sale price of the Registrant’s Common Stock on that date as reported by Nasdaq).
As of February 16, 2018, 72,452,452 shares of the registrant’s common stock, par value $0.01 per share, were outstanding.
DOCUMENTS INCORPORATED BY REFERENCE
Portions of the Proxy Statement of Registrant for the Annual Meeting of Stockholders to be held May 8, 2018, are incorporated in Part III of this report.
WERNER ENTERPRISES, INC.
INDEX
PAGE | ||
Item 1. | ||
Item 1A. | ||
Item 1B. | ||
Item 2. | ||
Item 3. | ||
Item 4. | ||
Item 5. | ||
Item 6. | ||
Item 7. | ||
Item 7A. | ||
Item 8. | ||
Item 9. | ||
Item 9A. | ||
Item 9B. | ||
Item 10. | ||
Item 11. | ||
Item 12. | ||
Item 13. | ||
Item 14. | ||
Item 15. | ||
Item 16. | ||
This Annual Report on Form 10-K for the year ended December 31, 2017 (this “Form 10-K”) and the documents incorporated herein by reference contain forward-looking statements based on expectations, estimates and projections as of the date of this filing. Actual results may differ materially from those expressed in such forward-looking statements. For further guidance, see Item 1A of Part I and Item 7 of Part II of this Form 10-K.
PART I
ITEM 1. | BUSINESS |
General
We are a transportation and logistics company engaged primarily in transporting truckload shipments of general commodities in both interstate and intrastate commerce. We also provide logistics services through our Werner Logistics segment. We believe we are one of the largest truckload carriers in the United States (based on total operating revenues), and our headquarters are located in Omaha, Nebraska, near the geographic center of our truckload service area. We were founded in 1956 by Clarence L. Werner, who started the business with one truck at the age of 19 and serves as our Executive Chairman. We were incorporated in the State of Nebraska in September 1982 and completed our initial public offering in June 1986 with a fleet of 632 trucks as of February 1986. At the end of 2017, our Truckload Transportation Services (“Truckload”) segment had a fleet of 7,435 trucks, of which 6,805 were company-operated and 630 were owned and operated by independent contractors. Our Werner Logistics division operated an additional 45 intermodal drayage trucks at the end of 2017.
We have two reportable segments – Truckload and Werner Logistics. You can find financial information regarding these segments and the geographic areas in which we conduct business in the Notes to Consolidated Financial Statements under Item 8 of this Form 10-K.
Our Truckload segment is comprised of the One-Way Truckload, Dedicated and Temperature Controlled. One-Way Truckload includes the following operating fleets: (i) the medium-to-long-haul van (“Van”) fleet transports a variety of consumer nondurable products and other commodities in truckload quantities over irregular routes using dry van trailers; (ii) the expedited (“Expedited”) fleet provides time-sensitive truckload services utilizing driver teams; and (iii) the regional short-haul (“Regional”) fleet provides comparable truckload van service within geographic regions across the United States. Dedicated provides truckload services dedicated to a specific customer, generally for a retail distribution center or manufacturing facility, utilizing either dry van or specialized trailers. Temperature Controlled provides truckload services for temperature sensitive products over irregular routes utilizing temperature-controlled trailers. (We previously utilized the name “Specialized Services” to encompass the operations of both Dedicated and Temperature Controlled.) Our Truckload fleets operate throughout the 48 contiguous U.S. states pursuant to operating authority, both common and contract, granted by the U.S. Department of Transportation (“DOT”) and pursuant to intrastate authority granted by various U.S. states. We also have authority to operate in several provinces of Canada and to provide through-trailer service into and out of Mexico. The principal types of freight we transport include retail store merchandise, consumer products, grocery products and manufactured products. We focus on transporting consumer nondurable products that generally ship more consistently throughout the year and whose volumes are generally more stable during a slowdown in the economy.
Our Werner Logistics segment is a non-asset-based transportation and logistics provider. Werner Logistics is comprised of the following five operating units that provide non-trucking services to our customers: (i) truck brokerage (“Brokerage”) uses contracted carriers to complete customer shipments; (ii) freight management (“Freight Management”) offers a full range of single-source logistics management services and solutions; (iii) the intermodal (“Intermodal”) unit offers rail transportation through alliances with rail and drayage providers as an alternative to truck transportation; and (iv) Werner Global Logistics international (“WGL”) provides complete management of global shipments from origin to destination using a combination of air, ocean, truck and rail transportation modes; and (v) Werner Final Mile (“Final Mile”) offers home and business deliveries of large or heavy items using two associates operating a liftgate straight truck. Our Brokerage unit had transportation services contracts with 17,641 carriers as of December 31, 2017.
Marketing and Operations
Our business philosophy is to provide superior on-time customer service at a significant value for our customers. To accomplish this, we operate premium modern tractors and trailers. This equipment has fewer mechanical and maintenance issues and helps attract and retain experienced drivers. We continually develop our business processes and technology to improve customer service and driver retention. We focus on customers who value the broad geographic coverage, diversified truck and logistics services, equipment capacity, technology, customized services and flexibility available from a large, financially-stable transportation and logistics provider.
1
We operate in the truckload and logistics sectors of the transportation industry. Our Truckload segment provides specialized services to customers based on (i) each customer’s trailer needs (such as van and temperature-controlled trailers), (ii) geographic area (regional and medium-to-long-haul van, including transport throughout Mexico and Canada), (iii) time-sensitive shipments (expedited) or (iv) conversion of their private fleet to us (dedicated). In 2017, trucking revenues (net of fuel surcharge) and trucking fuel surcharge revenues accounted for 76% of total operating revenues, and non-trucking and other operating revenues (primarily Werner Logistics revenues) accounted for 24% of total operating revenues. Our Werner Logistics segment manages the transportation and logistics requirements for customers, providing customers with additional sources of truck capacity, alternative modes of transportation, a global delivery network and systems analysis to optimize transportation needs. Werner Logistics services include (i) truck brokerage, (ii) freight management, (iii) intermodal transport, (iv) international and (v) final mile. The Werner Logistics international services are provided through our domestic and global subsidiary companies and include (i) ocean, air and ground transportation services, (ii) door-to-door freight forwarding and (iii) customs brokerage. Most Werner Logistics international services are provided throughout North America and Asia with additional coverage throughout Australia, Europe, South America and Africa. Werner Logistics is a non-asset-based transportation and logistics provider that is highly dependent on qualified associates, information systems and the services of qualified third-party capacity providers. You can find the revenues generated by services that accounted for more than 10% of our consolidated revenues, consisting of Truckload and Werner Logistics, for the last three years under Item 7 of Part II of this Form 10-K.
We have a diversified freight base but are dependent on a relatively small number of customers for a significant portion of our freight. During 2017, our largest 5, 10, 25 and 50 customers comprised 29%, 43%, 61% and 75% of our revenues, respectively. No single customer generated more than 8% of our revenues in 2017. The industry groups of our top 50 customers are 49% retail and consumer products, 27% grocery products, 13% manufacturing/industrial and 11% logistics and other. Many of our One-Way Truckload customer contracts may be terminated upon 30 days’ notice, which is common in the truckload industry. Most of our Dedicated customer contracts are one to three years in length and may be terminated by either party upon 30 to 90 days’ notice following the expiration of the contract’s first year, and we generally review rates in these contracts annually.
All of our company and independent contractor tractors are equipped with communication devices. These devices enable us and our drivers to conduct two-way communication using standardized and freeform messages. This technology also allows us to plan and monitor shipment progress. We automatically monitor truck movement and obtain specific data on the location of all trucks in the fleet every 15 minutes. Using the real-time global positioning data obtained from the devices, we have advanced application systems to improve customer and driver service. Examples of such application systems include: (i) an electronic logging system which records and monitors drivers’ hours of service and integrates with our information systems to pre-plan driver shipment assignments based on real-time available driving hours; (ii) software that pre-plans shipments drivers can trade enroute to meet driver home-time needs without compromising on-time delivery schedules; and (iii) automated “possible late load” tracking that informs the operations department of trucks possibly operating behind schedule, allowing us to take preventive measures to avoid late deliveries. In 1998, we began a successful pilot program and subsequently became the first trucking company in the United States to receive an exemption from DOT to use a global positioning-based paperless log system as an alternative to the paper logbooks traditionally used by truck drivers to track their daily work activities. We have used electronic logging devices (“ELDs”) to monitor and enforce drivers’ hours of service since 1996.
Seasonality
In the trucking industry, revenues generally follow a seasonal pattern. Peak freight demand has historically occurred in the months of September, October and November. After the December holiday season and during the remaining winter months, our freight volumes are typically lower because some customers reduce shipment levels. Our operating expenses have historically been higher in the winter months due primarily to decreased fuel efficiency, increased cold weather-related maintenance costs of revenue equipment and increased insurance and claims costs attributed to adverse winter weather conditions. We attempt to minimize the impact of seasonality through our marketing program by seeking additional freight from certain customers during traditionally slower shipping periods and focusing on transporting consumer nondurable products. Revenue can also be affected by adverse weather conditions, holidays and the number of business days that occur during a given period because revenue is directly related to the available working days of shippers.
Employee Associates and Independent Contractors
As of December 31, 2017, we employed 9,043 drivers; 602 mechanics and maintenance associates for the trucking operation; 1,285 office associates for the trucking operation; and 1,224 associates for Werner Logistics, international, driving schools and other non-trucking operations. We also had 630 independent contractors who provide both a tractor and a driver or drivers. None of our U.S., Canadian or Chinese associates are represented by a collective bargaining unit, and we consider relations with our associates to be good.
2
We recognize that our professional driver workforce is one of our most valuable assets. Most of our professional drivers are compensated on a per-mile basis. For most company-employed drivers, the rate per mile generally increases with the drivers’ length of service. Professional drivers may earn additional compensation through incentive performance pay programs and for performing additional work associated with their job (such as loading and unloading freight and making extra stops and shorter mileage trips).
At times, there are driver shortages in the trucking industry. Availability of experienced drivers can be affected by (i) changes in the demographic composition of the workforce; (ii) alternative employment opportunities other than truck driving that become available in the economy; and (iii) individual drivers’ desire to be home more frequently. The driver market remained challenging in 2017, and the supply of recent driver training school graduates continues to tighten. We believe that a declining number of, and increased competition for, driver training school graduates, an historically low national unemployment rate, aging truck driver demographics and increased truck safety regulations are tightening driver supply. We believe our strong mileage utilization, financial strength, safety record, and truck fleet age are attractive to drivers when compared to many other carriers. Additionally, we believe our large percentage of driving jobs in shorter-haul operations (such as Dedicated and Regional) that allow drivers to return home more often is attractive to drivers.
We utilize recent driver training school graduates as a significant source of new drivers. These drivers have completed a training program at a driver training school, hold a commercial driver’s license (“CDL”) and are further trained by Werner-certified trainer drivers prior to that driver becoming a solo driver with their own truck. As mentioned above, the recruiting environment for recent driver training school graduates remained challenging in 2017. The availability of these drivers has been negatively impacted by the decreased availability of student loan financing for driver training schools. We own two driver training schools that operate a total of 13 driver training locations to assist with the training and development of drivers for our company and the industry.
As economic conditions improve, competition for experienced drivers and recent driver training school graduates may increase and could become more challenging in 2018. We cannot predict whether we will experience future shortages in the availability of experienced drivers or driver training school graduates. If such a shortage were to occur and additional driver pay rate increases became necessary to attract and retain experienced drivers or driver training school graduates, our results of operations would be negatively impacted to the extent that we could not obtain corresponding freight rate increases.
We also recognize that independent contractors complement our company-employed drivers. Independent contractors supply their own tractors and drivers and are responsible for their operating expenses. Independent contractors also provide us with another source of drivers to support our fleet. We intend to maintain our emphasis on independent contractor recruiting, in addition to company driver recruitment. We, along with others in the trucking industry, however, continue to experience independent contractor recruitment and retention difficulties that have persisted over the past several years. Challenging operating conditions, including inflationary cost increases that are the responsibility of independent contractors and a shortage of financing available to independent contractors for equipment purchases, continue to make it difficult to recruit and retain independent contractors. If a shortage of independent contractors occurs, additional increases in per-mile settlement rates (for independent contractors) and driver pay rates (for company drivers) may become necessary to attract and retain a sufficient number of drivers. These increases could negatively affect our results of operations to the extent that we could not obtain corresponding freight rate increases.
Revenue Equipment
As of December 31, 2017, we operated 6,805 company tractors and 630 tractors owned by independent contractors in our Truckload segment. Our Werner Logistics segment operated an additional 45 company tractors at the end of 2017. The company tractors were primarily manufactured by Freightliner (a Daimler company), Peterbilt and Kenworth (both divisions of PACCAR). We adhere to a comprehensive maintenance program for both company tractors and trailers. We inspect independent contractor tractors prior to acceptance for compliance with Werner and DOT operational and safety requirements. We periodically inspect these tractors, in a manner similar to company tractor inspections, to monitor continued compliance. We also regulate the vehicle speed of company trucks to improve safety and fuel efficiency.
The average age of our company truck fleet was 1.9 years at December 31, 2017, compared to 1.8 years at December 31, 2016. At December 31, 2017, the average age of our trailer fleet was 4.7 years. In 2015 and 2016, we invested nearly $1 billion of capital expenditures (before sales of equipment) primarily to reduce the average age of our truck and trailer fleet. All of our trucks are equipped with satellite tracking devices. Approximately 86% of our company-owned trucks have collision mitigation safety systems, and 76% of our company-owned trucks have automatic manual transmissions.
We operated 24,500 company-owned trailers at December 31, 2017, comprised of dry vans, flatbeds, temperature-controlled, and other specialized trailers. Most of our trailers were manufactured by Wabash National Corporation. Nearly all of our dry van trailer fleet consisted of 53-foot composite (DuraPlate®) trailers, and we also provide other trailer lengths, such as 48-foot and 57-foot trailers, to meet the specialized needs of certain customers. Nearly 90% of our trailer fleet has satellite tracking; this is expected to grow to 100% of our trailer fleet by the end of 2018.
3
Our wholly-owned subsidiary, Werner Fleet Sales, sells our used trucks and trailers. Werner Fleet Sales has been in business since 1992 and operates in 8 locations. We may also trade used trucks to original equipment manufacturers when purchasing new trucks.
Fuel
In 2017, we purchased nearly all of our fuel from a predetermined network of fuel stops throughout the United States, of which approximately 96% was purchased from three large fuel stop chains. We negotiate discounted pricing based on historical purchase volumes with these fuel stop chains.
Shortages of fuel, increases in fuel prices and rationing of petroleum products can have a material adverse effect on our operations and profitability. Our customer fuel surcharge reimbursement programs generally enable us to recover from our customers a majority, but not all, of higher fuel prices compared to normalized average fuel prices. These fuel surcharges, which automatically adjust depending on the U.S. Department of Energy (“DOE”) weekly retail on-highway diesel fuel prices, enable us to recoup much of the higher cost of fuel when prices increase and provide customers with the benefit of lower fuel costs when fuel prices decline. We do not generally recoup higher fuel costs for empty and out-of-route miles (which are not billable to customers) and truck idle time. We cannot predict whether fuel prices will increase or decrease in the future or the extent to which fuel surcharges will be collected from customers. As of December 31, 2017, we had no derivative financial instruments to reduce our exposure to fuel price fluctuations.
We maintain aboveground and underground fuel storage tanks at many of our terminals. Leakage or damage to these facilities could expose us to environmental clean-up costs. The tanks are routinely inspected to help prevent and detect such problems.
Regulations
We are regulated by the U.S. DOT, and certain areas of our business are subject to various federal, state and international laws and regulations. DOT generally governs matters such as safety requirements, registration to engage in motor carrier operations, drivers’ hours of service (“HOS”), and certain mergers, consolidations, and acquisitions. Werner maintains a satisfactory DOT safety rating, which is the highest available rating. A conditional or unsatisfactory DOT safety rating could adversely impact our business as a proportion of our customer contracts require a satisfactory rating. Equipment weight and dimensions are also subject to federal, state, and international regulations with which we are required to comply.
The Federal Motor Carrier Safety Administration’s (“FMCSA”) Compliance, Safety, Accountability, (“CSA”) safety initiative monitors the safety performance of carriers. In December 2010, FMCSA made public the Safety Measurement System (“SMS”), which includes monthly updates of specific safety rating measurement and percentile ranking scores for over 500,000 trucking companies. Through SMS, the public could access carrier scores for CSA’s Behavior Analysis and Safety Improvement Categories (“BASICs”). The Fixing America’s Surface Transportation (“FAST”) Act of 2015 directed FMCSA to remove from public view the information regarding carrier alerts and percentile ranks (i.e., scores). FMCSA also was instructed to study the accuracy of CSA and SMS data and issue a corrective action plan to address the deficiencies identified in the study. In January 2016, FMCSA moved forward with a proposal to change the method for assigning a motor carrier’s Safety Fitness Determination (“SFD”) by using data from CSA. FMCSA withdrew the SFD proposed rule on March 23, 2017 and the agency must receive the National Academies of Sciences (“NAS”) study before determining whether further rulemaking action of SFD is necessary. In June 2017, NAS issued the Congressionally required study recommending that FMCSA adopt a new statistical model to measure motor carrier safety, along with other recommendations. In July 2017, FMCSA announced a planned demonstration project to consider requests from motor carriers to remove non-preventable crashes from their CSA records. We continue to monitor any CSA related developments.
Interstate carriers are subject to FMCSA HOS regulations. FMCSA adopted a final rule in December 2011 that included provisions affecting restart periods, rest breaks, on-duty time, and penalties for violations. We began dispatching drivers under the revised HOS rules which became effective July 1, 2013. These rules were more restrictive and we believe adversely affected driver productivity. The Consolidated Appropriations Act of 2016 was passed by Congress with a provision to reduce the negative effects of the restricted hours and required an FMCSA study to demonstrate results with statistically significant improvements in safety, driver health, and other things, before the agency could reinstate the restart rule restrictions that became effective in July 2013. Language included in the Fiscal Year 2017 Continuing Resolution allowed carriers to comply with the pre-July 2013 restart provision. In March 2017, FMCSA released the HOS Restart study report indicating the restrictions do not improve safety; as a result, the pre-July 2013 restart rule continues to be in effect indefinitely.
In June 2017, FMCSA proposed a pilot program to determine (i) the feasibility of adding split sleeper berth time options to the HOS regulations and (ii) whether such a change would improve safety. Once the Office of Management and Budget issues a final notice authorizing the data collection, FMCSA will then begin the pilot program and recruit drivers to participate.
4
Werner is the industry leader for ELDs to record driver hours and pioneered the Werner Paperless Logging System in 1996 that was subsequently approved for our use by FMCSA in 1998. In an effort to increase highway safety and improve compliance, Werner supported FMCSA’s ELD mandate. Legislative, regulatory, and legal efforts to delay the ELD final rule were unsuccessful and had minimal impact to the mandated implementation date. The final ELD rule was issued in December 2015, and on December 18, 2017, the final rule went into effect requiring all motor carriers to have certified ELDs that meet specific standards for documenting HOS. Both the Commercial Vehicle Safety Alliance and FMCSA announced that out-of-service enforcement of ELDs will not begin until April 1, 2018.
FMCSA published a final rule that establishes the Commercial Driver’s License Drug and Alcohol Clearinghouse in December 2016, which requires motor carriers, designated service agents, medical review officers, and substance abuse professionals to submit records related to drug and alcohol tests to a nationwide database. Carriers and service agents are required to report test refusals and positive results as well as query the database prior to hiring an applicant. Compliance with the national drug and alcohol clearinghouse final rule is required starting in January 2020, three years after its effective date.
FMCSA issued its final rule for Entry-Level Driver Training (“ELDT”) in December 2016. The final rule requires that behind-the-wheel proficiency be determined by the instructor’s evaluation. Werner believes the rule succeeds in outlining a core curriculum that can lead to improved trucking safety for the industry and general public. The compliance date of the ELDT rule is February 7, 2020, which is nearly three years after the rule’s revised effective date. We will continue to monitor the status of this rulemaking as it will directly impact our schools and the hiring of professional drivers.
The Environmental Protection Agency (“EPA”) and DOT announced in August 2011 Phase I of the Clean Power Plan, which was the first-ever program to reduce greenhouse gas (“GHG”) emissions and improvements to fuel efficiency for model year (“MY”) 2014-2018 heavy-duty trucks. In August 2016, EPA and DOT issued Phase II of the GHG and fuel economy plan impacting trucks beginning in MY 2021 with requirements phased in to 2027. The final rule requires a reduction of up to 25 percent in carbon emissions from tractor-trailers over the next decade. Newly manufactured trailers, left out of the first phase, will have aerodynamic requirements beginning in 2021 with tighter standards phased in until 2027. On December 20, 2016, EPA issued a statement acknowledging the need to further reduce nitrogen oxide emissions and is committed to finalize a rule by the end of 2019 and begin implementing new standards with MY 2024 vehicles. The implementation timing is being aligned with engine and vehicle GHG and fuel standard milestones under Phase II. In November 2017, the EPA Administrator signed a proposal to repeal the emission standards and other requirements for heavy-duty glider vehicles, glider engines, and glider kits.
California’s ongoing emissions reduction goals have significantly impacted the industry. On-Road Heavy Duty Vehicle Emissions Regulations adopted by the state, not only apply to California intrastate carriers, but also to carriers outside of California who enter the state with their equipment. Werner continues to comply with California’s Low Emission Transportation Refrigerated Unit (“TRU”) In-Use Performance Standards and its Tractor-Trailer GHG Reduction Rule, which is structured over a period of years to ensure ongoing compliance. We continue undertaking strategies to structure our fleet plans to operate compliant equipment in California.
WGL, through its domestic and global subsidiary companies, holds a variety of licenses required to carry out its international services. These licenses permit us to provide services as a Non-Vessel Operating Common Carrier (“NVOCC”), customs broker, freight forwarder, indirect air carrier, accredited cargo agent and others. These international services subject us to regulation by the Transportation Security Administration (“TSA”) and Customs and Borders Protection (“CBP”) agencies of the U.S. Department of Homeland Security, the U.S. Federal Maritime Commission (“FMC”), the International Air Transport Association (“IATA”), as well as similar regulatory agencies in foreign jurisdictions.
Our operations are subject to various federal, state, and local environmental laws and regulations, many of which are implemented by the EPA and similar state regulatory agencies. These laws and regulations govern the management of hazardous wastes, discharge of pollutants into the air and surface and underground waters and disposal of certain substances. We do not believe that compliance with these regulations has a material effect on our capital expenditures, earnings and competitive position.
Various provisions of the North American Free Trade Agreement (“NAFTA”) may alter the competitive environment regarding shipments in and out of Mexico and Canada. Recent political activity suggests that changes to NAFTA may be forthcoming, but we believe we are prepared to respond to any changes that may occur to this agreement. If negotiations result in a new agreement, it will need Congressional approval. We conduct a substantial amount of business in international freight shipments to and from the United States, Mexico, and Canada (see Note 8 in the Notes to Consolidated Financial Statements under Item 8 of Part II of this Form 10-K). We believe we are one of the largest truckload carriers in terms of freight volume shipped to and from the United States, Mexico, and Canada.
In Canada on December 16, 2017, a notice was issued in the Canada Gazette proposing amendments to the Commercial Vehicle Drivers HOS Regulations mandating the use of ELDs. The proposal would be aligned with similar ELD requirements in the United
5
States without introducing any impediments to trade. The newly proposed ELD regulations in Canada are not expected to have negative effects to our business model as Werner has used ELDs to record HOS since our Canadian operations started in 2000.
Werner is dedicated to participating in the development of meaningful public policy by continuing to evaluate local, state, and federal legislative and regulatory actions that impact our operations.
Competition
The freight transportation industry is highly competitive and includes thousands of trucking and non-asset-based logistics companies. We have a small share of the markets we target. Our Truckload segment competes primarily with other truckload carriers. Logistics companies, intermodal companies, railroads, less-than-truckload carriers and private carriers provide competition for both our Truckload and Werner Logistics segments. Our Werner Logistics segment also competes for the services of third-party capacity providers.
Competition for the freight we transport or manage is based primarily on service, efficiency, available capacity and, to some degree, on freight rates alone. We believe that few other truckload carriers have greater financial resources, own more equipment or carry a larger volume of freight than us. We believe we are one of the largest carriers in the truckload transportation industry based on total operating revenues.
Internet Website
We maintain an Internet website where you can find additional information regarding our business and operations. The website address is www.werner.com. On the website, we make certain investor information available free of charge, including our Annual Report on Form 10-K, Quarterly Reports on Form 10-Q, Current Reports on Form 8-K, stock ownership reports filed under Section 16 of the Securities Exchange Act of 1934, as amended (the “Exchange Act”), and any amendments to such reports filed or furnished pursuant to Section 13(a) or 15(d) of the Exchange Act. This information is included on our website as soon as reasonably practicable after we electronically file or furnish such materials to the U.S. Securities and Exchange Commission (“SEC”). The website also includes Interactive Data Files required to be posted pursuant to Rule 405 of SEC Regulation S-T. We also provide our corporate governance materials, such as Board committee charters and our Code of Corporate Conduct, on our website free of charge, and we may occasionally update these materials when necessary to comply with SEC and NASDAQ rules or to promote the effective and efficient governance of our company. Information provided on our website is not incorporated by reference into this Form 10-K.
ITEM 1A. | RISK FACTORS |
The following risks and uncertainties may cause our actual results, business, financial condition and cash flows to materially differ from those anticipated in the forward-looking statements included in this Form 10-K. Caution should be taken not to place undue reliance on forward-looking statements made herein because such statements speak only to the date they were made. Unless otherwise required by applicable securities laws, we undertake no obligation or duty to revise or update any forward-looking statements contained herein to reflect subsequent events or circumstances or the occurrence of unanticipated events. Also refer to the Cautionary Note Regarding Forward-Looking Statements in Item 7 of Part II of this Form 10-K.
Our business is subject to overall economic conditions that could have a material adverse effect on our results of operations.
We are sensitive to changes in overall economic conditions that impact customer shipping volumes, industry freight demand and industry truck capacity. When shipping volumes decline or available truck capacity increases, freight pricing generally becomes more competitive as carriers compete for loads to maintain truck productivity. We may be negatively affected by future economic conditions including employment levels, business conditions, fuel and energy costs, interest rates and tax rates. Economic conditions may also impact the financial condition of our customers, resulting in a greater risk of bad debt losses, and that of our suppliers, which may affect negotiated pricing or availability of needed goods and services.
Difficulty in recruiting and retaining experienced drivers, recent driver training school graduates and independent contractors could impact our results of operations and limit growth opportunities.
At times, the trucking industry has experienced driver shortages. Driver availability may be affected by changing workforce demographics, alternative employment opportunities, national unemployment rates, freight market conditions, availability of financial aid for driver training schools and changing industry regulations. If such a shortage were to occur and additional driver pay rate increases were necessary to attract and retain drivers, our results of operations would be negatively impacted to the extent that we could not obtain corresponding freight rate increases. Additionally, a shortage of drivers could result in idled equipment, which could affect our profitability.
6
Independent contractor availability may also be affected by both inflationary cost increases that are the responsibility of independent contractors and the availability of equipment financing. If a shortage of independent contractors occurs, additional increases in per-mile settlement rates (for independent contractors) and driver pay rates (for company drivers) may become necessary to attract and retain a sufficient number of drivers. These increases could negatively affect our results of operations to the extent that we would be unable to obtain corresponding freight rate increases.
Increases in fuel prices and shortages of fuel can have a material adverse effect on the results of operations and profitability.
To lessen the effect of fluctuating fuel prices on our margins, we have fuel surcharge programs with our customers. These programs generally enable us to recover a majority, but not all, of the fuel price increases. The remaining portion is generally not recoverable because it results from empty and out-of-route miles (which are not billable to customers) and truck idle time. Fuel prices that change rapidly in short time periods also impact our recovery because the surcharge rate in most programs only changes once per week. Fuel shortages, increases in fuel prices and petroleum product rationing could have a material adverse impact on our operations and profitability. To the extent that we cannot recover the higher cost of fuel through customer fuel surcharges, our financial results would be negatively impacted. As of December 31, 2017, we had no derivative financial instruments to reduce our exposure to fuel price fluctuations.
We operate in a highly competitive industry, which may limit growth opportunities and reduce profitability.
The freight transportation industry is highly competitive and includes thousands of trucking and non-asset-based logistics companies. We compete primarily with other truckload carriers in our Truckload segment. Logistics companies, intermodal companies, railroads, less-than-truckload carriers and private carriers also provide a lesser degree of competition in our Truckload segment, but such providers are more direct competitors in our Werner Logistics segment. Competition for the freight we transport or manage is based primarily on service, efficiency, available capacity and, to some degree, on freight rates alone. This competition could have an adverse effect on either the number of shipments we transport or the freight rates we receive, which could limit our growth opportunities and reduce our profitability.
We operate in a highly regulated industry. Changes in existing regulations or violations of existing or future regulations could adversely affect our operations and profitability.
We are regulated by the DOT in the United States and similar governmental transportation agencies in foreign countries in which we operate. We are also regulated by agencies in certain U.S. states. These regulatory agencies have the authority to govern transportation-related activities, such as safety, authorization to conduct motor carrier operations and other matters. The Regulations subsection in Item 1 of Part I of this Form 10-K describes several proposed and pending regulations that may have a significant effect on our operations including our productivity, driver recruitment and retention and capital expenditures. The subsidiaries of WGL hold a variety of licenses required to carry out its international services, and the loss of any of these licenses could adversely impact the operations of WGL.
The seasonal pattern generally experienced in the trucking industry may affect our periodic results during traditionally slower shipping periods and winter months.
In the trucking industry, revenues generally follow a seasonal pattern which may affect our results of operations. After the December holiday season and during the remaining winter months, our freight volumes are typically lower because some customers reduce shipment levels. Our operating expenses have historically been higher in the winter months because of cold temperatures and other adverse winter weather conditions which result in decreased fuel efficiency, increased cold weather-related maintenance costs of revenue equipment and increased insurance and claims costs. Revenue can also be affected by adverse weather conditions, holidays and the number of business days during a given period because revenue is directly related to the available working days of shippers.
We depend on key customers, the loss or financial failure of which may have a material adverse effect on our operations and profitability.
A significant portion of our revenue is generated from key customers. During 2017, our largest 5, 10 and 25 customers accounted for 29%, 43% and 61% of revenues, respectively. No single customer generated more than 8% of our revenues in 2017. We do not have long-term contractual relationships with many of our key One-Way Truckload customers. Our contractual relationships with our Dedicated customers are typically one to three years in length and may be terminated by either party upon 30 to 90 days’ notice following the expiration of the contract’s first year, and we generally review rates in these contracts annually. We cannot provide any assurance that key customer relationships will continue at the same levels. If a key customer substantially reduced or terminated our services, it could have a material adverse effect on our business and results of operations. We review our customers’ financial conditions for granting credit, monitor changes in customers’ financial conditions on an ongoing basis and review
7
individual past-due balances and collection concerns. However, a key customer’s financial failure may negatively affect our results of operations.
We depend on the services of third-party capacity providers, the availability of which could affect our profitability and limit growth in our Werner Logistics segment.
Our Werner Logistics segment is highly dependent on the services of third-party capacity providers, such as other truckload carriers, less-than-truckload carriers, railroads, ocean carriers and airlines. Many of those providers face the same economic challenges as we do and therefore are actively and competitively soliciting business. These economic conditions may have an adverse effect on the availability and cost of third-party capacity. If we are unable to secure the services of these third-party capacity providers at reasonable rates, our results of operations could be adversely affected.
If we cannot effectively manage the challenges associated with doing business internationally, our revenues and profitability may suffer.
Our results are affected by the success of our operations in Mexico, China and other foreign countries in which we operate (see Note 8 in the Notes to Consolidated Financial Statements under Item 8 of Part II of this Form 10-K). We are subject to risks of doing business internationally, including fluctuations in foreign currencies, changes in the economic strength of the countries in which we do business, difficulties in enforcing contractual obligations and intellectual property rights, burdens of complying with a wide variety of international and United States export and import laws, and social, political, and economic instability. Additional risks associated with our foreign operations, including restrictive trade policies and imposition of duties, taxes, or government royalties by foreign governments, are present but largely mitigated by the terms of NAFTA for Mexico and Canada. The agreement permitting cross border movements for both United States and Mexican based carriers into the United States and Mexico presents additional risks in the form of potential increased competition and the potential for increased congestion on the cross border lanes between countries. Recent political activity suggests that changes to NAFTA may be forthcoming. This and other measures that may impact the level of trade between the United States, Mexico and Canada could negatively impact our volume of cross border shipments and thus, our results of operations.
Our earnings could be reduced by increases in the number of insurance claims, cost per claim, costs of insurance premiums or availability of insurance coverage.
We are self-insured for a significant portion of liability resulting from bodily injury, property damage, cargo and associate workers’ compensation and health benefit claims. This is supplemented by premium-based insurance with licensed insurance companies above our self-insurance level for each type of coverage. To the extent we experience a significant increase in the number of claims, cost per claim or insurance premium costs for coverage in excess of our retention amounts, our operating results would be negatively affected. Healthcare legislation and inflationary cost increases could also have a negative effect on our results.
Decreased demand for our used revenue equipment could result in lower unit sales, resale values and gains on sales of assets.
We are sensitive to changes in used equipment prices and demand, especially with respect to tractors. We have been in the business of selling our company-owned trucks since 1992, when we formed our wholly-owned subsidiary Werner Fleet Sales. Reduced demand for used equipment could result in a lower volume of sales or lower sales prices, either of which could negatively affect our gains on sales of assets.
Our operations are subject to various environmental laws and regulations, the violation of which could result in substantial fines or penalties.
In addition to direct regulation by DOT, EPA and other federal, state, and local agencies, we are subject to various environmental laws and regulations dealing with the handling of hazardous materials, aboveground and underground fuel storage tanks, discharge and retention of storm-water, and emissions from our vehicles. We operate in industrial areas, where truck terminals and other industrial activities are located and where groundwater or other forms of environmental contamination have occurred. Our operations involve the risks of fuel spillage or seepage, environmental damage and hazardous waste disposal, among others. We also maintain bulk fuel storage at several of our facilities. If we are involved in a spill or other accident involving hazardous substances, or if we are found to be in violation of applicable laws or regulations, it could have a material adverse effect on our business and operating results. If we fail to comply with applicable environmental regulations, we could be subject to substantial fines or penalties and to civil and criminal liability. Tractors and trailers used in our daily operations have been affected by regulatory changes related to air emissions and fuel efficiency, and may be adversely affected in the future by new regulatory actions.
8
We rely on the services of key personnel, the loss of which could impact our future success.
We are highly dependent on the services of key personnel, including our executive officers. Although we believe we have an experienced and highly qualified management team, the loss of the services of these key personnel could have a significant adverse impact on us and our future profitability.
Difficulty in obtaining goods and services from our vendors and suppliers could adversely affect our business.
We are dependent on our vendors and suppliers. We believe we have good vendor relationships and that we are generally able to obtain favorable pricing and other terms from vendors and suppliers. If we fail to maintain satisfactory relationships with our vendors and suppliers, or if our vendors and suppliers experience significant financial problems, we could experience difficulty in obtaining needed goods and services because of production interruptions or other reasons. Consequently, our business could be adversely affected.
We use our information systems extensively for day-to-day operations, and service interruptions or a failure of our information technology infrastructure or a breach of our information security systems, networks or processes could have a material adverse effect on our business.
We depend on the stability, availability and security of our information systems to manage our business. Much of our software was developed internally or by adapting purchased software applications to suit our needs. Our information systems are used for planning loads, dispatching drivers and other capacity providers, billing customers, paying vendors and providing financial reports. If any of our critical information systems fail or become unavailable, we would have to perform certain functions manually, which could temporarily affect our ability to efficiently manage our operations. We have redundant computer hardware systems to reduce this risk. We also maintain information security policies to protect our systems and data from cyber security events and threats. The security risks associated with information technology systems have increased in recent years because of the increased sophistication, activities and evolving techniques of perpetrators of cyber attacks. The techniques used to obtain unauthorized access, disable or degrade service or sabotage systems change frequently, may be difficult to detect for a long time and often are not recognized until launched against a target. As a result, we may be unable to anticipate these techniques or to implement adequate preventative measures. A failure in or breach of our information technology security systems, or those of our third-party service providers, as a result of cyber attacks or unauthorized network access could disrupt our business, result in the disclosure or misuse of confidential or proprietary information, increase our costs and/or cause losses and reputational damage. In addition, recently, there has also been heightened regulatory and enforcement focus on data protection in the U.S., and failure to comply with applicable U.S. data protection regulations or other data protection standards may expose us to litigation, fines, sanctions or other penalties, which could harm our reputation and adversely impact our business, results of operations and financial condition.
ITEM 1B. | UNRESOLVED STAFF COMMENTS |
We have not received any written comments from SEC staff regarding our periodic or current reports that were issued 180 days or more preceding the end of our 2017 fiscal year and that remain unresolved.
ITEM 2. | PROPERTIES |
Our headquarters are located on approximately 161 acres near U.S. Interstate 80 west of Omaha, Nebraska, 72 acres of which are undeveloped. Our headquarters office building includes a computer center, drivers’ lounges, cafeteria and company store. The Omaha headquarters also includes a driver safety and training facility, equipment maintenance and repair facilities and a sales office for selling used trucks and trailers. These maintenance facilities contain a central parts warehouse, frame straightening and alignment machine, truck and trailer wash areas, equipment safety lanes, body shops for tractors and trailers, two paint booths and a reclaim center. Our headquarter facilities have suitable space available to accommodate planned needs for at least the next three to five years.
9
We also have several terminals throughout the United States, consisting of office and/or maintenance facilities. In addition, we own parcels of land in several locations in the United States for future terminal development. Our terminal locations are described below:
Location | Owned or Leased | Description | Segment | |||||||
Omaha, Nebraska | Owned | Corporate headquarters, maintenance, truck sales | Truckload, Werner Logistics, Corporate | |||||||
Omaha, Nebraska | Owned | Disaster recovery, warehouse | Corporate | |||||||
Phoenix, Arizona | Owned | Office, maintenance | Truckload | |||||||
Fontana, California | Owned | Office, maintenance, truck sales | Truckload | |||||||
Denver, Colorado | Owned | Office, maintenance | Truckload | |||||||
Atlanta, Georgia | Owned | Office, maintenance, truck sales | Truckload | |||||||
Indianapolis, Indiana | Leased Owned | Office, maintenance Office, truck sales | Truckload Truckload | |||||||
Springfield, Ohio | Owned | Office, maintenance, truck sales | Truckload | |||||||
Allentown, Pennsylvania | Leased | Office, maintenance | Truckload | |||||||
Dallas, Texas | Owned | Office, maintenance, truck sales | Truckload | |||||||
Laredo, Texas | Owned | Office, maintenance, transloading, truck sales | Truckload, Werner Logistics | |||||||
Lakeland, Florida | Leased | Office, maintenance | Truckload | |||||||
El Paso, Texas | Owned | Office, maintenance | Truckload | |||||||
Joliet, Illinois | Owned | Office, maintenance | Truckload | |||||||
West Memphis, Arkansas | Owned | Truck sales | Truckload | |||||||
Brownstown, Michigan | Owned | Maintenance | Truckload | |||||||
Newbern, Tennessee | Leased | Maintenance | Truckload | |||||||
We currently lease (i) small sales offices, brokerage offices and trailer parking yards in various locations throughout the United States and (ii) office space in Mexico, Canada and China. We own (i) a 96-room motel located near our Omaha headquarters; (ii) an 85-room hotel located near our Atlanta terminal; (iii) a 71-room private driver lodging facility at our Dallas terminal; (iv) a warehouse facility in Omaha; and (v) a terminal facility in Queretaro, Mexico, which we lease to a third party. The Werner Fleet Sales network had eight locations, which were located in certain terminals listed above. Our driver training schools currently operate in 13 locations.
ITEM 3. | LEGAL PROCEEDINGS |
We are a party subject to routine litigation incidental to our business, primarily involving claims for bodily injury, property damage, cargo and workers’ compensation incurred in the transportation of freight. We have maintained a self-insurance program with a qualified department of risk management professionals since 1988. These associates manage our bodily injury, property damage, cargo and workers’ compensation claims. An actuary reviews our undiscounted self-insurance reserves for bodily injury, property damage and workers’ compensation claims at year-end.
We renewed our liability insurance policies on August 1, 2017 and took on additional risk exposure by increasing our self-insurance retention (“SIR”) and deductible levels. Effective August 1, 2017, our SIR and deductible amount is $3.0 million, plus administrative expenses, for each occurrence involving bodily injury or property damage, compared to $2.0 million for all policy years since August 1, 2004. We are also responsible for varying annual aggregate amounts of liability for claims in excess of the SIR/deductible. For the policy year that began August 1, 2017, we have an annual $6.0 million aggregate for claims between $3.0 million and $5.0 million. We also have an additional $5.0 million deductible per claim for each claim between $5.0 million and $10.0 million. As a result, we are responsible for the first $10.0 million per claim, until we meet the $6.0 million aggregate for claims between $3.0 million and $5.0 million. For the policy years August 1, 2014 through July 31, 2017, we had an annual $8.0 million aggregate for claims between $2.0 million and $5.0 million and an annual aggregate of $5.0 million for claims between $5.0 million and $10.0 million. We maintain premium-based liability insurance coverage with insurance carriers substantially in excess of the $10.0 million per claim, to coverage levels that our management considers adequate. We are also responsible for administrative expenses
10
for each occurrence involving bodily injury or property damage. See also Note 1 and Note 6 in the Notes to Consolidated Financial Statements under Item 8 of Part II of this Form 10-K.
We are responsible for workers’ compensation claims up to $1.0 million per claim and have premium-based insurance coverage for individual claims above $1.0 million. We also maintain a $26.6 million bond for the State of Nebraska and a $6.9 million bond for our workers’ compensation insurance carrier.
ITEM 4. | MINE SAFETY DISCLOSURES |
Not applicable
PART II
ITEM 5. | MARKET FOR REGISTRANT’S COMMON EQUITY, RELATED STOCKHOLDER MATTERS AND ISSUER PURCHASES OF EQUITY SECURITIES |
Price Range of Common Stock
Our common stock trades on the NASDAQ Global Select MarketSM tier of the NASDAQ Stock Market under the symbol “WERN”. The following table sets forth, for the quarters indicated from January 1, 2016 through December 31, 2017, (i) the high and low trade prices per share of our common stock quoted on the NASDAQ Global Select MarketSM and (ii) our dividends declared per common share.
2017 | 2016 | ||||||||||
High | Low | Dividends Declared Per Common Share | High | Low | Dividends Declared Per Common Share | ||||||
Quarter Ended: | |||||||||||
March 31 | $29.00 | $25.30 | $0.06 | $27.95 | $20.91 | $0.06 | |||||
June 30 | 30.20 | 24.20 | 0.07 | 28.80 | 21.35 | 0.06 | |||||
September 30 | 36.60 | 28.55 | 0.07 | 25.49 | 22.16 | 0.06 | |||||
December 31 | 39.85 | 33.40 | 0.07 | 29.05 | 21.45 | 0.06 | |||||
As of February 16, 2018, our common stock was held by 251 stockholders of record. Because many of our shares of common stock are held by brokers and other institutions on behalf of stockholders, we are unable to estimate the total number of stockholders represented by these record holders. The high and low trade prices per share of our common stock in the NASDAQ Global Select MarketSM as of February 16, 2018 were $39.30 and $38.10, respectively.
Dividend Policy
We have paid cash dividends on our common stock following each fiscal quarter since the first payment in July 1987. We currently intend to continue paying a regular quarterly dividend. We do not currently anticipate any restrictions on our future ability to pay such dividends. However, we cannot give any assurance that dividends will be paid in the future or of the amount of any such dividends because they are dependent on our earnings, financial condition and other factors.
Equity Compensation Plan Information
For information on our equity compensation plans, please refer to Item 12 of Part III of this Form 10-K.
11
Performance Graph
Comparison of Five-Year Cumulative Total Return
The following graph is not deemed to be “soliciting material” or to be “filed” with the SEC or subject to the liabilities of Section 18 of the Exchange Act, and the report shall not be deemed to be incorporated by reference into any prior or subsequent filing by us under the Securities Act of 1933 or the Exchange Act except to the extent we specifically request that such information be incorporated by reference or treated as soliciting material.
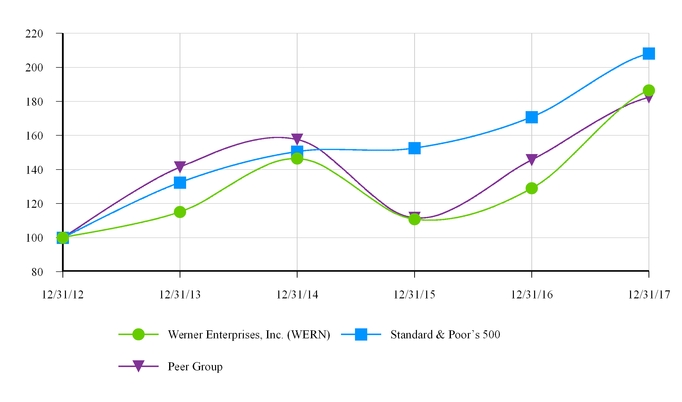
12/31/2012 | 12/31/2013 | 12/31/2014 | 12/31/2015 | 12/31/2016 | 12/31/2017 | |||||||||||||||||||
Werner Enterprises, Inc. (WERN) | $ | 100 | $ | 115 | $ | 146 | $ | 111 | $ | 129 | $ | 186 | ||||||||||||
Standard & Poor’s 500 | $ | 100 | $ | 132 | $ | 151 | $ | 153 | $ | 171 | $ | 208 | ||||||||||||
Peer Group | $ | 100 | $ | 141 | $ | 158 | $ | 112 | $ | 146 | $ | 182 | ||||||||||||
Assuming the investment of $100 on December 31, 2012, and reinvestment of all dividends, the graph above compares the cumulative total stockholder return on our common stock for the last five fiscal years with the cumulative total return of Standard & Poor’s 500 Market Index and our Peer Group over the same period. Our Peer Group includes companies similar to us in the transportation industry and has the following companies: ArcBest; Echo Global Logistics; Forward Air; Genesee & Wyoming; Heartland Express; Hub Group; JB Hunt; Kansas City Southern; Kirby; Knight-Swift Transportation (Knight Transportation and Swift Transportation merged in 2017); Landstar System; Old Dominion Freight Line; Saia; Schneider National; and YRC Worldwide. Our stock price was $38.65 as of December 31, 2017. This price was used for purposes of calculating the total return on our common stock for the year ended December 31, 2017.
Purchases of Equity Securities by the Issuer and Affiliated Purchasers
On October 15, 2007, we announced that on October 11, 2007 our Board of Directors approved an increase in the number of shares of our common stock that Werner Enterprises, Inc. (the “Company”) is authorized to repurchase. Under this authorization, the Company is permitted to repurchase an additional 8,000,000 shares. As of December 31, 2017, the Company had purchased 3,287,291 shares pursuant to this authorization and had 4,712,709 shares remaining available for repurchase. The Company may purchase shares from time to time depending on market, economic and other factors. The authorization will continue unless withdrawn by the Board of Directors.
12
No shares of common stock were repurchased during the fourth quarter of 2017 by either the Company or any “affiliated purchaser”, as defined by Rule 10b-18 of the Exchange Act.
ITEM 6. | SELECTED FINANCIAL DATA |
The following selected financial data should be read in conjunction with the consolidated financial statements and notes under Item 8 of Part II of this Form 10-K.
(In thousands, except per share amounts) | 2017 | 2016 | 2015 | 2014 | 2013 | ||||||||||||||
Operating revenues | $ | 2,116,737 | $ | 2,008,991 | $ | 2,093,529 | $ | 2,139,289 | $ | 2,029,183 | |||||||||
Net income (1) | 202,889 | 79,129 | 123,714 | 98,650 | 86,785 | ||||||||||||||
Diluted earnings per share (1) | 2.80 | 1.09 | 1.71 | 1.36 | 1.18 | ||||||||||||||
Cash dividends declared per share | 0.27 | 0.24 | 0.22 | 0.20 | 0.20 | ||||||||||||||
Total assets (2) | 1,807,991 | 1,793,003 | 1,585,647 | 1,480,462 | 1,354,097 | ||||||||||||||
Total debt | 75,000 | 180,000 | 75,000 | 75,000 | 40,000 | ||||||||||||||
Stockholders’ equity (1) | 1,184,782 | 994,787 | 935,654 | 833,860 | 772,519 | ||||||||||||||
Book value per share (1) (3) | 16.36 | 13.78 | 13.00 | 11.58 | 10.62 | ||||||||||||||
Return on average stockholders’ equity (1) (4) | 19.5 | % | 8.2 | % | 14.1 | % | 12.4 | % | 11.7 | % | |||||||||
Return on average total assets (1) (2) (5) | 11.5 | % | 4.7 | % | 8.2 | % | 7.0 | % | 6.5 | % | |||||||||
Operating ratio (consolidated) (6) | 93.2 | % | 93.7 | % | 90.4 | % | 92.5 | % | 93.1 | % | |||||||||
(1) | Includes the $110.5 million, or $1.52 per diluted share, non-cash reduction in income tax expense in 2017 resulting from the revaluation of net deferred income tax liabilities due to the Tax Act. Excluding this item, return on average total assets was 5.3%, and return on average stockholders’ equity was 9.0% for 2017. Management believes the exclusion of the tax reform benefit provides a more useful comparison of the Company’s performance from period to period. |
(2) | Pursuant to the Company’s early adoption of Accounting Standards Update 2015-17, “Total assets” and “Return on average total assets” for 2015 and later reflect the impact of reclassifying the current deferred income tax asset into the non-current deferred income tax liability. |
(3) | Stockholders’ equity divided by common shares outstanding as of the end of the period. Book value per share indicates the dollar value remaining for common shareholders if all assets were liquidated at recorded amounts and all debts were paid at recorded amounts. |
(4) | Net income expressed as a percentage of average stockholders’ equity. Return on equity is a measure of a corporation’s profitability relative to recorded shareholder investment. |
(5) | Net income expressed as a percentage of average total assets. Return on assets is a measure of a corporation’s profitability relative to recorded assets. |
(6) | Operating expenses expressed as a percentage of operating revenues. Operating ratio is a common measure used in the trucking industry to evaluate profitability. |
ITEM 7. | MANAGEMENT’S DISCUSSION AND ANALYSIS OF FINANCIAL CONDITION AND RESULTS OF OPERATIONS |
Management’s Discussion and Analysis of Financial Condition and Results of Operations (“MD&A”) summarizes the financial statements from management’s perspective with respect to our financial condition, results of operations, liquidity and other factors that may affect actual results. The MD&A is organized in the following sections:
• | Cautionary Note Regarding Forward-Looking Statements |
• | Overview |
• | Results of Operations |
• | Liquidity and Capital Resources |
• | Contractual Obligations and Commercial Commitments |
• | Off-Balance Sheet Arrangements |
• | Critical Accounting Policies and Estimates |
• | Inflation |
Cautionary Note Regarding Forward-Looking Statements:
This Annual Report on Form 10-K contains historical information and forward-looking statements based on information currently available to our management. The forward-looking statements in this report, including those made in this Item 7 (Management’s Discussion and Analysis of Financial Condition and Results of Operations), are made pursuant to the safe harbor provisions of the Private Securities Litigation Reform Act of 1995, as amended. These safe harbor provisions encourage reporting companies to provide prospective information to investors. Forward-looking statements can be identified by the use of certain words, such as “anticipate,” “believe,” “estimate,” “expect,” “intend,” “plan,” “project” and other similar terms and language. We believe the
13
forward-looking statements are reasonable based on currently available information. However, forward-looking statements involve risks, uncertainties and assumptions, whether known or unknown, that could cause our actual results, business, financial condition and cash flows to differ materially from those anticipated in the forward-looking statements. A discussion of important factors relating to forward-looking statements is included in Item 1A (Risk Factors) of Part I of this Form 10-K. Readers should not unduly rely on the forward-looking statements included in this Form 10-K because such statements speak only to the date they were made. Unless otherwise required by applicable securities laws, we undertake no obligation or duty to update or revise any forward-looking statements contained herein to reflect subsequent events or circumstances or the occurrence of unanticipated events.
Overview:
We have two reportable segments, Truckload and Werner Logistics, and we operate in the truckload and logistics sectors of the transportation industry. In the truckload sector, we focus on transporting consumer nondurable products that generally ship more consistently throughout the year. In the logistics sector, besides managing transportation requirements for individual customers, we provide additional sources of truck capacity, alternative modes of transportation, a global delivery network and systems analysis to optimize transportation needs. Our success depends on our ability to efficiently and effectively manage our resources in the delivery of truckload transportation and logistics services to our customers. Resource requirements vary with customer demand, which may be subject to seasonal or general economic conditions. Our ability to adapt to changes in customer transportation requirements is essential to efficiently deploy resources and make capital investments in tractors and trailers (with respect to our Truckload segment) or obtain qualified third-party capacity at a reasonable price (with respect to our Werner Logistics segment). Although our business volume is not highly concentrated, we may also be affected by our customers’ financial failures or loss of customer business.
Revenues for our Truckload segment operating units (One-Way Truckload, Dedicated and Temperature Controlled) are typically generated on a per-mile basis and also include revenues such as stop charges, loading and unloading charges, equipment detention charges and equipment repositioning charges. To mitigate our risk to fuel price increases, we recover from our customers additional fuel surcharges that generally recoup a majority of the increased fuel costs; however, we cannot assure that current recovery levels will continue in future periods. Because fuel surcharge revenues fluctuate in response to changes in fuel costs, we identify them separately and exclude them from the statistical calculations to provide a more meaningful comparison between periods. The key statistics used to evaluate trucking revenues, net of fuel surcharge, are (i) average revenues per tractor per week, (ii) average percentage of empty miles (miles without trailer cargo), (iii) average trip length (in loaded miles) and (iv) average number of tractors in service. General economic conditions, seasonal trucking industry freight patterns and industry capacity are important factors that impact these statistics. Our Truckload segment also generates a small amount of revenues categorized as non-trucking revenues, which consist primarily of the intra-Mexico portion of cross-border shipments delivered to or from Mexico where the Truckload segment utilizes a third-party capacity provider. We exclude such revenues from the statistical calculations.
Our most significant resource requirements are company drivers, independent contractors, tractors and trailers. Our financial results are affected by company driver and independent contractor availability and the markets for new and used revenue equipment. We are self-insured for a significant portion of bodily injury, property damage and cargo claims; workers’ compensation claims; and associate health claims (supplemented by premium-based insurance coverage above certain dollar levels). For that reason, our financial results may also be affected by driver safety, medical costs, weather, legal and regulatory environments and insurance coverage costs to protect against catastrophic losses.
The operating ratio is a common industry measure used to evaluate our profitability and that of our Truckload segment operating fleets. The operating ratio consists of operating expenses expressed as a percentage of operating revenues. The most significant variable expenses that impact the Truckload segment are driver salaries and benefits, fuel, fuel taxes (included in taxes and licenses expense), payments to independent contractors (included in rent and purchased transportation expense), supplies and maintenance and insurance and claims. As discussed further in the comparison of operating results for 2017 to 2016, several industry-wide issues have caused, and could continue to cause, costs to increase in future periods. These issues include shortages of drivers or independent contractors, changing fuel prices, higher new truck and trailer purchase prices and compliance with new or proposed regulations. Our main fixed costs include depreciation expense for tractors and trailers and equipment licensing fees (included in taxes and licenses expense). The Truckload segment requires substantial cash expenditures for tractor and trailer purchases. We fund these purchases with net cash from operations and financing available under our existing credit facilities, as management deems necessary.
We provide non-trucking services primarily through the five operating units within our Werner Logistics segment (Brokerage, Freight Management, Intermodal, WGL and Final Mile). Unlike our Truckload segment, the Werner Logistics segment is less asset-intensive and is instead dependent upon qualified associates, information systems and qualified third-party capacity providers. The largest expense item related to the Werner Logistics segment is the cost of purchased transportation we pay to third-party capacity providers. This expense item is recorded as rent and purchased transportation expense. Other operating expenses consist primarily of salaries, wages and benefits. We evaluate the Werner Logistics segment’s financial performance by reviewing the
14
gross margin percentage (revenues less rent and purchased transportation expenses expressed as a percentage of revenues) and the operating income percentage. The gross margin percentage can be impacted by the rates charged to customers and the costs of securing third-party capacity. We have a mix of contracted long-term rates and variable rates for the cost of third-party capacity, and we cannot assure that our operating results will not be adversely impacted in the future if our ability to obtain qualified third-party capacity providers changes or the rates of such providers increase.
Results of Operations:
The following table sets forth the Consolidated Statements of Income in dollars and as a percentage of total operating revenues and the percentage increase or decrease in the dollar amounts of those items compared to the prior year.
2017 | 2016 | 2015 | Percentage Change in Dollar Amounts | ||||||||||||||||||||||
(Amounts in thousands) | $ | % | $ | % | $ | % | 2017 to 2016 (%) | 2016 to 2015 (%) | |||||||||||||||||
Operating revenues | $ | 2,116,737 | 100.0 | $ | 2,008,991 | 100.0 | $ | 2,093,529 | 100.0 | 5.4 | (4.0 | ) | |||||||||||||
Operating expenses: | |||||||||||||||||||||||||
Salaries, wages and benefits | 681,547 | 32.2 | 636,112 | 31.7 | 639,908 | 30.6 | 7.1 | (0.6 | ) | ||||||||||||||||
Fuel | 198,745 | 9.4 | 155,042 | 7.7 | 204,583 | 9.8 | 28.2 | (24.2 | ) | ||||||||||||||||
Supplies and maintenance | 164,325 | 7.7 | 171,397 | 8.5 | 190,114 | 9.1 | (4.1 | ) | (9.8 | ) | |||||||||||||||
Taxes and licenses | 86,768 | 4.1 | 85,547 | 4.3 | 89,646 | 4.3 | 1.4 | (4.6 | ) | ||||||||||||||||
Insurance and claims | 79,927 | 3.8 | 83,866 | 4.2 | 80,848 | 3.9 | (4.7 | ) | 3.7 | ||||||||||||||||
Depreciation | 217,639 | 10.3 | 209,728 | 10.4 | 193,209 | 9.2 | 3.8 | 8.5 | |||||||||||||||||
Rent and purchased transportation | 509,573 | 24.1 | 512,296 | 25.5 | 480,624 | 22.9 | (0.5 | ) | 6.6 | ||||||||||||||||
Communications and utilities | 16,105 | 0.7 | 16,106 | 0.8 | 15,121 | 0.7 | — | 6.5 | |||||||||||||||||
Other | 18,288 | 0.9 | 12,827 | 0.6 | (980 | ) | (0.1 | ) | 42.6 | 1,408.9 | |||||||||||||||
Total operating expenses | 1,972,917 | 93.2 | 1,882,921 | 93.7 | 1,893,073 | 90.4 | 4.8 | (0.5 | ) | ||||||||||||||||
Operating income | 143,820 | 6.8 | 126,070 | 6.3 | 200,456 | 9.6 | 14.1 | (37.1 | ) | ||||||||||||||||
Total other expense (income) | (737 | ) | — | (1,390 | ) | — | (705 | ) | — | 47.0 | (97.2 | ) | |||||||||||||
Income before income taxes | 144,557 | 6.8 | 127,460 | 6.3 | 201,161 | 9.6 | 13.4 | (36.6 | ) | ||||||||||||||||
Income tax expense (benefit) | (58,332 | ) | (2.8 | ) | 48,331 | 2.4 | 77,447 | 3.7 | (220.7 | ) | (37.6 | ) | |||||||||||||
Net income | $ | 202,889 | 9.6 | $ | 79,129 | 3.9 | $ | 123,714 | 5.9 | 156.4 | (36.0 | ) | |||||||||||||
The following tables set forth the operating revenues, operating expenses and operating income for the Truckload segment, as well as certain statistical data regarding our Truckload segment operations for the periods indicated.
2017 | 2016 | 2015 | |||||||||||||||
Truckload Transportation Services (amounts in thousands) | $ | % | $ | % | $ | % | |||||||||||
Trucking revenues, net of fuel surcharge | $ | 1,403,863 | $ | 1,356,284 | $ | 1,411,099 | |||||||||||
Trucking fuel surcharge revenues | 205,515 | 155,293 | 212,489 | ||||||||||||||
Non-trucking and other operating revenues | 25,866 | 22,404 | 21,286 | ||||||||||||||
Operating revenues | 1,635,244 | 100.0 | 1,533,981 | 100.0 | 1,644,874 | 100.0 | |||||||||||
Operating expenses | 1,497,185 | 91.6 | 1,426,268 | 93.0 | 1,455,024 | 88.5 | |||||||||||
Operating income | 138,059 | 8.4 | 107,713 | 7.0 | 189,850 | 11.5 | |||||||||||
15
Truckload Transportation Services | 2017 | 2016 | 2015 | ||||||||
Operating ratio, net of fuel surcharge revenues (1) | 90.3 | % | 92.2 | % | 86.7 | % | |||||
Average revenues per tractor per week (2) | $ | 3,696 | $ | 3,591 | $ | 3,732 | |||||
Average trip length in miles (loaded) | 468 | 468 | 482 | ||||||||
Average percentage of empty miles (3) | 12.49 | % | 12.96 | % | 12.39 | % | |||||
Average tractors in service | 7,305 | 7,263 | 7,271 | ||||||||
Total trailers (at year end) | 22,900 | 22,725 | 22,630 | ||||||||
Total tractors (at year end): | |||||||||||
Company | 6,805 | 6,305 | 6,635 | ||||||||
Independent contractor | 630 | 795 | 815 | ||||||||
Total tractors | 7,435 | 7,100 | 7,450 | ||||||||
(1) | Calculated as if fuel surcharge revenues are excluded from total revenues and instead reported as a reduction of operating expenses, which provides a more consistent basis for comparing results of operations from period to period. |
(2) | Net of fuel surcharge revenues. |
(3) | “Empty” refers to miles without trailer cargo. |
The following tables set forth the Werner Logistics segment’s revenues, rent and purchased transportation expense, gross margin, other operating expenses (primarily salaries, wages and benefits expense) and operating income, as well as certain statistical data regarding the Werner Logistics segment.
2017 | 2016 | 2015 | ||||||||||||||||||
Werner Logistics (amounts in thousands) | $ | % | $ | % | $ | % | ||||||||||||||
Operating revenues | $ | 417,639 | 100.0 | $ | 417,172 | 100.0 | $ | 393,174 | 100.0 | |||||||||||
Rent and purchased transportation expense | 355,544 | 85.1 | 345,790 | 82.9 | 332,168 | 84.5 | ||||||||||||||
Gross margin | 62,095 | 14.9 | 71,382 | 17.1 | 61,006 | 15.5 | ||||||||||||||
Other operating expenses | 53,412 | 12.8 | 50,648 | 12.1 | 44,108 | 11.2 | ||||||||||||||
Operating income | $ | 8,683 | 2.1 | $ | 20,734 | 5.0 | $ | 16,898 | 4.3 | |||||||||||
Werner Logistics | 2017 | 2016 | 2015 | |||||
Average tractors in service | 50 | 73 | 56 | |||||
Total trailers (at year end) | 1,600 | 1,625 | 1,460 | |||||
Total tractors (at year end) | 45 | 74 | 62 | |||||
2017 Compared to 2016
Operating Revenues
Operating revenues increased 5.4% in 2017 compared to 2016. When comparing 2017 to 2016, Truckload segment revenues increased $101.3 million, or 6.6%, of which nearly half resulted from higher fuel surcharge revenues due to higher fuel prices. Revenues for the Werner Logistics segment increased $0.5 million.
Freight demand in our One-Way Truckload fleet was seasonally softer with weaker trends early in 2017, but began to improve to more normal seasonal levels in March. Freight continued to improve through August, trending better than normal and better than the more challenging periods of 2016. Beginning in September, the freight market strengthened further due in part to the two major hurricanes in Texas and Florida. While these events resulted in short-term costs to the Company, at the same time, they improved spot market pricing and further widened the positive gap between demand and capacity leading into peak season. Fourth quarter 2017 freight demand in our One-Way Truckload fleet was strong. Freight in October 2017 was seasonally better than normal, and demand strengthened further in November and December. Freight volumes thus far in 2018 have been much stronger than normal compared to the same months of previous years.
Trucking revenues, net of fuel surcharge, increased 3.5% in 2017 compared to 2016 due to a 2.9% increase in average revenues per tractor per week, net of fuel surcharge revenues. The average number of tractors in service increased 0.6% from 2016 to 2017. Average miles per truck remained flat from 2016 to 2017, and average revenues per total mile, net of fuel surcharge revenues, increased 2.9%. Freight metrics are improving, and we have increasing confidence that contractual rates will strengthen over the
16
next few quarters. We currently expect an increase in the average revenues per total mile, net of fuel surcharge revenues, in 2018 in the range of 6% to 10%.
The average number of tractors in service in the Truckload segment increased to 7,305 in 2017 compared to 7,263 in 2016. We ended 2017 with 7,435 tractors in the Truckload segment, a year-over-year increase of 335 trucks. Our Dedicated unit ended 2017 with 4,000 trucks (or 54% of our total Truckload segment fleet) compared to 3,650 trucks at the end of 2016. We cannot predict whether future driver shortages, if any, will adversely affect our ability to maintain our fleet size. If such a driver market shortage were to occur, it could result in a fleet size reduction, and our results of operations could be adversely affected.
Trucking fuel surcharge revenues increased 32.3% to $205.5 million in 2017 from $155.3 million in 2016 because of higher average fuel prices in 2017. These revenues represent collections from customers for the increase in fuel and fuel-related expenses, including the fuel component of our independent contractor cost (recorded as rent and purchased transportation expense) and fuel taxes (recorded in taxes and licenses expense), when diesel fuel prices rise. Conversely, when fuel prices decrease, fuel surcharge revenues decrease. To lessen the effect of fluctuating fuel prices on our margins, we collect fuel surcharge revenues from our customers for the cost of diesel fuel and taxes in excess of specified base fuel price levels according to terms in our customer contracts. Fuel surcharge rates generally adjust weekly based on an independent U.S. Department of Energy fuel price survey which is released every Monday. Our fuel surcharge programs are designed to (i) recoup higher fuel costs from customers when fuel prices rise and (ii) provide customers with the benefit of lower fuel costs when fuel prices decline. These programs generally enable us to recover a majority, but not all, of the fuel price increases. The remaining portion is generally not recoverable because it results from empty and out-of-route miles (which are not billable to customers) and truck idle time. Fuel prices that change rapidly in short time periods also impact our recovery because the surcharge rate in most programs only changes once per week.
Werner Logistics revenues are generated by its five operating units and exclude revenues for full truckload shipments transferred to the Truckload segment, which are recorded as trucking revenues by the Truckload segment. Werner Logistics also recorded revenue and brokered freight expense of $0.8 million in 2017 and $1.0 million in 2016 for Intermodal drayage movements performed by the Truckload segment (also recorded as trucking revenues by the Truckload segment), and these transactions between reporting segments are eliminated in consolidation. Werner Logistics revenues increased 0.1% to $417.6 million in 2017 from $417.2 million in 2016. The Werner Logistics gross margin dollars decreased 13.0% to $62.1 million in 2017 from $71.4 million in 2016, and the Werner Logistics gross margin percentage decreased to 14.9% in 2017 from 17.1% in 2016. The Werner Logistics operating income percentage decreased to 2.1% in 2017 from 5.0% in 2016. Tighter carrier capacity in 2017 compared to 2016 resulted in higher purchased transportation costs for our predominantly contractual logistics business, causing the lower gross margin and operating income percentages.
In 2017, Werner Logistics achieved 26% revenue growth over 2016 in our truck brokerage solution, while our intermodal and international solutions had lower revenues due to more challenging market conditions. As previously disclosed, a large Werner Logistics Freight Management customer (5.0% of Werner Logistics revenues in 2016) that was acquired in 2015 transitioned to their parent company’s transportation platform mid-quarter during first quarter 2017. We continue to see strong customer acceptance of the value of the Werner Logistics portfolio of service offerings, particularly as the market strengthens and shippers tend to consolidate their logistics business with the stability of larger asset-backed logistics providers. Achieving contractual rate increases in 2018 to recoup rising costs of third-party capacity is a focus for Werner Logistics.
Operating Expenses
Our operating ratio (operating expenses expressed as a percentage of operating revenues) was 93.2% in 2017 compared to 93.7% in 2016. Expense items that impacted the overall operating ratio are described on the following pages. The tables on pages 15 through 16 show the Consolidated Statements of Income in dollars and as a percentage of total operating revenues and the percentage increase or decrease in the dollar amounts of those items compared to the prior year, as well as the operating ratios, operating margins and certain statistical information for our two reportable segments, Truckload and Werner Logistics.
Salaries, wages and benefits increased $45.4 million or 7.1% in 2017 compared to 2016 and increased 0.5% as a percentage of operating revenues. The higher dollar amount of salaries, wages and benefits expense was due primarily to 3% more company trucks and miles in 2017 compared to 2016 and higher driver and student pay rates, both of which resulted in higher payroll taxes and other payroll-related fringe benefits. When evaluated on a per-mile basis, driver and non-driver salaries, wages and benefits increased, which we attribute primarily to 4% higher driver pay per company truck mile in 2017. Non-driver salaries, wages and benefits in the non-trucking Werner Logistics segment increased 12.8% in 2017 compared to 2016.
We renewed our workers’ compensation insurance coverage for the policy year beginning April 1, 2017. Our coverage levels are the same as the prior policy year. We continue to maintain a self-insurance retention of $1.0 million per claim. Our workers’ compensation insurance premiums for the policy year beginning April 2017 were similar to those for the previous policy year.
17
The driver recruiting market is challenging. Several ongoing market factors persisted including a declining number of, and increased competition for, driver training school graduates, a low national unemployment rate, aging truck driver demographics and increased truck safety regulations. We proactively took many significant actions over the last two years to strengthen our driver recruiting and retention to make Werner the preferred choice for the best drivers, including raising driver pay, lowering the age of our truck fleet, installing safety and training features on all new trucks, investing in our driver training schools and collaborating with customers to improve or eliminate unproductive freight. These steps helped us to grow our fleet by nearly 5% in 2017 in this difficult driver market. In 2017, our driver turnover rate once again improved, as we achieved our lowest annual driver turnover rate in 19 years. We are unable to predict whether we will experience future driver shortages. If such a shortage were to occur and additional driver pay rate increases became necessary to attract and retain drivers, our results of operations would be negatively impacted to the extent that we could not obtain corresponding freight rate increases.
Fuel increased $43.7 million or 28.2% in 2017 compared to 2016 and increased 1.7% as a percentage of operating revenues due to higher average diesel fuel prices and more company trucks and miles, partially offset by improved miles per gallon (“mpg”). Average diesel fuel prices in 2017 were 32 cents per gallon higher than in 2016, a 23% increase.
We continue to employ measures to improve our fuel mpg, including (i) limiting truck engine idle time, (ii) optimizing the speed, weight and specifications of our equipment and (iii) implementing mpg-enhancing equipment changes to our fleet including new trucks with EPA 2010 compliant engines, more aerodynamic truck features, idle reduction systems, trailer tire inflation systems, trailer skirts and automated manual transmissions to reduce our fuel gallons purchased. However, fuel savings from mpg improvement is partially offset by higher depreciation expense and the additional cost of diesel exhaust fluid (required in tractors with engines that meet the 2010 EPA emission standards). Although our fuel management programs require significant capital investment and research and development, we intend to continue these and other environmentally conscious initiatives, including our active participation as an EPA SmartWay Transport Partner. The SmartWay Transport Partnership is a national voluntary program developed by the EPA and freight industry representatives to reduce greenhouse gases and air pollution and promote cleaner, more efficient ground freight transportation.
For the first eight weeks of 2018, the average diesel fuel price per gallon was approximately 40 cents higher than the average diesel fuel price per gallon in the same period of 2017 and approximately 42 cents higher than the average for first quarter 2017.
Shortages of fuel, increases in fuel prices and petroleum product rationing can have a material adverse effect on our operations and profitability. We are unable to predict whether fuel price levels will increase or decrease in the future or the extent to which fuel surcharges will be collected from customers. As of December 31, 2017, we had no derivative financial instruments to reduce our exposure to fuel price fluctuations.
Supplies and maintenance decreased $7.1 million or 4.1% in 2017 compared to 2016 and decreased 0.8% as a percentage of operating revenues. Repairs and maintenance for our tractor and trailer fleets decreased in 2017 compared to 2016 despite higher company miles driven due to a newer fleet of tractors and trailers. These decreases were partially offset by higher driver recruiting and other driver-related costs in the 2017 period.
Insurance and claims decreased $3.9 million or 4.7% in 2017 compared to 2016 and decreased 0.4% as a percentage of operating revenues. The decrease in 2017 compared to 2016 is primarily the result of a lower amount of unfavorable loss development on prior period large dollar claims in 2017. Most of our insurance and claims expense results from our claim experience and claim development under our self-insurance program; the remainder results from insurance premiums for claims in excess of our self-insured limits. We renewed our liability insurance policies on August 1, 2017 and assumed additional risk exposure by increasing our self-insured retention and deductible levels. Effective on August 1, 2017, we are responsible for the first $3.0 million per claim with an annual $6.0 million aggregate for claims between $3.0 million and $5.0 million. We also have an additional $5.0 million deductible per claim for each claim between $5.0 million and $10.0 million. As a result, we are responsible for the first $10.0 million per claim, until we meet the $6.0 million aggregate for claims between $3.0 million and $5.0 million. For the policy years that ended July 31, 2016 and 2017, we were responsible for the first $2.0 million per claim with an annual $8.0 million aggregate for claims between $2.0 million and $5.0 million and an annual aggregate of $5.0 million for claims between $5.0 million and $10.0 million. We maintain liability insurance coverage with insurance carriers substantially in excess of the $10.0 million per claim. As a result of the higher self-insured retention and deductible amounts under the new policies, our liability insurance premiums for the policy year that began August 1, 2017 are about $3.7 million lower than premiums for the previous policy year. See Item 3 of Part I of this Form 10-K for information on our bodily injury and property damage coverage levels since August 1, 2014.
Depreciation increased $7.9 million or 3.8% in 2017 compared to 2016 and decreased 0.1% as a percentage of operating revenues. This expense increase is due primarily to (i) the higher cost of new trucks purchased compared to the cost of used trucks that were sold over the past 12 months and (ii) the purchase of new trailers over the past 12 months to replace older used trailers which were fully depreciated. During fourth quarter 2016 we changed the estimated life of certain trucks to more rapidly depreciate the trucks
18
to their residual values due to the weak used truck market. This change in accounting estimate resulted in additional depreciation expense of $4.1 million in 2016 and $3.4 million in 2017. We completed the sale of these specific trucks in 2017.
In 2015 and 2016, we invested nearly $1 billion of capital expenditures (before sales of equipment) primarily to reduce the average age of our trucks and trailers. Our investment in newer trucks and trailers improves our driver experience, raises operational efficiency and helps us to better manage our maintenance, safety and fuel costs. We intend to maintain our newer fleet age of trucks and trailers. The average age of our company truck fleet was 1.9 years as of December 31, 2017.
Rent and purchased transportation expense decreased $2.7 million or 0.5% in 2017 compared to 2016 and decreased 1.4% as a percentage of operating revenues. Rent and purchased transportation expense consists mostly of payments to third-party capacity providers in the Werner Logistics segment and other non-trucking operations and payments to independent contractors in the Truckload segment. The payments to third-party capacity providers generally vary depending on changes in the volume of services generated by the Werner Logistics segment. Werner Logistics rent and purchased transportation expense increased $9.8 million and increased to 85.1% of Werner Logistics revenues in 2017 from 82.9% in 2016. Tighter carrier capacity in 2017 compared to 2016 resulted in higher purchased transportation costs for our predominantly contractual logistics business, causing the lower gross margin percentages.
Rent and purchased transportation expense for the Truckload segment decreased $12.5 million in 2017 compared to 2016. This decrease is due primarily to lower payments to independent contractors in 2017 compared to 2016, resulting from a 15.6% decrease in independent contractor miles driven in 2017. This decrease was partially offset by higher average diesel fuel prices in 2017, which resulted in higher reimbursement to independent contractors for fuel. Independent contractor miles as a percentage of total miles were 12.1% in 2017 and 14.4% in 2016. Because independent contractors supply their own tractors and drivers and are responsible for their operating expenses, the decrease in independent contractor miles as a percentage of total miles also shifted costs from the rent and purchased transportation category to other expense categories, including (i) salaries, wages and benefits, (ii) fuel, (iii) depreciation, (iv) supplies and maintenance and (v) taxes and licenses.
Challenging operating conditions continue to make independent contractor recruitment and retention difficult. Such conditions include inflationary cost increases that are the responsibility of independent contractors and a shortage of financing available to independent contractors for equipment purchases. Historically, we have been able to add company tractors and recruit additional company drivers to offset any decrease in the number of independent contractors. If a shortage of independent contractors and company drivers occurs, further increases in per-mile settlement rates (for independent contractors) and driver pay rates (for company drivers) may become necessary to attract and retain these drivers. This could negatively affect our results of operations to the extent that we would not be able to obtain corresponding freight rate increases.
Other operating expenses increased $5.5 million in 2017 compared to 2016 and increased 0.3% as a percentage of operating revenues. Gains on sales of assets (primarily used trucks and trailers) are reflected as a reduction of other operating expenses and are reported net of sales-related expenses (which include costs to prepare the equipment for sale). Gains on sales of assets were $6.8 million in 2017, compared to $16.4 million in 2016, which included $10.5 million in real estate gains. In 2017, we sold more trucks and fewer trailers than in 2016. We realized average gains per truck sold in 2017 compared to average losses per truck in 2016, and we realized lower average gains per trailer sold in 2017 compared to 2016. The used truck pricing market remained difficult in 2017 due to a higher than normal supply of used trucks in the market and low buyer demand. Other operating expenses, primarily provision for doubtful accounts related to the driver training schools and professional and consulting fees, were $4.2 million lower in 2017 than in 2016.
Other Expense (Income)
Other expense (income) increased $0.7 million in 2017 compared to 2016 and remained flat as a percentage of operating revenues. Interest income decreased due to lower average outstanding notes receivable, which was partially offset by lower interest expense in 2017 compared to 2016 due to lower average outstanding debt.
Income Tax Expense (Benefit)
Income tax expense (benefit) decreased $106.7 million in 2017 compared to 2016, due primarily to the impact of federal tax law changes. The Tax Cuts and Jobs Act of 2017 (the “Tax Act”), enacted on December 22, 2017, lowered the federal corporate income tax rate to 21% from 35% effective January 1, 2018. We recorded a $110.5 million non-cash reduction in income tax expense in 2017, which resulted from the Company’s revalued net deferred income tax liabilities to reflect the lower federal income tax rate. Our effective income tax rate (income taxes expressed as a percentage of income before income taxes) was -40.4% (income tax benefit) in 2017 and was 37.9% (income tax expense) in 2016. The Company currently estimates its full year 2018 effective income tax rate to be approximately 25% to 26%.
19
2016 Compared to 2015
Operating Revenues
Operating revenues decreased 4.0% in 2016 compared to 2015. When comparing 2016 to 2015, the Truckload segment revenues decreased $110.9 million, or 6.7%, and revenues for the Werner Logistics segment increased $24.0 million, or 6.1%. The lower fuel prices in 2016 compared to 2015 resulted in lower fuel surcharge revenues in the Truckload segment.
2016 was a very challenging freight and rate year for our truckload and logistics business segments. Freight demand in the first half of 2016 was softer than the same periods of 2015 and 2014 but began to show sequential and seasonal improvement in the second half of the year. We believe part of this improvement was industry specific and part was company specific. During June 2016, to take advantage of the strengthening Dedicated market, we moved 150 trucks from One-Way Truckload into Dedicated, lessening the need to find freight for their trucks in the more challenged one-way truckload market. In September 2016, we moved an additional 100 trucks from One-Way Truckload into Dedicated.
The contractual rate market was very challenging in the first half of 2016, particularly in One-Way Truckload. An excess supply of industry trucks relative to sluggish freight demand created a market in which some customers pushed hard and obtained contractual rate decreases. At that time, we chose to exit from certain contractual business that would have required mid-to-high single digit contractual rate decreases for the next year, since we believed that this pricing was not sustainable. Market conditions and competition, however, necessitated agreeing to some flat to slightly lower contractual rates which became effective in the second half of 2016. Gradual improvement in freight volumes and transactional (non-contract) spot market rates in the second half of 2016 began to validate our pricing strategy, and in fourth quarter 2016 contract rates began to stabilize for new contracts.
Trucking revenues, net of fuel surcharge, decreased 3.9% in 2016 compared to 2015 due to a 3.8% decrease in average revenues per tractor per week, net of fuel surcharge revenues. The average number of tractors in service remained about the same in both years. Average miles per truck declined by 3.2% in 2016 compared to 2015, and average revenues per total mile, net of fuel surcharge revenues, decreased 0.6%.
The average number of tractors in service in the Truckload segment remained flat at 7,263 in 2016 compared to 7,271 in 2015. We ended 2016 with 7,100 tractors in the Truckload segment, a year-over-year decrease of 350 trucks. Our Specialized Services unit (formerly comprised of both Dedicated and Temperature Controlled), ended 2016 with 3,760 trucks (or 53% of our total Truckload segment fleet compared to 49% at the end of 2015), and One-Way Truckload ended the year with 3,340 trucks.
Trucking fuel surcharge revenues decreased 26.9% to $155.3 million in 2016 from $212.5 million in 2015 because of lower average fuel prices in 2016.
Werner Logistics revenues were generated by its four operating units and exclude revenues for full truckload shipments transferred to the Truckload segment, which are recorded as trucking revenues by the Truckload segment. Werner Logistics also recorded revenue and brokered freight expense of $1.0 million in 2016 and $1.3 million in 2015 for Intermodal drayage movements performed by the Truckload segment (also recorded as trucking revenues by the Truckload segment), and these transactions between reporting segments are eliminated in consolidation. Werner Logistics revenues increased 6.1% to $417.2 million in 2016 from $393.2 million in 2015. The Werner Logistics gross margin dollars increased 17.0% to $71.4 million in 2016 from $61.0 million in 2015, and the Werner Logistics gross margin percentage improved to 17.1% in 2016 from 15.5% in 2015. The Werner Logistics operating income percentage improved to 5.0% in 2016 from 4.3% in 2015. In 2016, Werner Logistics achieved growth in our truck brokerage and intermodal solutions despite the challenged logistics freight market.
Operating Expenses
Our operating ratio was 93.7% in 2016 compared to 90.4% in 2015. Expense items that impacted the overall operating ratio are described on the following pages. The tables on pages 15 through 16 show the Consolidated Statements of Income in dollars and as a percentage of total operating revenues and the percentage increase or decrease in the dollar amounts of those items compared to the prior year, as well as the operating ratios, operating margins and certain statistical information for our two reportable segments, Truckload and Werner Logistics.
Salaries, wages and benefits decreased $3.8 million or 0.6% in 2016 compared to 2016 but increased 1.1% as a percentage of operating revenues. The lower dollar amount of salaries, wages and benefits expense was due primarily to fewer company trucks and miles in 2016 compared to 2015, partially offset by higher driver mileage pay rates (including a pay increase effective January 1, 2016, for approximately 20% of our company drivers and prior driver pay increases in multiple Dedicated fleets). When evaluated on a per-mile basis, driver and non-driver salaries, wages and benefits increased, which we attribute primarily to 7% higher driver pay per company truck mile in 2016. Non-driver salaries, wages and benefits in the non-trucking Werner Logistics segment increased 20.3% in 2016 compared to 2015.
20
We renewed our workers’ compensation insurance coverage for the policy year beginning April 1, 2016. Our coverage levels are the same as the prior policy year. We continue to maintain a self-insurance retention of $1.0 million per claim. Our workers’ compensation insurance premiums for the policy year beginning April 2016 were similar to those for the previous policy year.
The driver recruiting market remained challenging in 2016. Several ongoing market factors persisted including a declining number of, and increased competition for, driver training school graduates, a low national unemployment rate, aging truck driver demographics and increased truck safety regulations. We took many significant actions in 2016 to strengthen our driver recruiting and retention to make Werner the preferred choice for the best drivers, including raising driver pay, lowering the age of our truck fleet, installing safety and training features on all new trucks, tightening our driver hiring standards and investing in our driver training schools. In 2016, we achieved our lowest driver turnover rate in 17 years.
Fuel decreased $49.5 million or 24.2% in 2016 compared to 2015 and decreased 2.1% as a percentage of operating revenues due to (i) lower average diesel fuel prices, (ii) fewer company trucks and miles and (iii) improved miles per gallon (“mpg”). Average diesel fuel prices in 2016 were 29 cents per gallon lower than in 2015, a 17% decrease.
During 2016, we continued to employ measures to improve our fuel mpg and invest in fuel saving equipment solutions, which were also intended to lessen environmental impact. These measures resulted in an improvement in mpg in 2016 compared to 2015, however, fuel savings from the mpg improvement was partially offset by higher depreciation expense and the additional cost of diesel exhaust fluid.
Supplies and maintenance decreased $18.7 million or 9.8% in 2016 compared to 2015 and decreased 0.6% as a percentage of operating revenues. Repairs and maintenance decreased in 2016 compared to 2015 due to our younger tractor and trailer fleet and fewer company driver miles driven in 2016.
Taxes and licenses decreased $4.1 million or 4.6% in 2016 compared to 2015 and did not change as a percentage of operating revenues. Federal and state diesel fuel taxes were lower in 2016 than in 2015 because of fewer company driver miles and a higher mpg in 2016. An improved mpg results in fewer gallons of diesel fuel purchased and consequently less fuel taxes paid.
Insurance and claims increased $3.0 million or 3.7% in 2016 compared to 2015 and increased 0.3% as a percentage of operating revenues. The increase in 2016 compared to 2015 is primarily the result of unfavorable loss development on prior period large dollar claims. We renewed our liability insurance policies on August 1, 2016, and continued to be responsible for the first $2.0 million per claim with an annual $8.0 million aggregate for claims between $2.0 million and $5.0 million and an annual aggregate of $5.0 million for claims in excess of $5.0 million and less than $10.0 million. Our liability and cargo insurance premiums for the policy year that began August 1, 2016 were about $3.5 million higher than premiums for the previous policy year. The market for excess trucking liability was extremely difficult in 2016 compared to 2015, as insurance carriers had either exited the market or increased premium rates due to the increasing plaintiff awards in the industry.
Depreciation increased $16.5 million or 8.5% in 2016 compared to 2015 and increased 1.2% as a percentage of operating revenues. This expense increase is due primarily to (i) the higher cost of new trucks purchased compared to the cost of used trucks that were sold over the past 12 months, (ii) the purchase of new trailers over the past 12 months to replace older used trailers which were fully depreciated and (iii) a change during fourth quarter 2016 in the estimated life of certain trucks to more rapidly depreciate the trucks to their residual values due to the weak used truck market. The effect of this change in accounting estimate was to increase 2016 depreciation expense by $4.1 million.
Rent and purchased transportation expense increased $31.7 million or 6.6% in 2016 compared to 2015 and increased 2.6% as a percentage of operating revenues. Werner Logistics rent and purchased transportation expense increased $13.6 million, which corresponds to the higher Werner Logistics revenues, but decreased to 82.9% of Werner Logistics revenues in 2016 from 84.5% in 2015. The improved gross margin percentage is the result of on-going efforts to match contractual customer consistent freight with our strategic carrier partners’ capacity and then utilize the available capacity in the market to cover transactional volume.
Rent and purchased transportation expense for the Truckload segment increased $18.3 million in 2016 compared to 2015. This increase is due primarily to higher payments to independent contractors in 2016 compared to 2015, resulting from a November 2015 increase in the per-mile settlement rate for certain independent contractors. This increase was partially offset by lower average diesel fuel prices in 2016, which resulted in lower reimbursement to independent contractors for fuel. Independent contractor miles as a percentage of total miles were 14.4% in 2016 and 11.9% in 2015.
Communications and utilities increased $1.0 million or 6.5% in 2016 compared to 2015 and increased 0.1% as a percentage of operating revenues. The increase is due to higher equipment tracking expenses and higher communication costs in 2016.
Other operating expenses increased $13.8 million in 2016 compared to 2015 and increased 0.7% as a percentage of operating revenues. Gains on sales of assets were $16.4 million in 2016, including $10.5 million from sales of real estate, compared to $23.2
21
million in 2015, which included $0.9 million in real estate gains. In 2016, we sold fewer trucks and more trailers than in 2015 and realized average losses per truck and higher average gains per trailer sold. The used truck pricing market became increasingly difficult as 2016 progressed due to a higher than normal supply of used trucks in the market and low buyer demand. Other operating expenses, primarily provision for doubtful accounts related to the driver training schools and professional and consulting fees, were $7.0 million higher in 2016 than in 2015.
Other Expense (Income)
Other expense (income) decreased $0.7 million in 2016 compared to 2015 and remained flat as a percentage of operating revenues due primarily to higher interest income on notes receivable. Interest expense was higher in 2016 compared to 2015 due to higher average outstanding debt.
Income Taxes
Our effective income tax rate (income taxes expressed as a percentage of income before income taxes) decreased to 37.9% for 2016 from 38.5% in 2015. The lower income tax rate in 2016 is primarily attributed to favorable tax adjustments for the remeasurement of uncertain tax positions in 2016.
Liquidity and Capital Resources:
During the year ended December 31, 2017, we generated cash flow from operations of $281.8 million, a 9.8% decrease ($30.6 million), compared to the year ended December 31, 2016. This decrease in net cash provided by operating activities is attributed primarily to a $32.5 million decrease in cash flows related to accounts receivable due in part to extended payment terms with customers and growth in revenues in the latter part of 2017 not yet collected from customers. Cash flow from operations decreased $58.0 million in 2016 from 2015, or 15.7%. This decrease is attributed primarily to a $44.6 million decrease in net income and a $15.4 million decrease from general working capital activities (including accounts receivable and accounts payable). We were able to make net capital expenditures, repay debt, and pay dividends with the net cash provided by operating activities and existing cash balances.
Net cash used in investing activities decreased by $226.4 million to $183.8 million in 2017 from $410.3 million in 2016 and increased by $74.7 million in 2016 from $335.5 million in 2015. Net property additions (primarily revenue equipment) were $198.8 million for the year ended December 31, 2017, compared to $429.6 million during the same period of 2016 and $351.5 million during 2015. This decrease occurred after we completed a significant reinvestment in our tractor and trailer fleet in 2015 and 2016. As of December 31, 2017, we were committed to property and equipment purchases of approximately $185.3 million. We currently estimate net capital expenditures (primarily revenue equipment) in 2018 to be in the range of $300.0 million to $350.0 million. This range allows for increased investment in our tractor and trailer fleet as a result of the changes to federal income tax laws.
Net financing activities used $101.4 million in 2017, provided $83.4 million in 2016 and used $25.0 million in 2015. During the year ended December 31, 2017, we repaid $105.0 million of debt. Our outstanding debt at December 31, 2017 totaled $75.0 million. During 2016, we borrowed $165.0 million of debt and repaid $60.0 million of debt, and in 2015, we borrowed and repaid $10.0 million of debt. We also made a $3.1 million note payment in both 2016 and 2015. We paid quarterly dividends of $18.8 million in 2017, $17.3 million in 2016 and $15.1 million in 2015. We increased our quarterly dividend rate by $0.01 per share, or 17%, beginning with the dividend paid in July 2017, and we increased our quarterly dividend rate by $0.01 per share, or 20%, beginning with the dividend paid in October 2015. We did not repurchase any common stock in 2017 or 2016; however, financing activities for 2015 included common stock repurchases of 225,000 shares at a cost of $6.4 million. From time to time, the Company has repurchased, and may continue to repurchase, shares of the Company’s common stock. The timing and amount of such purchases depends on stock market conditions and other factors. As of December 31, 2017, the Company had purchased 3,287,291 shares pursuant to our current Board of Directors repurchase authorization and had 4,712,709 shares remaining available for repurchase.
Management believes our financial position at December 31, 2017 is strong. As of December 31, 2017, we had $75.0 million of debt outstanding and over $1.1 billion of stockholders’ equity. As of December 31, 2017, we had a total of $325.0 million of credit pursuant to three credit facilities (see Note 2 in the Notes to Consolidated Financial Statements under Item 8 of Part II of this Form 10-K for information regarding our credit agreements as of December 31, 2017), of which we had borrowed $75.0 million. The remaining $250.0 million of credit available under these facilities at December 31, 2017 is reduced by the $39.6 million in stand-by letters of credit under which we are obligated. These stand-by letters of credit are primarily required as security for insurance policies. Based on our strong financial position, management does not foresee any significant barriers to obtaining sufficient financing, if necessary.
22
Contractual Obligations and Commercial Commitments:
The following table sets forth our contractual obligations and commercial commitments as of December 31, 2017.
Payments Due by Period
(Amounts in millions) | Total | Less than 1 year (2018) | 1-3 years (2019-2020) | 3-5 years (2021-2022) | More than 5 years (After 2022) | Period Unknown | ||||||||||||||||||
Contractual Obligations | ||||||||||||||||||||||||
Unrecognized tax benefits | $ | 2.9 | $ | — | $ | — | $ | — | $ | — | $ | 2.9 | ||||||||||||
Long-term debt, including current maturities | 75.0 | — | 75.0 | — | — | — | ||||||||||||||||||
Interest payments on debt | 3.2 | 1.9 | 1.3 | — | — | — | ||||||||||||||||||
Property and equipment purchase commitments | 185.3 | 185.3 | — | — | — | — | ||||||||||||||||||
Total contractual cash obligations | $ | 266.4 | $ | 187.2 | $ | 76.3 | $ | — | $ | — | $ | 2.9 | ||||||||||||
Other Commercial Commitments | ||||||||||||||||||||||||
Unused lines of credit | $ | 210.4 | $ | — | $ | 210.4 | $ | — | $ | — | $ | — | ||||||||||||
Stand-by letters of credit | 39.6 | 39.6 | — | — | — | — | ||||||||||||||||||
Total commercial commitments | $ | 250.0 | $ | 39.6 | $ | 210.4 | $ | — | $ | — | $ | — | ||||||||||||
Total obligations | $ | 516.4 | $ | 226.8 | $ | 286.7 | $ | — | $ | — | $ | 2.9 | ||||||||||||
As of December 31, 2017, we had unsecured committed credit facilities with three banks as well as a term commitment with one of these banks. We had with Wells Fargo Bank, N.A., a $100 million credit facility which will expire on July 12, 2020, and a $75 million term commitment with principal due and payable on September 15, 2019. We had an unsecured line of credit of $75 million with U.S. Bank, N.A., which will expire on July 13, 2020. We also had a $75 million credit facility with BMO Harris Bank, N.A., which will expire on March 5, 2020. Borrowings under these credit facilities and term note bear variable interest based on the London Interbank Offered Rate (“LIBOR”). As of December 31, 2017, we had $75 million outstanding under the term commitment at a variable rate of 2.08%, which is effectively fixed at 2.5% with an interest rate swap agreement. Interest payments on debt are based on the debt balance and interest rate at December 31, 2017. The borrowing capacity under these credit facilities is further reduced by the amount of stand-by letters of credit under which we are obligated. The stand-by letters of credit are primarily required for insurance policies. The unused lines of credit are available to us in the event we need financing for the replacement of our fleet or for other significant capital expenditures. Management believes our financial position is strong, and we therefore expect that we could obtain additional financing, if necessary. Property and equipment purchase commitments relate to committed equipment expenditures, primarily for revenue equipment. As of December 31, 2017, we had recorded a $2.9 million liability for unrecognized tax benefits. We are unable to reasonably determine when the $2.9 million categorized as “period unknown” will be settled.
Off-Balance Sheet Arrangements:
In 2017, we did not have any non-cancelable revenue equipment operating leases or other arrangements that meet the definition of an off-balance sheet arrangement.
Critical Accounting Policies and Estimates:
The preparation of consolidated financial statements in conformity with accounting principles generally accepted in the United States of America requires us to make estimates and assumptions that affect the (i) reported amount of assets and liabilities and disclosure of contingent assets and liabilities at the date of the consolidated financial statements and (ii) reported amounts of revenues and expenses during the reporting period. We evaluate these estimates on an ongoing basis as events and circumstances change, utilizing historical experience, consultation with experts and other methods considered reasonable in the particular circumstances. Actual results could differ from those estimates and may significantly impact our results of operations from period to period. It is also possible that materially different amounts would be reported if we used different estimates or assumptions.
23
The most critical accounting policies and estimates that require us to make significant judgments and estimates and affect our financial statements include the following:
• | Depreciation and impairment of tractors and trailers. We operate a significant number of tractors and trailers in connection with our business and must select estimated useful lives and salvage values for calculating depreciation. Depreciable lives of tractors and trailers range from 80 months to 12 years. Estimates of salvage value at the expected date of trade-in or sale are based on the expected market values of equipment at the time of disposal. We consider our experience with similar assets, conditions in the used revenue equipment market and operational information such as average annual miles. We believe that these methods properly spread the costs over the useful life of the assets. We continually monitor the adequacy of the lives and salvage values used in calculating depreciation expense and adjust these assumptions appropriately when warranted. We review our long-lived assets for impairment whenever events or circumstances indicate the carrying amount of a long-lived asset may not be recoverable. An impairment loss would be recognized if the carrying amount of the long-lived asset is not recoverable and the carrying amount exceeds its fair value. |
• | Estimates of accrued liabilities for insurance and claims for liability and physical damage losses and workers’ compensation. The insurance and claims accruals (current and non-current) are recorded at the estimated ultimate payment amounts and are based upon individual case estimates (including negative development) and estimates of incurred-but-not-reported losses using loss development factors based upon past experience. An actuary reviews our undiscounted self-insurance reserves for bodily injury and property damage claims and workers’ compensation claims at year-end. The actual cost to settle our self-insured claim liabilities can differ from our reserve estimates because of a number of uncertainties, including the inherent difficulty in estimating the severity of a claim and the potential amount to defend and settle a claim. |
• | Accounting for income taxes. Significant management judgment is required to determine (i) the provision for income taxes, (ii) whether deferred income taxes will be realized in full or in part and (iii) the liability for unrecognized tax benefits related to uncertain tax positions. Deferred income tax assets and liabilities are measured using enacted tax rates that are expected to apply to taxable income in the years when those temporary differences are expected to be recovered or settled. When it is more likely that all or some portion of specific deferred income tax assets will not be realized, a valuation allowance must be established for the amount of deferred income tax assets that are determined not to be realizable. On December 22, 2017, the Tax Act was enacted, which lowered the federal corporate income tax rate to 21% from 35% effective January 1, 2018. In accordance with the SEC’s Staff Accounting Bulletin No. 118, the Company has recognized the provisional tax impact related to the revaluation of deferred income tax assets and liabilities and included the amount in its consolidated financial statements for the year ended December 31, 2017. The ultimate impact may differ from the provisional amount due to, among other things, additional analysis, changes in interpretations and assumptions the Company has made, and additional regulatory guidance that may be issued. The accounting is expected to be completed when the Company’s 2017 income tax returns are filed later in 2018. We believe that we have adequately provided for our future tax consequences based upon current facts and circumstances and current tax law. However, should our positions be challenged, different outcomes could result and have a significant impact on our results of operations. |
Inflation:
Inflation may impact our operating costs. A prolonged inflation period could cause rises in interest rates, fuel, wages and other costs. These inflationary increases could adversely affect our results of operations unless freight rates could be increased correspondingly. However, the effect of inflation has been minimal over the past three years.
ITEM 7A. | QUANTITATIVE AND QUALITATIVE DISCLOSURES ABOUT MARKET RISK |
We are exposed to market risk from changes in interest rates, commodity prices and foreign currency exchange rates.
Commodity Price Risk
The price and availability of diesel fuel are subject to fluctuations attributed to changes in the level of global oil production, refining capacity, seasonality, weather and other market factors. Historically, we have recovered a majority, but not all, of fuel price increases from customers in the form of fuel surcharges. We implemented customer fuel surcharge programs with most of our customers to offset much of the higher fuel cost per gallon. However, we do not recover all of the fuel cost increase through these surcharge programs. We cannot predict the extent to which fuel prices will increase or decrease in the future or the extent to which fuel surcharges could be collected. As of December 31, 2017, we had no derivative financial instruments to reduce our exposure to fuel price fluctuations.
Foreign Currency Exchange Rate Risk
We conduct business in several foreign countries, including Mexico, Canada, China and Australia. To date, most foreign revenues are denominated in U.S. Dollars, and we receive payment for foreign freight services primarily in U.S. Dollars to reduce direct
24
foreign currency risk. Assets and liabilities maintained by a foreign subsidiary company in the local currency are subject to foreign exchange gains or losses. Foreign currency translation gains and losses primarily relate to changes in the value of revenue equipment owned by a subsidiary in Mexico, whose functional currency is the Peso. Foreign currency translation gains were $0.5 million in 2017, and foreign currency translation losses were $4.2 million in 2016 and $3.9 million in 2015, and were recorded in accumulated other comprehensive loss within stockholders’ equity in the Consolidated Balance Sheets. The exchange rate between the Mexican Peso and the U.S. Dollar was 19.74 Pesos to $1.00 at December 31, 2017 compared to 20.66 Pesos to $1.00 at December 31, 2016 and 17.21 Pesos to $1.00 at December 31, 2015.
Interest Rate Risk
We manage interest rate exposure through a mix of variable rate debt and interest rate swap agreements. We had $75.0 million of debt outstanding at December 31, 2017, for which the interest rate is effectively fixed at 2.5% through September 2019 with an interest rate swap agreement. Interest rates on our unused credit facilities are based on the LIBOR (see Contractual Obligations and Commercial Commitments). Increases in interest rates could impact our annual interest expense on future borrowings. As of December 31, 2017, we had one effective interest rate swap agreement with a notional amount of $75.0 million to reduce our exposure to interest rate increases.
25
ITEM 8. | FINANCIAL STATEMENTS AND SUPPLEMENTARY DATA |
REPORT OF INDEPENDENT REGISTERED PUBLIC ACCOUNTING FIRM
The Board of Directors and Stockholders
Werner Enterprises, Inc.:
Opinion on the Consolidated Financial Statements
We have audited the accompanying consolidated balance sheets of Werner Enterprises, Inc. and subsidiaries (the Company) as of December 31, 2017 and 2016, and the related consolidated statements of income, comprehensive income, stockholders’ equity, and cash flows for each of the years in the three‑year period ended December 31, 2017, and the related notes and financial statement schedule II listed in the Index in Item 15(a)(2) (collectively, the consolidated financial statements). In our opinion, the consolidated financial statements present fairly, in all material respects, the financial position of the Company as of December 31, 2017 and 2016, and the results of its operations and its cash flows for each of the years in the three-year period ended December 31, 2017, in conformity with U.S. generally accepted accounting principles.
We also have audited, in accordance with standards of the Public Company Accounting Oversight Board (United States) (PCAOB), the Company’s internal control over financial reporting as of December 31, 2017, based on criteria established in Internal Control - Integrated Framework (2013) issued by the Committee of Sponsoring Organizations of the Treadway Commission (COSO), and our report dated February 27, 2018, expressed an unqualified opinion on the effectiveness of the Company’s internal control over financial reporting.
Basis for Opinion
These consolidated financial statements are the responsibility of the Company’s management. Our responsibility is to express an opinion on these consolidated financial statements based on our audits. We are a public accounting firm registered with the PCAOB and are required to be independent with respect to the Company in accordance with the U.S. federal securities laws and the applicable rules and regulations of the Securities and Exchange Commission and the PCAOB.
We conducted our audits in accordance with the standards of the PCAOB. Those standards require that we plan and perform the audit to obtain reasonable assurance about whether the consolidated financial statements are free of material misstatement, whether due to error or fraud. Our audits included performing procedures to assess the risks of material misstatement of the consolidated financial statements, whether due to error or fraud, and performing procedures that respond to those risks. Such procedures included examining, on a test basis, evidence regarding amounts and disclosures in the consolidated financial statements. Our audits also included evaluating the overall presentation of the consolidated financial statements. We believe that our audits provide a reasonable basis for our opinion.
/s/ KPMG LLP
We have served as the Company’s auditor since 1999.
Omaha, Nebraska
February 27, 2018
26
WERNER ENTERPRISES, INC.
CONSOLIDATED STATEMENTS OF INCOME
Years Ended December 31, | |||||||||||
(In thousands, except per share amounts) | 2017 | 2016 | 2015 | ||||||||
Operating revenues | $ | 2,116,737 | $ | 2,008,991 | $ | 2,093,529 | |||||
Operating expenses: | |||||||||||
Salaries, wages and benefits | 681,547 | 636,112 | 639,908 | ||||||||
Fuel | 198,745 | 155,042 | 204,583 | ||||||||
Supplies and maintenance | 164,325 | 171,397 | 190,114 | ||||||||
Taxes and licenses | 86,768 | 85,547 | 89,646 | ||||||||
Insurance and claims | 79,927 | 83,866 | 80,848 | ||||||||
Depreciation | 217,639 | 209,728 | 193,209 | ||||||||
Rent and purchased transportation | 509,573 | 512,296 | 480,624 | ||||||||
Communications and utilities | 16,105 | 16,106 | 15,121 | ||||||||
Other | 18,288 | 12,827 | (980 | ) | |||||||
Total operating expenses | 1,972,917 | 1,882,921 | 1,893,073 | ||||||||
Operating income | 143,820 | 126,070 | 200,456 | ||||||||
Other expense (income): | |||||||||||
Interest expense | 2,243 | 2,577 | 1,974 | ||||||||
Interest income | (3,308 | ) | (4,158 | ) | (2,875 | ) | |||||
Other | 328 | 191 | 196 | ||||||||
Total other income | (737 | ) | (1,390 | ) | (705 | ) | |||||
Income before income taxes | 144,557 | 127,460 | 201,161 | ||||||||
Income tax expense (benefit) | (58,332 | ) | 48,331 | 77,447 | |||||||
Net income | $ | 202,889 | $ | 79,129 | $ | 123,714 | |||||
Earnings per share: | |||||||||||
Basic | $ | 2.81 | $ | 1.10 | $ | 1.72 | |||||
Diluted | $ | 2.80 | $ | 1.09 | $ | 1.71 | |||||
Weighted-average common shares outstanding: | |||||||||||
Basic | 72,270 | 72,057 | 71,957 | ||||||||
Diluted | 72,558 | 72,393 | 72,556 | ||||||||
See Notes to Consolidated Financial Statements.
27
WERNER ENTERPRISES, INC.
CONSOLIDATED STATEMENTS OF COMPREHENSIVE INCOME
Years Ended December 31, | |||||||||||
(In thousands) | 2017 | 2016 | 2015 | ||||||||
Net income | $ | 202,889 | $ | 79,129 | $ | 123,714 | |||||
Other comprehensive income (loss): | |||||||||||
Foreign currency translation adjustments | 483 | (4,191 | ) | (3,930 | ) | ||||||
Change in fair value of interest rate swap | 599 | 337 | 242 | ||||||||
Other comprehensive income (loss) | 1,082 | (3,854 | ) | (3,688 | ) | ||||||
Comprehensive income | $ | 203,971 | $ | 75,275 | $ | 120,026 | |||||
See Notes to Consolidated Financial Statements.
28
WERNER ENTERPRISES, INC.
CONSOLIDATED BALANCE SHEETS
December 31, | |||||||
(In thousands, except share amounts) | 2017 | 2016 | |||||
ASSETS | |||||||
Current assets: | |||||||
Cash and cash equivalents | $ | 13,626 | $ | 16,962 | |||
Accounts receivable, trade, less allowance of $8,250 and $9,183, respectively | 304,174 | 261,372 | |||||
Other receivables | 26,491 | 15,168 | |||||
Inventories and supplies | 11,694 | 12,768 | |||||
Prepaid taxes, licenses and permits | 15,972 | 15,374 | |||||
Income taxes receivable | 1,189 | 21,497 | |||||
Other current assets | 27,083 | 29,987 | |||||
Total current assets | 400,229 | 373,128 | |||||
Property and equipment, at cost: | |||||||
Land | 56,300 | 56,261 | |||||
Buildings and improvements | 171,619 | 148,443 | |||||
Revenue equipment | 1,630,344 | 1,676,070 | |||||
Service equipment and other | 256,074 | 229,217 | |||||
Total property and equipment | 2,114,337 | 2,109,991 | |||||
Less – accumulated depreciation | 767,474 | 747,353 | |||||
Property and equipment, net | 1,346,863 | 1,362,638 | |||||
Other non-current assets | 60,899 | 57,237 | |||||
Total assets | $ | 1,807,991 | $ | 1,793,003 | |||
LIABILITIES AND STOCKHOLDERS’ EQUITY | |||||||
Current liabilities: | |||||||
Checks issued in excess of cash balances | $ | 21,539 | $ | — | |||
Accounts payable | 73,802 | 66,618 | |||||
Current portion of long-term debt | — | 20,000 | |||||
Insurance and claims accruals | 79,674 | 83,404 | |||||
Accrued payroll | 32,520 | 26,189 | |||||
Other current liabilities | 24,642 | 18,650 | |||||
Total current liabilities | 232,177 | 214,861 | |||||
Long-term debt, net of current portion | 75,000 | 160,000 | |||||
Other long-term liabilities | 12,575 | 16,711 | |||||
Insurance and claims accruals, net of current portion | 108,270 | 113,875 | |||||
Deferred income taxes | 195,187 | 292,769 | |||||
Commitments and contingencies | |||||||
Stockholders’ equity: | |||||||
Common stock, $0.01 par value, 200,000,000 shares authorized; 80,533,536 shares | |||||||
issued; 72,409,222 and 72,166,969 shares outstanding, respectively | 805 | 805 | |||||
Paid-in capital | 102,563 | 101,035 | |||||
Retained earnings | 1,267,871 | 1,084,796 | |||||
Accumulated other comprehensive loss | (15,835 | ) | (16,917 | ) | |||
Treasury stock, at cost; 8,124,314 and 8,366,567 shares, respectively | (170,622 | ) | (174,932 | ) | |||
Total stockholders’ equity | 1,184,782 | 994,787 | |||||
Total liabilities and stockholders’ equity | $ | 1,807,991 | $ | 1,793,003 | |||
29
WERNER ENTERPRISES, INC.
CONSOLIDATED STATEMENTS OF CASH FLOWS
Years Ended December 31, | |||||||||||
(In thousands) | 2017 | 2016 | 2015 | ||||||||
Cash flows from operating activities: | |||||||||||
Net income | $ | 202,889 | $ | 79,129 | $ | 123,714 | |||||
Adjustments to reconcile net income to net cash provided by operating activities: | |||||||||||
Depreciation | 217,639 | 209,728 | 193,209 | ||||||||
Deferred income taxes | (100,948 | ) | 44,632 | 38,442 | |||||||
Gain on disposal of property and equipment | (6,798 | ) | (16,432 | ) | (23,240 | ) | |||||
Non-cash equity compensation | 4,546 | 2,381 | 4,361 | ||||||||
Insurance and claims accruals, net of current portion | (5,605 | ) | (11,320 | ) | 1,750 | ||||||
Other | (11,957 | ) | (3,370 | ) | 9,103 | ||||||
Changes in certain working capital items: | |||||||||||
Accounts receivable, net | (42,802 | ) | (10,349 | ) | 15,704 | ||||||
Other current assets | 19,183 | 4,979 | 9,455 | ||||||||
Accounts payable | 5,831 | (5,272 | ) | 7,256 | |||||||
Other current liabilities | (140 | ) | 18,291 | (9,362 | ) | ||||||
Net cash provided by operating activities | 281,838 | 312,397 | 370,392 | ||||||||
Cash flows from investing activities: | |||||||||||
Additions to property and equipment | (316,343 | ) | (537,838 | ) | (454,097 | ) | |||||
Proceeds from sales of property and equipment | 117,498 | 108,231 | 102,614 | ||||||||
Decrease in notes receivable | 20,037 | 19,353 | 19,517 | ||||||||
Issuance of notes receivable | (5,000 | ) | — | — | |||||||
Other | — | — | (3,580 | ) | |||||||
Net cash used in investing activities | (183,808 | ) | (410,254 | ) | (335,546 | ) | |||||
Cash flows from financing activities: | |||||||||||
Repayments of short-term debt | (45,000 | ) | (20,000 | ) | (10,000 | ) | |||||
Proceeds from issuance of short-term debt | — | 40,000 | 10,000 | ||||||||
Repayments of long-term debt | (60,000 | ) | (40,000 | ) | — | ||||||
Proceeds from issuance of long-term debt | — | 125,000 | — | ||||||||
Payment of notes payable | — | (3,117 | ) | (3,117 | ) | ||||||
Change in net checks issued in excess of cash balance | 21,539 | — | — | ||||||||
Dividends on common stock | (18,784 | ) | (17,289 | ) | (15,115 | ) | |||||
Repurchases of common stock | — | — | (6,438 | ) | |||||||
Tax withholding related to net share settlements of restricted stock awards | (1,632 | ) | (1,832 | ) | (1,724 | ) | |||||
Stock options exercised | 2,461 | 370 | 846 | ||||||||
Excess tax benefits from equity compensation | — | 238 | 556 | ||||||||
Net cash provided by (used in) financing activities | (101,416 | ) | 83,370 | (24,992 | ) | ||||||
Effect of exchange rate fluctuations on cash | 50 | (384 | ) | (625 | ) | ||||||
Net increase (decrease) in cash and cash equivalents | (3,336 | ) | (14,871 | ) | 9,229 | ||||||
Cash and cash equivalents, beginning of period | 16,962 | 31,833 | 22,604 | ||||||||
Cash and cash equivalents, end of period | $ | 13,626 | $ | 16,962 | $ | 31,833 | |||||
Supplemental disclosures of cash flow information: | |||||||||||
Interest paid | $ | 2,491 | $ | 2,470 | $ | 1,978 | |||||
Income taxes paid | 22,088 | 4,673 | 35,205 | ||||||||
Supplemental schedule of non-cash investing activities: | |||||||||||
Notes receivable issued upon sale of property and equipment | $ | 5,816 | $ | 25,449 | $ | 36,060 | |||||
Change in fair value of interest rate swap | 599 | 337 | 242 | ||||||||
Property and equipment acquired included in accounts payable | 3,227 | 1,874 | 627 | ||||||||
Property and equipment disposed included in other receivables | 654 | 155 | 21 | ||||||||
30
WERNER ENTERPRISES, INC.
CONSOLIDATED STATEMENTS OF STOCKHOLDERS’ EQUITY
(In thousands, except share and per share amounts) | Common Stock | Paid-In Capital | Retained Earnings | Accumulated Other Comprehensive Income (Loss) | Treasury Stock | Total Stockholders’ Equity | |||||||||||||||||
BALANCE, December 31, 2014 | $ | 805 | $ | 101,803 | $ | 915,085 | $ | (9,375 | ) | $ | (174,458 | ) | $ | 833,860 | |||||||||
Comprehensive income | — | — | 123,714 | (3,688 | ) | — | 120,026 | ||||||||||||||||
Purchases of 225,000 shares of common stock | — | — | — | — | (6,438 | ) | (6,438 | ) | |||||||||||||||
Dividends on common stock ($0.22 per share) | — | — | (15,833 | ) | — | — | (15,833 | ) | |||||||||||||||
Equity compensation activity, 185,382 shares, including excess tax benefits | — | (3,430 | ) | — | — | 3,108 | (322 | ) | |||||||||||||||
Non-cash equity compensation expense | — | 4,361 | — | — | — | 4,361 | |||||||||||||||||
BALANCE, December 31, 2015 | 805 | 102,734 | 1,022,966 | (13,063 | ) | (177,788 | ) | 935,654 | |||||||||||||||
Comprehensive income | — | — | 79,129 | (3,854 | ) | — | 75,275 | ||||||||||||||||
Dividends on common stock ($0.24 per share) | — | — | (17,299 | ) | — | — | (17,299 | ) | |||||||||||||||
Equity compensation activity, 168,219 shares, including excess tax benefits | — | (4,080 | ) | — | — | 2,856 | (1,224 | ) | |||||||||||||||
Non-cash equity compensation expense | — | 2,381 | — | — | — | 2,381 | |||||||||||||||||
BALANCE, December 31, 2016 | 805 | 101,035 | 1,084,796 | (16,917 | ) | (174,932 | ) | 994,787 | |||||||||||||||
Comprehensive income | — | — | 202,889 | 1,082 | — | 203,971 | |||||||||||||||||
Dividends on common stock ($0.27 per share) | — | — | (19,523 | ) | — | — | (19,523 | ) | |||||||||||||||
Equity compensation activity, 242,253 shares | — | (3,481 | ) | — | — | 4,310 | 829 | ||||||||||||||||
Non-cash equity compensation expense | — | 4,546 | — | — | — | 4,546 | |||||||||||||||||
Adoption of ASU 2016-09 | — | 463 | (291 | ) | — | — | 172 | ||||||||||||||||
BALANCE, December 31, 2017 | $ | 805 | $ | 102,563 | $ | 1,267,871 | $ | (15,835 | ) | $ | (170,622 | ) | $ | 1,184,782 | |||||||||
See Notes to Consolidated Financial Statements.
31
WERNER ENTERPRISES, INC.
NOTES TO CONSOLIDATED FINANCIAL STATEMENTS
(1) SUMMARY OF SIGNIFICANT ACCOUNTING POLICIES
Nature of Business: Werner Enterprises, Inc. (the “Company”) is a truckload transportation and logistics company operating under the jurisdiction of the U.S. Department of Transportation, similar governmental transportation agencies in the foreign countries in which we operate and various U.S. state regulatory authorities. For the years ended December 31, 2017, 2016 and 2015, our ten largest customers comprised 43%, 43% and 45%, respectively, of our revenues. No single customer generated more than 8% of the Company’s total revenues in 2017, 2016, and 2015.
Principles of Consolidation: The accompanying consolidated financial statements include the accounts of Werner Enterprises, Inc. and our majority-owned subsidiaries. All significant intercompany accounts and transactions relating to these majority-owned entities have been eliminated.
Use of Management Estimates: The preparation of consolidated financial statements in conformity with accounting principles generally accepted in the United States of America requires management to make estimates and assumptions that affect the (i) reported amounts of assets and liabilities and disclosure of contingent assets and liabilities at the date of the consolidated financial statements and (ii) reported amounts of revenues and expenses during the reporting period. The most significant estimates that affect our financial statements include the useful lives and salvage values of property and equipment, accrued liabilities for insurance and claims, estimates for income taxes and the allowance for doubtful accounts. Actual results could differ from those estimates.
Cash and Cash Equivalents: We consider all highly liquid investments, purchased with a maturity of three months or less, to be cash equivalents. Accounts at banks with an aggregate excess of the amount of checks issued over cash balances are included in current liabilities in the Consolidated Balance Sheets, and changes in such accounts are reported as a financing activity in the Consolidated Statements of Cash Flows.
Trade Accounts Receivable: We record trade accounts receivable at the invoiced amounts, net of an allowance for doubtful accounts. The allowance for doubtful accounts is our estimate of the amount of probable credit losses and revenue adjustments in our existing accounts receivable. We review the financial condition of customers for granting credit and determine the allowance based on analysis of individual customers’ financial condition, historical write-off experience and national economic conditions. We evaluate the adequacy of our allowance for doubtful accounts quarterly. Past due balances over 90 days and exceeding a specified amount are reviewed individually for collectibility. Account balances are charged off against the allowance after all means of collection have been exhausted and the potential for recovery is considered remote. We do not have any off-balance-sheet credit exposure related to our customers.
Inventories and Supplies: Inventories and supplies are stated at the lower of average cost and net realizable value and consist primarily of revenue equipment parts, tires, fuel and supplies. Tires placed on new revenue equipment are capitalized as a part of the equipment cost. Replacement tires are expensed when placed in service.
Property, Equipment, and Depreciation: Additions and improvements to property and equipment are capitalized at cost, while maintenance and repair expenditures are charged to operations as incurred. Gains and losses on the sale or exchange of equipment are recorded in other operating expenses.
Depreciation is calculated based on the cost of the asset, reduced by the asset’s estimated salvage value, using the straight-line method. Accelerated depreciation methods are used for income tax purposes. The lives and salvage values assigned to certain assets for financial reporting purposes are different than for income tax purposes. For financial reporting purposes, assets are generally depreciated using the following estimated useful lives and salvage values:
Lives | Salvage Values | |||
Building and improvements | 30 years | 0% | ||
Tractors | 80 months | 0% | ||
Trailers | 12 years | $1,000 | ||
Service and other equipment | 3-10 years | 0% | ||
During fourth quarter 2016, due to the weak used truck market, we reduced the estimated life of certain trucks to more rapidly depreciate the trucks to their residual values. The effect of this change in accounting estimate was to (i) increase 2016 depreciation expense and decrease operating income by $4.1 million and (ii) increase 2017 depreciation expense and decrease operating income by $3.4 million. We completed the sale of these specific trucks in 2017.
32
Long-Lived Assets: We review our long-lived assets for impairment whenever events or circumstances indicate the carrying amount of a long-lived asset may not be recoverable. An impairment loss would be recognized if the carrying amount of the long-lived asset is not recoverable and the carrying amount exceeds its fair value. For long-lived assets classified as held and used, the carrying amount is not recoverable when the carrying value of the long-lived asset exceeds the sum of the future net cash flows. We do not separately identify assets by operating segment because tractors and trailers are routinely transferred from one operating fleet to another. As a result, none of our long-lived assets have identifiable cash flows from use that are largely independent of the cash flows of other assets and liabilities. Thus, the asset group used to assess impairment would include all of our assets.
Insurance and Claims Accruals: Insurance and claims accruals (both current and non-current) reflect the estimated cost (including estimated loss development and loss adjustment expenses) for (i) cargo loss and damage, (ii) bodily injury and property damage, (iii) group health and (iv) workers’ compensation claims not covered by insurance. The costs for cargo, bodily injury and property damage insurance and claims are included in insurance and claims expense in the Consolidated Statements of Income; the costs of group health and workers’ compensation claims are included in salaries, wages and benefits expense. The insurance and claims accruals are recorded at the estimated ultimate payment amounts. Such insurance and claims accruals are based upon individual case estimates (including negative development) and estimates of incurred-but-not-reported losses using loss development factors based upon past experience. Actual costs related to insurance and claims have not differed materially from estimated accrued amounts for all years presented. An actuary reviews our undiscounted self-insurance reserves for bodily injury and property damage claims and workers’ compensation claims at year-end.
We renewed our liability insurance policies on August 1, 2017, and effective on that date, our self-insured retention (“SIR”) and deductible amount is $3.0 million, plus administrative expenses, for each occurrence involving bodily injury or property damage, with an additional $5.0 million deductible per claim for each claim between $5.0 million and $10.0 million. Our SIR/deductible was $2.0 million for policy years since August 1, 2004. We are also responsible for varying annual aggregate amounts of liability for claims in excess of the SIR/deductible (see page 10). Liability claims in excess of these aggregates are covered under premium-based policies (issued by insurance companies) to coverage levels that our management considers adequate. We are also responsible for administrative expenses for each occurrence involving bodily injury or property damage.
Our SIR for workers’ compensation claims is $1.0 million per claim, with premium-based insurance coverage for claims exceeding this amount. We also maintain a $26.6 million bond for the State of Nebraska and a $6.9 million bond for our workers’ compensation insurance carrier.
Under these insurance arrangements, we maintained $39.6 million in letters of credit as of December 31, 2017.
Revenue Recognition: The Consolidated Statements of Income reflect recognition of operating revenues (including fuel surcharge revenues) and related direct costs when the shipment is delivered. For shipments where a third-party capacity provider (including independent contractors under contract with us) is utilized to provide some or all of the service and we (i) are the primary obligor in regard to the shipment delivery, (ii) establish customer pricing separately from carrier rate negotiations, (iii) generally have discretion in carrier selection and/or (iv) have credit risk on the shipment, we record both revenues for the dollar value of services we bill to the customer and rent and purchased transportation expense for transportation costs we pay to the third-party provider upon the shipment’s delivery. In the absence of the conditions listed above, we record revenues net of those expenses related to third-party providers.
Foreign Currency Translation: Local currencies are generally considered the functional currencies outside the United States. Assets and liabilities are translated at year-end exchange rates for operations in local currency environments. Foreign revenues and expense items denominated in the functional currency are translated at the average rates of exchange prevailing during the year. Foreign currency translation adjustments reflect the changes in foreign currency exchange rates applicable to the net assets of the foreign operations. Foreign currency translation adjustments are recorded in accumulated other comprehensive loss within stockholders’ equity in the Consolidated Balance Sheets and as a separate component of comprehensive income in the Consolidated Statements of Comprehensive Income.
Income Taxes: Deferred income tax assets and liabilities are recognized for the future tax consequences attributable to temporary differences between the financial statement carrying amounts of existing assets and liabilities and their respective tax bases. Deferred income tax assets and liabilities are measured using the enacted tax rates that are expected to apply to taxable income in the years in which those temporary differences are expected to be recovered or settled. The effect on deferred income tax assets and liabilities of a change in tax rates is recognized in income in the period that includes the enactment date.
In accounting for uncertain tax positions, we recognize the tax benefit from an uncertain tax position only if it is more likely than not that the tax position will be sustained on examination by the taxing authorities, based on the technical merits of the position. The tax benefits recognized in the financial statements from such a position are measured based on the largest benefit that has a greater than 50% likelihood of being realized upon ultimate settlement. We recognize interest and penalties directly related to income tax matters in income tax expense.
33
Common Stock and Earnings Per Share: Basic earnings per share is computed by dividing net income by the weighted average number of common shares outstanding during the period. Diluted earnings per share is computed by dividing net income by the weighted average number of common shares outstanding plus the effect of dilutive potential common shares outstanding during the period using the treasury stock method. Dilutive potential common shares include outstanding stock options and restricted stock awards. There are no differences in the numerators of our computations of basic and diluted earnings per share for any periods presented. The computation of basic and diluted earnings per share is shown below (in thousands, except per share amounts).
Years Ended December 31, | |||||||||||
2017 | 2016 | 2015 | |||||||||
Net income | $ | 202,889 | $ | 79,129 | $ | 123,714 | |||||
Weighted average common shares outstanding | 72,270 | 72,057 | 71,957 | ||||||||
Dilutive effect of stock-based awards | 288 | 336 | 599 | ||||||||
Shares used in computing diluted earnings per share | 72,558 | 72,393 | 72,556 | ||||||||
Basic earnings per share | $ | 2.81 | $ | 1.10 | $ | 1.72 | |||||
Diluted earnings per share | $ | 2.80 | $ | 1.09 | $ | 1.71 | |||||
There were no options to purchase shares of common stock that were outstanding during the periods indicated above that were excluded from the computation of diluted earnings per share because the option purchase price was greater than the average market price of the common shares during the period. Performance awards are excluded from the calculation of dilutive potential common shares until the threshold performance conditions have been satisfied.
Equity Compensation: We have an equity compensation plan that provides for grants of non-qualified stock options, restricted stock, restricted stock units and stock appreciation rights to our associates and directors. We apply the fair value method of accounting for equity compensation awards. Issuances of stock upon an exercise of stock options or vesting of restricted stock are made from treasury stock; shares reacquired to satisfy tax withholding obligations upon vesting of restricted stock are recorded as treasury stock. Grants of stock options, restricted stock, and performance awards vest in increments, and we recognize compensation expense over the requisite service period of each award. We accrue compensation expense for performance awards for the estimated number of shares expected to be issued using the most current information available at the date of the financial statements. If the performance objectives are not met, no compensation expense will be recognized, and any previously recognized compensation expense will be reversed.
Comprehensive Income: Comprehensive income consists of net income and other comprehensive income (loss). Other comprehensive income (loss) refers to revenues, expenses, gains and losses that are not included in net income, but rather are recorded directly in stockholders’ equity. For the years ended December 31, 2017, 2016 and 2015, comprehensive income consists of net income, foreign currency translation adjustments and change in fair value of interest rate swap.
New Accounting Pronouncements Adopted: In July 2015, the Financial Accounting Standards Board (“FASB”) issued Accounting Standards Update (“ASU”) No. 2015-11, “Inventory: Simplifying the Measurement of Inventory,” which requires inventory to be recorded at the lower of average cost and net realizable value (instead of lower of cost or market). The Company adopted ASU No. 2015-11 as of January 1, 2017. Upon adoption, this update had no effect on our consolidated financial position, results of operations or cash flows.
In March 2016, the FASB issued ASU No. 2016-09, “Compensation - Stock Compensation: Improvements to Employee Share-Based Payment Accounting,” to simplify several aspects of the accounting for share-based payment transactions. The new update requires excess tax benefits and tax deficiencies to be recorded in the consolidated statements of income as a component of income tax expense when share-based awards vest or are settled. The update also eliminates the requirement to reclassify cash flows related to excess tax benefits from operating activities to financing activities on the consolidated statements of cash flows. The standard also provides an accounting policy election to account for forfeitures as they occur and now allows for withholding up to the maximum statutory tax rate on certain share-based awards without triggering liability accounting.
The Company adopted ASU No. 2016-09 as of January 1, 2017. Upon adoption, share-based payment excess tax benefits and tax deficiencies are recognized in the consolidated statements of income as a component of income tax expense, rather than additional paid-in capital as previously recognized. The Company elected to report excess tax benefits as operating activities in the consolidated statements of cash flows on a prospective basis, and prior period amounts have not been adjusted. The Company also elected to use actual forfeitures to determine the amount of share-based compensation expense to be recognized. This change was applied on a modified retrospective basis and resulted in a $0.3 million decrease to retained earnings in first quarter 2017.
34
Accounting Standards Updates Not Yet Effective: On May 28, 2014, the FASB issued ASU No. 2014-09, “Revenue from Contracts with Customers,” which requires an entity to recognize the amount of revenue to which it expects to be entitled for the transfer of promised goods or services to customers. The ASU will replace most existing revenue recognition guidance in U.S. GAAP when it becomes effective. The FASB has also issued additional guidance related to revenue recognition matters in subsequent ASUs, including a one-year deferral of the effective date of the new revenue standard. As a result of the deferral, the new standard is effective for us beginning January 1, 2018. Prior to adopting, we recognize revenue and related direct costs when the shipment is delivered. Effective January 1, 2018, the new standard requires us to recognize revenue and related direct costs over time as the shipment is being delivered. The standard permits the use of either the full retrospective or modified retrospective (cumulative effect) transition method. We will adopt the standard using the modified retrospective transition method. Based on our evaluation, the adoption of this standard will not have a material effect on our consolidated financial statements, although additional disclosures will be required.
In February 2016, the FASB issued ASU No. 2016-02, “Leases,” to increase transparency and comparability by recognizing lease assets and lease liabilities on the balance sheet and disclosing key information about leasing arrangements. The provisions of this update are effective for fiscal years beginning after December 15, 2018. We are evaluating the effect that ASU No. 2016-02 will have on our consolidated financial position, results of operations and cash flows.
In August 2016, the FASB issued ASU No. 2016-15, “Statement of Cash Flows (Topic 230): Classification of Certain Cash Receipts and Cash Payments,” which addresses eight specific cash flow issues with the objective of reducing the existing diversity in practice. The provisions of this update are effective for fiscal years beginning after December 15, 2017. Based on our evaluation, the adoption of this standard will not have a material effect on our consolidated statement of cash flows.
In November 2016, the FASB issued ASU No. 2016-18, “Statement of Cash Flows (Topic 230): Restricted Cash,” which requires an entity to include in its cash and cash-equivalent balances in the statement of cash flows those amounts that are deemed to be restricted cash and restricted cash equivalents. The provisions of this update are effective for fiscal years beginning after December 15, 2017, and retrospective adoption is required. The adoption of this standard will impact the consolidated statements of cash flows by increasing beginning and ending cash to include the restricted balance of our like-kind exchange account and remove from operating activities the change in such balance.
In May 2017, the FASB issued ASU No. 2017-09, “Compensation - Stock Compensation (Topic 718): Scope of Modification Accounting,” which provides guidance about which changes to the terms or conditions of a share-based payment award require an entity to apply modification accounting. The provisions of this update are effective for fiscal years beginning after December 15, 2017, and would be applied prospectively to an award modified on or after the adoption date, if any such modification were to occur.
In August 2017, the FASB issued ASU No. 2017-12, “Derivatives and Hedging (Topic 815): Targeted Improvements to Accounting for Hedging Activities,” with the objective of improving the financial reporting of hedging relationships to better portray the economic results of an entity’s risk management activities in its financial statements. The provisions of this update are effective for fiscal years beginning after December 15, 2018. We are evaluating the effect that ASU No. 2017-12 will have on our financial position, results of operations and cash flows.
(2) CREDIT FACILITIES
As of December 31, 2017, we had unsecured committed credit facilities with three banks as well as a term commitment with one of these banks. We had with Wells Fargo Bank, N.A., a $100.0 million credit facility which will expire on July 12, 2020, and a $75.0 million term commitment with principal due and payable on September 15, 2019. We had an unsecured line of credit of $75.0 million with U.S. Bank, N.A., which will expire on July 13, 2020. We also had a $75.0 million credit facility with BMO Harris Bank, N.A., which will expire on March 5, 2020. Borrowings under these credit facilities and term note bear variable interest based on the London Interbank Offered Rate (“LIBOR”).
As of December 31, 2017 and 2016, our outstanding debt totaled $75.0 million and $180.0 million, respectively. We had $75.0 million outstanding under the term commitment at a variable rate of 2.08% as of December 31, 2017, which is effectively fixed at 2.5% with an interest rate swap agreement. The $325.0 million of borrowing capacity under our credit facilities at December 31, 2017, is further reduced by $39.6 million in stand-by letters of credit under which we are obligated. Each of the debt agreements includes, among other things, financial covenants requiring us (i) not to exceed a maximum ratio of total debt to total capitalization and/or (ii) not to exceed a maximum ratio of total funded debt to earnings before interest, income taxes, depreciation and amortization (as such terms are defined in each credit facility). At December 31, 2017, we were in compliance with these covenants.
35
At December 31, 2017, the aggregate future maturities of long-term debt by year are as follows (in thousands):
2018 | $ | — | |
2019 | 75,000 | ||
2020 | — | ||
2021 | — | ||
2022 | — | ||
Total | $ | 75,000 | |
The carrying amounts of our long-term debt approximate fair value due to the duration of the notes and the variable interest rates.
(3) NOTES RECEIVABLE
We provide financing to some individuals who want to become independent contractors by purchasing a tractor from us and leasing their services to us. We maintain a primary security interest in the tractor until the independent contractor pays the note balance in full. Independent contractor notes receivable are included in other current assets and other non-current assets in the Consolidated Balance Sheets. At December 31, notes receivable consisted of the following (in thousands):
December 31, | |||||||
2017 | 2016 | ||||||
Independent contractor notes receivable | $ | 28,634 | $ | 46,831 | |||
Other notes receivable | 8,489 | 5,189 | |||||
37,123 | 52,020 | ||||||
Less current portion | 11,127 | 14,590 | |||||
Notes receivable – non-current | $ | 25,996 | $ | 37,430 | |||
We also provide financing to some individuals who attended our driver training schools. The student notes receivable are included in other receivables and other non-current assets in the Consolidated Balance Sheets. At December 31, student notes receivable consisted of the following (in thousands):
December 31, | |||||||
2017 | 2016 | ||||||
Student notes receivable | $ | 48,121 | $ | 34,097 | |||
Allowance for doubtful student notes receivable | (21,026 | ) | (15,682 | ) | |||
Total student notes receivable, net of allowance | 27,095 | 18,415 | |||||
Less current portion, net of allowance | 6,326 | 7,350 | |||||
Student notes receivable – non-current portion | $ | 20,769 | $ | 11,065 | |||
36
(4) INCOME TAXES
The Tax Cuts and Jobs Act of 2017 (the “Tax Act”) was enacted on December 22, 2017, and lowered the federal corporate income tax rate to 21% from 35% effective January 1, 2018. In accounting for income taxes, deferred income tax assets and liabilities are recognized for the future tax consequences attributable to temporary differences between the financial statement carrying amounts of existing assets and liabilities and their respective tax bases. Deferred income tax assets and liabilities are measured using the enacted tax rates that are expected to apply to taxable income in the years in which those temporary differences are expected to be recovered or settled. As a result of the reduction of the federal corporate income tax rate under the Tax Act, the Company revalued its ending net deferred income tax liabilities at December 31, 2017 and recognized a provisional $110.5 million income tax benefit.
The SEC staff issued Staff Accounting Bulletin No. 118 to address the application of U.S. GAAP in situations when a registrant does not have the necessary information available, prepared, or analyzed in reasonable detail to complete the accounting for certain income tax effects of the Tax Act. The Company has recognized the provisional tax impact related to the revaluation of deferred income tax assets and liabilities and included the amount in its consolidated financial statements for the year ended December 31, 2017. The ultimate impact may differ from the provisional amount due to, among other things, additional analysis, changes in interpretations and assumptions the Company has made, and additional regulatory guidance that may be issued. The accounting is expected to be completed when the Company’s 2017 income tax returns are filed later in 2018.
Income tax expense consisted of the following (in thousands):
Years Ended December 31, | |||||||||||
2017 | 2016 | 2015 | |||||||||
Current: | |||||||||||
Federal | $ | 38,535 | $ | 237 | $ | 32,090 | |||||
State | 3,979 | 2,928 | 5,665 | ||||||||
Foreign | 102 | 534 | 1,250 | ||||||||
42,616 | 3,699 | 39,005 | |||||||||
Deferred: | |||||||||||
Federal | (104,573 | ) | 42,895 | 33,912 | |||||||
State | 3,625 | 1,737 | 4,530 | ||||||||
(100,948 | ) | 44,632 | 38,442 | ||||||||
Total income tax expense (benefit) | $ | (58,332 | ) | $ | 48,331 | $ | 77,447 | ||||
The effective income tax rate differs from the federal corporate tax rate of 35% in 2017, 2016 and 2015 as follows (in thousands):
Years Ended December 31, | ||||||||||||
2017 | 2016 | 2015 | ||||||||||
Tax at statutory rate | $ | 50,595 | $ | 44,611 | $ | 70,406 | ||||||
Change in federal income tax rate | (110,508 | ) | — | — | — | |||||||
State income taxes, net of federal tax benefits | 4,943 | 3,032 | 6,627 | |||||||||
Non-deductible meals and entertainment | 1,495 | 1,549 | 1,687 | |||||||||
Income tax credits | (1,780 | ) | (1,900 | ) | (1,700 | ) | ||||||
Equity compensation | (820 | ) | — | — | — | |||||||
Other, net | (2,257 | ) | 1,039 | 427 | ||||||||
Total income tax expense (benefit) | $ | (58,332 | ) | $ | 48,331 | $ | 77,447 | |||||
37
At December 31, deferred income tax assets and liabilities consisted of the following (in thousands):
December 31, | |||||||
2017 | 2016 | ||||||
Deferred income tax assets: | |||||||
Insurance and claims accruals | $ | 41,986 | $ | 74,015 | |||
Compensation-related accruals | 6,797 | 10,056 | |||||
Allowance for uncollectible accounts | 3,599 | 6,135 | |||||
Other | 1,979 | 4,168 | |||||
Gross deferred income tax assets | 54,361 | 94,374 | |||||
Deferred income tax liabilities: | |||||||
Property and equipment | 243,482 | 377,093 | |||||
Prepaid expenses | 4,699 | 7,737 | |||||
Other | 1,367 | 2,313 | |||||
Gross deferred income tax liabilities | 249,548 | 387,143 | |||||
Net deferred income tax liability | $ | 195,187 | $ | 292,769 | |||
Deferred income tax assets are more likely than not to be realized as a result of future taxable income and reversal of deferred income tax liabilities.
We recognized a $1.6 million decrease in the net liability for unrecognized tax benefits for the year ended December 31, 2017, including the impact of the federal tax rate change, and a $1.1 million decrease for the year ended December 31, 2016. We accrued interest expense of $0.2 million during 2017 and $0.2 million during 2016, excluding from both years the reversal of accrued interest related to the adjustment of uncertain tax positions. If recognized, $2.3 million of unrecognized tax benefits as of December 31, 2017 and $3.9 million as of December 31, 2016 would impact our effective tax rate. Interest of $0.4 million as of December 31, 2017 and $1.1 million as of December 31, 2016 has been reflected as a component of the total liability. We expect no other significant increases or decreases for uncertain tax positions during the next twelve months. The reconciliations of beginning and ending gross balances of unrecognized tax benefits for 2017 and 2016 are shown below (in thousands).
December 31, | |||||||
2017 | 2016 | ||||||
Unrecognized tax benefits, beginning balance | $ | 6,055 | $ | 7,717 | |||
Gross increases – tax positions in prior period | 168 | 236 | |||||
Gross decreases – tax positions in prior period | — | (217 | ) | ||||
Gross increases – current-period tax positions | 136 | 473 | |||||
Settlements | (3,476 | ) | (2,154 | ) | |||
Unrecognized tax benefits, ending balance | $ | 2,883 | $ | 6,055 | |||
We file U.S. federal income tax returns, as well as income tax returns in various states and several foreign jurisdictions. The years 2014 through 2016 are open for examination by the U.S. Internal Revenue Service (“IRS”), and various years are open for examination by state and foreign tax authorities. State and foreign jurisdictional statutes of limitations generally range from three to four years.
(5) EQUITY COMPENSATION AND EMPLOYEE BENEFIT PLANS
Equity Plan
The Werner Enterprises, Inc. Amended and Restated Equity Plan (the “Equity Plan”), approved by the Company’s shareholders, provides for grants to employees and non-employee directors of the Company in the form of nonqualified stock options, restricted stock and units (“restricted awards”), performance awards and stock appreciation rights. The Board of Directors or the Compensation Committee of our Board of Directors determines the terms of each award, including the type, recipients, number of shares subject to and vesting conditions of each award. No awards of stock appreciation rights have been issued under the Equity Plan to date. The maximum number of shares of common stock that may be awarded under the Equity Plan is 20,000,000 shares. The maximum aggregate number of shares that may be awarded to any one person in any one calendar year under the Equity Plan is 500,000. As of December 31, 2017, there were 7,349,879 shares available for granting additional awards.
38
Equity compensation expense is included in salaries, wages and benefits within the Consolidated Statements of Income. As of December 31, 2017, the total unrecognized compensation cost related to non-vested equity compensation awards was approximately $6.6 million and is expected to be recognized over a weighted average period of 2.1 years. The following table summarizes the equity compensation expense and related income tax benefit recognized in the Consolidated Statements of Income (in thousands):
Years Ended December 31, | ||||||||||||
2017 | 2016 | 2015 | ||||||||||
Stock options: | ||||||||||||
Pre-tax compensation expense | $ | 6 | $ | (25 | ) | $ | 30 | |||||
Tax benefit | 2 | (9 | ) | 11 | ||||||||
Stock option expense, net of tax | $ | 4 | $ | (16 | ) | $ | 19 | |||||
Restricted awards: | ||||||||||||
Pre-tax compensation expense | $ | 3,244 | $ | 2,337 | $ | 1,875 | ||||||
Tax benefit | 1,265 | 886 | 722 | |||||||||
Restricted stock expense, net of tax | $ | 1,979 | $ | 1,451 | $ | 1,153 | ||||||
Performance awards: | ||||||||||||
Pre-tax compensation expense | $ | 1,459 | $ | 167 | $ | 2,514 | ||||||
Tax benefit | 569 | 63 | 968 | |||||||||
Performance award expense, net of tax | $ | 890 | $ | 104 | $ | 1,546 | ||||||
We do not have a formal policy for issuing shares upon an exercise of stock options or vesting of restricted and performance awards. Such shares are generally issued from treasury stock. From time to time, we repurchase shares of our common stock, the timing and amount of which depends on market and other factors. Historically, the shares acquired from such repurchases have provided us with sufficient quantities of stock to issue for equity compensation. Based on current treasury stock levels, we do not expect to repurchase additional shares specifically for equity compensation during 2018.
Stock Options
Stock options are granted at prices equal to the market value of the common stock on the date the option award is granted. Option awards currently outstanding became exercisable in installments from 24 to 72 months after the date of grant. The options are exercisable over a period not to exceed ten years and one day from the date of grant. The following table summarizes stock option activity for the year ended December 31, 2017:
Number of Options (in thousands) | Weighted Average Exercise Price ($) | Weighted Average Remaining Contractual Term (Years) | Aggregate Intrinsic Value (in thousands) | |||||||||
Outstanding at beginning of period | 171 | $ | 18.19 | |||||||||
Granted | — | — | ||||||||||
Exercised | (138 | ) | 17.83 | |||||||||
Forfeited | — | — | ||||||||||
Expired | — | — | ||||||||||
Outstanding at end of period | 33 | 19.69 | 2.33 | $ | 623 | |||||||
Exercisable at end of period | 33 | 19.69 | 2.33 | $ | 623 | |||||||
We did not grant any stock options during the years ended December 31, 2017, 2016 and 2015. The fair value of stock option grants is estimated using a Black-Scholes valuation model. The total intrinsic value of stock options exercised was as follows (in thousands):
2017 | $ | 1,722 | |
2016 | 119 | ||
2015 | 655 | ||
39
Restricted Awards
Restricted stock entitles the holder to shares of common stock when the award vests. Restricted stock units entitle the holder to a combination of cash or stock equal to the value of common stock when the unit vests. The value of these shares may fluctuate according to market conditions and other factors. Restricted awards currently outstanding vest over periods ranging from 12 to 60 months from the grant date of the award. The restricted awards do not confer any voting or dividend rights to recipients until such shares vest and do not have any post-vesting sales restrictions. The following table summarizes restricted award activity for the year ended December 31, 2017:
Number of Restricted Awards (in thousands) | Weighted Average Grant Date Fair Value ($) | |||||
Nonvested at beginning of period | 293 | $ | 25.98 | |||
Granted | 110 | 28.92 | ||||
Vested | (119 | ) | 24.70 | |||
Forfeited | (11 | ) | 26.89 | |||
Nonvested at end of period | 273 | 27.69 | ||||
We estimate the fair value of restricted awards based upon the market price of the underlying common stock on the date of grant, reduced by the present value of estimated future dividends because the awards are not entitled to receive dividends prior to vesting. Our estimate of future dividends is based on the most recent quarterly dividend rate at the time of grant, adjusted for any known future changes in the dividend rate. Cash settled restricted stock units are recorded as a liability within the Consolidated Balance Sheets and are adjusted to fair value each reporting period.
The total fair value of previously granted restricted awards vested during the years ended December 31, 2017, 2016, and 2015 was $4.4 million, $4.3 million, and $4.5 million, respectively. We withheld shares based on the closing stock price on the vesting date to settle the employees’ minimum statutory obligation for the applicable income and other employment taxes. Total cash remitted for the employees’ tax obligations to the relevant taxing authorities is reflected as a financing activity within the Consolidated Statements of Cash Flows, and the shares withheld to satisfy the minimum tax withholding obligations were recorded as treasury stock.
Performance Awards
Performance awards entitle the recipient to shares of common stock upon attainment of performance objectives as pre-established by the Compensation Committee. If the performance objectives are achieved, performance awards currently outstanding vest, subject to continued employment, over periods ranging from 12 to 60 months from the grant date of the award. The performance awards do not confer any voting or dividend rights to recipients until such shares vest and do not have any post-vesting sales restrictions. The following table summarizes performance award activity for the year ended December 31, 2017:
Number of Performance Awards (in thousands) | Weighted Average Grant Date Fair Value ($) | |||||
Nonvested at beginning of period | 124 | $ | 27.33 | |||
Granted | 69 | 26.89 | ||||
Vested | (35 | ) | 27.07 | |||
Forfeited | — | — | ||||
Nonvested at end of period | 158 | 27.20 | ||||
The 2017 performance awards are earned based upon the level of attainment by the Company of specified performance objectives related to cumulative diluted earnings per share for the two-year period from January 1, 2017 to December 31, 2018. Shares earned based on cumulative diluted earnings per share may be capped based on absolute total shareholder return during the three-year period ended December 31, 2019. The 2017 performance awards will vest in one installment on the third anniversary from the grant date. In February 2017, the Compensation Committee determined the 2016 fiscal year results upon which the 2016 performance awards were based fell below the threshold level; thus, no shares of common stock were earned, and the shares not earned are included in the 2016 forfeited shares.
We estimate the fair value of performance awards based upon the market price of the underlying common stock on the date of grant, reduced by the present value of estimated future dividends because the awards are not entitled to receive dividends prior to
40
vesting. Our estimate of future dividends is based on the most recent quarterly dividend rate at the time of grant, adjusted for any known future changes in the dividend rate.
The vesting date fair value of the performance awards vested during the years ended December 31, 2017, 2016 and 2015 was $1.0 million, $1.6 million and $1.1 million, respectively. We withheld shares based on the closing stock price on the vesting date to settle the employees’ minimum statutory obligation for the applicable income and other employment taxes. Total cash remitted for employees’ tax obligations to the relevant taxing authorities is reflected as a financing activity within the Consolidated Statements of Cash Flows, and the shares withheld to satisfy the minimum tax withholding obligations are recorded as treasury stock.
Employee Stock Purchase Plan
Employee associates that meet certain eligibility requirements may participate in our Employee Stock Purchase Plan (the “Purchase Plan”). Eligible participants designate the amount of regular payroll deductions and/or a single annual payment (each subject to a yearly maximum amount) that is used to purchase shares of our common stock on the over-the-counter market. The maximum annual contribution amount is currently $20,000. These purchases are subject to the terms of the Purchase Plan. We contribute an amount equal to 15% of each participant’s contributions under the Purchase Plan. Interest accrues on Purchase Plan contributions at a rate of 5.25% until the purchase is made. We pay the broker’s commissions and administrative charges related to purchases of common stock under the Purchase Plan. Our contributions for the Purchase Plan were as follows (in thousands):
2017 | $ | 208 | |
2016 | 183 | ||
2015 | 182 | ||
401(k) Retirement Savings Plan
We have an Employees’ 401(k) Retirement Savings Plan (the “401(k) Plan”). Associates are eligible to participate in the 401(k) Plan if they have been continuously employed with us or one of our subsidiaries for six months or more. We match a portion of each associate’s 401(k) Plan elective deferrals. Salaries, wages and benefits expense in the accompanying Consolidated Statements of Income includes our 401(k) Plan contributions and administrative expenses, which were as follows (in thousands):
2017 | $ | 2,357 | |
2016 | 2,113 | ||
2015 | 2,041 | ||
Nonqualified Deferred Compensation Plan
The Executive Nonqualified Excess Plan (the “Excess Plan”) is our nonqualified deferred compensation plan for the benefit of eligible key managerial associates whose 401(k) Plan contributions are limited because of IRS regulations affecting highly compensated associates. Under the terms of the Excess Plan, participants may elect to defer compensation on a pre-tax basis within annual dollar limits we establish. At December 31, 2017, there were 41 participants in the Excess Plan. Although our current intention is not to do so, we may also make matching credits and/or profit sharing credits to participants’ accounts as we so determine each year. Each participant is fully vested in all deferred compensation and earnings; however, these amounts are subject to general creditor claims until distributed to the participant. Under current federal tax law, we are not allowed a current income tax deduction for the compensation deferred by participants, but we are allowed a tax deduction when a distribution payment is made to a participant from the Excess Plan. The accumulated benefit obligation is included in other long-term liabilities in the Consolidated Balance Sheets. We purchased life insurance policies to fund the future liability. The aggregate market value of the life insurance policies is included in other non-current assets in the Consolidated Balance Sheets.
The accumulated benefit obligation and aggregate market value of the life insurance policies were as follows (in thousands):
December 31, | |||||||
2017 | 2016 | ||||||
Accumulated benefit obligation | $ | 7,682 | $ | 6,920 | |||
Aggregate market value | 7,059 | 5,821 | |||||
(6) COMMITMENTS AND CONTINGENCIES
We have committed to property and equipment purchases of approximately $185.3 million at December 31, 2017.
We are involved in certain claims and pending litigation arising in the ordinary course of business. The majority of these claims relate to bodily injury, property damage, cargo and workers’ compensation incurred in the transportation of freight, as well as certain class action litigation related to personnel and employments matters. We accrue for the uninsured portion of contingent
41
losses from these and other pending claims when it is both probable that a liability has been incurred and the amount of the loss can be reasonably estimated. Based on the knowledge of the facts, management believes the resolution of claims and pending litigation, taking into account existing reserves, will not have a material adverse effect on our consolidated financial statements. Moreover, the results of complex legal proceedings are difficult to predict and our view of these matters may change in the future as the litigation and related events unfold.
We are involved in class action litigation in the U.S. District Court for the District of Nebraska, in which the plaintiffs allege that we owe drivers for unpaid wages under the Fair Labor Standards Act (FLSA) and the Nebraska Wage Payment and Collection Act and that we failed to pay minimum wage per hour for drivers in our student driver training program, related to short break time and sleeper berth time. The period covered by this class action suit is August 2008 through March 2014. The case was tried to a jury in May 2017, resulting in a verdict of $0.8 million in plaintiffs’ favor on the short break matter and a verdict in our favor on the sleeper berth matter. As a result of various post-trial motions, the court has awarded $0.5 million to the plaintiffs for attorney fees and costs. As of December 31, 2017, we had accrued for the jury’s award, attorney fees and costs in the short break matter and had not accrued for the sleeper berth matter.
We are also involved in certain class action litigation in which the plaintiffs allege claims for failure to provide meal and rest breaks, unpaid wages, unauthorized deductions and other items. Based on the knowledge of the facts, management does not currently believe the outcome of these class actions is likely to have a material adverse effect on our financial position or results of operations. However, the final disposition of these matters and the impact of such final dispositions cannot be determined at this time.
(7) RELATED PARTY TRANSACTIONS
The Company leases land from a trust in which the Company’s principal stockholder is the sole trustee. The annual rent payments under this lease are $1.00 per year. The Company is responsible for all real estate taxes and maintenance costs related to the property, which were $72,000 in 2017, $50,000 in 2016, and $52,000 in 2015 and are recorded as expenses in the Consolidated Statements of Income. The Company has made leasehold improvements to the land totaling approximately $6.6 million for facilities used for business meetings and customer promotion.
(8) SEGMENT INFORMATION
We have two reportable segments – Truckload Transportation Services (“Truckload”) and Werner Logistics.
The Truckload segment consists of three operating units, One-Way Truckload, Dedicated and Temperature Controlled. These units are aggregated because they have similar economic characteristics and meet the other aggregation criteria described in the accounting guidance for segment reporting. One-Way Truckload is comprised of the following operating fleets: (i) the medium-to-long-haul van (“Van”) fleet transports a variety of consumer nondurable products and other commodities in truckload quantities over irregular routes using dry van trailers; (ii) the expedited (“Expedited”) fleet provides time-sensitive truckload services utilizing driver teams; and (iii) the regional short-haul (“Regional”) fleet provides comparable truckload van service within geographic regions across the United States. Dedicated provides truckload services dedicated to a specific customer, generally for a retail distribution center or manufacturing facility, utilizing either dry van or specialized trailers. Temperature Controlled provides truckload services for temperature sensitive products over irregular routes utilizing temperature-controlled trailers. (We previously utilized the name “Specialized Services” to encompass the operations of both Dedicated and Temperature Controlled.) Revenues for the Truckload segment include a small amount of non-trucking revenues which consist primarily of the intra-Mexico portion of cross-border shipments delivered to or from Mexico where we utilize a third-party capacity provider.
The Werner Logistics segment generates the majority of our non-trucking revenues through five operating units that provide non-trucking services to our customers. These five Werner Logistics operating units are as follows: (i) truck brokerage (“Brokerage”) uses contracted carriers to complete customer shipments; (ii) freight management (“Freight Management”) offers a full range of single-source logistics management services and solutions; (iii) the intermodal (“Intermodal”) unit offers rail transportation through alliances with rail and drayage providers as an alternative to truck transportation; (iv) Werner Global Logistics international (“WGL”) provides complete management of global shipments from origin to destination using a combination of air, ocean, truck and rail transportation modes; and (v) Werner Final Mile (“Final Mile”) offers home and business deliveries of large or heavy items using two associates operating a liftgate straight truck.
We generate other revenues from our driver training schools, transportation-related activities such as third-party equipment maintenance and equipment leasing, and other business activities. None of these operations meets the quantitative reporting thresholds. As a result, these operations are grouped in “Other” in the tables below. “Corporate” includes revenues and expenses that are incidental to our activities and are not attributable to any of our operating segments, including gains and losses on sales of assets not attributable to our operating segments. We do not prepare separate balance sheets by segment and, as a result, assets
42
are not separately identifiable by segment. Inter-segment eliminations in the table below represent transactions between reporting segments that are eliminated in consolidation.
The following table summarizes our segment information (in thousands):
Years Ended December 31, | |||||||||||
2017 | 2016 | 2015 | |||||||||
Revenues | |||||||||||
Truckload Transportation Services | $ | 1,635,244 | $ | 1,533,981 | $ | 1,644,874 | |||||
Werner Logistics | 417,639 | 417,172 | 393,174 | ||||||||
Other | 62,745 | 57,062 | 54,512 | ||||||||
Corporate | 1,938 | 1,749 | 2,297 | ||||||||
Subtotal | 2,117,566 | 2,009,964 | 2,094,857 | ||||||||
Inter-segment eliminations | (829 | ) | (973 | ) | (1,328 | ) | |||||
Total | $ | 2,116,737 | $ | 2,008,991 | $ | 2,093,529 | |||||
Operating Income | |||||||||||
Truckload Transportation Services | $ | 138,059 | $ | 107,713 | $ | 189,850 | |||||
Werner Logistics | 8,683 | 20,734 | 16,898 | ||||||||
Other | 35 | (6,177 | ) | (7,513 | ) | ||||||
Corporate | (2,957 | ) | 3,800 | 1,221 | |||||||
Total | $ | 143,820 | $ | 126,070 | $ | 200,456 | |||||
Information about the geographic areas in which we conduct business is summarized below (in thousands) as of and for the years ended December 31, 2017, 2016 and 2015. Operating revenues for foreign countries include revenues for (i) shipments with an origin or destination in that country and (ii) other services provided in that country. If both the origin and destination are in a foreign country, the revenues are attributed to the country of origin.
2017 | 2016 | 2015 | |||||||||
Revenues | |||||||||||
United States | $ | 1,837,525 | $ | 1,760,214 | $ | 1,821,026 | |||||
Foreign countries | |||||||||||
Mexico | 210,228 | 183,058 | 191,453 | ||||||||
Other | 68,984 | 65,719 | 81,050 | ||||||||
Total foreign countries | 279,212 | 248,777 | 272,503 | ||||||||
Total | $ | 2,116,737 | $ | 2,008,991 | $ | 2,093,529 | |||||
Long-lived Assets | |||||||||||
United States | $ | 1,321,206 | $ | 1,341,703 | $ | 1,134,433 | |||||
Foreign countries | |||||||||||
Mexico | 25,309 | 20,614 | 19,879 | ||||||||
Other | 348 | 321 | 158 | ||||||||
Total foreign countries | 25,657 | 20,935 | 20,037 | ||||||||
Total | $ | 1,346,863 | $ | 1,362,638 | $ | 1,154,470 | |||||
We generate substantially all of our revenues within the United States or from North American shipments with origins or destinations in the United States. No customer generated more than 8% of our total revenues for 2017, 2016 and 2015.
43
(9) QUARTERLY RESULTS OF OPERATIONS (UNAUDITED)
(In thousands, except per share amounts) | First Quarter | Second Quarter | Third Quarter | Fourth Quarter | |||||||||||
2017: | |||||||||||||||
Operating revenues | $ | 501,221 | $ | 519,508 | $ | 528,643 | $ | 567,365 | |||||||
Operating income | 25,972 | 36,913 | 35,874 | 45,061 | |||||||||||
Net income | 16,019 | 23,219 | 22,517 | 141,134 | |||||||||||
Basic earnings per share | 0.22 | 0.32 | 0.31 | 1.95 | |||||||||||
Diluted earnings per share | 0.22 | 0.32 | 0.31 | 1.94 | |||||||||||
(In thousands, except per share amounts) | First Quarter | Second Quarter | Third Quarter | Fourth Quarter | |||||||||||
2016: | |||||||||||||||
Operating revenues | $ | 482,802 | $ | 498,681 | $ | 508,676 | $ | 518,832 | |||||||
Operating income | 32,487 | 29,553 | 29,074 | 34,956 | |||||||||||
Net income | 20,092 | 18,306 | 18,920 | 21,811 | |||||||||||
Basic earnings per share | 0.28 | 0.25 | 0.26 | 0.30 | |||||||||||
Diluted earnings per share | 0.28 | 0.25 | 0.26 | 0.30 | |||||||||||
ITEM 9. | CHANGES IN AND DISAGREEMENTS WITH ACCOUNTANTS ON ACCOUNTING AND FINANCIAL DISCLOSURE |
No disclosure under this item was required within the two most recent fiscal years ended December 31, 2017, or any subsequent period, involving a change of accountants or disagreements on accounting and financial disclosure.
ITEM 9A. | CONTROLS AND PROCEDURES |
Evaluation of Disclosure Controls and Procedures
As of the end of the period covered by this report, we carried out an evaluation, under the supervision and with the participation of our management, including our Chief Executive Officer and Chief Financial Officer, of the effectiveness of the design and operation of our disclosure controls and procedures, as defined in Exchange Act Rule 15d-15(e). Our disclosure controls and procedures are designed to provide reasonable assurance of achieving the desired control objectives. Based upon that evaluation, our Chief Executive Officer and Chief Financial Officer concluded that our disclosure controls and procedures are effective at a reasonable assurance level in enabling us to record, process, summarize and report information required to be included in our periodic filings with the SEC within the required time period and that such information is accumulated and communicated to our management, including our Chief Executive Officer and Chief Financial Officer, as appropriate, to allow timely decisions regarding required disclosure.
We have confidence in our internal controls and procedures. Nevertheless, our management, including the Chief Executive Officer and Chief Financial Officer, does not expect that the internal controls or disclosure procedures and controls will prevent all errors or intentional fraud. An internal control system, no matter how well conceived and operated, can provide only reasonable, not absolute, assurance that the objectives of such internal controls are met. Further, the design of an internal control system must reflect that resource constraints exist, and the benefits of controls must be evaluated relative to their costs. Because of the inherent limitations in all internal control systems, no evaluation of controls can provide absolute assurance that all control issues, misstatements and instances of fraud, if any, have been prevented or detected.
Management’s Report on Internal Control over Financial Reporting
Management is responsible for establishing and maintaining adequate internal control over our financial reporting. Internal control over financial reporting is a process designed to provide reasonable assurance to our management and Board of Directors regarding the reliability of financial reporting and the preparation of financial statements for external purposes in accordance with U.S. generally accepted accounting principles. Internal control over financial reporting includes (i) maintaining records that in reasonable detail accurately and fairly reflect our transactions; (ii) providing reasonable assurance that transactions are recorded as necessary for preparation of our financial statements; (iii) providing reasonable assurance that receipts and expenditures of company assets are made in accordance with management authorization; and (iv) providing reasonable assurance that unauthorized
44
acquisition, use or disposition of company assets that could have a material effect on our financial statements would be prevented or detected on a timely basis.
Because of its inherent limitations, internal control over financial reporting may not prevent or detect misstatements. Also, projections of any evaluation of effectiveness to future periods are subject to the risk that controls may become inadequate because (i) changes in conditions may occur or (ii) the degree of compliance with the policies or procedures may deteriorate.
Management assessed the effectiveness of our internal control over financial reporting as of December 31, 2017. This assessment is based on the criteria for effective internal control described in Internal Control – Integrated Framework (2013) issued by the Committee of Sponsoring Organizations of the Treadway Commission. Based on its assessment, management concluded that our internal control over financial reporting was effective as of December 31, 2017.
Management has engaged KPMG LLP (“KPMG”), the independent registered public accounting firm that audited the consolidated financial statements included in this Form 10-K, to attest to and report on the effectiveness of our internal control over financial reporting. KPMG’s report is included herein.
Report of Independent Registered Public Accounting Firm
The Board of Directors and Stockholders
Werner Enterprises, Inc.:
Opinion on Internal Control Over Financial Reporting
We have audited Werner Enterprises, Inc. and subsidiaries’ (the Company) internal control over financial reporting as of December 31, 2017, based on criteria established in Internal Control - Integrated Framework (2013) issued by the Committee of Sponsoring Organizations of the Treadway Commission. In our opinion, the Company maintained, in all material respects, effective internal control over financial reporting as of December 31, 2017, based on criteria established in Internal Control - Integrated Framework (2013) issued by the Committee of Sponsoring Organizations of the Treadway Commission.
We have also audited, in accordance with the standards of the Public Company Accounting Oversight Board (United States) (PCAOB), the consolidated balance sheets of the Company as of December 31, 2017 and 2016, the related consolidated statements of income, comprehensive income, stockholders’ equity, and cash flows for each of the years in the three-year period ended December 31, 2017, and the related notes and financial statement schedule II listed in the Index in Item 15(a)(2) (collectively, the consolidated financial statements), and our report dated February 27, 2018, expressed an unqualified opinion on those consolidated financial statements.
Basis for Opinion
The Company’s management is responsible for maintaining effective internal control over financial reporting and for its assessment of the effectiveness of internal control over financial reporting, included in the accompanying Management’s Report on Internal Control over Financial Reporting. Our responsibility is to express an opinion on the Company’s internal control over financial reporting based on our audit. We are a public accounting firm registered with the PCAOB and are required to be independent with respect to the Company in accordance with the U.S. federal securities laws and the applicable rules and regulations of the Securities and Exchange Commission and the PCAOB.
We conducted our audit in accordance with the standards of the PCAOB. Those standards require that we plan and perform the audit to obtain reasonable assurance about whether effective internal control over financial reporting was maintained in all material respects. Our audit of internal control over financial reporting included obtaining an understanding of internal control over financial reporting, assessing the risk that a material weakness exists, and testing and evaluating the design and operating effectiveness of internal control based on the assessed risk. Our audit also included performing such other procedures as we considered necessary in the circumstances. We believe that our audit provides a reasonable basis for our opinion.
Definition and Limitations of Internal Control Over Financial Reporting
A company’s internal control over financial reporting is a process designed to provide reasonable assurance regarding the reliability of financial reporting and the preparation of financial statements for external purposes in accordance with generally accepted accounting principles. A company’s internal control over financial reporting includes those policies and procedures that (1) pertain to the maintenance of records that, in reasonable detail, accurately and fairly reflect the transactions and dispositions of the assets of the company; (2) provide reasonable assurance that transactions are recorded as necessary to permit preparation of financial statements in accordance with generally accepted accounting principles, and that receipts and expenditures of the company are being made only in accordance with authorizations of management and directors of the company; and (3) provide reasonable
45
assurance regarding prevention or timely detection of unauthorized acquisition, use, or disposition of the company’s assets that could have a material effect on the financial statements.
Because of its inherent limitations, internal control over financial reporting may not prevent or detect misstatements. Also, projections of any evaluation of effectiveness to future periods are subject to the risk that controls may become inadequate because of changes in conditions, or that the degree of compliance with the policies or procedures may deteriorate.
/s/ KPMG LLP
Omaha, Nebraska
February 27, 2018
Changes in Internal Control over Financial Reporting
Management, under the supervision and with the participation of our Chief Executive Officer and Chief Financial Officer, concluded that no changes in our internal control over financial reporting occurred during the quarter ended December 31, 2017 that have materially affected, or are reasonably likely to materially affect, our internal control over financial reporting.
ITEM 9B. | OTHER INFORMATION |
During fourth quarter 2017, no information was required to be disclosed in a report on Form 8-K, but not reported.
46
PART III
Certain information required by Part III is omitted from this Form 10-K because we will file a definitive proxy statement pursuant to Regulation 14A (the “Proxy Statement”) not later than 120 days after the end of the fiscal year covered by this Form 10-K, and certain information included therein is incorporated herein by reference. Only those sections of the Proxy Statement which specifically address the items set forth herein are incorporated by reference.
ITEM 10. | DIRECTORS, EXECUTIVE OFFICERS AND CORPORATE GOVERNANCE |
The information required by this Item, with the exception of the Code of Corporate Conduct discussed below, is incorporated herein by reference to our Proxy Statement.
Code of Corporate Conduct
We adopted our Code of Corporate Conduct, which is our code of ethics, that applies to our principal executive officer, principal financial officer, principal accounting officer and all other officers, employee associates and directors. The Code of Corporate Conduct is available on our website, www.werner.com under the “Investors” tab. We will post on our website any amendment to, or waiver from, any provision of our Code of Corporate Conduct that applies to our Chief Executive Officer, Chief Financial Officer or Chief Accounting Officer (if any) within four business days of any such event.
ITEM 11. | EXECUTIVE COMPENSATION |
The information required by this Item is incorporated herein by reference to our Proxy Statement.
ITEM 12. | SECURITY OWNERSHIP OF CERTAIN BENEFICIAL OWNERS AND MANAGEMENT AND RELATED STOCKHOLDER MATTERS |
The information required by this Item, with the exception of the equity compensation plan information presented below, is incorporated herein by reference to our Proxy Statement.
Equity Compensation Plan Information
The following table summarizes, as of December 31, 2017, information about compensation plans under which our equity securities are authorized for issuance:
Number of Securities Remaining Available for Future Issuance under Equity Compensation Plans (Excluding Securities Reflected in Column (a)) | ||||||
Number of Securities to be Issued upon Exercise of Outstanding Options, Warrants and Rights | Weighted-Average Exercise Price of Outstanding Options, Warrants and Rights | |||||
Plan Category | (a) | (b) | (c) | |||
Equity compensation plans approved by stockholders | 463,988 (1) | $19.69 (2) | 7,349,879 | |||
(1) | Includes 424,043 shares to be issued upon vesting of outstanding restricted stock awards. |
(2) | The weighted-average exercise price does not take into account the shares to be issued upon vesting of outstanding restricted stock awards, which have no exercise price. |
We do not have any equity compensation plans that were not approved by stockholders.
ITEM 13. | CERTAIN RELATIONSHIPS AND RELATED TRANSACTIONS, AND DIRECTOR INDEPENDENCE |
The information required by this Item is incorporated herein by reference to our Proxy Statement.
ITEM 14. | PRINCIPAL ACCOUNTING FEES AND SERVICES |
The information required by this Item is incorporated herein by reference to our Proxy Statement.
47
PART IV
ITEM 15. | EXHIBITS, FINANCIAL STATEMENT SCHEDULES |
(a) | Financial Statements and Schedules. |
(1) Financial Statements: See Part II, Item 8 hereof.
Page | ||
Report of Independent Registered Public Accounting Firm | 26 | |
Consolidated Statements of Income | 27 | |
Consolidated Statements of Comprehensive Income | 28 | |
Consolidated Balance Sheets | 29 | |
Consolidated Statements of Cash Flows | 30 | |
Consolidated Statements of Stockholders’ Equity | 31 | |
Notes to Consolidated Financial Statements | 32 | |
(2) Financial Statement Schedules: The consolidated financial statement schedule set forth under the following caption is included herein. The page reference is to the consecutively numbered pages of this report on Form 10-K.
Page | ||
Schedule II—Valuation and Qualifying Accounts | 50 | |
Schedules not listed above have been omitted because they are not applicable or are not required or the information required to be set forth therein is included in the Consolidated Financial Statements or Notes thereto.
(3) Exhibits: The response to this portion of Item 15 is submitted as a separate section of this Form 10-K (see Exhibit Index on pages 51 and 52).
ITEM 16. | FORM 10-K SUMMARY |
Not applicable
48
SIGNATURES
Pursuant to the requirements of Section 13 or 15(d) of the Securities Exchange Act of 1934, the registrant has duly caused this report to be signed on its behalf by the undersigned, thereunto duly authorized, on the 27th day of February, 2018.
WERNER ENTERPRISES, INC. | ||
By: | /s/ Derek J. Leathers | |
Derek J. Leathers President and Chief Executive Officer | ||
Pursuant to the requirements of the Securities Exchange Act of 1934, this report has been signed below by the following persons on behalf of the registrant and in the capacities and on the dates indicated.
Signature | Position | Date | ||
/s/ Clarence L. Werner | Executive Chairman and Director | February 27, 2018 | ||
Clarence L. Werner | ||||
/s/ Derek J. Leathers | President and Chief Executive Officer | February 27, 2018 | ||
Derek J. Leathers | (Principal Executive Officer) | |||
/s/ Gregory L. Werner | Director | February 27, 2018 | ||
Gregory L. Werner | ||||
/s/ Kenneth M. Bird, Ed.D. | Director | February 27, 2018 | ||
Kenneth M. Bird, Ed.D. | ||||
/s/ Patrick J. Jung | Director | February 27, 2018 | ||
Patrick J. Jung | ||||
/s/ Dwaine J. Peetz, Jr., M.D. | Director | February 27, 2018 | ||
Dwaine J. Peetz, Jr., M.D. | ||||
/s/ Gerald H. Timmerman | Director | February 27, 2018 | ||
Gerald H. Timmerman | ||||
/s/ Diane K. Duren | Director | February 27, 2018 | ||
Diane K. Duren | ||||
/s/ Michael L. Gallagher | Director | February 27, 2018 | ||
Michael L. Gallagher | ||||
/s/ John J. Steele | Executive Vice President, Treasurer | February 27, 2018 | ||
John J. Steele | and Chief Financial Officer (Principal Financial Officer) | |||
/s/ James L. Johnson | Executive Vice President, Chief Accounting Officer | February 27, 2018 | ||
James L. Johnson | and Corporate Secretary (Principal Accounting Officer) | |||
49
SCHEDULE II
WERNER ENTERPRISES, INC.
VALUATION AND QUALIFYING ACCOUNTS
(In thousands) | Balance at Beginning of Period | Charged to Costs and Expenses | Write-offs (Recoveries) of Doubtful Accounts | Balance at End of Period | |||||||||||
Year ended December 31, 2017: | |||||||||||||||
Allowance for doubtful accounts | $ | 9,183 | $ | 184 | $ | 1,117 | $ | 8,250 | |||||||
Year ended December 31, 2016: | |||||||||||||||
Allowance for doubtful accounts | $ | 10,298 | $ | (245 | ) | $ | 870 | $ | 9,183 | ||||||
Year ended December 31, 2015: | |||||||||||||||
Allowance for doubtful accounts | $ | 10,017 | $ | 692 | $ | 411 | $ | 10,298 | |||||||
(In thousands) | Balance at Beginning of Period | Charged to Costs and Expenses | Write-offs (Recoveries) of Doubtful Accounts | Balance at End of Period | |||||||||||
Year ended December 31, 2017: | |||||||||||||||
Allowance for doubtful student notes | $ | 15,682 | $ | 15,917 | $ | 10,573 | $ | 21,026 | |||||||
Year ended December 31, 2016: | |||||||||||||||
Allowance for doubtful student notes | $ | 8,622 | $ | 19,019 | $ | 11,959 | $ | 15,682 | |||||||
Year ended December 31, 2015: | |||||||||||||||
Allowance for doubtful student notes | $ | 17,603 | $ | 12,595 | $ | 21,576 | $ | 8,622 | |||||||
See report of independent registered public accounting firm.
50
EXHIBIT INDEX
Exhibit Number | Description | Incorporated by Reference to: | ||
51
Exhibit Number | Description | Incorporated by Reference to: | ||
101.INS | XBRL Instance Document | Filed herewith | ||
101.SCH | XBRL Taxonomy Extension Schema Document | Filed herewith | ||
101.CAL | XBRL Taxonomy Extension Calculation Linkbase Document | Filed herewith | ||
101.DEF | XBRL Taxonomy Extension Definition Linkbase Document | Filed herewith | ||
101.LAB | XBRL Taxonomy Extension Label Linkbase Document | Filed herewith | ||
101.PRE | XBRL Taxonomy Extension Presentation Linkbase Document | Filed herewith | ||
52