Attached files
| file | filename |
|---|---|
| 8-K - 8-K - Square, Inc. | d516726d8k.htm |

RUSTICA
MINNEAPOLIS, MN
Q4 2017 Shareholder Letter
SQUARE.COM/INVESTORS
HIGHLIGHTS:
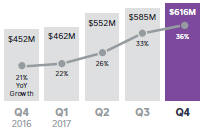
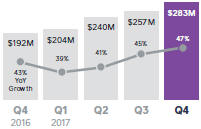
| • | We accelerated growth in the fourth quarter of 2017: Total net revenue grew 36% year over year and Adjusted Revenue grew 47% year over year, compared to 33% and 45%, respectively, in the third quarter of 2017. |
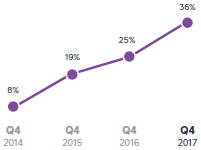
| • | We continue to create meaningful vectors of growth: In the fourth quarter of 2017, revenue from products launched since 2014 was 22% of total net revenue and 36% of Adjusted Revenue, up from 14% and 25%, respectively, in the prior year period. |
| • | Cash App is empowering individuals by providing access to the financial system: There were more than 7 million monthly active customers in December 2017. |
| • | We are building a cohesive ecosystem to serve the full spectrum of omnichannel commerce, enabling sellers to engage with buyers wherever they are. |
FOURTH QUARTER 2017 KEY RESULTS:
| GROSS PAYMENT VOLUME (GPV) | TOTAL NET REVENUE | NET INCOME (LOSS) | ||
|
|
| ||
| GPV MIX BY SELLER SIZE | ADJUSTED REVENUE | ADJUSTED EBITDA | ||
|
|
| ||
A reconciliation of non-GAAP metrics used in this letter to their nearest GAAP equivalents is provided at the end of this letter.
Adjusted Revenue is defined as total net revenue less transaction-based costs, adjusted to eliminate the effect of activity with Starbucks.
Adjusted EBITDA margin is calculated as Adjusted EBITDA divided by Adjusted Revenue.
2
| TO OUR SHAREHOLDERS: | FEBRUARY 27, 2018 | |
|
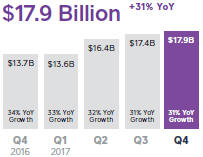
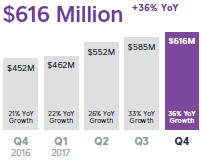
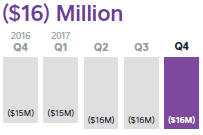
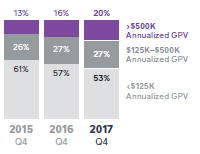
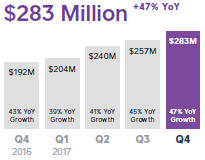
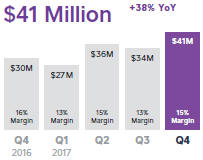
We accelerated top-line growth at significant scale in the fourth quarter of 2017. Total net revenue was $616 million, up 36% year over year, and Adjusted Revenue was $283 million, up 47% year over year. This is an increase from the third quarter of 2017, when total net revenue and Adjusted Revenue grew 33% and 45%, respectively, year over year. Gross Payment Volume (GPV) was $17.9 billion, up 31% year over year. We continue to see strength in larger sellers, with GPV from this segment growing 44% year over year and representing 47% of total GPV. Net loss in the fourth quarter was $16 million, essentially flat on a year-over-year basis. We achieved fourth-quarter Adjusted EBITDA of $41 million, representing an improvement of $11 million year over year and an Adjusted EBITDA margin of 15%.
Our 2017 results set the stage for strong momentum in 2018. Three focus areas will drive our strategy and investment this year: omnichannel commerce, financial services, and current international markets. These areas provide meaningful value to sellers and individuals and significantly increase the addressable market opportunity for Square.
• Strengthen omnichannel commerce: We are enabling sellers to engage with buyers wherever they are, which includes in person, messaging channels, websites and apps, and digital marketplaces. • Expand financial services: We have an opportunity to provide more financial services to sellers and individuals, particularly those who have been underserved by the traditional financial system. • Grow current international markets: We will focus our international efforts this year on gaining share in our current markets of Australia, Canada, Japan, and the UK. We will strengthen our go-to-market strategy, improve automated onboarding, and expand our overall product offering.
We continue to create meaningful vectors of growth: In the fourth quarter of 2017, revenue from products launched since 2014 was 22% of total net revenue and 36% of Adjusted Revenue, up from 14% and 25%, respectively, in the prior year period. |
A larger seller generates more than $125,000 in annualized GPV.
ON THE COVER: Rustica Bakery has been using Square managed payments and Point of Sale for five years and now pays its employees with Square Payroll across its three locations. |

3
| In 2014 we started to meaningfully expand our ecosystem and complement our core managed payments and point-of-sale business with new products such as Square Capital, Caviar, Invoices, Instant Deposit, and Build with Square APIs. Products launched since 2014 continue to scale, and in the fourth quarter of 2017 they generated 36% of Adjusted Revenue, up from 25% in the prior year period.
We are able to efficiently market these products to our base. Our machine-learning models analyze signals (e.g., business name, items or services sold, peak payment times, number of employees) across millions of sellers to provide actionable insights for cross-selling opportunities. We leverage these insights to create personalized messages and campaigns that we send to our sellers through email, in-app notifications, and banners in Square Dashboard. Our Account Management team also leverages the insights from our machine-learning models to proactively respond or to inform outreach: which sellers to contact, at what time, regarding which product(s). Collectively, these cross-sell strategies resulted in approximately 300,000 product adoptions in 2017.
Fancy Frugal Boutique is a furniture and home decor store in Indiana that self-onboarded to Square to manage payments and ordered Square Stand and a contactless and chip reader. Shortly after, our machine-learning model identified the business as a larger seller that could benefit from outreach by Account Management. An account manager contacted owner Becky Mikutis-Sherman and learned about her need to more effectively manage her employees through point-of-sale permissions, sales tracking for commissions, and easy-to-use payroll. Through conversation and discovery, the account manager was able to find a fit for the business with the right Square products. Becky adopted Employee Management and Square Payroll, and we deepened our relationship with this valuable seller.
Cash App is empowering individuals by providing access to the financial system: There were more than 7 million monthly active customers in December 2017.
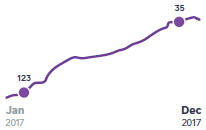
In the same way that we have empowered businesses with fast, simple, and cohesive financial tools, we are building a similar ecosystem of services for individuals with Cash App. In the fourth quarter, it was the #1 finance app |
ACCELERATING GROWTH IN PRODUCTS LAUNCHED SINCE 2014
Products launched since 2014 shown as a percentage of Adjusted Revenue (excludes hardware revenue).
Square Dashboard is our cloud-based reporting and analytics tool that sellers frequently use to access real-time data and insights about their sales, items, customers, and employees.
CASH APP RANKINGS
Trailing 90-day average of free app rankings in the App Store. |
4
| and on average a top 35 free app in the App Store. Cash App has reached significant scale due to its broad-based appeal: There were more than 7 million monthly active customers in December.
We continue to add services to Cash App that build upon our existing platform and give customers the utility they want when it comes to their money. We have added the capability for customers to receive direct deposit payments (such as those from an employer) and ACH payments from financial institutions. And customers can now use their Cash Card, a Visa debit card, to withdraw funds at ATMs. These features provide customers who may not have access to traditional financial services with an easy way to store and access their money. Cash Card is also a useful spending tool, and in December 2017 customers spent over $90 million with Cash Card, representing an annual run rate of over $1 billion. Additionally, customers can now buy and sell Bitcoin in Cash App. We observed that this was a feature our customers wanted, and we support Bitcoin because we see it as a step in the long-term path toward greater financial access for all.
Janea Lee of Tysons Corner, VA, began using Cash App after a friend recommended it. She uses the app several times a week to pay friends and family back for items like dinners and bills. She loved the look of Cash Card when she saw it on Twitter a few months ago and quickly signed up for her own. Janea now uses it daily for basics such as food and clothes. One of her favorite aspects of the Cash Card is the fact that she cannot overdraw because she can only spend from the money she keeps in the app herself. For Janea, Cash App makes it easy to keep track of what she spends all in one place.
We are building a cohesive ecosystem to serve the full spectrum of omnichannel commerce, enabling sellers to engage with buyers wherever they are.
True omnichannel commerce enables sellers to engage with buyers wherever they are. The “channel” extends beyond websites and brick and mortar, and “commerce” extends beyond just the purchase. Today, buyers are everywhere: in person, in messaging channels, on websites, in apps, and on digital marketplaces. And sellers in all industries—not just retail—must be able to meet their buyers during the entire life cycle, from |
An active Cash App customer has at least one cash inflow or outflow during a defined time period.
MOST POPULAR USES OF CASH CARD IN Q4 2017: • McDonald’s • Walmart • Uber • Lyft
Janea’s Cash Card |

5
| discovery to purchase to fulfillment to feedback to refunds. We are building out our cohesive ecosystem, including first- and third-party products, so that we can serve the full spectrum of commerce and provide sellers with an integrated solution to manage their business.
For sellers in the services industry, commerce often begins with a request from a buyer for the seller’s time (i.e., booking an appointment). By enabling buyers to book when, where, and how they want, Square helps to ensure that the seller is always open for business. During the fourth quarter, on average, 50% of reservations booked online with Square Appointments were made outside of a business’s hours. This also enables sellers to more effectively run their business: In the fourth quarter, sellers that use Square Appointments have seen, on average, a 24% year-over-year increase in reservations. Beyond appointments, services sellers need a solution to manage the rest of their business. We recently integrated Square Point of Sale with Appointments to create a seamless experience for sellers and buyers for online booking, in-store product purchases, tipping, and payment. This also provides a seller with access to the entire Square ecosystem in a single app, creating product integration that sellers value: In the fourth quarter, nearly 60% of sellers that used Square Appointments also used another Square product, such as Instant Deposit or Marketing.
Square seller Exquisite Threading is a beauty salon specializing in threading (a hair removal technique involving twisted thread) that Anwer Khan founded with a cart in a Wisconsin mall. In just a few weeks, there were three-hour wait times to get in. The following year, Anwer moved the business from the cart to a 3,000-square-foot storefront in the mall, and he needed a more robust point of sale. Anwer also sells beauty products, making Exquisite Threading both a services and a retail business—a good example of how the lines separating business types are vanishing. Exquisite Threading began using Square to take payments and has since added other Square products, including Appointments, Feedback, Loyalty, Marketing, and Square Capital. Business has continued to boom, and today Exquisite Threading has 120 employees and seven locations across Wisconsin, Ohio, and Missouri. |
Services includes industries such as beauty professionals, health and fitness, home and repair services, professional services, and leisure and entertainment.
“Our customers love the fact we have appointment scheduling software. The option to book online has not only streamlined our appointments by eliminating confusion and double-booking but has also reduced the amount of no- shows. This of course translates to more revenue.”
Anwer Khan Exquisite Threading |

6
| FINANCIAL DISCUSSION: | ||
|
Gross Payment Volume (GPV)
In the fourth quarter of 2017, we processed $17.9 billion of GPV, an increase of 31% from the fourth quarter of 2016. For the full year of 2017, GPV totaled $65.3 billion, an increase of 32% from the full year of 2016 and a demonstration of our continued ability to drive growth as we scale. We continue to attract larger sellers, whose GPV grew 44% year over year and accounted for 47% of total GPV in the fourth quarter of 2017, up from 43% in the fourth quarter of 2016.
Revenue
Total net revenue was $616 million in the fourth quarter of 2017, an increase of 36% year over year. Growth accelerated from 33% year over year in the third quarter of 2017 and 21% year over year in the fourth quarter of 2016. Total net revenue was $2.2 billion for the full year of 2017, an increase of 30% from the full year of 2016. Excluding the revenue impact from Starbucks, which transitioned off our infrastructure in the fourth quarter of 2016, total net revenue for the full year of 2017 increased 36% from the full year of 2016.
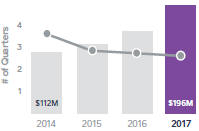
Adjusted Revenue was $283 million in the fourth quarter of 2017, an increase of 47% year over year. Growth accelerated from 45% year over year in the third quarter of 2017 and 43% year over year in the fourth quarter of 2016. For the full year of 2017, Adjusted Revenue was $984 million, an increase of 43% from the full year of 2016. Additionally, we continue to generate positive dollar-based retention across our entire seller base, demonstrating that existing sellers benefit from the Square ecosystem.
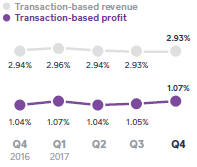
Transaction-based revenue was $525 million in the fourth quarter of 2017, up 30% from the fourth quarter of 2016. Transaction-based revenue as a percentage of GPV was 2.93% in the fourth quarter of 2017, down slightly from 2.94% in the fourth quarter of 2016. Transaction-based profit as a percentage of GPV was 1.07% in the fourth quarter of 2017, compared |
TOTAL NET REVENUE
ADJUSTED REVENUE
Adjusted Revenue is defined as total net revenue less transaction-based costs, adjusted to eliminate the effect of activity with Starbucks.
AS A PERCENTAGE OF GPV:
|
7
| to 1.04% in the prior year period. This metric continues to be driven by strong growth in Invoices, Virtual Terminal, and eCommerce API payments, which all have higher margins than our card-present transactions, as well as improvements in our transaction cost profile. For the full year of 2017, transaction-based revenue was $1.9 billion, up 32% from the full year of 2016.
Subscription and services-based revenue was $79 million in the fourth quarter of 2017, up 96% from the fourth quarter of 2016, an acceleration from year-over-year growth of 84% in the third quarter of 2017. Instant Deposit, Caviar, and Square Capital contributed the majority of subscription and services-based revenue. Square Capital facilitated 47,000 business loans totaling $305 million, up 23% year over year. For the full year of 2017, subscription and services-based revenue was $253 million, an increase of 95% from the full year of 2016.
Hardware revenue in the fourth quarter of 2017 was $12 million, up 36% from the fourth quarter of 2016. In the fourth quarter, hardware revenue benefited from an increase in sales of Square Stand and strong demand for our contactless and chip reader in Canada. Pre-orders of Square Register in the fourth quarter were strong, but the revenue impact will be seen in the first quarter of 2018 because shipping did not commence until the end of the fourth quarter. For the full year of 2017, hardware revenue was $41 million, down 7% compared to the full year of 2016, which benefited from the launch of our contactless and chip reader.
Operating Expenses/Earnings
Operating expenses were $253 million in the fourth quarter of 2017, up 40% year over year, and accounted for 41% of total net revenue. Non-GAAP operating expenses were up 44% year over year, accounting for 71% of Adjusted Revenue in the fourth quarter of 2017, compared to 72% in the fourth quarter of 2016. For the full year of 2017, operating expenses were $894 million, up 20% from the full year of 2016. On a non-GAAP basis, operating expenses were up 33% from the full year of 2016.
• Product development expenses were $93 million on a GAAP basis and $59 million on a non-GAAP basis in the fourth quarter of 2017, up 43% |
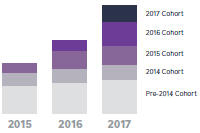
ADJUSTED REVENUE BY ANNUAL COHORT Attractive cohort economics with positive dollar-based retention.
Revenue retention rate is calculated as the year-over-year Adjusted Revenue growth of a quarterly cohort, averaged over the last four quarters (excluding hardware and Gift Card revenue).
STABLE PAYBACK PERIOD EVEN AS SALES AND MARKETING GROWS
Sales and marketing shown above represents GAAP sales and marketing expenses, excluding Cash App marketing expenses.
Payback period measures the effectiveness of sales and marketing spend. Payback period equals the number of quarters for a cohort’s cumulative Adjusted Revenue (excluding hardware and Gift Card revenue) to surpass our sales and marketing expense in the quarter in which we acquired the cohort. This excludes both revenue and costs associated with Cash App. The 2017 payback period represents a trailing four- quarter average as of Q1 2017. |
8
| and 47%, respectively, from the fourth quarter of 2016. This primarily reflects increases in personnel in our engineering, product, data science, and design teams. • Sales and marketing expenses were $77 million on a GAAP basis and $71 million on a non-GAAP basis in the fourth quarter of 2017, up 55% and 58%, respectively, from the fourth quarter of 2016. The year-over- year increase was driven primarily by an increase in Cash App peer-to-peer, paid marketing, and personnel costs. Of note: Throughout the year we maintained a payback period of three to four quarters, demonstrating our ability to efficiently add new sellers. • General and administrative expenses were $66 million on a GAAP basis and $53 million on a non-GAAP basis in the fourth quarter of 2017, up 25% and 30%, respectively, from the fourth quarter of 2016. The year-over-year increase was due primarily to increased personnel costs for functions including customer success, legal, compliance, and risk. • Transaction, loan, and advance losses were $17 million in the fourth quarter of 2017. Transaction losses as a percentage of GPV for the fourth quarter of 2017 trended below our 0.1% historical average, which underscores ongoing investments in our risk management.
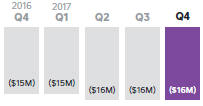
Net loss was $16 million in the fourth quarter of 2017, compared to $15 million in the fourth quarter of 2016, essentially flat on a year-over-year basis. Net loss per share was $0.04 on both a basic and diluted basis for the fourth quarter of 2017, and flat compared to the fourth quarter of 2016. We had 390 million weighted-average shares as of the fourth quarter of 2017. For the full year, net loss per share was $0.17 based on 379 million weighted-average shares, compared to $0.50 for the full year of 2016.
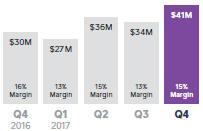
Adjusted EBITDA was $41 million in the fourth quarter of 2017, compared to $30 million in the fourth quarter of 2016, an improvement of 38% year over year. Adjusted EBITDA margin was 15% in the fourth quarter of 2017, compared to 16% in the fourth quarter of 2016, reflecting our decision to invest in the business for ongoing growth. For the full year of 2017, Adjusted EBITDA was $139 million, compared to $45 million for the full year of 2016. Our strong top-line growth enabled us to reinvest in the business, particularly in product development and sales and marketing.
Adjusted Net Income Per Share (Adjusted EPS) was $0.08 based on 451 |
NET INCOME (LOSS)
ADJUSTED EBITDA
A reconciliation of non-GAAP metrics used in this letter to their nearest GAAP equivalents is provided at the end of this letter. Adjusted EBITDA margin is calculated as Adjusted EBITDA divided by Adjusted Revenue. |
9
| million weighted-average diluted shares for the fourth quarter of 2017. For the full year of 2017, Adjusted EPS was $0.27, compared to $0.04 for the full year of 2016. There were 427 million weighted-average diluted shares for the full year of 2017.
Balance Sheet/Cash Flow
We ended the fourth quarter of 2017 with $1.1 billion in cash, cash equivalents, restricted cash, and investments in marketable securities, up from $576 million at the end of the fourth quarter of 2016. The increase in our cash balances was attributable to operating cash flow from our business, the issuance of convertible senior notes, and proceeds from the exercise of stock options and stock purchases under the employee stock purchase plan. However, we did have two notable cash outflows during the year as we paid $55 million to terminate the Starbucks’ warrant and made a $25 million strategic investment in Eventbrite. |
Adjusted EPS is calculated by dividing net loss, excluding transaction-based revenue and transaction-based costs related to Starbucks, share-based compensation expense, amortization of intangible assets, amortization of debt discount and issuance costs, loss on sale of property and equipment, and certain litigation settlement expenses, by the weighted-average number of shares of common stock during the period, including the dilutive effect of all potential shares. |
10
GUIDANCE:
| Q1
|
2018
| |||
| Total net revenue |
$605M to $620M | $2.82B to $2.88B | ||
| Adjusted Revenue |
$290M to $295M | $1.30B to $1.33B | ||
| Year-over-year growth (midpoint) |
44%
|
34%
| ||
|
|
| |||
| Adjusted EBITDA |
$30M to $33M | $240M to $250M | ||
| Adjusted EBITDA margin (midpoint)
|
11%
|
19%
| ||
|
|
| |||
| Net income (loss) per share |
$(0.09) to $(0.07) | $(0.08) to $(0.04) | ||
| Adjusted EPS (diluted) |
$0.03 to $0.05 | $0.43 to $0.47 | ||
Given the significant market opportunity ahead of us, we will continue to reinvest in our business to drive growth. Our 2018 guidance reflects continued investment, balanced by our ongoing commitment to margin expansion. As a reminder, our business is subject to certain seasonal trends. Historically, the first quarter is our slowest in terms of sequential revenue growth.
We have not reconciled Adjusted EBITDA and Adjusted EPS guidance to their GAAP equivalents as a result of the uncertainty regarding, and the potential variability of, reconciling items such as share-based compensation expense and weighted-average fully diluted shares outstanding. Accordingly, a reconciliation of these non-GAAP guidance metrics to their corresponding GAAP equivalents is not available without unreasonable effort. However, we have provided a reconciliation of GAAP to non-GAAP metrics in tables at the end of this letter. It is important to note that the actual amount of such reconciling items would have a significant impact if they were included in our Adjusted EBITDA, Adjusted EBITDA margin, and Adjusted EPS.
11
| Earnings Webcast
Square (NYSE:SQ) will host a conference call and earnings webcast at 2:00 p.m.
We will release financial results for the first quarter of 2018 on
May 2, 2018, after |
MEDIA CONTACT press@squareup.com
INVESTOR RELATIONS CONTACT ir@squareup.com |

|

|
|||
| Jack Dorsey | Sarah Friar | |||
| CEO | CFO |
12

|
“Everyone uses credit cards—you have to accept them. We’ve used other card processors, but I could never understand the monthly statements and the fees would constantly change.
“Square’s fees were transparent, I could get up and running quickly, and the analytics were a huge benefit.”
Sherry Adams Owner Stony Creek Landscapes |
SAFE HARBOR STATEMENT
This letter contains forward-looking statements within the meaning of the Safe Harbor provisions of the Private Securities Litigation Reform Act of 1995. All statements other than statements of historical fact could be deemed forward-looking, including, but not limited to, statements regarding the strategies, areas of focus, and future performance of Square, Inc. and its consolidated subsidiaries (the Company); the Company’s expected financial results for future periods; future growth in the Company’s businesses and products; the cessation of transaction-based revenue from Starbucks; the Company’s expectations regarding scale, profitability, and the demand for or benefits from its products, product features, and services in the U.S. and in international markets; and management’s statements related to business strategy, plans, and objectives for future operations. In some cases, forward-looking statements can be identified by terms such as “may,” “will,” “appears,” “should,” “expects,” “plans,” “anticipates,” “could,” “intends,” “target,” “projects,” “contemplates,” “believes,” “estimates,” “predicts,” “potential,” or “continue,” or the negative of these words or other similar terms or expressions that concern our expectations, strategy, plans, or intentions. Such statements are subject to a number of risks, uncertainties, and assumptions, and investors are cautioned not to place undue reliance on these statements. Actual results could differ materially from those expressed or implied, and reported results should not be considered as an indication of future performance.
Risks that contribute to the uncertain nature of the forward-looking statements include, among others, the Company’s ability to deal with the substantial and increasingly intense competition in its industry; changes to the rules and practices of payment card networks and acquiring processors; the effect of evolving regulations and oversight related to the Company’s provision of payments services and other financial services; the effect of management changes and business initiatives; and changes in political, business, and economic conditions; as well as other risks listed or described from time to time in the Company’s filings with the Securities and Exchange Commission (the SEC), including the Company’s Quarterly Report on Form 10-Q for the fiscal quarter ended September 30, 2017, which is on file with the SEC and available on the investor relations page of the Company’s website. Additional information will also be set forth in the Company’s Annual Report on Form 10-K for the fiscal year ended December 31, 2017. Except as required by law, the Company assumes no obligation to update any of the statements in this letter.
KEY OPERATING METRICS AND NON-GAAP FINANCIAL MEASURES
To supplement our financial information presented in accordance with generally accepted accounting principles in the United States (GAAP), we consider certain operating and financial measures that are not prepared in accordance with GAAP, including Gross Payment Volume, Adjusted Revenue, Adjusted EBITDA, Adjusted EBITDA margin, Adjusted Net Income (Loss), Adjusted EPS, and non-GAAP operating expenses. We believe these metrics and measures are useful to facilitate period-to-period comparisons of our business and to facilitate comparisons of our performance to that of other payments solution providers. Each of these metrics and measures excludes the effect of our processing agreement with Starbucks, which transitioned to another payments solutions provider in the fourth quarter of 2016. As we do not expect transactions with Starbucks to recur, we believe it is useful to exclude Starbucks activity to clearly show the impact Starbucks has had on our financial results historically. Our agreements with other sellers generally provide both those sellers and us the unilateral right to terminate such agreements at any time, without fine or penalty.
We define Gross Payment Volume (GPV) as the total dollar amount of all card payments processed by sellers using Square, net of refunds. Additionally, GPV includes Cash App activity related to peer-to-peer payments sent from a credit card, and Cash for Business.
Adjusted Revenue is a non-GAAP financial measure that we define as our total net revenue less transaction-based costs, adjusted to eliminate the effect of activity with Starbucks. As described above, Starbucks completed its previously announced transition to another payments provider and has ceased using our payments solutions altogether, and we believe that providing Adjusted Revenue metrics that exclude the impact of our agreement with Starbucks is useful to investors. We believe it is useful to subtract transaction-based costs from total net revenue to derive Adjusted Revenue as this is a primary metric used by management to measure our business performance, and it affords greater comparability to other payments solution providers. Adjusted Revenue has limitations as a financial measure, should be considered as supplemental in nature, and is not meant as a substitute for the related financial information prepared in accordance with GAAP. As described above, GPV excludes card payments processed for Starbucks.
Adjusted EBITDA, Adjusted Net Income (Loss), Adjusted EPS, and non-GAAP operating expenses are non-GAAP financial measures that represent our net loss and net loss per share, adjusted to eliminate the effect of Starbucks transaction-based revenue, Starbucks transaction-based costs, share-based compensation expenses, amortization of intangible assets, amortization of debt discount and issuance costs in connection with our offering of convertible senior notes in the first quarter of 2017, the litigation settlement with Robert E. Morley, the gain or loss on the sale of property and equipment, and impairment of intangible assets, as applicable. In addition to the items above, Adjusted EBITDA and non-GAAP operating expenses are non-GAAP financial measures that also exclude depreciation, other cash interest income and expense, other income and expense, and provision or benefit from income taxes, as applicable. Basic Adjusted Net Income (Loss) Per Share is computed by dividing the Adjusted Net Income (Loss) by the weighted-average number of shares of common stock outstanding during the period. Diluted Adjusted Net Income Per Share is computed by dividing Adjusted Net Income by the weighted-average number of shares of common stock outstanding, adjusted for the dilutive effect of all potential shares of common stock. In periods when we recorded an Adjusted Net Loss, the Diluted Adjusted Net Loss Per Share is the same as Basic Adjusted Net Loss Per Share because the effects of potentially dilutive items were anti-dilutive given the Adjusted Net Loss position.
We have included Adjusted EBITDA and Adjusted EPS because they are key measures used by our management to evaluate our operating performance, generate future operating plans, and make strategic decisions, including those relating to operating expenses and the allocation of internal resources.
14
Accordingly, we believe that Adjusted EBITDA and Adjusted EPS provide useful information to investors and others in understanding and evaluating our operating results in the same manner as our management and board of directors. In addition, they provide useful measures for period-to-period comparisons of our business, as they remove the effect of certain non-cash items and certain variable charges. Adjusted EBITDA and Adjusted EPS have limitations as financial measures, should be considered as supplemental in nature, and are not meant as substitutes for the related financial information prepared in accordance with GAAP.
These non-GAAP financial measures should not be considered in isolation from, or as a substitute for, financial information prepared in accordance with GAAP. These non-GAAP financial measures are not based on any standardized methodology prescribed by GAAP and are not necessarily comparable to similarly titled measures presented by other companies.
15
| Consolidated Statements of Operations | UNAUDITED | |
| In thousands, except per share data |
| THREE MONTHS ENDED | YEAR ENDED | |||||||||||||||
| Dec 31, 2017 | Dec 31, 2016 | Dec 31, 2017 | Dec 31, 2016 | |||||||||||||
| Revenue: |
||||||||||||||||
| Transaction-based revenue |
$ | 524,612 | $ | 402,496 | $ | 1,920,174 | $ | 1,456,160 | ||||||||
| Starbucks transaction-based revenue |
— | 34 | — | 78,903 | ||||||||||||
| Subscription and services-based revenue |
79,402 | 40,518 | 252,664 | 129,351 | ||||||||||||
| Hardware revenue |
12,021 | 8,869 | 41,415 | 44,307 | ||||||||||||
|
|
|
|
|
|
|
|
||||||||||
| Total net revenue |
616,035 | 451,917 | 2,214,253 | 1,708,721 | ||||||||||||
|
|
|
|
|
|
|
|
||||||||||
| Cost of revenue: |
||||||||||||||||
| Transaction-based costs |
333,377 | 260,006 | 1,230,290 | 943,200 | ||||||||||||
| Starbucks transaction-based costs |
— | (49) | — | 69,761 | ||||||||||||
| Subscription and services-based costs |
24,559 | 11,431 | 75,720 | 43,132 | ||||||||||||
| Hardware costs |
16,783 | 12,118 | 62,393 | 68,562 | ||||||||||||
| Amortization of acquired technology |
1,486 | 1,886 | 6,544 | 8,028 | ||||||||||||
|
|
|
|
|
|
|
|
||||||||||
| Total cost of revenue |
376,205 | 285,392 | 1,374,947 | 1,132,683 | ||||||||||||
|
|
|
|
|
|
|
|
||||||||||
| Gross profit |
239,830 | 166,525 | 839,306 | 576,038 | ||||||||||||
|
|
|
|
|
|
|
|
||||||||||
| Operating expenses: |
||||||||||||||||
| Product development |
92,633 | 64,889 | 321,888 | 268,537 | ||||||||||||
| Sales and marketing |
76,821 | 49,406 | 253,170 | 173,876 | ||||||||||||
| General and administrative |
66,318 | 53,027 | 250,553 | 251,993 | ||||||||||||
| Transaction, loan and advance losses |
16,833 | 13,034 | 67,018 | 51,235 | ||||||||||||
| Amortization of acquired customer assets |
234 | 147 | 883 | 850 | ||||||||||||
|
|
|
|
|
|
|
|
||||||||||
| Total operating expenses |
252,839 | 180,503 | 893,512 | 746,491 | ||||||||||||
|
|
|
|
|
|
|
|
||||||||||
| Operating loss |
(13,009) | (13,978) | (54,206) | (170,453) | ||||||||||||
|
|
|
|
|
|
|
|
||||||||||
| Interest and other (income) and expense, net |
2,839 | 153 | 8,458 | (780) | ||||||||||||
|
|
|
|
|
|
|
|
||||||||||
| Loss before income tax |
(15,848) | (14,131) | (62,664) | (169,673) | ||||||||||||
|
|
|
|
|
|
|
|
||||||||||
| Provision for income taxes |
(185) | 1,036 | 149 | 1,917 | ||||||||||||
|
|
|
|
|
|
|
|
||||||||||
| Net loss |
$ | (15,663) | (15,167) | (62,813) | (171,590) | |||||||||||
|
|
|
|
|
|
|
|
||||||||||
| Net loss per share: |
||||||||||||||||
| Basic |
$ | (0.04) | $ | (0.04) | $ | (0.17) | $ | (0.50) | ||||||||
|
|
|
|
|
|
|
|
||||||||||
| Diluted |
$ | (0.04) | $ | (0.04) | $ | (0.17) | $ | (0.50) | ||||||||
|
|
|
|
|
|
|
|
||||||||||
| Weighted-average shares used to compute net loss per share: |
||||||||||||||||
| Basic |
390,030 | 356,343 | 379,344 | 341,555 | ||||||||||||
|
|
|
|
|
|
|
|
||||||||||
| Diluted |
390,030 | 356,343 | 379,344 | 341,555 | ||||||||||||
|
|
|
|
|
|
|
|
||||||||||
16
| Consolidated Balance Sheets | UNAUDITED In thousands, except share and per share data |
| Assets | Dec 31, 2017 | Dec 31, 2016 | ||||||||
| Current assets: | ||||||||||
| Cash and cash equivalents |
$ | 696,474 | $ | 452,030 | ||||||
| Short-term investments |
|
169,576 | 59,901 | |||||||
| Restricted cash |
28,805 | 22,131 | ||||||||
| Settlements receivable |
620,523 | 321,102 | ||||||||
| Customer funds |
103,042 | 43,574 | ||||||||
| Loans held for sale |
73,420 | 42,144 | ||||||||
| Other current assets |
86,454 | 60,543 | ||||||||
|
|
|
|
||||||||
| Total current assets | 1,778,294 | 1,001,425 | ||||||||
|
|
|
|
||||||||
| Property and equipment, net | 91,496 | 88,328 | ||||||||
| Goodwill | 58,327 | 57,173 | ||||||||
| Acquired intangible assets, net | 14,334 | 19,292 | ||||||||
| Long-term investments | 203,667 | 27,366 | ||||||||
| Restricted cash | 9,802 | 14,584 | ||||||||
| Other non-current assets | 31,350 | 3,194 | ||||||||
|
|
|
|
||||||||
| Total assets | $ | 2,187,270 | $ | 1,211,362 | ||||||
|
|
|
|
||||||||
| Liabilities and Stockholders’ Equity | ||||||||||
| Current liabilities: | ||||||||||
| Accounts payable |
$ | 16,763 | $ | 12,602 | ||||||
| Customers payable |
733,736 | 431,632 | ||||||||
| Settlements payable |
114,788 | 51,151 | ||||||||
| Accrued transaction losses |
26,893 | 20,064 | ||||||||
| Accrued expenses |
52,280 | 39,543 | ||||||||
| Other current liabilities |
28,367 | 22,472 | ||||||||
|
|
|
|
||||||||
| Total current liabilities | 972,827 | 577,464 | ||||||||
|
|
|
|
||||||||
| Long-term debt | 358,572 | — | ||||||||
|
|
|
|
||||||||
| Other non-current liabilities | 69,538 | 57,745 | ||||||||
|
|
|
|
||||||||
| Total liabilities | 1,400,937 | 635,209 | ||||||||
|
|
|
|
||||||||
| Commitments and contingencies | ||||||||||
| Stockholders’ equity: | ||||||||||
| Preferred stock, $0.0000001 par value: 100,000,000 shares authorized at December 31, 2017 and December 31, 2016. None issued and outstanding at December 31, 2017 and |
||||||||||
| December 31, 2016. |
— | — | ||||||||
| Class A common stock, $0.0000001 par value: 1,000,000,000 shares authorized at |
||||||||||
| December 31, 2017 and December 31, 2016; 280,400,813 and 198,746,620 issued and outstanding at December 31, 2017 and December 31, 2016, respectively. |
— | — | ||||||||
| Class B common stock, $0.0000001 par value: 500,000,000 shares authorized at |
||||||||||
| December 31, 2017 and December 31, 2016; 114,793,262 and 165,800,756 issued and outstanding at December 31, 2017 and December 31, 2016, respectively. |
— | — | ||||||||
| Additional paid-in capital |
1,630,386 | 1,357,381 | ||||||||
| Accumulated other comprehensive loss |
(1,318) | (1,989) | ||||||||
| Accumulated deficit |
(842,735) | (779,239) | ||||||||
|
|
|
|
||||||||
| Total stockholders’ equity | 786,333 | 576,153 | ||||||||
|
|
|
|
||||||||
| Total liabilities and stockholders’ equity | $ | 2,187,270 | $ | 1,211,362 | ||||||
|
|
|
|
||||||||
17
| Consolidated Statements of Cash Flows | UNAUDITED In thousands |
| YEAR ENDED | ||||||||||
| Cash Flows from Operating Activities | Dec 31, 2017 | Dec 31, 2016 | ||||||||
| Net loss | $ | (62,813) | $ | (171,590) | ||||||
| Adjustments to reconcile net loss to net cash (used in) provided by operating activities: | ||||||||||
| Depreciation and amortization |
37,279 | 37,745 | ||||||||
| Non-cash interest and other expense |
14,421 | (49) | ||||||||
| Share-based compensation |
155,836 | 138,786 | ||||||||
| Transaction, loan and advance losses |
67,018 | 51,235 | ||||||||
| Deferred provision (benefit) for income taxes |
(1,385) | 58 | ||||||||
| Changes in operating assets and liabilities: |
||||||||||
| Settlements receivable |
(305,831) | (177,662) | ||||||||
| Customer funds |
(59,468) | (34,128) | ||||||||
| Purchase of loans held for sale |
(1,184,630) | (668,976) | ||||||||
| Sales and principal payments of loans held for sale |
1,145,314 | 627,627 | ||||||||
| Other current assets |
(26,119) | 16,116 | ||||||||
| Other non-current assets |
(3,274) | 631 | ||||||||
| Accounts payable |
4,515 | (2,147) | ||||||||
| Customers payable |
301,778 | 206,574 | ||||||||
| Settlements payable |
63,637 | 38,046 | ||||||||
| Charge-offs to accrued transaction losses |
(46,148) | (47,931) | ||||||||
| Accrued expenses |
12,207 | (409) | ||||||||
| Other current liabilities |
3,683 | 6,056 | ||||||||
| Other non-current liabilities |
11,691 | 3,149 | ||||||||
|
|
|
|
||||||||
| Net cash provided by operating activities |
127,711 | 23,131 | ||||||||
|
|
|
|
||||||||
| Cash Flows from Investing Activities | ||||||||||
| Purchase of marketable securities |
(544,910) | (164,766) | ||||||||
| Proceeds from maturities of marketable securities |
168,224 | 43,200 | ||||||||
| Proceeds from sale of marketable securities |
89,087 | 34,222 | ||||||||
| Purchase of property and equipment |
(26,097) | (25,433) | ||||||||
| Proceeds from sale of property and equipment |
— | 296 | ||||||||
| Payments for investment in privately held entity |
(25,000) | — | ||||||||
| Payment for acquisition of intangible assets |
— | (400) | ||||||||
| Business acquisitions, net of cash acquired |
(1,915) | (1,360) | ||||||||
|
|
|
|
||||||||
| Net cash used in investing activities: |
(340,611) | (114,241) | ||||||||
|
|
|
|
||||||||
18
| Consolidated Statements of Cash Flows (continued) | UNAUDITED In thousands |
| YEAR ENDED | ||||||||||
| Cash Flows from Financing Activities | Dec 31, 2017 | Dec 31, 2016 | ||||||||
| Proceeds from issuance of convertible senior notes, net |
428,250 | — | ||||||||
| Purchase of convertible senior note hedges |
(92,136) | — | ||||||||
| Proceeds from issuance of warrants |
57,244 | — | ||||||||
| Payment for termination of Starbucks warrant |
(54,808) | — | ||||||||
| Payments of offering costs related to initial public offering |
— | (5,530) | ||||||||
| Principal payments on capital lease obligation |
(1,439) | (168) | ||||||||
| Proceeds from the exercise of stock options and purchases under the employee stock purchase plan, net |
162,504 | 96,439 | ||||||||
| Payments for tax withholding related to vesting of restricted stock units |
(44,682) | — | ||||||||
|
|
|
|
||||||||
| Net cash provided by financing activities |
454,933 | 90,741 | ||||||||
|
|
|
|
||||||||
| Effect of foreign exchange rate on cash and cash equivalents |
4,303 | (438) | ||||||||
|
|
|
|
||||||||
| Net increase (decrease) in cash, cash equivalents and restricted cash |
245,336 | (807) | ||||||||
| Cash, cash equivalents and restricted cash, beginning of the year | 488,745 | 489,552 | ||||||||
|
|
|
|
||||||||
| Cash, cash equivalents and restricted cash, end of the year | $ | 735,081 | $ | 488,745 | ||||||
|
|
|
|
||||||||
19
| Key Operating Metrics and Non-GAAP Financial Measures | UNAUDITED | |
| In thousands, except GPV and per share data |
| THREE MONTHS ENDED | YEAR ENDED | |||||||||||||||
| Dec 31, 2017 | Dec 31, 2016 | Dec 31, 2017 | Dec 31, 2016 | |||||||||||||
| GPV (in millions) | $ | 17,888 | $ | 13,694 | $ | 65,343 | $ | 49,683 | ||||||||
| Adjusted Revenue | $ | 282,658 | $ | 191,877 | $ | 983,963 | $ | 686,618 | ||||||||
| Adjusted EBITDA | $ | 41,184 | $ | 29,793 | $ | 139,009 | $ | 44,887 | ||||||||
| Adjusted Net Income (Loss) Per Share: | ||||||||||||||||
| Basic |
$ | 0.09 | $ | 0.06 | $ | 0.30 | $ | 0.04 | ||||||||
| Diluted |
$ | 0.08 | $ | 0.05 | $ | 0.27 | $ | 0.04 | ||||||||
|
Adjusted Revenue Reconciliation |
UNAUDITED | |||||||||||||||
|
|
In thousands
|
| ||||||||||||||
| THREE MONTHS ENDED | YEAR ENDED | |||||||||||||||
| Dec 31, 2017 | Dec 31, 2016 | Dec 31, 2017 | Dec 31, 2016 | |||||||||||||
| Total net revenue | $ | 616,035 | $ | 451,917 | $ | 2,214,253 | $ | 1,708,721 | ||||||||
| Less: Starbucks transaction-based revenue | — | 34 | — | 78,903 | ||||||||||||
| Less: transaction-based costs | 333,377 | 260,006 | 1,230,290 | 943,200 | ||||||||||||
|
|
|
|
|
|
|
|
||||||||||
| Adjusted Revenue |
$ | 282,658 | $ | 191,877 | $ | 983,963 | $ | 686,618 | ||||||||
|
|
|
|
|
|
|
|
||||||||||
|
Adjusted EBITDA Reconciliation |
UNAUDITED | |||||||||||||||
|
|
In thousands
|
| ||||||||||||||
| THREE MONTHS ENDED | YEAR ENDED | |||||||||||||||
| Dec 31, 2017 | Dec 31, 2016 | Dec 31, 2017 | Dec 31, 2016 | |||||||||||||
| Net loss | $ | (15,663) | $ | (15,167) | $ | (62,813) | $ | (171,590) | ||||||||
| Starbucks transaction-based revenue | — | (34) | — | (78,903) | ||||||||||||
| Starbucks transaction-based costs | — | (49) | — | 69,761 | ||||||||||||
| Share-based compensation expense | 44,525 | 33,887 | 155,836 | 138,786 | ||||||||||||
| Depreciation and amortization | 9,632 | 9,928 | 37,279 | 37,745 | ||||||||||||
| Litigation settlement expense | — | — | — | 48,000 | ||||||||||||
| Interest and other (income) expense, net | 2,839 | 153 | 8,458 | (780) | ||||||||||||
| Provision (benefit) for income taxes | (185) | 1,036 | 149 | 1,917 | ||||||||||||
| Loss (gain) on sale of property and equipment | 36 | 39 | 100 | (49) | ||||||||||||
|
|
|
|
|
|
|
|
||||||||||
| Adjusted EBITDA |
$ | 41,184 | $ | 29,793 | $ | 139,009 | $ | 44,887 | ||||||||
|
|
|
|
|
|
|
|
||||||||||
20
| Adjusted Net Income (Loss) Reconciliation | UNAUDITED | |
| In thousands, except per share data |
| THREE MONTHS ENDED | YEAR ENDED | |||||||||||||||
| Dec 31, 2017 | Dec 31, 2016 | Dec 31, 2017 | Dec 31, 2016 | |||||||||||||
| Net loss | $ | (15,663) | $ | (15,167) | $ | (62,813) | $ | (171,590) | ||||||||
| Starbucks transaction-based revenue | — | (34) | — | (78,903) | ||||||||||||
| Starbucks transaction-based costs | — | (49) | — | 69,761 | ||||||||||||
| Share-based compensation expense | 44,525 | 33,887 | 155,836 | 138,786 | ||||||||||||
| Amortization of intangible assets | 1,747 | 2,090 | 7,615 | 9,013 | ||||||||||||
| Litigation settlement expense | — | — | — | 48,000 | ||||||||||||
| Amortization of debt discount and issuance costs | 4,335 | — | 14,223 | — | ||||||||||||
| Loss (gain) on sale of property and equipment | 36 | 39 | 100 | (49) | ||||||||||||
|
|
|
|
|
|
|
|
||||||||||
| Adjusted Net Income (Loss) |
$ | 34,980 | $ | 20,766 | $ | 114,961 | $ | 15,018 | ||||||||
|
|
|
|
|
|
|
|
||||||||||
| Adjusted Net Income (Loss) Per Share: |
||||||||||||||||
| Basic |
$ | 0.09 | $ | 0.06 | $ | 0.30 | $ | 0.04 | ||||||||
|
|
|
|
|
|
|
|
||||||||||
| Diluted |
$ | 0.08 | $ | 0.05 | $ | 0.27 | $ | 0.04 | ||||||||
|
|
|
|
|
|
|
|
||||||||||
| Weighted-average shares used to compute Adjusted Net Income (Loss) Per Share: |
||||||||||||||||
|
Basic |
390,030 | 356,343 | 379,344 | 341,555 | ||||||||||||
|
|
|
|
|
|
|
|
||||||||||
| Diluted |
450,703 | 382,531 | 426,519 | 370,258 | ||||||||||||
|
|
|
|
|
|
|
|
||||||||||
| Adjusted Revenue Guidance Reconciliation | UNAUDITED | |
| In thousands |
| THREE MONTHS ENDED | YEAR ENDED | |||||||
| Dec 31, 2017 | Dec 31, 2017 | |||||||
| Total net revenue | $ | 605,000 - 620,000 | $ | 2,820,000 - 2,880,000 | ||||
| Less: Transaction-based costs | 315,000 - 325,000 | 1,520,000 - 1,550,000 | ||||||
|
|
|
|
||||||
| Adjusted Revenue |
$ | 290,000 - 295,000 | $ | 1,300,000 - 1,330,000 | ||||
|
|
|
|
||||||
21
| Non-GAAP Operating Expenses | |
UNAUDITED In thousands |
|
| THREE MONTHS ENDED | YEAR ENDED | |||||||||||||||
| Dec 31, 2017 | Dec 31, 2016 | Dec 31, 2017 | Dec 31, 2016 | |||||||||||||
| Operating expenses | $ | (252,839) | $ | (180,503) | $ | (893,512) | $ | (746,491) | ||||||||
| Share-based compensation | 44,495 | 33,887 | 155,759 | 138,786 | ||||||||||||
| Depreciation and amortization | 8,115 | 7,544 | 30,544 | 27,536 | ||||||||||||
| Litigation settlement expense | — | — | — | 48,000 | ||||||||||||
| Loss (gain) on sale of property and equipment | 36 | 39 | 100 | (49) | ||||||||||||
|
|
|
|
|
|
|
|
||||||||||
| Non-GAAP operating expenses |
$ | (200,193) | $ | (139,033) | $ | (707,109) | $ | (532,218) | ||||||||
|
|
|
|
|
|
|
|
||||||||||
| Product development | $ | (92,633) | $ | (64,889) | $ | (321,888) | $ | (268,537) | ||||||||
| Share-based compensation | 28,564 | 21,340 | 98,310 | 91,404 | ||||||||||||
| Depreciation and amortization | 5,221 | 3,639 | 16,955 | 13,190 | ||||||||||||
| Loss (gain) on sale of property and equipment | — | — | — | — | ||||||||||||
|
|
|
|
|
|
|
|
||||||||||
| Non-GAAP product development |
$ | (58,848) | $ | (39,910) | $ | (206,623) | $ | (163,943) | ||||||||
|
|
|
|
|
|
|
|
||||||||||
| Sales and marketing | $ | (76,821) | $ | (49,406) | $ | (253,170) | $ | (173,876) | ||||||||
| Share-based compensation | 4,699 | 4,159 | 17,568 | 14,122 | ||||||||||||
| Depreciation and amortization | 590 | 17 | 1,415 | 30 | ||||||||||||
| Loss (gain) on sale of property and equipment | 36 | 41 | 158 | 73 | ||||||||||||
|
|
|
|
|
|
|
|
||||||||||
| Non-GAAP sales and marketing |
$ | (71,496) | $ | (45,189) | $ | (234,029) | $ | (159,651) | ||||||||
|
|
|
|
|
|
|
|
||||||||||
| General and administrative | $ | (66,318) | $ | (53,027) | $ | (250,553) | $ | (251,993) | ||||||||
| Share-based compensation | 11,232 | 8,388 | 39,881 | 33,260 | ||||||||||||
| Depreciation and amortization | 2,070 | 3,741 | 11,291 | 13,466 | ||||||||||||
| Litigation settlement expense | — | — | — | 48,000 | ||||||||||||
| Loss (gain) on sale of property and equipment | — | (2) | (58) | (122) | ||||||||||||
|
|
|
|
|
|
|
|
||||||||||
| Non-GAAP general and administrative |
$ | (53,016) | $ | (40,900) | $ | (199,439) | $ | (157,389) | ||||||||
|
|
|
|
|
|
|
|
||||||||||
| Depreciation and Amortization by Function | |
UNAUDITED In thousands |
|
| THREE MONTHS ENDED | YEAR ENDED | |||||||||||||||
| Dec 31, 2017 | Dec 31, 2016 | Dec 31, 2017 | Dec 31, 2016 | |||||||||||||
| Cost of revenue | $ | 1,517 | $ | 2,384 | $ | 6,735 | $ | 10,209 | ||||||||
| Product development | 5,221 | 3,639 | 16,955 | 13,190 | ||||||||||||
| Sales and marketing | 590 | 17 | 1,415 | 30 | ||||||||||||
| General and administrative | 2,070 | 3,741 | 11,291 | 13,466 | ||||||||||||
| Amortization of acquired customer assets | 234 | 147 | 883 | 850 | ||||||||||||
|
|
|
|
|
|
|
|
||||||||||
| Total depreciation and amortization |
$ | 9,632 | $ | 9,928 | $ | 37,279 | $ | 37,745 | ||||||||
|
|
|
|
|
|
|
|
||||||||||
22