Attached files
_____________________________________________________________________________________________________________________________________________________________________________
UNITED STATES
SECURITIES AND EXCHANGE COMMISSION
WASHINGTON, D.C. 20549
___________________________
FORM 10-K
þ ANNUAL REPORT PURSUANT TO SECTION 13 OR 15(d) OF THE SECURITIES EXCHANGE ACT OF 1934
For the fiscal year ended December 31, 2017
OR
¨ TRANSITION REPORT PURSUANT TO SECTION 13 OR 15(d) OF THE SECURITIES EXCHANGE ACT OF 1934
For the transition period from _____ to _____
Commission File No. 001-35674
REALOGY HOLDINGS CORP.
(Exact name of registrant as specified in its charter)
20-8050955
(I.R.S. Employer Identification Number)
Commission File No. 333-148153
REALOGY GROUP LLC
(Exact name of registrant as specified in its charter)
20-4381990
(I.R.S. Employer Identification Number)
Delaware
(State or other jurisdiction of incorporation or organization)
175 Park Avenue
Madison, NJ 07940
(Address of principal executive offices) (Zip Code)
(973) 407-2000
(Registrants' telephone number, including area code)
Securities registered pursuant to Section 12(b) of the Act: | |||
Title of each class | Name of each exchange on which registered | ||
Realogy Holdings Corp. | Common Stock, par value $0.01 per share | New York Stock Exchange | |
Realogy Group LLC | None | None | |
Securities registered pursuant to Section 12(g) of the Act: None
___________________________
Indicate by check mark if the Registrant is a well-known seasoned issuer, as defined in Rule 405 of the Securities Act.
Realogy Holdings Corp. Yes þ No ¨ Realogy Group LLC Yes ¨ No þ
Indicate by check mark if the Registrant is not required to file reports pursuant to Section 13 or Section 15(d) of the Exchange Act.
Realogy Holdings Corp. Yes ¨ No þ Realogy Group LLC Yes þ No ¨
Indicate by check mark whether the Registrant (1) has filed all reports required to be filed by Section 13 or 15(d) of the Securities Exchange Act of 1934 during the preceding 12 months (or for such shorter period that the registrant was required to file such reports), and (2) has been subject to such filing requirements for the past 90 days.
Realogy Holdings Corp. Yes þ No ¨ Realogy Group LLC Yes ¨ No þ
Indicate by check mark whether the Registrant has submitted electronically and posted on its corporate Web site, if any, every Interactive Data File required to be submitted and posted pursuant to Rule 405 of Regulation S-T (§ 232.405 of this chapter) during the preceding 12 months (or for such shorter period that the Registrant was required to submit and post such files).
Realogy Holdings Corp. Yes þ No ¨ Realogy Group LLC Yes þ No ¨
Indicate by check mark if disclosure of delinquent filer pursuant to Item 405 of Regulation S-K is not contained herein, and will not be contained, to the best of Registrant's knowledge, in definitive proxy or information statements incorporated by reference in Part III of this Form 10-K or any amendment to this Form 10-K.
Realogy Holdings Corp. þ Realogy Group LLC þ
Indicate by check mark whether the Registrant is a large accelerated filer, an accelerated filer, a non-accelerated filer, smaller reporting company, or an emerging growth company. See the definitions of "large accelerated filer," "accelerated filer," "smaller reporting company," and "emerging growth company" in Rule 12b-2 of the Exchange Act.
Large accelerated filer | Accelerated filer | Non-accelerated filer (Do not check if a smaller reporting company) | Smaller reporting company | Emerging growth company | |||||
Realogy Holdings Corp. | þ | ¨ | ¨ | ¨ | ¨ | ||||
Realogy Group LLC | ¨ | ¨ | þ | ¨ | ¨ | ||||
If an emerging growth company, indicate by check mark if the registrant has elected not to use the extended transition period for complying with any new or revised financial accounting standards provided pursuant to Section 13(a) of the Exchange Act. ¨
Indicate by check mark whether the Registrant is a shell company (as defined in Rule 12b-2 of the Exchange Act).
Realogy Holdings Corp. Yes ¨ No þ Realogy Group LLC Yes ¨ No þ
The aggregate market value of the voting and non-voting common equity of Realogy Holdings Corp. held by non-affiliates as of the close of business on June 30, 2017 was $4.4 billion. There were 130,150,797 shares of Common Stock, $0.01 par value, of Realogy Holdings Corp. outstanding as of February 23, 2018.
Realogy Group LLC meets the conditions set forth in General Instruction I(1)(a) and (b) of Form 10-K and is therefore filing this Form with the reduced disclosure format applicable to Realogy Group LLC.
DOCUMENTS INCORPORATED BY REFERENCE
Portions of the Proxy Statement prepared for the Annual Meeting of Stockholders to be held May 2, 2018 are incorporated by reference into Part III of this report.
_______________________________________________________________________________________________________________________________________________________________________________
PART I | ||
Item 1. | ||
Item 1A. | ||
Item 2. | ||
Item 3. | ||
Item 4. | ||
PART II | ||
Item 5. | ||
Item 6. | ||
Item 7. | ||
Item 7A. | ||
Item 8. | ||
Item 9. | ||
Item 9A. | ||
Item 9B. | ||
PART III | ||
Item 10. | ||
Item 11. | ||
Item 12. | ||
Item 13. | ||
Item 14. | ||
PART IV | ||
Item 15. | ||
Item 16. | ||
FORWARD-LOOKING STATEMENTS
Forward-looking statements included in this Annual Report and our other public filings or other public statements that we make from time to time are based on various facts and derived utilizing numerous important assumptions and are subject to known and unknown risks, uncertainties and other factors that may cause our actual results, performance or achievements to be materially different from any future results, performance or achievements expressed or implied by such forward-looking statements. Forward-looking statements include the information concerning our future financial performance, business strategy, projected plans and objectives, as well as projections of macroeconomic and industry trends, which are inherently unreliable due to the multiple factors that impact economic trends, and any such variations may be material. Statements preceded by, followed by or that otherwise include the words "believes," "expects," "anticipates," "intends," "projects," "estimates," "plans," and similar expressions or future or conditional verbs such as "will," "should," "would," "may" and "could" are generally forward-looking in nature and not historical facts. You should understand that the following important factors could affect our future results and cause actual results to differ materially from those expressed in the forward-looking statements:
• | risks related to general business, economic, employment and political conditions and the U.S. residential real estate markets, either regionally or nationally, including but not limited to: |
◦ | a lack of improvement or a decline in the number of homesales, stagnant or declining home prices and/or a deterioration in other economic factors that particularly impact the residential real estate market and the business segments in which we operate whether broadly or by geography and price segments; |
◦ | increasing mortgage rates and/or constraints on the availability of mortgage financing; |
◦ | insufficient or excessive home inventory levels by market and price point; |
◦ | deceleration in the building of new housing and/or irregular timing or volume of new development closings; |
◦ | a decrease in consumer confidence; |
◦ | the impact of recessions, slow economic growth, disruptions in the U.S. government or banking system, disruptions in a major geoeconomic region, or equity or commodity markets and high levels of unemployment in the U.S. and abroad, which may impact all or a portion of the housing markets in which we and our franchisees operate; |
◦ | the potential negative impact of certain provisions of the Tax Cuts and Jobs Act of 2017 (the “2017 Tax Act”) (i) on home values over time in states with high property, sales and state and local income taxes as the deductibility of such taxes is now capped at $10,000 and (ii) on homeownership rates given a narrowing of potential tax-related advantages to owning compared to renting given higher standard deductions available to all taxpayers; |
◦ | other legislative, tax or regulatory changes (including changes in regulatory interpretations or enforcement practices) that would adversely impact the residential real estate market, including changes relating to the Real Estate Settlement Procedures Act ("RESPA"), potential reforms of Fannie Mae and Freddie Mac, immigration reform, and further potential tax code reform; |
◦ | a decrease in housing affordability due to higher mortgage rates and increases in average homesale prices; |
◦ | high levels of foreclosure activity; |
◦ | changing attitudes toward home ownership compared to renting, including among potential first-time homebuyers who may delay, or decide not to, purchase a home, as well as existing homeowners who may decide to sell their home and rent their next home; and |
◦ | the inability or unwillingness of current homeowners to purchase their next home due to various factors, including limited or negative equity in their current home, difficult mortgage underwriting standards, attractive rates on existing mortgages and the lack of available inventory in their market; |
• | increased competition whether through traditional competitors, other industry participants or competitors with alternative business models (such as flat fee, capped fee or desk fee models) including companies employing technologies intended to disrupt the traditional brokerage model, as well as eliminating brokers or agents from, or minimizing the role they play in, the homesale transaction, such as reducing brokerage commissions, and companies otherwise competing for a portion of gross commission income; |
• | competition for more productive sales agents and sales agent teams will continue to impact the ability of our company owned brokerage business and our affiliated franchisees to attract and retain independent sales agents, either individually or as members of a team, and will result in continuing pressure on the share of gross |
1
commission income paid by our company owned brokerages and our affiliated franchisees to their independent affiliated sales agents;
• | the failure to attract and retain managers of our company owned brokerage offices who have primary responsibility for the recruitment and retention of independent sales agents for those offices; |
• | our geographic and high-end market concentration, particularly with respect to our company owned brokerage operations, including the impact of the 2017 Tax Act; |
• | our inability to enter into franchise agreements with new franchisees or renew existing franchise agreements at current contractual royalty rates without increasing the amount and prevalence of sales incentives, including non-standard incentives, to realize royalty revenue growth from them, or to maintain or enhance our value proposition to franchisees; |
• | the lack of revenue growth or declining profitability of our franchisees and company owned brokerage operations, including the impact of lower average broker commission rates; |
• | changes in corporate relocation practices resulting in fewer employee relocations, reduced relocation benefits (including the impact from the change in the way home moving expenses are treated for tax purposes under the 2017 Tax Act), increasing competition in corporate relocation or the loss of one or more significant affinity clients; |
• | an increase in the experienced claims losses of our title underwriter could adversely impact the earnings of our title and settlement services segment; |
• | our inability to develop or hire skilled executives and other key employees or challenges associated with change management may impact our ability to continue to execute or evolve our strategy; |
• | our inability to successfully develop or obtain new technologies and systems, to replace or introduce new technologies and systems as quickly as our competitors and in a cost-effective manner or to achieve the benefits anticipated from new technologies or systems; |
• | our inability to leverage real-time data analytics to support our company owned and franchisee real estate brokerages, affiliated independent sales agents and their customers as well as our relocation and title and settlement services segments; |
• | disputes or issues with entities that license us their tradenames for use in our business or events that negatively impact their brands that could impede our franchising of those brands; |
• | actions by our franchisees that could harm our business or reputation, non-performance of our franchisees, controversies with our franchisees or actions against us by their independent sales agents or employees or third parties with which our franchisees have business relationships; |
• | our inability to achieve or maintain cost savings and other benefits from our restructuring activities; |
• | our inability to realize the benefits from acquisitions due to the loss of key personnel or productive agents of the acquired companies, as well as the possibility that expected benefits and synergies of the transactions may not be achieved in a timely manner or at all; |
• | our failure or alleged failure to comply with laws, regulations and regulatory interpretations and any changes or stricter interpretations of any of the foregoing, including but not limited to (1) state or federal employment laws or regulations that would require reclassification of independent contractor sales agents to employee status, (2) RESPA or state consumer protection or similar laws and (3) privacy or data security laws and regulations; |
• | any adverse resolution of litigation, governmental or regulatory proceedings or arbitration awards as well as any adverse impact of decisions to voluntarily modify business arrangements or enter into settlement agreements to avoid the risk of protracted and costly litigation or other proceedings; |
• | risks and growing costs related to cybersecurity threats to our data and customer, franchisee, employee and independent sales agent data, including but not limited to the failure or significant disruption of our operations and our obligations with respect to lost data, the increasing level and sophistication of cybersecurity attacks aimed at compromising our systems and data (including via systems not directly controlled by us, such as those maintained by our franchisees, affiliated independent sales agents, joint venture partners and third party service providers, including our third-party relocation service providers), and the reputational or financial risks associated with a loss of data or material data breach or the diversion of homesale transaction closing funds; |
• | risks associated with our substantial indebtedness and interest obligations and restrictions contained in our debt agreements, including risks relating to having to dedicate a significant portion of our cash flows from operations to service our debt; |
2
• | risks relating to our ability to refinance or repay our indebtedness, incur additional indebtedness or return capital to stockholders; |
• | our inability to securitize certain assets of our relocation business, which would require us to find an alternative source of liquidity that may not be available, or if available, may not be on favorable terms; |
• | risks that could materially adversely impact our equity investment in our mortgage origination joint venture, including increases in mortgage rates, the impact of the transition from our former joint venture to our new joint venture, or operational or liquidity risks that may be faced by the joint venture, such as, regulatory changes, litigation, investigations and inquiries, or any termination of the venture; |
• | risks relating to the unfavorable impact on homesale activity due to severe weather events or natural disasters; |
• | any remaining resolutions or outcomes with respect to contingent liabilities of our former parent, Cendant Corporation ("Cendant"), under the Separation and Distribution Agreement and the Tax Sharing Agreement (described elsewhere in this Annual Report and incorporated by reference as exhibits to this Annual Report), including any adverse impact on our future cash flows; and |
• | new types of taxes or increases in state, local or federal taxes that could diminish profitability or liquidity. |
Other factors not identified above, including those described under "Item 1A.—Risk Factors" and "Item 7.—Management’s Discussion and Analysis of Financial Condition and Results of Operations" of this Annual Report, may also cause actual results to differ materially from those described in our forward-looking statements. Most of these factors are difficult to anticipate and are generally beyond our control. You should consider these factors in connection with any forward-looking statements that may be made by us and our businesses generally.
Except for our ongoing obligations to disclose material information under the federal securities laws, we undertake no obligation to release publicly any revisions to any forward-looking statements, to report events or to report the occurrence of unanticipated events unless we are required to do so by law. For any forward-looking statement contained in this Annual Report, our public filings or other public statements, we claim the protection of the safe harbor for forward-looking statements contained in the Private Securities Litigation Reform Act of 1995.
TRADEMARKS AND SERVICE MARKS
We own or have rights to use the trademarks, service marks and trade names that we use in conjunction with the operation of our business. Some of the more important trademarks that we own or have rights to use that appear in this Annual Report include the CENTURY 21®, COLDWELL BANKER®, ERA®, CORCORAN®, COLDWELL BANKER COMMERCIAL®, SOTHEBY’S INTERNATIONAL REALTY®, BETTER HOMES AND GARDENS® Real Estate, CLIMB REAL ESTATE®, CARTUS®, ZIPREALTY® and ZAPLABS® marks, which are registered in the United States and/or registered or pending registration in other jurisdictions, as appropriate to the needs of our relevant business. Each trademark, trade name or service mark of any other company appearing in this Annual Report is owned by such company.
MARKET AND INDUSTRY DATA AND FORECASTS
This Annual Report includes data, forecasts and information obtained from independent trade associations, industry publications and surveys and other information available to us. Some data is also based on our good faith estimates, which are derived from management’s knowledge of the industry and independent sources. As noted in this Annual Report, the National Association of Realtors ("NAR"), the Federal National Mortgage Association ("Fannie Mae") and the Federal Home Loan Mortgage Corporation ("Freddie Mac") were the primary sources for third-party industry data and forecasts. While data provided by NAR and Fannie Mae are two indicators of the direction of the residential housing market, we believe that homesale statistics will continue to vary between us and NAR and Fannie Mae because:
• | they use survey data and estimates in their historical reports and forecasting models, which are subject to sampling error, whereas we use data based on actual reported results; |
• | there are geographical differences and concentrations in the markets in which we operate versus the national market. For example, many of our company owned brokerage offices are geographically located where average homesale prices are generally higher than the national average and therefore NAR survey data will not correlate with NRT's results; |
• | comparability is also impaired due to NAR’s utilization of seasonally adjusted annualized rates whereas we report actual period-over-period changes and their use of median price for their forecasts compared to our average price; |
3
• | NAR historical data is subject to periodic review and revision and these revisions have been and could be material in the future; and |
• | NAR and Fannie Mae generally update their forecasts on a monthly basis and a subsequent forecast may change materially from a forecast that was previously issued. |
While we believe that the industry data presented herein is derived from the most widely recognized sources for reporting U.S. residential housing market statistical data, we do not endorse or suggest reliance on this data alone.
Forecasts regarding rates of home ownership, median sales price, volume of homesales, and other metrics included in this Annual Report to describe the housing industry are inherently uncertain or speculative in nature and actual results for any period could materially differ. Industry publications, surveys and forecasts generally state that the information contained therein has been obtained from sources believed to be reliable, but such information may not be accurate or complete. We have not independently verified any of the data from third-party sources nor have we ascertained the underlying economic assumptions relied upon therein. Statements as to our market position are based on market data currently available to us. While we are not aware of any misstatements regarding industry data provided herein, our estimates involve risks and uncertainties and are subject to change based upon various factors, including those discussed under the headings "Risk Factors" and "Forward-Looking Statements." Similarly, we believe our internal research is reliable, even though such research has not been verified by any independent sources.
4
PART I
Except as otherwise indicated or unless the context otherwise requires, the terms "we," "us," "our," "our company," "Realogy," "Realogy Holdings" and the "Company" refer to Realogy Holdings Corp., a Delaware corporation, and its consolidated subsidiaries, including Realogy Intermediate Holdings LLC, a Delaware limited liability company ("Realogy Intermediate"), and Realogy Group LLC, a Delaware limited liability company ("Realogy Group"). Neither Realogy Holdings, the indirect parent of Realogy Group, nor Realogy Intermediate, the direct parent company of Realogy Group, conducts any operations other than with respect to its respective direct or indirect ownership of Realogy Group. As a result, the consolidated financial positions, results of operations and cash flows of Realogy Holdings, Realogy Intermediate and Realogy Group are the same.
Realogy Holdings is not a party to the Amended and Restated Credit Agreement dated as of March 5, 2013, as amended from time to time (the "Senior Secured Credit Facility") and the Term Loan A Agreement dated as of October 23, 2015, as amended from time to time (the "Term Loan A Facility") and certain references in this Annual Report to our consolidated indebtedness exclude Realogy Holdings with respect to indebtedness under the Senior Secured Credit Facility and Term Loan A Facility. In addition, while Realogy Holdings is a guarantor of Realogy Group's obligations under its unsecured notes, Realogy Holdings is not subject to the restrictive covenants in the indentures governing such indebtedness.
As used in this Annual Report, the terms "3.375% Senior Notes," "4.50% Senior Notes," "5.25% Senior Notes" and "4.875% Senior Notes" refer to our 3.375% Senior Notes due 2016 (paid in full at maturity in 2016), our 4.50% Senior Notes due 2019, our 5.25% Senior Notes due 2021 and our 4.875% Senior Notes due 2023, respectively, and referred to collectively as "Unsecured Notes." In addition, the terms "First and a Half Lien Notes" and "First Lien Notes" refer to our 9.00% Senior Secured Notes due 2020 and our 7.625% Senior Secured Notes due 2020, respectively, which were all redeemed in 2015.
Item 1. Business.
Our Company
We are the leading and most integrated provider of residential real estate services in the U.S. We are the world's largest franchisor of residential real estate brokerages with some of the most recognized brands in the real estate industry, the leading U.S. residential real estate brokerage (based upon transaction volume), one of the largest U.S. and a leading global provider of outsourced employee relocation services and a significant provider of title and settlement services.
The core of our strategy is clear and simple: “We Serve Agents.” This strategy is aimed at growing the base of high-performing independent sales agents at our company owned and franchisee brokerages and providing them with compelling data and technology products and services to make them more productive and their businesses more profitable.
Our revenue is derived on a fee-for-service basis, and given our breadth of complementary service offerings, we are able to generate fees from multiple aspects of a residential real estate transaction. Our operating platform is supported by our portfolio of industry leading franchise brokerage brands, including Century 21®, Coldwell Banker®, Coldwell Banker Commercial®, ERA®, Sotheby's International Realty® and Better Homes and Gardens® Real Estate. We also own and operate Corcoran®, Citi HabitatsSM and ZipRealty® brands. Our multiple brands and operations allow us to derive revenue from many different segments of the residential real estate market, in many different geographies and at varying price points.
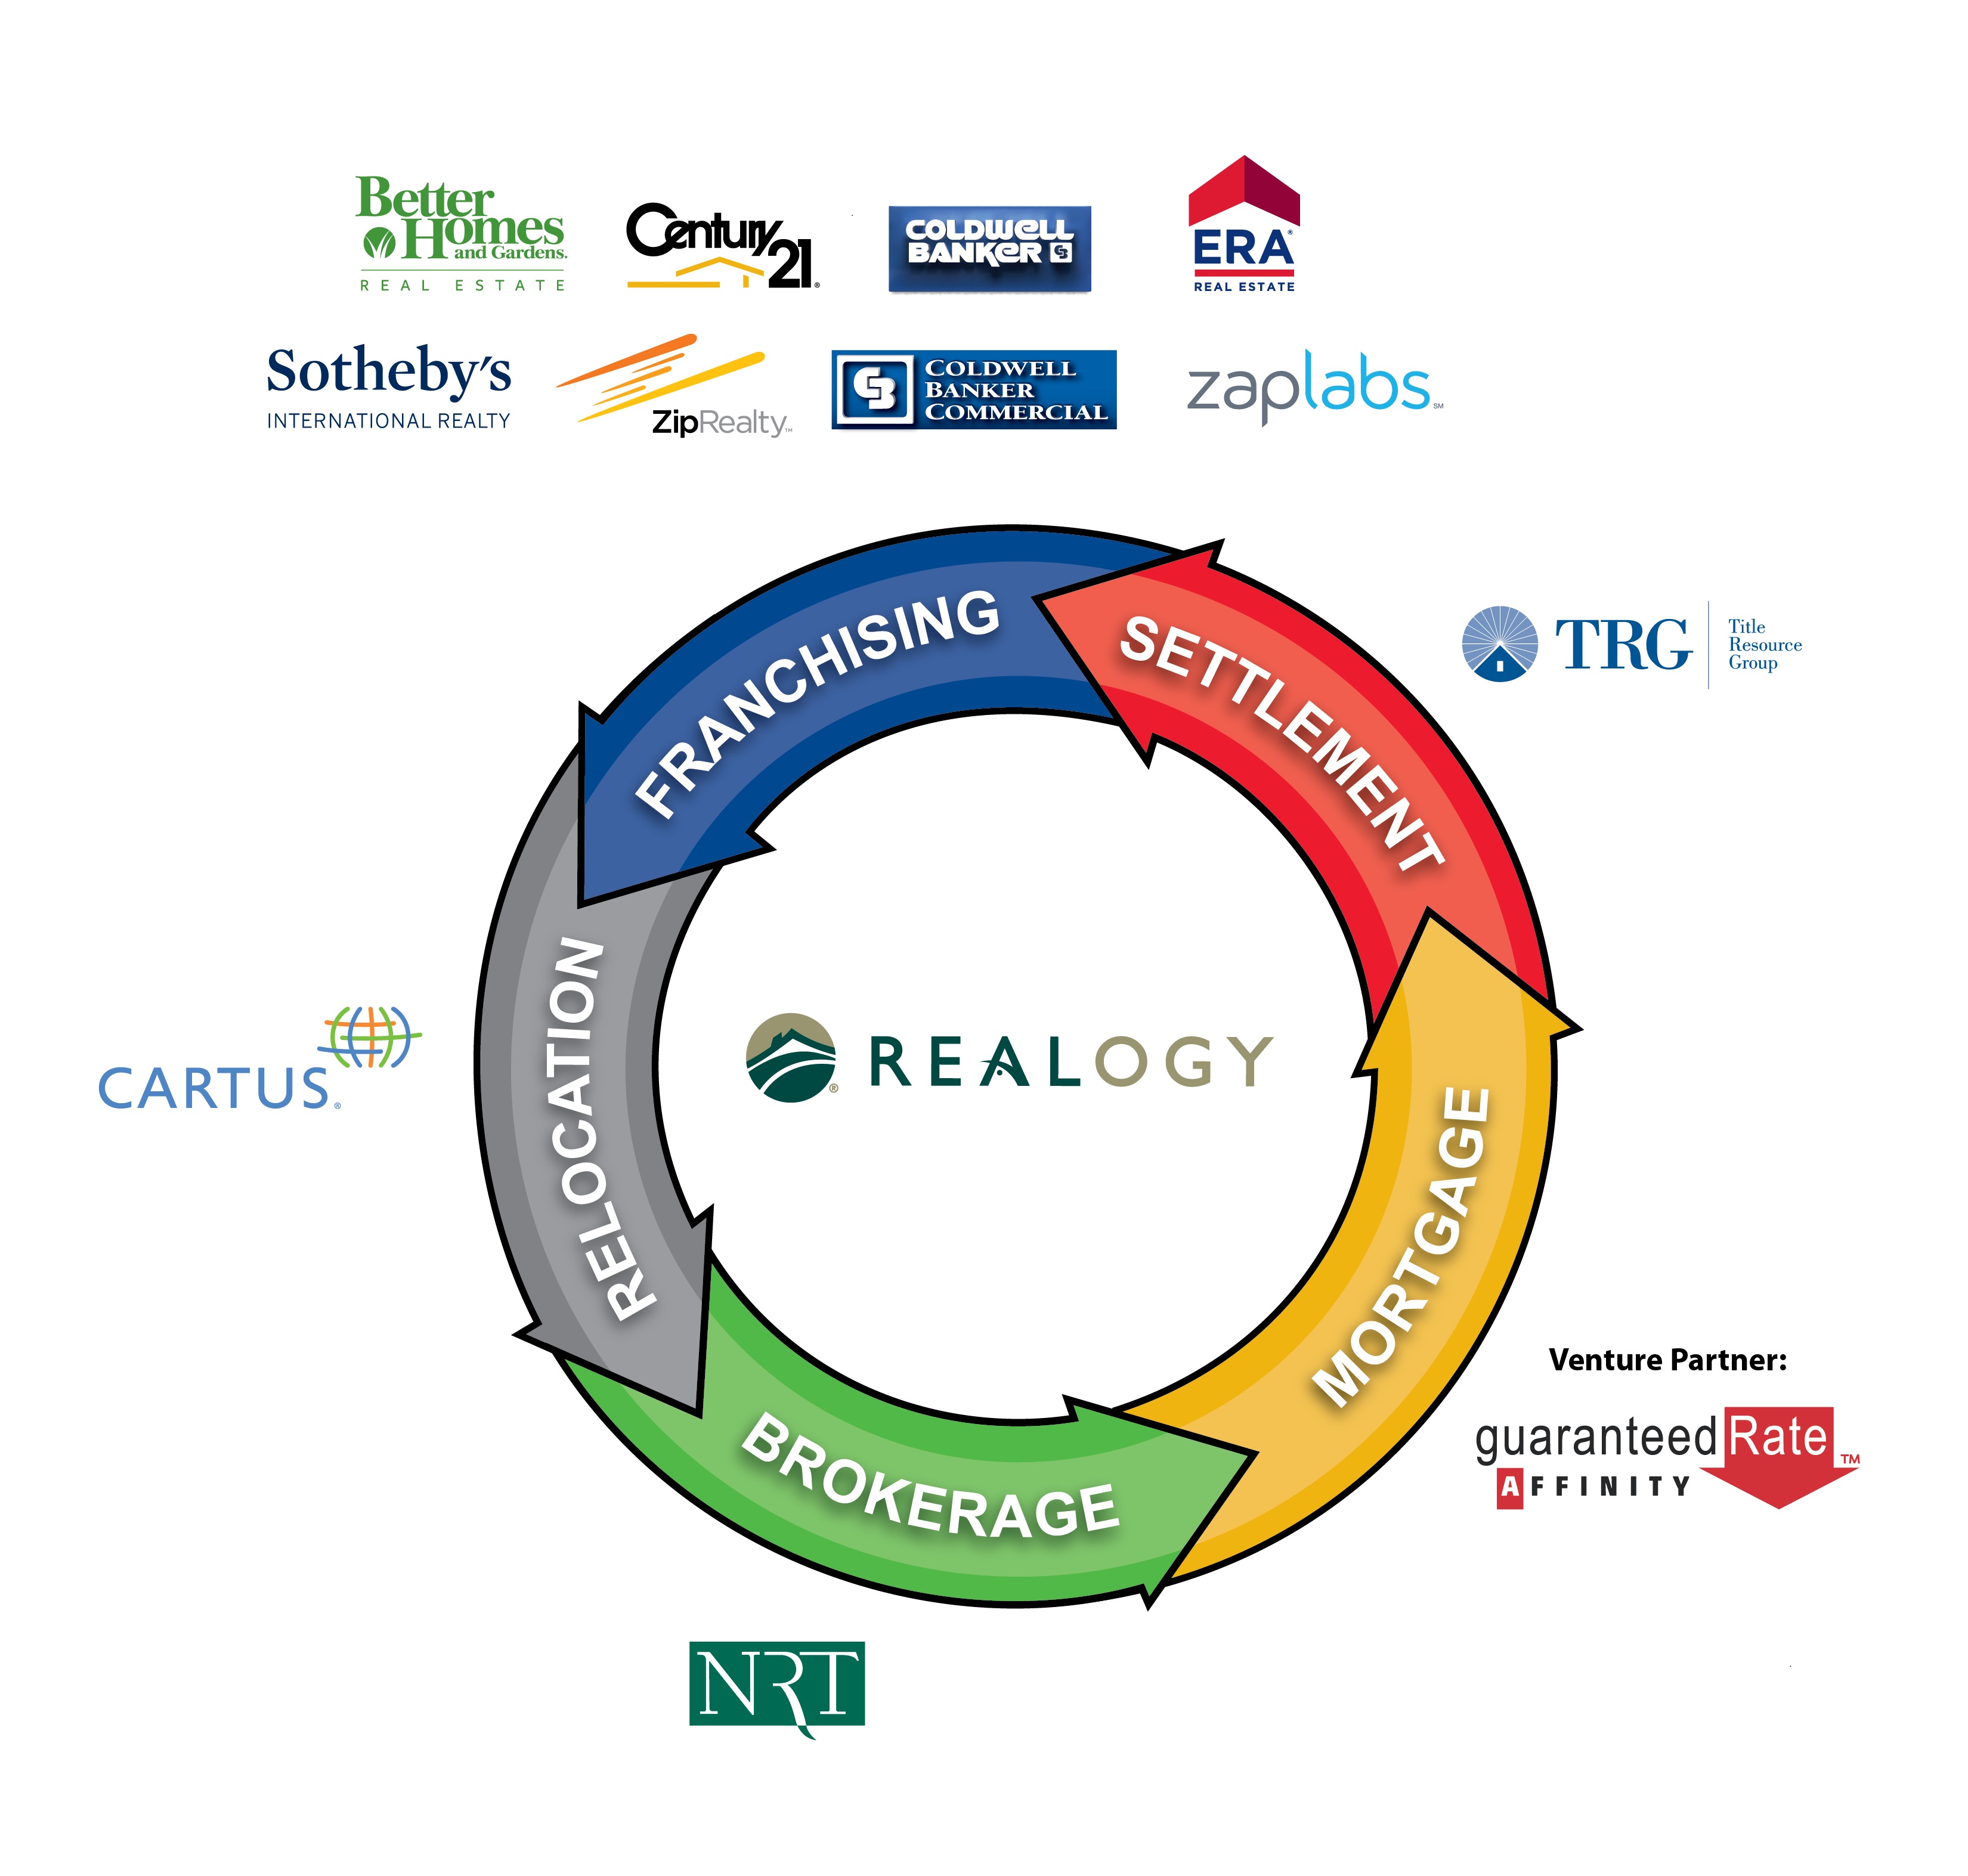
Segment Overview
We report our operations in four segments, each of which receives fees based upon services performed for our customers: Real Estate Franchise Services ("RFG"), Company Owned Real Estate Brokerage Services ("NRT"), Relocation Services ("Cartus®") and Title and Settlement Services ("TRG").
Real Estate Franchise Services. We are the largest franchisor of residential real estate brokerages in the world through our portfolio of well-known brokerage brands, including Century 21®, Coldwell Banker®, Coldwell Banker Commercial®, ERA®, Sotheby's International Realty® and Better Homes and Gardens® Real Estate. As of December 31, 2017, our real estate franchise systems and proprietary brands had approximately 289,000 independent sales agents worldwide (which included approximately 50,300 company owned brokerage independent sales agents), including approximately 192,000 independent sales agents operating in the U.S. As of December 31, 2017, our real estate franchise systems and proprietary
5
brands had approximately 14,800 offices (which included approximately 790 company owned brokerage offices) worldwide in 116 countries and territories, including approximately 6,100 brokerage offices in the U.S.
The average tenure among U.S. franchisees is approximately 21.5 years as of December 31, 2017. Our franchisees pay us fees for the right to operate under one of our trademarks and to enjoy the benefits of the systems and business enhancing tools provided by our real estate franchise operations. In addition to highly competitive brands that provide unique offerings to our franchisees, we support our franchisees with dedicated national marketing and servicing programs, technology including the Zap® technology platform, training, education, learning and development to facilitate our franchisees in growing their business and increasing their revenue and profitability. We believe that one of our strengths is the strong relationships that we have with our franchisees, as evidenced by our 98% retention rate as of December 31, 2017. Our retention rate represents the annual franchisee gross commission income for the year ended December 31, 2016 generated by our franchisees that remain in our franchise systems as of December 31, 2017, measured against the annual gross commission income of all franchisees for the year ended December 31, 2016.
Company Owned Real Estate Brokerage Services. We own and operate the leading residential real estate brokerage business (based upon transaction volume) in the U.S. under the Coldwell Banker®, Corcoran®, Sotheby's International Realty®, ZipRealty® and Citi HabitatsSM brand names. We offer full-service residential brokerage services in more than 50 of the 100 largest metropolitan areas of the U.S. NRT, as the broker for a home buyer or seller, derives revenues primarily from gross commission income received at the closing of real estate transactions. NRT also has relationships with developers, primarily in major cities, to provide marketing and brokerage services in new developments. To complement its residential brokerage services, NRT offers home ownership services that include comprehensive single-family residential property management in many of the nation's largest rental markets. In addition, the equity earnings or losses related to our 49.9% ownership of PHH Home Loans LLC ("PHH Home Loans"), our former home mortgage venture with PHH Mortgage Corporation (“PHH”) were included in the financial results of NRT. As discussed below, our mortgage origination joint venture with Guaranteed Rate, which began doing business in August 2017 on a phased-in basis, is included within our Title and Settlement Services segment.
Relocation Services. We are a leading global provider of outsourced employee relocation services. We are one of the largest providers of such services in the U.S. and also operate in key international relocation destinations. We offer a broad range of world-class employee relocation services designed to manage all aspects of an employee's move to facilitate a smooth transition in what otherwise may be a complex and difficult process for the employee and employer. Our relocation services business serves corporations, including 54% of the Fortune 50 companies. We also service affinity organizations such as insurance companies and credit unions that provide our services to their members. In 2017, we assisted in approximately 162,000 corporate and affinity relocations in nearly 150 countries for approximately 800 active clients. As of December 31, 2017, our top 25 relocation clients had an average tenure of approximately 20 years with us. Member brokers
6
of the Cartus Broker Network, including certain franchisees and NRT, receive referrals from the relocation services, affinity services and from each other in exchange for a referral fee.
Title and Settlement Services. We assist with the closing of real estate transactions by providing full-service title and settlement (i.e., closing and escrow) services to customers, real estate companies, including our company owned real estate brokerage and relocation services businesses, as well as a targeted channel of large financial institution clients. In 2017, TRG was involved in the closing of approximately 188,000 transactions of which approximately 57,000 related to NRT. In addition to our own title and settlement services, we also coordinate a nationwide network of attorneys, title agents and notaries to service financial institution and relocation clients on a national basis. We also serve as an underwriter of title insurance policies in connection with residential and commercial real estate transactions. This segment also includes the Company's share of equity earnings and losses, including start-up costs, for our 49.9% ownership of Guaranteed Rate Affinity, our mortgage origination joint venture with Guaranteed Rate, which began doing business in August 2017 on a phased-in basis. See "Item 7.—Management's Discussion and Analysis of Financial Condition and Results of Operations—Recent Developments" and the financial statements, including the notes thereto, included elsewhere in this Annual Report, for further information on our mortgage origination joint venture.
Housing Market and Market Share
U.S. Gross Commission Income. Residential real estate brokerage companies typically realize revenues in the form of a sales commission earned from closed homesale sides (either the "buy" side and/or the "sell" side of a real estate transaction), which we refer to as gross commission income. We believe that the level of gross commission income generated in the U.S. represents a substantial addressable market. We estimate that more than $70 billion in gross commission income was generated by U.S. residential existing homesale transactions involving a broker in 2017. Our company owned brokerages and franchisees earned approximately $13 billion in gross commission income in the same period.
Market Share. As measured in a comparison to the volume of all existing homesale transactions in the U.S. as reported by NAR (regardless of whether an agent or broker was involved in the transaction), we estimate that our market share in 2017 increased modestly year-over-year to approximately 15.9% compared to 15.7% in 2016. Our estimated share of all U.S. existing homesale unit transactions in 2017 remained at approximately 13.5%.
Basis of Calculation
U.S. Gross Commission Income Calculation. We estimate U.S. gross commission income by multiplying NAR’s published existing homesale transaction units, reduced to approximately 88% (to reflect 87% of the total homes that were bought using an agent or broker and 89% of the total homes that were sold using an agent or broker in 2017 according to NAR), by (a) NAR's published average sales price and (b) the average annual broker commission rate published by Real Trends, a provider of residential brokerage industry analysis, of 5.1%.
Market Share Calculation. We measure our market share transaction volume by the ratio of (a) homesale transaction volume (sides times average price) in which we and our franchisees participate to (b) NAR's existing homesale transaction volume (regardless of whether an agent or broker was involved in the transaction)—calculated by doubling the number of existing homesale transactions reported by NAR to account for both the buy and sell sides of a transaction multiplied by NAR's average sales price. Homesale unit transaction market share is calculated similarly but without including average sales price in either the numerator or denominator.
* * *
Our headquarters is located at 175 Park Avenue, Madison, New Jersey 07940. Our general telephone number is (973) 407-2000. We were incorporated on December 14, 2006 in the State of Delaware. The Company files electronically with the Securities and Exchange Commission (the "SEC") required reports on Form 8-K, Form 10-Q and Form 10-K; proxy materials; ownership reports for insiders as required by Section 16 of the Securities Exchange Act of 1934; registration statements and other forms or reports as required. Certain of the Company's officers and directors also file statements of changes in beneficial ownership on Form 4 with the SEC. The public may read and copy any materials that the Company has filed with the SEC at the SEC's Public Reference Room located at 100 F Street, NE, Washington, D.C. 20549. The public may obtain information on the operation of the Public Reference Room by calling the SEC at 800-SEC-0330. Such materials may also be accessed electronically on the SEC's Internet site (www.sec.gov). We maintain an Internet website at http://www.realogy.com and make available free of charge on or through our website our annual report on Form 10-K, quarterly reports on Form 10-Q, current reports on Form 8-K, Section 16 reports and any amendments to these reports in the Investor Relations section of our website as soon as reasonably practicable after such material is
7
electronically filed with or furnished to the SEC. Our website address is provided as an inactive textual reference. The contents of our website are not incorporated by reference herein or otherwise a part of this Annual Report.
Industry Trends
Industry definition. We primarily operate in the U.S. residential real estate industry, which is approximately a $1.8 trillion industry based on 2017 transaction volume (i.e. average homesale price times number of new and existing homesale transactions) and derive substantially all of our revenues from serving the needs of buyers and sellers of existing homes rather than new homes manufactured and sold by homebuilders. Residential real estate brokerage companies typically realize revenues in the form of a commission that is based on a percentage of the price of each home sold. As a result, the real estate industry generally benefits from rising home prices and increasing homesale transactions (and conversely is adversely impacted by falling prices and lower homesale transactions). We believe that existing homesale transactions and the services associated with these transactions, such as mortgage origination, title services and relocation services, represent one of the most attractive segments of the residential real estate industry for the following reasons:
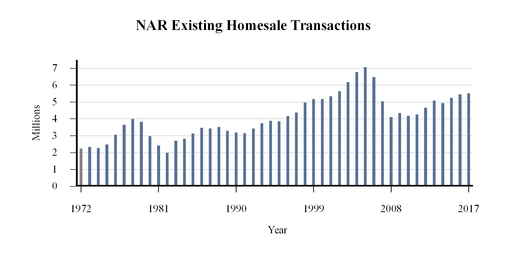
• | the existing homesales segment represents a significantly larger addressable market than new homesales. Of the approximately 6.1 million homesales in the U.S. in 2017, NAR estimates that approximately 5.5 million were existing homesales, representing approximately 90% of the overall sales as measured in units; |
• | existing homesales afford us the opportunity to represent either the buyer or the seller and in some cases both the buyer and the seller; and |
• | we are able to generate revenues from ancillary services provided to our customers. |
While substantially all homebuyers start their search for a home using the Internet, according to NAR, 87% of home buyers and 89% of home sellers used an agent or broker in 2017. We believe that agents or brokers will continue to be directly involved in most home purchases and sales, primarily because real estate transactions have certain characteristics that benefit from the service and value offered by an agent or broker, including the following:
• | the average homesale transaction size is very high and generally is the largest transaction one does in a lifetime; |
• | homesale transactions occur infrequently; |
• | there is a compelling need for personal service as home preferences are unique to each buyer; |
• | a high level of support is required given the complexity associated with the process, including specific marketing and technology services; and |
• | there is a high variance in price, depending on neighborhood, floor plan, architecture, fixtures, and outdoor space. |
Cyclical nature of industry. The U.S. residential real estate industry is cyclical, but has historically shown strong growth over time. Based on information published by NAR, existing homesale units increased at a compound annual growth rate, or CAGR, of 2.0% from 1972 through 2017, with 29 annual increases, versus 16 annual decreases.
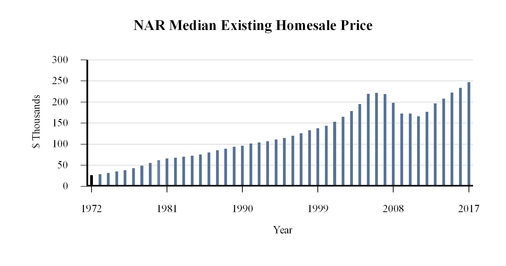
During that same period, median existing homesale prices increased at a CAGR of 5.1% (not adjusted for inflation) from 1972 through 2017, a period that included four economic recessions.
8
According to NAR, the existing homesale transaction volume (median homesale price times existing homesale transactions) grew at a CAGR of 7.2% from 1972 through 2017.
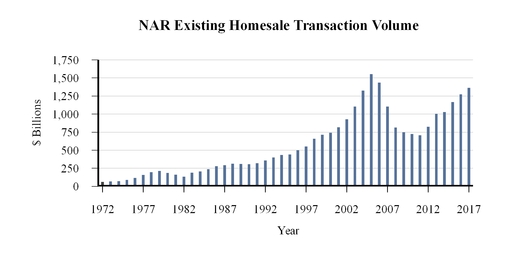
The U.S. residential real estate industry was in a significant and lengthy downturn from the second half of 2005 through 2011. Based upon data published by NAR from 2005 to 2011, the number of annual U.S. existing homesale transactions declined by 40% and the median existing homesale price declined by 24%. Beginning in 2012, the U.S. residential real estate industry began its recovery. Based upon data published by NAR from 2011 to 2017, the number of annual U.S. existing homesale units and the median existing homesale price improved by 29% and 49%, respectively.
Long-term demographics. We believe that long-term demand for housing and the growth of our industry is primarily driven by affordability, the economic health of the U.S. economy, demographic trends such as population growth, increases in the number of U.S. households, low interest rates, increases in renters that qualify as homebuyers and locally based factors. We believe that the residential real estate market will benefit over the long term from expected positive fundamentals, including the following factors:
• | based on U.S. Census data and NAR, the number of existing homesale transactions in 2017 was similar to the average number of homesale transactions in 2001 and 2002 while the number of U.S. households grew from 108 million in 2001 to 126 million in 2017; and |
• | according to the 2017 State of the Nation's Housing Report compiled by the Harvard Joint Center for Housing Studies, household growth is expected to average about 1.36 million annually from 2015–2025 and about 1.15 million annually from 2025–2035. The millennial generation is poised to form millions of new households over the next decade. |
9
Participation in Multiple Aspects of the Residential Real Estate Market
We participate in services associated with many aspects of the residential real estate market. Our four complementary businesses and mortgage joint venture work together, allowing us to generate revenue at various points in a residential real estate transaction, including the purchase or sale of homes, corporate relocation and affinity services, settlement and title services, and franchising of our brands. The businesses each benefit from our deep understanding of the industry, strong relationships with real estate brokers, sales agents and other real estate professionals and expertise across the transactional process. Unlike other industry participants who offer only one or two services, we can offer homeowners, our franchisees and our corporate and affinity clients ready access to numerous associated services that facilitate and simplify the home purchase and sale process. These services provide further revenue opportunities for our owned businesses and those of our franchisees. Specifically, our brokerage offices and those of our franchisees participate in purchases and sales of homes involving relocations of corporate transferees and affinity members using Cartus® relocation services and we offer customers (purchasers and sellers) of both our owned and franchised brokerage businesses convenient title and settlement services. These services produce incremental revenues for our businesses and franchisees. In addition, we participate in the mortgage process through our 49.9% ownership of Guaranteed Rate Affinity, which began doing business in August 2017 on a phased-in basis. PHH Home Loans, our former mortgage origination joint venture, is the in the final stages of winding down. All four of our businesses and our mortgage joint venture can derive revenue from the same real estate transaction.
10
Our Brands
Our brands are among the most well-known and established real estate brokerage brands in the real estate industry. Our real estate franchise brands are listed in the following chart, which includes information as of December 31, 2017 for both our franchised and company owned offices:
Franchise Brands (1) |  |  |  |  |  | |||||||||
Worldwide Offices (2) | 8,000 | 3,200 | 2,300 | 950 | 350 | |||||||||
Worldwide Brokers and Sales Agents (2) | 118,600 | 94,300 | 39,900 | 21,900 | 11,500 | |||||||||
U.S. Annual Sides | 417,337 | 731,486 | 133,225 | 122,475 | 72,424 | |||||||||
# of Countries with Owned or Franchised Operations | 80 | 47 | 32 | 69 | 3 | |||||||||
Characteristics | A leader in brand awareness and the most recognized name in real estate Significant international office footprint | Longest running national real estate brand in the U.S. (since 1906) Known as an innovator in real estate and a leader in smart home technology | Driving performance through innovation, collaboration and shared accountability Highest percentage of international offices among our international brands | Synonymous with luxury Strong ties to auction house established in 1744 Rapid international growth | Unique access to consumers, marketing channels and content through its brand licensing relationship with a leading media company | |||||||||
_______________
(1) | Does not include Corcoran®, ZipRealty®, Citi HabitatsSM and Climb Real Estate®. Information presented for Coldwell Banker® includes Coldwell Banker Commercial®. |
(2) | Includes an aggregate of approximately 8,800 offices and approximately 97,000 related brokers and independent sales agents of non-U.S. franchisees and franchisors, based upon information they reported to us. |
Real Estate Franchise Services
Our primary objectives as the largest franchisor of residential real estate brokerages in the world are to retain and expand existing franchises, sell new franchises, and most importantly, provide branding and support to our franchisees. At December 31, 2017, our real estate franchise systems and proprietary brands had approximately 14,800 offices (which included approximately 790 company owned brokerage offices) worldwide in 116 countries and territories in North and South America, Europe, Asia, Africa, the Middle East and Australia, including approximately 6,100 brokerage offices in the U.S.
We derive substantially all of our real estate franchising revenues from royalties and marketing fees received under long-term franchise agreements with our domestic franchisees (typically ten years in duration) and NRT. These royalties are based on a percentage of the franchisees' sales commission earned from closed homesale sides (either the "buy" side and/or the "sell" side of a real estate transaction), which we refer to as gross commission income. Our franchisees pay us royalties, net of volume incentives achieved (other than NRT), for the right to operate under one of our trademarks and to utilize the benefits of the franchise systems. We provide our franchisees with systems and tools that are designed to help our franchisees serve their customers, attract new or retain existing independent sales agents, and support our franchisees with servicing programs, technology including the Zap® technology platform described below and education, as well as branding-related marketing which is funded through contributions by our franchisees and us (including NRT). We operate and maintain an Internet-based reporting system for our domestic franchisees which generally allows them to electronically transmit listing information and other relevant reporting data to us. We also own and operate websites for each of our
11
brands for the benefit of our franchisees and their independent sales agents, some of which were re-launched in 2016 and 2017 using our proprietary Zap-based technology.
RFG's domestic annual net royalty revenues from franchisees other than our company owned brokerages can be represented by multiplying (1) that year's total number of closed homesale sides in which those franchisees participated by (2) the average sale price of those homesales by (3) the average brokerage commission rate charged by these franchisees by (4) RFG's net contractual royalty rate. The net contractual royalty rate represents the average percentage of our franchisees' commission revenues paid to us as a royalty, net of volume incentives achieved (or for some larger franchisees, flat fee royalties) and net of non-standard incentives granted to franchisees. Non-standard incentives may be used as consideration for attracting new or growing or extending existing franchisee agreements, though most of our franchisees do not receive non-standard incentives, in contrast to volume incentives. The domestic royalty revenue from NRT is calculated by multiplying homesale sides by average sale price by average brokerage commission rate by 6% royalty rate. NRT does not receive volume incentives or non-standard incentives. In addition to domestic royalty revenue, RFG earns revenue from marketing fees, the preferred alliance program, international affiliates and upfront international fees. The following chart illustrates the key drivers for revenue earned by RFG: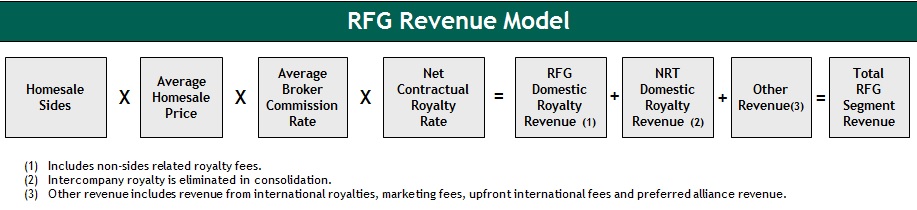
We believe one of our strengths is the strong relationships that we have with our franchisees as evidenced by the retention rate of 98% as of December 31, 2017. Our retention rate represents the annual franchisee gross commission income for the year ended December 31, 2016 generated by our franchisees that remain in our franchise systems as of December 31, 2017, measured against the annual gross commission income of all franchisees for the year ended December 31, 2016. On average, our domestic franchisees' tenure with our brands was approximately 21.5 years as of December 31, 2017. During 2017, none of our franchisees (other than NRT) generated more than 1% of our real estate franchise business revenues.
The franchise agreements impose restrictions on the business and operations of the franchisees and require them to comply with the operating and identity standards set forth in each brand's policy and procedures manuals. A franchisee's failure to comply with these restrictions and standards could result in a termination of the franchise agreement. The franchisees generally are not permitted to terminate the franchise agreements prior to their expiration, and in those cases where termination rights do exist, they are very limited (e.g., if the franchisee retires, becomes disabled or dies). Generally, new domestic franchise agreements have a term of ten years and require the franchisees to pay us an initial franchise fee for the franchisee's principal office plus, upon the receipt of any commission income, a royalty fee in most cases equal to 6% of their commission income. Each of our franchise systems (other than Coldwell Banker Commercial®) offers a volume incentive program, whereby each franchisee is eligible to receive a refund of a portion of the royalties paid upon the satisfaction of certain conditions. The volume incentive is calculated for each eligible franchisee as a progressive percentage of each franchisee's annual gross revenue (paid timely) for each calendar year. Under the current form of the franchise agreements, the volume incentive varies for each franchise system, and will generally result in a net royalty rate of 6% to 3% for each individual franchisee. We provide a detailed table to each franchisee that describes the gross revenue thresholds required to achieve a volume incentive and the corresponding incentive amounts. We reserve the right to increase or decrease the percentage and/or dollar amounts in the table on an annual basis, subject to certain limitations. Our company owned brokerage offices do not participate in the volume incentive program.
Each franchise system requires all franchisees and company owned offices to make monthly contributions to marketing funds maintained by each brand. These contributions are used primarily for the development, implementation, production, placement and payment of national and regional advertising, marketing, promotions, public relations and/or other marketing-related activities, such as lead generation, all to promote and further the recognition of each brand and its independent franchisees. In addition to the contributions from franchisees and company owned offices, the Real Estate Franchise Services group is generally required to make contributions to one of the marketing funds and may make discretionary contributions (at its option) to any of the marketing funds.
12
The Company also offers support services to its franchisees, including technology-enabled solutions such as customer relationship management (CRM), lead generation and productivity tools developed by our wholly-owned subsidiary, ZapLabs.
Under certain circumstances, we extend conversion notes (development advance notes were issued prior to 2009) to eligible franchisees for the purpose of providing an incentive to join the brand, to renew their franchise agreements, or to facilitate their growth opportunities. Growth opportunities include the expansion of franchisees' existing businesses by opening additional offices, through the consolidation of operations of other franchisees, as well as through the acquisition of independent sales agents and offices operated by independent brokerages. Many franchisees use the proceeds from the conversion notes to change signage and marketing materials, upgrade technology and websites, or to assist in acquiring companies or recruiting agents. The notes are not funded until appropriate credit checks and other due diligence matters are completed and the business is opened and operating under one of our brands. Upon satisfaction of certain revenue performance based thresholds, the notes are forgiven ratably over the term of the franchise agreement. If the revenue performance thresholds are not met, franchisees may be required to repay all or a portion of the outstanding notes.
In addition to offices owned and operated by our franchisees, we, through NRT, own and operate approximately 750 offices under the Coldwell Banker®, Coldwell Banker Commercial® and Sotheby's International Realty® brand names. NRT pays intercompany royalty fees and marketing fees to our Real Estate Franchise Services Segment in connection with its operation of these offices. These fees are recognized as income or expense by the applicable segment level and eliminated in the consolidation of our businesses.
In the U.S., we employ a direct franchising model whereby we contract with and provide services directly to independent owner-operators. Elsewhere, for all brands other than Sotheby's International Realty, we generally employ a master franchise model, whereby we contract with a qualified third party to build a franchise network in the country or region in which franchising rights have been granted. In the case of Sotheby's International Realty, a direct franchising model is generally utilized. Under both the direct and the master franchise model outside of the U.S., we typically enter into long-term franchise agreements (often 25 years in duration) and receive an initial area development fee and ongoing royalties. Under the master franchise model, the ongoing royalties we receive are generally a percentage of the royalties received by the master franchisor from its franchisees with which it contracts. Under the direct franchise model, a royalty fee is paid to us on transactions conducted by our franchisees in the applicable country or region.
We also offer third-party service providers an opportunity to market their products to our franchisees and their independent sales agents and customers through our preferred alliance program. To participate in this program, service providers generally agree to provide preferred pricing to our franchisees and/or their customers or independent sales agents and to pay us a combination of an initial licensing or access fee, subsequent marketing fees and/or commissions based upon our franchisees' or independent sales agents' usage of the preferred alliance vendors.
We own the trademarks Century 21®, Coldwell Banker®, Coldwell Banker Commercial®, ERA® and related trademarks and logos, and such trademarks and logos are material to the businesses that are part of our real estate franchise segment. Our franchisees and our subsidiaries actively use these trademarks, and all of the material trademarks are registered (or have applications pending) with the United States Patent and Trademark Office as well as with corresponding trademark offices in major countries worldwide where these businesses have significant franchised operations.
We have an exclusive license to own, operate and franchise the Sotheby's International Realty® brand to qualified residential real estate brokerage offices and individuals operating in eligible markets pursuant to a license agreement with SPTC Delaware LLC, a subsidiary of Sotheby's ("Sotheby's"). Such license agreement has a 100-year term, which consists of an initial 50-year term ending February 16, 2054 and a 50-year renewal option. We pay a licensing fee to Sotheby's for the use of the Sotheby's International Realty® name equal to 9.5% of the net royalties earned by our Real Estate Franchise Services Segment attributable to franchisees affiliated with the Sotheby's International Realty® brand, including our company owned offices.
In October 2007, we entered into a long-term license agreement to own, operate and franchise the Better Homes and Gardens® Real Estate brand from Meredith. The license agreement between Realogy and Meredith is for a 50-year term, with a renewal option for another 50 years at our option. We pay a licensing fee to Meredith for the use of the Better Homes and Gardens® Real Estate brand name equal to 9.0% of the net royalties earned by our Real Estate Franchise Services Segment attributable to franchisees affiliated with the Better Homes & Gardens Real Estate brand, subject to a minimum annual licensing fee.
13
Each of our brands has a consumer website that offers real estate listings, contacts and services. Century21.com, coldwellbanker.com, coldwellbankercommercial.com, sothebysrealty.com, era.com and bhgrealestate.com are the official websites for the Century 21®, Coldwell Banker®, Coldwell Banker Commercial®, Sotheby's International Realty®, ERA® and Better Homes and Gardens® Real Estate franchise systems, respectively. The contents of these websites are not incorporated by reference herein or otherwise a part of this Annual Report.
Company Owned Real Estate Brokerage Services
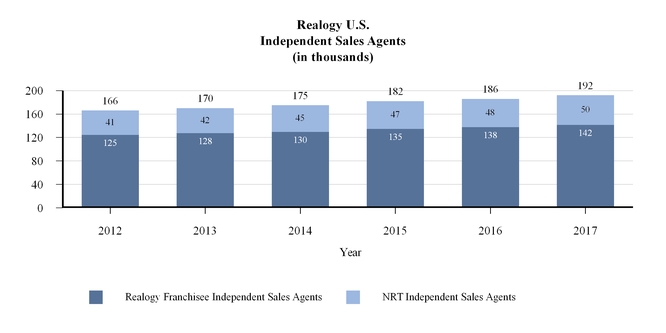
Through our subsidiary, NRT, we own and operate a full-service real estate brokerage business in more than 50 of the 100 largest metropolitan areas in the U.S. Our company owned real estate brokerage business operates under the Coldwell Banker® and Sotheby's International Realty® franchised brands as well as proprietary brands that we own, but do not currently franchise, such as Corcoran®, ZipRealty® and Citi HabitatsSM. As of December 31, 2017, we had approximately 790 company owned brokerage offices, approximately 5,200 employees and approximately 50,300 independent sales agents working with these company owned offices.
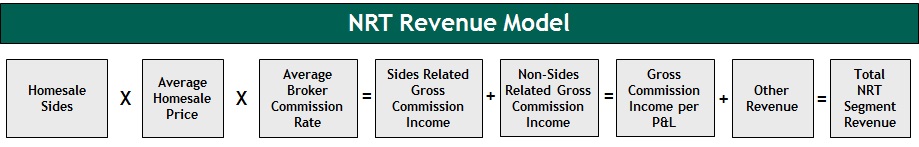
Our company owned real estate brokerage business derives revenue primarily from gross commission income received serving as the broker at the closing of real estate transactions. For the year ended December 31, 2017, our average homesale broker commission rate was 2.44% which represents the average commission rate earned on either the "buy" side or the "sell" side of a homesale transaction. Gross commission income is also earned on non-sale transactions such as home rentals. NRT, as a franchisee of RFG, pays a royalty fee of 6% per transaction to RFG from the commission earned on a real estate transaction. The following chart illustrates the key drivers for revenue earned by NRT:
In addition, as a full-service real estate brokerage company, we promote the complementary services of our relocation and title and settlement services businesses. We believe we provide integrated services that enhance the customer experience.
When we assist the seller in a real estate transaction, independent sales agents generally provide the seller with a full-service marketing program, which may include developing a direct marketing plan for the property, assisting the seller in pricing the property and preparing it for sale, listing it on multiple listing services, advertising the property (including on websites), showing the property to prospective buyers, assisting the seller in sale negotiations, and assisting the seller in preparing for closing the transaction. When we assist the buyer in a real estate transaction, independent sales agents generally help the buyer in locating specific properties that meet the buyer's personal and financial specifications, show properties to the buyer, assist the buyer in negotiating (where permissible) and preparing for closing the transaction. In addition, NRT has relationships with developers, primarily in major cities, to provide marketing and brokerage services in new developments.
At December 31, 2017, we operated approximately 90% of our offices under the Coldwell Banker® brand name, approximately 5% of our offices under the Sotheby's International Realty® brand name and 5% of our offices under the Corcoran®, Citi HabitatsSM, ZipRealty® and Climb Real Estate® brand names combined. Our offices are geographically diverse with a strong presence in the east and west coast areas, primarily around large metropolitan areas in the U.S., where home prices are generally higher. We operate our Coldwell Banker® offices in numerous regions throughout the U.S., our Sotheby's International Realty® offices in several regions throughout the U.S, and Corcoran® offices in New York City, the Hamptons (New York), and Palm Beach, Florida.
We intend to grow our business organically and, to a lesser extent, through strategic acquisitions focused primarily on expanding our existing markets. To grow organically, we will focus on working with office managers to attract, retain and effectively coordinate with independent sales agents who can successfully engage and promote transactions from new and existing clients. To complement our residential brokerage services, NRT offers home ownership services that include comprehensive single-family residential property management in many of the nation's largest rental markets.
Following the completion of an acquisition, we tend to consolidate the newly acquired operations with our existing operations. By consolidating operations, we reduce or eliminate duplicative costs, such as advertising, rent and administrative support. By utilizing our existing infrastructure to coordinate with a broader network of independent sales
14
agents and revenue base, we can enhance the profitability of our operations. We also seek to enhance the profitability of newly acquired operations by strategies that increase the productivity of the newly affiliated independent sales agents. We offer these independent sales agents supplemental tools and marketing information that are often unavailable at smaller firms, such as access to sophisticated information technology and ongoing technical support, increased brand advertising and brand marketing support, relocation referrals, and a wide offering of brokerage-related services.
Our real estate brokerage business has a contract with Cartus under which the brokerage business provides brokerage services to relocating employees of the clients of Cartus. When receiving a referral from Cartus, our brokerage business seeks to assist the relocating employee in completing a homesale or home purchase. Upon completion of a homesale or home purchase, our brokerage business receives a commission on the purchase or sale of the property and is obligated to pay Cartus a portion of such commission as a referral fee. We believe that these fees are comparable to the fees charged by other relocation companies.
Relocation Services
Through our subsidiary, Cartus, we are a leading global provider of outsourced employee relocation services. We primarily offer corporate clients employee relocation services, such as:
• | homesale assistance, including: |
◦ | the valuation, inspection, purchasing and selling of a transferee's home; |
◦ | the issuance of home equity advances to transferees permitting them to purchase a new home before selling their current home (these advances are generally guaranteed by the individual's employer); |
◦ | certain home management services; |
◦ | assistance in locating a new home; and |
◦ | closing on the sale of the old home, generally at the instruction of the client; |
• | expense processing, relocation policy counseling, relocation-related accounting, including international assignment compensation services, and other consulting services; |
• | arranging household goods moving services, approximately 60,000 domestic and international shipments in 2017, and providing support for all aspects of moving a transferee's household goods, including the handling of insurance and claim assistance, invoice auditing and quality control; |
• | coordinating visa and immigration support, intercultural and language training, and expatriation/repatriation counseling and destination services; and |
• | group move management services providing coordination for moves involving a large number of transferees to or from a specific regional area over a short period of time. |
The wide range of our services allows our Cartus clients to outsource their entire relocation programs to us.
In 2017, we assisted in approximately 162,000 corporate and affinity relocations in nearly 150 countries for approximately 800 active clients, including 54% of the Fortune 50 companies as well as affinity organizations. Cartus has operations in the U.S. and internationally in the United Kingdom, Canada, Hong Kong, Singapore, China, India, Brazil, Germany, France, Switzerland and the Netherlands.
Substantially all homesale service transactions for clients are classified as "no risk." Under "no risk" business, the client is responsible for reimbursement of all direct expenses associated with the homesale. Such expenses include, but are not limited to, appraisal, inspection and real estate brokerage commissions. The client also bears the risk of loss on the resale of the transferee's home. Clients are responsible for reimbursement of all other direct costs associated with the relocation including, but not limited to, costs to move household goods, mortgage origination points, temporary living and travel expenses. Generally, we fund the direct expenses associated with the homesale as well as those associated with the relocation on behalf of the client and the client then reimburses us for these costs plus interest charges on the advanced funds. This limits our exposure on "no risk" homesale services to the credit risk of our clients rather than to the potential fluctuations in the real estate market or to the creditworthiness of the individual transferring employee. Historically, due to the credit quality of our clients, we have had minimal losses with respect to these "no risk" homesale services.
The "at risk" business that we conduct is minimal. In "at risk" homesale service transactions, we acquire the home being sold by relocating employees, incur the cost for all direct expenses (acquisition, carrying and selling costs) associated with the homesale and bear any loss on the sale of the home.
15
Substantially all of our contracts with our relocation clients are terminable at any time at the option of the client, are non-exclusive and do not require such client to maintain any level of business with us. If a client ceases or reduces volume under its contract, we will be compensated for all services performed up to the time that volume ceases and reimbursed for all expenses incurred.
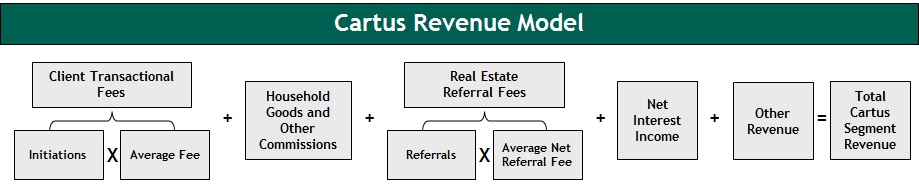
There are a number of different revenue streams associated with relocation services. We earn referral commissions primarily from real estate brokers and household goods moving companies that provide services to the transferee. Clients may also pay transactional fees for the services performed. We also earn net interest income which represents interest earned from clients on the funds we advance on behalf of the transferring employee net of costs associated with the securitization obligations used to finance these payments. Cartus measures operating performance based on initiations, which represent the total number of transferees and affinity members we serve, and referrals, which represent the number of referrals from which we earn revenue from real estate brokers.
About 17% of our relocation revenue in 2017 was derived from our affinity services, which provides real estate services, including home buying and selling assistance, as well as mortgage assistance to organizations such as insurance companies and credit unions that have established members who are buying or selling a home. Often these organizations offer our affinity services to their members at no cost and, where permitted, provide their members with a financial incentive for using these services. These member benefits and services help the organizations attract new members and retain current members.
To service the needs of our relocation and affinity clients as well as broker-to-broker referrals, we manage the Cartus Broker Network, which is a network of real estate brokers consisting of our company owned brokerage operations, select franchisees and independent real estate brokers who have been approved to become members. Cartus requires experienced brokers and independent sales agents and obtains background checks on all members of the network. Member brokers of the Cartus Broker Network receive referrals from our relocation services, affinity business and each other in exchange for a referral fee. The Cartus Broker Network is a key contributor to our lead generation strategy, with approximately 97% of the converted leads generated through the network being directed to independent sales agents affiliated with our franchisees and company-owned brokerages in 2017. The Cartus Broker Network closed approximately 78,500 real estate transactions in 2017 related to relocation, affinity, and broker-to-broker activity.
The following chart illustrates the key drivers for revenue generated by Cartus:
Title and Settlement Services
Our title and settlement services business, TRG, provides full-service title and settlement (i.e., closing and escrow) services to real estate companies and financial institutions. We act in the capacity of a title agent and sell title insurance to property buyers and mortgage lenders. We are licensed as a title agent in 42 states and Washington, D.C., and have physical locations in 25 states and Washington, D.C. We issue title insurance policies on behalf of large national underwriters as well as through our Dallas-based subsidiary, Title Resources Guaranty Company ("Title Resources"). Title Resources is a title insurance underwriter licensed in 31 states and Washington, D.C. We operate mostly in major metropolitan areas. As of December 31, 2017, we had approximately 443 offices, approximately 218 of which are co-located within one of our company owned brokerage offices.
Virtually all lenders require their borrowers to obtain title insurance policies at the time mortgage loans are made on real property. The terms and conditions upon which the real property will be insured are determined in accordance with the standard policies and procedures of the title underwriter. When our title agencies sell title insurance, the title search and examination function is performed by the agent. The title agent and underwriter split the premium. The amount of such premium "split" is determined by agreement between the agency and underwriter, or is promulgated by state law. We derive
16
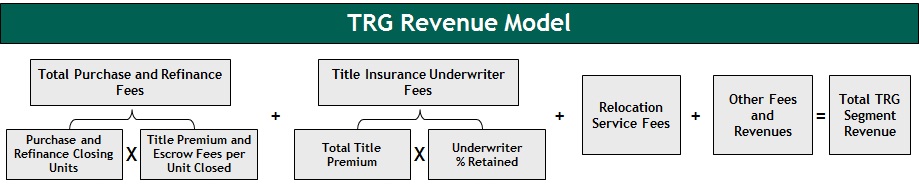
revenue through fees charged in real estate transactions for rendering the services described above, fees charged for escrow and closing services, and a percentage of the title premium on each title insurance policy sold. We have entered into underwriting agreements with various underwriters, which state the conditions under which we may issue a title insurance policy on their behalf. For policies issued through our agency operations, assuming no negligence on our part, we are not typically liable for losses under those policies; rather the title insurer is typically liable for such losses.
Our company owned brokerage operations are the principal source of our title and settlement services business for homesale transactions. Other sources of our title and settlement services homesale business include our real estate franchise business, Cartus and unaffiliated brokerage operations. In addition, in July 2017, TRG completed the formation of a national commercial title services division. For refinance transactions, we generate title and escrow revenues from our mortgage origination joint venture and other financial institutions throughout the mortgage lending industry. Many of our offices have subleased space from, and are co-located within, our company owned brokerage offices. The capture rate of our title and settlement services business from company owned brokerage operations was approximately 39% in 2017.
We coordinate a national network of escrow and closing agents (some of whom are our employees, while others are attorneys in private practice and independent title companies) to provide full-service title and settlement services to a broad-based group that includes lenders, home buyers and sellers, developers and independent real estate sales agents. Our role is generally that of an intermediary managing the completion of all the necessary documentation and services required to complete a real estate transaction.
Our title and settlement services business measures operating performance based on purchase and refinance closing units and the related title premiums and escrow fees earned on such closings. In addition, we measure net title premiums earned for title policies issued by our underwriting operation.
The following chart illustrates the key drivers for revenue generated by our title and settlement services business:
We intend to grow our title and settlement services business by attracting title and escrow sales agents in existing markets and, to a lesser extent, by completing acquisitions to expand our geographic footprint or complement existing operations. We will also continue to seek to increase our capture rate of title business from our NRT homesale sides. In addition, we expect to continue to grow and diversify our lender channel and our underwriting businesses by expanding and adding clients and increasing our agent base, respectively.
The equity earnings or losses related to Guaranteed Rate Affinity, our mortgage origination joint venture that began doing business on a phased-in basis in August 2017, are included in the financial results of TRG. The equity earnings or losses related to our former mortgage origination joint venture, PHH Home Loans, were included in the financial results of NRT.
Marketing and Technology
The marketing and technology services and support provided by independent sales agents to their customers are an important element of the value offered by an agent in the home purchase and sale process. Our commitment to continuously develop and improve our marketing and technology products and service is part of our value proposition to our company owned and franchised real estate brokerages, affiliated independent sales agents and their customers as well as to our relocation and title and settlement services segments. Increasingly, these products and services are desired on as an integrated tool, rather than stand-alone products and services. We have expended, and expect to continue to expend, substantial time, capital, and other resources to identify the needs of our company owned brokerages, franchisees, independent sales agents and their customers and to develop marketing, technology and service offerings to meet the needs of our affiliated independent sales agents.
Real Estate Franchise Operations. Each of our franchise brands operates a marketing fund that is funded principally by our franchisees, with some contributions from us. The focus of each marketing fund is to build and maintain brand awareness and preference for the brand and drive leads to our franchisees and their affiliated independent sales agents,
17
which is accomplished through a variety of media, including but not limited to social media, advertising, direct marketing and internet advertising.
The Zap platform is the foundation of our online marketing technology strategy. Zap is designed to leverage the collective strength of each brand online, and is updated frequently in order to keep up with changing needs of brokers, agents and consumers to continually strengthen our value proposition. Zap currently powers the Better Homes and Gardens Real Estate, Century 21, Coldwell Banker and ERA brand websites. Each of these brands also leverage Zap’s mobile applications for iPhone, iPad and Android. These mobile applications empower independent sales agents to access contact information and behavioral data as well as respond to requests in Zap while outside of the office. Each independent sales agent also has a personally-branded mobile application that they can customize with their own content and use to market themselves. We believe the Zap technology platform is designed to increase the value proposition to our franchisees, their independent sales agents and their customers by:
• | aiding in lead generation and obtaining additional homesale transactions for our franchisees and their independent sales agents; |
• | connecting those agents to a predictive customer relationship management (CRM) tool; |
• | enhancing access to listing distributions through mobile applications and websites; and |
• | informing them with valuable client insight to help those agents increase their productivity. |
Our brand websites contain listing information on a regional and national market basis, independent sales agent information, community profiles, home buying and selling advice, relocation tips and mortgage financing information and unique property and neighborhood insights from local agents. The Zap technology platform is designed to empower affiliated sales agents and brokers to cultivate productive relationships with consumers at all stages of the transaction. The Zap technology platform also is intended to provide consumers with a streamlined yet comprehensive user experience to facilitate the necessary steps for researching homes, communities and independent sales agents.
Each brand manages a comprehensive system of marketing tools, systems and sales information and data that can be accessed through freestanding brand intranet sites to assist independent sales agents in becoming the best marketer of their listings. In addition to the Sotheby's International Realty® brand, a leading luxury brand, our franchisees and our company owned brokerages also participate in luxury marketing programs, such as Century 21 Fine Homes & Estates®, Coldwell Banker Global Luxury, ERA® Distinctive Properties and Distinctive Collection by Better Homes and Gardens® Real Estate.
Advertising is primarily used by the brands to drive consumers to their respective websites and in turn convert leads to the independent sales agents of our franchisees. Significant focus is placed on developing websites for each brand to create value to the real estate consumer. Each brand website focuses on streamlined, easy search processes for listing inventory and rich descriptive details, multiple photos, full motion videos and in some cases virtual reality tours to market the real estate listing. Additionally, each brand website serves as a national distribution point for independent sales agents to market themselves to consumers to enhance the customer experience. We also place significant emphasis on distributing our real estate listings with third-party websites to expand a homebuyer's access to such listings, at times enhancing the presentation of the listings on third-party websites to make the listings more attractive to consumers. Consumers seeking more detailed information about a particular listing on a third-party website are able to click through to a brand website or a company owned brokerage website or telephone the franchisee or company owned brokerage directly.
Company Owned Brokerage Operations. Our company owned brokerages sponsor a wide array of marketing programs, materials and opportunities to complement the sales work of our affiliated independent sales agents and increase brand awareness. The effectiveness and quality of marketing programs play a significant role in attracting and retaining independent sales agents.
NRT's sponsored marketing programs and initiatives primarily focus on attracting potential new home buyers and sellers to NRT's affiliated independent sales agents. These programs and initiatives also complement the awareness of our brands by increasing the local recognition of our agents and local brokerages.
Much of our marketing efforts are geared toward showcasing the inventory of our real estate listings and the affiliated independent sales agents who are the selling agents of these listings. In addition to prominently placing the listing property and related selling agent information on numerous real estate websites, we promote the selling agents and their properties on social media sites and offer tools and systems intended to enhance the home buying and home selling experiences of our
18
customers. We also offer the independent sales agents broad-based advertising, mailings and other campaigns to generate leads, interest and recognition.
The Internet has become the primary advertising channel in our industry and we have sought to become a leader among full-service residential real estate brokerage firms in the use and application of marketing technology. We place our property listings on hundreds of real estate websites and we operate a variety of our own websites.
NRT also utilizes both proprietary and third-party technology to offer independent sales agents tools that may enhance their productivity and increase their understanding of their local markets and the impact of their marketing efforts. Some of these tools include the HomeBase Transaction Management and InTouch CRM systems, as well as MarketQuest and e-Marketing reporting tools.
Education
Each real estate brand provides learning and development materials and access to continuing education to its franchisees to assist them in building their real estate sales businesses. Each brand's engagement program contains different materials and delivery methods. The marketing materials include a detailed description of the services offered by our franchise systems (which will be available to the independent sales agent). Live instructors at conventions and orientation seminars deliver some engagement modules while other modules can be viewed by brokers anywhere in the world through virtual classrooms over the Internet. Most of the programs and materials are then made available in electronic form to franchisees over the respective system's private intranet site. Many of the materials are customizable to allow franchisees to achieve a personalized look and feel and make modifications to certain content as appropriate for their business and marketplace.
Employees
At December 31, 2017, we had approximately 11,800 employees, including approximately 840 employees outside of the U.S. None of our employees are represented by a union. We believe that our employee relations are good.
Seasonality
The residential housing market is seasonal, with a higher level of homesale transactions typically occurring in the second and third quarter of each year. As a result, historically, operating results and revenues for all of our businesses have been strongest in the second and third quarters of the calendar year.
Competition
Real Estate Brokerage Industry. The residential real estate brokerage industry is highly competitive with low barriers to entry for new participants. Recruitment and retention of independent sales agents and independent sales agent teams are critical to the business and financial results of a brokerage—whether or not they are affiliated with a franchisor. Most of a brokerage's real estate listings are sourced through the sphere of influence of their independent sales agents, notwithstanding the growing influence of internet-generated leads. Competition for independent sales agents in our industry is high and has intensified particularly with respect to more productive independent sales agents. Competition for independent sales agents is generally subject to numerous factors, including remuneration (such as sales commission percentage and other financial incentives paid to independent sales agents), other expenses borne by independent sales agents, leads or business opportunities generated for the independent sales agent from the brokerage, independent sales agents' perception of the value of the broker's brand affiliation, marketing and advertising efforts by the brokerage or franchisor, the office manager, staff and fellow independent sales agents with whom they collaborate daily, as well as technology, continuing professional education, and other services provided by the brokerage or franchisor. See "Item 7.—Management's Discussion and Analysis of Financial Condition and Results of Operations—Key Drivers" for a discussion of the various compensation models being utilized by real estate brokerages to compensate their independent sales agents.
According to NAR, approximately 43% of individual brokers and independent sales agents are affiliated with a franchisor. Competition among the national real estate brokerage brand franchisors to grow their franchise systems is intense. We believe that competition for the sale of franchises in the real estate brokerage industry is based principally upon the perceived value that the franchisor provides to enhance the franchisee's ability to grow its business and improve the recruitment, retention and productivity of its independent sales agents. The value provided by a franchisor encompasses many different aspects including the quality of the brand, tools, technology, marketing and other services, the availability of
19
financing provided to the franchisees, and the fees the franchisees must pay. Our largest national competitors in this industry include, but are not limited to, three large franchisors: Keller Williams Realty, Inc.; HSF Affiliates LLC (a joint venture controlled by HomeServices of America that operates Berkshire Hathaway HomeServices and Real Living Real Estate); and RE/MAX International, Inc.
Our company owned brokerages compete with national independent real estate brokerages, franchisees of national and regional real estate franchisors, including our own brands and the other national franchisors described in the preceding paragraph, regional independent real estate brokerages and discount and limited service brokerages. We and others within the industry also encounter competition from companies that employ technologies intended to disrupt the traditional brokerage model or eliminate brokers or agents from, or minimize the role they play in, the homesale transaction, such as through the reduction of brokerage commissions. Other non-traditional models that operate outside of the brokerage industry, such as companies that leverage capital to purchase homes directly from sellers, have also been gaining market attention in recent years. Certain of our competitors are also increasingly well-funded, which strengthens their competitive position and ability to offer aggressive compensation arrangements to top-performing sales agents. Moreover, a growing number of companies are competing in non-traditional ways for a portion of the gross commission income generated by homesale transactions. For example, listing aggregators and other web-based real estate service providers not only compete for our company owned brokerage business by establishing relationships with independent sales agents and/or buyers and sellers of homes, they also increasingly charge brokerages and independent sales agents for advertising on their sites.
The ability of our real estate brokerage franchisees and our company owned brokerage businesses to successfully compete is important to our prospects for growth. Their ability to compete may be affected by the recruitment, retention and performance of independent sales agents, the location of offices and target markets, the services provided to independent sales agents, the fees charged to independent sales agents, the number and nature of competing offices in the vicinity, affiliation with a recognized brand name, community reputation, technology and other factors. A franchisee's success may also be affected by national, regional and local economic conditions.
Relocation Business. Competition in our corporate relocation business is based on capabilities, price and quality. We compete primarily with global outsourced and regional relocation services providers in the corporate relocation business. The larger outsourced relocation services providers that we compete with include BGRS, SIRVA, Inc. and Weichert Relocation Resources, Inc. Competition is expected to continue to intensify as an increasingly higher percentage of relocation clients reduce their global relocation benefits and related spend.
Title and Settlement Business. The title and settlement business is highly competitive and fragmented. The number and size of competing companies vary in the different areas in which we conduct business. In certain parts of the country we compete with small title agents and attorneys while in other parts of the country our competition is the larger title underwriters and national vendor management companies. In addition, we compete with the various brands of national competitors including Fidelity National Title Insurance Company, First American Title Insurance Company, Stewart Title Guaranty Company and Old Republic Title Company.
Government Regulation
Franchise Regulation. In the U.S., the sale of franchises is regulated by various state laws, as well as by the Federal Trade Commission (the "FTC"). The FTC requires that franchisors make extensive disclosure to prospective franchisees but does not require registration. A number of states require registration and/or disclosure in connection with franchise offers and sales. In addition, several states have "franchise relationship laws" or "business opportunity laws" that limit the ability of the franchisor to terminate franchise agreements or to withhold consent to the renewal or transfer of these agreements. The states with relationship or other statutes governing the termination of franchises include Alaska, Arkansas, California, Connecticut, Delaware, Hawaii, Idaho, Illinois, Indiana, Iowa, Kentucky, Maryland, Michigan, Minnesota, Mississippi, Missouri, Nebraska, New Jersey, Rhode Island, Virginia, Washington and Wisconsin. Puerto Rico and the Virgin Islands also have statutes governing termination of franchises. Some franchise relationship statutes require a mandated notice period for termination and some require a notice and cure period. In addition, some require that the franchisor demonstrate good cause for termination. These statutes do not have a substantial effect on our operations because our franchise agreements generally comport with the statutory requirements for cause for termination, and they provide notice and cure periods for most defaults. When the franchisee is granted a statutory period longer than permitted under the franchise agreement, we extend our notice and/or cure periods to match the statutory requirements. In some states, case law requires a franchisor to renew a franchise agreement unless a franchisee has given cause for non-renewal. Failure to comply with these laws could result in civil liability to the affected franchisees. While our franchising operations have not been materially adversely affected by such existing regulation, we cannot predict the effect of any future federal or state legislation or regulation. Internationally, many countries have similar laws affecting franchising.
Real Estate Regulation. RESPA, state real estate brokerage laws and similar laws in countries in which we do business restrict payments which real estate brokers, title agencies, mortgage bankers, mortgage brokers and other settlement service providers may receive or pay in connection with the sales of residences and referral of settlement services (e.g., mortgages, homeowners insurance and title insurance). Such laws may to some extent impose limitations on preferred alliance and other arrangements involving our real estate franchise, real estate brokerage, settlement services and relocation businesses or the business of our mortgage origination joint venture. In addition, with respect to our company owned real estate brokerage, relocation and title and settlement services businesses as well as our mortgage origination joint venture, RESPA and similar state laws require timely disclosure of certain relationships or financial interests with providers of real estate settlement services.
RESPA and related regulations do, however, contain a number of provisions that allow for payments or fee splits between providers, including fee splits between brokers and agents and market-based fees for the provision of actual goods or services. In addition, RESPA allows for referrals to affiliated entities, including joint ventures, when specific requirements have been met. We rely on these provisions in conducting our business activities and believe our arrangements comply with RESPA. RESPA compliance, however, has become a greater challenge in recent years for most industry participants offering settlement services, including mortgage companies, title companies and brokerages, because of changes in the regulatory environment and expansive interpretations of RESPA or similar state statutes by certain courts.
Pursuant to the Dodd-Frank Wall Street Reform and Consumer Protection Act ("Dodd-Frank"), administration of RESPA has been moved from the Department of Housing and Urban Development ("HUD") to the Consumer Financial Protection Bureau (the "CFPB"). The CFPB has taken, in the recent past, a much stricter approach toward interpretation of RESPA and related regulations than HUD and has significantly increased the use of enforcement proceedings. In the face of this changing regulatory landscape, various industry participants, while disagreeing with the CFPB’s narrow interpretation of RESPA, have nevertheless decided to modify or terminate long-standing business arrangements to avoid the risk of protracted and costly litigation defending such arrangements. At present, leadership at the CFPB is in transition, with a new acting director. In the message accompanying the new five-year Strategic Plan published by the CFPB in February 2018, the acting director summarized the changes at the CFPB -- to fulfill its statutory responsibilities, but to go no further. The
20
Strategic Plan notes that the CFPB will focus on protecting the legal rights of consumers while engaging in rulemaking where appropriate to address unwarranted regulatory burdens. Beyond the CFPB enforcement practices, private RESPA litigation may also be pursued, including an action settled by us, our former joint venture and PHH that is described in Note 13, "Commitments and Contingencies—Litigation", to our consolidated financial statements included elsewhere in this Annual Report. In addition, permissible activities under state statutes similar to RESPA may be interpreted more narrowly and enforcement proceedings of those statutes by state regulatory authorities may also be aggressively pursued.
Our company owned real estate brokerage business is also subject to numerous federal, state and local laws and regulations that contain general standards for and limitations on the conduct of real estate brokers and sales agents, including those relating to the licensing of brokers and sales agents, fiduciary and agency duties, consumer disclosure obligations, administration of trust funds, collection of commissions, restrictions on information sharing with affiliates, fair housing standards and advertising and consumer disclosures. Under state law, our company owned real estate brokers have certain duties to supervise and are responsible for the conduct of their brokerage businesses. Although real estate sales agents historically have been classified as independent contractors, newer rules and interpretations of state and federal employment laws and regulations, including those governing employee classification and wage and hour regulations, may impact industry practices and our company owned brokerage operations. Real estate licensing laws generally permit brokers to engage sales agents as independent contractors but require that the broker supervise their activities.
Regulation of Title Insurance and Settlement Services. Many states license and regulate title agencies/settlement service providers or certain employees and underwriters through their Departments of Insurance or other regulatory body. In many states, title insurance rates are either promulgated by the state or are required to be filed with each state by the agent or underwriter, and some states promulgate the split of title insurance premiums between the agent and underwriter. States sometimes unilaterally lower the insurance rates relative to loss experience and other relevant factors. States also require title agencies and title underwriters to meet certain minimum financial requirements for net worth and working capital. In addition, the insurance laws and regulations of Texas, the jurisdiction in which our title insurance underwriter subsidiary, Title Resources, is domiciled, generally provide that no person may acquire control, directly or indirectly, of a Texas domiciled insurer, unless the person has provided required information to, and the acquisition is approved or not disapproved by, the Texas Department of Insurance. Generally, any person acquiring beneficial ownership of 10% or more of our voting securities would be presumed to have acquired indirect control of our title insurance underwriter subsidiary unless the Texas Department of Insurance, upon application, determines otherwise. Our insurance underwriter is also subject to a holding company act in its state of domicile, which regulates, among other matters, investment policies and the ability to pay dividends.
Certain states in which we operate have "controlled business" statutes which impose limitations on affiliations between providers of title and settlement services, on the one hand, and real estate brokers, mortgage lenders and other real estate service providers, on the other hand. We are aware of the states imposing such limits and monitor the others to ensure that if they implement such a limit that we will be prepared to comply with any such rule. "Controlled business" typically is defined as sources controlled by, or which control, directly or indirectly, the title insurer or agent. Pursuant to legislation enacted in the State of New York in late 2014 requiring the licensing of title agents, the New York Department of Insurance has issued regulations that provide that title agents with affiliated businesses must make a good faith effort to obtain, and be open for, title insurance business from all sources and not business only from affiliated persons, including actively competing in the marketplace. We are not aware of any other recent or pending controlled business legislation. A company's failure to comply with such statutes could result in the non-renewal of the Company's license to provide title and settlement services. We provide our services not only to our affiliates but also to third-party businesses in the geographic areas in which we operate. Accordingly, we manage our business in a manner to comply with any applicable "controlled business" statutes by ensuring that we generate sufficient business from sources we do not control. We have never been cited for failing to comply with a "controlled business" statute.
Regulation of the Mortgage Industry by the Dodd-Frank Act. Dodd-Frank endows the CFPB with rule making, examination and enforcement authority involving consumer financial products and services, including mortgage finance. The CFPB has issued a myriad of proposed and final rules which could materially and adversely affect the mortgage and housing industries. Dodd-Frank establishes new standards and practices for mortgage originators, including determining a prospective borrower's ability to repay its mortgage and restricting the fees that mortgage originators may collect.
Cybersecurity and Data Privacy Regulations. We are required to comply with regulations both in the United States and in other countries where we do business that regulate cybersecurity and related matters. For example, on March 1, 2017, new cybersecurity rules took effect for financial institutions, insurers and certain other companies, including our title and settlement services subsidiary, supervised by the New York Department of Financial Services (the “NYDFS
21
Cybersecurity Regulation”). The NYDFS Cybersecurity Regulation imposes new regulatory burdens intended to protect the confidentiality, integrity and availability of information systems.
In addition, we are required to comply with increasingly complex and changing data privacy regulations both in the United States and in other countries and territories where we do business that regulate the collection, use and transfer of personal data, including particularly the transfer of personal data between or among countries. These laws and their interpretations continue to develop and may be inconsistent from jurisdiction to jurisdiction. In many cases, these laws apply not only to third-party transactions, but also to transfers of information between us and our subsidiaries, including employee information. Many of these foreign data privacy regulations (including the General Data Protection Regulation, which becomes effective in the European Union on May 25, 2018) are more stringent than those in the United States and may result in significantly greater compliance burdens and costs. In addition, non-compliance with these regulations could result in penalties or significant legal liability for our acts and, potentially, for acts of companies that perform services on our behalf.
22
Item 1A. Risk Factors.
You should carefully consider each of the following risk factors and all of the other information set forth in this Annual Report. The risk factors generally have been separated into three primary groups: (1) risks relating to our business; (2) risks relating to our indebtedness; and (3) risks relating to an investment in our common stock. Based on the information currently known to us, we believe that the following information identifies the most significant risk factors affecting our Company and our common stock. However, the risks and uncertainties are not limited to those set forth in the risk factors described below. In addition, past financial performance may not be a reliable indicator of future performance and historical trends should not be used to anticipate results or trends in future periods.
Risks Related to Our Business
Macroeconomic Conditions
The residential real estate market is cyclical and we are negatively impacted by downturns and constraints in this market.
The residential real estate market tends to be cyclical and typically is affected by changes in general economic conditions which are beyond our control. The U.S. residential real estate industry was in a significant and lengthy downturn from the second half of 2005 through 2011. Beginning in 2012, the U.S. residential real estate industry began a recovery. We cannot predict whether the housing market will continue to improve or maintain a steady state. If the residential real estate market or the economy as a whole does not continue to improve or worsens, our business, financial condition and liquidity may be materially adversely affected, including our ability to access capital and grow our business.
Any of the following could halt or limit the current growth of the housing market and have a material adverse effect on our business by causing a lack of sustained growth or a decline in the number of homesales and/or prices which in turn, could adversely affect our revenues and profitability:
• | high levels of unemployment and/or continued slow wage growth; |
• | a period of slow economic growth or recessionary conditions; |
• | increasing mortgage rates and down payment requirements and/or constraints on the availability of mortgage financing; |
• | weak credit markets; |
• | insufficient or excessive regional home inventory levels; |
• | a low level of consumer confidence in the economy and/or the residential real estate market due to macroeconomic events domestically or internationally; |
• | instability of financial institutions; |
• | legislative or regulatory changes (including changes in regulatory interpretations or regulatory practices) that would adversely impact the residential real estate market; |
• | federal and/or state income tax changes and other tax reform affecting real estate and/or real estate transactions, including, in particular, the impact of the Tax Cuts and Jobs Act of 2017 (the “2017 Tax Act”); |
• | renewed high levels of foreclosure activity; |
• | adverse changes in local or regional economic conditions, particularly in states where our business is concentrated; |
• | the inability or unwillingness of homeowners to enter into homesale transactions due to first-time homebuyer concerns about investing in a home and move-up buyers having limited or negative equity in their existing homes; |
• | a decrease in the affordability of homes; |
• | decreasing home ownership rates, declining demand for real estate and changing social attitudes toward home ownership; and/or |
• | natural disasters, such as hurricanes, earthquakes, wildfires, mudslides and other events that disrupt local or regional real estate markets. |
In addition, homesale inventory levels for the mainstream housing market have been declining over the past several years due to strong demand. According to NAR, the inventory of existing homes for sale in the U.S. was 1.5 million and 1.7 million at the end of December 2017 and December 2016, respectively. The December 2017 inventory represents a national average supply of 3.2 months at the current homesales pace which is significantly below the 5.9 month 25-year average as of December 31, 2017. The national average supply at the then-current homesales pace for December 31, 2016, 2015 and
23
2014 was 3.6 months, 3.9 months and 4.4 months, respectively. If interest rates were to rise, homebuilders may determine to discontinue or delay new projects, which could further contribute to inventory constraints. While a continuation of low inventory levels may contribute to favorable demand conditions and improved homesale price growth, insufficient inventory levels have had a negative impact on homesale volume growth and may increase competition for homes and limit the proclivity of current homeowners to purchase an alternate home. Ongoing constraints on home inventory levels may continue to have an adverse impact on the number of homesale transactions for our company owned brokerage business and the businesses of our franchisees, which may limit our ability to grow revenue.
The passage of the 2017 Tax Act may have a negative impact on homeownership rates and homesale transaction activity, which could adversely affect our profitability.
The 2017 Tax Act, which became law on December 22, 2017, includes provisions that, among other things:
• | reduce individual federal tax brackets at most income levels; |
• | increase the standard deduction from $12,700 to $24,000 for married taxpayers filing a joint return; |
• | caps the aggregate amount of property, sales and state and local income tax deductions at $10,000; |
• | reduce the principal amount to which the home mortgage interest deduction will be available to potentially impacted U.S. taxpayers who enter into a mortgage on or after December 15, 2017 from $1,000,000 to $750,000, while entirely suspending interest deductibility of home equity loans; and |
• | suspend the deductibility of certain home moving expenses. |
These changes affecting individual taxpayers will cease to apply after December 31, 2025 unless further extended by future legislation. Certain of these provisions of the 2017 Tax Act, alone or in combination, directly impact traditional incentives associated with home ownership and may reduce the financial distinction between renting and owning a home for many households who are U.S. residents for federal income tax purposes at certain income levels, which may have a negative impact on the national homeownership rate. In addition, certain existing homeowners may be less likely to purchase a larger or more expensive home or refinance a mortgage given the reduced mortgage interest deductibility opportunities (from $1,000,000 to $750,000 on mortgages that are not grandfathered) and lessened property tax deductibility. The reduction in state and local tax deductibility impacts all households, including renters, particularly in states with higher taxes. It is unclear what impact, if any, this will have on the mobility of such state residents, or on home values in such geographies, although it may result in some shift in the value of homes from high tax states (where the deductibility of such taxes may be limited beyond previous levels) to those states with low or no state income tax. The effects of the 2017 Tax Act on average homesale prices may be more impactful in states where average home prices, state and local incomes taxes, and/or property taxes are high, including California and the New York tri-state area, where our company owned brokerage and our franchisee businesses maintain a material presence. In addition, the suspension of the deduction for certain moving expenses may result in fewer instances of specific relocation services.
Reductions in the number of homesale transactions or average homesale price or reductions in or changes to the types of relocation services provided could have a material adverse effect on our revenues and profitability.
Adverse developments in general business and economic conditions could have a material adverse effect on our financial condition and our results of operations.
Our business and operations and those of our franchisees are sensitive to general business and economic conditions in the U.S. and worldwide. These conditions include short-term and long-term interest rates, inflation, fluctuations in debt and equity capital markets, levels of unemployment, consumer confidence and the general condition of the U.S. and the world economy.
The residential real estate market also depends upon the strength of financial institutions, which are sensitive to changes in the general macroeconomic environment. Lack of available credit or lack of confidence in the financial sector could materially and adversely affect our business, financial condition and results of operations.
A host of factors beyond our control could cause fluctuations in these conditions, including the political environment, disruptions in a major geoeconomic region, or equity or commodity markets and acts or threats of war or terrorism which could have a material adverse effect on our financial condition and our results of operations.
24
Monetary policies of the federal government and its agencies may have a material impact on our operations.
Our business is significantly affected by the monetary policies of the federal government and its agencies. We are particularly affected by the policies of the Federal Reserve Board, which regulates the supply of money and credit in the U.S. The Federal Reserve Board's policies impact the real estate market through their effect on interest rates as well as the cost of our interest-bearing liabilities.
We could be negatively impacted by any rising interest rate environment. As mortgage rates rise, the number of homesale transactions may decrease as potential home sellers choose to stay with their lower mortgage rate rather than sell their home and pay a higher mortgage rate with the purchase of another home, and potential home buyers choose to rent rather than pay higher mortgage rates. An increase in mortgage rates would also be expected to reduce the number of homesale refinancing transactions, which could materially adversely impact our earnings from our mortgage origination joint venture as well as the revenue stream of our title and settlement services segment. Changes in the Federal Reserve Board's policies, the interest rate environment and mortgage market are beyond our control, are difficult to predict and could have a material adverse effect on our business, results of operations and financial condition.
Strategic and Operational
Our company owned brokerage operations are subject to geographic and high-end real estate market risks, which could adversely affect our revenues and profitability.
Our subsidiary, NRT, owns real estate brokerage offices located in and around large metropolitan areas in the U.S. Local and regional economic conditions in these locations could differ materially from prevailing conditions in other parts of the country. For the year ended December 31, 2017, NRT realized approximately 27% of its revenues from California, 22% from the New York metropolitan area and 9% from Florida, which, in the aggregate, totals approximately 58% of its revenues. A downturn in residential real estate demand or economic conditions that is concentrated in these regions could result in a decline in NRT's total gross commission income and profitability disproportionate to the downturn experienced throughout the U.S. and could have a material adverse effect on us. The effects of the 2017 Tax Act on average homesale prices may be more impactful in states where average home prices, state and local incomes taxes, and/or property taxes are high, including California and the New York tri-state area. In addition, given the significant geographic overlap of our title and settlement services business with our company owned brokerage offices, such regional declines affecting our company owned brokerage operations could have a disproportionate adverse effect on our title and settlement services business as well. A downturn in residential real estate demand or economic conditions in these states could result in a decline in our overall revenues and have a material adverse effect on us.
NRT has a significant concentration of transactions at the higher end of the U.S. real estate market. A shift in NRT's mix of property transactions from the high range to lower and middle range homes would adversely affect the average price of NRT's closed homesales. Such a shift, absent an increase in transactions, would have an adverse effect on our operating results. In addition, NRT continues to face heightened competition for both homesale transactions and high performing independent sales agents because of its prominent position in the higher end housing markets.
Moreover, NRT also has relationships with developers, primarily in major cities, to provide marketing and brokerage services in new developments. Deceleration in the building of new housing and/or timing of closings of new developments may lead to lower unit sales in the new development market, which could have a material adverse effect on the revenue generated by NRT and our profitability.
Market competition, the influence of independent sales agents and the continued execution of our strategic initiatives may continue to shift a higher proportion of homesale commissions to affiliated independent sales agents or otherwise erode our share of the commission income generated by homesale transactions, which could negatively affect our profitability.
We believe that the influence of independent sales agents and independent sales agent teams has increased during the past five years and, together with increasing competition due to new entrants and the changing practices of existing competitors, has put, and could continue to put, downward pressure on industry margins, which could negatively impact our profitability.
Our company owned brokerage business introduced growth initiatives in late 2016 focused on the recruitment and retention of high performing independent sales agents through the use of financial incentives and best-in-class retention practices, among other things. While these initiatives enabled us to mitigate declines in market share through the retention
25
of existing independent sales agents and improved recruiting success, we have experienced and expect to continue to experience adverse pressure on costs and margin from these initiatives.
There are also market participants who differentiate themselves by offering consumers lower commission rates on transactions. Although such competitors have yet to have a material impact on overall brokerage commission rates, this could change in the future if they use greater discounts as a means to increase their market share or improve their value proposition.
If independent sales agents are paid a higher proportion of the commissions earned on a homesale transaction or the level of commission income we earn from a homesale transaction is otherwise reduced, the operating margins of our company owned residential brokerages or our franchisees could be adversely affected.
We may not successfully develop or procure technology, including Zap® product enhancements, that support the ability of our company owned and franchisee real estate brokerages and their affiliated independent sales agents to compete effectively and efficiently, which could adversely affect our results of operations.
Our future success depends in part on our ability to continuously develop and improve our technology products and services or procure such technology, in particular for our company owned and franchisee real estate brokerages, affiliated independent sales agents and their customers as well as for our relocation and title and settlement services segments. We have expended, and expect to continue to expend, substantial time, capital, and other resources to identify the needs of our company owned brokerages, franchisees, independent sales agents and their customers and to develop technology and service offerings to meet those needs.
We may incur unforeseen expenses in the development of enhancements to the Zap platform or the advancement of other technology products and we may not be able to introduce new technologies as quickly as we would like or in a cost-effective manner. In addition, we may be unable to attract and retain employees involved in developing our technology and systems. Furthermore, we may not be successful, or as successful as our competitors, in procuring or developing technologies and systems that operate effectively across multiple devices and platforms in a way that is appealing or beneficial to our users and there can be no assurance that independent sales agents in our franchise system, including those affiliated with our company owned brokerages, or customers will use the Zap platform or other technology products we may develop. Any of the foregoing could adversely affect our value proposition and the productivity of independent sales agents, which in turn could adversely affect our results of operations.
Competition in the residential real estate and relocation business is intense and may adversely affect our financial performance.
We generally face intense competition in the residential real estate services business.
As a real estate brokerage franchisor, our products are our brand names and the support services we provide to our franchisees and our ability to grow our franchisor business is also dependent on the operational and financial success of our franchisees.
• | Upon the expiration of a franchise agreement, a franchisee may choose to franchise with one of our competitors or operate as an independent broker. Competitors may offer franchisees whose franchise agreements are expiring or prospective franchisees products and services similar to ours at rates that are lower than we charge. |
• | We face the risk that currently unaffiliated brokers may not enter into franchise agreements with us because they believe they can compete effectively in the market without the need to license a brand of a franchisor and receive services offered by a franchisor. Additionally, unaffiliated brokers may decide not to enter into a franchise relationship with us as they may believe that their business will be more attractive to a prospective purchaser without the existence of a franchise relationship. |
• | Regional and local franchisors as well as franchisors offering different franchise models or services provide additional competitive pressure in certain areas. To remain competitive in the sale of franchises and to retain our existing franchisees, we may have to reduce the fees we charge our franchisees, increase the amount of non-standard incentives we issue or take other actions or employ other models to be competitive with fees charged by competitors. In addition, the full-service traditional franchise model that we employ has experienced declines in market share over the past several years. If this trend continues or if we fail to successfully diversify our franchise offerings, we may fail to attract new franchisees and existing franchisees may not renew their agreements with us. |
26
• | Our ability to succeed as a franchisor is largely dependent on the efforts and abilities of our franchisees to attract and retain independent sales agents, which is subject to numerous factors, including the sales commissions or other compensation they receive and their perception of brand value and the value of support services we provide. Competition for sales agents in the real estate services industry, including within our franchise system, is high, in particular with respect to more productive sales agents. Increasingly, independent sales agents have affiliated with brokerages that offer a different mix of services to the independent sales agents, allowing the independent sales agent to retain a greater percentage of the commission and purchase services from other vendors as needed. If our franchisees fail to attract and retain successful independent sales agents or they fail to replace departing successful independent sales agents with similarly productive independent sales agents, our franchisees' gross commission income may decrease, resulting in a reduction in royalty fees paid to us. |
• | Listing aggregators and other web-based real estate service providers may also begin to compete for part of our franchisor service revenue through referral or other fees and could disintermediate our relationships with our franchisees and our franchisees' relationships with their independent sales agents and buyers and sellers of homes. |
Our company owned brokerage business, like that of our franchisees, generally faces intense competition. We compete with national and regional independent real estate brokerages and franchisors, franchisees of our brands and other real estate franchisors and discount and limited service brokerages for both business and independent sales agents. Real estate brokers typically compete for business primarily on the basis of services offered, reputation, utilization of technology, personal contacts and brokerage commission.
• | Competition is particularly severe in the densely populated metropolitan areas in which we operate. |
• | In addition, the real estate brokerage industry has minimal barriers to entry for new participants, including participants pursuing non-traditional methods of marketing real estate, such as brokers who discount their commissions and companies that employ technologies intended to disrupt the traditional brokerage model or minimize or eliminate the role brokers and sales agents perform in the homesale transaction process. Other non-traditional models that operate outside of the brokerage industry, such as companies that leverage capital to purchase homes directly from sellers, having been gaining market attention in recent years. Certain of our competitors are also increasingly well-funded, which strengthens their competitive position and ability to offer aggressive or alternative compensation arrangements to top-performing sales agents. Moreover, a growing number of companies are competing in non-traditional ways for a portion of the gross commission income generated by homesale transactions. For example, listing aggregators and other web-based real estate service providers not only compete for our company owned brokerage business by establishing relationships with independent sales agents and/or buyers and sellers of homes, they also increasingly charge brokerages and independent sales agents new fees for existing and new services. |
• | Our average homesale commission rate per side in our company owned real estate services segment has remained relatively constant from 2002 to 2017, changing from 2.62% in 2002 to 2.44% for the year ended December 31, 2017. As with our real estate franchise business, a decrease in the average brokerage commission rate may adversely affect our revenues. |
• | We also compete for the services of qualified licensed independent sales agents. Some of the firms competing for sales agents use different models of compensation, which may be appealing to certain sales agents and hinder our ability to attract and retain those agents. The ability of our company owned brokerage offices to retain independent sales agents is generally subject to numerous factors, including the sales commissions they receive, their perception of brand value and provided support services, and markets served. Competition for sales agents could reduce the commission amounts retained by our Company after giving effect to the split with independent sales agents and possibly increase the amounts that we spend on marketing. |
In our relocation services business, we compete primarily with global and regional outsourced relocation service providers. We have faced greater competition from firms that provide services on a global basis. Competition is expected to continue to intensify as an increasingly higher percentage of relocation clients reduce their global relocation benefits and related spend.
The title and settlement services business is highly competitive and fragmented. The number and size of competing companies vary in the different areas in which we conduct business. In certain parts of the country we compete with small title agents and attorneys while in other parts of the country our competition is the larger title underwriters and national vendor management companies.
27
Our financial results are affected by the operating results of our franchisees.
Our real estate franchise services segment receives revenue in the form of royalties, which are based on a percentage of gross commission income earned by our franchisees. Accordingly, the financial results of our real estate franchise services segment are dependent upon the operational and financial success of our franchisees. If industry trends or economic conditions are not sustained or do not continue to improve or if one or more of our top performing franchisees become less competitive, our franchisees' financial results may worsen and our royalty revenues may decline, which could have a material adverse effect on our revenues and profitability. In addition, we may have to increase our bad debt and note reserves. We may also have to terminate franchisees due to non-payment.
If franchisees fail to renew their franchise agreements, or if we continue to induce franchisees to renew these agreements through lower royalty rates or higher incentives, then our royalty revenues may decrease, and profitability may be lower than in the past. These risks are pronounced in years when a significant number of franchise agreements, which typically have a ten year term, are expiring. In addition, although during 2017, none of our franchisees (other than NRT) generated more than 1% of our real estate franchise business, a significant majority of this segment's revenue is generated from our top 250 franchisees. If one or more of our significant franchisees fail to renew their contracts with us, our revenues and profitability could be materially adversely affected.
Our franchisees and their independent sales agents could take actions that could harm our business.
Our franchisees are independent business operators and we do not exercise control over their day-to-day operations. Our franchisees may not successfully operate a real estate brokerage business in a manner consistent with industry standards, or may not affiliate with effective independent sales agents or employees. If our franchisees or their independent sales agents were to provide diminished quality of service to customers, our image and reputation may suffer materially and adversely affect our results of operations. Improper actions involving our franchisees, including regarding their relationships with independent sales agents, clients and employees, may also lead to direct claims against us based on theories of vicarious liability, negligence, joint operations and joint employer liability which, if determined adversely, could increase costs, negatively impact the business prospects of our franchisees and subject us to incremental liability for their actions.
Additionally, franchisees and their independent sales agents, including those handling properties for our relocation business, may engage or be accused of engaging in unlawful or tortious acts, such as violating the anti-discrimination requirements of the Fair Housing Act. Such acts or the accusation of such acts could harm our brands' image, reputation and goodwill or compromise our relocation business relationships with clients.
Franchisees, as independent business operators, may from time to time disagree with us and our strategies regarding the business or our interpretation of our respective rights and obligations under the franchise agreement. To the extent we have such disputes, the attention of our management and our franchisees will be diverted, which could have a material adverse effect on our business, financial condition, results of operations or cash flows.
Actions by the independent sales agents engaged by our company owned brokerages could materially and adversely affect our reputation and subject us to liability.
Our company owned brokerage operations rely on the performance of independent sales agents. If the independent sales agents were to provide lower quality services to our customers, our image and reputation could be materially adversely affected. In addition, we could also be subject to litigation and regulatory claims arising out of their performance of brokerage services, which if adversely determined, could materially and adversely affect us.
We do not own two of our brands and significant difficulties in the business of the brand owners could negatively reflect on the brand and the brand value.
The Sotheby's International Realty® and Better Homes and Gardens® Real Estate brands are owned by the companies that founded these brands. We are the exclusive party licensed to run brokerage services in residential real estate under those brands, whether through our franchisees or our company owned operations. Our future operations and performance with respect to these brands requires the successful protection of those brands. Any significant difficulties in the business of the brand owners could negatively reflect on the brand and the brand value.
28
If one or more significant affinity clients or a significant number of our relocation clients cease or reduce volume under their contracts with us, our revenues and profitability could be materially adversely affected.
Substantially all of our contracts with our affinity and relocation clients are terminable at any time at the option of the client, are non-exclusive and do not require such client to maintain any level of business with us. If one or more significant affinity or relocation clients cease or reduce volume under their contracts with us, our revenues and profitability could be materially adversely affected.
If recent trends in corporate relocation practices continue, there could be fewer employee relocations, which may have a material adverse impact on the operating results of our relocation business.
Many of the general residential housing trends impacting our businesses that derive revenue from homesales also impact our relocation services business. Additionally, key performance drivers of our relocation business include global corporate spending on relocation services, which continue to shift to lower cost relocation benefits as corporate clients engage in cost reduction initiatives and/or restructuring programs, as well as changes in employment relocation trends. As a result of a shift in the mix of services and number of services being delivered per move, our relocation business has been increasingly subject to a competitive pricing environment and lower average revenue per relocation. Lower volume growth, in particular with respect to global relocation activity, has also impacted the operating results of our relocation business. These factors may continue to put pressure on the growth and profitability of this segment. In addition, the suspension of the deduction for certain moving expenses under the 2017 Tax Act could potentially contribute to fewer businesses offering these benefits and could result in fewer instances of these services.
We are reliant on third-party vendors to perform services on our behalf.
Aspects of our business, such as our relocation segment, are performed on our behalf by third-party vendors and cover a wide variety of services and such vendors may be in possession of personal information of our customers. In many instances these suppliers are in direct contact with our customers in order to deliver services on our behalf. If our third-party suppliers were to provide diminished services to our customers or face cybersecurity breaches of their information technology systems, our image and reputation could be materially adversely affected. In addition, we could also be subject to litigation and regulatory claims arising out of the performance of our third-party suppliers based on theories of vicarious liability, negligence or failure to comply with laws and regulations including those related to anti-bribery and anti-corruption, such as the Foreign Corrupt Practices Act and U.K. Bribery Act and those related to data protection and privacy, such as the General Data Protection Regulation, effective May 2018.
We are reliant upon information technology to operate our business and maintain our competitiveness.
Our ability to leverage our technology and data scale is critical to our long-term strategy. Our business, including our ability to attract employees and independent sales agents, increasingly depends upon the use of sophisticated information technologies and systems, including technology and systems (cloud solutions, mobile and otherwise) utilized for communications, marketing, productivity tools, training, lead generation, records of transactions, business records (employment, accounting, tax, etc.), procurement, call center operations and administrative systems. The operation of these technologies and systems is dependent upon third-party technologies, systems and services, for which there are no assurances of continued or uninterrupted availability and support by the applicable third-party vendors on commercially reasonable terms. We also cannot assure that we will be able to continue to effectively operate and maintain our information technologies and systems. In addition, our information technologies and systems are expected to require refinements and enhancements on an ongoing basis, and we expect that advanced new technologies and systems will continue to be introduced. We may not be able to obtain such new technologies and systems, or to replace or introduce new technologies and systems as quickly as our competitors or in a cost-effective manner. Also, we may not achieve the benefits anticipated or required from any new technology or system, and we may not be able to devote financial resources to new technologies and systems in the future.
Tightened mortgage underwriting standards could continue to reduce homebuyers' ability to access the credit markets on reasonable terms.
During the past several years, many lenders have significantly tightened their underwriting standards and many alternative mortgage products have become less available in the marketplace. More stringent mortgage underwriting standards could adversely affect the ability and willingness of prospective buyers to finance home purchases or to sell their existing homes, which would adversely affect our operating results.
29
We may not realize the expected benefits from our mortgage origination joint venture.
Our joint venture with Guaranteed Rate began doing business in August 2017 on a phased-in basis. We may not realize the expected benefits (including anticipated earnings and dividends) from the mortgage origination joint venture. For example, changes affecting the mortgage industry in general, including but not limited to regulatory changes, increases in mortgage interest rates and decreases in operating margins, may have a material adverse impact on earnings and dividends from the joint venture. Likewise, operational or liquidity risks that may be faced by the joint venture or our partner, such as litigation or regulatory investigations that may arise, could have a material adverse impact on the benefits we expect to realize from the venture.
In addition, under the Operating Agreement governing the joint venture, we own a 49.9% equity interest and have certain governance rights related to the joint venture, but do not have control of the day-to-day operations of the joint venture. Rather, our joint venture partner, Guaranteed Rate, is the managing partner of the venture and may make decisions with respect to the day-to-day operation of the venture, which may harm the joint venture or be contrary to our best interests and may adversely affect our results of operations or equity interest in the joint venture.
Regulatory and Legal
Cybersecurity incidents could disrupt business operations, result in the loss of critical and confidential information, and adversely impact our reputation and results of operations.
We face growing risks and costs related to cybersecurity threats to our data and customer, franchisee, employee and independent sales agent data, including but not limited to:
• | the failure or significant disruption of our operations from various causes, including human error, computer malware, ransomware, insecure software, zero day threats, or other events related to our critical information technologies and systems; |
• | the increasing level and sophistication of cybersecurity attacks, including distributed denial of service attacks, data theft, fraud or malicious acts on the part of trusted insiders, social engineering, or other unlawful tactics aimed at compromising the systems and data of our officers, employees and franchisee and company owned brokerage sales agents and their customers (including via systems not directly controlled by us, such as those maintained by our franchisees, affiliated independent sales agents, joint venture partners and third party service providers, including our third-party relocation service providers); and |
• | the reputational and financial risks associated with a loss of data or material data breach (including unauthorized access to our proprietary business information or personal information of our customers, employees and independent sales agents), the transmission of computer malware, or the diversion of homesale transaction closing funds. |
Global cybersecurity threats can range from uncoordinated individual attempts to gain unauthorized access to information technology systems via viruses, worms, and other malicious software, to phishing to advanced and targeted hacking launched by individuals or organizations. These attacks may be directed at the Company, its employees, franchisees, third-party service providers, joint venture partners, and/or the independent sales agents of our franchisee and company owned brokerages and their customers.
In the ordinary course of our business, we and our third-party service providers, our franchisee and company owned brokerage sales agents and our relocation business collect and store sensitive data, including our proprietary business information and intellectual property and that of our clients as well as personally identifiable information, sensitive financial information and other confidential information of our employees, customers and the customers of our franchisee and company owned brokerage sales agents.
Additionally, we increasingly rely on third-party data processing, storage providers, and critical infrastructure services, including cloud solution providers. The secure processing, maintenance and transmission of this information are critical to our operations and with respect to information collected and stored by our third-party service providers, we are reliant upon their security procedures. A breach or attack affecting one of our third-party service providers or partners could harm our business even if we do not control the service that is attacked.
Moreover, the real estate industry is actively targeted by cyber-attacker attempts to conduct electronic fraudulent activity (such as phishing), security breaches and similar attacks directed at participants in real estate services transactions. These attacks, when successful, can result in fraud, including wire fraud related to the diversion of homesale transaction
30
funds, or other harm, which could result in reputational damage to us, our brands, our franchisees, and our independent sales agents and could also result in material increases in our operational costs. Further, these threats to our business may be wholly or partially beyond our control as our franchisees as well as our customers, franchisee and company owned brokerage independent sales agents and their customers and third-party service providers may use computers, smartphones and other devices and systems that are outside of our security control environment. In addition, real estate transactions involve the transmission of funds by the buyers and sellers of real estate and consumers or other service providers selected by the consumer may be the subject of direct cyber-attacks that result in the fraudulent diversion of funds, notwithstanding efforts we have taken to educate consumers with respect to these risks.
In addition, the increasing prevalence and the evolution of cyber-attacks and other efforts to breach or disrupt our systems or those of our employees, customers, third-party service providers, joint venture partners, and/or franchisee and company owned brokerage sales agents and their customers, has led, and will likely continue to lead, to increased costs to us with respect to preventing, investigating, mitigating and remediating these risks, as well as any related attempted or actual fraud.
Moreover, we are required to comply with regulations both in the United States and in other countries where we do business that regulate cybersecurity, privacy and related matters.
While we, our third-party service providers and our franchisees and franchisee and company owned brokerage sales agents, our joint venture partners and our relocation business have experienced, and expect to continue to experience, these types of threats and incidents, none of them to date has been material to the Company. Although we employ measures to prevent, detect, address and mitigate these threats (including access controls, data encryption, penetration testing, vulnerability assessments and maintenance of backup and protective systems), and conduct diligence on the security measures employed by key third-party service providers, cybersecurity incidents, depending on their nature and scope, could potentially result in the misappropriation, destruction, corruption or unavailability of critical data and confidential or proprietary information (our own or that of third parties, including personally identifiable information and financial information) and the disruption of business operations.
Our corporate errors and omissions and cybersecurity breach insurance may be insufficient to compensate us for losses that may occur. The potential consequences of a material cybersecurity incident include regulatory violations of applicable U.S. and international privacy and other laws, reputational damage, loss of market value, litigation with third parties (which could result in our exposure to material civil or criminal liability), diminution in the value of the services we provide to our customers, and increased cybersecurity protection and remediation costs (that may include liability for stolen assets or information), which in turn could have a material adverse effect on our competitiveness and results of operations.
We may experience significant claims relating to our operations, and losses resulting from fraud, defalcation or misconduct.
We issue title insurance policies which provide coverage for real property to mortgage lenders and buyers of real property. When acting as a title agent issuing a policy on behalf of an underwriter, our insurance risk is typically limited to the first five thousand dollars for claims on any one policy, though our insurance risk is not limited if we are negligent. Our title underwriter typically underwrites title insurance policies of up to $1.5 million. For policies in excess of $1.5 million, we typically obtain a reinsurance policy from a national underwriter to reinsure the excess amount. To date, our title underwriter has experienced claims losses that are significantly below the industry average; however, our claims experience could increase in the future, which could negatively impact the profitability of that business. We may also be subject to legal claims or additional claims losses arising from the handling of escrow transactions and closings by our owned title agencies or our underwriter's independent title agents. We carry errors and omissions insurance for errors made by our company owned brokerage business during the real estate settlement process as well as errors by us related to real estate services. Our franchise agreements also require our franchisees to name us as an additional insured on their errors and omissions and general liability insurance policies. The occurrence of a significant claim in excess of our insurance coverage (including any coverage under franchisee insurance policies) in any given period could have a material adverse effect on our financial condition and results of operations during the period. In addition, insurance carriers may dispute coverage for various reasons and there can be no assurance that all claims will be covered by insurance.
Fraud, defalcation and misconduct by employees are also risks inherent in our business, particularly given the high transactional volumes in our company owned brokerage, title and settlement services and our relocation businesses. We may also from time to time be subject to liability claims based upon the fraud or misconduct of our franchisees. To the extent that any loss or theft of funds substantially exceeds our insurance coverage, our business could be materially adversely affected.
31
If we fail to protect the privacy and personally identifiable information of our customers or employees, we may be subject to legal claims, government action and damage to our reputation.
We rely on the collection and use of personal information from customers to conduct our business. We are required to comply with increasingly complex and changing data privacy regulations both in the United States and in other countries where we do business that regulate the collection, use and transfer of personal data, including particularly the transfer of personal data between or among countries. These laws and their interpretations continue to develop and may be inconsistent from jurisdiction to jurisdiction. In many cases, these laws apply not only to third-party transactions, but also to transfers of information between us and our subsidiaries, including employee information.
Many of these foreign data privacy regulations (including the General Data Protection Regulation, which becomes effective in the European Union on May 25, 2018) are more stringent than those in the United States and may result in significantly greater compliance burdens and costs. In addition, non-compliance with these regulations could result in penalties or significant legal liability for our acts and, potentially, for acts of companies that perform services on our behalf.
We could be adversely affected if legislation or regulations are expanded to require changes in our business practices or if governing jurisdictions interpret or implement their legislation or regulations in ways that negatively affect our business, results of operations or financial condition.
In addition, while we disclose our information collection and dissemination practices in a published privacy statement on our websites, which we may modify from time to time, we may be subject to legal claims, government action and damage to our reputation if we act or are perceived to be acting inconsistently with the terms of our privacy statement, customer expectations or state, national and international regulations.
The occurrence of a significant claim in excess of our insurance coverage in any given period could have a material adverse effect on our financial condition and results of operations during the period. In the event we or the vendors with which we contract to provide services on behalf of our customers were to suffer a breach of personal information, our customers, such as our Cartus corporate or affinity clients, their employees or members, respectively, franchisees, independent sales agents and lender channel clients, could terminate their business with us. Further, we may be subject to claims to the extent individual employees or independent contractors breach or fail to adhere to Company policies and practices and such actions jeopardize any personal information.
In addition, concern among potential home buyers or sellers about our privacy practices could result in regulatory investigations, especially in the European Union as related to its Data Privacy Directive or the General Data Protection Regulation once it becomes effective. Additionally, concern among potential home buyers or sellers could keep them from using our services or require us to incur significant expense to alter our business practices or educate them about how we use personal information.
We are subject to certain risks related to litigation filed by or against us, and adverse results may harm our business and financial condition.
We cannot predict with certainty the cost of defense, the cost of prosecution, insurance coverage or the ultimate outcome of litigation and other proceedings filed by or against us, including remedies or damage awards, and adverse results in such litigation and other proceedings, including treble damages and penalties. Adverse outcomes may harm our business and financial condition. Such litigation and other proceedings may include, but are not limited to:
• | actions relating to claims alleging violations of RESPA (see Dodge litigation described in Note 13, "Commitments and Contingencies—Litigation", to our consolidated financial statements included elsewhere in this Annual Report) or state consumer fraud statutes, intellectual property, commercial arrangements, franchising arrangements, negligence and fiduciary duty claims arising from franchising arrangements or company owned brokerage operations or violations of similar laws in countries we operate in around the world; |
• | employment law claims, including claims challenging the classification of sales agents as independent contractors as well as wage and hour and joint employer claims; |
• | cybersecurity incidents, theft and data breach claims; |
• | actions against our title company for defalcations on closing payments or alleging it knew or should have known others were committing mortgage fraud; |
• | copyright infringement actions, including those alleging improper use of copyrighted photographs on websites or in marketing materials without consent of the copyright holder; |
32
• | brokerage disputes like the failure to disclose hidden defects in the property as well as other brokerage claims associated with listing information and property history, including disputes involving buyers of relocation property; |
• | vicarious or joint liability based upon the conduct of individuals or entities traditionally outside of our control, including franchisees and independent sales agents; |
• | antitrust and anti-competition claims; |
• | general fraud claims; and |
• | compliance with wage and hour regulations. |
In addition, class action lawsuits can often be particularly burdensome litigation given the breadth of claims, the large potential damages claimed and the significant costs of defense. The risks of litigation become magnified and the costs of settlement increase in class actions in which the courts grant partial or full certification of a large class. In the case of intellectual property litigation and proceedings, adverse outcomes could include the cancellation, invalidation or other loss of material intellectual property rights used in our business and injunctions prohibiting our use of business processes or technology that is subject to third-party patents or other third-party intellectual property rights. In addition, we may be required to enter into licensing agreements (if available on acceptable terms or at all) and pay royalties. Insurance coverage may be unavailable for certain types of claims and even where available, insurance carriers may dispute coverage for various reasons, including the cost of defense, and such insurance may not be sufficient to cover the losses we incur.
Adverse decisions in litigation against companies unrelated to us could impact our business practices and those of our franchisees in a manner that adversely impacts our financial condition and results of operations.
Litigation, claims and regulatory proceedings against other participants in the residential real estate or relocation industry may impact the Company when the rulings in those cases cover practices common to the broader industry. Examples may include claims associated with RESPA compliance, broker fiduciary duties, and sales agent classification. Similarly, the Company may be impacted by litigation and other claims against companies in other industries. Rulings on matters such as the enforcement of arbitration agreements and worker classification may adversely affect the Company and other residential real estate industry participants as a result of the classification of sales agents as independent contractors, irrespective of the fact that the parties subject to the rulings are in a different industry. There is active worker classification litigation in numerous jurisdictions, including Massachusetts, California, New Jersey and New York, against a variety of industries where the plaintiffs seek to reclassify independent contractors as employees or to challenge the use of federal and state minimum wage and overtime exemptions. To the extent plaintiffs are successful in these types of litigation matters, and we or our franchisees cannot distinguish our or their practices (or our industry’s practices), we and our franchisees could face significant liability and could be required to modify certain business relationships, either of which could materially and adversely impact our financial condition and results of operations.
Our relationship with our employees is subject to an array of different employment, tax reporting and regulatory obligations and any significant failure to comply with these obligations could materially and adversely affect our business.
In the U.S., these obligations relate to federal and state tax codes, federal and state wage and hour laws, state unemployment, workers’ compensation and disability tax laws, right to organize and anti-discrimination and workplace safety laws. Each state has unique wage and hour laws, which have been the subject of increasing litigation nationwide. In addition, federal agencies and each state have its own rules and tests for classification of independent contractors as well as to determine whether employees meet exemptions from minimum wages and overtime laws. These tests consider many factors that also vary from state to state. The tests have evolved based on state case law decisions, regulations and legislative changes, and frequently involve factual analysis. In addition, states have laws and regulations concerning the licensing of real estate agents. While these laws and regulations may have separate provisions related to the classification of sales agents as independent contractors, there can be no assurance that courts will follow the tests in these real estate specific laws and regulations when they differ from those in labor statutes and regulations. When companies are found to have misclassified workers as independent contractors instead of employees, courts can impose significant penalties and damages.
We are also subject to the unique wage and payroll-related laws of each other country in which we have employees, including employee right to privacy laws. Failure to comply with these laws could result in significant penalties and damages.
The legal relationship between residential real estate brokers and licensed sales agents throughout the industry historically has been that of independent contractor. Although we believe our classification practices are proper and
33
consistent with the legal framework for such classification, our company owned brokerage operations could face substantial litigation or disputes in direct claims or regulatory procedures, including the risk of court or regulatory determinations that certain groups of real estate agents should be reclassified as employees and entitled to unpaid minimum wage, overtime, benefits, expense reimbursement and other employment obligations. Significant reclassification determinations in the absence of available exemptions from minimum wage or overtime laws, including damages and penalties for prior periods, could be disruptive to our business, constrain our operations in certain jurisdictions and have a material adverse effect on the operational and financial performance of the Company. In addition, real estate agent reclassification could have a material adverse effect on the operational and financial performance of our franchisees and our competitors.
The weakening or unavailability of our intellectual property rights could adversely impact our business.
Our trademarks, trade names, domain names and other intellectual property rights are fundamental to our brands and our franchising business. The steps we take to obtain, maintain and protect our intellectual property rights may not be adequate and, in particular, we may not own all necessary registrations for our intellectual property. Applications we have filed to register our intellectual property may not be approved by the appropriate regulatory authorities. Our intellectual property rights may not be successfully asserted in the future or may be invalidated, circumvented or challenged. We may be unable to prevent third parties from using our intellectual property rights without our authorization or independently developing technology that is similar to ours. Also, third parties may own rights in similar trademarks. Any unauthorized use of our intellectual property by third parties could reduce our competitive advantages or otherwise harm our business and brands. If we had to litigate to protect these rights, any proceedings could be costly, and we may not prevail. Our intellectual property rights, including our trademarks, may fail to provide us with significant competitive advantages in the U.S. and in foreign jurisdictions that do not have or do not enforce strong intellectual property rights.
We cannot be certain that our intellectual property does not and will not infringe issued intellectual property rights of others. We may be subject to legal proceedings and claims in the ordinary course of our business, including claims of alleged infringement of the patents, trademarks and other intellectual property rights of third parties. Any such claims, whether or not meritorious, could result in costly litigation. Depending on the success of these proceedings, we may be required to enter into licensing or consent agreements (if available on acceptable terms or at all), or to pay damages or cease using certain service marks or trademarks.
We franchise our brands to franchisees. While we try to ensure that the quality of our brands is maintained by all of our franchisees, we cannot assure that these franchisees will not take actions that hurt the value of our intellectual property or our reputation.
Our license agreement with Sotheby's for the use of the Sotheby's International Realty® brand is terminable by Sotheby's prior to the end of the license term if certain conditions occur, including but not limited to the following: (1) we attempt to assign any of our rights under the license agreement in any manner not permitted under the license agreement, (2) we become bankrupt or insolvent, (3) a court issues a non-appealable, final judgment that we have committed certain breaches of the license agreement and we fail to cure such breaches within 60 days of the issuance of such judgment, or (4) we discontinue the use of all of the trademarks licensed under the license agreement for a period of twelve consecutive months.
Our license agreement with Meredith Corporation ("Meredith") for the use of the Better Homes and Gardens® Real Estate brand is terminable by Meredith prior to the end of the license term if certain conditions occur, including but not limited to the following: (1) we attempt to assign any of our rights under the license agreement in any manner not permitted under the license agreement, (2) we become bankrupt or insolvent, or (3) a trial court issues a final judgment that we are in material breach of the license agreement or any representation or warranty we made was false or materially misleading when made.
Several of our businesses are highly regulated and any failure to comply with such regulations or any changes in such regulations could adversely affect our business.
The sale of franchises is regulated by various state laws as well as by the Federal Trade Commission (the “FTC”). The FTC requires that franchisors make extensive disclosure to prospective franchisees but does not require registration. A number of states require registration and/or disclosure in connection with franchise offers and sales. In addition, several states have "franchise relationship laws" or "business opportunity laws" that limit the ability of franchisors to terminate franchise agreements or to withhold consent to the renewal or transfer of these agreements.
34
Our company owned real estate brokerage business must comply with the requirements governing the licensing and conduct of real estate brokerage and brokerage-related businesses in the jurisdictions in which we do business. These laws and regulations contain general standards for and limitations on the conduct of real estate brokers and sales agents, including those relating to licensing of brokers and sales agents, fiduciary, agency and statutory duties, administration of trust funds, collection of commissions, advertising and consumer disclosures. Under state law, our real estate brokers have certain duties and are responsible for the conduct of their brokerage business.
Our company owned real estate brokerage business, our relocation business, our mortgage origination joint venture, our title and settlement service business and the businesses of our franchisees (excluding commercial brokerage transactions) must comply with the Real Estate Settlement Procedures Act (“RESPA”). RESPA and comparable state statutes prohibit providing or receiving payments, or other things of value, for the referral of business to settlement service providers in connection with the closing of real estate transactions involving federally-backed mortgages. RESPA and related regulations do, however, contain a number of provisions that allow for payments or fee splits between providers, including fee splits between brokers and agents, fees splits between brokers, and market-based fees for the provision of actual goods or services. In addition, RESPA allows for referrals to affiliated entities, including joint ventures, when specific requirements have been met. We rely on these provisions in conducting our business activities and believe our arrangements comply with RESPA. RESPA, however, has become a greater challenge in recent years for most industry participants offering settlement services, including mortgage companies, title companies and brokerages, because of changes in the regulatory environment and expansive interpretations of RESPA or similar state statutes by certain courts. With the passage of Dodd-Frank in 2010, primary responsibility for enforcement of RESPA has shifted to the CFPB. The CFPB has, in the recent past, taken a much stricter approach toward interpretation of RESPA and related regulations than the prior regulatory authority (the Department of Housing and Urban Development) and has become significantly more active in the use of enforcement proceedings. In the face of this changing regulatory landscape, various industry participants, while disagreeing with the CFPB’s narrow interpretation of RESPA, have nevertheless decided to modify or terminate long-standing business arrangements to avoid the risk of protracted and costly litigation defending such arrangements. RESPA also has been invoked by plaintiffs in private litigation for various purposes. Moreover, a recent change in leadership at the CFPB, which is currently subject to legal challenge, has contributed further uncertainty with respect to RESPA interpretation and compliance. However, permissible activities under state statutes similar to RESPA may be interpreted more narrowly and enforcement proceedings of those statutes by state regulatory authorities may also be aggressively pursued.
Our title insurance business also is subject to regulation by insurance and other regulatory authorities in each state in which we provide title insurance. Additionally, our relocation business operates certain insurance programs that are subject to certain regulations. State regulations may impede or impose burdensome conditions on our ability to take actions that we may want to take to enhance our operating results.
We are also, to a lesser extent, subject to various other rules and regulations such as "controlled business" statutes, which impose limitations on affiliations between providers of title and settlement services, on the one hand, and real estate brokers, mortgage lenders and other real estate providers, on the other hand, or similar laws or regulations that would limit or restrict transactions among affiliates in a manner that would limit or restrict collaboration among our businesses.
In all of our business units there is a risk that we could be adversely affected by current laws, regulations or interpretations or that more restrictive laws, regulations or interpretations could increase responsibilities and duties to customers and franchisees and other parties, the adoption of which could make compliance more difficult or expensive. There is also a risk that a change in current laws could adversely affect our business. In addition, any adverse changes in regulatory interpretations, rules and laws that would place additional limitations or restrictions on affiliated transactions could have the effect of limiting or restricting collaboration among our business units. We cannot assure you that future changes in legislation, regulations or interpretations will not adversely affect our business operations.
For example, in 2008, the Justice Department and the FTC entered into a settlement agreement with NAR related, in part, to the cooperative sharing of entries in traditional multiple listing services with online-only brokers. The 2008 settlement agreement expires in November 2018 and in response to Congressional inquiries, the Justice Department and the FTC will co-host a workshop on competition dynamics in the real estate services industry. There can be no assurances as to whether the Justice Department and the FTC will determine that certain industry practices or developments have an anti-competitive effect on the industry. Any such determination by the Justice Department and the FTC could result in industry investigations, legislative or regulatory action or other actions, any of which could have the potential to disrupt our business.
Regulatory authorities also have relatively broad discretion to grant, renew and revoke licenses and approvals and to implement regulations. Accordingly, such regulatory authorities could prevent or temporarily suspend us from carrying on
35
some or all of our activities or otherwise penalize us if our financial condition or our practices were found not to comply with the then current regulatory or licensing requirements or any interpretation of such requirements by the regulatory authority. Our failure to comply with any of these requirements or interpretations could limit our ability to renew current franchisees or sign new franchisees or otherwise have a material adverse effect on our operations.
Our international business activities, and in particular our relocation business, must comply with applicable laws and regulations that impose sanctions on improper payments, including the Foreign Corrupt Practices Act, U.K. Bribery Act and similar laws of other countries.
Our failure to comply with any of the foregoing laws and regulations may subject us to fines, penalties, injunctions and/or potential criminal violations. Any changes to these laws or regulations or any new laws or regulations may make it more difficult for us to operate our business and may have a material adverse effect on our operations.
Other Business Risks
We could be subject to significant losses if banks do not honor our escrow and trust deposits.
Our company owned brokerage business and our title and settlement services business act as escrow agents for numerous customers. As an escrow agent, we receive money from customers to hold until certain conditions are satisfied. Upon the satisfaction of those conditions, we release the money to the appropriate party. We deposit this money with various banks and while these deposits are not assets of the Company (and therefore excluded from our consolidated balance sheet), we remain contingently liable for the disposition of these deposits. The banks may hold a significant amount of these deposits in excess of the federal deposit insurance limit. If any of our depository banks were to become unable to honor any portion of our deposits, customers could seek to hold us responsible for such amounts and, if the customers prevailed in their claims, we could be subject to significant losses. These escrow and trust deposits totaled $469 million at December 31, 2017.
Our reliance on third-party vendors for key components of our business could have a material adverse effect on our business and results of operations.
Many components of our business, including information technology, key operational processes (such as accounts payable, payroll, and travel and expense) and critical client systems, are provided by third parties. The actions of our third-party vendors are beyond our control. If our vendors fail to perform as we expect, or if we fail to adequately monitor their performance, our operations and reputation could suffer. Depending on the function involved, vendor failure or error may lead to increased costs, business disruption, processing inefficiencies, the loss of or damage to intellectual property or sensitive data through security breaches or otherwise, effects on financial reporting, loss of customers, litigation or remediation costs, or damage to our reputation. In addition, although we have instituted a Vendor Code of Conduct, we may be subject to the consequences of fraud, bribery, or misconduct by employees of our vendors, which can result in significant financial or reputational harm.
We may be unable to achieve or maintain cost savings and other benefits from our restructuring activities.
We continue to engage in business optimization initiatives that focus on maximizing the efficiency and effectiveness of the cost structure of each of the Company's business units. The action is designed to improve client service levels across each of the business units while enhancing the Company's profitability and incremental margins. We may not be able to achieve these improvements in the efficiency and effectiveness of our operations. We also may incur greater costs than currently anticipated to achieve these savings and we may not be able to maintain these cost savings and other benefits in the future.
We may not realize anticipated benefits from acquisitions.
Integrating acquired companies involves complex operational and personnel related challenges, including:
• | the possible defection of a significant number of employees and independent sales agents; |
• | the disruption of our respective ongoing businesses; |
• | possible inconsistencies in policies and procedures, as well as business and IT controls; |
• | the failure to maintain important business relationships and contracts; |
• | unanticipated costs of terminating or relocating facilities and operations; |
• | unanticipated expenses related to the integration; |
36
• | increased amortization of intangibles; and |
• | potential unknown liabilities associated with acquired businesses. |
A prolonged diversion of management's attention and any delays or difficulties encountered in connection with the integration of any business acquisition could prevent us from realizing the anticipated cost savings and revenue growth from our acquisitions.
We may not have the ability to complete future acquisitions.
At varying times, we have pursued an active acquisition strategy as a means of strengthening our geographic footprint, and expanding our scope of operations. We have also focused on integrating acquisitions into our operations to achieve economies of scale. The success of our future acquisition strategy will continue to depend upon our ability to fund such acquisitions given our total outstanding indebtedness, find suitable acquisition candidates on favorable terms and for target companies to find our acquisition proposals more favorable than those made by other competitors.
Potential reform of Freddie Mac and Fannie Mae or a reduction in U.S. government support for the housing market could have a material impact on our operations.
Numerous pieces of legislation seeking various types of changes for government sponsored entities or GSEs have been introduced in Congress to reform the U.S. housing finance market including, among other things, changes designed to reduce government support for housing finance and the winding down of Freddie Mac and Fannie Mae over a period of years. Legislation, if enacted, or additional regulation which curtails Freddie Mac and/or Fannie Mae's activities and/or results in the wind down of these entities could increase mortgage costs and could result in more stringent underwriting guidelines imposed by lenders or cause other disruptions in the mortgage industry, any of which could have a material adverse effect on the housing market in general and our operations in particular.
Changes in accounting standards, subjective assumptions and estimates used by management related to complex accounting matters could have an adverse effect on results of operations.
Generally accepted accounting principles in the United States and related accounting pronouncements, implementation guidance and interpretations with regard to a wide range of matters, such as revenue recognition, lease accounting, stock-based compensation, asset impairments, valuation reserves, income taxes and fair value accounting, are highly complex and involve many subjective assumptions, estimates and judgments made by management. Changes in these rules or their interpretations or changes in underlying assumptions, estimates or judgments made by management could significantly change our reported results.
Our international operations are subject to risks not generally experienced by our U.S. operations.
Our relocation services business operates worldwide, and to a lesser extent, our real estate franchise services segment has international franchisees and master franchisees. For the year ended December 31, 2017, revenues from these operations represented approximately 2% of our total revenues. Our international operations are subject to risks not generally experienced by our U.S. operations. The risks involved in our international operations and relationships that could result in losses against which we are not insured and therefore affect our profitability include:
• | fluctuations in foreign currency exchange rates; |
• | exposure to local economic conditions and local laws and regulations, including those relating to our employees; |
• | potential adverse changes in the political stability of foreign countries or in their diplomatic relations with the U.S.; |
• | restrictions on the withdrawal of foreign investment and earnings; |
• | government policies against businesses owned by foreigners; |
• | onerous employment laws; |
• | diminished ability to legally enforce our contractual rights and use of our trademarks in foreign countries; |
• | difficulties in registering, protecting or preserving trade names and trademarks in foreign countries; |
• | difficulties in complying with franchise disclosure and registration requirements in foreign countries; |
• | restrictions on the ability to obtain or retain licenses required for operations; |
• | withholding and other taxes on third party cross-border transactions as well as remittances and other payments by subsidiaries; |
37
• | onerous requirements, subject to broad interpretation, for indirect taxes and income taxes that can result in audits with potentially significant financial outcomes; |
• | changes in foreign taxation structures; |
• | compliance with the Foreign Corrupt Practices Act, the U.K. Bribery Act or similar laws of other countries; and |
• | regional and country specific data protection and privacy laws including, effective May 2018, the General Data Protection Regulation. |
In addition, activities of franchisees and master franchisees outside of the U.S. are more difficult and more expensive to monitor and improper activities may be more difficult to detect.
Loss or attrition among our senior executives or other key employees and our inability to develop our existing workforce and to recruit top talent could adversely affect our financial performance.
Our success is largely dependent on the efforts and abilities of our executive officers and other key employees, our ability to develop the skills and talent of our workforce and our ability to recruit, retain and motivate top talent. Talent management has been and continues to be a strategic priority and our ability to recruit and retain our executive officers and key employees, including those with significant experience in the residential real estate market, is generally subject to numerous factors, including the compensation and benefits we pay. If we are unable to internally develop or hire skilled executives and other critical positions or if we encounter challenges associated with change management, our ability to continue to execute or evolve our strategy may be impaired and our business may be adversely affected.
Severe weather events or natural disasters may disrupt our business and have an unfavorable impact on homesale activity.
The occurrence of a severe weather event or natural disaster can reduce home inventory levels and negatively impact the demand for homes in affected areas, which can delay the closing of homesale transactions and have an unfavorable impact on homesale transaction volume, relocation transactions, title closing units and broker-to-broker referral fees. In addition, we could incur damage, which may be significant, to our office locations as a result of severe weather events or natural disasters and our insurance may not be adequate to cover such losses. Certain areas in which our businesses operate, such as California and Florida, are particularly subject to severe weather events and natural disasters.
We may incur substantial and unexpected liabilities arising out of our pension plan.
We have a defined benefit pension plan for which participation was frozen as of July 1, 1997; however, the plan is subject to minimum funding requirements. Although the Company to date has met its minimum funding requirements, the pension plan represents a liability on our balance sheet and will continue to require cash contributions from us, which may increase beyond our expectations in future years based on changing market conditions. In addition, changes in interest rates, mortality rates, health care costs, early retirement rates, investment returns and the market value of plan assets can affect the funded status of our pension plan and cause volatility in the future funding requirements of the plan.
Our ability to use our net operating losses ("NOLs") and other tax attributes may be limited.
Our ability to utilize NOLs and other tax attributes could be limited by the "ownership change" we underwent within the meaning of Section 382 of the Internal Revenue Code of 1986, as amended (the "Code"), as a result of the sale of our common stock in our initial public offering and the related transactions. An ownership change is generally defined as a greater than 50 percentage point increase in equity ownership by 5% stockholders in any three-year period. Pursuant to rules under Section 382 of the Code and a published Internal Revenue Service (the "IRS") notice, a company's "net unrealized built-in gain" within the meaning of Section 382 of the Code may reduce the limitation on such company's ability to utilize NOLs resulting from an ownership change. Although there can be no assurance in this regard, we believe that the limitation on our ability to utilize our NOLs resulting from our ownership change should be significantly reduced as a result of our net unrealized built-in gain. Even assuming we are able to use our unrealized built-in gain, the cash tax benefit from our NOLs is dependent upon our ability to generate sufficient taxable income. Although we believe that we will be able to generate sufficient taxable income to fully utilize our NOLs, we may be unable to earn enough taxable income prior to the expiration of our NOLs.
We are responsible for certain of Cendant's contingent and other corporate liabilities.
Although we have resolved various Cendant contingent and other corporate liabilities and have established reserves for most of the remaining unresolved claims of which we have knowledge, adverse outcomes from the unresolved Cendant
38
liabilities for which Realogy Group has assumed partial liability under the Separation and Distribution Agreement could be material with respect to our earnings or cash flows in any given reporting period.
Risks Related to Our Indebtedness
Our significant indebtedness and interest obligations could prevent us from meeting our obligations under our debt instruments and could adversely affect our ability to fund our operations, react to changes in the economy or our industry, or incur additional borrowings under our existing facilities.
We are significantly encumbered by our debt obligations. As of December 31, 2017, our total debt, excluding our securitization obligations, was $3,348 million (without giving effect to outstanding letters of credit). Our liquidity position has been, and is expected to continue to be, negatively impacted by the substantial interest expense on our debt obligations.
Our leverage could have important consequences, including the following:
• | it causes a substantial portion of our cash flows from operations to be dedicated to the payment of interest and required amortization on our indebtedness and not be available for other purposes, including our operations, capital expenditures, technology, share repurchases, dividends and future business opportunities or principal repayment; |
• | it could cause us to be unable to comply with the senior secured leverage ratio covenant under our Senior Secured Credit Facility and Term Loan A Facility; |
• | it could cause us to be unable to meet our debt service requirements under our Senior Secured Credit Facility, the Term Loan A Facility or the indentures governing the Unsecured Notes or meet our other financial obligations; |
• | it may limit our ability to incur additional borrowings under our existing facilities or securitizations, to obtain additional debt or equity financing for working capital, capital expenditures, business development, debt service requirements, acquisitions or general corporate or other purposes, or to refinance our indebtedness; |
• | it exposes us to the risk of increased interest rates because a portion of our borrowings, including borrowings under our Senior Secured Credit Facility and Term Loan A Facility, are at variable rates of interest; |
• | it may limit our ability to adjust to changing market conditions and place us at a competitive disadvantage compared to our competitors that have less debt; |
• | it may cause a downgrade of our debt and long-term corporate ratings; |
• | it may limit our ability to repurchase shares; |
• | it may limit our ability to attract acquisition candidates or to complete future acquisitions; |
• | it may cause us to be more vulnerable to periods of negative or slow growth in the general economy or in our business, or may cause us to be unable to carry out capital spending that is important to our growth; and |
• | it may limit our ability to attract and retain key personnel. |
An event of default under our Senior Secured Credit Facility, the Term Loan A Facility or the indentures governing our other material indebtedness would adversely affect our operations and our ability to satisfy obligations under our indebtedness.
The Senior Secured Credit Facility and Term Loan A Facility contain restrictive covenants, including a requirement that we maintain a specified senior secured leverage ratio, which is defined as the ratio of our total senior secured debt (net of unrestricted cash and permitted investments) to trailing four quarter EBITDA calculated on a Pro Forma Basis, as those terms are defined in the credit agreement governing the Senior Secured Credit Facility. If we are unable to comply with the senior secured leverage ratio covenant or other restrictive covenants and we fail to remedy or avoid a default as permitted under the Senior Secured Credit Facility and Term Loan A Facility, there would be an "event of default" under the Senior Secured Credit Facility and Term Loan A Facility.
Other events of default include, without limitation, nonpayment of principal or interest, material misrepresentations, insolvency, bankruptcy, certain material judgments, change of control, and cross-events of default on material indebtedness as well as failure to obtain an unqualified audit opinion by 90 days after the end of any fiscal year. Upon the occurrence of any event of default under the Senior Secured Credit Facility and Term Loan A Facility, the lenders:
• | will not be required to lend any additional amounts to us; |
• | could elect to declare all borrowings outstanding, together with accrued and unpaid interest and fees, to be immediately due and payable; |
39
• | could require us to apply all of our available cash to repay these borrowings; or |
• | could prevent us from making payments on the Unsecured Notes, any of which could result in an event of default under the indentures governing the Unsecured Notes or our Apple Ridge Funding LLC securitization program. |
If we were unable to repay the amounts outstanding under our Senior Secured Credit Facility and Term Loan A Facility, the lenders and holders of such debt under our Senior Secured Credit Facility and Term Loan A Facility could proceed against the collateral granted to secure the Senior Secured Credit Facility and Term Loan A Facility. We have pledged a significant portion of our assets as collateral to secure such indebtedness. If the lenders under our Senior Secured Credit Facility or Term Loan A Facility accelerate the repayment of borrowings, we may not have sufficient assets to repay the Senior Secured Credit Facility and Term Loan A Facility and our other indebtedness or be able to borrow sufficient funds to refinance such indebtedness. In the future, we may need to seek new financing or explore the possibility of amending the terms of our Senior Secured Credit Facility and Term Loan A Facility, and we may not be able to do so on commercially reasonable terms or terms that are acceptable to us, if at all.
In addition, if an event of default is continuing under our Senior Secured Credit Facility, Term Loan A Facility, the indentures governing the Unsecured Notes or our other material indebtedness, such event could cause a termination of our ability to obtain future advances under, and amortization of, our Apple Ridge Funding LLC securitization program.
Variable rate indebtedness subjects us to interest rate risk, which could cause our debt service obligations to increase significantly.
At December 31, 2017, $1,886 million of our borrowings under our Senior Secured Credit Facility and Term Loan A Facility was at variable rates of interest thereby exposing us to interest rate risk. If interest rates increase from their current historically low rates, our debt service obligations on the variable rate indebtedness would increase even if the amount borrowed remained the same, and our net income would decrease. Although we have entered into interest rate swaps involving the exchange of floating for fixed rate interest payments to reduce interest rate volatility for a significant portion of our variable rate borrowings, such interest rate swaps do not eliminate interest rate volatility for all of our variable rate indebtedness at December 31, 2017.
Restrictive covenants under our Senior Secured Credit Facility, Term Loan A Facility, Unsecured Letter of Credit Facility and indentures may limit the manner in which we operate.
Our Senior Secured Credit Facility, Term Loan A Facility, Unsecured Letter of Credit Facility and the indentures governing the Unsecured Notes contain, and any future indebtedness we may incur may contain, various negative covenants that restrict our ability to, among other things:
• | incur or guarantee additional indebtedness, or issue disqualified stock or preferred stock; |
▪ | pay dividends or make distributions to our stockholders; |
▪ | repurchase or redeem capital stock; |
▪ | make investments or acquisitions; |
▪ | incur restrictions on the ability of certain of our subsidiaries to pay dividends or to make other payments to us; |
▪ | enter into transactions with affiliates; |
▪ | create liens; |
▪ | merge or consolidate with other companies or transfer all or substantially all of our assets; |
▪ | transfer or sell assets, including capital stock of subsidiaries; and |
▪ | prepay, redeem or repurchase certain indebtedness. |
As a result of these covenants, we are limited in the manner in which we conduct our business and we may be unable to engage in favorable business activities, repurchase shares of our common stock or finance future operations or capital needs.
We may be unable to continue to securitize certain of our relocation assets, which may adversely impact our liquidity.
At December 31, 2017, $194 million of securitization obligations were outstanding through special purpose entities monetizing certain assets of our relocation services business under two lending facilities. We have provided a performance guaranty which guarantees the obligations of our Cartus subsidiary and its subsidiaries, as originator and servicer under the Apple Ridge securitization program. The securitization markets have experienced, and may again experience, significant disruptions which may have the effect of increasing our cost of funding or reducing our access to these markets in the future.
40
In addition, the Apple Ridge securitization facility contains terms which if triggered may result in a termination or limitation of new or existing funding under the facility and/or may result in a requirement that all collections on the assets be used to pay down the amounts outstanding under such facility. The triggering events include but are not limited to: (1) those tied to the age and quality of the underlying assets; (2) a change of control; (3) a breach of our senior secured leverage ratio covenant under our Senior Secured Credit Facility if uncured; and (4) the acceleration of indebtedness under our Senior Secured Credit Facility, unsecured notes or other material indebtedness. The occurrence of a trigger event under the Apple Ridge securitization facility could restrict our ability to access new or existing funding under this facility or result in termination of the facility. If securitization financing is not available to us for any reason, we could be required to borrow under the Revolving Credit Facility, which would adversely impact our liquidity, or we may be required to find additional sources of funding which may be on less favorable terms or may not be available at all.
Risks Related to an Investment in Our Common Stock
The price of our common stock may fluctuate significantly.
The market price for our common stock could fluctuate significantly for various reasons, many of which are outside our control, including those described above and the following:
• | our operating and financial performance and prospects; |
• | future sales of substantial amounts of our common stock in the public market, including but not limited to shares we may issue from time to time as consideration for future acquisitions or investments; |
• | housing and mortgage finance markets; |
• | the incurrence of additional indebtedness or other adverse changes relating to our debt; |
• | our quarterly or annual earnings or those of other companies in our industry; |
• | future announcements concerning our business or our competitors' businesses; |
• | the public's reaction to our press releases, other public announcements and filings with the SEC; |
• | changes in earnings estimates or recommendations by sell-side securities analysts who track our common stock or ratings changes or commentary by rating agencies on our debt; |
• | changes in, or the elimination of, our stock repurchase program or cash dividend; |
• | the timing and amount of share repurchases, if any; |
• | market and industry perception of our success, or lack thereof, in pursuing our growth strategy; |
• | strategic actions by us or our competitors, such as acquisitions or restructurings; |
• | actual or potential changes in laws, regulations and regulatory interpretations, including as a result of the 2017 Tax Act; |
• | changes in interest rates; |
• | changes in demographics relating to housing such as household formation; |
• | changing consumer attitudes concerning home ownership; |
• | changes in accounting standards, policies, guidance, interpretations or principles; |
• | arrival and departure of key personnel; |
• | adverse resolution of new or pending litigation, arbitration or regulatory proceedings against us; and |
• | changes in general market, economic and political conditions in the United States and global economies or financial markets, including those resulting from natural disasters, terrorist attacks, acts of war and responses to such events. |
These broad market and industry factors may materially reduce the market price of our common stock, regardless of our operating performance. In addition, price volatility may be greater if the public float and trading volume of our common stock is low.
If any of the foregoing occurs, it could cause our stock price to fall and may expose us to litigation, including class action lawsuits that, even if unsuccessful, could be costly to defend and a distraction to management.
41
We cannot provide assurance that we will continue to pay dividends or purchase shares of our common stock under our stock repurchase program or that our capital allocation strategy will enhance stockholder value.
There can be no assurance that we will have sufficient cash or surplus under Delaware law to be able to continue to pay dividends or purchase shares of our common stock under our stock repurchase program. Certain of our debt instruments contain covenants that restrict the ability of our subsidiaries to pay dividends to us and repurchase shares of our common stock. We are permitted under the terms of our debt instruments to incur additional indebtedness, which may restrict or prevent us from paying dividends on our common stock. Agreements governing any future indebtedness, in addition to those governing our current indebtedness, may not permit us to pay dividends on our common stock or repurchase shares of our common stock. Because Realogy Holdings is a holding company and has no direct operations, we will only be able to pay dividends or repurchase shares of our common stock from our available cash on hand and any funds we receive from our subsidiaries. Our title insurance underwriter is subject to regulations that limit its ability to pay dividends or make loans or advances to us, principally to protect policyholders. Under Delaware law, dividends may be payable only out of surplus, which is our assets minus our liabilities and our capital or, if we have no surplus, out of our net profits for the fiscal year in which the dividend is declared and/or the preceding fiscal year. As a result, we may not pay dividends according to our policy or at all if, among other things, we do not have sufficient cash to pay the intended dividends, our financial performance does not achieve expected results or the terms of our indebtedness prohibit it.
Our Board may also decrease or suspend the payment of dividends or our stock repurchase program if the Board deems such action to be in our best interests or those of our stockholders. A reduction or elimination of our cash dividend or stock repurchase program could adversely affect the market price of our common stock. If we do not pay dividends, the price of our common stock must appreciate in order to realize a gain on an investment in Realogy. This appreciation may not occur and our stock may in fact depreciate in value.
In addition, our stock repurchase program and any future dividends will utilize a portion of our cash, which may impact our ability to finance future growth and to pursue possible future strategic opportunities and acquisitions. Moreover, stock repurchases may not enhance stockholder value because the market price of our common stock may decline below the levels at which we repurchased shares of stock. There can be no assurance that our capital allocation strategy, including our cash dividend and stock repurchase program, will enhance short or long-term stockholder value.
Delaware law and our organizational documents may impede or discourage a takeover, which could deprive our investors of the opportunity to receive a premium for their shares.
We are a Delaware corporation, and the anti-takeover provisions of Delaware law impose various impediments to the ability of a third party to acquire control of us, even if a change of control would be beneficial to our existing stockholders. In addition, provisions of our amended and restated certificate of incorporation and amended and restated bylaws may make it more difficult for, or prevent a third party from, acquiring control of us without the approval of our Board of Directors. Among other things, these provisions:
• | do not permit cumulative voting in the election of directors, which would otherwise allow less than a majority of stockholders to elect director candidates; |
• | delegate the sole power to a majority of the Board of Directors to fix the number of directors; |
• | provide the power to our Board of Directors to fill any vacancy on our Board of Directors, whether such vacancy occurs as a result of an increase in the number of directors or otherwise; |
• | authorize the issuance of "blank check" preferred stock without any need for action by stockholders; |
• | eliminate the ability of stockholders to call special meetings of stockholders; |
• | prohibit stockholders from acting by written consent; and |
• | establish advance notice requirements for nominations for election to our Board of Directors or for proposing matters that can be acted on by stockholders at stockholder meetings. |
The foregoing factors could impede a merger, takeover or other business combination or discourage a potential investor from making a tender offer for our common stock which, under certain circumstances, could reduce the market value of our common stock and our investors' ability to realize any potential change-in-control premium.
42
We may issue shares of preferred stock in the future, which could make it difficult for another company to acquire us or could otherwise adversely affect holders of our common stock, which could depress the price of our common stock.
Our amended and restated certificate of incorporation authorizes us to issue one or more series of preferred stock. Our Board of Directors will have the authority to determine the preferences, limitations and relative rights of shares of preferred stock and to fix the number of shares constituting any series and the designation of such series, without any further vote or action by our stockholders. Our preferred stock could be issued with voting, liquidation, dividend and other rights superior to the rights of our common stock. The potential issuance of preferred stock may delay or prevent a change in control of us, discouraging bids for our common stock at a premium to the market price, and materially and adversely affect the market price and the voting and other rights of the holders of our common stock.
Our business could be negatively impacted as a result of actions by activist stockholders or others.
Stockholder activism at public companies has been rising and we may be subject to actions or requests—either formal or informal—from activist stockholders or others. Responding to such actions could be costly and time-consuming, may not align with our business strategies and could divert the attention of our Board of Directors and senior management from the pursuit of our business strategies. Perceived uncertainties as to our future direction as a result of stockholder activism may lead to the perception of a change in the direction of the business or other instability and may make it more difficult to attract and retain qualified personnel, independent sales agents and business partners and may affect our relationships with vendors, customers and other third parties. In addition, actions of activist stockholders may cause significant fluctuations of our stock price based on temporary or speculative market perceptions or other factors that do not necessarily reflect the underlying fundamentals and prospects of our business.
Item 2. Properties.
Corporate headquarters. Our corporate headquarters is located at 175 Park Avenue in Madison, New Jersey with a lease term expiring in December 2029 and consists of approximately 270,000 square feet of space.
Real estate franchise services. Our real estate franchise business conducts its main operations at our leased office at 175 Park Avenue in Madison, New Jersey.
Company owned real estate brokerage services. As of December 31, 2017, our company owned real estate brokerage segment leased approximately 4.9 million square feet of domestic office space under approximately 1,021 leases. Its corporate headquarters and one regional headquarters facility are located in leased offices at 175 Park Avenue, Madison, New Jersey. As of December 31, 2017, NRT leased 7 facilities serving as regional headquarters, 33 facilities serving as local administration, training facilities or storage, and approximately 790 brokerage sales offices under 981 leases. These offices are generally located in shopping centers and small office parks, typically with lease terms of one to five years. Included in the 4.9 million square feet is approximately 124,000 square feet of vacant and/or subleased space, principally relating to brokerage sales office consolidations.
Relocation services. Our relocation business has its main corporate operations in a leased building in Danbury, Connecticut with a lease term expiring in November 2030. There are leased offices in the U.S., located in Lisle, Illinois; Irving, Texas; Omaha, Nebraska; Folsom and San Diego, California; Herndon, Virginia; Pensacola, Florida; and Bellevue, Washington. International offices include leased facilities in the United Kingdom, Hong Kong, Singapore, China, Brazil, Germany, France, Switzerland, Canada and the Netherlands.
Title and settlement services. Our title and settlement services business conducts its main operations at a leased facility in Mount Laurel, New Jersey, pursuant to a lease expiring in December 2021. As of December 31, 2017, this business also has leased regional and branch offices in 25 states and Washington, D.C.
We believe that all of our properties and facilities are well maintained.
Item 3. Legal Proceedings.
See Note 13, "Commitments and Contingencies—Litigation", to our consolidated financial statements included elsewhere in this Annual Report for additional information on the Company's legal proceedings, including a description of the Dodge, et al. v. PHH Corporation, et al. litigation, formerly captioned Strader, et al. and Hall v. PHH Corporation, et al. and which we refer to as the Strader legal matter.
The Company believes that it has adequately accrued for legal matters as appropriate. The Company records litigation accruals for legal matters which are both probable and estimable.
Litigation and other disputes are inherently unpredictable and subject to substantial uncertainties and unfavorable resolutions could occur. In addition, class action lawsuits or regulatory proceedings challenging practices that have broad impact can be costly to defend and, depending on the class size and claims, could be costly to settle. As such, the Company could incur judgments or enter into settlements of claims with liability that are materially in excess of amounts accrued and these settlements could have a material adverse effect on the Company’s financial condition, results of operations or cash flows in any particular period.
43
Litigation and claims against other participants in the residential real estate industry may impact the Company when the rulings in those cases cover practices common to the broader industry. Examples may include claims associated with RESPA compliance, broker fiduciary duties, and sales agent classification. One such case is PHH Corp. vs. Consumer Financial Protection Bureau, No. 15-1177. On January 31, 2018, the full D.C. Circuit Court of Appeals issued a decision in that litigation affirming the following RESPA statutory issues:
• | Section 8(c)(2) of RESPA (which permits “bona fide” payments for goods and services actually performed), is a viable exception under RESPA and does not constitute a payment for a referral in violation of RESPA where the amount paid does not exceed the reasonable market value of the goods or services; |
• | new CFPB interpretations of RESPA cannot be enforced on a retroactive basis where there is reliance on prior regulatory interpretations; and |
• | the CFPB is bound by the three-year statute of limitations for government enforcement of RESPA. |
The Company also may be impacted by litigation and other claims against companies in other industries. Rulings on matters such as the enforcement of arbitration and class waiver agreements and worker classification may adversely affect the Company and other residential real estate industry participants as a result of the classification of sales agents as independent contractors, irrespective of the fact that the parties subject to the rulings are in a different industry. To the extent the defendants are unsuccessful in these types of litigation matters, and we or our franchisees cannot distinguish our or their practices (or our industry’s practices), we and our franchisees could face significant liability and could be required to modify certain business relationships, either of which could materially and adversely impact our financial condition and results of operations. There also are changing employment-related regulatory interpretations at both the federal and state levels that could create risks around historic practices and that could require changes in business practices, both for us and our franchisees.
Item 4. Mine Safety Disclosures.
None.
44
PART II
Item 5. | Market for Registrant’s Common Equity, Related Stockholder Matters and Issuer Purchases of Equity Securities. |
Market Price of Common Stock
Our common stock is listed on the New York Stock Exchange ("NYSE") under the symbol "RLGY". As of February 23, 2018, the number of stockholders of record was 22. The following table sets forth the quarterly high and low sales prices per share of RLGY common stock as reported by the NYSE, for the years ended December 31, 2016 and 2017:
2016 | 2017 | ||||||||||||||
High | Low | High | Low | ||||||||||||
First Quarter | $ | 36.46 | $ | 27.98 | $ | 30.29 | $ | 25.14 | |||||||
Second Quarter | $ | 37.33 | $ | 27.43 | $ | 32.62 | $ | 27.79 | |||||||
Third Quarter | $ | 31.48 | $ | 25.39 | $ | 35.18 | $ | 31.82 | |||||||
Fourth Quarter | $ | 27.30 | $ | 21.43 | $ | 34.50 | $ | 25.46 | |||||||
Dividend Policy
In August 2016, the Company’s Board of Directors approved the initiation of a quarterly cash dividend policy of $0.09 per share on its common stock. The Board declared and paid a quarterly cash dividend of $0.09 per share of the Company's common stock during each quarter of 2017, returning a total of $49 million to stockholders in cash dividends.
Pursuant to the Company’s policy, the dividends payable in cash are treated as a reduction of additional paid-in capital since the Company is currently in a retained deficit position.
The declaration and payment of any future dividend will be subject to the discretion of the Board of Directors and will depend on a variety of factors, including the Company’s financial condition and results of operations, contractual restrictions, including restrictive covenants contained in the Company’s credit agreements, and the indentures governing the Company’s outstanding debt securities, capital requirements and other factors that the Board of Directors deems relevant. Because Realogy Holdings is a holding company and has no direct operations, we will only be able to pay dividends from our available cash on hand and any funds we receive from our subsidiaries. Our title insurance underwriter is subject to regulations that limit its ability to pay dividends or make loans or advances to us, principally to protect policyholders. Under Delaware law, dividends may be payable only out of surplus, which is our net assets minus our liabilities and our capital or, if we have no surplus, out of our net profits for the fiscal year in which the dividend is declared and/or the preceding fiscal year. As a result, we may not pay dividends according to our policy or at all if, among other things, we do not have sufficient cash to pay the intended dividends, if our financial performance does not achieve expected results or the terms of our indebtedness prohibit it.
Share Repurchase Program
The Company may repurchase shares of its common stock pursuant to authorizations made from its Board of Directors. Shares repurchased are retired and not displayed separately as treasury stock on the consolidated financial statements. The par value of the shares repurchased and retired is deducted from common stock and the excess of the purchase price over par value is first charged against any available additional paid-in-capital with the balance charged to retained earnings. Direct costs incurred to repurchase the shares are included in the total cost of the shares.
In February 2016, the Company's Board of Directors authorized a share repurchase program of up to $275 million of the Company’s common stock, which has been fully utilized. In February 2017, the Company's Board of Directors authorized a share repurchase program of up to an additional $300 million of the Company's common stock. On February 26, 2018, the Board authorized a new share repurchase program of up to $350 million of the Company's common stock, which is in addition to the remaining authorization available under the February 2017 share repurchase program. Repurchases under each program may be made at management's discretion from time to time on the open market, pursuant to Rule 10b5-1 trading plans or through privately negotiated transactions. The size and timing of these repurchases will depend on price, market and economic conditions, legal and contractual requirements and other factors, and each share repurchase program has no time limit and may be suspended or discontinued at any time. All of the repurchased common stock has been retired. The following table sets forth information relating to repurchase of shares of our common stock
45
during the quarter ended December 31, 2017:
Period | Total Number of Shares Purchased | Average Price Paid per Share | Total Number of Shares Purchased as Part of Publicly Announced Programs | Approximate Dollar Value of Shares that May Yet Be Purchased Under the Programs | ||||||||
October 1-31, 2017 | 498,100 | $33.11 | 498,100 | $ | 181,407,680 | |||||||
November 1-30, 2017 | 2,141,680 | $26.61 | 2,141,680 | $ | 124,417,575 | |||||||
December 1-31, 2017 | 881,098 | $27.17 | 881,098 | $ | 100,478,142 | |||||||
During the period January 1, 2018 through February 23, 2018, we repurchased an additional 1.5 million shares at a weighted average market price of $26.82. Giving effect to these repurchases, we had approximately $60 million of remaining capacity authorized under the February 2017 share repurchase program as of February 23, 2018.
Stock Performance Graph
The stock performance graph set forth below is not deemed filed with the Securities and Exchange Commission and shall not be deemed incorporated by reference into any of our prior or future filings made with the Securities and Exchange Commission.
The following graph compares Realogy's cumulative total shareholder return with the cumulative total return of the S&P 500 index and the S&P Home Builders Select Industry Index or XHB Index. We have included the XHB Index because it provides a diversified group of holdings representing home building, building products, home furnishings and home appliances, which we believe correlate with the housing industry as a whole. A portion of our 2015, 2016 and 2017 long-term incentive compensation awards are also tied to the relative performance of our total stockholder return to that index over the three-year period ending December 31, 2017, December 31, 2018 and December 31, 2019, respectively. The cumulative total shareholder return for the index as well as the XHB Index includes the reinvestment of dividends. The graph assumes that the value of the investment in the Company's common shares, the index and the peer group was $100 on December 31, 2012 and updates the value through December 31, 2017.
Cumulative Total Return | |||||||||||||||||||||||
December 31, 2012 | December 31, 2013 | December 31, 2014 | December 31, 2015 | December 31, 2016 | December 31, 2017 | ||||||||||||||||||
Realogy Holdings Corp. | $ | 100.00 | $ | 117.9 | $ | 106.03 | $ | 87.39 | $ | 61.75 | $ | 64.38 | |||||||||||
SPDR S&P Homebuilders ETF (XHB) index | $ | 100.00 | $ | 109.4 | $ | 121.90 | $ | 132.32 | $ | 120.69 | $ | 209.21 | |||||||||||
S&P 500 | $ | 100.00 | $ | 132.39 | $ | 150.51 | $ | 152.59 | $ | 170.84 | $ | 208.14 | |||||||||||
46
Item 6. Selected Financial Data.
The following table presents our selected historical consolidated financial data and operating statistics. The consolidated statement of operations data for the years ended December 31, 2017, 2016, and 2015 and the consolidated balance sheet data as of December 31, 2017 and 2016 have been derived from our audited consolidated financial statements included elsewhere herein. The statement of operations data for the year ended December 31, 2014 and 2013 and the consolidated balance sheet data as of December 31, 2015, 2014 and 2013 have been derived from our consolidated financial statements not included elsewhere herein.
Neither Realogy Holdings, the indirect parent of Realogy Group, nor Realogy Intermediate, the direct parent company of Realogy Group, conducts any operations other than with respect to its respective direct or indirect ownership of Realogy Group. As a result, the consolidated financial positions and results of operations of Realogy Holdings, Realogy Intermediate and Realogy Group are the same.
The selected historical consolidated financial data and operating statistics presented below should be read in conjunction with our annual consolidated financial statements and accompanying notes and "Management’s Discussion and Analysis of Financial Condition and Results of Operations" included elsewhere herein. Our annual consolidated financial information may not be indicative of our future performance.
As of or for the Year Ended December 31, | |||||||||||||||||||
2017 | 2016 | 2015 | 2014 | 2013 | |||||||||||||||
(In millions, except per share data and operating statistics) | |||||||||||||||||||
Statement of Operations Data: | |||||||||||||||||||
Net revenue | $ | 6,114 | $ | 5,810 | $ | 5,706 | $ | 5,328 | $ | 5,289 | |||||||||
Total expenses | 5,763 | 5,461 | 5,424 | 5,103 | 5,114 | ||||||||||||||
Income before income taxes, equity in earnings and noncontrolling interests | 351 | 349 | 282 | 225 | 175 | ||||||||||||||
Income tax (benefit) expense (a) | (65 | ) | 144 | 110 | 87 | (242 | ) | ||||||||||||
Equity in earnings of unconsolidated entities | (18 | ) | (12 | ) | (16 | ) | (9 | ) | (26 | ) | |||||||||
Net income | 434 | 217 | 188 | 147 | 443 | ||||||||||||||
Less: Net income attributable to noncontrolling interests | (3 | ) | (4 | ) | (4 | ) | (4 | ) | (5 | ) | |||||||||
Net income attributable to Realogy Holdings and Realogy Group | $ | 431 | $ | 213 | $ | 184 | $ | 143 | $ | 438 | |||||||||
Earnings per share attributable to Realogy Holdings: | |||||||||||||||||||
Basic earnings per share | $ | 3.15 | $ | 1.47 | $ | 1.26 | $ | 0.98 | $ | 3.01 | |||||||||
Diluted earnings per share | $ | 3.11 | $ | 1.46 | $ | 1.24 | $ | 0.97 | $ | 2.99 | |||||||||
Weighted average common and common equivalent shares used in: | |||||||||||||||||||
Basic | 136.7 | 144.5 | 146.5 | 146.0 | 145.4 | ||||||||||||||
Diluted | 138.4 | 145.8 | 148.1 | 147.2 | 146.6 | ||||||||||||||
Cash dividends declared per share (beginning in August 2016) | $ | 0.36 | $ | 0.18 | $ | — | $ | — | $ | — | |||||||||
Balance Sheet Data: | |||||||||||||||||||
Cash and cash equivalents | $ | 227 | $ | 274 | $ | 415 | $ | 313 | $ | 236 | |||||||||
Securitization assets (b) | 218 | 238 | 281 | 286 | 268 | ||||||||||||||
Total assets | 7,337 | 7,421 | 7,531 | 7,304 | 7,092 | ||||||||||||||
Securitization obligations | 194 | 205 | 247 | 269 | 252 | ||||||||||||||
Long-term debt, including short-term portion | 3,348 | 3,507 | 3,702 | 3,855 | 3,857 | ||||||||||||||
Equity | 2,622 | 2,469 | 2,422 | 2,183 | 2,013 | ||||||||||||||
Statement of Cash Flows Data (c): | |||||||||||||||||||
Net cash provided by operating activities | $ | 667 | $ | 586 | $ | 588 | $ | 452 | $ | 569 | |||||||||
Net cash used in investing activities | (146 | ) | (191 | ) | (211 | ) | (302 | ) | (97 | ) | |||||||||
Net cash used in financing activities | (570 | ) | (534 | ) | (275 | ) | (75 | ) | (607 | ) | |||||||||
47
For the Year Ended December 31, | |||||||||||||||||||
2017 | 2016 | 2015 | 2014 | 2013 | |||||||||||||||
Operating Statistics: | |||||||||||||||||||
Real Estate Franchise Services (d) (e) | |||||||||||||||||||
Closed homesale sides (f) | 1,144,217 | 1,135,344 | 1,101,333 | 1,065,339 | 1,083,424 | ||||||||||||||
Average homesale price (g) | $ | 288,929 | $ | 272,206 | $ | 263,894 | $ | 250,214 | $ | 233,011 | |||||||||
Average homesale brokerage commission rate (h) | 2.50 | % | 2.50 | % | 2.51 | % | 2.52 | % | 2.54 | % | |||||||||
Net effective royalty rate (i) | 4.42 | % | 4.46 | % | 4.48 | % | 4.49 | % | 4.49 | % | |||||||||
Net royalty per side (j) | $ | 313 | $ | 299 | $ | 294 | $ | 282 | $ | 265 | |||||||||
Company Owned Real Estate Brokerage Services (e) (k) | |||||||||||||||||||
Closed homesale sides (f) | 344,446 | 335,699 | 336,744 | 308,332 | 316,640 | ||||||||||||||
Average homesale price (g) | $ | 514,685 | $ | 489,504 | $ | 489,673 | $ | 500,589 | $ | 471,144 | |||||||||
Average homesale brokerage commission rate (h) | 2.44 | % | 2.46 | % | 2.46 | % | 2.47 | % | 2.50 | % | |||||||||
Gross commission income per side (l) | $ | 13,309 | $ | 12,752 | $ | 12,730 | $ | 13,072 | $ | 12,459 | |||||||||
Relocation Services | |||||||||||||||||||
Initiations (m) | 161,755 | 163,063 | 167,749 | 171,210 | 165,705 | ||||||||||||||
Referrals (n) | 83,678 | 87,277 | 99,531 | 96,755 | 91,373 | ||||||||||||||
Title and Settlement Services | |||||||||||||||||||
Purchasing title and closing units (o) | 159,113 | 152,997 | 130,541 | 113,074 | 115,572 | ||||||||||||||
Refinance title and closing units (p) | 28,564 | 50,919 | 38,544 | 27,529 | 76,196 | ||||||||||||||
Average fee per closing unit (q) | $ | 2,092 | $ | 1,875 | $ | 1,861 | $ | 1,780 | $ | 1,504 | |||||||||
_______________
(a) | For the year ended December 31, 2017, the Company recorded an income tax benefit of $65 million which related to a $184 million income tax rate change on the Company's net deferred tax liability as a result of the 2017 Tax Act resulting in a smaller net liability and a $32 million change in the reserve for uncertain tax positions, partially offset by income taxes for 2017 income. For the years ended December 31, 2016, 2015 and 2014, the Company recorded a change in reserve for uncertain tax positions of a benefit of $2 million, a benefit of $1 million and an expense of $1 million, respectively. For the year ended December 31, 2013, the Company recorded an income tax benefit of $242 million which was primarily due to a $341 million release of the domestic deferred tax valuation allowance and a $2 million change in the reserve for uncertain tax positions, partially offset by income taxes for 2013 income. |
(b) | Represents the portion of relocation receivables and advances and other related assets that collateralize our securitization obligations. Refer to Note 8, "Short and Long-Term Debt" in the consolidated financial statements for further information. |
(c) | Statement of Cash Flows Data for 2016 and prior periods are restated to reflect the retrospective adoption of Accounting Standards Updates "Statement of Cash Flows (Topic 230): Classification of Certain Cash Receipts and Cash Payments" and "Restricted Cash" issued by the Financial Accounting Standards Board. See Note 2, "Summary of Significant Accounting Policies" in the consolidated financial statements for additional information. |
(d) | These amounts include only those relating to third-party franchisees and do not include amounts relating to the Company Owned Real Estate Brokerage Services segment. |
(e) | In April 2015, the Company Owned Real Estate Brokerage Services segment acquired Coldwell Banker United, a large franchisee of the Real Estate Franchise Services segment. As a result of the acquisition, the drivers of the acquired entity shifted from the Real Estate Franchise Services segment to the Company Owned Real Estate Brokerage Services segment. Closed homesale sides for the Company Owned Real Estate Brokerage segment included 16,746 sides related to the acquisition of Coldwell Banker United in 2015. |
(f) | A closed homesale side represents either the "buy" side or the "sell" side of a homesale transaction. |
(g) | Represents the average selling price of closed homesale transactions. |
(h) | Represents the average commission rate earned on either the "buy" side or "sell" side of a homesale transaction. |
(i) | Represents the average percentage of our franchisees’ commission income (excluding NRT) paid to the Real Estate Franchise Services segment as a royalty, net of volume incentives achieved. The net effective royalty rate does not include the effect of non-standard incentives granted to certain franchisees. Royalty fees are charged to all franchisees pursuant to the terms of the relevant franchise agreements and are included in each of the real estate brands' franchise disclosure documents. Non-standard incentives may be used as consideration to attract, retain and help grow certain franchisees. Most of our franchisees do not receive these non-standard incentives and in contrast to volume incentives, they are not homesale transaction based. We have accordingly excluded |
48
the non-standard incentives from the calculation of the net effective royalty rate. Had these non-standard incentives been included, the net effective royalty rate would be lower by approximately 24, 23, 21, 18 and 16 basis points for the years ended December 31, 2017, 2016, 2015, 2014 and 2013, respectively. We intend to discontinue the use of net effective royalty rate as an operating statistic in future periods and will report "Net royalty per side" in its place; see footnote (j).
(j) | Represents domestic royalties earned from our franchisees net of volume incentives achieved and non-standard incentives divided by the total number of our franchisees’ closed homesale sides. The Company believes that net royalty per side, which represents the royalty revenue impact of each incremental side, is a better measure of the profitability of its real estate franchise services segment than net effective royalty rate as it provides visibility into the incremental impact of changes in average homesale price as well as the impact of standard volume or non-standard incentives granted to certain franchisees. |
(k) | Our real estate brokerage business has a significant concentration of offices and transactions in geographic regions where home prices are at the higher end of the U.S. real estate market, particularly the east and west coasts. The real estate franchise business has franchised offices that are more widely dispersed across the United States than our real estate brokerage operations. Accordingly, operating results and homesale statistics may differ between our brokerage and franchise businesses based upon geographic presence and the corresponding homesale activity in each geographic region. |
(l) | Represents gross commission income divided by closed homesale sides. Gross commission income includes commissions earned in homesale transactions and certain other activities, primarily leasing and property management transactions. |
(m) | Represents the total number of transferees and affinity members served by the relocation services business. |
(n) | Represents the number of referrals from which we earned revenue from real estate brokers. |
(o) | Represents the number of title and closing units processed as a result of home purchases. The amounts presented include 8,351, 18,930 and 13,304 purchase units as a result of acquisitions for 2017, 2016 and 2015, respectively. |
(p) | Represents the number of title and closing units processed as a result of homeowners refinancing their home loans. The amounts presented include 1,858, 4,469 and 3,403 refinance units as a result of acquisitions for 2017, 2016 and 2015, respectively. |
(q) | Represents the average fee we earn on purchase title and refinancing title units. |
In presenting the financial data above in conformity with general accepted accounting principles, we are required to make estimates and assumptions that affect the amounts reported. See "Item 7.—Management’s Discussion and Analysis of Financial Condition and Results of Operations—Critical Accounting Policies" for a detailed discussion of the accounting policies that we believe require subjective and complex judgments that could potentially affect reported results.
Item 7. Management’s Discussion and Analysis of Financial Condition and Results of Operations.
The following discussion and analysis should be read in conjunction with our consolidated financial statements and accompanying notes thereto included elsewhere herein. Unless otherwise noted, all dollar amounts in tables are in millions. This Management’s Discussion and Analysis of Financial Condition and Results of Operations contain forward-looking statements. See "Forward-Looking Statements" and "Item 1A.—Risk Factors" for a discussion of the uncertainties, risks and assumptions associated with these statements. Actual results may differ materially from those contained in any forward-looking statements.
RECENT DEVELOPMENTS
The Tax Cuts and Jobs Act of 2017
The Tax Cuts and Jobs Act of 2017 (the “2017 Tax Act”) became law on December 22, 2017.
2017 Impact on Corporate Tax Rate
For tax years beginning in 2018, the U.S. Federal corporate tax rate will be reduced from 35% to 21%. Since Realogy’s December 31, 2017 balance sheet reflects a net deferred tax liability, the rate change will result in a smaller net liability and the Company has recognized a significant tax benefit of approximately $184 million in 2017.
2018 Impact on Corporate Tax Rate
The Company's effective tax rate, which includes state and local income taxes, is estimated to be 29% beginning in 2018 which will result in lower than previously anticipated cash income taxes once the Company's net operating loss carryforwards are fully utilized. We currently expect to fully utilize our net operating loss carryforwards in early 2020. The tax reform changes related to interest expense deductibility, executive compensation, income from foreign subsidiaries and meals and entertainment are not expected to have a significant impact on the Company's tax provision.
49
Impact on Consumers
Among other things, the 2017 Tax Act:
• | reduces individual federal tax brackets at most income levels; |
• | increases the standard deduction from $12,700 to $24,000 for married taxpayers filing a joint return; |
• | caps the aggregate amount of property, sales and state and local income tax deductions at $10,000; |
• | reduces the principal amount to which the home mortgage interest deduction will be available to potentially impacted U.S. taxpayers who enter into a mortgage on or after December 15, 2017 from $1,000,000 to $750,000, while entirely suspending interest deductibility of home equity loans; and |
• | suspends the deductibility of certain home moving expenses. |
The impact of the income tax changes on individuals as well as the potential impact on homesale transactions is difficult to predict and we are currently unable to estimate the extent to which these provisions of the 2017 Tax Act will affect our business. While certain of these provisions (such as caps on property tax and mortgage interest deductions) negatively impact traditional incentives associated with home ownership and may reduce the financial distinction between renting and owning a home, other provisions (such as the reduction in tax rates and increase in standard deductions) could help individuals accumulate additional funds for the down payment on a house or help support a home mortgage payment. Although the reduction in state and local tax deductibility will impact many individuals, particularly in states with higher taxes it is unclear what impact, if any, this will have on the mobility of such state residents, or on home values in such geographies, although it may result in some shift in the value of homes from high tax states to those states with low or no state income tax. The effects of the 2017 Tax Act on average homesale prices may be more impactful in states where average home prices, state and local incomes taxes, and/or property taxes are high, including California and the New York tri-state area, where our company owned brokerage and our franchisee businesses maintain a material presence. In addition, the suspension of the deduction for certain moving expenses may result in fewer instances of specific relocation services.
Refinancing
In February 2018, the Company completed debt transactions which:
• | amended its Revolving Credit Facility, by increasing the capacity from $1,050 million to $1,400 million and extending the maturity date from October 2020 to February 2023 (the "New Revolving Credit Facility"); |
• | refinanced the existing aggregate $733 million Term Loan A and Term Loan A-1 tranches due October 2020 and July 2021, respectively, into a new single tranche of $750 million Term Loan A due February 2023 (which included incremental borrowings of $17 million) (the "New Term Loan A"); and |
• | refinanced the existing $1,083 million Term Loan B due July 2022 with a new Term Loan B issued at par in the amount of $1,080 million and with a maturity date in February 2025 (the "New Term Loan B"). |
The interest rates with respect to the New Revolving Credit Facility and New Term Loan A are the same that had been in place under Term Loan A-1 and are based on, at the Company's option, adjusted London Interbank Offering Rate ("LIBOR") or JPMorgan Chase Bank, N.A.’s prime rate ("ABR") plus an additional margin subject to adjustments based on the Company’s then current senior secured leverage ratio under the Senior Secured Credit Facility. The New Term Loan A provides for quarterly amortization payments on the last day of each quarter, totaling per annum 2.5%, 2.5%, 5.0%, 7.5% and 10.0% of the original principal amount of the New Term Loan A, commencing June 30, 2018, with the balance of the New Term Loan A due in full on February 8, 2023. The interest rate and amortization with respect to New Term Loan B is unchanged. The other terms of the New Revolving Credit Facility, New Term Loan A and New Term Loan B are substantially the same as those in place prior to the transactions.
Leadership Realignment and Other Initiatives
Beginning in the first quarter of 2018, the Company commenced the implementation of a plan to drive our business forward and enhance stockholder value. The key initiatives of this plan include senior leadership realignment, an enhanced focus on technology and talent, as well as further attention on office footprint and other operational efficiencies, including the consolidation of certain support services provided to NRT and RFG.
50
Mortgage Origination Joint Venture
During the third and fourth quarters of 2017, Guaranteed Rate Affinity, LLC (“Guaranteed Rate Affinity”), the Company's mortgage origination joint venture with Guaranteed Rate, Inc. (“Guaranteed Rate”), acquired certain assets of the mortgage operations of PHH Home Loans, LLC, the Company's former mortgage origination joint venture with PHH Mortgage Corporation, including its four regional centers and employees across the United States, but not its mortgage assets. Guaranteed Rate Affinity began doing business in August 2017 on a phased-in basis. Guaranteed Rate Affinity originates and markets its mortgage lending services to the Company's real estate brokerage and relocation subsidiaries as well as other real estate brokerage companies across the country. Guaranteed Rate owns a controlling 50.1% stake of Guaranteed Rate Affinity and the Company owns the remaining 49.9%. While the Company has certain governance rights related to the joint venture, it does not have control of the day-to-day operations of Guaranteed Rate Affinity.
After giving effect to the establishment of Guaranteed Rate Affinity and the liquidation of our interest in PHH Home Loans, LLC in the first half of 2018, the Company expects to realize net cash proceeds of approximately $19 million. While the equity earnings or losses related to the Company's former joint venture were included in the financial results of NRT, the equity earnings or losses related to Guaranteed Rate Affinity are included in the financial results of TRG.
Adoption of New Share Repurchase Program
On February 26, 2018, the Board authorized a new share repurchase program of up to $350 million of the Company's common stock, which is in addition to the remaining authorization available under the February 2017 share repurchase program. Refer to "Part II—Item 5. Market for Registrant’s Common Equity, Related Stockholder Matters and Issuer Purchases of Equity Securities" for additional information on the Company's share repurchase programs.
CURRENT INDUSTRY TRENDS
According to the National Association of Realtors ("NAR"), during 2017, homesale transaction volume increased 6% due to a 5% increase in the average homesale price and a 1% increase in the number of homesale transactions. The higher increase in the average homesales price relative to the increase in homesale transactions is a function of high demand against a limited supply of homes for sale. RFG and NRT homesale transaction volume on a combined basis increased 7% for the year ended December 31, 2017. NRT experienced a 5% increase in the average homesale price and a 3% increase in existing homesale transactions while RFG experienced a 6% increase in the average homesale price and a 1% increase in existing homesale transactions.
Recruitment and retention of independent sales agents and independent sales agent teams are critical to the business and financial results of a brokerage, including our company owned brokerages and those operated by our affiliated franchisees. Competition for independent sales agent in our industry, including within our franchise system, is high, in particular with respect to more productive sales agents. Most of a brokerage's real estate listings are sourced through the sphere of influence of their independent sales agents, notwithstanding the growing influence of internet-generated leads. Competition for independent sales agents is generally subject to numerous factors, including:
• | remuneration (such as sales commission percentage and other financial incentives paid to independent sales agents); |
• | other expenses borne by independent sales agents; |
• | leads or business opportunities generated for the independent sales agent from the brokerage; |
• | independent sales agents' perception of the value of the broker's brand affiliation; |
• | marketing and advertising efforts by the brokerage or franchisor; |
• | the office manager, staff and fellow independent sales agents with whom they collaborate daily; and |
• | technology, continuing professional education, and other services provided by the brokerage or franchisor. |
We believe that the influence of independent sales agents and independent sales agent teams has increased in recent years and, together with the increasing competition from other brokerages, has negatively impacted the recruitment and retention of independent sales agents and put upward pressure on the average share of commissions earned by affiliated independent sales agents. These factors have also put pressure on RFG's royalty revenue compared to homesale transaction volume as the economics for agents and agent teams change.
Commencing in late 2016, NRT launched strategic initiatives focused on the targeted recruitment and retention of affiliated independent sales agents. The initiatives built on the full-service real estate brokerage model utilized by NRT in
51
most markets by placing an even greater focus on the quality of our services and more aggressively utilizing financial incentives to strengthen our recruiting and retention practices. The execution of the initiatives had a positive impact on our efforts to recruit and retain high-performing independent sales agents during 2017, which we believe was a key contributor to the rebuilding of our market share in 2017 from declines over the past several years. Execution of these initiatives resulted in increased spending on recruitment efforts and put upward pressure on the average share of commissions earned by affiliated independent sales agents.
While the execution of these recruiting and retention initiatives increased NRT's commission expense, and is expected to continue to increase, and adversely impact the margin earned by NRT, we expect that the continued execution of the initiatives and associated revenues from increased homesale transaction volume will (i) immediately positively impact RFG results (via intercompany royalties), (ii) over the longer term, improve NRT's operating results and (iii) continue to positively impact our market share.
NRT has relationships with developers, primarily in major cities, to provide marketing and brokerage services in new developments. New development closings generally have a development period of between 18 and 24 months from contracted date to closing. During 2017, NRT experienced stronger growth in its new development business with a significant increase in the number of closed transactions from 2016. This growth was largely due to the timing of closings of several major developments during the year. While our current new development pipeline remains robust over the next several years, due to the timing of anticipated closings and the cyclical nature of this business, we expect a reduction in the number of closed transactions in 2018 and a corresponding reduction in related earnings to NRT, with a significant portion of the impact expected in the first half of the year.
As reported by NAR, the housing affordability index has continued to be at historically favorable levels, despite the increases in the average homesale price over the past several years. An index above 100 signifies that a family earning the median income has sufficient income to purchase a median-priced home, assuming a 20 percent down payment and ability to qualify for a mortgage. The composite housing affordability index was 158 for 2017 and 167 for 2016. The housing affordability index remains significantly higher than the 25-year average of 142.
According to Freddie Mac, mortgage rates on commitments for a 30-year, conventional, fixed-rate first mortgage averaged 3.99% for 2017 and 3.65% for 2016. Although mortgage rates have slightly increased during 2017, they continue to be at low levels compared to the 25-year average of 5.95%. While this increase adversely impacts housing affordability, we believe that rising wages, improving consumer confidence and a continuation of low inventory levels for the mainstream housing market may offset, in whole or in part, rising interest rates and may result in continued favorable demand conditions. To the extent that mortgage rates increase further, consumers continue to have financing alternatives such as adjustable rate mortgages or shorter term mortgages which can be utilized to obtain a lower mortgage rate than a 30-year fixed-rate mortgage.
Partially offsetting the positive impact of historically favorable mortgage rates are low housing inventory levels, which have been in decline over the past several years. According to NAR, the inventory of existing homes for sale in the U.S. was 1.5 million and 1.7 million at the end of December 2017 and December 2016, respectively. The December 2017 inventory represents a national average supply of 3.2 months at the current homesales pace which is significantly below the 5.9 month 25-year average. The national average supply at the then-current homesales pace for December 31, 2016, 2015 and 2014 was 3.6 months, 3.9 months and 4.4, respectively.
Additional offsetting factors include the ongoing rise in home prices, conservative mortgage underwriting standards and certain homeowners having limited or negative equity in homes. Mortgage credit conditions tightened significantly during the last housing downturn, with banks limiting credit availability to more creditworthy borrowers and requiring larger down payments, stricter appraisal standards, and more extensive mortgage documentation. Although mortgage credit conditions appear to be easing, mortgages remain less available to some borrowers with lower FICO scores or credit issues and it frequently takes longer to close a homesale transaction due to current mortgage and underwriting requirements.
52
Existing Homesales
For the year ended December 31, 2017, NAR existing homesale transactions increased to 5.5 million homes or up 1% compared to 2016. For the year ended December 31, 2017, RFG and NRT homesale transactions on a combined basis increased 1% compared to 2016. The number of homesale transactions for RFG and NRT has continued to be challenged by inventory constraints, however for NRT there has been improvement in the high end of the housing market. The annual and quarterly year-over-year trends in homesale transactions are as follows:
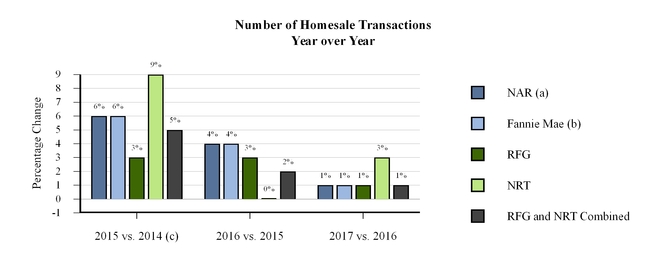
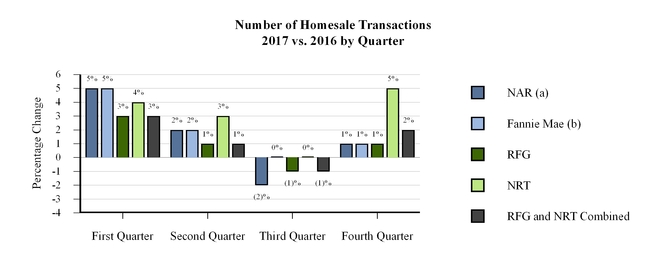
_______________
(a) | Historical existing homesale data is as of the most recent NAR press release, which is subject to sampling error. |
(b) | Existing homesale data, on a seasonally adjusted basis, is as of the most recent Fannie Mae press release. |
(c) | In April 2015, NRT acquired Coldwell Banker United, a large franchisee of RFG, and as a result the drivers of Coldwell Banker United shifted from RFG to NRT. In addition, NRT homesale sides include transactions from the acquisition of ZipRealty in August 2014. The year-over-year change in homesale sides, excluding the impact of these acquisitions, would have been 5% for RFG and 2% for NRT. |
As of their most recent releases, NAR is forecasting an increase in existing homesales of 1% in 2018 and 3% in 2019 while Fannie Mae is forecasting an increase in existing homesale transactions of 2% in both 2018 and 2019.
53
Existing Homesale Price
In 2017, NAR existing homesale average price increased 5% compared to 2016. In 2017, RFG and NRT average homesale price on a combined basis increased 6% compared to 2016. The combined average homesale price increase was due to the increase in homesale transactions at the high end of the markets served by RFG and NRT. Both RFG and NRT homesale price also improved as a result of increased demand due in part to the continuation of constrained inventory levels. The annual and quarterly year-over-year trends in the price of homes are as follows:
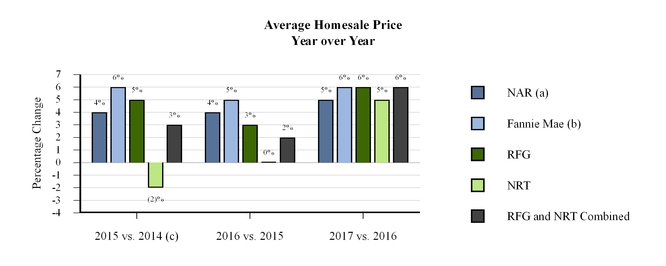
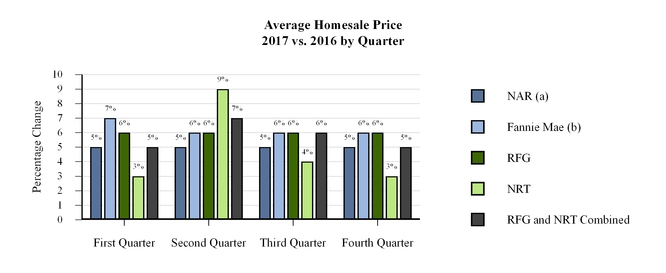
_______________
(a) | Historical homesale price data is for existing homesale average price and is as of the most recent NAR press release. |
(b) | Existing homesale price data is for median price and is as of the most recent Fannie Mae press release. |
(c) | In April 2015, NRT acquired Coldwell Banker United, a large franchisee of RFG, and as a result the drivers of Coldwell Banker United shifted from RFG to NRT. In addition, NRT homesale price includes transactions from the acquisition of ZipRealty in August 2014. The acquisition of Coldwell Banker United did not have a significant impact on the average homesale price for RFG. The year-over-year change in average homesale price for NRT, excluding the impact of these acquisitions, would have been 1% for NRT. |
As of their most recent releases, NAR is forecasting an increase in median existing homesale price of 3% in both 2018 and 2019 while Fannie Mae is forecasting an increase of 5% in 2018 and 4% in 2019.
* * *
54
We believe that long-term demand for housing and the growth of our industry are primarily driven by the affordability of housing, the economic health of the U.S. economy, demographic trends such as population growth, the increase in household formation, mortgage rate levels and mortgage availability, certain tax benefits, job growth, the inherent attributes of homeownership versus renting and the influence of local housing dynamics of supply versus demand. At this time, most of these factors are generally trending favorably. Factors that may negatively affect continued growth in the housing industry include:
• | certain provisions of the 2017 Tax Act that directly impact traditional incentives associated with home ownership and may reduce the financial distinction between renting and owning a home, including those that reduce the amount that certain taxpayers would be allowed to deduct for home mortgage interest or state, local and property taxes; |
• | higher mortgage rates due to increases in long-term interest rates as well as reduced availability of mortgage financing; |
• | continued insufficient inventory levels; |
• | lack of building of new housing or irregular timing of new development closings leading to lower unit sales at NRT, which has relationships with developers, primarily in major cities, to provide marketing and brokerage services in new developments; |
• | changing attitudes towards home ownership; |
• | an increase in potential homebuyers with low credit ratings or inability to afford down payments; |
• | the impact of limited or negative equity of current homeowners, as well as the lack of available inventory may limit their proclivity to purchase an alternative home; |
• | reduced affordability of homes; |
• | economic stagnation or contraction in the U.S. economy; |
• | a decline in home ownership levels in the U.S.; |
• | other legislative or regulatory reforms, including but not limited to reform that adversely impacts the financing of the U.S. housing market; and |
• | geopolitical and economic instability. |
Many of the trends impacting our businesses that derive revenue from homesales also impact Cartus, which is a global provider of outsourced employee relocation services. In addition to general residential housing trends, key drivers of Cartus are global corporate spending on relocation services, which continue to shift to lower cost relocation benefits as corporate clients engage in cost reduction initiatives and/or restructuring programs as well as changes in employment relocation trends. Cartus is subject to a competitive pricing environment and lower average revenue per relocation as a result of a shift in the mix of services and number of services being delivered per move. These factors have and may continue to put pressure on the growth and profitability of this segment. Moreover, the 2017 Tax Act suspends the deductibility of certain home moving expenses, which may result in fewer instances of specific relocation services.
KEY DRIVERS OF OUR BUSINESSES
Within RFG and NRT, we measure operating performance using the following key operating metrics: (i) closed homesale sides, which represents either the "buy" side or the "sell" side of a homesale transaction, (ii) average homesale price, which represents the average selling price of closed homesale transactions, and (iii) average homesale broker commission rate, which represents the average commission rate earned on either the "buy" side or "sell" side of a homesale transaction. For RFG, we also use net royalty per side, which represents the royalty payment to RFG for each homesale transaction side taking into account volume incentives achieved, flat royalty rates and non-standard incentives. We consider net royalty per side the best measure of royalty revenue per transaction as it reflects the impact of changes in average homesale price and represents the royalty revenue impact of each incremental side.
Since 2014, we have experienced approximately a one basis point decline in the average broker commission rate each year and we expect that over the long term the average brokerage commission rates will continue to modestly decline as a result of increases in average homesale prices and, to a lesser extent, competitors providing fewer or similar services for a reduced fee. Continuing growth in the housing market should result in an increase in our revenues, although such increases could be offset by modestly declining brokerage commission rates, lower net effective royalty rates and competitive pressures.
55
Royalty fees are charged to all franchisees pursuant to the terms of the relevant franchise agreements and are included in each of the real estate brands' franchise disclosure documents. Most of our third-party franchisees are subject to a 6% royalty rate and entitled to volume incentives. Volume incentives are calculated as a progressive percentage of the applicable franchisee's eligible annual gross income and generally result in a net royalty rate ranging from 6% to 3% for the franchisee. Volume incentives increase or decrease as the franchisee's gross commission income generated increases or decreases, respectively. We have the right to adjust the annual volume incentive tables on an annual basis in response to changing market conditions. In addition, some of our larger franchisees have a flat royalty rate of less than 6% and are not eligible for volume incentives.
Since 2013, RFG's net domestic royalty revenue has increased 25% from $287 million to $358 million, while homesale transaction volume at RFG has increased 31% over the same period. While increases in domestic royalty revenue have not kept pace with homesale transaction volume, we have seen an 18% increase in net royalties per side. As a result, the revenue provided from each incremental side has continued to increase over this time period.
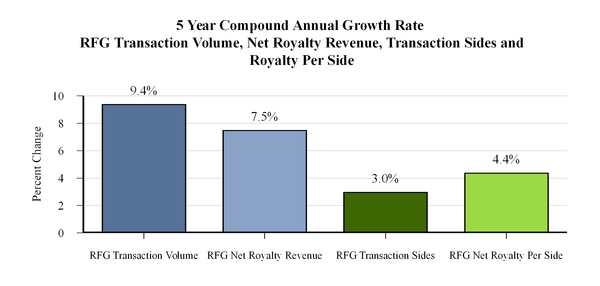
Transaction volume growth has exceeded royalty revenue growth over the past five years due primarily to the growth in gross commission income generated by our top 250 franchisees and our increased use of non-standard sales incentives, both of which directly impact royalty revenue. Over the past several years, our top 250 franchisees have grown faster than our other franchisees through organic growth and market consolidation. The gross commission income earned by our top 250 franchisees as a percentage of total gross commission income generated by all of our franchisees was 63% in 2017 compared to 60% in 2013. If such increases in the amount of gross commission income generated by our top 250 franchisees continue to occur at a quicker pace relative to our other franchisees, we would expect our royalty revenue to continue to increase at a slower pace as compared to homesale transaction volume. Likewise, our royalty revenue would continue to increase at a slower pace as compared to homesale transaction volume if the gross commission income generated by all of our franchisees grows faster than the applicable annual volume incentive table increase or if we increase our use of standard volume or non-standard incentives. However, we expect that any such increases in gross commission income will result in additional royalty payments to us.
Non-standard incentives may also be used as consideration to attract, retain and help grow certain franchisees. Most of our franchisees do not receive these non-standard incentives and in contrast to volume incentives, the majority are not homesale transaction based. We expect that the trend of increasing non-standard incentives will continue in the future in order to attract, retain and help grow certain franchisees. As noted above, this may result in slower growth in our royalty revenue as compared to homesale transaction volume.
NRT has a significant concentration of real estate brokerage offices and transactions in geographic regions where home prices are at the higher end of the U.S. real estate market, particularly the east and west coasts, while RFG has franchised offices that are more widely dispersed across the United States. Accordingly, operating results and homesale statistics may differ between NRT and RFG based upon geographic presence and the corresponding homesale activity in each geographic region. In addition, the share of commissions earned by independent sales agents directly impacts the margin earned by NRT. Such share of commissions earned by independent sales agents varies by region and commission schedules are generally progressive to incentivize sales agents to achieve higher levels of production. We expect that commission share
56
will continue to be subject to upward pressure in favor of the independent sales agent because of the increased bargaining power of independent sales agents and teams as well as more aggressive recruitment and retention activities taken by us and our competitors.
As described above under "Current Industry Trends," competition for independent sales agents in our industry has intensified and we expect this competition will continue particularly with respect to more productive independent sales agents. Currently, there are several different compensation models being utilized by real estate brokerages to compensate their independent sales agents. The most common models are as follows:
• | a graduated commission plan, sometimes referred to as the "traditional model" where the independent sales agent receives a percentage of the brokerage commission that increases as the independent sales agent increases his or her volume of homesale transactions and the brokerage frequently provides independent sales agents with a broad set of support offerings and promotion of properties, |
• | a desk rental or 100% plan, where the independent sales agent is entitled to all or nearly all of the broker commission and pays the broker on both a monthly and transaction basis for office space, tools, technology and support while also being personally responsible for the promotion of properties and other items, |
• | a capped model, which generally blends aspects of the first two models described herein, and |
• | a fixed transaction fee model where the sales agent is entitled to all of the broker commission and pays a fixed fee per homesale transaction and often receives very limited support from the brokerage. |
Although less common, some real estate brokerages employ their sales agents and, in such instances, employee agents may earn smaller brokerage commissions in exchange for other employee benefits or bonuses. Most brokerages focus primarily on one compensation model though some may offer one or more of these models to their sales agents. Increasingly, independent sales agents have affiliated with brokerages that offer a different mix of services to the independent sales agents, allowing the independent sales agent to retain a greater percentage of the commission. However, there are long-term trade-offs in the level of support independent sales agents receive in areas such as marketing, technology and professional education.
While NRT has historically compensated its independent sales agents using a traditional model, utilizing elements of other models depending upon the geographic market, we are placing an even greater focus on the quality of our services and use of financial incentives to strengthen our recruiting and retention of independent sales agents and teams. These actions include a more aggressive strategy to recruit and retain high performing sales agents. In addition, there is an enhanced focus on the value proposition offered to independent sales agent teams. This strategic emphasis on recruitment and retention is driven by our overall goal to sustain or grow market share in various markets and ultimately improve the Company's overall profitability. While we have seen revenue improvements directly related to these initiatives, we have experienced and expect to continue to experience pressure on costs and margin from these initiatives.
Within Cartus, we measure operating performance using the following key operating statistics: (i) initiations, which represent the total number of new transferees and the total number of real estate closings for affinity members and (ii) referrals, which represent the number of referrals from which we earn revenue from real estate brokers.
In TRG, operating performance is evaluated using the following key metrics: (i) purchase title and closing units, which represent the number of title and closing units we process as a result of home purchases, (ii) refinance title and closing units, which represent the number of title and closing units we process as a result of homeowners refinancing their home loans, and (iii) average fee per closing unit, which represents the average fee we earn on purchase title and refinancing title sides. An increase or decrease in homesale transactions will impact the financial results of TRG; however, the financial results are not significantly impacted by a change in homesale price. We believe that an increase in mortgage rates in the future will most likely have a negative impact on refinancing title and closing units.
A decline in the number of homesale transactions and decline in homesale prices could adversely affect our results of operations by: (i) reducing the royalties we receive from our franchisees, (ii) reducing the commissions our company owned brokerage operations earn, (iii) reducing the demand for our title and settlement services, (iv) reducing the referral fees we earn in our relocation services business, and (v) increasing the risk of franchisee default due to lower homesale volume. Our results could also be negatively affected by a decline in commission rates charged by brokers or greater commission payments to sales agents.
57
The following table presents our drivers for the years ended December 31, 2017, 2016 and 2015. See "Results of Operations" below for a discussion as to how these drivers affected our business for the periods presented.
Year Ended December 31, | % Change | Year Ended December 31, | % Change | ||||||||||||||||||
2017 | 2016 | 2016 | 2015 | ||||||||||||||||||
RFG (a) | |||||||||||||||||||||
Closed homesale sides | 1,144,217 | 1,135,344 | 1 | % | 1,135,344 | 1,101,333 | 3 | % | |||||||||||||
Average homesale price | $ | 288,929 | $ | 272,206 | 6 | % | $ | 272,206 | $ | 263,894 | 3 | % | |||||||||
Average homesale broker commission rate | 2.50 | % | 2.50 | % | — | 2.50 | % | 2.51 | % | (1 | ) bps | ||||||||||
Net royalty per side (b) | $ | 313 | $ | 299 | 5 | % | $ | 299 | $ | 294 | 2 | % | |||||||||
NRT | |||||||||||||||||||||
Closed homesale sides | 344,446 | 335,699 | 3 | % | 335,699 | 336,744 | — | % | |||||||||||||
Average homesale price | $ | 514,685 | $ | 489,504 | 5 | % | $ | 489,504 | $ | 489,673 | — | % | |||||||||
Average homesale broker commission rate | 2.44 | % | 2.46 | % | (2 | ) bps | 2.46 | % | 2.46 | % | — | ||||||||||
Gross commission income per side | $ | 13,309 | $ | 12,752 | 4 | % | $ | 12,752 | $ | 12,730 | — | % | |||||||||
Cartus | |||||||||||||||||||||
Initiations | 161,755 | 163,063 | (1 | %) | 163,063 | 167,749 | (3 | %) | |||||||||||||
Referrals | 83,678 | 87,277 | (4 | %) | 87,277 | 99,531 | (12 | %) | |||||||||||||
TRG | |||||||||||||||||||||
Purchase title and closing units (c) | 159,113 | 152,997 | 4 | % | 152,997 | 130,541 | 17 | % | |||||||||||||
Refinance title and closing units (d) | 28,564 | 50,919 | (44 | %) | 50,919 | 38,544 | 32 | % | |||||||||||||
Average fee per closing unit | $ | 2,092 | $ | 1,875 | 12 | % | $ | 1,875 | $ | 1,861 | 1 | % | |||||||||
(a) | Includes all franchisees except for NRT. |
(b) | Royalty per side amounts have been revised to include the effect of non-standard incentives granted to certain franchisees. |
(c) | The amounts presented include 8,351, 18,930 and 13,304 purchase units as a result of acquisitions for 2017, 2016 and 2015, respectively. |
(d) | The amounts presented include 1,858, 4,469 and 3,403 refinance units as a result of acquisitions for 2017, 2016 and 2015, respectively. |
58
RESULTS OF OPERATIONS
Discussed below are our consolidated results of operations and the results of operations for each of our reportable segments. The reportable segments presented below represent our operating segments for which separate financial information is available and which is utilized on a regular basis by our chief operating decision maker to assess performance and to allocate resources. In identifying our reportable segments, we also consider the nature of services provided by our operating segments. Management evaluates the operating results of each of our reportable segments based upon revenue and EBITDA. EBITDA is defined as net income (loss) before depreciation and amortization, interest (income) expense, net (other than relocation services interest for securitization assets and securitization obligations) and income taxes, each of which is presented on our Consolidated Statements of Operations. Our presentation of EBITDA may not be comparable to similarly titled measures used by other companies.
Year Ended December 31, 2017 vs. Year Ended December 31, 2016
Our consolidated results were comprised of the following:
Year Ended December 31, | |||||||||||
2017 | 2016 | Change | |||||||||
Net revenues | $ | 6,114 | $ | 5,810 | $ | 304 | |||||
Total expenses (1) | 5,763 | 5,461 | 302 | ||||||||
Income before income taxes, equity in earnings and noncontrolling interests | 351 | 349 | 2 | ||||||||
Income tax (benefit) expense | (65 | ) | 144 | (209 | ) | ||||||
Equity in earnings of unconsolidated entities | (18 | ) | (12 | ) | (6 | ) | |||||
Net income | 434 | 217 | 217 | ||||||||
Less: Net income attributable to noncontrolling interests | (3 | ) | (4 | ) | 1 | ||||||
Net income attributable to Realogy Holdings and Realogy Group | $ | 431 | $ | 213 | $ | 218 | |||||
_______________
(1) | Total expenses for the year ended December 31, 2017 includes $12 million of restructuring charges, an $8 million expense related to the settlement of the Strader legal matter, an $8 million expense related to the transition of the Company's CEO and $5 million related to losses on the early extinguishment of debt, partially offset by a net benefit of $10 million of former parent legacy items as a result of a reduction in the reserve and $4 million of gains related to mark-to-market adjustments for our interest rate swaps. Total expenses for the year ended December 31, 2016 includes $39 million of restructuring charges and $6 million of losses related to mark-to-market adjustments for our interest rate swaps, partially offset by a net benefit of $2 million of former parent legacy items. |
Net revenues increased $304 million or 5% for the year ended December 31, 2017 compared with the year ended December 31, 2016, principally due to increases in gross commission income and franchise fees as a result of homesale transaction volume increase of 7% on a combined basis for NRT and RFG.
Total expenses increased $302 million or 6% primarily due to:
• | a $285 million increase in commission and other sales agent-related costs due to an increase in homesale transaction volume at NRT and higher sales commissions paid to its independent sales agents; |
• | a $45 million increase in operating and general and administrative expenses primarily driven by: |
◦ | $25 million of additional employee-related costs associated with acquisitions; |
◦ | a $29 million increase in other expenses including professional fees and occupancy costs; |
◦ | an $8 million expense related to the transition of the Company's CEO; and |
◦ | an $8 million expense related to the settlement of the Strader legal matter in 2017; |
partially offset by:
◦ | a $13 million decrease in variable operating costs at TRG primarily due to lower refinance and underwriter volume; and |
◦ | a $16 million decrease in other employee related costs primarily due to lower incentive accruals. |
• | a $20 million increase in marketing expenses comprised of $10 million at NRT, $5 million at RFG and $3 million at TRG; and |
• | $5 million related to the losses on the early extinguishment of debt. |
59
The expense increases were partially offset by:
• | a $16 million net decrease in interest expense to $158 million for the year ended December 31, 2017 compared to $174 million for the year ended December 31, 2016. Mark-to-market adjustments for our interest rate swaps resulted in gains of $4 million for the year ended December 31, 2017 compared to losses of $6 million for the year ended December 31, 2016. Before the mark-to-market adjustments for our interest rate swaps, interest expense decreased $6 million to $162 million in 2017 from $168 million in 2016 as a result of a reduction in total outstanding indebtedness; |
• | a $27 million decrease in restructuring costs related to the Company's business optimization plan (see Note 11, "Restructuring Costs", in the Consolidated Financial Statements for additional information); and |
• | an $8 million increase in the net benefit of former parent legacy items primarily as a result of a reduction in the reserve due to the settlement of a Cendant legacy tax matter. |
Earnings from equity investments were $18 million during the year ended December 31, 2017 compared to $12 million during the year ended December 31, 2016. The $6 million net increase in earnings is primarily due to:
• | a $14 million increase in equity earnings at NRT as a result of $35 million of earnings from the sale of PHH Home Loans' assets to Guaranteed Rate Affinity, partially offset by $7 million of exit costs. In addition, there was a $14 million decrease in earnings due to lower operating results as a result of lower origination volume, compressed industry margins and lower results due to the level of organizational change associated with the transition of the operations to Guaranteed Rate Affinity. |
The increase in equity earnings was partially offset by:
• | an $8 million decrease in equity earnings at TRG primarily related to costs associated with the start up of operations of Guaranteed Rate Affinity, including $3 million of amortization of intangible assets recorded in purchase accounting. |
The provision for income taxes was a benefit of $65 million for the year ended December 31, 2017 compared to expense of $144 million for the year ended December 31, 2016. The benefit is due to the recognition of a significant tax benefit of approximately $184 million as a result of the 2017 Tax Act and a $32 million change in our reserve for uncertain tax positions, partially offset by current operating results. The net benefit recorded for the 2017 Tax Act is a provisional amount that reflects the Company’s reasonable estimate at this time, and is subject to adjustment during a measurement period not to exceed one year from enactment in accordance with guidance from the Securities and Exchange Commission. The Company's effective tax rate, which includes state and local income taxes, was 40% for 2016. As a result of the 2017 Tax Act, the Company's effective tax rate is estimated to be 29% beginning in 2018.
Following is a more detailed discussion of the results of each of our reportable segments for the years ended December 31, 2017 and 2016:
Revenues (a) | % Change | EBITDA (b) | % Change | Margin | ||||||||||||||||||||||||||
2017 | 2016 | 2017 | 2016 | 2017 | 2016 | Change | ||||||||||||||||||||||||
RFG | $ | 830 | $ | 781 | 6 | % | $ | 559 | $ | 516 | 8 | % | 67 | % | 66 | % | 1 | |||||||||||||
NRT (c) | 4,643 | 4,344 | 7 | 126 | 137 | (8 | ) | 3 | 3 | — | ||||||||||||||||||||
Cartus | 382 | 405 | (6 | ) | 85 | 96 | (11 | ) | 22 | 24 | (2 | ) | ||||||||||||||||||
TRG | 570 | 573 | (1 | ) | 58 | 62 | (6 | ) | 10 | 11 | (1 | ) | ||||||||||||||||||
Corporate and Other | (311 | ) | (293 | ) | * | (103 | ) | (78 | ) | * | ||||||||||||||||||||
Total Company | $ | 6,114 | $ | 5,810 | 5 | % | $ | 725 | $ | 733 | (1 | )% | 12 | % | 13 | % | (1 | ) | ||||||||||||
Less: Depreciation and amortization (d) | 201 | 202 | ||||||||||||||||||||||||||||
Interest expense, net | 158 | 174 | ||||||||||||||||||||||||||||
Income tax (benefit) expense | (65 | ) | 144 | |||||||||||||||||||||||||||
Net income attributable to Realogy Holdings and Realogy Group | $ | 431 | $ | 213 | ||||||||||||||||||||||||||
_______________
* | not meaningful |
(a) | Includes the elimination of transactions between segments, which consists of intercompany royalties and marketing fees paid by NRT of $311 million and $293 million during the years ended December 31, 2017 and 2016, respectively. |
(b) | EBITDA for the year ended December 31, 2017 includes $12 million of restructuring charges discussed further below, an $8 million expense related to the settlement of the Strader legal matter, an $8 million expense related to the transition of the Company's CEO |
60
and $5 million related to losses on the early extinguishment of debt, partially offset by a net benefit of $10 million of former parent legacy items as a result of a reduction in the reserve. In addition, the Company believes that 2017 EBITDA was also negatively impacted by an estimated $8 million due to natural disasters in the third and fourth quarters. EBITDA for the year ended December 31, 2016 includes $39 million of restructuring costs, partially offset by a net benefit of $2 million for former parent legacy items.
(c) | NRT EBITDA includes $22 million and $8 million of equity in earnings from PHH Home Loans for the years ended December 31, 2017 and 2016, respectively. |
(d) | Depreciation and amortization the year ended December 31, 2017 includes $3 million of amortization expense related to Guaranteed Rate Affinity's purchase accounting included in the "Equity in earnings of unconsolidated entities" line on the Consolidated Statement of Operations. |
As described in the aforementioned table, EBITDA margin for "Total Company" expressed as a percentage of revenues decreased 1 percentage point to 12% from 13% for 2017 compared to 2016. On a segment basis, RFG's margin increased 1 percentage point to 67% from 66% due to an increase in homesale transaction volume. NRT's margin remained flat at 3% primarily due to higher sales commission percentages paid to its independent sales agents offset by lower restructuring costs and an increase in earnings related to the wind down of its equity investment in PHH Home Loans in 2017 compared to 2016. Cartus' margin decreased 2 percentage points to 22% from 24% primarily due to lower international revenue and lower foreign currency exchange rate gains, partially offset by lower employee related costs during 2017 compared to 2016 and the absence of restructuring costs incurred in 2016. TRG's margin decreased 1 percentage point to 10% from 11% for the year ended December 31, 2017 compared to 2016 due to a decrease in earnings from equity investments primarily related to costs associated with the start up of operations of Guaranteed Rate Affinity.
Corporate and Other EBITDA for the year ended December 31, 2017 decreased $25 million to negative $103 million primarily due to a $10 million increase in other costs due to professional fees supporting strategic initiatives and occupancy costs, a $9 million increase in employee costs primarily due to investments in technology development, $8 million of costs related to the transition of the Company's CEO, an $8 million expense related to the settlement of the Strader legal matter and $5 million related to losses on the early extinguishment of debt. These expenses were partially offset by an $8 million increase in the net benefit of former parent legacy items as a result of a reduction in the reserve due to the settlement of a Cendant legacy tax matter in 2017 and a $7 million decrease in restructuring charges incurred during 2017 compared to 2016.
EBITDA before restructuring charges was $737 million for the year ended December 31, 2017 compared to $772 million for the year ended December 31, 2016. EBITDA before restructuring charges by reportable segment for the year ended December 31, 2017 was as follows:
Year Ended December 31, | ||||||||||||||||||
2017 | 2016 | |||||||||||||||||
EBITDA | Restructuring Charges | EBITDA Before Restructuring | EBITDA Before Restructuring (a) | % Change | ||||||||||||||
RFG | $ | 559 | $ | 1 | $ | 560 | $ | 520 | 8 | % | ||||||||
NRT | 126 | 9 | 135 | 159 | (15 | ) | ||||||||||||
Cartus | 85 | — | 85 | 100 | (15 | ) | ||||||||||||
TRG | 58 | 1 | 59 | 63 | (6 | ) | ||||||||||||
Corporate and Other | (103 | ) | 1 | (102 | ) | (70 | ) | * | ||||||||||
Total Company | $ | 725 | $ | 12 | $ | 737 | $ | 772 | (5 | )% | ||||||||
_______________
* | not meaningful |
(a) | Excludes $39 million of restructuring charges incurred in 2016 as follows: $4 million at RFG, $22 million at NRT, $4 million at Cartus, $1 million at TRG and $8 million at Corporate and Other. |
The following table reflects RFG and NRT results on a combined basis for the years ended December 31, 2017, 2016 and 2015. The EBITDA before restructuring and equity in earnings margin for the combined segments decreased 1 percentage point to 13% for 2017 from 14% for 2016 primarily due to higher sales commission percentages paid to NRT's independent sales agents.
Revenues (a) | EBITDA Before Restructuring and Equity in Earnings (b) | Margin | ||||||||||||||||||||||||||||||
2017 | 2016 | 2015 | 2017 | 2016 | 2015 | 2017 | 2016 | 2015 | ||||||||||||||||||||||||
RFG and NRT Combined | $ | 5,162 | $ | 4,832 | $ | 4,804 | $ | 673 | $ | 671 | $ | 685 | 13 | % | 14 | % | 14 | % | ||||||||||||||
61
_______________
(a) | Excludes transactions between segments, which consists of intercompany royalties and marketing fees paid by NRT to RFG of $311 million, $293 million and $295 million for the years ended December 31, 2017, 2016 and 2015, respectively. |
(b) | EBITDA for the combined RFG and NRT segments excludes $10 million, $26 million and $5 million of restructuring charges and $22 million, $8 million and $14 million of equity in earnings from PHH Home Loans for the years ended December 31, 2017, 2016 and 2015, respectively. We exclude (i) restructuring charges as the frequency and magnitude of these charges may vary widely across periods and (ii) NRT’s equity earnings from PHH Home Loans as this former home mortgage joint venture is in the final stages of liquidation and the results of our new home mortgage joint venture, Guaranteed Rate Affinity, are included in the financial results of TRG. We do not believe these items contribute to a meaningful evaluation of our ongoing operating performance. |
Real Estate Franchise Services (RFG)
Revenues increased $49 million to $830 million and EBITDA increased $43 million to $559 million for the year ended December 31, 2017 compared with 2016.
The increase in revenue was driven by a $21 million increase in third-party domestic franchisee royalty revenue primarily due to a 1% increase in the number of homesale transactions and a 6% increase in the average homesale price, partially offset by a $2 million increase in non-standard incentive amortization. The increase in revenue was also due to a $17 million increase in royalties received from NRT as a result of volume increases at NRT, a $4 million increase in international revenues and a $5 million increase in other revenue primarily due to marketing-related activities and brand conferences and franchisee events. Brand marketing fund revenue increased $4 million and related expense increased $5 million, primarily due to the level of advertising spending during the year ended December 31, 2017 compared with 2016.
The intercompany royalties received from NRT of $299 million and $282 million during the years ended December 31, 2017 and 2016, respectively, are eliminated in consolidation against the same expense reflected in NRT's segment results. See "Company Owned Real Estate Brokerage Services" for a discussion of the drivers related to intercompany royalties paid to RFG.
The $43 million increase in EBITDA was principally due to the $49 million increase in revenues discussed above and a $3 million decrease in restructuring costs incurred during the year ended December 31, 2017 compared with 2016, partially offset by a $5 million increase in brand marketing fund expense discussed above and a $3 million increase in expenses related to the brand conferences and franchisee events.
Company Owned Real Estate Brokerage Services (NRT)
Revenues increased $299 million to $4,643 million and EBITDA declined $11 million to $126 million for the year ended December 31, 2017 compared with 2016.
The revenue increase of $299 million was comprised of a $229 million increase in commission income earned on homesale transactions by our existing brokerage operations and a $70 million increase in commission income earned from acquisitions. The revenue increase was driven by a 3% increase in the number of homesale transactions and a 5% increase in the average price of homes, partially offset by a 2 basis points decrease in the average broker commission rate. We believe our positive revenue growth is attributable to the recruiting and organic growth focus by NRT management as well as improvement in the high end of the housing market. In addition, homesale price is continuing to increase due to continued constrained inventory levels across the lower and mid price points in the markets served by NRT.
EBITDA decreased $11 million primarily due to:
• | a $285 million increase in commission expenses paid to independent sales agents from $2,945 million for the year ended December 31, 2016 to $3,230 million for the year ended December 31, 2017. The increase in commission expense is due to an increase of $241 million by our existing brokerage operations as a result of the impact of initiatives focused on growing and retaining our productive independent sales agent base and higher homesale transaction volume, as well as a $44 million increase related to acquisitions; |
• | a $19 million increase in other costs including occupancy costs of which $7 million related to acquisitions; |
• | a $17 million increase in royalties paid to RFG from $282 million in 2016 to $299 million in 2017; |
• | a $10 million increase in marketing expenses of which $3 million related to acquisitions; and |
• | a $4 million increase in employee-related costs due to a $12 million increase attributable to acquisitions offset by an $8 million decrease due primarily due to lower incentive accruals. |
These EBITDA decreases were partially offset by:
62
• | a $299 million increase in revenues discussed above; |
• | a $14 million increase in earnings for our equity method investment in PHH Home Loans for the year ended December 31, 2017 compared with 2016 as a result of $35 million of earnings from the sale of PHH Home Loans' assets to Guaranteed Rate Affinity, partially offset by $7 million of exit costs. In addition, there was a $14 million decrease in earnings due to lower operating results as a result of lower origination volume, compressed industry margins and lower results due to the level of organizational change associated with the transition of the operations to Guaranteed Rate Affinity; and |
• | a $13 million decrease in restructuring costs incurred during the year ended December 31, 2017 compared with 2016. |
Relocation Services (Cartus)
Revenues decreased $23 million to $382 million and EBITDA decreased $11 million to $85 million for the year ended December 31, 2017 compared with 2016.
Revenues decreased $23 million primarily as a result of a $13 million decrease in international revenue as an increasingly higher percentage of clients are reducing their global relocation activity, as well as an $11 million decrease in other revenue due primarily to lower volume.
EBITDA decreased $11 million primarily as a result of the $23 million decrease in revenues discussed above and a $4 million net negative impact from foreign currency exchange rates, partially offset by an $8 million decrease in employee related costs, the absence of $4 million of restructuring costs incurred during 2016 and a $2 million net decrease in other operating expenses as a result of lower volume.
Title and Settlement Services (TRG)
Revenues decreased $3 million to $570 million and EBITDA decreased $4 million to $58 million for the year ended December 31, 2017 compared with 2016.
The decrease in revenues was driven by a $20 million decrease in refinance revenue and a $10 million decrease in underwriter revenue due to an overall decrease in activity in the refinance market in 2017, offset by a $27 million increase in resale revenue of which $16 million was related to acquisitions.
EBITDA decreased $4 million as a result of a $9 million increase in employee-related costs primarily related to acquisitions, a $5 million decrease in earnings from equity investments primarily related to costs associated with the start up of operations of Guaranteed Rate Affinity, a $3 million increase in other costs and the $3 million decrease in revenues discussed above. These EBITDA decreases were partially offset by a $13 million decrease in variable operating costs primarily due to lower refinancing and underwriter volume and $2 million related to the reversal of a legal reserve in 2017.
Year Ended December 31, 2016 vs. Year Ended December 31, 2015
Our consolidated results were comprised of the following:
Year Ended December 31, | |||||||||||
2016 | 2015 | Change | |||||||||
Net revenues | $ | 5,810 | $ | 5,706 | $ | 104 | |||||
Total expenses (1) | 5,461 | 5,424 | 37 | ||||||||
Income before income taxes, equity in earnings and noncontrolling interests | 349 | 282 | 67 | ||||||||
Income tax expense | 144 | 110 | 34 | ||||||||
Equity in earnings of unconsolidated entities | (12 | ) | (16 | ) | 4 | ||||||
Net income | 217 | 188 | 29 | ||||||||
Less: Net income attributable to noncontrolling interests | (4 | ) | (4 | ) | — | ||||||
Net income attributable to Realogy Holdings and Realogy Group | $ | 213 | $ | 184 | $ | 29 | |||||
_______________
(1) | Total expenses for the year ended December 31, 2016 includes $39 million of restructuring costs and $6 million of losses related to mark-to-market adjustments for our interest rate swaps, partially offset by a net benefit of $2 million for former parent legacy items. Total expenses for the year ended December 31, 2015 includes $48 million related to the loss on the early extinguishment of debt, $20 million of losses related to mark-to-market adjustments for our interest rate swaps and $10 million of restructuring costs, partially offset by a net benefit of $15 million for former parent legacy items. |
Net revenues increased $104 million or 2% for the year ended December 31, 2016 compared with the year ended December 31, 2015, primarily due to an increase in revenue at TRG as a result of acquisitions, as well as an increase in revenue at RFG driven by higher average homesale price and number of homesale transactions.
Total expenses increased $37 million due to:
• | a $68 million increase in operating and general and administrative expenses primarily driven by: |
◦ | $40 million of additional employee-related costs associated with acquisitions; |
◦ | a $39 million increase in variable operating costs at TRG related to higher volume primarily as a result of acquisitions; and |
63
◦ | a $3 million increase in employee-related costs primarily driven by $16 million of salary, benefits and other increases, partially offset by a decrease of $13 million due to lower incentive accruals; |
partially offset by:
◦ | the absence in 2016 of $6 million related to certain transaction costs associated with the acquisition of Coldwell Banker United and the settlement of a legal matter in 2015; |
• | a $29 million increase in restructuring charges related to the Company's business optimization initiative due to $39 million being incurred in 2016 compared to $10 million in 2015; |
• | a $15 million increase in marketing expenses mainly due to higher advertising costs at NRT and TRG primarily related to acquisitions; |
• | a $14 million increase in commission expenses paid to independent real estate sales agents at NRT; and |
• | a $13 million decrease in the net benefit of former parent legacy items as a result of the reduction of a tax liability in 2015. |
These increases in total expenses were partially offset by:
• | a $57 million decrease in interest expense for the year ended December 31, 2016 compared to the year ended December 31, 2015. Before the mark-to-market adjustments for our interest rate swaps, interest expense decreased $43 million to $168 million in 2016 from $211 million in 2015 as a result of a reduction in total outstanding indebtedness and a lower weighted average interest rate. Mark-to-market adjustments for our interest rate swaps resulted in losses of $6 million in 2016 compared to losses of $20 million in 2015; and |
• | the absence in 2016 of a $48 million loss on the early extinguishment of debt related to transactions in 2015. |
Equity in earnings of unconsolidated entities declined $4 million primarily due to a $6 million decrease in earnings from PHH Home Loans.
During the fourth quarter of 2015, the Company began a business optimization initiative that focuses on maximizing the efficiency and effectiveness of the cost structure of each of the Company's business units. The action is designed to improve client service levels across each of the business units while enhancing the Company's profitability and incremental margins. The plan focuses on several key areas of opportunity which include process improvement efficiencies, office footprint optimization, leveraging technology and media spend, centralized procurement, outsourcing administrative services and organizational design. The Company incurred restructuring charges of $10 million in the fourth quarter of 2015 and $39 million in 2016 which consisted of personnel-related costs, facility-related costs and other restructuring-related costs. See Note 11, "Restructuring Costs", in the consolidated financial statements for additional information.
The Company's provision for income taxes was $144 million for the year ended December 31, 2016 compared to $110 million for the year ended December 31, 2015. Our effective tax rate was 40% and 37% for the year ended December 31, 2016 and December 31, 2015, respectively. The effective tax rate was positively impacted in 2016, by a reduction in valuation allowance related to our foreign tax credits, offset by an increase in our deferred tax liabilities, primarily driven by stock-based compensation shortfalls and changes to U.S. tax legislation and was positively impacted in 2015, primarily by a reduction in our deferred tax liabilities, driven by changes to state tax legislation.
Following is a more detailed discussion of the results of each of our reportable segments for the years ended December 31, 2016 and 2015:
Revenues (a) | % Change | EBITDA (b) | % Change | Margin | ||||||||||||||||||||||||||
2016 | 2015 | 2016 | 2015 | 2016 | 2015 | Change | ||||||||||||||||||||||||
RFG | $ | 781 | $ | 755 | 3 | % | $ | 516 | $ | 495 | 4 | % | 66 | % | 66 | % | — | |||||||||||||
NRT | 4,344 | 4,344 | — | 137 | 199 | (31 | ) | 3 | 5 | (2 | ) | |||||||||||||||||||
Cartus | 405 | 415 | (2 | ) | 96 | 105 | (9 | ) | 24 | 25 | (1 | ) | ||||||||||||||||||
TRG | 573 | 487 | 18 | 62 | 48 | 29 | 11 | 10 | 1 | |||||||||||||||||||||
Corporate and Other | (293 | ) | (295 | ) | * | (78 | ) | (121 | ) | * | ||||||||||||||||||||
Total Company | $ | 5,810 | $ | 5,706 | 2 | % | $ | 733 | $ | 726 | 1 | % | 13 | % | 13 | % | — | |||||||||||||
Less: Depreciation and amortization | 202 | 201 | ||||||||||||||||||||||||||||
Interest expense, net | 174 | 231 | ||||||||||||||||||||||||||||
Income tax expense | 144 | 110 | ||||||||||||||||||||||||||||
Net income attributable to Realogy Holdings and Realogy Group | $ | 213 | $ | 184 | ||||||||||||||||||||||||||
64
_______________
* | not meaningful |
(a) | Includes the elimination of transactions between segments, which consists of intercompany royalties and marketing fees paid by NRT of $293 million and $295 million during the year ended December 31, 2016 and 2015, respectively. |
(b) | EBITDA for the year ended December 31, 2016 includes $39 million of restructuring costs, partially offset by a net benefit of $2 million for former parent legacy items. EBITDA for the year ended December 31, 2015 includes $48 million related to the loss on early extinguishment of debt and $10 million of restructuring costs, partially offset by a net benefit of $15 million for former parent legacy items. |
EBITDA before restructuring charges was $772 million for the year ended December 31, 2016 compared to $736 million for the year ended December 31, 2015. EBITDA before restructuring charges by reportable segment for the year ended December 31, 2016 was as follows:
Year Ended December 31, | ||||||||||||||||||
2016 | 2015 | |||||||||||||||||
EBITDA | Restructuring Charges | EBITDA Before Restructuring | EBITDA Before Restructuring (a) | % Change | ||||||||||||||
RFG | $ | 516 | $ | 4 | $ | 520 | $ | 495 | 5 | % | ||||||||
NRT | 137 | 22 | 159 | 204 | (22 | ) | ||||||||||||
Cartus | 96 | 4 | 100 | 106 | (6 | ) | ||||||||||||
TRG | 62 | 1 | 63 | 48 | 31 | |||||||||||||
Corporate and Other | (78 | ) | 8 | (70 | ) | (117 | ) | * | ||||||||||
Total Company | $ | 733 | $ | 39 | $ | 772 | $ | 736 | 5 | % | ||||||||
_______________
* | not meaningful |
(a) | Excludes $10 million of restructuring charges incurred in 2015 as follows: $5 million at NRT, $1 million at Cartus and $4 million at Corporate and Other. |
As described in the aforementioned table, EBITDA margin for "Total Company" expressed as a percentage of revenues remained flat at 13% for the year ended December 31, 2016 compared to 2015. On a segment basis, RFG's margin remained flat at 66%; however, it increased 1 percentage point to 67% excluding restructuring charges. NRT's margin declined to 3% from 5% primarily due to a decrease in revenue; however, it decreased 1 percentage point to 4% excluding restructuring charges. Cartus' margin decreased 1 percentage point to 24% from 25%; however, excluding restructuring charges, Cartus' margin decreased 1 percentage point to 25% from 26% as a result of a decrease in non-affinity referral revenue due to lower broker-to-broker volume. TRG's margin increased 1 percentage point to 11% from 10% due to an increase in resale and refinance volume.
Corporate and Other EBITDA for the year ended December 31, 2016 improved by $43 million to negative $78 million primarily due to:
• | the absence of $48 million for the loss on early extinguishment of debt incurred in 2015; |
• | the absence of $6 million of certain transaction costs associated with the acquisition of Coldwell Banker United and the settlement of a legal matter in 2015; and |
• | a $4 million decrease in employee-related costs; |
partially offset by:
• | a $13 million decrease in the net benefit for former parent legacy items as a result of a tax liability reduction in 2015; and |
• | a $4 million increase in restructuring charges related to the Company's business optimization plan. |
Real Estate Franchise Services (RFG)
Revenues increased $26 million to $781 million and EBITDA increased $21 million to $516 million for the year ended December 31, 2016 compared with 2015.
The increase in revenue was primarily driven by a $19 million increase in third-party domestic franchisee royalty revenue due to a 3% increase in both the average homesale price and in the number of homesale transactions. The increase in revenue was also due to a $6 million increase in other revenue primarily related to marketing-related activities and the
65
timing of brand conferences, and a $3 million increase in international revenues. The increase in revenue was partially offset by a $3 million increase in non-standard incentives amortization during the year ended December 31, 2016 compared with 2015.
Intercompany royalties received from NRT were $282 million and $284 million during the years ended December 31, 2016 and 2015, respectively, and are eliminated in consolidation. See "Company Owned Real Estate Brokerage Services" for a discussion of the drivers related to intercompany royalties paid to RFG.
The $21 million increase in EBITDA was principally due to the $26 million increase in revenues discussed above, partially offset by $4 million of restructuring costs related to the Company's business optimization plan.
Company Owned Real Estate Brokerage Services (NRT)
Revenues remained flat at $4,344 million and EBITDA declined $62 million to $137 million for the year ended December 31, 2016 compared with 2015.
Revenues remained flat as a result of a $109 million decrease primarily due to lower commission income earned on homesale transactions by our existing brokerage operations, offset by a $109 million increase in revenue primarily due to commission income earned from acquisitions. Revenues were negatively impacted by the slowing of activity in the high-end markets served by NRT, the cumulative impact of market share attrition, and inventory issues in the mid and lower priced homes in many of the markets served by NRT.
EBITDA decreased $62 million primarily due to:
• | $22 million in restructuring costs related to the Company's business optimization plan in 2016 compared to $5 million in 2015; |
• | a $17 million increase in employee-related costs attributable to acquisitions; |
• | a $14 million increase in commission expenses paid to independent sales agents from $2,931 million in 2015 to $2,945 million in 2016. The increase in commission expense is due to a $65 million increase related to acquisitions, partially offset by a decrease of $51 million by our existing brokerage operations; |
• | a $6 million increase in occupancy costs related to acquisitions; |
• | a $6 million decrease in equity earnings related to our investment in PHH Home Loans; and |
• | a $4 million increase in marketing expenses primarily related to acquisitions. |
These decreases were partially offset by:
• | a $2 million decrease in royalties paid to RFG from $284 million in 2015 to $282 million in 2016. |
Relocation Services (Cartus)
Revenues decreased $10 million to $405 million and EBITDA decreased $9 million to $96 million for the year ended December 31, 2016 compared with 2015.
Revenues decreased $10 million as a result of a $17 million decrease in non-affinity referral revenue due to lower broker-to-broker referrals, the absence of a large group move which occurred in 2015 and lower relocation referral volume in 2016 compared to 2015, partially offset by higher average fees. The decrease was partially offset by a $7 million increase in affinity referrals due to higher transaction volume and average fees.
EBITDA decreased $9 million as a result of the $10 million decrease in revenues discussed above as well as $4 million in restructuring costs related to the Company's business optimization plan. These decreases were partially offset by a $5 million net positive impact from foreign currency exchange rates.
Title and Settlement Services (TRG)
Revenues increased $86 million to $573 million and EBITDA increased $14 million to $62 million for the year ended December 31, 2016 compared with 2015.
The increase in revenues was due to a $46 million increase in resale revenue driven by a 17% increase in resale title and closing units of which acquisitions contributed 14 percentage points, as well as a $15 million increase in refinancing revenue driven by a 32% increase in refinancing title and closing units of which acquisitions contributed 11 percentage
66
points. Underwriter and other revenue increased $18 million and $8 million, respectively, due to the volume increases discussed above.
EBITDA increased $14 million as a result of the $86 million increase in revenues discussed above, partially offset by an increase of $39 million in variable operating costs and a $32 million increase in employee-related costs primarily related to acquisitions.
FINANCIAL CONDITION, LIQUIDITY AND CAPITAL RESOURCES
Financial Condition
December 31, 2017 | December 31, 2016 | Change | |||||||||
Total assets | $ | 7,337 | $ | 7,421 | $ | (84 | ) | ||||
Total liabilities | 4,715 | 4,952 | (237 | ) | |||||||
Total equity | 2,622 | 2,469 | 153 | ||||||||
For the year ended December 31, 2017, total assets decreased $84 million primarily due to a $96 million net decrease in franchise agreements and other amortizable intangible assets primarily attributable to amortization, a $47 million decrease in cash and cash equivalents and a $21 million decrease in relocation receivables due to lower volume. These decreases were partially offset by a $36 million increase in other current and non-current assets primarily due to agent recruiting and retention and higher prepaid expenses, a $22 million increase in property and equipment and a $20 million increase in goodwill from acquisitions.
Total liabilities decreased $237 million due to a $159 million decrease in corporate debt primarily due to a $115 million reduction in borrowings under the Revolving Credit Facility and amortization payments on the term loan facilities, a $62 million decrease in deferred tax liabilities due to the 2017 Tax Act and a change in our reserve for uncertain tax positions, partially offset by current operating results, a $36 million decrease in other non-current liabilities due to the impact of interest rate swaps and reduced liabilities as a result of cash paid for contingent consideration from acquisitions, and an $11 million decrease in securitization obligations driven by lower relocation volume. These decreases were partially offset by an $15 million increase in accrued expenses and other current liabilities and a $16 million increase in accounts payable.
Total equity increased $153 million primarily due to net income of $431 million, partially offset by a $280 million decrease in additional paid in capital during the year ended December 31, 2017. The decrease in additional paid in capital primarily relates to the Company's repurchase of $280 million of common stock and $49 million of dividend payments, partially offset by stock-based compensation activity of $49 million.
Liquidity and Capital Resources
Our primary liquidity needs have been to service our debt and finance our working capital and capital expenditures, which we have historically satisfied with cash flows from operations and funds available under our revolving credit facilities and securitization facilities. In February 2018, the Company increased the borrowing capacity under its Revolving Credit Facility from $1,050 million to $1,400 million and extended the maturities of the Revolving Credit Facility, Term Loan B and Term Loan A.
We intend to use future cash flow primarily to acquire stock under our share repurchase program, pay dividends, fund acquisitions, enter into strategic relationships and reduce indebtedness. In February 2018, the Company's Board of Directors authorized a new share repurchase program of up to $350 million of the Company's common stock which is incremental to the remaining authorization under the share repurchase program authorized in 2017. Repurchases under these programs may be made at management's discretion from time to time on the open market, pursuant to Rule 10b5-1 trading plans or privately negotiated transactions. The size and timing of these repurchases will depend on price, market and economic conditions, legal and contractual requirements and other factors. The repurchase programs have no time limit and may be suspended or discontinued at any time.
As of December 31, 2017, the Company had repurchased and retired 16.5 million shares of common stock for an aggregate of $475 million under the 2016 and 2017 share repurchase programs at a weighted average market price of $28.77 per share. As of December 31, 2017, approximately $100 million of authorization remains available for repurchase of shares under the 2017 share repurchase program.
During the period January 1, 2018 to February 23, 2018, we repurchased an additional 1.5 million shares under the plan at a weighted average market price of $26.82 per share. Giving effect to these repurchases, we had approximately $60 million of remaining capacity authorized under the February 2017 share repurchase program as of February 23, 2018.
Beginning in August 2016, we initiated and paid a quarterly cash dividend of $0.09 per share and paid $0.09 per share cash dividends in every subsequent quarter. In 2017, we returned $49 million to stockholders through the payment of cash dividends. The declaration and payment of any future dividend will be subject to the discretion of the Board of Directors and will depend on a variety of factors, including the Company’s financial condition and results of operations, contractual restrictions (including restrictive covenants contained in the Company’s credit agreement, and the indenture governing the Company’s outstanding debt securities), capital requirements and other factors that the Board of Directors deems relevant.
In April 2007, the Company established a standby irrevocable letter of credit for the benefit of Avis Budget Group in accordance with the Separation and Distribution Agreement. The letter of credit was utilized to support the Company’s payment obligations with respect to its share of Cendant contingent and other corporate liabilities. In September 2017, the standby irrevocable letter of credit was terminated pursuant to the governing agreement as the aggregate value of the Cendant contingent and other liabilities fell below $30 million with the resolution of a Cendant legacy tax matter in the third quarter of 2017, reducing the capacity and outstanding letters of credit under the Unsecured Letter of Credit Facility. At December 31, 2017, the aggregate value of the former parent contingent liabilities was $18 million.
We may also from time to time seek to repurchase our outstanding notes through tender offers, open market purchases, privately negotiated transactions or otherwise. Such repurchases, if any, will depend on prevailing market conditions, our liquidity requirements, contractual restrictions and other factors.
We are currently experiencing growth in the residential real estate market; however, if the residential real estate market or the economy as a whole does not continue to improve or weakens, our business, financial condition and liquidity may be materially adversely affected, including our ability to access capital and grow our business.
Historically, operating results and revenues for all of our businesses have been strongest in the second and third quarters of the calendar year. A significant portion of the expenses we incur in our real estate brokerage operations are related to marketing activities and commissions and therefore are variable. However, many of our other expenses, such as interest payments, facilities costs and certain personnel-related costs, are fixed and cannot be reduced during a seasonal slowdown. Consequently, our debt balances are generally at their highest levels at or around the end of the first quarter of every year.
Our liquidity position has significantly improved but continues to be impacted by our remaining interest expense and would be adversely impacted by stagnation or a downturn of the residential real estate market and a significant increase in LIBOR or ABR.
We will continue to evaluate potential refinancing and financing transactions. There can be no assurance as to which, if any, of these alternatives we may pursue as the choice of any alternative will depend upon numerous factors such as market conditions, our financial performance and the limitations applicable to such transactions under our existing financing agreements and the consents we may need to obtain under the relevant documents. There can be no assurance that financing will be available to us on acceptable terms or at all.
Cash Flows
Year ended December 31, 2017 vs. Year ended December 31, 2016
At December 31, 2017, we had $234 million of cash, cash equivalents and restricted cash, a decrease of $47 million compared to the balance of $281 million at December 31, 2016. The following table summarizes our cash flows for the years ended December 31, 2017 and 2016:
Year Ended December 31, | |||||||||||
2017 | 2016 | Change | |||||||||
Cash provided by (used in): | |||||||||||
Operating activities | $ | 667 | $ | 586 | $ | 81 | |||||
Investing activities | (146 | ) | (191 | ) | 45 | ||||||
Financing activities | (570 | ) | (534 | ) | (36 | ) | |||||
Effects of change in exchange rates on cash, cash equivalents and restricted cash | 2 | (3 | ) | 5 | |||||||
Net change in cash, cash equivalents and restricted cash | $ | (47 | ) | $ | (142 | ) | $ | 95 | |||
67
For the year ended December 31, 2017, $81 million more cash was provided by operating activities compared to the same period in 2016. The change was principally due to $41 million more cash dividends received from PHH Home Loans, $26 million less cash used for accounts payable, accrued expenses and other liabilities and $19 million of additional cash provided by operating results.
For the year ended December 31, 2017, we used $45 million less cash for investing activities compared to the same period in 2016 primarily due to $77 million less cash used for acquisition related payments, $24 million more cash provided by other investing activities and $11 million more cash received from PHH Home Loans, partially offset by $55 million of cash used for our investment in Guaranteed Rate Affinity and $12 million more cash used for property and equipment additions.
For the year ended December 31, 2017, $570 million of cash was used in financing activities compared to $534 million of cash used during the same period in 2016. For the year ended December 31, 2017, $570 million of cash was used for:
• | $280 million for the repurchase of our common stock; |
• | $130 million net repayment of borrowings under the Revolving Credit Facility; |
• | $49 million of dividend payments; |
• | $42 million of quarterly amortization payments on the term loan facilities; |
• | $26 million of other financing payments partially related to capital leases and interest rate swaps; |
• | $22 million for payments of contingent consideration; |
• | $11 million net decrease in securitization borrowings; |
• | $11 million of tax payments related to net share settlement for stock-based compensation; and |
• | $6 million of debt issuance costs; |
partially offset by,
• | $8 million proceeds from exercise of stock options. |
For the year ended December 31, 2016, $534 million of cash was used for:
• | the repayment of $758 million to reduce the Term Loan B facility; |
• | the repayment of $500 million to retire 3.375% Senior Notes at maturity; |
• | $195 million for the repurchase of our common stock; |
• | $41 million of quarterly amortization payments on the term loan facilities; |
• | $40 million net decrease in securitization borrowings; |
• | $34 million of other financing payments partially related to capital leases and interest rate swaps; |
• | $26 million of dividend payments; |
• | $25 million for payments of contingent consideration; |
• | $16 million of debt issuance costs; and |
• | $6 million of tax payments related to net share settlement for stock-based compensation; |
partially offset by,
• | $750 million of proceeds from the issuance of $250 million of 5.25% Senior Notes and $500 million of 4.875% Senior Notes; and |
• | $355 million proceeds from issuance of the Term Loan A-1 facility. |
68
Year ended December 31, 2016 vs. Year ended December 31, 2015
At December 31, 2016, we had $281 million of cash, cash equivalents and restricted cash, a decrease of $142 million compared to the balance of $423 million at December 31, 2015. The following table summarizes our cash flows for the years ended December 31, 2016 and 2015:
Year Ended December 31, | |||||||||||
2016 | 2015 | Change | |||||||||
Cash provided by (used in): | |||||||||||
Operating activities | $ | 586 | $ | 588 | $ | (2 | ) | ||||
Investing activities | (191 | ) | (211 | ) | 20 | ||||||
Financing activities | (534 | ) | (275 | ) | (259 | ) | |||||
Effects of change in exchange rates on cash, cash equivalents and restricted cash | (3 | ) | (2 | ) | (1 | ) | |||||
Net change in cash, cash equivalents and restricted cash | $ | (142 | ) | $ | 100 | $ | (242 | ) | |||
For the year ended December 31, 2016, $2 million less cash was provided by operating activities compared to 2015. The change was principally due to $25 million more cash used for accounts payable, accrued expenses and other liabilities, $6 million more cash used for other operating activities and $2 million less cash provided by operating results, partially offset by $31 million more cash provided by the net change in relocation and trade receivables.
For the year ended December 31, 2016, we used $20 million less cash for investing activities compared to 2015 primarily due to $32 million less cash used for acquisition related payments, partially offset by $9 million more cash used for other investing activities.
For the year ended December 31, 2016, $534 million of cash was used in financing activities compared to $275 million of cash used during 2015. For the year ended December 31, 2016, $534 million of cash was used for:
• | the repayment of $758 million to reduce the Term Loan B facility; |
• | the repayment of $500 million to retire 3.375% Senior Notes at maturity; |
• | $195 million for the repurchase of our common stock; |
• | $41 million of quarterly amortization payments on the term loan facilities; |
• | $40 million net decrease in securitization borrowings; |
• | $34 million of other financing payments partially related to capital leases and interest rate swaps; |
• | $26 million of dividend payments; |
• | $25 million for payments of contingent consideration; |
• | $16 million of debt issuance costs; and |
• | $6 million of tax payments related to net share settlement for stock-based compensation; |
partially offset by,
• | $750 million of proceeds from the issuance of $250 million of 5.25% Senior Notes and $500 million of 4.875% Senior Notes; and |
• | $355 million proceeds from issuance of the Term Loan A-1 facility. |
For the year ended December 31, 2015, $275 million of cash was used for:
• | $789 million of cash paid for the redemption of all of the outstanding $593 million of First Lien Notes and $196 million of First and a Half Lien Notes; |
• | $39 million of cash paid for fees associated with early extinguishment of debt; |
• | $24 million of other financing payments partially related to interest rate swaps and capital leases; |
• | $21 million net decrease in securitization borrowings; |
• | $19 million of quarterly amortization payments on the Term Loan B Facility; |
• | payment of $10 million of debt transaction costs related to the Revolving Credit Facility amendment and issuance of the new Term Loan A Facility; |
• | $7 million for payments of contingent consideration; and |
• | $6 million of tax payments related to net share settlement for stock-based compensation; |
69
partially offset by,
• | $435 million of proceeds from the issuance of the Term Loan A Facility; and |
• | $200 million of incremental borrowings under the Revolving Credit Facility. |
Financial Obligations
Indebtedness Table
As of December 31, 2017, the Company’s borrowing arrangements were as follows:
Interest Rate | Expiration Date | Principal Amount | Unamortized Discount and Debt Issuance Costs | Net Amount | ||||||||||||
Senior Secured Credit Facility: | ||||||||||||||||
Revolving Credit Facility (1) | (2) | October 2020 | $ | 70 | $ * | $ | 70 | |||||||||
Term Loan B | (3) | July 2022 | 1,083 | 20 | 1,063 | |||||||||||
Term Loan A Facility: | ||||||||||||||||
Term Loan A | (4) | October 2020 | 391 | 1 | 390 | |||||||||||
Term Loan A-1 | (5) | July 2021 | 342 | 3 | 339 | |||||||||||
Senior Notes | 4.50 | % | April 2019 | 450 | 6 | 444 | ||||||||||
Senior Notes | 5.25 | % | December 2021 | 550 | 4 | 546 | ||||||||||
Senior Notes | 4.875 | % | June 2023 | 500 | 4 | 496 | ||||||||||
Securitization obligations: (6) | ||||||||||||||||
Apple Ridge Funding LLC (7) | June 2018 | 181 | * | 181 | ||||||||||||
Cartus Financing Limited (8) | August 2018 | 13 | * | 13 | ||||||||||||
Total (9) | $ | 3,580 | $ | 38 | $ | 3,542 | ||||||||||
* | The debt issuance costs related to our Revolving Credit Facility and securitization obligations are classified as a deferred financing asset within other assets. |
(1) | As of December 31, 2017, the Company had $1,050 million of borrowing capacity under its Revolving Credit Facility leaving $980 million of available capacity. The Revolving Credit Facility expires in October 2020, but is classified on the balance sheet as current due to the revolving nature of the facility. |
(2) | Interest rates with respect to revolving loans under the Senior Secured Credit Facility at December 31, 2017 were based on, at the Company's option, (a) adjusted LIBOR plus an additional margin or (b) ABR plus an additional margin, in each case subject to adjustment based on the then current senior secured leverage ratio. Based on the previous quarter senior secured leverage ratio, the LIBOR margin was 2.00% and the ABR margin was 1.00% for the three months ended December 31, 2017. |
(3) | The Term Loan B provided for quarterly amortization payments totaling 1% per annum of the original principal amount. The interest rate with respect to term loans under the Term Loan B was based on, at the Company’s option, (a) adjusted LIBOR plus 2.25% (with a LIBOR floor of 0.75%) or (b) JPMorgan Chase Bank, N.A.’s prime rate ("ABR") plus 1.25% (with an ABR floor of 1.75%). |
(4) | The Term Loan A provided for quarterly amortization payments, which commenced March 31, 2016, totaling per annum 5%, 5%, 7.5%, 10.0% and 12.5% of the original principal amount of the Term Loan A in 2016, 2017, 2018, 2019 and 2020, respectively. The interest rates with respect to term loans under the Term Loan A were based on, at the Company's option, (a) adjusted LIBOR plus an additional margin or (b) ABR plus an additional margin, in each case subject to adjustment based on the then current senior secured leverage ratio. Based on the previous quarter senior secured leverage ratio, the LIBOR margin was 2.00% and the ABR margin was 1.00% for the three months ended December 31, 2017. |
(5) | The Term Loan A-1 provided for quarterly amortization payments, which commenced on September 30, 2016, totaling per annum 2.5%, 2.5%, 5%, 7.5% and 10.0% of the original principal amount of the Term Loan A-1, with the last amortization payment made on June 30, 2021. The interest rates with respect to term loans under the Term Loan A-1 were based on, at the Company's option, (a) adjusted LIBOR plus an additional margin or (b) ABR plus an additional margin, in each case subject to adjustment based on the then current senior secured leverage ratio. Based on the previous quarter senior secured leverage ratio, the LIBOR margin was 2.00% and the ABR margin was 1.00% for the three months ended December 31, 2017. |
(6) | Available capacity is subject to maintaining sufficient relocation related assets to collateralize these securitization obligations. |
(7) | In November 2017, the capacity of the Apple Ridge facility was reduced from $325 million to $250 million. As of December 31, 2017, the Company had $250 million of borrowing capacity under the Apple Ridge Funding LLC securitization program leaving $69 million of available capacity. |
70
(8) | Consists of a £10 million revolving loan facility and a £5 million working capital facility. As of December 31, 2017, the Company had $20 million of borrowing capacity under the Cartus Financing Limited securitization program leaving $7 million of available capacity. |
(9) | Not included in this table is the Company's Unsecured Letter of Credit Facility which had a capacity of $74 million with $69 million utilized at a weighted average rate of 3.24% at December 31, 2017. |
Refinancing
In February 2018, the Company completed debt transactions which:
• | amended its revolving credit facility, by increasing the capacity from $1,050 million to $1,400 million and extending the maturity date from October 2020 to February 2023 (the "New Revolving Credit Facility"); |
• | refinanced the existing aggregate $733 million Term Loan A and Term Loan A-1 tranches due October 2020 and July 2021, respectively, into a new single tranche of $750 million Term Loan A due February 2023 (which included incremental borrowings of $17 million) (the "New Term Loan A"); and |
• | refinanced the existing $1,083 million Term Loan B due July 2022 with a new Term Loan B issued at par in the amount of $1,080 million and with a maturity date in February 2025 (the "New Term Loan B"). |
Pro Forma Indebtedness Table
The following table sets forth the Company's borrowing arrangements as of December 31, 2017 on a pro forma basis giving effect to the debt transactions described above (the "Refinancing"):
_______________
Interest Rate | Expiration Date | Principal Amount | |||||
Senior Secured Credit Facility: | |||||||
New Revolving Credit Facility (1) | (2) | February 2023 | $ | 70 | |||
New Term Loan B | (3) | February 2025 | 1,080 | ||||
Term Loan A Facility: | |||||||
New Term Loan A | (4) | February 2023 | 750 | ||||
Senior Notes | 4.50% | April 2019 | 450 | ||||
Senior Notes | 5.25% | December 2021 | 550 | ||||
Senior Notes | 4.875% | June 2023 | 500 | ||||
Securitization obligations: | |||||||
Apple Ridge Funding LLC | June 2018 | 181 | |||||
Cartus Financing Limited | August 2018 | 13 | |||||
Total | $ | 3,594 | |||||
(1) | Giving effect to the Refinancing, the Company had $1,400 million of borrowing capacity under its New Revolving Credit Facility. On February 23, 2018, the Company had $242 million in outstanding borrowings under the New Revolving Credit Facility, leaving $1,158 million of available capacity. |
(2) | Interest rates with respect to revolving loans under the Senior Secured Credit Facility continue to be based on, at the Company's option, (a) adjusted LIBOR plus an additional margin or (b) ABR plus an additional margin, in each case subject to adjustment based on the then current senior secured leverage ratio under the Senior Secured Credit Facility, however the pricing grid for the New Revolving Credit Facility has been expanded to include a new pricing adjustment where if the senior secured leverage ratio is less 2.00 to 1.00, the applicable LIBOR margin is 1.75% and the ABR margin is 0.75%. |
(3) | The New Term Loan B continues to provide for quarterly amortization payments totaling 1% per annum of the original principal amount. The interest rate with respect to term loans under the New Term Loan B remains unchanged and is based on, at the Company’s option, (a) adjusted LIBOR plus 2.25% (with a LIBOR floor of 0.75%) or (b) JPMorgan Chase Bank, N.A.’s prime rate ("ABR") plus 1.25% (with an ABR floor of 1.75%). |
(4) | The New Term Loan A provides for quarterly amortization payments on the last day of each quarter, which commence June 30, 2018, totaling per annum 2.5%, 2.5%, 5.0%, 7.5% and 10.0% of the original principal amount of the New Term Loan A, with the balance of the New Term Loan A due in full on February 8, 2023. The interest rates with respect to term loans under the New Term Loan A are the same that had been in place under Term Loan A-1 and are based on, at the Company's option, (a) adjusted LIBOR plus an additional margin or (b) ABR plus an additional margin, in each case subject to adjustment based on the then current senior secured leverage ratio. |
71
See Note 8, "Short and Long-Term Debt", in the consolidated financial statements, for additional information on the Company's indebtedness, and Note 19, "Subsequent Events", in the consolidated financial statements, for a detailed description of the Refinancing.
Covenants under the Senior Secured Credit Facility, Term Loan A Facility and Indentures
The Senior Secured Credit Facility, Term Loan A Facility, the Unsecured Letter of Credit Facility and the indentures governing the Unsecured Notes contain various covenants that limit (subject to certain exceptions) Realogy Group’s ability to, among other things:
• | incur or guarantee additional debt or issue disqualified stock or preferred stock; |
• | pay dividends or make distributions to Realogy Group’s stockholders, including Realogy Holdings; |
• | repurchase or redeem capital stock; |
• | make loans, investments or acquisitions; |
• | incur restrictions on the ability of certain of Realogy Group's subsidiaries to pay dividends or to make other payments to Realogy Group; |
• | enter into transactions with affiliates; |
• | create liens; |
• | merge or consolidate with other companies or transfer all or substantially all of Realogy Group's and its material subsidiaries' assets; |
• | transfer or sell assets, including capital stock of subsidiaries; and |
• | prepay, redeem or repurchase subordinated indebtedness. |
As a result of the covenants to which we remain subject, we are limited in the manner in which we conduct our business and we may be unable to engage in favorable business activities or finance future operations or capital needs. In addition, the Senior Secured Credit Facility and Term Loan A Facility require us to maintain a senior secured leverage ratio.
The senior secured leverage ratio is tested quarterly and may not exceed 4.75 to 1.00. The senior secured leverage ratio is measured by dividing Realogy Group's total senior secured net debt by the trailing twelve-month EBITDA calculated on a Pro Forma Basis, as those terms are defined in the senior secured credit facilities. Total senior secured net debt does not include unsecured indebtedness, including the Unsecured Notes, or the securitization obligations. EBITDA calculated on a Pro Forma Basis, as defined in the senior secured credit facilities, includes adjustments to EBITDA for restructuring costs, former parent legacy cost (benefit) items, net, loss on the early extinguishment of debt, non-cash charges and incremental securitization interest costs, as well as pro forma cost savings for restructuring initiatives, the pro forma effect of business optimization initiatives and the pro forma effect of acquisitions and new franchisees, in each case calculated as of the beginning of the twelve-month period. The Company was in compliance with the senior secured leverage ratio covenant at December 31, 2017.
See Note 8, "Short and Long-Term Debt—Senior Secured Credit Facility" and "Short and Long-Term Debt—Term Loan A Facility" to the Consolidated Financial Statements for additional information.
Non-GAAP Financial Measures
The SEC has adopted rules to regulate the use in filings with the SEC and in public disclosures of "non-GAAP financial measures," such as EBITDA and Operating EBITDA. These measures are derived on the basis of methodologies other than in accordance with GAAP.
EBITDA is defined by us as net income (loss) before depreciation and amortization, interest expense, net (other than relocation services interest for securitization assets and securitization obligations) and income taxes and is our primary non-GAAP measure. Operating EBITDA is defined by us as EBITDA before restructuring, loss on the early extinguishment of debt and former parent legacy items and is used as a supplementary financial measure.
We present EBITDA and Operating EBITDA because we believe they are useful as supplemental measures in evaluating the performance of our operating businesses and provide greater transparency into our results of operations. Our management, including our chief operating decision maker, uses EBITDA as a factor in evaluating the performance of our business. EBITDA and Operating EBITDA should not be considered in isolation or as a substitute for net income or other statement of operations data prepared in accordance with GAAP.
72
We believe EBITDA facilitates company-to-company operating performance comparisons by backing out potential differences caused by variations in capital structures (affecting net interest expense), taxation, the age and book depreciation of facilities (affecting relative depreciation expense) and the amortization of intangibles, which may vary for different companies for reasons unrelated to operating performance. We further believe that EBITDA is frequently used by securities analysts, investors and other interested parties in their evaluation of companies, many of which present an EBITDA measure when reporting their results.
EBITDA and Operating EBITDA have limitations as analytical tools, and you should not consider EBITDA and Operating EBITDA either in isolation or as substitutes for analyzing our results as reported under GAAP. Some of these limitations are:
• | these measures do not reflect changes in, or cash required for, our working capital needs; |
• | these measures do not reflect our interest expense (except for interest related to our securitization obligations), or the cash requirements necessary to service interest or principal payments on our debt; |
• | these measures do not reflect our income tax expense or the cash requirements to pay our taxes; |
• | these measures do not reflect historical cash expenditures or future requirements for capital expenditures or contractual commitments; |
• | although depreciation and amortization are non-cash charges, the assets being depreciated and amortized will often require replacement in the future, and these measures do not reflect any cash requirements for such replacements; and |
• | other companies may calculate these measures differently so they may not be comparable. |
Set forth in the table below is a reconciliation of net income attributable to Realogy to EBITDA and Operating EBITDA for the years ended December 31, 2017, 2016 and 2015:
For the Year Ended December 31 | |||||||||||
2017 | 2016 | 2015 | |||||||||
Net income attributable to Realogy | $ | 431 | $ | 213 | $ | 184 | |||||
Income tax (benefit) expense | (65 | ) | 144 | 110 | |||||||
Income before income taxes | 366 | 357 | 294 | ||||||||
Interest expense, net | 158 | 174 | 231 | ||||||||
Depreciation and amortization (a) | 201 | 202 | 201 | ||||||||
EBITDA | 725 | 733 | 726 | ||||||||
EBITDA adjustments: | |||||||||||
Restructuring costs | 12 | 39 | 10 | ||||||||
Former parent legacy benefit, net | (10 | ) | (2 | ) | (15 | ) | |||||
Loss on the early extinguishment of debt | 5 | — | 48 | ||||||||
Operating EBITDA | $ | 732 | $ | 770 | $ | 769 | |||||
_______________
(a) | Depreciation and amortization for the year ended December 31, 2017 includes $3 million of amortization expense related to Guaranteed Rate Affinity's purchase accounting included in the "Equity in earnings of unconsolidated entities" line on the Consolidated Statement of Operations. |
73
Contractual Obligations
The following table summarizes our future contractual obligations as of December 31, 2017:
2018 | 2019 | 2020 | 2021 | 2022 | Thereafter | Total | |||||||||||||||||||||
Revolving Credit Facility (a) | $ | — | $ | — | $ | 70 | $ | — | $ | — | $ | — | $ | 70 | |||||||||||||
Term Loan B (b) | 11 | 11 | 11 | 11 | 1,039 | — | 1,083 | ||||||||||||||||||||
Term Loan A (c) | 33 | 44 | 314 | — | — | — | 391 | ||||||||||||||||||||
Term Loan A-1 (d) | 13 | 22 | 31 | 276 | — | — | 342 | ||||||||||||||||||||
4.50% Senior Notes | — | 450 | — | — | — | — | 450 | ||||||||||||||||||||
5.25% Senior Notes | — | — | — | 550 | — | — | 550 | ||||||||||||||||||||
4.875% Senior Notes | — | — | — | — | — | 500 | 500 | ||||||||||||||||||||
Interest payments on long-term debt (e) | 158 | 141 | 120 | 99 | 47 | 12 | 577 | ||||||||||||||||||||
Securitized obligations (f) | 194 | — | — | — | — | — | 194 | ||||||||||||||||||||
Operating leases (g) | 163 | 142 | 116 | 91 | 72 | 196 | 780 | ||||||||||||||||||||
Capital leases (including imputed interest) | 14 | 9 | 5 | 3 | — | — | 31 | ||||||||||||||||||||
Purchase commitments (h) | 57 | 23 | 15 | 13 | 18 | 222 | 348 | ||||||||||||||||||||
Total (i)(j) | $ | 643 | $ | 842 | $ | 682 | $ | 1,043 | $ | 1,176 | $ | 930 | $ | 5,316 | |||||||||||||
_______________
(a) | The Revolving Credit Facility expires in October 2020; however outstanding borrowings under this facility are classified on the balance sheet as current due to the revolving nature of the facility. |
(b) | The Company’s Term Loan B has quarterly amortization payments totaling 1% per annum of the $1,100 million original principal amount of the Term Loan B issued under the Amended and Restated Credit Agreement with the balance payable in July 2022. |
(c) | The Company’s Term Loan A has quarterly amortization payments, which commenced March 31, 2016, totaling per annum 5%, 5%, 7.5%, 10.0% and 12.5% of the $435 million original principal amount of the Term Loan A in 2017, 2018, 2019, 2020 and 2021, respectively, with the balance payable in October 2020. |
(d) | The Company’s Term Loan A-1 has quarterly amortization payments, which commenced September 30, 2016, totaling per annum 2.5%, 2.5%, 5%, 7.5% and 10.0% of the $355 million original principal amount of the Term Loan A-1, with the last amortization payment made on June 30, 2021. |
(e) | Interest payments are based on applicable interest rates in effect at December 31, 2017 and include the impact of derivative instruments designed to fix the interest rate of a portion of the Company's variable rate debt. |
(f) | The Apple Ridge securitization facility expires in June 2018 and the Cartus Financing Limited agreements expire in August 2018. |
(g) | The operating lease amounts included in the above table do not include variable costs such as maintenance, insurance and real estate taxes. |
(h) | Purchase commitments include a minimum licensing fee that the Company is required to pay to Sotheby’s from 2009 through 2054. The annual minimum licensing fee is approximately $2 million. Purchase commitments also include a minimum licensing fee to be paid to Meredith from 2009 through 2058 for the licensing of the Better Homes and Gardens Real Estate brand. The annual minimum fee was $4 million in 2017 and will generally remain the same thereafter. |
(i) | The contractual obligations table does not include other non-current liabilities such as pension liabilities of $33 million and unrecognized tax benefits of $22 million as the Company is not able to estimate the year in which these liabilities could be paid. |
(j) | The contractual obligations table does not include non-standard incentives offered to certain franchisees which are paid at certain points during the franchise agreement period provided the franchisee maintains a certain level of annual gross commission income and the franchisee is in compliance with the terms of the franchise agreement at the time of payment. If current annual gross commission income levels are maintained by our franchisees, we would pay a total of $5 million over the next two years. |
Critical Accounting Policies
The preparation of our consolidated financial statements in accordance with generally accepted accounting principles is based on the selection and application of accounting policies that require us to make significant estimates and assumptions about the effects of matters that are inherently uncertain. Several of the estimates and assumptions we are required to make relate to matters that are inherently uncertain as they pertain to future events. We consider the accounting policies discussed below to be critical to the understanding of our financial statements and involve subjective and complex judgments that could potentially affect reported results. Actual results could differ from our estimates and assumptions and any such differences could be material to our consolidated financial statements.
74
Impairment of goodwill and other indefinite-lived intangible assets
Goodwill represents the excess of acquisition costs over the fair value of the net tangible assets and identifiable intangible assets acquired in a business combination. Indefinite-lived intangible assets primarily consist of trademarks acquired in business combinations. Goodwill and indefinite-lived assets are not amortized, but are subject to impairment testing. The aggregate carrying values of our goodwill and other indefinite-lived intangible assets were $3,710 million and $767 million, respectively, at December 31, 2017 and are subject to impairment testing annually as of October 1, or whenever events or changes in circumstances indicate that the carrying amount may not be fully recoverable. This testing compares carrying values to fair values and, when appropriate, the carrying value is reduced to fair value. In testing goodwill, the fair value of our reporting units is estimated using a discounted cash flow approach utilizing long-term cash flow forecasts and our annual operating plans adjusted for terminal value assumptions.
We determine the fair value of our reporting units utilizing our best estimate of future revenues, operating expenses, cash flows, market and general economic conditions as well as assumptions that we believe marketplace participants would utilize including discount rates, cost of capital, trademark royalty rates, and long-term growth rates. The trademark royalty rate was determined by reviewing similar trademark agreements with third parties. Although we believe our assumptions are reasonable, actual results may vary significantly. These impairment tests involve the use of accounting estimates and assumptions, changes in which could materially impact our financial condition or operating performance if actual results differ from such estimates and assumptions. To address this uncertainty, we perform sensitivity analysis on key estimates and assumptions.
Based upon the impairment analysis performed in the fourth quarter of 2017, there was no impairment of goodwill or other indefinite-lived intangible assets for 2017. However, significant negative industry or economic trends, disruptions to our business, unexpected significant changes or planned changes in use of the assets, divestitures and market capitalization declines may have a negative effect on the fair values. Management evaluated the effect of lowering the estimated fair value for each of the reporting units by 10% and determined that no impairment of goodwill or other indefinite-lived intangible assets would have been recognized under this evaluation.
Common stock valuation
On an annual basis, we grant stock-based awards to certain senior management, employees and directors. These awards are measured based on the fair value on the grant date. The fair value of restricted stock, restricted stock units and performance share units without a market condition is equal to the closing sale price of the Company's common stock on the date of grant. The fair value of options is estimated on the date of grant using the Black-Scholes option-pricing model and the fair value of performance share units with market conditions is estimated on the date of grant using the Monte Carlo Simulation method. Expense for stock-based awards is recognized over the service period based on the vesting requirements, or when requisite performance metrics or milestones are achieved, and forfeitures are recognized as they occur. Determining the fair value of stock-based awards at the grant date requires considerable judgment, including estimating expected volatility, expected term and risk-free rate.
Our expected volatility is based on the average volatility rates of the Company and similar actively traded companies since we only have trading history as a public company since October 2012. The expected term is calculated based on the simplified method and is estimated to be 6.25 years for time vesting stock options. The risk-free rate is derived from the U.S. Treasury yield curve in effect at the time of the grant using the estimated grant holding period. If factors change and we employ different assumptions, the fair value of future awards and resulting stock-based compensation expense may differ significantly from what we have estimated historically.
Income taxes
Deferred tax assets and liabilities are determined based on the difference between the financial statements and tax basis of assets and liabilities using enacted tax rates in effect for the year in which the differences are expected to reverse. Our provision for income taxes is based on domestic and international statutory income tax rates in the jurisdictions in which we operate. Significant judgment is required in determining income tax provisions as well as deferred tax asset and liability balances, including the estimation of valuation allowances and the evaluation of tax positions.
Net deferred tax assets and liabilities are primarily comprised of temporary differences, net operating loss carryforwards and tax credit carryforwards that are available to reduce taxable income in future periods. The determination of the amount of valuation allowance to be provided on deferred tax assets involves estimates regarding (1) the timing and
75
amount of the reversal of taxable temporary differences, (2) expected future taxable income, and (3) the impact of tax planning strategies.
Significant judgment is required in determining income tax provisions and in evaluating tax positions. We establish additional reserves for income taxes when, despite the belief that tax positions are fully supportable, there remain certain positions that do not meet the minimum recognition threshold. The approach for evaluating certain and uncertain tax positions is defined by the authoritative guidance and this guidance determines when a tax position is more likely than not to be sustained upon examination by the applicable taxing authority. In the normal course of business, the Company and its subsidiaries are examined by various federal, state and foreign tax authorities. We regularly assess the potential outcomes of these examinations and any future examinations for the current or prior years in determining the adequacy of our provision for income taxes. We continually assess the likelihood and amount of potential adjustments and adjust the income tax provision, the current tax liability and deferred taxes in the period in which the facts that give rise to a revision become known.
See "Item 7.—Management’s Discussion and Analysis of Financial Condition and Results of Operations" for a discussion of the 2017 Tax Act.
Recently Issued Accounting Pronouncements
See Note 2 of the Notes to the Consolidated Financial Statements for a discussion of recently issued accounting pronouncements.
Item 7A. Quantitative and Qualitative Disclosures about Market Risks.
We are exposed to market risk from changes in interest rates primarily through our senior secured debt. At December 31, 2017, our primary interest rate exposure was to interest rate fluctuations, specifically LIBOR, due to its impact on our variable rate borrowings of our Revolving Credit Facility and Term Loan B under the Senior Secured Credit Facility and the Term Loan A Facility. Given that our borrowings under the Senior Secured Credit Facility and Term Loan A Facility are generally based upon LIBOR, this rate will be the Company's primary market risk exposure for the foreseeable future. We do not have significant exposure to foreign currency risk nor do we expect to have significant exposure to foreign currency risk in the foreseeable future.
We assess our market risk based on changes in interest rates utilizing a sensitivity analysis. The sensitivity analysis measures the potential impact on earnings, fair values and cash flows based on a hypothetical change (increase and decrease) in interest rates. We exclude the fair values of relocation receivables and advances and securitization borrowings from our sensitivity analysis because we believe the interest rate risk on these assets and liabilities is mitigated as the rate we earn on relocation receivables and advances and the rate we incur on our securitization borrowings are based on similar variable indices.
At December 31, 2017, we had variable interest rate long-term debt outstanding under our Senior Secured Credit Facility and Term Loan A Facility of $1,886 million, which excludes $194 million of securitization obligations. The weighted average interest rate on the outstanding amounts under our Senior Secured Credit Facility and Term Loan A Facility at December 31, 2017 was 3.70%. The interest rate with respect to the Term Loan B is based on adjusted LIBOR plus 2.25% (with a LIBOR floor of 0.75%). The interest rates with respect to the Revolving Credit Facility and term loans under the Term Loan A Facility are based on adjusted LIBOR plus an additional margin subject to adjustment based on the current senior secured leverage ratio. Based on the December 31, 2017 senior secured leverage ratio, the LIBOR margin was 2.00%. At December 31, 2017 the one-month LIBOR rate was 1.56%; therefore, we have estimated that a 0.25% increase in LIBOR would have a $5 million impact on our annual interest expense.
We have entered into interest rate swaps with a notional value of $1,475 million at December 31, 2017 to manage a portion of our exposure to changes in interest rates associated with our $1,886 million of variable rate borrowings. Our interest rate swaps were as follows:
Notional Value (in millions) | Commencement Date | Expiration Date | |||
$225 | July 2012 | February 2018 | (a) | ||
$200 | January 2013 | February 2018 | (a) | ||
$600 | August 2015 | August 2020 | |||
$450 | November 2017 | (a) | November 2022 | ||
76
_______________
(a) | Interest rates swaps with a notional value of $425 million expired February 10, 2018, and interest rate swaps with a notional value of $450 million commenced in the fourth quarter of 2017. |
The swaps help protect our outstanding variable rate borrowings from future interest rate volatility. The fixed interest rates on the swaps range from 2.07% to 2.89%. The Company had a liability for the fair value of the interest rate swaps of $13 million and $33 million at December 31, 2017 and 2016, respectively. The fair value of these interest rate swaps is subject to movements in LIBOR and will fluctuate in future periods. We have estimated that a 0.25% increase in the LIBOR yield curve would increase the fair value of our interest rate swaps by $9 million and would decrease interest expense. While these results may be used as a benchmark, they should not be viewed as a forecast of future results.
Item 8. Financial Statements and Supplementary Data.
See "Index to Financial Statements" on page F-1.
Item 9. Changes in and Disagreements with Accountants on Accounting and Financial Disclosure.
Not applicable.
Item 9A. Controls and Procedures.
Controls and Procedures for Realogy Holdings Corp.
(a) | Realogy Holdings Corp. ("Realogy Holdings") maintains disclosure controls and procedures that are designed to ensure that information required to be disclosed in its filings under the Securities Exchange Act of 1934, as amended (the "Exchange Act"), is recorded, processed, summarized and reported within the periods specified in the rules and forms of the Securities and Exchange Commission. Such information is accumulated and communicated to its management, including its Chief Executive Officer and Chief Financial Officer, as appropriate, to allow timely decisions regarding required disclosure. Realogy Holdings' management, including the Chief Executive Officer and the Chief Financial Officer, recognizes that any set of controls and procedures, no matter how well designed and operated, can provide only reasonable assurance of achieving the desired control objectives. |
(b) | As of the end of the period covered by this Annual Report on Form 10-K, Realogy Holdings has carried out an evaluation, under the supervision and with the participation of its management, including its Chief Executive Officer and Chief Financial Officer, of the effectiveness of the design and operation of its disclosure controls and procedures. Based upon that evaluation, the Chief Executive Officer and Chief Financial Officer concluded that Realogy Holdings' disclosure controls and procedures are effective at the "reasonable assurance" level. |
(c) | There has not been any change in Realogy Holdings' internal control over financial reporting during the period covered by this Annual Report on Form 10-K that has materially affected, or is reasonably likely to materially affect, its internal control over financial reporting. |
Management’s Report on Internal Control Over Financial Reporting for Realogy Holdings Corp.
Realogy Holdings' management is responsible for establishing and maintaining adequate internal control over financial reporting as defined in Rules 13a-15(f) and 15d-15(f) under the Exchange Act. Realogy Holdings' internal control over financial reporting is a process designed to provide reasonable assurance regarding the reliability of financial reporting and the preparation of financial statements for external purposes in accordance with generally accepted accounting principles. Realogy Holdings' internal control over financial reporting includes those policies and procedures that:
(i) | pertain to the maintenance of records that, in reasonable detail, accurately and fairly reflect the transactions and dispositions of Realogy Holdings' assets; |
(ii) | provide reasonable assurance that transactions are recorded as necessary to permit preparation of financial statements in accordance with generally accepted accounting principles, and that receipts and expenditures of the Company are being made only in accordance with authorizations of Realogy Holdings' management and directors; and |
(iii) | provide reasonable assurance regarding prevention or timely detection of unauthorized acquisition, use or disposition of Realogy Holdings' assets that could have a material effect on the financial statements. |
Because of its inherent limitations, internal control over financial reporting may not prevent or detect misstatements. Also, projections of any evaluation of effectiveness to future periods are subject to the risk that controls may become inadequate because of changes in conditions, or that the degree of compliance with the policies or procedures may deteriorate.
Management assessed the effectiveness of Realogy Holdings' internal control over financial reporting as of December 31, 2017. In making this assessment, management used the criteria set forth by the Committee of Sponsoring Organizations of the Treadway Commission (COSO) in its 2013 Internal Control-Integrated Framework. Based on this assessment, management determined that Realogy Holdings maintained effective internal control over financial reporting as of December 31, 2017.
Auditor Report on the Effectiveness of Realogy Holdings Corp.’s Internal Control Over Financial Reporting
PricewaterhouseCoopers LLP, the independent registered public accounting firm that audited the financial statements included in this Annual Report, has issued an attestation report on the effectiveness of Realogy Holdings' internal control over financial reporting, which is included within their audit opinion on page F-2.
77
* * *
Controls and Procedures for Realogy Group LLC
(a) | Realogy Group LLC ("Realogy Group") maintains disclosure controls and procedures that are designed to ensure that information required to be disclosed in its filings under the Securities Exchange Act of 1934, as amended (the "Exchange Act"), is recorded, processed, summarized and reported within the periods specified in the rules and forms of the Securities and Exchange Commission. Such information is accumulated and communicated to its management, including its Chief Executive Officer and Chief Financial Officer, as appropriate, to allow timely decisions regarding required disclosure. Realogy Group's management, including the Chief Executive Officer and the Chief Financial Officer, recognizes that any set of controls and procedures, no matter how well designed and operated, can provide only reasonable assurance of achieving the desired control objectives. |
(b) | As of the end of the period covered by this Annual Report on Form 10-K, Realogy Group has carried out an evaluation, under the supervision and with the participation of its management, including its Chief Executive Officer and Chief Financial Officer, of the effectiveness of the design and operation of its disclosure controls and procedures. Based upon that evaluation, the Chief Executive Officer and Chief Financial Officer concluded that Realogy Group's disclosure controls and procedures are effective at the "reasonable assurance" level. |
(c) | There has not been any change in Realogy Group's internal control over financial reporting during the period covered by this Annual Report on Form 10-K that has materially affected, or is reasonably likely to materially affect, its internal control over financial reporting. |
Management’s Report on Internal Control Over Financial Reporting for Realogy Group LLC
Realogy Group’s management is responsible for establishing and maintaining adequate internal control over financial reporting as defined in Rules 13a-15(f) and 15d-15(f) under the Exchange Act. Realogy Group’s internal control over financial reporting is a process designed to provide reasonable assurance regarding the reliability of financial reporting and the preparation of financial statements for external purposes in accordance with generally accepted accounting principles. Realogy Group’s internal control over financial reporting includes those policies and procedures that:
(i) | pertain to the maintenance of records that, in reasonable detail, accurately and fairly reflect the transactions and dispositions of Realogy Group’s assets; |
(ii) | provide reasonable assurance that transactions are recorded as necessary to permit preparation of financial statements in accordance with generally accepted accounting principles, and that receipts and expenditures of the Company are being made only in accordance with authorizations of Realogy Group’s management and directors; and |
(iii) | provide reasonable assurance regarding prevention or timely detection of unauthorized acquisition, use or disposition of Realogy Group’s assets that could have a material effect on the financial statements. |
Because of its inherent limitations, internal control over financial reporting may not prevent or detect misstatements. Also, projections of any evaluation of effectiveness to future periods are subject to the risk that controls may become inadequate because of changes in conditions, or that the degree of compliance with the policies or procedures may deteriorate.
Management assessed the effectiveness of Realogy Group’s internal control over financial reporting as of December 31, 2017. In making this assessment, management used the criteria set forth by the Committee of Sponsoring Organizations of the Treadway Commission (COSO) in its 2013 Internal Control-Integrated Framework. Based on this assessment, management determined that Realogy Group maintained effective internal control over financial reporting as of December 31, 2017.
Auditor Report on the Effectiveness of Realogy Group LLC's Internal Control Over Financial Reporting
PricewaterhouseCoopers LLP, the independent registered public accounting firm that audited the financial statements included in this Annual Report, has issued an attestation report on the effectiveness of Realogy Group's internal control over financial reporting, which is included within their audit opinion on page F-4.
78
Item 9B. Other Information.
Director Not Standing for Re-Election. On February 26, 2018, Raul Alvarez notified Realogy Holdings Corp. of his decision not to stand for re-election to the Board of Directors when his current term expires at the Realogy Holdings Corp. 2018 Annual Meeting of Stockholders. Mr. Alvarez’s decision not to stand for re-election was based solely on his other personal and professional time commitments and was not due to any disagreement with the Company.
79
PART III
Item 10. Directors, Executive Officers and Corporate Governance.
Identification of Directors
The information required by this item is included in the Proxy Statement under the caption "Election of Directors" and is incorporated by reference to this report.
Identification of Executive Officers
The following provides information regarding individuals who served as executive officers of Realogy Group and Realogy Holdings at February 23, 2018. The age of each individual indicated below is as of February 23, 2018.
Ryan M. Schneider, 48, has served as our Chief Executive Officer and President since December 31, 2017 and as a director since October 20, 2017. From October 23, 2017 until his appointment as our CEO and President, Mr. Schneider served as the Company’s President and Chief Operating Officer. Prior to joining the Company, Mr. Schneider served as President, Card of Capital One Financial Corporation (“Capital One”), a financial holding company, from December 2007 to November 2016 where he was responsible for all of Capital One’s consumer and small business credit card lines of business in the United States, the United Kingdom and Canada. Mr. Schneider held a variety of other positions within Capital One from December 2001 to December 2007, including Executive Vice President and President, Auto Finance and Executive Vice President, U.S. Card. From November 2016 until April 2017, he served as Senior Advisor to Capital One.
Donald J. Casey, 56, has served as the President and Chief Executive Officer of TRG (formerly known as Cendant Settlement Services Group) since April 2002. From 1995 until April 2002, he served as Senior Vice President, Brands of PHH Mortgage. From 1993 to 1995, Mr. Casey served as Vice President, Government Operations of Cendant Mortgage. From 1989 to 1993, Mr. Casey served as a secondary marketing analyst for PHH Mortgage Services (prior to its acquisition by Cendant).
David L. Gordon, 56, has served as our Executive Vice President and Chief Technology Officer since January 2018. From March 2015 to January 2018, Mr. Gordon served as Executive Vice President, U.S. Chief Technology and Operations Officer for Bank of Montreal (BMO) Financial Group, a diversified financial services provider based in North America. From June 2013 to March 2015, Mr. Gordon served in multiple officer roles at Promontory Financial Group, a global financial services consulting firm and wholly owned subsidiary of IBM, including Chief Administrative Officer and Chief Technology Officer. For 12 years prior thereto, Mr. Gordon held several leadership positions at Capital One Financial Services, a financial holding company, most recently as Senior Vice President, IT Operations.
M. Ryan Gorman, 39, has served as the President and Chief Executive Officer of NRT LLC since January 2018 and as Chief Strategy & Operating Officer of NRT from September 2016 to January 2018. From May 2012 to September 2016, Mr. Gorman served at NRT’s Senior Vice President, Strategic Operations and from November 2007 to May 2012 he served as the Company’s Head of Strategic Development. From October 2004 to November 2007, Mr. Gorman served as the Head of Strategic Development of TRG (formerly known as Cendant Settlement Services Group). Before joining the Company, he held advisory and principal investment roles with PricewaterhouseCoopers, Credit Suisse and The Blackstone Group.
Timothy B. Gustavson, 49, has served as our Senior Vice President, Chief Accounting Officer and Controller since March 2015. From 2008 until March 2015, Mr. Gustavson served as Realogy’s Assistant Corporate Controller and Vice President of Finance. Mr. Gustavson joined Realogy in 2006 as Vice President of External Reporting and prior to Realogy, Mr. Gustavson spent 16 years in public accounting with the KPMG audit practice. Mr. Gustavson is a certified public accountant.
Sunita Holzer, 56, has served as our Executive Vice President and Chief Human Resources Officer ("CHRO") since March 2015. Prior to Realogy, Ms. Holzer served as Executive Vice President and CHRO for Computer Sciences Corporation from 2012 to 2014, where she had oversight of global human resources for 80,000 employees across 60 countries. Ms. Holzer also was Executive Vice President and CHRO at Chubb Insurance from 2003 to 2012. Prior to her tenure at Chubb Insurance, Ms. Holzer held executive HR roles at GE Capital, American Express and American International Group.
Anthony E. Hull, 59, has served as our Executive Vice President, Chief Financial Officer and Treasurer since our separation from Cendant in July 2006. From December 14, 2007 to February 3, 2008, Mr. Hull performed the functions of our Chief Accounting Officer. Mr. Hull was Executive Vice President, Finance of Cendant from October 2003 until our
80
separation from Cendant in July 2006. From January 1996 to September 2003, Mr. Hull served as Chief Financial Officer for DreamWorks, a diversified entertainment company. From 1990 to 1994, Mr. Hull worked in various capacities for Paramount Communications, a diversified entertainment and publishing company. From 1984 to 1990, Mr. Hull worked in investment banking at Morgan Stanley.
John W. Peyton, 50, has served as the Chief Executive Officer of Realogy Franchise Group since April 2017 after serving as Chief Operating Officer and President of Realogy Franchise Group from October 2016. Previously, he served as a senior executive with Starwood Hotels & Resorts Worldwide Inc., a leading hotel and leisure company, for 17 years, most recently as its Chief Marketing Officer from 2014 to September 2016 and as its Senior Vice President of Global Initiatives from 2012 to 2014, where he directed the implementation of key strategic company priorities around the world, including supply chain and revenue management initiatives.
Marilyn J. Wasser, 62, has served as our Executive Vice President, General Counsel and Corporate Secretary since May 10, 2007. From May 2005 until May 2007, Ms. Wasser was Executive Vice President, General Counsel and Corporate Secretary for Telcordia Technologies, a provider of telecommunications software and services. From 1983 until 2005, Ms. Wasser served in several positions of increasing responsibility with AT&T Corporation and AT&T Wireless Services, ultimately serving as Executive Vice President, Associate General Counsel and Corporate Secretary of AT&T Wireless Services from September 2002 to February 2005 and immediately prior thereto, from 1995 until 2002, as EVP Law, Corporate Secretary and Chief Compliance Officer of AT&T.
Compliance with Section 16(a) of the Exchange Act
The information required by this item is included in the Proxy Statement under the caption "Section 16(a) Beneficial Ownership Reporting Compliance" and is incorporated by reference to this report.
Code of Ethics
The information required by this item is included in the Proxy Statement under the caption "Code of Business Conduct and Ethics" and is incorporated by reference to this Annual Report.
Corporate Governance
The information required by this item is included in the Proxy Statement under the caption "Governance of the Company" and is incorporated by reference to this Annual Report.
Item 11. Executive Compensation.
The information required by this item is included in the Proxy Statement under the captions "Governance of the Company—Compensation of Directors," "Governance of the Company—Committees of the Board" and "Executive Compensation" and is incorporated by reference to this Annual Report.
Item 12. Security Ownership of Certain Beneficial Owners and Management and Related Stockholder Matters.
Securities Authorized for Issuance Under Equity Compensation Plans
The information required by this item relating to securities authorized for issuance under equity compensation plans is included in the Proxy Statement under the caption "Proposal 4. Approval of the 2018 Long-Term Incentive Plan" and is incorporated by reference to this report.
The remaining information required by this item is included in the Proxy Statement under the caption "Governance of the Company—Ownership of Our Common Stock" and is incorporated by reference to this report.
Item 13. | Certain Relationships and Related Transactions, and Director Independence. |
The information required by this item is included in the Proxy Statement under the captions "Governance of the Company" and "Related Person Transactions" and is incorporated by reference to this Annual Report.
Item 14. Principal Accounting Fees and Services.
The information required by this item is included in the Proxy Statement under the captions "Disclosure About Fees" and "Pre-Approval of Audit and Non-Audit Services" under the section entitled "Proposal 3. Ratification of the Appointment of the Independent Registered Public Accounting Firm" and is incorporated by reference to this Annual Report.
81
PART IV
Item 15. Exhibits, Financial Statements and Schedules.
(A)(1) and (2) Financial Statements
The consolidated financial statements of the registrants listed in the "Index to Financial Statements" on page F-1 together with the reports of PricewaterhouseCoopers LLP, independent auditors, are filed as part of this Annual Report.
(A)(3) Exhibits
See Index to Exhibits.
The agreements included or incorporated by reference as exhibits to this Annual Report contain representations and warranties by each of the parties to the applicable agreement. These representations and warranties were made solely for the benefit of the other parties to the applicable agreement and (i) were not intended to be treated as categorical statements of fact, but rather as a way of allocating the risk to one of the parties if those statements prove to be inaccurate; (ii) may have been qualified in such agreement by disclosures that were made to the other party in connection with the negotiation of the applicable agreement; (iii) may apply contract standards of "materiality" that are different from "materiality" under the applicable securities laws; and (iv) were made only as of the date of the applicable agreement or such other date or dates as may be specified in the agreement. We acknowledge that, notwithstanding the inclusion of the foregoing cautionary statements, we are responsible for considering whether additional specific disclosures of material information regarding material contractual provisions are required to make the statements in this Annual Report not misleading.
(A)(4) Consolidated Financial Statement Schedules
Schedule II—Valuation and Qualifying Accounts for the years ended December 31, 2017, 2016 and 2015:
_______________
(in millions) | Additions | ||||||||||||||||||
Description | Balance at Beginning of Period | Charged to Costs and Expenses | Charged to Other Accounts | Deductions | Balance at End of Period | ||||||||||||||
Allowance for doubtful accounts (a) | |||||||||||||||||||
Year ended December 31, 2017 | $ | 13 | $ | 3 | $ | — | $ | (5 | ) | $ | 11 | ||||||||
Year ended December 31, 2016 | 20 | 2 | — | (9 | ) | 13 | |||||||||||||
Year ended December 31, 2015 | 27 | 6 | — | (13 | ) | 20 | |||||||||||||
Deferred tax asset valuation allowance | |||||||||||||||||||
Year ended December 31, 2017 | $ | 10 | $ | 3 | $ | — | $ | — | $ | 13 | |||||||||
Year ended December 31, 2016 | 11 | (1 | ) | — | — | 10 | |||||||||||||
Year ended December 31, 2015 | 10 | 1 | — | — | 11 | ||||||||||||||
(a) | The deduction column represents uncollectible accounts written off, net of recoveries from Trade Receivables, in the Consolidated Balance Sheets. |
Item 16. Form 10-K Summary.
None.
82
SIGNATURES
Pursuant to the requirements of Section 15(d) of the Securities Exchange Act of 1934, the registrants have duly caused this Annual Report on Form 10-K to be signed on their behalf by the undersigned, thereunto duly authorized, on February 27, 2018.
REALOGY HOLDINGS CORP.
and
REALOGY GROUP LLC
(Registrants)
By: | /S/ RYAN M. SCHNEIDER |
Name: | Ryan M. Schneider |
Title: | Chief Executive Officer and President |
POWER OF ATTORNEY
KNOW ALL PERSONS BY THESE PRESENTS, that each person whose signature appears below constitutes and appoints Ryan M. Schneider, Anthony E. Hull and Marilyn J. Wasser, and each of them severally, his or her true and lawful attorney-in-fact with power of substitution and resubstitution to sign in his or her name, place and stead, in any and all capacities, to do any and all things and execute any and all instruments that such attorney may deem necessary or advisable under the Securities Exchange Act of 1934 and any rules, regulations and requirements of the U.S. Securities and Exchange Commission in connection with this Annual Report on Form 10-K and any and all amendments hereto, as fully and for all intents and purposes as he or she might do or could do in person, and hereby ratifies and confirms all said attorneys-in-fact and agents, each acting alone, and his or her substitute or substitutes, may lawfully do or cause to be done by virtue hereof.
83
Pursuant to the requirements of the Securities Exchange Act of 1934, this Annual Report has been signed below by the following persons in the capacities and on the dates indicated below on behalf of each of the Registrants.
Name | Title | Date | ||
/s/ RYAN M. SCHNEIDER | Chief Executive Officer and President (Principal Executive Officer) | February 27, 2018 | ||
Ryan M. Schneider | ||||
/s/ ANTHONY E. HULL | Executive Vice President, Chief Financial Officer and Treasurer (Principal Financial Officer) | February 27, 2018 | ||
Anthony E. Hull | ||||
/s/ TIMOTHY B. GUSTAVSON | Senior Vice President, Chief Accounting Officer and Controller (Principal Accounting Officer) | February 27, 2018 | ||
Timothy B. Gustavson | ||||
/s/ MICHAEL J. WILLIAMS | Chairman of the Board of Directors of Realogy Holdings Corp. and Manager of Realogy Group LLC | February 27, 2018 | ||
Michael J. Williams | ||||
/s/ RAUL ALVAREZ | Director of Realogy Holdings Corp. and Manager of Realogy Group LLC | February 27, 2018 | ||
Raul Alvarez | ||||
/s/ FIONA P. DIAS | Director of Realogy Holdings Corp. and Manager of Realogy Group LLC | February 27, 2018 | ||
Fiona P. Dias | ||||
/s/ MATTHEW J. ESPE | Director of Realogy Holdings Corp. and Manager of Realogy Group LLC | February 27, 2018 | ||
Matthew J. Espe | ||||
/s/ V. ANN HAILEY | Director of Realogy Holdings Corp. and Manager of Realogy Group LLC | February 27, 2018 | ||
V. Ann Hailey | ||||
/s/ DUNCAN L. NIEDERAUER | Director of Realogy Holdings Corp. and Manager of Realogy Group LLC | February 27, 2018 | ||
Duncan L. Niederauer | ||||
/s/ SHERRY M. SMITH | Director of Realogy Holdings Corp. and Manager of Realogy Group LLC | February 27, 2018 | ||
Sherry M. Smith | ||||
/s/ CHRIS TERRILL | Director of Realogy Holdings Corp. and Manager of Realogy Group LLC | February 27, 2018 | ||
Chris Terrill | ||||
84
INDEX TO FINANCIAL STATEMENTS
Page | |
F-1
Report of Independent Registered Public Accounting Firm
To the Board of Directors and Stockholders of Realogy Holdings Corp.
Opinions on the Financial Statements and Internal Control over Financial Reporting
We have audited the accompanying consolidated balance sheets of Realogy Holdings Corp. and its subsidiaries ("the Company") as of December 31, 2017 and December 31, 2016, and the related consolidated statements of operations, comprehensive income, equity and cash flows for each of the three years in the period ended December 31, 2017, including the related notes and schedule of valuation and qualifying accounts for each of the three years in the period ended December 31, 2017 appearing under Item 15(A)(4) (collectively referred to as the “consolidated financial statements”). We also have audited the Company's internal control over financial reporting as of December 31, 2017, based on criteria established in Internal Control - Integrated Framework (2013) issued by the Committee of Sponsoring Organizations of the Treadway Commission (COSO).
In our opinion, the consolidated financial statements referred to above present fairly, in all material respects, the financial position of the Company as of December 31, 2017 and December 31, 2016, and the results of their operations and their cash flows for each of the three years in the period ended December 31, 2017 in conformity with accounting principles generally accepted in the United States of America. Also in our opinion, the Company maintained, in all material respects, effective internal control over financial reporting as of December 31, 2017, based on criteria established in Internal Control - Integrated Framework (2013) issued by the COSO.
Basis for Opinions
The Company's management is responsible for these consolidated financial statements, for maintaining effective internal control over financial reporting, and for its assessment of the effectiveness of internal control over financial reporting, included in Management's Report on Internal Control over Financial Reporting appearing under Item 9A. Our responsibility is to express opinions on the Company's consolidated financial statements and on the Company's internal control over financial reporting based on our audits. We are a public accounting firm registered with the Public Company Accounting Oversight Board (United States) ("PCAOB") and are required to be independent with respect to the Company in accordance with the U.S. federal securities laws and the applicable rules and regulations of the Securities and Exchange Commission and the PCAOB.
We conducted our audits in accordance with the standards of the PCAOB. Those standards require that we plan and perform the audits to obtain reasonable assurance about whether the consolidated financial statements are free of material misstatement, whether due to error or fraud, and whether effective internal control over financial reporting was maintained in all material respects.
Our audits of the consolidated financial statements included performing procedures to assess the risks of material misstatement of the consolidated financial statements, whether due to error or fraud, and performing procedures that respond to those risks. Such procedures included examining, on a test basis, evidence regarding the amounts and disclosures in the consolidated financial statements. Our audits also included evaluating the accounting principles used and significant estimates made by management, as well as evaluating the overall presentation of the consolidated financial statements. Our audit of internal control over financial reporting included obtaining an understanding of internal control over financial reporting, assessing the risk that a material weakness exists, and testing and evaluating the design and operating effectiveness of internal control based on the assessed risk. Our audits also included performing such other procedures as we considered necessary in the circumstances. We believe that our audits provide a reasonable basis for our opinions.
Definition and Limitations of Internal Control over Financial Reporting
A company's internal control over financial reporting is a process designed to provide reasonable assurance regarding the reliability of financial reporting and the preparation of financial statements for external purposes in accordance with generally accepted accounting principles. A company's internal control over financial reporting includes those policies and procedures that (i) pertain to the maintenance of records that, in reasonable detail, accurately and fairly reflect the transactions and dispositions of the assets of the company; (ii) provide reasonable assurance that transactions are recorded as necessary to permit preparation of financial statements in accordance with generally accepted accounting principles, and that receipts and expenditures of the company are being made only in accordance with authorizations of management and directors of the company; and (iii) provide reasonable assurance regarding prevention or timely detection of unauthorized acquisition, use, or disposition of the company's assets that could have a material effect on the financial statements.
F-2
Because of its inherent limitations, internal control over financial reporting may not prevent or detect misstatements. Also, projections of any evaluation of effectiveness to future periods are subject to the risk that controls may become inadequate because of changes in conditions, or that the degree of compliance with the policies or procedures may deteriorate.
/s/ PricewaterhouseCoopers LLP
Florham Park, New Jersey
February 27, 2018
We have served as the Company's auditor since 2009.
F-3
Report of Independent Registered Public Accounting Firm
To the Board of Directors and Stockholder of Realogy Group LLC
Opinions on the Financial Statements and Internal Control over Financial Reporting
We have audited the accompanying consolidated balance sheets of Realogy Group LLC and its subsidiaries as of December 31, 2017 and December 31, 2016, and the related consolidated statements of operations, comprehensive income, equity and cash flows for each of the three years in the period ended December 31, 2017, including the related notes and schedule of valuation and qualifying accounts for each of the three years in the period ended December 31, 2017 appearing under Item 15(A)(4) (collectively referred to as the “consolidated financial statements”). We also have audited the Company's internal control over financial reporting as of December 31, 2017, based on criteria established in Internal Control - Integrated Framework (2013) issued by the Committee of Sponsoring Organizations of the Treadway Commission (COSO).
In our opinion, the consolidated financial statements referred to above present fairly, in all material respects, the financial position of the Company as of December 31, 2017 and December 31, 2016, and the results of their operations and their cash flows for each of the three years in the period ended December 31, 2017 in conformity with accounting principles generally accepted in the United States of America. Also in our opinion, the Company maintained, in all material respects, effective internal control over financial reporting as of December 31, 2017, based on criteria established in Internal Control - Integrated Framework (2013) issued by the COSO.
Basis for Opinions
The Company's management is responsible for these consolidated financial statements, for maintaining effective internal control over financial reporting, and for its assessment of the effectiveness of internal control over financial reporting, included in Management's Report on Internal Control over Financial Reporting appearing under Item 9A. Our responsibility is to express opinions on the Company's consolidated financial statements and on the Company's internal control over financial reporting based on our audits. We are a public accounting firm registered with the Public Company Accounting Oversight Board (United States) ("PCAOB") and are required to be independent with respect to the Company in accordance with the U.S. federal securities laws and the applicable rules and regulations of the Securities and Exchange Commission and the PCAOB.
We conducted our audits in accordance with the standards of the PCAOB and in accordance with auditing standards generally accepted in the United States of America. Those standards require that we plan and perform the audits to obtain reasonable assurance about whether the consolidated financial statements are free of material misstatement, whether due to error or fraud, and whether effective internal control over financial reporting was maintained in all material respects.
Our audits of the consolidated financial statements included performing procedures to assess the risks of material misstatement of the consolidated financial statements, whether due to error or fraud, and performing procedures that respond to those risks. Such procedures included examining, on a test basis, evidence regarding the amounts and disclosures in the consolidated financial statements. Our audits also included evaluating the accounting principles used and significant estimates made by management, as well as evaluating the overall presentation of the consolidated financial statements. Our audit of internal control over financial reporting included obtaining an understanding of internal control over financial reporting, assessing the risk that a material weakness exists, and testing and evaluating the design and operating effectiveness of internal control based on the assessed risk. Our audits also included performing such other procedures as we considered necessary in the circumstances. We believe that our audits provide a reasonable basis for our opinions.
Definition and Limitations of Internal Control over Financial Reporting
A company's internal control over financial reporting is a process designed to provide reasonable assurance regarding the reliability of financial reporting and the preparation of financial statements for external purposes in accordance with generally accepted accounting principles. A company's internal control over financial reporting includes those policies and procedures that (i) pertain to the maintenance of records that, in reasonable detail, accurately and fairly reflect the transactions and dispositions of the assets of the company; (ii) provide reasonable assurance that transactions are recorded as necessary to permit preparation of financial statements in accordance with generally accepted accounting principles, and that receipts and expenditures of the company are being made only in accordance with authorizations of management and directors of the company; and (iii) provide reasonable assurance regarding prevention or timely detection of unauthorized acquisition, use, or disposition of the company's assets that could have a material effect on the financial statements.
F-4
Because of its inherent limitations, internal control over financial reporting may not prevent or detect misstatements. Also, projections of any evaluation of effectiveness to future periods are subject to the risk that controls may become inadequate because of changes in conditions, or that the degree of compliance with the policies or procedures may deteriorate.
/s/ PricewaterhouseCoopers LLP
Florham Park, New Jersey
February 27, 2018
We have served as the Company's auditor since 2009.
F-5
REALOGY HOLDINGS CORP. AND REALOGY GROUP LLC
CONSOLIDATED STATEMENTS OF OPERATIONS
(In millions, except per share data)
Year Ended December 31, | |||||||||||
2017 | 2016 | 2015 | |||||||||
Revenues | |||||||||||
Gross commission income | $ | 4,576 | $ | 4,277 | $ | 4,288 | |||||
Service revenue | 938 | 955 | 882 | ||||||||
Franchise fees | 396 | 372 | 353 | ||||||||
Other | 204 | 206 | 183 | ||||||||
Net revenues | 6,114 | 5,810 | 5,706 | ||||||||
Expenses | |||||||||||
Commission and other agent-related costs | 3,230 | 2,945 | 2,931 | ||||||||
Operating | 1,544 | 1,542 | 1,458 | ||||||||
Marketing | 261 | 241 | 226 | ||||||||
General and administrative | 364 | 321 | 337 | ||||||||
Former parent legacy benefit, net | (10 | ) | (2 | ) | (15 | ) | |||||
Restructuring costs, net | 12 | 39 | 10 | ||||||||
Depreciation and amortization | 198 | 202 | 201 | ||||||||
Interest expense, net | 158 | 174 | 231 | ||||||||
Loss on the early extinguishment of debt | 5 | — | 48 | ||||||||
Other expense (income), net | 1 | (1 | ) | (3 | ) | ||||||
Total expenses | 5,763 | 5,461 | 5,424 | ||||||||
Income before income taxes, equity in earnings and noncontrolling interests | 351 | 349 | 282 | ||||||||
Income tax (benefit) expense | (65 | ) | 144 | 110 | |||||||
Equity in earnings of unconsolidated entities | (18 | ) | (12 | ) | (16 | ) | |||||
Net income | 434 | 217 | 188 | ||||||||
Less: Net income attributable to noncontrolling interests | (3 | ) | (4 | ) | (4 | ) | |||||
Net income attributable to Realogy Holdings and Realogy Group | $ | 431 | $ | 213 | $ | 184 | |||||
Earnings per share attributable to Realogy Holdings: | |||||||||||
Basic earnings per share | $ | 3.15 | $ | 1.47 | $ | 1.26 | |||||
Diluted earnings per share | $ | 3.11 | $ | 1.46 | $ | 1.24 | |||||
Weighted average common and common equivalent shares of Realogy Holdings outstanding: | |||||||||||
Basic | 136.7 | 144.5 | 146.5 | ||||||||
Diluted | 138.4 | 145.8 | 148.1 | ||||||||
Cash dividends declared per share (beginning in August 2016) | $ | 0.36 | $ | 0.18 | $ | — | |||||
See Notes to Consolidated Financial Statements.
F-6
REALOGY HOLDINGS CORP. AND REALOGY GROUP LLC
CONSOLIDATED STATEMENTS OF COMPREHENSIVE INCOME
(In millions)
Year Ended December 31, | |||||||||||
2017 | 2016 | 2015 | |||||||||
Net income | $ | 434 | $ | 217 | $ | 188 | |||||
Currency translation adjustment | 3 | (5 | ) | (4 | ) | ||||||
Defined Benefit Plans: | |||||||||||
Actuarial gain (loss) for the plans | (1 | ) | (3 | ) | 1 | ||||||
Less: amortization of actuarial loss to periodic pension cost | (2 | ) | (1 | ) | (2 | ) | |||||
Defined benefit plans | 1 | (2 | ) | 3 | |||||||
Other comprehensive income (loss), before tax | 4 | (7 | ) | (1 | ) | ||||||
Income tax expense (benefit) related to items of other comprehensive income (loss) amounts | 1 | (3 | ) | — | |||||||
Other comprehensive income (loss), net of tax | 3 | (4 | ) | (1 | ) | ||||||
Comprehensive income | 437 | 213 | 187 | ||||||||
Less: comprehensive income attributable to noncontrolling interests | (3 | ) | (4 | ) | (4 | ) | |||||
Comprehensive income attributable to Realogy Holdings and Realogy Group | $ | 434 | $ | 209 | $ | 183 | |||||
See Notes to Consolidated Financial Statements.
F-7
REALOGY HOLDINGS CORP. AND REALOGY GROUP LLC
CONSOLIDATED BALANCE SHEETS
(In millions, except share data)
December 31, | |||||||
2017 | 2016 | ||||||
ASSETS | |||||||
Current assets: | |||||||
Cash and cash equivalents | $ | 227 | $ | 274 | |||
Restricted cash | 7 | 7 | |||||
Trade receivables (net of allowance for doubtful accounts of $11 and $13) | 153 | 152 | |||||
Relocation receivables | 223 | 244 | |||||
Other current assets | 179 | 141 | |||||
Total current assets | 789 | 818 | |||||
Property and equipment, net | 289 | 267 | |||||
Goodwill | 3,710 | 3,690 | |||||
Trademarks | 749 | 748 | |||||
Franchise agreements, net | 1,294 | 1,361 | |||||
Other intangibles, net | 284 | 313 | |||||
Other non-current assets | 222 | 224 | |||||
Total assets | $ | 7,337 | $ | 7,421 | |||
LIABILITIES AND EQUITY | |||||||
Current liabilities: | |||||||
Accounts payable | $ | 156 | $ | 140 | |||
Securitization obligations | 194 | 205 | |||||
Current portion of long-term debt | 127 | 242 | |||||
Accrued expenses and other current liabilities | 478 | 463 | |||||
Total current liabilities | 955 | 1,050 | |||||
Long-term debt | 3,221 | 3,265 | |||||
Deferred income taxes | 327 | 389 | |||||
Other non-current liabilities | 212 | 248 | |||||
Total liabilities | 4,715 | 4,952 | |||||
Commitments and contingencies (Note 13) | |||||||
Equity: | |||||||
Realogy Holdings preferred stock: $.01 par value; 50,000,000 shares authorized, none issued and outstanding at December 31, 2017 and December 31, 2016 | — | — | |||||
Realogy Holdings common stock: $.01 par value; 400,000,000 shares authorized, 131,636,870 shares issued and outstanding at December 31, 2017 and 140,227,692 shares issued and outstanding at December 31, 2016 | 1 | 1 | |||||
Additional paid-in capital | 5,285 | 5,565 | |||||
Accumulated deficit | (2,631 | ) | (3,062 | ) | |||
Accumulated other comprehensive loss | (37 | ) | (40 | ) | |||
Total stockholders' equity | 2,618 | 2,464 | |||||
Noncontrolling interests | 4 | 5 | |||||
Total equity | 2,622 | 2,469 | |||||
Total liabilities and equity | $ | 7,337 | $ | 7,421 | |||
See Notes to Consolidated Financial Statements.
F-8
REALOGY HOLDINGS CORP. AND REALOGY GROUP LLC
CONSOLIDATED STATEMENTS OF CASH FLOWS
(In millions)
Year Ended December 31, | |||||||||||
2017 | 2016 | 2015 | |||||||||
Operating Activities | |||||||||||
Net income | $ | 434 | $ | 217 | $ | 188 | |||||
Adjustments to reconcile net income to net cash provided by operating activities: | |||||||||||
Depreciation and amortization | 198 | 202 | 201 | ||||||||
Deferred income taxes | (63 | ) | 124 | 96 | |||||||
Amortization of deferred financing costs and discount | 16 | 16 | 18 | ||||||||
Loss on the early extinguishment of debt | 5 | — | 48 | ||||||||
Equity in earnings of unconsolidated entities | (18 | ) | (12 | ) | (16 | ) | |||||
Stock-based compensation | 52 | 57 | 57 | ||||||||
Mark-to-market adjustments on derivatives | (2 | ) | 4 | 18 | |||||||
Other adjustments to net income | 1 | (4 | ) | (4 | ) | ||||||
Net change in assets and liabilities, excluding the impact of acquisitions and dispositions: | |||||||||||
Trade receivables | (1 | ) | (10 | ) | (27 | ) | |||||
Relocation receivables | 23 | 31 | 17 | ||||||||
Other assets | (25 | ) | (22 | ) | (25 | ) | |||||
Accounts payable, accrued expenses and other liabilities | 9 | (17 | ) | 8 | |||||||
Dividends received from unconsolidated entities | 52 | 11 | 13 | ||||||||
Other, net | (14 | ) | (11 | ) | (4 | ) | |||||
Net cash provided by operating activities | 667 | 586 | 588 | ||||||||
Investing Activities | |||||||||||
Property and equipment additions | (99 | ) | (87 | ) | (84 | ) | |||||
Payments for acquisitions, net of cash acquired | (18 | ) | (95 | ) | (127 | ) | |||||
Investment in unconsolidated entities | (55 | ) | — | — | |||||||
Proceeds from investments in unconsolidated entities | 11 | — | — | ||||||||
Other, net | 15 | (9 | ) | — | |||||||
Net cash used in investing activities | (146 | ) | (191 | ) | (211 | ) | |||||
Financing Activities | |||||||||||
Net change in revolving credit facilities | (130 | ) | — | 200 | |||||||
Repayment of amended Term Loan B Facility | — | (758 | ) | — | |||||||
Proceeds from issuance of Term Loan A and A-1 facilities | — | 355 | 435 | ||||||||
Amortization payments on term loan facilities | (42 | ) | (41 | ) | (19 | ) | |||||
Redemption of First Lien Notes and First and a Half Lien Notes | — | — | (789 | ) | |||||||
Proceeds from issuance of Senior Notes | — | 750 | — | ||||||||
Redemption of Senior Notes | — | (500 | ) | — | |||||||
Net change in securitization obligations | (11 | ) | (40 | ) | (21 | ) | |||||
Debt issuance costs | (6 | ) | (16 | ) | (10 | ) | |||||
Cash paid for fees associated with early extinguishment of debt | (1 | ) | — | (39 | ) | ||||||
Repurchase of common stock | (280 | ) | (195 | ) | — | ||||||
Dividends paid on common stock | (49 | ) | (26 | ) | — | ||||||
Proceeds from exercise of stock options | 8 | 2 | 5 | ||||||||
Taxes paid related to net share settlement for stock-based compensation | (11 | ) | (6 | ) | (6 | ) | |||||
Payments of contingent consideration related to acquisitions | (22 | ) | (25 | ) | (7 | ) | |||||
Other, net | (26 | ) | (34 | ) | (24 | ) | |||||
Net cash used in financing activities | (570 | ) | (534 | ) | (275 | ) | |||||
Effect of changes in exchange rates on cash, cash equivalents and restricted cash | 2 | (3 | ) | (2 | ) | ||||||
Net (decrease) increase in cash, cash equivalents and restricted cash | (47 | ) | (142 | ) | 100 | ||||||
Cash, cash equivalents and restricted cash, beginning of period | 281 | 423 | 323 | ||||||||
Cash, cash equivalents and restricted cash, end of period | $ | 234 | $ | 281 | $ | 423 | |||||
Supplemental Disclosure of Cash Flow Information | |||||||||||
Interest payments (including securitization interest of $7, $6 and $6 respectively) | $ | 172 | $ | 181 | $ | 244 | |||||
Income tax payments, net | 12 | 24 | 17 | ||||||||
See Notes to Consolidated Financial Statements.
F-9
REALOGY HOLDINGS CORP.
CONSOLIDATED STATEMENTS OF EQUITY
(In millions)
Realogy Holdings Stockholders' Equity | |||||||||||||||||||||||||||
Common Stock | Additional Paid-In Capital | Accumulated Deficit | Accumulated Other Comprehensive Loss | Non- controlling Interests | Total Equity | ||||||||||||||||||||||
Shares | Amount | ||||||||||||||||||||||||||
Balance at January 1, 2015 | 146.4 | $ | 1 | $ | 5,677 | $ | (3,464 | ) | $ | (35 | ) | $ | 4 | $ | 2,183 | ||||||||||||
Net income | — | — | — | 184 | — | 4 | 188 | ||||||||||||||||||||
Other comprehensive loss | — | — | — | — | (1 | ) | — | (1 | ) | ||||||||||||||||||
Exercise of stock options | 0.2 | — | 5 | — | — | — | 5 | ||||||||||||||||||||
Stock-based compensation | — | — | 57 | — | — | — | 57 | ||||||||||||||||||||
Issuance of shares for vesting of equity awards, net of forfeitures | 0.2 | — | — | — | — | — | — | ||||||||||||||||||||
Shares withheld for taxes on equity awards | (0.1 | ) | — | (6 | ) | — | — | — | (6 | ) | |||||||||||||||||
Dividends | — | — | — | — | — | (4 | ) | (4 | ) | ||||||||||||||||||
Balance at December 31, 2015 | 146.7 | $ | 1 | $ | 5,733 | $ | (3,280 | ) | $ | (36 | ) | $ | 4 | $ | 2,422 | ||||||||||||
Cumulative effect of adoption of new accounting pronouncements related to stock-based compensation | — | — | — | 5 | — | — | 5 | ||||||||||||||||||||
Net income | — | — | — | 213 | — | 4 | 217 | ||||||||||||||||||||
Other comprehensive loss | — | — | — | — | (4 | ) | — | (4 | ) | ||||||||||||||||||
Repurchase of common stock | (6.9 | ) | — | (195 | ) | — | — | — | (195 | ) | |||||||||||||||||
Exercise of stock options | 0.1 | — | 2 | — | — | — | 2 | ||||||||||||||||||||
Stock-based compensation | — | — | 57 | — | — | — | 57 | ||||||||||||||||||||
Issuance of shares for vesting of equity awards | 0.5 | — | — | — | — | — | — | ||||||||||||||||||||
Shares withheld for taxes on equity awards | (0.2 | ) | — | (6 | ) | — | — | — | (6 | ) | |||||||||||||||||
Dividends | — | — | (26 | ) | — | — | (3 | ) | (29 | ) | |||||||||||||||||
Balance at December 31, 2016 | 140.2 | $ | 1 | $ | 5,565 | $ | (3,062 | ) | $ | (40 | ) | $ | 5 | $ | 2,469 | ||||||||||||
Net income | — | — | — | 431 | — | 3 | 434 | ||||||||||||||||||||
Other comprehensive income | — | — | — | — | 3 | — | 3 | ||||||||||||||||||||
Repurchase of common stock | (9.5 | ) | — | (280 | ) | — | — | — | (280 | ) | |||||||||||||||||
Exercise of stock options | 0.3 | — | 8 | — | — | — | 8 | ||||||||||||||||||||
Stock-based compensation | — | — | 52 | — | — | — | 52 | ||||||||||||||||||||
Issuance of shares for vesting of equity awards | 1.0 | — | — | — | — | — | — | ||||||||||||||||||||
Shares withheld for taxes on equity awards | (0.4 | ) | — | (11 | ) | — | — | — | (11 | ) | |||||||||||||||||
Dividends | — | — | (49 | ) | — | — | (4 | ) | (53 | ) | |||||||||||||||||
Balance at December 31, 2017 | 131.6 | $ | 1 | $ | 5,285 | $ | (2,631 | ) | $ | (37 | ) | $ | 4 | $ | 2,622 | ||||||||||||
See Notes to Consolidated Financial Statements.
F-10
REALOGY HOLDINGS CORP. AND REALOGY GROUP LLC
NOTES TO CONSOLIDATED FINANCIAL STATEMENTS
(Unless otherwise noted, all amounts are in millions, except per share amounts)
1. | BASIS OF PRESENTATION |
Realogy Holdings Corp. ("Realogy Holdings", "Realogy" or the "Company") is a holding company for its consolidated subsidiaries including Realogy Intermediate Holdings LLC ("Realogy Intermediate") and Realogy Group LLC ("Realogy Group") and its consolidated subsidiaries. Realogy, through its subsidiaries, is a global provider of residential real estate services. Neither Realogy Holdings, the indirect parent of Realogy Group, nor Realogy Intermediate, the direct parent company of Realogy Group, conducts any operations other than with respect to its respective direct or indirect ownership of Realogy Group. As a result, the consolidated financial positions, results of operations, comprehensive income and cash flows of Realogy Holdings, Realogy Intermediate and Realogy Group are the same.
The accompanying Consolidated Financial Statements include the financial statements of Realogy Holdings and Realogy Group. Realogy Holdings' only asset is its investment in the common stock of Realogy Intermediate, and Realogy Intermediate's only asset is its investment in Realogy Group. Realogy Holdings' only obligations are its guarantees of certain borrowings and certain franchise obligations of Realogy Group. All expenses incurred by Realogy Holdings and Realogy Intermediate are for the benefit of Realogy Group and have been reflected in Realogy Group’s consolidated financial statements. The consolidated financial statements of the Company have been prepared in accordance with accounting principles generally accepted in the United States of America. All intercompany balances and transactions have been eliminated.
Business Description
The Company reports its operations in the following four business segments:
• | Real Estate Franchise Services (known as Realogy Franchise Group or RFG)—franchises the Century 21®, Coldwell Banker®, Coldwell Banker Commercial®, ERA®, Sotheby's International Realty® and Better Homes and Gardens® Real Estate brand names. As of December 31, 2017, our franchise systems and proprietary brands had approximately 14,800 offices (which included approximately 790 company owned brokerage offices) and approximately 289,000 independent sales agents (which included approximately 50,300 company owned brokerage independent sales agents) operating in the U.S. and 115 other countries and territories around the world. |
Our wholly-owned subsidiary, ZapLabs LLC, is the developer of our proprietary technology platform for the real estate brokerages and independent sales agents in our franchise system as well as their customers. We believe the Zap technology platform will increase the value proposition to franchisees, independent sales agents and customers as well as improve the productivity of independent sales agents.
• | Company Owned Real Estate Brokerage Services (known as NRT)—operates a full-service real estate brokerage business with approximately 790 owned and operated brokerage offices with approximately 50,300 independent sales agents principally under the Coldwell Banker®, Corcoran®, Sotheby’s International Realty®, ZipRealty® and Citi HabitatsSM brand names in more than 50 of the 100 largest metropolitan areas in the U.S. This segment also includes the Company's share of earnings for our PHH Home Loans venture, which is in the final stages of winding down as we transition to our new mortgage origination joint venture with Guaranteed Rate Affinity, which will be included in the financial results of the Title and Settlement Services segment. |
• | Relocation Services (known as Cartus®)—primarily offers clients employee relocation services such as homesale assistance, providing home equity advances to transferees (generally guaranteed by the individual's employer), home finding and other destination services, expense processing, relocation policy counseling and consulting services, arranging household goods moving services, coordinating visa and immigration support, intercultural and language training and group move management services. In addition, we provide home buying and selling assistance to members of affinity clients. |
• | Title and Settlement Services (known as Title Resource Group or TRG)—provides full-service title and settlement services to real estate companies, affinity groups, corporations and financial institutions with many of these services provided in connection with the Company's real estate brokerage and relocation services business. This segment also includes the Company's share of earnings, including start-up costs, for our Guaranteed Rate Affinity joint venture. |
F-11
2. SUMMARY OF SIGNIFICANT ACCOUNTING POLICIES
USE OF ESTIMATES
In presenting the consolidated financial statements, management makes estimates and assumptions that affect the amounts reported and related disclosures. Estimates, by their nature, are based on judgment and available information. Accordingly, actual results could differ materially from those estimates.
REVENUE RECOGNITION
Real Estate Franchise Services
The Company franchises its real estate brands to real estate brokerage businesses that are independently owned and operated. Franchise revenue principally consists of royalty and marketing fees from the Company’s franchisees. The royalty received is primarily based on a percentage of the franchisee’s gross commission income. Royalty fees are accrued as the underlying franchisee revenue is earned (upon close of the homesale transaction). Annual volume incentives given to certain franchisees on royalty fees are recorded as a reduction to revenue and are accrued for in relative proportion to the recognition of the underlying gross franchise revenue. Non-standard sales incentives are recorded as a reduction to revenue ratably over the related performance period or from the date of issuance through the remaining life of the related franchise agreement. Franchise revenue also includes initial franchise fees and initial area development fees, which are generally non-refundable and recognized by the Company as revenue when all material services or conditions relating to the sale have been substantially performed. The Company also earns marketing fees from its franchisees and utilizes such fees to fund marketing campaigns on behalf of its franchisees. As such, marketing revenue is earned as these funds are spent.
Company Owned Real Estate Brokerage Services
As an owner-operator of real estate brokerages, the Company assists home buyers and sellers in listing, marketing, selling and finding homes. Real estate commissions earned by the Company’s real estate brokerage business are recorded as revenue on a gross basis upon the closing of a real estate transaction (i.e., purchase or sale of a home), which are referred to as gross commission income. The commissions the Company pays to real estate agents are recognized concurrently with associated revenues and presented as the commission and other agent-related costs line item on the accompanying Consolidated Statements of Operations.
Relocation Services
The Company provides relocation services to corporate and government clients for the transfer of their employees ("transferees"). Such services include homesale assistance including the purchasing and/or selling of a transferee’s home and providing home equity advances to transferees (generally guaranteed by the individual's employer), arranging household goods moving services, and other relocation services such as expense processing, relocation policy counseling, relocation-related accounting, coordinating visa and immigration support, intercultural and language training and destination services. Clients may pay a bundled outsourcing management fee that can cover several of the relocation services listed, according the clients’ specific needs. In many cases, Cartus charges an outsourcing fee to the client that covers multiple relocation services that Cartus will deliver to the transferee. The Company earns revenues from fees charged to clients for the performance and/or facilitation of these services and recognizes such revenue as services are provided. In the majority of relocation transactions, the gain or loss on the sale of a transferee’s home is generally borne by the individual's employer. Furthermore, the Company recognizes household goods commission revenue for arranging household goods moving services on a net basis when the household goods reach the destination location. In addition, we provide home buying and selling assistance to members of Affinity organizations.
The Company earns referral commission revenue primarily from real estate brokers for the home sale and purchase of transferees and Affinity members, which is recognized at the time the underlying property closes, and revenues from other third-party service providers where the Company earns a referral commission, which is recognized at the time of completion of services.
Additionally, the Company generally earns interest income on the funds it advances on behalf of the transferring employee, which is recorded within other revenue (as is the corresponding interest expense on the securitization obligations) in the accompanying Consolidated Statements of Operations.
F-12
Title and Settlement Services
The Company provides title and closing services, which include title search procedures for title insurance policies, homesale escrow and other closing services. Title revenues, which are recorded net of amounts remitted to third-party insurance underwriters, and title and closing service fees are recorded at the time a homesale transaction or refinancing closes. The Company also owns an underwriter of title insurance. For independent title agents, the underwriter recognizes policy premium revenue on a gross basis (before deduction of agent commission) upon notice of policy issuance from the agent. For affiliated title agents, the underwriter recognizes the incremental policy premium revenue upon the effective date of the title policy as the agent commission revenue is already recognized by the affiliated title agent.
CONSOLIDATION
The Company consolidates any VIE for which it is the primary beneficiary with a controlling financial interest. Also, the Company consolidates an entity not deemed a VIE if its ownership, direct or indirect, exceeds 50% of the outstanding voting shares of an entity and/or it has the ability to control the financial or operating policies through its voting rights, board representation or other similar rights. For entities where the Company does not have a controlling interest (financial or operating), the investments in such entities are accounted for using the equity method or at fair value with changes in fair value recognized in net income, as appropriate. The Company applies the equity method of accounting when it has the ability to exercise significant influence over operating and financial policies of an investee. The Company measures all other investments at fair value with changes in fair value recognized in net income or in the case that an equity investment does not have readily determinable fair values, at cost minus impairment (if any) plus or minus changes resulting from observable price changes in orderly transactions for the identical or a similar investment.
CASH AND CASH EQUIVALENTS
The Company considers highly liquid investments with remaining maturities not exceeding three months at the date of purchase to be cash equivalents.
RESTRICTED CASH
Restricted cash primarily relates to amounts specifically designated as collateral for the repayment of outstanding borrowings under the Company’s securitization facilities. Such amounts approximated $7 million at both December 31, 2017 and 2016.
ALLOWANCE FOR DOUBTFUL ACCOUNTS
The Company estimates the allowance necessary to provide for uncollectible accounts receivable. The estimate is based on historical experience, combined with a review of current developments and includes specific accounts for which payment has become unlikely. The process by which the Company calculates the allowance begins in the individual business units where specific problem accounts are identified and reserved primarily based upon the age profile of the receivables and specific payment issues.
ADVERTISING EXPENSES
Advertising costs are generally expensed in the period incurred. Advertising expenses, recorded within the marketing expense line item on the Company’s Consolidated Statements of Operations, were approximately $211 million, $198 million and $194 million for the years ended December 31, 2017, 2016 and 2015, respectively.
DEBT ISSUANCE COSTS
Debt issuance costs include costs incurred in connection with obtaining debt and extending existing debt. These financing costs are presented in the balance sheet as a direct deduction from the carrying value of the associated debt liability, consistent with the presentation of a debt discount, with the exception of the debt issuance costs related to the Revolving Credit Facility and securitization obligations which are classified as a deferred financing asset within other assets. The debt issuance costs are amortized via the effective interest method and the amortization period is the life of the related debt.
INCOME TAXES
The Company’s provision for income taxes is determined using the asset and liability method, under which deferred tax assets and liabilities are calculated based upon the temporary differences between the financial statement and income tax
F-13
bases of assets and liabilities using currently enacted tax rates. These differences are based upon estimated differences between the book and tax basis of the assets and liabilities for the Company. Certain tax assets and liabilities of the Company may be adjusted in connection with the finalization of income tax audits.
The Company’s deferred tax assets are recorded net of a valuation allowance when, based on the weight of available evidence, it is more likely than not that all or some portion of the recorded deferred tax balances will not be realized in future periods. Decreases to the valuation allowance are recorded as reductions to the Company’s provision for income taxes and increases to the valuation allowance result in additional provision for income taxes.
DERIVATIVE INSTRUMENTS
The Company records derivatives and hedging activities on the balance sheet at their respective fair values. The Company uses foreign currency forward contracts largely to manage its exposure to changes in foreign currency exchange rates associated with its foreign currency denominated receivables and payables. The Company primarily manages its foreign currency exposure to the Euro, British Pound, Swiss Franc and Canadian Dollar. The Company has not elected to utilize hedge accounting for these forward contracts; therefore, any change in fair value is recorded in the Consolidated Statements of Operations. However, the fluctuations in the value of these forward contracts generally offset the impact of changes in the value of the underlying risk that they are intended to economically hedge.
The Company also enters into interest rate swaps to manage its exposure to changes in interest rates associated with its variable rate borrowings. At December 31, 2017, the Company has interest rate swaps with an aggregate notional value of $1,475 million to offset the variability in cash flows resulting from the term loan facilities as follows:
Notional Value (in millions) | Commencement Date | Expiration Date | |||
$225 | July 2012 | February 2018 | (a) | ||
$200 | January 2013 | February 2018 | (a) | ||
$600 | August 2015 | August 2020 | |||
$450 | November 2017 | (a) | November 2022 | ||
_______________
(a) | Interest rates swaps with a notional value of $425 million expired February 10, 2018, and interest rate swaps with a notional value of $450 million commenced in the fourth quarter of 2017. |
The swaps help to protect our outstanding variable rate borrowings from future interest rate volatility. The Company has not elected to utilize hedge accounting for these interest rate swaps; therefore, any change in fair value is recorded in the Consolidated Statements of Operations.
INVESTMENTS
The Company owned 49.9% of PHH Home Loans, a mortgage origination venture formed in 2005 for the purpose of originating and selling mortgage loans primarily sourced through the Company’s real estate brokerage and relocation businesses, while PHH Corporation ("PHH") owned the remaining percentage. In February 2017, Realogy announced that it and Guaranteed Rate, Inc. (“Guaranteed Rate”) agreed to form a new mortgage origination joint venture, Guaranteed Rate Affinity, LLC ("Guaranteed Rate Affinity"). During the third and fourth quarters of 2017, Guaranteed Rate Affinity, acquired certain assets of the mortgage operations of PHH Home Loans, including its four regional centers and employees across the United States, but not its mortgage assets. Guaranteed Rate Affinity began doing business in August 2017 on a phased-in basis.
Guaranteed Rate Affinity originates and markets its mortgage lending services to the Company's real estate brokerage and relocation subsidiaries as well as other real estate brokerage companies across the country. Guaranteed Rate owns a controlling 50.1% stake of Guaranteed Rate Affinity and the Company owns 49.9%. The Company has certain governance rights related to the joint venture, however it does not have control of the day-to-day operations of Guaranteed Rate Affinity. While the equity earnings or losses related to PHH Home Loans were included in the financial results of the Company Owned Real Estate Brokerage Services segment, the equity earnings or losses related to Guaranteed Rate Affinity are included in the financial results of the Title and Settlement Services segment.
At December 31, 2017 and 2016, the Company had various equity method investments aggregating $74 million and $66 million, respectively, which are recorded within other current and non-current assets on the accompanying Consolidated Balance Sheets. The $74 million investment balance at December 31, 2017 included $48 million for the Company's
F-14
investment in Guaranteed Rate Affinity and $19 million for the Company's investment in PHH Home Loans, which has ceased operations. The Company's remaining interest in PHH Home Loans is expected to be liquidated in the first half of 2018 and the Company expects to realize net cash proceeds of $19 million, reducing the investment balance to zero. The $66 million investment balance at December 31, 2016 included $59 million for the Company's investment in PHH Home Loans.
For the year ended December 31, 2017, the Company recorded equity earnings of $18 million which consisted of $35 million of earnings from the sale of PHH Home Loans' assets to Guaranteed Rate Affinity, partially offset by $7 million of exit costs and losses of $6 million from the continuing operations of PHH Home Loans. In addition, there was a $4 million loss from equity method investments at the Title and Settlement Services segment primarily related to costs associated with the start up of operations of Guaranteed Rate Affinity, including $3 million of amortization of intangible assets recorded in purchase accounting.
For the years ended December 31, 2016 and 2015, the Company recorded equity earnings of $12 million and $16 million, respectively, which consisted of $8 million and $14 million, respectively, relating to its investment in PHH Home Loans.
The Company received $60 million, $7 million and $10 million in cash dividends, primarily from PHH Home Loans, during the years ended December 31, 2017, 2016 and 2015, respectively. The Company invested $55 million of cash into Guaranteed Rate Affinity during the year ended December 31, 2017.
PROPERTY AND EQUIPMENT
Property and equipment (including leasehold improvements) are initially recorded at cost, net of accumulated depreciation and amortization. Depreciation, recorded as a component of depreciation and amortization on the Consolidated Statements of Operations, is computed utilizing the straight-line method over the estimated useful lives of the related assets. Amortization of leasehold improvements, also recorded as a component of depreciation and amortization, is computed utilizing the straight-line method over the estimated benefit period of the related assets or the lease term, if shorter. Useful lives are 30 years for buildings, up to 20 years for leasehold improvements, and from 3 to 7 years for furniture, fixtures and equipment.
The Company capitalizes the costs of software developed for internal use which commences during the development phase of the project. The Company amortizes software developed or obtained for internal use on a straight-line basis, generally from 1 to 5 years, when such software is ready for use. The net carrying value of software developed or obtained for internal use was $86 million and $83 million at December 31, 2017 and 2016, respectively.
IMPAIRMENT OF GOODWILL, INTANGIBLE ASSETS AND OTHER LONG-LIVED ASSETS
Goodwill represents the excess of acquisition costs over the fair value of the net tangible assets and identifiable intangible assets acquired in a business combination. Indefinite-lived intangible assets primarily consist of trademarks acquired in business combinations. Goodwill and indefinite-lived assets are not amortized, but are subject to impairment testing. The aggregate carrying values of our goodwill and other indefinite-lived intangible assets were $3,710 million and $767 million, respectively, at December 31, 2017 and are subject to impairment testing annually as of October 1, or whenever events or changes in circumstances indicate that the carrying amount may not be fully recoverable. This testing compares carrying values to fair values and, when appropriate, the carrying value is reduced to fair value. In testing goodwill, the fair value of our reporting units is estimated utilizing a discounted cash flow approach utilizing long-term cash flow forecasts and our annual operating plans adjusted for terminal value assumptions.
We determine the fair value of our reporting units utilizing our best estimate of future revenues, operating expenses, cash flows, market and general economic conditions as well as assumptions that we believe marketplace participants would utilize including discount rates, cost of capital, trademark royalty rates and long-term growth rates. The trademark royalty rate was determined by reviewing similar trademark agreements with third parties. Although we believe our assumptions are reasonable, actual results may vary significantly. These impairment tests involve the use of accounting estimates and assumptions, changes in which could materially impact our financial condition or operating performance if actual results differ from such estimates and assumptions. To address this uncertainty, we perform sensitivity analysis on key estimates and assumptions.
Based upon the impairment analysis performed in the fourth quarter of 2017, 2016 and 2015, there was no impairment of goodwill or other indefinite-lived intangible assets for these years. Management evaluated the effect of lowering the
F-15
estimated fair value for each of the reporting units by 10% and determined that no impairment of goodwill would have been recognized under this evaluation for 2017, 2016 or 2015.
The Company evaluates the recoverability of its other long-lived assets, including amortizable intangible assets, if circumstances indicate an impairment may have occurred. This analysis is performed by comparing the respective carrying values of the assets to the current and expected future cash flows, on an undiscounted basis, to be generated from such assets. Property and equipment is evaluated separately within each business unit. If such analysis indicates that the carrying value of these assets is not recoverable, then the carrying value of such assets is reduced to fair value through a charge to the Company’s Consolidated Statements of Operations. There were no impairments relating to other long-lived assets, including amortizable intangible assets, during 2017, 2016 or 2015.
SUPPLEMENTAL CASH FLOW INFORMATION
Significant non-cash transactions in 2017, 2016 and 2015 included $18 million, $14 million and $17 million, respectively, in capital lease additions, which resulted in non-cash additions to property and equipment, net and other non-current liabilities.
STOCK-BASED COMPENSATION
The Company grants stock-based awards to certain senior management, employees and directors including non-qualified stock options, restricted stock, restricted stock units and performance share units.
The fair value of non-qualified stock options is estimated using the Black-Scholes option pricing model on the grant date and is recognized as expense over the service period based on the vesting requirements. The fair value of restricted stock, restricted stock units and performance share units without a market condition is measured based on the closing price of the Company's common stock on the grant date and is recognized as expense over the service period of the award, or when requisite performance metrics or milestones are probable of being achieved. The fair value of awards with a market condition are estimated using the Monte Carlo simulation method and expense is recognized on a straight-line basis over the requisite service period of the award. The Company recognizes forfeitures as they occur. Determining the fair value of stock-based awards at the grant date requires considerable judgment, including estimating expected volatility and expected term, risk-free rate.
RECENTLY ADOPTED ACCOUNTING PRONOUNCEMENTS
In August 2016, the FASB issued a new standard on classification of cash receipts and payments on the statement of cash flows intending to reduce diversity in practice on how certain transactions are classified. In addition, in November 2016, the FASB issued a new standard requiring that the statement of cash flows explain the change during the period in the total of cash, cash equivalents, and amounts generally described as restricted cash or restricted cash equivalents. The Company elected to early adopt these ASUs in the fourth quarter of 2017 using retrospective application at the beginning of the earliest comparative period presented in the year of adoption, January 1, 2015. Adoption of the new guidance resulted in the following key changes:
• | Contingent consideration for business acquisitions - Prior to adoption of the new guidance, the Company classified payments of contingent consideration for business acquisitions on a separate line in the financing section of its Consolidated Statement of Cash Flows. Under the new guidance, payments of contingent consideration are separated and classified as investing activities for payments made soon after the acquisition’s consummation date (three months or less), financing activities for payments made up to the original acquisition date amount of the contingent consideration liability and operating activities for payments made in excess of the original amount of the contingent consideration liability. |
• | Debt prepayments or extinguishment - Prior to adoption of the new guidance, the Company classified cash paid for fees associated with the prepayment or extinguishment of debt in the operating section of its Consolidated Statement of Cash Flows as part of net income (loss), adding back only the non-cash portion as an adjustment to reconcile net income (loss) to net cash provided (used) by operating activities. Under the new guidance, all cash paid for fees associated with the prepayment or extinguishment of debt is classified as financing activities and the total of the cash and non-cash portions are added back in the operating section. |
• | Restricted Cash - Prior to adoption of the new guidance, the Company presented the change in restricted cash as a separate line in the investing section of its Consolidated Statement of Cash Flows. Under the new guidance, restricted cash is presented with cash and cash equivalents on the Consolidated Statement of Cash Flows and the |
F-16
activity is now reflected in the total change in cash, cash equivalents and restricted cash. Additionally, for reconciliation purposes, the Company broke out restricted cash as a separate line on the Company’s Consolidated Balance Sheet.
Adoption of the new guidance resulted in reclassifications between cash flow categories, but no net cash impact to its Consolidated Statement of Cash Flows.
RECENTLY ISSUED ACCOUNTING PRONOUNCEMENTS
The Company considers the applicability and impact of all Accounting Standards Updates. ASUs not listed below were assessed and determined to be either not applicable or are expected to have minimal impact on our consolidated financial position or results of operations.
In February 2018, the FASB issued a new standard which permits companies to reclassify certain income tax effects resulting from the 2017 Tax Act, called "stranded tax effects", from accumulated other comprehensive income ("AOCI") to retained earnings. According to the new guidance, the reclassification amount should include the effect of the change in the U.S. federal corporate income tax rate on the gross deferred tax amounts and related valuation allowances, if any, at the date of enactment of the 2017 Tax Act related to items remaining in AOCI. The guidance is effective for all companies for fiscal years beginning after December 15, 2018, and interim periods within those fiscal years. Early adoption is permitted, including adoption in any interim period for public companies who have not yet issued financial statements. The Company expects to adopt this standard in the first quarter of 2018 which is expected to result in a debit to AOCI and a credit to Retained Earnings/Accumulated Deficit of approximately $9 million.
In February 2016, the FASB issued its new standard on leases which requires virtually all leases to be recognized on the balance sheet. Lessees will recognize a right-of-use asset and a lease liability for all leases (other than leases that meet the definition of a short-term lease). The liability will be equal to the present value of lease payments. The asset will be based on the liability, subject to adjustment, such as for initial direct costs. For income statement purposes, the FASB retained a dual model, requiring leases to be classified as either operating or finance leases. Operating leases will result in straight-line expense, similar to current operating leases, while finance leases will result in a front-loaded expense pattern, similar to current capital leases. Classification will be based on criteria that are largely similar to those applied in current lease accounting, but without explicit bright lines. The new standard is effective for annual periods beginning after December 15, 2018. Early adoption is permitted. The new leasing standard requires modified retrospective transition, which requires application of the new guidance at the beginning of the earliest comparative period presented in the year of adoption. In January 2018, the FASB issued a proposed ASU that would allow entities to elect a simplified transition approach which would require applying the provisions of the new guidance at the effective date (e.g., January 1, 2019) as opposed to the earliest period presented under the modified retrospective approach (January 1, 2017). While the Company is still evaluating the impact of the standard on its consolidated financial statements, it does expect that the right to use asset and lease liability recorded on its Consolidated Balance Sheets will be material. The Company currently discloses its future lease obligations in Note 13. "Commitments and Contingencies". The Company is in the process of implementing a new lease management system which will be utilized to account for leases under the new guidance once adopted.
In May 2014, the FASB issued a standard on revenue recognition that will impact most companies to some extent. The objective of the revenue standard is to provide a single, comprehensive revenue recognition model for all contracts with customers to improve comparability within industries, across industries, and across capital markets. The revenue standard contains principles that an entity will apply to determine the measurement of revenue and the timing of revenue recognition. The new standard permits for two alternative implementation methods, the use of either (1) full retrospective application to each prior reporting period presented or (2) modified retrospective application in which the cumulative effect of initially applying the revenue standard is recognized as an adjustment to the opening balance of retained earnings in the period of adoption. The Company will adopt the new standard in the first quarter of 2018 using the modified retrospective transition method. The Company has redrafted its revenue recognition accounting policies affected by the standard, assessed the redesign of internal controls, as well as evaluated the expanded disclosure requirements. After thorough review of the Company's revenue streams, the Company determined that the new standard will not have a material impact on financial results as the majority of the Company's revenue is recognized at a point in time, at the completion of a homesale transaction, which will not change under the new revenue recognition guidance.
3. | ACQUISITIONS |
Assets acquired and liabilities assumed in business combinations were recorded in the Company’s Consolidated Balance Sheets as of the respective acquisition dates based upon their estimated fair values at such dates. The results of
F-17
operations of businesses acquired by the Company have been included in the Company’s Consolidated Statements of Operations since their respective dates of acquisition.
In connection with the Company’s acquisition of real estate brokerage operations, the Company obtains contractual pendings and listings intangible assets, which represent the estimated fair value of homesale transactions that are pending closing or homes listed for sale by the acquired brokerage operations. Pendings and listings intangible assets are amortized over the estimated closing period of the underlying contracts and homes listed for sale, which in most cases is approximately five months.
2017 Acquisitions
During the year ended December 31, 2017, the Company acquired sixteen real estate brokerage operations through its wholly owned subsidiary, NRT, for aggregate cash consideration of $11 million and established $3 million of contingent consideration. These acquisitions resulted in goodwill of $10 million, pendings and listings of $2 million, customer relationships of $1 million and other intangibles of $1 million.
During the year ended December 31, 2017, the Company acquired two title and settlement operations through its wholly owned subsidiary, TRG, for cash consideration of $8 million and established $4 million of contingent consideration. These acquisitions resulted in goodwill of $9 million, pendings of $2 million and other intangible items of $1 million including tradenames.
None of the 2017 acquisitions were significant to the Company’s results of operations, financial position or cash flows individually or in the aggregate.
2016 Acquisitions
During the year ended December 31, 2016, the Company acquired eleven real estate brokerage and property management operations through its wholly owned subsidiary, NRT, for aggregate cash consideration of $74 million and established $9 million of contingent consideration. These acquisitions resulted in goodwill of $52 million, customer relationships of $20 million, pendings and listings of $6 million, other intangibles of $3 million, other assets of $5 million and other liabilities of $3 million.
During the year ended December 31, 2016, the Company acquired one title and settlement operation through its wholly owned subsidiary, TRG, for cash consideration of $24 million and established $10 million of contingent consideration. This acquisition resulted in goodwill of $20 million, title plant of $7 million, pendings of $5 million, trademarks of $3 million, other intangibles of $2 million, other assets of $6 million and other liabilities of $9 million.
None of the 2016 acquisitions were significant to the Company’s results of operations, financial position or cash flows individually or in the aggregate.
2015 Acquisitions
During the year ended December 31, 2015, the Company acquired thirteen real estate brokerage related operations through its wholly owned subsidiary, NRT, including a large franchisee of the Real Estate Franchise segment, for aggregate cash consideration of $96 million and established $13 million of liabilities related to contingent consideration and other acquisition related liabilities. These acquisitions resulted in goodwill of $94 million, pendings and listings of $10 million, other intangibles of $1 million, other assets of $7 million and other liabilities of $3 million.
During the year ended December 31, 2015, the Company acquired three title and settlement operations through its wholly owned subsidiary, TRG, for cash consideration of $34 million and established $37 million of liabilities related to contingent consideration. These acquisitions resulted in goodwill of $47 million, trademarks of $9 million, pendings of $8 million, other intangibles of $5 million, title plant shares of $1 million and other assets of $1 million.
None of the 2015 acquisitions were significant to the Company’s results of operations, financial position or cash flows individually or in the aggregate.
F-18
4. | INTANGIBLE ASSETS |
Goodwill by segment and changes in the carrying amount are as follows:
Real Estate Franchise Services | Company Owned Brokerage Services | Relocation Services | Title and Settlement Services | Total Company | |||||||||||||||
Balance at January 1, 2015 | $ | 2,292 | $ | 747 | $ | 360 | $ | 78 | $ | 3,477 | |||||||||
Goodwill acquired | — | 94 | — | 47 | 141 | ||||||||||||||
Balance at December 31, 2015 | 2,292 | 841 | 360 | 125 | 3,618 | ||||||||||||||
Goodwill acquired | — | 52 | — | 20 | 72 | ||||||||||||||
Balance at December 31, 2016 | 2,292 | 893 | 360 | 145 | 3,690 | ||||||||||||||
Goodwill acquired | — | 11 | — | 9 | 20 | ||||||||||||||
Balance at December 31, 2017 | $ | 2,292 | $ | 904 | $ | 360 | $ | 154 | $ | 3,710 | |||||||||
Goodwill and accumulated impairment summary | |||||||||||||||||||
Gross goodwill | $ | 3,315 | $ | 1,062 | $ | 641 | $ | 478 | $ | 5,496 | |||||||||
Accumulated impairment losses (a) | (1,023 | ) | (158 | ) | (281 | ) | (324 | ) | (1,786 | ) | |||||||||
Balance at December 31, 2017 | $ | 2,292 | $ | 904 | $ | 360 | $ | 154 | $ | 3,710 | |||||||||
_______________
(a) | During the fourth quarter of 2008 and 2007 the Company recorded impairment charges, which reduced goodwill by $1,279 million and $507 million, respectively. No goodwill or unamortized intangible asset impairments have been recorded since 2008. |
Intangible assets are as follows:
As of December 31, 2017 | As of December 31, 2016 | ||||||||||||||||||||||
Gross Carrying Amount | Accumulated Amortization | Net Carrying Amount | Gross Carrying Amount | Accumulated Amortization | Net Carrying Amount | ||||||||||||||||||
Amortizable—Franchise agreements (a) | $ | 2,019 | $ | 725 | $ | 1,294 | $ | 2,019 | $ | 658 | $ | 1,361 | |||||||||||
Indefinite life—Trademarks (b) | $ | 749 | $ | 749 | $ | 748 | $ | 748 | |||||||||||||||
Other Intangibles | |||||||||||||||||||||||
Amortizable—License agreements (c) | $ | 45 | $ | 10 | $ | 35 | $ | 45 | $ | 9 | $ | 36 | |||||||||||
Amortizable—Customer relationships (d) | 549 | 335 | 214 | 550 | 312 | 238 | |||||||||||||||||
Indefinite life—Title plant shares (e) | 18 | 18 | 18 | 18 | |||||||||||||||||||
Amortizable—Pendings and listings (f) | 2 | 1 | 1 | 6 | 5 | 1 | |||||||||||||||||
Amortizable—Other (g) | 33 | 17 | 16 | 33 | 13 | 20 | |||||||||||||||||
Total Other Intangibles | $ | 647 | $ | 363 | $ | 284 | $ | 652 | $ | 339 | $ | 313 | |||||||||||
_______________
(a) | Generally amortized over a period of 30 years. |
(b) | Primarily relates to the Century 21®, Coldwell Banker®, ERA®, Corcoran®, Coldwell Banker Commercial® and Cartus tradenames, which are expected to generate future cash flows for an indefinite period of time. |
(c) | Relates to the Sotheby’s International Realty® and Better Homes and Gardens® Real Estate agreements which are being amortized over 50 years (the contractual term of the license agreements). |
(d) | Relates to the customer relationships at the Relocation Services segment, the Title and Settlement Services segment, the Real Estate Franchise Services segment and our Company Owned Real Estate Brokerage Services segment. These relationships are being amortized over a period of 2 to 20 years. |
(e) | Ownership in a title plant is required to transact title insurance in certain states. The Company expects to generate future cash flows for an indefinite period of time. |
(f) | Generally amortized over a period of 5 months. |
(g) | Consists of covenants not to compete which are amortized over their contract lives and other intangibles which are generally amortized over periods ranging from 5 to 10 years. |
F-19
Intangible asset amortization expense is as follows:
For the Year Ended December 31, | |||||||||||
2017 | 2016 | 2015 | |||||||||
Franchise agreements | $ | 67 | $ | 67 | $ | 67 | |||||
License agreements | 1 | 1 | 1 | ||||||||
Customer relationships | 25 | 28 | 28 | ||||||||
Pendings and listings | 4 | 12 | 16 | ||||||||
Other | 5 | 5 | 5 | ||||||||
Total | $ | 102 | $ | 113 | $ | 117 | |||||
Based on the Company’s amortizable intangible assets as of December 31, 2017, the Company expects related amortization expense to be approximately $98 million, $97 million, $95 million, $93 million, $92 million and $1,085 million in 2018, 2019, 2020, 2021, 2022 and thereafter, respectively.
5. | FRANCHISING AND MARKETING ACTIVITIES |
Franchise fee revenue includes domestic initial franchise fees and international area development fees of $8 million for each of the years ended December 31, 2017, 2016 and 2015. In addition, franchise fee revenue is net of annual volume incentives provided to real estate franchisees of $62 million, $56 million and $51 million for the years ended December 31, 2017, 2016 and 2015, respectively. The Company’s real estate franchisees may receive volume incentives on their royalty payments. Such annual incentives are based upon the amount of the franchisees commission income earned and paid to the Company during the calendar year. Each brand has several different annual incentive schedules currently in effect.
The Company’s wholly owned real estate brokerage services segment, NRT, pays royalties to the Company’s franchise business; however, such amounts are eliminated in consolidation. NRT paid royalties to the Real Estate Franchise Services segment of $299 million, $282 million and $284 million for the years ended December 31, 2017, 2016 and 2015, respectively.
Marketing fees are generally paid by the Company’s real estate franchisees and are generally calculated based on a specified percentage of gross closed commissions earned on real estate transactions, and may be subject to certain minimum and maximum payments. Brand marketing fund revenue was $87 million, $83 million and $83 million for the years ended December 31, 2017, 2016 and 2015, respectively, which included marketing fees paid to the Real Estate Franchise Services segment from NRT of $12 million, $11 million and $11 million for the years ended December 31, 2017, 2016 and 2015, respectively. As provided for in the franchise agreements and generally at the Company’s discretion, all of these fees are to be expended for marketing purposes.
The number of franchised and company owned offices in operation are as follows:
(Unaudited) As of December 31, | ||||||||
2017 | 2016 | 2015 | ||||||
Franchised: | ||||||||
Century 21® | 7,973 | 7,330 | 6,897 | |||||
ERA® | 2,298 | 2,347 | 2,355 | |||||
Coldwell Banker® | 2,330 | 2,289 | 2,258 | |||||
Coldwell Banker Commercial® | 180 | 180 | 163 | |||||
Sotheby’s International Realty® | 905 | 836 | 794 | |||||
Better Homes and Gardens® Real Estate | 353 | 332 | 304 | |||||
Total Franchised | 14,039 | 13,314 | 12,771 | |||||
Company Owned: | ||||||||
Coldwell Banker® | 707 | 708 | 708 | |||||
Sotheby’s International Realty® | 41 | 41 | 41 | |||||
Corcoran®/Other | 41 | 40 | 38 | |||||
Total Company Owned | 789 | 789 | 787 | |||||
F-20
The number of franchised and company owned offices (in the aggregate) changed as follows:
(Unaudited) For the Year Ended December 31, | ||||||||
2017 | 2016 | 2015 | ||||||
Franchised: | ||||||||
Beginning balance | 13,314 | 12,771 | 12,769 | |||||
Additions | 1,137 | 847 | 445 | |||||
Terminations | (412 | ) | (304 | ) | (443 | ) | ||
Ending balance | 14,039 | 13,314 | 12,771 | |||||
Company Owned: | ||||||||
Beginning balance | 789 | 787 | 727 | |||||
Additions | 20 | 38 | 74 | |||||
Closures | (20 | ) | (36 | ) | (14 | ) | ||
Ending balance | 789 | 789 | 787 | |||||
As of December 31, 2017, there were an insignificant number of franchise agreements that were executed for which offices are not yet operating. Additionally, as of December 31, 2017, there were an insignificant number of franchise agreements pending termination.
In order to assist franchisees in converting to one of the Company’s brands or as an incentive to renew their franchise agreement, the Company may at its discretion, provide non-standard incentives, primarily in the form of conversion notes. Provided the franchisee meets certain minimum annual revenue thresholds during the term of the notes and is in compliance with the terms of the franchise agreement, the amount of the note is forgiven annually in equal ratable amounts over the life of the franchise agreement. Otherwise, related principal is due and payable to the Company. The amount of such franchisee conversion notes were $124 million, net of less than $1 million of reserves, and $123 million, net of less than $1 million of reserves, at December 31, 2017 and 2016, respectively. These notes are principally classified within other non-current assets in the Company’s Consolidated Balance Sheets. The Company recorded a contra-revenue in the statement of operations related to the forgiveness and impairment of these notes and other sales incentives of $25 million, $24 million and $22 million for the years ended December 31, 2017, 2016 and 2015, respectively.
6. | PROPERTY AND EQUIPMENT, NET |
Property and equipment, net consisted of:
December 31, | |||||||
2017 | 2016 | ||||||
Furniture, fixtures and equipment | $ | 281 | $ | 254 | |||
Capitalized software | 366 | 351 | |||||
Building and leasehold improvements | 265 | 235 | |||||
Land | 3 | 3 | |||||
Gross property and equipment | 915 | 843 | |||||
Less: accumulated depreciation | (626 | ) | (576 | ) | |||
Property and equipment, net | $ | 289 | $ | 267 | |||
The Company recorded depreciation expense related to property and equipment of $96 million, $89 million and $84 million for the years ended December 31, 2017, 2016 and 2015, respectively.
F-21
7. | ACCRUED EXPENSES AND OTHER CURRENT LIABILITIES |
Accrued expenses and other current liabilities consisted of:
December 31, | |||||||
2017 | 2016 | ||||||
Accrued payroll and related employee costs | $ | 140 | $ | 138 | |||
Accrued volume incentives | 41 | 40 | |||||
Accrued commissions | 38 | 31 | |||||
Restructuring accruals | 5 | 14 | |||||
Deferred income | 68 | 69 | |||||
Accrued interest | 13 | 13 | |||||
Contingent consideration for acquisitions | 26 | 24 | |||||
Due to former parent | 18 | 28 | |||||
Other | 129 | 106 | |||||
Total accrued expenses and other current liabilities | $ | 478 | $ | 463 | |||
8. | SHORT AND LONG-TERM DEBT |
Total indebtedness is as follows:
December 31, | |||||||
2017 | 2016 | ||||||
Senior Secured Credit Facility: | |||||||
Revolving Credit Facility | $ | 70 | $ | 200 | |||
Term Loan B | 1,063 | 1,069 | |||||
Term Loan A Facility: | |||||||
Term Loan A | 390 | 411 | |||||
Term Loan A-1 | 339 | 347 | |||||
4.50% Senior Notes | 444 | 439 | |||||
5.25% Senior Notes | 546 | 545 | |||||
4.875% Senior Notes | 496 | 496 | |||||
Total Short-Term & Long-Term Debt | $ | 3,348 | $ | 3,507 | |||
Securitization obligations: | |||||||
Apple Ridge Funding LLC | $ | 181 | $ | 192 | |||
Cartus Financing Limited | 13 | 13 | |||||
Total securitization obligations | $ | 194 | $ | 205 | |||
Indebtedness Table
As of December 31, 2017, the Company’s borrowing arrangements were as follows:
Interest Rate | Expiration Date | Principal Amount | Unamortized Discount and Debt Issuance Costs | Net Amount | |||||||||||
Senior Secured Credit Facility: | |||||||||||||||
Revolving Credit Facility (1) | (2) | October 2020 | $ | 70 | $ * | $ | 70 | ||||||||
Term Loan B | (3) | July 2022 | 1,083 | 20 | 1,063 | ||||||||||
Term Loan A Facility: | |||||||||||||||
Term Loan A | (4) | October 2020 | 391 | 1 | 390 | ||||||||||
Term Loan A-1 | (5) | July 2021 | 342 | 3 | 339 | ||||||||||
Senior Notes | 4.50% | April 2019 | 450 | 6 | 444 | ||||||||||
Senior Notes | 5.25% | December 2021 | 550 | 4 | 546 | ||||||||||
Senior Notes | 4.875% | June 2023 | 500 | 4 | 496 | ||||||||||
Securitization obligations: (6) | |||||||||||||||
Apple Ridge Funding LLC (7) | June 2018 | 181 | * | 181 | |||||||||||
Cartus Financing Limited (8) | August 2018 | 13 | * | 13 | |||||||||||
Total (9) | $ | 3,580 | $ | 38 | $ | 3,542 | |||||||||
F-22
_______________
* | The debt issuance costs related to our Revolving Credit Facility and securitization obligations are classified as a deferred financing asset within other assets. |
(1) | As of December 31, 2017, the Company had $1,050 million of borrowing capacity under its Revolving Credit Facility, leaving $980 million of available capacity. The Revolving Credit Facility expires in October 2020, but is classified on the balance sheet as current due to the revolving nature of the facility. On February 23, 2018, the Company had $242 million in outstanding borrowings under the New Revolving Credit Facility, leaving $1,158 million of available capacity. See Note 19, "Subsequent Events" for a description of the February 2018 refinancing. |
(2) | Interest rates with respect to revolving loans under the Senior Secured Credit Facility at December 31, 2017 were based on, at the Company's option, (a) adjusted LIBOR plus an additional margin or (b) ABR plus an additional margin, in each case subject to adjustment based on the then current senior secured leverage ratio. Based on the previous quarter senior secured leverage ratio, the LIBOR margin was 2.00% and the ABR margin was 1.00% for the three months ended December 31, 2017. |
(3) | The Term Loan B provided for quarterly amortization payments totaling 1% per annum of the original principal amount. The interest rate with respect to term loans under the Term Loan B was based on, at the Company’s option, (a) adjusted LIBOR plus 2.25% (with a LIBOR floor of 0.75%) or (b) JPMorgan Chase Bank, N.A.’s prime rate ("ABR") plus 1.25% (with an ABR floor of 1.75%). See Note 19, "Subsequent Events" for a description of the February 2018 refinancing. |
(4) | The Term Loan A provided for quarterly amortization payments, which commenced March 31, 2016, totaling per annum 5%, 5%, 7.5%, 10.0% and 12.5% of the original principal amount of the Term Loan A in 2016, 2017, 2018, 2019 and 2020, respectively. The interest rates with respect to term loans under the Term Loan A were based on, at the Company's option, (a) adjusted LIBOR plus an additional margin or (b) ABR plus an additional margin, in each case subject to adjustment based on the then current senior secured leverage ratio. Based on the previous quarter senior secured leverage ratio, the LIBOR margin was 2.00% and the ABR margin was 1.00% for the three months ended December 31, 2017. See Note 19, "Subsequent Events" for a description of the February 2018 refinancing. |
(5) | The Term Loan A-1 provided for quarterly amortization payments, which commenced on September 30, 2016, totaling per annum 2.5%, 2.5%, 5%, 7.5% and 10.0% of the original principal amount of the Term Loan A-1, with the last amortization payment made on June 30, 2021. The interest rates with respect to term loans under the Term Loan A-1 were based on, at the Company's option, (a) adjusted LIBOR plus an additional margin or (b) ABR plus an additional margin, in each case subject to adjustment based on the then current senior secured leverage ratio. Based on the previous quarter senior secured leverage ratio, the LIBOR margin was 2.00% and the ABR margin was 1.00% for the three months ended December 31, 2017. See Note 19, "Subsequent Events" for a description of the February 2018 refinancing. |
(6) | Available capacity is subject to maintaining sufficient relocation related assets to collateralize these securitization obligations. |
(7) | In November 2017, the capacity of the Apple Ridge facility was reduced from $325 million to $250 million. As of December 31, 2017, the Company had $250 million of borrowing capacity under the Apple Ridge Funding LLC securitization program leaving $69 million of available capacity. |
(8) | Consists of a £10 million revolving loan facility and a £5 million working capital facility. As of December 31, 2017, the Company had $20 million of borrowing capacity under the Cartus Financing Limited securitization program leaving $7 million of available capacity. |
(9) | Not included in this table is the Company's Unsecured Letter of Credit Facility which had a capacity of $74 million with $69 million utilized at a weighted average rate of 3.24% at December 31, 2017. |
Maturities Table
As of December 31, 2017, the combined aggregate amount of maturities for long-term borrowings, excluding securitization obligations, for each of the next five years is as follows:
Year | Amount | |||
2018 (a) | $ | 127 | ||
2019 | 527 | |||
2020 | 356 | |||
2021 | 837 | |||
2022 | 1,039 | |||
_______________
(a) | The current portion of long-term debt consists of four quarters of 2018 amortization payments totaling $33 million, $13 million and $11 million for the Term Loan A, Term Loan A-1 and Term Loan B facilities, respectively, as well as $70 million of revolver borrowings under the revolving credit facility which expires in October 2020, but are classified on the balance sheet as current due to the revolving nature of the facility. See Note 19, "Subsequent Events" for a description of the February 2018 refinancing. |
F-23
Senior Secured Credit Facility
In July 2016, the Company entered into a third amendment (the "Third Amendment") to the Amended and Restated Credit Agreement dated as of March 5, 2013, as amended. The Third Amendment replaced the $1,858 million Term Loan B due March 2020 with a new $1,100 million Term Loan B due July 20, 2022. In January 2017, the Company entered into a fourth amendment (the "Fourth Amendment") to the Amended and Restated Credit Agreement (as so amended, the "Senior Secured Credit Agreement") that repriced the Term Loan B through a refinancing of the existing term loan with a new Term Loan B. The Fourth Amendment reduced the interest rate by 75 basis points but did not change the maturity date for the Term Loan B. The Company also entered into an Incremental Assumption Agreement to the Senior Secured Credit Agreement pursuant to which the Company increased the borrowing capacity under its Revolving Credit Facility to $1,050 million from the existing $815 million.
The Senior Secured Credit Agreement provides for:
(a) | a Term Loan B issued in the original aggregate principal amount of $1,100 million with a maturity date of July 2022. The Term Loan B has quarterly amortization payments totaling 1% per annum of the initial aggregate principal amount. The interest rate with respect to term loans under the Term Loan B is based on, at Realogy Group's option, adjusted LIBOR plus 2.25% (with a LIBOR floor of 0.75%) or ABR plus 1.25% (with an ABR floor of 1.75%); and |
(b) | a $1,050 million Revolving Credit Facility with a maturity date of October 23, 2020, which includes (i) a $125 million letter of credit subfacility and (ii) a swingline loan subfacility. The interest rate with respect to revolving loans under the Revolving Credit Facility is based on, at Realogy Group's option, adjusted LIBOR or ABR plus an additional margin subject to the following adjustments based on the Company’s then current senior secured leverage ratio: |
Senior Secured Leverage Ratio | Applicable LIBOR Margin | Applicable ABR Margin | ||
Greater than 3.50 to 1.00 | 2.50% | 1.50% | ||
Less than or equal to 3.50 to 1.00 but greater than or equal to 2.50 to 1.00 | 2.25% | 1.25% | ||
Less than 2.50 to 1.00 | 2.00% | 1.00% | ||
The Senior Secured Credit Agreement permits the Company to obtain up to $500 million of additional credit facilities from lenders reasonably satisfactory to the administrative agent and us, without the consent of the existing lenders under the new senior secured credit facility, plus an unlimited amount if Realogy Group's senior secured leverage ratio is less than 3.50 to 1.00 on a pro forma basis. Subject to certain restrictions, the Senior Secured Credit Agreement also permits us to issue senior secured or unsecured notes in lieu of any incremental facility.
The obligations under the Senior Secured Credit Agreement are secured to the extent legally permissible by substantially all of the assets of Realogy Group, Realogy Intermediate and all of their domestic subsidiaries, other than certain excluded subsidiaries.
Realogy Group’s Senior Secured Credit Agreement contains financial, affirmative and negative covenants and requires Realogy Group to maintain a senior secured leverage ratio, not to exceed 4.75 to 1.00. The leverage ratio is tested quarterly regardless of the amount of borrowings outstanding and letters of credit issued under the revolver at the testing date. Total senior secured net debt does not include unsecured indebtedness, including the Unsecured Notes as well as the securitization obligations. At December 31, 2017, Realogy Group was in compliance with the senior secured leverage ratio covenant.
See Note 19, "Subsequent Events" for a description of the Refinancing in February 2018 which resulted in: (i) increasing the capacity of the revolving credit facility from $1,050 million to $1,400 million and extending the maturity date from October 2020 to February 2023; (ii) aggregating the existing Term Loan A and Term Loan A-1 tranches due October 2020 and July 2021, respectively, into a new single tranche of $750 million Term Loan A due February 2023; and (iii) refinancing the existing $1,083 million Term Loan B due July 2022 with a new Term Loan B issued at par in the amount of $1,080 million with a maturity date in February 2025.
F-24
Term Loan A Facility
In October 2015, Realogy Group entered into the Term Loan A senior secured credit agreement which provides for a five-year, $435 million loan issued at par with a maturity date of October 23, 2020 (the “Term Loan A”) and has terms substantially similar to the Senior Secured Credit Agreement. The Term Loan A provides for quarterly amortization payments, which commenced March 31, 2016, totaling the amount per annum equal to the following percentages of the original principal amount of the Term Loan A: 5%, 5%, 7.5%, 10.0% and 12.5% for amortizations payable in 2016, 2017, 2018, 2019 and 2020, with the balance payable upon the final maturity date. The interest rates with respect to term loans under the Term Loan A are based on, at our option, adjusted LIBOR or ABR plus an additional margin subject to the following adjustments based on the Company’s then current senior secured leverage ratio:
Senior Secured Leverage Ratio | Applicable LIBOR Margin | Applicable ABR Margin | ||
Greater than 3.50 to 1.00 | 2.50% | 1.50% | ||
Less than or equal to 3.50 to 1.00 but greater than or equal to 2.50 to 1.00 | 2.25% | 1.25% | ||
Less than 2.50 to 1.00 | 2.00% | 1.00% | ||
In July 2016, Realogy Group entered into a first amendment to the Term Loan A senior secured credit agreement. Under the amendment, the Company issued the Term Loan A-1 in the amount of $355 million with a maturity date in July 2021 under its existing Term Loan A Facility and on terms substantially similar to its existing Term Loan A. The Term Loan A-1 provides for quarterly amortization payments totaling per annum 2.5%, 2.5%, 5.0%, 7.5% and 10.0% of the original principal amount of the Term Loan A-1, which commenced September 30, 2016 continuing through June 30, 2021. The interest rates with respect to term loans under the Term Loan A-1 are based on, at our option, adjusted LIBOR or ABR plus an additional margin subject to the following adjustments based on the Company’s then current senior secured leverage ratio:
Senior Secured Leverage Ratio | Applicable LIBOR Margin | Applicable ABR Margin | ||
Greater than 3.50 to 1.00 | 2.50% | 1.50% | ||
Less than or equal to 3.50 to 1.00 but greater than or equal to 2.50 to 1.00 | 2.25% | 1.25% | ||
Less than 2.50 to 1.00 but greater than or equal to 2.00 to 1.00 | 2.00% | 1.00% | ||
Less than 2.00 to 1.00 | 1.75% | 0.75% | ||
Consistent with the Senior Secured Credit Agreement, the Term Loan A Facility permits the Company to obtain up to $500 million of additional credit facilities from lenders reasonably satisfactory to the administrative agent and the company, without the consent of the existing lenders under the Term Loan A, plus an unlimited amount if the Company's senior secured leverage ratio is less than 3.50 to 1.00 on a pro forma basis. Subject to certain restrictions, the Term Loan A Facility also permits us to issue senior secured or unsecured notes in lieu of any incremental facility.
Unsecured Notes
The 4.50% Senior Notes, 5.25% Senior Notes and 4.875% Senior Notes (each as defined below, collectively the "Unsecured Notes") are unsecured senior obligations of Realogy Group that mature on April 15, 2019, December 1, 2021 and June 1, 2023, respectively. Interest on the Unsecured Notes is payable each year semiannually on April 15 and October 15 for the 4.50% Senior Notes and June 1 and December 1 for both the 5.25% Senior Notes and 4.875% Senior Notes.
The Unsecured Notes are guaranteed on an unsecured senior basis by each domestic subsidiary of Realogy Group that is a guarantor under the Senior Secured Credit Facility and Realogy Group's outstanding debt securities, and are guaranteed by Realogy Holdings on an unsecured senior subordinated basis.
Other Debt Facilities
The Company has an Unsecured Letter of Credit Facility to provide for the issuance of letters of credit required for general corporate purposes by the Company. At December 31, 2017, the capacity of the facility was $74 million with $69 million being utilized and at December 31, 2016, the capacity of the facility was $131 million with $127 million being
F-25
utilized. In August 2017, the standby irrevocable letter of credit, which was utilized to support the Company's payment obligations with respect to its share of Cendant contingent and other corporate liabilities, was terminated as a result of the resolution of a Cendant legacy tax matter, reducing the capacity and outstanding letters of credit under the Unsecured Letter of Credit Facility. The facility's expiration dates are as follows:
Capacity (in millions) | Expiration Date |
$8 | September 2018 |
$66 | December 2019 |
The fixed pricing to the Company is based on a spread above the credit default swap rate for senior unsecured debt obligations of the Company over the applicable letter of credit period. Realogy Group's obligations under the Unsecured Letter of Credit Facility are guaranteed on an unsecured senior basis by each domestic subsidiary of Realogy Group that is a guarantor under the Senior Secured Credit Facility and Realogy Group's outstanding debt securities.
Securitization Obligations
Realogy Group has secured obligations through Apple Ridge Funding LLC under a securitization program. In June 2017, Realogy Group extended the program until June 2018. In November 2017, the capacity of the Apple Ridge facility was reduced from $325 million to $250 million. At December 31, 2017, Realogy Group had $181 million of outstanding borrowings under the facility.
Realogy Group, through a special purpose entity known as Cartus Financing Limited, has agreements providing for a £10 million revolving loan facility and a £5 million working capital facility. In September 2017, Realogy Group extended the existing Cartus Financing Limited securitization program to August 2018. There were $13 million of outstanding borrowings on the facilities at December 31, 2017. These Cartus Financing Limited facilities are secured by the relocation assets of a U.K. government contract in this special purpose entity and are therefore classified as permitted securitization financings as defined in Realogy Group’s Senior Secured Credit Facility and the indentures governing the Unsecured Notes.
The Apple Ridge entities and the Cartus Financing Limited entity are consolidated special purpose entities that are utilized to securitize relocation receivables and related assets. These assets are generated from advancing funds on behalf of clients of Realogy Group’s relocation business in order to facilitate the relocation of their employees. Assets of these special purpose entities are not available to pay Realogy Group’s general obligations. Under the Apple Ridge program, provided no termination or amortization event has occurred, any new receivables generated under the designated relocation management agreements are sold into the securitization program and as new eligible relocation management agreements are entered into, the new agreements are designated to the program. The Apple Ridge program has restrictive covenants and trigger events, including performance triggers linked to the age and quality of the underlying assets, foreign obligor limits, multicurrency limits, financial reporting requirements, restrictions on mergers and change of control, any uncured breach of Realogy Group’s senior secured leverage ratio under Realogy Group’s Senior Secured Credit Facility, and cross-defaults to Realogy Group’s material indebtedness. The occurrence of a trigger event under the Apple Ridge securitization facility could restrict our ability to access new or existing funding under this facility or result in termination of the facility, either of which would adversely affect the operation of our relocation business.
Certain of the funds that Realogy Group receives from relocation receivables and related assets must be utilized to repay securitization obligations. These obligations were collateralized by $218 million and $238 million of underlying relocation receivables and other related relocation assets at December 31, 2017 and 2016, respectively. Substantially all relocation related assets are realized in less than twelve months from the transaction date. Accordingly, all of Realogy Group’s securitization obligations are classified as current in the accompanying Consolidated Balance Sheets.
Interest incurred in connection with borrowings under these facilities amounted to $7 million and $6 million for the years ended December 31, 2017 and December 31, 2016, respectively. This interest is recorded within net revenues in the accompanying Consolidated Statements of Operations as related borrowings are utilized to fund Realogy Group's relocation business where interest is generally earned on such assets. These securitization obligations represent floating rate debt for which the average weighted interest rate was 3.3% and 2.6% for the years ended December 31, 2017 and 2016, respectively.
Loss on the Early Extinguishment of Debt
As a result of the refinancing transaction in January of 2017 and reduction of the Unsecured Letter of Credit Facility in September of 2017, the Company recorded losses on the early extinguishment of debt of $5 million during the year ended December 31, 2017.
F-26
As a result of refinancing transactions, note repurchases and note redemptions, the Company recorded a loss on the early extinguishment of debt of $48 million during the year ended December 31, 2015.
9. | EMPLOYEE BENEFIT PLANS |
DEFINED BENEFIT PENSION PLAN
The Company’s defined benefit pension plan was closed to new entrants as of July 1, 1997 and existing participants do not accrue any additional benefits. The net periodic pension cost for both 2017 and 2016 was $1 million and was comprised of interest cost of approximately $6 million and the amortization of the actuarial net loss of $2 million, partially offset by a benefit of $7 million for the expected return on assets.
At December 31, 2017 and 2016, the accumulated benefit obligation of this plan was $145 million and $147 million, respectively, and the fair value of the plan assets were $108 million and $104 million, respectively, resulting in an unfunded accumulated benefit obligation of $37 million and $43 million, respectively, which is recorded in Other non-current liabilities in the Consolidated Balance Sheets.
Estimated future benefit payments as of December 31, 2017 are as follows:
Year | Amount | |||
2018 | $ | 9 | ||
2019 | 9 | |||
2020 | 9 | |||
2021 | 10 | |||
2022 | 10 | |||
2023 through 2027 | 47 | |||
The minimum funding required during 2018 is estimated to be $3 million.
The following table presents the fair values of plan assets by category as of December 31, 2017:
Asset Category | Quoted Price in Active Market for Identical Assets (Level I) | Significant Other Observable Inputs (Level II) | Significant Unobservable Inputs (Level III) | Total | ||||||||||||
Cash and cash equivalents | $ | 1 | $ | — | $ | — | $ | 1 | ||||||||
Equity securities | — | 71 | — | 71 | ||||||||||||
Fixed income securities | — | 36 | — | 36 | ||||||||||||
Total | $ | 1 | $ | 107 | $ | — | $ | 108 | ||||||||
The following table presents the fair values of plan assets by category as of December 31, 2016:
Asset Category | Quoted Price in Active Market for Identical Assets (Level I) | Significant Other Observable Inputs (Level II) | Significant Unobservable Inputs (Level III) | Total | ||||||||||||
Cash and cash equivalents | $ | 1 | $ | — | $ | — | $ | 1 | ||||||||
Equity securities | — | 74 | — | 74 | ||||||||||||
Fixed income securities | — | 29 | — | 29 | ||||||||||||
Total | $ | 1 | $ | 103 | $ | — | $ | 104 | ||||||||
OTHER EMPLOYEE BENEFIT PLANS
The Company also maintains post-retirement health and welfare plans for certain subsidiaries and a non-qualified pension plan for certain individuals. At both December 31, 2017 and 2016, the related projected benefit obligation for these plans accrued on the Company’s Consolidated Balance Sheets (primarily within other non-current liabilities) was $6 million.
F-27
DEFINED CONTRIBUTION SAVINGS PLAN
The Company sponsors a defined contribution savings plan that provides certain of its eligible employees an opportunity to accumulate funds for retirement and has a Company match for a portion of the contributions made by participating employees. The Company’s cost for contributions to this plan was $16 million, $15 million and $14 million for the years ended December 31, 2017, 2016 and 2015, respectively.
10. | INCOME TAXES |
The components of pretax income for domestic and foreign operations consisted of the following:
Year Ended December 31, | |||||||||||
2017 | 2016 | 2015 | |||||||||
Domestic | $ | 365 | $ | 351 | $ | 290 | |||||
Foreign | 4 | 10 | 8 | ||||||||
Pretax income | $ | 369 | $ | 361 | $ | 298 | |||||
The components of income tax (benefit) expense consisted of the following:
Year Ended December 31, | |||||||||||
2017 | 2016 | 2015 | |||||||||
Current: | |||||||||||
Federal | $ | (7 | ) | $ | 10 | $ | 8 | ||||
State | 4 | 8 | 3 | ||||||||
Foreign | 1 | 2 | 3 | ||||||||
Total current | (2 | ) | 20 | 14 | |||||||
Deferred: | |||||||||||
Federal | (72 | ) | 107 | 91 | |||||||
State | 9 | 16 | 4 | ||||||||
Foreign | — | 1 | 1 | ||||||||
Total deferred | (63 | ) | 124 | 96 | |||||||
Income tax (benefit) expense | $ | (65 | ) | $ | 144 | $ | 110 | ||||
The Tax Cuts and Jobs Act of 2017 (the “2017 Tax Act”), which became law on December 22, 2017, will reduce the U.S. Federal corporate tax rate from 35% to 21% for tax years beginning in 2018. The $65 million income tax benefit includes a tax benefit of approximately $184 million due to the re-measurement of the Company’s net deferred tax liabilities associated with the 2017 Tax Act and a $32 million reduction in the Company's reserve for uncertain tax positions, partially offset by current operating results. The recorded net benefit related to the 2017 Tax Act is a provisional amount that reflects the Company’s reasonable estimate at this time, and is subject to adjustment during a measurement period not to exceed one year from enactment in accordance with guidance from the Securities and Exchange Commission.
A reconciliation of the Company’s effective income tax rate at the U.S. federal statutory rate of 35% to the actual expense was as follows:
Year Ended December 31, | ||||||||
2017 | 2016 | 2015 | ||||||
Federal statutory rate | 35 | % | 35 | % | 35 | % | ||
State and local income taxes, net of federal tax benefits | 4 | 4 | 2 | |||||
Impact of the 2017 Tax Act | (50 | ) | — | — | ||||
Permanent differences | — | 1 | 1 | |||||
Uncertain tax positions | (9 | ) | — | — | ||||
Net change in valuation allowance | 1 | — | 1 | |||||
Other | 1 | — | (2 | ) | ||||
Effective tax rate | (18 | %) | 40 | % | 37 | % | ||
F-28
Deferred income taxes result from temporary differences between the amount of assets and liabilities recognized for financial reporting and tax purposes. The components of the deferred income tax assets and liabilities, as of December 31, are as follows:
2017 | 2016 | ||||||
Deferred income tax assets: | |||||||
Net operating loss carryforwards | $ | 288 | $ | 503 | |||
Tax credit carryforwards | 35 | 41 | |||||
Accrued liabilities and deferred income | 85 | 131 | |||||
Minimum pension obligations | 16 | 23 | |||||
Provision for doubtful accounts | 8 | 16 | |||||
Liability for unrecognized tax benefits | 1 | 3 | |||||
Interest rate swaps | 2 | 8 | |||||
Total deferred tax assets | 435 | 725 | |||||
Less: valuation allowance | (13 | ) | (10 | ) | |||
Total deferred income tax assets after valuation allowance | 422 | 715 | |||||
Deferred income tax liabilities: | |||||||
Depreciation and amortization | 736 | 1,099 | |||||
Prepaid expenses | 2 | 1 | |||||
Undistributed foreign earnings | — | 2 | |||||
Basis difference in investment in joint ventures | 10 | 2 | |||||
Total deferred tax liabilities | 748 | 1,104 | |||||
Net deferred income tax liabilities | $ | (326 | ) | $ | (389 | ) | |
Deferred tax assets and deferred tax liabilities are netted by tax jurisdiction. The Net deferred income tax liability of $326 million as of December 31, 2017 is included in the accompanying Consolidated Balance Sheets with $327 million in deferred income taxes (non-current liabilities) and $1 million in other non-current assets. The Net deferred income tax liability of $389 million as of December 31, 2016 is included in the accompanying Consolidated Balance Sheets with the entire $389 million in deferred income taxes (non-current liabilities).
As of December 31, 2017, the Company had gross federal and state net operating loss carryforwards of $1,026 million. The federal net operating loss carryforwards expire between 2027 and 2033 and the state net operating loss carryforwards expire between 2018 and 2033.
Accounting for Uncertainty in Income Taxes
The Company utilizes the FASB guidance for accounting for uncertainty in income taxes, which prescribes a recognition threshold and a measurement attribute for the financial statement recognition and measurement of tax positions taken or expected to be taken in a tax return. The Company reflects changes in its liability for unrecognized tax benefits as income tax expense in the Consolidated Statements of Operations. As of December 31, 2017, the Company’s gross liability for unrecognized tax benefits was $22 million, of which $19 million would affect the Company’s effective tax rate, if recognized. The Company does not expect that its unrecognized tax benefits will significantly change over the next 12 months.
The Company files U.S., state and foreign income tax returns in jurisdictions with varying statutes of limitations. Tax returns for the 2006 through 2017 tax years remain subject to examination by federal and certain state tax authorities. In significant foreign jurisdictions, tax returns for the 2008 through 2017 tax years generally remain subject to examination by their respective tax authorities. The Company believes that it is reasonably possible that the total amount of its unrecognized tax benefits could decrease by $2 million in certain taxing jurisdictions where the statute of limitations is set to expire within the next 12 months.
The Company recognizes accrued interest and penalties related to unrecognized tax benefits in interest expense and operating expenses, respectively. The Company recognized a reduction of interest expense of $2 million for the year ended December 31, 2017, a reduction of interest expense of $4 million for the year ended December 31, 2016 and reduction of interest expense of $1 million for the year ended December 31, 2015.
F-29
The rollforward of unrecognized tax benefits are summarized in the table below:
Unrecognized tax benefits—January 1, 2015 | $ | 106 | |
Gross decreases—tax positions in prior periods | (4 | ) | |
Gross increases—tax positions in current period | 1 | ||
Settlements | (23 | ) | |
Reduction due to lapse of statute of limitations | (2 | ) | |
Unrecognized tax benefits—December 31, 2015 | 78 | ||
Gross increases—tax positions in prior periods | 3 | ||
Reduction due to lapse of statute of limitations | (3 | ) | |
Unrecognized tax benefits—December 31, 2016 | 78 | ||
Gross increases—tax positions in prior periods | 1 | ||
Gross decreases—tax positions in prior periods | (54 | ) | |
Reduction due to lapse of statute of limitations | (3 | ) | |
Unrecognized tax benefits—December 31, 2017 | $ | 22 | |
The Company is subject to income taxes in the United States and several foreign jurisdictions. Significant judgment is required in determining the worldwide provision for income taxes and recording related assets and liabilities. In the ordinary course of business, there are many transactions and calculations where the ultimate tax determination is uncertain. The Company is regularly under audit by tax authorities whereby the outcome of the audits is uncertain. The Company believes there is appropriate support for positions taken on its tax returns. The liabilities that have been recorded represent the best estimates of the probable loss on certain positions and are adequate for all open years based on an assessment of many factors including past experience and interpretations of tax law applied to the facts of each matter. However, the outcomes of tax audits are inherently uncertain.
Tax Sharing Agreement
Under the Tax Sharing Agreement with Cendant, Wyndham Worldwide and Travelport, the Company is generally responsible for 62.5% of payments made to settle claims with respect to tax periods ending on or prior to December 31, 2006 that relate to income taxes imposed on Cendant and certain of its subsidiaries, the operations (or former operations) of which were determined by Cendant not to relate specifically to the respective businesses of Realogy, Wyndham Worldwide, Avis Budget or Travelport. With respect to any remaining residual legacy Cendant tax liabilities, the Company and its former parent believe there is appropriate support for the positions taken on Cendant’s tax returns. However, tax audits and any related litigation, including disputes or litigation on the allocation of tax liabilities between parties under the Tax Sharing Agreement, could result in outcomes for the Company that are different from those reflected in the Company’s historical financial statements.
11. | RESTRUCTURING COSTS |
Restructuring charges for the years ended December 31, 2017, 2016 and 2015 were $12 million, $39 million and $10 million, respectively. The components of the restructuring charges for the years ended December 31, 2017, 2016 and 2015 were as follows:
Years Ended December 31, | |||||||||||
2017 | 2016 | 2015 | |||||||||
Personnel-related costs (1) | $ | 7 | $ | 22 | $ | 3 | |||||
Facility-related costs (2) | 3 | 10 | 3 | ||||||||
Accelerated depreciation on asset disposals | 1 | 1 | — | ||||||||
Other restructuring costs (3) | 1 | 6 | 4 | ||||||||
Total restructuring charges | $ | 12 | $ | 39 | $ | 10 | |||||
_______________
(1) | Personnel-related costs consist of severance costs provided to employees who have been terminated and duplicate payroll costs during transition. |
F-30
(2) | Facility-related costs consist of costs associated with planned facility closures such as contract termination costs, lease payments that will continue to be incurred under the contract for its remaining term without economic benefit to the Company and other facility and employee relocation related costs. |
(3) | Other restructuring costs consist of costs related to professional fees, consulting fees and other costs associated with restructuring activities which are primarily included in the Corporate and Other business segment. |
Business Optimization Initiative
During the fourth quarter of 2015, the Company began a business optimization initiative that focused on maximizing the efficiency and effectiveness of the cost structure of each of the Company's business units. The action was designed to improve client service levels across each of the business units while enhancing the Company's profitability and incremental margins. The plan focused on several key areas of opportunity which include process improvement efficiencies, office footprint optimization, leveraging technology and media spend, centralized procurement, outsourcing administrative services and organizational design. The expected costs of activities undertaken in connection with the restructuring plan are largely complete.
The following is a reconciliation of the beginning and ending restructuring reserve balances for the Business Optimization Initiative:
Personnel-related costs | Facility-related costs | Accelerated depreciation asset disposals | Other restructuring costs | Total | |||||||||||||||
Balance at October 1, 2015 | $ | — | $ | — | $ | — | $ | — | $ | — | |||||||||
Restructuring charges | 3 | 3 | — | 4 | 10 | ||||||||||||||
Costs paid or otherwise settled | — | — | — | (1 | ) | (1 | ) | ||||||||||||
Balance at December 31, 2015 | $ | 3 | $ | 3 | $ | — | $ | 3 | $ | 9 | |||||||||
Restructuring charges | 22 | 10 | 1 | 6 | 39 | ||||||||||||||
Costs paid or otherwise settled | (16 | ) | (6 | ) | (1 | ) | (9 | ) | (32 | ) | |||||||||
Balance at December 31, 2016 | $ | 9 | $ | 7 | $ | — | $ | — | $ | 16 | |||||||||
Restructuring charges | 7 | 3 | 1 | 1 | 12 | ||||||||||||||
Costs paid or otherwise settled | (13 | ) | (7 | ) | — | (1 | ) | (21 | ) | ||||||||||
Balance at December 31, 2017 | $ | 3 | $ | 3 | $ | 1 | $ | — | $ | 7 | |||||||||
The following table shows the total restructuring costs expected to be incurred by type of cost for the Business Optimization Initiative:
Total amount expected to be incurred | Amount incurred to date | Total amount remaining to be incurred | |||||||||
Personnel-related costs | $ | 32 | $ | 32 | $ | — | |||||
Facility-related costs | 16 | 16 | — | ||||||||
Accelerated depreciation related to asset disposals | 3 | 2 | 1 | ||||||||
Other restructuring costs | 12 | 11 | 1 | ||||||||
Total | $ | 63 | $ | 61 | $ | 2 | |||||
The following table shows the total restructuring costs expected to be incurred by reportable segment for the Business Optimization Initiative:
Total amount expected to be incurred | Amount incurred to date | Total amount remaining to be incurred | |||||||||
Real Estate Franchise Services | $ | 5 | $ | 5 | $ | — | |||||
Company Owned Real Estate Brokerage Services | 36 | 36 | — | ||||||||
Relocation Services | 5 | 5 | — | ||||||||
Title and Settlement Services | 2 | 2 | — | ||||||||
Corporate and Other | 15 | 13 | 2 | ||||||||
Total | $ | 63 | $ | 61 | $ | 2 | |||||
F-31
12. | STOCK-BASED COMPENSATION |
The Company issues incentive equity awards, such as non-qualified stock options, restricted stock units ("RSUs"), performance restricted stock units ("PRSUs") and performance share units ("PSUs"), to employees, consultants and directors of Realogy under its 2012 Long-Term Incentive Plan and Amended and Restated 2012 Long-Term Incentive Plan ("the Plans"). The Plans include a retirement provision for equity grants which provide for continued vesting of awards once an employee has attained the age of 65 years, or 55 years of age or older plus at least ten years of tenure with the Company, provided they have been employed or provided services to the Company for one year following the date of grant or start of the performance period. There has been a total of 16.6 million shares authorized for issuance under the Plans with approximately 3 million shares available for future grants.
Incentive Equity Awards Granted by the Company
In October 2017, the Company announced that Ryan Schneider had been elected as President and Chief Operating Officer of the Company and appointed as a member of the Company’s Board of Directors. In accordance with the succession plan developed by the Board, Mr. Schneider was named Chief Executive Officer (the “CEO”) on December 31, 2017. Mr. Schneider was granted an inducement equity award with an aggregate grant date fair value of $5 million consisting of: (i) $2.5 million in RSUs and (ii) $2.5 million in non-qualified stock options, with the RSUs vesting in equal annual installments over a three-year period and with the options becoming exercisable in equal annual installments over a four-year period, in each case, based on continued service through the vesting date.
A summary of activity for the year ended December 31, 2017 is presented below (number of shares in millions):
Restricted Stock Units | Weighted Average Grant Date Fair Value | Performance Share Units (a) | Weighted Average Grant Date Fair Value | Options (f) | Weighted Average Exercise Price | |||||||||||||||
Outstanding at January 1, 2017 | 1.5 | $ | 37.72 | 1.4 | $ | 38.31 | 3.3 | $ | 31.69 | |||||||||||
Granted | 1.2 | 28.61 | 0.7 | 27.70 | 0.7 | 29.60 | ||||||||||||||
Distributed/Exercised | (0.6 | ) | (b) | 39.64 | (0.3 | ) | (c) | 42.30 | (0.3 | ) | (d) | 23.29 | ||||||||
Forfeited/Expired | (0.1 | ) | 30.90 | — | — | (0.1 | ) | 50.24 | ||||||||||||
Outstanding at December 31, 2017 | 2.0 | $ | 31.71 | 1.8 | $ | 33.16 | 3.6 | (e) | $ | 31.75 | ||||||||||
_______________
(a) | The PSU amounts in the table are shown at the target amount of the award. |
(b) | The total fair value of RSUs which were distributed during the year ended December 31, 2017 was $26 million. |
(c) | The total fair value of PSUs which were distributed during the year ended December 31, 2017 was $14 million, which includes the distribution of PSUs awarded in 2014, measuring performance over a three-year performance period ended December 31, 2016, at a fair value of $10 million. Amounts distributed do not include 0.2 million PSUs awarded in 2015, measuring performance over a three-year period ended and vested December 31, 2017, at a fair value of $9 million and at a weighted average grant date fair value of $46.46. These PSUs were distributed in early 2018. |
(d) | The intrinsic value of options exercised during the year ended December 31, 2017 was $2 million. Cash received from options exercised during the year ended December 31, 2017 was $8 million. |
(e) | Options outstanding at December 31, 2017 have an intrinsic value of $6 million and have a weighted average remaining contractual life of 5.8 years. |
(f)The following table summarizes information regarding exercisable stock options as of December 31, 2017:
Range of Exercise Prices | Options Vested | Weighted Average Exercise Price | Aggregate Intrinsic Value | Weighted Average Remaining Contractual Life | |||||||||
$15.00 to $50.00 | 2.4 | $ | 27.86 | $ | 6.3 | 4.7 years | |||||||
$50.01 and above | 0.1 | $ | 140.26 | $ | — | 2.8 years | |||||||
Awards granted annually include a mix of RSUs (PRSUs for the CEO and direct reports), options and PSUs.
The RSUs and PRSUs vest over three years, with 33.33% vesting on each anniversary of the grant date. The fair value of RSUs and PRSUs are equal to the closing sale price of the Company's common stock on the date of grant. Time-vesting of the PRSUs for the CEO and direct reports is subject to achievement of a minimum EBITDA performance goal during the year that the award was granted.
F-32
The PSUs are incentives that reward grantees based upon the Company's financial performance over a three-year performance period which begins January 1st of the grant year and ends on December 31st of the third year following the grant year. There are two PSU awards: one is based upon the total stockholder return of Realogy's common stock relative to the total stockholder return of the SPDR S&P Homebuilders Index ("XHB") (the "RTSR award"), and the other is based upon the achievement of cumulative free cash flow goals. The number of shares that may be issued under the PSU is variable and based upon the extent to which the performance goals are achieved over the performance period (with a range of payout from 0% to 175% of target for the RTSR award and 0% to 200% of target for the achievement of cumulative free cash flow award). The shares earned will be distributed during the first quarter after the end of the performance period. The fair value of PSUs without a market condition is equal to the closing sale price of the Company's common stock on the date of grant. The fair value of the PSU RTSR award was estimated on the date of grant using the Monte Carlo Simulation method utilizing the following assumptions:
2017 RTSR PSU | 2016 RTSR PSU | 2015 RTSR PSU | |||||||||
Weighted average grant date fair value | $ | 27.98 | $ | 27.99 | $ | 41.08 | |||||
Weighted average expected volatility (a) | 29.0 | % | 28.1 | % | 25.1 | % | |||||
Weighted average volatility of XHB | 18.4 | % | 19.4 | % | 21.1 | % | |||||
Weighted average correlation coefficient | 0.53 | 0.58 | 0.57 | ||||||||
Weighted average risk-free interest rate | 1.5 | % | 0.9 | % | 1.0 | % | |||||
Weighted average dividend yield | — | — | — | ||||||||
_______________
(a) | Expected volatility is based on historical volatilities of the Company and select comparable companies. |
The stock options have a maximum term of ten years and vest over four years, with 25% vesting on each anniversary date of the grant date. The options have an exercise price equal to the closing sale price of the Company's common stock on the date of grant. The fair value of the options was estimated on the date of grant using the Black-Scholes option-pricing model utilizing the following assumptions:
2017 Options | 2016 Options | 2015 Options | |||||||||
Weighted average grant date fair value | $ | 8.61 | $ | 10.81 | $ | 17.66 | |||||
Weighted average expected volatility (a) | 30.7 | % | 31.7 | % | 36.1 | % | |||||
Weighted average expected term (years) (b) | 6.25 | 6.25 | 6.25 | ||||||||
Weighted average risk-free interest rate (c) | 2.0 | % | 1.3 | % | 1.6 | % | |||||
Weighted average dividend yield | 1.2 | % | 0.1 | % | — | % | |||||
_______________
(a) | Expected volatility was based on historical volatilities of the Company and select comparable companies. |
(b) | The expected term of the options granted represents the period of time that options are expected to be outstanding and is based on the simplified method. |
(c) | The risk-free interest rate was based on the U.S. Treasury yield curve in effect at the time of the grant, which corresponds to the expected term of the options. |
Stock-Based Compensation Expense
As of December 31, 2017, based on current performance achievement expectations, there was $36 million of unrecognized compensation cost related to incentive equity awards under the plans which will be recorded in future periods as compensation expense over a remaining weighted average period of approximately 1.9 years. The Company recorded stock-based compensation expense related to the incentive equity awards of $52 million, $57 million and $57 million for the years ended December 31, 2017, 2016 and 2015, respectively.
13. | COMMITMENTS AND CONTINGENCIES |
Litigation
The Company is involved in claims, legal proceedings, alternative dispute resolution and governmental inquiries related to alleged contract disputes, business practices, intellectual property and other commercial, employment, regulatory and tax matters. Examples of such matters include but are not limited to allegations:
• | that the Company is vicariously liable for the acts of franchisees under theories of actual or apparent agency; |
F-33
• | by current or former franchisees that franchise agreements were breached including improper terminations; |
• | concerning claims for alleged RESPA or state real estate law violations including but not limited to claims challenging the validity of sales agent indemnification, and administrative fees; |
• | that residential real estate sales agents engaged by NRT—under certain state or federal laws—are potentially employees instead of independent contractors, and they or regulators therefore may bring claims against NRT for breach of contract, wage and hour classification claims, wrongful discharge, unemployment and workers' compensation and could seek benefits, back wages, overtime, indemnification, penalties related to classification practices and expense reimbursement available to employees; |
• | concerning other employment law matters, including wage and hour claims; |
• | concerning claims generally against the company owned brokerage operations for negligence, misrepresentation or breach of fiduciary duty in connection with the performance of real estate brokerage or other professional services as well as other brokerage claims associated with listing information and property history; |
• | related to copyright law, including infringement actions alleging improper use of copyrighted photographs on websites or in marketing materials without consent of the copyright holder; |
• | concerning claims generally against the title company contending that, as the escrow company, the company knew or should have known that a transaction was fraudulent or concerning other title defects or settlement errors; |
• | concerning information security and cyber-crime, including claims related to the diversion of homesale transaction closing funds and/or the protection of the privacy and personally identifiable information of our customers and employees; |
• | concerning anti-trust and anti-competition matters; and |
• | those related to general fraud claims. |
Real Estate Business Litigation
Dodge, et al. v. PHH Corporation, et al., formerly captioned Strader, et al. and Hall v. PHH Corporation, et al. (U.S. District Court for the Central District of California). This is a purported class action brought by four California residents against 15 defendants, including Realogy and certain of its subsidiaries, PHH Corporation and PHH Home Loans, LLC (a joint venture between Realogy and PHH), alleging violations of Section 8(a) of RESPA. Plaintiffs seek to represent two subclasses comprised of all persons in the United States who, since January 31, 2005, (1) obtained a RESPA-covered mortgage loan from either (a) PHH Home Loans, LLC or one of its subsidiaries, or (b) one of the mortgage services managed by PHH Corporation for other lenders, and (2) paid a fee for title insurance or settlement services to TRG or one of its subsidiaries. Plaintiffs allege, among other things, that PHH Home Loans, LLC operates in violation of RESPA and that the other defendants violate RESPA by referring business to one another under agreements or arrangements. Plaintiffs seek treble damages and an award of attorneys’ fees, costs and disbursements. On May 19, 2017, the parties held a mediation session, at which they agreed in principle to a settlement of the action, pursuant to which the Company would pay approximately $8 million (or one-half of the settlement). As a result, the Company accrued $8 million in the second quarter of 2017 and the liability is included in accrued expenses and other current liabilities on the Consolidated Balance Sheets. On July 31, 2017, the fourth amended complaint was filed changing the named plaintiffs. At a hearing on the plaintiffs' motion for preliminary approval of the settlement held October 19, 2017, the Court indicated that if certain modest revisions were made to the settlement agreement and an amended motion for preliminary approval filed, the Court would grant preliminary approval. On January 29, 2018, the Court issued an order granting preliminary approval of the settlement, directed class notices to be sent by February 2018 and set the hearing on final approval of the settlement for August 16, 2018.
The Company is involved in certain other claims and legal actions arising in the ordinary course of our business. Such litigation, regulatory actions and other proceedings may include, but are not limited to, actions relating to intellectual property, commercial arrangements, franchising arrangements, actions against our title company alleging it knew or should have known that others were committing mortgage fraud, standard brokerage disputes like the failure to disclose accurate square footage or hidden defects in the property such as mold, vicarious liability based upon conduct of individuals or entities outside of our control, including franchisees and independent sales agents, antitrust and anti-competition claims, general fraud claims, employment law claims, including claims challenging the classification of our sales agents as independent contractors, wage and hour classification claims and claims alleging violations of RESPA or state consumer fraud statutes. While the results of such claims and legal actions cannot be predicted with certainty, we do not believe based on information currently available to us that the final outcome of current proceedings against the Company will have a material adverse effect on our consolidated financial position, results of operations or cash flows.
F-34
Cendant Corporate Litigation
Realogy Group (then Realogy Corporation) separated from Cendant on July 31, 2006 (the "Separation"), pursuant to a plan by Cendant (now known as Avis Budget Group, Inc.) to separate into four independent companies-one for each of Cendant's business units-real estate services (Realogy Group), travel distribution services ("Travelport"), hospitality services, including timeshare resorts ("Wyndham Worldwide"), and vehicle rental ("Avis Budget Group"). Pursuant to the Separation and Distribution Agreement dated as of July 27, 2006 among Cendant, Realogy Group, Wyndham Worldwide and Travelport, (the "Separation and Distribution Agreement"), each of Realogy Group, Wyndham Worldwide and Travelport have assumed certain contingent and other corporate liabilities (and related costs and expenses), which are primarily related to each of their respective businesses. In addition, Realogy Group has assumed 62.5% and Wyndham Worldwide has assumed 37.5% of certain contingent and other corporate liabilities (and related costs and expenses) of Cendant or its subsidiaries, which are not primarily related to any of the respective businesses of Realogy Group, Wyndham Worldwide, Travelport and/or Cendant’s vehicle rental operations, in each case incurred or allegedly incurred on or prior to the date of the separation of Travelport from Cendant.
* * *
The Company believes that it has adequately accrued for legal matters as appropriate. The Company records litigation accruals for legal matters which are both probable and estimable.
Litigation and other disputes are inherently unpredictable and subject to substantial uncertainties and unfavorable resolutions could occur. In addition, class action lawsuits can be costly to defend and, depending on the class size and claims, could be costly to settle. As such, the Company could incur judgments or enter into settlements of claims with liability that are materially in excess of amounts accrued and these settlements could have a material adverse effect on the Company’s financial condition, results of operations or cash flows in any particular period.
Transfer of Cendant Corporate Liabilities, Issuance of Guarantees to Cendant and Affiliates and Contingent Liability Letter of Credit
Realogy Group has certain guarantee commitments with Cendant (pursuant to the assumption of certain liabilities and the obligation to indemnify Cendant, Wyndham Worldwide and Travelport for such liabilities). These guarantee arrangements primarily relate to certain contingent litigation liabilities, contingent tax liabilities, and other corporate liabilities, of which Realogy Group assumed and is generally responsible for 62.5%. Upon separation from Cendant, the liabilities assumed by Realogy Group were comprised of certain Cendant corporate liabilities which were recorded on the historical books of Cendant as well as additional liabilities which were established for guarantees issued at the date of Separation related to certain unresolved contingent matters that could arise during the guarantee period. Regarding the guarantees, if any of the companies responsible for all or a portion of such liabilities were to default in its payment of costs or expenses related to any such liability, Realogy Group would be responsible for a portion of the defaulting party or parties’ obligation. To the extent such recorded liabilities are in excess or are not adequate to cover the ultimate payment amounts, such excess or deficiency will be reflected in the results of operations in future periods.
In April 2007, the Company established a standby irrevocable letter of credit for the benefit of Avis Budget Group in accordance with the Separation and Distribution Agreement. The letter of credit was utilized to support the Company’s payment obligations with respect to its share of Cendant contingent and other corporate liabilities. The stated amount of the standby irrevocable letter of credit was subject to periodic adjustment to reflect the then current estimate of Cendant contingent and other liabilities. The standby irrevocable letter of credit terminates if (i) the Company’s senior unsecured credit rating is raised to BB by Standard and Poor’s or Ba2 by Moody’s or (ii) the aggregate value of the former parent contingent liabilities falls below $30 million.
The letter of credit was $53 million at December 31, 2016. With the resolution of a Cendant legacy tax matter in 2017, the aggregate value of the former parent contingent liabilities fell below $30 million and therefore the standby irrevocable letter of credit was terminated in accordance with the agreement.
The due to former parent balance was $18 million and $28 million at December 31, 2017 and December 31, 2016, respectively. The due to former parent balance was comprised of the Company’s portion of the following: (i) Cendant’s remaining state and foreign contingent tax liabilities, (ii) accrued interest on contingent tax liabilities, (iii) potential liabilities related to Cendant’s terminated or divested businesses, and (iv) potential liabilities related to the residual portion of accruals for Cendant operations.
F-35
Tax Matters
The Company is subject to income taxes in the United States and several foreign jurisdictions. Significant judgment is required in determining the worldwide provision for income taxes and recording related assets and liabilities. In the ordinary course of business, there are many transactions and calculations where the ultimate tax determination is uncertain. The Company is regularly under audit by tax authorities whereby the outcome of the audits is uncertain. The Company believes there is appropriate support for positions taken on its tax returns. The liabilities that have been recorded represent the best estimates of the probable loss on certain positions and are adequate for all open years based on an assessment of many factors including past experience and interpretations of tax law applied to the facts of each matter. However, the outcomes of tax audits are inherently uncertain.
Under the Tax Sharing Agreement with Cendant, Wyndham Worldwide and Travelport, the Company is generally responsible for 62.5% of payments made to settle claims with respect to tax periods ending on or prior to December 31, 2006 that relate to income taxes imposed on Cendant and certain of its subsidiaries, the operations (or former operations) of which were determined by Cendant not to relate specifically to the respective businesses of Realogy, Wyndham Worldwide, Avis Budget or Travelport.
With respect to any remaining legacy Cendant tax liabilities, the Company and its former parent believe there is appropriate support for the positions taken on Cendant’s tax returns. However, tax audits and any related litigation, including disputes or litigation on the allocation of tax liabilities between parties under the Tax Sharing Agreement, could result in outcomes for the Company that are different from those reflected in the Company’s historical financial statements.
Escrow and Trust Deposits
As a service to its customers, the Company administers escrow and trust deposits which represent undisbursed amounts received for the settlement of real estate transactions. Deposits at FDIC-insured institutions are insured up to $250 thousand. These escrow and trust deposits totaled $469 million and $415 million at December 31, 2017 and 2016, respectively. These escrow and trust deposits are not assets of the Company and, therefore, are excluded from the accompanying Consolidated Balance Sheets. However, the Company remains contingently liable for the disposition of these deposits.
Leases
The Company is committed to making rental payments under noncancelable operating leases covering various facilities and equipment. Future minimum lease payments required under noncancelable operating leases as of December 31, 2017 are as follows:
Year | Amount | |||
2018 | $ | 163 | ||
2019 | 142 | |||
2020 | 116 | |||
2021 | 91 | |||
2022 | 72 | |||
Thereafter | 196 | |||
Total | $ | 780 | ||
Capital lease obligations were $29 million, net of $2 million of imputed interest, at December 31, 2017 and $27 million, net of $2 million of imputed interest, at December 31, 2016.
The Company incurred rent expense of $192 million, $186 million and $179 million for the years ended December 31, 2017, 2016 and 2015, respectively.
Purchase Commitments and Minimum Licensing Fees
In the normal course of business, the Company makes various commitments to purchase goods or services from specific suppliers, including those related to capital expenditures. The purchase commitments made by the Company as of December 31, 2017 are approximately $94 million.
The Company is required to pay a minimum licensing fee to Sotheby’s which began in 2009 and continues through 2054. The annual minimum licensing fee is approximately $2 million per year. The Company is also required to pay a
F-36
minimum licensing fee to Meredith Corporation for the licensing of the Better Homes and Gardens Real Estate brand. The annual minimum licensing fee began in 2009 at $0.5 million and increased to $4 million in 2014, where it will generally remain through 2058.
Future minimum payments for these purchase commitments and minimum licensing fees as of December 31, 2017 are as follows:
Year | Amount | |||
2018 | $ | 57 | ||
2019 | 23 | |||
2020 | 15 | |||
2021 | 13 | |||
2022 | 18 | |||
Thereafter | 222 | |||
Total | $ | 348 | ||
Standard Guarantees/Indemnifications
In the ordinary course of business, the Company enters into numerous agreements that contain standard guarantees and indemnities whereby the Company indemnifies another party for breaches of representations and warranties. In addition, many of these parties are also indemnified against any third-party claim resulting from the transaction that is contemplated in the underlying agreement. Such guarantees or indemnifications are granted under various agreements, including those governing: (i) purchases, sales or outsourcing of assets or businesses, (ii) leases and sales of real estate, (iii) licensing of trademarks, (iv) use of derivatives, and (v) issuances of debt securities. The guarantees or indemnifications issued are for the benefit of the: (i) buyers in sale agreements and sellers in purchase agreements, (ii) landlords in lease contracts, (iii) franchisees in licensing agreements, (iv) financial institutions in derivative contracts, and (v) underwriters in issuances of securities. While some of these guarantees extend only for the duration of the underlying agreement, many survive the expiration of the term of the agreement or extend into perpetuity (unless subject to a legal statute of limitations). There are no specific limitations on the maximum potential amount of future payments that the Company could be required to make under these guarantees, nor is the Company able to develop an estimate of the maximum potential amount of future payments to be made under these guarantees as the triggering events are not subject to predictability. With respect to certain of the aforementioned guarantees, such as indemnifications of landlords against third-party claims for the use of real estate property leased by the Company, the Company maintains insurance coverage that mitigates any potential payments to be made.
Other Guarantees/Indemnifications
In the normal course of business, the Company coordinates numerous events for its franchisees and thus reserves a number of venues with certain minimum guarantees, such as room rentals at hotels local to the conference center. However, such room rentals are paid by each individual franchisee. If the franchisees do not meet the minimum guarantees, the Company is obligated to fulfill the minimum guaranteed fees. The maximum potential amount of future payments that the Company would be required to make under such guarantees is approximately $7 million. The Company would only be required to pay this maximum amount if none of the franchisees conducted their planned events at the reserved venues. Historically, the Company has not been required to make material payments under these guarantees.
Insurance and Self-Insurance
At December 31, 2017 and 2016, the Consolidated Balance Sheets include approximately $40 million and $31 million, respectively, of liabilities relating to: (i) self-insured risks for errors and omissions and other legal matters incurred in the ordinary course of business within the Company Owned Real Estate Brokerage Services segment, (ii) vacant dwellings and household goods in transit and storage within the Relocation Services segment, and (iii) premium and claim reserves for the Company’s title underwriting business. The Company may also be subject to legal claims arising from the handling of escrow transactions and closings. The Company’s subsidiary, NRT, carries errors and omissions insurance for errors made during the real estate settlement process of $15 million in the aggregate, subject to a deductible of $1 million per occurrence. In addition, the Company carries an additional errors and omissions insurance policy for Realogy Holdings Corp. and its subsidiaries for errors made for real estate related services up to $35 million in the aggregate, subject to a deductible of $2.5 million per occurrence. This policy also provides excess coverage to NRT creating an aggregate limit of $50 million, subject to the NRT deductible of $1 million per occurrence.
F-37
The Company issues title insurance policies which provide coverage for real property mortgage lenders and buyers of real property. When acting as a title agent issuing a policy on behalf of an underwriter, assuming no negligence on part of the title agent, the Company is not liable for losses under those policies but rather the title insurer is typically liable for such losses. The title underwriter which the Company acquired in January 2006 typically underwrites title insurance policies of up to $1.5 million. For policies in excess of $1.5 million, the Company typically obtains a reinsurance policy from a national underwriter to reinsure the excess amount. The Company, as an underwriter, manages our claims losses through strict agent vetting, clear underwriting guidelines, training and frequent communications with our agents.
Fraud, defalcation and misconduct by employees are also risks inherent in the business. The Company is the custodian of cash deposited by customers with specific instructions as to its disbursement from escrow, trust and account servicing files. The Company maintains Fidelity insurance covering the loss or theft of funds of up to $30 million per occurrence, subject to a deductible of $750 thousand per occurrence.
The Company also maintains self-insurance arrangements relating to health and welfare, workers’ compensation, auto and general liability in addition to other benefits provided to the Company’s employees. The accruals for these self-insurance arrangements totaled approximately $16 million and $21 million at December 31, 2017 and 2016, respectively.
14. | EQUITY |
Changes in Accumulated Other Comprehensive Loss
The components of accumulated other comprehensive losses are as follows:
Currency Translation Adjustments (1) | Minimum Pension Liability Adjustment | Accumulated Other Comprehensive Loss (2) | |||||||||
Balance at January 1, 2015 | $ | — | $ | (35 | ) | $ | (35 | ) | |||
Other comprehensive income (loss) before reclassifications | (4 | ) | 1 | (3 | ) | ||||||
Amounts reclassified from accumulated other comprehensive income | — | 2 | (3) | 2 | |||||||
Income tax (expense) benefit | 1 | (1 | ) | — | |||||||
Current period change | (3 | ) | 2 | (1 | ) | ||||||
Balance at December 31, 2015 | (3 | ) | (33 | ) | (36 | ) | |||||
Other comprehensive loss before reclassifications | (5 | ) | (3 | ) | (8 | ) | |||||
Amounts reclassified from accumulated other comprehensive income | — | 1 | (3) | 1 | |||||||
Income tax benefit | 2 | 1 | 3 | ||||||||
Current period change | (3 | ) | (1 | ) | (4 | ) | |||||
Balance at December 31, 2016 | (6 | ) | (34 | ) | (40 | ) | |||||
Other comprehensive income (loss) before reclassifications | 3 | (1 | ) | 2 | |||||||
Amounts reclassified from accumulated other comprehensive income | — | 2 | (3) | 2 | |||||||
Income tax expense | (1 | ) | — | (1 | ) | ||||||
Current period change | 2 | 1 | 3 | ||||||||
Balance at December 31, 2017 | $ | (4 | ) | $ | (33 | ) | $ | (37 | ) | ||
_______________
(1) | Assets and liabilities of foreign subsidiaries having non-U.S. dollar functional currencies are translated at exchange rates at the balance sheet dates and equity accounts are translated at historical spot rates. Revenues and expenses are translated at average exchange rates during the periods presented. The gains or losses resulting from translating foreign currency financial statements into U.S. dollars are included in accumulated other comprehensive income (loss). Gains or losses resulting from foreign currency transactions are included in the Consolidated Statements of Operations. |
(2) | As of December 31, 2017, the Company does not have any after-tax components of accumulated other comprehensive loss attributable to noncontrolling interests. |
(3) | These amounts represent the amortization of actuarial loss to periodic pension cost and were reclassified from accumulated other comprehensive income to the general and administrative expenses line on the statement of operations. |
Dividend Policy
In August 2016, the Company’s Board of Directors approved the initiation of a quarterly cash dividend policy of $0.09 per share on its common stock. The Board declared and paid a quarterly cash dividend of $0.09 per share of the Company's common stock during each quarter of 2017, returning $49 million to stockholders.
F-38
The declaration and payment of any future dividend will be subject to the discretion of the Board of Directors and will depend on a variety of factors, including the Company’s financial condition and results of operations, contractual restrictions, including restrictive covenants contained in the Company’s credit agreements, and the indentures governing the Company’s outstanding debt securities, capital requirements and other factors that the Board of Directors deems relevant.
Pursuant to the Company’s policy, the dividends payable in cash are treated as a reduction of additional paid-in capital since the Company is currently in an accumulated deficit position.
Realogy Group Statements of Equity for the years ended December 31, 2017, 2016 and 2015
Total equity for Realogy Group equals that of Realogy Holdings, but the components, common stock and additional paid-in capital are different. The table below presents information regarding the balances and changes in common stock and additional paid-in capital of Realogy Group for each of the three years ended December 31, 2017, 2016 and 2015.
Realogy Group Stockholder’s Equity | ||||||||||||||||||||||||||
Common Stock | Additional Paid-In Capital | Accumulated Deficit | Accumulated Other Comprehensive Loss | Non- controlling Interests | Total Equity | |||||||||||||||||||||
Shares | Amount | |||||||||||||||||||||||||
Balance at January 1, 2015 | — | $ | — | $ | 5,678 | $ | (3,464 | ) | $ | (35 | ) | $ | 4 | $ | 2,183 | |||||||||||
Net income | — | — | — | 184 | — | 4 | 188 | |||||||||||||||||||
Other comprehensive loss | — | — | — | — | (1 | ) | — | (1 | ) | |||||||||||||||||
Contributions from Realogy Holdings | — | — | 5 | — | — | — | 5 | |||||||||||||||||||
Stock-based compensation | — | — | 51 | — | — | — | 51 | |||||||||||||||||||
Dividends | — | — | — | — | — | (4 | ) | (4 | ) | |||||||||||||||||
Balance at December 31, 2015 | — | $ | — | $ | 5,734 | $ | (3,280 | ) | $ | (36 | ) | $ | 4 | $ | 2,422 | |||||||||||
Cumulative effect of adoption of new accounting pronouncements related to stock-based compensation | — | — | — | 5 | — | — | 5 | |||||||||||||||||||
Net income | — | — | — | 213 | — | 4 | 217 | |||||||||||||||||||
Other comprehensive loss | — | — | — | — | (4 | ) | — | (4 | ) | |||||||||||||||||
Repurchase of Common Stock | — | — | (195 | ) | — | — | — | (195 | ) | |||||||||||||||||
Contributions from Realogy Holdings | — | — | 2 | — | — | — | 2 | |||||||||||||||||||
Stock-based compensation | — | — | 51 | — | — | — | 51 | |||||||||||||||||||
Dividends | — | — | (26 | ) | — | — | (3 | ) | (29 | ) | ||||||||||||||||
Balance at December 31, 2016 | — | $ | — | $ | 5,566 | $ | (3,062 | ) | $ | (40 | ) | $ | 5 | $ | 2,469 | |||||||||||
Net income | — | — | — | 431 | — | 3 | 434 | |||||||||||||||||||
Other comprehensive income | — | — | — | — | 3 | — | 3 | |||||||||||||||||||
Repurchase of Common Stock | — | — | (280 | ) | — | — | — | (280 | ) | |||||||||||||||||
Contributions from Realogy Holdings | — | — | 8 | — | — | — | 8 | |||||||||||||||||||
Stock-based compensation | — | — | 41 | — | — | — | 41 | |||||||||||||||||||
Dividends | — | — | (49 | ) | — | — | (4 | ) | (53 | ) | ||||||||||||||||
Balance at December 31, 2017 | — | $ | — | $ | 5,286 | $ | (2,631 | ) | $ | (37 | ) | $ | 4 | $ | 2,622 | |||||||||||
F-39
15. EARNINGS PER SHARE
Earnings per share attributable to Realogy Holdings
Basic earnings per share is computed based on net income attributable to Realogy Holdings stockholders divided by the basic weighted-average shares outstanding during the period. Dilutive earnings per share is computed consistently with the basic computation while giving effect to all dilutive potential common shares and common share equivalents that were outstanding during the period. Realogy Holdings uses the treasury stock method to reflect the potential dilutive effect of unvested stock awards and unexercised options. The following table sets forth the computation of basic and diluted earnings per share:
Year Ended December 31, | ||||||||||||
(in millions, except per share data) | 2017 | 2016 | 2015 | |||||||||
Net income attributable to Realogy Holdings shareholders | $ | 431 | $ | 213 | $ | 184 | ||||||
Basic weighted average shares | 136.7 | 144.5 | 146.5 | |||||||||
Stock options, restricted stock, restricted stock units and performance share units (a) | 1.7 | 1.3 | 1.6 | |||||||||
Weighted average diluted shares | 138.4 | 145.8 | 148.1 | |||||||||
Earnings Per Share: | ||||||||||||
Basic | $ | 3.15 | $ | 1.47 | $ | 1.26 | ||||||
Diluted | $ | 3.11 | $ | 1.46 | $ | 1.24 | ||||||
_______________
(a) | Excludes 5.3 million, 4.5 million and 3.5 million shares of common stock issuable for incentive equity awards, including performance share units based on the achievement of target amounts, for the years ended December 31, 2017, 2016 and 2015, respectively, which are anti-dilutive to the diluted earnings per share computation. |
Under the 2016 and 2017 share repurchase programs, the Company's Board of Directors authorized up to $575 million of the Company’s common stock. For the year ended December 31, 2017, the Company repurchased and retired 9.4 million shares of common stock for $276 million at a weighted average market price of $29.38 per share. For the year ended December 31, 2016, the Company repurchased and retired 7.1 million shares of common stock for $199 million at a weighted average market price of $27.96 per share, which includes 0.2 million shares for which the trade date occurred in late December 2016 while settlement occurred in January 2017. The purchase of shares under these plans reduce the weighted-average number of shares outstanding in the basic earnings per share calculation.
16. RISK MANAGEMENT AND FAIR VALUE OF FINANCIAL INSTRUMENTS
RISK | MANAGEMENT |
The following is a description of the Company’s risk management policies.
Interest Rate Risk
The Company is exposed to market risk from changes in interest rates primarily through senior secured debt. At December 31, 2017, the Company's primary interest rate exposure was to interest rate fluctuations, specifically LIBOR, due to its impact on variable rate borrowings of Revolving Credit Facility and Term Loan B under the Senior Secured Credit Agreement and Term Loan A Facility. Given that borrowings under the Senior Secured Credit Agreement and Term Loan A Facility are generally based upon LIBOR, this rate will be the Company's primary market risk exposure for the foreseeable future. At December 31, 2017, the Company had variable interest rate long-term debt, which was based on LIBOR, from the outstanding term loans and revolver under its Senior Secured Credit Facility and Term Loan A Facility of $1,886 million, excluding $194 million of securitization obligations.
The Company has interest rate swaps with an aggregate notional value of $1,475 million to manage a portion of the Company's exposure to changes in interest rate associated with variable rate borrowings. The fixed interest rates on the swaps range from 2.07% to 2.89%. Although we have entered into these interest rate swaps, involving the exchange of floating for fixed rate interest payments, such interest rate swaps do not eliminate interest rate volatility for all of our variable rate indebtedness at December 31, 2017. In addition, the fair value of the interest rate swaps is also subject to movements in LIBOR and will fluctuate in future periods. The Company has recognized a liability of $13 million for the
F-40
fair value of the interest rate swaps at December 31, 2017. Therefore, an increase in the LIBOR yield curve could increase the fair value of the interest rate swaps and decrease interest expense.
In the normal course of business, the Company borrows funds under its securitization facilities and utilizes such funds to generate assets on which it generally earns interest income. The Company does not believe it is exposed to significant interest rate risk in connection with these activities as the rate it incurs on such borrowings and the rate it earns on such assets are generally based on similar variable indices, thereby providing a natural hedge.
Credit Risk and Exposure
The Company is exposed to counterparty credit risk in the event of nonperformance by counterparties to various agreements and sales transactions. The Company manages such risk by evaluating the financial position and creditworthiness of such counterparties and by requiring collateral in instances in which financing is provided. The Company mitigates counterparty credit risk associated with its derivative contracts by monitoring the amounts at risk with each counterparty to such contracts, periodically evaluating counterparty creditworthiness and financial position, and where possible, dispersing its risk among multiple counterparties.
As of December 31, 2017, there were no significant concentrations of credit risk with any individual counterparty or a group of counterparties. The Company actively monitors the credit risk associated with the Company’s receivables.
Market Risk Exposure
The Company Owned Real Estate Brokerage Services segment, NRT, owns real estate brokerage offices located in and around large metropolitan areas in the U.S. NRT has more offices and realizes more of its revenues in California, Florida and the New York metropolitan area than any other regions of the country. For the year ended December 31, 2017, NRT generated approximately 27% of its revenues from California, 22% from the New York metropolitan area and 9% from Florida. For the year ended December 31, 2016, NRT generated approximately 26% of its revenues from California, 22% from the New York metropolitan area and 9% from Florida. For the year ended December 31, 2015, NRT generated approximately 27% of its revenues from California, 23% from the New York metropolitan area and 10% from Florida.
Derivative Instruments
The Company records derivatives and hedging activities on the balance sheet at their respective fair values. The Company uses foreign currency forward contracts largely to manage its exposure to changes in foreign currency exchange rates associated with its foreign currency denominated receivables and payables. The Company primarily manages its foreign currency exposure to the Euro, British Pound, Swiss Franc and Canadian Dollar. The Company has not elected to utilize hedge accounting for these forward contracts; therefore, any change in fair value is recorded in the Consolidated Statements of Operations. However, the fluctuations in the value of these forward contracts generally offset the impact of changes in the value of the underlying risk that they are intended to economically hedge. As of December 31, 2017, the Company had outstanding foreign currency forward contracts in a liability position with a fair value of less than $1 million and a notional value of $25 million. As of December 31, 2016, the Company had outstanding foreign currency forward contracts in a liability position with a fair value of $2 million and a notional value of $29 million.
The Company also enters into interest rate swaps to manage its exposure to changes in interest rates associated with its variable rate borrowings. At December 31, 2017, the Company has interest rate swaps with an aggregate notional value of $1,475 million to offset the variability in cash flows resulting from the term loan facilities as follows:
Notional Value (in millions) | Commencement Date | Expiration Date | |||
$225 | July 2012 | February 2018 | (a) | ||
$200 | January 2013 | February 2018 | (a) | ||
$600 | August 2015 | August 2020 | |||
$450 | November 2017 | (a) | November 2022 | ||
_______________
(a) | Interest rates swaps with a notional value of $425 million expired February 10, 2018, and interest rate swaps with a notional value of $450 million commenced in the fourth quarter of 2017. |
The swaps help to protect our outstanding variable rate borrowings from future interest rate volatility. The Company has not elected to utilize hedge accounting for these interest rate swaps; therefore, any change in fair value is recorded in the Consolidated Statements of Operations.
F-41
The fair value of derivative instruments was as follows:
Liability Derivatives | Fair Value | |||||||||
Not Designated as Hedging Instruments | Balance Sheet Location | December 31, 2017 | December 31, 2016 | |||||||
Interest rate swap contracts | Other current and non-current liabilities | $ | 13 | $ | 33 | |||||
The effect of derivative instruments on earnings was as follows:
Derivative Instruments Not Designated as Hedging Instruments | Location of (Gain) or Loss Recognized for Derivative Instruments | (Gain) or Loss Recognized on Derivatives | ||||||||||||
Year Ended December 31, | ||||||||||||||
2017 | 2016 | 2015 | ||||||||||||
Interest rate swap contracts | Interest expense | $ | (4 | ) | $ | 6 | $ | 20 | ||||||
Foreign exchange contracts | Operating expense | 2 | (2 | ) | (2 | ) | ||||||||
Fair Value Measurements
The following tables present the Company’s assets and liabilities that are measured at fair value on a recurring basis and are categorized using the fair value hierarchy. The fair value hierarchy has three levels based on the reliability of the inputs used to determine fair value.
Level Input: | Input Definitions: | |
Level I | Inputs are unadjusted, quoted prices for identical assets or liabilities in active markets at the measurement date. | |
Level II | Inputs other than quoted prices included in Level I that are observable for the asset or liability through corroboration with market data at the measurement date. | |
Level III | Unobservable inputs that reflect management’s best estimate of what market participants would use in pricing the asset or liability at the measurement date. | |
The availability of observable inputs can vary from asset to asset and is affected by a wide variety of factors including, for example, the type of asset, whether the asset is new and not yet established in the marketplace, and other characteristics particular to the transaction. To the extent that valuation is based on models or inputs that are less observable or unobservable in the market, the determination of fair value requires more judgment. Accordingly, the degree of judgment exercised by the Company in determining fair value is greatest for instruments categorized in Level III. In certain cases, the inputs used to measure fair value may fall into different levels of the fair value hierarchy. In such cases, for disclosure purposes, the level in the fair value hierarchy within which the fair value measurement in its entirety falls is determined based on the lowest level input that is significant to the fair value measurement in its entirety.
The fair value of financial instruments is generally determined by reference to quoted market values. In cases where quoted market prices are not available, fair value is based on estimates using present value or other valuation techniques, as appropriate. The fair value of interest rate swaps is determined based upon a discounted cash flow approach.
The Company measures financial instruments at fair value on a recurring basis and recognizes transfers within the fair value hierarchy at the end of the fiscal quarter in which the change in circumstances that caused the transfer occurred.
The following table summarizes fair value measurements by level at December 31, 2017 for assets and liabilities measured at fair value on a recurring basis:
Level I | Level II | Level III | Total | ||||||||||||
Interest rate swaps (included in other current and non-current liabilities) | $ | — | $ | 13 | $ | — | $ | 13 | |||||||
Deferred compensation plan assets (included in other non-current assets) | 3 | — | — | 3 | |||||||||||
Contingent consideration for acquisitions (included in accrued expenses and other current liabilities and non-current liabilities) | — | — | 34 | 34 | |||||||||||
F-42
The following table summarizes fair value measurements by level at December 31, 2016 for assets and liabilities measured at fair value on a recurring basis:
Level I | Level II | Level III | Total | ||||||||||||
Interest rate swaps (included in other non-current liabilities) | $ | — | $ | 33 | $ | — | $ | 33 | |||||||
Deferred compensation plan assets (included in other non-current assets) | 3 | — | — | 3 | |||||||||||
Contingent consideration for acquisitions (included in accrued expenses and other current liabilities and non-current liabilities) | — | — | 50 | 50 | |||||||||||
The fair value of the Company’s contingent consideration for acquisitions is measured using a probability weighted-average discount rate to estimate future cash flows based upon the likelihood of achieving future operating results for individual acquisitions. These assumptions are deemed to be unobservable inputs and as such the Company’s contingent consideration is classified within Level III of the valuation hierarchy. The Company reassesses the fair value of the contingent consideration liabilities on a quarterly basis.
The following table presents changes in Level III financial liabilities measured at fair value on a recurring basis:
Level III | ||||
Fair value of contingent consideration at December 31, 2016 | $ | 50 | ||
Additions: contingent consideration related to acquisitions completed during the period | 7 | |||
Reductions: payments of contingent consideration | (22 | ) | ||
Changes in fair value (reflected in the Consolidated Statement of Operations) | (1 | ) | ||
Fair value of contingent consideration at December 31, 2017 | $ | 34 | ||
The following table summarizes the principal amount of the Company’s indebtedness compared to the estimated fair value, primarily determined by quoted market values, at:
December 31, 2017 | December 31, 2016 | ||||||||||||||
Debt | Principal Amount | Estimated Fair Value (a) | Principal Amount | Estimated Fair Value (a) | |||||||||||
Senior Secured Credit Facility: | |||||||||||||||
Revolving Credit Facility | $ | 70 | $ | 70 | $ | 200 | $ | 200 | |||||||
Term Loan B | 1,083 | 1,085 | 1,094 | 1,100 | |||||||||||
Term Loan A Facility: | |||||||||||||||
Term Loan A | 391 | 393 | 413 | 414 | |||||||||||
Term Loan A-1 | 342 | 343 | 351 | 351 | |||||||||||
4.50% Senior Notes | 450 | 457 | 450 | 461 | |||||||||||
5.25% Senior Notes | 550 | 569 | 550 | 562 | |||||||||||
4.875% Senior Notes | 500 | 495 | 500 | 483 | |||||||||||
Securitization obligations | 194 | 194 | 205 | 205 | |||||||||||
_______________
(a) | The fair value of the Company's indebtedness is categorized as Level II. |
F-43
17. | SEGMENT INFORMATION |
The reportable segments presented below represent the Company’s operating segments for which separate financial information is available and which is utilized on a regular basis by its chief operating decision maker to assess performance and to allocate resources. In identifying its reportable segments, the Company also considers the nature of services provided by its operating segments. Management evaluates the operating results of each of its reportable segments based upon revenue and EBITDA, which is defined as net income (loss) before depreciation and amortization, interest (income) expense, net (other than Relocation Services interest for relocation receivables and securitization obligations) and income taxes, each of which is presented in the Company’s Consolidated Statements of Operations. The Company’s presentation of EBITDA may not be comparable to similar measures used by other companies.
Revenues (a) (b) | |||||||||||
Year Ended December 31, | |||||||||||
2017 | 2016 | 2015 | |||||||||
Real Estate Franchise Services | $ | 830 | $ | 781 | $ | 755 | |||||
Company Owned Real Estate Brokerage Services | 4,643 | 4,344 | 4,344 | ||||||||
Relocation Services | 382 | 405 | 415 | ||||||||
Title and Settlement Services | 570 | 573 | 487 | ||||||||
Corporate and Other (c) | (311 | ) | (293 | ) | (295 | ) | |||||
Total Company | $ | 6,114 | $ | 5,810 | $ | 5,706 | |||||
_______________
(a) | Transactions between segments are eliminated in consolidation. Revenues for the Real Estate Franchise Services segment include intercompany royalties and marketing fees paid by the Company Owned Real Estate Brokerage Services segment of $311 million, $293 million and $295 million for the years ended December 31, 2017, 2016 and 2015, respectively. Such amounts are eliminated through the Corporate and Other line. |
(b) | Revenues for the Relocation Services segment include intercompany referral commissions paid by the Company Owned Real Estate Brokerage Services segment of $40 million, $43 million and $49 million for the years ended December 31, 2017, 2016 and 2015, respectively. Such amounts are recorded as contra-revenues by the Company Owned Real Estate Brokerage Services segment. There are no other material intersegment transactions. |
(c) | Includes the elimination of transactions between segments. |
EBITDA | |||||||||||
Year Ended December 31, | |||||||||||
2017 (a) | 2016 (b) | 2015 (c) | |||||||||
Real Estate Franchise Services | $ | 559 | $ | 516 | $ | 495 | |||||
Company Owned Real Estate Brokerage Services | 126 | 137 | 199 | ||||||||
Relocation Services | 85 | 96 | 105 | ||||||||
Title and Settlement Services | 58 | 62 | 48 | ||||||||
Corporate and Other (d) | (103 | ) | (78 | ) | (121 | ) | |||||
Total Company | $ | 725 | $ | 733 | $ | 726 | |||||
(a) | For the year ended December 31, 2017, the Real Estate Franchise Services segment includes restructuring charges of $1 million; the Company Owned Real Estate Brokerage Services segment includes restructuring charges of $9 million; the Title and Settlement Services segment includes restructuring charges of $1 million; and Corporate and Other includes an $8 million expense related to the settlement of the Strader legal matter, an $8 million expense related to the transition of the Company's CEO, $5 million related to the losses on the early extinguishment of debt and restructuring charges of $1 million, partially offset by a net benefit of $10 million of former parent legacy items. |
(b) | For the year ended December 31, 2016, the Real Estate Franchise Services segment includes restructuring charges of $4 million; the Company Owned Real Estate Brokerage Services segment includes restructuring charges of $22 million; the Relocation Services segment includes restructuring charges of $4 million; the Title and Settlement Services segment includes restructuring charges of $1 million; and Corporate and Other includes restructuring charges of $8 million, partially offset by a net benefit of $2 million of former parent legacy items. |
(c) | For the year ended December 31, 2015, the Company Owned Real Estate Brokerage Services segment includes restructuring charges of $5 million; the Relocation Services segment includes restructuring charges of $1 million; and Corporate and Other includes $48 million related to the loss on the early extinguishment of debt and restructuring charges of $4 million, partially offset by a net benefit of $15 million of former parent legacy items. |
F-44
(d) | Includes the elimination of transactions between segments. |
Provided below is a reconciliation of EBITDA to Net income attributable to Realogy Holdings and Realogy Group:
Year Ended December 31, | |||||||||||
2017 | 2016 | 2015 | |||||||||
Net income attributable to Realogy Holdings and Realogy Group | $ | 431 | $ | 213 | $ | 184 | |||||
Add: Depreciation and amortization (a) | 201 | 202 | 201 | ||||||||
Interest expense, net | 158 | 174 | 231 | ||||||||
Income tax (benefit) expense | (65 | ) | 144 | 110 | |||||||
EBITDA | $ | 725 | $ | 733 | $ | 726 | |||||
_______________
(a) | Depreciation and amortization for the year ended December 31, 2017 includes $3 million of amortization expense related to Guaranteed Rate Affinity's purchase accounting included in the "Equity in earnings of unconsolidated entities" line on the Consolidated Statement of Operations. |
Depreciation and Amortization
Year Ended December 31, | |||||||||||
2017 | 2016 | 2015 | |||||||||
Real Estate Franchise Services | $ | 79 | $ | 77 | $ | 77 | |||||
Company Owned Real Estate Brokerage Services | 50 | 49 | 46 | ||||||||
Relocation Services | 33 | 31 | 33 | ||||||||
Title and Settlement Services | 16 | 23 | 25 | ||||||||
Corporate and Other | 20 | 22 | 20 | ||||||||
Total Company | $ | 198 | $ | 202 | $ | 201 | |||||
Segment Assets
As of December 31, | |||||||
2017 | 2016 | ||||||
Real Estate Franchise Services | $ | 4,413 | $ | 4,477 | |||
Company Owned Real Estate Brokerage Services | 1,258 | 1,249 | |||||
Relocation Services | 1,029 | 1,081 | |||||
Title and Settlement Services | 486 | 416 | |||||
Corporate and Other | 151 | 198 | |||||
Total Company | $ | 7,337 | $ | 7,421 | |||
Capital Expenditures
Year Ended December 31, | |||||||||||
2017 | 2016 | 2015 | |||||||||
Real Estate Franchise Services | $ | 9 | $ | 8 | $ | 8 | |||||
Company Owned Real Estate Brokerage Services | 44 | 44 | 41 | ||||||||
Relocation Services | 11 | 12 | 14 | ||||||||
Title and Settlement Services | 13 | 9 | 8 | ||||||||
Corporate and Other | 22 | 14 | 13 | ||||||||
Total Company | $ | 99 | $ | 87 | $ | 84 | |||||
F-45
The geographic segment information provided below is classified based on the geographic location of the Company’s subsidiaries.
United States | All Other Countries | Total | |||||||||
On or for the year ended December 31, 2017 | |||||||||||
Net revenues | $ | 5,997 | $ | 117 | $ | 6,114 | |||||
Total assets | 7,261 | 76 | 7,337 | ||||||||
Net property and equipment | 287 | 2 | 289 | ||||||||
On or for the year ended December 31, 2016 | |||||||||||
Net revenues | $ | 5,683 | $ | 127 | $ | 5,810 | |||||
Total assets | 7,347 | 74 | 7,421 | ||||||||
Net property and equipment | 265 | 2 | 267 | ||||||||
On or for the year ended December 31, 2015 | |||||||||||
Net revenues | $ | 5,579 | $ | 127 | $ | 5,706 | |||||
Total assets | 7,450 | 81 | 7,531 | ||||||||
Net property and equipment | 252 | 2 | 254 | ||||||||
18. | SELECTED QUARTERLY FINANCIAL DATA (UNAUDITED) |
Provided below is selected unaudited quarterly financial data for 2017 and 2016.
2017 | |||||||||||||||
First | Second | Third | Fourth | ||||||||||||
Net revenues | |||||||||||||||
Real Estate Franchise Services | $ | 170 | $ | 237 | $ | 224 | $ | 199 | |||||||
Company Owned Real Estate Brokerage Services | 897 | 1,392 | 1,267 | 1,087 | |||||||||||
Relocation Services | 77 | 102 | 111 | 92 | |||||||||||
Title and Settlement Services | 120 | 157 | 154 | 139 | |||||||||||
Corporate and Other (a) | (61 | ) | (95 | ) | (82 | ) | (73 | ) | |||||||
Total Company | $ | 1,203 | $ | 1,793 | $ | 1,674 | $ | 1,444 | |||||||
Income (loss) before income taxes, equity in earnings and noncontrolling interests (b) | |||||||||||||||
Real Estate Franchise Services | $ | 82 | $ | 146 | $ | 139 | $ | 113 | |||||||
Company Owned Real Estate Brokerage Services | (35 | ) | 65 | 36 | (14 | ) | |||||||||
Relocation Services | (5 | ) | 21 | 32 | 15 | ||||||||||
Title and Settlement Services | (3 | ) | 23 | 19 | 6 | ||||||||||
Corporate and Other | (73 | ) | (72 | ) | (73 | ) | (71 | ) | |||||||
Total Company | $ | (34 | ) | $ | 183 | $ | 153 | $ | 49 | ||||||
Net income (loss) attributable to Realogy Holdings and Realogy Group | $ | (28 | ) | $ | 109 | $ | 95 | $ | 255 | ||||||
Income (loss) per share attributable to Realogy Holdings (c): | |||||||||||||||
Basic income (loss) per share | $ | (0.20 | ) | $ | 0.79 | $ | 0.70 | $ | 1.91 | ||||||
Diluted income (loss) per share | $ | (0.20 | ) | $ | 0.78 | $ | 0.69 | $ | 1.89 | ||||||
_______________
(a) | Represents the elimination of transactions primarily between the Real Estate Franchise Services segment and the Company Owned Real Estate Brokerage Services segment. |
(b) | The quarterly results include the following: |
• | an $8 million expense related to the settlement of the Strader legal matter in the second quarter; |
• | restructuring charges of $5 million, $2 million, $2 million and $3 million in the first, second, third and fourth quarters, respectively; |
• | former parent legacy net benefit of $11 million in the second quarter and former parent legacy net cost of $1 million in the third quarter; |
• | a loss on the early extinguishment of debt of $4 million and $1 million in the first and third quarters, respectively; |
F-46
• | mark-to-market adjustments for interest rate swaps of a $1 million gain, a $5 million loss, and an $8 million gain in the first, second and fourth quarters, respectively; and |
• | an $8 million expense related to the transition of the Company's CEO in the fourth quarter. |
(c) | Basic and diluted EPS amounts in each quarter are computed using the weighted-average number of shares outstanding during that quarter, while basic and diluted EPS for the full year is computed using the weighted-average number of shares outstanding during the year. Therefore, the sum of the four quarters’ basic or diluted EPS may not equal the full year basic or diluted EPS (see Note 15 "Earnings Per Share" for further information). |
2016 | |||||||||||||||
First | Second | Third | Fourth | ||||||||||||
Net revenues | |||||||||||||||
Real Estate Franchise Services | $ | 157 | $ | 221 | $ | 215 | $ | 188 | |||||||
Company Owned Real Estate Brokerage Services | 841 | 1,268 | 1,231 | 1,004 | |||||||||||
Relocation Services | 83 | 109 | 116 | 97 | |||||||||||
Title and Settlement Services | 111 | 149 | 164 | 149 | |||||||||||
Corporate and Other (a) | (58 | ) | (85 | ) | (82 | ) | (68 | ) | |||||||
Total Company | $ | 1,134 | $ | 1,662 | $ | 1,644 | $ | 1,370 | |||||||
Income (loss) before income taxes, equity in earnings and noncontrolling interests (b) | |||||||||||||||
Real Estate Franchise Services | $ | 73 | $ | 130 | $ | 133 | $ | 102 | |||||||
Company Owned Real Estate Brokerage Services | (32 | ) | 63 | 55 | (8 | ) | |||||||||
Relocation Services | (1 | ) | 22 | 34 | 16 | ||||||||||
Title and Settlement Services | (5 | ) | 21 | 17 | 6 | ||||||||||
Corporate and Other | (101 | ) | (83 | ) | (63 | ) | (30 | ) | |||||||
Total Company | $ | (66 | ) | $ | 153 | $ | 176 | $ | 86 | ||||||
Net income (loss) attributable to Realogy Holdings and Realogy Group | $ | (42 | ) | $ | 92 | $ | 106 | $ | 57 | ||||||
Income (loss) per share attributable to Realogy Holdings (c): | |||||||||||||||
Basic income (loss) per share | $ | (0.29 | ) | $ | 0.63 | $ | 0.74 | $ | 0.40 | ||||||
Diluted income (loss) per share | $ | (0.29 | ) | $ | 0.63 | $ | 0.73 | $ | 0.40 | ||||||
_______________
(a) | Represents the elimination of transactions primarily between the Real Estate Franchise Services segment and the Company Owned Real Estate Brokerage Services segment. |
(b) | The quarterly results include the following: |
• | former parent legacy net cost of $1 million in the first quarter and former parent legacy net benefit of $3 million in the fourth quarter; |
• | restructuring charges of $9 million, $12 million, $9 million and $9 million in the first, second, third and fourth quarters, respectively; and |
• | mark-to-market adjustments for interest rate swaps of a $31 million loss, a $14 million loss, a $5 million gain, and a $34 million gain in the first, second, third and fourth quarters, respectively. |
(c) | Basic and diluted EPS amounts in each quarter are computed using the weighted-average number of shares outstanding during that quarter, while basic and diluted EPS for the full year is computed using the weighted-average number of shares outstanding during the year. Therefore, the sum of the four quarters’ basic or diluted EPS may not equal the full year basic or diluted EPS. |
F-47
19. | SUBSEQUENT EVENTS |
Refinancing
In February 2018, the Company completed debt transactions which:
• | amended its revolving credit facility, by increasing the capacity from $1,050 million to $1,400 million and extending the maturity date from October 2020 to February 2023 (the "New Revolving Credit Facility"); |
• | refinanced the existing aggregate $733 million Term Loan A and Term Loan A-1 tranches due October 2020 and July 2021, respectively, into a new single tranche of $750 million Term Loan A due February 2023 (which included incremental borrowings of $17 million) (the "New Term Loan A"). The New Term Loan A Facility provides for quarterly amortization payments on the last day of each quarter, totaling per annum 2.5%, 2.5%, 5.0%, 7.5% and 10.0% of the original principal amount of the New Term Loan A, commencing June 30, 2018, with the balance of the New Term Loan A due in full on February 8, 2023; and |
• | refinanced the existing $1,083 million Term Loan B due July 2022 with a new Term Loan B issued at par in the amount of $1,080 million and with a maturity date in February 2025 (the "New Term Loan B"). |
The interest rates with respect to the New Revolving Credit Facility and the New Term Loan A are the same that had been in place under Term Loan A-1 and are based on, at the Company's option, adjusted LIBOR or ABR plus an additional margin subject to adjustments based on the Company’s then current senior secured leverage ratio. The interest rate and amortization with respect to New Term Loan B is unchanged. The other terms of the New Revolving Credit Facility, New Term Loan A and New Term Loan B are substantially the same as those in place prior to the transactions.
Adoption of New Share Repurchase Program
On February 26, 2018, the Board authorized a new share repurchase program of up to $350 million of the Company's common stock, which is in addition to the remaining authorization available under the February 2017 share repurchase program. Repurchases under the new program may be made at management's discretion from time to time on the open market, pursuant to Rule 10b5-1 trading plans or through privately negotiated transactions. The size and timing of these repurchases will depend on price, market and economic conditions, legal and contractual requirements and other factors. Similarly, the new repurchase program has no time limit and may be suspended or discontinued at any time.
F-48
EXHIBIT INDEX
Exhibit | Description |
2.1 |
2.2 |
3.1 |
3.2 |
3.3 |
3.4 |
3.5 |
4.1 |
4.2 |
4.3 |
4.4 |
4.5 |
4.6 |
4.7 |
4.8 |
4.9 |
G-1
4.10 |
4.11 |
4.12 |
4.13 |
4.14 |
4.15 |
4.16 |
4.17 |
4.18 |
4.19 |
4.20 |
4.21 |
4.22 |
10.1 |
10.2 |
10.3 |
G-2
10.4 |
10.5 |
10.6 |
10.7 |
10.8 |
10.9 |
10.10 |
10.11 |
10.12 | Term Loan A Agreement, dated as of October 23, 2015, among Realogy Intermediate Holdings LLC, Realogy Group LLC, the lenders party thereto from time to time and JPMorgan Chase Bank, N.A., as administrative agent for the lenders (Incorporated by reference to Exhibit 10.2 to Registrants' Current Report on Form 8-K filed on October 28, 2015). Note: The Term Loan A Agreement reflecting the cumulative effect of all amendments through February 8, 2018 is attached as Exhibit A to Exhibit 10.14 in this Exhibit Index. |
10.13 |
G-3
10.14 | Second Amendment, dated as of February 8, 2018, to the Term Loan A Agreement, dated as of October 23, 2015, among Realogy Intermediate Holdings LLC, Realogy Group LLC, the lenders party thereto from time to time and JPMorgan Chase Bank, N.A., as administrative agent for the lenders (Incorporated by reference to Exhibit 10.1to Registrants' Current Report on Form 8-K filed on February 8, 2018). Note: The Term Loan A Agreement reflecting the cumulative effect of all amendments through February 8, 2018 is attached as Exhibit A to this Exhibit 10.14. |
10.15 |
10.16 |
10.17 |
10.18** |
10.19** |
10.20** |
10.21** |
10.22** |
10.23** |
10.24** |
10.25** |
10.26** |
10.27** |
G-4
10.28* ** |
10.29** |
10.30** |
10.31** |
10.32** |
10.33** |
10.34** |
10.35** |
10.36** |
10.37** |
10.38 |
10.39 |
10.40 |
10.41 |
10.42 |
G-5
10.43 |
10.44 |
10.45 |
10.46 |
10.47 |
10.48 |
10.49 |
10.50 |
10.51 |
10.52 |
G-6
10.53 |
10.54 |
10.55** |
10.57** |
10.58** |
10.59** |
10.60** |
10.61** |
10.62 |
21.1* |
23.1* |
24.1* |
31.1* |
31.2* |
31.3* |
31.4* |
32.1* |
G-7
32.2* |
101.INS ^ | XBRL Instance Document. |
101.SCH ^ | XBRL Taxonomy Extension Schema Document. |
101.CAL^ | XBRL Taxonomy Extension Calculation Linkbase Document. |
101.DEF ^ | XBRL Taxonomy Extension Definition Linkbase Document. |
101.LAB ^ | XBRL Taxonomy Extension Label Linkbase Document. |
101.PRE ^ | XBRL Taxonomy Extension Presentation Linkbase Document. |
_______________
* | Filed herewith. |
** | Compensatory plan or arrangement. |
^ | Furnished electronically with this report. |
G-8