Attached files
| file | filename |
|---|---|
| EX-32.1 - EX-32.1 - Monotype Imaging Holdings Inc. | d507580dex321.htm |
| EX-31.2 - EX-31.2 - Monotype Imaging Holdings Inc. | d507580dex312.htm |
| EX-31.1 - EX-31.1 - Monotype Imaging Holdings Inc. | d507580dex311.htm |
| EX-23.1 - EX-23.1 - Monotype Imaging Holdings Inc. | d507580dex231.htm |
| EX-10.9 - EX-10.9 - Monotype Imaging Holdings Inc. | d507580dex109.htm |
Table of Contents
UNITED STATES
SECURITIES AND EXCHANGE COMMISSION
Washington, D.C. 20549
FORM 10-K
| ☑ | ANNUAL REPORT PURSUANT TO SECTION 13 OR 15(d) OF THE SECURITIES EXCHANGE ACT OF 1934 |
For the fiscal year ended December 31, 2017
| ☐ | TRANSITION REPORT PURSUANT TO SECTION 13 OR 15(d) OF THE SECURITIES EXCHANGE ACT OF 1934 |
For the transition period from to
Commission File Number 001-33612
MONOTYPE IMAGING HOLDINGS INC.
(Exact name of registrant as specified in its charter)
| Delaware | 20-3289482 | |
| (State of incorporation) | (I.R.S. Employer Identification No.) | |
| 600 Unicorn Park Drive Woburn, Massachusetts |
01801 | |
| (Address of principal executive offices) | (Zip Code) | |
Registrant’s telephone number, including area code: (781) 970-6000
Securities Registered Pursuant to Section 12(b) of the Act:
| Title of Each Class |
Name of Exchange on Which Registered | |
| Common Stock, $0.001 par value | The NASDAQ Stock Market LLC |
Securities Registered Pursuant to Section 12(g) of the Act:
None
Indicate by check mark if the registrant is a well-known seasoned issuer, as defined in Rule 405 of the Securities Act. Yes ☑ No ☐
Indicate by check mark if the registrant is not required to file reports pursuant to Section 13 or 15(d) of the Act. Yes ☐ No ☑
Indicate by check mark whether the registrant (1) has filed all reports required to be filed by Section 13 or 15(d) of the Securities Exchange Act of 1934 during the preceding 12 months (or such shorter period that the registrant was required to file such reports), and (2) has been subject to such filing requirements for the past 90 days.
Yes ☑ No ☐
Indicate by check mark whether the registrant has submitted electronically and posted on its corporate Web site, if any, every Interactive Data File required to be submitted and posted pursuant to Rule 405 of Regulation S-T (§232.405 of this chapter) during the preceding 12 months (or for such shorter period that the registrant was required to submit and post such files). Yes ☑ No ☐
Indicate by check mark if disclosure of delinquent filers pursuant to Item 405 of Regulation S-K is not contained herein, and will not be contained, to the best of registrant’s knowledge, in definitive proxy or information statements incorporated by reference in Part III of this Form 10-K or any amendment to this Form 10-K. ☐
Indicate by check mark whether the registrant is a large accelerated filer, an accelerated filer, a non-accelerated filer, a smaller reporting company or an emerging growth company. See the definitions of “large accelerated filer,” “accelerated filer,” “smaller reporting company” and “emerging growth company” in Rule 12b-2 of the Exchange Act. (Check one):
Large accelerated filer ☑ Accelerated filer ☐ Non-accelerated filer ☐ Smaller reporting company ☐
Emerging growth company ☐
If an emerging growth company, indicate by check mark if the registrant has elected not to use the extended transition period for complying with any new or revised financial accounting standards provided pursuant to Section 13(a) of the Exchange Act. ☐
Indicate by check mark whether the registrant is a shell company (as defined in Rule 12b-2 of the Act). Yes ☐ No ☑
The aggregate market value of the registrant’s common stock held by non-affiliates of the registrant, computed by reference to the last reported sale price of the common stock as reported on the NASDAQ Global Select Market on June 30, 2017 was approximately $578,250,116 (assumes officers, directors, and all shareholders beneficially owning 10% or more of the outstanding common shares are affiliates).
The number of shares outstanding of the registrant’s common stock as of February 20, 2018 was approximately 41,560,522.
DOCUMENTS INCORPORATED BY REFERENCE.
Portions of the registrant’s definitive Proxy Statement to be filed with the Securities and Exchange Commission pursuant to Regulation 14A in connection with the 2018 Annual Meeting of Stockholders are incorporated herein by reference into Part III of this report.
Table of Contents
MONOTYPE IMAGING HOLDINGS INC.
| Item No. |
Page No. | |||||
| PART I | ||||||
| Item 1. | 2 | |||||
| Item 1A. | 16 | |||||
| Item 1B. | 34 | |||||
| Item 2. | 34 | |||||
| Item 3. | 35 | |||||
| Item 4. | 35 | |||||
| PART II | ||||||
| Item 5. | 36 | |||||
| Item 6. | 40 | |||||
| Item 7. | Management’s Discussion and Analysis of Financial Condition and Results of Operations |
41 | ||||
| Item 7A. | 65 | |||||
| Item 8. | 68 | |||||
| Item 9. | Changes in and Disagreements With Accountants on Accounting and Financial Disclosure |
113 | ||||
| Item 9A. | 114 | |||||
| Item 9B. | 117 | |||||
| PART III | ||||||
| Item 10. | 117 | |||||
| Item 11. | 117 | |||||
| Item 12. | Security Ownership of Certain Beneficial Owners and Management and Related Stockholder Matters |
117 | ||||
| Item 13. | Certain Relationships and Related Transactions, and Directors Independence |
117 | ||||
| Item 14. | 117 | |||||
| PART IV | ||||||
| Item 15. | 118 | |||||
| Item 16. | 123 | |||||
| 124 | ||||||
As used in this report, the terms “we,” “us,” “our,” “Monotype” and the “Company” mean Monotype Imaging Holdings Inc. and its subsidiaries, unless the context indicates another meaning.
Unless otherwise noted, all dollar amounts in this report are expressed in United States dollars.
We own, have rights to, or have applied for the trademarks and trade names that we use in conjunction with our business, including our name and logo. All other trademarks and trade names appearing in this report are the property of their respective holders.
1
Table of Contents
PART I
| Item 1. | Business |
Certain statements in this Annual Report on Form 10-K are “forward-looking statements” within the meaning of Section 27A of the Securities Act of 1933, as amended (the “Securities Act”), and Section 21E of the Securities Exchange Act of 1934, as amended (the “Exchange Act”). These statements involve a number of risks, uncertainties and other factors that could cause our actual results, performance or achievements to be materially different from any future results, performance or achievements expressed or implied by these forward-looking statements. Factors which could materially affect such forward-looking statements can be found in the section entitled “Risk Factors” in Part 1, Item 1A in this Annual Report on Form 10-K. Investors are urged to consider these factors carefully in evaluating the forward-looking statements and are cautioned not to place undue reliance on such forward-looking statements. The forward-looking statements made herein are only made as of the date hereof and we will undertake no obligation to publicly update such forward-looking statements to reflect subsequent events or circumstances.
Overview
We are a leading global provider of design assets, technology and expertise that are designed to enable the best user experiences, ensure brand integrity and help companies engage their best customers. Monotype empowers expression and engagement for creatives, designers, engineers and marketers at the world’s most revered brands. These professionals sit at globally recognized organizations or are independent creatives who support these organizations. We support their efforts by producing compelling content that builds beloved and valued brands, providing technology that cultivates meaningful engagement with their brand enthusiasts, and providing intelligence and insight through the measurement of content performance.
At the highest level, we organize our business operations into two areas:
Creative Professionals—Our focus is to help companies provide high-quality, branded or personalized content across multiple devices and mediums. Our solutions, which include type, branded mobile content, visual content marketing solutions, custom design services, and technologies that facilitate engagement with a company’s best customers, are licensed through our direct sales channel, e-commerce and partner platforms. We work with a wide range of customers worldwide, including brands, agencies and publishers.
OEM—Our focus is to provide consumer device manufacturers and independent software vendors, or ISVs, with the right solutions for delivering consistent, compelling user experiences. Our solutions power the visual expression of the leading makers of a wide range of devices, including laser printers, digital copiers, automotive displays, mobile phones, navigation devices, e-book readers, tablets, digital cameras, digital televisions, set-top boxes, consumer appliances and Internet of Things devices, as well as provide a high-quality text experience in numerous software applications and operating systems.
Our principal office is located in Woburn, Massachusetts, with regional offices in San Francisco, Los Altos and Los Angeles, California; Boulder, Colorado; Elk Grove Village and Chicago, Illinois; New York, New York; Cordoba, Argentina; Salfords and London, United Kingdom; Bad Homburg and Berlin, Germany; Noida, India; Shanghai and Hong Kong, China; Seoul, Republic of Korea; and Tokyo, Japan.
2
Table of Contents
Industry Overview and Market Opportunity
As global communication and commerce continue to advance, individuals now have greater access to information than ever before. As a result, digital – and especially, mobile digital – continues to be the dominant source for media consumption. This has created a digitally tethered consumer, emboldened to direct what information they see and how they receive it. The resulting shift in the consumers’ balance of power has dramatically altered traditional marketing paradigms for marketers and advertisers.
This digital transformation introduced a glut of new distribution channels by which marketers reach their intended audiences. This, coupled with increased complexity around media consumption due to a proliferation of devices, screens and operating platforms, has put pressure on organizations to modernize their technology and increase the level of digital expertise across the entire organization. Business strategies and capabilities designed by business leaders and creative professionals at organizations today now require a digitally-oriented-first approach.
Today’s creative professionals—including brand managers, agencies and other marketing professionals— are challenged with a complex blend of offline and online communication channels, a myriad of platforms available for consuming content, and a change in consumer preference for more personalized messaging that has made designing and managing a global brand highly complex. Creative professionals require an abundance of content, delivered seamlessly across online and offline platforms, that is engaging, on brand, and relevant to its intended audience. For device manufacturers, the challenge is ensuring both the brand assets and design deploy everywhere with the look-and-feel the author intended.
Our customers turn to us for design assets, technology and expertise, which address the needs of an ever-changing landscape, whether they are content creators, the marketers distributing the content, or the consumer device manufacturers and independent software vendors and developers who enable the consumption of content. These customers use our products to enhance user experiences, create compelling digital and print content, and provide platforms for using content to engage their best customers as brand advocates.
Content Creators
Content creators include brands, advertising agencies, graphic designers, printers, publishers, and non-professional creators of content (such as social media users, designers, bloggers and self-publishers). Content creators produce digital and/or printed material, and they seek creative ways to convey meaning and differentiate identity. Fonts are an important tool for this differentiation. For example, creative professionals at multinational corporations are increasingly tasked with creating solutions that extend their brand into new markets. The challenge is to ensure that branding efforts are reflected consistently in every communication, regardless of media. In addition, creative professionals need design tools that integrate seamlessly into their workflows, making them more efficient. Web fonts, which travel with the content to a user’s connected device for consistent viewing regardless of the environment, are an example of a solution that addresses the needs of creative professional customers. Social media and messaging platforms offer a wide range of opportunities for consumers (non-professional creatives) to express a personal brand. Stickers, emojis and fonts allow consumers to communicate who they are in fun and expressive ways and, when their use is monitored and reported, also provide analytics back to the brand.
3
Table of Contents
Marketers
Marketers are facing new challenges. Traditional media channels for reaching consumers, such as broadcast television, are losing their audience. A proliferation of digital media channels for consuming content has forced marketers to reshape their strategies to better serve a mobile-first, multi-screen marketing landscape. The content is on-demand and has a heavy social component through which consumers interact with the content and other consumers. Marketers need to have compelling content in order to participate in these channels without being viewed as intrusive or inauthentic. Two positive aspects of the changing landscape are that consumers are actively seeking to align with brands they view as reflecting their values and that these media platforms (including social and messaging platforms) offer more direct data on their users and their interaction with the content. Marketers now have an opportunity to make their best customers advocates of the brand. The content that these users create (broadly defined in the industry as user-generated content or “UGC”) allows consumers to provide an authentic voice for promoting brands, since the brand earns it through customer loyalty rather than paying for it. Similarly, marketers have the opportunity to provide branded content to these customers who want to show their support. With the right technology platforms, marketers can measure these interactions and refine their programs to optimize the return on their marketing expenses.
Consumer Device Manufacturers
Consumer devices are platforms for consuming content. These devices require robust multimedia functionality, as consumers create and share videos, animations and other rich-media and interactive content across various mobile devices. Consumer device manufacturers must display multimedia content, including text, from these different sources, while providing a consistent look-and-feel across devices, supporting worldwide languages and, in many cases, supporting enhanced personalization. As technologies enable media to move seamlessly from one device to another, scalable, multilingual type and related display solutions that are optimized for these devices are critical. For example:
| • | The automotive industry uses digital displays with complex, worldwide language requirements. In addition, the industry is becoming more aware of legibility as a factor in helping to reduce driver distraction. |
| • | Digital TVs incorporate scalable text for menu navigation, content delivery and connectivity. |
| • | Rich media functionality has moved to mobile platforms, driving the adoption of scalable text on phones, tablets and similar devices. |
| • | Over the past five to seven years, the commercialization of augmented reality and virtual reality (“AR/VR”) across consumer, enterprise and government applications has sparked a need for text stabilization and improved display. This better text display helps to reduce the physical discomfort some experience in these immersive experiences as well as enables improved brand personalization and fidelity – both of which ease technology adoption among new user groups. |
The market for laser printers and digital copiers is more mature than the rest of the consumer device market. As a result, the least expensive end of the market has become more commoditized. Laser printer manufacturers are responding by increasing the functionality of their products with advances such as a larger number of embedded fonts, enhanced control panel functionality, and creating new printing paradigms and services offerings, including mobile printing and managed print services. Comprehensive global text solutions and related technologies continue to be an important part of printing platforms.
4
Table of Contents
Independent Software Vendors and Developers
Similar to consumer devices, software solutions and cloud services are marketed globally. For example, ISVs require multilingual text solutions for product user interfaces as well as a range of type to add functionality to applications. Mobile device game developers want a distinctive and consistent typeface for their games, especially when the game is designed to run on multiple devices and consoles. In addition, developers want to customize their offerings with fonts specific to their vertical market or geographic regions.
ISVs and platform developers are increasingly distributing their solutions through software-as-a-service, cloud-based models and to multiple devices including PCs, mobile phones, game consoles, tablets and other devices. As a result, developers require font technologies that allow products to maintain a consistent, high-quality user experience regardless of the delivery model and device and its screen resolution.
Our Products
Monotype’s product offering, primarily delivered through a term-based license or a software-as-a-service (SaaS) subscription, allows content creators and marketers to produce beautiful, authentic and impactful brands on any screen, in print or across the web.
Design Assets and Related Technology Solutions
Type at the Forefront
| • | The core of our business, the Monotype® Libraries, comprises some of the largest and most trusted inventories of typefaces. The library is made up of more than 14,000 typefaces, including some of the world’s most well-known designs, such as the Times New Roman®, Helvetica®, Frutiger®, ITC Franklin Gothic™, FF® Meta® and Droid™ typefaces. |
| • | The Monotype Library Subscription is an easy-to-use font subscription service that provides individuals, designers and small teams with the ability to discover, access, install and use typefaces from the Monotype Library. This provides customers with access to more than 10,000 of the world’s most popular typefaces, from more than 2,500 typeface families. As part of the offering, our hinted web fonts are designed especially for the online environment, providing web designers and content developers with type that upholds a high display quality in any browser. |
| • | The Monotype Enterprise License offers typeface experimentation and a license model for enabling global brand fidelity in any environment. It is designed to give brands and agencies the flexibility and dependability they need to create beautiful, consistent brand expressions. For an annual fee, customers can install desktop fonts from a collection of fonts from the Monotype Library and utilize those in a variety of scenarios such as desktop, digital ads, mobile applications, including AR/VR, web fonts and even our embedded printer and screen imaging software for scaling fonts and overall type legibility on devices. This subscription model gives Monotype the flexibility to continue to innovate and bring additional value to our customers over time. It also offers access to underlying technologies previously only available through individual licenses, including our printer and screen imaging software. |
| • | FontExplorer® X Pro and FontExplorer X Server font management solutions provide powerful, flexible and easy-to-use capabilities for managing and accessing fonts. |
5
Table of Contents
Screen Imaging Technologies
| • | iType® font scaling engine renders high-quality display of text in every major language and in any size on memory-constrained devices, including, but not limited to, automotive displays, AR/VR, mobile phones, e-readers, tablets, set-top boxes and digital cameras, and is fully compatible with the industry-standard TrueType® and OpenType® font formats. |
| • | iType Connects streamlines the development process by providing a pre-integrated solution for common consumer device platforms, such as FreeTypeTM. |
| • | WorldType® Layout Engine enables consumer devices to accurately compose, position and render multilingual text, including text composed in complex writing systems such as Indic, Arabic and Hebrew scripts. |
| • | WorldType Shaper product provides customers with existing layout systems the ability to integrate intelligent shaping and bidirectional capabilities to support complex scripts. |
| • | Monotype® Spark™ software is a powerful type and technology solution for developing high-quality, scalable text interfaces in low-end platforms with limited run-time memory. Designers and engineers use the Monotype Spark software to create flexible, scalable text displays in low and mid-end devices like wearables, medical devices and low-to-mid-end automotive clusters, without investing a substantial amount of work or money in additional hardware or memory. Monotype Spark software makes the type on these devices more beautiful and enables product manufacturers to keep development costs low and create an easy path to scale devices to support new languages and character sets in the future. |
| • | Edge rendering technologies preserve the look of high-quality text on a wide range of displays, even at small text sizes. Resolution and display technologies such as LCD or e-paper can significantly affect the visual display of rendered text. Edge technology encompasses Edge Tuner, the ability to “tune” the rendered output, and Edge Hinting, a method for fine-tuning individual characters. Edge Tuning and Edge Hinting help customers achieve superior visual results using scalable fonts in a low memory footprint. |
| • | Edge360™ technology brings advanced textual effects to 2D and 3D user interfaces, applications and games. For example, text can be zoomed in and out very quickly without having to re-render the text at the end of the zoom process. Text can be rotated in three dimensions—all while retaining clarity throughout the process. |
| • | FlipFont™ mobile font download solution allows users to personalize and enhance the user interface and menus of their Android phones, making them more appealing and fun to use. Android handset manufacturers can enable FlipFont so users easily connect to an online selection of fonts, choose a new typeface, purchase the font, and safely download and install it. |
| • | Our e-commerce websites including myfonts.com, fonts.com, linotype.com and fontshop.com offer thousands of high-quality font products, including our own libraries as well as fonts from third parties. Our sites attracted more than 50 million visitors in 2017 from over 200 countries and territories. |
Printer Imaging Technologies
| • | Universal Font Scaling Technology, or UFST® font scaling engine, and our MicroType® font compression technology, are our primary solutions for laser printer |
6
Table of Contents
| manufacturers. Our font scaling engine and font compression technologies are compatible with virtually all font formats and industry standards, including the PostScript and PCL printing languages. Our font solutions for consumer device manufacturers, including our Edge™ and SmartHint™ technologies, enable precise pixel adjustments to enable fonts to display with optimal quality in suboptimal display environments. |
| • | Printer driver kits enable printer manufacturers to create customized laser printer drivers that allow applications to print as intended. |
| • | Our core sets of fonts for printer manufacturers consist of the PCL® (Printer Command Language) 6 and PostScript® 3 font collections. These fonts are designed for compatibility with HP and Adobe Systems Incorporated, or Adobe, font specifications. |
Design Assets for Brand and Self-Expression
| • | Our mobile engagement platform powered by Swyft Media helps brands and advertisers create and distribute branded content that consumers want and share with friends across a wide variety of mobile and social apps. |
Marketing Solutions for Brand Engagement
Global Brand Engagement and Social Endorsement through Mobile and Digital Channels
| • | Olapic’s earned content platform amplifies engagement and performance in every channel with curated, high-converting images and videos taken by a particular brand’s actual customers. Olapic helps solve the lack of high quality, high-performing content and the associated cost to create valuable content, commonly referred to as content crunch, for marketers by tapping into the brand loyalists to provide high performing visual assets. |
| • | Olapic’s Content in Motion platform turns existing images into short-form video content, increasing efficiency and extending the value of a brand’s visual asset library. With both custom motion graphic or branded on-demand templates available, Content in Motion provides a video solution that scales across teams and brand needs. |
| • | Olapic’s Creator Platform is an influencer and professionally generated content platform that manages a private network of influencers, ambassadors & creators who source visual assets for a brand. The Creator Platform helps remove the manual work from these processes using a CRM and logistics engine to centralize influencer relationships, contributed content, and performance reporting. |
| • | Swyft Media’s innovative Mobile Engagement Platform gives advertisers and brands an opportunity to use branded content like emojis, digital stickers, GIFs, photo frames, lenses, photo filters, chat and videos to reach and engage millennials and young consumers in the places they spend the most time—mobile and social apps. This content lets consumers act as brand advocates through their social endorsement while also helping brands identify their most supportive customers. |
Design and Technology Expertise to Support Global Brand Initiatives
| • | We provide expert consultation and custom type design services to help customers articulate their distinctive brand value through type. We have strong relationships |
7
Table of Contents
| with a broad network of highly talented font designers. Working directly with clients and through branding agencies, our type design experts have developed the branding fonts used by many Fortune 1000 companies. |
| • | Our engineers provide technology support and professional services to make the most of our display and printing technologies. We help a wide range of companies from start-ups to Fortune’s Global 2000 companies get their products to market quickly with less risk by using proven, high-quality, scalable solutions. |
Competitive Strengths
Design Assets. Our design assets serve varying needs within diverse organizations. Our rich, multi-language font IP and embedded font technology are crucial to our OEM customers who manufacture high-volume consumer devices that require superior multilingual legibility in support of multimedia functionality and multinational distribution. That same font IP is used to build a brand’s identity (at a corporate or product level). Our Monotype Libraries, comprised of the Monotype, Linotype, ITC, Ascender, FontFont and Bitstream type collections, are some of the world’s best known inventories of type. Our selection is continuously expanding, adding even more fonts from some of the world’s best type designers. Today, we offer more than 139,000 typeface designs, featuring a rich blend of timeless classics and cutting-edge designs, which support more than 250 Latin and non-Latin languages. Our UGC technology enables brands to extract highly authentic content in the form of photos and videos from users on social media platforms at scale. This content can be used in marketing programs to better connect with intended audiences and improve marketing outcomes. Our mobile messaging IP and technology is vital to those marketers looking to cultivate meaningful engagement with brand enthusiasts across the world’s leading messaging platforms.
Expertise, Experienced Leadership and Employee Base. Our expertise in software engineering and font design gives us a strong foundation to meet the challenges of today’s consumer environments. We are home to some of the world’s top type designers who provide expert consultation and custom design services to help customers articulate their distinctive brand values. We have deep domain expertise and engineering skills in mobile messaging and visual content marketing through our acquisitions of Swyft Media and Olapic. Our experts work closely with customers to achieve goals like developing successful, engaging brands. Our employee base includes some of the world’s most experienced professionals who intimately understand typefaces and software.
Established Relationships with Market Leaders. Several of our customer relationships date back 25 years or more. Our OEM customers are many of the largest and most successful companies in each of the markets they serve. In the consumer device space, we provide solutions to market leaders like Google, Apple and Microsoft. In the laser printer market, our customers include eight of the top ten laser printer manufacturers based on the volume of units shipped worldwide. Our Creative Professional customers include major international retail, consumer packaged goods, financial services, media, publishing and marketing solutions companies, such as Hearst Magazines and Pearson, as well as major design firms.
Global and Multi-Channel Presence. Our customers are located throughout the world. In 2017, 2016 and 2015, 56.9%, 58.3% and 45.5% of our revenue, respectively, was derived from sales by our customers located in the United Kingdom, Germany, China and Japan. With our enterprise sales associates covering North America, EMEA, and APAC coupled with our
8
Table of Contents
websites, including myfonts.com, fonts.com, fontshop.com and linotype.com, we provide a footprint and sales channel designed to fit any customer’s needs. We support all of the world’s major languages and have specifically designed our solutions for displaying rich content in Asian and other non-Latin languages. We enable OEM customers to engineer a common platform supporting multiple languages, reducing costs and time to market, and increasing product flexibility. China, Japan and Korea are increasingly becoming centers of design, manufacturing and consumers of consumer devices, and we have more than 25 years of experience partnering with leading Asian companies such as Ricoh, Toshiba and Kyocera Mita.
Attractive Business Model. We have a significant, predictable base of licensing revenue that is based, in part, on multi-year financial commitments by our customers, mainly due to our established relationships with OEMs, the high volume of web transactions and growing recurring direct business. Other revenue contracts have renewable term licenses, and in Creative Professional, our Olapic offering is a subscription-based model, providing a recurring stream of revenue. The high volume of low-dollar web transactions runs at a predictable rate, which together lends to an overall recurring and predictable revenue base of over approximately 85% of our total revenue.
Technological and Intellectual Property Leadership. Our technologies are key to providing unique, flexible and comprehensive solutions for content creation, distribution and consumption, and we continue to invest in extending our technology and market leadership positions. For example, the flexibility of our offerings enables us to provide tailored, comprehensive solutions for specific industries, such as the automotive industry. In addition, our Olapic technology platform for gathering, moderating, distributing and measuring user-generated content and other types of branded content, when combined with our traditional offerings, provides our customers a unique solution for designing content and using that content for marketing purposes.
Our Strategy
Monotype empowers expression and engagement for creatives, designers, marketers and engineers who have two primary intentions:
| • | Produce compelling brand experiences that will resonate with a targeted audience; and |
| • | Cultivate a relationship with that audience by engaging with brand enthusiasts. |
Our strategy is to make these design and marketing activities more effective and efficient for our customers. For those designing content or user experiences, our strategy begins with our rich heritage of the world’s most iconic typefaces, which form the foundation of the best designs. We also provide complimentary design elements and content, including user-generated content, as well as services for creating branded emojis, to major global brands and individual designers who seek innovative ways to express a brand message. In addition, we offer technology that allows efficient discovery, curation and publishing of this content.
For marketers who seek to use this content to communicate with their best customers, our strategy is to enable distribution of branded user experiences to attract, acquire and engage their customers. The goal is to provide earned content—content that is generated and shared by brand enthusiasts—that resonates with these customers through an authentic representation of the brand. The best of these customers become advocates and promoters for the brand with their own voice (and content). These interactions are intended to drive further customer action such as a revenue transaction or brand evangelism. Marketers cultivate a meaningful relationship with brand enthusiasts to generate earned, authentic
9
Table of Contents
content while the measurement of earned content helps marketers improve ecommerce merchandising, increase performance by optimizing creative decisions, and connect and reward their most valuable followers.
From creating compelling brand experiences to cultivating engaging relationships between brands and their best customers, we strive to be the first place to turn for the design assets, technology and expertise that empower brand engagement and the best user experiences. Following are the key components of our strategy:
Creative Professional
Empower the Creative Process. Our focus is to help designers and other creative professionals succeed as workflows and publishing environments become more complex. Our customers are creating content that is distributed through a broad range of publishing environments, including the web, mobile devices, applications, as well as print. We provide a comprehensive selection of typeface designs, custom typefaces, worldwide language support and fonts that are tuned to display in the highest quality, regardless of the output medium. Our licensing options provide flexible coverage to meet our customers’ evolving requirements. A key component of our strategy is offering simplified, flexible subscriptions to large portions of our font library with the goal of making it easier for creative professionals to access and use any font.
Our customers’ creative needs are not limited to fonts. Just as distribution environments have grown in complexity, so too have the forms of content to which consumers respond. Consumers find content that they view as authentic (as opposed to staged) as more attractive. To that end, our strategy includes offering design assets and other types of content that meet this requirement. User-generated photos and videos, which reflect consumers’ interpretation of the brand, and branded assets such as emoji, which allow consumers to express themselves using a brand’s imagery, are examples of how Monotype is expanding its offering to meet these broader creative requirements.
Cultivate Meaningful Digital Engagement. Our strategy now extends beyond the creation of content to marketers’ use of this content to communicate with their best customers. Monotype enables distribution of branded user experiences to attract, acquire and engage our customers’ consumers. The goal is to provide content that resonates with these consumers through an authentic representation of the brand. With the acquisition of Olapic, we offer a platform for gathering and moderating user-generated content. The platform allows brands to make user-generated content actionable and then to measure response rates to determine what designs are most effective, which contributors offer the best content and what programs are most successful.
In addition, mobile messaging apps, photo sharing apps and other social platforms have become the backbone for communicating in today’s world, especially among younger consumers. In these environments, consumers are eager to personalize their text messages and their posts with branded content such as digital stickers and emojis. Our Mobile Engagement Platform provides value to stakeholders across the mobile messaging ecosystem and provides access to many of the top messaging applications platforms through partnerships, including with Apple’s iMessage and Google. Brands and advertisers are able to reach consumers through branded, monetizable content that is integrated within the social experience. In addition, consumers are able to take advantage of shareable, branded content such as digital stickers and emojis to express themselves.
10
Table of Contents
OEM
Display Imaging
Increase Penetration of our Technologies and Fonts into a Wide Range of Device Categories. Our technologies and fonts play an important role in the mass-market success of device categories such as automotive displays, smart TVs, wearables, mobile devices and e-book readers and tablets. We have an established base of customers in these categories, and we will seek to expand within existing accounts as new models are added, or as new product lines are introduced. We intend to continue to pursue new design wins such as next-generation in-vehicle displays, helping customers to meet key requirements including brand integrity, high legibility and worldwide language support. We also seek to expand our value proposition to device manufacturers by providing a more holistic solution that serves both product experience and branding needs. Our offering is an important component of the user experience on consumer devices. Yet the user experience is only one manifestation of a manufacturer’s brand communication. As an example, a mobile smartphone manufacturer utilizes our font IP and embedded technology to optimize the user experience of the device. That same manufacturer uses our font IP, messaging IP, and UGC technology to develop a brand’s identity and influence purchase decisions of its target audience in leading channels. Our strategy includes introducing a licensing model that meets not only the device-side needs of device engineers but also the design and marketing needs of creative professionals within these large organizations.
Printer Imaging
Leverage Our Long-Term Relationships. We constantly strive to strengthen our long-term relationships by working closely with OEMs to fulfill evolving requirements, such as providing value-added solutions that differentiate offerings, reduce cost, or capitalize on new technology paradigms. For example, we offer printer manufacturers flexible, high-performance printer driver tool kits that support popular operating systems. OEMs are able to integrate and customize robust printing capabilities to gain a competitive edge. Our flexible architecture, support for multiple print languages and extensive use of common code enables printer manufacturers to speed products to market while reducing development time and costs. Using our solution to support multiple page description languages, in combination with our fonts and drivers, provides a more complete offering. In addition, we offer licensing models that make deploying our fonts and technologies broadly within a printer manufacturer’s offering easy for the long term.
Independent Software Vendors and Developers
Expand Support of ISVs to All Deployment Environments. Our core offering to ISVs and developers consists of providing fonts, custom typefaces and rendering technologies for language coverage, platform compatibility, user experience enhancement and creative expression. Options for accessing and deploying our software and applications have expanded from on-device to secure cloud-based services and combinations of the two. New environments such as AR/VR require our customers to display content in ways not envisioned previously. Our AR/VR solution enables ISVs to create a robust text experience within these applications. Our ISV strategy is to license our fonts and tools to provide the flexibility ISVs need to create compelling offerings for devices like tablets, smartphones and medical devices.
Overall, We Seek to:
Expand and Deepen our Global Presence. We intend to drive our revenue growth by leveraging our knowledge of global markets and through our global operations. Our strategy
11
Table of Contents
focuses on countries and regions where our target Creative Professional and OEM customers and prospects are concentrated. Our approach includes expanding our presence in key countries and developing a direct or indirect presence in countries that we evaluate as having strong potential for growth. Through this organic expansion and possible acquisitions, we intend to increase our ability to service consumer device manufacturers and creative professionals throughout the world.
Selectively Pursue Complementary Acquisitions, Strategic Partnerships and Third-Party Intellectual Property. We intend to continue to selectively pursue acquisitions, strategic partnerships and third-party intellectual property to accelerate our time to market with complementary solutions, penetrate new geographies and enhance our intellectual property portfolio. We believe that the market for our solutions is still fragmented. We have a demonstrated track record of identifying, acquiring and integrating companies that enhance our intellectual property portfolio. Our acquisition on August 9, 2016 of Olapic, Inc., a privately-held earned content platform company, has diversified and expanded our offering. In addition, in 2017 we created a strategic partnerships team to focus on integrating our design assets and technologies into larger platforms that our customers use for design and marketing tasks. This team also seeks to expand distribution of our offering through third-party marketplaces and ecommerce sites.
Our Customers
We are committed to serving the design and marketing needs of our customers. Our technologies and services are sold to customers in two principal markets: Creative Professional and OEM. In 2017, 2016 and 2015 our revenue in these two markets was as follows (in thousands):
| 2017 | 2016 | 2015 | ||||||||||||||||||||||
| Principal Markets |
Revenue | Percentage of Total Revenue |
Revenue | Percentage of Total Revenue |
Revenue | Percentage of Total Revenue |
||||||||||||||||||
| Creative Professional |
$ | 130,595 | 55 | % | $ | 102,381 | 50 | % | $ | 88,074 | 46 | % | ||||||||||||
| OEM |
105,194 | 45 | % | 101,060 | 50 | % | 104,345 | 54 | % | |||||||||||||||
|
|
|
|
|
|
|
|
|
|
|
|
|
|||||||||||||
| Total |
$ | 235,789 | 100 | % | $ | 203,441 | 100 | % | $ | 192,419 | 100 | % | ||||||||||||
|
|
|
|
|
|
|
|
|
|
|
|
|
|||||||||||||
Our solutions are embedded in a broad range of consumer devices and are compatible with most major operating environments. We partner with operating system and software application vendors such as Google, Apple, Microsoft, Oracle and Access. Additionally, we are an active participant in the development of industry standards which pave the way for support of advanced typographic capabilities across multiple devices. We are active in the development of various technology standards, including the ISO/IEC core font technology standardization work through our participation in the ISO MPEG Committee; various projects coordinated by W3C that include Web Fonts Working Group, CSS Working Group and Publishing Working Group; and Interactive Advertising Bureau as an active participant in multiple IAB Working Groups contributing to the development of various standards and industry guidelines. We serve as a chair of the W3C Web Fonts Working Group demonstrating our commitment to ensuring that web clients and applications effectively support fonts and font technologies, ultimately bringing to web developers and end users the highest level of text quality, performance and flexibility. In the past, we also contributed to a wide variety of standardization activities including the developments of hardware-accelerated vector graphics APIs (The Khronos Group), Java ME platforms for mobile devices (Java Community
12
Table of Contents
Project), DVB Multimedia Home Platform, and IDPF EPUB e-book standards and OMA Rich Media Environment.
Our customers are among the world’s leading consumer device manufacturers and most well-known brands, including:
| • | eight of the top ten laser printer manufacturers based on the volume of units shipped worldwide; |
| • | web fonts customers including The Economist, Hyundai, Hilton and Pepsi; |
| • | major software companies including Microsoft, Google and Apple; |
| • | e-book readers/tablets, including Amazon and Kobo; |
| • | other multinational corporations such as Condé Nast, Lloyds TSB, Panasonic, Pearson, Sony Computer Entertainment of America, Nintendo, Activision, TiVo, Ubisoft, Adidas and Nike; |
| • | major international media and marketing solutions companies such as Hearst Magazines; |
| • | many of the top automotive brands and manufacturers including Audi, Chrysler, Fiat, Ford, Honda, Hyundai and Great Wall Motors; |
| • | digital television and set-top box manufacturers including TTE Technology, Toshiba and Sharp; and |
| • | major consumer-packaged goods, apparel, travel and leisure, beauty, housewares and home furnishings, jewelry, and retail companies, such as Calvin Klein, eBay, Fitbit, Four Seasons Hotel, Garmin, Home Depot, H&M, Nu Skin Enterprises, REI, The Peninsula Hotels, Urban Outfitters and West Elm. |
In 2017, 2016 and 2015, our top ten licensees by revenue accounted for approximately 27.3%, 30.3% and 33.5% of our total revenue, respectively. For the years ended December 31, 2017, 2016 and 2015, no customer individually accounted for more than 10% of our total revenue. For the quarters ended December 31, 2017, 2016 and 2015, no customer individually accounted for more than 10% of our total revenue.
Marketing and Selling
Our sales representatives directly target prospective clients with design, marketing and engineering requirements, focusing primarily on establishing long-term relationships. In addition, our renewals team maintains on-going relationships with existing customers and focuses on renewing specific contracts and engagements with those customers. Our e-commerce websites, myfonts.com, fonts.com, fontshop.com and linotype.com drive sales from professional and casual users.
Our marketing organization works to deliver a consistent message detailing our capabilities and to develop new avenues for presenting our solutions. We promote our solutions through a combination of web content, social media outlets, public relations activities, opt-in e-mail newsletters, blogs, editorial articles, brochures, print advertising, case studies, collateral, speaking engagements, special events, exhibitions, educational programs, and attendance and participation at industry conferences and trade shows. We promote our e-commerce websites, myfonts.com, fonts.com, fontshop.com and linotype.com through a combination of affiliate programs, search engine optimization and e-mail marketing.
13
Table of Contents
Research and Development
We have a strong commitment to research and development for core technology programs directed at creating new products, product enhancements and new applications for existing products, as well as funding research into future market opportunities. Each of the markets we serve is generally characterized by rapid technological change and product innovation. We believe that continued timely development of new products and product enhancements to serve existing and new markets is necessary to remain competitive. Further, we continue to advance our machine learning capabilities across the business. At Olapic, we leverage machine learning to streamline moderation of user-generated content for our clients by processing over 180 million images in 2017, training the Olapic platform to sort through images that are unfit for use. In type, we use machine learning to improve search and discovery of font IP for our customers that access our libraries via our ecommerce sites and applications. This aids the users in finding the right IP for their specific needs quickly and more accurately. Our research and development operations are located in Woburn, Massachusetts; Los Altos, California; Boulder, Colorado; Elk Grove, Illinois; New York, New York; Cordoba, Argentina; Salfords, United Kingdom; Bad Homburg and Berlin, Germany; Noida, India; Hong Kong, China; and Tokyo, Japan.
In 2017, 2016 and 2015, we incurred research and development expenses of $37.7 million, or 16.1% of sales, $28.9 million, or 14.2% of sales and $21.5 million, or 11.2% of sales, respectively. Further information on research and development expenses may be found in Item 7, Management’s Discussion and Analysis of Financial Condition and Results of Operations.
Intellectual Property
We rely on a combination of copyright, patent and trademark laws and on contractual restrictions to establish and protect proprietary rights in our technologies and fonts. Whenever possible, we enter into non-disclosure agreements with our suppliers, partners and others to limit access to and disclosure of our proprietary information.
We apply for U.S. and international patents with respect to our technologies, and seek copyright registration of our software and U.S. and international trademark registration in those instances which we determine are competitively advantageous and cost effective to do so. We have been granted a total of 21 patents and have 24 patents pending with the U.S. Patent and Trademark Office with many also filed in foreign jurisdictions. Some of our most important patents are related to our dynamic subsetting, font compression and machine learning technologies. We have unregistered trademarks and, where appropriate, registered trademarks on the key fonts in our Monotype Libraries. We intend to continue our policy of taking all measures we deem necessary to protect our patent, copyright, trade secret and trademark rights.
Some of our fonts are owned by third parties that we license under exclusive or non-exclusive agreements. We have also collaborated with third parties in the production and development of fonts.
Competition
Our solutions compete with those offered by a variety of companies, including vendors of print and screen imaging technologies, printer drivers and design tools, as well as designers and distributors of fonts. We compete principally on the basis of our technical innovation,
14
Table of Contents
engineering and customer support expertise, the breadth of our font offerings and the overall performance of our solutions, including reliability and timely delivery. Competition with our solutions comes from a variety of sources, including companies that license technologies and fonts, such as Adobe, and local providers of solutions that are specific to a particular country’s language requirements, such as Morisawa in Japan. We also compete with open source fonts and technologies, including the FreeType text renderer, a product of an open source collaborative organization that provides its Linux font rendering code for free, and Google, which provides open source fonts. In addition, we compete with several small players in the emergent components of the content marketing space in which we participate, such as, but not limited to, Bazaarvoice, Curalate and Adobe Experience Manager Livefyre. The competition for our custom font design services generally comes from companies offering their own type libraries and custom type services, including boutique font foundries and independent professionals.
Employees and Consultants
At December 31, 2017, we employed 734 persons. The table below provides our employees by functional area.
| Number of Employees |
Percentage | |||||||
| Marketing and selling |
313 | 43 | % | |||||
| Research and development |
300 | 41 | % | |||||
| General and administration |
121 | 16 | % | |||||
|
|
|
|
|
|||||
| Total |
734 | 100 | % | |||||
|
|
|
|
|
|||||
None of our employees or consultants is represented by a union or covered by a collective bargaining agreement. Our German employees are represented by works councils in Berlin and Bad Homburg. These works councils have the right to participate in certain decisions by Monotype GmbH, including operational changes, such as relocation of the business or change of control transactions, and social matters such as wages and salaries and working hours. We believe that our relations with our employees and consultants are good.
Segment Information
Information concerning revenue from our two principal markets for the last three years may be found in Note 14 to our consolidated financial statements included in this Annual Report on Form 10-K. We do not allocate expenses and assets to our two principal markets, Creative Professional and OEM, and operating results are assessed on an aggregate basis to make decisions about the allocation of resources. Further information about our principal markets and segment information, including geographic revenue, may be found in Note 14 to our consolidated financial statements included in this Annual Report on Form 10-K.
Corporate and Investor Information
We maintain a website at monotype.com. We make available on our website documents describing our corporate governance and our Code of Business Conduct and Ethics. We are not including the information contained on our website as a part of, or incorporating it by reference into, this Annual Report on Form 10-K. We make available free of charge through our website our proxy statements, registration statements, annual reports on Form 10-K, quarterly reports on Form 10-Q and current reports on Form 8-K, and amendments to these
15
Table of Contents
reports, as soon as reasonably practicable after we electronically file such material with, or furnish such material to, the Securities and Exchange Commission, or the SEC. Our SEC filings are also available over the Internet at the SEC’s website at http://www.sec.gov. You may also read and copy any document we have filed by visiting the SEC’s public reference room at 100 F Street, NE., Washington, DC 20549. Please call the SEC at 1-800-SEC-0330 for further information about the public reference room. The SEC maintains an internet site that contains reports, proxy and information statements and other information regarding our filings at www.sec.gov. Our SEC reports and other information may also be inspected at the offices of the Financial Industry Regulatory Authority, 1735 K Street, N.W., Washington, D.C. 20006.
| Item 1A. | Risk Factors |
Set forth below are certain risk factors that could harm our business, results of operations and financial condition. You should carefully read the following risk factors, together with the financial statements, related notes and other information contained in this Annual Report on Form 10-K. This Annual Report on Form 10-K contains forward-looking statements that contain risks and uncertainties. Please refer to the discussion of “Forward-Looking Statements” on page two of this Annual Report on Form 10-K in connection with your consideration of the risk factors and other important factors that may affect future results described below.
Risks Related to Our Industries
Business and licensing models are evolving and if we are not able to successfully make our design and marketing solutions available under these models, our business prospects could suffer.
New licensing and business models are evolving in the industries that we serve. For example, as channels of distribution for content and the devices used to consume content increase and diversify, the need for flexible license models to address the needs of designers, marketers, and engineers across these platforms increases. As licensing models evolve, we may not be successful in adapting to or maintaining these new business models and our business prospects could suffer.
These new licensing and business models include subscription-based licensing and service agreements for specified time periods in addition to perpetual license fees. Although our subscription models are designed to increase the number of customers who purchase our products and services and create a recurring revenue stream that is more predictable, these models create certain risks related to the timing of revenue recognition and potential reductions in cash flows. This may give rise to a number of risks, including:
| • | Any increases in sales under a subscription sales model could result in decreased revenues over the short term if such sales are offset by a decline in sales from perpetual license customers; |
| • | If customers desire only perpetual licenses, our subscription sales may lag behind our expectations; |
| • | A subscription model could make it difficult for us to rapidly increase our revenues from subscription-based services through additional sales in any period, as revenue from new customers will be recognized over the applicable subscription term; |
| • | We may be unsuccessful in maintaining our target pricing, new seat adoption and projected renewal rates; we may select a target price that is not optimal and could |
16
Table of Contents
| negatively affect our sales or earnings; or we may have to rely heavily on promotional rates to achieve target seat adoption, which could reduce average revenue per user; and/or |
| • | A decline in new or renewed subscription in any period may not be immediately reflected in our reported financial results for that period, but may result in a decline in our revenue in future quarters. If we were to experience significant downturns in subscription sales and renewal rates, our reported financial results might not reflect such downturns until future periods. |
We face significant competition in various markets, and if we are unable to compete successfully, our ability to generate revenue from our business could suffer.
We face significant competition in the market for the design assets, including type, and technologies that we offer. We believe that our most significant competitive threat comes from companies that provide design assets and marketing technologies to large global organizations, including Adobe and Google. We also compete, with respect to specific offerings such as type, with the internal resources of our customers to whom we license our solutions. Similarly, we also face competition from providers of free technology, such as FreeType, and from font foundries (especially those whose products are specific to a particular country’s language), font-related websites, providers of branded digital content, and independent professionals.
Some of our current or future competitors may have significantly greater financial, technical, marketing and other resources than we do, may enjoy greater name recognition than we do or may have more experience or advantages than we have in the markets in which they compete. These advantages may include, among others:
| • | sales and marketing advantages; |
| • | the recruitment and retention of skilled personnel; |
| • | the establishment and negotiation of profitable strategic, distribution and customer relationships; |
| • | the development and acquisition of innovative software technology and the acquisition of software companies; |
| • | greater ability to experiment with and drive industry-wide adoption of new licensing models; |
| • | greater ability to pursue larger scale product development and distribution initiatives on a global basis; |
| • | greater financial resources; |
| • | substantially larger patent portfolios; and |
| • | operational advantages. |
Many of our Creative Professional and OEM customers also rely on design and marketing solutions, including fonts and technologies, provided by our competitors. As a result, we must continue to invest significant resources in product development in order to enhance our solutions and introduce new high-quality solutions to meet the wide variety of competitive pressures. Our ability to generate revenue from our business could suffer if we fail to do so successfully.
17
Table of Contents
Current and future industry standards may limit our business opportunities.
Various industry leaders have adopted or are in the process of adopting standards for consumer devices that incorporate, or have the potential to incorporate, our technologies. In addition, standards applicable to web-based development and distribution, such as web publishing platforms, are evolving. Although we have made some efforts, where applicable, to have our solutions adopted as industry standards, these efforts have been limited, and we do not control the ultimate decision with respect to whether our solutions will be adopted as industry standards in the future or, to the extent they are adopted, whether and for how long they will continue as such. If industry standards adopted exclude our solutions or we are unable to be compatible with such adopted solutions, we will lose market share and our ability to secure the business of customers subject to those standards will be adversely affected. Costs or potential delays in the development of our solutions to comply with such standards could significantly increase our expenses and place us at a competitive disadvantage compared to others who comply faster or in a more cost efficient way or those whose solutions are adopted as the industry standard. We may also need to acquire or license additional intellectual property rights from third parties for standards compliance, which may not be available on commercially reasonable terms. We may be required to license our intellectual property to third parties for purposes of standards compliance.
Certain product solutions in our business are dependent on the ways that industry leaders conduct business, and these industry leaders may change the way that they interact with brands or with consumers in a manner that restricts us from providing products or services that reach these consumers.
Certain product solutions in our business are reliant on access to large industry leading social media and messaging platforms in order to provide value to our customers. If these platforms change the way they conduct business with their customers, limit functionality or discontinue third-party access to their networks, this could limit our ability to adequately perform our obligations. For example, Olapic relies on user generated content platforms like Instagram to source imagery for curation. Should access to those pictures be restricted for any reason, we might not be able to fulfill our commitment to deliver the curated content.
Open source or no-cost products and services may make us more vulnerable to competition because new market entrants and existing competitors could introduce similar products quickly and cheaply.
Open source refers to the free sharing of software code used to build applications in the software development community. Individual programmers may modify and create derivative works and distribute them at no cost to the end-user. To the extent that open source software that has the same or similar functionality as our technologies, or supports the offering of products or services that are competitive with ours, is developed or gains market share, demand for our technologies may decline; we may have to reduce the prices we charge for our technologies; and our results of operations may be negatively affected. For example, as the Android operating system became more prevalent in smart phones and tablets, the opportunity to embed our technology directly into these devices declined.
In addition, open source type software has become more widely available, including from competitors such as Google, and to the extent such type is widely adopted, the demand for our type offerings may decrease and our revenue could be adversely affected. Finally, our brand engagement product offerings compete with free products, some of which allow consumers to create their own content that may incorporate branded images. To the extent
18
Table of Contents
that such free products are widely adopted, the demand for our brand engagement product offerings may decrease and our revenue could be adversely affected.
As we license our design assets and technologies into new markets, some of which are just developing, we could be subject to an increased number of legal claims.
As we market and supply our products and services to new industries, such as the automotive or medical device industries, we could be subject to product liability claims by such customers or users of our customers’ products. In addition, we may become involved in the recall of a product that is alleged or deemed to be defective due to or in connection with our fonts or font technologies. The successful assertion of a product liability claim or the expenses of a recall and the damage to our reputation could have an adverse effect on our business, results of operations or financial condition. In addition, our Swyft business relies on emojis and other digital assets that may sometimes resemble a specific person and our Olapic business relies on technology and services to help our customers source user generated content that reflects their brands. While we provide our customers with the tools to seek the rights to use the user generated content, in the event those rights are not obtained, we could be involved in claims relating to the misappropriation of a third party’s intellectual property or a violation of a person’s right of privacy. Such claims may subject us to public criticism, lawsuits, and/or reputational harm, all of which could disrupt our business and expose us to increased liability and adversely affect the demand for our products and services.
Risks Related to Our Design Assets, Technology and Expertise
If we fail to develop and deliver innovative products and services in response to changes in our industry, including changes in consumer tastes or trends, our revenue could decline.
The markets for our design assets, technology and expertise are characterized by rapid change and technological evolution and are intensely competitive and price sensitive. Our future success depends, to a great extent, on our ability to develop and deliver innovative products and services that are widely adopted in response to changes in our industry, that are compatible with the solutions introduced by other participants in our industry and for which our customers are willing to pay competitive prices. For example, as screen resolution technology improves, our offering must evolve to reflect the fact that text legibility is, in part, being addressed by these technical solutions. We rely on the introduction of new or expanded solutions with additional or enhanced features and functionality that reach across our customers’ brand engagement efforts to allow us to maintain our value in the face of downward pressure on our pricing resulting from efforts by our Creative Professional and OEM customers to reduce costs. We may not correctly identify new or changing market trends at an early enough stage to capitalize on market opportunities. For example, our customers are participating in an increasingly global marketplace, and we need to ensure our global product and services offerings meet these needs. Our failure to deliver such innovative solutions that allow us to stay competitive and for which we can maintain our pricing would adversely affect our revenue.
The success of our business is influenced by the ability of our products and services to allow our customers to express their brand across a variety of consumer devices, software applications and operating systems and content creation and distribution platforms.
To be successful we must design our products and services to allow our customers to engage with consumers across a variety of consumer devices, software applications,
19
Table of Contents
operating systems and content creation and distribution platforms. We depend on the cooperation of consumer device manufacturers with respect to the components integrated into their devices, such as PDLs, as well as software developers that create the operating systems and applications, to incorporate our solutions into their product offerings. Content creation platforms are evolving rapidly and our solutions must meet the needs of both authors and device manufacturers who seek to have targeted customers consume information on multiple devices and across multiple channels. To the extent our products and services are less relevant, are incompatible, or contain errors or defects, our business would be adversely affected.
Our products and services compete with solutions offered by some of our customers, which have significant competitive advantages.
We face competitive risks in situations where our customers are also current or potential competitors. For example, Adobe is a significant licensee of our fonts, but Adobe is also a competitor with respect to enabling its customers to create consistent and accessible content. To the extent that Adobe or our other customers choose to utilize competing solutions they have developed or in which they have an interest, rather than utilizing our solutions, our business and operating results could be adversely affected. Adobe also offers broader product lines than we do, including software products that provide Adobe with greater opportunities to bundle and cross-sell products to its large user base. To the extent our customers were to offer products or services comparable to ours at a similar or lower price, our revenue could decline and our business would be harmed.
Our business is dependent in part on assets and rights that we license from third parties and these license rights may be inadequate for our business.
Certain of our solutions are dependent in part on the licensing and incorporation of technologies from third parties. We also license a substantial number of fonts from third-party designers and most of our sticker and emoji content from third party branded IP holders. For example, we have license agreements with Microsoft, Adobe and others under which we license certain fonts, and our e-commerce sites, including myfonts.com, rely upon the license of type from third parties. Our license agreements with these parties are limited by the ownership or licensing rights of our licensors. Our Olapic business also relies on user generated content owned by third parties for which our brand customers can seek usage rights.
If any of the technologies we source from third parties fail to perform as expected, if our licensors do not continue to support any of their technology or intellectual property, including fonts, because they go out of business or otherwise, or if the content is subject to infringement claims, then we may incur substantial costs in replacing the content or fall behind in our development schedule and our business plan while we search for a replacement. In addition, replacement content may not be available for license on commercially reasonable terms, or at all, which could subject us to claims by our customers for breach of the terms of our agreements with them.
Our business and prospects depend on the strength of our brands, and if we do not maintain and strengthen our brands, we may be unable to maintain or expand our business.
Maintaining and strengthening the brand of the Monotype Libraries and our other brands is critical to maintaining and expanding our business, as well as to our ability to enter into new markets for our products and services. If we fail to promote and maintain these brands
20
Table of Contents
successfully, our ability to sustain and expand our business and enter into new markets will suffer. Maintaining and strengthening our brands will depend heavily on our ability to continue to develop and provide innovative and high-quality solutions for our customers, as well as to continue to maintain our strong online presence and relationships with third-party type and technology providers. For example, we will need to ensure our brand asset services are relevant for the evolving digital publishing needs of our Creative Professional customers. If we fail to adapt to changing consumer preferences or if we introduce solutions that our customers or potential customers reject, the strength of our brands could be adversely affected. Further, unauthorized third parties may use our brands in ways that may dilute or undermine their strength.
If we fail to adequately protect our intellectual property, we could lose our intellectual property rights, which could negatively affect our revenue or dilute or undermine the strength of our brands.
Our success is heavily dependent upon our ability to protect our intellectual property which includes our type and technologies. To protect our intellectual property, we rely on a combination of U.S. and international patents, design registrations, copyrights, trademarks, trade secret restrictions, end user license agreements, or EULAs, and the implementation and enforcement of nondisclosure and other contractual restrictions. Despite these efforts, we may be unable to effectively protect our proprietary rights and the enforcement of our proprietary rights may be extremely costly. For example, our ability to enforce intellectual property rights in the actual design of our fonts is limited.
We hold patents related to certain of our rasterizer and compression technologies and registered trademarks on many of our fonts. Our patents may be challenged or invalidated, patents may not issue from any of our pending applications or claims allowed from existing or pending patents may not be of sufficient scope or strength (or may not issue in the countries where products incorporating our technology may be sold) to provide meaningful protection or be of any commercial advantage to us. Some of our patents have been and/or may be licensed or cross-licensed to our competitors. We rely on trademark protection for the names of our fonts. Unauthorized parties may attempt to copy or otherwise obtain and distribute our proprietary technologies and fonts. Also, many applications do not need to identify our fonts by name, such as those designs embedded in mobile telephones and set-top boxes, and therefore may not need to license trademarked fonts. We sometimes protect fonts by copyright registration but we do not always own the copyrights in fonts licensed from third parties. In addition, we cannot be certain that we will be able to enforce our copyrights against a third party who independently develops fonts even if it generates font designs substantially similar or identical to ours.
For example, if we enter into a license agreement with a customer that permits the embedding of our fonts into an electronic document only for the purpose of viewing and printing the document, technologies, including those related to web-based fonts, may exist or may develop which allow unauthorized persons who receive such an embedded document to use the embedded font for editing the document or even to install the font into an operating system, the same as if the font had been properly licensed. Unauthorized use of our intellectual property or copying of our fonts may dilute or undermine the strength of our brands. Also, we may be unable to generate revenue from products that incorporate our type or technologies without our authorization. Monitoring unauthorized use of our solutions is difficult and expensive. A substantial portion of the consumer devices that require type or related technologies are manufactured in China. We cannot be certain that the steps we take to prevent unauthorized use of our intellectual property will be effective, particularly in
21
Table of Contents
countries like China where the laws may not protect proprietary rights as fully as in the United States.
We may be forced to litigate to defend our intellectual property rights or to defend against claims by third parties against us relating to intellectual property rights.
Disputes and litigation regarding the ownership of technologies and fonts and rights associated with solutions such as ours are common, and sometimes involve patent holding companies or other adverse patent owners who have no relevant product revenue and against whom our own patents may therefore provide little or no deterrence. Third parties have from time to time claimed, and in the future may claim, that our products and services infringe or violate their intellectual property rights. Any such claims could cause us to incur significant expenses and, if successfully asserted against us, could require that we pay substantial damages and prevent us from selling our products. We may be forced to litigate to enforce or defend our intellectual property rights, to protect our trade secrets or to determine the validity and scope of other parties’ proprietary rights. Even if we were to prevail, any litigation regarding intellectual property could be costly and time-consuming and divert the attention of our management and key personnel from our business operations. We may also be obligated to indemnify our customers or business partners, including brand owners, pursuant to any such litigation, which could further exhaust our resources. Furthermore, as a result of an intellectual property challenge, we may be required to enter into royalty, license or other agreements, and we may not be able to obtain such agreements at all or on terms acceptable to us. We have been in the past involved in litigation with third parties, including Adobe, to defend our intellectual property rights and have not always prevailed. Finally, any such claims may subject us to public criticism, lawsuits, and/or reputational harm, all of which could disrupt our business and expose us to increased liability and adversely affect the demand for our products and services.
Certain component technologies in our solutions may be subject to open source licenses, which may restrict how we use or distribute our technologies or require that we release the source code of certain technologies subject to those licenses.
Certain open source licenses, such as the GNU Lesser General Public License, require that source code subject to the license be released or made available to the public. Such open source licenses typically mandate that proprietary technologies, when combined in specific ways with open source software, become subject to the open source license. We take steps to ensure that our proprietary technologies are not combined with, or do not incorporate, open source software in ways that would require our proprietary technologies to be subject to an open source license. However, few courts have interpreted the open source licenses, and the manner in which these licenses may be interpreted and enforced is therefore subject to uncertainty. While our EULAs prohibit the use of our technologies in any way that would cause them to become subject to an open source license, our customers could, in violation of our EULA, combine our technologies with technologies covered by an open source license.
In addition, we rely on multiple software engineers to design our proprietary technologies. Although we take steps to ensure that our engineers do not include open source software in the technologies they design, we may not exercise complete control over the product development efforts of our engineers and we cannot be certain that they have not incorporated open source software into our proprietary technologies. In the event that portions of our proprietary technologies are determined to be subject to an open source license, we might be required to publicly release the affected portions of our source code, which could reduce or eliminate our ability to commercialize our solutions. Also, our ability
22
Table of Contents
to market our type and technologies depends in part on the existence of proprietary operating systems. If freely distributed operating systems like Linux or Android become more prevalent, the need for our solutions may diminish and our revenue could be adversely affected. Finally, in the event we develop technologies that operate under or are delivered under an open source license, such technologies may have little or no direct financial benefit to us.
Risks Related to Our Customers and our Customer Relationships
We face pressure from our customers to lower our license fees and, to the extent we lower them in the future, our revenue may be adversely affected.
The consumer device markets are highly competitive and consumer device manufacturers are continually looking for ways to reduce the costs of components included in their products in order to maintain or broaden consumer acceptance of those products. Because our type and technologies are a component incorporated into consumer devices, when negotiating renewals of customer contracts, we face pressure from our customers to lower our license fees. In addition, our Creative Professional business is increasingly comprised of recurring revenue, including subscription-based licensing models. We have in the past, and may in the future, need to lower our recurring license fees, either immediately or over time, to preserve customer relationships or extend use of our type or technologies. To the extent contractual license fees for any particular customer are lower in the future, we cannot be certain that we will be able to achieve related increases in the use of our type or technologies or other benefits to fully offset the effects of these reduced revenues.
If we are unable to further penetrate our existing markets, expand into new markets or adapt or develop our products and services, our business prospects could be limited.
In our Creative Professional business, we expect that our future success will depend, in part, upon our ability to successfully license our existing design assets into additional large enterprises, especially in new geographic regions where we have not historically had a direct presence. In addition, as business and consumer communication trends evolve, our success will also depend on our ability to pursue new design asset classes. Finally, to date, we have primarily engaged with the designers and creative teams within a brand’s marketing group. However, our success will depend on our ability to connect with the broader concerns facing a brand’s chief marketing officer.
In our OEM business, we expect that our future success will depend, in part, upon our ability to successfully transition from offering a primarily embedded software solution to a holistic offering that includes design and marketing, as well as continuing to penetrate existing markets for devices with displays including mobile devices, e-book readers, automotive displays, digital televisions, set-top boxes and consumer appliances. Our ability to grow our revenue depends upon our ability to further penetrate these markets and to successfully penetrate those markets in which we currently have no presence.
Demand for our solutions in any of these developing markets may not develop or grow, and a sufficiently broad base of Creative Professional and OEM customers may not adopt or continue to use products that employ our solutions. Because of our limited experience in some of these markets, we may not be able to adequately adapt our business and our solutions to the needs of these customers.
23
Table of Contents
Our success depends on the existence of a market for consumer devices that incorporate our type and technologies.
| • | Our revenue depends in large part on market demand for solutions that enable consumer devices to render high-quality text. |
The consumer device market is characterized by rapidly changing technology, evolving industry standards and needs, and frequent new platform and product introductions. If the need for laser printers and other consumer devices utilizing our technology were to decrease or if current models of these products were replaced by new or existing products for which we do not have a competitive solution or if our solutions are replaced by others that become the industry standard and we are not able to develop technologies to build on such industry standards, our customers may not purchase our solutions and our revenue would be adversely affected. For example, if consumer devices evolve from text-based screens to voice controlled or gesture activated interactions, our solutions may be less relevant to the device manufacturers.
| • | The market for laser printers is a mature market growing at a slower rate than other markets in which we operate. To the extent that sales of laser printers level off or decline, our licensing revenue may be adversely affected. |
A significant portion of our revenue in 2017, 2016 and 2015 was derived from laser printer manufacturers. The laser printer market is a mature market and as a result, it has grown at a slower rate than other markets in which we operate. Although we have taken some steps to become less dependent on the volume of printer unit sales, our licensing revenue from OEMs is still dependent on the overall demand for printers. If sales of printers incorporating our solutions level off or decline over time, then our licensing revenue may be adversely affected.
| • | Our licensing revenue depends in large part upon device manufacturers incorporating our type and technologies into their products, and if our solutions are not incorporated in these products or fewer products are sold that incorporate our solutions, our revenue will be adversely affected. |
Our licensing revenue from OEMs depends upon the extent to which these device manufacturers embed our type and technologies in their products. We do not control their decision whether or not to embed our solutions into their products, and we do not control their product development or commercialization efforts. If we fail to develop and offer solutions that adequately or competitively address the needs of the changing marketplace, OEMs may not be willing to embed our solutions into their products. The process utilized by OEMs to design, develop, produce and sell their products is generally 12 to 24 months in duration. As a result, if an OEM is unwilling or unable to embed our solutions into a product that it is manufacturing or developing, we may experience significant delays in generating revenue while we wait for that OEM to begin development of a new product that may embed our solutions. In addition, if OEMs sell fewer products incorporating our solutions, our revenue will be adversely affected.
We derive a substantial majority of our revenue from a limited number of licensees, and if we are unable to maintain these customer relationships or attract additional customers, our revenue will be adversely affected.
We derive a large percentage of our revenue and profitability from the licensing of our type and technologies to Creative Professionals who use our fonts in the content that they
24
Table of Contents
create and OEMs, including ISVs. Some of our license agreements are for a limited period of time and, upon expiration of their license agreements, these customers may not renew their agreements or may elect not to enter into new agreements with us on terms as favorable as our current agreements. Moreover, the terms of some of these agreements may be more favorable to us than others. If there is consolidation, for example, through acquisition, within any of the markets that we serve, our financial results may be adversely impacted. In addition, for the years ended December 31, 2017, 2016 and 2015, our top ten licensees by revenue accounted for approximately 27.3%, 30.3% and 33.5% of our total revenue, respectively. Accordingly, if we are unable to maintain these relationships or establish relationships with new customers, our licensing revenue will be adversely affected.
If standard setting industry leaders were to fail to incorporate, or discontinue their use of, our solutions in their products, our business could be materially and adversely affected.
Major players in our industry have the capacity to dictate business models, technology standards and access to customers. To the extent these industry leaders do not incorporate our solutions into their offerings, we may not be successful in penetrating the markets we target. For example, because of their market position as industry leaders, the incorporation by Hewlett Packard, or HP, of our solutions in its laser printers and the incorporation of our solutions by Adobe in its PostScript product promote widespread adoption of our technologies by manufacturers seeking to maintain compatibility with HP and Adobe. If HP or Adobe were to stop using our solutions in their products, the market acceptance of our technologies by other consumer device manufacturers would be materially and adversely affected, and this would in turn adversely affect our revenue.
Our operating results may fluctuate based upon an increase or decrease of market share by consumer device manufacturers to whom we license our type or technologies.
The terms of our license agreements with our consumer device manufacturers vary. For example, we have fixed fee licensing agreements with certain customers, some of which may decline over time or which may not be renewed at the end of the current term. If these customers, some of whom are instrumental in setting industry standards and influencing early adoption of platforms or technology incorporating our solutions, were to increase their share of the consumer device market, under the terms of these agreements there would not be a corresponding increase in our revenue. Any change in the market share of consumer device manufacturers to whom we license our type or technologies is entirely outside of our control.
Risks Related to Our Business Operations
We conduct a substantial portion of our business outside North America and, as a result, we face diverse risks related to engaging in international business.
We have offices in seven foreign countries and we are dedicating a significant portion of our sales efforts in countries outside North America. We are dependent on international sales for a substantial amount of our total revenue. In 2017, 2016 and 2015, approximately 56.9%, 58.3% and 45.5%, respectively, of our total revenue was derived from operations outside the U.S. and we expect that international sales will continue to represent a substantial portion of our revenue for the foreseeable future. This future international revenue will depend on the continued use and expansion of our type and technologies, including the licensing of our solutions worldwide.
25
Table of Contents
We are subject to the risks of conducting business internationally, including:
| • | our ability to enforce our contractual and intellectual property rights, especially in those foreign countries that do not respect and protect intellectual property rights to the same extent that the United States does, which increases the risk of unauthorized and uncompensated use of our type or technologies; |
| • | United States and foreign government trade restrictions, including those that may impose restrictions on importation of programming, technology or components to or from the United States; |
| • | foreign government taxes, regulations and permit requirements, including foreign taxes that we may not be able to offset against taxes imposed upon us in the United States, and foreign tax and other laws limiting our ability to repatriate funds to the United States; |
| • | risks related to fluctuations in foreign currency exchange rates, in particular fluctuations in the exchange rate of the Japanese yen, the European Union’s euro, and the United Kingdom’s pound sterling, including risks related to hedging activities we may undertake; |
| • | foreign labor laws, regulations and restrictions; |
| • | changes in diplomatic and trade relationships, including the United Kingdom’s decision to leave the European Union, as well as related events; |
| • | difficulty in staffing and managing foreign operations; |
| • | political instability, natural disasters, war and/or events of terrorism; and |
| • | the strength of international economies. |
If we have difficulty finding appropriate partnership and/or acquisition candidates, our ability to execute aspects of our strategic plan may be hindered and, if we do find appropriate acquisition candidates, we may fail to realize the anticipated value of the acquisition.
We intend to pursue selectively complementary acquisitions, strategic partnerships, and third party intellectual property licenses to accelerate our time to market, penetrate new geographies and expand our offering. Execution of our strategy relies on finding and closing partnerships and/or acquisitions that fit with our business and that meet our financial expectations. To the extent that we are unable to identify appropriate opportunities and close deals on acceptable financial terms, we may face hurdles in executing portions of our strategy. In addition, the pursuit of potential acquisitions may divert the attention of management and cause us to incur various expenses in identifying, investigating and pursuing suitable acquisitions, whether or not they are consummated.
Completed acquisitions could create risks for us, including:
| • | entry into markets that are emerging or in which we have minimal prior experience and where competitors in such markets have stronger market positions; |
| • | difficulties in assimilating acquired personnel, operations and technologies; |
| • | inability to retain key customers, distributors, vendors and other business partners of the acquired business; |
| • | unanticipated costs or liabilities associated with such acquisitions, including the need to bring an acquired company into compliance with laws and regulations applicable to our international operations; |
26
Table of Contents
| • | difficulty in maintaining controls, procedures and policies during the transition and integration; |
| • | potential failure of the due diligence processes to identify significant problems, liabilities or other challenges of an acquired company or technology, including but not limited to, issues with the acquired company’s intellectual property, product quality or product architecture, data back-up and security (including security from cyber-attacks), privacy practices, revenue recognition or other accounting practices, employee, customer or partner issues or legal and financial contingencies; |
| • | exposure to litigation or other claims in connection with, or inheritance of claims or litigation risk as a result of, an acquisition, including but not limited to claims from terminated employees, customers, former stockholders or other third parties; |
| • | diversion of management’s attention from other business concerns; |
| • | use of resources that are needed in other parts of our business; |
| • | potential incompatibility of business cultures; |
| • | use of substantial portions of our available cash to consummate such acquisitions; and |
| • | dilution to current stockholders to the extent we issue equity to consummate such acquisitions. |
We rely on certain customers to whom we license our design assets and technologies to prepare accurate reports for our determination of licensing revenue, including any revenue sharing obligations, and if these reports are inaccurate, our revenue may be under-, or over-stated and our forecasts and budgets may be incorrect.
Our revenue is generated primarily from royalties and recurring revenues paid by customers who license our design assets and technologies. Under certain of these arrangements, our customers pay us a fee based on usage of our solutions and we rely on our licensees to accurately report their usage. We calculate our license fees, prepare our financial reports, projections and budgets and direct our licensing and technology development efforts based in part on these reports. However, it is often difficult for us to independently determine whether or not our customers are reporting accurately. We have implemented an audit program of our licensees’ records, but the effects of this program may be limited as audits are generally expensive and time consuming, and initiating audits could harm our relationships with our customers. In addition, our audit rights are contractually limited. To the extent that these customers understate or fail to report their usage of their solutions, we will not collect and recognize revenue to which we are entitled. Alternatively, we may encounter circumstances in which a customer may notify us that it previously reported inaccurate usage. In such cases, we may be required to give our customer a credit which would result in a reduction in revenue in the period in which a credit is granted, and such a reduction could be material.
Parties from whom we license fonts or components of our technologies may challenge the basis for our calculations of the royalties due to them.
Some of our agreements with licensors require us to give them the right to audit our calculations of royalties payable to them. In addition, licensors may at any time challenge the basis of our calculations and we cannot be sure that we will be successful in our defense. Any royalties paid as a result of any successful challenge would increase our expenses and could negatively impact our relationship with such licensor, including by impairing our ability to continue to use and re-license technologies or fonts from that licensor.
27
Table of Contents
Changing laws and regulations could affect our operating results.
| • | New accounting rules could impact our ability to report financial results of our business. |
Our adoption of the new U.S. revenue recognition accounting rules on January 1, 2018 may impact our ability to correctly and timely report our financial results. While we do not expect to encounter any issues, the quarter ending March 31, 2018 will be our first time using the system for both accounting and reporting purposes.
| • | Increasing regulatory focus on privacy issues and expanding laws and regulations could impact our business models and expose us to increased liability. |
In connection with our products and services and sometimes on behalf of our customers, we and certain third party service providers with which we have business relationships may collect, use, process, store, share, retain and transfer personally identifiable information (“PII”) that is derived from the activities of our end users in various channels, including traditional, mobile and e-commerce websites, mobile and desktop applications, social media, software products, email interactions and text messaging, as well as other users of social media platforms. Transferring PII across borders is complex and in certain jurisdictions, is highly regulated. Worldwide, new laws (such as the EU General Data Protection Regulation), regulations, policies, official guidance, standards and industry self-regulatory codes governing how companies handle PII have been enacted and more are being considered that may affect or limit our ability to reach current or prospective customers, respond to requests for access to PII, or to fully implement our business models. Governments, privacy advocates, class action attorneys and the media are increasingly scrutinizing how companies collect, use, process, store, share, retain and transfer PII. Agency enforcement actions and court decisions may be binding on companies that collect, use, process, store, retain and transfer PII. As these laws, regulations, policies, guidance, standards and self-regulatory codes, evolve, along with societal norms around data privacy and information governance, they may be inconsistent from jurisdiction to jurisdiction, and complying with these emerging and changing international requirements may cause us to incur substantial costs. Further, noncompliance could result in significant penalties or legal liability, including significant financial penalties and reputational harm, and could cause us to have to change our business models or inhibit us from implementing our business models effectively.
Our compliance with privacy laws, regulations, policies, guidance, standards and self-regulatory codes, and our reputation among our end users and the public, also depend in part on our customers’ and service providers’ adherence to privacy laws and regulations and their use of the PII collected on our behalf or via our products and services in ways consistent with applicable privacy laws and consumers’ expectations. We rely on contractual representations made to us by these customers and service providers that their use of the PII collected via our products or services or on our behalf do not violate any applicable privacy laws, rules and regulations or their own privacy policies. We do not formally audit such customers to confirm compliance with these representations. If these representations are false or if these parties do not otherwise comply with applicable privacy laws, we could face adverse publicity and possible legal or other regulatory action, including significant fines.
28
Table of Contents
Any perception of our practices, products or services as an invasion of privacy, whether or not consistent with current laws, regulations and industry practices, may subject us to public criticism, class action lawsuits, reputational harm and/or claims by regulators, industry groups or other third parties, all of which could disrupt our business, expose us to increased liability and affect the demand for our products and services.
| • | We incur significant costs and demands upon management as a result of complying with changing laws and regulations, including those affecting public companies, which could affect our operating results. |
We have incurred and will incur significant costs, and have and could experience internal resources constraints, associated with the evaluation of and compliance with evolving corporate governance, reporting and other requirements, including requirements under the Sarbanes-Oxley Act and the Massachusetts data protection laws, as well as rules implemented by the SEC and the NASDAQ Global Select Market. In addition, we may incur costs associated with complying with changing laws and regulations governing the operation of a business and the use of customer data in the regions in which we operate. The expenses incurred by public companies for reporting and corporate governance purposes have been increasing. We expect that the rules and regulations applicable to us could cause our legal and financial compliance costs to increase and could make some activities more time-consuming and costly. In addition, in the current public company environment, officers and directors are subject to increased scrutiny and may be subject to increased potential liability. As a result, it may be more difficult for us to attract and retain qualified individuals to serve on our board of directors or as our executive officers. This could negatively impact our future success.
A prolonged economic downturn could materially harm our business.
Our ability to generate revenue is affected by the level of business activity of our Creative Professional and OEM customers, which, in most cases, is affected by the level of economic activity occurring in the industries and markets that our customers serve. Negative trends in the general economy, including trends resulting from a recession, the availability of credit, actual or threatened military action by the United States, terrorist attacks on the United States or abroad, could cause a decrease in consumer and/or business spending and could negatively affect the rate of growth of consumer device markets or of adoption of consumer devices. Any economic downturn, including a reduction in consumer confidence or disposable income in general, could also adversely affect the demand for, or impair the ability of our customers to pay for, the products and services that they have purchased from us. We cannot predict the timing, strength or duration of any economic slowdown or subsequent economic recovery and this uncertainty makes it difficult to determine if past experience is a good guide to the future. If the general economy or markets in which we operate worsen from present levels, the demand for our products and services could decline, and our revenue and profitability could be materially and adversely impacted.
Security vulnerabilities in our products or systems could lead to reduced revenues or to liability claims.
Maintaining the security of our products, computers and networks, including data centers that house our equipment and deliver our services, is an important issue for us and our customers. Unauthorized parties may be able to develop and deploy viruses, worms, malware and other malicious software programs that attack our products and services, our networks, or otherwise exploit any security vulnerabilities of our products, services and
29
Table of Contents
networks. Hardware, software and applications including cloud-based solutions that we procure from third parties may contain defects in design or manufacture, including bugs and other problems that could unexpectedly compromise the security of the system. Because techniques used by unauthorized parties to obtain unauthorized access to or sabotage systems change frequently and generally are not recognized until long after being launched against a target, we may be unable to anticipate these techniques or to implement adequate preventative measures. We can make no assurance that we will be able to detect, prevent, timely and adequately address, or mitigate the negative effects of cyberattacks or other security breaches, and we cannot guarantee that our systems will not be compromised, whether as a result of criminal conduct, advances in computer hacking, service disruptions, or data security incidents due to employee error, malfeasance, or other vulnerabilities. Any of these occurrences, whether intentional or accidental, could lead to interruptions, delays, or cessation of operation of our products, services and networks.
Unauthorized parties may seek to, among other things, misappropriate, compromise or alter our intellectual property, our confidential information, or confidential information of third parties including our customers; create system disruptions or product or service vulnerabilities; or cause shutdowns. Unauthorized disclosure, misuse, loss or corruption of our data, damage or misuse of our computer systems, or the inability of our customers to access or use our systems and solutions could disrupt our operations, result in a material loss of business, expose us to substantial legal liability, and significantly harm our reputation. Potential breaches of our security measures and the accidental loss, inadvertent disclosure or unauthorized dissemination of proprietary information or sensitive, personal or confidential data about us, our employees or our customers, including the potential loss or disclosure of such information or data as a result of hacking, fraud, trickery or other forms of deception, could expose us, our employees, our customers or the individuals affected to a risk of loss or misuse of this information, result in litigation and potential liability or fines for us, governmental inquiry and oversight, damage our brand and reputation or otherwise harm our business. We may be required to expend significant resources to attempt to protect against security threats, enhance our security measures, or investigate and remediate any security vulnerabilities. If such efforts are unsuccessful, we could experience the disruption of our operations, a material loss of business, exposure to substantial legal liability and significant harm to our reputation.
Our quarterly results may fluctuate significantly.
We expect our operating results to be subject to quarterly fluctuations. The revenue we generate and our operating results will be affected by numerous factors, including:
| • | demand for consumer devices that include our solutions; |
| • | general economic conditions; |
| • | demand for our fonts and custom font design services; |
| • | delays in product shipment by our customers; |
| • | industry consolidation; |
| • | introduction, enhancement and market acceptance of type and technology offered by us and our competitors; |
| • | price reductions or business model changes by us or our competitors or changes in how type and related technologies are priced and licensed; |
| • | the mix of solutions offered by us and our competitors; |
| • | the mix of international and U.S. revenue generated by licensing our solutions; |
30
Table of Contents
| • | financial implications of acquisitions, in particular foreign acquisitions involving different accounting standards, foreign currency issues, international tax planning requirements and the like; and |
| • | timing of billings to customers on royalty reports received by us under our licensing agreements. |
Our revenue also varies from quarter-to-quarter as a result of variances on the timing of transactions through our e-commerce websites. Quarterly fluctuations in our operating results may, in turn, cause the price of our stock to fluctuate substantially. We believe that quarterly comparisons of our financial results are not necessarily meaningful and should not be relied upon as an indication of our future performance.
The loss of members of our executive and senior management team may prevent us from executing our business strategy.
Our future success depends in large part upon the continued services of key members of our executive and senior management team. Our senior officers bring a diverse skill set to our management team, which we rely on for strategy and direction as the Company grows and diversifies. The loss of the services of any of these key employees could seriously harm our ability to execute our business strategy. Further, all of our officers are at-will employees. The loss of any of these key employees may cause us to incur significant costs in identifying, hiring, training and retaining their replacements.
We rely on highly skilled personnel, and if we are unable to retain or motivate key personnel or hire qualified personnel, or implement the appropriate processes and systems to support them, we may not be able to maintain our operations or grow effectively.
Our performance is largely dependent on the talents and efforts of highly skilled individuals, including font designers who are recognized as leaders in the industry and experienced software engineers. These individuals have acquired specialized knowledge and skills with respect to us and our operations. These individuals can be terminated or can leave our employ at any time. Some of these individuals are consultants. Our ability to hire and retain qualified personnel could impact our capacity to maintain our business, and efforts to grow our business could be hindered. If any of these individuals or a group of individuals were to terminate their employment unexpectedly or end their consulting relationship sooner than anticipated, we could face substantial difficulty in hiring qualified successors, could incur significant costs in connection with their termination and could experience a loss in productivity while any such successor obtains the necessary training and experience.
Our future success depends on our continuing ability to identify, hire, develop, motivate and retain highly skilled personnel and consultants for all areas of our organization to drive the execution of our strategic vision. In this regard, if we are unable to hire, train and support, with internal systems and processes, a sufficient number of qualified employees and consultants for any reason or retain employees or consultants with the required expertise, we may not be able to implement our current initiatives or grow effectively or execute our business strategy successfully.
Risks Related to the Securities Markets and Investment in our Common Stock
Our business could be negatively affected as a result of the actions of activist stockholders.
Shareholder activism, which could take many forms or arise in a variety of situations, has been increasing in publicly traded companies recently. On October 6, 2017, we were notified
31
Table of Contents
that various funds affiliated with Starboard Value, BLR Partners LP and FMLP Inc. (collectively, the “Starboard Group”), had obtained a significant stake in our Company for the purposes of (i) engaging in discussions with the Company regarding operating results, cost and capital allocation, opportunities to enhance stockholder value and corporate governance, (ii) taking all action necessary to achieve the foregoing and (iii) taking any other actions the Starboard Group determines to undertake in connection with their respective investment in the Company, including, but not limited to, a potential solicitation of proxies in furtherance of seeking representation on the Board of Directors of the Company. Although Starboard Group significantly reduced their stake in our Company on February 16, 2018, other activists, either working alone or collectively in a group, may obtain a significant stake in our Company. Considering and responding to any proposals from activist stockholders, including potential proxy contests, could result in substantial costs and divert management’s and our Board of Directors’ attention and resources from our business. We have incurred, and expect to continue to incur in the first quarter of 2018, significant legal and advisory fees related to the activist stockholder matters. Additionally, such stockholder activism could give rise to perceived uncertainties as to our future, adversely affect our relationships with customers and service providers, make it more difficult to attract and retain qualified personnel, and cause our stock price to experience periods of volatility.
Market volatility may affect our stock price and the value of your investment.
The market price of our common stock may fluctuate significantly in response to a number of factors, most of which we cannot control, including:
| • | announcements of new products, services or technologies, commercial relationships, acquisitions or other events by us or our competitors; |
| • | fluctuations in stock market prices and trading volumes of similar companies; |
| • | variations in our quarterly operating results; |
| • | changes in our financial guidance or securities analysts’ estimates of our financial performance; |
| • | changes in accounting principles; |
| • | sales of large blocks of our common stock, including sales by our executive officers, directors and significant stockholders; |
| • | additions or departures of key personnel; |
| • | discussion of us or our stock price by the financial press and in online investor communities; |
| • | announcements by the Starboard Group or by us in response to such announcements; |
| • | general market or economic conditions, including factors unrelated to our operating performance or the operating performance of our competitors; and |
| • | other risks and uncertainties described in these “Risk Factors”. |
Market prices of technology companies have been extremely volatile. Stock prices of many technology companies have often fluctuated in a manner unrelated or disproportionate to the operating performance of such companies. In the past, following periods of market volatility, stockholders have often instituted securities class action litigation. If we were involved in securities litigation, it could have a substantial cost and divert resources and the attention of management from our business.
32
Table of Contents
The structure of our current Credit Facility could affect our financing options and liquidity.
We have a five-year, $150.0 million secured revolving credit facility (the “Credit Facility”) with Silicon Valley Bank, the administrative agent for a syndicate of lenders. Borrowings under the Credit Facility bear interest at a variable rate based upon, at the Company’s option, either London Interbank Offering Rate, (“LIBOR”) or the base rate, plus in each case, an applicable margin. The Credit Facility contains certain financial covenants and is secured by substantially all of our assets. Draw downs on the Credit Facility could have important consequences to our business or the holders of our common stock, including:
| • | limiting our ability to obtain additional financing in the future for working capital, capital expenditures or acquisitions; |
| • | requiring a significant portion of our cash flow from operations to be dedicated to the payment of the principal of and interest on our indebtedness, thereby reducing funds available for other purposes; and |
| • | making us more vulnerable to economic downturns and limiting our ability to withstand competitive pressures. |
Anti-takeover provisions in our charter documents and under Delaware law could make an acquisition of us, which may be beneficial to our stockholders, more difficult and may inhibit attempts by our stockholders to replace or remove our current management.
Provisions in our certificate of incorporation and by-laws may delay or prevent an acquisition of us or a change in our management. These provisions include a classified board of directors, a prohibition on actions by written consent of our stockholders and the ability of our board of directors to issue preferred stock without stockholder approval. In addition, because we are incorporated in Delaware, we are governed by the provisions of Section 203 of the Delaware General Corporation Law, which limits the ability of stockholders owning in excess of 15% of our outstanding voting stock to merge or combine with us. Although we believe these provisions collectively provide for an opportunity to obtain greater value for stockholders by requiring potential acquirers to negotiate with our board of directors, they would apply even if an offer rejected by our board were considered beneficial by some stockholders. In addition, these provisions may frustrate or prevent any attempts by our stockholders to replace or remove our current management by making it more difficult for stockholders to replace members of our board of directors, which is responsible for appointing the members of our management.
We currently pay dividends on our common stock, but there is no guarantee that this will continue.
Since the third quarter of 2012, our Board of Directors has approved a quarterly dividend to shareholders of our common stock. Future payments and record dates are subject to board approval. However, if our financial or operating conditions change, or if we fail to satisfy the restrictive covenants contained in the terms of our Credit Facility that limit our ability to make dividend payments, it may affect our ability to pay dividends on a quarterly basis or at all.
We may require additional capital, and raising additional funds by issuing securities or additional debt financing may cause dilution to existing stockholders, restrict our operations or require us to relinquish proprietary rights.
We may need to raise additional capital in the future. We may raise additional funds through public or private equity offerings or debt financings. To the extent that we raise
33
Table of Contents
additional capital by issuing equity securities, our existing stockholders’ ownership will be diluted. Any new debt financing we enter into may involve covenants that restrict our operations more than our current credit facility. These restrictive covenants would likely include limitations on additional borrowing, specific restrictions on the use of our assets and our ability to pay dividends, as well as prohibitions on our ability to create liens, make investments or repurchase stock.
If securities analysts do not publish research or reports about our business or if they publish negative evaluations of our stock, the price of our stock could decline.
The trading market for our common stock relies, in part, on the research and reports that industry or financial analysts publish about us or our business. Although we have obtained analyst coverage, if one or more of the analysts covering our business downgrade their evaluations of our stock, the price of our stock could decline. If one or more of these analysts cease to cover our stock, we could lose visibility in the market for our stock, which in turn could cause our stock price to decline.
| Item 1B. | Unresolved Staff Comments |
None.
| Item 2. | Properties |
The principal leased properties of the Company and its subsidiaries are listed in the table below.
| Location |
Principal Use |
Approximate Square Feet |
Lease term | |||||
| Facilities Used in Current Operations |
||||||||
| Woburn, Massachusetts, USA |
Software Development, Marketing, Sales, Administrative and Corporate | 42,000 | Expires January 2023 with two 5-year renewal options | |||||
| Noida, India |
Software Development and Administrative | 41,000 | Expires November 2019 with two 3-year renewal options | |||||
| Cordoba, Argentina |
Software Development, Customer Service and Administrative | 20,000 | Expires November 2019 | |||||
| New York, New York, USA |
Software Development, Marketing, Sales and Administrative | 18,000 | Expires September 2025 with one 5-year renewal options | |||||
We also maintain seventeen additional leased facilities in San Francisco, Los Altos and Los Angeles, California; Boulder, Colorado; Elk Grove Village and Chicago, Illinois; New York City, New York; Salfords and London, United Kingdom; Bad Homburg and Berlin, Germany; Shanghai and Hong Kong, China, Seoul, South Korea; and Tokyo, Japan. These additional
34
Table of Contents
offices occupy approximately 53,000 square feet in the aggregate. We do not consider any specific leased facility to be material to our operations. We believe equally suited facilities are available in several other areas throughout the United States and abroad.
| Item 3. | Legal Proceedings |
From time to time, we may be a party to various claims, suits and complaints. We do not believe that there are claims or legal proceedings that, if determined adversely to us, would have a material adverse effect on our business, results of operations or financial condition.
| Item 4. | Mine Safety Disclosures |
Not applicable.
35
Table of Contents
PART II
| Item 5. | Market for Registrant’s Common Equity, Related Stockholder Matters and Issuer Purchases of Equity Securities |
Market Information and Related Stockholder Matters
Our common shares, $0.001 par value, trade on the NASDAQ Global Select Market.
The following table sets forth, for the periods indicated, the high and low closing sales prices per share of our common stock as reported by the NASDAQ Global Select Market.
| High | Low | |||||||
| Period 2017: |
||||||||
| First Quarter |
$ | 23.60 | $ | 19.15 | ||||
| Second Quarter |
21.35 | 18.25 | ||||||
| Third Quarter |
19.95 | 17.85 | ||||||
| Fourth Quarter |
25.60 | 19.50 | ||||||
| Period 2016: |
||||||||
| First Quarter |
$ | 24.94 | $ | 21.87 | ||||
| Second Quarter |
24.68 | 22.03 | ||||||
| Third Quarter |
25.12 | 19.04 | ||||||
| Fourth Quarter |
21.81 | 18.60 | ||||||
The closing price of our common stock, as reported by the NASDAQ Global Select Market, was $25.35 on February 20, 2018.
Holders
As of February 20, 2018, there were approximately 466 holders of record of our common stock.
Dividends
The following table sets forth, for the dates indicated, dividends declared on our common stock.
| Declaration Date |
Per share amount |
|||
| Period 2017: |
||||
| October 26, 2017 |
$ | 0.113 | ||
| July 26, 2017 |
0.113 | |||
| April 27, 2017 |
0.113 | |||
| February 15, 2017 |
0.113 | |||
| Period 2016: |
||||
| October 26, 2016 |
$ | 0.110 | ||
| July 26, 2016 |
0.110 | |||
| April 26, 2016 |
0.110 | |||
| February 8, 2016 |
0.110 | |||
The Company paid a total of $18.8 million and $17.5 million in dividends during 2017 and 2016, respectively. We anticipate paying cash dividends on a quarterly basis in the future, subject to approval by our Board of Directors. On February 14, 2018, our Board of Directors declared a $0.116 per share, or approximately $4.9 million, quarterly cash dividend on our outstanding common stock.
36
Table of Contents
Securities Authorized for Issuance Under Equity Compensation Plans
The following table sets forth information regarding securities authorized for issuance under the Company’s equity compensation plans as of December 31, 2017. To date, the Company has not granted any warrants or rights.
| Plan Category |
Number of securities to be issued upon exercise of outstanding options |
Weighted- average exercise price of outstanding options |
Number of securities remaining available for future issuance under equity compensation plans (excluding securities reflected in first column) (3) |
|||||||||
| Equity compensation plans approved by security holders (1) |
982,021 | $ | 20.61 | 2,739,207 | ||||||||
| Equity compensation plans not approved by security holders (2) |
39,367 | $ | 12.63 | 213,232 | ||||||||
|
|
|
|
|
|||||||||
| Total |
1,021,388 | $ | 20.30 | 2,952,439 | ||||||||
|
|
|
|
|
|||||||||
| (1) | Includes our Third Amended and Restated 2007 Stock Option and Incentive Plan, or 2007 Award Plan. |
| (2) | Options issued in connection with our 2012 acquisition of Bitstream Inc. under Marketplace Rule 5635(c)(4) of the NASDAQ Global Select Market. In addition, 712,116 shares, 53,520 shares, 43,486 shares, 35,477 shares and 15,648 shares of restricted stock were issued in connection with the Olapic, Inc., Swyft Media, Mark Boulton Design, Design By Front Limited and Bitstream Inc. acquisitions, respectively. |
| (3) | Total shares allocated to the plans less the total number of awards granted through December 31, 2017. |
The Company is subject to the listing requirements of the NASDAQ Global Select Market.
37
Table of Contents
Performance Graph
This performance graph shall not be deemed “filed” with the SEC or subject to Section 18 of the Exchange Act, nor shall it be deemed incorporated by reference in any of our filings under the Securities Act.
The following graph shows a comparison from December 31, 2012 through December 31, 2017 of the cumulative total return for our common stock, NASDAQ Composite Index and NASDAQ Computer Index. Such returns are based on historical results and are not intended to suggest future performance. Data assumes that dividends, if any, were reinvested.
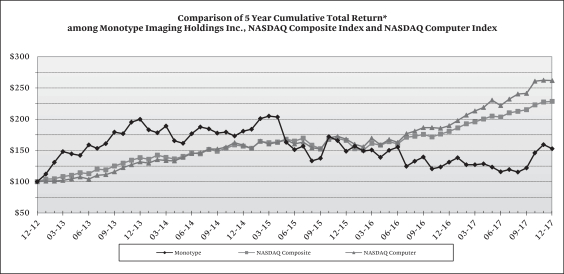
| * | Assumes $100 was invested on December 31, 2012 in our common stock and in the applicable indexes. |
Unregistered Sales of Equity Securities
On August 9, 2016, in connection with our acquisition of Olapic, Inc., we issued an aggregate of 712,116 shares of our restricted common stock as inducement awards to one hundred eight employees of Olapic, Inc. who became employees of the Company. On January 30, 2015, in connection with our acquisition of Swyft Media, we issued an aggregate of 53,520 shares of our restricted common stock as inducement awards to two employees of Swyft Media who became employees of the Company. These issuances were made in compliance with NASDAQ Marketplace Rule 5635(c) and in reliance upon exemptions from registration provided by Section 4(2) of the Securities Act.
38
Table of Contents
Issuer Purchases of Securities
Pursuant to the terms of our 2007 Award Plan and 2010 Inducement Stock Plan, or 2010 Inducement Plan, we automatically reacquire any unvested restricted shares at their original price from the grantee upon termination of employment. The following table provides information about purchases by the Company during the quarter ended December 31, 2017 of equity securities that are registered by the Company pursuant to Section 12 of the Exchange Act:
Monotype Imaging Holdings Inc. Purchases of Equity Securities
| Period |
Total Number of Shares Purchased |
Weighted- average Price Paid per Share |
Total Number of Shares Purchased as Part of Publicly Announced Plans or Programs |
Maximum Number (or Approximate Dollar Value) of Shares that May Yet be Purchased Under the Plans or Programs |
||||||||||||
| October 2, 2017 to October 27, |
59,661 | $ | 2.82 | 8,000 | $ | 12,775,111 | ||||||||||
| November 1, 2017 to November 30, |
65,622 | $ | — | — | 12,775,111 | |||||||||||
| December 7, 2017 to December 31, |
49,592 | $ | 11.18 | 16,000 | 12,393,569 | |||||||||||
|
|
|
|
|
|||||||||||||
| Total |
174,875 | $ | 4.67 | 24,000 | 12,393,569 | |||||||||||
|
|
|
|
|
|||||||||||||
| (1) | The Company purchased 51,156 shares and 26,483 shares of unvested restricted stock in accordance with either the 2007 Award Plan, or the 2010 Inducement Plan in October and December, respectively. The price paid by the Company was determined pursuant to the terms of either the 2007 Award Plan or 2010 Inducement Plan and related restricted stock agreements. |
| (2) | The Company purchased shares of common stock in accordance with its share repurchase program announced on August 30, 2016. The Company purchased the shares on the open market at prevailing market prices. The Plan expired December 31, 2017. |
| (3) | The Company withheld 505 shares and 7,109 shares of vested restricted stock for payment of taxes associated with the vesting in October and December, respectively. |
39
Table of Contents
| Item 6. | Selected Financial Data |
The following selected consolidated financial data should be read in conjunction with our consolidated financial statements and related notes and “Management’s Discussion and Analysis of Financial Condition and Results of Operations” appearing elsewhere in this report. The data presented for the years ended December 31, 2017, 2016 and 2015, and as of December 31, 2017 and 2016, are derived from our audited consolidated financial statements included elsewhere in this report. The data presented for the years ended December 31, 2014 and 2013, and as of December 31, 2015, 2014 and 2013, are derived from our consolidated financial statements not included in this report.
| Years Ended December 31, | ||||||||||||||||||||
| 2017 | 2016 | 2015 | 2014 | 2013 | ||||||||||||||||
| Consolidated Statement of Income Data: |
||||||||||||||||||||
| Revenue |
$ | 235,789 | $ | 203,441 | $ | 192,419 | $ | 184,500 | $ | 166,624 | ||||||||||
| Cost of revenue |
38,761 | 32,904 | 30,281 | 28,583 | 23,776 | |||||||||||||||
| Cost of revenue—amortization of acquired technology |
3,529 | 4,672 | 4,448 | 4,574 | 4,560 | |||||||||||||||
|
|
|
|
|
|
|
|
|
|
|
|||||||||||
| Total cost of revenue |
42,290 | 37,576 | 34,729 | 33,157 | 28,336 | |||||||||||||||
|
|
|
|
|
|
|
|
|
|
|
|||||||||||
| Gross profit |
193,499 | 165,865 | 157,690 | 151,343 | 138,288 | |||||||||||||||
| Marketing and selling |
91,508 | 64,571 | 57,297 | 49,580 | 42,019 | |||||||||||||||
| Research and development |
37,663 | 28,915 | 21,477 | 20,684 | 19,897 | |||||||||||||||
| General and administrative |
46,557 | 42,595 | 33,343 | 23,599 | 19,720 | |||||||||||||||
| Amortization of other intangibles |
4,067 | 3,393 | 3,129 | 5,398 | 5,963 | |||||||||||||||
|
|
|
|
|
|
|
|
|
|
|
|||||||||||
| Total operating expenses |
179,795 | 139,474 | 115,246 | 99,261 | 87,599 | |||||||||||||||
|
|
|
|
|
|
|
|
|
|
|
|||||||||||
| Income from operations |
13,704 | 26,391 | 42,444 | 52,082 | 50,689 | |||||||||||||||
| Other (income) expense: |
||||||||||||||||||||
| Interest expense, net |
2,722 | 1,227 | 919 | 1,034 | 1,272 | |||||||||||||||
| Loss on extinguishment of debt |
— | — | 112 | — | — | |||||||||||||||
| Other (income) expense, net |
4,813 | (35 | ) | 938 | 1,628 | 1,469 | ||||||||||||||
|
|
|
|
|
|
|
|
|
|
|
|||||||||||
| Total other expense |
7,535 | 1,192 | 1,969 | 2,662 | 2,741 | |||||||||||||||
| Income before provision for income taxes |
6,169 | 25,199 | 40,475 | 49,420 | 47,948 | |||||||||||||||
| (Benefit from) provision for income taxes |
(5,391 | ) | 10,313 | 14,278 | 16,875 | 16,863 | ||||||||||||||
|
|
|
|
|
|
|
|
|
|
|
|||||||||||
| Net income |
$ | 11,560 | $ | 14,886 | $ | 26,197 | $ | 32,545 | $ | 31,085 | ||||||||||
|
|
|
|
|
|
|
|
|
|
|
|||||||||||
| Net income available to common stockholders—basic |
$ | 10,615 | $ | 14,395 | $ | 25,575 | $ | 31,940 | $ | 30,582 | ||||||||||
|
|
|
|
|
|
|
|
|
|
|
|||||||||||
| Net income available to common stockholders—diluted |
$ | 10,615 | $ | 14,394 | $ | 25,579 | $ | 31,950 | $ | 30,582 | ||||||||||
|
|
|
|
|
|
|
|
|
|
|
|||||||||||
| Net income per common share: |
||||||||||||||||||||
| Basic |
$ | 0.27 | $ | 0.37 | $ | 0.66 | $ | 0.83 | $ | 0.81 | ||||||||||
|
|
|
|
|
|
|
|
|
|
|
|||||||||||
| Diluted |
$ | 0.27 | $ | 0.36 | $ | 0.65 | $ | 0.81 | $ | 0.78 | ||||||||||
|
|
|
|
|
|
|
|
|
|
|
|||||||||||
| Weighted-average number of common shares outstanding—basic |
39,619,133 | 39,405,700 | 38,840,094 | 38,565,368 | 37,833,817 | |||||||||||||||
| Weighted-average number of common shares outstanding—diluted |
39,858,248 | 39,731,923 | 39,382,566 | 39,466,717 | 39,285,651 | |||||||||||||||
| Cash dividends declared per common share |
$ | 0.449 | $ | 0.440 | $ | 0.400 | $ | 0.320 | $ | 0.240 | ||||||||||
|
|
|
|
|
|
|
|
|
|
|
|||||||||||
40
Table of Contents
| 2017 | 2016 | 2015 | 2014 | 2013 | ||||||||||||||||
| Consolidated Summary Balance Sheet Data: |
||||||||||||||||||||
| Cash and cash equivalents |
$ | 82,822 | $ | 91,434 | $ | 87,520 | $ | 90,325 | $ | 78,411 | ||||||||||
| Total current assets |
136,188 | 125,581 | 109,103 | 109,456 | 97,013 | |||||||||||||||
| Total assets |
526,050 | 525,020 | 391,787 | 374,458 | 356,359 | |||||||||||||||
| Total current liabilities |
60,187 | 48,486 | 35,288 | 33,473 | 28,318 | |||||||||||||||
| Total debt |
93,000 | 105,000 | — | — | — | |||||||||||||||
| Additional paid-in capital |
298,113 | 274,946 | 256,215 | 232,522 | 209,376 | |||||||||||||||
| Total stockholders’ equity |
329,368 | 313,978 | 307,182 | 295,113 | 286,875 | |||||||||||||||
| Item 7. | Management’s Discussion and Analysis of Financial Condition and Results of Operations |
You should read the following discussion and analysis of our financial condition and results of operations in conjunction with our consolidated financial statements and notes to those statements, appearing elsewhere in this report. This report contains forward-looking statements reflecting our current expectations that involve risks and uncertainties, such as statements of our plans, objectives, expectations and intentions. The cautionary statements made in this report should be read as applying to all related forward-looking statements wherever they appear in this report. Our actual results may differ materially from those indicated in the forward-looking statements due to a number of factors, including those discussed in Item 1A, Risk Factors and elsewhere in this report.
Overview
We are a leading global provider of design assets, technology and expertise that are designed to enable the best user experiences, ensure brand integrity and help companies engage their best customers. We empower expression and engagement for creatives, designers, engineers and marketers at the world’s most revered brands. Monotype is home to some of the world’s most well-known typeface collections. We provide high-quality creative assets and technology solutions to marketers and content creators that empower our customers to achieve global brand fidelity and drive consistent user experiences across a wide variety of devices and online media. Along with our custom type services, our solutions enable consumers and professionals to express their creativity, while our tools and technologies improve creative workflows and maximize efficiency as content is published or distributed. Our solutions provide worldwide language coverage and high-quality text, and our embedded solutions support compelling user interfaces. We offer more than 14,000 typeface designs, and include some of the world’s most widely used designs, such as the Times New Roman®, Helvetica®, Frutiger®, ITC Franklin Gothic™, FF Meta and Droid™ typefaces, and support more than 250 Latin and non-Latin languages. Our e-commerce websites, including myfonts.com, fonts.com, linotype.com, and fontshop.com, which attracted more than 50 million visitors in 2017 from over 200 countries and territories, offer thousands of high-quality font products including our own fonts from the Monotype Libraries, as well as fonts from third parties.
Olapic
On August 9, 2016, the Company purchased all of the outstanding shares of Olapic, Inc., a privately-held company located in New York, New York; its wholly-owned subsidiaries Olapic UK Ltd., based in London, England; and Olapic Argentina S.A., based in Córdoba, Argentina. Olapic is a provider of a leading visual commerce platform for collecting, curating,
41
Table of Contents
showcasing and measuring crowd sourced photos and videos. Olapic’s Earned Content Platform helps brands collect, curate, use and analyze user-generated content in the form of images and videos in their ecommerce experiences and across multiple marketing channels. This allows consumers to make more educated purchasing decisions, discover new products and connect to the brand’s community. Olapic leverages photos and videos from social network sites to help to create powerful branded experiences that drive consumer engagement and increase conversions. The Company acquired Olapic for an aggregate purchase price of approximately $123.7 million, net of cash acquired, consisted of approximately $13.7 million in cash and $110.0 million borrowed from its line of credit. The merger agreement included an additional $9.0 million of consideration that has been placed in escrow and will be paid to the founders of Olapic contingent upon continued employment with the Company. Accordingly, this amount will be recognized as compensation expense over the service period contractually required to earn such amounts, which is $3.0 million after twenty four months and the remainder after thirty six months from the acquisition date. Monotype issued approximately $17.1 million of a combination of restricted stock awards or restricted stock units to the founders and employees of Olapic. These awards will vest over time based on continued employment, and accordingly will be accounted for as compensation expense. Seventy five employees from Olapic’s U.S. operations, eighty five employees from Olapic’s Argentina operations and forty one UK and European employees joined the Company in connection with the acquisition. The results of operations of Olapic have been included in our consolidated results and revenue is included within the Creative Professional market beginning on August 9, 2016, the date of acquisition. In connection with the acquisition, we recorded $89.6 million of goodwill. The goodwill reflects the value of the synergies we expect to realize and the assembled workforce. The acquisition of Olapic was structured in such a manner that the goodwill is not expected to be deductible for tax purposes. The purchase price has been allocated to the tangible and intangible assets acquired and liabilities assumed based upon the respective estimates of fair value as of the date of the acquisition and using assumptions that the Company’s management believes are reasonable given the information available.
Sources of Revenue
We derive revenue from two principal sources: licensing our design assets and technology to brands and creative professionals, which we refer to as our Creative Professional revenue, and licensing our text imaging solutions to consumer device manufacturers and independent software vendors, which we refer to as our OEM revenue. We derive our Creative Professional revenue primarily from brands, agencies, publishers, corporations, enterprises, small businesses and individuals. We derive our OEM revenue primarily from consumer device manufacturers. Some of our revenue streams, particularly project-related and custom font design revenue where spending is largely discretionary in nature, have historically been and we expect them to continue to be in the future, susceptible to weakening economic conditions.
Our customers are located in the United States, Asia, Europe, and throughout the rest of the world, and our operating subsidiaries are located in the United States, Argentina, the United Kingdom, Germany, India, China and Japan. We are dependent on international sales by our foreign operating subsidiaries for a substantial amount of our total revenue. Revenue from our subsidiary in China is generally from Asian customers and revenue from our other subsidiaries is from customers in a number of different countries, including the United States.
Effective as of January 1, 2017, our presentation of geographic revenue has been changed to better align with how our business operates. As a result, we now report revenue based on
42
Table of Contents
the geographic location of our customers, rather than based on the location of our subsidiary receiving such revenue. For example, licenses may be sold to large international companies which may be headquartered in the Republic of Korea, but the sales are received and recorded by our subsidiary located in the United States. Historically, in the table below such revenues would be included in the revenue for the United States, whereas for our new presentation, such revenues would be reported in the Republic of Korea and included in the revenue for Rest of World. Geographic revenue for the year ended 2016 has been restated to conform to this presentation. Revenue for the year ended 2015 has not been restated as it is impracticable to do so.
| 2017 | 2016 | |||||||||||||||
| Sales | % of Total | Sales | % of Total | |||||||||||||
| United States |
$ | 101,565 | 43.1 | % | $ | 84,895 | 41.7 | % | ||||||||
| Europe, Middle East and Africa (EMEA) |
57,147 | 24.2 | 44,770 | 22.0 | ||||||||||||
| Japan |
58,566 | 24.8 | 53,620 | 26.4 | ||||||||||||
| Rest of World |
18,511 | 7.9 | 20,156 | 9.9 | ||||||||||||
|
|
|
|
|
|
|
|
|
|||||||||
| Total |
$ | 235,789 | 100.0 | % | $ | 203,441 | 100.0 | % | ||||||||
|
|
|
|
|
|
|
|
|
|||||||||
| 2015 | ||||||||
| Sales | % of Total | |||||||
| United States |
$ | 105,034 | 54.5 | % | ||||
| United Kingdom |
11,533 | 6.0 | ||||||
| Germany |
23,593 | 12.3 | ||||||
| Japan |
51,521 | 26.8 | ||||||
| Other Asia |
738 | 0.4 | ||||||
|
|
|
|
|
|||||
| Total |
$ | 192,419 | 100.0 | % | ||||
|
|
|
|
|
|||||
For the years ended December 31, 2017 and 2016, revenue from customers located outside the United States comprised 56.9% and 58.3%, respectively, of our total revenue. For the year ended December 31, 2015, sales by our subsidiaries located outside the United States comprised of 45.5% of our total revenue. We expect that sales by our international subsidiaries will continue to represent a substantial portion of our revenue for the foreseeable future. Future international revenue will depend on the continued use and expansion of our design assets and technology worldwide.
We derive a significant portion of our OEM revenue from a limited number of customers, in particular manufacturers of laser printers and consumer electronic devices. For the years ended December 31, 2017, 2016 and 2015, our top ten licensees by revenue accounted for approximately 27.3%, 30.3% and 33.5% of our total revenue, respectively. No one customer accounted for more than 10% of our total revenue in 2017, 2016 or 2015. For the quarters ended December 31, 2017, 2016 and 2015, no customer individually accounted for more than 10% of our total revenue.
Cost of Revenue
Our cost of revenue consists of font license fees that we pay on certain fonts that are owned by third parties, allocated internal engineering expense and overhead costs directly related to custom font design services and cloud-based web services costs related to our SaaS-based offerings. License fees that we pay to third parties are typically based on a percentage of our Creative Professional and OEM revenue and do not involve minimum fees. Our cost of OEM revenue has typically had a lower cost than our cost of Creative Professional revenue
43
Table of Contents
because we own a higher percentage of the fonts licensed to our OEM customers, provide value-added technology and have negotiated lower royalty rates on the fonts we license from third parties because of volume. We have achieved improved margins on our Creative Professional revenue as a result of product mix and lower royalty rates. In addition, Creative Professional revenue includes custom font design service revenue, which has a substantially higher cost than our other revenue. Our gross profit margin may vary depending on the mix of revenue between sales of our fonts and sales of third party fonts, and depending on the level of custom font design service revenue.
Cost of revenue also includes amortization of acquired technology, which we amortize over 7 to 15 years. For purposes of amortizing acquired technology we estimate the remaining useful life of the technology based upon various considerations, including our knowledge of the technology and the way our customers use it. We use the straight-line method to amortize our acquired technology. There is no reliable evidence to suggest that we should expect any other pattern of amortization than an even pattern, and we believe this best reflects the expected pattern of economic usage.
Gross Profit
Our gross profit percentage is influenced by a number of factors including product mix, pricing and volume at any particular time. However, our cost of OEM revenue is typically lower than our cost of Creative Professional revenue because we own a higher percentage of the fonts licensed to our OEM customers, provide value-added technology and have negotiated lower royalty rates on the fonts we license from third parties because of volume. In addition, within our Creative Professional business, the cost of our custom font design service revenue is substantially higher than the cost of our other revenue. The relative cost of our Creative Professional revenue has decreased in recent periods, as efforts to sell license rights to more fonts that we own have been successful, and because we have recently experienced success in our effort to sell certain license rights that carry lower royalty rates to Creative Professional customers. Our Creative Professional revenue is growing at a faster rate than our OEM revenue. We expect these trends to continue. Our gross profit is subject to variability from period-to-period, depending on the product mix and the level of custom font design service revenue.
Marketing and Selling
Our marketing and selling expense consists of salaries, bonuses, commissions and benefits related to our marketing and selling personnel, business travel expenses, advertising and trade show expenses, web-related expenses, allocated facilities costs and other overhead expenses. Sales commission expense varies as a function of revenue and goal achievement from period-to-period.
Research and Development
Our research and development expense consists of salaries, bonuses and benefits related to our research and development, engineering, font design and integration support personnel and their business travel expenses, license fees related to certain of our technology licenses, expenses for contracted services and allocated facilities costs and other overhead expenses. Our research and development expense in a given period may be reduced to the extent that internal engineering resources are allocated to cost of revenue for custom design services.
44
Table of Contents
Our research and development is primarily focused on enhancing the functionality of our fonts and technology solutions, and developing new products. From time-to-time, we license third-party font technology in connection with new technology development projects that are part of our research and development efforts. Our research and development costs are expensed as incurred.
General and Administrative
Our general and administrative expense consists of salaries, bonuses and benefits related to our general and administrative personnel, accounting, legal and other professional fees, allocated facilities costs and other overhead expenses and insurance costs.
Amortization of Intangible Assets
We amortize intangible assets acquired as follows:
| • | Customer relationships—5 to 16 years; |
| • | Acquired technology—7 to 15 years; and |
| • | Non-compete agreements—3 to 6 years. |
For purposes of amortization, we estimate the life of customer relationships based upon various considerations, including our knowledge of the industry and the marketplace in which we operate. We amortize non-compete agreements over the stated life of the agreement. We use the straight-line method to amortize our intangible assets. There is no reliable evidence to suggest that we should expect any other pattern of amortization than an even pattern, and we believe this best reflects the expected pattern of economic usage.
Critical Accounting Policies
The preparation of financial statements and related disclosures in conformity with generally accepted accounting principles in the United States, or GAAP, and our discussion and analysis of our financial condition and results of operations requires us to make judgments, assumptions and estimates that affect the amounts reported in our consolidated financial statements and accompanying notes. We base our estimates on historical experience and on various other assumptions that we believe are reasonable under the circumstances, the results of which form the basis for judgments about the carrying values of assets and liabilities. Actual results may differ from these estimates.
We believe the following critical accounting policies affect our more significant judgments used in the preparation of our consolidated financial statements. Additional information about our critical accounting policies may be found in Note 2 to our consolidated financial statements in Item 8 of this Annual Report on Form 10-K.
Revenue Recognition
We recognize revenue in accordance with ASC Topic No. 985-605, Software Revenue Recognition. Revenue is recognized when persuasive evidence of an agreement exists, the product has been delivered or services have been provided, the fee is fixed or determinable and collection of the fee is probable. However, determining whether and when some of these criteria have been satisfied often involves assumptions and judgments that can have a significant impact on the timing and amount of revenues the Company reports. For example,
45
Table of Contents
the Company often receives multiple purchase orders or contracts from a single customer or a group of related parties that are evaluated to determine if they are, in effect, parts of a single arrangement. If they are determined to be parts of a single arrangement, revenues are recorded as if a single multiple-element arrangement exists. In addition, arrangements with customers may include multiple deliverables, or multiple elements in a single purchase order or contract. The fee for such arrangement is allocated to the various elements based on vendor-specific objective evidence of fair value, or VSOE, and revenue is recognized accordingly. In the absence of VSOE, all revenue from the arrangement is deferred until the earlier of the point at which (a) such sufficient VSOE does exist, or (b) all elements of the arrangement have been delivered. In certain circumstances, the revenue is recognized ratably, in accordance with the revenue recognition guidance.
Creative Professional Revenue
Our Creative Professional revenue is primarily derived from font licenses, font related services and from custom font design services. We license fonts directly to end-users through our direct sales organization, e-commerce websites and indirectly through third-party resellers. Web font and digital ad related services refer to our web font services and web design tools. Our customers include graphic designers, advertising agencies, media organizations and corporations. In addition, Creative Professional revenue includes revenue derived from our software as a service, or SaaS, offerings.
Revenue from font licenses to our e-commerce customers is recognized upon payment by the customer and when the software embodying the font is shipped or made available. Revenue from font licenses to other customers is recognized upon shipment of the software embodying the font and when all other revenue recognition criteria have been met. Revenue from resellers is recognized upon notification from the reseller that our font product has been licensed and when all other revenue recognition criteria have been met. Custom font design services are generally recognized upon delivery, unless it is part of a bundled services arrangement, in which case, it is recognized over the longest service period, or accounted for on a percentage-of-completion basis where appropriate. Web font and digital ad service revenue is mainly self-hosted and recorded upon delivery. Revenue from Olapic’s Earned Content platform is a SaaS-based, subscription model. Company hosted subscription-based arrangements and our SaaS products are accounted for as subscription revenue, recognized ratably over the subscription period. The Company’s SaaS arrangements provide customers the right to access its hosted software applications and our customers do not have the right to take possession of the Company’s software during the hosting arrangement.
Web server and commercial rights to online fonts is considered recurring revenue and is recognized upon payment by the customer and proof of font delivery, and when all other revenue recognition criteria have been met. Contract accounting, completed contract for short-term projects and percentage-of-completion for long-term projects, is used where services are deemed essential to the software.
OEM Revenue
Our OEM revenue is derived substantially from printer imaging, printer driver and display imaging products. Under our licensing arrangements, we either receive a royalty for each product unit incorporating our fonts and technology that is shipped by our OEM customers or a fixed fee as specified under license arrangements with certain of our OEM customers. Fixed fee licensing arrangements are not based on units shipped by the customer, but instead, customers pay us on a periodic basis for the right to embed our fonts and
46
Table of Contents
technology in their products over a certain term. Although significantly less than royalties from per-unit shipments and fixed fees from OEM customers, we also receive revenue from software application and operating systems vendors, who include our fonts and technology in their products, and for font development. Many of our per-unit royalty licenses continue for the duration that our OEM customers ship products that include our technology, unless terminated for breach. Other licenses have terms that typically range from one fiscal quarter to five years, and usually provide for automatic or optional renewals. We recognize revenue from per-unit royalties in the period during which we receive a royalty report from a customer, typically one quarter after royalty-bearing units are shipped, as we do not have the ability to estimate the number of units shipped by our customers. Revenue from fixed fee licenses is generally recognized when it is billed to the customer, so long as the product has been delivered, the license fee is fixed and non-refundable, is not bundled with any time-based elements and collection is probable. OEM revenue also includes project-related agreements for which contract accounting, completed contract for short-term projects and percentage-of-completion for long-term projects, may be used.
Goodwill, Indefinite-Lived Intangible Assets and Long-lived Assets
We record tangible and intangible assets acquired and liabilities assumed in a business combination under the purchase method of accounting. Amounts paid for acquisitions are allocated to the assets acquired and liabilities assumed based on their fair values at the date of acquisition. We allocate the excess of the cost of an acquired entity over the amounts assigned to assets acquired and liabilities assumed in a business combination to goodwill. The value initially assigned to the acquired assets and assumed liabilities, particularly intangible assets and goodwill, are subject to underlying assumptions that require significant management judgment. If different assumptions were used, it could materially impact the purchase price allocation and our financial position and results of operations.
Our chief operating decision maker, or CODM, our president and chief executive officer, assesses performance and makes resource allocation decisions based on our financial performance. The CODM evaluates financial performance measured by revenue on a consolidated and market basis, and by consolidated net adjusted EBITDA. Annual budgeting, hiring and resource allocation are evaluated based on consolidated and market revenue, and consolidated net adjusted EBITDA. As a result primarily of the aforementioned factors, we operate within a single business segment and reporting unit.
We assess the impairment of goodwill and indefinite-lived intangible assets annually, or more frequently if events or changes in circumstances indicate that the carrying value of such assets exceeds their fair value. We perform our annual goodwill and indefinite-lived intangible impairment tests as of December 31. In accordance with Accounting Standards Update, ASU, No. 2011-08, Intangibles—Goodwill and Other (Topic 350): Testing Goodwill for Impairment, we have opted to perform a qualitative assessment of the fair value of the reporting unit. If the Company determines, on the basis of the qualitative factors, that the fair value of the reporting unit is more likely than not less than its carrying value, the quantitative two-step fair value impairment test is required. Otherwise, no further testing is required. Similarly, for indefinite-lived intangible assets, in accordance with ASU No. 2012-02, Intangibles—Goodwill and Other (Topic 350): Testing Indefinite-Lived Intangible Assets for Impairment, an entity has the option to first assess qualitative factors to determine whether it is necessary to perform the two-step test. If an entity believes, as a result of its qualitative assessment, that it is more-likely-than-not that the fair value of a reporting unit is less than its carrying amount, the quantitative impairment test is required. Otherwise, the quantitative test is optional for indefinite-lived intangible assets. For both years presented,
47
Table of Contents
2017 and 2016, we assessed qualitative factors of goodwill, as described below, to determine whether it was more likely than not that the fair value of our reporting unit was impaired and determined that the fair value was more likely than not higher than its carrying value. For both years presented, 2017 and 2016, we assessed qualitative factors of our indefinite-lived intangible assets. In both years presented, we determined that the fair value was more likely than not higher that the carrying value.
With respect to both goodwill and indefinite-lived intangible assets, factors that could trigger an impairment review include significant negative industry or economic trends, exiting an activity in conjunction with a restructuring of operations, a sustained decrease in share price or current, historical or projected losses that demonstrate continuing losses associated with an asset. Impairment evaluations involve management estimates of useful lives and future cash flows, including assumptions about future conditions such as future revenue, operating expenses, the fair values of certain assets based on appraisals and industry trends. Actual useful lives and cash flows could be different from those estimated by our management. If this resulted in an impairment of goodwill and indefinite-lived intangible assets, it could have a material adverse effect on our financial position and results of operations.
Stock Based Compensation
We account for stock based compensation in accordance with ASC Topic No. 718, Compensation—Stock Compensation or ASC 718, which requires the measurement of compensation costs at fair value on the date of grant and recognition of compensation expense over the service period for awards expected to vest.
For restricted stock awards and restricted stock units issued under the Company’s stock based compensation plans, the fair value of each grant is calculated based on the Company’s stock price on the date of grant. For service-based awards, the Company recognizes compensation expense on a straight-line basis over the requisite service period of the award. For performance-based awards, stock based compensation expense is recognized over the expected performance achievement period of individual performance milestones, when the achievement of each individual performance milestone becomes probable.
The Company uses the Black-Scholes option pricing model to determine the weighted-average fair value of options granted and recognizes the compensation cost of stock based awards on a straight-line basis over the vesting period of the award. The determination of the fair value of stock based payment awards using the Black-Scholes model are affected by our stock price and a number of assumptions, including expected volatility, expected life, risk-free interest rate and expected dividends. We estimate volatility based on our own stock price history. The expected life of awards is estimated based on actual historical exercise behavior of our employees. The risk-free interest rate assumption is based on a U.S. treasury instrument whose term is consistent with the expected life of our awards. The expected dividend yield assumption is based on the actual annual yield.
In 2017, we elected to account for forfeitures when they occur, on a modified retrospective basis in connection with our adoption of ASU 2016-09, Compensation – Stock Compensation (Topic 718): Improvements to Employee Share-Based Payment Accounting. As a result of this adoption, $0.6 million of additional stock based compensation expense, net of tax, was recorded to retained earnings on the date of adoption as a cumulative effect adjustment related to our accounting policy change for forfeitures.
48
Table of Contents
In 2016, forfeitures were estimated quarterly. Prior to 2016, forfeitures were estimated at the time of grant and were revised, if necessary, in subsequent periods if actual forfeitures differed from those estimates. Stock based compensation expense recognized in our financial statements is based on awards that are ultimately expected to vest. We evaluate the assumptions used to value our awards on a quarterly basis and if factors change and we employ different assumptions, stock based compensation expense may differ significantly from what we have recorded in the past. If there are any modifications or cancellations of the underlying unvested securities, we may be required to accelerate, increase or cancel any remaining unearned stock based compensation expense. Future stock based compensation expense and unearned stock based compensation will increase to the extent that we grant additional equity awards to employees or we assume unvested equity awards in connection with acquisitions.
During the years ended December 31, 2017, 2016 and 2015, we recorded total stock based compensation of $20.3 million, $17.3 million and $13.7 million, respectively. In 2017, approximately $20.1 million of the $20.3 million was expensed, and in 2015, approximately $13.6 million of the $13.7 million was expensed. In 2016, all of the $17.3 million was expensed. See Note 13 for further details. As of December 31, 2017, the Company had $35.0 million of unrecognized compensation expense related to employees unvested stock options and employees and directors restricted share awards that are expected to be recognized over a weighted-average period of 2.4 years. Some of the restricted stock units granted are subject to performance-based vesting conditions. The vesting for those grants is based on the achievement of specific annual Company revenue targets over three consecutive years; there is no time-based vesting element to these awards. Achievement can be accelerated or cumulative, and some of the awards contain a catch up provision. As of December 31, 2015, it was determined that one annual revenue target associated with the performance-based restricted stock units was probable; accordingly, $0.6 million of stock based compensation expense was recorded in the consolidated statement of income. As of December 31, 2016, it was determined that two separate annual revenue targets associated with the performance-based restricted stock units were probable; accordingly, $1.1 million of compensation expense was recorded in the consolidated statement of income. The remaining performance targets had not been met, and it was determined that it is not probable that the future performance criteria will be met.
Pension Plan
We account for our unfunded defined benefit pension plan in accordance with ASC Subtopic No. 715-30, Defined Benefit Plans—Pension. The pension plan is closed to new participants. The pension plan covers substantially all employees of our German subsidiary who joined our German subsidiary prior to the plan closing in 2006. Benefits under this plan are based on the employees’ years of service and compensation. We fund the plan sufficiently to meet current benefits only. There are no assets associated with the plan. In each of 2017, 2016 and 2015 we paid $0.1 million to the plan participants. At December 31, 2017 and 2016, our unfunded position was $6.3 million and $5.4 million, respectively. A significant portion of the pension benefit obligation is determined based on the rate of future compensation increases, inflation and interest rates. Given the fact that the pension plan is unfunded, changes in economic and market conditions may require us to increase cash contributions in future years. In addition, changes to our assumptions may materially impact the accrued pension liability.
49
Table of Contents
Provision for Income Taxes
We provide for income taxes in accordance with ASC Topic No. 740, Income Taxes, or ASC 740. Under this method, a deferred tax asset or liability is determined based on the difference between the financial statement and the tax basis of assets and liabilities, as measured by enacted tax rates in effect when these differences are expected to be reversed. This process includes estimating current tax exposure together with assessing temporary differences resulting from differing treatment of items for tax and financial accounting purposes. These differences result in deferred tax assets and liabilities. We also assess the likelihood that our deferred tax assets will be recovered from future taxable income and, to the extent we believe recovery to be unlikely, we have established a valuation allowance. Significant judgment is required in determining the provision for income taxes, deferred tax assets and liabilities and any valuation allowance against our deferred tax assets. Our financial position and results of operations may be materially affected if actual results significantly differ from these estimates or the estimates are adjusted in future periods.
We have recorded a valuation allowance against certain deferred tax assets, including foreign tax credits, where we have determined that their future use is uncertain. ASC 740 requires a valuation allowance be established when it is “more likely than not” that all or a portion of deferred tax assets will not be realized. A review of all available positive and negative evidence is considered, including a company’s performance, the market environment in which the company operates, length of carry-back and carry-forward periods, existing sales backlog, future taxable income projections and tax planning strategies. We have historically provided valuation allowances on certain tax assets, due to the uncertainty of generating taxable income in the appropriate jurisdiction and of the appropriate character to realize such assets. In these instances, the Company has made the determination that it is “more likely than not” that all or a portion of the deferred tax will not be realized.
We will continue to review our deferred tax position on a periodic basis and will reflect any change in judgment as a discrete item in the related period.
The amount of income taxes we pay is subject to ongoing audits by federal, state and foreign tax authorities, which often result in proposed assessments. Our estimate for the potential outcome for any uncertain tax issue is highly judgmental. We believe we have adequately provided for any reasonably foreseeable outcome related to these matters. However, our future results may include favorable or unfavorable adjustments to our estimated tax liabilities in the period that the assessments are made or resolved, or when the statute of limitations for certain periods expires. As a result, our effective tax rate may fluctuate significantly on a quarterly basis.
As part of the process of preparing our consolidated financial statements, we are required to estimate our income taxes in each of the jurisdictions in which we operate. This process involves estimating our actual current tax expense together with assessing the future impact of temporary differences resulting from differing treatment of items for tax and accounting purposes. The tax effect of these temporary differences is shown on our December 31, 2017 consolidated balance sheet (see Note 11 to our consolidated financial statements) and denotes these differences as a net deferred tax liability of $26.8 million. This consists of total deferred tax liabilities of $44.5 million and net deferred tax assets of $17.7 million after providing a valuation allowance of $6.9 million.
50
Table of Contents
New Tax Legislation
On December 22, 2017, the Tax Cuts and Jobs Act (“The Act”) was signed into law. This legislation includes significant changes in U.S. tax law, including a reduction in the corporate tax rates and the creation of a territorial tax system with a one-time mandatory tax on previously deferred foreign earnings of U.S. subsidiaries. The legislation reduced the U.S. corporate tax rate from the current rate of 35% to 21% for tax years beginning after December 31, 2017. As a result of the enacted law, the Company was required to revalue deferred tax assets and liabilities existing as of December 31, 2017 from the 35% federal rate in effect through the end of 2017, to the new 21% rate. Accordingly, the Company recorded a current period tax benefit of $16.8 million and a corresponding reduction in the deferred tax liability. In addition, as a result of changes made by The Act related to taxation of foreign source income and the utilization of foreign tax credits, the Company recorded a valuation allowance on foreign tax credit carryforwards of $5.6 million. The new legislation will require the Company to pay tax on the unremitted earnings of its foreign subsidiaries though December 31, 2017. Because of the complexities involved in determining the previously unremitted earnings and profits of all our foreign subsidiaries, the Company is still in the process of obtaining, preparing, and analyzing the required information, as permitted in accordance with Staff Accounting Bulletin No. 118. The Company has recorded an initial estimate of the tax on unremitted earnings of approximately $0.2 million, net of related foreign tax credits. This amount has been further offset by available foreign tax credits, and as a result the net estimated amount payable related to the deemed repatriation of foreign earnings is zero.
Results of Operations
The following table sets forth items in the consolidated statement of income as a percentage of sales for the periods indicated:
| Year Ended December 31, | ||||||||||||
| 2017 | 2016 | 2015 | ||||||||||
| Revenue: |
||||||||||||
| Creative Professional |
55.4 | % | 50.3 | % | 45.8 | % | ||||||
| OEM |
44.6 | 49.7 | 54.2 | |||||||||
|
|
|
|
|
|
|
|||||||
| Total revenue |
100.0 | 100.0 | 100.0 | |||||||||
| Cost of revenue |
16.4 | 16.2 | 15.7 | |||||||||
| Cost of revenue—amortization of acquired technology |
1.5 | 2.3 | 2.3 | |||||||||
|
|
|
|
|
|
|
|||||||
| Total cost of revenue |
17.9 | 18.5 | 18.0 | |||||||||
|
|
|
|
|
|
|
|||||||
| Gross profit |
82.1 | 81.5 | 82.0 | |||||||||
| Marketing and selling |
38.8 | 31.7 | 29.8 | |||||||||
| Research and development |
16.1 | 14.2 | 11.2 | |||||||||
| General and administrative |
19.7 | 20.9 | 17.3 | |||||||||
| Amortization of other intangible assets |
1.7 | 1.7 | 1.6 | |||||||||
|
|
|
|
|
|
|
|||||||
| Total operating expenses |
76.3 | 68.5 | 59.9 | |||||||||
|
|
|
|
|
|
|
|||||||
| Income from operations |
5.8 | 13.0 | 22.1 | |||||||||
| Interest expense, net |
1.2 | 0.6 | 0.5 | |||||||||
| Loss on extinguishment of debt |
— | — | 0.1 | |||||||||
| Loss on foreign exchange |
2.0 | 0.2 | 0.5 | |||||||||
| Loss (gain) on derivatives |
0.1 | (0.2 | ) | — | ||||||||
| Other (income) expense |
(0.1 | ) | — | — | ||||||||
|
|
|
|
|
|
|
|||||||
| Total other expenses |
3.2 | 0.6 | 1.1 | |||||||||
| Income before provision for income taxes |
2.6 | 12.4 | 21.0 | |||||||||
| (Benefit) provision for income taxes |
(2.3 | ) | 5.1 | 7.4 | ||||||||
|
|
|
|
|
|
|
|||||||
| Net income |
4.9 | % | 7.3 | % | 13.6 | % | ||||||
|
|
|
|
|
|
|
|||||||
51
Table of Contents
Year Ended December 31, 2017 as Compared to Year Ended December 31, 2016
Sales by Market. We view our operations and manage our business as one segment; the development, marketing and licensing of design assets and technologies. Factors used to identify our single segment include the financial information available for evaluation by our chief operating decision maker, our president and chief executive officer, in determining how to allocate resources and assess performance. While our technologies and services are sold to customers in two principal markets Creative Professional and consumer device manufacturers and independent software vendors, together OEM, expenses and assets are not formally allocated to these markets, and operating results are assessed on an aggregate basis to make decisions about the allocation of resources. The following table presents revenue for these two principal markets (in thousands):
| 2017 | 2016 | Increase | ||||||||||
| Creative Professional |
$ | 130,595 | $ | 102,381 | $ | 28,214 | ||||||
| OEM |
105,194 | 101,060 | 4,134 | |||||||||
|
|
|
|
|
|
|
|||||||
| Total revenue |
$ | 235,789 | $ | 203,441 | $ | 32,348 | ||||||
|
|
|
|
|
|
|
|||||||
Revenue
Revenue was $235.8 million and $203.4 million for the years ended December 31, 2017 and 2016, respectively, an increase of $32.3 million, or 15.9%.
Creative Professional revenue increased $28.2 million, or 27.6%, to $130.6 million for the year ended December 31, 2017, as compared to $102.4 million for the year ended December 31, 2016, mainly due to a full year of revenue from Olapic and continued growth in sales of recurring licenses, web font revenue and digital ad revenue.
OEM revenue was $105.2 million and $101.1 million for the years ended December 31, 2017 and 2016, respectively, an increase of $4.1 million, or 4.1%. Revenue from our display imaging consumer electronic OEM customers increased and revenue from our printer imaging electronic OEM customers increased period over period, as we continued to convert customers to fixed fee contracts from royalty bearing contracts, partially offset by decreased revenue from our independent software vendor customers.
Cost of Revenue
Cost of revenue, excluding amortization of acquired technology, was $38.8 million for the year ended December 31, 2017, as compared to $32.9 million for the year ended December 31, 2016, an increase of $5.9 million, or 17.8%. The increase in cost of revenue, excluding amortization of acquired technology, is mainly due to increased revenue, period over period. In the year ended December 31, 2017, cost of revenue included a full year of costs from our Olapic business which we acquired on August 9, 2016 and a larger proportion of our Creative Professional revenue, as compared to the same period in 2016.
The portion of cost of revenue consisting of amortization of acquired technology was $3.5 million and $4.7 million in the years ended December 31, 2017 and 2016, respectively, a decrease of $1.1 million, or 24.4%, primarily due to an asset that became fully amortized in October 2016.
52
Table of Contents
Gross Profit
Gross profit was 82.1% and 81.5% of revenue in the years ended December 31, 2017 and 2016, respectively, an increase of 0.6 percentage points, mainly due to decreased amortization of acquired technology, net of variations in product mix as described above.
Operating Expenses
Marketing and Selling. Marketing and selling expense increased $26.9 million, or 41.7%, to $91.5 million for the year ended December 31, 2017, as compared to $64.6 million for the year ended December 31, 2016, primarily due to a full year of Olapic and investments in the Olapic business. Personnel and personnel related expenses increased $23.2 million period over period, mainly from our acquisition of Olapic and targeted hiring in our direct sales organization, increased variable compensation due to the increased revenue and severance expense associated with our restructuring action taken in the fall of 2017, primarily to refine our go-to-market approach for Olapic. Increased software and rent expense, primarily due to increased headcount, contributed $3.3 million to the overall increase in marketing and selling expense, for the year ended December 31, 2017, as compared to the same period in 2016.
Research and Development. Research and development expense increased $8.8 million, or 30.4%, to $37.7 million for the year ended December 31, 2017, as compared to $28.9 million for the year ended December 31, 2016. Personnel and personnel related expenses increased $7.9 million for the year ended December 31, 2017, as compared to the same period in 2016, mainly due to increased headcount in connection with our acquisition of Olapic and targeted hiring, net of a reduction for capitalized personnel costs for development projects and an increase in personnel costs classified as cost of sales for custom font development in 2017, as compared to the same period in 2016. Higher facilities related expenses contributed $0.9 million to the increase in research and development, period over period, a result of increased headcount and the addition of Olapic.
General and Administrative. General and administrative expense was $46.6 million for the year ended December 31, 2017, as compared to $42.6 million for the year ended December 31, 2016, an increase of $4.0 million, or 9.3%. Personnel and personnel related expenses increased $1.7 million in the year ended December 31, 2017, as compared to the same period in 2016, primarily as a result of key hiring and the addition of Olapic. Software and depreciation expense together increased $2.3 million, period over period, mainly due to the addition of Olapic.
Amortization of Other Intangible Assets. Amortization of other intangible assets was $4.1 million and $3.4 million in 2017 and 2016, an increase of $0.7 million, or 20.0%, respectively, primarily due to our acquisition of Olapic.
Interest Expense, Net
Interest expense, net of interest income, was $2.7 million and $1.2 million in 2017 and 2016, respectively, an increase of $1.5 million, mainly due to a full year of interest expense on our borrowings under our revolving line of credit for the acquisition of Olapic on August 9, 2016.
53
Table of Contents
Loss on Foreign Exchange
Loss on foreign exchange increased $4.2 million to $4.8 million in 2017, as compared to $0.6 million in 2016. The loss in both periods was the result of currency fluctuations on our foreign denominated receivables and payables. In 2017, the loss was mainly attributed to the strengthening of the Euro, as compared to the U.S. dollar, on U.S. dollar denominated receivables held by our foreign subsidiaries.
Loss (Gain) on Derivatives
Loss (gain) on derivatives was a loss of $0.3 million and a gain of $0.5 thousand in 2017 and 2016, respectively, the net result of changes in the market value of our currency derivative contracts.
Provision for Income Taxes
Our effective tax rate was a benefit of 87.4% and a charge of 40.9% for the years ended December 31, 2017 and 2016, respectively. The 2017 effective tax rate included a benefit of 272.3% for tax rate changes due to The Act. Also in connection with The Act, the 2017 effective tax rate included a charge of 90.5% for valuation allowances provided on foreign tax credit carryforwards in 2017. The Act was enacted on December 22, 2017. The 2017 effective tax rate included a charge of 31.9% for non-deductible expenses recognized due to the Olapic acquisition and the acceleration of the contingent payments associated with the Swyft Media acquisition, compared to a charge of 7.0% in 2016. The 2017 effective tax rate included a charge of 16.4% for stock based compensation, as compared to a charge of 0.5% in 2016, primarily related to the change in accounting as a result of the adoption of ASU 2016-09, which requires that all tax effects of stock compensation be reflected as part of current period tax expense.
As of December 31, 2017, the total amount of unrecognized tax benefits was $7.1 million, as compared to a balance of $6.8 million in 2016, mainly due to increases as a result of positions taken in 2017. We classify potential interest and penalties as a component of tax expense. As of December 31, 2017 and 2016, we had $0.2 million and $0.2 million of accrued interest and penalties, respectively.
Year Ended December 31, 2016 as Compared to Year Ended December 31, 2015
The following table presents revenue for these two principal markets (in thousands):
| 2016 | 2015 | Increase/ (Decrease) |
||||||||||
| Creative Professional |
$ | 102,381 | $ | 88,074 | $ | 14,307 | ||||||
| OEM |
101,060 | 104,345 | (3,285 | ) | ||||||||
|
|
|
|
|
|
|
|||||||
| Total revenue |
$ | 203,441 | $ | 192,419 | $ | 11,022 | ||||||
|
|
|
|
|
|
|
|||||||
Revenue
Revenue was $203.4 million and $192.4 million for the years ended December 31, 2016 and 2015, respectively, an increase of $11.0 million, or 5.7%.
Creative Professional revenue increased $14.3 million, or 16.2%, to $102.4 million for the year ended December 31, 2016, as compared to $88.1 million for the year ended
54
Table of Contents
December 31, 2015, primarily due to increases in web font revenue, recurring license web server applications and revenue from Olapic. Recurring revenue increased as a result of the release of digital ad impressions revenue and revenue from Olapic, period over period.
OEM revenue was $101.1 million and $104.3 million for the years ended December 31, 2016 and 2015, respectively, a decrease of $3.2 million, or 3.1%, mainly due to a decrease in royalty revenue. Royalty revenue from our printer and independent software vendor customers decreased due to lower volume of printer shipments and timing of custom project revenue, respectively. This decrease was partially offset by increased revenue from our display imaging consumer electronic OEM customers as a result of higher volume.
Cost of Revenue
Cost of revenue, excluding amortization of acquired technology, was $32.9 million for the year ended December 31, 2016, as compared to $30.3 million for the year ended December 31, 2015, an increase of $2.6 million, or 8.7%. The increase in cost of revenue in the year ended December 31, 2016, is a result of a higher proportion of Creative Professional revenue in our mix of total revenue which typically has a higher associated cost than OEM, partially offset by lower costs associated with our Creative Professional revenue with enterprise customers, as compared to the same period in 2015.
The portion of cost of revenue consisting of amortization of acquired technology was $4.7 million and $4.4 million in the years ended December 31, 2016 and 2015, respectively, an increase of $0.3 million, or 5.0%, due to our acquisition of Olapic.
Gross Profit
Gross profit was 81.5% and 82.0% of revenue in the years ended December 31, 2016 and 2015, respectively. The decrease in gross profit in the year ended December 31, 2016, as compared to the same period in 2015, is a result of a higher proportion of Creative Professional revenue in our mix of total revenue which typically has a higher associated cost than OEM, partially offset by improved margins on our Creative Professional revenue with enterprise customers. Further, our Creative Professional revenue has grown both organically and from the acquisition of Olapic, while our OEM revenue has declined as described above. In 2016, Creative Professional revenue was 50.4% of total revenue, as compared to 45.8% of total revenue in 2015.
Operating Expenses
Marketing and Selling. Marketing and selling expense was $64.6 million and $57.3 million for the year ended December 31, 2016 and 2015, respectively, an increase of $7.3 million, or 12.7%, primarily due to personnel expenses. Personnel and personnel related expenses increased $7.8 million, mainly due to additional headcount from our acquisition of Olapic and other targeted hiring, additional compensation expense recognized on deferred compensation arrangements in connection with our acquisitions of Swyft and Olapic and restructuring actions. The increase was partially offset by a reduction in headcount due to a redeployment of certain employees at the beginning of 2016 to development related activities from our sales and marketing organization. Increased infrastructure expense due to increased headcount, contributed $0.7 million to the overall increase in marketing and selling expense, period over period. These increases were partially offset by a reduction in the use of outside consultants, resulting in a decrease of $1.1 million period over period.
55
Table of Contents
Research and Development. Research and development expense increased $7.4 million, or 34.6%, to $28.9 million for the year ended December 31, 2016, as compared to $21.5 million for the year ended December 31, 2015 primarily due to personnel expenses. Personnel and personnel related expenses increased $5.7 million, mainly due to additional headcount from our acquisition of Olapic and the redeployment of certain former marketing and selling employees at the beginning of 2016, as compared to the same period in 2015. Headcount increased 73.4% over the prior year. External consulting and related software development increased $0.8 million period over period. Higher facilities related expenses contributed $0.4 million to the increase in research and development in the year ended December 31, 2016, as compared to the same period in 2015, a result of our acquisition of Olapic.
General and Administrative. General and administrative expense increased $9.3 million, or 27.8%, to $42.6 million for the year ended December 31, 2016, as compared to $33.3 million for the year ended December 31, 2015, primarily due to personnel expenses. Personnel and personnel related expenses increased $9.5 million in the 2016, as compared to the same period in 2015, mainly due to additional headcount from targeted hiring and our acquisition of Olapic. In the year ended December 31, 2015, we recognized a $3.8 million expense for deferred compensation arrangement in connection with the Amendment to the Swyft Media Merger Agreement. There was no similar item in the year ended December 31, 2016. Higher infrastructure expenses, primarily increased depreciation and software maintenance, together contributed $1.6 million primarily due to a full year of expense associated with our new ERP system. Increased legal, audit and rent expense together contributed $2.0 million to the overall increase, primarily due to our acquisition of Olapic in 2016, as compared to 2015.
Amortization of Other Intangible Assets. Amortization of other intangible assets was $3.4 million and $3.1 million in 2016 and 2015, an increase $0.3 million, or 8.8%, respectively, primarily due to our acquisition of Olapic.
Interest Expense, Net
Interest expense, net of interest income, was $1.2 million and $0.9 million in 2016 and 2015, respectively, an increase of $0.3 million, or 33.5%. The increase in interest expense in 2016 was primarily due to borrowings under our revolving line of credit. Total debt outstanding at December 31, 2016 was $105.0 million, which was drawn on our revolving credit facility in connection with our acquisition of Olapic, Inc. on August 9, 2016. Prior to August 9, 2016, there was no debt outstanding. In the year ended December 31, 2015, interest expense consisted mainly of unused line fees in connection with our credit facility.
Loss on Extinguishment of Debt
Loss on extinguishment of debt was $0.1 million in the year ended December 31, 2015, which was incurred in connection with the refinancing of our Credit Facility in September 2015. There was no similar item in 2016.
Loss on Foreign Exchange
Loss on foreign exchange decreased $0.6 million, or 55.6%, to $0.4 million in 2016, as compared to $1.0 million in 2015. The loss in both periods was the result of currency fluctuations on our foreign denominated receivables and payables.
56
Table of Contents
Gain on Derivatives
Gain on derivatives was $0.5 million and $27 thousand in 2016 and 2015, respectively, the net result of changes in the market value of our currency derivative contracts.
Provision for Income Taxes
Our effective tax rate was 40.9% and 35.3% for the years ended December 31, 2016 and 2015, respectively. The 2016 effective tax rate included a charge of 7.0% for non-deductible expenses recognized due to the Olapic acquisition and the acceleration of the contingent payments associated with the Swyft Media acquisition, compared to a charge of 3.0% in 2015. The 2015 effective tax rate included a benefit of 3.2% for the reversal of reserves from the settlement of tax audits of our subsidiary in Japan and of our 2012 U.S. federal tax return, as well as the expiration of the statute of limitations on reserves related to the Company’s 2011 tax returns, as compared to a benefit of 0.2% for the reversal of reserves in the 2016 effective tax rate. The 2016 effective tax rate included a charge of 3.2% for state and local income taxes, net of federal benefit, as compared to a charge of 1.0% in 2015. The research tax credit was a benefit of 1.9% in 2016, as compared to a benefit of 0.9% in 2015.
As of December 31, 2016, the total amount of unrecognized tax benefits was $6.8 million, as compared to a balance of $5.5 million in 2015, mainly due to increases as a result of positions taken in 2016. We classify potential interest and penalties as a component of tax expense. As of December 31, 2016 and 2015 we had $0.2 million and $0.1 million of accrued interest and penalties, respectively.
Recently Issued Accounting Pronouncements
Information concerning recently issued accounting pronouncements may be found in Note 2 to our consolidated financial statements included in this Annual Report on Form 10-K.
Liquidity and Capital Resources
Cash Flows for the Years Ended December 31, 2017, 2016 and 2015
Since our inception, we have financed our operations primarily through cash from operations, private and public stock sales and long-term debt arrangements, as described below. We believe our existing cash and cash equivalents, our cash flow from operating activities and available bank borrowings will be sufficient to meet our anticipated cash needs for at least one year from the issuance of these financial statements. At December 31, 2017, our principal sources of liquidity were cash and cash equivalents totaling $82.8 million and a $150.0 million revolving credit facility, of which $93.0 million is outstanding related to the acquisition of Olapic. On August 30, 2016, our board of directors approved a $25.0 million share purchase program, which provides for purchases through December 31, 2017. For the years ended December 31, 2017 and 2016, we used $7.0 million and $5.6 million in cash to purchase shares under the plan, respectively. In the year ended December 31, 2015, we used $18.2 million in cash to purchase shares in connection with our share repurchase program approved in October 2013 and completed in June 2015, after reaching the maximum cumulative spend. We also used $0.4 million in cash to purchase shares in excess of our previously approved share purchase program in 2015. In the year ended December 31, 2017, we used $18.8 million in cash for our quarterly dividend. Olapic has, and will continue to operate at a net loss in the near term. Our future working capital requirements will depend on many factors, including the operations of our existing business, our potential strategic
57
Table of Contents
expansion, and future acquisitions we might undertake. In 2018, we anticipate a significant increase in payments to advisors associated with ongoing shareholder matters.
The following table presents our cash flows from operating activities, investing activities and financing activities for the periods presented (in thousands):
| Year Ended December 31, | ||||||||||||
| 2017 | 2016 | 2015 | ||||||||||
| Net cash provided by operating activities |
$ | 32,882 | $ | 40,739 | $ | 53,364 | ||||||
| Net cash used in investing activities |
(7,045 | ) | (120,803 | ) | (22,927 | ) | ||||||
| Net cash (used in) provided by financing activities |
(35,709 | ) | 85,244 | (32,552 | ) | |||||||
| Effect of exchange rates on cash and cash equivalents |
1,260 | (1,266 | ) | (690 | ) | |||||||
|
|
|
|
|
|
|
|||||||
| Total (decrease) increase in cash and cash equivalents |
$ | (8,612 | ) | $ | 3,914 | $ | (2,805 | ) | ||||
|
|
|
|
|
|
|
|||||||
Operating Activities
Variations in operating cash flows occur from time-to-time, because our enterprise customers make upfront payments on subscription revenue. These payments are required under the terms of our license agreements and can cause large fluctuations in accounts receivable and deferred revenue. The timing and extent of such payments may significantly impact our cash balances.
In 2017, we generated $32.9 million in cash from our operations. Net income after adjusting for depreciation and amortization, loss on retirement of fixed assets, amortization of deferred financing costs and accreted interest, stock based compensation, provision for doubtful accounts, deferred income taxes, and unrealized currency gain on foreign denominated intercompany generated $36.0 million in cash. Increases in accrued expenses and other liabilities, offset by increased prepaid expenses and decreased accounts payable, generated $4.9 million in cash mainly due to increased personnel in addition to the timing of payments. Accrued income taxes generated $1.3 million during 2017. Increased accounts receivable and decreased deferred revenue used $9.3 million in cash, which is mainly due to timing.
In 2016, we generated $40.7 million in cash from our operations. Net income after adjusting for depreciation and amortization, amortization of deferred financing costs and accreted interest, stock based compensation, excess tax benefit on stock options, provision for doubtful accounts, deferred income taxes, and unrealized currency gain on foreign denominated intercompany generated $46.1 million in cash. In connection with the Olapic acquisition, we used $9.0 million in cash to fund an escrow account to be used for the payments due in 2018 and 2019 under the Agreement. In addition, $0.4 million was generated from the release of funds from the Swyft Media escrow account. Increases in accounts payable, accrued expenses and other liabilities generated $12.1 million in cash mainly due to increased headcount in addition to the timing of payments. Accrued income taxes used $1.9 million during 2016. Increased accounts receivable and prepaid expenses, net of increased deferred revenue used $6.8 million in cash, which is mainly due to timing.
In 2015, we generated $53.4 million in cash from our operations. Net income after adjusting for depreciation and amortization, loss on retirement of fixed assets, loss on debt
58
Table of Contents
extinguishment, amortization of deferred financing costs and accreted interest, adjustment to contingent consideration, stock based compensation, excess tax benefit on stock options, provision for doubtful accounts, deferred income taxes, and unrealized currency (loss) gain on foreign denominated intercompany generated $58.5 million in cash. In connection with the Amendment to the Swyft Media Merger Agreement executed in November 2015, we used $6.2 million in cash to fund an escrow account to be used for the payments due in 2018 under the Agreement. As the balance may only be utilized for such payments, it has been classified as restricted cash in our balance sheet as of December 31, 2015 and included in operating and financing activities. Increases in accrued expenses and other liabilities, and accounts payable, combined with a decrease in prepaid expenses and other assets generated $2.0 million, which is mainly due to the timing of payments including a higher dividend accrual. Accrued income taxes generated $1.9 million during 2015. Increased accounts receivable and deferred revenue used $2.8 million in cash, which is mainly due to the timing of a couple large deals.
Investing Activities
During 2017, we used $7.0 million in investing activities for the purchase of property and equipment. During 2016, we used $120.8 million in investing activities for the purchase of $2.5 million of property and equipment and $118.3 million for acquisitions. During 2015, we used $22.9 million in investing activities for the purchase of $8.6 million of property and equipment and $14.3 million for acquisitions.
Financing Activities
Cash used in financing activities in 2017 was $35.7 million. We received cash from the exercises of stock options of $2.0 million. We paid cash dividends of $18.8 million, and paid $12.0 million on our outstanding revolving line of credit. We also purchased $7.0 million in treasury stock during 2017.
Cash provided by financing activities in 2016 was $85.2 million. Cash borrowed from our revolving Credit Facility for the acquisition of Olapic generated $110.0 million, of which we have since paid back $5.0 million. We received cash from exercises of stock options of $2.8 million and excess tax benefit on stock options provided $0.6 million. We paid shareholder dividends of $17.5 million and used $5.6 million to purchase treasury stock in 2016.
Cash used in financing activities in 2015 was $32.6 million. We received cash from exercises of stock options of $8.2 million and excess tax benefit on stock options provided $1.8 million. We paid shareholder dividends of $15.1 million, contingent consideration of $5.7 million, and used $18.6 million to purchase treasury stock in 2015. We used $3.1 million of restricted cash related to the Swyft Media founder-shareholder contingent consideration.
Dividends
Dividends are declared at the discretion of the Company’s Board of Directors and dependent on actual cash from operations, the Company’s financial condition and capital requirements and any other factors the Company’s Board of Directors may consider relevant. We anticipate this to be a recurring quarterly dividend with future payments and record dates subject to board approval. On October 26, 2017, the Board of Directors approved a $0.113 per share, quarterly cash dividend on our outstanding common stock. The record date was January 2, 2018 and the dividend was paid to shareholders on January 22, 2018. On February 14, 2018, our Board of Directors approved a $0.116 per share quarterly cash
59
Table of Contents
dividend on our outstanding common stock. The record date is set for April 2, 2018 and the dividend is payable to shareholders of record on April 20, 2018.
Credit Facility
On September 15, 2015, the Company entered into a new credit agreement (the “New Credit Agreement”) by and among the Company, the Company’s subsidiary, Monotype Imaging Inc., any financial institution that becomes a Lender (as defined therein) and Silicon Valley Bank, as agent which provides for a five-year $150.0 million secured revolving credit facility (the “Credit Facility”). The Credit Facility permits the Company to request that the Lenders, at their election, increase the secured credit facility to a maximum of $200.0 million. The Credit Facility is available to the Company on a revolving basis through September 15, 2020. Repayment of any amounts borrowed are not required until maturity of the Credit Facility. However, the Company may repay any amounts borrowed at any time, without premium or penalty. The Company had $93.0 million and $105.0 million outstanding under the Credit Facility at December 31, 2017 and 2016, respectively. Available borrowings under the Credit Facility have been reduced by approximately $0.5 million for one standby letter of credit issued in connection with a facility lease agreement, leaving $56.5 million and $44.5 million available for borrowings at December 31, 2017 and 2016, respectively.
Borrowings under the Credit Facility bear interest through September 15, 2020 at a variable rate not less than zero based upon, at the Company’s option, either LIBOR or the higher of (i) the prime rate as published in the Wall Street Journal, and (ii) 0.5% plus the overnight federal funds rate, plus in each case, an applicable margin. The applicable margin for LIBOR loans, based on the applicable leverage ratio, is 1.25%, 1.50% or 1.75% per annum, and the applicable margin for base rate loans, based on the applicable leverage ratio, is either 0.25%, 0.50% or 0.75%% per annum. At December 31, 2017 our rate, inclusive of applicable margins, was 3.1% for LIBOR. The Company is required to pay a commitment fee, based on the applicable leverage ratio, equal to 0.20%, 0.25% or 0.30% per annum on the undrawn portion available under the revolving credit facility and variable per annum fees in respect of outstanding letters of credit. In connection with the New Credit Agreement, the Company incurred closing and legal fees of approximately $1.0 million in 2015, which have been accounted for as deferred financing costs and will be amortized to interest expense over the term of the New Credit Agreement. In addition, $0.2 million of unamortized deferred financing costs associated with the pro-rata share of the prior loan syndicate lenders that did not participate in the new facility were written off and charged to other expense in the third quarter of 2015.
In addition to other covenants, the New Credit Agreement places limits on the Company and its subsidiaries’ ability to incur debt or liens and engage in sale-leaseback transactions, make loans and investments, incur additional indebtedness, engage in mergers, acquisitions and asset sales, transact with affiliates and alter its business. The New Credit Agreement also contains events of default, and affirmative covenants, including financial maintenance covenants which include (i) a maximum ratio of consolidated total debt to consolidated adjusted EBITDA of 3.00 to 1.00, and (ii) a minimum consolidated fixed charge coverage ratio of 1.25 to 1.00. Adjusted EBITDA, under the Credit Facility, is defined as consolidated net income (or loss), plus net interest expense, income taxes, depreciation and amortization, and stock based compensation expense, plus acquisition expenses not to exceed $2.0 million on a trailing twelve month basis, plus restructuring, issuance costs, cash non-operating costs and other expenses or losses minus cash non-operating gains and other non-cash gains; provided however that the aggregate of all cash non-operating expense shall not exceed $250 thousand
60
Table of Contents
and all such fees, costs and expenses shall not exceed $1.5 million on a trailing twelve months basis. As of December 31, 2017, the maximum leverage ratio permitted was 3.00:1.00 and our leverage ratio was 2.17:1.00 and the minimum fixed charge coverage ratio was 1.25:1.00 and our fixed charge ratio was 3.83:1.00. Failure to comply with these covenants, or the occurrence of an event of default, could permit the Lenders under the New Credit Agreement to declare all amounts borrowed under the New Credit Agreement, together with accrued interest and fees, to be immediately due and payable. In addition, the Credit Facility is secured by a lien on substantially all of the Company’s and its domestic subsidiaries’ tangible and intangible property by a pledge of all of the equity interests of the Company’s direct and indirect domestic subsidiaries and by a pledge by the Company’s domestic subsidiaries of 65% of the equity of their direct foreign subsidiaries, subject to limited exceptions.
The following table presents a reconciliation from net income, which is the most directly comparable GAAP operating performance measure, to EBITDA and from EBITDA to Adjusted EBITDA as defined in our credit facilities (in thousands):
| Year Ended December 31, | ||||||||||||
| 2017 | 2016 | 2015 | ||||||||||
| Net income |
$ | 11,560 | $ | 14,886 | $ | 26,197 | ||||||
| (Benefit) provision for income taxes |
(5,391 | ) | 10,313 | 14,278 | ||||||||
| Interest expense, net |
2,722 | 1,227 | 919 | |||||||||
| Depreciation and amortization |
12,397 | 12,279 | 10,819 | |||||||||
|
|
|
|
|
|
|
|||||||
| EBITDA |
$ | 21,288 | $ | 38,705 | $ | 52,213 | ||||||
| Stock based compensation |
20,120 | 17,271 | 13,583 | |||||||||
| Non-cash add backs |
— | — | 112 | |||||||||
| Restructuring, issuance and cash non-operating costs |
1,500 | 1,500 | 1,069 | |||||||||
| Acquisition expenses |
— | 1,125 | 339 | |||||||||
|
|
|
|
|
|
|
|||||||
| Adjusted EBITDA (1) |
$ | 42,908 | $ | 58,601 | $ | 67,316 | ||||||
|
|
|
|
|
|
|
|||||||
| (1) | Adjusted EBITDA is not a measure of operating performance under GAAP and should not be considered as an alternative or substitute for GAAP profitability measures such as income (loss) from operations and net income (loss). Adjusted EBITDA as an operating performance measure has material limitations since it excludes the statement of income impact of depreciation and amortization expense, interest expense, net, the provision (benefit) for income taxes and stock based compensation and therefore does not represent an accurate measure of profitability, particularly in situations where a company is highly leveraged or has a disadvantageous tax structure. We have significant intangible assets and amortization expense is a meaningful element in our financial statements and therefore its exclusion from Adjusted EBITDA is a material limitation. We have a significant amount of debt and we have had a significant amount of debt in the past and interest expense is a necessary element of our costs and therefore its exclusion from Adjusted EBITDA is a material limitation. We generally incur significant U.S. federal, state and foreign income taxes each year and the provision (benefit) for income taxes is a necessary element of our costs and therefore its exclusion from Adjusted EBITDA is a material limitation. Stock based compensation and the associated expense has a meaningful impact on our financial statements. Non-cash expenses, restructuring, issuance and cash non-operating expenses have a meaningful impact on our financial statements. Therefore, their exclusion from Adjusted EBITDA is a material limitation. As a result, Adjusted EBITDA should be evaluated in conjunction with net income (loss) for complete analysis of our profitability, as net income (loss) includes the financial statement impact of these items and is the most directly comparable GAAP operating |
61
Table of Contents
| performance measure to Adjusted EBITDA. As Adjusted EBITDA is not defined by GAAP, our definition of Adjusted EBITDA may differ from and therefore may not be comparable to similarly titled measures used by other companies, thereby limiting its usefulness as a comparative measure. Because of the limitations that Adjusted EBITDA has as an analytical tool, investors should not consider it in isolation, or as a substitute for analysis of our operating results as reported under GAAP. |
The Credit Facility also contains provisions for an increased interest rate during periods of default. We do not believe that these covenants will affect our ability to operate our business, and we were in compliance with the covenants under our Credit Facility as of December 31, 2017 and 2016.
Non-GAAP Measures
In addition to Adjusted EBITDA as discussed above, we rely internally on certain measures that are not calculated according to GAAP. This non-GAAP measure is net adjusted EBITDA, which is defined as income (loss) from operations before depreciation, amortization of acquired intangible assets and stock based compensation expenses. We use net adjusted EBITDA as a principal indicator of the operating performance of our business. We use net adjusted EBITDA in internal forecasts and models when establishing internal operating budgets, supplementing the financial results and forecasts reported to our board of directors, determining bonus compensation for our employees based on operating performance and evaluating short-term and long-term operating trends in our operations. We believe that net adjusted EBITDA permits a comparative assessment of our operating performance, relative to our performance based on our GAAP results, while isolating the effects of charges that may vary from period-to-period without direct correlation to underlying operating performance. We believe that these non-GAAP financial adjustments are useful to investors because they allow investors to evaluate the effectiveness of the methodology and information used by management in our financial and operational decision-making. We believe that trends in our net adjusted EBITDA may be valuable indicators of our operating performance.
The following table presents a reconciliation from net income, which is the most directly comparable GAAP operating financial measure, to net adjusted EBITDA as used by management (in thousands):
| Year Ended December 31, | ||||||||||||
| 2017 | 2016 | 2015 | ||||||||||
| Net income |
$ | 11,560 | $ | 14,886 | $ | 26,197 | ||||||
| Interest expense, net |
2,722 | 1,227 | 919 | |||||||||
| Other expense (income), net |
4,813 | (35 | ) | 1,050 | ||||||||
| (Benefit) provision for income taxes |
(5,391 | ) | 10,313 | 14,278 | ||||||||
|
|
|
|
|
|
|
|||||||
| Income from operations |
13,704 | 26,391 | 42,444 | |||||||||
| Depreciation and amortization |
12,397 | 12,279 | 10,819 | |||||||||
| Stock based compensation |
20,120 | 17,271 | 13,583 | |||||||||
| Acquisition-related compensation (1) |
5,739 | 3,869 | 4,164 | |||||||||
|
|
|
|
|
|
|
|||||||
| Net adjusted EBITDA (2) |
$ | 51,960 | $ | 59,810 | $ | 71,010 | ||||||
|
|
|
|
|
|
|
|||||||
| (1) | The 2017 amount includes $2.2 million of expense associated with the deferred compensation arrangement resulting from the Amendment to the Swyft Merger Agreement and $3.5 million of expense associated with deferred compensation from the Olapic acquisition. The 2016 amount includes $2.5 million of expense associated with |
62
Table of Contents
| the deferred compensation arrangement resulting from the Amendment to the Swyft Merger Agreement and $1.4 million of expense associated with deferred compensation from the Olapic acquisition. The 2015 amount includes $0.4 million of expense associated with the deferred compensation arrangement resulting from the Amendment to the Swyft Merger Agreement. |
| (2) | Net adjusted EBITDA is not a measure of operating performance under GAAP and should not be considered as an alternative or substitute for GAAP profitability measures such as income (loss) from operations and net income (loss). Net adjusted EBITDA as an operating performance measure has material limitations since it excludes the statement of income impact of depreciation and amortization expense, stock based compensation and acquisition-related consideration and therefore does not represent an accurate measure of profitability. We have significant intangible assets and amortization expense is a meaningful element in our financial statements and therefore its exclusion from net adjusted EBITDA is a material limitation. Stock based compensation and the associated expense has a meaningful impact on our financial statements and therefore its exclusion from net adjusted EBITDA is a material limitation. Acquisition-related consideration and its associated income or (expense) has a meaningful impact on our financial statements therefore its exclusion from net adjusted EBITDA is a material limitation. As a result, net adjusted EBITDA should be evaluated in conjunction with income (loss) from operations for complete analysis of our profitability, as income (loss) from operations includes the financial statement impact of these items and is the most directly comparable GAAP operating performance measure to net adjusted EBITDA. As net adjusted EBITDA is not defined by GAAP, our definition of net adjusted EBITDA may differ from and therefore may not be comparable to similarly titled measures used by other companies, thereby limiting its usefulness as a comparative measure. Because of the limitations that net adjusted EBITDA has as an analytical tool, investors should not consider it in isolation, or as a substitute for analysis of our operating results as reported under GAAP. |
In our quarterly earnings press releases and conference calls, in addition to Adjusted EBITDA and net adjusted EBITDA as discussed above, we discuss a key measure that is not calculated according to GAAP. This non-GAAP measure is non-GAAP earnings per diluted share, which is defined as earnings per diluted share before amortization of acquired intangible assets and stock based compensation expenses. We use non-GAAP earnings per diluted share as one of our principal indicators of the operating performance of our business. We use non-GAAP earnings per diluted share in internal forecasts, supplementing the financial results and forecasts reported to our board of directors and evaluating short-term and long-term operating trends in our operations. We believe that non-GAAP earnings per diluted share permits a comparative assessment of our operating performance, relative to our performance based on our GAAP results, while isolating the effects of charges that may vary from period-to-period without direct correlation to underlying operating performance. We believe that these non-GAAP financial adjustments are useful to investors because they allow investors to evaluate the effectiveness of the methodology and information used by management in our financial and operational decision-making. We believe that trends in our non-GAAP earnings per diluted share may be valuable indicators of our operating performance.
63
Table of Contents
The following table presents a reconciliation from earnings per diluted share, which is the most directly comparable GAAP measure, to non-GAAP earnings per diluted share as used by management:
| Year Ended December 31, | ||||||||||||
| 2017 | 2016 | 2015 | ||||||||||
| GAAP net income per diluted share |
$ | 0.27 | $ | 0.36 | $ | 0.65 | ||||||
| Amortization, net of tax of $0.07, $0.08 and $0.07, respectively |
0.12 | 0.12 | 0.13 | |||||||||
| Stock based compensation, net of tax of $0.15, $0.18 and $0.12, respectively |
0.36 | 0.27 | 0.23 | |||||||||
| Acquisition-related compensation, net of tax of $0.00, $0.00 and $0.00, respectively (1) |
0.14 | 0.10 | 0.11 | |||||||||
|
|
|
|
|
|
|
|||||||
| Non-GAAP earnings per diluted share (2) |
$ | 0.89 | $ | 0.85 | $ | 1.12 | ||||||
|
|
|
|
|
|
|
|||||||
| (1) | The 2017 amount includes $2.2 million, or $0.05 per share, of expense associated with the deferred compensation arrangement resulting from the Amendment to the Swyft Merger Agreement and $3.5 million, or $0.09 per share, of expense associated with deferred compensation from the Olapic acquisition. The 2016 amount includes $2.5 million, or $0.06 per share, of expense associated with the deferred compensation arrangement resulting from the Amendment to the Swyft Merger Agreement and $1.4 million, or $0.04 per share, of expense associated with deferred compensation from the Olapic acquisition. The 2015 amount includes $0.4 million, or $0.11 per share, of expense associated with the deferred compensation arrangement resulting from the Amendment to the Swyft Merger Agreement. |
| (2) | Non-GAAP earnings per diluted share is not a measure of operating performance under GAAP and should not be considered as an alternative or substitute for GAAP profitability measures such as earnings per share and earnings per diluted share. Non-GAAP earnings per diluted share as an operating performance measure has material limitations since it excludes the statement of income impact of amortization expense and stock based compensation, and therefore, does not represent an accurate measure of profitability. We have significant intangible assets and amortization expense is a meaningful element in our financial statements and therefore its exclusion from non-GAAP earnings per diluted share is a material limitation. Stock based compensation and the associated expense has a meaningful impact on our financial statements and therefore its exclusion from non-GAAP diluted earnings per share is a material limitation. As a result, non-GAAP earnings per diluted share should be evaluated in conjunction with earnings per diluted share for complete analysis of our profitability, as earnings per diluted share includes the financial statement impact of these items and is the most directly comparable GAAP operating performance measure to non-GAAP earnings per diluted share. As non-GAAP earnings per diluted share is not defined by GAAP, our definition of non-GAAP earnings per diluted share may differ from and therefore may not be comparable to similarly titled measures used by other companies, thereby limiting its usefulness as a comparative measure. Because of the limitations that non-GAAP earnings per share has as an analytical tool, investors should not consider it in isolation, or as a substitute for analysis of our operating results as reported under GAAP. |
64
Table of Contents
Other Liquidity Matters
Contractual Obligations
The following summarizes our contractual obligations at December 31, 2017 and the effect of such obligations on liquidity and cash flow in future years (in thousands):
| Contractual Obligations |
Total | 2018 | 2019-2020 | 2021-2022 | Thereafter | |||||||||||||||
| Operating leases(1) |
$ | 20,432 | $ | 4,899 | $ | 6,773 | $ | 5,505 | $ | 3,255 | ||||||||||
| (1) | See Note 15 to the audited consolidated financial statements regarding contractual obligations included in this Annual Report on Form 10-K under Item 8. |
We may be required to make cash outlays related to our unrecognized tax benefits. However, due to the uncertainty of the timing of future cash flows associated with our unrecognized tax benefits, we are unable to make reasonably reliable estimates of the period of cash settlement, if any, with the respective taxing authorities. Accordingly, unrecognized tax benefits of $7.1 million as of December 31, 2017 have been excluded from the contractual obligations table above. For further information on unrecognized tax benefits, see Note 11 to our consolidated financial statements included in this Annual Report on Form 10-K under Item 8.
In addition to the above, we have a pension obligation under the German defined benefit pension plan. The total projected benefit obligation is $6.3 million and details regarding this plan are located in Note 10 to our consolidated financial statement included in this Annual Report on Form 10-K under Item 8.
Legal proceedings and disputes
Details on recent legal matters can be found in Notes 15 and 17 to our consolidated financial statements included in this Annual Report on Form 10-K under Item 8.
Off-Balance Sheet Arrangements
As of December 31, 2017 and 2016, we did not have any material relationships with unconsolidated entities, often referred to as special purpose entities, which would have been established for the purpose of facilitating off-balance sheet arrangements or other contractually narrow or limited purposes. Other than our operating leases for office space and computer equipment, and derivative financial instruments discussed in “Quantitative and Qualitative Disclosures about Market Risk,” we do not engage in off-balance sheet financing arrangements.
| Item 7A. | Quantitative and Qualitative Disclosures about Market Risk |
We are exposed to financial market risk, including interest rate risk and foreign currency exchange risk.
Concentration of Revenue and Credit Risk
Financial instruments that potentially subject us to concentrations of credit risk consist principally of cash and cash equivalents and trade receivables. Cash equivalents consist primarily of bank deposits and certain investments, such as commercial paper, corporate bonds and municipal securities, with maturities less than 90 days at the date of purchase. Deposits of cash held outside the United States totaled approximately $24.3 million and $16.4 million at December 31, 2017 and 2016, respectively.
65
Table of Contents
We grant credit to customers in the ordinary course of business. Credit evaluations are performed on an ongoing basis to reduce credit risk, and no collateral is required from our customers. An allowance for uncollectible accounts is provided for those accounts receivable considered to be uncollectible based upon historical experience and credit evaluation. As of December 31, 2017 and 2016, there were no customers that individually accounted for 10% or more of our gross accounts receivable. Due to the nature of our quarterly revenue streams derived from royalty revenue, it is not unusual for our accounts receivable balances to include a few customers with large balances. Historically, we have not recorded material losses due to customers’ nonpayment. Our Creative Professional business consists of a higher volume of lower dollar value transactions. Accordingly, as the percent of Creative Professional revenue increases in relation to total revenue, we expect the average time to collect our accounts receivables, and our overall accounts receivables balances, to increase.
For the years ended December 31, 2017, 2016 and 2015, no customer accounted for more than 10% of our total revenue. For the quarters ended December 2017, 2016 and 2015, no customer individually accounted for more than 10% of our total revenue.
Interest Rate Risk
Our exposure to market risk associated with changes in interest rates relates primarily to our long-term debt. At December 31, 2017 and 2016, the Company had borrowings under our revolving Credit Facility of $93.0 million and $105.0 million, respectively. The interest rate on our Credit Facility fluctuates with either the prime rate or the LIBOR interest rate and at December 31, 2017 our rate was 3.1% for LIBOR. A 10% increase in the rate would have increased our interest expense by $0.3 million.
Foreign Currency Exchange Rate Risk
In accordance with ASC Topic No. 830, Foreign Currency Matters, or ASC 830, all assets and liabilities of our foreign subsidiaries whose functional currency is a currency other than U.S. dollars are translated into U.S. dollars at an exchange rate as of the balance sheet date or historical rates, as appropriate. Revenue and expenses of these subsidiaries are translated at the average monthly exchange rates. The resulting translation adjustments as calculated from the translation of the foreign subsidiaries to U.S. dollars are recorded as a separate component of comprehensive income. For the years ended December 31, 2017, 2016 and 2015, sales by our subsidiaries located outside North America, primarily EMEA and Japan, comprised 56.9%, 58.3% and 45.5%, respectively, of our total revenue. An effect of a 10% weakening of the British pound sterling, the Euro, Japanese yen and Argentine peso, relative to the U.S. dollar, would have decreased our revenues by $9.5 million, decreased expenses by $10.6 million and increased operating income by $1.1 million for the year ended December 31, 2017. The sensitivity analysis assumes that all currencies move in the same direction at the same time and the ratio of non-U.S. dollar denominated revenue and expenses to U.S. dollar denominated revenue and expenses does not change from current levels.
We also incur foreign currency exchange gains and losses related to certain customers that are invoiced in U.S. dollars, but who have the option to make an equivalent payment in their own functional currencies at a specified exchange rate as of a specified date. In the period from that date until payment in the customer’s functional currency is received and converted into U.S. dollars, we can incur realized gains and losses. We also incur foreign currency exchange gains and losses on certain intercompany assets and liabilities denominated in foreign currencies. We are currently utilizing 30-day forward contracts to
66
Table of Contents
mitigate our exposure on these currency fluctuations. Any increase or decrease in the fair value of the forward contracts is offset by the change in the value of the hedged assets of our consolidated foreign affiliate. At December 31, 2017, we had one 30-day forward contract to sell 2.5 million British pound sterling and to purchase $3.4 million that together had an immaterial fair value. At December 31, 2016, we had one 30-day forward contract to sell 2.8 million British pound sterling and to purchase $3.4 million that together had an immaterial fair value. There were no outstanding forward contracts at December 31, 2015.
67
Table of Contents
| Item 8. | Financial Statements and Supplementary Data |
MONOTYPE IMAGING HOLDINGS INC.
INDEX TO CONSOLIDATED FINANCIAL STATEMENTS
68
Table of Contents
REPORT OF INDEPENDENT REGISTERED PUBLIC ACCOUNTING FIRM
The Board of Directors and Stockholders of
Monotype Imaging Holdings Inc.
Opinion on the Financial Statements
We have audited the accompanying consolidated balance sheets of Monotype Imaging Holdings Inc. (the Company) as of December 31, 2017 and 2016, the related consolidated statements of income, comprehensive income, stockholders’ equity and cash flows for each of the three years in the period ended December 31, 2017, and the related notes and the financial statement schedule listed in the Index at Item 15(a) (collectively referred to as the “consolidated financial statements”). In our opinion, the consolidated financial statements present fairly, in all material respects, the financial position of the Company at December 31, 2017 and 2016, and the results of its operations and its cash flows for each of the three years in the period ended December 31, 2017, in conformity with U.S. generally accepted accounting principles.
We also have audited, in accordance with the standards of the Public Company Accounting Oversight Board (United States) (PCAOB), the Company’s internal control over financial reporting as of December 31, 2017, based on criteria established in Internal Control-Integrated Framework issued by the Committee of Sponsoring Organizations of the Treadway Commission (2013 framework), and our report dated February 27, 2018 expressed an unqualified opinion thereon.
Basis for Opinion
These financial statements are the responsibility of the Company’s management. Our responsibility is to express an opinion on the Company’s financial statements based on our audits. We are a public accounting firm registered with the PCAOB and are required to be independent with respect to the Company in accordance with the U.S. federal securities laws and the applicable rules and regulations of the Securities and Exchange Commission and the PCAOB.
We conducted our audits in accordance with the standards of the PCAOB. Those standards require that we plan and perform the audit to obtain reasonable assurance about whether the financial statements are free of material misstatement, whether due to error or fraud. Our audits included performing procedures to assess the risks of material misstatement of the financial statements, whether due to error or fraud, and performing procedures that respond to those risks. Such procedures included examining, on a test basis, evidence regarding the amounts and disclosures in the financial statements. Our audits also included evaluating the accounting principles used and significant estimates made by management, as well as evaluating the overall presentation of the financial statements. We believe that our audits provide a reasonable basis for our opinion.
/s/ Ernst & Young LLP
We have served as the Company’s auditor since 2005.
Boston, Massachusetts
February 27, 2018
69
Table of Contents
MONOTYPE IMAGING HOLDINGS INC.
CONSOLIDATED BALANCE SHEETS
(in thousands, except share and per share data)
| December 31, | ||||||||
| 2017 | 2016 | |||||||
| ASSETS |
||||||||
| Current assets: |
||||||||
| Cash and cash equivalents |
$ | 82,822 | $ | 91,434 | ||||
| Restricted cash |
11,987 | — | ||||||
| Accounts receivable, net of allowance for doubtful accounts of $634 and $467 at December 31, 2017 and 2016, respectively |
34,461 | 26,549 | ||||||
| Income tax refunds receivable |
1,204 | 2,967 | ||||||
| Prepaid expenses and other current assets |
5,714 | 4,631 | ||||||
|
|
|
|
|
|||||
| Total current assets |
136,188 | 125,581 | ||||||
| Property and equipment, net |
16,763 | 14,166 | ||||||
| Goodwill |
279,131 | 273,489 | ||||||
| Intangible assets, net |
84,856 | 90,717 | ||||||
| Restricted cash |
6,000 | 17,992 | ||||||
| Other assets |
3,112 | 3,075 | ||||||
|
|
|
|
|
|||||
| Total assets |
$ | 526,050 | $ | 525,020 | ||||
|
|
|
|
|
|||||
| LIABILITIES AND STOCKHOLDERS’ EQUITY |
||||||||
| Current liabilities: |
||||||||
| Accounts payable |
$ | 1,467 | $ | 2,170 | ||||
| Accrued expenses and other current liabilities |
43,096 | 28,762 | ||||||
| Accrued income taxes payable |
522 | 1,473 | ||||||
| Deferred revenue |
15,102 | 16,081 | ||||||
|
|
|
|
|
|||||
| Total current liabilities |
60,187 | 48,486 | ||||||
| Revolving line of credit |
93,000 | 105,000 | ||||||
| Other long-term liabilities |
6,428 | 11,753 | ||||||
| Deferred income taxes |
28,004 | 37,780 | ||||||
| Reserve for income taxes |
2,783 | 2,727 | ||||||
| Accrued pension benefits |
6,280 | 5,296 | ||||||
| Commitments and contingencies (Note 15) |
||||||||
| Stockholders’ equity: |
||||||||
| Preferred stock, $0.001 par value, Authorized shares: 10,000,000; Issued and outstanding: none |
— | — | ||||||
| Common stock, $0.001 par value; Authorized shares: 250,000,000; Shares issued: 44,934,364 at December 31, 2017 and 43,771,600 at December 31, 2016 |
44 | 43 | ||||||
| Additional paid-in capital |
298,113 | 274,946 | ||||||
| Treasury stock, at cost, 3,215,644 shares at December 31, 2017 and 2,493,174 shares at December 31, 2016 |
(64,083 | ) | (56,232 | ) | ||||
| Retained earnings |
97,815 | 105,718 | ||||||
| Accumulated other comprehensive loss |
(2,521 | ) | (10,497 | ) | ||||
|
|
|
|
|
|||||
| Total stockholders’ equity |
329,368 | 313,978 | ||||||
|
|
|
|
|
|||||
| Total liabilities and stockholders’ equity |
$ | 526,050 | $ | 525,020 | ||||
|
|
|
|
|
|||||
The accompanying notes are an integral part of these consolidated financial statements.
70
Table of Contents
MONOTYPE IMAGING HOLDINGS INC.
CONSOLIDATED STATEMENTS OF INCOME
(in thousands, except share and per share data)
| Year Ended December 31, | ||||||||||||
| 2017 | 2016 | 2015 | ||||||||||
| Revenue |
$ | 235,789 | $ | 203,441 | $ | 192,419 | ||||||
| Cost of revenue |
38,761 | 32,904 | 30,281 | |||||||||
| Cost of revenue—amortization of acquired technology |
3,529 | 4,672 | 4,448 | |||||||||
|
|
|
|
|
|
|
|||||||
| Total cost of revenue |
42,290 | 37,576 | 34,729 | |||||||||
|
|
|
|
|
|
|
|||||||
| Gross profit |
193,499 | 165,865 | 157,690 | |||||||||
| Operating expenses: |
||||||||||||
| Marketing and selling |
91,508 | 64,571 | 57,297 | |||||||||
| Research and development |
37,663 | 28,915 | 21,477 | |||||||||
| General and administrative |
46,557 | 42,595 | 33,343 | |||||||||
| Amortization of other intangible assets |
4,067 | 3,393 | 3,129 | |||||||||
|
|
|
|
|
|
|
|||||||
| Total operating expenses |
179,795 | 139,474 | 115,246 | |||||||||
|
|
|
|
|
|
|
|||||||
| Income from operations |
13,704 | 26,391 | 42,444 | |||||||||
| Other (income) expense: |
||||||||||||
| Interest expense |
3,183 | 1,470 | 963 | |||||||||
| Interest income |
(461 | ) | (243 | ) | (44 | ) | ||||||
| Loss on extinguishment of debt |
— | — | 112 | |||||||||
| Loss on foreign exchange |
4,765 | 437 | 987 | |||||||||
| Loss (gain) on derivatives |
338 | (455 | ) | (27 | ) | |||||||
| Other income, net |
(290 | ) | (17 | ) | (22 | ) | ||||||
|
|
|
|
|
|
|
|||||||
| Total other expense |
7,535 | 1,192 | 1,969 | |||||||||
|
|
|
|
|
|
|
|||||||
| Income before income taxes |
6,169 | 25,199 | 40,475 | |||||||||
| (Benefit from) provision for income taxes |
(5,391 | ) | 10,313 | 14,278 | ||||||||
|
|
|
|
|
|
|
|||||||
| Net income |
$ | 11,560 | $ | 14,886 | $ | 26,197 | ||||||
|
|
|
|
|
|
|
|||||||
| Net income available to common stockholders—basic |
$ | 10,615 | $ | 14,395 | $ | 25,575 | ||||||
|
|
|
|
|
|
|
|||||||
| Net income available to common stockholders—diluted |
$ | 10,615 | $ | 14,394 | $ | 25,579 | ||||||
|
|
|
|
|
|
|
|||||||
| Net income per common share: |
||||||||||||
| Basic |
$ | 0.27 | $ | 0.37 | $ | 0.66 | ||||||
|
|
|
|
|
|
|
|||||||
| Diluted |
$ | 0.27 | $ | 0.36 | $ | 0.65 | ||||||
|
|
|
|
|
|
|
|||||||
| Weighted-average number of shares outstanding—basic |
39,619,133 | 39,405,700 | 38,840,094 | |||||||||
| Weighted-average number of shares outstanding—diluted |
39,858,248 | 39,731,923 | 39,382,566 | |||||||||
| Dividends declared per common share |
$ | 0.449 | $ | 0.440 | $ | 0.400 | ||||||
|
|
|
|
|
|
|
|||||||
The accompanying notes are an integral part of these consolidated financial statements.
71
Table of Contents
MONOTYPE IMAGING HOLDINGS INC.
CONSOLIDATED STATEMENTS OF COMPREHENSIVE INCOME
(in thousands)
| Year Ended December 31, | ||||||||||||
| 2017 | 2016 | 2015 | ||||||||||
| Net income |
$ | 11,560 | $ | 14,886 | $ | 26,197 | ||||||
| Other comprehensive income, net of tax: |
||||||||||||
| Unrecognized actuarial (loss) gain, net of tax of ($0), ($160) and $111, respectively |
— | (278 | ) | 268 | ||||||||
| Foreign currency translation adjustments, net of tax of $3,677, ($1,154) and ($2,016), respectively |
7,976 | (2,691 | ) | (3,622 | ) | |||||||
|
|
|
|
|
|
|
|||||||
| Comprehensive income |
$ | 19,536 | $ | 11,917 | $ | 22,843 | ||||||
|
|
|
|
|
|
|
|||||||
The accompanying notes are an integral part of these consolidated financial statements.
72
Table of Contents
MONOTYPE IMAGING HOLDINGS INC.
CONSOLIDATED STATEMENTS OF STOCKHOLDERS’ EQUITY
(in thousands, except share and per share data)
| Common Stock | Treasury Stock | Additional Paid-In Capital |
Retained Earnings |
Accumulated Other Comprehensive Income (Loss) |
Total Stock- holders’ Equity |
|||||||||||||||||||||||||||
| Shares | Amount | Shares | Amount | |||||||||||||||||||||||||||||
| Balance, December 31, 2014 |
40,770,197 | $ | 39 | 1,303,737 | $ | (31,946 | ) | $ | 232,522 | $ | 98,672 | $ | (4,174 | ) | $ | 295,113 | ||||||||||||||||
| Net income |
26,197 | 26,197 | ||||||||||||||||||||||||||||||
| Issuance of capital shares |
||||||||||||||||||||||||||||||||
| —restricted share grants |
609,975 | 1 | — | 1 | ||||||||||||||||||||||||||||
| —exercised options |
632,871 | 2 | 8,171 | 8,173 | ||||||||||||||||||||||||||||
| —restricted units converted |
6,603 | — | — | — | ||||||||||||||||||||||||||||
| Repurchase of unvested shares of restricted common stock |
— | 38,589 | — | — | ||||||||||||||||||||||||||||
| Purchase of treasury shares |
— | 657,028 | (18,509 | ) | (18,509 | ) | ||||||||||||||||||||||||||
| Stock based compensation |
13,665 | 13,665 | ||||||||||||||||||||||||||||||
| Tax benefit associated with options |
1,857 | 1,857 | ||||||||||||||||||||||||||||||
| Dividends declared |
(15,961 | ) | (15,961 | ) | ||||||||||||||||||||||||||||
| Unrecognized actuarial loss, net of tax |
268 | 268 | ||||||||||||||||||||||||||||||
| Cumulative translation adjustment, net of tax |
(3,622 | ) | (3,622 | ) | ||||||||||||||||||||||||||||
|
|
|
|
|
|
|
|
|
|
|
|
|
|
|
|
|
|||||||||||||||||
| Balance, December 31, 2015 |
42,019,646 | $ | 42 | 1,999,354 | $ | (50,455 | ) | $ | 256,215 | $ | 108,908 | $ | (7,528 | ) | $ | 307,182 | ||||||||||||||||
| Net income |
14,886 | 14,886 | ||||||||||||||||||||||||||||||
| Issuance of capital shares |
||||||||||||||||||||||||||||||||
| —restricted share grants |
1,453,452 | 1 | (1 | ) | — | |||||||||||||||||||||||||||
| —exercised options |
265,346 | — | 2,820 | 2,820 | ||||||||||||||||||||||||||||
| —restricted units converted |
33,156 | — | — | — | ||||||||||||||||||||||||||||
| Repurchase of unvested shares of restricted common stock |
— | 203,083 | — | — | ||||||||||||||||||||||||||||
| Purchase of treasury shares |
— | 287,250 | (5,705 | ) | (5,705 | ) | ||||||||||||||||||||||||||
| Shares withheld |
3,487 | (72 | ) | (72 | ) | |||||||||||||||||||||||||||
| Stock based compensation |
17,271 | 17,271 | ||||||||||||||||||||||||||||||
| Tax associated with options |
(140 | ) | (140 | ) | ||||||||||||||||||||||||||||
| Tax associated with restricted stock |
(1,219 | ) | (1,219 | ) | ||||||||||||||||||||||||||||
| Dividends declared |
(18,076) |
(18,076 | ) | |||||||||||||||||||||||||||||
| Unrecognized actuarial loss, net of tax |
(278 | ) | (278 | ) | ||||||||||||||||||||||||||||
| Cumulative translation adjustment, net of tax |
(2,691 | ) | (2,691 | ) | ||||||||||||||||||||||||||||
|
|
|
|
|
|
|
|
|
|
|
|
|
|
|
|
|
|||||||||||||||||
| Balance, December 31, 2016 |
43,771,600 | $ | 43 | 2,493,174 | $ | (56,232 | ) | $ | 274,946 | $ | 105,718 | $ | (10,497 | ) | $ | 313,978 | ||||||||||||||||
73
Table of Contents
MONOTYPE IMAGING HOLDINGS INC.
CONSOLIDATED STATEMENTS OF STOCKHOLDERS’ EQUITY – (Continued)
(in thousands, except share and per share data)
| Common Stock | Treasury Stock | Additional Paid-In Capital |
Retained Earnings |
Accumulated Other Comprehensive Income (Loss) |
Total Stock- holders’ Equity |
|||||||||||||||||||||||||||
| Shares | Amount | Shares | Amount | |||||||||||||||||||||||||||||
| Balance, December 31, 2016 |
43,771,600 | $ | 43 | 2,493,174 | $ | (56,232 | ) | $ | 274,946 | $ | 105,718 | $ | (10,497 | ) | $ | 313,978 | ||||||||||||||||
| Net income |
11,560 | 11,560 | ||||||||||||||||||||||||||||||
| Issuance of capital shares |
||||||||||||||||||||||||||||||||
| —restricted share grants |
925,651 | 1 | (1 | ) | — | |||||||||||||||||||||||||||
| —exercised options |
189,220 | — | 2,028 | 2,028 | ||||||||||||||||||||||||||||
| —restricted units converted |
47,893 | — | — | — | ||||||||||||||||||||||||||||
| Repurchase of unvested shares of restricted common stock |
— | 310,315 | — | — | ||||||||||||||||||||||||||||
| Purchase of treasury shares |
— | 364,989 | (6,890 | ) | (6,890 | ) | ||||||||||||||||||||||||||
| Shares withheld |
47,166 | (961 | ) | (961 | ) | |||||||||||||||||||||||||||
| Cumulative effect of adoption ASC 718 |
872 | (571 | ) | 301 | ||||||||||||||||||||||||||||
| Stock based compensation |
20,268 | 20,268 | ||||||||||||||||||||||||||||||
| Dividends declared |
(18,892 | ) | (18,892 | ) | ||||||||||||||||||||||||||||
| Unrecognized actuarial loss, net of tax |
— | — | ||||||||||||||||||||||||||||||
| Cumulative translation adjustment, net of tax |
7,976 | 7,976 | ||||||||||||||||||||||||||||||
|
|
|
|
|
|
|
|
|
|
|
|
|
|
|
|
|
|||||||||||||||||
| Balance, December 31, 2017 |
44,934,364 | $ | 44 | 3,215,644 | $ | (64,083 | ) | $ | 298,113 | $ | 97,815 | $ | (2,521 | ) | $ | 329,368 | ||||||||||||||||
|
|
|
|
|
|
|
|
|
|
|
|
|
|
|
|
|
|||||||||||||||||
The accompanying notes are an integral part of these consolidated financial statements.
74
Table of Contents
MONOTYPE IMAGING HOLDINGS INC.
CONSOLIDATED STATEMENTS OF CASH FLOWS
(in thousands)
| Year Ended December 31, | ||||||||||||
| 2017 | 2016 | 2015 | ||||||||||
| Cash flows from operating activities: |
||||||||||||
| Net income |
$ | 11,560 | $ | 14,886 | $ | 26,197 | ||||||
| Adjustments to reconcile net income to net cash provided by operating activities: |
||||||||||||
| Depreciation and amortization |
12,397 | 12,279 | 10,819 | |||||||||
| Loss on retirement of fixed assets |
337 | — | 20 | |||||||||
| Loss on extinguishment of debt |
— | — | 112 | |||||||||
| Amortization of deferred financing costs and accreted interest |
220 | 220 | 431 | |||||||||
| Adjustment to contingent consideration |
— | — | 3,610 | |||||||||
| Stock based compensation |
20,120 | 17,271 | 13,583 | |||||||||
| Excess tax benefit on stock options |
— | (570 | ) | (1,857 | ) | |||||||
| Provision for doubtful accounts |
928 | 478 | 194 | |||||||||
| Deferred income taxes |
(13,457 | ) | 2,013 | 5,702 | ||||||||
| Unrealized currency (gain) loss on foreign denominated intercompany transactions |
3,881 | (499 | ) | (370 | ) | |||||||
| Changes in operating assets and liabilities, net of effect of acquisitions: |
||||||||||||
| Accounts receivable |
(8,097 | ) | (4,473 | ) | (6,322 | ) | ||||||
| Prepaid expenses and other assets |
(1,770 | ) | (2,932 | ) | 852 | |||||||
| Restricted cash |
6 | (8,688 | ) | (6,170 | ) | |||||||
| Accounts payable |
(740 | ) | 800 | 281 | ||||||||
| Accrued income taxes payable |
1,264 | (1,897 | ) | 1,929 | ||||||||
| Accrued expenses and other liabilities |
7,414 | 11,263 | 815 | |||||||||
| Deferred revenue |
(1,181 | ) | 588 | 3,538 | ||||||||
|
|
|
|
|
|
|
|||||||
| Net cash provided by operating activities |
32,882 | 40,739 | 53,364 | |||||||||
| Cash flows from investing activities: |
||||||||||||
| Purchases of property and equipment |
(6,991 | ) | (2,501 | ) | (8,637 | ) | ||||||
| Purchase of intangible asset |
(54 | ) | — | – | ||||||||
| Acquisition of businesses, net of cash acquired |
— | (118,302 | ) | (14,290 | ) | |||||||
|
|
|
|
|
|
|
|||||||
| Net cash used in investing activities |
(7,045 | ) | (120,803 | ) | (22,927 | ) | ||||||
| Cash flows from financing activities: |
||||||||||||
| Proceeds from revolving line of credit |
— | 110,000 | — | |||||||||
| Payments on revolving line of credit |
(12,000 | ) | (5,000 | ) | — | |||||||
| Payment of contingent consideration |
— | — | (5,731 | ) | ||||||||
| Restricted cash |
— | — | (3,134 | ) | ||||||||
| Common stock dividend paid |
(18,751 | ) | (17,536 | ) | (15,116 | ) | ||||||
| Purchase of treasury stock |
(6,985 | ) | (5,610 | ) | (18,601 | ) | ||||||
| Excess tax benefit of stock options |
— | 570 | 1,857 | |||||||||
| Proceeds from exercise of common stock options |
2,028 | 2,820 | 8,173 | |||||||||
|
|
|
|
|
|
|
|||||||
| Net cash (used in) provided by financing activities |
(35,708 | ) | 85,244 | (32,552 | ) | |||||||
| Effect of exchange rates on cash and cash equivalents |
1,259 | (1,266 | ) | (690 | ) | |||||||
|
|
|
|
|
|
|
|||||||
| (Decrease) increase in cash and cash equivalents |
(8,612 | ) | 3,914 | (2,805 | ) | |||||||
| Cash and cash equivalents, beginning of year |
91,434 | 87,520 | 90,325 | |||||||||
|
|
|
|
|
|
|
|||||||
| Cash and cash equivalents, end of year |
$ | 82,822 | $ | 91,434 | $ | 87,520 | ||||||
|
|
|
|
|
|
|
|||||||
| Supplemental disclosures: |
||||||||||||
| Interest paid |
$ | 2,822 | $ | 1,021 | $ | 435 | ||||||
| Income taxes paid |
$ | 6,651 | $ | 10,762 | $ | 5,877 | ||||||
| Non cash transactions: |
||||||||||||
| Dividends declared |
$ | 4,712 | $ | 4,542 | $ | 4,002 | ||||||
| Purchase of treasury stock |
$ | — | $ | 95 | $ | — | ||||||
The accompanying notes are an integral part of these consolidated financial statements.
75
Table of Contents
MONOTYPE IMAGING HOLDINGS INC.
NOTES TO CONSOLIDATED FINANCIAL STATEMENTS
December 31, 2017
1. Nature of Business
Monotype Imaging Holdings Inc. (the “Company” or “we”) is a leading provider of branded and design assets, technology and expertise for creative professionals and consumer device manufacturers. We provide high-quality, branded or personalized content across multiple devices and mediums. Our solutions, which include type, branded mobile content, visual content marketing solutions, custom design services, and tools and technologies that enable the creative process, are licensed through our direct sales channel, e-commerce platforms and partner platforms. We also provide consumer device manufacturers and independent software vendors, or ISVs, with the right solutions for delivering consistent, compelling user experiences. Our solutions power the visual expression of the leading makers of a wide range of devices, including laser printers, digital copiers and mobile devices, among others, as well as provide a high-quality text experience in numerous software applications and operating systems. We license our design assets and technology to creative professionals, consumer device manufacturers and independent software vendors. We are headquartered in Woburn, Massachusetts and we operate in one business segment: the development, marketing and licensing of design assets and technology. We also maintain various offices worldwide for selling and marketing, research and development and administration. At December 31, 2017, we conduct our operations through five domestic operating subsidiaries, Monotype Imaging Inc., Monotype ITC Inc. (“ITC”), MyFonts Inc. (“MyFonts”), Swyft Media Inc. and Olapic, Inc., and six foreign operating subsidiaries, Olapic Argentina S.A., Monotype Ltd. (“Monotype UK”), Monotype GmbH (“Monotype Germany”), Monotype Solutions India Pvt. Ltd. (“Monotype India”), Monotype Hong Kong Ltd. (“Monotype Hong Kong”) and Monotype KK (“Monotype Japan”).
2. Significant Accounting Policies
The accompanying consolidated financial statements reflect the application of certain significant accounting policies as described in this note and elsewhere in these notes to the accompanying consolidated financial statements.
Basis of Presentation and Consolidation
The consolidated financial statements include the accounts of Monotype Imaging Holdings Inc. and its wholly-owned subsidiaries and have been prepared by the Company in United States (U.S.) dollars and in accordance with accounting principles generally accepted in the United States, or GAAP, applied on a consistent basis.
On August 9, 2016, we acquired all of the outstanding shares of Olapic, Inc. for $123.7 million. The Company used $13.7 million in cash and borrowed $110.0 million from its line of credit. Following the acquisition, Olapic, Inc. and its wholly owned subsidiaries Olapic UK Ltd. and Olapic Argentina S.A. became wholly-owned subsidiaries of Monotype Imaging Inc.
The accompanying consolidated financial statements present the Company as of December 31, 2017 and 2016 and for the years ended December 31, 2017 and 2016, including the accounts of Monotype Imaging Inc., ITC, MyFonts, Swyft Media Inc., Olapic, Inc., Olapic Argentina S.A., Monotype UK, Monotype Germany, Monotype India, Monotype Hong Kong
76
Table of Contents
and Monotype Japan. The accompanying consolidated financial statements present the Company for the year ended December 31, 2015, including the accounts of Monotype Imaging Inc., ITC, MyFonts, Swyft Media Inc., Monotype UK, Monotype Germany, Monotype India, Monotype Hong Kong and Monotype Japan. All intercompany accounts and transactions have been eliminated.
Certain prior year balances have been reclassified to conform to current year classification.
Use of Estimates
The preparation of the financial statements in conformity with GAAP requires management to make estimates and assumptions that affect the reported amounts of assets and liabilities and the disclosure of contingent assets and liabilities at the date of the financial statements and the reported amounts of revenue and expenses during the reporting period. We believe the most judgmental estimates include those related to revenue recognition, the allowance for doubtful accounts, income taxes, the valuation of goodwill, intangible assets, other long-lived assets, the valuation of stock based compensation, accrued pension benefits and the recoverability of the Company’s net deferred tax assets. We base our estimates and judgments on historical experience and various other appropriate factors, the results of which form the basis for making judgments about the carrying values of assets and liabilities and the amount of revenue and expenses that are not readily apparent from other sources. Although the Company regularly reassesses the assumptions underlying these estimates, actual results could differ materially from these estimates. Changes in estimates are recorded in the period in which they become known. The Company bases its estimates on historical experience and various other assumptions that it believes to be reasonable under the circumstances. Actual results may differ from management’s estimates if these results differ from historical experience or other assumptions prove not to be substantially accurate, even if such assumptions are reasonable when made.
The Company is subject to a number of risks similar to those of other companies of similar size in its industry, including, but not limited to, rapid technological changes, competition from substitute products and services from larger companies, limited number of suppliers, customer concentration, government regulations, management of international activities, protection of proprietary rights, patent litigation, and dependence on key individuals.
Subsequent Events Considerations
The Company considers events or transactions that occur after the balance sheet date but prior to the issuance of the financial statements to provide additional evidence for certain estimates or to identify matters that require additional disclosure. Subsequent events have been evaluated as required. The Company has evaluated all subsequent events and determined that, other than as reported herein, there are no material recognized or unrecognized subsequent events.
Fair Value of Financial Instruments
Our financial instruments consist of cash and cash equivalents, accounts receivable, accounts payable, accrued expenses, derivative instruments and debt. We value our financial instruments at fair value in accordance with Accounting Standards Codification, or ASC, Topic No. 820, Fair Value Measurement and Disclosures. The Company’s recurring fair value measures relate to cash equivalents and derivative instruments. The Company’s
77
Table of Contents
non-financial assets and non-financial liabilities subject to non-recurring measures include goodwill and intangibles.
The carrying amounts of the Company’s financial instruments approximated their fair values at December 31, 2017 and 2016 due to the short-term nature of these instruments, and for the long-term debt, the interest rates the Company believes it could obtain for borrowings with similar terms.
The Company has evaluated the estimated fair value of financial instruments using available market information and management’s estimates. The use of different market assumptions and/or estimation methodologies could have a significant impact on the estimated fair value amounts. See Note 9 for further discussion.
Cash and Cash Equivalents
Cash and cash equivalents consist of bank deposits and certain investments, such as commercial paper, corporate bonds and municipal securities, with maturities of less than 90 days at the date of purchase. We consider all highly liquid investments with original maturities of three months or less at the time of acquisition to be cash equivalents which are stated at fair value. The Company does not believe it is exposed to any significant credit risk on its cash equivalents.
Restricted Cash
Cash and cash equivalents that are restricted as to withdrawal or use under the terms of contractual agreements are classified on our balance sheet based on relevant restrictions, and accordingly, $12.0 million was classified as short term assets at December 31, 2017, and $6.0 million and $18.0 million were classified as long term assets at December 31, 2017 and 2016, respectively. At both December 31, 2017 and 2016, we had $18.0 million of cash held in escrow to be used for payments due in 2018 and 2019 in connection with the Olapic, Inc. acquisition and payments due in 2018 in connection with the amendment to the Swyft Media merger agreement.
Concentration of Credit Risks
Financial instruments that potentially subject us to concentrations of credit risk consist principally of cash and cash equivalents and accounts receivables. Deposits of cash held outside the U.S. totaled approximately $24.3 million and $16.4 million, at December 31, 2017 and 2016, respectively. The Company maintains its cash and cash equivalents principally with accredited financial institutions of high credit standing. Although the Company deposits its cash with multiple financial institutions, its deposits, at times, may exceed federally insured limits.
We grant credit to customers in the ordinary course of business. Credit evaluations are performed on an ongoing basis to reduce credit risk, and no collateral is required from our customers. An allowance for uncollectible accounts is provided for those accounts receivable considered to be uncollectible based upon historical experience and credit evaluation. As of December 31, 2017 and 2016, there were no customers that accounted for 10% of our gross accounts receivable. For the years ended December 31, 2017, 2016 and 2015, no one customer individually accounted for 10% or more of our total revenue. For the quarters ended December 2017, 2016 and 2015, no customer individually accounted for more than 10% of our total revenue.
78
Table of Contents
Historically, we have not recorded material losses due to customers’ nonpayment. Due to these factors, no additional losses beyond the amounts provided for collection losses is believed by management to be probable in the Company’s accounts receivable. Our Creative Professional business consists of a higher volume of lower dollar value transactions. Accordingly, as the percent of Creative Professional revenue increases in relation to total revenue, we expect the average time to collect our accounts receivables, and our overall accounts receivables balances, to increase.
Property and Equipment
Property and equipment are stated at cost. We capitalize expenditures that materially increase asset lives and charge ordinary repairs and maintenance to operations as incurred. Depreciation and amortization is computed using the straight-line method over the estimated useful lives of the assets, as there is no reliable evidence to suggest that we should expect any other pattern of depreciation or amortization than an even pattern. We believe this best reflects the expected pattern of economic usage. The estimated useful lives are as follows:
| Estimated Useful Life | ||
| Computer equipment and software |
2 to 7 years | |
| Furniture and fixtures |
3 to 13 years | |
| Leasehold improvements |
Shorter of lease term or estimated useful life of 3 to 5 years |
Goodwill and Indefinite-lived Intangible Assets
Goodwill represents the excess of the cost of acquired businesses over the fair value of identifiable net assets assumed in a business combination. We account for goodwill and indefinite-lived intangible assets in accordance with ASC Topic No. 350, Intangibles—Goodwill and Other, or ASC 350, which requires that goodwill not be amortized, but instead be tested at least annually for impairment in accordance with the provisions of ASC 350. The provisions of ASC 350 provide for a two-step impairment test framework to be performed on goodwill and indefinite-lived intangible assets. For goodwill, in the first step of the two-step test, the Company must compare the fair value of each reporting unit to its carrying value. The Company determines the fair value of its reporting units based on the present value of estimated future cash flows and market approach. If the fair value of the reporting unit exceeds the carrying value of the net assets assigned to that unit, goodwill is not impaired and further testing is not required. If the carrying value of the net assets assigned to the reporting unit exceeds the fair value of the reporting unit, then the Company must perform the second step of the impairment test in order to determine the implied fair value of the reporting unit’s goodwill. If the carrying value of a reporting unit’s goodwill exceeds its implied fair value, then an impairment loss equal to the difference will need to be recorded. For intangible assets that have indefinite useful lives, the impairment evaluation includes a comparison of the carrying value of the intangible asset to that intangible assets’ fair value. The fair value of the asset is based upon the net present value of future cash flows, including a terminal value calculation. If the intangible asset’s estimated fair value exceeds its carrying value, no impairment exists. If the fair value of the intangible asset does not exceed its carrying value, then an impairment loss shall be recognized in an amount equal to the excess.
In accordance with Accounting Standards Update, or ASU, No. 2011-08, Intangibles – Goodwill and Other (Topic 350): Testing Goodwill for Impairment, the Company has the option of
79
Table of Contents
performing a qualitative assessment of the fair value of the reporting unit. If the Company determines, on the basis of the qualitative factors, that the fair value of the reporting unit is more likely than not less than its carrying value, the quantitative two-step fair value impairment test is required. Otherwise, no further testing is required. Similarly, for indefinite-lived intangible assets, in accordance with ASU No. 2012-02, Intangibles – Goodwill and Other (Topic 350): Testing Indefinite-Lived Intangible Assets for Impairment, an entity has the option to first assess qualitative factors to determine whether it is necessary to perform the two-step test. If an entity believes, as a result of its qualitative assessment, that it is more-likely-than-not that the fair value of a reporting unit is less than its carrying amount, the quantitative impairment test is required. Otherwise, the quantitative test is optional for indefinite-lived intangible assets.
Impairment testing for goodwill is done at a reporting unit level. Reporting units are one level below the business segment level, but can be combined when reporting units within the same segment have similar economic characteristics. We operate within a single business segment and reporting unit. The Company performs its annual goodwill impairment test as of December 31. As of December 31, 2017 and 2016, we elected to perform a qualitative analysis of the fair value of our goodwill and determined that the fair value was more likely than not higher than its carrying value. As such, the two-step test was not necessary.
For both years presented, 2017 and 2016, we elected to perform a qualitative analysis of the fair value of our indefinite-lived intangible assets. We perform our annual indefinite-lived intangible asset impairment test as of December 31. The fair value was determined to be more likely than not greater than the carrying value of the indefinite-lived intangible assets, and therefore, no write down of such assets was recorded in any of the years presented.
Long-Lived Assets
We account for long-lived assets including property and equipment and long-lived amortizable intangible assets in accordance with ASC Topic No. 360, Property, Plant and Equipment, or ASC 360. ASC 360 requires companies to assess whether indicators of impairment are present on a periodic basis. If such indicators are present, ASC 360 prescribes a two-step impairment test (i) if the carrying amount of a long-lived asset is not recoverable based on its undiscounted future cash flows, then (ii) the impairment loss is measured as the difference between the carrying amount and the fair value of the asset based on the forecasted discounted cash flows of the asset. We have had no impairments or indicators of impairment of our long-lived assets during the years presented.
Business Acquisitions
In accordance with ASC Topic No. 805, Business Combinations, or ASC 805, we record acquisitions under the purchase method of accounting. Accordingly, the purchase price is allocated to the tangible assets and liabilities and intangible assets acquired, based on their estimated fair values from the perspective of a market participant. The excess purchase price over the fair value of identified assets is recorded as goodwill. Under ASC 350, goodwill and purchased intangible assets with indefinite lives are not amortized but are reviewed for impairment annually, or more frequently, if impairment indicators arise. Purchased intangible assets with definite lives are amortized over their respective useful lives.
Revenue Recognition
We recognize revenue in accordance with ASC Topic No. 985-605, Software Revenue Recognition. Revenue is recognized when persuasive evidence of an agreement exists, the
80
Table of Contents
product has been delivered or services have been provided, the fee is fixed or determinable and collection of the fee is probable. However, determining whether and when some of these criteria have been satisfied often involves assumptions and judgments that can have a significant impact on the timing and amount of revenues the Company reports. For example, the Company often receives multiple purchase orders or contracts from a single customer or a group of related parties that are evaluated to determine if they are, in effect, parts of a single arrangement. If they are determined to be parts of a single arrangement, revenues are recorded as if a single multiple-element arrangement exists. In addition, arrangements with customers may include multiple deliverables, or multiple elements in a single purchase order or contract. The fee for such arrangement is allocated to the various elements based on vendor-specific objective evidence of fair value, or VSOE, and revenue is recognized accordingly. In the absence of VSOE, all revenue from the arrangement is deferred until the earlier of the point at which (a) such sufficient VSOE does exist or (b) all elements of the arrangement have been delivered. In certain circumstances, the revenue is recognized ratably, in accordance with the revenue recognition guidance.
Creative Professional Revenue
Our Creative Professional revenue is primarily derived from font licenses, font related services and from custom font design services. We license fonts directly to end-users through our direct sales organization, e-commerce websites and indirectly through third-party resellers. Web font and digital ad related services refer to our web font services and web design tools. Our customers include graphic designers, advertising agencies, media organizations and corporations. In addition, Creative Professional revenue includes revenue derived from our software as a service, or SaaS, offerings.
Revenue from font licenses to our e-commerce customers is recognized upon payment by the customer and when the software embodying the font is shipped or made available. Revenue from font licenses to other customers is recognized upon shipment of the software embodying the font and when all other revenue recognition criteria have been met. Revenue from resellers is recognized upon notification from the reseller that our font product has been licensed and when all other revenue recognition criteria have been met. Custom font design services are generally recognized upon delivery, unless it is part of a bundled services arrangement, in which case, it is recognized over the longest service period, or accounted for on a percentage-of-completion basis, where appropriate. Web font and digital ad service revenue is mainly self-hosted and recorded upon delivery. Revenue from Olapic’s Earned Content platform is a SaaS-based, subscription model. Company hosted subscription-based arrangements and our SaaS products are accounted for as subscription revenue, recognized ratably over the subscription period. The Company’s SaaS arrangements provide customers the right to access its hosted software applications and our customers do not have the right to take possession of the Company’s software during the hosting arrangement.
Web server and commercial rights to online fonts is considered recurring revenue and is recognized upon payment by the customer and proof of font delivery, and when all other revenue recognition criteria have been met. Contract accounting, completed contract for short-term projects and percentage-of-completion for long-term projects, is used where services are deemed essential to the software.
OEM Revenue
Our OEM revenue is derived substantially from printer imaging, printer driver and display imaging products. Under our licensing arrangements, we either receive a royalty for
81
Table of Contents
each product unit incorporating our fonts and technology that is shipped by our OEM customers or a fixed fee as specified under license arrangements with certain of our OEM customers. Fixed fee licensing arrangements are not based on units shipped by the customer, but instead, customers pay us on a periodic basis for the right to embed our fonts and technology in their products over a certain term. Although significantly less than royalties from per-unit shipments and fixed fees from OEM customers, we also receive revenue from software application and operating systems vendors, who include our fonts and technology in their products, and for font development. Many of our per-unit royalty licenses continue for the duration that our OEM customers ship products that include our technology, unless terminated for breach. Other licenses have terms that typically range from one fiscal quarter to five years, and usually provide for automatic or optional renewals. We recognize revenue from per-unit royalties in the period during which we receive a royalty report from a customer, typically one quarter after royalty-bearing units are shipped. Revenue from fixed fee licenses is generally recognized when it is billed to the customer, so long as the product has been delivered, the license fee is fixed and non-refundable, is not bundled with any time-based elements and collection is probable. OEM revenue also includes project-related agreements for which contract accounting, completed contract for short-term projects and percentage-of-completion for long-term projects, may be used.
Cost of Revenue
Our cost of revenue consists of font license fees that we pay on certain fonts that are owned by third parties, allocated internal engineering expense and overhead costs directly related to custom design services and customer service costs related to our software as a service. We recognize royalty expenses with respect to font license fees concurrent with the recognition of revenue on licenses to which they relate. Amortization of acquired technology is an additional cost of revenue (see Note 5).
Deferred Revenue
Deferred revenue results primarily from subscriptions, deferred licenses and, from time-to-time, prepayments against future royalties received from our customers. Long-term deferred revenue is classified as other long-term liabilities in the accompanying consolidated balance sheets at December 31, 2017 and 2016.
Software Development Costs
We expense software development costs, including costs to develop software or the software products to be marketed to external users, before technological feasibility of such products is reached. Costs that are incurred to produce the finished product after technological feasibility has been established if material, would be capitalized as an intangible asset, and are amortized on a straight-line basis over the economic useful lives. For the years ended December 31, 2017, 2016 and 2015, there were no material costs capitalized since substantially all development costs were incurred prior to attaining technological feasibility. In addition to the software development costs described above, the Company capitalizes certain costs that are incurred to purchase or create and implement internal-use software programs, including software coding, installation, testing and certain data conversions. These capitalized costs are amortized on a straight-line basis over the economic useful life. At December 31, 2017 and 2016, the Company had $9.9 million and $7.3 million, respectively, of unamortized software costs included in property and equipment, net in our accompanying consolidated balance sheets. The balance in both periods predominantly pertained to our ERP project.
82
Table of Contents
Research and Development Expenses
Our research and development expense consists principally of salaries, bonuses and benefits of our research and development, engineering and font design personnel who are primarily focused on enhancing the functionality of our text imaging solutions and developing new products. In accordance with ASC Topic No. 730, Research and Development, such costs are required to be expensed until the point that technological feasibility of the software is established. Technological feasibility is determined after a working model has been completed. As our research and development costs primarily relate to software development during the period prior to technological feasibility, all research and development costs are charged to operations as incurred.
Advertising Costs
We expense advertising costs as incurred. Advertising expenses were $2.0 million, $2.6 million and $3.3 million for the years ended December 31, 2017, 2016 and 2015, respectively.
Stock based Compensation
We account for stock based compensation in accordance with ASC Topic No. 718, Compensation—Stock Compensation, which requires all stock based payments to employees, including grants of employee stock options, to be recognized in the income statement based on their estimated fair values.
For restricted stock awards and restricted stock units issued under the Company’s stock based compensation plans, the fair value of each grant is calculated based on the Company’s stock price on the date of grant. For service-based awards, the Company recognizes compensation expense on a straight-line basis over the requisite service period of the award. For performance-based awards, stock based compensation expense is recognized over the expected performance achievement period of individual performance milestones when the achievement of each individual performance milestone becomes probable. See Note 13 for a summary of the activity under our stock based employee compensation plans for the year ended December 31, 2017.
We use the Black-Scholes option pricing model to determine the weighted-average fair value of options granted and recognize the compensation cost of stock based awards on a straight-line basis over the vesting period of the award. The determination of the fair value of stock based payment awards using the Black-Scholes model are affected by our stock price and a number of assumptions, including expected volatility, expected life, risk-free interest rates and expected dividends. The expected volatility assumption is based on our actual historical stock price volatility. The expected life of awards is based on the actual historical exercise behavior of our employees. The risk-free interest rate assumption is based on a U.S. treasury instrument whose term is consistent with the expected life of our awards. The expected dividend yield assumption is based on the estimated annualized dividend yield on our stock based on our history of paying dividends.
In 2017, we elected to account for forfeitures when they occur, on a modified retrospective basis in connection with our adoption of ASU 2016-09, Compensation – Stock Compensation (Topic 718): Improvements to Employee Share-Based Payment Accounting. As a result of this adoption, $0.6 million of additional stock based compensation expense, net of tax, was recorded to retained earnings on the date of adoption as a cumulative effect
83
Table of Contents
adjustment related to our accounting policy change for forfeitures. In 2016, forfeitures were estimated quarterly. Prior to 2016, forfeitures were estimated at the time of grant and were revised, if necessary, in subsequent periods if actual forfeitures differed from those estimates. Stock based compensation expense recognized in our financial statements is based on awards that are ultimately expected to vest. We evaluate the assumptions used to value our awards on a quarterly basis and if factors change and we employ different assumptions, stock based compensation expense may differ significantly from what we have recorded in the past. If there are any modifications or cancellations of the underlying unvested securities, we may be required to accelerate, increase or cancel any remaining unearned stock based compensation expense. Future stock based compensation expense and unearned stock based compensation will increase to the extent that we grant additional equity awards to employees or we assume unvested equity awards in connection with acquisitions.
In accordance with the adoption of ASU 2016-09, the tax effect of differences between tax deductions related to stock compensation and the corresponding financial statement expense is recorded to tax expense in our consolidated statement of income and is no longer recorded to additional paid in capital in our balance sheet. We also elected to prospectively apply the change in presentation of excess tax benefits wherein excess tax benefits recognized on stock based compensation expense is now classified as an operating activity in our condensed consolidated statements of cash flows. We did not adjust the classifications of excess tax benefits in our condensed consolidated statements of cash flows for the years ended December 31, 2016 and 2015. As such, the benefits of tax deductions in excess of recognized stock based compensation are reported as a financing activity rather than an operating activity in the statement of cash flows. This requirement reduces net operating cash flows and increases net financing cash flows in the years ended December 31, 2016 and 2015.
The fair value of options was estimated at the date of grant using a Black-Scholes option-pricing model with the following weighted-average assumptions:
| Year Ended December 31, | ||||
| 2016 | 2015 | |||
| Risk-free interest rate |
1.4% | 1.5% | ||
| Expected dividend yield |
2.0% | 1.6% | ||
| Expected volatility |
33.8% | 34.6% | ||
| Expected term |
4.8 years | 4.8 years | ||
| Weighted-average fair value per share |
$5.68 | $7.15 | ||
The Company did not grant options in the year ended December 31, 2017.
Postemployment Benefits
We account for postemployment benefits in accordance with ASC Topic No. 712, Compensation – Nonretirement Postemployment Benefits. These benefits, primarily severance, are not accrued until the amount can be reasonably estimated.
Derivative Financial Instruments
We use foreign currency derivative instruments to hedge our exposure to fluctuations in foreign currencies on our intercompany note (Note 8) and other foreign currency
84
Table of Contents
transactions. We have historically used interest rate derivative instruments to hedge the exposure to interest rate volatility resulting from our variable rate debt. ASC Topic No. 815, Derivatives and Hedging, or ASC 815, requires that all derivative instruments be reported on the balance sheet at fair value and establishes criteria for designation and effectiveness of hedging relationships, including a requirement that all designations must be made at the inception of each instrument. As we did not make such initial designations, ASC 815 requires changes in the fair value of the derivative instrument to be recognized as current period income or expense.
Foreign Currency Translation
In accordance with ASC Topic No. 830, Foreign Currency Matters, all assets and liabilities of our foreign subsidiaries whose functional currency is a currency other than U.S. dollars are translated into U.S. dollars at an exchange rate as of the balance sheet date or historical rates, as appropriate. Revenue and expenses of these subsidiaries are translated at the average monthly exchange rates in effect for the periods in which the transactions occur. Accordingly, gains and losses resulting from translating foreign currency financial statements are reported as a separate component of other comprehensive income. Foreign currency transaction gains and losses including those related to intercompany translation with subsidiaries are included in net income.
Comprehensive Income
ASC Topic No. 220, Comprehensive Income, requires disclosure of all components of comprehensive income on an annual and interim basis. Comprehensive income is defined as the change in equity of a business enterprise during a period from transactions and other events and circumstances from non-owner sources. Comprehensive income consists of foreign currency translation adjustments and adjustments to record changes in the funded status of our defined benefit pension plan in accordance with ASC Subtopic No. 715-30, Defined Benefit Plans—Pension. At December 31, 2017, 2016 and 2015, the accumulated balance of foreign currency translation adjustment was cumulative losses of $1.4 million, $9.4 million and $6.7 million, respectively. The accumulated balance of the unrecognized actuarial gain (loss) were cumulative losses of $1.1 million, $1.0 million and $0.8 million at December 31, 2017, 2016 and 2015, respectively.
Income Taxes
We account for income taxes in accordance with ASC Topic No. 740, Income Taxes, or ASC 740. Under this method, a deferred tax asset or liability is determined based on the difference between the financial statement and the tax basis of assets and liabilities, as measured by enacted tax rates in effect when these differences are expected to be reversed. This process includes estimating current tax expense together with assessing temporary differences resulting from differing treatment of items for tax and financial accounting purposes. These differences result in deferred tax assets and liabilities. We also assess the likelihood that our deferred tax assets will be recovered from future taxable income and, to the extent we believe, based on the weight of available evidence, it is more likely than not that some or all of the deferred tax assets will not be realized, we have established a valuation allowance. Significant judgment is required in determining the provision for income taxes, deferred tax assets and liabilities and any valuation allowance against our deferred tax assets.
The Company accrues liabilities for uncertain tax positions in accordance with the framework provided in ASC 740. The Company classifies interest and penalties as a component of tax expense.
85
Table of Contents
Net income per share data
The Company calculates net income per share using the “two-class” and treasury stock methods. Under the two-class method, basic net income per share is computed by dividing the net income applicable to common stockholders by the weighted-average number of common shares outstanding for the fiscal period. Diluted net income per share is computed using the more dilutive of (a) the if-converted, or treasury stock, method, or (b) the two-class method. The treasury stock method gives effect to all potentially dilutive securities, including the exercise of stock options and vesting of restricted stock. The two-class method assumes the exercise of stock options consistent with the treasury stock method, but assumes participating securities (unvested restricted stock) are not vested and allocates earnings to common shares and participating securities. Income is allocated to participating securities and common stockholders.
Recently Issued Accounting Pronouncements
Adopted
Stock based Compensation
In March 2016, the Financial Accounting Standards Board, or FASB, issued ASU 2016-09, Compensation—Stock Compensation (Topic 718): Improvements to Employee Share-Based Payment Accounting. The guidance identifies areas for simplification involving several aspects of accounting for stock based payments, including income tax consequences, classification of awards as either equity, or liabilities, an option to make a policy election to recognize gross stock based compensation expense with actual forfeitures recognized as they occur as well as certain classification changes on the statement of cash flows. This guidance is effective for annual and interim reporting periods beginning after December 15, 2016, with early adoption permitted. We adopted ASU 2016-09 on January 1, 2017 and elected to account for forfeitures when they occur, on a modified retrospective basis. As a result of this adoption, $0.6 million of additional stock based compensation expense, net of tax, was recorded to retained earnings on the date of adoption as a cumulative effect adjustment related to our accounting policy change for forfeitures. In accordance with the adoption of this guidance, the tax effect of differences between tax deductions related to stock compensation and the corresponding financial statement expense compensation will no longer be recorded to additional paid in capital in our balance sheet. Instead, such amounts will be recorded to tax expense. We also elected to prospectively apply the change in presentation of excess tax benefits wherein excess tax benefits recognized on stock based compensation expense is now classified as an operating activity in our condensed consolidated statements of cash flows. We did not adjust the classifications of excess tax benefits in our condensed consolidated statements of cash flows for the years ended December 31, 2016 and 2015. The adoption did not have any other material impact on our financial statements.
Pending
Derivatives
In August 2017, the FASB issued ASU No. 2017-12, Derivatives and Hedging (Topic 815): Targeted Improvements to Accounting for Hedging Activities. This guidance simplifies the application of the hedge accounting guidance in current GAAP and improve the financial reporting of hedging relationships by allowing entities to better align their risk management activities and financial reporting for hedging relationships through changes to both designation and measurement for qualifying hedging relationships and the presentation of
86
Table of Contents
hedge results. Further, the new guidance allows more flexibility in the requirements to qualify and maintain hedge accounting. The new standard is effective for fiscal years beginning after December 15, 2018 and interim periods. We are currently evaluating the impact of the adoption of ASU 2017-12; however, we do not expect the adoption of this standard to have a material impact on our consolidated financial statements.
Stock Compensation
In May 2017, the FASB issued ASU 2017-09, Compensation-Stock Compensation (Topic 718): Scope of Modification Accounting. This guidance clarifies when companies would apply modification accounting to changes to the terms or conditions of a stock based payment award. The guidance narrows the definition of a modification. This guidance is effective for annual and interim periods beginning after December 15, 2017. We are currently evaluating the impact of the adoption of ASU 2017-09; however, we do not expect the adoption of this standard to have a material impact on our consolidated financial statements.
Pension Benefits
In March 2017, the FASB issued ASU No. 2017-07, Compensation-Retirement Benefits (Topic 715)-Improving the Presentation of Net Periodic Pension Cost and Net Periodic Postretirement Benefit Cost. This guidance revises the presentation of the net periodic benefit cost in the income statement. The new standard will be effective for annual and interim periods beginning after December 15, 2017. We are currently evaluating the impact of the adoption of ASU 2017-07; however, we do not expect the adoption of this standard to have a material impact on our consolidated financial statements.
Goodwill
In January 2017, the FASB issued ASU 2017-04, Intangibles – Goodwill and Other (Topic 350): Simplifying the Test for Goodwill Impairment, which eliminated step 2 from the goodwill impairment test. This guidance is effective for annual and interim reporting periods beginning after December 15, 2019, with early adoption permitted for testing dates after January 1, 2017. We are currently evaluating the impact of the adoption of ASU 2017-04; however, we do not expect the adoption of this standard to have a material impact on our consolidated financial statements.
Statement of Cash Flows
In November 2016, the FASB issued ASU 2016-18, Statement of Cash Flows (Topic 230): Restricted Cash, which requires companies to include amounts generally described as restricted cash and restricted cash equivalents in cash and cash equivalents when reconciling beginning-of-period and end-of-period total amounts shown on the statement of cash flows. This guidance is effective for annual and interim reporting periods beginning after December 15, 2017, with early adoption permitted. We do not expect the adoption of this guidance to have a material effect on our consolidated financial statements and related disclosures.
Leases
In February 2016, the FASB issued ASU 2016-02, Leases (Topic 842): Amendments to the FASB Accounting Standards Codification, which replaces the existing guidance for leases. ASU 2016-02 requires the identification of arrangements that should be accounted for as leases by
87
Table of Contents
lessees. In general, for lease arrangements exceeding a twelve-month term, these arrangements must now be recognized as assets and liabilities on the balance sheet of the lessee. Under ASU 2016-02, a right-of-use asset and lease obligation will be recorded for all leases, whether operating or financing, while the income statement will reflect lease expense for operating leases and amortization/interest expense for financing leases. The balance sheet amount recorded for existing leases at the date of adoption of ASU 2016-02 must be calculated using the applicable incremental borrowing rate at the date of adoption. In addition, ASU 2016-02 requires the use of the modified retrospective method, which will require adjustment to all comparative periods presented in the consolidated financial statements. This guidance is effective for annual and interim periods beginning after December 15, 2018 and requires retrospective application. The Company is currently assessing the impact that adopting ASU 2016-02 will have on its consolidated financial statements and related disclosures.
Revenue Recognition
In May 2014, the FASB and the International Accounting Standards Board jointly issued ASU 2014-09, Revenue from Contracts with Customers (Topic 606), which outlines a comprehensive five-step revenue recognition model based on principle that replaces virtually all existing revenue recognition under U.S. GAAP and which requires revenue to be recognized in a manner to depict the transfer of promised goods or services to a customer at an amount that reflects the consideration expected to be received in exchange for those goods or services. ASU 2014-09 also provided the guidance in ASC Topic 340, Other Assets and Deferred Costs—Contracts with Customers (Subtopic 340-40), which includes criteria for the capitalization and amortization of certain contract acquisition and fulfillment costs. The standard requires retrospective application, however, it allows entities to choose either full retrospective adoption in which the standard is applied to all of the periods presented, or modified retrospective adoption, in which the cumulative catch-up adjustment to the opening balance of retained earnings is recognized at the date of application, with additional disclosures required to describe these effects. In August 2015, the FASB issued ASU 2015-14, Revenue from Contracts with Customers (Topic 606): Deferral Date, which defers the effective date of ASU 2014-09 by one year. The guidance is effective for annual reporting and interim periods beginning after December 15, 2017, with early adoption permitted for annual and interim periods beginning after December 15, 2016.
We will adopt the standard on January 1, 2018, and at that time, we will apply the modified retrospective method of adoption. We have developed an implementation plan to assess the impact of the new guidance on our operations, financial results and related disclosures. To date, we have substantially completed our initial assessment of the potential areas of the balance sheet and financial statement components impacted, have prepared our preliminary accounting policy memorandum and are completing our assessment of the quantitative impact of adoption, including assessing the impact of the new guidance on our results of operations and internal controls. Based on our procedures performed to date, we have identified certain revenue streams, specifically term and royalty-based license agreements, for which the standard will have a material impact. Under the current guidance, revenue related to our term license agreements that are bundled with services related performance obligations for which vendor-specific objective evidence (“VSOE”) does not exist is required to be recognized ratably over the term of the agreement. However, under the new guidance, the Company will allocate revenue to each performance obligation in the agreement and each will require separate accounting treatment and lead to accelerated revenue recognition compared with current practice. The license portion will be recognized at the time of delivery and the service revenue will be recognized over time based on the
88
Table of Contents
relative standalone selling prices of each performance obligation. In addition, we have on occasion, offered extended payment terms for term licenses to our customers, including cases in which the license is delivered in full at the beginning of the contract. We currently recognize revenue under such arrangements when the payments become due, based upon the current requirement that the fee be fixed or determinable. However, under the new guidance, revenue related to such arrangements would be accelerated, with revenue related to the license recognized at the time of delivery, less a financing component (interest income) to be recognized over time based on the payment terms. Further, under the new guidance, we will be required to estimate royalty revenue from our royalty-based licenses in the period that the royalty-bearing event occurs, which is different from our current practice of recognizing royalty revenue when it is reported to us by the licensee, at which time the fee is deemed fixed or determinable. During 2017, the Company recorded $9.2 million of additional one time revenue for the conversion of its printer imaging electronic OEM customers to fixed fee contracts from royalty bearing contracts. At December 31, 2017, the Company had successfully converted over 90% of its printer imaging electronic OEM annual revenues to fixed fee contracts. The new guidance also requires certain costs related to contract acquisition, such as sales commissions, to be capitalized and amortized over the expected period of benefit. We currently recognize such expenses based on when they are earned. We are currently in the process of evaluating our commission plans and other factors that that will impact the period over which such expenses are recognized under the new guidance. We will elect the practical expedient which permits an entity to not adjust for the effects of a significant financing component if we expect that at the contract inception, the period between when the entity transfers a promised good or service to a customer and when the customer pays for that good or service will be one year or less. We also will elect the practical expedient which permits an entity to only apply the transition guidance to contracts that are not completed at the date of the initial application of ASU 2014-09. We will elect the practical expedient which permits us to expense costs as they are incurred if the amortization period is determined to be one year or less.
We expect the new guidance to have a significant impact on our financial statements, including the expected transition adjustment to adopt ASC606. We are still in the process of evaluating the quantitative impact that the standard will have on our financial statements and related disclosures.
3. Acquisitions
Olapic
On August 9, 2016, the Company purchased all of the outstanding shares of Olapic, Inc., a privately-held company located in New York, New York; its wholly-owned subsidiaries Olapic UK Ltd., based in London, England; and Olapic Argentina S.A., based in Córdoba, Argentina (collectively, “Olapic”). Olapic is a provider of a leading visual commerce platform for collecting, curating, showcasing and measuring crowd sourced photos and videos. Olapic’s Earned Content Platform helps brands collect, curate, use and analyze user-generated content in the form of images and videos in their ecommerce experiences and across multiple marketing channels. This allows consumers to make more educated purchasing decisions, discover new products and connect to the brand’s community. The Company leverages photos and videos from social network sites to help to create powerful branded experiences that drive consumer engagement and increase conversions. The Company acquired Olapic for an aggregate purchase price of approximately $123.7 million, net of cash acquired, which consisted of approximately $13.7 million in cash and borrowed $110.0 million from its line of credit. The Merger Agreement included an additional $9.0 million of consideration that has been placed in escrow and will be paid to the founders of Olapic contingent upon continued
89
Table of Contents
employment with the Company. Accordingly, this amount will be recognized as compensation expense over the service period contractually required to earn such amounts, which is $3.0 million after twenty four months and the remainder after thirty six months from the acquisition date. Monotype issued approximately $17.1 million of a combination of restricted stock awards or restricted stock units to the founders and employees of Olapic. These awards will vest over time based on continued employment, and accordingly will be accounted for as compensation expense. Seventy four employees from Olapic’s U.S. operations, eighty four employees from Olapic’s Argentina operations and forty UK and European employees joined the Company in connection with the acquisition. The results of operations of Olapic have been included in our consolidated results and revenue is included within the Creative Professional market beginning on August 9, 2016, the date of acquisition.
The table below provides the Olapic employees by functional area who joined the Company in connection with the acquisition:
| Number of employees |
||||
| Marketing and selling |
117 | |||
| Research and development |
68 | |||
| General and administration |
13 | |||
|
|
|
|||
| Total |
198 | |||
|
|
|
|||
The purchase price was allocated to the assets and liabilities based upon their estimated fair value at the date of acquisition, as noted below (in thousands):
| Estimated Fair Value at Acquisition Date |
||||
| Cash |
$ | 5,942 | ||
| Accounts receivable and other current assets |
8,174 | |||
| Property and equipment and other assets |
1,029 | |||
| Goodwill |
89,705 | |||
| Identifiable intangible assets |
30,100 | |||
| Accounts payable and other accrued expenses |
(2,468 | ) | ||
| Deferred revenue |
(7,334 | ) | ||
| Deferred tax liability |
(1,449 | ) | ||
|
|
|
|||
| Total purchase price |
$ | 123,699 | ||
|
|
|
|||
The estimated fair values of intangible assets acquired were recorded as follows:
| Estimated Fair Value at Acquisition Date (in thousands) |
Estimated Useful Life (in years) |
|||||||
| Developed technology |
$ | 14,300 | 10 | |||||
| Customer relationships |
7,900 | 10 | ||||||
| Non-compete agreements |
1,400 | 4 | ||||||
| Indefinite-lived intangible assets: |
||||||||
| Trademarks and tradenames |
6,500 | |||||||
|
|
|
|||||||
| Total |
$ | 30,100 | ||||||
|
|
|
|||||||
A portion of the purchase price has been allocated to intangible assets and goodwill, respectively, and is reflected in the tables above. The fair value of the assets acquired and
90
Table of Contents
liabilities assumed is less than the purchase price, resulting in the recognition of goodwill. The goodwill reflects the value of the synergies we expect to realize and the assembled workforce. The acquisition of Olapic was structured in such a manner that the goodwill is not expected to be deductible for tax purposes. The purchase price has been allocated to the tangible and intangible assets acquired and liabilities assumed based upon the respective estimates of fair value as of the date of the acquisition and using assumptions that the Company’s management believes are reasonable given the information available.
We recorded revenue of $19.4 million, and a net loss of $28.4 million, from the acquired Olapic operations within the Company’s consolidated operations for the year ended December 31, 2017. We recorded revenue of $4.4 million and a net loss of $8.4 million from Olapic, since the acquisition date, which is included in our consolidated statements of income for the year ended December 31, 2016. Transaction costs of $1.1 million are included in general and administrative expenses in our consolidated statements of income for the year ended December 31, 2016.
Pro Forma Results
The following table shows unaudited pro forma results of operations as if we had acquired Olapic at the beginning of the periods presented (in thousands, except per share amounts):
| Year Ended December 31, |
||||
| 2016 | ||||
| Revenue |
$ | 212,237 | ||
| Net income |
$ | 3,799 | ||
| Net income per common share: basic |
$ | 0.08 | ||
| Net income per common share: diluted |
$ | 0.08 | ||
| Weighted average number of shares—basic |
39,405,700 | |||
| Weighted average number of shares—diluted |
39,731,923 | |||
The unaudited pro forma results of operations are not necessarily indicative of the actual results that would have occurred had the transactions actually taken place at the beginning of the periods indicated.
4. Property and Equipment
Property and equipment consists of the following (in thousands):
| December 31, | ||||||||
| 2017 | 2016 | |||||||
| Computer equipment and software |
$ | 23,787 | $ | 19,505 | ||||
| Furniture and fixtures |
1,539 | 1,417 | ||||||
| Leasehold improvements |
5,921 | 5,973 | ||||||
|
|
|
|
|
|||||
| Total cost |
31,247 | 26,895 | ||||||
| Less accumulated depreciation and amortization |
(14,484 | ) | (12,729 | ) | ||||
|
|
|
|
|
|||||
| Property and equipment, net |
$ | 16,763 | $ | 14,166 | ||||
|
|
|
|
|
|||||
At December 31, 2017, computer equipment and software included $3.8 million of unamortized software costs related to internal use software projects that have not yet been placed in service.
91
Table of Contents
Depreciation and amortization expense for the years ended December 31, 2017, 2016 and 2015 was $4.8 million, $4.2 million and $3.2 million, respectively.
5. Goodwill and Intangible Assets
Goodwill
The changes in the carrying value of goodwill are as follows (in thousands):
| Balance at December 31, 2015 |
$ | 185,735 | ||
| Acquisitions |
89,623 | |||
| Foreign currency exchange rate changes |
(1,806 | ) | ||
| Deferred tax adjustment |
(63 | ) | ||
|
|
|
|||
| Balance at December 31, 2016 |
$ | 273,489 | ||
| Acquisitions |
81 | |||
| Foreign currency exchange rate changes |
5,623 | |||
| Deferred tax adjustment |
(62 | ) | ||
|
|
|
|||
| Balance at December 31, 2017 |
$ | 279,131 | ||
|
|
|
In 2016, the Company recorded approximately $89.6 million in increases to goodwill related to the Olapic acquisition. See Note 3 for further details on our acquisitions.
Intangible Assets
Intangible assets are stated at cost and are amortized over the expected life of the asset. Intangible assets as of December 31, 2017 and 2016 are as follows (dollar amounts in thousands):
| Weighted- Average Amortization Period (Years) |
December 31, 2017 | December 31, 2016 | ||||||||||||||||||||||||||
| Gross Carrying Amount |
Accumulated Amortization |
Net Balance |
Gross Carrying Amount |
Accumulated Amortization |
Net Balance |
|||||||||||||||||||||||
| Customer relationships |
10 | $ | 68,296 | $ | (54,213 | ) | $ | 14,083 | $ | 67,502 | $ | (50,808 | ) | $ | 16,694 | |||||||||||||
| Acquired technology |
11 | 69,200 | (48,945 | ) | 20,255 | 68,228 | (44,361 | ) | 23,867 | |||||||||||||||||||
| Non-compete agreements |
4 | 14,632 | (13,470 | ) | 1,162 | 14,440 | (12,655 | ) | 1,785 | |||||||||||||||||||
| Indefinite-lived intangible assets: |
||||||||||||||||||||||||||||
| Trademarks |
44,956 | — | 44,956 | 43,971 | — | 43,971 | ||||||||||||||||||||||
| Domain names |
4,400 | — | 4,400 | 4,400 | — | 4,400 | ||||||||||||||||||||||
|
|
|
|
|
|
|
|
|
|
|
|
|
|||||||||||||||||
| Total |
$ | 201,484 | $ | (116,628 | ) | $ | 84,856 | $ | 198,541 | $ | (107,824 | ) | $ | 90,717 | ||||||||||||||
|
|
|
|
|
|
|
|
|
|
|
|
|
|||||||||||||||||
Amortization expense is calculated using the straight-line method as there is no reliable evidence to suggest that we should expect any pattern of amortization other than an even pattern, and we believe this best reflects the expected pattern of economic usage.
92
Table of Contents
Estimated future intangible amortization expense based on balances at December 31, 2017 is as follow (in thousands):
| Acquired Technology |
Other Intangible Assets |
|||||||
| 2018 |
$ | 4,063 | $ | 3,451 | ||||
| 2019 |
4,020 | 3,183 | ||||||
| 2020 |
3,173 | 2,499 | ||||||
| 2021 |
2,345 | 1,803 | ||||||
| 2022 |
1,445 | 1,299 | ||||||
| Thereafter |
5,209 | 3,010 | ||||||
|
|
|
|
|
|||||
| Total amortization expense |
$ | 20,255 | $ | 15,245 | ||||
|
|
|
|
|
|||||
6. Accrued Expenses and Other Current Liabilities
Accrued expenses and other current liabilities consist of the following (in thousands):
| December 31, | ||||||||
| 2017 | 2016 | |||||||
| Payroll and related benefits |
$ | 11,687 | $ | 11,385 | ||||
| Deferred compensation. |
10,994 | — | ||||||
| Royalties |
4,874 | 4,690 | ||||||
| Legal and audit fees |
1,027 | 1,374 | ||||||
| Sales tax payable |
4,106 | 2,879 | ||||||
| Dividend payable |
4,712 | 4,542 | ||||||
| Restructuring |
1,488 | — | ||||||
| Other |
4,208 | 3,892 | ||||||
|
|
|
|
|
|||||
| Total |
$ | 43,096 | $ | 28,762 | ||||
|
|
|
|
|
|||||
7. Debt
On September 15, 2015, the Company entered into a new credit agreement (the “New Credit Agreement”) by and among the Company, the Company’s subsidiary, Monotype Imaging Inc., any financial institution that becomes a Lender (as defined therein) and Silicon Valley Bank, as agent which provides for a five-year $150.0 million secured revolving credit facility (the “Credit Facility”). The Credit Facility permits the Company to request that the Lenders, at their election, increase the secured credit facility to a maximum of $200.0 million. The Credit Facility is available to the Company on a revolving basis through September 15, 2020. Repayment of any amounts borrowed are not required until maturity of the Credit Facility. However, the Company may repay any amounts borrowed at any time, without premium or penalty. The Company had $93.0 million and $105.0 million outstanding under the Credit Facility at December 31, 2017 and 2016, respectively. Available borrowings under the Credit Facility have been reduced by approximately $0.5 million for one standby letter of credit issued in connection with a facility lease agreement, leaving $56.5 million and $44.5 million available for borrowings at December 31, 2017 and 2016, respectively.
Borrowings under the Credit Facility bear interest at a variable rate not less than zero based upon, at the Company’s option, either LIBOR or the higher of (i) the prime rate as published in the Wall Street Journal, and (ii) 0.5% plus the overnight federal funds rate, plus
93
Table of Contents
in each case, an applicable margin. The applicable margin for LIBOR loans, based on the applicable leverage ratio, is 1.25%, 1.50% or 1.75% per annum, and the applicable margin for base rate loans, based on the applicable leverage ratio, is either 0.25%, 0.50% or 0.75%% per annum. At December 31, 2017 our rate, inclusive of applicable margins, was 3.1% for LIBOR. The Company is required to pay a commitment fee, based on the applicable leverage ratio, equal to 0.20%, 0.25% or 0.30% per annum on the undrawn portion available under the revolving credit facility and variable per annum fees in respect of outstanding letters of credit. In connection with the New Credit Agreement, the Company incurred closing and legal fees of approximately $1.0 million, which have been accounted for as deferred financing costs and will be amortized to interest expense over the term of the New Credit Agreement. In addition, $0.2 million of unamortized deferred financing costs associated with the pro-rata share of the prior loan syndicate lenders that did not participate in the new facility were written off and charged to other expense in the third quarter of 2015.
In addition to other covenants, the New Credit Agreement places limits on the Company and its subsidiaries’ ability to incur debt or liens and engage in sale-leaseback transactions, make loans and investments, incur additional indebtedness, engage in mergers, acquisitions and asset sales, transact with affiliates and alter its business. The New Credit Agreement also contains events of default, and affirmative covenants, including financial maintenance covenants which include (i) a maximum ratio of consolidated total debt to consolidated adjusted EBITDA of 3.00 to 1.00, and (ii) a minimum consolidated fixed charge coverage ratio of 1.25 to 1.00. At December 31, 2017, our leverage ratio was 2.17:1.00 and our fixed charge ratio was 3.83:1.00. Adjusted EBITDA, under the Credit Facility, is defined as consolidated net income (or loss), plus net interest expense, income taxes, depreciation and amortization, and stock based compensation expense, plus acquisition expenses not to exceed $2.0 million on a trailing twelve month basis, plus restructuring, issuance costs, cash non-operating costs and other expenses or losses minus cash non-operating gains and other non-cash gains; provided however that the aggregate of all cash non-operating expense shall not exceed $250 thousand and all such fees, costs and expenses shall not exceed $1.5 million on a trailing twelve months basis.. Failure to comply with these covenants, or the occurrence of an event of default, could permit the lenders under the New Credit Agreement to declare all amounts borrowed under the New Credit Agreement, together with accrued interest and fees, to be immediately due and payable. In addition, the Credit Facility is secured by a lien on substantially all of the Company’s and its domestic subsidiaries’ tangible and intangible property by a pledge of all of the equity interests of the Company’s direct and indirect domestic subsidiaries and by a pledge by the Company’s domestic subsidiaries of 65% of the equity of their direct foreign subsidiaries, subject to limited exceptions. The Company was in compliance with all covenants under our Credit Facility as of December 31, 2017 and 2016.
8. Derivative Financial Instruments
We incur foreign currency exchange gains and losses related to certain customers that are invoiced in U.S. dollars, but have the contractual option to make an equivalent payment in their own functional currencies at a specified exchange rate as of a specified date. In the period from that date until payment in the customer’s functional currency is received and converted into U.S. dollars, we can incur unrealized gains and losses. We also incur foreign currency exchange gains and losses on certain intercompany assets and liabilities denominated in foreign currencies. We are currently utilizing 30-day forward contracts to mitigate our exposure on these currency fluctuations. These contracts are generally set to expire and are settled at month end. The instruments are not designated as hedging instruments, and accordingly, the gain or loss is recognized upon cash settlement and is included in gain or loss on derivatives in the accompanying consolidated statements of
94
Table of Contents
income. At December 31, 2017 and 2016, we had one forward contract outstanding, which was entered into on those dates. There were no outstanding forward contracts at December 31, 2015. (Gains) and losses on our derivative financial instruments for the years ended December 31, 2017, 2016 and 2015 are included in loss (gain) on derivatives in our accompanying consolidated statements of income. See Note 9 for details regarding the fair value.
9. Fair Value Measurements
Fair value is defined as the price that would be received to sell an asset or paid to transfer a liability in an orderly transaction between market participants at the measurement date. In order to increase consistency and comparability in fair value measurements, the Codification establishes a fair value hierarchy that prioritizes observable and unobservable inputs used to measure fair value into three broad levels, which are described below:
Level 1: Quoted prices (unadjusted) in active markets that are accessible at the measurement date for assets or liabilities. The fair value hierarchy gives the highest priority to Level 1 inputs.
Level 2: Observable inputs other than quoted prices included in Level 1, such as quoted prices for similar assets and liabilities in active markets; quoted prices for identical or similar assets and liabilities in markets that are not active; or other inputs that are observable or can be corroborated by observable market data.
Level 3: Unobservable inputs that are supported by little or no market activity and that are significant to the fair value of the assets or liabilities. This includes certain pricing models, discounted cash flow methodologies and similar techniques that use significant unobservable inputs. The fair value hierarchy gives the lowest priority to Level 3 inputs.
In determining fair value, the Company utilizes valuation techniques that maximize the use of observable inputs and minimizes the use of unobservable inputs to the extent possible as well as considers counterparty and our own credit risk in its assessment of fair value.
95
Table of Contents
The following tables present our financial assets and liabilities that are carried at fair value, classified according to the three categories described above (in thousands):
| Fair Value Measurement at December 31, 2017 | ||||||||||||||||
| Total | Quoted Prices in Active Markets for Identical Assets (Level 1) |
Significant Other Observable Inputs (Level 2) |
Significant Unobservable Inputs (Level 3) |
|||||||||||||
| Assets: |
||||||||||||||||
| Cash equivalents—money market funds |
$ | 2,014 | $ | 2,014 | $ | — | $ | — | ||||||||
| Cash equivalents—commercial paper |
16,477 | — | 16,477 | — | ||||||||||||
| Cash equivalents—corporate bonds |
1,457 | — | 1,457 | — | ||||||||||||
| Cash equivalents—U.S. government and agency securities |
10,488 | 10,488 | — | — | ||||||||||||
|
|
|
|
|
|
|
|
|
|||||||||
| Total current assets |
30,436 | 12,502 | 17,934 | — | ||||||||||||
| Restricted cash equivalents—money market fund |
9,000 | 9,000 | — | — | ||||||||||||
| Restricted cash equivalents—U.S. government and agency security fund |
8,987 | 8,987 | — | — | ||||||||||||
|
|
|
|
|
|
|
|
|
|||||||||
| Total long term assets |
17,987 | 17,987 | — | — | ||||||||||||
|
|
|
|
|
|
|
|
|
|||||||||
| Total assets |
$ | 48,423 | $ | 30,489 | $ | 17,934 | $ | — | ||||||||
|
|
|
|
|
|
|
|
|
|||||||||
| Fair Value Measurement at December 31, 2016 | ||||||||||||||||
| Total | Quoted Prices in Active Markets for Identical Assets (Level 1) |
Significant Other Observable Inputs (Level 2) |
Significant Unobservable Inputs (Level 3) |
|||||||||||||
| Assets: |
||||||||||||||||
| Cash equivalents—money market funds |
$ | 16,994 | $ | 16,994 | $ | — | $ | — | ||||||||
| Cash equivalents—commercial paper |
16,989 | — | 16,989 | — | ||||||||||||
| Cash equivalents—corporate bonds |
4,802 | — | 4,802 | — | ||||||||||||
| Cash equivalents—U.S. government and agency securities |
11,368 | 11,368 | — | — | ||||||||||||
|
|
|
|
|
|
|
|
|
|||||||||
| Total current assets |
50,153 | 28,362 | 21,791 | — | ||||||||||||
| Restricted cash equivalents—money market fund |
9,000 | 9,000 | — | — | ||||||||||||
| Restricted cash equivalents—U.S. government and agency security fund |
8,992 | 8,992 | — | — | ||||||||||||
|
|
|
|
|
|
|
|
|
|||||||||
| Total long term assets |
17,992 | 17,992 | — | — | ||||||||||||
|
|
|
|
|
|
|
|
|
|||||||||
| Total assets |
$ | 68,145 | $ | 46,354 | $ | 21,791 | $ | — | ||||||||
|
|
|
|
|
|
|
|
|
|||||||||
96
Table of Contents
The Company’s recurring fair value measures relate to short-term investments, which are classified as cash equivalents, derivative instruments and from time-to-time contingent consideration. The fair value of our cash equivalents are either based on quoted prices for similar assets or other observable inputs such as yield curves at commonly quoted intervals and other market corroborated inputs. The fair value of our derivatives is based on quoted market prices from various banking institutions or an independent third-party provider for similar instruments. In determining the fair value, we consider our non-performance risk and that of our counterparties. At December 31, 2017, we had one 30-day forward contract to sell 2.5 million British pound sterling and purchase $3.4 million that together, had an immaterial fair value. At December 31, 2016, we had one 30-day forward contract to sell 2.8 million British pound sterling and purchase $3.4 million that together, had an immaterial fair value.
The Company’s non-financial assets and non-financial liabilities subject to non-recurring measurements include goodwill and intangible assets.
10. Employee Benefit Plans
Defined Contribution Plans
The Company has defined contribution plans in the United States, the United Kingdom, India and Japan. The Company has a defined contribution employee savings plan in the United States, the Monotype Imaging Employee Savings Plan, or the U.S. 401(k) Plan. In the United States, the provisions of Section 401(k) of the Internal Revenue Code under which its United States employees may make contributions govern the plans. The U.S. 401(k) Plan provides for a discretionary employer matching contribution. For the years ended December 31, 2017, 2016 and 2015, the Company matched dollar-for-dollar up to the first 6% of the participant’s compensation. The U.S. 401(k) Plan also provides for a discretionary employer profit sharing contribution. Participants are fully vested in the current value of their contributions and all earnings thereon. Participants become vested in the employer contributions and all earnings thereon based on years of service as follows: 25.0% vested after one year; 50.0% vested after two years; 100.0% vested after three years. In the United Kingdom, we contribute either 4%, 5% or 6% of each employee’s salary into a retirement account, provided the employee contributes a minimum of 1% 2% or 3% of salary, respectively. In India, the Company matches participant contributions dollar-for-dollar up to 12% of salary into an interest bearing government-controlled account, as required by law. In Japan, the Company contributes a fixed percent of the employee’s salary into an interest bearing account. Contributions to all of the Company’s defined contribution plans were $3.5 million, $2.2 million and $1.9 million for the years ended December 31, 2017, 2016 and 2015, respectively, and have been included in the accompanying consolidated statements of income.
Defined Benefit Pension Plan
Monotype Germany maintains an unfunded defined benefit pension plan, or the German Plan, which covers substantially all employees who joined the company prior to the plan’s closure to new participants in 2006. Participants are entitled to benefits in the form of retirement, disability and surviving dependent pensions. Benefits generally depend on years of service and the salary of the employees.
97
Table of Contents
The components of net periodic benefit cost included in the accompanying consolidated statements of income were as follows (in thousands):
| 2017 | 2016 | 2015 | ||||||||||
| Service cost |
$ | 94 | $ | 94 | $ | 119 | ||||||
| Interest cost |
108 | 120 | 116 | |||||||||
| Amortization of loss |
91 | 50 | 77 | |||||||||
|
|
|
|
|
|
|
|||||||
| Net periodic benefit cost |
$ | 293 | $ | 264 | $ | 312 | ||||||
|
|
|
|
|
|
|
|||||||
The assumptions used to determine the net periodic benefit cost were as follows:
| 2017 | 2016 | 2015 | ||||||||||
| Weighted-average discount rate |
1.7 | % | 1.9 | % | 2.4 | % | ||||||
| Weighted-average rate of compensation increase |
3.0 | % | 3.0 | % | 3.0 | % | ||||||
Reconciliation of Funded Status and Accumulated Benefit Obligation
The German Plan is an unfunded plan and accordingly has no assets. A reconciliation of the beginning and ending balance of the projected benefit obligation for the years ended December 31, 2017 and 2016 is as follows (in thousands):
| 2017 | 2016 | |||||||
| Change in projected benefit obligation: |
||||||||
| Projected benefit obligation at beginning of year |
$ | 5,353 | $ | 4,960 | ||||
| Service cost |
94 | 94 | ||||||
| Interest cost |
108 | 120 | ||||||
| Actuarial loss |
90 | 472 | ||||||
| Benefits paid |
(123 | ) | (108 | ) | ||||
| Foreign currency exchange rate changes |
748 | (185 | ) | |||||
|
|
|
|
|
|||||
| Projected benefit obligation at end of year |
$ | 6,270 | $ | 5,353 | ||||
|
|
|
|
|
|||||
| Accumulated benefit obligation |
$ | 6,148 | $ | 5,253 | ||||
|
|
|
|
|
|||||
| Funded status at end of year |
$ | (6,270 | ) | $ | (5,353 | ) | ||
|
|
|
|
|
|||||
| Net Amounts Recognized in the Financial Statements: |
||||||||
| Current liability |
$ | 155 | $ | 122 | ||||
| Unrecognized actuarial gain reported within accrued pension benefits |
6,115 | 5,231 | ||||||
|
|
|
|
|
|||||
| Net accrued pension liability recognized |
$ | 6,270 | $ | 5,353 | ||||
| Amounts included in accumulated other comprehensive income not yet recognized in periodic pension cost, net of tax |
$ | (1,559 | ) | $ | (1,560 | ) | ||
| Amounts expected to be amortized from accumulated other comprehensive income into net periodic pension costs over the next fiscal year (consists of net actuarial gain/loss) |
$ | 93 | $ | 85 | ||||
Monotype Germany also provides cash awards to its employees based on length of service. At December 31, 2017 and 2016, the balance accrued for such benefits totaled $165 thousand and $65 thousand, respectively, and is included in accrued pension benefits in the accompanying consolidated balance sheets.
98
Table of Contents
The assumptions used to determine the accrued pension benefits (obligations) were as follows:
| 2017 | 2016 | |||||||
| Weighted-average discount rate |
1.7 | % | 1.9 | % | ||||
| Weighted-average rate of compensation increase |
3.0 | % | 3.0 | % | ||||
| Rate of inflation |
1.8 | % | 1.8 | % | ||||
The most recent actuarial valuation of the plan was performed as of December 31, 2017. The measurement dates are December 31, 2017 for 2017 and December 31, 2016 for 2016.
The following table reflects the total future expected benefit payments to plan participants. These payments have been estimated based on the same assumptions used to measure the Company’s benefit obligation at year end (in thousands):
| Expected Future Benefit Payments: |
||||
| 2018 |
$ | 155 | ||
| 2019 |
174 | |||
| 2020 |
181 | |||
| 2021 |
189 | |||
| 2022 |
193 | |||
| 2023-2027 |
1,100 |
11. Income Taxes
New Tax Legislation
On December 22, 2017, the Tax Cuts and Jobs Act (“The Act”) was signed into law. This legislation includes significant changes in U.S. tax law, including a reduction in the corporate tax rates and the creation of a territorial tax system with a one-time mandatory tax on previously deferred foreign earnings of U.S. subsidiaries. The legislation reduced the U.S. corporate tax rate from the current rate of 35% to 21% for tax years beginning after December 31, 2017. As a result of the enacted law, the Company was required to revalue deferred tax assets and liabilities existing as of December 31, 2017 from the 35% federal rate in effect through the end of 2017, to the new 21% rate. Accordingly, the Company recorded a current period tax benefit of $16.8 million and a corresponding reduction in the deferred tax liability. In addition, as a result of changes made by The Act related to taxation of foreign source income and the utilization of foreign tax credits, the Company recorded a valuation allowance on foreign tax credit carryforwards of $5.6 million. The new legislation will require the Company to pay tax on the unremitted earnings of its foreign subsidiaries through December 31, 2017. Because of the complexities involved in determining the previously unremitted earnings and profits of all our foreign subsidiaries, the Company is still in the process of obtaining, preparing, and analyzing the required information, as permitted in accordance with Staff Accounting Bulletin No. 118. The Company has recorded an initial estimate of the tax on unremitted earnings of approximately $0.2 million, however, this amount is offset by available foreign tax credits, and as a result the net estimated amount payable related to the deemed repatriation of foreign earnings is zero. This amount has been further offset by available foreign tax credits, and as a result the net estimated amount payable related to the deemed repatriation of foreign earnings is zero.
99
Table of Contents
Income Taxes
The components of domestic and foreign income (loss) before the provision (benefit) for income taxes are as follows (in thousands):
| 2017 | 2016 | 2015 | ||||||||||
| U.S. |
$ | (13,124 | ) | $ | 142 | $ | 18,787 | |||||
| Foreign |
19,293 | 25,057 | 21,688 | |||||||||
|
|
|
|
|
|
|
|||||||
| Total income before provision for income taxes |
$ | 6,169 | $ | 25,199 | $ | 40,475 | ||||||
|
|
|
|
|
|
|
|||||||
The components of the provision for income taxes are as follows (in thousands):
| 2017 | 2016 | 2015 | ||||||||||
| Current |
||||||||||||
| U.S. Federal |
$ | 793 | $ | (152 | ) | $ | 2,873 | |||||
| State and local |
224 | 279 | 550 | |||||||||
| Foreign jurisdictions |
7,049 | 8,173 | 5,153 | |||||||||
|
|
|
|
|
|
|
|||||||
| 8,066 | 8,300 | 8,576 | ||||||||||
| Deferred |
||||||||||||
| U.S. Federal |
(12,433 | ) | 1,403 | 6,267 | ||||||||
| State and local |
43 | 976 | 81 | |||||||||
| Foreign jurisdictions |
(1,067 | ) | (366 | ) | (646 | ) | ||||||
|
|
|
|
|
|
|
|||||||
| (13,457 | ) | 2,013 | 5,702 | |||||||||
|
|
|
|
|
|
|
|||||||
| Total (benefit) provision |
$ | (5,391 | ) | $ | 10,313 | $ | 14,278 | |||||
|
|
|
|
|
|
|
|||||||
A reconciliation of income taxes computed at federal statutory rates to income tax expense is as follows (dollar amounts in thousands):
| 2017 | 2016 | 2015 | ||||||||||||||||||||||
| Provision for income taxes at statutory rate |
$ | 2,159 | 35.0 | % | $ | 8,820 | 35.0 | % | $ | 14,167 | 35.0 | % | ||||||||||||
| State and local income taxes, net of federal tax benefit |
174 | 2.8 | % | 816 | 3.2 | % | 410 | 1.0 | % | |||||||||||||||
| Foreign rate differential |
(138 | ) | (2.2 | )% | (278 | ) | (1.1 | )% | (229 | ) | (0.5 | )% | ||||||||||||
| Stock based compensation |
1,011 | 16.4 | % | 130 | 0.5 | % | 100 | 0.3 | % | |||||||||||||||
| Research credits |
(117 | ) | (1.9 | )% | (485 | ) | (1.9 | )% | (371 | ) | (0.9 | )% | ||||||||||||
| Reversal of reserve for income taxes |
(64 | ) | (1.0 | )% | (47 | ) | (0.2 | )% | (1,305 | ) | (3.2 | )% | ||||||||||||
| Federal and foreign rate changes |
(16,799 | ) | (272.3 | )% | — | — | — | — | ||||||||||||||||
| Foreign tax credit valuation allowance |
5,587 | 90.5 | % | — | — | — | — | |||||||||||||||||
| Permanent non-deductible acquisition-related expense |
1,969 | 31.9 | % | 1,748 | 7.0 | % | 1,209 | 3.0 | % | |||||||||||||||
| Permanent non-deductible executive compensation expense |
591 | 9.6 | % | 34 | 0.1 | % | 249 | 0.6 | % | |||||||||||||||
| Other, net |
236 | 3.8 | % | (425 | ) | (1.7 | )% | 48 | — | |||||||||||||||
|
|
|
|
|
|
|
|
|
|
|
|
|
|||||||||||||
| Reported income tax (benefit) provision |
$ | (5,391 | ) | (87.4 | )% | $ | 10,313 | 40.9 | % | $ | 14,278 | 35.3 | % | |||||||||||
|
|
|
|
|
|
|
|
|
|
|
|
|
|||||||||||||
For the year ended December 31, 2017, our effective tax rate was a benefit of 87.4%. The 2017 effective tax rate included a benefit of 272.3% for tax rate changes due to The Act. Our
100
Table of Contents
effective tax rate included a charge of 90.5% for valuation allowances provided on foreign tax credit carryforwards in 2017, in connection with The Act. Non-deductible acquisition-related expenses, primarily from the Olapic and Swyft acquisitions, contributed a charge of 31.9% to the 2017 effective tax rate. The 2017 effective tax rate included a charge of 16.4% for stock based compensation, primarily related to the change in accounting as a result of the adoption of ASU 2016-09, which requires that all tax effects of stock compensation be reflected as part of current period tax expense. See Note 2 for further discussion.
For the year ended December 31, 2016, our effective tax rate was 40.9%. The 2016 effective tax rate included a charge of 7.1% for non-deductible acquisition-related expenses primarily from the Olapic and Swyft acquisitions that are contingent on the continued employment of key employees. For financial reporting purposes, these amounts are treated as compensation expense recognized ratably over the minimum required employment periods, which range from January 2018 to August 2019. Since these transactions were accounted for as stock acquisitions, such amounts are not deductible for tax purposes.
For the year ended December 31, 2015, our effective rate was 35.3%. The 2015 effective tax rate included a charge of 3.6% for non-deductible expenses recognized due to the acceleration of the contingent payments associated with the Swyft Media acquisition. The 2015 effective tax rate also included a benefit of 3.2% for the reversal of reserves in connection with a settlement of tax audits of our subsidiary in Japan and of our 2012 U.S. federal tax return, as well as the expiration of the statute of limitations on reserves related to the Company’s 2011 tax returns. The 2015 effective tax rate included a charge of 1.0% for state and local income taxes, net of federal benefit. The foreign rate differential was a benefit of 0.5% in 2015.
In the year ended December 31, 2017, the provision for income taxes included a charge of $3.7 million that was debited directly to stockholders’ equity, rather than to the provision for income taxes related to amounts recorded directly to accumulated other comprehensive income, and a benefit of $0.3 million that was credited directly to stockholders’ equity, rather than to the provision for income taxes, for the cumulative effect adjustment related to our accounting policy election change for forfeitures, in connection with our adoption of ASU 2016-09 on January 1, 2017. The provision for income taxes includes an expense of $1.4 million for the year ended December 31, 2016 that was debited directly to stockholders’ equity, rather than to the provision for income taxes for the tax adjustment associated with the exercise of non-qualified stock options by employees and vesting of restricted stock. The provision for income taxes includes $1.9 million for the years ended December 31, 2015 that was credited directly to stockholders’ equity, rather than to the provision for income taxes for the tax benefit associated with the exercise of non-qualified stock options by employees and vesting of restricted stock. In addition, the 2016 and 2015 provision does not include benefits of $1.1 million and $1.9 million, respectively, related to other amounts recorded directly to accumulated other comprehensive income.
101
Table of Contents
Significant components of the Company’s deferred tax assets and liabilities consisted of the following (in thousands):
| December 31, | ||||||||
| 2017 | 2016 | |||||||
| Deferred tax assets: |
||||||||
| Compensation related deductions |
$ | 7,593 | $ | 9,392 | ||||
| Tax credit carryforwards |
8,053 | 1,927 | ||||||
| Federal, foreign and state net operating losses |
6,963 | 10,135 | ||||||
| Cumulative translation and foreign items |
1,064 | 5,479 | ||||||
| Accrued expenses and deferred revenue |
977 | 2,159 | ||||||
|
|
|
|
|
|||||
| Subtotal deferred tax assets |
24,650 | 29,092 | ||||||
| Valuation allowance |
(6,921 | ) | (1,617 | ) | ||||
|
|
|
|
|
|||||
| Total deferred income tax assets |
$ | 17,729 | $ | 27,475 | ||||
|
|
|
|
|
|||||
| Deferred tax liabilities: |
||||||||
| Fixed assets |
$ | 1,817 | $ | 2,447 | ||||
| Intangible assets |
16,424 | 17,644 | ||||||
| Goodwill and indefinite-lived intangibles |
25,599 | 44,419 | ||||||
| Unrealized gain |
708 | — | ||||||
|
|
|
|
|
|||||
| Total deferred tax liabilities |
$ | 44,548 | $ | 64,510 | ||||
|
|
|
|
|
|||||
| Net deferred tax liabilities |
$ | 26,819 | $ | 37,035 | ||||
|
|
|
|
|
|||||
| Deferred tax assets and liabilities as classified in the consolidated balance sheets, based on the tax jurisdiction in which they reside as follows: |
||||||||
| Net deferred income tax assets—long-term (1) |
$ | 1,185 | $ | 745 | ||||
| Net deferred income tax liabilities—long-term |
(28,004 | ) | (37,780 | ) | ||||
|
|
|
|
|
|||||
| Net deferred income tax liabilities |
$ | (26,819 | ) | $ | (37,035 | ) | ||
|
|
|
|
|
|||||
| (1) | Included in other assets in the accompanying consolidated balance sheets. |
In assessing the realizability of the deferred tax assets within each jurisdiction, the primary evidence we considered included the cumulative pre-tax income for financial reporting purposes over the past three years, and the estimated future taxable income based on historical, as well as subsequent interim period operating results. After giving consideration to these factors, we concluded that it was more likely than not that the deferred tax assets would be fully realized, and as a result, no valuation allowance against the domestic deferred tax assets was deemed necessary at December 31, 2017 and 2016, except as described below.
A valuation allowance has been established for U.S. foreign tax credit carryforwards and potential future foreign tax credit carryforwards that may primarily be generated by Monotype Germany’s deferred tax liability related to temporary differences. As of December 31, 2017 and 2016, the valuation allowance against these credits was $6.9 million and $1.4 million, respectively. As a result of the changes in U.S. tax law related to taxation of foreign earnings, the Company has concluded that utilization of existing foreign tax credit carryforwards will be significantly limited. Factors attributing to this conclusion include the significant reduction in U.S. tax rates, along with the fact that branch earnings are subject to a separate limitation, which will significantly limit the sources of future foreign source income. Monotype Germany is a branch for U.S. tax purposes, and therefore we are eligible to
102
Table of Contents
claim a foreign tax credit for taxes paid to Germany. However, under The Act, foreign tax credits related to Germany may only offset income related to Monotype Germany, thus limiting the amount of foreign tax credits that may be realized. As a result of the complexity of the U.S. foreign tax credit computation, and the uncertainty related to whether we will be entitled to a foreign tax credit when the related deferred taxes are paid or accrued, we have established a valuation allowance against these credits.
In accordance with ASC 740, the Company has recorded approximately $7.1 million as a reserve for unrecognized tax benefits at December 31, 2017. The following is a reconciliation of the Company’s gross unrecognized tax benefits at December 31, 2016 and 2017 (in thousands):
| December 31, 2015 |
$ | 5,516 | ||
| Increases related to: |
||||
| Positions taken in prior years |
147 | |||
| Positions taken and acquired in the current year |
930 | |||
|
|
|
|||
| December 31, 2016 |
$ | 6,593 | ||
| Increases related to: |
||||
| Positions taken in prior years |
34 | |||
| Positions taken in the current year |
553 | |||
| Decreases related to: |
||||
| Expiration of statute of limitations |
(65 | ) | ||
|
|
|
|||
| December 31, 2017 |
$ | 7,115 | ||
|
|
|
Of this amount of unrecognized tax benefits, approximately $5.0 million, $5.1 million and $4.5 million, if recognized, would result in a reduction of the Company’s effective tax rate at December 31, 2017, 2016 and 2015, respectively. The Company recognizes interest and penalties as a component of income tax expense. As of December 31, 2017, 2016 and 2015, the Company has accrued approximately $0.2 million, $0.2 million and $0.1 million, respectively, related to interest and penalties. The tax provision for the years ended December 31, 2017, 2016 and 2015 includes a tax expense of $0.1 million, expense of $0.1 million and a benefit of $0.1 million, respectively, for interest. The Company does not anticipate a significant change in the balance of uncertain tax positions over the next twelve months.
As a result of the enactment of The Act, the Company has included in U.S. taxable income the total amount of its undistributed earnings, and provided the incremental U.S. tax on this amount. As a result, the Company does not have any untaxed, undistributed earnings. However, the Company is indefinitely invested in its foreign subsidiaries, excluding its foreign branch in Germany, and has not provided deferred taxes for any other basis differences in its foreign subsidiaries.
The Act creates a new requirement that certain income earned by a foreign subsidiary must be included in the income of the foreign subsidiary U.S. shareholder. This income (called Global Intangible Low-Taxed Income, or GILTI) is defined as the excess of foreign subsidiaries income over a nominal return on fixed assets. The Company expects to be subject to this inclusion in future years. Under U.S. GAAP, the Company is allowed to make an accounting policy choice of either accounting for the effects of the GILTI inclusion as a current period expense, when incurred, or factoring such amounts into the Company’s measurement of its deferred taxes. The Company has elected to treat the effects of this provision as a period cost, and therefore, has not considered the impacts of GILTI on its deferred tax liabilities at December 31, 2017.
103
Table of Contents
As a result of the Olapic acquisition, the Company has federal net operating loss carryforwards of $21.1 million at December 31, 2017. The net operating losses are subject to limitations under federal Internal Revenue Code Section 382. The Company also has state net operating loss carryforwards with a state tax effect of $2.2 million. These losses are also subject to limitation in certain states.
As of December 31, 2017, the Company has foreign net operating losses with a tax effect of $0.8 million.
The Company is currently subject to audit by the Internal Revenue Service and foreign jurisdictions for the years 2014 through 2017 and the Company and its subsidiaries state income tax returns are subject to audit for the years 2013 through 2017.
12. Net income per share
Basic and diluted earnings per share are computed pursuant to the two-class method. The two-class method determines earnings per share for each class of common stock and participating security according to their respective participation rights in undistributed earnings. Unvested restricted stock awards granted to employees are considered participating securities as they receive non-forfeitable rights to cash dividends at the same rate as common stock. In accordance with ASC Topic No. 260, diluted net income per share is calculated using the more dilutive of the following two approaches:
| 1. | Assume exercise of stock options and vesting of restricted stock using the treasury stock method. |
| 2. | Assume exercise of stock options using the treasury stock method, but assume participating securities (unvested restricted stock) are not vested and allocate earnings to common shares and participating securities using the two-class method. |
104
Table of Contents
For the years ended December 31, 2017, 2016 and 2015, the two class method was used in the computation as it was the more dilutive of the two approaches. The following presents a reconciliation of the numerator and denominator used in the calculation of basic net income per share and a reconciliation of the denominator used in the calculation of diluted net income per share (in thousands, except share and per share data):
| Year Ended December 31, | ||||||||||||
| 2017 | 2016 | 2015 | ||||||||||
| Numerator: |
||||||||||||
| Net income, as reported |
$ | 11,560 | $ | 14,886 | $ | 26,197 | ||||||
| Less: net income attributable to participating securities |
(945 | ) | (491 | ) | (622 | ) | ||||||
|
|
|
|
|
|
|
|||||||
| Net income available to common shareholders—basic |
$ | 10,615 | $ | 14,395 | $ | 25,575 | ||||||
|
|
|
|
|
|
|
|||||||
| Denominator: |
||||||||||||
| Basic: |
||||||||||||
| Weighted-average shares of common stock outstanding |
41,709,787 | 40,927,360 | 39,818,129 | |||||||||
| Less: weighted-average shares of unvested restricted common stock outstanding |
(2,090,654 | ) | (1,521,660 | ) | (978,035 | ) | ||||||
|
|
|
|
|
|
|
|||||||
| Weighted-average number of common shares used in computing basic net income per common share |
39,619,133 | 39,405,700 | 38,840,094 | |||||||||
|
|
|
|
|
|
|
|||||||
| Net income per share applicable to common shareholders—basic |
$ | 0.27 | $ | 0.37 | $ | 0.66 | ||||||
|
|
|
|
|
|
|
|||||||
| Numerator: |
||||||||||||
| Net income available to common shareholders—basic |
$ | 10,615 | $ | 14,395 | $ | 25,575 | ||||||
| Plus: undistributed earnings allocated to participating securities |
— | (116 | ) | 253 | ||||||||
| Less: undistributed earnings reallocated to participating securities |
— | 115 | (249 | ) | ||||||||
|
|
|
|
|
|
|
|||||||
| Net income available to common shareholders—diluted |
$ | 10,615 | $ | 14,394 | $ | 25,579 | ||||||
|
|
|
|
|
|
|
|||||||
| Denominator: |
||||||||||||
| Diluted: |
||||||||||||
| Weighted-average shares of common stock outstanding |
41,709,787 | 40,927,360 | 39,818,129 | |||||||||
| Less: weighted-average shares of unvested restricted common stock outstanding |
(2,090,654 | ) | (1,521,660 | ) | (978,035 | ) | ||||||
| Weighted-average number of common shares issuable upon exercise of outstanding stock options, based on the treasury stock method |
239,115 | 326,223 | 542,472 | |||||||||
|
|
|
|
|
|
|
|||||||
| Weighted-average number of common shares used in computing diluted net income per common share |
39,858,248 | 39,731,923 | 39,382,566 | |||||||||
|
|
|
|
|
|
|
|||||||
| Net income per share applicable to common shareholders—diluted |
$ | 0.27 | $ | 0.36 | $ | 0.65 | ||||||
|
|
|
|
|
|
|
|||||||
105
Table of Contents
The following common share equivalents have been excluded from the computation of diluted weighted-average shares outstanding, for the periods indicated, as their effect would have been anti-dilutive:
| Year Ended December 31, | ||||||||||||
| 2017 | 2016 | 2015 | ||||||||||
| Options |
602,929 | 710,424 | 498,857 | |||||||||
| Unvested restricted common stock |
409,746 | 356,220 | 346,965 | |||||||||
| Unvested restricted stock units |
23,922 | 14,963 | 12,798 | |||||||||
13. Stockholders’ Equity
Share repurchases
On August 30, 2016, the Company’s Board of Directors approved a share purchase program permitting repurchases of up to $25.0 million of the Company’s outstanding shares of common stock through December 31, 2017. During 2016, the Company purchased 287,250 shares of its common stock under the program for $5.7 million including brokers’ fees. During 2017, the Company purchased 364,989 shares of its common stock under the program for $6.9 million including brokers’ fees. Intended to offset shareholder dilution, the Company expected to make purchases periodically, either on the open market or in privately negotiated transactions, subject to availability, as business and market conditions warranted. The share purchase program did not obligate the Company to acquire any particular amount of common stock, and the program may have been suspended or discontinued at management’s and/or the Board of Director’s discretion. As of December 31, 2017, the Company had purchased a total of 652,239 shares of its common stock of an aggregate purchase price of $12.6 million, including brokers’ fees. The plan expired on December 31, 2017.
On October 23, 2013, the Company’s Board of Directors approved a share purchase program of up to $50.0 million of the Company’s outstanding shares of common stock over the following two years. Intended to offset shareholder dilution, the Company expected purchases under the program would be made periodically, on the open market as business and market conditions warranted, through June 5, 2015, at which date the maximum amount of repurchases was reached. During the year ended December 31, 2015, the Company purchased a total of 657,028 shares of its common stock for an aggregate purchase price of $18.5 million, including brokers’ fees. Of that amount, the Company purchased 14,278 shares of common stock, for an aggregate purchase price of $0.4 million, including brokers’ fees, in excess of its publicly announced share repurchase program upon the conclusion of the program. As of December 31, 2015, the Company had purchased a total of 1,803,155 shares of its common stock for an aggregate purchase price of $50.4 million, including brokers’ fees.
Stock Compensation Plans
In November 2004, the Company’s stockholders approved the 2004 Stock Option and Grant Plan, or the 2004 Award Plan. The 2004 Award Plan provides long-term incentives and rewards to full-time and part-time officers, directors, employees, consultants, advisors and other key persons (collectively, “Key Persons”) who are responsible for, or contribute to, the management, growth or profitability of the Company. Options and stock grants issued under the 2004 Award Plan generally vested over a four year period and expired ten years from the date of grant. The Company has granted incentive stock options, nonqualified stock options and restricted stock awards under the 2004 Award Plan. The 2004 Award Plan expired on
106
Table of Contents
July 28, 2017, ten years from the date of the last equity grant. A total of 2,591,204 options and 2,810,403 restricted stock awards had been granted under the 2004 Award Plan.
In March 2007, the Company’s Board of Directors approved the adoption of the Company’s 2007 Stock Option and Incentive Plan, which was subsequently approved by stockholders in May 2007 and became effective on July 24, 2007. On March 30, 2011, the Company’s Board of Directors approved an amendment and restatement of the 2007 Stock Option and Incentive Plan, or 2007 Award Plan, which was subsequently approved by stockholders on May 13, 2011. On March 26, 2014, the Company’s Board of Directors approved a second amendment and restatement of the 2007 Award Plan which was subsequently approved by the stockholders on May 5, 2014. On March 22, 2017, the Company’s Board of Directors approved a third amendment and restatement of the 2007 Award Plan which was subsequently approved by the stockholders on May 1, 2017. The 2007 Award Plan permits the Company to make grants of incentive stock options, non-qualified stock options, stock appreciation rights, deferred stock awards, or restricted stock units, restricted stock awards, unrestricted stock awards, cash-based awards and dividend equivalent rights to Key Persons. A total of 10,703,560 shares of common stock have been authorized for issuance of awards under the 2007 Award Plan, subject to adjustment for any stock split, dividend or other change in the Company’s capitalization. In addition, shares that are forfeited or cancelled from awards under the 2004 Award Plan or the 2007 Award Plan will be available for future grants under the 2007 Award Plan. The number of shares authorized for issuance under the 2007 Award Plan increased by 2,000,000 shares from 4,383,560 in May 2011 in connection with the shareholder approval of the amended and restated 2007 Stock Option and Incentive Plan. Further in May 2014, the number of shares authorized for issuance under the 2007 Award Plan increased by 3,000,000 shares from 6,383,560, in connection with shareholder approval of the Second Amended and Restated 2007 Award Plan. The number of shares authorized for issuance under the 2007 Award Plan increased by 1,320,000 from 9,383,560 in connection with shareholder approval of the Third Amended and Restated 2007 Award Plan.
Stock options granted under the 2007 Award Plan have a maximum term of ten years from the date of grant and generally vest over four years. Option awards granted under the 2007 Award Plan must have an exercise price of no less than the fair market value of the common stock on the date of grant. The Company has granted nonqualified stock options, restricted stock awards and restricted stock units under the 2007 Plan. Some of the restricted stock units granted are subject to performance-based vesting conditions, and at December 31, 2017, 80.4% of the outstanding units are subject to performance-based vesting. The vesting for those grants is based on the achievement of specific annual Company revenue targets over one year to three consecutive years; some also have time based vesting following any achievement of the targets while others do not. For some of the awards, achievement can be accelerated or cumulative, and some of the awards contain a catch up provision. As of December 31, 2017, two annual revenue targets associated with performance-based restricted stock units had been achieved; accordingly, $0.9 million of compensation expense was recorded in the consolidated statement of income for the year then ended. The remaining performance targets associated with restricted stock units had not been met, and it was determined that it was not probable that the future performance criteria will be met; therefore, there was no compensation expense recorded for these pieces of the restricted stock units in the year ended December 31, 2017. As of December 31, 2016, it was determined that two annual revenue targets associated with the performance-based restricted stock units were probable; accordingly, $1.1 million of compensation expense was recorded in the consolidated statement of income. As of December 31, 2015, it was determined that one annual revenue target associated with the performance-based restricted stock units was probable; accordingly, $0.6 million of compensation expense was recorded in the
107
Table of Contents
consolidated statement of income. The Company will continue to monitor the circumstances of these awards.
As of December 31, 2017, 5,224,819 options, 3,677,384 restricted stock awards and 847,116 restricted stock units have been granted under the 2007 Award Plan. Pursuant to the terms of our 2007 Award Plan, we automatically reacquire any unvested restricted shares at their original price from the grantee upon termination of employment. In the years ended December 31, 2017, 2016 and 2015, the Company repurchased 181,936 shares, 123,083 shares and 37,597 shares, respectively, of unvested restricted common stock pursuant to the 2007 Award Plan.
On December 7, 2010 the Company’s Management Development and Compensation Committee approved the 2010 Inducement Stock Plan, or 2010 Inducement Plan, in connection with our acquisition of Ascender Corporation. The Company is permitted to issue equity awards to individuals in certain circumstances in accordance with Marketplace Rule 5635(c)(4) of the NASDAQ Stock Market, Inc., without prior shareholder approval. The Company established the 2010 Inducement Plan for such purpose. The 2010 Inducement Plan permits the Company to make grants of non-qualified stock options, stock appreciation rights, deferred stock awards, restricted stock awards and unrestricted stock awards to induce highly qualified prospective officers and employees, who are not employed by the Company and its subsidiaries, on the date of grant to accept employment and to provide them with a proprietary interest in the Company. The Company has reserved 700,000 shares of common stock for issuance of awards under the 2010 Inducement Plan. On July 29, 2016, the Company increased the number of shares available for issuance under the 2010 Inducement Plan by 1,000,000, and on March 22, 2017, the Board of Directors decreased the number of shares available for issuance under the 2010 Inducement Plan to 100,000. Shares of stock underlying any award that is forfeited, canceled, held back upon the exercise of an option, settlement of tax withholding or otherwise terminated shall be added back to the shares of stock available for issuance under the 2010 Inducement Plan. Stock options granted under the 2010 Inducement Plan have a maximum term of ten years from the date of grant and generally vest over four years. Option awards granted under the 2010 Inducement Plan must have an exercise price of no less than the fair market value of the common stock on the date of grant. The Company has granted nonqualified stock options, restricted stock awards and restricted stock units under the 2010 Inducement Plan.
As of December 31, 2017, 227,490 options, 914,010 restricted stock awards and 83,133 restricted stock units have been granted under the 2010 Inducement Plan. Pursuant to the terms of our 2010 Inducement Plan, we automatically reacquire any unvested restricted shares at their original price from the grantee upon termination of employment. In the years ended December 31, 2017, 2016 and 2015, we repurchased 128,379 shares, 80,000 shares and 992 shares, respectively, of our unvested restricted common stock in accordance with the 2010 Inducement Plan.
108
Table of Contents
Stock based Compensation
The following presents the impact of stock based compensation expense on our consolidated statements of income (in thousands):
| Year Ended December 31, |
||||||||||||
| 2017 | 2016 | 2015 | ||||||||||
| Marketing and selling |
$ | 9,553 | $ | 7,377 | $ | 6,312 | ||||||
| Research and development |
4,306 | 4,087 | 2,458 | |||||||||
| General and administrative |
6,261 | 5,807 | 4,813 | |||||||||
|
|
|
|
|
|
|
|||||||
| Total expensed |
$ | 20,120 | $ | 17,271 | $ | 13,583 | ||||||
| Property and equipment |
147 | — | 82 | |||||||||
|
|
|
|
|
|
|
|||||||
| Total stock based compensation |
$ | 20,267 | $ | 17,271 | $ | 13,665 | ||||||
|
|
|
|
|
|
|
|||||||
In the years ended December 31, 2017, 2016 and 2015, approximately $0.1 million, $0 and $0.1 million, respectively, of stock based compensation was capitalized, along with other certain employee related costs, as part of internal software development projects, and these amounts are included in property and equipment, net in our consolidated balance sheets.
As of December 31, 2017, the Company had $35.0 million of unrecognized compensation expense related to employees and directors unvested stock option awards, restricted share awards and restricted stock units that are expected to be recognized over a weighted-average period of 2.4 years.
Stock Option Awards
Stock option activity for all plans for the year ended December 31, 2017 is presented below:
| Number of Shares |
Weighted- Average Price per Share |
Aggregate Intrinsic Value (1) (in thousands) |
Weighted- Average Remaining Contractual Life (in Years) |
|||||||||||||
| Outstanding at December 31, 2016 |
1,275,192 | $ | 19.09 | |||||||||||||
| Granted |
— | $ | — | |||||||||||||
| Exercised |
(189,220 | ) | $ | 10.72 | ||||||||||||
| Expired |
— | $ | — | |||||||||||||
| Forfeited |
(64,584 | ) | $ | 24.40 | ||||||||||||
|
|
|
|||||||||||||||
| Outstanding at December 31, 2017 |
1,021,388 | $ | 20.30 | $ | 5,607 | 4.6 | ||||||||||
|
|
|
|||||||||||||||
| Exercisable at December 31, 2017 |
906,809 | $ | 19.55 | $ | 5,554 | 4.2 | ||||||||||
|
|
|
|||||||||||||||
| Vested and expected to vest at December 31, 2017 (2) |
1,021,388 | $ | 20.30 | $ | 5,607 | |||||||||||
|
|
|
|||||||||||||||
| (1) | The aggregate intrinsic value is calculated as the positive difference between the exercise price of the underlying options and the quoted price of our shares of common stock on December 31, 2017. |
109
Table of Contents
| (2) | Represents the number of vested options as of December 31, 2017, plus the number of unvested options at December 31, 2017 that are ultimately expected to vest. |
The aggregate intrinsic value of exercised options in the years ended December 31, 2017, 2016, and 2015 was $2.1 million, $3.3 million and $9.7 million, respectively, calculated as the difference between the exercise price of the underlying options and the estimated fair value of the common stock for the options on the respective date of exercise.
Unvested Restricted Stock Awards
Unvested restricted stock award activity for the year ended December 31, 2017 is presented below:
| Shares | Weighted- Average Fair Value Per Share |
|||||||
| Unvested shares outstanding at December 31, 2016 |
1,852,896 | $ | 24.89 | |||||
| Granted |
925,651 | $ | 20.09 | |||||
| Vested |
(592,954 | ) | $ | 25.84 | ||||
| Forfeited |
(310,315 | ) | $ | 22.44 | ||||
|
|
|
|||||||
| Unvested shares outstanding at December 31, 2017 |
1,875,278 | $ | 22.63 | |||||
|
|
|
|||||||
The fair value of shares vested during 2017, 2016 and 2015 was $12.0 million, $8.5 million, and $8.5 million, respectively.
Unvested Restricted Stock Units
Unvested restricted stock unit activity for the year ended December 31, 2017 is presented below:
| Number of Shares |
Weighted- Average Grant Date Fair Value |
Aggregate Intrinsic Value (1) (in thousands) |
Weighted- Average Remaining Contractual Life (in Years) |
|||||||||||||
| Outstanding at December 31, 2016 |
404,272 | $ | 26.02 | $ | 8,025 | 1.0 | ||||||||||
| Granted |
368,309 | $ | 20.74 | |||||||||||||
| Converted |
(47,893 | ) | $ | 23.80 | ||||||||||||
| Expired |
— | $ | — | |||||||||||||
| Forfeited |
(160,161 | ) | $ | 27.42 | ||||||||||||
|
|
|
|||||||||||||||
| Outstanding at December 31, 2017 |
564,527 | $ | 22.37 | $ | 13,605 | 0.7 | ||||||||||
|
|
|
|||||||||||||||
| Expected to convert at December 31, 2017 (2) |
173,754 | $ | 22.09 | $ | 4,187 | |||||||||||
|
|
|
|||||||||||||||
| (1) | The aggregate intrinsic value is calculated as the positive difference between the exercise price of the underlying units and the quoted price of our shares of common stock on December 31, 2017. |
| (2) | Represents the number of unvested restricted stock units as of December 31, 2017 that are ultimately expected to vest based on our probability of achievement. |
110
Table of Contents
14. Segment Reporting
We view our operations and manage our business as one segment: the development, marketing and licensing of technologies and fonts. Factors used to identify our single segment include the financial information available for evaluation by our chief operating decision maker, our president and chief executive officer, in determining how to allocate resources and assess performance. While our technologies and services are sold into two principal markets, Creative Professional and OEM, assets and expenses are not formally allocated to these market segments, and operating results are assessed on an aggregate basis to make decisions about the allocation of resources. The following table presents revenue for our two major markets (in thousands):
| Year Ended December 31, | ||||||||||||
| 2017 | 2016 | 2015 | ||||||||||
| Creative Professional |
$ | 130,595 | $ | 102,381 | $ | 88,074 | ||||||
| OEM |
105,194 | 101,060 | 104,345 | |||||||||
|
|
|
|
|
|
|
|||||||
| Total |
$ | 235,789 | $ | 203,441 | $ | 192,419 | ||||||
|
|
|
|
|
|
|
|||||||
Geographic segment information
We market our products and services through offices in the United States, United Kingdom, Germany, China, Republic of Korea and Japan. Effective as of January 1, 2017, our presentation of geographic revenue has been changed to better align with how our business operates. As a result, we now report revenue based on the geographic location of our customers, rather than based on the location of our subsidiary receiving such revenue. For example, licenses may be sold to large international companies which may be headquartered in the Republic of Korea, but the sales are received and recorded by our subsidiary located in the United States. Historically, in the table below such revenues would be included in the revenue for the United States, whereas for our new presentation, such revenues would be reported in the Republic of Korea and included in the revenue for Rest of World. Geographic revenue for the year ended 2016 has been restated to conform to this presentation. Revenue for the year ended 2015 has not been restated, as it is impracticable to do so. The following summarizes revenue by location:
| 2017 | 2016 | |||||||||||||||
| Sales | % of Total | Sales | % of Total | |||||||||||||
| United States |
$ | 101,565 | 43.1 | % | $ | 84,895 | 41.7 | % | ||||||||
| Europe, Middle East and Africa (EMEA) |
57,147 | 24.2 | 44,770 | 22.0 | ||||||||||||
| Japan |
58,566 | 24.8 | 53,620 | 26.4 | ||||||||||||
| Rest of World |
18,511 | 7.9 | 20,156 | 9.9 | ||||||||||||
|
|
|
|
|
|
|
|
|
|||||||||
| Total |
$ | 235,789 | 100.0 | % | $ | 203,441 | 100.0 | % | ||||||||
|
|
|
|
|
|
|
|
|
|||||||||
| 2015 | ||||||||
| Sales | % of Total | |||||||
| United States |
$ | 105,034 | 54.5 | % | ||||
| United Kingdom |
11,533 | 6.0 | ||||||
| Germany |
23,593 | 12.3 | ||||||
| Japan |
51,521 | 26.8 | ||||||
| Other Asia |
738 | 0.4 | ||||||
|
|
|
|
|
|||||
| Total |
$ | 192,419 | 100.0 | % | ||||
|
|
|
|
|
|||||
111
Table of Contents
Long-lived assets, which include property and equipment, goodwill and intangibles, but exclude other assets and deferred tax assets, are attributed to geographic areas in which Company assets reside and is shown below (in thousands):
| December 31, | ||||||||
| 2017 | 2016 | |||||||
| Long-lived assets: |
||||||||
| United States |
$ | 314,930 | $ | 318,786 | ||||
| United Kingdom |
4,004 | 3,882 | ||||||
| Germany |
58,319 | 52,237 | ||||||
| Asia (including Japan) |
3,497 | 3,467 | ||||||
|
|
|
|
|
|||||
| Total |
$ | 380,750 | $ | 378,372 | ||||
|
|
|
|
|
|||||
15. Commitments and Contingencies
Operating Leases
We conduct operations in facilities under operating leases expiring through 2025. In accordance with the lease terms, we pay real estate taxes and other operating costs. Our leases in New York, Massachusetts, Germany, India, South Korea and Japan contain renewal options. The Company’s future minimum payments under non-cancelable operating leases as of December 31, 2017 are approximately as follows (in thousands):
| Years ending December 31: |
||||
| 2018 |
$ | 4,899 | ||
| 2019 |
3,793 | |||
| 2020 |
2,980 | |||
| 2021 |
2,851 | |||
| 2022 |
2,654 | |||
| Thereafter |
3,255 | |||
|
|
|
|||
| Total |
$ | 20,432 | ||
|
|
|
Certain of our operating leases include escalating rental payments and lease incentives such as free rent. We record rent expense on a straight-line basis over the contractual life of the lease. Rent expense charged to operations was approximately $5.8 million, $3.5 million and $3.0 million for the years ended December 31, 2017, 2016 and 2015, respectively.
Legal Proceedings
From time to time, we may be a party to various claims, suits and complaints. We do not believe that there are claims or legal proceedings that, if determined adversely to us, would have a material adverse effect on our business, results of operations or financial condition.
Licensing Warranty
Under our standard license agreement with OEM customers, we warrant that the licensed technologies are free of infringement claims of intellectual property rights and will meet the specifications as defined in the licensing agreement for a one-year period. Under the licensing agreements, liability for such indemnity obligations is limited, generally to the total arrangement fee; however, exceptions have been made on a case-by-case basis, increasing the maximum potential liability to agreed-upon amounts at the time the contract is entered into
112
Table of Contents
or unlimited liability. We have never incurred costs payable to a customer or business partner to defend lawsuits or settle claims related to these warranties, and as a result, management believes the estimated fair value of these warranties is minimal. Accordingly, there are no liabilities recorded for these warranties as of December 31, 2017 and 2016.
16. Supplementary Financial Data (Unaudited)
(in thousands, except per share amounts)
| Three Months Ended | ||||||||||||||||||||||||||||||||
| December 31, 2017 |
September 30, 2017 |
June 30, 2017 |
March 31, 2017 |
December 31, 2016 |
September 30, 2016 |
June 30, 2016 |
March 31, 2016 |
|||||||||||||||||||||||||
| Revenue |
$ | 65,016 | $ | 60,507 | $ | 57,801 | $ | 52,465 | $ | 52,637 | $ | 52,229 | $ | 48,733 | $ | 49,842 | ||||||||||||||||
| Gross profit |
54,008 | 49,903 | 46,779 | 42,809 | 43,091 | 42,368 | 40,014 | 40,392 | ||||||||||||||||||||||||
| Net income (loss) |
11,870 | 1,261 | (496 | ) | (1,075 | ) | 450 | 2,425 | 6,653 | 5,358 | ||||||||||||||||||||||
| Net income (loss) available to common shareholders—basic |
11,304 | 1,196 | (496 | ) | (1,075 | ) | 455 | 2,341 | 6,447 | 5,218 | ||||||||||||||||||||||
| Net income (loss) available to common shareholders—diluted |
11,306 | 1,195 | (496 | ) | (1,075 | ) | 450 | 2,340 | 6,447 | 5,219 | ||||||||||||||||||||||
| Income (loss) per common share: |
||||||||||||||||||||||||||||||||
| Basic |
$ | 0.28 | $ | 0.03 | $ | (0.01 | ) | $ | (0.03 | ) | $ | 0.01 | $ | 0.06 | $ | 0.16 | $ | 0.13 | ||||||||||||||
| Diluted |
$ | 0.28 | $ | 0.03 | $ | (0.01 | ) | $ | (0.03 | ) | $ | 0.01 | $ | 0.06 | $ | 0.16 | $ | 0.13 | ||||||||||||||
17. Subsequent Events
Legal Proceedings
On January 30, 2018, Spider Search Analytics LLC filed a patent infringement action in the U.S. District Court for the District of Delaware against Monotype Imaging Holdings Inc., or the Company, claiming that Monotype Imaging Inc., a wholly owned subsidiary of the Company, has infringed on their patent for crawling the web through the Company’s use of third party software. Management is currently in the process of reviewing the allegations and has not yet completed its evaluation of the matter, and accordingly, it is not yet possible to conclude on the likelihood of a successful defense or to estimate the potential financial impact on the Company of an adverse decision. Accordingly, nothing has been accrued in our consolidated financial statements.
Dividend Declaration
On February 14, 2018 the Company’s Board of Directors declared a $0.116 per share quarterly cash dividend on our outstanding common stock. The record date is set for April 3, 2018 and the dividend is payable to shareholders on April 21, 2018. Dividends are declared at the discretion of the Company’s Board of Directors and depend on actual cash from operations, the Company’s financial condition and capital requirements and any other factors the Company’s Board of Directors may consider relevant. Future dividend declarations, as well as the record and payment dates for such dividends, will be determined by the Company’s Board of Directors on a quarterly basis.
| Item 9. | Changes In and Disagreements With Accountants on Accounting and Financial Disclosure |
None
113
Table of Contents
| Item 9A. | Controls and Procedures |
We maintain disclosure controls and procedures, which are designed to ensure that information required to be disclosed in the reports we file or submit under the Exchange Act is recorded, processed, summarized and reported within the time periods specified in the SEC’s rules and forms, and that such information is accumulated and communicated to our management, including our principal executive officer and principal financial officer, as appropriate, to allow timely decisions regarding required disclosure.
Our management, including our principal executive officer and principal financial officer, evaluated the effectiveness of our disclosure controls and procedures, as such term is defined in Rule 13a-15(e) and Rule 15d-15(e) under the Exchange Act, as of the end of the period covered by this Annual Report on Form 10-K. Based on that evaluation, our management, including our principal executive officer and principal financial officer, concluded that our disclosure controls and procedures were effective as of December 31, 2017. All internal control systems, no matter how well designed, have inherent limitations. Therefore, even those systems determined to be effective can provide only reasonable assurance with respect to financial statement preparation and presentation.
Management’s Annual Report on Internal Control Over Financial Reporting
Our management is responsible for establishing and maintaining adequate internal control over financial reporting, as this term is defined in Rule 13a-15(f) and 15d-15(f) of the Exchange Act. All internal control systems, no matter how well designed, have inherent limitations. Therefore, even those systems determined to be effective can provide only reasonable assurance with respect to financial statement preparation and presentation.
Under the supervision and with the participation of our management, including our principal executive officer and principal financial officer, we conducted an evaluation of the effectiveness of our internal control over financial reporting as of December 31, 2017 based on the framework set forth in Internal Control-Integrated Framework issued by the Committee of Sponsoring Organizations of the Treadway Commission (2013 Framework). Based on our evaluation under the framework set forth in Internal Control-Integrated Framework, our management concluded that our internal control over financial reporting was effective at the reasonable assurance level as of December 31, 2017.
Based on our evaluation under the framework set forth in Internal Control-Integrated Framework, our management concluded that our internal control over financial reporting was effective at the reasonable assurance level as of December 31, 2017.
Our internal control over financial reporting as of December 31, 2017 has been audited by Ernst & Young LLP, an independent registered public accounting firm, as stated in their report below.
Changes in Internal Control over Financial Reporting
An evaluation was also performed under the supervision and with the participation of our management, including the principal executive officer and principal financial officer, of any change in our internal controls over financial reporting that occurred during our last fiscal quarter and that has materially affected, or is reasonably likely to affect, our internal controls over financial reporting.
There has been no change in our internal controls over financial reporting during our most recent fiscal quarter that has materially affected, or is reasonably likely to materially affect, our internal controls over financial reporting.
114
Table of Contents
REPORT OF INDEPENDENT REGISTERED PUBLIC ACCOUNTING FIRM
The Board of Directors and Stockholders of
Monotype Imaging Holdings Inc.
Opinion on Internal Control over Financial Reporting
We have audited Monotype Imaging Holdings Inc.’s internal control over financial reporting as of December 31, 2017, based on criteria established in Internal Control-Integrated Framework issued by the Committee of Sponsoring Organizations of the Treadway Commission (2013 framework) (the COSO criteria). In our opinion, Monotype Imaging Holdings Inc.’s (the Company) maintained, in all material respects, effective internal control over financial reporting as of December 31, 2017, based on the COSO criteria.
We also have audited, in accordance with the standards of the Public Company Accounting Oversight Board (United States) (PCAOB), the consolidated balance sheets of Monotype Imaging Holdings Inc. as of December 31, 2017 and 2016, the related consolidated statements of income, comprehensive income, stockholders’ equity and cash flows for each of the three years in the period ended December 31, 2017, and the related notes and the financial statement schedule listed in the Index at Item 15(a) of the Company and our reported dated February 27, 2018 expressed an unqualified opinion thereon.
Basis for Opinion
The Company’s management is responsible for maintaining effective internal control over financial reporting and for its assessment of the effectiveness of internal control over financial reporting included in the accompanying Management’s Annual Report on Internal Control Over Financial Reporting. Our responsibility is to express an opinion on the Company’s internal control over financial reporting based on our audit. We are a public accounting firm registered with the PCAOB and are required to be independent with respect to the Company in accordance with the U.S. federal securities laws and the applicable rules and regulations of the Securities and Exchange Commission and the PCAOB.
We conducted our audit in accordance with the standards of the PCAOB. Those standards require that we plan and perform the audit to obtain reasonable assurance about whether effective internal control over financial reporting was maintained in all material respects.
Our audit included obtaining an understanding of internal control over financial reporting, assessing the risk that a material weakness exists, testing and evaluating the design and operating effectiveness of internal control based on the assessed risk, and performing such other procedures as we considered necessary in the circumstances. We believe that our audit provides a reasonable basis for our opinion.
Definition and Limitations of Internal Control Over Financial Reporting
A company’s internal control over financial reporting is a process designed to provide reasonable assurance regarding the reliability of financial reporting and the preparation of financial statements for external purposes in accordance with generally accepted accounting principles. A company’s internal control over financial reporting includes those policies and procedures that (1) pertain to the maintenance of records that, in reasonable detail, accurately and fairly reflect the transactions and dispositions of the assets of the company; (2) provide reasonable assurance that transactions are recorded as necessary to permit preparation of financial statements in accordance with generally accepted accounting principles, and that receipts and expenditures of the company are being made only in
115
Table of Contents
accordance with authorizations of management and directors of the company; and (3) provide reasonable assurance regarding prevention or timely detection of unauthorized acquisition, use, or disposition of the company’s assets that could have a material effect on the financial statements.
Because of its inherent limitations, internal control over financial reporting may not prevent or detect misstatements. Also, projections of any evaluation of effectiveness to future periods are subject to the risk that controls may become inadequate because of changes in conditions, or that the degree of compliance with the policies or procedures may deteriorate.
/s / Ernst & Young LLP
Boston, Massachusetts
February 27, 2018
116
Table of Contents
| Item 9B. | Other Information |
None
PART III
| Item 10. | Directors, Executive Officers and Corporate Governance |
Pursuant to General Instructions G to Form 10-K, the information required for Part III, Item 10 is incorporated herein by reference from our proxy statement in connection with our 2018 Annual Meeting of Stockholders, which proxy statement is expected to be filed with the SEC not later than 120 days after the close of our fiscal year ended December 31, 2017.
| Item 11. | Executive Compensation |
Pursuant to General Instructions G to Form 10-K, the information required for Part III, Item 11, including specifically the “Compensation Committee Report,” is incorporated herein by reference from our proxy statement in connection with our 2018 Annual Meeting of Stockholders, which proxy statement is expected to be filed with the SEC not later than 120 days after the close of our fiscal year ended December 31, 2017.
| Item 12. | Security Ownership of Certain Beneficial Owners and Management and Related Stockholder Matters |
Pursuant to General Instructions G to Form 10-K, the information required for Part III, Item 12 is incorporated herein by reference from our proxy statement in connection with our 2018 Annual Meeting of Stockholders, which proxy statement is expected to be filed with the SEC not later than 120 days after the close of our fiscal year ended December 31, 2017.
| Item 13. | Certain Relationships and Related Transactions, and Directors Independence |
Pursuant to General Instructions G to Form 10-K, the information required for Part III, Item 13 is incorporated herein by reference from our proxy statement in connection with our 2018 Annual Meeting of Stockholders, which proxy statement is expected to be filed with the SEC not later than 120 days after the close of our fiscal year ended December 31, 2017.
| Item 14. | Principal Accounting Fees and Services |
Pursuant to General Instructions G to Form 10-K, the information required for Part III, Item 14 is incorporated herein by reference from our proxy statement in connection with our 2018 Annual Meeting of Stockholders, which proxy statement is expected to be filed with the SEC not later than 120 days after the close of our fiscal year ended December 31, 2017.
117
Table of Contents
PART IV
| Item 15. | Exhibits and Financial Statement Schedules |
(a) The following documents are filed as part of this Report:
1. Consolidated Financial Statements
The financial statements required by this item are listed in Item 8, “Financial Statements and Supplementary Data” herein.
2. List of Financial Statement Schedules
See “Schedule II—Valuation and Qualifying Accounts.” All other schedules are omitted because they are not applicable, not required or the required information is shown in the consolidated financial statements or notes thereto.
3. List of Exhibits
EXHIBIT INDEX
118
Table of Contents
119
Table of Contents
120
Table of Contents
121
Table of Contents
122
Table of Contents
| Exhibit Number |
Description |
Incorporated by Reference | ||||
| Form |
Filing Date | |||||
| 101.DEF | XBRL Taxonomy Extension Definition Linkbase Document | |||||
| 101.LAB | XBRL Taxonomy Extension Label Linkbase Document | |||||
| 101.PRE | XBRL Taxonomy Extension Presentation Linkbase Document | |||||
| * | Filed herewith. |
| ** | Furnished herewith. |
| Item 16. | Form 10-K Summary |
Not applicable.
123
Table of Contents
Pursuant to the requirements of Section 13 or 15(d) of the Securities Exchange Act of 1934, the Registrant has duly caused this report to be signed on its behalf by the undersigned, thereunto duly authorized on February 27, 2018.
| MONOTYPE IMAGING HOLDINGS INC. | ||
| By: | /s/ SCOTT E. LANDERS | |
| Scott E. Landers | ||
| President and Chief Executive Officer and Director | ||
SIGNATURES AND POWER OF ATTORNEY
KNOWN ALL MEN BY THESE PRESENTS that each individual whose signature appears below constitutes and appoints each of Scott E. Landers and Anthony Callini such person’s true and lawful attorney-in-fact and agent with full power of substitution and resubstitution, for such person and in such person’s name, place and stead, in any and all capacities, to sign any and all amendments to this Annual Report on Form 10-K, and to file the same, with all exhibits thereto, and all documents in connection therewith, with the Securities and Exchange Commission, granting unto each said attorney-in-fact and agent full power and authority to do and perform each and every act and thing requisite and necessary to be done in and about the premises, as fully to all intents and purposes as such person might or could do in person, hereby ratifying and confirming all that any said attorney-in-fact and agent, or any substitute or substitutes of any of them, may lawfully do or cause to be done by virtue hereof.
Pursuant to the requirements of the Securities Exchange Act of 1934, this report has been signed by the following persons on behalf of the registrant and in the capacities and on the dates indicated:
| Signature |
Title |
Date | ||
|
/s/ SCOTT E. LANDERS Scott E. Landers |
President, Chief Executive Officer and Director (Duly Authorized Officer and Principal Executive Officer) |
February 27, 2018 | ||
| /s/ ANTHONY CALLINI Anthony Callini |
Executive Vice President, Chief Financial Officer, Treasurer and Assistant Secretary (Principal Accounting Officer) |
February 27, 2018 | ||
|
/s/ ROBERT L. LENTZ Robert L. Lentz |
Chairman of the Board of Directors | February 27, 2018 | ||
| /s/ GAY W. GADDIS Gay W. Gaddis |
Director | February 27, 2018 | ||
|
/s/ ROGER J. HEINEN, JR. Roger J. Heinen, Jr. |
Director | February 27, 2018 | ||
|
/s/ PAMELA F. LENEHAN Pamela F. Lenehan |
Director | February 27, 2018 | ||
|
/s/ DOUGLAS J. SHAW Douglas J. Shaw |
Director | February 27, 2018 | ||
| /s/ PETER J. SIMONE Peter J. Simone |
Director | February 27, 2018 | ||
|
/s/ TIMOTHY B. YEATON Timothy B. Yeaton |
Director | February 27, 2018 | ||
124
Table of Contents
MONOTYPE IMAGING HOLDINGS INC.
SCHEDULE II—VALUATION AND QUALIFYING ACCOUNTS
| Description |
Balance at Beginning of Period |
Charged (benefit) to Costs and Expenses |
Deductions | Balance at End of Period |
||||||||||||
| Reserves for Accounts Receivable: |
||||||||||||||||
| Year ended December 31, 2017 |
$ | 467 | $ | 928 | $ | (761 | ) | $ | 634 | |||||||
| Year ended December 31, 2016 |
264 | 478 | (275 | ) | 467 | |||||||||||
| Year ended December 31, 2015 |
164 | 194 | (94 | ) | 264 | |||||||||||
125