Attached files
| file | filename |
|---|---|
| EX-32.2 - EX-32.2 - IMAX CORP | d544249dex322.htm |
| EX-32.1 - EX-32.1 - IMAX CORP | d544249dex321.htm |
| EX-31.2 - EX-31.2 - IMAX CORP | d544249dex312.htm |
| EX-31.1 - EX-31.1 - IMAX CORP | d544249dex311.htm |
| EX-24 - EX-24 - IMAX CORP | d544249dex24.htm |
| EX-23 - EX-23 - IMAX CORP | d544249dex23.htm |
| EX-21 - EX-21 - IMAX CORP | d544249dex21.htm |
| EX-10.30 - EX-10.30 - IMAX CORP | d544249dex1030.htm |
| EX-10.26 - EX-10.26 - IMAX CORP | d544249dex1026.htm |
Table of Contents
UNITED STATES
SECURITIES AND EXCHANGE COMMISSION
WASHINGTON, D.C. 20549
Form 10-K
(Mark One)
| ☒ | ANNUAL REPORT PURSUANT TO SECTION 13 OR 15(d) OF THE SECURITIES EXCHANGE ACT OF 1934 |
For the fiscal year ended December 31, 2017
| ☐ | TRANSITION REPORT PURSUANT TO SECTION 13 OR 15(d) OF THE SECURITIES EXCHANGE ACT OF 1934 |
Commission file Number 001-35066
IMAX Corporation
(Exact name of registrant as specified in its charter)
| Canada | 98-0140269 | |
| (State or other jurisdiction of incorporation or organization) |
(I.R.S. Employer Identification Number) | |
| 2525 Speakman Drive, Mississauga, Ontario, Canada L5K 1B1 (905) 403-6500 |
902 Broadway, Floor 20 New York, New York, USA 10010 (212) 821-0100 | |
| (Address of principal executive offices, zip code, telephone numbers) | ||
Securities registered pursuant to Section 12(b) of the Act:
| Title of Each Class |
Name of Exchange on Which Registered | |
| Common Shares, no par value | The New York Stock Exchange |
Securities registered pursuant to Section 12(g) of the Act:
None
(Title of class)
Indicate by check mark if the registrant is a well-known seasoned issuer, as defined in Rule 405 of the Securities Act. Yes ☒ No ☐
Indicate by check mark if the registrant is not required to file reports pursuant to Section 13 or Section 15(d) of the Act. Yes ☐ No ☒
Indicate by check mark whether the registrant (1) has filed all reports required to be filed by Section 13 or 15(d) of the Securities Exchange Act of 1934 during the preceding 12 months (or for such shorter period that the registrant was required to file such reports), and (2) has been subject to such filing requirements for the past 90 days. Yes ☒ No ☐
Indicate by check mark whether the registrant has submitted electronically and posted on its corporate Web site, if any, every Interactive Data File required to be submitted and posted pursuant to Rule 405 of Regulation S-T (§232.405 of this chapter) during the preceding 12 months (or for such shorter period that the registrant was required to submit and post such files). Yes ☒ No ☐
Indicate by check mark if disclosure of delinquent filers pursuant to Item 405 of Regulation S-K is not contained herein, and will not be contained, to the best of the registrant’s knowledge, in definitive proxy or information statements incorporated by reference in Part III of this Form 10-K or any amendment to this Form 10-K ☒
Indicate by check mark whether the registrant is a large accelerated filer, an accelerated filer, a non-accelerated filer, or a smaller reporting company. See the definitions of “large accelerated filer,” “accelerated filer” and “smaller reporting company” in Rule 12b-2 of the Exchange Act. (Check one):
| Large accelerated filer | ☒ | Accelerated filer | ☐ | |||
| Non-accelerated filer | ☐ (Do not check if a smaller reporting company) | Smaller reporting Company | ☐ | |||
| Emerging growth company | ☐ | |||||
If an emerging growth company, indicate by check mark if the registrant has elected not to use the extended transition period for complying with any new or revised financial accounting standards provided pursuant to Section 13(a) of the Exchange Act. ☐
Indicate by check mark whether the registrant is a shell Company (as defined in Rule 12b-2 of the Act). Yes ☐ No ☒
The aggregate market value of the common shares of the registrant held by non-affiliates of the registrant, computed by reference to the last sale price of such shares as of the close of trading on June 30, 2017 was $1,219.7 million.
As of January 31, 2018, there were 64,902,201 common shares of the registrant outstanding.
Document Incorporated by Reference
Portions of the registrant’s definitive Proxy Statement to be filed within 120 days of the close of IMAX Corporation’s fiscal year ended December 31, 2017, with the Securities and Exchange Commission pursuant to Regulation 14A involving the election of directors and the annual meeting of the stockholders of the registrant (the “Proxy Statement”) are incorporated by reference in Part III of this Form 10-K to the extent described therein.
Table of Contents
IMAX CORPORATION
December 31, 2017
| Page | ||||||
| PART I | ||||||
| Item 1. |
4 | |||||
| Item 1A. |
15 | |||||
| Item 1B. |
23 | |||||
| Item 2. |
24 | |||||
| Item 3. |
24 | |||||
| Item 4. |
24 | |||||
| PART II | ||||||
| Item 5. |
25 | |||||
| Item 6. |
29 | |||||
| Item 7. |
Management’s Discussion and Analysis of Financial Condition and Results of Operations |
30 | ||||
| Item 7A. |
63 | |||||
| Item 8. |
65 | |||||
| Item 9. |
Changes in and Disagreements with Accountants on Accounting and Financial Disclosure |
134 | ||||
| Item 9A. |
134 | |||||
| Item 9B. |
134 | |||||
| PART III | ||||||
| Item 10. |
135 | |||||
| Item 11. |
135 | |||||
| Item 12. |
Security Ownership of Certain Beneficial Owners and Management and Related Stockholder Matters |
135 | ||||
| Item 13. |
Certain Relationships and Related Transactions, and Director Independence |
135 | ||||
| Item 14. |
135 | |||||
| PART IV | ||||||
| Item 15. |
135 | |||||
| Item 16. |
138 | |||||
| 139 | ||||||
2
Table of Contents
IMAX CORPORATION
EXCHANGE RATE DATA
Unless otherwise indicated, all dollar amounts in this document are expressed in United States (“U.S.”) dollars. The following table sets forth, for the periods indicated, certain exchange rates based on the noon buying rate in the City of New York for cable transfers in foreign currencies as certified for customs purposes by the Bank of Canada (the “Noon Buying Rate”). Such rates quoted are the number of U.S. dollars per one Canadian dollar and are the inverse of rates quoted by the Bank of Canada for Canadian dollars per U.S. $1.00. The average exchange rate is based on the average of the exchange rates on the last day of each month during such periods. The Noon Buying Rate on December 31, 2017 was U.S. $0.7971.
| Years Ended December 31, | ||||||||||
| 2017 | 2016 | 2015 | 2014 | 2013 | ||||||
| Exchange rate at end of period |
0.7971 | 0.7448 | 0.7225 | 0.8620 | 0.9402 | |||||
| Average exchange rate during period |
0.7712 | 0.7558 | 0.7748 | 0.9022 | 0.9713 | |||||
| High exchange rate during period |
0.8245 | 0.7972 | 0.8527 | 0.9422 | 1.0164 | |||||
| Low exchange rate during period |
0.7276 | 0.6854 | 0.7148 | 0.8589 | 0.9348 | |||||
SPECIAL NOTE REGARDING FORWARD-LOOKING INFORMATION
Certain statements included in this annual report may constitute “forward-looking statements” within the meaning of the United States Private Securities Litigation Reform Act of 1995. These forward-looking statements include, but are not limited to, references to future capital expenditures (including the amount and nature thereof), business and technology strategies and measures to implement strategies, competitive strengths, goals, expansion and growth of business, operations and technology, plans and references to the future success of IMAX Corporation together with its consolidated subsidiaries (the “Company”) and expectations regarding the Company’s future operating, financial and technological results. These forward-looking statements are based on certain assumptions and analyses made by the Company in light of its experience and its perception of historical trends, current conditions and expected future developments, as well as other factors it believes are appropriate in the circumstances. However, whether actual results and developments will conform with the expectations and predictions of the Company is subject to a number of risks and uncertainties, including, but not limited to, risks associated with investments and operations in foreign jurisdictions and any future international expansion, including those related to economic, political and regulatory policies of local governments and laws and policies of the United States and Canada; risks related to the Company’s growth and operations in China; the performance of IMAX DMR films; the signing of theater system agreements; conditions, changes and developments in the commercial exhibition industry; risks related to currency fluctuations; the potential impact of increased competition in the markets within which the Company operates; competitive actions by other companies; the failure to respond to change and advancements in digital technology; risks relating to recent consolidation among commercial exhibitors and studios; risks related to new business initiatives; conditions in the in-home and out-of-home entertainment industries; the opportunities (or lack thereof) that may be presented to and pursued by the Company; risks related to cyber-security; risks related to the Company’s inability to protect the Company’s intellectual property; general economic, market or business conditions; the failure to convert theater system backlog into revenue; changes in laws or regulations; the failure to fully realize the projected cost savings and benefits from the Company’s restructuring initiative; and other factors, many of which are beyond the control of the Company. Consequently, all of the forward-looking statements made in this annual report are qualified by these cautionary statements, and actual results or anticipated developments by the Company may not be realized, and even if substantially realized, may not have the expected consequences to, or effects on, the Company. The Company undertakes no obligation to update publicly or otherwise revise any forward-looking information, whether as a result of new information, future events or otherwise.
IMAX®, IMAX® Dome, IMAX® 3D, IMAX® 3D Dome, Experience It In IMAX®, The IMAX Experience®, An IMAX Experience®, An IMAX 3D Experience®, IMAX DMR®, DMR®, IMAX nXos®, IMAX think big®, think big® and IMAX Is Believing®, are trademarks and trade names of the Company or its subsidiaries that are registered or otherwise protected under laws of various jurisdictions.
3
Table of Contents
The Company is a Canadian corporation that was formed in March 1994 as a result of an amalgamation between WGIM Acquisition Corp. and the former IMAX Corporation (“Predecessor IMAX”). Predecessor IMAX was incorporated in 1967.
GENERAL
The Company, together with its consolidated subsidiaries, is one of the world’s leading entertainment technology companies, specializing in motion picture technologies and presentations. IMAX offers a unique end-to-end cinematic solution combining proprietary software, theater architecture and equipment to create the highest-quality, most immersive motion picture experience for which the IMAX® brand has become known globally. Top filmmakers and studios utilize IMAX theaters to connect with audiences in innovative ways, and as a result, IMAX’s theater network is among the most important and successful theatrical distribution platforms for major event films around the world.
The Company’s core business consists of:
| • | the Digital Re-Mastering (“DMR”) of films into the IMAX format for exhibition in the IMAX theater network in exchange for a certain percentage of contingent box office receipts from both studios and exhibitors; and |
| • | the provision of IMAX premium theater systems (“IMAX theater systems”) to exhibitor customers through sales, long-term leases or joint revenue sharing arrangements. |
IMAX theater systems are based on proprietary and patented technology developed over the course of the Company’s 50-year history. The Company’s customers who purchase, lease or otherwise acquire the IMAX theater systems through joint revenue sharing arrangements are theater exhibitors that operate commercial theaters (particularly multiplexes), museums, science centers, or destination entertainment sites. The Company generally does not own IMAX theaters, but licenses the use of its trademarks along with the sale, lease or contribution of the IMAX theater system. The Company refers to all theaters using the IMAX theater system as “IMAX theaters”.
IMAX theater systems combine:
| • | the ability to exhibit content that has undergone IMAX DMR conversion, which results in higher image and sound fidelity than conventional cinema experiences; |
| • | advanced, high-resolution projectors with specialized equipment and automated theater control systems, which generate significantly more contrast and brightness than conventional theater systems; |
| • | large screens and proprietary theater geometry, which result in a substantially larger field of view so that the screen extends to the edge of a viewer’s peripheral vision and creates more realistic images; |
| • | sound system components, which deliver more expansive sound imagery and pinpointed origination of sound to any specific spot in an IMAX theater; |
| • | specialized theater acoustics, which result in a four-fold reduction in background noise; and |
| • | a license to the globally recognized IMAX brand. |
Together these components cause audiences in IMAX theaters to feel as if they are a part of the on-screen action, creating a more intense, immersive and exciting experience than a traditional theater.
As a result of the immersiveness and superior image and sound quality of The IMAX Experience, the Company’s exhibitor customers typically charge a premium for IMAX DMR films over films exhibited in their other auditoriums. The premium pricing, combined with the higher attendance levels associated with IMAX DMR films, generates incremental box-office for the Company’s exhibitor customers and for the movie studios releasing their films to the IMAX theater network. The incremental box-office generated by IMAX DMR films has helped establish IMAX as a key premium distribution and marketing platform for Hollywood blockbuster films.
IMAX THEATER NETWORK
The Company believes the IMAX theater network is one of the most extensive premium theater networks in the world with 1,370 theater systems (1,272 commercial multiplex, 12 commercial destination, 86 institutional) operating in 75 countries as at December 31, 2017.
4
Table of Contents
The Company believes that over time its commercial multiplex theater network could grow to approximately 2,855 IMAX theaters worldwide from the 1,272 commercial multiplex IMAX theaters in operation as of December 31, 2017. While the Company continues to grow in the United States and Canada, it believes that the majority of its future growth will come from international markets. As at December 31, 2017, 67.2% of IMAX theater systems in operation were located within international markets (defined as all countries other than the United States and Canada), up from 63.7% as at December 31, 2016, and approximately 90.2% of IMAX theater systems in backlog are scheduled to be installed in international markets, compared to 87.8% as at December 31, 2016. Revenues and gross box-office derived from outside the United States and Canada continue to exceed revenues and gross box-office from the United States and Canada.
Greater China continues to be the Company’s second-largest market, measured by revenues, with approximately 33% of overall revenues generated from the Company’s China operations in 2017. As at December 31, 2017, the Company had 544 theaters operating in Greater China and an additional 309 theaters in backlog that are scheduled to be installed in Greater China by 2022. The Company’s backlog in Greater China represents 61.9% of the Company’s current backlog. The Company’s largest single international partnership is in China with Wanda Film, formerly Wanda Cinema Line Corporation (“Wanda”). Wanda’s total commitment to the Company is for 359 theater systems, of which 343 theater systems are under the parties’ joint revenue sharing arrangement.
In 2015, the Company’s subsidiary, IMAX China Holding, Inc. (“IMAX China”), completed an initial public offering of its ordinary shares on the Main Board of the Hong Kong Stock Exchange Limited (the “IMAX China IPO”). Following the IMAX China IPO, the Company continues to indirectly own approximately 67.93% of IMAX China, which remains a consolidated subsidiary of the Company.
PRINCIPAL PRODUCTS AND SERVICES
The Company believes it is the world’s largest designer and manufacturer of specialty premium projection and sound system components for large-format theaters around the world, as well as a significant producer and distributor of large-format films. The Company’s theater systems include specialized IMAX projectors, advanced sound systems and specialty screens.
The Company’s principal products and services are as follows:
| • | IMAX DMR: The Digital Re-Mastering of films into the IMAX format for exhibition in the IMAX theater network. |
| • | IMAX Theater Systems: The provision of IMAX premium theater systems to exhibitor customers. |
| • | New Business: Original content investments, virtual reality initiatives, IMAX Home Entertainment, and other new business initiatives that are in the development and/or start-up phase. |
| • | Other: The distribution of documentary films, the provision of film post-production, owning and operating certain IMAX theaters, camera rentals and other miscellaneous items. |
These product lines do not reflect the nature and sources of revenue, or the manner in which management reviews financial information. The Company’s segmented information is provided in Item 7 and note 18 to the accompanying audited consolidated financial statements in Item 8 of this Annual Report on Form 10-K for the Fiscal Year ended December 31, 2017 (this “2017 Form 10-K”), which is incorporated by reference into this Item I.
Digital Re-Mastering (IMAX DMR)
The Company has developed a proprietary technology, known as IMAX DMR, to digitally re-master Hollywood films into IMAX digital cinema package format or 15/70-format film for exhibition in IMAX theaters. IMAX DMR digitally enhances the image resolution of motion picture films for projection on IMAX screens while maintaining or enhancing the visual clarity and sound quality to levels for which The IMAX Experience is known.
The IMAX DMR process involves the following:
| • | in certain instances, scanning, at the highest possible resolution, each individual frame of the movie and converting it into a digital image; |
| • | optimizing the image using proprietary image enhancement tools; |
| • | enhancing the digital image using techniques such as sharpening, color correction, grain and noise removal and the elimination of unsteadiness and removal of unwanted artifacts; |
| • | recording the enhanced digital image into an IMAX digital cinema package (“DCP”) format or onto IMAX 15/70-format film; and |
5
Table of Contents
| • | specially re-mastering the sound track to take full advantage of the unique sound system of IMAX theater systems. |
The original soundtrack of a film to be exhibited in the IMAX theater network is re-mastered for the IMAX digital sound systems in connection with the IMAX DMR release. Unlike the soundtracks played in conventional theaters, IMAX re-mastered soundtracks are uncompressed and full fidelity. IMAX sound systems use proprietary loudspeaker systems and proprietary surround sound configurations that ensure every theater seat is in an optimal listening position.
IMAX films also benefit from enhancements made by individual filmmakers exclusively for the IMAX release, and filmmakers and studios have sought IMAX-specific enhancements in recent years to generate interest in and excitement for their films. Such enhancements include shooting select scenes with IMAX cameras to increase the audience’s immersion in the film and taking advantage of the unique dimensions of the IMAX screen by projecting the film in a larger aspect ratio. In addition, the upcoming films Marvel’s Avengers: Infinity War and the Untitled Avengers Sequel are expected to be shot in their entireties using IMAX cameras.
In 2017, 60 films were converted through the IMAX DMR process and released to theaters in the IMAX network by film studios as compared to 51 films in 2016. In addition, in 2017, in conjunction with Marvel and Disney|ABC Television Group, the Company co-produced and exclusively premiered theatrically the television series “Marvel’s Inhumans” in IMAX theaters.
To date, the Company has announced the following 31 DMR titles to be released in 2018 to the IMAX theater network:
| • | The Commuter: The IMAX Experience (Lionsgate Entertainment Inc., January 2018); |
| • | 12 Strong: The IMAX Experience (Warner Bros. Pictures, January 2018); |
| • | Padmaavat: The IMAX Experience (Viacom 18 Motion Pictures and Paramount Pictures, January 2018, India, plus limited Domestic footprint and International markets); |
| • | Maze Runner: The Death Cure: The IMAX Experience (20th Century Fox, January 2018); |
| • | Fifty Shades Freed: The IMAX Experience (Universal Pictures, February 2018); |
| • | Monster Hunt 2: The IMAX Experience (Edko Films, February 2018, China only); |
| • | Detective Chinatown 2: The IMAX Experience (WanDa Pictures, February 2018, China only); |
| • | Operation Red Sea: The IMAX Experience (Bona Film Group, February 2018, China only); |
| • | Marvel’s Black Panther: The IMAX Experience (Walt Disney Studios, February 2018); |
| • | Red Sparrow: The IMAX Experience (20th Century Fox, March 2018); |
| • | A Wrinkle in Time: The IMAX Experience (Walt Disney Studios, March 2018); |
| • | Tomb Raider: The IMAX Experience (Warner Bros. Pictures, March 2018); |
| • | Pacific Rim Uprising: The IMAX Experience (Warner Bros. Pictures, March 2018); |
| • | Ready Player One: The IMAX Experience (Warner Bros. Pictures, March 2018); |
| • | Rampage: The IMAX Experience (Warner Bros. Pictures, April 2018); |
| • | Avengers: Infinity War: The IMAX Experience (Walt Disney Studios, May 2018, most International markets – April 2018); |
| • | Deadpool 2: The IMAX Experience (20th Century Fox, May 2018, select markets only); |
| • | Solo: A Star Wars Story: The IMAX Experience (Walt Disney Studios, May 2018); |
| • | The Incredibles 2: The IMAX Experience (Walt Disney Studios, June 2018); |
| • | Jurassic World: Fallen Kingdom: The IMAX Experience (Universal Pictures, June 2018); |
| • | Ant-Man and the Wasp: The IMAX Experience (Walt Disney Studios, June 2018, US markets - July 2018); |
| • | Mission Impossible: Fallout: The IMAX Experience (Paramount Pictures, July 2018); |
| • | The Darkest Minds: The IMAX Experience (20th Century Fox, August 2018); |
| • | Predator: The IMAX Experience (20th Century Fox, September 2018); |
| • | Robin Hood: The IMAX Experience (Lionsgate Entertainment Inc., September 2018); |
| • | Venom: The IMAX Experience (Sony Pictures Entertainment, October 2018); |
| • | X-Men: Dark Phoenix: The IMAX Experience (20th Century Fox, November 2018); |
| • | Fantastic Beasts: The Crimes of Grindelwald: The IMAX Experience (Warner Bros. Pictures, November 2018); |
| • | Ralph Breaks the Internet: Wreck-It-Ralph 2: The IMAX Experience (Walt Disney Studios, December 2018, select markets); |
| • | Alita: Battle Angel: An IMAX Experience (20th Century Fox, December 2018); and |
| • | Aquaman: The IMAX Experience (Warner Bros. Pictures, December 2018). |
In addition, the Company in conjunction with Panda Productions will be releasing an IMAX original production, Pandas, in April 2018.
6
Table of Contents
The Company remains in active negotiations with all of the major Hollywood studios for additional films to fill out its short and long-term film slate, and anticipates that the number of IMAX DMR films to be released to the IMAX theater network in 2018 will be similar to the 60 IMAX DMR films released to the IMAX theater network in 2017.
IMAX Systems
The Company’s primary products are its theater systems. The Company’s digital projection systems include a projector that offers superior image quality and stability and a digital theater control system; a digital audio system delivering up to 12,000 watts of sound; a screen with a proprietary coating technology, and, if applicable, 3D glasses cleaning equipment. IMAX’s digital projection system also operates without the need for analog film prints. Traditional IMAX film-based theater systems contain the same components as the digital projection systems but include a rolling loop 15/70-format projector and require the use of analog film prints. Since its introduction in 2008, the vast majority of the Company’s theater sales have been digital systems. Furthermore, a majority of the Company’s existing film-based theater systems have been upgraded, at a cost to the exhibitor, to an IMAX digital system. As part of the arrangement to sell or lease its theater systems, the Company provides extensive advice on theater planning and design and supervision of installation services. Theater systems are also leased or sold with a license for the use of the globally recognized IMAX brand.
The Company’s digital projection system provides a premium and differentiated experience to moviegoers that is consistent with what they have come to expect from the IMAX brand, while providing for the compelling economics and flexibility that digital technology affords.
The terms of each arrangement vary according to the configuration of the theater system provided, the cinema market and the film distribution market relevant to the geographic location of the customer.
Revenue from theater business arrangements is recognized at a different time from when cash is collected. See “Critical Accounting Policies” in Item 7 for further discussion on the Company’s revenue recognition policies.
IMAX Theater Backlog and Network
The Company’s sales backlog is as follows:
| December 31, 2017 | December 31, 2016 | |||||||||||||||
| Number of Systems |
Fixed Contractual Dollar Value (in thousands) |
Number of Systems |
Fixed Contractual Dollar Value (in thousands) |
|||||||||||||
| Sales and sales-type lease arrangements |
162 | $ | 205,001 | 143 | $ | 175,331 | ||||||||||
| Joint revenue sharing arrangements |
||||||||||||||||
| Hybrid arrangements |
121 | 64,328 | (1) | 92 | 48,658 | (1) | ||||||||||
| Traditional arrangements |
216 | 11,942 | (1) | 263 | 3,680 | (1) | ||||||||||
|
|
|
|
|
|
|
|
|
|||||||||
| 499 | (2) | $ | 281,271 | 498 | (3) | $ | 227,669 | |||||||||
|
|
|
|
|
|
|
|
|
|||||||||
| (1) | Reflects contractual payments. Future contingent payments are not reflected as these are based on negotiated shares of box office results. |
| (2) | Includes 32 laser-based digital theater system configurations, including 5 upgrades. |
| (3) | Includes 20 laser-based digital theater system configurations, including 3 upgrades. |
The number of theater systems in the backlog reflects the minimum number of commitments under signed contracts. The dollar value fluctuates depending on the number of new theater system arrangements signed from year to year, which adds to backlog and the installation and acceptance of theater systems and the settlement of contracts, both of which reduce backlog. Sales backlog typically represents the fixed contracted revenue under signed theater system sale and lease agreements that the Company believes will be recognized as revenue upon installation and acceptance of the associated theater. Sales backlog includes initial fees along with the estimated present value of contractual ongoing fees due over the term, however it excludes amounts allocated to maintenance and extended warranty revenues as well as fees (contingent fees) in excess of contractual ongoing fees that may be received in the future.
7
Table of Contents
The value of sales backlog does not include revenue from theaters in which the Company has an equity interest, operating leases, letters of intent or long-term conditional theater commitments. The value of theaters under joint revenue sharing arrangements is excluded from the dollar value of sales backlog, although certain theater systems under joint revenue sharing arrangements provide for contracted upfront payments and therefore carry a backlog value based on those payments. The Company believes that the contractual obligations for theater system installations that are listed in sales backlog are valid and binding commitments.
From time to time, in the normal course of its business, the Company will have customers who are unable to proceed with a theater system installation for a variety of reasons, including the inability to obtain certain consents, approvals or financing. Once the determination is made that the customer will not proceed with installation, the agreement with the customer is terminated or amended. If the agreement is terminated, once the Company and the customer are released from all their future obligations under the agreement, all or a portion of the initial rents or fees that the customer previously made to the Company are recognized as revenue.
The following chart shows the number of the Company’s theater systems by configuration, opened theater network and backlog as at December 31:
| 2017 | 2016 | |||||||||||||||
| Theater Network |
Backlog | Theater Network |
Backlog | |||||||||||||
| Flat Screen (2D) |
5 | — | 9 | — | ||||||||||||
| Dome Screen (2D) |
41 | — | 45 | — | ||||||||||||
| IMAX 3D Dome (3D) |
2 | — | 2 | — | ||||||||||||
| IMAX 3D GT (3D) |
14 | — | 18 | — | ||||||||||||
| IMAX 3D SR (3D) |
7 | — | 9 | — | ||||||||||||
| IMAX Digital: Xenon (3D) |
1,250 | 467 | 1,093 | 478 | ||||||||||||
| IMAX Digital: Laser (3D) |
51 | 32 | (1) | 39 | 20 | (2) | ||||||||||
|
|
|
|
|
|
|
|
|
|||||||||
| Total |
1,370 | 499 | 1,215 | 498 | ||||||||||||
|
|
|
|
|
|
|
|
|
|||||||||
| (1) | Backlog includes five upgrades to laser-based digital theater systems |
| (2) | Backlog includes three upgrades to laser-based digital theater systems |
The Company estimates that it will install approximately 145 new theater systems (excluding upgrades) in 2018. The Company cautions, however, that theater system installations may slip from period to period over the course of the Company’s business, usually for reasons beyond its control.
IMAX theater systems consist of the following configurations:
IMAX Digital: Xenon Theater Systems. The vast majority of the Company’s theater system signings have been for the Company’s proprietary xenon-based digital systems. The Company believes that its xenon-based digital projection system delivers high quality imagery compared with other digital systems. As at December 31, 2017, the Company had installed 1,250 xenon-based digital theater systems and has an additional 467 xenon-based digital theater systems in its backlog.
IMAX Digital: Laser Theater Systems. The Company introduced its laser-based digital projection system at the end of 2014. The Company believes the IMAX laser-based digital projectors present greater brightness and clarity, higher contrast, a wider color gamut and deeper blacks, and consume less power and last longer than existing digital technology, capable of illuminating the largest screens in the IMAX theater network. As at December 31, 2017, the Company had installed 51 laser-based digital systems. The Company is in the process of developing an updated laser-based projection system, which is targeted primarily for screens in commercial multiplexes.
IMAX Flat Screen and IMAX Dome Theater Systems. IMAX flat screen and IMAX dome systems primarily have been installed in institutions such as museums and science centers. Flat screen IMAX theaters were introduced in 1970, while IMAX dome theaters, which are designed for tilted dome screens, were introduced in 1973. There have been several significant proprietary and patented enhancements to these systems since their introduction. As at December 31, 2017, there were 48 IMAX flat screen and IMAX dome theater systems in the IMAX network, as compared to 56 IMAX flat screen and IMAX dome theater systems as at December 31, 2016. With the introduction of the IMAX digital theater systems, there has been a decrease in the number of IMAX flat screen and IMAX dome theater systems in the network.
8
Table of Contents
IMAX 3D GT and IMAX 3D SR Theater Systems. IMAX 3D theaters utilize a flat screen 3D system, which produces realistic 3D images on an IMAX screen. As at December 31, 2017, there were 21 IMAX 3D GT and IMAX 3D SR theater systems in operation compared to 27 IMAX 3D GT and IMAX 3D SR theater systems in operation as at December 31, 2016. The decrease in the number of 3D GT and 3D SR theater systems is largely attributable to the conversion of existing 3D GT and 3D SR theater systems to IMAX digital theater systems.
New Business Initiatives
The Company is exploring new lines of business outside of its core business, with a focus on alternative location-based entertainment experiences, investments in original content, as well as premium IMAX home entertainment technologies and services.
Virtual Reality
The Company is piloting a comprehensive virtual reality (“VR”) strategy to develop a premium, location-based VR offering that delivers immersive, multi-dimensional experiences, including entertainment content and games, to branded VR centers (“IMAX VR Centers”). Pilot IMAX VR Centers are located in a stand-alone venue and in several multiplexes, and are retrofitted with proprietary VR pods that permit interactive, moveable VR experiences. The Company’s VR initiative is premised on a unique combination of premium content, proprietary design and best-in-class technology.
In January 2017, the Company launched its flagship pilot IMAX VR Center in Los Angeles. Since that time, the Company has opened six pilot IMAX VR Centers (two in New York City, one in Toronto, one in Manchester, England, one in Shanghai, China and one in Bangkok, Thailand.) The Company continues to evaluate its pilot VR strategy based on several factors, including the overall customer experience, pricing models, throughput, types of content featured and differences in geographic areas.
The Company has also established a virtual reality fund (the “VR Fund”) among the Company, its subsidiary IMAX China and other strategic investors. The VR Fund will help finance the creation of interactive VR content experiences over the next three years for use across all VR platforms, including in the pilot IMAX VR Centers. The VR Fund recently helped finance the production of one interactive VR experience, which debuted exclusively in the pilot IMAX VR Centers in November 2017 before being made available to other VR platforms.
Original Content
In 2017, the Company partnered with Marvel Television Inc. (“Marvel”) and Disney|ABC Television Group to co-produce and premiere theatrically the television series “Marvel’s Inhumans” in IMAX theaters. The first two episodes of the series ran worldwide in IMAX theaters for two weeks in September 2017 and subsequently the series premiered on the ABC network in the U.S. and across other networks internationally. As part of the investment, the Company shares in the economics across the venture, including in both the theatrical and television platforms.
The Company continues to believe that the IMAX network serves as a valuable platform to launch and distribute original content, especially during shoulder periods. However, the Company expects that future investments in original content will be less capital intensive to the Company than its investment in “Marvel’s Inhumans”.
The Company has also created two film funds to help finance the production of original content. The Company is forming the IMAX China Film Fund (the “China Film Fund”) with its subsidiary IMAX China Holding Inc. (“IMAX China”), its partner CMC and several other large investors to help fund Mandarin language commercial films. The China Film Fund, which is expected initially to be capitalized with over $80.0 million, will target productions that can leverage the Company’s brand, relationships, technology and release windows in China. The China Film Fund is expected to co-finance approximately 15 Mandarin-language tent-pole films over three years, and will target contributions of between $3.0 million and $7.0 million per film. The China Film Fund will operate under an IMAX China-CMC controlled greenlight committee.
In addition, the Company’s IMAX Original Film Fund (the “Original Film Fund”) was established in 2014 to co-finance a portfolio of 10 original large format films. The Original Film Fund, which is intended to be capitalized with up to $50.0 million, will finance an ongoing supply of original films that the Company believes will be more exciting and compelling than traditional documentaries. The initial investment in the Film Fund was committed to by a third party in the amount of $25.0 million, with the possibility of contributing additional funds. The Company agreed to contribute $9.0 million to the Original Film Fund over five years starting in 2014 and sees the Original Film Fund as a self-perpetuating vehicle designed to generate a continuous flow of high-quality documentary content. As at December 31, 2017, the Original Film Fund has invested $13.4 million toward the development of original films.
9
Table of Contents
IMAX Home Entertainment Technologies and Services
The Company has also announced home theater initiatives, including a joint venture with TCL Multimedia Technology Holding Limited (“TCL”) to design, develop, manufacture and sell a premium home theater system. The joint venture has signed agreements with end users for the sale of more than 170 premium home theater systems, and has signed agreements with distributors for the sale of more than 470 home theater systems. The Company does not intend to invest significant capital into the joint venture going forward, and instead expects any additional funding to be provided through third party capital.
Beyond its premium home theater, the Company has also developed other components of a broader home entertainment platform designed to permit customers to view content on a premium video-on-demand basis in their home theaters.
Other
The Company is also a distributor of large-format films, primarily for its institutional theater partners.
Films produced by the Company are typically financed through third parties, whereby the Company will generally receive a film production fee in exchange for producing the film and a distribution fee for distributing the film. The ownership rights to such films may be held by the film sponsors, the film investors and/or the Company. As at December 31, 2017, the Company currently has distribution rights with respect to 46 of such films, which cover such subjects such as space, wildlife, music, history and natural wonders.
Several more recent large-format films that have been distributed by the Company include: A Beautiful Planet, which was released in April 2016 and has grossed over $19.3 million as at the end of 2017; Voyage of Time, which was released in October 2016 and has grossed over $0.5 million as at the end of 2017; Island of Lemurs: Madagascar, which was released in April 2014 and has grossed over $13.8 million as at the end of 2017; Journey to the South Pacific, which was released in 2013 has grossed $13.6 million as at the end of 2017. Large-format films have significantly longer exhibition periods than conventional commercial films and many of the films in the large-format library have remained popular for many decades, including the films SPACE STATION, Hubble 3D and T-REX: Back to the Cretaceous.
The Company also provides film post-production and quality control services for large-format films (whether produced internally or externally), and digital post-production services.
As at December 31, 2017, the Company had two owned and operated IMAX theaters (December 31, 2016 — two owned and operated IMAX theaters). In addition, the Company has a commercial arrangement with one theater resulting in the sharing of profits and losses and provides management services to three other theaters. The Company also rents its proprietary 2D and 3D large-format film and digital cameras to third party production companies. The Company maintains cameras and other film equipment and also offers production advice and technical assistance to both documentary and Hollywood filmmakers.
MARKETING AND CUSTOMERS
The Company markets its theater systems through a direct sales force and marketing staff located in offices in Canada, the United States, Greater China, Europe and Asia. In addition, the Company has agreements with consultants, business brokers and real estate professionals to locate potential customers and theater sites for the Company on a commission basis.
The commercial multiplex theater segment of the IMAX theater network is the Company’s largest segment, comprising 1,272 IMAX theaters, or 92.8%, of the 1,370 IMAX theaters open as at December 31, 2017. The Company’s institutional customers include science and natural history museums, zoos, aquaria and other educational and cultural centers. The Company also sells or leases its theater systems to theme parks, private home theaters, tourist destination sites, fairs and expositions (the Commercial Destination segment). At December 31, 2017, approximately 67.2% of all opened IMAX theaters were in locations outside of the United States and Canada.
10
Table of Contents
The following table outlines the breakdown of the theater network by type and geographic location as at December 31:
| 2017 Theater Network | 2016 Theater Network | |||||||||||||||||||||||||||||||
| Commercial Multiplex |
Commercial Destination |
Institutional | Total | Commercial Multiplex |
Commercial Destination |
Institutional | Total | |||||||||||||||||||||||||
| United States |
364 | 4 | 35 | 403 | 349 | 5 | 41 | 395 | ||||||||||||||||||||||||
| Canada |
37 | 2 | 7 | 46 | 37 | 2 | 7 | 46 | ||||||||||||||||||||||||
| Greater China(1) |
527 | — | 17 | 544 | 407 | — | 17 | 424 | ||||||||||||||||||||||||
| Asia (excluding Greater China) |
100 | 1 | 3 | 104 | 93 | 2 | 3 | 98 | ||||||||||||||||||||||||
| Western Europe |
88 | 4 | 10 | 102 | 76 | 6 | 10 | 92 | ||||||||||||||||||||||||
| Russia & the CIS |
58 | — | — | 58 | 56 | — | — | 56 | ||||||||||||||||||||||||
| Latin America(2) |
42 | — | 12 | 54 | 38 | — | 12 | 50 | ||||||||||||||||||||||||
| Rest of the World |
56 | 1 | 2 | 59 | 51 | 1 | 2 | 54 | ||||||||||||||||||||||||
|
|
|
|
|
|
|
|
|
|
|
|
|
|
|
|
|
|||||||||||||||||
| Total |
1,272 | 12 | 86 | 1,370 | 1,107 | 16 | 92 | 1,215 | ||||||||||||||||||||||||
|
|
|
|
|
|
|
|
|
|
|
|
|
|
|
|
|
|||||||||||||||||
| (1) | Greater China includes the People’s Republic of China, Hong Kong, Taiwan and Macau. |
| (2) | Latin America includes South America, Central America and Mexico. |
For information on revenue breakdown by geographic area, see note 18 to the accompanying audited consolidated financial statements in Item 8 of this 2017 Form 10-K. The Company’s foreign operations are subject to certain risks. See “Risk Factors – The Company conducts business internationally, which exposes it to uncertainties and risks that could negatively affect its operations sales and future growth prospects” and “Risk Factors – The Company faces risks in connection with the continued expansion of its business in China” in Item 1A. The Company’s largest customers as at December 31, 2017, collectively represent 34.1% of the Company’s network of theaters, 28.5% of the Company’s theater system backlog and 13.2% of revenues.
INDUSTRY OVERVIEW
Competition
The out-of-home entertainment industry is very competitive, and the Company faces a number of competitive challenges. In recent years, for instance, exhibitors and entertainment technology companies have introduced their own branded, large-screen 3D auditoriums or other proprietary theater systems, some of which include laser-based projectors, and in many cases, have marketed those auditoriums or theater systems as having the same quality or attributes as an IMAX theater. The Company believes that all of these alternative formats deliver images and experiences that are inferior to The IMAX Experience.
The Company may continue to face competition in the future from companies in the entertainment industry with new technologies and/or substantially greater capital resources to develop and support them. The Company also faces in-home competition from a number of alternative motion picture distribution channels such as home video, pay-per-view, streaming services, video-on-demand, DVD, Internet and syndicated and broadcast television. The Company further competes for the public’s leisure time and disposable income with other forms of entertainment, including gaming, sporting events, concerts, live theater, social media and restaurants.
The Company believes that its competitive strengths include the value of the IMAX brand name, the premium IMAX consumer experience, the design, quality and historic reliability rate of IMAX theater systems, the return on investment of an IMAX theater, the number and quality of IMAX films that it distributes, the relationships the Company maintains with prominent Hollywood and international filmmakers, a number of whom desire to film portions of their movies with IMAX cameras, the quality of the sound system components included with the IMAX theater, the availability of Hollywood and international event films to IMAX theaters through IMAX DMR technology, consumer loyalty and the level of the Company’s service and maintenance and extended warranty efforts. The Company believes that its laser-based projection system increases further the technological superiority of the consumer experience it delivers. As a result, the Company believes that virtually all of the best performing premium theaters in the world are IMAX theaters.
11
Table of Contents
Exhibitor Consolidation
The Company’s primary customers are commercial multiplex exhibitors. The commercial exhibition industry has undergone significant consolidation in recent years, with Dalian Wanda’s acquisitions of AMC and Hoyts Group in 2012 and 2015, respectively, and AMC’s acquisition of Carmike Cinemas and Odeon & UCI Cinemas Group (“Odeon”), which includes Nordic Cinema Group (“Nordic”), in 2016. The industry continues to consolidate, as evidenced by Cineworld Group’s planned acquisition of Regal Entertainment Group, the Company’s second largest customer.
The Company believes that recent exhibitor consolidation has helped facilitate the growth of the Company’s theater network. The Company has historically enjoyed strong relationships with large commercial exhibitor chains, which have greater capital to purchase, lease or otherwise acquire IMAX theater systems. As larger commercial chains such as AMC have purchased smaller chains, those smaller chains have in turn become part of the IMAX theater network. For instance, following AMC’s acquisition of Odeon and Nordic, the Company and AMC entered into an agreement for 25 new IMAX theater systems across the Odeon and Nordic theater network. This deal represented the largest single European agreement in the Company’s history. The Company believes that continued consolidation could facilitate further signings and other strategic benefits going forward.
However, exhibitor consolidation has also resulted in individual exhibitor chains constituting a material portion of the Company’s revenue and network. Continued industry consolidation (as well as consolidation in the movie studio industry) may present risks to the Company. See “Risk Factors” in Item 1.A of this 2017 Form 10-K.
THE IMAX BRAND
IMAX is a world leader in entertainment technology. The Company relies on its brand to communicate its leadership and singular goal of creating entertainment experiences that exceed all expectations. Top filmmakers and studios use the IMAX brand to message that a film will connect with audiences in unique and extraordinary ways. The IMAX brand is a promise to deliver what today’s movie audiences crave — a memorable, more emotionally engaging, more thrilling and shareable experience. Consumer research conducted in six countries worldwide by a leading third-party research firm shows that the IMAX brand has near universal awareness, creates a special experience and is one of the most differentiated movie-going brands. On a standardized measure of brand equity, the IMAX brand ranged from two to 10 times more powerful than other exhibition and entertainment technology brands. The Company believes that its strong brand equity supports consumers’ predisposition to choose IMAX over competing brands and to pay a premium for The IMAX Experience now and into the future.
RESEARCH AND DEVELOPMENT
The Company believes that it is one of the world’s leading entertainment technology companies with significant proprietary expertise in digital and film-based projection and sound system component design, engineering and imaging technology, particularly in laser-based technology. In recent years, the Company has increased its level of research and development in order to develop laser-based projection systems. The Company rolled out its laser-based projection system at the end of 2014, which is capable of illuminating the largest screens in the Company’s network. The laser-based projection system provides greater brightness and clarity, higher contrast, a wider color gamut and deeper blacks, while consuming less power and lasting longer than existing digital technology, to ensure that the Company continues to provide the highest quality, premier movie going experience available to consumers. However, the Company has experienced lower than expected margins from the installation of these laser-based projection systems. As a result, over the past several years, the Company has focused its research and development efforts on an updated laser-based projection system, which is targeted primarily for screens in commercial multiplexes.
Recent research and development activity has also focused on the exploration of a comprehensive VR strategy to deliver immersive and interactive experiences to consumers through pilot IMAX VR Centers. The Company also has made progress deploying its proprietary expertise in image technology and 3D technology, as well as its proprietary film content and the IMAX brand, for applications in its in-home entertainment technology initiatives, including its premium home theater system with TCL. The premium home theater system incorporates 4K projection technology, together with security and delivery technology to enable the viewing of current theatrical releases that have been digitally re-mastered with IMAX enhancement technology.
Going forward, the Company plans to continue research and development activity in the future in other areas considered important to the Company’s continued commercial success, including further improving the reliability of its projectors; enhancing the Company’s 2D and 3D image quality; expanding the applicability of the Company’s digital technology; developing IMAX theater systems’ capabilities; and improving the Company’s proprietary tuning system and mastering processes. Furthermore, due to the increasing
12
Table of Contents
success major Hollywood filmmakers have experienced with IMAX cameras, the Company has identified the development and manufacture of additional IMAX cameras as an important research and development initiative.
For the years ended December 31, 2017, 2016, and 2015, the Company recorded research and development expenses of $20.9 million, $16.3 million and $12.7 million, respectively. As at December 31, 2017, 81 of the Company’s employees were connected with research and development projects.
MANUFACTURING AND SERVICE
Projector Component Manufacturing
The Company assembles the projector of its theater systems at its office in Mississauga, Ontario, Canada (near Toronto). The Company develops and designs all of the key elements of the proprietary technology involved in this component. Fabrication of a majority of parts and sub-assemblies is subcontracted to a group of carefully pre-qualified third-party suppliers. Manufacture and supply contracts are signed for the delivery of the component on an order-by-order basis. The Company believes its significant suppliers will continue to supply quality products in quantities sufficient to satisfy its needs. The Company inspects all parts and sub-assemblies, completes the final assembly and then subjects the projector to comprehensive testing individually and as a system prior to shipment. In 2017, these projectors, including both the Company’s xenon and laser-based projection systems, had reliability rates based on scheduled shows of approximately 99.9%.
Sound System Component Manufacturing
The Company develops, designs and assembles the key elements of its theater sound system component. The standard IMAX theater sound system component comprises parts from a variety of sources, with approximately 50% of the materials of each sound system attributable to proprietary parts provided under original equipment manufacturers agreements with outside vendors. These proprietary parts include custom loudspeaker enclosures and horns, specialized amplifiers, and signal processing and control equipment. The Company inspects all parts and sub-assemblies, completes the final assembly and then subjects the sound system component to comprehensive testing individually and as a system prior to shipment.
Screen and Other Components
The Company purchases its screen component and glasses cleaning equipment from third parties. The standard screen system component is comprised of a projection screen manufactured to IMAX specifications and a frame to hang the projection screen. The proprietary glasses cleaning machine is a stand-alone unit that is connected to the theater’s water and electrical supply to automate the cleaning of 3D glasses.
Maintenance and Extended Warranty Services
The Company also provides ongoing maintenance and extended warranty services to IMAX theater systems. These arrangements are usually for a separate fee, although the Company often includes free service in the initial year of an arrangement. The maintenance and extended warranty arrangements include service, maintenance and replacement parts for theater systems.
To support the IMAX theater network, the Company has personnel stationed in major markets throughout the world who provide periodic and emergency maintenance and extended warranty services on existing theater systems. The Company provides various levels of maintenance and warranty services, which are priced accordingly. Under full service programs, Company personnel typically visit each theater every six months to provide preventative maintenance, cleaning and inspection services and emergency visits to resolve problems and issues with the theater system. Under some arrangements, customers can elect to participate in a service partnership program whereby the Company trains a customer’s technician to carry out certain aspects of maintenance. Under such shared maintenance arrangements, the Company participates in certain of the customer’s maintenance checks each year, provides a specified number of emergency visits and provides spare parts, as necessary. For both xenon and laser-based digital systems, the Company provides pre-emptive maintenance, remote system monitoring and a network operations center that provides continuous access to product experts.
13
Table of Contents
PATENTS AND TRADEMARKS
The Company’s inventions cover various aspects of its proprietary technology and many of these inventions are protected by Letters of Patent or applications filed throughout the world, most significantly in the United States, Canada, China, Belgium, Japan, France, Germany and the United Kingdom. The subject matter covered by these patents, applications and other licenses encompasses theater design and geometry, electronic circuitry and mechanisms employed in projectors and projection equipment (including 3D projection equipment), a method for synchronizing digital data, a method of generating stereoscopic (3D) imaging data from a monoscopic (2D) source, a process for digitally re-mastering 35mm films into large-format, a method for increasing the dynamic range and contrast of projectors, a method for visibly seaming or superimposing images from multiple projectors and other inventions relating to digital projectors. The Company has secured the exclusive license rights from Kodak to a portfolio of more than 50 patent families covering laser projection technology as well as certain exclusive rights to a broad range of Kodak patents in the field of digital cinema. The Company has been and will continue to be diligent in the protection of its proprietary interests.
As at December 31, 2017, the Company holds 106 patents, has 14 patents pending in the United States and has corresponding patents or filed applications in many countries throughout the world. While the Company considers its patents to be important to the overall conduct of its business, it does not consider any particular patent essential to its operations. Certain of the Company’s patents for improvements to the IMAX projection system components expire between 2018 and 2034.
The Company owns or otherwise has rights to trademarks and trade names used in conjunction with the sale of its products, systems and services. The following trademarks are considered significant in terms of the current and contemplated operations of the Company: IMAX®, IMAX® Dome, IMAX® 3D, IMAX® 3D Dome, Experience It in IMAX®, The IMAX Experience®, An IMAX Experience®, An IMAX 3DExperience®, IMAX DMR®, DMR®, IMAX nXos®, IMAX think big®, think big® and IMAX Is Believing®. These trademarks are widely protected by registration or common law throughout the world. The Company also owns the service mark IMAX THEATRETM.
EMPLOYEES
The Company had 606 employees as at December 31, 2017, compared to 703 employees as at December 31, 2016. Both employee counts exclude hourly employees at the Company’s owned and operated theaters, virtual reality centers and certain other new business initiatives.
AVAILABLE INFORMATION
The Company makes available, free of charge, its Annual Reports on Form 10-K, Quarterly Reports on Form 10-Q and Current Reports on Form 8-K, and any amendments to such reports, as soon as reasonably practicable after such filings have been made with the United States Securities and Exchange Commission (the “SEC”). The public may read and copy any materials the Company files with the SEC at the SEC’s Public Reference Room at 100 F Street, NE, Washington, DC 20549, as well as obtain information on the operation of the Public Reference Room by calling the SEC at 1-800-SEC-0330. Reports may be obtained free of charge through the SEC’s website at www.sec.gov and through the Company’s website at www.imax.com or by calling the Company’s Investor Relations Department at 212-821-0100. No information included on the Company’s website shall be deemed included or otherwise incorporated into this 2017 Form 10-K, except where expressly indicated.
14
Table of Contents
| Item 1A. | Risk Factors |
If any of the risks described below occurs, the Company’s business, operating results and financial condition could be materially adversely affected.
The risks described below are not the only ones the Company faces. Additional risks not presently known to the Company or that it deems immaterial, may also impair its business or operations.
The Company conducts business internationally, which exposes it to uncertainties and risks that could negatively affect its operations, sales and future growth prospects.
A significant portion of the Company’s revenues and gross box-office are generated by customers located outside the United States and Canada. Approximately 65%, 62% and 60% of the Company’s revenues were derived outside of the United States and Canada in 2017, 2016 and 2015, respectively. As at December 31, 2017, approximately 90% of IMAX theater systems arrangements in backlog are scheduled to be installed in international markets. The Company’s network currently spans 75 different countries, and the Company expects its international operations to continue to account for an increasingly significant portion of its revenues in the future. There are a number of risks associated with operating in international markets that could negatively affect the Company’s operations, sales and future growth prospects. These risks include:
| • | new restrictions on access to markets, both for theater systems and films; |
| • | unusual or burdensome foreign laws or regulatory requirements or unexpected changes to those laws or requirements; |
| • | fluctuations in the value of foreign currency versus the U.S. dollar and potential currency devaluations; |
| • | new tariffs, trade protection measures, import or export licensing requirements, trade embargoes and other trade barriers; |
| • | imposition of foreign exchange controls in such foreign jurisdictions; |
| • | dependence on foreign distributors and their sales channels; |
| • | difficulties in staffing and managing foreign operations; |
| • | local business practices that can present challenges to compliance with applicable anti-corruption and bribery laws; |
| • | difficulties in establishing market-appropriate pricing; |
| • | less accurate and/or less reliable box-office reporting; |
| • | adverse changes in monetary and/or tax policies, and/or difficulties in repatriating cash from foreign jurisdictions (including with respect to China, where approval of the State Administration of Foreign Exchange is required); |
| • | poor recognition of intellectual property rights; |
| • | difficulties in enforcing contractual rights; |
| • | inflation; |
| • | requirements to provide performance bonds and letters of credit to international customers to secure system component deliveries; and |
| • | political, economic and social instability. |
In addition, changes in United States or Canadian foreign policy can present additional risks or uncertainties as the Company continues to expand its international operations.
15
Table of Contents
The Company faces risks in connection with the continued expansion of its business in China.
At present, Greater China is the Company’s second largest market, by revenue. In recent years, the Company’s Greater China operations have accounted for an increasingly significant portion of its overall revenues, with nearly 33% of overall revenues generated from the Company’s China operations in 2017. As at December 31, 2017, the Company had 544 theaters operating in Greater China with an additional 309 theaters in backlog, which represent 61.9% of the Company’s current backlog and which are scheduled to be installed in Greater China by 2022. Of the systems currently scheduled to be installed in Greater China, 47.3% are under joint revenue sharing arrangements, which further increase the Company’s ongoing exposure to box office performance in this market.
The China market faces a number of risks, including changes in laws and regulations, currency fluctuations, increased competition and changes in economic conditions, including the risk of an economic downturn or recession, as well as other conditions that may impact the Company’s exhibitor and studio partners, as well as consumer spending. Adverse developments in any of these areas could impact the Company’s future revenues and cash flows and could cause the Company to fail to achieve anticipated growth. In addition, over the past several years, the growth of screens in Greater China has outpaced IMAX box office growth.
Moreover, certain risks and uncertainties of doing business in China are solely within the control of the Chinese government, and Chinese law regulates both the scope of the Company’s continued expansion in China and the business conducted by it within China. For instance, the Chinese government regulates both the number and timing or terms of Hollywood films released to the China market. The Company cannot provide assurance that the Chinese government will continue to permit the release of IMAX films in China or that the timing or number of IMAX releases will be favorable to the Company. There are also uncertainties regarding the interpretation and application of laws and regulations and the enforceability of intellectual property and contract rights in China. If the Company were unable to navigate China’s regulatory environment, including with respect to its current customs inquiry, or if the Company were unable to enforce its intellectual property or contract rights in China, the Company’s business could be adversely impacted.
The success of the IMAX theater network is directly related to the availability and success of IMAX DMR films for which there can be no guarantee.
An important factor affecting the growth and success of the IMAX theater network is the availability and strategic selection of films for IMAX theaters and the box-office performance of such films. The Company itself produces only a small number of such films and, as a result, the Company relies principally on films produced by third party filmmakers and studios, including both Hollywood and local language features converted into the Company’s large format using the Company’s IMAX DMR technology. In 2017, 60 IMAX DMR films were released by studios to the worldwide IMAX theater network. There is no guarantee that filmmakers and studios will continue to release films to the IMAX theater network, or that the films selected for release to the IMAX theater network will be commercially successful. The Company is directly impacted by the box-office results for the films released to the IMAX network through its joint revenue sharing arrangements as well as through the percentage of the box-office receipts the Company receives from the studios releasing IMAX DMR films, and the Company’s continued ability to secure films, find suitable partners for joint revenue share arrangements and to sell IMAX theater systems also depends on the number and commercial success of films released to its network. The commercial success of films released to IMAX theaters depends on a number of factors outside of the Company’s control, including whether the film receives critical acclaim, the timing of its release, the success of the marketing efforts of the studio releasing the film, consumer preferences and trends in cinema attendance. Moreover, films can be subject to delays in production or changes in release schedule, which can negatively impact the number, timing and quality of IMAX DMR and IMAX original films released to the IMAX theater network.
In addition, as the Company’s international network has expanded, the Company has signed deals with studios in other countries to convert their films to the Company’s large format and release them to IMAX theaters. The Company may be unable to select films which will be successful in international markets or may be unsuccessful in selecting the right mix of Hollywood and local DMR films for a particular country or region. Also, conflicts in international release schedules may make it difficult to release every IMAX film in certain markets.
The Company depends principally on commercial movie exhibitors to purchase or lease IMAX theater systems, to supply box-office revenue under joint revenue sharing arrangements and under its sales and sales-type lease agreements and to supply venues in which to exhibit IMAX DMR films. The Company can make no assurances that exhibitors will continue to do any of these things.
The Company is unable to predict the pace at which exhibitors will purchase or lease IMAX theater systems or enter into joint revenue sharing arrangements with the Company, or whether any of the Company’s existing exhibitor customers will continue to do any of the foregoing. If exhibitors choose to reduce their levels of expansion, negotiate less favorable economic terms, or decide not to enter into transactions with the Company, the Company’s revenues would not increase at an anticipated rate and motion picture studios may be
16
Table of Contents
less willing to convert their films into the Company’s format for exhibition in commercial IMAX theaters. As a result, the Company’s future revenues and cash flows could be adversely affected.
Recent consolidation among commercial exhibitors and studios reduces the breadth of the Company’s customer base, and could result in a narrower market for the Company’s products and reduced negotiating leverage. A deterioration in the Company’s relationship with key partners could materially, adversely affect the Company’s business, financial condition or results of operation. In addition, an adverse economic impact on a significant customer’s business operations could have a corresponding material adverse effect on the Company.
The Company’s primary customers are commercial multiplex exhibitors. The commercial exhibition industry has undergone significant consolidation in recent years, with Dalian Wanda’s acquisitions of AMC and Hoyts Group in 2012 and 2015, respectively, and AMC’s acquisition of Carmike Cinemas and Odeon & UCI Cinemas Group, which includes Nordic Cinema Group, in 2016. The industry continues to consolidate, as evidenced by Cineworld Group’s planned acquisition of Regal Entertainment Group. Exhibitor concentration has resulted in individual exhibitor chains constituting a material portion of the Company’s network and revenue. For instance, Wanda and AMC continue to be the Company’s largest exhibitor customer, representing approximately, 16.4%, 13.5% and 16.0% of the Company’s total revenues in 2017, 2016 and 2015, respectively. Wanda’s current commitment to the Company stands at 359 IMAX theater systems, and Wanda and AMC together represented approximately 40.7% of the commercial network and 30.5% of the Company’s backlog as of December 31, 2017. The share of the Company’s revenue that is generated by Wanda and AMC is expected to continue to grow as the significant number of Wanda theater systems currently in backlog are opened. No assurance can be given that significant customers such as Wanda and/or AMC will continue to purchase theater systems and/or enter into joint revenue sharing arrangements with the Company and if so, whether contractual terms will be affected. If the Company does business with either Wanda and/or AMC or other large exhibitor chains less frequently or on less favorable terms than currently, the Company’s business, financial condition or results of operations may be adversely affected. In addition, an adverse economic impact on a significant customer’s business operations could have a corresponding material adverse effect on the Company.
The Company also receives revenues from studios releasing IMAX DMR films. Hollywood studios have also experienced recent consolidation, as evidenced by Walt Disney Studios’ planned acquisition of certain studio assets from Twenty First Century Fox. Studio consolidation could result in individual studios comprising a greater percentage of the Company’s film slate and overall DMR revenue, and could expose the Company to the same risks described above in connection with exhibitor consolidation.
General political, social and economic conditions can affect the Company’s business by reducing both revenue generated from existing IMAX theater systems and the demand for new IMAX theater systems.
The Company’s success depends in part on general political, social and economic conditions and the willingness of consumers to purchase tickets to IMAX movies. If movie-going becomes less popular globally, the Company’s business could be adversely affected. In addition, the Company’s operations could be adversely affected if consumers’ discretionary income falls as a result of an economic downturn. In recent years, the majority of the Company’s revenue has been directly derived from the box-office revenues of its films. Accordingly, a decline in attendance at commercial IMAX theaters could materially and adversely affect several sources of key revenue streams for the Company.
The Company also depends on the sale and lease of IMAX theater systems to commercial movie exhibitors to generate revenue. Commercial movie exhibitors generate revenues from consumer attendance at their theaters, which depends on the willingness of consumers to visit movie theaters and spend discretionary income at movie theaters. In the event of declining box-office and concession revenues, commercial exhibitors may be less willing to invest capital in new IMAX theaters. In addition, a significant portion of theaters in the Company’s backlog are expected to be installed in newly built multiplexes. An economic downturn could impact developers’ ability to secure financing and complete the buildout of these locations, thereby negatively impacting the Company’s ability to grow its theater network.
The Company may experience adverse effects due to exchange rate fluctuations.
A substantial portion of the Company’s revenues are denominated in U.S. dollars, while a substantial portion of its expenses are denominated in Canadian dollars. The Company also generates revenues in Chinese Yuan Renminbi, Euros and Japanese Yen. While the Company periodically enters into forward contracts to hedge its exposure to exchange rate fluctuations between the U.S. and the Canadian dollar, the Company may not be successful in reducing its exposure to these fluctuations. The use of derivative contracts is intended to mitigate or reduce transactional level volatility in the results of foreign operations, but does not completely eliminate volatility. Even in jurisdictions in which the Company does not accept local currency or requires minimum payments in U.S. dollars, significant local currency issues may impact the profitability of the Company’s arrangements for the Company’s customers, which
17
Table of Contents
ultimately affect the Company’s ability to negotiate cost-effective arrangements and, therefore, the Company’s results of operations. In addition, because IMAX films generate box-office in 75 different countries, unfavorable exchange rates between applicable local currencies and the U.S. dollar could affect the Company’s reported gross box-office and revenues, further impacting the Company’s results of operations.
The introduction of new, competing products and technologies could harm the Company’s business.
The out-of-home entertainment industry is very competitive, and the Company faces a number of competitive challenges. According to the National Association of Theater Owners, as at December 31, 2017, there were approximately 42,381 conventional-sized screens in North American multiplexes. The Company faces competition both in the form of technological advances in in-home entertainment as well as those within the theater-going experience. In recent years, for instance, exhibitors and entertainment technology companies have introduced their own branded, large-screen 3D auditoriums or other proprietary theater systems, and in many cases have marketed those auditoriums or theater systems as having the same quality or attributes as an IMAX theater. The Company may continue to face competition in the future from companies in the entertainment industry with new technologies and/or substantially greater capital resources to develop and support them. If the Company is unable to continue to deliver a premium movie-going experience, or if other technologies surpass those of the Company, the Company may be unable to continue to produce theater systems which are premium to, or differentiated from, other theater systems.
As noted above, the Company faces in-home competition from a number of alternative motion picture distribution channels such as home video, pay-per-view, streaming services, video-on-demand, DVD, Internet and syndicated and broadcast television. The Company further competes for the public’s leisure time and disposable income with other forms of entertainment, including gaming, sporting events, concerts, live theater, social media and restaurants.
If the Company is unable to continue to produce a differentiated theater experience, consumers may be unwilling to pay the price premiums associated with the cost of IMAX theater tickets and box-office performance of IMAX films may decline. Declining box-office performance of IMAX films could materially and adversely harm the Company’s business and prospects.
Failure to respond adequately or in a timely fashion to changes and advancements in digital technology could negatively affect the Company’s business.
There have been a number of advancements in the digital cinema field in recent years. In order to keep pace with these changes and in order to continue to provide an experience which is premium to and differentiated from conventional cinema experiences, the Company has made, and expects to continue to make, significant investments in digital technology in the form of research and development and the acquisition of third party intellectual property and/or proprietary technology. Recently, the Company has made significant investments in laser technology as part of the development of its next-generation laser-based digital projection system, which it began rolling out to the largest theaters in the IMAX network at the end of 2014. The Company continued research and development throughout 2017 to support the further development of an updated laser-based digital projection system, which is targeted primarily for screens in commercial multiplexes. The process of developing new technologies is inherently uncertain and subject to certain factors that are outside of the Company’s control, including reliance on third party partners and suppliers, and the Company can provide no assurance its investments will result in commercially viable advancements to the Company’s existing products or in commercially successful new products, or that any such advancements or products will improve upon existing technology or will be developed within the timeframe expected.
The Company is undertaking new lines of business and these new business initiatives may not be successful.
The Company is undertaking new lines of business. These initiatives represent new areas of growth for the Company and could include the offering of new products and services that may not be accepted by the market. The Company has recently explored initiatives in the fields of location-based virtual reality, original content and in-home entertainment technology, all of which are intensively competitive businesses and which are dependent on consumer demand, over which the Company has no control. If any new business in which the Company invests or attempts to develop does not progress as planned, the Company may be adversely affected by investment expenses that have not led to the anticipated results, by write-downs of its equity investments, by the distraction of management from its core business or by damage to its brand or reputation.
In addition, these initiatives may involve the formation of joint ventures and business alliances. While the Company seeks to employ the optimal structure for each such business alliance, the alliance may require a high level of cooperation with and reliance on the Company’s partners and there is a possibility that the Company may have disagreements with its relevant partner with respect to financing, technological management, product development, management strategies or otherwise. Any such disagreement may cause
18
Table of Contents
the joint venture or business alliance to be terminated.
The Company may not be able to adequately protect its intellectual property, and competitors could misappropriate its technology or brand, which could weaken its competitive position.
The Company depends on its proprietary knowledge regarding IMAX theater systems and digital and film technology. The Company relies principally upon a combination of copyright, trademark, patent and trade secret laws, restrictions on disclosures and contractual provisions to protect its proprietary and intellectual property rights. These laws and procedures may not be adequate to prevent unauthorized parties from attempting to copy or otherwise obtain the Company’s processes and technology or deter others from developing similar processes or technology, which could weaken the Company’s competitive position and require the Company to incur costs to secure enforcement of its intellectual property rights. The protection provided to the Company’s proprietary technology by the laws of foreign jurisdictions may not protect it as fully as the laws of Canada or the United States. The lack of protection afforded to intellectual property rights in certain international jurisdictions may be increasingly problematic given the extent to which future growth of the Company is anticipated to come from foreign jurisdictions. Finally, some of the underlying technologies of the Company’s products and system components are not covered by patents or patent applications.
The Company owns or licenses patents issued and patent applications pending, including those covering its digital projector, digital conversion technology and laser illumination technology. The Company’s patents are filed in the United States, often with corresponding patents or filed applications in other jurisdictions, such as Canada, China, Belgium, Japan, France, Germany and the United Kingdom. The patent applications pending may not be issued or the patents may not provide the Company with any competitive advantage. The patent applications may also be challenged by third parties. Several of the Company’s issued patents for improvements to IMAX projectors, IMAX 3D Dome and sound system components expire between 2021 and 2034. Any claims or litigation initiated by the Company to protect its proprietary technology could be time consuming, costly and divert the attention of its technical and management resources.
The IMAX brand stands for the highest quality and most immersive motion picture entertainment. Protecting the IMAX brand is a critical element in maintaining the Company’s relationships with studios and its exhibitor clients. Though the Company relies on a combination of trademark and copyright law as well as its contractual provisions to protect the IMAX brand, those protections may not be adequate to prevent erosion of the brand over time, particularly in foreign jurisdictions. Erosion of the brand could threaten the demand for the Company’s products and services and impair its ability to grow future revenue streams.
The Company faces cyber-security and similar risks, which could result in the disclosure, theft or loss of confidential or other proprietary information, including intellectual property; damage to the Company’s brand and reputation; legal exposure and financial losses.
The nature of the Company’s business involves access to and storage of confidential and proprietary content and other information, including intellectual property, as well as information regarding the Company’s customers, employees, licensees and suppliers. Although the Company maintains robust procedures to safeguard such content and information, as well as a cyber-security insurance policy, the Company’s information technology systems could be penetrated by internal or external parties’ intent on extracting information, corrupting information, stealing intellectual property or trade secrets, or disrupting business processes. Information security risks have increased in recent years because of the proliferation of new technologies and the increased sophistication and activities of perpetrators of cyber-attacks. It is possible that computer hackers could compromise the Company’s security measures or the security measures of parties with whom the Company does business, and thereby obtain the confidential or proprietary information of the Company or its customers, employees, licensees and suppliers. Any such breach or unauthorized access could result in a disruption of the Company’s operations, the theft, unauthorized use or publication of the Company’s intellectual property and other proprietary information, a reduction of the revenues the Company is able to generate from its operations, damage to the Company’s brand and reputation, a loss of confidence in the security of the Company’s business and products, and significant legal and financial exposure, each of which could potentially have an adverse effect on the Company’s business.
The Company’s revenues from existing customers are derived in part from financial reporting provided by its customers, which may be inaccurate or incomplete, resulting in lost or delayed revenues.
The Company’s revenue under its joint revenue sharing arrangements, a portion of the Company’s payments under lease or sales arrangements and its film distribution fees are based upon financial reporting provided by its customers. If such reporting is inaccurate, incomplete or withheld, the Company’s ability to receive the appropriate payments in a timely fashion that are due to it may be impaired. The Company’s contractual ability to audit IMAX theaters may not rectify payments lost or delayed as a result of customers not fulfilling their contractual obligations with respect to financial reporting.
19
Table of Contents
There is collection risk associated with payments to be received over the terms of the Company’s theater system agreements.
The Company is dependent in part on the viability of its exhibitors for collections under long-term leases, sales financing agreements and joint revenue sharing arrangements. Exhibitors or other operators may experience financial difficulties that could cause them to be unable to fulfill their contractual payment obligations to the Company. As a result, the Company’s future revenues and cash flows could be adversely affected.
The Company may not convert all of its backlog into revenue and cash flows.
At December 31, 2017, the Company’s sales backlog included 499 theater systems, consisting of 162 systems under sales arrangements and 337 theater systems under joint revenue sharing arrangements. The Company lists signed contracts for theater systems for which revenue has not been recognized as sales backlog prior to the time of revenue recognition. The total value of the sales backlog represents all signed theater system sale or lease agreements that are expected to be recognized as revenue in the future and includes initial fees along with the present value of fixed minimum ongoing fees due over the term, but excludes contingent fees in excess of fixed minimum ongoing fees that might be received in the future and maintenance and extended warranty fees. Notwithstanding the legal obligation to do so, not all of the Company’s customers with which it has signed contracts may accept delivery of theater systems that are included in the Company’s backlog. This could adversely affect the Company’s future revenues and cash flows. In addition, customers with theater system obligations in backlog sometimes request that the Company agree to modify or reduce such obligations, which the Company has agreed to in the past under certain circumstances. Customer requested delays in the installation of theater systems in backlog remain a recurring and unpredictable part of the Company’s business.
The Company’s operating results and cash flow can vary substantially from period to period and could increase the volatility of its share price.
The Company’s operating results and cash flow can fluctuate substantially from period to period. In particular, fluctuations in theater system installations and gross box-office performance of IMAX DMR content can materially affect operating results. Factors that have affected the Company’s operating results and cash flow in the past, and are likely to affect its operating results and cash flow in the future, include, among other things:
| • | the timing of signing and installation of new theater systems (particularly for installations in newly-built multiplexes, which can result in delays that are beyond the Company’s control); |
| • | the timing and commercial success of films distributed to the Company’s theater network; |
| • | the demand for, and acceptance of, its products and services; |
| • | the recognition of revenue of sales and sales-type leases; |
| • | the classification of leases as sales-type versus operating leases; |
| • | the volume of orders received and that can be filled in the quarter; |
| • | the level of its sales backlog; |
| • | the signing of film distribution agreements; |
| • | the financial performance of IMAX theaters operated by the Company’s customers and by the Company; |
| • | financial difficulties faced by customers, particularly customers in the commercial exhibition industry; |
| • | the magnitude and timing of spending in relation to the Company’s research and development efforts and related investments as well as new business initiatives; and |
| • | the number and timing of joint revenue sharing arrangement installations, related capital expenditures and timing of related cash receipts. |
20
Table of Contents
Most of the Company’s operating expenses are fixed in the short term. The Company may be unable to rapidly adjust its spending to compensate for any unexpected shortfall in sales, joint revenue sharing arrangements revenue or IMAX DMR revenue which would harm operating results for a particular period, although the results of any particular period are not necessarily indicative of its results for any period.
The Company’s theater system revenue can vary significantly from its cash flows under theater system sales or lease agreements.
The Company’s theater systems revenue can vary significantly from the associated cash flows. The Company often provides financing to customers for theater systems on a long-term basis through long-term leases or notes receivables. The terms of leases or notes receivable are typically 10 years. The Company’s sale and lease-type agreements typically provide for three major sources of cash flow related to theater systems:
| • | initial fees, which are paid in installments generally commencing upon the signing of the agreement until installation of the theater systems; |
| • | ongoing fees, which are paid monthly after all theater systems have been installed and are generally equal to the greater of a fixed minimum amount per annum and a percentage of box-office receipts; and |
| • | ongoing annual maintenance and extended warranty fees, which are generally payable commencing in the second year of theater operations. |
Initial fees generally make up the vast majority of cash received under theater system sales or lease agreements for a theater arrangement.
For sales and sales-type leases, the revenue recorded is generally equal to the sum of initial fees and the present value of minimum ongoing fees due under the agreement. Cash received from initial fees in advance of meeting the revenue recognition criteria for the theater systems is recorded as deferred revenue. Contingent fees are recognized as they are reported by the theaters after annual minimum fixed fees are exceeded.
Leases that do not transfer substantially all of the benefits and risks of ownership to the customer are classified as operating leases. For these leases, initial fees and minimum fixed ongoing fees are recognized as revenue on a straight-line basis over the lease term. Contingent fees are recognized as they are reported by the theaters after annual minimum fixed fees are exceeded.
As a result of the above, the revenue set forth in the Company’s financial statements does not necessarily correlate with the Company’s cash flow or cash position. Revenues include the present value of future contracted cash payments and there is no guarantee that the Company will receive such payments under its lease and sale agreements if its customers default on their payment obligations.
The Company’s stock price has historically been volatile and declines in market price, including as a result a market downturn, may negatively affect its ability to raise capital, issue debt, secure customer business and retain employees.
The Company is listed on the New York Stock Exchange (“NYSE”) and its publicly traded shares have in the past experienced, and may continue to experience, significant price and volume fluctuations. This market volatility could reduce the market price of its common stock, regardless of the Company’s operating performance. A decline in the capital markets generally, or an adjustment in the market price or trading volumes of the Company’s publicly traded securities, may negatively affect its ability to raise capital, issue debt, secure customer business or retain employees. These factors, as well as general economic and geopolitical conditions, may have a material adverse effect on the market price of the Company’s publicly traded securities.
The credit agreement governing the Company’s senior secured credit facility contains significant restrictions that limit its operating and financial flexibility.
The credit agreement governing the Company’s senior secured credit facility contains certain restrictive covenants that, among other things, limit its ability to:
| • | incur additional indebtedness; |
21
Table of Contents
| • | pay dividends and make distributions; |
| • | repurchase stock; |
| • | make certain investments; |
| • | transfer or sell assets; |
| • | create liens; |
| • | enter into transactions with affiliates; |
| • | issue or sell stock of subsidiaries; |
| • | create dividend or other payment restrictions affecting restricted subsidiaries; and |
| • | merge, consolidate, amalgamate or sell all or substantially all of its assets to another person. |
These restrictive covenants impose operating and financial restrictions on the Company that limit the Company’s ability to engage in acts that may be in the Company’s long-term best interests.
The Company is subject to impairment losses on its film assets.
The Company amortizes its film assets, including IMAX DMR costs capitalized using the individual film forecast method, whereby the costs of film assets are amortized and participation costs are accrued for each film in the ratio of revenues earned in the current period to management’s estimate of total revenues ultimately expected to be received for that title. Management regularly reviews, and revises when necessary, its estimates of ultimate revenues on a title-by-title basis, which may result in a change in the rate of amortization of the film assets and write-downs or impairments of film assets. Results of operations in future years include the amortization of the Company’s film assets and may be significantly affected by periodic adjustments in amortization rates.
The Company is subject to impairment losses on its inventories.
The Company records write-downs for excess and obsolete inventory based upon current estimates of future events and conditions, including the anticipated installation dates for the current backlog of theater system contracts, technological developments, signings in negotiation and anticipated market acceptance of the Company’s current and pending theater systems.
If the Company’s goodwill or long-lived assets become impaired the Company may be required to record a significant charge to earnings.
Under United States Generally Accepted Accounting Principles (“U.S. GAAP”), the Company reviews its long-lived assets for impairment when events or changes in circumstances indicate the carrying value may not be recoverable. Goodwill is required to be qualitatively assessed at least annually and when events or changes in circumstances arise or can be quantitatively tested for impairment. Factors that may be considered a change in circumstances include (but are not limited to) a decline in stock price and market capitalization, declines in future cash flows, and slower growth rates in the Company’s industry. The Company may be required to record a significant charge to earnings in its financial statements during the period in which any impairment of its goodwill or long-lived assets is determined.
Changes in accounting and changes in management’s estimates may affect the Company’s reported earnings and operating income.
U.S. GAAP and accompanying accounting pronouncements, implementation guidelines and interpretations for many aspects of the Company’s business, such as revenue recognition, film accounting, accounting for pensions and other postretirement benefits, accounting for income taxes, and treatment of goodwill or long-lived assets, are highly complex and involve many subjective judgments. Changes in these rules, their interpretation, management’s estimates, or changes in the Company’s products or business could significantly change its reported future earnings and operating income and could add significant volatility to those measures, without a comparable underlying change in cash flow from operations. See “Critical Accounting Policies” in Item 7.
22
Table of Contents
The Company may not fully realize the projected cost savings and benefits from its restructuring initiative.
The Company recently implemented a cost reduction plan that included staff reductions and the consolidation of certain leased facilities. As part of its cost reduction plan, the Company eliminated approximately 100 full-time positions, including positions at IMAX China Holding, Inc., equal to roughly 14% of the Company’s full-time global workforce. Although the Company expects the restructuring plan to result in cost savings aimed at increasing profitability, operating leverage and free cash flow, there can be no assurances that these benefits will be realized to the full extent projected. If the Company does not achieve projected savings as a result of these initiatives, or incurs higher than expected or unanticipated costs in implementing these initiatives, its business, financial condition or results of operations could be adversely impacted.
Enactment of the Tax Act could have a negative effect on the Company or its shareholders.
On December 20, 2017, the U.S. Congress passed the Tax Cuts and Jobs Act (H.R. 1) (the “Tax Act”), and on December 22, 2017, President Trump signed the Tax Act into law. The Tax Act makes significant changes to the U.S. federal income tax rules applicable to both individuals and entities, including corporations. This tax legislation reduced the U.S. statutory corporate tax rate and made other changes that could have an impact on our overall U.S. federal tax liability in a given period. The tax legislation also included a number of provisions that limit or eliminate various deductions, including interest expense, performance-based compensation for certain executives and the domestic production activities deduction, among others, that could affect the Company’s U.S. federal income tax position. The Company is continuing to evaluate the overall impact of this tax legislation on its operations and U.S. federal income tax position. See Note 9 (Income Taxes) to the consolidated financial statements included in Part II, Item 8 for further discussion of the Tax Act. There can be no assurance that changes in tax laws or regulations, both within the U.S. and the other jurisdictions in which the Company operates, will not materially and adversely affect the effective tax rate, tax payments, financial condition and results of operations. Similarly, changes in tax laws and regulations that impact the Company’s customers and counterparties or the economy generally may also impact its financial condition and results of operations. There is some uncertainty as to the impact of the Tax Act on the Company or an investment in the Company’s shares. Investors should consult with their tax advisors with respect to the status of U.S. tax reform and its potential effect on an investment in the Company’s securities.
The Company relies on its key personnel, and the loss of one or more of those personnel could harm its ability to carry out its business strategy.
The Company’s operations and prospects depend in large part on the performance and continued service of its senior management team. The Company may not find qualified replacements for any of these individuals if their services are no longer available. The loss of the services of one or more members of the Company’s senior management team could adversely affect its ability to effectively pursue its business strategy.
Because the Company is incorporated in Canada, it may be difficult for plaintiffs to enforce against the Company liabilities based solely upon U.S. federal securities laws.
The Company is incorporated under the federal laws of Canada, some of its directors and officers are residents of Canada and a substantial portion of its assets and the assets of such directors and officers are located outside the United States. As a result, it may be difficult for U.S. plaintiffs to effect service within the United States upon those directors or officers who are not residents of the United States, or to realize against them or the Company in the United States upon judgments of courts of the United States predicated upon the civil liability under the U.S. federal securities laws. In addition, it may be difficult for plaintiffs to bring an original action outside of the United States against the Company to enforce liabilities based solely on U.S. federal securities laws.
| Item 1B. | Unresolved Staff Comments |
None.
23
Table of Contents
| Item 2. | Properties |
The Company’s principal executive offices are located in Mississauga, Ontario, Canada, New York, New York, and Playa Vista, California. The Company’s principal facilities are as follows:
| Operation |
Own/Lease | Expiration | ||||
| Mississauga, Ontario (1) |
Headquarters, Administrative, Assembly and Research and Development |
Own | N/A | |||
| Playa Vista, California (2) |
Sales, Marketing, Film Production and Post-Production |
Own | N/A | |||
| New York, New York |
Executive |
Lease | 2029 | |||
| Tokyo, Japan |
Sales, Marketing and Maintenance |
Lease | 2018 | |||
| Shanghai, China |
Sales, Marketing, Maintenance and Administrative |
Lease | 2019 | |||
| Dublin, Ireland |
Sales, Marketing, Administrative and Research and Development |
Lease | 2026 | |||
| Moscow, Russia |
Sales |
Lease | 2018 | |||
| London, United Kingdom |
Sales |
Lease | 2018 |
| (1) | This facility is subject to a charge in favor of Wells Fargo Bank in connection with a secured term and revolving credit facility (see note 11 to the accompanying audited consolidated financial statements in Item 8 of this 2017 Form 10-K ). |
| (2) | This facility is subject to a charge in favor of Wells Fargo Bank in connection with the Playa Vista Loan (as defined in note 11 to the accompanying audited consolidated financial statements in Item 8 of this 2017 Form 10-K). |
The Company believes that its existing facilities and equipment are in good operating condition and are suitable for the conduct of its business.
| Item 3. | Legal Proceedings |
See note 13 to the accompanying audited consolidated financial statements in Item 8 of this 2017 Form 10-K.
| Item 4. | Mine Safety Disclosures |
Not applicable.
24
Table of Contents
| Item 5. | Market for Registrant’s Common Equity, Related Stockholder Matters, and Issuer Purchases of Equity Securities |
The Company’s common shares are listed for trading under the trading symbol “IMAX” on the NYSE. The following table sets forth the range of high and low sales prices per share for the common shares on the NYSE.
| U.S. Dollars | ||||||||
| High | Low | |||||||
| NYSE |
||||||||
| Year ended December 31, 2017 |
||||||||
| Fourth quarter |
$ | 26.40 | $ | 20.50 | ||||
| Third quarter |
$ | 23.20 | $ | 17.70 | ||||
| Second quarter |
$ | 33.60 | $ | 22.00 | ||||
| First quarter |
$ | 34.25 | $ | 30.75 | ||||
| Year ended December 31, 2016 |
||||||||
| Fourth quarter |
$ | 34.80 | $ | 27.95 | ||||
| Third quarter |
$ | 34.47 | $ | 28.55 | ||||
| Second quarter |
$ | 33.50 | $ | 27.63 | ||||
| First quarter |
$ | 33.92 | $ | 25.99 | ||||
As at January 31, 2018, the Company had approximately 239 registered holders of record of the Company’s common shares.
Over the last two years, the Company has not paid, nor does the Company have any current plans to pay, cash dividends on its common shares. The payment of dividends by the Company is subject to certain restrictions under the terms of the Company’s indebtedness (see note 11 to the accompanying audited consolidated financial statements in Item 8 and “Liquidity and Capital Resources” in Item 7 of this 2017 Form 10-K). The payment of any future dividends will be determined by the Board of Directors in light of conditions then existing, including the Company’s financial condition and requirements, future prospects, restrictions in financing agreements, business conditions and other factors deemed relevant by the Board of Directors.
Equity Compensation Plans
The following table sets forth information regarding the Company’s Equity Compensation Plan as at December 31, 2017:
| Number of Securities to be Issued Upon Exercise of Outstanding Options, Warrants and Rights |
Weighted Average Exercise Price of Outstanding Options, Warrants and Rights |
Number of Securities Remaining Available for Future Issuance Under Equity Compensation Plans (Excluding Securities Reflected in Column (a)) |
||||||||||
| Plan Category |
(a) | (b) | (c) | |||||||||
| Equity compensation plans approved by security holders |
6,077,429 | $ | 29.86 | 4,704,507 | ||||||||
| Equity compensation plans not approved by security holders |
nil | nil | nil | |||||||||
|
|
|
|
|
|
|
|||||||
| Total |
6,077,429 | $ | 29.86 | 4,704,507 | ||||||||
|
|
|
|
|
|
|
|||||||
Performance Graph
The following graph compares the total cumulative shareholder return for $100 invested on December 31, 2011 (assuming that all dividends were reinvested) in common shares of the Company against the cumulative total return of the NYSE Composite Index, the S&P/TSX Composite Index and the IMAX Peer Group to the end of the most recently completed fiscal year. The IMAX Peer Group consists of TiVo Corporation, World Wrestling Entertainment, Inc., Corus Entertainment Inc., Take-Two Interactive Software, Inc., Dolby Laboratories, Inc., Six Flags Entertainment Corporation, Lions Gate Entertainment Corp. and Cinemark Holdings, Inc.
25
Table of Contents
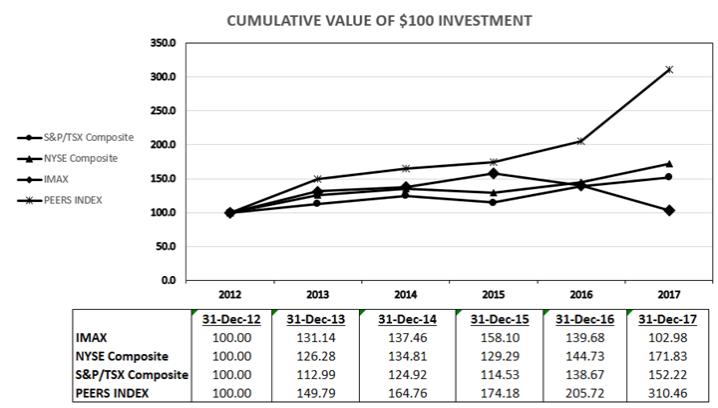
Issuer Purchases of Equity Securities
In 2017, the Company repurchased 1,736,150 common shares at an average price of $26.57 per share. The repurchases in 2017 exhausted the remaining allowance of $46.1 million under the previously announced $200.0 million share repurchase program, which expired in June 2017. The average carrying value of the stock retired was deducted from common stock and the remaining excess over the average carrying value of stock was charged to accumulated deficit. Since the inception of the prior buyback program, the Company has repurchased 6,697,406 common shares at an average price of $29.86 per share.
On June 12, 2017, the Company announced that its Board of Directors approved a new $200.0 million share repurchase program for shares of the Company’s common stock. The share purchase program expires on June 30, 2020. The repurchases may be made either in the open market or through private transactions, subject to market conditions, applicable legal requirements and other relevant factors. The Company has no obligation to repurchase shares and the share repurchase program may be suspended or discontinued by the Company at any time. There were no share repurchases under the new program in 2017.
The total number of shares repurchased during the year does not include any shares received in the administration of employee share-based compensation plans.
CERTAIN INCOME TAX CONSIDERATIONS
United States Federal Income Tax Considerations
The following discussion is a general summary of the material U.S. federal income tax consequences of the ownership and disposition of the common shares by a holder of common shares that is an individual resident of the United States or a United States corporation (a “U.S. Holder”). This discussion does not discuss all aspects of U.S. federal income taxation that may be relevant to investors subject to special treatment under U.S. federal income tax law (including, for example, owners of 10.0% or more of the voting shares of the Company).
26
Table of Contents
Distributions on Common Shares
In general, distributions (without reduction for Canadian withholding taxes) paid by the Company with respect to the common shares will be taxed to a U.S. Holder as dividend income to the extent that such distributions do not exceed the current and accumulated earnings and profits of the Company (as determined for U.S. federal income tax purposes). Subject to certain limitations, under current law dividends paid to non-corporate U.S. Holders may be eligible for a reduced rate of taxation as long as the Company is considered to be a “qualified foreign corporation”. A qualified foreign corporation includes a foreign corporation that is eligible for the benefits of an income tax treaty with the United States or a foreign corporation the stock of which is regularly tradable on an established securities market in the United States. The amount of a distribution that exceeds the current and accumulated earnings and profits of the Company will be treated first as a non-taxable return of capital to the extent of the U.S. Holder’s tax basis in the common shares and thereafter as taxable capital gain. Corporate holders generally will not be allowed a deduction for dividends received in respect of distributions on common shares. Subject to the limitations set forth in the U.S. Internal Revenue Code of 1986, as amended, as modified by the U.S.-Canada Income Tax Treaty, U.S. Holders may elect to claim a foreign tax credit against their U.S. federal income tax liability for Canadian income tax withheld from dividends. Alternatively, U.S. Holders may claim a deduction for such amounts of Canadian tax withheld.
Disposition of Common Shares
Upon the sale or other disposition of common shares, a U.S. Holder generally will recognize capital gain or loss equal to the difference between the amount realized on the sale or other disposition and such holder’s tax basis in the common shares. Gain or loss upon the sale or other disposition of the common shares will be long-term if, at the time of the sale or other disposition, the common shares have been held for more than one year. Long-term capital gains of non-corporate U.S. Holders may be eligible for a reduced rate of taxation. The deduction of capital losses is subject to limitations for U.S. federal income tax purposes.
Canadian Federal Income Tax Considerations
This summary is applicable to a holder or prospective purchaser of common shares who, for the purposes of the Income Tax Act (Canada) and any applicable treaty and at all relevant times, is not (and is not deemed to be) resident in Canada, does not (and is not deemed to) use or hold the common shares in, or in the course of, carrying on a business in Canada, and is not an insurer that carries on an insurance business in Canada and elsewhere.
This summary is based on the current provisions of the Income Tax Act (Canada), the regulations thereunder, all specific proposals to amend such Act and regulations publicly announced by or on behalf of the Minister of Finance (Canada) prior to the date hereof and the Company’s understanding of the administrative policies and assessing practices published in writing by the Canada Revenue Agency prior to the date hereof. This summary does not otherwise take into account any change in law or administrative policy or assessing practice, whether by judicial, governmental, legislative or administrative decision or action, nor does it take into account other federal or provincial, territorial or foreign tax consequences, which may vary from the Canadian federal income tax considerations described herein.
This summary is of a general nature only and it is not intended to be, nor should it be construed to be, legal or tax advice to any holder of the common shares and no representation with respect to Canadian federal income tax consequences to any holder of common shares is made herein. Accordingly, prospective purchasers and holders of the common shares should consult their own tax advisers with respect to their individual circumstances.
Dividends on Common Shares
Canadian withholding tax at a rate of 25.0% (subject to reduction under the provisions of any applicable tax treaty) will be payable on dividends (or amounts paid or credited on account or in lieu of payment of, or in satisfaction of, dividends) paid or credited to a holder of common shares. Under the Canada-U.S. Income Tax Convention (1980), as amended (the “Canada - U.S. Income Tax Treaty”) the withholding tax rate is generally reduced to 15.0% for a holder entitled to the benefits of the Canada - U.S. Income Tax Treaty who is the beneficial owner of the dividends (or 5.0% if the holder is a company that owns at least 10.0% of the common shares).
Capital Gains and Losses
Subject to the provisions of any relevant tax treaty, capital gains realized by a holder on the disposition or deemed disposition of common shares held as capital property will not be subject to Canadian tax unless the common shares are taxable Canadian property (as defined in the Income Tax Act (Canada)), in which case the capital gains will be subject to Canadian tax at rates which will approximate
27
Table of Contents
those payable by a Canadian resident. Common shares generally will not be taxable Canadian property to a holder provided that, at the time of the disposition or deemed disposition, the common shares are listed on a designated stock exchange (which currently includes the NYSE) unless at any time within the 60 month period immediately preceding such time (a) any combination of (i) such holder, (ii) persons with whom such holder did not deal at arm’s length or (iii) a partnership in which such holder or any such persons holds a membership interest either directly or indirectly through one or more partnerships, owned 25.0% or more of the issued shares of any class or series of shares of the Company and (b) more than 50% of the fair market value of the common shares was derived directly or indirectly from one or any combination of (i) real or immovable property situated in Canada, (ii) Canadian resource properties, (iii) timber resource properties, and (iv) options in respect of, or interests in, or for civil law rights in, property described in any of paragraphs (i) to (iii), whether or not the property exists. In certain circumstances set out in the Income Tax Act (Canada), the common shares may be deemed to be taxable Canadian property. Under the Canada-U.S. Income Tax Treaty, a holder entitled to the benefits of the Canada - U.S. Income Tax Treaty and to whom the common shares are taxable Canadian property will not be subject to Canadian tax on the disposition or deemed disposition of the common shares unless at the time of disposition or deemed disposition, the value of the common shares is derived principally from real property situated in Canada.
28
Table of Contents
| Item 6. | Selected Financial Data |
The selected financial data set forth below is derived from the consolidated financial information of the Company. The financial information has been prepared in accordance with U.S. GAAP. All financial information referred to herein is expressed in U.S. dollars unless otherwise noted.
| Years Ended December 31, | ||||||||||||||||||||
| (In thousands of U.S. dollars, except per share amounts) | 2017 | 2016 | 2015 | 2014 | 2013 | |||||||||||||||
| Statements of Operations Data: |
||||||||||||||||||||
| Revenues |
$ | 380,767 | $ | 377,334 | $ | 373,805 | $ | 290,541 | $ | 287,937 | ||||||||||
| Costs and expenses applicable to revenues |
195,521 | 174,656 | 154,517 | 117,153 | 123,334 | |||||||||||||||
|
|
|
|
|
|
|
|
|
|
|
|||||||||||
| Gross margin |
$ | 185,246 | $ | 202,678 | $ | 219,288 | $ | 173,388 | $ | 164,603 | ||||||||||
|
|
|
|
|
|
|
|
|
|
|
|||||||||||
| Net income |
$ | 12,518 | $ | 39,320 | $ | 64,624 | $ | 42,169 | $ | 44,115 | ||||||||||
|
|
|
|
|
|
|
|
|
|
|
|||||||||||
| Net income attributable to common shareholders |
$ | 2,344 | $ | 28,788 | $ | 55,844 | $ | 39,736 | $ | 44,115 | ||||||||||
|
|
|
|
|
|
|
|
|
|
|
|||||||||||
| Net income per share attributable to common shareholders |
|
|||||||||||||||||||
| Net income per share – basic |
||||||||||||||||||||
| Net income per share from continuing operations |
$ | 0.04 | $ | 0.43 | $ | 0.79 | $ | 0.57 | $ | 0.66 | ||||||||||
| Net income per share from discontinued operations |
— | — | — | 0.01 | — | |||||||||||||||
|
|
|
|
|
|
|
|
|
|
|
|||||||||||
| $ | 0.04 | $ | 0.43 | $ | 0.79 | $ | 0.58 | $ | 0.66 | |||||||||||
|
|
|
|
|
|
|
|
|
|
|
|||||||||||
| Net income per share – diluted |
||||||||||||||||||||
| Net income per share from continuing operations |
$ | 0.04 | $ | 0.42 | $ | 0.78 | $ | 0.56 | $ | 0.64 | ||||||||||
| Net income per share from discontinued operations |
— | — | — | — | — | |||||||||||||||
|
|
|
|
|
|
|
|
|
|
|
|||||||||||
| $ | 0.04 | $ | 0.42 | $ | 0.78 | $ | 0.56 | $ | 0.64 | |||||||||||
|
|
|
|
|
|
|
|
|
|
|
|||||||||||
BALANCE SHEET DATA
| (in thousands of U.S. dollars) | As at December 31, | |||||||||||||||||||
| 2017 | 2016 | 2015 | 2014 | 2013 | ||||||||||||||||
| Cash and cash equivalents |
$ | 158,725 | $ | 204,759 | $ | 317,449 | $ | 106,503 | $ | 29,546 | ||||||||||
| Total assets |
$ | 866,612 | $ | 857,334 | $ | 930,629 | $ | 621,106 | $ | 481,145 | ||||||||||
| Total bank indebtedness |
$ | 25,357 | $ | 27,316 | $ | 29,276 | $ | 4,283 | $ | — | ||||||||||
| Total shareholders’ equity |
$ | 602,257 | $ | 621,574 | $ | 673,850 | $ | 382,775 | $ | 319,585 | ||||||||||
In October 2016, the FASB issued ASU No. 2016-16, “Income Taxes (Topic 740)”. The purpose of ASU 2016-16 is to eliminate the exception for an intra-entity transfer of an asset other than inventory. The amendments require the recognition of the income tax consequences of an intra-entity transfer of an asset, other than inventory, when the transfer occurs. The Company elected to early adopt ASU 2016-16 during the first quarter of 2017. The impact from the adoption was reflected in the Company’s consolidated financial statements on a modified retrospective basis resulting in an increase to Accumulated deficit of $8.3 million, a decrease to Other assets of $14.8 million, an increase to Deferred taxes of $7.9 million and an increase to Accrued and other liabilities of $1.4 million.
29
Table of Contents
| Item 7. | Management’s Discussion and Analysis of Financial Condition and Results of Operations |
OVERVIEW
IMAX Corporation, together with its consolidated subsidiaries (the “Company”), is one of the world’s leading entertainment technology companies, specializing in motion picture technologies and presentations. The Company refers to all theaters using the IMAX theater system as “IMAX theaters”. IMAX offers a unique end-to-end cinematic solution combining proprietary software, theater architecture and equipment to create the highest-quality, most immersive motion picture experience for which the IMAX® brand has become known globally. Top filmmakers and studios utilize IMAX theaters to connect with audiences in innovative ways, and, as a result, IMAX’s network is among the most important and successful theatrical distribution platforms for major event films around the world. There were 1,370 IMAX theater systems (1,272 commercial multiplexes, 12 commercial destinations, 86 institutional) operating in 75 countries as of December 31, 2017. This compares to 1,215 theater systems (1,107 commercial multiplexes, 16 commercial destinations, 92 institutional) operating in 75 countries as of December 31, 2016.
The Company’s core business consists of:
| • | the Digital Re-Mastering (“DMR”) of films into the IMAX format for exhibition in the IMAX theater network in exchange for a certain percentage of contingent box office receipts from both studios and exhibitors; and |
| • | the provision of IMAX premium theater systems (“IMAX theater systems”) to exhibitor customers through sales, long-term leases or joint revenue sharing arrangements. |
IMAX theater systems are based on proprietary and patented technology developed over the course of the Company’s 50-year history and combine:
| • | the ability to exhibit content that has undergone IMAX DMR conversion, which results in higher image and sound fidelity than conventional cinema experiences; |
| • | advanced, high-resolution projectors with specialized equipment and automated theater control systems, which generate significantly more contrast and brightness than conventional theater systems; |
| • | large screens and proprietary theater geometry, which result in a substantially larger field of view so that the screen extends to the edge of a viewer’s peripheral vision and creates more realistic images; |
| • | sound system components, which deliver more expansive sound imagery and pinpointed origination of sound to any specific spot in an IMAX theater; |
| • | specialized theater acoustics, which result in a four-fold reduction in background noise; and |
| • | a license to the globally recognized IMAX brand. |
Together these components cause audiences in IMAX theaters to feel as if they are a part of the on-screen action, creating a more intense, immersive and exciting experience than in a traditional theater.
As a result of the immersiveness and superior image and sound quality of The IMAX Experience, the Company’s exhibitor customers typically charge a premium for IMAX DMR films over films exhibited in their other auditoriums. The premium pricing, combined with the higher attendance levels associated with IMAX DMR films, generates incremental box office for the Company’s exhibitor customers and for the movie studios releasing their films to the IMAX theater network. The incremental box office generated by IMAX DMR films has helped establish IMAX as a key premium distribution and marketing platform for Hollywood blockbuster films. The Company released 60 films in 2017, up from 51 films in 2016. The Company expects to release a similar number of IMAX DMR films in 2018 as compared to 2017.
SOURCES OF REVENUE
The primary revenue sources for the Company can be categorized into four main groups: network business, theater business, new business and other.
The network business includes variable revenues that are primarily derived from film studios and exhibitors. Under the Company’s DMR arrangements, the Company provides DMR services to studios in exchange for a percentage of contingent box office receipts. Under joint revenue sharing arrangements, the Company provides IMAX theater systems to exhibitors and also receives a percentage of contingent box office receipts. In addition, certain of the Company’s sales and sales-type leases require customers to make contingent rent payments that are tied to box office performance, and this contingent rent is included in the network business.
30
Table of Contents
The theater business includes fixed revenues that are primarily derived from theater exhibitors through either a sale or sales-type lease arrangement for IMAX theater systems. Sales and sales-type lease arrangements typically require fixed upfront and annual minimum payments. The Company’s theater business also includes fixed revenues that are required under its hybrid theater systems from the joint revenue sharing arrangements segment. In addition, theater exhibitors also pay for associated maintenance, extended warranty services and the provision of aftermarket parts of its system components, and these revenues are included in the theater business.
New business includes revenues from content licensing and distribution fees associated with the Company’s original content investments, virtual reality initiatives, IMAX Home Entertainment, and other new business initiatives that are in the development and/or start-up phase).
The Company also derives a small portion of other revenues from the film studios for provision of film production services, operation of its owned and operated theaters and camera rentals.
The Company believes that separating the fixed price revenues from the variable sources of revenue, as well as isolating its non-core new business initiatives, provides greater transparency into the Company’s performance.
Network Business: Digital Re-Mastering (IMAX DMR) and Joint Revenue Sharing Arrangements
Digital Re-Mastering (IMAX DMR)
The Company has developed a proprietary technology, known as IMAX DMR, to digitally re-master Hollywood films into IMAX digital cinema package format or 15/70-format film for exhibition in IMAX theaters at a cost that is incurred by the Company. IMAX DMR digitally enhances the image resolution of motion picture films for projection on IMAX screens while maintaining or enhancing the visual clarity and sound quality to levels for which The IMAX Experience is known. In a typical IMAX DMR film arrangement, the Company receives a percentage, which in recent years has averaged approximately 12.5%, of net box office receipts, defined as gross box office receipts less applicable sales taxes, of any commercial films released outside of Greater China in return for converting them to the IMAX DMR format and distributing them through the IMAX theater network. Within Greater China, the Company receives a lower percentage of box office receipts for certain Hollywood films.
IMAX films also benefit from enhancements made by individual filmmakers exclusively for the IMAX release, and filmmakers and studios have sought IMAX-specific enhancements in recent years to generate interest in and excitement for their films. Such enhancements include shooting select scenes with IMAX cameras to increase the audience’s immersion in the film and taking advantage of the unique dimensions of the IMAX screen by projecting the film in a larger aspect ratio. In addition, the upcoming films Marvel’s Avengers: Infinity War and the Untitled Avengers Sequel are expected to be shot in their entireties using IMAX cameras.
The original soundtrack of a film to be released to the IMAX theater network is re-mastered for the IMAX digital sound systems in connection with the IMAX DMR release. Unlike the soundtracks played in conventional theaters, IMAX re-mastered soundtracks are uncompressed and full fidelity. IMAX sound systems use proprietary loudspeaker systems and proprietary surround sound configurations that ensure every theater seat is in an optimal listening position.
The Company believes that the growth in international box office remains an important driver of future growth for the Company. During the year ended December 31, 2017, 63.4% of the Company’s gross box office from IMAX DMR films was generated in international markets, as compared to 61.8% in the year ended December 31, 2016. To support continued growth in international markets, the Company has sought to bolster its international film strategy, supplementing the Company’s film slate of Hollywood DMR titles with appealing local IMAX DMR releases in select markets. During the year ended December 31, 2017, 22 local language IMAX DMR films including 15 in China, three in Russia, three in Japan and one in India were released to the IMAX theater network. The Company expects to announce additional local language IMAX DMR films to be released to the IMAX theater network in the remainder of 2018 and beyond.
In addition, in conjunction with Marvel and Disney|ABC Television Group, the Company co-produced and exclusively premiered theatrically the television series “Marvel’s Inhumans” in IMAX theaters.
To date, the Company has announced the following 31 DMR titles to be released in 2018 to the IMAX theater network:
| • | The Commuter: The IMAX Experience (Lionsgate Entertainment Inc., January 2018); |
| • | 12 Strong: The IMAX Experience (Warner Bros. Pictures, January 2018); |
31
Table of Contents
| • | Padmaavat: The IMAX Experience (Viacom 18 Motion Pictures and Paramount Pictures, January 2018, India, plus limited Domestic footprint and International markets); |
| • | Maze Runner: The Death Cure: The IMAX Experience (20th Century Fox, January 2018); |
| • | Fifty Shades Freed: The IMAX Experience (Universal Pictures, February 2018); |
| • | Monster Hunt 2: The IMAX Experience (Edko Films, February 2018, China only); |
| • | Detective Chinatown 2: The IMAX Experience (WanDa Pictures, February 2018, China only); |
| • | Operation Red Sea: The IMAX Experience (Bona Film Group, February 2018, China only); |
| • | Marvel’s Black Panther: The IMAX Experience (Walt Disney Studios, February 2018); |
| • | Red Sparrow: The IMAX Experience (20th Century Fox, March 2018); |
| • | A Wrinkle in Time: The IMAX Experience (Walt Disney Studios, March 2018); |
| • | Tomb Raider: The IMAX Experience (Warner Bros. Pictures, March 2018); |
| • | Pacific Rim Uprising: The IMAX Experience (Warner Bros. Pictures, March 2018); |
| • | Ready Player One: The IMAX Experience (Warner Bros. Pictures, March 2018); |
| • | Rampage: The IMAX Experience (Warner Bros. Pictures, April 2018); |
| • | Avengers: Infinity War: The IMAX Experience (Walt Disney Studios, May 2018, most International markets – April 2018); |
| • | Deadpool 2: The IMAX Experience (20th Century Fox, May 2018, select markets only); |
| • | Solo: A Star Wars Story: The IMAX Experience (Walt Disney Studios, May 2018); |
| • | The Incredibles 2: The IMAX Experience (Walt Disney Studios, June 2018); |
| • | Jurassic World: Fallen Kingdom: The IMAX Experience (Universal Pictures, June 2018); |
| • | Ant-Man and the Wasp: The IMAX Experience (Walt Disney Studios, June 2018, US markets - July 2018); |
| • | Mission Impossible: Fallout: The IMAX Experience (Paramount Pictures, July 2018); |
| • | The Darkest Minds: The IMAX Experience (20th Century Fox, August 2018); |
| • | Predator: The IMAX Experience (20th Century Fox, September 2018); |
| • | Robin Hood: The IMAX Experience (Lionsgate Entertainment Inc., September 2018); |
| • | Venom: The IMAX Experience (Sony Pictures Entertainment, October 2018); |
| • | X-Men: Dark Phoenix: The IMAX Experience (20th Century Fox, November 2018); |
| • | Fantastic Beasts: The Crimes of Grindelwald: The IMAX Experience (Warner Bros. Pictures, November 2018); |
| • | Ralph Breaks the Internet: Wreck-It-Ralph 2: The IMAX Experience (Walt Disney Studios, December 2018, select markets); |
| • | Alita: Battle Angel: An IMAX Experience (20th Century Fox, December 2018); and |
| • | Aquaman: The IMAX Experience (Warner Bros. Pictures, December 2018). |
In addition, the Company in conjunction with Panda Productions will be releasing an IMAX original production, Pandas, in April 2018.
The Company remains in active negotiations with all of the major Hollywood studios for additional films to fill out its short and long-term film slate.
Joint Revenue Sharing Arrangements – Contingent Rent
The Company provides IMAX theater systems to certain of its exhibitor customers under joint revenue sharing arrangements (“JRSA”). The Company has two basic types of joint revenue sharing arrangements: traditional and hybrid.
Under a traditional joint revenue sharing arrangement, the Company provides an IMAX theater system to a customer in return for a portion of the customer’s IMAX box office receipts and, in some cases, concession revenues, rather than requiring the customer to pay a fixed upfront payment or annual minimum payments, as would be required under a sales or sales-type lease arrangement (which is discussed below under “Theater Business”). Payments, which are based on box office receipts, are required throughout the term of the arrangement and are due either monthly or quarterly. Certain maintenance and extended warranty services are provided to the customer for a separate fixed annual fee. The Company retains title to the theater system equipment components, and the equipment is returned to the Company at the conclusion of the arrangement.
Under a hybrid joint revenue sharing arrangement, by contrast, the customer is responsible for making upfront payments prior to the delivery and installation of the IMAX theater system in an amount that is typically half of what the Company would receive from a straight sale transaction. As with a traditional joint revenue sharing arrangement, the customer also pays the Company a portion of the customer’s IMAX box office receipts over the term of the arrangement, although the percentage of box office receipts owing to the Company is typically half that of a traditional joint revenue sharing arrangement. The fixed revenues under a hybrid joint revenue
32
Table of Contents
sharing arrangement are reported in the Company’s theater business operations, while the contingent box office receipts are included in the Company’s network business operations.
Under the majority of joint revenue sharing arrangements (both traditional and hybrid), the initial non-cancellable term of IMAX theater systems is 10 years or longer, and is renewable by the customer for one to two additional terms of between three to five years. The Company has the right to remove the equipment for non-payment or other defaults by the customer. The contracts are non-cancellable by the customer unless the Company fails to perform its obligations.
The introduction of joint revenue sharing arrangements has been an important factor in the expansion of the Company’s commercial theater network. Joint revenue sharing arrangements allow commercial theater exhibitors to install IMAX theater systems without the significant initial capital investment required in a sale or sales-type lease arrangement. Joint revenue sharing arrangements drive recurring cash flows and earnings for the Company, as customers under joint revenue sharing arrangements pay the Company a portion of their ongoing box office. The Company funds its joint revenue sharing arrangements through cash flows from operations. As at December 31, 2017, the Company had 747 theaters in operation under joint revenue sharing arrangements, a 16.7% increase as compared to the 640 joint revenue sharing arrangements open as at December 31, 2016. The Company also had contracts in backlog for an additional 337 theaters under joint revenue sharing arrangements as at December 31, 2017.
The revenue earned from customers under the Company’s joint revenue sharing arrangements can vary from quarter to quarter and year to year based on a number of factors including film performance, the mix of theater system configurations, the timing of installation of these theater systems, the nature of the arrangement, the location, size and management of the theater and other factors specific to individual arrangements.
IMAX Systems – Contingent Rent
The Company’s sales and sales type lease arrangements include contingent rent in excess of fixed minimum ongoing payments. This contingent rent, which is included in the Company’s network business operations, is recognized after the fixed minimum amount per annum is exceeded as driven by box office performance. Contingent payments in excess of fixed minimum ongoing payments of sales or sales type lease arrangements are recognized as revenue when reported by theater operators, provided collectability is reasonably assured. In addition, contingent rent includes amounts realized for changes in rent and maintenance payments which are indexed to a local consumer price index.
Theater Business: IMAX Systems, Theater System Maintenance and Fixed Fees from Joint Revenue Sharing Arrangements
IMAX Systems
The Company also provides IMAX theater systems to customers on a sales or long-term lease basis, typically with an initial 10-year term. These agreements typically require the payment of initial fees and ongoing fees (which can include a fixed minimum amount per annum and contingent fees in excess of the minimum payments), as well as maintenance and extended warranty fees. The initial fees vary depending on the system configuration and location of the theater. Initial fees are paid to the Company in installments between the time of system signing and the time of system installation, which is when the total of these fees, in addition to the present value of future annual minimum payments, are recognized as revenue. Ongoing fees are paid over the term of the contract, commencing after the theater system has been installed, and is a fixed minimum amount per annum. Finance income is derived over the term of a financed sale or sales-type lease arrangement as the unearned income on that financed sale or sales-type lease is earned. Certain maintenance and extended warranty services are provided to the customer for a separate fixed annual fee.
Under the Company’s sales agreements, title to the theater system equipment components passes to the customer. In certain instances, however, the Company retains title or a security interest in the equipment until the customer has made all payments required under the agreement. Under the terms of a sales-type lease agreement, title to the theater system equipment components remains with the Company. The Company has the right to remove the equipment for non-payment or other defaults by the customer.
The revenue earned from customers under the Company’s theater system sales or lease agreements varies from quarter to quarter and year to year based on a number of factors, including the number and mix of theater system configurations sold or leased, the timing of installation of the theater systems, the nature of the arrangement and other factors specific to individual contracts.
33
Table of Contents
Joint Revenue Sharing Arrangements – Fixed Fees
As discussed in joint revenue sharing arrangements above, under a hybrid joint revenue sharing arrangement the customer is responsible for making upfront payments prior to the delivery and installation of the IMAX theater system in an amount that is typically half of what the Company would receive from a straight sale transaction. These fixed upfront payments are included in the Company’s theater business operations.
Theater System Maintenance
For all IMAX theaters, theater owners or operators are also responsible for paying the Company an annual maintenance and extended warranty fee. Under these arrangements, the Company provides proactive and emergency maintenance services to every theater in its network to ensure that each presentation is up to the highest IMAX quality standard. Annual maintenance fees are paid throughout the duration of the term of the theater agreements.
Other Theater Revenues
Additionally, the Company generates revenues from the sale of after-market parts and 3D glasses.
Revenue from theater business arrangements is recognized at a different time from when cash is collected. See “Critical Accounting Policies” in Item 1 of the Company’s Form 10-K for the year ended December 31, 2017 (the “2017 Form 10-K”) for further discussion on the Company’s revenue recognition policies.
New Business
The Company is exploring new lines of business outside of its core business, with a focus on investments in alternative location-based entertainment experiences, original content, as well as premium IMAX home entertainment technologies and services.
Virtual Reality
The Company is piloting a comprehensive virtual reality (“VR”) strategy to develop a premium, location-based VR offering to deliver immersive, multi-dimensional experiences, including entertainment content and games, to branded VR centers (“IMAX VR Centers”). Pilot IMAX VR Centers are located in a stand-alone venue and in several multiplexes and are retrofitted with proprietary VR pods that permit interactive, moveable VR experiences. The Company’s VR initiative is premised on a unique combination of premium content, proprietary design and best-in-class technology.
In January 2017, the Company launched its flagship pilot IMAX VR Center in Los Angeles. Since that time, the Company has opened six pilot IMAX VR Centers (two in New York City, one in Toronto, one in Manchester, England, one in Shanghai, China and one in Bangkok, Thailand). The Company continues to evaluate its pilot VR strategy based on several factors including the overall customer experience, pricing models, throughput, types of content featured and differences in geographic areas.
The Company also has a virtual reality fund (the “VR Fund”) among the Company, its subsidiary IMAX China and other strategic investors. The VR Fund will help finance the creation of interactive VR content experiences over the next three years for use across all VR platforms, including in the pilot IMAX VR Centers. The VR Fund recently helped finance the production of one interactive VR experience, which debuted exclusively in the pilot IMAX VR Centers in November 2017 before being made available to other VR platforms.
Original Content
In 2017, the Company partnered with Marvel Television Inc. (“Marvel”) and Disney|ABC Television Group to co-produce and premiere theatrically the television series “Marvel’s Inhumans” in IMAX theaters. The first two episodes of the series ran worldwide in IMAX theaters for two weeks in September 2017 and subsequently the series premiered on the ABC network in the U.S. and across other networks internationally. As part of the investment, the Company shares in the economics across the venture, including in both the theatrical and television platforms. This agreement marks the first time a live-action television series has debuted in this manner, and the first time the Company has an economic interest in a television property.
34
Table of Contents
The Company continues to believe that the IMAX network serves as a valuable platform to launch and distribute original content, especially during shoulder periods. However, the Company expects that future investments in original content will be less capital intensive to the Company than its investment in “Marvel’s Inhumans”.
The Company has also created two film funds to help finance the production of original content. The Company is forming the IMAX China Film Fund (the “China Film Fund”) with its subsidiary IMAX China Holding Inc. (“IMAX China”), its partner CMC and several other large investors to help fund Mandarin language commercial films. The China Film Fund, which is expected initially to be capitalized with over $80.0 million, will target productions that can leverage the Company’s brand, relationships, technology and release windows in China. The China Film Fund is expected to co-finance approximately 15 Mandarin-language tent-pole films over three years, and will target contributions of between $3.0 million and $7.0 million per film. The China Film Fund will operate under an IMAX China-CMC controlled greenlight committee.
In addition, the Company’s IMAX Original Film Fund (the “Original Film Fund”) was established in 2014 to co-finance a portfolio of 10 original large format films. The initial investment in the Film Fund was committed to by a third party in the amount of $25.0 million, with the possibility of contributing additional funds. The Company agreed to contribute $9.0 million to the Original Film Fund over five years starting in 2014 and sees the Original Film Fund as a self-perpetuating vehicle designed to generate a continuous flow of high-quality documentary content. As at December 31, 2017, the Original Film Fund has invested $13.4 million toward the development of original films.
IMAX Home Entertainment Technologies and Services
The Company has also announced home theater initiatives, including a joint venture with TCL Multimedia Technology Holding Limited (“TCL”) to design, develop, manufacture and sell a premium home theater system. The joint venture has signed agreements with end users for the sale of more than 170 premium home theater systems, and has signed agreements with distributors for the sale of more than 470 home theater systems. The Company does not intend to invest significant capital into the joint venture going forward, and instead expects any additional funding to be provided through third party capital.
Beyond its premium home theater, the Company has also developed other components of a broader home entertainment platform designed to permit customers to view content on a premium video-on-demand basis in their home theaters.
Other
The Company is also a distributor of large-format films, primarily for its institutional theater partners. The Company generally distributes films which it produces or for which it has acquired distribution rights from independent producers. The Company receives either a percentage of the theater box office receipts or a fixed amount as a distribution fee.
The Company also provides film post-production and quality control services for large-format films (whether produced internally or externally), and digital post-production services.
The Company derives a small portion of its revenues from other sources. As at December 31, 2017, the Company had two owned and operated IMAX theaters (December 31, 2016 — two owned and operated IMAX theaters). In addition, the Company has a commercial arrangement with one theater resulting in the sharing of profits and losses and provides management services to three other theaters. The Company also rents its proprietary 2D and 3D large-format film and digital cameras to third party production companies. The Company maintains cameras and other film equipment and also offers production advice and technical assistance to both documentary and Hollywood filmmakers.
35
Table of Contents
IMAX Theater Network and Backlog
IMAX Theater Network
The following table outlines the breakdown of the IMAX theater network by type and geographic location as at December 31:
| 2017 Theater Network | 2016 Theater Network | |||||||||||||||||||||||||||||||
| Commercial Multiplex |
Commercial Destination |
Institutional | Total | Commercial Multiplex |
Commercial Destination |
Institutional | Total | |||||||||||||||||||||||||
| United States |
364 | 4 | 35 | 403 | 349 | 5 | 41 | 395 | ||||||||||||||||||||||||
| Canada |
37 | 2 | 7 | 46 | 37 | 2 | 7 | 46 | ||||||||||||||||||||||||
| Greater China(1) |
527 | — | 17 | 544 | 407 | — | 17 | 424 | ||||||||||||||||||||||||
| Asia (excluding Greater China) |
100 | 1 | 3 | 104 | 93 | 2 | 3 | 98 | ||||||||||||||||||||||||
| Western Europe |
88 | 4 | 10 | 102 | 76 | 6 | 10 | 92 | ||||||||||||||||||||||||
| Russia & the CIS |
58 | — | — | 58 | 56 | — | — | 56 | ||||||||||||||||||||||||
| Latin America(2) |
42 | — | 12 | 54 | 38 | — | 12 | 50 | ||||||||||||||||||||||||
| Rest of the World |
56 | 1 | 2 | 59 | 51 | 1 | 2 | 54 | ||||||||||||||||||||||||
|
|
|
|
|
|
|
|
|
|
|
|
|
|
|
|
|
|||||||||||||||||
| Total |
1,272 | 12 | 86 | 1,370 | 1,107 | 16 | 92 | 1,215 | ||||||||||||||||||||||||
|
|
|
|
|
|
|
|
|
|
|
|
|
|
|
|
|
|||||||||||||||||
| (1) | Greater China includes China, Hong Kong, Taiwan and Macau. |
| (2) | Latin America includes South America, Central America and Mexico. |
The Company believes that over time its commercial multiplex theater network could grow to approximately 2,855 IMAX theaters worldwide from 1,272 commercial multiplex IMAX theaters operating as of December 31, 2017. The Company believes that the majority of its future growth will come from international markets. As at December 31, 2017, 67.2% of IMAX theater systems in operation were located within international markets (defined as all countries other than the United States and Canada), up from 63.7% as at December 31, 2016. Revenues and gross box office derived from outside the United States and Canada continue to exceed revenues and gross box office from the United States and Canada. Risks associated with the Company’s international business are outlined in Risk Factors – “The Company conducts business internationally, which exposes it to uncertainties and risks that could negatively affect its operations, sales and future growth prospects” in Item 1A of Part I of this 2017 Form 10-K.
Greater China continues to be the Company’s second largest market, measured by revenues, with approximately 33% of overall revenues generated from the Company’s China operations in 2017. As at December 31, 2017, the Company had 544 theaters operating in Greater China with an additional 309 theaters in backlog that are scheduled to be installed in Greater China by 2022. The Company’s backlog in Greater China represents 61.9% of the Company’s current backlog. The Company’s largest single international partnership is in China with Wanda Film, formerly Wanda Cinema Line Corporation (“Wanda”). Wanda’s total, commitment to the Company is for 359 theater systems in Greater China (of which 343 theater systems are under the parties’ joint revenue sharing arrangement). See Risk Factors – “The Company faces risks in connection with the continued expansion of its business in China” in Item 1A of Part I of this 2017 Form 10-K.
36
Table of Contents
The following table outlines the breakdown of the Commercial Multiplex theater network by arrangement type and geographic location as at December 31
| 2017 | ||||||||||||||||||||
| IMAX Commercial Multiplex Theater Network | ||||||||||||||||||||
| Traditional JRSA | Hybrid JRSA | Total JRSA | Sale / Sales- type lease |
Total | ||||||||||||||||
| Domestic Total (United States & Canada) |
273 | 4 | 277 | 124 | 401 | |||||||||||||||
|
|
|
|
|
|
|
|
|
|
|
|||||||||||
| International: |
||||||||||||||||||||
| Greater China |
260 | 80 | 340 | 187 | 527 | |||||||||||||||
| Asia (excluding Greater China) |
35 | 23 | 58 | 42 | 100 | |||||||||||||||
| Western Europe |
31 | 24 | 55 | 33 | 88 | |||||||||||||||
| Russia & the CIS |
— | — | — | 58 | 58 | |||||||||||||||
| Latin America |
— | — | — | 42 | 42 | |||||||||||||||
| Rest of the World |
14 | 3 | 17 | 39 | 56 | |||||||||||||||
|
|
|
|
|
|
|
|
|
|
|
|||||||||||
| International Total |
340 | 130 | 470 | 401 | 871 | |||||||||||||||
|
|
|
|
|
|
|
|
|
|
|
|||||||||||
| Worldwide Total |
613 | 134 | 747 | 525 | 1,272 | |||||||||||||||
|
|
|
|
|
|
|
|
|
|
|
|||||||||||
| 2016 | ||||||||||||||||||||
| IMAX Commercial Multiplex Theater Network | ||||||||||||||||||||
| JRSA | Hybrid JRSA | Total JRSA | Sale / Sales- type lease |
Total | ||||||||||||||||
| Domestic Total (United States & Canada) |
262 | 4 | 266 | 120 | 386 | |||||||||||||||
|
|
|
|
|
|
|
|
|
|
|
|||||||||||
| International: |
||||||||||||||||||||
| Greater China |
195 | 66 | 261 | 146 | 407 | |||||||||||||||
| Asia (excluding Greater China) |
34 | 20 | 54 | 39 | 93 | |||||||||||||||
| Western Europe |
21 | 23 | 44 | 32 | 76 | |||||||||||||||
| Russia & the CIS |
— | — | — | 56 | 56 | |||||||||||||||
| Latin America |
— | — | — | 38 | 38 | |||||||||||||||
| Rest of the World |
13 | 2 | 15 | 36 | 51 | |||||||||||||||
|
|
|
|
|
|
|
|
|
|
|
|||||||||||
| International Total |
263 | 111 | 374 | 347 | 721 | |||||||||||||||
|
|
|
|
|
|
|
|
|
|
|
|||||||||||
| Worldwide Total |
525 | 115 | 640 | 467 | 1,107 | |||||||||||||||
|
|
|
|
|
|
|
|
|
|
|
|||||||||||
As at December 31, 2017, 277 (2016 – 266) of the 747 (2016 – 640) theaters under joint revenue sharing arrangements in operation, or 37.1% (2016 – 41.6%) were located in the United States and Canada, with the remaining 470 (2016 – 374) or 62.9% (2016 – 58.4%) of arrangements being located in international markets.
37
Table of Contents
Sales Backlog
The Company’s current sales backlog is as follows:
| December 31, 2017 | December 31, 2016 | |||||||||||||||
| Number of Systems |
Fixed Contractual Dollar Value (in thousands) |
Number of Systems |
Fixed Contractual Dollar Value (in thousands) |
|||||||||||||
| Sales and sales-type lease arrangements |
162 | $ | 205,001 | 143 | $ | 175,331 | ||||||||||
| Joint revenue sharing arrangements |
||||||||||||||||
| Hybrid arrangements |
121 | 64,328 | (1) | 92 | 48,658 | (1) | ||||||||||
| Traditional arrangements |
216 | 11,942 | (1) | 263 | 3,680 | (1) | ||||||||||
|
|
|
|
|
|
|
|
|
|||||||||
| 499 | (2) | $ | 281,271 | 498 | (3) | $ | 227,669 | |||||||||
|
|
|
|
|
|
|
|
|
|||||||||
| (1) | Reflects contractual payments. Future contingent payments are not reflected as these are based on negotiated shares of box office results. |
| (2) | Includes 32 laser-based digital theater system configurations, including 5 upgrades. |
| (3) | Includes 20 laser-based digital theater system configurations, including 3 upgrades. |
The number of theater systems in the backlog reflects the minimum number of commitments under signed contracts. The dollar value fluctuates depending on the number of new theater system arrangements signed from year to year, which adds to backlog, and the installation and acceptance of theater systems and the settlement of contracts, both of which reduce backlog. Sales backlog typically represents the fixed contracted revenue under signed theater system sale and lease agreements that the Company believes will be recognized as revenue upon installation and acceptance of the associated theater. Sales backlog includes initial fees along with the estimated present value of contractual ongoing fees due over the term; however, it excludes amounts allocated to maintenance and extended warranty revenues as well as fees (contingent rent) in excess of contractual ongoing fees that may be received in the future. The value of sales backlog does not include revenue from theaters in which the Company has an equity interest, operating leases, letters of intent or long-term conditional theater commitments. The value of theaters under joint revenue sharing arrangements is excluded from the dollar value of sales backlog, although certain theater systems under joint revenue sharing arrangements provide for contracted upfront payments and therefore carry a backlog value based on those payments. The Company believes that the contractual obligations for theater system installations that are listed in sales backlog are valid and binding commitments.
From time to time, in the normal course of its business, the Company will have customers who are unable to proceed with a theater system installation for a variety of reasons, including the inability to obtain certain consents, approvals or financing. Once the determination is made that the customer will not proceed with installation, the agreement with the customer is terminated or amended. If the agreement is terminated, once the Company and the customer are released from all their future obligations under the agreement, all or a portion of the initial rents or fees that the customer previously made to the Company are recognized as revenue.
38
Table of Contents
The following table outlines the breakdown of the total backlog by arrangement type and geographic location as at December 31:
| 2017 | ||||||||||||||||||||
| IMAX Theater Backlog | ||||||||||||||||||||
| JRSA | Hybrid JRSA | Total JRSA | Sale / Lease | Total | ||||||||||||||||
| Domestic Total (United States & Canada) |
37 | 3 | 40 | 9 | 49 | |||||||||||||||
|
|
|
|
|
|
|
|
|
|
|
|||||||||||
| International: |
||||||||||||||||||||
| Greater China |
134 | 102 | 236 | 73 | 309 | |||||||||||||||
| Asia (excluding Greater China) |
6 | 11 | 17 | 20 | 37 | |||||||||||||||
| Western Europe |
33 | 4 | 37 | 8 | 45 | |||||||||||||||
| Latin America |
— | — | — | 17 | 17 | |||||||||||||||
| Rest of the World |
6 | 1 | 7 | 35 | 42 | |||||||||||||||
|
|
|
|
|
|
|
|
|
|
|
|||||||||||
| International Total |
179 | 118 | 297 | 153 | 450 | |||||||||||||||
|
|
|
|
|
|
|
|
|
|
|
|||||||||||
| Worldwide Total |
216 | 121 | 337 | 162 | 499 | |||||||||||||||
|
|
|
|
|
|
|
|
|
|
|
|||||||||||
| 2016 | ||||||||||||||||||||
| IMAX Theater Backlog | ||||||||||||||||||||
| JRSA | Hybrid JRSA | Total JRSA | Sale / Lease | Total | ||||||||||||||||
| Domestic Total (United States & Canada) |
48 | 3 | 51 | 10 | 61 | |||||||||||||||
|
|
|
|
|
|
|
|
|
|
|
|||||||||||
| International: |
||||||||||||||||||||
| Greater China |
199 | 76 | 275 | 59 | 334 | |||||||||||||||
| Asia (excluding Greater China) |
4 | 8 | 12 | 20 | 32 | |||||||||||||||
| Western Europe |
7 | 5 | 12 | 6 | 18 | |||||||||||||||
| Russia & the CIS |
— | — | — | 18 | 18 | |||||||||||||||
| Latin America |
— | — | — | 15 | 15 | |||||||||||||||
| Rest of the World |
5 | — | 5 | 15 | 20 | |||||||||||||||
|
|
|
|
|
|
|
|
|
|
|
|||||||||||
| International Total |
215 | 89 | 304 | 133 | 437 | |||||||||||||||
|
|
|
|
|
|
|
|
|
|
|
|||||||||||
| Worldwide Total |
263 | 92 | 355 | 143 | 498 | |||||||||||||||
|
|
|
|
|
|
|
|
|
|
|
|||||||||||
Approximately 90.2% of IMAX theater system arrangements in backlog as at December 31, 2017 are scheduled to be installed in international markets (2016 – 87.8%).
39
Table of Contents
Signings and Installations
The following reflects the Company’s theater system signings and installations:
| Years Ended December 31, | ||||||||
| 2017 | 2016 | |||||||
| Theater System Signings: |
||||||||
| Full new sales and sales-type lease arrangements |
85 | 61 | ||||||
| New traditional joint revenue sharing arrangements |
35 | 246 | ||||||
| New hybrid joint revenue sharing arrangements |
50 | 7 | ||||||
|
|
|
|
|
|||||
| Total new theaters |
170 | 314 | ||||||
| Upgrades of IMAX theater systems |
7 | 5 | ||||||
|
|
|
|
|
|||||
| Total theater signings |
177 | 319 | ||||||
|
|
|
|
|
|||||
| Years Ended December 31, | ||||||||
| 2017 | 2016 | |||||||
| Theater System Installations: |
||||||||
| Full new sales and sales-type lease arrangements |
60 | 56 | (1) | |||||
| New traditional joint revenue sharing arrangements |
86 | 76 | ||||||
| New hybrid joint revenue sharing arrangements |
19 | 33 | ||||||
| Short-term operating lease arrangement |
— | 1 | ||||||
|
|
|
|
|
|||||
| Total new theaters |
165 | 166 | ||||||
| Upgrades of IMAX theater systems |
5 | (2) | 16 | (2)(3) | ||||
|
|
|
|
|
|||||
| Total theater installations |
170 | 182 | ||||||
|
|
|
|
|
|||||
| (1) | Includes one used theater system. |
| (2) | Includes four laser-based digital systems under sales and sales-type lease arrangements and one under a traditional joint revenue sharing agreement (2016 – 12 laser-based digital systems under sales and sales-type lease arrangements and two under traditional joint revenue sharing arrangements). |
| (3) | Includes two installations of an upgrade to a xenon-based digital system under sales arrangements. |
The Company anticipates that it will install approximately 145 new theater systems (excluding upgrades) in 2018. The Company cautions, however, that theater system installations may slip from period to period over the course of the Company’s business, usually for reasons beyond its control.
CRITICAL ACCOUNTING POLICIES AND ESTIMATES
The Company prepares its consolidated financial statements in accordance with United States Generally Accepted Accounting Principles (“U.S. GAAP”).
The preparation of these consolidated financial statements requires management to make estimates and judgments under its accounting policies that affect the financial results. The precision of these estimates and the likelihood of future changes depend on a number of underlying variables and a range of possible outcomes.
Management bases its estimates on historical experience, future expectations and other assumptions that are believed to be reasonable at the date of the consolidated financial statements. Actual results may differ from these estimates due to uncertainty involved in measuring, at a specific point in time, events which are continuous in nature, and differences may be material. The Company’s significant accounting policies are discussed in note 2 to its audited consolidated financial statements in Item 8 of the Company’s Annual Report for the Fiscal Year ended December 31, 2017 (this “2017 Form 10-K”). Management considers an accounting policy to be critical if it is important to its financial condition and results, and requires significant judgments and estimates.
40
Table of Contents
The Company considers the following significant estimates, assumptions and judgments to have the most significant effect on its results:
Revenue Recognition
Application of the various accounting principles under U.S. GAAP related to the measurement and recognition of revenue requires the Company to make judgments and estimates. Contract arrangements with nonstandard terms and conditions may require significant contract interpretation to determine the appropriate accounting. The Company believes that revenue recognition is critical for its financial statements because consolidated net income is directly affected by the timing of revenue recognition
Multiple Element Arrangements
The Company’s revenue arrangements with certain customers may involve multiple elements consisting of a theater system (projector, sound system, screen system and, if applicable, 3D glasses cleaning machine); services associated with the theater system including theater design support, supervision of installation, and projectionist training; a license to use the IMAX brand; 3D glasses; maintenance and extended warranty services; and licensing of films. The Company evaluates all elements in an arrangement to determine what are considered typical deliverables for accounting purposes and which of the deliverables represent separate units of accounting based on the applicable accounting guidance in the Leases Topic of the Financial Accounting Standards Board (“FASB”) Accounting Standards Codification (“ASC” or “Codification”); the Guarantees Topic of the FASB ASC; the Entertainment – Films Topic of the FASB ASC; and the Revenue Recognition Topic of the FASB ASC. If separate units of accounting are either required under the relevant accounting standards or determined to be applicable under the Revenue Recognition Topic, the total consideration received or receivable in the arrangement is allocated based on the applicable guidance in the above noted standards.
Theater Systems
The Company has identified the projection system, sound system, screen system and, if applicable, 3D glasses cleaning machine, theater design support, supervision of installation, projectionist training and the use of the IMAX brand to be a single deliverable and a single unit of accounting (“the System Deliverable”). When an arrangement does not include all the elements of a System Deliverable, the elements of the System Deliverable included in the arrangement are considered by the Company to be a single deliverable and a single unit of accounting.
The Company uses vendor-specific objective evidence of selling price (VSOE) when the Company sells the deliverable separately and is the price actually charged by the Company for that deliverable. VSOE is established for the Company’s System Deliverable, maintenance and extended warranty services and film license arrangements. The Company uses a best estimate of selling price (BESP) for units of accounting that do not have VSOE or third-party evidence of selling price. The Company determines BESP for a deliverable by considering multiple factors including the Company’s historical pricing practices, product class, market competition and geography.
Revenue allocated to the System Deliverable is recognized in accordance with the Revenue Recognition Topic of the FASB ASC, when all of the following conditions have been met: (i) the projector, sound system and screen system have been installed and are in full working condition, (ii) the 3D glasses cleaning machine, if applicable, has been delivered, (iii) projectionist training has been completed, and (iv) the earlier of (a) receipt of written customer acceptance certifying the completion of installation and run-in testing of the equipment and the completion of projectionist training or (b) public opening of the theater, provided there is persuasive evidence of an arrangement, the price is fixed or determinable and collectability is reasonably assured.
The initial revenue recognized consists of the initial payments received and the present value of any future initial payments and fixed minimum ongoing payments that have been attributed to this unit of accounting. Contingent payments in excess of the fixed minimum ongoing payments are recognized when reported by theater operators, provided collectability is reasonably assured.
The Company has also agreed, on occasion, to sell equipment under lease or at the end of a lease term. Consideration agreed to for these lease buyouts is included in revenues from equipment and product sales, when persuasive evidence of an arrangement exists, the fees are fixed or determinable, collectability is reasonably assured and title to the theater system passes from the Company to the customer.
Film Production and IMAX DMR Services
In certain film arrangements, the Company produces a film financed by third parties, whereby the third party retains the copyright and the Company obtains exclusive distribution rights. Under these arrangements, the Company is entitled to receive a fixed fee or to
41
Table of Contents
retain as a fee the excess of funding over cost of production (the “production fee”). The third parties receive a portion of the revenues received by the Company from distributing the film, which is charged to costs and expenses applicable to revenues-services. The production fees are deferred, and recognized as a reduction in the cost of the film, based on the ratio of the Company’s distribution revenues recognized in the current period to the ultimate distribution revenues expected from the film.
Revenues from digitally re-mastering (IMAX DMR) films where third parties own or hold the copyrights and the rights to distribute the film are derived in the form of processing fees and recoupments calculated as a percentage of box-office receipts generated from the re-mastered films. Processing fees are recognized as Service revenues when the performance of the related re-mastering service is completed, provided there is persuasive evidence of an arrangement, the fee is fixed or determinable and collectability is reasonably assured. Recoupments, calculated as a percentage of box-office receipts, are recognized as Services revenues when box-office receipts are reported by the third party that owns or holds the related film rights, provided collectability is reasonably assured.
Losses on film production and IMAX DMR services are recognized as costs and expenses applicable to revenues-services in the period when it is determined that the Company’s estimate of total revenues to be realized by the Company will not exceed estimated total production costs to be expended on the film production and the cost of IMAX DMR services.
Allowances for Accounts Receivable and Financing Receivables
Allowances for doubtful accounts receivable are based on the Company’s assessment of the collectability of specific customer balances, which is based upon a review of the customer’s credit worthiness, past collection history and the underlying asset value of the equipment, where applicable. Interest on overdue accounts receivable is recognized as income as the amounts are collected.
The Company monitors the performance of the theaters to which it has leased or sold theater systems which are subject to ongoing payments. When facts and circumstances indicate that there is a potential impairment in the accounts receivable, net investment in lease or a financing receivable, the Company will evaluate the potential outcome of either a renegotiation involving changes in the terms of the receivable or defaults on the existing lease or financed sale agreements. The Company will record a provision if it is considered probable that the Company will be unable to collect all amounts due under the contractual terms of the arrangement or a renegotiated lease amount will cause a reclassification of the sales-type lease to an operating lease.
These provisions are adjusted when there is a significant change in the amount or timing of the expected future cash flows or when actual cash flows differ from cash flow previously expected. While such credit losses have historically been within the Company’s expectations and the provisions established, the Company cannot guarantee that it will continue to experience the same credit loss rates that it has in the past. Changes in the underlying financial condition of its customers could result in a material impact on the Company’s consolidated results of operation and financial position.
Inventories
The Company records write-downs for excess and obsolete inventory based upon current estimates of future events and conditions, including the anticipated installation dates for the current backlog of theater system contracts, technological developments, signings in negotiation, growth prospects within the customers’ ultimate marketplace and anticipated market acceptance of the Company’s current and pending theater systems.
Asset Impairments
The Company performs a qualitative, and when necessary quantitative, impairment test on its goodwill on an annual basis, coincident with the year-end, as well as in quarters where events or changes in circumstances suggest that the carrying amount may not be recoverable.
Goodwill impairment is assessed at the reporting unit level by comparing the unit’s carrying value, including goodwill, to the fair value of the unit. The Company completed a full quantitative analysis as required by ASC 350 – “Intangibles – Goodwill and Other” (Step 1) in 2014. The carrying values of each unit are subject to allocations of certain assets and liabilities that the Company has applied in a systematic and rational manner. The fair value of the Company’s units is assessed using a discounted cash flow model. The model is constructed using the Company’s budget and long-range plan as a base. The Company performs a qualitative assessment of its reporting units and certain select quantitative calculations against its current long range plan to determine whether it is more likely than not (that is, a likelihood of more than 50 percent) that the fair value of a reporting unit is less than its carrying amount (Step 0).
42
Table of Contents
Long-lived asset impairment testing is performed at the lowest level of an asset group at which identifiable cash flows are largely independent. In performing its review for recoverability, the Company estimates the future cash flows expected to result from the use of the asset or asset group and its eventual disposition. If the sum of the expected future cash flows is less than the carrying amount of the asset or asset group, an impairment loss is recognized in the consolidated statement of operations. Measurement of the impairment loss is based on the excess of the carrying amount of the asset or asset group over the fair value calculated using discounted expected future cash flows.
The Company’s estimates of future cash flows involve anticipating future revenue streams, which contain many assumptions that are subject to variability, as well as estimates for future cash outlays, the amounts of which, and the timing of which are both uncertain. Actual results that differ from the Company’s budget and long-range plan could result in a significantly different result to an impairment test, which could impact earnings.
The Company’s investment in debt securities classified as an available-for-sale investment has unrealized holding gains and losses which is excluded from earnings and reported in other comprehensive income until realized. Realization occurs upon the sale of a portion of or the entire investment. The investment is impaired if the value is not expected to recover based on the length of time and extent to which the market value has been less than cost. Furthermore, when the Company intends to sell a specifically identified beneficial interest, a write-down for other-than-temporary impairment shall be recognized in earnings.
Pension Plan Assumptions
The Company’s pension plan obligations and related costs are calculated using actuarial concepts, within the framework of the Compensation – Retirement Benefits Topic of the FASB ASC. A critical assumption to this accounting is the discount rate. The Company evaluates this critical assumption annually or when otherwise required to by accounting standards. Other assumptions include factors such as expected retirement date, mortality rate, rate of compensation increase, and estimates of inflation.
The discount rate enables the Company to state expected future cash payments for benefits as a present value on the measurement date. The guideline for setting this rate is a high-quality long-term corporate bond rate. A lower discount rate increases the present value of benefit obligations and increases pension expense. The Company’s discount rate was determined by considering the average of pension yield curves constructed from a large population of high-quality corporate bonds. The resulting discount rate reflects the matching of plan liability cash flows to the yield curves.
The discount rate used is a key assumption in the determination of the pension benefit obligation and expense. A 1.0% change in the discount rate used would result in a $2.2 million reduction or a $2.6 million increase in the pension benefit obligation with a corresponding benefit or charge recognized in other comprehensive income in the year.
Deferred Tax Asset Valuation
As at December 31, 2017, the Company had net deferred income tax assets of $30.7 million. The Company’s management assesses realization of its deferred tax assets based on all available evidence in order to conclude whether it is more likely than not that the deferred tax assets will be realized. Available evidence considered by the Company includes, but is not limited to, the Company’s historical operating results, projected future operating results, reversing temporary differences, contracted sales backlog at December 31, 2017, changing business circumstances, and the ability to realize certain deferred tax assets through loss and tax credit carry-back and carry-forward strategies.
When there is a change in circumstances that causes a change in judgment about the realizability of the deferred tax assets, the Company would adjust the applicable valuation allowance in the period when such change occurs.
Tax Exposures
The Company is subject to ongoing tax exposures, examinations and assessments in various jurisdictions. Accordingly, the Company may incur additional tax expense based upon the outcomes of such matters. In addition, when applicable, the Company adjusts tax expense to reflect the Company’s ongoing assessments of such matters which require judgment and can materially increase or decrease its effective rate as well as impact operating results. The Company provides for such exposures in accordance with Income Taxes Topic of the FASB ASC.
43
Table of Contents
Stock-Based Compensation
The Company’s stock-based compensation generally includes stock options and restricted share units (“RSUs”).
The Company estimates the fair value of stock option awards on the date of grant using fair value measurement techniques. The fair value of RSU awards is equal to the closing price of the Company’s common stock on the date of grant.
The Company utilizes a lattice-binomial option-pricing model (the “Binomial Model”) to determine the fair value of stock option awards. The fair value determined by the Binomial Model is affected by the Company’s stock price as well as assumptions regarding a number of highly complex and subjective variables. These variables include, but are not limited to, the Company’s expected stock price volatility over the term of the awards, and actual and projected employee stock option exercise behaviors. The Binomial Model also considers the expected exercise multiple which is the multiple of exercise price to grant price at which exercises are expected to occur on average. Option-pricing models were developed for use in estimating the value of traded options that have no vesting or hedging restrictions and are fully transferable. Because the Company’s employee stock options have certain characteristics that are significantly different from traded options, and because changes in the subjective assumptions can materially affect the estimated value, in management’s opinion, the Binomial Model best provides an accurate measure of the fair value of the Company’s employee stock options. Although the fair value of employee stock options is determined in accordance with the Equity topic of the FASB ASC using an option-pricing model, that value may not be indicative of the fair value observed in a willing buyer/willing seller market transaction.
Impact of Recently Issued Accounting Pronouncements
Please see note 3 to the audited consolidated financial statements in Item 8 of this Company’s 2017 Form 10-K for information regarding the Company’s recent changes in accounting policies and recently issued accounting pronouncements impacting the Company.
ASSET IMPAIRMENTS AND OTHER CHARGES (RECOVERIES)
The following table identifies the Company’s charges (recoveries) relating to the impairment of assets:
| Years Ended December 31, | ||||||||||||
| (in thousands of U.S. dollars) | 2017 | 2016 | 2015 | |||||||||
| Asset impairments |
||||||||||||
| Property, plant and equipment |
$ | 3,966 | $ | 223 | $ | 405 | ||||||
| Impairment of investments and loans |
1,225 | 194 | 425 | |||||||||
| Film assets |
17,363 | 3,020 | — | |||||||||
| Other assets |
2,533 | — | — | |||||||||
| Other charges (recoveries): |
||||||||||||
| Accounts receivable |
1,967 | 1,029 | 677 | |||||||||
| Financing receivables |
680 | (75 | ) | 75 | ||||||||
| Inventories |
500 | 458 | 572 | |||||||||
| Other assets |
47 | — | — | |||||||||
| Property, plant and equipment |
1,224 | 885 | 1,485 | |||||||||
| Other intangible assets |
63 | 206 | 86 | |||||||||
|
|
|
|
|
|
|
|||||||
| Total asset impairments and other charges |
$ | 29,568 | $ | 5,940 | $ | 3,725 | ||||||
|
|
|
|
|
|
|
|||||||
Asset Impairments
As a result of the Company’s restructuring activities in June 2017, certain long-lived assets were deemed to be impaired as the Company’s exit from certain activities limited the future revenue associated with these assets. The Company recognized property, plant and equipment charges of $3.7 million, film impairment charges of $0.3 million and other asset charges of $1.5 million. Additional details of the Company’s restructuring activities are discussed in note 22 to its audited consolidated financial statements in Item 8 of this 2017 Form 10-K.
The Company records asset impairment charges for property, plant and equipment after an assessment of the carrying value of certain asset groups in light of their future expected cash flows. During 2017, the Company recorded asset impairment charges of $0.3 million
44
Table of Contents
(2016 — $0.2 million; 2015 — $0.4 million) as the Company recognized that the carrying values for the assets exceeded the expected undiscounted future cash flows.
In 2017, the Company identified and wrote-off $1.2 million related to a certain loan that is no longer considered collectible. No such charge was recognized in the years ended December 31, 2016 and 2015, respectively.
The Company recognized a $0.2 million other-than-temporary impairment of its investments in 2016 as the value is not expected to recover based on the length of time and extent to which the market value has been less than cost (2015 — $0.4 million). No such charge was recorded in the year ended December 31, 2017.
The Company recognized an impairment on its episodic content assets, within film assets, of $11.7 million as a result of lower than anticipated revenue generated for the “Marvel’s Inhumans” television series’ first season. No such charge was recorded in the years ended December 31, 2016 and 2015, respectively.
The Company reviewed the carrying value of certain documentary film assets as a result of lower than expected revenue being generated during the period and revised expectations for future revenues based on the latest information available. An impairment of $5.3 million was recorded based on the carrying value of these documentary films as compared to the related estimated future box office and revenues that would ultimately be generated by these films (2016 — $3.0 million; 2015 — $nil).
In 2017, the VR Fund helped finance the production of one interactive VR experience. Due to the weaker than expected performance at the VR Centers, the Company recognized a $1.0 million impairment of the VR content asset. The VR fund is consolidated by the Company and has a third party non-controlling interest. The Company’s share of this impairment after non-controlling interest is $0.4 million.
Other Charges (Recoveries)
The Company recorded a net provision of $2.0 million in 2017 (2016 — $1.0 million; 2015 —$0.7 million) in accounts receivable based on the Company’s ongoing assessment of the collectability of specific customer balances. The higher charge in 2017 is primarily resulting from the deterioration in the financial condition of certain theater exhibitors and studios.
In 2017, the Company recorded a net provision of $0.7 million in financing receivables (2016 — net recovery of $0.1 million; 2015 — net provision of $0.1 million). Provisions of the Company’s financing receivables is recorded when the collectability associated with certain financing receivables is uncertain. These provisions are adjusted when there is a significant change in the amount or timing of the expected future cash flows or when actual cash flows differ from cash flows previously expected.
The Company recorded an $0.5 million provision (2016 — $0.5 million; 2015 — $0.6 million) in costs and expenses applicable to revenues due to a reduction in the net realizable value of its inventories. These charges primarily resulted from a reduction in the net realizable value of its theater system equipment inventories and certain service part inventories due to normal operational activity.
In 2017, the Company recorded a charge of $1.2 million (2016 — $0.3 million; 2015 — $0.4 million) reflecting property, plant and equipment that were no longer in use. In 2016, the Company also recorded a charge of $0.6 million (2015 — $0.6 million) in cost of sales applicable to Equipment and product sales upon the upgrade of xenon-based digital systems under operating lease arrangements to laser-based digital systems under sales or sales-type lease arrangements. No such charge was recorded in the year ended December 31, 2017. In addition, in 2015, the Company recorded a charge of $0.5 million in cost of sales applicable to Rentals upon the upgrade of certain xenon-based digital systems to laser-based digital systems operating under joint revenue sharing arrangements. No such charge was recorded for the year ended December 31, 2017 and 2016, respectively.
In 2017, the Company recorded a charge of $0.1 million (2016 — $0.2 million; 2015 — $0.1 million) reflecting other intangible assets that were no longer in use.
As of December 31, 2017, the Company can determine a reasonable estimate of the effects of U.S. tax reform and is recording that estimate as a provisional amount. The provisional re-measurement of the deferred tax assets and liabilities resulted in a $9.3 million discrete tax provision which increased the effective tax rate by 31.1% for the year. See “Results of Operations” in Item 7 and note 9 to the audited consolidated financial statements in Item 8 of this Company’s 2017 Form 10-K for further discussion.
45
Table of Contents
NON-GAAP FINANCIAL MEASURES
In this report, the Company presents certain data which are not recognized under U.S. GAAP and are considered “non-GAAP financial measures” under U.S. Securities and Exchange Commission rules. Specifically, the Company presents the following non-GAAP financial measures as supplemental measures of its performance:
| • | Adjusted net income; |
| • | Adjusted net income per diluted share; |
| • | Adjusted net income attributable to common shareholders; |
| • | Adjusted net income attributable to common shareholders per diluted share; and |
| • | EBITDA, adjusted EBITDA per Credit Facility and adjusted EBITDA per Credit Facility excluding “Marvel’s Inhumans”. |
The Company presents adjusted net income and adjusted net income per diluted share, which excludes stock-based compensation and non- recurring exit costs, restructuring charges and associated impairments, the related tax impact of these adjustments and a tax charge resulting from the enactment of the U.S. Tax Act, because it believes that they are important supplemental measures of the Company’s comparable controllable operating performance. Although stock-based compensation is an important aspect of the Company’s employee and executive compensation packages, it is mostly a non-cash expense and is excluded from certain internal business performance measures, and the Company wants to ensure that its investors fully understand the impact of its stock-based compensation (net of any related tax impact) and non-recurring charges on net income.
In addition, the Company presents adjusted net income attributable to common shareholders and adjusted net income attributable to common shareholders per diluted share because it believes that they are important supplemental measures of its comparable financial results. Without the presentation of these adjusted presentation measures the Company believes it could potentially distort the analysis of trends in business performance and it wants to ensure that its investors fully understand the impact of net income attributable to non-controlling interests, its stock-based compensation, non-recurring exit costs, restructuring charges and associated impairments (net of any related tax impact) and a tax charge resulting from the enactment of the U.S. Tax Act in determining net income attributable to common shareholders.
Management uses these measures for internal reporting and forecasting purposes in order to review operating performance on a comparable basis from period to period. However, these non-GAAP measures may not be comparable to similarly titled amounts reported by other companies. The Company’s non-GAAP measures should be considered in addition to, and not as a substitute for, or superior to, net income and net income attributable to common shareholders and other measures of financial performance reported in accordance with U.S. GAAP
The Company is required to maintain a minimum level of “EBITDA”, as such term is defined in the Company’s credit agreement (and which is referred to herein as “Adjusted EBITDA per Credit Facility”, as the credit agreement includes additional adjustments beyond interest, taxes, depreciation and amortization). EBITDA and Adjusted EBITDA per Credit Facility (each as defined below) are used by management to evaluate, assess and benchmark the Company’s operational results, and the Company believes that EBITDA and Adjusted EBITDA per Credit Facility are relevant and useful information widely used by analysts, investors and other interested parties in the Company’s industry. Accordingly, the Company is disclosing this information to permit a more comprehensive analysis of its operating performance and to provide additional information with respect to the Company’s ability to comply with its credit agreement requirements. EBITDA is defined as net income with adjustments for depreciation and amortization, interest income (expense)-net, and income tax provision (benefit). Adjusted EBITDA per Credit Facility is defined as EBITDA plus adjustments for loss from equity accounted investments, stock and other non-cash compensation, exit costs, restructuring charges and associated impairments and adjusted EBITDA attributable to non-controlling interests.
The Company is also introducing the metric Adjusted EBITDA per Credit Facility excluding “Marvel’s Inhumans”, which is defined and discussed under “Credit Facility” in this Item 7. However, the Company cautions that EBITDA, Adjusted EBITDA per Credit Facility and Adjusted EBITDA per Credit Facility excluding “Marvel’s Inhumans” are non-GAAP measures and should not be construed as substitutes for net income, operating income or other operating performance measures that are determined in accordance with U.S. GAAP. In addition, EBITDA, Adjusted EBITDA per Credit Facility and Adjusted EBITDA per Credit Facility excluding “Marvel’s Inhumans” might not be comparable to similarly titled measures used by other companies.
46
Table of Contents
RESULTS OF OPERATIONS
Important factors that the Company’s Chief Executive Officer (“CEO”) Richard L. Gelfond uses in assessing the Company’s business and prospects include:
| • | the signing, installation and financial performance of theater system arrangements (particularly its joint revenue sharing arrangements and new laser-based projection systems); |
| • | film performance and the securing of new film projects (particularly IMAX DMR films); |
| • | revenue and gross margins from the Company’s segments; |
| • | earnings from operations as adjusted for unusual items that the Company views as non-recurring; |
| • | the success of new business initiatives (including new content and VR initiatives); |
| • | short- and long-term cash flow projections; |
| • | the continuing ability to invest in and improve the Company’s technology to enhance its differentiation of presentation versus other cinematic experiences; and |
| • | the overall execution, reliability and consumer acceptance of The IMAX Experience. |
Management, including the Company’s CEO, who is the Company’s Chief Operating Decision Maker (“CODM”) (as defined in the Segment Reporting Topic of the FASB ASC), assesses segment performance based on segment revenues, gross margins and film performance. Selling, general and administrative expenses, research and development costs, amortization of intangibles, receivables provisions (recoveries), write-downs net of recoveries, interest income, interest expense and tax (provision) recovery are not allocated to the segments. As identified in note 18 to the accompanying audited financial statements in Item 1, the Company identified new business as an additional reportable segment in the first quarter of 2017. The Company now has the following eight reportable segments: IMAX DMR; joint revenue sharing arrangements; IMAX systems; theater system maintenance; other; new business; film distribution; and film post-production. The Company is presenting the following information at a disaggregated level to provide more relevant information to readers, as permitted by the standard:
| • | Network Business |
| • | The IMAX DMR segment consists of variable revenues from studios for the conversion of films into the IMAX DMR format generated by the box office results from the exhibition of those films in the IMAX theater network. |
| • | Joint revenue sharing arrangements – contingent rent, consists of variable rent revenues from box office exhibited in IMAX theaters in exchange for the provision of IMAX theater projection system equipment to exhibitors. This excludes fixed hybrid revenues and upfront installation costs from the Company’s hybrid joint revenue sharing arrangements, which are included in theater business. |
| • | IMAX systems – contingent rent, consists of variable payments in excess of certain fixed minimum ongoing payments, under arrangements in the IMAX systems segment, which are recognized when reported by theater operators, provided collectability is reasonably assured. |
| • | Theater Business |
| • | The IMAX systems segment consists of the design, manufacture and installation of IMAX theater projection system equipment under sales or sales-type lease arrangements for fixed upfront and ongoing consideration, including ongoing fees and finance income. |
| • | Joint revenue sharing arrangements – fixed fee, consists of fixed hybrid revenues and upfront installation costs from the joint revenue sharing arrangement segment. |
| • | The theater system maintenance segment consists of the provision of IMAX theater projection system equipment maintenance services to the IMAX theater network and the associated costs of those services. |
| • | Other theater includes after-market sales of IMAX theater projection system parts and 3D glasses from the other segment. |
| • | New Business |
| • | The new business segment consists of content licensing and distribution fees associated with the Company’s original content investments, VR initiatives, IMAX Home Entertainment, and other new business initiatives that are in the development and/or start-up phase. |
| • | Other |
| • | The film distribution segment consists of revenues and costs associated with the distribution of documentary films for which the Company has distribution rights. |
| • | The film post-production segment consists of the provision of film post-production, and their associated costs. |
| • | The other segment consists of certain IMAX theaters that the Company owns and operates, camera rentals and other miscellaneous items. |
47
Table of Contents
The Company’s Management’s Discussion and Analysis (“MD&A”) of Financial Condition and Results of Operations has been organized by the Company into four primary groups – Network Business, Theater Business, New Business and Other. Each of the Company’s reportable segments, as identified above, has been classified into one of these broader groups for purposes of MD&A discussion. The Company believes that this approach is consistent with how the CODM reviews the financial performance of the business and makes strategic decisions regarding resource allocation and investments to meet long-term business goals. Management believes that a discussion and analysis based on these groups is significantly more relevant and useful to readers, as the Company’s consolidated statements of operations captions combine results from several segments. Certain of the prior year’s figures have been reclassified to conform to the current year’s presentation.
The following table sets forth the breakdown of revenue and gross margin by category:
| (In thousands of U.S. dollars) | Revenue | Gross Margin | ||||||||||||||||||||||
| 2017 | 2016 | 2015 | 2017 | 2016 | 2015 | |||||||||||||||||||
| Network Business |
||||||||||||||||||||||||
| IMAX DMR |
$ | 108,853 | $ | 106,403 | $ | 107,089 | $ | 71,789 | $ | 69,196 | $ | 77,645 | ||||||||||||
| Joint revenue sharing arrangements - contingent rent |
70,444 | 73,500 | 81,396 | 47,337 | 54,705 | 63,500 | ||||||||||||||||||
| IMAX systems - contingent rent |
3,890 | 4,644 | 3,900 | 3,890 | 4,644 | 3,900 | ||||||||||||||||||
|
|
|
|
|
|
|
|
|
|
|
|
|
|||||||||||||
| 183,187 | 184,547 | 192,385 | 123,016 | 128,545 | 145,045 | |||||||||||||||||||
|
|
|
|
|
|
|
|
|
|
|
|
|
|||||||||||||
| Theater Business |
||||||||||||||||||||||||
| IMAX systems |
||||||||||||||||||||||||
| Sales and sales-type leases(1) |
79,853 | 89,525 | 86,934 | 47,639 | 44,788 | 44,787 | ||||||||||||||||||
| Ongoing fees and finance income(2) |
10,494 | 11,359 | 11,292 | 10,095 | 10,660 | 10,478 | ||||||||||||||||||
| Joint revenue sharing arrangements – fixed fees |
10,118 | 17,913 | 17,724 | 2,349 | 5,132 | 4,873 | ||||||||||||||||||
| Theater system maintenance |
45,383 | 40,430 | 36,944 | 18,275 | 13,660 | 12,701 | ||||||||||||||||||
| Other theater |
9,145 | 10,888 | 10,482 | 1,965 | 1,930 | 2,105 | ||||||||||||||||||
|
|
|
|
|
|
|
|
|
|
|
|
|
|||||||||||||
| 154,993 | 170,115 | 163,376 | 80,323 | 76,170 | 74,944 | |||||||||||||||||||
|
|
|
|
|
|
|
|
|
|
|
|
|
|||||||||||||
| New Business |
24,522 | 626 | — | (16,176 | ) | (2,199 | ) | — | ||||||||||||||||
|
|
|
|
|
|
|
|
|
|
|
|
|
|||||||||||||
| Other |
||||||||||||||||||||||||
| Film distribution and post-production |
13,172 | 14,127 | 10,945 | (1,006 | ) | (180 | ) | 1,122 | ||||||||||||||||
| Other |
4,893 | 7,919 | 7,099 | (911 | ) | 342 | (1,823 | ) | ||||||||||||||||
|
|
|
|
|
|
|
|
|
|
|
|
|
|||||||||||||
| 18,065 | 22,046 | 18,044 | (1,917 | ) | 162 | (701 | ) | |||||||||||||||||
|
|
|
|
|
|
|
|
|
|
|
|
|
|||||||||||||
| $ | 380,767 | $ | 377,334 | $ | 373,805 | $ | 185,246 | $ | 202,678 | $ | 219,288 | |||||||||||||
|
|
|
|
|
|
|
|
|
|
|
|
|
|||||||||||||
| (1) | Includes initial payments and the present value of fixed minimum payments from equipment, sales and sales-type lease transactions. |
| (2) | Includes rental income from operating leases and finance income. |
48
Table of Contents
Results of Operations Discussion for the Three Years Ended December 31, 2017
The Company reported net income of $12.5 million, or $0.19 per basic and diluted share, for the year ended December 31, 2017, as compared to net income of $39.3 million, or $0.58 per basic and diluted share, for the year ended December 31, 2016 and net income of $64.6 million, or $0.92 per basic share and $0.90 per diluted share, for the year ended December 31, 2015.
Net income for the year ended December 31, 2017 includes a $22.7 million charge, or $0.35 per diluted share (2016 — $30.5 million, or $0.45 per diluted share; 2015 — $21.9 million or $0.31 per diluted share), for stock-based compensation and a $16.2 million charge, or $0.25 per diluted share for exit costs, restructuring charges and associated impairments (2016 — $nil; 2015 — $nil). In 2017, the Company also recognized a $9.3 million, or $0.14 per diluted share, non-recurring tax charge as the Company re-measured its deferred tax assets and liabilities as of the date of enactment of the recently passed Tax Act.
Adjusted net income, which consists of net income excluding the impact of stock-based compensation, exit costs, restructuring charges and associated impairments, the related tax impact of these adjustments, and tax charge from the provisional re-measurement of U.S. deferred tax assets and liabilities given changes enacted by the Tax Act, was $51.5 million, or $0.79 per diluted share, for the year ended December 31, 2017 as compared to adjusted net income of $61.1 million, or $0.90 per diluted share, for the year ended December 31, 2016 and $82.4 million, or $1.15 per diluted share, for the year ended December 31, 2015.
The Company reported net income attributable to common shareholders of $2.3 million, or $0.04 per basic share and diluted share for the year ended December 31, 2017 (2016 — $28.8 million, or $0.43 per basic share and $0.42 per diluted share; 2015 — $55.8 million, or $0.79 per basic share and $0.78 per diluted share).
Adjusted net income attributable to common shareholders, which consists of net income attributable to common shareholders excluding the impact of stock-based compensation, exit costs, restructuring charges and associated impairments, the related tax impact of these adjustments, and tax charge from the provisional re-measurement of U.S. deferred tax assets and liabilities given changes enacted by the Tax Act, was $40.5 million, or $0.62 per diluted share, for the year ended December 31, 2017 as compared to adjusted net income attributable to common shareholders of $50.0 million, or $0.73 per diluted share, for the year ended December 31, 2016 and $73.0 million, or $1.02 per diluted share, for the year ended December 31, 2015.
A reconciliation of net income and net income attributable to common shareholders, the most directly comparable U.S. GAAP measure, to adjusted net income, adjusted net income per diluted share, adjusted net income attributable to common shareholders and adjusted net income attributable to common shareholders per diluted share is presented in the table below:
| Years Ended December 31, | ||||||||||||||||||||||||
| 2017 | 2016 | 2015 | ||||||||||||||||||||||
| Net Income | Diluted EPS |
Net Income | Diluted EPS |
Net Income | Diluted EPS |
|||||||||||||||||||
| Reported net income |
$ | 12,518 | $ | 0.19 | $ | 39,320 | $ | 0.58 | $ | 64,624 | $ | 0.90 | ||||||||||||
| Adjustments: |
||||||||||||||||||||||||
| Stock-based compensation |
22,653 | 0.35 | 30,523 | 0.45 | 21,880 | 0.31 | ||||||||||||||||||
| Exit costs, restructuring charges and associated impairments |
16,174 | 0.25 | — | — | — | — | ||||||||||||||||||
| Tax impact on items listed above |
(9,218 | ) | (0.14 | ) | (8,783 | ) | (0.13 | ) | (4,056 | ) | (0.06 | ) | ||||||||||||
| Impact of enactment of U.S. Tax Act |
9,323 | 0.14 | — | — | — | — | ||||||||||||||||||
|
|
|
|
|
|
|
|
|
|
|
|
|
|||||||||||||
| Adjusted net income |
51,450 | 0.79 | 61,060 | 0.90 | 82,448 | 1.15 | ||||||||||||||||||
| Net income attributable to non-controlling interests (1) |
(10,174 | ) | (0.16 | ) | (10,532 | ) | (0.16 | ) | (8,780 | ) | (0.12 | ) | ||||||||||||
| Stock-based compensation (net of tax of $0.2 million, $0.2 million and $0.2 million, respectively) (1) |
(620 | ) | (0.01 | ) | (533 | ) | (0.01 | ) | (703 | ) | (0.01 | ) | ||||||||||||
| Exit costs, restructuring charges and associated impairments (net of tax of $0.1 million) (1) |
(181 | ) | — | — | — | — | — | |||||||||||||||||
|
|
|
|
|
|
|
|
|
|
|
|
|
|||||||||||||
| Adjusted net income attributable to common shareholders |
$ | 40,475 | $ | 0.62 | $ | 49,995 | $ | 0.73 | $ | 72,965 | $ | 1.02 | ||||||||||||
|
|
|
|
|
|
|
|
|
|
|
|
|
|||||||||||||
| Weighted average diluted shares outstanding |
65,540 | 68,263 | 71,058 | |||||||||||||||||||||
|
|
|
|
|
|
|
|||||||||||||||||||
| (1) | Reflects amounts attributable to non-controlling interests. |
49
Table of Contents
Revenues and Gross Margin
The Company’s revenues for the year ended December 31, 2017 increased to $380.8 million from $377.3 million in 2016. The gross margin across all segments in 2017 was $185.2 million, or 48.7% of total revenue, compared to $202.7 million, or 53.7% of total revenue in 2016. Impairment charges included in gross margin for the year ended December 31, 2017 were $19.7 million, of which $13.0 million related to new business initiatives, or 5.2% of total revenue, compared to $3.7 million, of which $nil related to new business initiatives, or 1.0% of total revenue in the year ended December 31, 2016. Impacting the gross margin in 2017, was a gross loss experienced in the Company’s new business segment mainly due to the impairment charges discussed above.
The Company’s revenues for the year ended December 31, 2016 increased to $377.3 million from $373.8 million in 2015, largely due to an increase in revenues from the Company’s theater business. The gross margin across all segments in 2016 was $202.7 million, or 53.7% of total revenue, compared to $219.3 million, or 58.7% of total revenue in 2015. Impacting the gross margin in 2016 was the lower revenues experienced in the Company’s network business largely due to weaker box-office performance, particularly in the China region. Gross box-office is a significant driver of the Company’s business as the impact of film performance affects multiple reporting segments, as discussed below.
Network Business
Gross box-office generated by IMAX DMR films increased 1.1% to $976.5 million in 2017 from $965.6 million in 2016. The 2016 gross box-office generated was 2.1% lower than the $985.3 million in 2015. In 2017, gross box-office was generated primarily from the exhibition of 67 films (60 new and 7 carryovers), as compared to 58 films (51 new and 7 carryover) exhibited in 2016 and 57 films (44 new and 13 carryover) exhibited in 2015. In recent years, the Company has experienced weaker gross box-office particularly in the China region resulting from both film performance and unfavorable exchange rates.
The Company’s network business performance is impacted by the timing of a film release to the IMAX theater network, the commercial success of the film, the Company’s take rates under its DMR and joint revenue sharing arrangements, and the distribution window for the exhibition of films in the IMAX theater network. Other factors impacting performance include fluctuations in the value of foreign currencies versus the U.S. dollar and potential currency devaluations.
Network business revenue decreased by 0.7% to $183.2 million in the year ended December 31, 2017 from $184.5 million in the year ended December 31, 2016, primarily as a result of decreased revenue from joint revenue sharing arrangements. Furthermore, network business revenue was 4.1% lower in 2016 from the $192.4 million experienced in 2015. The gross margin experienced by the Company’s network business in 2017 was $123.0 million, or 67.2% of network business revenue, compared to $128.5 million, or 69.7% in 2016 and $145.0 million, or 75.4% in 2015.
The 4.2% decrease in revenues from joint revenue sharing arrangements was largely due to lower joint venture take rates, offset slightly by continued network growth. Joint venture take rates are impacted by the mix of theater systems installed and the particular geographic market for those systems. Contingent rent revenues from joint revenue sharing arrangements decreased to $70.4 million in the year ended December 31, 2017 from $73.5 million in the year ended December 31, 2016. In 2015 revenues from joint revenue sharing arrangements were $81.4 million. The decrease in revenues in 2016 versus 2015 from joint revenue sharing arrangements was due to weaker film performance in 2016, partly a result of unfavorable exchange rates between applicable local currencies and the U.S. dollar. The Company ended 2017 with 747 theaters operating under joint revenue sharing arrangements, as compared to 640 theaters at the end of 2016, an increase of 16.7% and 529 theaters at the end of 2015. Gross box office generated by the joint revenue sharing arrangements was 2.8% higher at $525.3 million in the year ended December 31, 2017 from $511.0 million in the year ended December 31, 2016 and $514.1 million in the year ended December 31, 2015.
The gross margin from joint revenue sharing arrangements decreased to $47.3 million in the year ended December 31, 2017 from $54.7 million in the year ended December 31, 2016 and $63.5 million in 2015. Included in the calculation of gross margin for the year ended December 31, 2017 were certain advertising, marketing and commission costs primarily associated with new theater launches of $3.7 million, as compared to $2.7 million in 2016 and $3.0 million for such expenses in 2015. The lower gross margin experienced in 2017 versus prior years is mostly due to the lower take rates experienced (as discussed above), as well higher depreciation expense resulting from the continuous growth in the number of operational theaters under joint revenue sharing arrangements.
IMAX DMR revenues increased 2.3% to $108.9 million in the year ended December 31, 2017 from $106.4 million in the year ended December 31, 2016, partially offsetting the decrease in revenues from joint revenue sharing arrangements. IMAX DMR revenues increased largely as a result of stronger returns under the Company’s DMR arrangements, driven by the geographical mix of films
50
Table of Contents
exhibited in 2017 as compared to prior years. IMAX DMR revenues decreased 0.6% in 2016 from $107.1 million in the year ended December 31, 2015.
The gross margin from the IMAX DMR segment was $71.8 million, $69.2 million and $77.6 million in the years ended December 31, 2017, 2016 and 2015, respectively. Margin is a function of the costs associated with the respective films exhibited in the period, and can vary particularly with respect to marketing expenses.
Contingent rent revenue consists of variable payments received in excess of the fixed minimum ongoing payments which are primarily driven by gross box office performance reported by theater operators. Contingent rent revenue from IMAX systems decreased to $3.9 million in the year ended December 31, 2017 from $4.6 million in the year ended December 31, 2016. Contingent rent revenue from IMAX systems increased to $4.6 million in the year ended December 31, 2016 from $3.9 million in the year ended December 31, 2015.
Theater Business
The primary drivers of this line of business are theater system installations and the Company’s maintenance contract that accompany each theater installation. For the year ended December 31, 2017, theater business revenue decreased $15.1 million, or 8.9% to $155.0 million as compared to the year ended December 31, 2016 and increased 4.1% in 2016 as compared to the year ended December 31, 2015. The decrease in theater business revenue in 2017 as compared to 2016 was primarily due to:
| • | 14 fewer installations of systems contracted as hybrid joint revenue sharing arrangements ($8.7 million less fixed fees); and |
| • | 10 fewer installations of system upgrades ($12.5 million). |
The negative variance was partially offset by a $3.9 million increase due to four additional systems installed under sales or sales-type lease arrangements.
Despite the revenue decrease, theater business gross margin increased 5.5% to $80.3 million in 2017 as compared to $76.2 million in 2016, primarily due to the geographic market and variation of sales, sales-type lease and joint revenue sharing arrangements installed. The theater business gross margin was 51.8% compared to 44.8% in 2016 and 45.9% in 2015.
The installation of theater systems in newly-built theaters or multiplexes, which make up a large portion of the Company’s theater system backlog, depends primarily on the timing of the construction of those projects, which is not under the Company’s control. The breakdown in mix of sales and sales-type lease and joint revenue sharing arrangements (see discussion below) installations by theater system configuration for 2017, 2016 and 2015 is outlined in the table below:
| Years Ended December 31, | ||||||||||||||||||||||||
| 2017 | 2016 | 2015 | ||||||||||||||||||||||
| Number of Systems |
Dollar Value |
Number of Systems |
Dollar Value |
Number of Systems |
Dollar Value |
|||||||||||||||||||
| New IMAX digital theater systems — installed and recognized |
||||||||||||||||||||||||
| Sales and sales-types lease arrangements |
60 | $ | 73,560 | 56 | $ | 69,620 | 56 | $ | 68,799 | |||||||||||||||
| Short-term operating lease arrangement |
— | — | 1 | — | — | — | ||||||||||||||||||
| Joint revenue sharing arrangements — hybrid |
19 | 10,115 | 33 | 18,777 | 31 | 15,645 | ||||||||||||||||||
|
|
|
|
|
|
|
|
|
|
|
|
|
|||||||||||||
| Total new theater systems |
79 | 83,675 | 90 | 88,397 | 87 | 84,444 | ||||||||||||||||||
|
|
|
|
|
|
|
|
|
|
|
|
|
|||||||||||||
| IMAX digital theater system upgrades — installed and recognized |
||||||||||||||||||||||||
| Sales and sales-types lease arrangements |
4 | 5,502 | 14 | 17,975 | 11 | 14,950 | ||||||||||||||||||
| Short-term operating lease arrangements |
— | — | — | — | 2 | — | ||||||||||||||||||
|
|
|
|
|
|
|
|
|
|
|
|
|
|||||||||||||
| Total upgraded theater systems |
4 | 5,502 | 14 | 17,975 | 13 | 14,950 | ||||||||||||||||||
|
|
|
|
|
|
|
|
|
|
|
|
|
|||||||||||||
| Total theater systems installed and recognized |
83 | $ | 89,177 | 104 | $ | 106,372 | 100 | $ | 99,394 | |||||||||||||||
|
|
|
|
|
|
|
|
|
|
|
|
|
|||||||||||||
51
Table of Contents
The average revenue per full, new theater system under a sales and sales-type lease arrangement varies depending upon the number of theater system commitments with a single respective exhibitor, an exhibitor’s location or other various factors. Average revenue per full, new theater system under a sales and sales-type lease arrangement was $1.2 million for the year ended December 31, 2017, as compared to $1.3 million in the year ended December 31, 2016 and $1.2 million for the year ended December 31, 2015.
Revenues from sales and sales-type leases includes settlement revenue of $1.3 million in 2016 as compared to $0.1 million in 2015. Costs associated with settlements consist primarily of commission costs. Gross margin from sales and sales-type leases include settlement margin of $1.2 million in 2016, as compared to $0.1 million in 2015. No such settlement revenue or costs were recorded in the year ended December 31, 2017.
Theater system maintenance revenue increased 12.3% to $45.4 million in the year ended December 31, 2017 from $40.4 million in the year ended December 31, 2016 and $36.9 in 2015, a 9.4% increase in 2016 from 2015. Theater system maintenance gross margin was $18.3 million in the year ended December 31, 2017 versus $13.7 million in the year ended December 31, 2016 and $12.7 million in 2015. The Company recorded a write-down of $0.3 million, $0.2 million and less than $0.1 million for certain service parts inventories in the years ended 2017, 2016 and 2015, respectively. Maintenance revenue continues to grow as the number of theaters in the IMAX theater network grows. Maintenance margins vary depending on the mix of theater system configurations in the theater network, volume-pricing related to larger relationships and the timing and the date(s) of installation and/or service.
Ongoing fees and finance income was $10.5 million in the year ended December 31, 2017 compared to $11.4 million in the year ended December 31, 2016 and $11.3 million in 2015. Gross margin for ongoing rent and finance income decreased to $10.1 million in the year ended December 31, 2017 from $10.7 million in the year ended December 31, 2016 and $10.5 million in 2015. The costs associated with ongoing fees are minimal as it usually consists of depreciation on the Company’s theaters under operating lease agreements and/or marketing.
Other theater revenue decreased to $9.1 million in the year ended December 31, 2017 as compared to $10.9 million in the year ended December 31, 2016 and $10.5 million in 2015. Other theater revenue primarily includes revenue generated from the Company’s after-market sales of projection system parts and 3D glasses. Despite the revenue decline, the gross margin recognized from other theater revenue was on par with prior years ($2.0 million in the year ended December 31, 2017 as compared to $1.9 million in 2016 and $2.1 million in 2015).
New Business
Revenue earned from the Company’s new business initiatives was $24.5 million in the year ended December 31, 2017, as compared to $0.6 million in the year ended December 31, 2016 and $nil in 2015. New business revenue was primarily generated from the release of the co-produced television series “Marvel’s Inhumans” in September 2017 and contractual payments relating to the development of an IMAX VR camera.
The gross margin recognized from the new business segment was a loss of $16.2 million in the year ended December 31, 2017 as compared to a loss of $2.2 million in the year ended December 31, 2016 and $nil in 2015, primarily due to the “Marvel’s Inhumans” performance as well as the launch of the Company’s first pilot IMAX VR Center in Los Angeles, the opening of five VR Centers in 2017 and the performance of the Company’s other new business initiatives, as compared to the prior year comparative period.
The performance of the new business segment for the year ended December 31, 2017, was mostly driven by the Company’s investment in, and the theatrical premiere of, the television series “Marvel’s Inhumans”. Episodic revenue, cost of revenue and negative gross margin recognized for the year ended December 31, 2017, were $20.4 million, $33.4 million and $13.0 million, respectively.
The Company is evaluating its new business initiatives separately from its core business as the nature of its activities is separate and distinct from its ongoing operations. The Company recognized a net loss before tax from its new business initiatives for the year ended December 31, 2017 of $31.5 million, which includes amortization of $15.4 million, exit costs, restructuring charges and associated impairments of $3.4 million, impairment charges of $13.0 million and an equity loss of $0.7 million, as compared to net loss of $10.9 million, which includes amortization of $0.6 million and an equity loss of $2.3 million, in the prior year comparative period. Net loss before tax from its new business initiatives for the year ended December 31, 2015 was $8.5 million, which includes amortization of less than $0.1 million and an equity loss of $2.4 million.
Adjusted EBITDA per Credit Facility from the Company’s new business initiatives was $0.3 million in the year ended December 31, 2017 as compared to negative Adjusted EBITDA per Credit Facility of $8.0 million and $6.1 million in the year ended December 31, 2016 and 2015, respectively.
52
Table of Contents
Other
Film distribution and post-production revenues was $13.2 million in the year ended December 31, 2017, as compared to $14.1 million in the year ended December 31, 2016. In 2017 revenues from post-production was almost double that of 2016 due to work performed on Dunkirk, which was mostly offset by a decrease in film distribution revenue. The film distribution and post-production segments experienced a gross loss of $1.0 million in the year ended December 31, 2017 as compared to a loss of $0.2 million in the year ended December 31, 2016. The Company reviewed the carrying value of certain documentary film assets as a result of lower than expected revenue being generated during the year and revised expectations for future revenues based on the latest information available. In 2017, an impairment of $5.3 million was recorded based on the carrying value of these documentary films as compared to the related estimated future box office and revenues that would ultimately be generated by these films.
Film distribution and post-production revenues increased 29.1% to $14.1 million in 2016 from $10.9 million in 2015, primarily due to an increase in film distribution revenue from IMAX original films. The year ended December 31, 2016, includes the release of two IMAX original productions, A Beautiful Planet and Voyage of Time, whereas no original films were released in 2015. Gross margin was a loss of $0.2 million in 2016 as compared to $1.1 million in 2015, primarily due to a charge against film assets of $3.0 million in 2016, to reflect the carrying value of certain documentary film assets that exceeded the expected revenues generated from estimated future box-office. No similar charge was recorded in 2015. This was partially offset by revenue earned from the release of the two IMAX original productions in 2016 as discussed above.
Other revenue decreased to $4.9 million in the year ended December 31, 2017, as compared to $7.9 million in the year ended December 31, 2016 and $7.1 million in 2015. Other revenue primarily includes revenue generated from the Company’s theater operations and camera rental business. The decrease in revenue is primarily the result of two IMAX owned and operational theaters in the year ended December 31, 2017, as compared to three such theaters in the prior years comparative period.
The gross margin recognized from other revenue was a loss of $0.9 million in the year ended December 31, 2017, as compared to loss of $0.3 million in the year ended December 31, 2016 and loss of $1.8 million in 2015 due to the performance of the owned and operated theaters and the lower revenues from camera rentals.
Selling, General and Administrative Expenses
In conjunction with the Company’s restructuring and cost-savings initiatives, selling, general and administrative expenses decreased to $110.4 million in 2017, as compared to $124.7 million in 2016. Selling, general and administrative expenses excluding the impact of stock-based compensation were $90.0 million in 2017, as compared to $94.2 million in 2016.
Selling, general and administrative expenses increased to $124.7 million in 2016, as compared to $115.3 million in 2015. Selling, general and administrative expenses excluding the impact of stock-based compensation were $94.2 million in 2016, as compared to $93.4 million in 2015.
The following reflects the significant items impacting selling, general and administrative expenses for the years ended December 31, 2017, 2016 and 2015:
| 2017 | 2016 | 2015 | 2017 versus 2016 | 2016 versus 2015 | ||||||||||||||||||||||||
| Stock-based compensation |
$ | 20,393 | $ | 30,523 | $ | 21,880 | $ | (10,130 | ) | (33.2 | )% | $ | 8,643 | 39.5 | % | |||||||||||||
| Staff costs |
58,284 | 60,659 | 57,046 | (2,375 | ) | (3.9 | )% | 3,613 | 6.3 | % | ||||||||||||||||||
| Foreign exchange (gain) loss |
(954 | ) | 859 | 2,373 | (1,813 | ) | (211.1 | )% | (1,514 | ) | (63.8 | )% | ||||||||||||||||
| Other general corporate expenditures |
32,677 | 32,704 | 34,046 | (27 | ) | (0.1 | )% | (1,342 | ) | (3.9 | )% | |||||||||||||||||
|
|
|
|
|
|
|
|
|
|
|
|||||||||||||||||||
| Total |
$ | 110,400 | $ | 124,745 | $ | 115,345 | $ | (14,345 | ) | $ | 9,400 | |||||||||||||||||
|
|
|
|
|
|
|
|
|
|
|
|||||||||||||||||||
Staff costs presented above are related to the Company’s core business and include salaries and benefits.
The Company’s net foreign exchange gains/losses are related to the translation of foreign currency denominated monetary assets and liabilities.
Other general corporate expenditures include professional fees, travel and entertainment. Selling, general and administrative expenses also includes asset impairment charges and write-offs, if any, and miscellaneous items, other than interest.
53
Table of Contents
Research and Development
Research and development expenses increased to $20.9 million in 2017 compared to $16.3 million in 2016 and $12.7 million in 2015 and are primarily attributable to the continued development of the Company’s updated laser-based digital projection system and other new business initiatives which commenced in 2016, including the development of a VR camera and virtual reality centers.
The Company intends for additional research and development to continue through 2018, as the Company supports further development of an updated laser-based projection system, which is targeted primarily for screens in commercial multiplexes.
The Company also intends to continue research and development in other areas considered important to the Company’s continued commercial success, including further improving the reliability of its projectors, developing and manufacturing more IMAX cameras, enhancing the Company’s 2D and 3D image quality, expanding the applicability of the Company’s digital technology, developing IMAX theater systems’ capabilities in both home and live entertainment, improvements to the DMR process and the ability to deliver DMR releases digitally to its theater network, without the requirement for hard drives.
Receivable Provisions, Net of Recoveries
Receivable provisions, net of recoveries for accounts receivable and financing receivables amounted to a net provision of $2.6 million in 2017, as compared to $1.0 million in 2016 and $0.8 million in 2015. The higher charge in 2017 as compared to prior years’ is primarily resulting from the deterioration in the financial condition of certain theater exhibitors and studios.
The Company’s accounts receivables and financing receivables are subject to credit risk, as a result of geographical location, exchange rate fluctuations, and other unforeseeable financial difficulties. These receivables are concentrated with the leading theater exhibitors and studios in the film entertainment industry. To minimize the Company’s credit risk, the Company retains title to underlying theater systems leased, performs initial and ongoing credit evaluations of its customers and makes ongoing provisions for its estimate of potentially uncollectible amounts. Accordingly, the Company believes it has adequately protected itself against exposures relating to receivables and contractual commitments.
Asset Impairments and Other Charges
In 2017, the Company identified and wrote off $1.2 million related to a certain loan that is no longer considered collectible. No such charge was recognized in the prior years comparative period.
The Company recorded a charge related to property, plant and equipment of $0.2 million and $0.4 million in 2016 and 2015, respectively, reflecting assets that no longer meet the capitalization requirements. No such charge was recorded in the year ended December 31, 2016.
In 2016, the Company recognized a $0.2 million other-than-temporary impairment of its investments as the value is not expected to recover based on the length of time and extent to which the market value has been less than cost, as compared to $0.4 million in 2015. No such charge was recorded in the year ended December 31, 2017.
Interest Income and Expense
Interest income was $1.0 million in 2017, as compared to $1.5 million in 2016 and $1.0 million in 2015.
Interest expense was $1.9 million in 2017, as compared to $1.8 million in 2016 and $1.7 million in 2015. Consistent with its historical financial reporting, the Company has elected to classify interest and penalties related to income tax liabilities, when applicable, as part of the interest expense in its consolidated statements of operations rather than income tax expense. In 2017, 2016 and 2015, the Company recovered less than $0.1 million, respectively, in potential interest and penalties associated with its provision for uncertain tax positions. Also included in interest expense is the amortization of deferred finance costs in the amount of $0.6 million, $0.5 million and $1.0 million in 2017, 2016 and 2015, respectively. The Company’s policy is to defer and amortize all the costs relating to debt financing which are paid directly to the debt provider, over the life of the debt instrument.
54
Table of Contents
Exit costs, restructuring charges and associated impairments
Exit costs, restructuring charges and associated impairments were $16.2 million in the year ended December 31, 2017 which is comprised of costs incurred to exit an existing operating lease, employee severance costs, costs of consolidating facilities and contract termination costs. No such charges were incurred in prior years.
Income Taxes
The Company’s effective tax rate differs from the statutory tax rate and varies from year to year primarily as a result of numerous permanent differences, investment and other tax credits, the provision for income taxes at different rates in foreign and other provincial jurisdictions, enacted statutory tax rate increases or reductions in the year, including the impact of the Tax Cuts and Jobs Act (the “Tax Act”), changes due to foreign exchange, changes in the Company’s valuation allowance based on the Company’s recoverability assessments of deferred tax assets, and favorable or unfavorable resolution of various tax examinations.
The Company recorded income tax expense of $16.8 million for the year-ended December 31, 2017. The effective tax rate for the year of 55.9% was significantly higher than the statutory rate due to the impact of the Tax Act, which was enacted on December 22, 2017 by the U.S. government. The Tax Act makes broad and complex changes to the U.S. tax code including, but not limited to reducing the U.S. federal corporate tax rate from 35% to 21%, and imposing other limitations and changes that limit or eliminate various deductions, including interest expense, performance based compensation for certain executives, and other deductions requiring the re-measurement of deferred tax assets and liabilities. U.S. GAAP requires that the impact of changes to tax legislation be recognized in the period in which the law was enacted.
On December 22, 2017, the SEC issued Staff Accounting Bulletin (“SAB 118”), which provides guidance on accounting for tax effects of the Tax Act when a company does not have all the necessary information available, prepared or analyzed (including computations) in reasonable detail to complete its accounting for the effect of the changes in the Tax Act. SAB 118 provides a measurement period that should not extend beyond one year from the Tax Act enactment date for companies to complete the accounting under ASC 740. While the Company is able to make reasonable estimates of the impact of the reduction in corporate rate and other changes in the legislation on deferred tax assets and liabilities the final impact of the Tax Act may differ from these estimates, due to, among other things, changes in interpretations and assumptions, additional guidance that may be issued by the I.R.S., and actions the Company may take.
The effect of the re-measurement on deferred taxes is reflected entirely in the period that includes the enactment date and is allocated directly to income tax expense. As of December 31, 2017, the Company can determine a reasonable estimate of the effects of tax reform and is recording that estimate as a provisional amount. The provisional re-measurement of the deferred tax assets and liabilities resulted in a $9.3 million discrete tax provision which increased the effective tax rate by 31.1% for the year. The provisional re-measurement amount may change as data becomes available allowing more accurate scheduling of the deferred tax assets and liabilities.
The Tax Act also includes a number of other changes including: (a) the imposition of a one-time deemed repatriation tax on accumulated foreign earnings (the “Transition Tax”), (b) a 100% dividends received deduction on dividends from foreign affiliates, (c) a current inclusion in U.S. federal taxable income of earnings of foreign affiliates that are determined to be global intangible low taxed income or “GILTI”, (d) creation of the base erosion anti-abuse tax, or “BEAT”, (e) provision for an effective tax rate of 13.125% for certain income derived from outside of the U.S. (referred to as foreign derived intangible income or “FDII”) and, (f) 100% expensing of qualifying fixed assets acquired after September 27, 2017.
Given that the Company is a Canadian based multinational with subsidiary operations in the US and other foreign jurisdictions a number of these changes are not anticipated to impact the Company. The Company does not expect to be subject to the BEAT, Transition Tax or GILTI given its current legal and tax structures. The Company will be eligible to expense qualifying fixed assets acquired after September 27, 2017, and will be impacted by the additional limitations imposed on the deductibility of executive compensation, and does not expect to be adversely impacted by the limitations placed on the deductibility of interest expense. The impact of the Tax Act may differ from this estimate, during the one-year measurement period due to, among other things, further refinement of the Company’s calculations, changes in interpretations and assumptions the Company has made, guidance that may be issued and actions the Company may take as a result of the Tax Act.
As a result, no income taxes have been provided for any undistributed foreign earnings, or any additional outside basis differences inherent in these foreign entities, as the Company is a Canadian corporation and these amounts continue to be indefinitely reinvested in foreign operations which are owned directly or indirectly.
55
Table of Contents
As at December 31, 2017, the Company had a gross deferred income tax asset of $30.9 million, against which the Company is carrying a $0.2 million valuation allowance. For the year ended December 31, 2017, the Company recorded an income tax provision of $16.8 million, which included a provision of $1.4 million related to its provision for uncertain tax positions. In addition, included in the provision for income taxes was a $0.6 million provision for tax shortfalls related to stock-based compensation costs recognized in the period, and the $9.3 million charge relating to the re-measurement of the Company’s US deferred tax assets and liabilities given the enactment of the Tax Act.
The Company recorded an income tax provision of $16.2 million for 2016, of which $1.6 million is related to a decrease in its provision for uncertain tax positions and offset by net income tax recovery of $0.1 million.
During the year ended December 31, 2017, after considering all available evidence, both positive (including recent profits, projected future profitability, backlog, carry forward periods for, and utilization of net operating loss carryovers and tax credits, discretionary deductions and other factors) and negative (including cumulative losses in past years and other factors), the Company concluded that the valuation allowance against the Company’s deferred tax assets was adequate. The remaining $0.2 million balance in the valuation allowance as at December 31, 2017 is primarily attributable to certain U.S. state net operating loss carryovers that may expire without being utilized.
The Company’s Chinese subsidiary has made certain enquiries of the Chinese State Administration of Taxation regarding the potential deductibility of certain stock based compensation for stock options issued by the Chinese subsidiary’s parent company, IMAX China. In addition, Chinese regulatory authorities responsible for capital and exchange controls will need to review and approve the proposed transactions before they can be completed. There may be a requirement for future investment of funds into China in order to secure the deduction. Should the Company proceed, any such future investment would come from existing capital invested in the IMAX China group of companies being redeployed amongst the IMAX China group of companies, including the Chinese subsidiary. The Company is unable to reliably estimate the magnitude of the related tax benefits at this time.
Equity-Accounted Investments
The Company accounts for investments in new business ventures using the guidance of the FASB ASC 323. At December 31, 2017, the equity method of accounting is being utilized for investments with a total carrying value of $nil (December 31, 2016 — $nil). The Company’s accumulated losses in excess of its equity investment were $2.0 million as at December 31, 2017 and $0.5 million as at December 31, 2016, and are classified in Accrued and other liabilities. For the year ended December 31, 2017, gross revenues, cost of revenue and net loss for these investments were $2.5 million, $3.9 million and $2.5 million, respectively (2016 — $0.6 million, $6.8 million and $6.2 million, respectively; 2015 — $nil, $9.3 million and $9.1 million, respectively). The Company recorded its proportionate share of the net loss which amounted to $0.7 million for 2017 as compared to $2.3 million in 2016 and $2.4 million in 2015.
Non-Controlling Interests
The Company’s consolidated financial statements include the non-controlling interest in the net income of IMAX China resulting from the IMAX China Investment and the IMAX China IPO as well as the impact of non-controlling interests in its subsidiaries created for the Film Fund and VR Content Fund activity. For the year ended December 31, 2017, the net income attributable to non-controlling interests of the Company’s subsidiaries was $10.2 million (2016 — $10.5 million; 2015 — $8.8 million).
Pension Plan
The Company has an unfunded defined benefit pension plan, the Supplemental Executive Retirement Plan (the “SERP”), covering the Company’s CEO, Mr. Gelfond. As at December 31, 2017, the Company had an unfunded and accrued projected benefit obligation of approximately $19.0 million (December 31, 2016 — $19.6 million) in respect of the SERP.
The components of net periodic benefit cost were as follows:
| Years ended December 31, | ||||||||||||
| 2017 | 2016 | 2015 | ||||||||||
| Interest cost |
$ | 427 | $ | 261 | $ | 253 | ||||||
|
|
|
|
|
|
|
|||||||
| Pension expense |
$ | 427 | $ | 261 | $ | 253 | ||||||
|
|
|
|
|
|
|
|||||||
56
Table of Contents
The plan experienced an actuarial gain of $1.0 million during 2017, $0.2 million in 2016, and $0.2 million in 2015 resulting primarily from the continuing change in the Pension Benefit Guaranty Corporation (“PBGC”) published annuity interest rates year-over-year used to determine the lump sum payment under the plan.
Under the terms of the SERP, if Mr. Gelfond’s employment is terminated other than for cause (as defined in his employment agreement), he is entitled to receive SERP benefits in the form of a lump sum payment. SERP benefit payments to Mr. Gelfond are subject to a deferral for six months after the termination of his employment, at which time Mr. Gelfond will be entitled to receive interest on the deferred amount credited at the applicable federal rate for short-term obligations. Pursuant to an employment agreement dated November 8, 2016, the term of Mr. Gelfond’s employment was extended through December 31, 2019, although Mr. Gelfond has not informed the Company that he intends to retire at that time. Under the terms of the arrangement, no compensation earned beginning in 2011 is to be included in calculating this entitlement under the SERP.
The Company has a postretirement plan to provide health and welfare benefits to Canadian employees meeting certain eligibility requirements. As at December 31, 2017, the Company had an unfunded benefit obligation of $1.7 million (December 31, 2016 — $1.7 million). For the year ended December 31, 2017 the Company contributed and expensed an aggregate of $0.1 million (2016 — $0.1 million; 2015 — $0.1 million).
In July 2000, the Company agreed to maintain health benefits for Messrs. Gelfond and Bradley J. Wechsler, the Company’s former Co-CEO and current Chairman of its Board of Directors, upon retirement. As at December 31, 2017, the Company had an unfunded benefit obligation recorded of $0.7 million (December 31, 2016 — $0.6 million). For the year ended December 31, 2017 the Company contributed and expensed an aggregate of less than $0.1 million (2016 — $0.1 million; 2015 — $0.2 million).
The Company also maintains a deferred compensation retirement plan (the “Retirement Plan”) covering Greg Foster, CEO of IMAX Entertainment and Senior Executive Vice President of the Company. The Company has agreed to make a total contribution of $3.2 million over Mr. Foster’s employment term. The Retirement Plan is subject to a vesting schedule based on continued employment with the Company, such that 25% will vest July 2019; 50% will vest July 2022; 75% will vest July 2025; and Mr. Foster will be 100% vested in July 2027. As at December 31, 2017, the Company had an unfunded benefit obligation recorded of $1.0 million (December 31, 2016 - $0.5 million). During 2017, the Company contributed and expensed an aggregate of $0.7 million (2016 — $0.5 million).
Stock-Based Compensation
The Company estimates the fair value of stock option awards on the date of grant using fair value measurement techniques. The fair value of RSU awards is equal to the closing price of the Company’s common stock on the date of grant.
Stock-based compensation expense recognized under FASB ASC 718, “Compensation – Stock Compensation” (“ASC 718”) for 2017, 2016 and 2015 was $23.0 million, $30.5 million and $21.9 million, respectively. The following reflects the Company’s stock-based compensation expense recorded to the respective financial statement line items in 2017:
| 2017 | ||||
| Cost and expenses applicable to revenues |
$ | 1,704 | ||
| Selling, general and administrative expenses |
20,393 | |||
| Research and development |
556 | |||
| Exit costs, restructuring charges and associated impairments |
357 | |||
|
|
|
|||
| $ | 23,010 | |||
|
|
|
|||
In 2016 and 2015, all stock-based compensation expense was recorded in selling, general and administrative expenses.
57
Table of Contents
LIQUIDITY AND CAPITAL RESOURCES
Credit Facility
The Company maintains a senior secured credit facility (the “Credit Facility”) with a maximum borrowing capacity of $200.0 million and a scheduled maturity of March 3, 2020. The Credit Facility is collateralized by a first priority security interest in substantially all of the present and future assets of the Company and the Guarantors. Certain of the Company’s subsidiaries serve as guarantors (the “Guarantors”) of the Company’s obligations under the Credit Facility.
The terms of the Credit Facility are set forth in the Fourth Amended and Restated Credit Agreement (the “Credit Agreement”), dated March 3, 2015, among the Company, the Guarantors, the lenders named therein, Wells Fargo Bank, National Association (“Wells Fargo”), as agent and issuing lender (Wells Fargo, together with the lenders named therein, the “Lenders”) and Wells Fargo Securities, LLC, as Sole Lead Arranger and Sole Bookrunner and in various collateral and security documents entered into by the Company and the Guarantors.
Total amounts drawn and available under the Credit Facility at December 31, 2017 were $nil and $200.0 million, respectively (December 31, 2016 – $nil and $200.0 million, respectively).
Under the Credit Facility, the effective interest rate for the year ended December 31, 2017 was nil, as no amounts were outstanding during the period (2016 – nil).
The Credit Agreement provides that the Company is required at all times to satisfy a Minimum Liquidity Test (as defined in the Credit Agreement) of at least $50.0 million. The Company is also required to maintain minimum Adjusted EBITDA per Credit Facility (as defined in the Credit Agreement as EBITDA and referred to herein as Adjusted EBITDA per Credit Facility) of $100.0 million, and a Maximum Total Leverage Ratio (as defined in the Credit Agreement) of 1.75:1.0. The Company was in compliance with all of these requirements at December 31, 2017. The Maximum Total Leverage Ratio was 0.19:1 as at December 31, 2017, where Total Debt (as defined in the Credit Agreement) is the sum of all obligations evidenced by notes, bonds, debentures or similar instruments and was $25.7 million. Adjusted EBITDA per Credit Facility is calculated as follows:
| Adjusted EBITDA per Credit Facility: | ||||
| (In thousands of U.S. Dollars) | ||||
| Net income |
$12,518 | |||
| Add (subtract): |
||||
| Provision for income taxes |
16,790 | |||
| Interest expense, net of interest income |
915 | |||
| Depreciation and amortization, including film asset amortization(1) |
66,245 | |||
|
|
|
|||
| EBITDA |
$ | 96,468 | ||
| Exit costs, restructuring charges and associated impairments |
16,174 | |||
| Stock and other non-cash compensation |
23,718 | |||
| Write-downs, net of recoveries including asset impairments and receivable provisions(1) |
24,015 | |||
| Loss from equity accounted investments |
703 | |||
|
|
|
|||
| Adjusted EBITDA before non-controlling interests |
161,078 | |||
| Adjusted EBITDA attributable to non-controlling interests(2) |
(22,927 | ) | ||
|
|
|
|||
| Adjusted EBITDA per Credit Facility |
$ | 138,151 | * | |
|
|
|
|||
| Adjusted EBITDA per Credit Facility, excluding impact from “Marvel’s Inhumans” |
$ | 126,158 | * | |
|
|
|
|||
| * | Adjusted EBITDA per Credit Facility of $138.2 million includes the impact of the Company’s investment in “Marvel’s Inhumans”, which resulted in a $13.0 million loss. However, as permitted by the Credit Facility, this loss was offset by addbacks of $13.3 million and $11.7 million for amortization and impairment charges, respectively, relating to the investment, the net effect of which was to increase Adjusted EBITDA per Credit Facility by $12.0 million. This investment represents the Company’s first foray into a commercial television property, and therefore the Adjusted EBITDA per Credit Facility metric presented above may not be reflective of the Company’s typical operational activity. Further, the Company does not yet know whether it will make similar investments in the future. As a result, the Company is also presenting Adjusted EBITDA per Credit Facility excluding the impact of “Marvel’s Inhumans” to better facilitate comparisons to prior and future periods. |
58
Table of Contents
| (1) | See note 17 to the audited consolidated financial statements in Item 8 of the Company’s 2017 Form 10-K. |
| (2) | The Adjusted EBITDA per Credit Facility calculation specified for purposes of the minimum Adjusted EBITDA per Credit Facility covenant excludes the reduction in Adjusted EBITDA per Credit Facility from the Company’s non-controlling interests. |
Playa Vista Financing
In 2014, IMAX PV Development Inc., (“PV Borrower”) a wholly-owned subsidiary of the Company, entered into a loan agreement with Wells Fargo to principally fund the costs of development and construction of the Company’s new West Coast headquarters, located in the Playa Vista neighborhood of Los Angeles, California (the “Playa Vista Loan”).
The Playa Vista Loan was fully drawn at $30.0 million and bore interest at a variable interest rate per annum equal to 2.0% above the 30-day LIBOR rate. PV Borrower was required to make monthly payments of combined principal and interest over a 10-year term with a lump sum payment at the end of year 10. The Playa Vista Loan is being amortized over 15 years. The Playa Vista Loan will be fully due and payable on October 19, 2025 (the “Maturity Date”), and may be prepaid at any time without premium, but with all accrued interest and other applicable payments.
The Playa Vista Loan is secured by a deed of trust from PV Borrower in favor of Wells Fargo and other documents evidencing and securing the loan, granting a first lien on and security interest in the Playa Vista property and the Playa Vista project, including all improvements to be constructed thereon. The company has also guaranteed Playa Vista Loan.
The Loan Documents contain affirmative, negative and financial covenants (including compliance with the financial covenants of the Company’s outstanding Credit Facility), agreements, representations, warranties, borrowing conditions, and events of default customary for development projects such as the Playa Vista Project.
Total amount drawn under the Playa Vista Loan as at December 31, 2017 was $25.7 million (December 31, 2016 — $27.7 million). Under the Playa Vista Loan, the effective interest rate for December 31, 2017 was 3.14% (December 31, 2016 — 2.52%).
Letters of Credit and Other Commitments
As at December 31, 2017 and 2016, the Company did not have any letters of credit and advance payment guarantees outstanding, under the Credit Facility.
The Company also has a $10.0 million facility for advance payment guarantees and letters of credit through the Bank of Montreal for use solely in conjunction with guarantees fully insured by Export Development Canada (the “Bank of Montreal Facility”). The Bank of Montreal Facility is unsecured and includes typical affirmative and negative covenants, including delivery of annual consolidated financial statements within 120 days of the end of the fiscal year. The Bank of Montreal Facility is subject to periodic annual reviews. As at December 31, 2017, the Company did not have any letters of credit and advance payment guarantees outstanding under the Bank of Montreal Facility (December 31, 2016 – $0.1 million).
Cash and Cash Equivalents
As at December 31, 2017, the Company’s principal sources of liquidity included cash and cash equivalents of $158.7 million, the Credit Facility, anticipated collection from trade accounts receivable of $130.5 million including receivables from theaters under joint revenue sharing arrangements and DMR agreements with studios, anticipated collection from financing receivables due in the next 12 months of $27.0 million and payments expected in the next 12 months on existing backlog deals. As at December 31, 2017, the Company did not have any amount drawn on the Credit Facility (remaining availability of $200.0 million) and the Company had $25.7 million drawn on the Playa Vista Loan. There were no letters of credit and advance payment guarantees outstanding under the Credit Facility and the Bank of Montreal Facility. Cash held outside of North America as at December 31, 2017 was $119.4 million (December 31, 2016 — $117.4 million), of which $32.6 million was held in the People’s Republic of China (“PRC”) (December 31, 2016 — $31.5 million). The Company’s intent is to permanently reinvest these amounts outside of Canada and the Company does not currently anticipate that it will need funds generated from foreign operations to fund North American operations. In the event funds from foreign operations are needed to fund operations in North America and if withholding taxes have not already been previously provided, the Company would be required to accrue and pay these additional withholding tax amounts on repatriation of funds from China to Canada. The Company currently estimates this amount to be $6.9 million.
59
Table of Contents
During the year ended December 31, 2017, the Company’s operations provided cash of $85.4 million. The Company used cash of $73.5 million to fund capital expenditures, to build equipment for use in joint revenue sharing arrangements, to purchase other intangible assets, to invest in new business ventures such as its VR initiatives and to purchase property, plant and equipment. These uses of cash were partially offset by cash provided by operating activities. Based on management’s current operating plan for 2018, the Company expects to continue to use cash to deploy additional theater systems under joint revenue sharing arrangements, to fund DMR agreements with studios, invest in new business ventures and continued share repurchases. Cash flows from joint revenue sharing arrangements are derived from the theater box-office and concession revenues and the Company invested directly in the roll out of 105 new theater systems under joint revenue sharing arrangements in the year ending December 31, 2017, of which 86 new theater systems were capitalized by the Company.
The Company completed its previously announced $200.0 million share repurchase program in the second quarter of 2017 by repurchasing 1,736,150 common shares at an average price of $26.57 per share. The retired shares were repurchased for $46.1 million.
In June 2017, the Company announced a number of actions aimed at increasing Company value, including the approval by the Company’s Board of Directors of a new share repurchase program which authorizes the repurchase of up to $200.0 million of its common shares by June 30, 2020. The repurchases may be made either in the open market or through private transactions, subject to market conditions, applicable legal requirements and other relevant factors. The Company has no obligation to repurchase shares and the share repurchase program may be suspended or discontinued by the Company at any time. There were no repurchases of shares under the new share repurchase program during the year.
In addition, the Company has implemented a cost reduction plan with the goal to create annualized cost savings aimed at increasing profitability, operating leverage and free cash flow. For more details see notes 14 and 22 to the accompanying consolidated financial statements in Item 8 of this 2017 Form 10-K.
The Company’s operating cash flow will be adversely affected if management’s projections of future signings for theater systems and film performance, theater installations and film productions are not realized. The Company forecasts its short-term liquidity requirements on a quarterly and annual basis. Since the Company’s future cash flows are based on estimates and there may be factors that are outside of the Company’s control (see “Risk Factors” in Item 1A in the Company’s 2017 Form 10-K), there is no guarantee that the Company will continue to be able to fund its operations through cash flows from operations. Under the terms of the Company’s typical sale and sales-type lease agreement, the Company receives substantial cash payments before the Company completes the performance of its obligations. Similarly, the Company receives cash payments for some of its film productions in advance of related cash expenditures. Based on the Company’s cash flow from operations and facilities, it expects to have sufficient capital and liquidity to fund its operations in the normal course for the next 12 months.
Operating Activities
The Company’s net cash provided by operating activities is affected by a number of factors, including the proceeds associated with new signings of theater system lease and sale agreements in the year, costs associated with contributing systems under joint revenue sharing arrangements, the box-office performance of films distributed by the Company and/or released to IMAX theaters, increases or decreases in the Company’s operating expenses, including research and development and new business initiatives, and the level of cash collections received from its customers.
Cash provided by operating activities amounted to $85.4 million for the year ended December 31, 2017. Changes in other non-cash operating assets as compared to December 31, 2016 include:
| • | a net increase of $37.8 million in accounts receivable resulting from amounts billed in the year offset by cash receipts; |
| • | a net increase of $7.3 million in financing receivables primarily due to ongoing minimum rent payments received offset by installation and recognition of IMAX theater systems under sales or sales-type lease arrangements; |
| • | a net decrease of $10.8 million in inventories as the amounts relieved from inventory for systems recognized and service parts used exceeded the build-up of inventory for future IMAX theater system installations under sales or hybrid arrangements; |
| • | a net increase of $0.9 million in prepaid expenses due to timing; and |
| • | a net increase of $0.5 million in other assets which primarily reflects a change in commission and other deferred selling expenses. |
60
Table of Contents
Changes in other operating liabilities as compared to December 31, 2016 include: a net increase in deferred revenue of $22.9 million related to backlog payments received in the current period, offset by amount relieved from deferred revenue related to theater system installations; a net increase in accounts payable of $4.2 million; and a net decrease of $0.6 million in accrued liabilities, both of which are due to normal operational activity.
Investing Activities
Capital expenditures, including the Company’s investment in joint revenue sharing equipment, purchase of property, plant and equipment, other intangible assets and investments in film assets were $106.6 million in 2017 as compared to $85.3 million in 2016. The Company expects its investment in capital expenditures to remain fairly consistent as the nature of these cash outlays in particular, joint revenue sharing arrangements and film assets, exist to strengthen operational performances.
Net cash used in investing activities amounted to $73.6 million in year ended December 31, 2017, which includes purchases of $24.1 million in property, plant and equipment of which $4.5 million is for the Company’s new business segment assets, an investment in joint revenue sharing equipment of $42.6 million, an investment in new business ventures of $1.6 million and an investment in other intangible assets of $5.2 million, primarily related to expanding the functionality of the Company’s enterprise resource planning system.
Financing Activities
Net cash used in financing activities in the year ended December 31, 2017 amounted to $57.5 million as compared to $125.8 million in the year ended December 31, 2016. In the year ended December 31, 2017, the Company paid $46.1 million for the repurchase of common shares under the Company’s share repurchase program and $25.5 million to purchase treasury stock for the settlement of restricted share units and options. In addition, the Company also made repayments of $2.0 million under the Playa Vista Loan. These cash outlays were offset by $16.7 million received from the issuance of common shares resulting from stock option exercises and a $0.6 million of taxes withheld and paid on vested employee stock awards.
Prior Year Cash Flow Activities
Net cash provided by operating activities amounted to $77.9 million in the year ended December 31, 2016. Changes in other non-cash operating assets as compared to 2015 included: a net increase of $1.4 million in accounts receivable; a net increase of $4.6 million in financing receivables; a net increase of $3.8 million in inventories; a net increase of $0.1 million in prepaid expenses; and a net increase of $6.7 million in other assets which includes an increase of $5.7 million in prepaid tax and a net increase of $1.0 million in other assets which reflect a change in commissions and other deferred selling expenses. Changes in other operating liabilities as compared to December 31, 2015 included: a net decrease in deferred revenue of $14.7 million related to amounts relieved from deferred revenue due to theater system installations, offset partially by payments received in the current year related to theater systems not yet installed; a net decrease in accounts payable of $3.4 million; and a net increase of $3.9 million in accrued liabilities.
Net cash used in investing activities amounted to $64.9 million in 2016, which included purchases of $15.3 million in property, plant and equipment, an investment in joint revenue sharing equipment of $42.9 million, an investment in new business ventures of $1.9 million and an investment in other intangible assets of $4.8 million.
Net cash provided by financing activities in 2016 amounted to $125.8 million as compared to cash used in financing activities of $204.7 million in 2015. In 2016, the Company paid $116.5 million for the repurchase of common shares under the Company’s share repurchase program and $19.9 million to purchase treasury stock for the settlement of restricted share units and options. In addition, the Company paid $2.4 million of taxes relating to secondary sales and repatriation dividends and $0.5 million of taxes relating to employee stock award vesting. Furthermore, the Company also made $2.0 million in repayments under the Playa Vista Loan. These cash outlays were offset by $13.1 million received from the issuance of common shares resulting from stock option exercises, and $2.5 million received from a capital contribution to the Film Fund made by third parties.
Capital expenditures including the Company’s investment in joint revenue sharing equipment, purchase of property, plant and equipment, net of sales proceeds, other intangible assets and investments in film assets were $85.3 million in the year ended December 31, 2016.
61
Table of Contents
CONTRACTUAL OBLIGATIONS
Payments to be made by the Company under contractual obligations as of December 31, 2017 are as follows:
| Payments Due by Fiscal Year | ||||||||||||||||||||
| (In thousands of U.S. Dollars) | Total Obligations |
1 year | > 1 - 3 years | > 3 - 5 years | Thereafter | |||||||||||||||
| Purchase obligations |
$ | 38,055 | $ | 38,055 | $ | — | $ | — | $ | — | ||||||||||
| Pension obligations |
20,076 | — | 20,076 | — | — | |||||||||||||||
| Operating lease obligations |
24,933 | 6,226 | 5,007 | 2,761 | 10,939 | |||||||||||||||
| Playa Vista Loan |
25,667 | 2,000 | 4,000 | 4,000 | 15,667 | |||||||||||||||
| Postretirement benefits obligations |
4,569 | 746 | 1,093 | 908 | 1,822 | |||||||||||||||
| Other financial commitments |
10,677 | 6,677 | 4,000 | — | — | |||||||||||||||
|
|
|
|
|
|
|
|
|
|
|
|||||||||||
| $ | 123,977 | $ | 53,704 | $ | 34,176 | $ | 7,669 | $ | 28,428 | |||||||||||
|
|
|
|
|
|
|
|
|
|
|
|||||||||||
| (1) | The Company’s total payments to be made under binding commitments with suppliers and outstanding payments to be made for supplies ordered but yet to be invoiced. |
| (2) | The SERP assumptions are that Mr. Gelfond will receive a lump sum payment six months after retirement at the end of the current term of his employment agreement (December 31, 2019), although Mr. Gelfond has not informed the Company that he intends to retire at that time. |
| (3) | The Company’s total minimum annual rental payments to be made under operating leases, mostly consisting of rent at the Company’s property in New York and at the various owned and operated theaters. |
| (4) | The Playa Vista Loan is fully due and payable on October 19, 2025. The Company is required to make monthly payments of combined principal and interest. |
| (5) | Other financial commitments include the Company’s total minimum commitment toward the development, production, post-production and marketing, related to certain film and new content initiatives for which a term sheet and/or agreement has been executed. |
Pension and Postretirement Obligations
The Company has an unfunded defined benefit pension plan, the SERP, covering Mr. Gelfond. As at December 31, 2017, the Company had an unfunded and accrued projected benefit obligation of approximately $19.0 million (December 31, 2016 — $19.6 million) in respect of the SERP.
Pursuant to an employment agreement dated November 8, 2016, the term of Mr. Gelfond’s employment was extended through December 31, 2019, although Mr. Gelfond has not informed the Company that he intends to retire at that time. Under the terms of the arrangement, no compensation earned beginning in 2011 is to be included in calculating his entitlement under the SERP.
The Company has a postretirement plan to provide health and welfare benefits to Canadian employees meeting certain eligibility requirements. As at December 31, 2017, the Company had an unfunded benefit obligation of $1.7 million (December 31, 2016 — $1.7 million).
In July 2000, the Company agreed to maintain health benefits for Messrs. Gelfond and Bradley J. Wechsler, the Company’s former Co-CEO and current Chairman of its Board of Directors, upon retirement. As at December 31, 2017, the Company had an unfunded benefit obligation of $0.7 million (December 31, 2016 — $0.6 million).
The Company also maintains a Retirement Plan covering Greg Foster, CEO of IMAX Entertainment and Senior Executive Vice President of the Company. The Company has agreed to make a total contribution of $3.2 million over Mr. Foster’s employment term. The Retirement Plan is subject to a vesting schedule based on continued employment with the Company, such that 25% will vest July 2019; 50% will vest July 2022; 75% will vest July 2025; and Mr. Foster will be 100% vested in July 2027. As at December 31, 2017, the Company had an unfunded benefit obligation recorded of $1.0 million (December 31, 2016 — $0.5 million).
62
Table of Contents
OFF-BALANCE SHEET ARRANGEMENTS
There are currently no off-balance sheet arrangements that have or are reasonably likely to have a current or future material effect on the Company’s financial condition.
| Item 7A. | Quantitative and Qualitative Factors about Market Risk |
The Company is exposed to market risk from foreign currency exchange rates and interest rates, which could affect operating results, financial position and cash flows. Market risk is the potential change in an instrument’s value caused by, for example, fluctuations in interest and currency exchange rates. The Company’s primary market risk exposure is the risk of unfavorable movements in exchange rates between the U.S. dollar, the Canadian dollar and the Chinese Yuan Renminbi. The Company does not use financial instruments for trading or other speculative purposes.
Foreign Exchange Rate Risk
A majority of the Company’s revenue is denominated in U.S. dollars while a significant portion of its costs and expenses is denominated in Canadian dollars. A portion of the Company’s net U.S. dollar cash flows is converted to Canadian dollars to fund Canadian dollar expenses through the spot market. In addition, IMAX films generate box office in 75 different countries, and therefore unfavorable exchange rates between applicable local currencies and the U.S. dollar could have an impact on the Company’s reported gross box office and revenues. The Company has incoming cash flows from its revenue generating theaters and ongoing operating expenses in China through its majority-owned subsidiary IMAX (Shanghai) Multimedia Technology Co., Ltd. In Japan, the Company has ongoing Yen-denominated operating expenses related to its Japanese operations. Net Renminbi and Japanese Yen cash flows are converted to U.S. dollars through the spot market. The Company also has cash receipts under leases denominated in Renminbi, Japanese Yen, Euros and Canadian dollars.
The Company manages its exposure to foreign exchange rate risks through the Company’s regular operating and financing activities and, when appropriate, through the use of derivative financial instruments. These derivative financial instruments are utilized to hedge economic exposures as well as reduce earnings and cash flow volatility resulting from shifts in market rates.
The Company’s subsidiaries, IMAX (Shanghai) Multimedia Technology Co., Ltd. and IMAX (Shanghai) Theatre Technology Services Co. Ltd., held approximately 213.0 million Renminbi ($32.6 million U.S. dollars) in cash and cash equivalents in the PRC as at December 31, 2017 (December 31, 2016 — 218.2 million Renminbi or $31.5 million U.S. dollars) and are required to transact locally in Renminbi. Foreign currency exchange transactions, including the remittance of any funds into and out of the PRC, are subject to controls and require the approval of the China State Administrative of Foreign Exchange to complete. Any developments relating to the Chinese economy and any actions taken by the China government are beyond the control of the Company, however, the Company monitors and manages its capital and liquidity requirements to ensure compliance with local regulatory and policy requirements.
For the year ended December 31, 2017, the Company recorded a foreign exchange net gain of $1.0 million as compared to a foreign exchange net loss of $0.9 million in 2016, associated with the translation of foreign currency denominated monetary assets and liabilities.
The Company has entered into a series of foreign currency forward contracts to manage the Company’s risks associated with the volatility of foreign currencies. The forward contracts have settlement dates throughout 2018 and 2019. Foreign currency derivatives are recognized and measured in the balance sheet at fair value. Changes in the fair value (gains or losses) are recognized in the consolidated statement of operations except for derivatives designated and qualifying as foreign currency hedging instruments. All foreign currency forward contracts held by the Company as at December 31, 2017, are designated and qualify as foreign currency hedging instruments. For foreign currency hedging instruments, the effective portion of the gain or loss in a hedge of a forecasted transaction is reported in other comprehensive income and reclassified to the consolidated statements of operations when the forecasted transaction occurs. Any ineffective portion is recognized immediately in the consolidated statement of operations. The notional value of foreign currency hedging instruments at December 31, 2017 was $35.2 million (December 31, 2016 — $37.8 million). A gain of $2.5 million was recorded to Other Comprehensive Income with respect to the depreciation/appreciation in the value of these contracts in 2017 (2016 — gain of $1.0 million). A gain of $0.8 million was reclassified from Accumulated Other Comprehensive Income to selling, general and administrative expenses in 2017 (2016 — loss of $3.1 million). Appreciation or depreciation on forward contracts not meeting the requirements for hedge accounting in the Derivatives and Hedging Topic of the FASB Accounting Standards Codification are recorded to selling, general and administrative expenses.
63
Table of Contents
For all derivative instruments, the Company is subject to counterparty credit risk to the extent that the counterparty may not meet its obligations to the Company. To manage this risk, the Company enters into derivative transactions only with major financial institutions.
At December 31, 2017, the Company’s financing receivables and working capital items denominated in Canadian dollars, Renminbi, Yen and Euros translated into U.S. dollars was $90.1 million. Assuming a 10% appreciation or depreciation in foreign currency exchange rates from the quoted foreign currency exchange rates at December 31, 2017, the potential change in the fair value of foreign currency-denominated financing receivables and working capital items would have been $9.0 million. A significant portion of the Company’s selling, general, and administrative expenses is denominated in Canadian dollars. Assuming a 1% change appreciation or depreciation in foreign currency exchange rates at December 31, 2017, the potential change in the amount of selling, general, and administrative expenses would be $0.1 million for every $10.0 million in Canadian denominated expenditures.
Interest Rate Risk Management
The Company’s earnings are also affected by changes in interest rates due to the impact those changes have on its interest income from cash, and its interest expense from variable-rate borrowings under the Credit Facility.
As at December 31, 2017 and 2016 the Company had not drawn down on its Credit Facility.
As at December 31, 2017, the Company had drawn down $25.7 million on its Playa Vista Loan (December 31, 2016 — $27.7 million).
The Company’s largest exposure with respect to variable rate debt comes from changes in LIBOR. The Company had variable rate debt instruments representing 9.8% and 12.0% of its total liabilities at December 31, 2017 and 2016, respectively. If the interest rates available to the Company increased by 10%, the Company’s interest expense would increase by approximately $0.1 million and interest income from cash would increase by approximately $0.1 million. These amounts are determined by considering the impact of the hypothetical interest rates on the Company’s variable rate debt and cash balances at December 31, 2017.
64
Table of Contents
| Item 8. | Financial Statements and Supplementary Data |
INDEX TO CONSOLIDATED FINANCIAL STATEMENTS
************
65
Table of Contents
Report of Independent Registered Public Accounting Firm
To the Shareholders and Board of Directors of IMAX Corporation
Opinions on the Financial Statements and Internal Control over Financial Reporting
We have audited the accompanying consolidated balance sheets of IMAX Corporation and its subsidiaries as of December 31, 2017 and December 31, 2016, and the related consolidated statements of operations, comprehensive income, shareholders’ equity and cash flows for each of the three years in the period ended December 31, 2017, including the related notes, and the schedule of valuation and qualifying accounts for each of the three years in the period then ended December 31, 2017 appearing on page 140 (collectively referred to as the consolidated financial statements). We also have audited the entity’s internal control over financial reporting as of December 31, 2017, based on criteria established in Internal Control - Integrated Framework (2013) issued by the Committee of Sponsoring Organizations of the Treadway Commission (COSO).
In our opinion, the consolidated financial statements referred to above present fairly, in all material respects, the consolidated financial position of the entity as of December 31, 2017 and December 31, 2016 and its consolidated results of its operations and its consolidated cash flows for each of the three years in the period ended December 31, 2017 in conformity with accounting principles generally accepted in the United States of America (US GAAP). Also in our opinion, the entity maintained, in all material respects, effective internal control over financial reporting as of December 31, 2017, based on criteria established in Internal Control - Integrated Framework (2013) issued by the COSO.
Change in accounting principle
As discussed in note 3 to the consolidated financial statements, the entity changed the manner in which it accounts for the income tax effect of the intra-entity transfers of assets other than inventory in 2017.
Basis for Opinions
The Company’s management is responsible for these consolidated financial statements, for maintaining effective internal control over financial reporting, and for its assessment of the effectiveness of internal control over financial reporting, included in Management’s Annual Report on Internal Control over Financial Reporting appearing under Item 9A. Our responsibility is to express opinions on the entity’s consolidated financial statements and on the entity’s internal control over financial reporting based on our audits. We are a public accounting firm registered with the Public Company Accounting Oversight Board (United States) (PCAOB) and are required to be independent with respect to the entity in accordance with the U.S. federal securities laws and the applicable rules and regulations of the Securities and Exchange Commission and the PCAOB.
We conducted our audits in accordance with the standards of the PCAOB. Those standards require that we plan and perform the audits to obtain reasonable assurance about whether the consolidated financial statements are free of material misstatement, whether due to error or fraud, and whether effective internal control over financial reporting was maintained in all material respects.
Our audits of the consolidated financial statements included performing procedures to assess the risks of material misstatement of the consolidated financial statements, whether due to error or fraud, and performing procedures that respond to those risks. Such procedures included examining, on a test basis, evidence regarding the amounts and disclosures in the consolidated financial statements. Our audits also included evaluating the accounting principles used and significant estimates made by management, as well as evaluating the overall presentation of the consolidated financial statements. Our audit of internal control over financial reporting included obtaining an understanding of internal control over financial reporting, assessing the risk that a material weakness exists, and testing and evaluating the design and operating effectiveness of internal control based on the assessed risk. Our audits also included performing such other procedures as we considered necessary in the circumstances. We believe that our audits provide a reasonable basis for our opinions.
66
Table of Contents
Definition and limitations of internal control over financial reporting
A Company’s internal control over financial reporting is a process designed to provide reasonable assurance regarding the reliability of financial reporting and the preparation of consolidated financial statements for external purposes in accordance with generally accepted accounting principles. An entity’s internal control over financial reporting includes those policies and procedures that (i) pertain to the maintenance of records that, in reasonable detail, accurately and fairly reflect the transactions and dispositions of the assets of the entity; (ii) provide reasonable assurance that transactions are recorded as necessary to permit preparation of consolidated financial statements in accordance with generally accepted accounting principles, and that receipts and expenditures of the entity are being made only in accordance with authorizations of management and directors of the entity; and (iii) provide reasonable assurance regarding prevention or timely detection of unauthorized acquisition, use, or disposition of the entity’s assets that could have a material effect on the consolidated financial statements.
Because of its inherent limitations, internal control over financial reporting may not prevent or detect misstatements. Also, projections of any evaluation of effectiveness to future periods are subject to the risk that controls may become inadequate because of changes in conditions, or that the degree of compliance with the policies or procedures may deteriorate.
/s/ PricewaterhouseCoopers LLP
Chartered Professional Accountants, Licensed Public Accountants
Toronto, Canada
February 27, 2018
We have served as the entity’s auditor since 1987, which includes periods before the entity became subject to SEC reporting requirements.
67
Table of Contents
CONSOLIDATED BALANCE SHEETS
(In thousands of U.S. dollars)
| As at December 31, | ||||||||
| 2017 | 2016 | |||||||
| Assets |
||||||||
| Cash and cash equivalents |
$ | 158,725 | $ | 204,759 | ||||
| Accounts receivable, net of allowance for doubtful accounts of $1,613 (December 31, 2016 — $1,250) |
130,546 | 96,349 | ||||||
| Financing receivables (notes 4 and 19(c)) |
129,494 | 122,125 | ||||||
| Inventories (note 5) |
30,788 | 42,121 | ||||||
| Prepaid expenses |
7,549 | 6,626 | ||||||
| Film assets (note 6) |
5,026 | 16,522 | ||||||
| Property, plant and equipment (note 7) |
276,781 | 245,415 | ||||||
| Other assets (notes 8 and 19(e)) |
26,757 | 33,195 | ||||||
| Deferred income taxes (note 9) |
30,708 | 20,779 | ||||||
| Other intangible assets (note 10) |
31,211 | 30,416 | ||||||
| Goodwill |
39,027 | 39,027 | ||||||
|
|
|
|
|
|||||
| Total assets |
$ | 866,612 | $ | 857,334 | ||||
|
|
|
|
|
|||||
| Liabilities |
||||||||
| Bank indebtedness (note 11) |
$ | 25,357 | $ | 27,316 | ||||
| Accounts payable |
24,235 | 19,990 | ||||||
| Accrued and other liabilities (notes 6, 12, 13, 14(c), 19(b), 19(d), 20 and 22) |
100,140 | 93,208 | ||||||
| Deferred revenue |
113,270 | 90,266 | ||||||
|
|
|
|
|
|||||
| Total liabilities |
263,002 | 230,780 | ||||||
|
|
|
|
|
|||||
| Commitments and contingencies (notes 12 and 13) |
||||||||
| Non-controlling interests (note 21) |
1,353 | 4,980 | ||||||
|
|
|
|
|
|||||
| Shareholders’ equity |
||||||||
| Capital stock (note 14) common shares — no par value. Authorized — unlimited number. 64,902,201 — issued and 64,695,550 — outstanding (December 31, 2016 — 66,224,467 — issued and 66,159,902 — outstanding) |
445,797 | 439,213 | ||||||
| Less: Treasury stock, 206,651 shares at cost (December 31, 2016 — 64,565) |
(5,133 | ) | (1,939 | ) | ||||
| Other equity |
175,300 | 177,304 | ||||||
| Accumulated deficit |
(87,592 | ) | (47,366 | ) | ||||
| Accumulated other comprehensive loss |
(626 | ) | (5,200 | ) | ||||
|
|
|
|
|
|||||
| Total shareholders’ equity attributable to common shareholders |
527,746 | 562,012 | ||||||
| Non-controlling interests (note 21) |
74,511 | 59,562 | ||||||
|
|
|
|
|
|||||
| Total shareholders’ equity |
602,257 | 621,574 | ||||||
|
|
|
|
|
|||||
| Total liabilities and shareholders’ equity |
$ | 866,612 | $ | 857,334 | ||||
|
|
|
|
|
|||||
(the accompanying notes are an integral part of these consolidated financial statements)
68
Table of Contents
CONSOLIDATED STATEMENTS OF OPERATIONS
(In thousands of U.S. dollars, except per share amounts)
| Years Ended December 31, | ||||||||||||
| 2017 | 2016 | 2015 | ||||||||||
| Revenues |
||||||||||||
| Equipment and product sales (note 15(c)) |
$ | 103,294 | $ | 122,382 | $ | 118,937 | ||||||
| Services (note 15(c)) |
195,594 | 166,862 | 161,964 | |||||||||
| Rentals (note 15(c)) |
72,281 | 77,315 | 83,651 | |||||||||
| Finance income |
9,598 | 9,500 | 9,112 | |||||||||
| Other (note 15(a)) |
— | 1,275 | 141 | |||||||||
|
|
|
|
|
|
|
|||||||
| 380,767 | 377,334 | 373,805 | ||||||||||
|
|
|
|
|
|
|
|||||||
| Costs and expenses applicable to revenues (note 2(m)) |
||||||||||||
| Equipment and product sales |
48,172 | 69,680 | 63,635 | |||||||||
| Services (note 15(c)) |
120,629 | 83,780 | 70,855 | |||||||||
| Rentals |
26,720 | 21,086 | 20,027 | |||||||||
| Other |
— | 110 | — | |||||||||
|
|
|
|
|
|
|
|||||||
| 195,521 | 174,656 | 154,517 | ||||||||||
|
|
|
|
|
|
|
|||||||
| Gross margin |
185,246 | 202,678 | 219,288 | |||||||||
| Selling, general and administrative expenses (note 15(b)) (including share-based compensation expense of $20.4 million, $30.5 million and $21.9 million for 2017, 2016 and 2015, respectively) |
110,400 | 124,745 | 115,345 | |||||||||
| Research and development |
20,855 | 16,315 | 12,730 | |||||||||
| Amortization of intangibles |
3,019 | 2,079 | 1,860 | |||||||||
| Receivable provisions, net of recoveries (note 16) |
2,647 | 954 | 752 | |||||||||
| Asset impairments (notes 7 and 19(e)) |
1,225 | 417 | 830 | |||||||||
| Exit costs, restructuring charges and associated impairments (note 22) |
16,174 | — | — | |||||||||
|
|
|
|
|
|
|
|||||||
| Income from operations |
30,926 | 58,168 | 87,771 | |||||||||
| Interest income |
1,027 | 1,490 | 968 | |||||||||
| Interest expense |
(1,942 | ) | (1,805 | ) | (1,661 | ) | ||||||
|
|
|
|
|
|
|
|||||||
| Income from operations before income taxes |
30,011 | 57,853 | 87,078 | |||||||||
| Provision for income taxes |
(16,790 | ) | (16,212 | ) | (20,052 | ) | ||||||
| Loss from equity-accounted investments, net of tax |
(703 | ) | (2,321 | ) | (2,402 | ) | ||||||
|
|
|
|
|
|
|
|||||||
| Net income |
12,518 | 39,320 | 64,624 | |||||||||
| Less: net income attributable to non-controlling interests (note 21) |
(10,174 | ) | (10,532 | ) | (8,780 | ) | ||||||
|
|
|
|
|
|
|
|||||||
| Net income attributable to common shareholders |
$ | 2,344 | $ | 28,788 | $ | 55,844 | ||||||
|
|
|
|
|
|
|
|||||||
| Net income per share attributable to common shareholders - basic and diluted: (note 14(d)) |
|
|||||||||||
| Net income per share — basic |
$ | 0.04 | $ | 0.43 | $ | 0.79 | ||||||
|
|
|
|
|
|
|
|||||||
| Net income per share — diluted |
$ | 0.04 | $ | 0.42 | $ | 0.78 | ||||||
|
|
|
|
|
|
|
|||||||
(the accompanying notes are an integral part of these consolidated financial statements)
69
Table of Contents
CONSOLIDATED STATEMENTS OF COMPREHENSIVE INCOME
(In thousands of U.S. dollars)
| Years Ended December 31, | ||||||||||||
| 2017 | 2016 | 2015 | ||||||||||
| Net income |
$ | 12,518 | $ | 39,320 | $ | 64,624 | ||||||
|
|
|
|
|
|
|
|||||||
| Unrealized defined benefit plan actuarial gain (note 20(a)) |
1,004 | 159 | 180 | |||||||||
| Unrealized postretirement benefit plans actuarial gain (notes 20(c) and 20(d)) |
125 | 184 | 79 | |||||||||
| Amortization of postretirement benefit plan actuarial loss (note 20(c)) |
— | 69 | 135 | |||||||||
| Unrealized net gain (loss) from cash flow hedging instruments (note 19(d)) |
2,545 | 1,049 | (5,881 | ) | ||||||||
| Realization of cash flow hedging net (gain) loss upon settlement (note 19(d)) |
(824 | ) | 3,078 | 3,217 | ||||||||
| Foreign currency translation adjustments (note 2) |
3,618 | (2,851 | ) | (2,121 | ) | |||||||
|
|
|
|
|
|
|
|||||||
| Other comprehensive income (loss), before tax |
6,468 | 1,688 | (4,391 | ) | ||||||||
| Income tax (expense) benefit related to other comprehensive income (loss) (note 9(h)) |
(746 | ) | (1,180 | ) | 511 | |||||||
|
|
|
|
|
|
|
|||||||
| Other comprehensive income (loss), net of tax |
5,722 | 508 | (3,880 | ) | ||||||||
|
|
|
|
|
|
|
|||||||
| Comprehensive income |
18,240 | 39,828 | 60,744 | |||||||||
| Less: Comprehensive income attributable to non-controlling interests |
(11,322 | ) | (8,797 | ) | (9,196 | ) | ||||||
|
|
|
|
|
|
|
|||||||
| Comprehensive income attributable to common shareholders |
$ | 6,918 | $ | 31,031 | $ | 51,548 | ||||||
|
|
|
|
|
|
|
|||||||
(the accompanying notes are an integral part of these consolidated financial statements)
70
Table of Contents
CONSOLIDATED STATEMENTS OF CASH FLOWS
(In thousands of U.S. dollars)
| Years Ended December 31, | ||||||||||||
| 2017 | 2016 | 2015 | ||||||||||
| Cash provided by (used in): |
||||||||||||
| Operating Activities |
||||||||||||
| Net income |
$ | 12,518 | $ | 39,320 | $ | 64,624 | ||||||
| Adjustments to reconcile net income to cash from operations: |
||||||||||||
| Depreciation and amortization (notes 17(c) and 18(a)) |
66,807 | 46,485 | 42,803 | |||||||||
| Write-downs, net of recoveries (notes 17(d) and 18(a)) |
29,568 | 5,940 | 3,725 | |||||||||
| Change in deferred income taxes |
(4,017 | ) | 4,940 | (1,336 | ) | |||||||
| Stock and other non-cash compensation |
24,075 | 31,586 | 22,379 | |||||||||
| Unrealized foreign currency exchange (gain) loss |
(502 | ) | 462 | 785 | ||||||||
| Loss from equity-accounted investments |
306 | 2,685 | 3,838 | |||||||||
| Gain on non-cash contribution to equity-accounted investees |
397 | (364 | ) | (1,436 | ) | |||||||
| Investment in film assets |
(34,645 | ) | (22,308 | ) | (15,119 | ) | ||||||
| Changes in other non-cash operating assets and liabilities (note 17(a)) |
(9,141 | ) | (30,874 | ) | (36,058 | ) | ||||||
|
|
|
|
|
|
|
|||||||
| Net cash provided by operating activities |
85,366 | 77,872 | 84,205 | |||||||||
|
|
|
|
|
|
|
|||||||
| Investing Activities |
||||||||||||
| Purchase of property, plant and equipment |
(24,143 | ) | (15,278 | ) | (43,257 | ) | ||||||
| Investment in joint revenue sharing equipment |
(42,634 | ) | (42,910 | ) | (28,474 | ) | ||||||
| Investment in new business ventures |
(1,606 | ) | (1,911 | ) | (2,000 | ) | ||||||
| Acquisition of other intangible assets |
(5,214 | ) | (4,787 | ) | (5,065 | ) | ||||||
|
|
|
|
|
|
|
|||||||
| Net cash used in investing activities |
(73,597 | ) | (64,886 | ) | (78,796 | ) | ||||||
|
|
|
|
|
|
|
|||||||
| Financing Activities |
||||||||||||
| Increase in bank indebtedness (note 11) |
— | — | 25,290 | |||||||||
| Repayment of bank indebtedness (note 11) |
(2,000 | ) | (2,000 | ) | (333 | ) | ||||||
| Repurchase of common shares |
(46,140 | ) | (116,518 | ) | (34,276 | ) | ||||||
| Settlement of restricted share units and options |
(20,331 | ) | (17,889 | ) | (10,000 | ) | ||||||
| Exercise of stock options |
16,668 | 13,113 | 35,609 | |||||||||
| Taxes paid on secondary sales and repatriation dividend |
— | (2,443 | ) | — | ||||||||
| Treasury stock repurchased for future settlement of restricted share units |
(5,133 | ) | (1,996 | ) | — | |||||||
| Taxes withheld and paid on employee stock awards vested |
(600 | ) | (528 | ) | (520 | ) | ||||||
| Issuance of subsidiary shares to non-controlling interests - private offering |
— | 2,479 | 40,000 | |||||||||
| Share issuance costs from the issuance of subsidiary shares to non-controlling interests - private offering |
— | — | (2,000 | ) | ||||||||
| Issuance of subsidiary shares to non-controlling interests - public offering |
— | — | 178,226 | |||||||||
| Share issuance expenses - public offering |
— | — | (16,257 | ) | ||||||||
| Dividends paid to non-controlling interests |
— | — | (9,511 | ) | ||||||||
| Credit facility amendment fees paid |
— | — | (1,533 | ) | ||||||||
|
|
|
|
|
|
|
|||||||
| Net cash (used in) provided by financing activities |
(57,536 | ) | (125,782 | ) | 204,695 | |||||||
|
|
|
|
|
|
|
|||||||
| Effects of exchange rate changes on cash |
(267 | ) | 106 | 842 | ||||||||
|
|
|
|
|
|
|
|||||||
| (Decrease) increase in cash and cash equivalents during year |
(46,034 | ) | (112,690 | ) | 210,946 | |||||||
| Cash and cash equivalents, beginning of year |
204,759 | 317,449 | 106,503 | |||||||||
|
|
|
|
|
|
|
|||||||
| Cash and cash equivalents, end of year |
$ | 158,725 | $ | 204,759 | $ | 317,449 | ||||||
|
|
|
|
|
|
|
|||||||
(the accompanying notes are an integral part of these consolidated financial statements)
71
Table of Contents
CONSOLIDATED STATEMENTS OF SHAREHOLDERS’ EQUITY
(In thousands of U.S. dollars)
| Common Shares Issued and Outstanding |
Capital Stock |
Other Equity |
Accumulated (Deficit) Earnings |
Accumulated Other Comprehensive Loss |
Non- controlling Interests |
Total Shareholders’ Equity |
||||||||||||||||||||||
| Balance as at December 31, 2014 |
68,988,050 | $ | 344,862 | $ | 47,319 | $ | (6,259 | ) | $ | (3,147 | ) | $ | — | $ | 382,775 | |||||||||||||
| Net income |
— | — | — | 64,624 | — | — | 64,624 | |||||||||||||||||||||
| Other comprehensive loss, net of tax |
— | — | — | — | (4,296 | ) | 416 | (3,880 | ) | |||||||||||||||||||
| Net income attributable to non-controlling interests |
— | — | — | (8,780 | ) | — | 9,113 | 333 | ||||||||||||||||||||
| Paid-in capital for non-employee stock options granted |
— | — | 81 | — | — | — | 81 | |||||||||||||||||||||
| Employee stock options exercised |
1,650,643 | 49,756 | (14,278 | ) | — | — | — | 35,478 | ||||||||||||||||||||
| Non-employee stock options exercised |
9,000 | 206 | (75 | ) | — | — | — | 131 | ||||||||||||||||||||
| Paid-in capital for employee stock options granted |
— | — | 12,225 | — | — | — | 12,225 | |||||||||||||||||||||
| Paid-in capital for restricted share units granted |
— | — | 8,075 | — | — | — | 8,075 | |||||||||||||||||||||
| Restricted share units vested (net of shares withheld for tax) |
25,551 | 626 | (1,151 | ) | — | — | — | (525 | ) | |||||||||||||||||||
| Restricted share units vested and issued to employees purchased on open market |
— | — | (6,203 | ) | — | — | — | (6,203 | ) | |||||||||||||||||||
| Stock options exercises settled from treasury shares purchased on open market |
— | — | (3,797 | ) | — | — | — | (3,797 | ) | |||||||||||||||||||
| Repurchase of common shares |
(1,000,000 | ) | (5,390 | ) | — | (28,886 | ) | — | — | (34,276 | ) | |||||||||||||||||
| Accretion charges associated with redeemable common stock |
— | — | — | (769 | ) | — | — | (769 | ) | |||||||||||||||||||
| Utilization of windfall tax benefits from vested restricted share units and expensed stock options |
— | — | 529 | — | — | — | 529 | |||||||||||||||||||||
| Issuance of subsidiary shares, initial public offering |
— | 71,291 | 106,935 | — | — | — | 178,226 | |||||||||||||||||||||
| Share issuance expenses, initial public offering |
— | (13,041 | ) | (3,216 | ) | — | — | — | (16,257 | ) | ||||||||||||||||||
| Dividends paid |
— | — | — | — | — | (9,511 | ) | (9,511 | ) | |||||||||||||||||||
| Tax impact of sale of subsidiary shares in initial public offering |
— | — | (12,450 | ) | — | — | — | (12,450 | ) | |||||||||||||||||||
| Reduction in non-controlling interest value upon qualified initial public offering |
— | — | 29,100 | — | — | (29,100 | ) | — | ||||||||||||||||||||
| Conversion of Class C Shares upon initial public offering |
— | — | — | — | — | 79,041 | 79,041 | |||||||||||||||||||||
|
|
|
|
|
|
|
|
|
|
|
|
|
|
|
|||||||||||||||
| Balance as at December 31, 2015 |
69,673,244 | $ | 448,310 | $ | 163,094 | $ | 19,930 | $ | (7,443 | ) | $ | 49,959 | $ | 673,850 | ||||||||||||||
| Retrospective adjustment related to forfeiture rate |
— | — | 5,331 | (4,431 | ) | — | — | 900 | ||||||||||||||||||||
| Net income |
— | — | — | 39,320 | — | — | 39,320 | |||||||||||||||||||||
| Other comprehensive income, net of tax |
— | — | — | — | 2,243 | (1,735 | ) | 508 | ||||||||||||||||||||
| Net income attributable to non-controlling interests |
— | — | — | (10,532 | ) | — | 11,338 | 806 | ||||||||||||||||||||
| Paid-in capital for non-employee stock options granted |
— | — | 30 | — | — | — | 30 | |||||||||||||||||||||
| Employee stock options exercised |
347,814 | 11,431 | (3,139 | ) | — | — | — | 8,292 | ||||||||||||||||||||
| Fair value of stock options exercised at the grant date |
— | 3,139 | — | — | — | — | 3,139 | |||||||||||||||||||||
| Paid-in capital for employee stock options granted |
— | — | 13,766 | — | — | — | 13,766 | |||||||||||||||||||||
| Paid-in capital for restricted share units granted |
— | — | 16,493 | — | — | — | 16,493 | |||||||||||||||||||||
| Restricted share units vested (net of shares withheld for tax) |
52,631 | 1,198 | (14,731 | ) | — | — | — | (13,533 | ) | |||||||||||||||||||
| Stock options exercises settled from treasury shares purchased on open market |
— | — | (5,224 | ) | — | — | — | (5,224 | ) | |||||||||||||||||||
| Cash received from the issuance of common shares in excess of par value |
— | — | 1,684 | — | — | — | 1,684 | |||||||||||||||||||||
| Repurchase of common shares |
(3,849,222 | ) | (24,865 | ) | — | (91,653 | ) | — | — | (116,518 | ) | |||||||||||||||||
| Shares held in treasury |
(64,565 | ) | (1,939 | ) | — | — | — | — | (1,939 | ) | ||||||||||||||||||
|
|
|
|
|
|
|
|
|
|
|
|
|
|
|
|||||||||||||||
| Balance as at December 31, 2016 |
66,159,902 | $ | 437,274 | $ | 177,304 | $ | (47,366 | ) | $ | (5,200 | ) | $ | 59,562 | $ | 621,574 | |||||||||||||
| Retrospective adjustment related to intra-entity transfers |
— | — | — | (8,314 | ) | — | — | (8,314 | ) | |||||||||||||||||||
| Net income |
— | — | — | 12,518 | — | — | 12,518 | |||||||||||||||||||||
| Other comprehensive income, net of tax |
— | — | — | — | 4,574 | 1,148 | 5,722 | |||||||||||||||||||||
| Net income attributable to non-controlling interests |
— | — | — | (10,174 | ) | — | 13,801 | 3,627 | ||||||||||||||||||||
| Paid-in capital for non-employee stock options granted |
— | — | 17 | — | — | — | 17 | |||||||||||||||||||||
| Employee stock options exercised |
405,229 | 14,652 | (3,542 | ) | — | — | — | 11,110 | ||||||||||||||||||||
| Fair value of stock options exercised at the grant date |
— | 3,542 | — | — | — | — | 3,542 | |||||||||||||||||||||
| Paid-in capital for employee stock options granted |
— | — | 5,496 | — | — | — | 5,496 | |||||||||||||||||||||
| Paid-in capital for restricted share units granted |
— | — | 17,157 | — | — | — | 17,157 | |||||||||||||||||||||
| Restricted share units vested (net of shares withheld for tax) |
7,127 | 274 | (14,756 | ) | — | — | — | (14,482 | ) | |||||||||||||||||||
| Stock options exercises settled from treasury shares purchased on open market |
66,093 | — | (8,393 | ) | — | — | — | (8,393 | ) | |||||||||||||||||||
| Cash received from the issuance of common shares in excess of par value |
— | — | 2,017 | — | — | — | 2,017 | |||||||||||||||||||||
| Repurchase of common shares |
(1,736,150 | ) | (11,884 | ) | — | (34,256 | ) | — | — | (46,140 | ) | |||||||||||||||||
| Shares held in treasury |
(206,651 | ) | (3,194 | ) | — | — | — | — | (3,194 | ) | ||||||||||||||||||
|
|
|
|
|
|
|
|
|
|
|
|
|
|
|
|||||||||||||||
| Balance as at December 31, 2017 |
64,695,550 | $ | 440,664 | $ | 175,300 | $ | (87,592 | ) | $ | (626 | ) | $ | 74,511 | $ | 602,257 | |||||||||||||
|
|
|
|
|
|
|
|
|
|
|
|
|
|
|
|||||||||||||||
(The accompanying notes are an integral part of these consolidated financial statements)
72
Table of Contents
NOTES TO CONSOLIDATED FINANCIAL STATEMENTS
(Tabular amounts in thousands of U.S. dollars, unless otherwise stated)
1. Description of the Business
IMAX Corporation, together with its consolidated subsidiaries (the “Company”), is an entertainment technology company specializing in digital and film-based motion picture technologies, whose principal activities are the:
| • | design, manufacture, sale and lease of proprietary theater systems for IMAX theaters principally owned and operated by commercial and institutional customers located in 75 countries as at December 31, 2017; |
| • | production, digital re-mastering, post-production and/or distribution of certain films shown throughout the IMAX theater network; |
| • | provision of other services to the IMAX theater network, including ongoing maintenance and extended warranty services for IMAX theater systems; |
| • | operation of certain theaters primarily in the United States; and |
| • | other activities, which includes short-term rental of cameras and aftermarket sales of projector system components. |
The Company refers to all theaters using the IMAX theater system as “IMAX theaters.”
The Company’s revenues from equipment and product sales include the sale and sales-type leasing of its theater systems and sales of their associated parts and accessories, contingent rentals on sales-type leases and contingent additional payments on sales transactions.
The Company’s revenues from services include the provision of maintenance and extended warranty services, digital re-mastering services, film production and film post-production services, film distribution, and the operation of certain theaters.
The Company’s rentals include revenues from the leasing of its theater systems that are operating leases, contingent rentals on operating leases, joint revenue sharing arrangements and the rental of the Company’s cameras and camera equipment.
The Company’s finance income represents interest income arising from the sales-type leases and financed sales of the Company’s theater systems.
The Company’s other revenues include the settlement of contractual obligations with customers.
2. Summary of Significant Accounting Policies
Significant accounting policies are summarized as follows:
The Company prepares its consolidated financial statements in accordance with U.S. GAAP.
(a) Basis of Consolidation
The consolidated financial statements include the accounts of the Company together with its consolidated subsidiaries, except for subsidiaries which the Company has identified as variable interest entities (“VIEs”) where the Company is not the primary beneficiary.
The Company has evaluated its various variable interests to determine whether they are VIEs as required by the Consolidation Topic of the Financial Accounting Standards Board (“FASB”) Accounting Standards Codification (“ASC” or “Codification”).
The Company has 11 film and content related companies that are VIEs. For five of the Company’s film production companies, the Company has determined that it is the primary beneficiary of these entities as the Company has the power to direct the activities of the respective VIE that most significantly impact the respective VIE’s economic performance and has the obligation to absorb losses of the VIE that could
73
Table of Contents
potentially be significant to the respective VIE or the right to receive benefits from the respective VIE that could potentially be significant to the respective VIE. The majority of these consolidated assets are held by the IMAX Original Film Fund (the “Original Film Fund”) and the virtual reality fund (the “VR Fund”) as described in note 21(b). For the other six film production companies which are VIEs, the Company did not consolidate these film entities since it does not have the power to direct activities and does not absorb the majority of the expected losses or expected residual returns. The Company equity accounts for these entities. A loss in value of an investment other than a temporary decline is recognized as a charge to the consolidated statements of operations.
Total assets and liabilities of the Company’s consolidated VIEs are as follows:
| December 31, | December 31, | |||||||
| 2017 | 2016 | |||||||
| Total assets |
$ | 7,539 | $ | 10,346 | ||||
| Total liabilities |
7,178 | 6,368 | ||||||
Total assets and liabilities of the VIE entities which the Company does not consolidate are as follows:
| December 31, | December 31, | |||||||
| 2017 | 2016 | |||||||
| Total assets |
$ | 448 | $ | 444 | ||||
| Total liabilities |
388 | 363 | ||||||
The Company’s exposure, which is determined based on the level of funding contributed by the Company and the development stage of the respective film, is $nil at December 31, 2017 (2016 — $nil).
The Company accounts for investments in new business ventures using the guidance of the FASB ASC 323 “Investments – Equity Method and Joint Ventures” (“ASC 323”) and ASC 320 “Investments in Debt and Equity Securities” (“ASC 320”), as appropriate.
All intercompany accounts and transactions, including all unrealized intercompany profits on transactions with equity-accounted investees, have been eliminated.
(b) Use of Estimates
The preparation of consolidated financial statements in conformity with U.S. GAAP requires management to make estimates and judgments that affect the reported amounts of assets and liabilities and disclosures of contingent assets and liabilities at the date of consolidated financial statements and the reported amounts of revenues and expenses during the reporting period. Actual results could be materially different from these estimates. Significant estimates made by management include, but are not limited to: selling prices associated with the individual elements in multiple element arrangements; residual values of leased theater systems; economic lives of leased assets; allowances for potential uncollectability of accounts receivable, financing receivables and net investment in leases; provisions for inventory obsolescence; ultimate revenues for film assets; impairment provisions for film assets, long-lived assets and goodwill; depreciable lives of property, plant and equipment; useful lives of intangible assets; pension plan assumptions; accruals for contingencies including tax contingencies; valuation allowances for deferred income tax assets; and, estimates of the fair value of stock-based payment awards.
(c) Cash and Cash Equivalents
The Company considers all highly liquid investments convertible to a known amount of cash and with an original maturity to the Company of three months or less to be cash equivalents.
(d) Accounts Receivable and Financing Receivables
Allowances for doubtful accounts receivable are based on the Company’s assessment of the collectability of specific customer balances, which is based upon a review of the customer’s credit worthiness, past collection history and the underlying asset value of the equipment, where applicable. Interest on overdue accounts receivable is recognized as income as the amounts are collected.
74
Table of Contents
For trade accounts receivable that have characteristics of both a contractual maturity of one year or less, and arose from the sale of other goods or services, the Company charges off the balance against the allowance for doubtful accounts when it is known that a provided amount will not be collected.
The Company monitors the performance of the theaters to which it has leased or sold theater systems which are subject to ongoing payments. When facts and circumstances indicate that there is a potential impairment in the net investment in lease or a financing receivable, the Company will evaluate the potential outcome of either a renegotiation involving changes in the terms of the receivable or defaults on the existing lease or financed sale agreements. The Company will record a provision if it is considered probable that the Company will be unable to collect all amounts due under the contractual terms of the arrangement or a renegotiated lease amount will cause a reclassification of the sales-type lease to an operating lease.
When the net investment in lease or the financing receivable is impaired, the Company will recognize a provision for the difference between the carrying value in the investment and the present value of expected future cash flows discounted using the effective interest rate for the net investment in the lease or the financing receivable. If the Company expects to recover the theater system, the provision is equal to the excess of the carrying value of the investment over the fair value of the equipment.
When the minimum lease payments are renegotiated and the lease continues to be classified as a sales-type lease, the reduction in payments is applied to reduce unearned finance income.
These provisions are adjusted when there is a significant change in the amount or timing of the expected future cash flows or when actual cash flows differ from cash flow previously expected.
Once a net investment in lease or financing receivable is considered impaired, the Company does not recognize interest income until the collectability issues are resolved. When finance income is not recognized, any payments received are applied against outstanding gross minimum lease amounts receivable or gross receivables from financed sales. Once the collectability issues are resolved, the Company will once again commence the recognition of interest income.
(e) Inventories
Inventories are carried at the lower of cost, determined on an average cost basis, and net realizable value except for raw materials, which are carried at the lower of cost and replacement cost. Finished goods and work-in-process include the cost of raw materials, direct labor, theater design costs, and an applicable share of manufacturing overhead costs.
The costs related to theater systems under sales and sales-type lease arrangements are relieved from inventory to costs and expenses applicable to revenues-equipment and product sales when revenue recognition criteria are met. The costs related to theater systems under operating lease arrangements and joint revenue sharing arrangements are transferred from inventory to assets under construction in property, plant and equipment when allocated to a signed joint revenue sharing arrangement or when the arrangement is first classified as an operating lease.
The Company records provisions for excess and obsolete inventory based upon current estimates of future events and conditions, including the anticipated installation dates for the current backlog of theater system contracts, technological developments, signings in negotiation, growth prospects within the customers’ ultimate marketplace and anticipated market acceptance of the Company’s current and pending theater systems.
Finished goods inventories can contain theater systems for which title has passed to the Company’s customer (as the theater system has been delivered to the customer) but the revenue recognition criteria as discussed in note 2(m) have not been met.
(f) Film Assets
Costs of producing films, including labor, allocated overhead, capitalized interest, and costs of acquiring film rights are recorded as film assets and accounted for in accordance with Entertainment-Films Topic of the FASB ASC. Production financing provided by third parties that acquire substantive rights in the film is recorded as a reduction of the cost of the production. Film assets are amortized and participation costs are accrued using the individual-film-forecast method in the same ratio that current gross revenues bear to current and anticipated future ultimate revenues. Estimates of ultimate revenues are prepared on a title-by-title basis and reviewed regularly by management and revised where necessary to reflect the most current information. Ultimate revenues for films include estimates of revenue over a period not to exceed ten years following the date of initial release.
75
Table of Contents
Film exploitation costs, including advertising costs, are expensed as incurred.
Costs, including labor and allocated overhead, of digitally re-mastering films where the copyright is owned by a third party and the Company shares in the revenue of the third party are included in film assets. These costs are amortized using the individual-film-forecast method in the same ratio that current gross revenues bear to current and anticipated future ultimate revenues from the re-mastered film.
The recoverability of film assets is dependent upon commercial acceptance of the films. If events or circumstances indicate that the recoverable amount of a film asset is less than the unamortized film costs, the film asset is written down to its fair value. The Company determines the fair value of its film assets using a discounted cash flow model.
(g) Property, Plant and Equipment
Property, plant and equipment are recorded at cost and are depreciated on a straight-line basis over their estimated useful lives as follows:
| Theater system components(1) |
— | over the equipment’s anticipated useful life (7 to 20 years) | ||
| Camera equipment |
— | 5 to 10 years | ||
| Buildings |
— | 20 to 25 years | ||
| Office and product equipment |
— | 3 to 5 years | ||
| Leasehold improvements |
— | over the shorter of the initial term of the underlying leases plus any reasonably assured renewal terms, and the useful life of the asset |
| (1) | Includes equipment under joint revenue sharing arrangements. |
Equipment and components allocated to be used in future operating leases and joint revenue sharing arrangements, as well as direct labor costs and an allocation of direct production costs, are included in assets under construction until such equipment is installed and in working condition, at which time the equipment is depreciated on a straight-line basis over the lesser of the term of the joint revenue sharing arrangement and the equipment’s anticipated useful life.
The Company reviews the carrying values of its property, plant and equipment for impairment whenever events or changes in circumstances indicate that the carrying amount of an asset or asset group might not be recoverable. Assets are grouped at the lowest level for which identifiable cash flows are largely independent when testing for, and measuring for, impairment. In performing its review of recoverability, the Company estimates the future cash flows expected to result from the use of the asset or asset group and its eventual disposition. If the sum of the expected undiscounted future cash flows is less than the carrying amount of the asset or asset group, an impairment loss is recognized in the consolidated statements of operations. Measurement of the impairment loss is based on the excess of the carrying amount of the asset or asset group over the fair value calculated using discounted expected future cash flows.
A liability for the fair value of an asset retirement obligation associated with the retirement of tangible long-lived assets and the associated asset retirement costs are recognized in the period in which the liability and costs are incurred if a reasonable estimate of fair value can be made using a discounted cash flow model. The associated asset retirement costs are capitalized as part of the carrying amount of the long-lived asset and subsequently amortized over the asset’s useful life. The liability is accreted over the period to expected cash outflows.
(h) Other Assets
Other assets include lease incentives, deferred selling costs that are direct and incremental to the acquisition of sales contracts, various investments, insurance recoverable, foreign currency derivatives, deferred charges on debt financing, and prepaid taxes.
Costs of debt financing are deferred and amortized over the term of the debt using the effective interest method.
Selling costs related to an arrangement incurred prior to recognition of the related revenue are deferred and expensed to costs and expenses applicable to revenues upon: (i) recognition of the contract’s theater system revenue; or (ii) abandonment of the sale arrangement.
Foreign currency derivatives are accounted for at fair value using quoted prices in closed exchanges (Level 2 input in accordance with the Fair Value Measurements Topic of the FASB ASC hierarchy).
76
Table of Contents
The Company may provide lease incentives to certain exhibitors which are essential to entering into the respective lease arrangement. Lease incentives include payments made to or on behalf of the exhibitor. These lease incentives are recognized as a reduction in rental revenue on a straight-line basis over the term of the lease.
Investments in new business ventures are accounted for using ASC 323 as described in note 2(a). The Company currently accounts for its joint venture investment with TCL Multimedia Technology Holdings Limited (“TCL”), using the equity method of accounting. The Company accounts for in-kind contributions to its equity investment in accordance with ASC 845 “Non-Monetary Transactions” (“ASC 845”) whereby if the fair value of the asset or assets contributed is greater than the carrying value a partial gain shall be recognized.
The Company’s investment in debt securities is classified as an available-for-sale investment in accordance with ASC 320. Unrealized holding gains and losses for this investment is excluded from earnings and reported in other comprehensive income until realized. Realization occurs upon sale of a portion of or the entire investment. The investment is impaired if the fair value is less than cost, which is assessed in each reporting period. When the Company intends to sell a specifically identified beneficial interest, a write-down for other-than-temporary impairment shall be recognized in earnings.
The Company’s investment in preferred shares, which meets the criteria for classification as an equity security in accordance with ASC 325, is accounted for at cost. The Company records the related warrants at fair value upon recognition date. Warrants are recognized over the term of the agreement.
(i) Goodwill
Goodwill represents the excess of purchase price over the fair value of net identifiable assets acquired in a purchase business combination. Goodwill is not subject to amortization and is tested for impairment annually or more frequently if events or circumstances indicate that the asset might be impaired. The Company performs a qualitative assessment of its reporting units and certain select quantitative calculations against its current long-range plan to determine whether it is more likely than not (that is, a likelihood of more than 50 percent) that the fair value of a reporting unit is less than its carrying amount. The Company first assesses certain qualitative factors to determine whether the existence of events or circumstances leads to determination that it is more likely than not that the fair value of a reporting unit is less than its carrying amount. If, after assessing the totality of events or circumstances, the Company determines it is not more likely than not that the fair value of a reporting unit is less than its carry amount, then performing the two-step impairment test is unnecessary. When necessary, impairment of goodwill is tested at the reporting unit level by comparing the reporting unit’s carrying amount, including goodwill, to the fair value of the reporting unit. The fair value of the reporting unit is estimated using a discounted cash flow approach. If the carrying amount of the reporting unit exceeds its fair value, then a second step is performed to measure the amount of impairment loss, if any, by comparing the fair value of each identifiable asset and liability in the reporting unit to the total fair value of the reporting unit. Any impairment loss is expensed in the consolidated statement of operations and is not reversed if the fair value subsequently increases.
(j) Other Intangible Assets
Patents, trademarks and other intangibles are recorded at cost and are amortized on a straight-line basis over estimated useful lives ranging from 4 to 10 years except for intangible assets that have an identifiable pattern of consumption of the economic benefit of the asset, which are amortized over the consumption pattern.
The Company reviews the carrying values of its other intangible assets for impairment whenever events or changes in circumstances indicate that the carrying amount of an asset or asset group might not be recoverable. Assets are grouped at the lowest level for which identifiable cash flows are largely independent when testing for, and measuring for, impairment. In performing its review for recoverability, the Company estimates the future cash flows expected to result from the use of the asset or asset group and its eventual disposition. If the sum of the expected undiscounted future cash flows is less than the carrying amount of the asset or asset group, an impairment loss is recognized in the consolidated statement of operations. Measurement of the impairment loss is based on the excess of the carrying amount of the asset or asset group over the fair value calculated using discounted expected future cash flows.
(k) Deferred Revenue
Deferred revenue represents cash received prior to revenue recognition criteria being met for theater system sales or leases, film contracts, maintenance and extended warranty services, film related services and film distribution.
77
Table of Contents
(l) Income Taxes
Income taxes are accounted for under the liability method whereby deferred income tax assets and liabilities are recognized for the expected future tax consequences of temporary differences between the accounting and tax bases of assets and liabilities. Deferred income tax assets and liabilities are measured using enacted tax rates expected to apply to taxable income in the years in which temporary differences are expected to be recovered or settled. The effect on deferred income tax assets and liabilities of a change in tax rates or laws is recognized in the consolidated statement of operations in the period in which the change is enacted. Investment tax credits are recognized as a reduction of income tax expense.
The Company assesses realization of deferred income tax assets and, based on all available evidence, concludes whether it is more likely than not that the net deferred income tax assets will be realized. A valuation allowance is provided for the amount of deferred income tax assets not considered to be realizable.
The Company is subject to ongoing tax exposures, examinations and assessments in various jurisdictions. Accordingly, the Company may incur additional tax expense based upon the outcomes of such matters. In addition, when applicable, the Company adjusts tax expense to reflect the Company’s ongoing assessments of such matters which require judgment and can materially increase or decrease its effective rate as well as impact operating results. The Company provides for such exposures in accordance with the Income Taxes Topic of the FASB ASC.
(m) Revenue Recognition
Multiple Element Arrangements
The Company’s revenue arrangements with certain customers may involve multiple elements consisting of a theater system (projector, sound system, screen system and, if applicable, 3D glasses cleaning machine); services associated with the theater system including theater design support, supervision of installation, and projectionist training; a license to use the IMAX brand; 3D glasses; maintenance and extended warranty services; and licensing of films. The Company evaluates all elements in an arrangement to determine what are considered deliverables for accounting purposes and which of the deliverables represent separate units of accounting based on the applicable accounting guidance in the Leases Topic of the FASB ASC; the Guarantees Topic of the FASB ASC; the Entertainment – Films Topic of FASB ASC; and the Revenue Recognition Topic of the FASB. If separate units of accounting are either required under the relevant accounting standards or determined to be applicable under the Revenue Recognition Topic, the total consideration received or receivable in the arrangement is allocated based on the applicable guidance in the above noted standards.
Theater Systems
The Company has identified the projection system, sound system, screen system and, if applicable, 3D glasses cleaning machine, theater design support, supervision of installation, projectionist training and the use of the IMAX brand to be a single deliverable and a single unit of accounting (the “System Deliverable”). When an arrangement does not include all the elements of a System Deliverable, the elements of the System Deliverable included in the arrangement are considered by the Company to be a single deliverable and a single unit of accounting. The Company is not responsible for the physical installation of the equipment in the customer’s facility; however, the Company supervises the installation by the customer. The customer has the right to use the IMAX brand from the date the Company and the customer enter into an arrangement.
The Company’s System Deliverable arrangements involve either a lease or a sale of the theater system. Consideration for the System Deliverable, other than for those delivered pursuant to joint revenue sharing arrangements, consist of upfront or initial payments made before and after the final installation of the theater system equipment and ongoing payments throughout the term of the lease or over a period of time, as specified in the arrangement. The ongoing payments are the greater of an annual fixed minimum amount or a certain percentage of the theater box-office. Amounts received in excess of the annual fixed minimum amounts are considered contingent payments. The Company’s arrangements are non-cancellable, unless the Company fails to perform its obligations. In the absence of a material default by the Company, there is no right to any remedy for the customer under the Company’s arrangements. If a material default by the Company exists, the customer has the right to terminate the arrangement and seek a refund only if the customer provides notice to the Company of a material default and only if the Company does not cure the default within a specified period.
For arrangements entered into or materially modified after January 1, 2011, consideration is allocated to each unit of accounting based on the unit’s relative selling prices. The Company uses vender-specific objective evidence of selling price (VSOE) when the Company sells the deliverable separately and is the price actually charged by the Company for that deliverable. VSOE is established for the Company’s System Deliverable, maintenance and extended warranty services and film license arrangements. The Company uses a best
78
Table of Contents
estimate of selling price (BESP) for units of accounting that do not have VSOE or third-party evidence of selling price. The Company determines BESP for a deliverable by considering multiple factors including the Company’s historical pricing practices, product class, market competition and geography.
Sales Arrangements
For arrangements qualifying as sales, the revenue allocated to the System Deliverable is recognized in accordance with the Revenue Recognition Topic of the FASB ASC, when all of the following conditions have been met: (i) the projector, sound system and screen system have been installed and are in full working condition, (ii) the 3D glasses cleaning machine, if applicable, has been delivered, (iii) projectionist training has been completed and (iv) the earlier of (a) receipt of written customer acceptance certifying the completion of installation and run-in testing of the equipment and the completion of projectionist training or (b) public opening of the theater, provided there is persuasive evidence of an arrangement, the price is fixed or determinable and collectability is reasonably assured.
The initial revenue recognized consists of the initial payments received and the present value of any future initial payments and fixed minimum ongoing payments that have been attributed to this unit of accounting. Contingent payments in excess of the fixed minimum ongoing payments are recognized when reported by theater operators, provided collectability is reasonably assured.
The Company has also agreed, on occasion, to sell equipment under lease or at the end of a lease term. Consideration agreed to for these lease buyouts is included in revenues from equipment and product sales, when persuasive evidence of an arrangement exists, the fees are fixed or determinable, collectability is reasonably assured and title to the theater system passes from the Company to the customer.
Lease Arrangements
The Company uses the Leases Topic of FASB ASC to evaluate whether an arrangement is a lease within the scope of the accounting standard. Arrangements not within the scope of the accounting standard are accounted for either as a sales or services arrangement, as applicable.
For lease arrangements, the Company determines the classification of the lease in accordance with the Lease Topic of FASB ASC. A lease arrangement that transfers substantially all of the benefits and risks incident to ownership of the equipment is classified as a sales-type lease based on the criteria established by the accounting standard; otherwise the lease is classified as an operating lease. Prior to commencement of the lease term for the equipment, the Company may modify certain payment terms or make concessions. If these circumstances occur, the Company reassesses the classification of the lease based on the modified terms and conditions.
For sales-type leases, the revenue allocated to the System Deliverable is recognized when the lease term commences, which the Company deems to be when all of the following conditions have been met: (i) the projector, sound system and screen system have been installed and are in full working condition; (ii) the 3D glasses cleaning machine, if applicable, has been delivered; (iii) projectionist training has been completed; and (iv) the earlier of (a) receipt of the written customer acceptance certifying the completion of installation and run-in testing of the equipment and the completion of projectionist training or (b) public opening of the theater, provided collectability is reasonably assured.
The initial revenue recognized for sales-type leases consists of the initial payments received and the present value of future initial payments and fixed minimum ongoing payments computed at the interest rate implicit in the lease. Contingent payments in excess of the fixed minimum payments are recognized when reported by theater operators, provided collectability is reasonably assured.
For operating leases, initial payments and fixed minimum ongoing payments are recognized as revenue on a straight-line basis over the lease term. For operating leases, the lease term is considered to commence when all of the following conditions have been met: (i) the projector, sound system and screen system have been installed and in full working condition; (ii) the 3D glasses cleaning machine, if applicable, has been delivered; (iii) projectionist training has been completed; and (iv) the earlier of (a) receipt of written customer acceptance certifying the completion of installation and run-in testing of the equipment and the completion of projectionist training or (b) public opening of the theater. Contingent payments in excess of fixed minimum ongoing payments are recognized as revenue when reported by theater operators, provided collectability is reasonably assured.
Revenues from joint revenue sharing arrangements with upfront payments that qualify for classification as sales and sales-type leases are recognized in accordance with the sales and sales-type lease criteria discussed above. Contingent revenues from joint revenue sharing arrangements are recognized as box-office results and concessions revenues are reported by the theater operator, provided collectability is reasonably assured.
79
Table of Contents
Finance Income
Finance income is recognized over the term of the sales-type lease or financed sales receivable, provided collectability is reasonably assured. Finance income recognition ceases when the Company determines that the associated receivable is not collectible.
Finance income is suspended when the Company identifies a theater that is delinquent, non-responsive or not negotiating in good faith with the Company. Once the collectability issues are resolved the Company will resume recognition of finance income.
Improvements and Modifications
Improvements and modifications to the theater system after installation are treated as separate revenue transactions, if and when the Company is requested to perform these services. Revenue is recognized for these services when the performance of the services has been completed, provided there is persuasive evidence of an arrangement, the fee is fixed or determinable and collectability is reasonably assured.
Cost of Equipment and Product Sales
Theater systems and other equipment subject to sales-type leases and sales arrangements includes the cost of the equipment and costs related to project management, design, delivery and installation supervision services as applicable. The costs related to theater systems under sales and sales-type lease arrangements are relieved from inventory to costs and expenses applicable to revenues-equipment and product sales when revenue recognition criteria are met. In addition, the Company defers direct selling costs such as sales commissions and other amounts related to these contracts until the related revenue is recognized. These costs included in costs and expenses applicable to revenues-equipment and product sales, totaled $2.7 million in 2017 (2016 — $3.3 million; 2015 — $3.4 million). The cost of equipment and product sales prior to direct selling costs was $45.5 million in 2017 (2016 — $66.5 million; 2015 — $60.2 million). The Company may have warranty obligations at or after the time revenue is recognized which require replacement of certain parts that do not affect the functionality of the theater system or services. The costs for warranty obligations for known issues are accrued as charges to costs and expenses applicable to revenues-equipment and product sales at the time revenue is recognized based on the Company’s past historical experience and cost estimates.
Cost of Rentals
For theater systems and other equipment subject to an operating lease or placed in a theater operators’ venue under a joint revenue sharing arrangement, the cost of equipment and those costs that result directly from and are essential to the arrangement, is included within property, plant and equipment. Depreciation and impairment losses, if any, are included in cost of rentals based on the accounting policy set out in note 2(g). Commissions are recognized as costs and expenses applicable to revenues-rentals in the month they are earned, which is typically the month of installation. These costs totaled $1.6 million in 2017 (2016 — $1.8 million; 2015 — $1.1 million). Direct advertising and marketing costs for each theater are charged to costs and expenses applicable to revenues-rentals as incurred. These costs totaled $2.6 million in 2017 (2016 — $0.9 million; 2015 — $1.9 million).
Terminations, Consensual Buyouts and Concessions
The Company enters into theater system arrangements with customers that contain customer payment obligations prior to the scheduled installation of the theater system. During the period of time between signing and the installation of the theater system, which may extend several years, certain customers may be unable to, or may elect not to, proceed with the theater system installation for a number of reasons including business considerations, or the inability to obtain certain consents, approvals or financing. Once the determination is made that the customer will not proceed with installation, the arrangement may be terminated under the default provisions of the arrangement or by mutual agreement between the Company and the customer (a “consensual buyout”). Terminations by default are situations when a customer does not meet the payment obligations under an arrangement and the Company retains the amounts paid by the customer. Under a consensual buyout, the Company and the customer agree, in writing, to a settlement and to release each other of any further obligations under the arrangement or an arbitrated settlement is reached. Any initial payments retained or additional payments received by the Company are recognized as revenue when the settlement arrangements are executed and the cash is received, respectively. These termination and consensual buyout amounts are recognized in Other revenues.
In addition, the Company could agree with customers to convert their obligations for other theater system configurations that have not yet been installed to arrangements to acquire or lease the IMAX digital theater system. The Company considers these situations to be a termination of the previous arrangement and origination of a new arrangement for the IMAX digital theater system. For all
80
Table of Contents
arrangements entered into or modified prior to the date of adoption of the amended FASB ASC 605-25, the Company continues to defer an amount of any initial fees received from the customer such that the aggregate of the fees deferred and the net present value of the future fixed initial and ongoing payments to be received from the customer equals the selling price of the IMAX digital theater system to be leased or acquired by the customer. Any residual portion of the initial fees received from the customer for the terminated theater system is recorded in other revenues at the time when the obligation for the original theater system is terminated and the new theater system arrangement is signed. Under the amended FASB ASC 605-25, for all arrangements entered into or materially modified after the date of adoption, the total arrangement consideration to be received is allocated on a relative selling price basis to the digital upgrade and the termination of the previous theater system. The arrangement consideration allocated to the termination of the existing arrangement is recorded in Other revenues at the time when the obligation for the original theater system is terminated and the new theater system arrangement is signed.
The Company may offer certain incentives to customers to complete theater system transactions including payment concessions or free services and products such as film licenses or 3D glasses. Reductions in, and deferral of, payments are taken into account in determining the sales price either by a direct reduction in the sales price or a reduction of payments to be discounted in accordance with the Leases or Interests Topic of the FASB ASC. Free products and services are accounted for as separate units of accounting. Other consideration given by the Company to customers are accounted for in accordance with the Revenue Recognition Topic of the FASB ASC.
Maintenance and Extended Warranty Services
Maintenance and extended warranty services may be provided under a multiple element arrangement or as a separately priced contract. Revenues related to these services are deferred and recognized on a straight-line basis over the contract period and are recognized in Services revenues. Maintenance and extended warranty services includes maintenance of the customer’s equipment and replacement parts. Under certain maintenance arrangements, maintenance services may include additional training services to the customer’s technicians. All costs associated with this maintenance and extended warranty program are expensed as incurred. A loss on maintenance and extended warranty services is recognized if the expected cost of providing the services under the contracts exceeds the related deferred revenue.
Film Production and IMAX DMR Services
In certain film arrangements, the Company produces a film financed by third parties whereby the third party retains the copyright and the Company obtains exclusive distribution rights. Under these arrangements, the Company is entitled to receive a fixed fee or to retain as a fee the excess of funding over cost of production (the “production fee”). The third parties receive a portion of the revenues received by the Company from distributing the film, which is charged to costs and expenses applicable to revenues-services. The production fees are deferred, and recognized as a reduction in the cost of the film based on the ratio of the Company’s distribution revenues recognized in the current period to the ultimate distribution revenues expected from the film. Film exploitation costs, including advertising and marketing totaled $15.4 million in 2017 (2016 — $17.5 million; 2015 — $13.3 million) and are recorded in costs and expenses applicable to revenues-services as incurred.
Revenue from film production services where the Company does not hold the associated distribution rights are recognized in Services revenues when performance of the contractual service is complete, provided there is persuasive evidence of an agreement, the fee is fixed or determinable and collectability is reasonably assured.
Revenues from digitally re-mastering (IMAX DMR) films where third parties own or hold the copyrights and the rights to distribute the film are derived in the form of processing fees and recoupments calculated as a percentage of box-office receipts generated from the re-mastered films. Processing fees are recognized as Services revenues when the performance of the related re-mastering service is completed provided there is persuasive evidence of an arrangement, the fee is fixed or determinable and collectability is reasonably assured. Recoupments, calculated as a percentage of box-office receipts, are recognized as Services revenue when box-office receipts are reported by the third party that owns or holds the related film rights, provided collectability is reasonably assured.
Losses on film production and IMAX DMR services are recognized as costs and expenses applicable to revenues-services in the period when it is determined that the Company’s estimate of total revenues to be realized by the Company will not exceed estimated total production costs to be expended on the film production and the cost of IMAX DMR services.
81
Table of Contents
Film Distribution
Revenue from the licensing of films is recognized in Services revenues when persuasive evidence of a licensing arrangement exists, the film has been completed and delivered, the license period has begun, the fee is fixed or determinable and collectability is reasonably assured. When license fees are based on a percentage of box-office receipts, revenue is recognized when box-office receipts are reported by exhibitors, provided collectability is reasonably assured. Film exploitation costs, including advertising and marketing, totaled a recovery of $0.7 million in 2017 (2016 — expense of $2.2 million; 2015 — recovery of $0.1 million) and are recorded in costs and expenses applicable to revenues-services as incurred.
Film Post-Production Services
Revenues from post-production film services are recognized in Services revenues when performance of the contracted services is complete provided there is persuasive evidence of an arrangement, the fee is fixed or determinable and collectability is reasonably assured.
Other
The Company recognizes revenue in Services revenues from its owned and operated theaters resulting from box-office ticket and concession sales as tickets are sold, films are shown and upon the sale of various concessions. The sales are cash or credit card transactions with theater goers based on fixed prices per seat or per concession item.
In addition, the Company enters into commercial arrangements with third party theater owners resulting in the sharing of profits and losses which are recognized in Services revenues when reported by such theaters. The Company also provides management services to certain theaters and recognizes revenue over the term of such services.
Revenues on camera rentals are recognized in Rental revenues over the rental period.
Revenue from the sale of 3D glasses is recognized in Equipment and product sales revenue when the 3D glasses have been delivered to the customer.
Other service revenues are recognized in Service revenues when the performance of contracted services is complete.
(n) Research and Development
Research and development costs are expensed as incurred and primarily include projector and sound parts, labor, consulting fees, allocation of overheads and other related materials which pertain to the Company’s development of ongoing product and services. Research and development costs pertaining to fixed and intangible assets that have alternative future uses are capitalized and amortized under their related policies.
(o) Foreign Currency Translation
Monetary assets and liabilities of the Company’s operations which are denominated in currencies other than the functional currency are translated into the functional currency at the exchange rates prevailing at the end of the period. In 2013, the Company determined that the functional currency of one of its consolidated subsidiaries had changed from the Company’s reporting currency to the currency of the nation in which it is domiciled. As a result, in accordance with the FASB ASC 830 “Foreign Currency Matters”, the adjustment attributable to current-rate translation of non-monetary assets as of the date of the change was reported in other comprehensive income (“OCI”). The functional currency of its other consolidated subsidiaries continues to be the United States dollar. Foreign exchange translation gains and losses are included in the determination of earnings in the period in which they arise.
Foreign currency derivatives are recognized and measured in the balance sheet at fair value. Changes in the fair value (gains or losses) are recognized in the consolidated statement of operations except for derivatives designated and qualifying as foreign currency hedging instruments. For foreign currency hedging instruments, the effective portion of the gain or loss in a hedge of a forecasted transaction is reported in other comprehensive income (loss) and reclassified to the consolidated statement of operations when the forecasted transaction occurs. Any ineffective portion is recognized immediately in the consolidated statement of operations.
82
Table of Contents
(p) Stock-Based Compensation
The Company’s stock-based compensation generally includes stock options and restricted share units (“RSUs”). Stock-based compensation is recognized in accordance with the FASB ASC Topic 505, “Equity” and Topic 718, “Compensation-Stock Compensation.”
The Company estimates the fair value of stock option awards on the date of grant using fair value measurement techniques such as an option-pricing model. The fair value of RSU awards is equal to the closing price of the Company’s common stock on the date of grant. The value of the portion of the employee award that is ultimately expected to vest is recognized as expense over the requisite service periods in the Company’s consolidated statement of operations.
The Company utilizes a lattice-binomial option-pricing model (“Binomial Model”) to determine the fair value of stock option awards. The fair value determined by the Binomial Model is affected by the Company’s stock price as well as assumptions regarding a number of highly complex and subjective variables. These variables include, but are not limited to, the Company’s expected stock price volatility over the term of the awards, and actual and projected employee stock option exercise behaviors. The Binomial Model also considers the expected exercise multiple which is the multiple of exercise price to grant price at which exercises are expected to occur on average. Option-pricing models were developed for use in estimating the value of traded options that have no vesting or hedging restrictions and are fully transferable. Because the Company’s employee stock options have certain characteristics that are significantly different from traded options, and because changes in the subjective assumptions can materially affect the estimated value, in management’s opinion, the Binomial Model best provides a fair measure of the fair value of the Company’s employee stock options. See note 14(c) for the assumptions used to determine the fair value of stock-based payment awards.
Stock-based compensation expense includes compensation cost for employee stock-based payment awards granted and all modified, repurchased or cancelled employee awards. In addition, compensation expense includes the compensation cost, based on the grant-date fair value calculated for pro forma disclosures under ASC 718-10-55, for the portion of awards for which required service had not been rendered that were outstanding. Compensation expense for these employee awards is recognized using the straight-line single-option method. Stock-based compensation expense is not adjusted for estimated forfeitures, but instead adjusted upon an actual forfeiture of a stock option or RSU award. The Company utilizes the market yield on U.S. treasury securities (also known as nominal rate) over the contractual term of the instrument being issued.
Stock Options
As the Company stratifies its employees into homogeneous groups in order to calculate fair value under the Binomial Model, ranges of assumptions used are presented for expected option life. The Company uses historical data to estimate option exercise within the valuation model; various groups of employees that have similar historical exercise behavior are considered separately for valuation purposes. The expected volatility rate is estimated based on a blended volatility method which takes into consideration the Company’s historical share price volatility, the Company’s implied volatility which is implied by the observed current market prices of the Company’s traded options and the Company’s peer group volatility. The Company utilizes the Binomial Model to determine expected option life based on such data as vesting periods of awards, historical data that includes past exercise and post-vesting cancellations and stock price history.
The Company’s policy is to issue new common shares from treasury or shares purchased in the open market to satisfy stock options which are exercised.
Restricted Share Units
The Company’s RSUs have been classified as equity in accordance with Topic 505. The fair value of RSU awards is equal to the closing price of the Company’s common stock on the date of grant.
Awards to Non-Employees
Stock-based awards for services provided by non-employees are accounted for based on the fair value of the services received or the stock-based award, whichever is more reliably determinable. If the fair value of the stock-based award is used, the fair value is measured at the date of the award and remeasured until the earlier of the date that the Company has a performance commitment from the non-employees, the date performance is completed, or the date the awards vest.
83
Table of Contents
(q) Pension Plans and Postretirement Benefits
The Company has a defined benefit pension plan, the Supplemental Executive Retirement Plan (the “SERP”). As the Company’s SERP is unfunded, as at December 31, 2017, a liability is recognized for the projected benefit obligation.
Assumptions used in computing the defined benefit obligations are reviewed annually by management in consultation with its actuaries and adjusted for current conditions. Actuarial gains or losses and prior service costs or credits that arise during the period but are not recognized as components of net periodic benefits cost are recognized as a component of other comprehensive income. Amounts recognized in accumulated other comprehensive income including unrecognized actuarial gains or losses and prior service costs are adjusted as they are subsequently recognized in the consolidated statement of operations as components of net periodic benefit cost. Prior service costs resulting from the pension plan inception or amendments are amortized over the expected future service life of the employees, cumulative actuarial gains and losses in excess of 10% of the projected benefit obligation are amortized over the expected average remaining service life of the employees, and current service costs are expensed when earned. The remaining weighted average future service life of the employee used in computing the defined benefit obligation for the year ended December 31, 2017 was 2.0 years.
For defined contribution pension plans, required contributions by the Company are recorded as an expense.
A liability is recognized for the unfunded accumulated benefit obligation of the postretirement benefits plan. Assumptions used in computing the accumulated benefit obligation are reviewed by management in consultation with its actuaries and adjusted for current conditions. Current service cost is recognized as incurred and actuarial gains and losses are recognized as a component of other comprehensive income (loss). Amounts recognized in accumulated other comprehensive income (loss) including unrecognized actuarial gains or losses are adjusted as they are subsequently recognized in the consolidated statement of operations as components of net periodic benefit cost.
(r) Guarantees
The FASB ASC Guarantees Topic requires a guarantor to recognize, at the inception of a guarantee, a liability for the fair value of certain guarantees. Disclosures as required under the accounting guidance have been included in note 13(f).
3. New Accounting Standards and Accounting Changes
Adoption of New Accounting Policies
The Company adopted several standards on January 1, 2017, which are effective for annual periods ending after December 31, 2016, and for annual and interim periods thereafter, which did not have a material impact on its consolidated financial statements.
In October 2016, the FASB issued ASU No. 2016-16, “Income Taxes (Topic 740)”. The purpose of ASU 2016-16 is to eliminate the exception for an intra-entity transfer of an asset other than inventory. The amendments require the recognition of the income tax consequences of an intra-entity transfer of an asset, other than inventory, when the transfer occurs. The Company elected to early adopt ASU 2016-16 during the first quarter of 2017. The impact from the adoption was reflected in the Company’s consolidated financial statements on a modified retrospective basis resulting in an increase to Accumulated deficit of $8.3 million, a decrease to Other assets of $14.8 million, an increase to Deferred taxes of $7.9 million and an increase to Accrued and other liabilities of $1.4 million.
Recently Issued FASB Accounting Standard Codification Updates
In February 2016, the FASB issued ASU No. 2016-02, “Leases (Topic 842)” (“ASU 2016-02”). The purpose of the amendment is to help investors and other financial statement users better understand the amount, timing, and uncertainty of cash flows arising from leases. New disclosures will include qualitative and quantitative requirements to provide additional information about the amounts recorded in the financial statements. Lessor accounting will remain largely unchanged from current guidance; however, ASU 2016-02 will provide improvements that are intended to align lessor accounting with the lessee model and with updated revenue recognition guidance. For public entities, the amendments in ASU 2016-02 are effective for interim and annual reporting periods beginning after December 15, 2018. As a lessor, the Company has a significant portion of its revenue derived from leases, including its joint revenue sharing arrangements, and while the lessor accounting model is not fundamentally different, the Company continues to evaluate the effect of the standard on this revenue stream.
84
Table of Contents
In March 2016, the FASB issued ASU No. 2016-08, “Revenue from Contracts with Customers (Topic 606): Principal versus Agent Considerations” (“ASU 2016-08”). The purpose of ASU 2016-08 is to clarify the implementation of guidance on principal versus agent considerations.
In April 2016, the FASB issued ASU No. 2016-10, “Revenue from Contracts with Customers (Topic 606): Identifying Performance Obligations and Licensing” (“ASU 2016-10”). The purpose of ASU 2016-10 is to provide more detailed guidance in the following key areas: identifying performance obligations and licenses of intellectual property.
In May 2016, the FASB issued ASU No. 2016-11, to rescind from the FASB Accounting Standards Codification certain SEC paragraphs as a result of two SEC Staff Announcements at the March 3, 2016 meeting.
In May 2016, the FASB issued ASU No. 2016-12, “Revenue from Contracts with Customers (Topic 606): Narrow-Scope Improvements and Practical Expedients” (“ASU 2016-12”). The purpose of ASU 2016-12 is to clarify certain narrow aspects of Topic 606 such as assessing the collectability criterion, presentation of sales taxes and other similar taxes collected from customers, noncash consideration, contract modifications at transition, completed contracts at transition, and technical corrections.
In December 2016, the FASB issued ASU No. 2016-20, “Technical Corrections and Improvements to Topic 606, Revenue from Contracts with Customers”. The amendments in ASU 2016-20 represent changes to clarify the accounting standard codification, correct unintended application of guidance, or make minor improvements to the accounting standards codification that are related to Topic 606, Revenue from Contracts with Customers.
In November 2017, the FASB issued ASU No. 2017-14, to eliminate or amend from the FASB Accounting Standards Codification Topic 220, Topic 605 and Topic 606 certain SEC paragraphs.
For public companies, ASU 2016-08, ASU 2016-10, ASU 2016-11, ASU 2016-12, ASU 2016-20, and ASU 2017-14 which are all related to Topic 606, are effective for interim and annual reporting periods beginning after December 15, 2017.
Effective January 1, 2018, for the 2018 fiscal year, the Company adopted Topic 606, “Revenue from Contracts with Customers” (ASC 606) utilizing the modified retrospective approach with a cumulative catch up adjustment and will provide additional disclosures comparing results to previous U.S. GAAP in its 2018 consolidated financial statements. The Company plans to apply the new revenue standard only to contracts not completed as of the date of initial application, referred to as open contracts. All system sales and maintenance contracts with the existing network of IMAX theaters and the backlog of sales contracts make up a significant majority of the Company’s open contracts at any point in time. DMR arrangements where the film continues to be shown by the Company’s exhibitor partners, film distribution arrangements with remaining terms, aftermarket sales orders that have been received but for which control of the assets has not yet transferred to the customer are all also considered open contracts.
The Company’s revenues from the sales of projection systems, provision of maintenance services, sale of aftermarket 3D glasses and parts, conversion of film content into the IMAX DMR format, distribution of documentary film content and the provision of post production services are within the scope of the standard. The Company’s joint revenue sharing revenue arrangements, with the exception of those where the title transfers to the customer prior to recognition of the system revenue (hybrid sales arrangements), are not in scope of the standard due to their classification as leases. Similarly, any system revenue transactions classified as sales-type leases are excluded from the provisions of the new standard.
The Company has assessed its performance obligations under its arrangements pursuant to ASC 606 and has concluded that there are no significant differences between the performance obligations required to be units of account under ASC 606 and the deliverables considered to be units of account under ASC 605. Specifically, the Company has concluded that its “System Deliverable”, which consists of a theater system (projector, sound system, screen system and, if applicable, 3D glasses cleaning machine); services associated with the theater system including theater design support, supervision of installation services, and projectionist training; a license to use the IMAX brand to market the theater; 3D glasses; maintenance and extended warranty services; and potentially the licensing of films. remains unchanged when considered under ASC 606.
Certain of the Company’s revenue streams will be impacted by the variable consideration provisions of the new standard. The arrangements for the sale of projection systems include indexed minimum payment increases over the term of the arrangement, as well as provision for additional payments in excess of the minimum agreed payments in situations where the theater exceeds certain box office thresholds. Both contract provisions constitute variable consideration under the new standard that, subject to constraints to ensure significant reversal of revenues do not occur, require estimation and recognition at the point of revenue recognition, which is at the
85
Table of Contents
earlier of client acceptance of the installation of the system, including projectionist training, and the theater’s opening to the public. As this variable consideration extends through the entire term of the arrangement, which typically last 10 years, the Company applies constraints to its estimates and recognizes the variable consideration on a discounted present value basis at recognition. Under the previous standard, these amounts were recognized as reported by exhibitors (or customers) in future periods.
In certain joint revenue sharing arrangements, specifically the Company’s hybrid sales arrangements, the Company’s arrangements call for sufficient upfront revenues to cover the cost of the arrangement, with monthly payments calculated based on the theater’s net box office earned. Title and control of the projection system transfer to the customer at the point of revenue recognition, which is the earlier of client acceptance of the theater installation, including projectionist training, and theater opening to the public. Under the new revenue recognition standard, the percentage payment is considered variable consideration that must be estimated and recognized at the time of initial revenue recognition. Using box office projections and the Company’s history with theater and box office experience, the Company estimates the amount of percentage payment earned over the life of the arrangement, subject to sufficient constraint such that there is not a risk of significant revenue reversal. Under the previous recognition standard, these amounts were recognized as reported by exhibitors (or customers) in future periods. As a result, the Company does not believe that hybrid sales arrangements should be considered as part of the Joint Revenue Sharing Arrangement segment since the revenue recognition patterns of the arrangements now very closely resemble those of the traditional sale arrangements.
The Company’s arrangements include a requirement for the provision of maintenance services over the life of the arrangement, subject to a consumer price index increase on renewal each year. Under the new standard, the Company has included the future consideration from the provision of maintenance services in the relative selling price calculation at revenue recognition. The amount allocated to maintenance services is deferred and recognized over the full life of the arrangement. As the maintenance services are a stand ready obligation revenue is recognized evenly over time, which is consistent with past treatment. Under the previous recognition standard, only the first year’s extended warranty and maintenance services included as part of the upfront consideration received by the Company was included in the relative selling price allocation to determine the allocation of consideration between deliverables, while the future years maintenance services were recognized and amortized over each year’s renewal term. The Company does not expect a significant change in the allocation of consideration between performance obligations to arise as a result of this change.
The DMR and Film Distribution revenue streams fall under the variable consideration exemption for sales- or usage-based royalties. While the Company does not hold rights to the intellectual property in the form of the film content, the Company is being reimbursed for the application of its intellectual property in the form of its patented DMR processes used in the creation of new intellectual property in the form of an IMAX DMR version of film. The Company’s Film Distribution revenues are strictly from the license of its intellectual property in the form of documentary film content to which the Company holds distribution rights.
The Company’s remaining revenue streams are not significantly impacted by the new standard. The Company’s balance sheet will require adjustment for contract assets and liabilities arising from the variable consideration calculations noted above.
At this point, the Company is in the process of calculating the opening retained earnings impacts of the above. The Company is implementing changes to its revenue accounting system, processes and internal controls over revenue recognition as part of the adoption of the new standard.
In June 2016, the FASB issued ASU No. 2016-13, “Financial Instruments – Credit Losses (Topic 326): Measurement of Credit Losses on Financial Instruments” (“ASU 2016-13”). The purpose of ASU 2016-13 is to require a financial asset measured on the amortized cost basis to be presented at the net amount expected to be collected. Credit losses relating to available-for-sale debt securities should be recorded through an allowance for credit losses. For public entities, the amendments in ASU 2016-13 are effective for interim and annual reporting periods beginning after December 15, 2019. The Company is currently assessing the impact of ASU 2016-13 on its consolidated financial statements.
In January 2017, the FASB issued ASU No. 2017-01, “Business Combinations (Topic 805): Clarifying the Definition of a Business” (“ASU 2017-01”). The purpose of the amendment is to clarify the definition of a business with the objective of adding guidance to assist entities with evaluating whether transactions should be accounted for as acquisitions (or disposals) of assets or businesses. For public entities, the amendments in ASU 2017-01 are effective for interim and annual reporting periods beginning after December 15, 2017. The adoption of this standard in January 2018 did not have a material impact to the Company’s consolidated financial statements.
In January 2017, the FASB issued ASU No. 2017-04, “Intangibles – Goodwill and Other (Topic 350): Simplifying the Test for Goodwill Impairment” (“ASU 2017-04”). The purpose of the amendment is to simplify how an entity is required to test goodwill for impairment by eliminating Step 2 from the goodwill impairment test. Step 2 measures a goodwill impairment loss by comparing the implied fair value of a reporting unit’s goodwill with the carrying amount of that goodwill. For public entities, the amendments in ASU
86
Table of Contents
2017-04 are effective for interim and annual reporting periods beginning after December 15, 2019. The Company is currently assessing the impact of ASU 2017-04 on its consolidated financial statements.
In March 2017, the FASB issued ASU No. 2017-07, “Compensation – Retirement Benefits (Topic 715): Improving the Presentation of Net Periodic Pension Cost and Net Periodic Postretirement Benefit Cost” (“ASU 2017-07”). The amendment requires the service cost component of net periodic benefit cost be presented in the same income statement line item as other employee compensation costs arising from services rendered during the period and other components of the net periodic benefit cost be presented separately from the line item that includes the service cost and outside of any subtotal of operating income. For public entities, the amendments in ASU 2017-07 are effective for interim and annual reporting periods beginning after December 15, 2017. The adoption of this standard in January 2018 did not have a material impact to the Company’s consolidated financial statements.
In May 2017, the FASB issued ASU No. 2017-09, “Compensation - Stock compensation (Topic 718): Scope of modification accounting” (“ASU 2017-09”). The purpose of the amendment is to clarify which changes to the terms or condition of a share-based payment award require an entity to apply modification accounting. For all entities that offer share based payment awards, ASU 2017-09 are effective for interim and annual reporting periods beginning after December 15, 2017. The adoption of this standard in January 2018 did not have a material impact to the Company’s consolidated financial statements.
In August 2017, the FASB issued ASU No. 2017-12, “Derivatives and Hedging (Topic 815)”. The purpose of the amendment is to better align the results of cash flow and fair value hedge accounting with risk management activities through changes to both the designation and measurement guidance for qualifying hedging relationships and the presentation of hedge results in the financial statements. For public entities, the amendments in ASU 2017-12 are effective for interim and annual reporting periods beginning after December 15, 2018. The Company is currently assessing the impact of ASU 2017-12 on its consolidated financial statements.
The Company considers the applicability and impact of all recently issued FASB accounting standard codification updates. Accounting standards updates that are not noted above were assessed and determined to be not applicable or not significant to the Company’s consolidated financial statements for the period ended December 31, 2017.
87
Table of Contents
4. Lease Arrangements
(a) General Terms of Lease Arrangements
A number of the Company’s leases are classified as sales-type leases. Certain arrangements that are legal sales are also classified as sales-type leases as certain clauses within the arrangements limit transfer of title or provide the Company with conditional rights to the system. The customer’s rights under the Company’s lease arrangements are described in note 2(m). The Company classifies its lease arrangements at inception of the arrangement and, if required, after a modification of the lease arrangement, to determine whether they are sales-type leases or operating leases. Under the Company’s lease arrangements, the customer has the ability and the right to operate the hardware components or direct others to operate them in a manner determined by the customer. The Company’s lease portfolio terms are typically non-cancellable for 10 to 20 years with renewal provisions from inception. Except for those sales arrangements that are classified as sales-type leases, the Company’s leases generally do not contain an automatic transfer of title at the end of the lease term. The Company’s lease arrangements do not contain a guarantee of residual value at the end of the lease term. The customer is required to pay for executory costs such as insurance and taxes and is required to pay the Company for maintenance and extended warranty generally after the first year of the lease until the end of the lease term. The customer is responsible for obtaining insurance coverage for the theater systems commencing on the date specified in the arrangement’s shipping terms and ending on the date the theater systems are delivered back to the Company.
The Company has assessed the nature of its joint revenue sharing arrangements and concluded that, based on the guidance in the Revenue Recognition Topic of the ASC, the arrangements contain a lease. Under joint revenue sharing arrangements, the customer has the ability and the right to operate the hardware components or direct others to operate them in a manner determined by the customer. The Company’s joint revenue sharing arrangements are typically non-cancellable for 10 years or longer with renewal provisions. Title to equipment under joint revenue sharing arrangements does not transfer to the customer. The Company’s joint revenue sharing arrangements do not contain a guarantee of residual value at the end of the term. The customer is required to pay for executory costs such as insurance and taxes and is required to pay the Company for maintenance and extended warranty throughout the term. The customer is responsible for obtaining insurance coverage for the theater systems commencing on the date specified in the arrangement’s shipping terms and ending on the date the theater systems are delivered back to the Company. See additional details regarding the Company’s traditional and hybrid joint revenue sharing arrangements as described in note 2(m).
(b) Financing Receivables
Financing receivables, consisting of net investment in sales-type leases and receivables from financed sales of theater systems are as follows:
| As at December 31, | ||||||||
| 2017 | 2016 | |||||||
| Gross minimum lease payments receivable |
$ | 8,537 | $ | 10,466 | ||||
| Unearned finance income |
(1,147 | ) | (1,710 | ) | ||||
|
|
|
|
|
|||||
| Minimum lease payments receivable |
7,390 | 8,756 | ||||||
| Accumulated allowance for uncollectible amounts |
(155 | ) | (672 | ) | ||||
|
|
|
|
|
|||||
| Net investment in leases |
7,235 | 8,084 | ||||||
|
|
|
|
|
|||||
| Gross financed sales receivables |
162,522 | 154,301 | ||||||
| Unearned finance income |
(39,341 | ) | (39,766 | ) | ||||
|
|
|
|
|
|||||
| Financed sales receivables |
123,181 | 114,535 | ||||||
| Accumulated allowance for uncollectible amounts |
(922 | ) | (494 | ) | ||||
|
|
|
|
|
|||||
| Net financed sales receivables |
122,259 | 114,041 | ||||||
|
|
|
|
|
|||||
| Total financing receivables |
$ | 129,494 | $ | 122,125 | ||||
|
|
|
|
|
|||||
| Net financed sales receivables due within one year |
$ | 25,455 | $ | 21,980 | ||||
| Net financed sales receivables due after one year |
$ | 96,804 | $ | 92,061 | ||||
In 2017, the financed sales receivables had a weighted average effective interest rate of 9.1% (2016 — 9.3%).
88
Table of Contents
(c) Contingent Fees
Contingent fees that meet the Company’s revenue recognition policy, from customers under various theater system arrangements, have been reported in revenue as follows:
| Years Ended December 31, | ||||||||||||
| 2017 | 2016 | 2015 | ||||||||||
| Sales |
$ | 2,613 | $ | 3,308 | $ | 2,492 | ||||||
| Sales-type leases |
53 | 375 | 363 | |||||||||
| Operating leases |
185 | 602 | 901 | |||||||||
|
|
|
|
|
|
|
|||||||
| Subtotal - sales, sales-type leases and operating leases |
2,851 | 4,285 | 3,756 | |||||||||
| Joint revenue sharing arrangements |
70,779 | 73,976 | 82,016 | |||||||||
|
|
|
|
|
|
|
|||||||
| $ | 73,630 | $ | 78,261 | $ | 85,772 | |||||||
|
|
|
|
|
|
|
|||||||
(d) Future Minimum Rental Payments
Future minimum rental payments receivable from operating and sales-type leases at December 31, 2017, for each of the next five years are as follows:
| Operating Leases | Sales-Type Leases | |||||||
| 2018 |
$ | 484 | $ | 1,503 | ||||
| 2019 |
166 | 1,456 | ||||||
| 2020 |
69 | 1,331 | ||||||
| 2021 |
69 | 1,306 | ||||||
| 2022 |
70 | 899 | ||||||
| Thereafter |
215 | 1,655 | ||||||
|
|
|
|
|
|||||
| Total |
$ | 1,073 | $ | 8,150 | ||||
|
|
|
|
|
|||||
Total future minimum rental payments receivable from sales-type leases at December 31, 2017 exclude $0.4 million which represents amounts billed but not yet received.
89
Table of Contents
5. Inventories
| As at December 31, | ||||||||
| 2017 | 2016 | |||||||
| Raw materials |
$ | 21,206 | $ | 28,000 | ||||
|
Work-in-process |
2,601 | 3,818 | ||||||
| Finished goods |
6,981 | 10,303 | ||||||
|
|
|
|
|
|||||
| $ | 30,788 | $ | 42,121 | |||||
|
|
|
|
|
|||||
At December 31, 2017, finished goods inventory for which title had passed to the customer and revenue was deferred amounted to $4.9 million (December 31, 2016 — $2.3 million).
Inventories at December 31, 2017 include impairments and write-downs for excess and obsolete inventory based upon current estimates of net realizable value considering future events and conditions of $0.5 million (December 31, 2016 — $0.5 million).
6. Film Assets
| As at December 31, | ||||||||
| 2017 | 2016 | |||||||
| Completed and released films, net of accumulated amortization of $158,155 (2016—$128,650) |
$ | 3,467 | $ | 10,643 | ||||
| Films in production |
97 | 325 | ||||||
| Films in development |
1,462 | 5,554 | ||||||
|
|
|
|
|
|||||
| $ | 5,026 | $ | 16,522 | |||||
|
|
|
|
|
|||||
The Company expects to amortize film costs of $3.4 million for released films within three years from December 31, 2017 (December 31, 2016 — $4.8 million), including $2.2 million, which reflects the portion of the costs of the Company’s completed films that are expected to be amortized within the next year. The amount of participation payments to third parties related to these films that the Company expects to pay during 2018, which is included in accrued liabilities at December 31, 2017, is $4.5 million (2016 — $4.2 million).
The Company recognized an impairment on its episodic content assets, in its new business segment, of $11.7 million for the year ended December 31, 2017, due to lower than anticipated revenue generated for the television series’ first season. The first season of the series was completed in 2017 and as a result the episodic asset value was $nil as at December 31, 2017.
In 2017, the Company recorded a charge of $5.3 million (December 31, 2016 — $3.0 million) in costs and expenses applicable to revenues – services, after an assessment of the carrying value of certain documentary films and their estimated future box-office was performed.
90
Table of Contents
7. Property, Plant and Equipment
| As at December 31, 2017 | ||||||||||||
| Cost | Accumulated Depreciation |
Net Book Value |
||||||||||
| Equipment leased or held for use |
||||||||||||
| Theater system components(1)(2)(3)(4) |
$ | 264,259 | $ | 103,922 | $ | 160,337 | ||||||
| Camera equipment |
5,757 | 3,939 | 1,818 | |||||||||
|
|
|
|
|
|
|
|||||||
| 270,016 | 107,861 | 162,155 | ||||||||||
|
|
|
|
|
|
|
|||||||
| Assets under construction(5) |
23,398 | — | 23,398 | |||||||||
|
|
|
|
|
|
|
|||||||
| Other property, plant and equipment |
||||||||||||
| Land |
8,203 | — | 8,203 | |||||||||
| Buildings |
74,478 | 17,364 | 57,114 | |||||||||
| Office and production equipment(6) |
40,442 | 22,164 | 18,278 | |||||||||
| Leasehold improvements |
10,974 | 3,341 | 7,633 | |||||||||
|
|
|
|
|
|
|
|||||||
| 134,097 | 42,869 | 91,228 | ||||||||||
|
|
|
|
|
|
|
|||||||
| $ | 427,511 | $ | 150,730 | $ | 276,781 | |||||||
|
|
|
|
|
|
|
|||||||
| As at December 31, 2016 | ||||||||||||
| Cost | Accumulated Depreciation |
Net Book Value |
||||||||||
| Equipment leased or held for use |
||||||||||||
| Theater system components(1)(2)(3) |
$ | 224,890 | $ | 89,218 | $ | 135,672 | ||||||
| Camera equipment |
5,739 | 3,732 | 2,007 | |||||||||
|
|
|
|
|
|
|
|||||||
| 230,629 | 92,950 | 137,679 | ||||||||||
|
|
|
|
|
|
|
|||||||
| Assets under construction(5) |
18,315 | — | 18,315 | |||||||||
|
|
|
|
|
|
|
|||||||
| Other property, plant and equipment |
||||||||||||
| Land |
8,203 | — | 8,203 | |||||||||
| Buildings |
69,861 | 14,877 | 54,984 | |||||||||
| Office and production equipment(6) |
41,128 | 21,935 | 19,193 | |||||||||
| Leasehold improvements |
10,067 | 3,026 | 7,041 | |||||||||
|
|
|
|
|
|
|
|||||||
| 129,259 | 39,838 | 89,421 | ||||||||||
|
|
|
|
|
|
|
|||||||
| $ | 378,203 | $ | 132,788 | $ | 245,415 | |||||||
|
|
|
|
|
|
|
|||||||
The Company recognized asset impairment charges of $0.3 million (2016 — $0.2 million; 2015 — $0.4 million) against property, plant and equipment after an assessment of the carrying value of certain assets in light of their future expected cash flows.
In addition, as a result of the Company’s recent restructuring activities, certain long-lived assets were deemed to be impaired as the Company’s exit from certain activities limited the future revenue associated with these assets. The Company recognized property, plant and equipment charges of $3.7 million. No such charge was recorded in the year ended December 31, 2016 and 2015.
| (1) | Included in theater system components are assets with costs of $8.5 million (2016 — $10.3 million) and accumulated depreciation of $7.2 million (2016 — $8.1 million) that are leased to customers under operating leases. |
| (2) | Included in theater system components are assets with costs of $249.0 million (2016 — $205.2 million) and accumulated depreciation of $92.9 million (2016 — $75.7 million) that are used in joint revenue sharing arrangements. |
| (3) | In 2016, the Company identified and wrote off $0.6 million of theater system components upon the upgrade of xenon-based digital systems under operating lease arrangements to laser-based digital systems under sales or sales-type lease arrangements. No such charge was recorded in the year ended December 31, 2017. |
| (4) | During 2016, the Company signed certain amending agreements which increased the length of the term for all applicable existing and future theaters under joint revenue sharing arrangement. As a result, the Company adjusted the estimated useful life of its theater system components in use for those respective joint revenue sharing theaters, on a prospective basis, to reflect the change |
91
Table of Contents
| in term. This resulted in decreased depreciation expense of $0.1 million in 2016 and $1.0 million in 2017 as well as in each of the next 4 years since the Systems will now be depreciated over a longer useful life. |
| (5) | Included in assets under construction are components with costs of $15.0 million (2016 — $14.5 million) that will be utilized to construct assets to be used in joint revenue sharing arrangements. |
| (6) | Fully amortized office and production equipment is still in use by the Company. In 2017, the Company identified and wrote off $0.4 million (2016 — $0.7 million) of office and production equipment that is no longer in use and fully amortized. |
8. Other Assets
| As at December 31, | ||||||||
| 2017 | 2016 | |||||||
| Lease incentives provided to theaters |
$ | 7,393 | $ | 5,632 | ||||
| Commissions and other deferred selling expenses |
3,762 | 3,352 | ||||||
| Other investments |
3,516 | 2,000 | ||||||
| Investment in film business |
3,484 | 1,389 | ||||||
| Insurance recoverable |
2,708 | 2,708 | ||||||
| Investment in content |
2,911 | 522 | ||||||
| Foreign currency derivatives |
1,447 | 480 | ||||||
| Deferred charges on debt financing and other fees |
1,182 | 1,713 | ||||||
| Prepaid taxes (note 9) |
— | 14,728 | ||||||
| Other |
354 | 671 | ||||||
|
|
|
|
|
|||||
| $ | 26,757 | $ | 33,195 | |||||
|
|
|
|
|
|||||
9. Income Taxes
(a) Income (loss) before income taxes by tax jurisdiction are comprised of the following:
| Years Ended December 31, | ||||||||||||
| 2017 | 2016 | 2015 | ||||||||||
| Canada |
$ | (17,261 | ) | $ | 21,002 | $ | 41,099 | |||||
| United States |
(11,895 | ) | 505 | 4,504 | ||||||||
| China |
50,410 | 41,224 | 45,818 | |||||||||
| Ireland |
3,632 | (9,768 | ) | (10,581 | ) | |||||||
| Other |
5,125 | 4,890 | 6,238 | |||||||||
|
|
|
|
|
|
|
|||||||
| $ | 30,011 | $ | 57,853 | $ | 87,078 | |||||||
|
|
|
|
|
|
|
|||||||
92
Table of Contents
(b) The provision for income taxes related to income (loss) before income taxes is comprised of the following:
| Years Ended December 31, | ||||||||||||
| 2017 | 2016 | 2015 | ||||||||||
| Current: |
||||||||||||
| Canada |
$ | (6,898 | ) | $ | (1,396 | ) | $ | (10,862 | ) | |||
| United States |
267 | 1,756 | 985 | |||||||||
| China |
(12,724 | ) | (10,131 | ) | (10,591 | ) | ||||||
| Ireland |
(735 | ) | (405 | ) | — | |||||||
| Other |
(717 | ) | (1,093 | ) | (920 | ) | ||||||
|
|
|
|
|
|
|
|||||||
| (20,807 | ) | (11,269 | ) | (21,388 | ) | |||||||
|
|
|
|
|
|
|
|||||||
| Deferred:(1) |
||||||||||||
| Canada |
8,748 | (3,583 | ) | (518 | ) | |||||||
| United States |
(7,109 | ) | (4,359 | ) | 147 | |||||||
| China |
1,405 | 776 | (83 | ) | ||||||||
| Ireland |
1,085 | 2,352 | 1,840 | |||||||||
| Other |
(112 | ) | (129 | ) | (50 | ) | ||||||
|
|
|
|
|
|
|
|||||||
| 4,017 | (4,943 | ) | 1,336 | |||||||||
|
|
|
|
|
|
|
|||||||
| $ | (16,790 | ) | $ | (16,212 | ) | $ | (20,052 | ) | ||||
|
|
|
|
|
|
|
|||||||
| (1) | For the year ended December 31, 2017, the Company has not adjusted the valuation allowance from the prior year (2016 — $0.1 million decrease) relating to the future utilization of deductible temporary differences, tax credits, and certain net operating loss carryforwards. Also included in the provision for income taxes is the deferred tax related to amounts recorded in and reclassified from other comprehensive income in the year of $0.7 million. |
(c) The provision for income taxes from continuing operations differs from the amount that would have resulted by applying the combined Canadian federal and provincial statutory income tax rates to earnings due to the following:
| Years Ended December 31, | ||||||||||||
| 2017 | 2016 | 2015 | ||||||||||
| Income tax provision at combined statutory rates |
$ | (7,954 | ) | $ | (15,330 | ) | $ | (23,081 | ) | |||
| Adjustments resulting from: |
||||||||||||
| Stock based compensation |
(295 | ) | (565 | ) | 2,387 | |||||||
| Other non-deductible/non-includable items |
(717 | ) | (1,254 | ) | (439 | ) | ||||||
| Decrease (increase) in valuation allowance relating to current year temporary differences |
— | 129 | (16 | ) | ||||||||
| Changes to tax reserves |
(1,435 | ) | 1,628 | (453 | ) | |||||||
| U.S. federal and state taxes |
(373 | ) | (767 | ) | (27 | ) | ||||||
| Withholding taxes |
(1,217 | ) | (786 | ) | (716 | ) | ||||||
| Income tax at different rates in foreign and other provincial jurisdictions |
4,147 | 50 | 961 | |||||||||
| Investment and other tax credits (non-refundable) |
1,570 | 2,190 | 1,597 | |||||||||
| Changes to deferred tax assets and liabilities resulting from audit and other tax return adjustments |
(532 | ) | (1,612 | ) | (242 | ) | ||||||
| Windfall tax (shortfall) benefit |
(591 | ) | 57 | — | ||||||||
| Impact of changes due to U.S. tax reform |
(9,323 | ) | — | — | ||||||||
| Other |
(70 | ) | 48 | (23 | ) | |||||||
|
|
|
|
|
|
|
|||||||
| Provision for income taxes, as reported |
$ | (16,790 | ) | $ | (16,212 | ) | $ | (20,052 | ) | |||
|
|
|
|
|
|
|
|||||||
93
Table of Contents
(d) The net deferred income tax asset is comprised of the following:
| As at December 31, | ||||||||
| 2017 | 2016 | |||||||
| Net operating loss carryforwards |
$ | 3,306 | $ | 2,893 | ||||
| Investment tax credit and other tax credit carryforwards |
161 | — | ||||||
| Write-downs of other assets |
1,219 | 759 | ||||||
| Excess of tax accounting basis in property, plant and equipment, inventories and other assets |
9,380 | — | ||||||
| Accrued pension liability |
6,406 | 6,571 | ||||||
| Accrued stock-based compensation |
3,004 | 12,352 | ||||||
| Other accrued reserves |
9,615 | 3,754 | ||||||
|
|
|
|
|
|||||
| Total deferred income tax assets |
33,091 | 26,329 | ||||||
| Income recognition on net investment in leases |
(2,186 | ) | (3,985 | ) | ||||
| Excess accounting over tax basis in property, plant and equipment, inventories and other assets |
— | (1,368 | ) | |||||
|
|
|
|
|
|||||
| 30,905 | 20,976 | |||||||
| Valuation allowance |
(197 | ) | (197 | ) | ||||
|
|
|
|
|
|||||
| Net deferred income tax asset |
$ | 30,708 | $ | 20,779 | ||||
|
|
|
|
|
|||||
The gross deferred tax assets include a liability of $0.4 million relating to the remaining tax effect resulting from the Company’s defined benefit pension plan, the related actuarial gains and losses, and unrealized net gains and losses on cash flow hedging instruments recorded in accumulated other comprehensive income.
The Company elected to early adopt ASU 2016-16 related to income taxes during the first quarter of 2017. The impact from the adoption was reflected in the Company’s consolidated financial statements on a modified retrospective basis resulting in an increase to Accumulated deficit of $8.3 million, a decrease to Other assets of $14.8 million, an increase to Deferred taxes of $7.9 million and an increase to Accrued and other liabilities of $1.4 million.
The Company recorded income tax expense of $16.8 million for the year-ended December 31, 2017. The effective tax rate for the year of 55.9% was significantly higher than the statutory rate due to the impact of the Tax Cuts and Jobs Act (the “Tax Act”), which was enacted on December 22, 2017 by the U.S. government. The Tax Act makes broad and complex changes to the U.S. tax code including, but not limited to reducing the U.S. federal corporate tax rate from 35% to 21%, and imposing other limitations and changes that limit or eliminate various deductions, including interest expense, performance based compensation for certain executives, and other deductions requiring the re-measurement of deferred tax assets and liabilities. U.S. GAAP requires that the impact of changes to tax legislation be recognized in the period in which the law was enacted.
On December 22, 2017, the SEC issued Staff Accounting Bulletin (“SAB 118”), which provides guidance on accounting for tax effects of the Tax Act when a company does not have all the necessary information available, prepared or analyzed (including computations) in reasonable detail to complete its accounting for the effect of the changes in the Tax Act. In accordance with SAB 118, a company must reflect the income tax effects of those aspects of the Act for which the accounting under ASC 740 is complete. To the extent that a company’s accounting for certain income tax effects of the Tax Act is incomplete but it is able to determine a reasonable estimate, it must record a provisional estimate to be included in the financial statements. If a company cannot determine a provisional estimate to be included in the financial statements, it should continue to apply ASC 740 on the basis of the provision of the tax laws that were in effect immediately before the enactment of the Tax Act. SAB 118 provides a measurement period that should not extend beyond one year from the Tax Act enactment date for companies to complete the accounting under ASC 740. While the Company is able to make reasonable estimates of the impact of the reduction in corporate rate and other changes in the legislation the final impact of the Tax Act may differ from these estimates, due to, among other things, changes in interpretations and assumptions, additional guidance that may be issued by the I.R.S., and actions the Company may take.
The effect of the re-measurement on deferred taxes is reflected entirely in the period that includes the enactment date and is allocated directly to income tax expense. As of December 31, 2017, the Company can determine a reasonable estimate of the effects of tax reform and is recording that estimate as a provisional amount. The provisional re-measurement of the deferred tax assets and liabilities resulted in a $9.3 million discrete tax provision which increased the effective tax rate by 31.1% for the year. The provisional re-measurement amount may change as data becomes available allowing more accurate scheduling of the deferred tax assets and liabilities.
94
Table of Contents
The Tax Act also includes a number of other changes including: (a) the imposition of a one-time deemed repatriation tax on accumulated foreign earnings (the “Transition Tax”), (b) a 100% dividends received deduction on dividends from foreign affiliates, (c) a current inclusion in U.S. federal taxable income of earnings of foreign affiliates that are determined to be global intangible low taxed income or “GILTI”, (d) creation of the base erosion anti-abuse tax, or “BEAT”, (e) provision for an effective tax rate of 13.125% for certain income derived from outside of the U.S. (referred to as foreign derived intangible income or “FDII”) and, (f) 100% expensing of qualifying fixed assets acquired after September 27, 2017.
Given that the Company is a Canadian based multinational with subsidiary operations in the US and other foreign jurisdictions a number of these changes are not anticipated to impact the Company. The Company does not expect to be subject to the BEAT, Transition Tax or GILTI given its current legal and tax structures. The Company will be eligible to expense qualifying fixed assets acquired after September 27, 2017, and will be impacted by the additional limitations imposed on the deductibility of executive compensation, and does not expect to be adversely impacted by the limitations placed on the deductibility of interest expense. The impact of the Tax Act may differ from this estimate, during the one-year measurement period due to, among other things, further refinement of the Company’s calculations, changes in interpretations and assumptions the Company has made, guidance that may be issued and actions the Company may take as a result of the Tax Act.
As a result, no U.S. income taxes have been provided for any undistributed foreign earnings, or any additional outside basis differences inherent in these foreign entities, as the Company is a Canadian corporation and these amounts continue to be indefinitely reinvested in foreign operations which are owned directly or indirectly.
The Company has not provided Canadian taxes on cumulative earnings of non-Canadian affiliates and associated companies that have been reinvested indefinitely. Taxes are provided for earnings of non-Canadian affiliates and associated companies when the Company determines that such earnings are no longer indefinitely reinvested.
(e) Estimated U.S. net operating loss carryforwards of $19.0 million and $23.1 million of loss carryforwards in Ireland can be carried forward indefinitely to reduce taxable income. Additional net operating loss carryforwards of $0.6 million in Canada and Japan can be carried forward through to 2029. Investment tax credits and other tax credits can be carried forward to reduce income taxes payable through to 2038.
(f) Valuation allowance
The provision for income taxes in the year ended December 31, 2017 does not include an adjustment to the valuation allowance (2016 — $0.1 million recovery) in continuing operations. During the year ended December 31, 2017, after considering all available evidence, both positive (including recent and historical profits, projected future profitability, backlog, carryforward periods for, and utilization of net operating loss carryovers and tax credits, discretionary deductions and other factors) and negative (including cumulative losses in past years and other factors), it was concluded that the existing valuation allowance against the Company’s deferred tax assets was appropriate (2016 — $0.1 million decrease). The $0.2 million (2016 — $0.2 million) balance in the valuation allowance as at December 31, 2017 is primarily attributable to certain U.S. state net operating loss carryovers that may expire unutilized.
(g) Uncertain tax positions
The Company recorded a net increase of $3.3 million related to reserves for income taxes, of which $1.9 million was recorded directly to retained earnings. As at December 31, 2017 and December 31, 2016, the Company had total unrecognized tax benefits (including interest and penalties) of $15.9 million and $12.6 million, respectively, for deductibility of stock based compensation, international withholding taxes and other items. Approximately $15.9 million of the unrecognized tax benefits could impact the Company’s effective tax rate if recognized. While the Company believes it has adequately provided for all tax positions, amounts asserted by taxing authorities could differ from the Company’s accrued position. Accordingly, additional provisions on federal, provincial, state and foreign tax-related matters could be recorded in the future as revised estimates are made or the underlying matters are settled or otherwise resolved.
95
Table of Contents
A reconciliation of the beginning and ending amount of unrecognized tax benefits (excluding interest and penalties) for the years ended December 31 is as follows:
| 2017 | 2016 | 2015 | ||||||||||
| Balance at beginning of the year |
$ | 12,593 | $ | 14,221 | $ | 1,972 | ||||||
| Additions based on tax positions related to the current year |
3,639 | 314 | 12,694 | |||||||||
| Reductions for tax positions of prior years |
(195 | ) | (500 | ) | — | |||||||
| Reductions resulting from lapse of applicable statute of limitations and administrative practices |
(110 | ) | (1,442 | ) | (445 | ) | ||||||
|
|
|
|
|
|
|
|||||||
| Balance at the end of the year |
$ | 15,927 | $ | 12,593 | $ | 14,221 | ||||||
|
|
|
|
|
|
|
|||||||
Consistent with its historical financial reporting, the Company has elected to classify interest and penalties related to income tax liabilities, when applicable, as part of the interest expense in its consolidated statements of operations rather than income tax expense. The Company expensed less than $0.1 million in potential interest and penalties associated with its provision for uncertain tax positions for the years ended December 31, 2017 (2016 — less than $0.1 million recovery; 2015 — less than $0.1 million recovery).
The number of years with open tax audits varies depending on the tax jurisdiction. The Company’s major taxing jurisdictions include Canada, the province of Ontario, the United States (including multiple states), Ireland and China.
The Company’s 2011 through 2016 tax years remain subject to examination by the IRS for U.S. federal tax purposes, and the 2006 through 2016 tax years remain subject to examination by the appropriate governmental agencies for Canadian federal tax purposes. There are other on-going audits in various other jurisdictions that are not material to the financial statements.
Cash held outside of North America as at December 31, 2017 was $119.4 million (December 31, 2016 — $117.4 million), of which $32.6 million was held in the People’s Republic of China (“PRC”) (December 31, 2016 — $31.5 million). The Company’s intent is to permanently reinvest these amounts outside of Canada and the Company does not currently anticipate that it will need funds generated from foreign operations to fund North American operations. In the event funds from foreign operations are needed to fund operations in North America and if withholding taxes have not already been previously provided, the Company would be required to accrue and pay these additional withholding tax amounts on repatriation of funds from China to Canada. The Company currently estimates this amount to be $6.9 million.
(h) Income Tax Effect on Comprehensive Income
The income tax (expense) benefit related to the following items included in other comprehensive income (loss) are:
| Years Ended December 31, | ||||||||||||
| 2017 | 2016 | 2015 | ||||||||||
| Unrecognized actuarial gain or loss on defined benefit plan |
$ | (307 | ) | $ | (41 | ) | $ | (47 | ) | |||
| Unrecognized actuarial gain or loss on postretirement benefit plans |
13 | (48 | ) | (21 | ) | |||||||
| Amortization of actuarial gain or loss on postretirement benefit plan |
— | (18 | ) | (35 | ) | |||||||
| Unrealized change in cash flow hedging instruments |
107 | (271 | ) | 1,543 | ||||||||
| Realized change in cash flow hedging instruments upon settlement |
(559 | ) | (802 | ) | (844 | ) | ||||||
| Foreign currency translation adjustments |
— | — | (85 | ) | ||||||||
|
|
|
|
|
|
|
|||||||
| $ | (746 | ) | $ | (1,180 | ) | $ | 511 | |||||
|
|
|
|
|
|
|
|||||||
96
Table of Contents
10. Other Intangible Assets
| As at December 31, 2017 | ||||||||||||
| Accumulated | Net Book | |||||||||||
| Cost | Amortization | Value | ||||||||||
| Patents and trademarks |
$ | 12,184 | $ | 7,710 | $ | 4,474 | ||||||
| Licenses and intellectual property |
21,471 | 7,800 | 13,671 | |||||||||
| Other |
19,529 | 6,463 | 13,066 | |||||||||
|
|
|
|
|
|
|
|||||||
| $ | 53,184 | $ | 21,973 | $ | 31,211 | |||||||
|
|
|
|
|
|
|
|||||||
| As at December 31, 2016 | ||||||||||||
| Accumulated | Net Book | |||||||||||
| Cost | Amortization | Value | ||||||||||
| Patents and trademarks |
$ | 11,395 | $ | 7,046 | $ | 4,349 | ||||||
| Licenses and intellectual property |
22,490 | 7,620 | 14,870 | |||||||||
| Other |
15,352 | 4,155 | 11,197 | |||||||||
|
|
|
|
|
|
|
|||||||
| $ | 49,237 | $ | 18,821 | $ | 30,416 | |||||||
|
|
|
|
|
|
|
|||||||
Other intangible assets of $19.5 million are comprised mainly of the Company’s investment in an enterprise resource planning system. Fully amortized other intangible assets are still in use by the Company. In 2017, the Company identified and wrote off $0.1 million (2016 — $0.2 million) of patents and trademarks that are no longer in use.
During 2017, the Company acquired $5.2 million in other intangible assets. The net book value of these other intangible assets was $4.6 million as at December 31, 2017. The weighted average amortization period for these additions is 4.9 years.
During 2017, the Company incurred costs of $0.4 million to renew or extend the term of acquired patents and trademarks which were recorded in selling, general and administrative expenses (2016 — $0.2 million).
The estimated amortization expense for each of the years ended December 31, are as follows:
| 2018 |
$ | 4,649 | ||
| 2019 |
4,649 | |||
| 2020 |
4,649 | |||
| 2021 |
4,649 | |||
| 2022 |
4,649 |
97
Table of Contents
11. Credit Facility and Playa Vista Loan
The Company maintains a senior secured credit facility (the “Credit Facility”) with a maximum borrowing capacity of $200.0 million and a scheduled maturity of March 3, 2020. The Credit Facility is collateralized by a first priority security interest in substantially all of the present and future assets of the Company and the Guarantors. Certain of the Company’s subsidiaries serve as guarantors (the “Guarantors”) of the Company’s obligations under the Credit Facility.
The terms of the Credit Facility are set forth in the Fourth Amended and Restated Credit Agreement (as amended, the “Credit Agreement”), dated March 3, 2015, among the Company, the Guarantors, the lenders named therein, Wells Fargo Bank, National Association (“Wells Fargo”), as agent and issuing lender (Wells Fargo, together with the lenders named therein, the “Lenders”) and Wells Fargo Securities, LLC, as Sole Lead Arranger and Sole Bookrunner and in various collateral and security documents entered into by the Company and the Guarantors.
The Company was in compliance with all of its requirements at December 31, 2017.
Total amounts drawn and available under the Credit Facility at December 31, 2017 and 2016 were $nil and $200.0 million, respectively.
As at December 31, 2017 and 2016, the Company did not have any letters of credit and advance payment guarantees outstanding under the Credit Facility.
Playa Vista Financing
In 2014, IMAX PV Development Inc., (“PV Borrower”) a wholly-owned subsidiary of the Company, entered into a loan agreement with Wells Fargo to principally fund the costs of development and construction of the Company’s new West Coast headquarters, located in the Playa Vista neighborhood of Los Angeles, California (the “Playa Vista Loan”).
The Playa Vista Loan was fully drawn at $30.0 million and bore interest at a variable interest rate per annum equal to 2.0% above the 30-day LIBOR rate. PV Borrower was required to make monthly payments of combined principal and interest over a 10-year term with a lump sum payment at the end of year 10. The Playa Vista Loan is being amortized over 15 years. The Playa Vista Loan will be fully due and payable on October 19, 2025 (the “Maturity Date”), and may be prepaid at any time without premium, but with all accrued interest and other applicable payments.
The Playa Vista Loan is secured by a deed of trust from PV Borrower in favor of Wells Fargo and other documents evidencing and securing the loan, granting a first lien on and security interest in the Playa Vista property and the Playa Vista project, including all improvements to be constructed thereon. The company has also guaranteed Playa Vista Loan.
The Loan Documents contain affirmative, negative and financial covenants (including compliance with the financial covenants of the Company’s outstanding Credit Facility), agreements, representations, warranties, borrowing conditions, and events of default customary for development projects such as the Playa Vista Project.
98
Table of Contents
Bank indebtedness includes the following:
| As at December 31, | ||||||||
| 2017 | 2016 | |||||||
| Playa Vista Loan |
25,667 | 27,667 | ||||||
| Deferred charges on debt financing |
(310 | ) | (351 | ) | ||||
|
|
|
|
|
|||||
| $ | 25,357 | $ | 27,316 | |||||
|
|
|
|
|
|||||
Total amounts drawn under the Playa Vista Loan at December 31, 2017 was $25.7 million (December 31, 2016 — $27.7 million) at an effective interest rate of 3.14%, respectively (December 31, 2016 — 2.52%, respectively).
In accordance with the Playa Vista Loan Documents, the Company is obligated to make principal payments on the loan as follows:
| 2018 |
$ | 2,000 | ||
| 2019 |
2,000 | |||
| 2020 |
2,000 | |||
| 2021 |
2,000 | |||
| 2022 |
2,000 | |||
| Thereafter |
15,667 | |||
|
|
|
|||
| $ | 25,667 | |||
|
|
|
Wells Fargo Foreign Exchange Facility
Within the Credit Facility, the Company is able to purchase foreign currency forward contracts and/or other swap arrangements. There is no settlement risk on its foreign currency forward contracts at December 31, 2017, as the fair value exceeded the notional value of the forward contracts. As at December 31, 2017, the Company has $35.2 million in notional value of such arrangements outstanding.
Bank of Montreal Facility
As at December 31, 2017 and 2016, the Company had available a $10.0 million facility with the Bank of Montreal for use solely in conjunction with the issuance of performance guarantees and letters of credit fully insured by Export Development Canada (the “Bank of Montreal Facility”). The Company did not have any letters of credit and advance payment guarantees outstanding as at December 31, 2017 (December 31, 2016 — $0.1 million) under the Bank of Montreal Facility.
12. Commitments
In the ordinary course of business, the Company enters into contractual agreements with third parties that include non-cancelable payment obligations, for which it is liable in future periods. These arrangements can include terms binding the Company to minimum payments and/or penalties if it terminates the agreement for any reason other than an event of default as described by the agreement. The following table presents a summary of the Company’s contractual obligations and commitments as at December 31, 2017:
| Payments Due by Fiscal Year | ||||||||||||||||||||||||||||
| Total | ||||||||||||||||||||||||||||
| Obligations | 2018 | 2019 | 2020 | 2021 | 2022 | Thereafter | ||||||||||||||||||||||
| Purchase obligations |
$ | 38,055 | $ | 38,055 | $ | — | $ | — | $ | — | $ | — | $ | — | ||||||||||||||
| Pension obligations |
20,076 | — | — | 20,076 | — | — | — | |||||||||||||||||||||
| Operating lease obligations |
24,933 | 6,226 | 3,462 | 1,545 | 1,364 | 1,397 | 10,939 | |||||||||||||||||||||
| Playa Vista Loan |
25,667 | 2,000 | 2,000 | 2,000 | 2,000 | 2,000 | 15,667 | |||||||||||||||||||||
| Postretirement benefits obligations |
4,569 | 746 | 613 | 480 | 488 | 420 | 1,822 | |||||||||||||||||||||
| Other financial commitments |
10,677 | 6,677 | 4,000 | — | — | — | — | |||||||||||||||||||||
|
|
|
|
|
|
|
|
|
|
|
|
|
|
|
|||||||||||||||
| $ | 123,977 | $ | 53,704 | $ | 10,075 | $ | 24,101 | $ | 3,852 | $ | 3,817 | $ | 28,428 | |||||||||||||||
|
|
|
|
|
|
|
|
|
|
|
|
|
|
|
|||||||||||||||
99
Table of Contents
Operating Lease Obligations
The Company’s lease commitments consist of rent and equipment under operating leases. The Company accounts for any incentives provided over the term of the lease. The following table summarizes information about the Company’s total rental expenses under operating leases:
| Years Ended December 31, | ||||||||||||
| 2017 | 2016 | 2015 | ||||||||||
| Total rent expense |
$ | 5,685 | $ | 5,106 | $ | 4,766 | ||||||
Recorded in the accrued liabilities balance as at December 31, 2017 is $4.1 million (December 31, 2016 — $1.6 million) related to accrued rent and lease inducements being recognized as an offset to rent expense over the term of the respective leases.
Purchase Obligations
Purchase obligations primarily consist of the Company’s commitments made under long-term supplier contracts.
Pension and Postretirement Benefits Obligations
The Company has an unfunded defined benefit pension plan, covering certain individuals and a postretirement plan to provide health and welfare benefits to Canadian employees meeting certain eligibility requirements. See note 20 for further information.
Playa Vista Loan
The Company is required to make monthly payments of combined principal and interest over a 10-year term with a lump sum payment at the end of year 10. The Playa Vista Loan will be fully due and payable on October 19, 2025. See note 11 for further information.
Other Financial Commitments
Other financial commitments include the Company’s total minimum commitment toward the development, production, post-production and marketing, related to certain film and new content initiatives.
Letters of Credit and Advance Payment Guarantees
As at December 31, 2017 the Company did not have any letters of credit and advance payment guarantees outstanding (December 31, 2016 — $nil), under the Credit Facility. As at December 31, 2017 the Company did not have any letters of credit and advance payment guarantees outstanding as compared to $0.1 million as at December 31, 2016, under the Bank of Montreal Facility.
The Company compensates its sales force with both fixed and variable compensation. Commissions on the sale or lease of the Company’s theater systems are payable in graduated amounts from the time of collection of the customer’s first payment to the Company up to the collection of the customer’s last initial payment. At December 31, 2017, $2.3 million (December 31, 2016 —$2.0 million) of commissions have been accrued and will be payable in future periods.
100
Table of Contents
13. Contingencies and Guarantees
The Company is involved in lawsuits, claims, and proceedings, including those identified below, which arise in the ordinary course of business. In accordance with the Contingencies Topic of the FASB ASC, the Company will make a provision for a liability when it is both probable that a loss has been incurred and the amount of the loss can be reasonably estimated. The Company believes it has adequate provisions for any such matters. The Company reviews these provisions in conjunction with any related provisions on assets related to the claims at least quarterly and adjusts these provisions to reflect the impacts of negotiations, settlements, rulings, advice of legal counsel and other pertinent information related to the case. Should developments in any of these matters outlined below cause a change in the Company’s determination as to an unfavorable outcome and result in the need to recognize a material provision, or, should any of these matters result in a final adverse judgment or be settled for significant amounts, they could have a material adverse effect on the Company’s results of operations, cash flows, and financial position in the period or periods in which such a change in determination, settlement or judgment occurs.
The Company expenses legal costs relating to its lawsuits, claims and proceedings as incurred.
(a) On May 15, 2006, the Company initiated arbitration against Three-Dimensional Media Group, Ltd. (“3DMG”) before the International Centre for Dispute Resolution in New York (the “ICDR”), alleging breaches of the license and consulting agreements between the Company and 3DMG. On June 15, 2006, 3DMG filed an answer denying any breaches and asserting counterclaims that the Company breached the parties’ license agreement. On June 21, 2007, the ICDR unanimously denied 3DMG’s Motion for Summary Judgment filed on April 11, 2007 concerning the Company’s claims and 3DMG’s counterclaims. The proceeding was suspended on May 4, 2009 due to failure of 3DMG to pay fees associated with the proceeding. The proceeding was further suspended on October 11, 2010 pending resolution of re-examination proceedings involving one of 3DMG’s patents. Following a status conference on April 27, 2016 before the ICDR, the ICDR granted 3DMG leave to amend its answer and counterclaims, and subsequently lifted the stay in this matter. In its amended counterclaims, 3DMG seeks damages for alleged unpaid royalties, damages and other fees under the license and consulting agreements, and the Panel has permitted 3DMG to advance new damage theories. The ICDR held the first phase of a final hearing during the week of July 10, 2017, and the final hearing occurred during the week of October 16, 2017. The parties submitted final briefs in December 2017, and the Panel has scheduled closing oral arguments for March 2018. The Company believes that the amount of loss suffered in connection with the amended counterclaims would not have a material impact on the financial position or results of operations of the Company, although no assurance can be given with respect to the ultimate outcome of the arbitration. The minimum amount in the range has been used to measure the amount to be accrued for this loss contingency in accordance with FASB ASC Topic 450.
(b) In January 2004, the Company and IMAX Theatre Services Ltd., a subsidiary of the Company, commenced an arbitration seeking damages before the International Court of Arbitration of the International Chamber of Commerce (the “ICC”) with respect to the breach by Electronic Media Limited (“EML”) of its December 2000 agreement with the Company. In June 2004, the Company commenced a related arbitration before the ICC against EML’s affiliate, E-City Entertainment (I) PVT Limited (“E-City”). On March 27, 2008, the arbitration panel issued a final award in favor of the Company in the amount of $11.3 million, consisting of past and future rents owed to the Company, plus interest and costs, as well as an additional $2,512 each day in interest from October 1, 2007 until the date the award is paid. In July 2008, E-City commenced a proceeding in Mumbai, India seeking an order that the ICC award may not be recognized in India and on June 10, 2013, the Bombay High Court ruled that it had jurisdiction over the proceeding filed by E-City. The Company appealed that ruling to the Supreme Court of India, and on March 10, 2017, the Supreme Court set aside the Bombay High Court’s judgement and dismissed E-City’s petition. On March 29, 2017, the Company filed an Execution Application in the Bombay High Court seeking to enforce the ICC award against E-City and several related parties. That matter is currently pending. The Company has also taken steps to enforce the ICC final award outside of India. In December 2011, the Ontario Superior Court of Justice issued an order recognizing the final award and requiring E-City to pay the Company $30,000 to cover the costs of the application, and in October 2015, the New York Supreme Court recognized the Canadian judgment and entered it as a New York judgment. The Company intends to continue pursuing its rights and seeking to enforce the award, although no assurances can be given with respect to the ultimate outcome.
(c) In March 2013, IMAX (Shanghai) Multimedia Technology Co., Ltd. (“IMAX Shanghai”), the Company’s majority-owned subsidiary in China, received notice from the Shanghai office of the General Administration of Customs (“Customs Authority”) that it had been selected for a customs audit (the “Audit”). In the course of the Audit, the Customs Authority discovered the underpayment by IMAX Shanghai of the freight and insurance portion of the customs duties and taxes applicable to the importation of certain IMAX theater systems during the period from October 2011 through March 2013. Though IMAX Shanghai’s importation agent accepted responsibility for the error giving rise to the underpayment, the matter was transferred first to the Anti-Smuggling Bureau (the “ASB”) of the Customs Authority and then to the Third Division of Shanghai People’s Procuratorate for further review. During the year ended December 31, 2017, at the request of the ASB, IMAX Shanghai paid approximately $0.15 million to the ASB to satisfy the amount owing as a result of the underpayment. Given that the amount of the underpayment exceeds RMB 200,000 (the applicable ASB threshold), the Company has been advised that the matter may be treated as a criminal rather than as an administrative matter. During
101
Table of Contents
the year ended December 31, 2017, IMAX Shanghai recorded an estimate of $0.3 million in respect of fines that it believes are likely to result from the matter. IMAX Shanghai has been advised that the range of potential penalties is between three and five times the underpayment depending on whether the matter is assessed as criminal or administrative; however, the actual amount of any fines or other penalties remains unknown and the Company cautions that these actual fines or other penalties maybe be greater or less than the amount accrued or the expected range.
(d) On November 11, 2013, Giencourt Investments, S.A. (“Giencourt”) initiated arbitration before the International Centre for Dispute Resolution in Miami, Florida, based on alleged breaches by the Company of its theater agreement and related license agreement with Giencourt. An arbitration hearing for witness testimony was held during the week of December 14, 2015. At the hearing, Giencourt’s expert identified monetary damages of up to approximately $10.4 million, which Giencourt sought to recover from the Company. The Company asserted a counterclaim against Giencourt for breach of contract and sought to recover lost profits in excess of $24.0 million under the agreements. Subsequently, in December 2015, Giencourt made a motion to the panel seeking to enforce a purported settlement of the matter based on negotiations between Giencourt and the Company. The panel held a final hearing with closing arguments in October 2016. On February 7, 2017, the panel issued a Partial Final Award and on July 21, 2017, the panel issued a Final Award (collectively, the “Award”), which held that the parties had reached a binding settlement, and therefore the panel did not reach the merits of the dispute. The Company strongly disputes that discussions about a potential resolution of this matter amounted to an enforceable settlement. In October 2017, the Company filed a petition to vacate the arbitration award in the United States Court for the Southern District of Florida on various grounds, including that the panel exceeded its jurisdiction. At this time, the Company is unable to determine the amounts that it may owe pursuant to the Award, or the timing of any such payments, and therefore no assurances can be given with respect to the ultimate outcome of the matter.
(e) In addition to the matters described above, the Company is currently involved in other legal proceedings or governmental inquiries which, in the opinion of the Company’s management, will not materially affect the Company’s financial position or future operating results, although no assurance can be given with respect to the ultimate outcome of any such proceedings.
(f) In the normal course of business, the Company enters into agreements that may contain features that meet the definition of a guarantee. The Guarantees Topic of the FASB ASC defines a guarantee to be a contract (including an indemnity) that contingently requires the Company to make payments (either in cash, financial instruments, other assets, shares of its stock or provision of services) to a third party based on (a) changes in an underlying interest rate, foreign exchange rate, equity or commodity instrument, index or other variable, that is related to an asset, a liability or an equity security of the counterparty, (b) failure of another party to perform under an obligating agreement or (c) failure of another third party to pay its indebtedness when due.
Financial Guarantees
The Company has provided no significant financial guarantees to third parties.
Product Warranties
The Company’s accrual for product warranties, that was recorded as part of accrued and other liabilities in the consolidated balance sheets is $0.1 million and less than $0.1 million as at December 31, 2017 and 2016, respectively.
Director/Officer Indemnifications
The Company’s General By-law contains an indemnification of its directors/officers, former directors/officers and persons who have acted at its request to be a director/officer of an entity in which the Company is a shareholder or creditor, to indemnify them, to the extent permitted by the Canada Business Corporations Act, against expenses (including legal fees), judgments, fines and any amount actually and reasonably incurred by them in connection with any action, suit or proceeding in which the directors and/or officers are sued as a result of their service, if they acted honestly and in good faith with a view to the best interests of the Company. The nature of the indemnification prevents the Company from making a reasonable estimate of the maximum potential amount it could be required to pay to counterparties. The Company has purchased directors’ and officers’ liability insurance. No amount has been accrued in the consolidated balance sheet as at December 31, 2017 and December 31, 2016 with respect to this indemnity.
102
Table of Contents
Other Indemnification Agreements
In the normal course of the Company’s operations, the Company provides indemnifications to counterparties in transactions such as: theater system lease and sale agreements and the supervision of installation or servicing of the theater systems; film production, exhibition and distribution agreements; real property lease agreements; and employment agreements. These indemnification agreements require the Company to compensate the counterparties for costs incurred as a result of litigation claims that may be suffered by the counterparty as a consequence of the transaction or the Company’s breach or non-performance under these agreements. While the terms of these indemnification agreements vary based upon the contract, they normally extend for the life of the agreements. A small number of agreements do not provide for any limit on the maximum potential amount of indemnification; however, virtually all of the Company’s system lease and sale agreements limit such maximum potential liability to the purchase price of the system. The fact that the maximum potential amount of indemnification required by the Company is not specified in some cases prevents the Company from making a reasonable estimate of the maximum potential amount it could be required to pay to counterparties. Historically, the Company has not made any significant payments under such indemnifications and no amounts have been accrued in the consolidated financial statements with respect to the contingent aspect of these indemnities.
14. Capital Stock
(a) Authorized
Common Shares
The authorized capital of the Company consists of an unlimited number of common shares. The following is a summary of the rights, privileges, restrictions and conditions of the common shares.
The holders of common shares are entitled to receive dividends if, as and when declared by the directors of the Company, subject to the rights of the holders of any other class of shares of the Company entitled to receive dividends in priority to the common shares.
The holders of the common shares are entitled to one vote for each common share held at all meetings of the shareholders.
(b) Changes during the Year
During the year, the Company settled common shares pursuant to the exercise of stock options for cash proceeds and vesting of RSUs. The settlement of common shares can be either settled through newly issued common shares from treasury or through the purchase of common shares in the open market by the IMAX Long-Term Incentive Plan trustee. The following table summarizes the settlement of stock option and RSU transactions during the year:
| Years Ended December 31, | ||||||||||||
| 2017 | 2016 | 2015 | ||||||||||
| Stock options |
||||||||||||
| Issued from treasury |
405,229 | 347,814 | 1,659,643 | |||||||||
| Plan trustee purchases |
263,112 | 170,204 | 102,032 | |||||||||
|
|
|
|
|
|
|
|||||||
| Total stock options exercised |
668,341 | 518,018 | 1,761,675 | |||||||||
|
|
|
|
|
|
|
|||||||
| Cash proceeds on stock option exercises |
$ | 14,652 | $ | 11,431 | $ | 35,609 | ||||||
|
|
|
|
|
|
|
|||||||
| RSUs |
||||||||||||
| Issued from treasury |
7,127 | 54,159 | 25,551 | |||||||||
| Plan trustee purchases |
422,022 | 394,423 | 167,469 | |||||||||
| Shares withheld for tax withholdings |
27,630 | 18,336 | 14,351 | |||||||||
|
|
|
|
|
|
|
|||||||
| Total RSUs vested |
456,779 | 466,918 | 207,371 | |||||||||
|
|
|
|
|
|
|
|||||||
103
Table of Contents
(c) Stock-Based Compensation
The Company issues stock-based compensation to eligible employees, directors, and consultants under the IMAX Corporation Amended and Restated Long-Term Incentive Plan (the “IMAX LTIP”) and the China Long-Term Incentive Plan (the “China LTIP”) as summarized below.
The IMAX LTIP is the Company’s governing document and awards to employees, directors, and consultants under this plan may consist of stock options, RSUs and other awards. Stock options are no longer granted under the Company’s previous approved Stock Option Plan (“SOP”).
A separate stock option plan, the China LTIP, was adopted by a subsidiary of the Company in October 2012.
Compensation costs recorded in the consolidated statements of operations for the Company’s stock-based compensation plans were $23.0 million (2016 — $30.5 million; 2015 — $21.9 million). The following reflects the stock-based compensation expense recorded to the respective financial statement line items:
| 2017 | ||||
| Cost and expenses applicable to revenues |
$ | 1,704 | ||
| Selling, general and administrative expenses |
20,393 | |||
| Research and development |
556 | |||
| Exit costs, restructuring charges and associated impairments |
357 | |||
|
|
|
|||
| $ | 23,010 | |||
|
|
|
|||
As at December 31, 2017, the Company has reserved a total of 10,781,936 (December 31, 2016 — 12,012,572) common shares for future issuance under the SOP and IMAX LTIP. Of the common shares reserved for issuance, there are options in respect of 5,082,100 (December 31, 2016 — 5,190,542) common shares and RSUs in respect of 995,329 (December 31, 2016 — 1,124,180) common shares outstanding at December 31, 2017. At December 31, 2017 options in respect of 3,913,088 (December 31, 2016 —4,001,078) common shares were vested and exercisable.
Stock Option Plan
The Company’s policy is to issue new common shares from treasury or shares purchased in the open market to satisfy stock options which are exercised.
The Company utilizes a Binomial Model to determine the fair value of stock-based payment awards. The fair value determined by the Binomial Model is affected by the Company’s stock price as well as assumptions regarding a number of highly complex and subjective variables. These variables include, but are not limited to, the Company’s expected stock price volatility over the term of the awards, and employee stock option exercise behaviors. The Binomial Model also considers the expected exercise multiple which is the multiple of exercise price to grant price at which exercises are expected to occur on average. Option-pricing models were developed for use in estimating the value of traded options that have no vesting or hedging restrictions and are fully transferable. Because the Company’s employee stock options have certain characteristics that are significantly different from traded options, and because changes in the subjective assumptions can materially affect the estimated value, in management’s opinion, the Binomial Model best provides a fair measure of the fair value of the Company’s employee stock options.
All awards of stock options are made at fair market value of the Company’s common shares on the date of grant. The fair market value of a common share on a given date means the higher of the closing price of a common share on the grant date (or the most recent trading date if the grant date is not a trading date) on the New York Stock Exchange (“NYSE”) or such national exchange as may be designated by the Company’s Board of Directors (the “Fair Market Value”). The stock options vest within 5 years and expire 10 years or less from the date granted. The SOP and IMAX LTIP provide for double-trigger accelerated vesting in the event of a change in control, as defined in each plan.
The Company recorded the following expenses related to stock option grants issued to employees and directors in the IMAX LTIP and SOP plans.
104
Table of Contents
| Years Ended December 31, | ||||||||||||
| 2017 | 2016 | 2015 | ||||||||||
| Stock option expense |
$ | 4,462 | $ | 12,795 | $ | 10,710 | ||||||
An income tax benefit is recorded in the consolidated statement of operations of $1.0 million for the 2017 stock option expenses and $3.8 million for the year ended December 31, 2016, respectively.
Total stock-based compensation expense related to non-vested employee stock options not yet recognized at December 31, 2017 are as follows:
| Years Ended December 31, | ||||||||||||
| 2017 | 2016 | 2015 | ||||||||||
| Expense related to non-vested employee stock options not yet recognized |
$ | 7,441 | $ | 5,894 | $ | 12,575 | ||||||
The weighted average period over which the awards are expected to be recognized are as follows:
| Years Ended December 31, | ||||||||||||
| 2017 | 2016 | 2015 | ||||||||||
| Weighted average period awards are expected to be recognized (in years) |
2.3 | 2.3 | 1.7 | |||||||||
The weighted average fair value of all stock options granted to employees and directors at the measurement date and the assumptions used to estimate the average fair value of the stock option are as follow:
| 2017 | 2016 | 2015 | ||||||||||
| Weighted average fair value per share |
$ | 8.31 | $ | 8.16 | $ | 8.07 | ||||||
| Average risk-free interest rate |
2.34 | % | 1.67 | % | 1.97 | % | ||||||
| Expected option life (in years) |
4.71 - 5.83 | 4.44 - 5.24 | 3.55 - 5.76 | |||||||||
| Expected volatility |
30 | % | 30 | % | 30 | % | ||||||
| Dividend yield |
0 | % | 0 | % | 0 | % | ||||||
Stock options to Non-Employees
There were no common share options issued to non-employees in 2017, 2016 or 2015. The following table summarizes certain information about the outstanding stock options related to non-employees:
| Years Ended December 31, | ||||||||||||
| 2017 | 2016 | 2015 | ||||||||||
| Weighted average exercise price per share of outstanding stock options |
$ | — | $ | 29.64 | $ | 26.79 | ||||||
| Number of outstanding stock options |
— | 17,000 | 38,750 | |||||||||
| Weighted average exercise price per share of exercisable stock options |
$ | — | $ | 30.10 | $ | 26.34 | ||||||
| Number of exercisable stock options |
— | 15,200 | 21,525 | |||||||||
| Aggregate intrinsic value of vested stock options |
$ | — | $ | 123 | $ | 198 | ||||||
In 2017, the Company recorded a charge of less than $0.1 million (2016 — less than $0.1 million; 2015 — $0.1 million) to selling, general and administrative expenses related to the non-employee stock options. There were no accrued liabilities related to non-employee stock options as at December 31, 2017 (December 31, 2016 — less than $0.1 million).
105
Table of Contents
China Long-Term Incentive Plan (“China LTIP”)
The China LTIP was adopted by IMAX China Holding, Inc. (“IMAX China”), a subsidiary of the Company, in October 2012. Each stock option (“China Option”), RSU or cash settled share-based payment (“CSSBP”) issued under the China LTIP represents an opportunity to participate economically in the future growth and value creation of IMAX China. Prior to the initial public offering of IMAX China on October 8, 2015 (the “IMAX China IPO”), the China Options and CSSBPs issued by IMAX China operated in tandem with options granted to certain employees of IMAX China under the Company’s SOP and the IMAX LTIP (“Tandem Options”).
During 2015, no Tandem Options were granted in conjunction with China Options or CSSBPs. Immediately prior to the IMAX China IPO, there were 186,446 outstanding and unvested Tandem Options issued under the Company’s SOP and IMAX LTIP with a weighted average exercise price of $23.70 per share. The Tandem Options had a maximum contractual life of 7 years. The total fair value of the Tandem Options granted with respect to the China LTIP was $1.9 million. The Company was recognizing this expense over a 5-year period.
Pursuant to their terms, upon the occurrence of a qualified initial public offering, the 186,446 Tandem Options issued would forfeit immediately and the related charge would be reversed. As a result of the IMAX China IPO on October 8, 2015, the 186,446 Tandem Options with an average price of $23.70 per share were forfeited immediately. The Company recorded a recovery of $0.6 million in 2015 (2014 — $0.3 million expense) related to the forfeiture of Tandem Options issued under the Company’s SOP and IMAX LTIP.
The Company subsequently recognized an immediate charge related to the vesting of China Options and certain CSSBPs for China employees. The total fair value of the China Options and CSSBP awards granted with respect to the China LTIP was $3.9 million and $2.1 million, respectively. During the fourth quarter of 2015, a charge of $2.1 million and $1.4 million was recorded relating to the China Options and CSSBPs, respectively. The remaining charge was recognized over the related requisite period. The CSSBPs represent the right to receive cash payments in an amount equal to a certain percentage of the excess of the total equity value of IMAX China based on the per share price in the IMAX China IPO over the strike price of the CSSBPs. The CSSBPs were issued in conjunction with the China LTIP, with similar terms and conditions as the China Options. The CSSBP awards are accounted as liability awards, however the fair value of the liability is fixed at the time of the initial public offering. During 2017, the remaining balance of the CSSBPs vested and were settled in cash for $0.6 million (2016 — $0.5 million).
In connection with the IMAX China IPO and in accordance with the China LTIP, IMAX China adopted a post-IPO share option plan and a post-IPO restricted stock unit plan. Pursuant to these plans, IMAX China has issued additional China Options and China LTIP Restricted Share Units (“China RSUs”).
The following table summarizes the expense related to China Options, China RSUs, CSSBPs and any accrued liability related to CSSBPs:
| Years Ended December 31, | ||||||||||||
| 2017 | 2016 | 2015 | ||||||||||
| Expense |
||||||||||||
| China Options |
$ | 1,034 | $ | 971 | $ | 2,136 | ||||||
| China RSUs |
1,124 | 518 | — | |||||||||
| CSSBPs |
353 | 429 | 1,357 | |||||||||
| CSSBPs liability |
$ | — | $ | 289 | $ | 395 | ||||||
106
Table of Contents
Stock Option Summary
The following table summarizes certain information in respect of option activity under the SOP and IMAX LTIP:
| Weighted Average Exercise | ||||||||||||||||||||||||
| Number of Shares | Price Per Share | |||||||||||||||||||||||
| 2017 | 2016 | 2015 | 2017 | 2016 | 2015 | |||||||||||||||||||
| Options outstanding, beginning of year |
5,190,542 | 4,805,244 | 5,925,660 | $ | 28.35 | $ | 27.03 | $ | 24.24 | |||||||||||||||
| Granted |
854,764 | 984,452 | 873,929 | 30.07 | 31.49 | 31.59 | ||||||||||||||||||
| Exercised |
(668,341 | ) | (518,018 | ) | (1,761,675 | ) | 21.92 | 22.07 | 20.21 | |||||||||||||||
| Forfeited |
(108,551 | ) | (66,903 | ) | (232,670 | ) | 32.42 | 29.28 | 24.60 | |||||||||||||||
| Expired |
(89,958 | ) | — | — | 32.29 | — | — | |||||||||||||||||
| Cancelled |
(96,356 | ) | (14,233 | ) | — | 29.28 | 24.82 | — | ||||||||||||||||
|
|
|
|
|
|
|
|||||||||||||||||||
| Options outstanding, end of year |
5,082,100 | 5,190,542 | 4,805,244 | 29.31 | 28.35 | 27.03 | ||||||||||||||||||
|
|
|
|
|
|
|
|||||||||||||||||||
| Options exercisable, end of year |
3,913,088 | 4,001,078 | 2,800,723 | 28.96 | 27.79 | 25.83 | ||||||||||||||||||
|
|
|
|
|
|
|
|||||||||||||||||||
As at December 31, 2017, 5,082,100 options included both fully vested and unvested options with a weighted average exercise price of $29.31, aggregate intrinsic value of $0.5 million and weighted average remaining contractual life of 4.7 years. As at December 31, 2017, options that are exercisable have an intrinsic value of $0.3 million and a weighted average remaining contractual life of 4.3 years. The intrinsic value of options exercised in 2017 was $6.8 million (2016 — $5.4 million; 2015 — $29.8 million).
Restricted Share Units
RSUs have been granted to employees, consultants and directors under the IMAX LTIP. Each RSU represents a contingent right to receive one common share and is the economic equivalent of one common share. The grant date fair value of each RSU is equal to the share price of the Company’s stock at the grant date. The Company recorded the following expenses related to RSU grants issued to employees and directors in the plan:
| Years Ended December 31, | ||||||||||||
| 2017 | 2016 | 2015 | ||||||||||
| RSU expenses |
$ | 16,033 | $ | 15,809 | $ | 8,197 | ||||||
The Company’s actual tax benefits realized for the tax deductions related to the vesting of RSUs was $3.6 million for the year ended December 31, 2017 (2016 — $4.6 million; 2015 — $0.4 million).
The Company did not issue any RSU grants to advisors or strategic partners of the Company for the year ended December 31, 2017. The Company did not record any expense for the years ended December 31, 2017 and 2016. An expense of less than $0.1 million was recorded in 2015 related to RSU grants issued to certain advisors and strategic partners of the Company.
Total stock-based compensation expense related to non-vested RSUs not yet recognized and the weighted average period over which the awards are expected to be recognized are as follow:
| Years Ended December 31, | ||||||||||||
| 2017 | 2016 | 2015 | ||||||||||
| Expense related to non-vested RSUs not yet recognized |
$ | 22,440 | $ | 29,050 | $ | 24,399 | ||||||
| Weighted average period awards are expected to be recognized (in years) |
2.1 | 2.4 | 3.0 | |||||||||
107
Table of Contents
The following table summarizes certain information in respect of RSU activity under the IMAX LTIP:
| Number of Awards | Weighted Average Grant Date Fair Value Per Share | |||||||||||||||||||||||
| 2017 | 2016 | 2015 | 2017 | 2016 | 2015 | |||||||||||||||||||
| RSUs outstanding, beginning of year |
1,124,180 | 973,637 | 595,834 | $ | 33.01 | $ | 32.27 | $ | 27.13 | |||||||||||||||
| Granted |
463,010 | 664,278 | 605,349 | 30.47 | 32.29 | 36.04 | ||||||||||||||||||
| Vested and settled |
(456,779 | ) | (466,918 | ) | (207,371 | ) | 31.66 | 30.63 | 28.81 | |||||||||||||||
| Forfeited |
(135,082 | ) | (46,817 | ) | (20,175 | ) | 32.03 | 31.16 | 29.27 | |||||||||||||||
|
|
|
|
|
|
|
|||||||||||||||||||
| RSUs outstanding, end of year |
995,329 | 1,124,180 | 973,637 | 32.68 | 33.01 | 32.27 | ||||||||||||||||||
|
|
|
|
|
|
|
|||||||||||||||||||
Historically, RSUs granted under the IMAX LTIP have vested between immediately and four years from the grant date. In connection with the amendment and restatement of the IMAX LTIP at the Company’s annual and special meeting of the shareholders on June 6, 2016, the IMAX LTIP plan was amended to impose a minimum one-year vesting period on future RSU grants, with a carve-out for 300,000 RSUs that may vest on a shorter schedule. Vesting of the RSUs is subject to continued employment or service with the Company. The following table summarizes the number of RSUs issued from the carve-out balance:
| Opening, June 6, 2016 |
300,000 | |||
| Issued during 2016 |
(39,726 | ) | ||
|
|
|
|||
| Outstanding, December 31, 2016 |
260,274 | |||
| Issued during 2017 |
(46,613 | ) | ||
|
|
|
|||
| Outstanding, December 31, 2017 |
213,661 | |||
|
|
|
Issuer Purchases of Equity Securities
In 2017, the Company repurchased 1,736,150 (2016 — 3,849,222) common shares at an average price of $26.57 per share (2016 — $30.25 per share). The repurchases in 2017 exhausted the remaining allowance of $46.1 million under the previously announced $200 million share repurchase program. The average carrying value of the stock retired was deducted from common stock and the remaining excess over the average carrying value of stock was charged to accumulated deficit. Since the inception of this program, the Company has repurchased 6,697,406 common shares at an average price of $29.86 per share.
On June 12, 2017, the Company announced that its Board of Directors approved a new $200.0 million share repurchase program for shares of the Company’s common stock. The share purchase program expires on June 30, 2020. The repurchases may be made either in the open market or through private transactions, subject to market conditions, applicable legal requirements and other relevant factors. The Company has no obligation to repurchase shares and the share repurchase program may be suspended or discontinued by the Company at any time. There were no share repurchases of shares under the new share repurchase program in 2017.
The total number of shares purchased during the year ended December 31, 2017 and 2016 does not include any shares purchased in the administration of employee share-based compensation plans (which amounted to 825,692 (2016 – 630,720) common shares, at an average price of $30.23 (2016 – $31.52) per share).
As at December 31, 2017, the IMAX LTIP trustee held 206,651 shares purchased for $5.1 million in the open market to be issued upon the settlement of RSUs and stock options. The shares held with the trustee are recorded at cost and are reported as a reduction against capital stock on the consolidated balance sheet.
108
Table of Contents
| (d) | Net income per share |
Reconciliations of the numerator and denominator of the basic and diluted per-share computations are comprised of the following:
| Years Ended December 31, | ||||||||||||
| 2017 | 2016 | 2015 | ||||||||||
| Net income attributable to common shareholders |
$ | 2,344 | $ | 28,788 | $ | 55,844 | ||||||
| Less: Accretion charges associated with redeemable common stock |
— | — | (769 | ) | ||||||||
|
|
|
|
|
|
|
|||||||
| Net income applicable to common shareholders |
$ | 2,344 | $ | 28,788 | $ | 55,075 | ||||||
|
|
|
|
|
|
|
|||||||
| Weighted average number of common shares (000’s): |
||||||||||||
| Issued and outstanding, beginning of period |
66,160 | 69,673 | 68,988 | |||||||||
| Weighted average number of shares (repurchased) issued during the period, net |
(780 | ) | (2,098 | ) | 538 | |||||||
|
|
|
|
|
|
|
|||||||
| Weighted average number of shares used in computing basic earnings per share |
65,380 | 67,575 | 69,526 | |||||||||
| Assumed exercise of stock options and RSUs, net of shares assumed repurchased |
160 | 688 | 1,532 | |||||||||
|
|
|
|
|
|
|
|||||||
| Weighted average number of shares used in computing diluted earnings per share |
65,540 | 68,263 | 71,058 | |||||||||
|
|
|
|
|
|
|
|||||||
The calculation of diluted earnings per share exclude 4,993,014 (2016 — 2,814,907) shares that are issuable upon exercise of 579,808 (2016 — 377,048) RSUs and 4,413,206 (2016 — 2,437,859) stock options for the years ended December 31, 2017 and 2016, as the impact of these exercises would be antidilutive.
15. Consolidated Statements of Operations Supplemental Information
(a) Other Revenues
The Company enters into theater system arrangements with customers that typically contain customer payment obligations prior to the scheduled installation of the theater systems. During the period of time between signing and theater system installation, certain customers each year are unable to, or elect not to, proceed with the theater system installation for a number of reasons, including business considerations, or the inability to obtain certain consents, approvals or financing. Once the determination is made that the customer will not proceed with installation, the customer and/or the Company may terminate the arrangement by default or by entering into a consensual buyout. In these situations, the parties are released from their future obligations under the arrangement, and the initial payments that the customer previously made to the Company are typically not refunded and are recognized as Other Revenues. In addition, the Company enters into agreements with customers to terminate their obligations for additional theater system configurations, which were in the Company’s backlog. Other revenues from settlement arrangements were $nil, $1.3 million and $0.1 million in 2017, 2016 and 2015, respectively.
(b) Foreign Exchange
Included in selling, general and administrative expenses for the year ended December 31, 2017 is $1.0 million for a net foreign exchange gain related to the translation of foreign currency denominated monetary assets and liabilities as compared to a net loss of $0.9 million and a net loss of $2.4 million for the year ended December 31, 2016 and 2015, respectively. See note 19(d) for additional information.
(c) Collaborative Arrangements
Joint Revenue Sharing Arrangements
In a joint revenue sharing arrangement, the Company receives a portion of a theater’s box-office and concession revenues, and in some cases a small upfront or initial payment, in exchange for placing a theater system at the theater operator’s venue. Under joint revenue sharing arrangements, the customer has the ability and the right to operate the hardware components or direct others to operate them in a manner determined by the customer. The Company’s joint revenue sharing arrangements are typically non-cancellable for 10 years or longer with renewal provisions. Title to equipment under joint revenue sharing arrangements generally does not transfer to the customer. The Company’s joint revenue sharing arrangements do not contain a guarantee of residual value at the end of the term. The customer is required to pay for executory costs such as insurance and taxes and is required to pay the Company for maintenance and extended warranty throughout the term. The customer is responsible for obtaining insurance coverage for the theater systems
109
Table of Contents
commencing on the date specified in the arrangement’s shipping terms and ending on the date the theater systems are delivered back to the Company.
The Company has signed joint revenue sharing agreements with 47 exhibitors (2016 — 48) for a total of 1,084 theater systems (2016 — 995), of which 747 theaters (2016 — 640) were operating as at December 31, 2017. The terms of the Company’s joint revenue sharing arrangements are similar in nature, rights and obligations. The accounting policy for the Company’s joint revenue sharing arrangements is disclosed in note 2(m).
Amounts attributable to transactions arising between the Company and its customers under joint revenue sharing arrangements are included in Equipment and Product Sales and Rentals revenue and for the year ended December 31, 2017 amounted to $80.6 million (2016 — $91.4 million; 2015 —$99.1 million).
IMAX DMR
In an IMAX DMR arrangement, the Company transforms conventional motion pictures into the Company’s large screen format, allowing the release of Hollywood content to the global IMAX theater network. In a typical IMAX DMR film arrangement, the Company will absorb its costs for the digital re-mastering and then recoup this cost from a percentage of the box-office receipts of the film, which in recent years has averaged approximately 12.5% outside of Greater China and a lower percentage for certain films within Greater China. The Company does not typically hold distribution rights or the copyright to these films.
In 2017, the majority of IMAX DMR revenue was earned from the exhibition of 60 IMAX DMR films (2016 — 51) throughout the IMAX theater network. The accounting policy for the Company’s IMAX DMR arrangements is disclosed in note 2(m).
Amounts attributable to transactions arising between the Company and its customers under IMAX DMR arrangements are included in Services revenues and for the year ended December 31, 2017 amounted to $108.9 million (2016 —$106.4 million; 2015 —$107.1 million).
Co-Produced Film Arrangements
In certain film arrangements, the Company co-produces a film with a third party whereby the third party retains the copyright and rights to the film except that the Company obtains exclusive theatrical distribution rights to the film. Under these arrangements, both parties contribute funding to the Company’s wholly-owned company for the production of the film or content and for associated exploitation costs. Clauses in the film arrangements generally provide for the third party to take over the production of the film if the cost of the production exceeds its approved budget or if it appears as though the film will not be delivered on a timely basis.
As at December 31, 2017, the Company has two significant co-produced arrangements which primarily represents the VIE total assets balance of $7.5 million and liabilities balance of $7.2 million and three other co-produced film arrangements, the terms of which are similar. The accounting policies relating to co-produced film arrangements are disclosed in notes 2(a) and 2(m).
In 2017, amounts totaling $1.2 million (2016 — $1.4 million; 2015 — $1.5 million) attributable to transactions between the Company and other parties involved in the production of the films have been included in cost and expenses applicable to revenues-services.
In 2016, the Company entered into an arrangement to co-produce television episodic content. Funding was provided to the third party and the third party retains the copyright and rights to the content. The Company obtained exclusive theatrical distribution rights to the first two episodes and a percentage share to all television revenue.
As at December 31, 2017, the Company is participating in one significant co-produced television arrangement. This arrangement is not a VIE.
For the year ended December 31, 2017, revenues of $20.4 million and costs and expenses applicable to revenues of $33.4 million, attributable to this collaborative arrangement have been recorded in Revenue – Services and Costs and expenses applicable to revenues – Services, respectively. Included therein are net revenues attributable to transactions between the Company and other parties involved in the production of the episodic content of $20.1 million.
110
Table of Contents
16. Receivable Provisions, Net of Recoveries
The following table reflects the Company’s receivable provisions net of recoveries recorded in the consolidated statements of operations:
| Years Ended December 31, | ||||||||||||
| 2017 | 2016 | 2015 | ||||||||||
| Accounts receivable provisions, net of recoveries |
$ | 1,967 | $ | 1,029 | $ | 677 | ||||||
| Financing receivable provisions, net of recoveries |
680 | (75 | ) | 75 | ||||||||
|
|
|
|
|
|
|
|||||||
| Receivable provisions, net of recoveries |
$ | 2,647 | $ | 954 | $ | 752 | ||||||
|
|
|
|
|
|
|
|||||||
17. Consolidated Statements of Cash Flows Supplemental Information
| (a) | Changes in other non-cash operating assets and liabilities are comprised of the following: |
| Years Ended December 31, | ||||||||||||
| 2017 | 2016 | 2015 | ||||||||||
| Decrease (increase) in: |
||||||||||||
| Accounts receivable |
$ | (37,807 | ) | $ | (1,414 | ) | $ | (22,521 | ) | |||
| Financing receivables |
(7,253 | ) | (4,627 | ) | (13,628 | ) | ||||||
| Inventories |
10,832 | (3,825 | ) | (21,070 | ) | |||||||
| Prepaid expenses |
(924 | ) | (127 | ) | (1,552 | ) | ||||||
| Other assets, prepaid tax |
— | (5,664 | ) | — | ||||||||
| Other assets |
(457 | ) | (1,038 | ) | (655 | ) | ||||||
| Increase (decrease) in: |
||||||||||||
| Accounts payable |
4,204 | (3,360 | ) | 9,183 | ||||||||
| Accrued and other liabilities |
(642 | ) | 3,914 | (2,057 | ) | |||||||
| Deferred revenue |
22,906 | (14,733 | ) | 16,242 | ||||||||
|
|
|
|
|
|
|
|||||||
| $ | (9,141 | ) | $ | (30,874 | ) | $ | (36,058 | ) | ||||
|
|
|
|
|
|
|
|||||||
| (b) | Cash payments made on account of: |
| Years Ended December 31, | ||||||||||||
| 2017 | 2016 | 2015 | ||||||||||
| Income taxes |
$ | 22,829 | $ | 24,640 | $ | 22,798 | ||||||
|
|
|
|
|
|
|
|||||||
| Interest |
$ | 826 | $ | 721 | $ | 411 | ||||||
|
|
|
|
|
|
|
|||||||
| (c) | Depreciation and amortization are comprised of the following: |
| Years Ended December 31, | ||||||||||||
| 2017 | 2016 | 2015 | ||||||||||
| Film assets(1) |
$ | 31,031 | $ | 16,324 | $ | 16,357 | ||||||
| Property, plant and equipment |
||||||||||||
| Joint revenue sharing arrangements |
18,112 | 15,840 | 13,663 | |||||||||
| Other property, plant and equipment |
11,803 | 9,692 | 7,698 | |||||||||
| Other intangible assets |
4,319 | 3,235 | 3,285 | |||||||||
| Other assets |
980 | 862 | 784 | |||||||||
| Deferred financing costs |
562 | 532 | 1,016 | |||||||||
|
|
|
|
|
|
|
|||||||
| $ | 66,807 | $ | 46,485 | $ | 42,803 | |||||||
|
|
|
|
|
|
|
|||||||
| (1) | Included in film asset amortization is a charge of $1.5 million (2016 — $0.2 million; 2015 — $0.9 million) relating to changes in estimates based on the ultimate recoverability of future films. |
111
Table of Contents
| (d) | Write-downs, net of recoveries, are comprised of the following: |
| Years Ended December 31, | ||||||||||||
| 2017 | 2016 | 2015 | ||||||||||
| Asset impairments |
||||||||||||
| Property, plant and equipment |
$ | 3,966 | $ | 223 | $ | 405 | ||||||
| Impairment of investments |
1,225 | 194 | 425 | |||||||||
| Film assets |
17,363 | 3,020 | — | |||||||||
| Other assets |
2,533 | — | — | |||||||||
| Other charges (recoveries) |
||||||||||||
| Accounts receivables |
1,967 | 1,029 | 677 | |||||||||
| Financing receivables |
680 | (75 | ) | 75 | ||||||||
| Inventories(1) |
500 | 458 | 572 | |||||||||
| Other assets |
47 | — | — | |||||||||
| Property, plant and equipment(2) |
1,224 | 885 | 1,485 | |||||||||
| Other intangible assets |
63 | 206 | 86 | |||||||||
|
|
|
|
|
|
|
|||||||
| $ | 29,568 | $ | 5,940 | $ | 3,725 | |||||||
|
|
|
|
|
|
|
|||||||
| Inventory charges |
||||||||||||
| Recorded in costs and expenses applicable to revenues - equipment & product sales |
$ | 500 | $ | 227 | $ | 537 | ||||||
| Recorded in costs and expenses applicable to revenues - services |
— | 231 | 35 | |||||||||
|
|
|
|
|
|
|
|||||||
| $ | 500 | $ | 458 | $ | 572 | |||||||
|
|
|
|
|
|
|
|||||||
| (1) | In 2017, the Company recorded a charge of $1.2 million (2016 — $0.3 million; 2015 — $0.4 million) reflecting property, plant and equipment that were no longer in use. In 2016, the Company also recorded a charge of $0.6 million (2015 — $0.6 million) in cost of sales applicable to Equipment and product sales upon the upgrade of xenon-based digital systems under operating lease arrangements to laser-based digital systems under sales or sales-type lease arrangements. No such charge was recorded in the year ended December 31, 2017. In addition, in 2015, the Company recorded a charge of $0.5 million in cost of sales applicable to Rentals upon the upgrade of certain xenon-based digital systems to laser-based digital systems operating under joint revenue sharing arrangements. No such charge was recorded in 2017 and 2016. |
| (e) | Significant non-cash investing and financing activities are comprised of the following: |
| Years Ended December 31, | ||||||||
| 2017 | 2016 | |||||||
| Net accruals related to: |
||||||||
| Purchases of property, plant and equipment |
$ | 871 | $ | (1,229 | ) | |||
| Investment in joint revenue sharing arrangements |
69 | 346 | ||||||
| Acquisition of other intangible assets |
37 | (121 | ) | |||||
|
|
|
|
|
|||||
| $ | 977 | $ | (1,004 | ) | ||||
|
|
|
|
|
|||||
112
Table of Contents
18. Segmented Information
Management, including the Company’s Chief Executive Officer (“CEO”) who is the Company’s Chief Operating Decision Maker (as defined in the Segment Reporting Topic of the FASB ASC), assesses segment performance based on segment revenues, gross margins and film performance. Selling, general and administrative expenses, research and development costs, amortization of intangibles, receivables provisions (recoveries), write-downs net of recoveries, interest income, interest expense and tax (provision) recovery are not allocated to the segments.
In the first quarter of 2017, modifications were made to the CEO’s reporting package to move away from the Company’s historical two primary groups – IMAX Theater Systems and Film – and to better align with the way in which the CODM manages the business. The new structure is expected to assist users of the financial statements with an enhanced understanding of how management views the business, and the drivers behind the Company’s performance. Certain of the prior period’s figures have been reclassified to conform to the current period’s presentation.
The Company has identified new business as an additional reportable segment in the first quarter of 2017. The Company now has the following eight reportable segments: IMAX systems; IMAX DMR; joint revenue sharing arrangements; theater system maintenance; film distribution; film post-production; new business; and other.
The Company’s reportable segments are now organized under four primary groups identified by nature of product sold or service provided: (1) Network Business, representing variable revenue generated by box office results and which includes the reportable segment of IMAX DMR and contingent rent from the joint revenue sharing arrangements and IMAX systems segments; (2) Theater Business, representing revenue generated by the sale and installation of theater systems and maintenance services, primarily related to the IMAX Systems and Theater System Maintenance reportable segments, and also includes fixed hybrid revenues and upfront installation costs from the joint revenue sharing arrangements segment and after-market sales of projection system parts and 3D glasses from the other segment; (3) New Business, which includes content licensing and distribution fees associated with the Company’s original content investments, virtual reality initiatives, IMAX Home Entertainment, and other business initiatives that are in the development and/or start-up phase, and (4) Other; which includes the film post-production and distribution segments and certain IMAX theaters that the Company owns and operates, camera rentals and other miscellaneous items from the other segment. The Company is presenting information at a disaggregated level to provide more relevant information to readers, as permitted by the standard. The accounting policies of the segments are the same as those described in note 2.
Transactions between the film production and IMAX DMR segment and the film post-production segment are valued at exchange value. Inter-segment profits are eliminated upon consolidation, as well as for the disclosures below.
113
Table of Contents
(a) Operating Segments
| Years Ended December 31, | ||||||||||||
| 2017 | 2016 | 2015 | ||||||||||
| Revenue(1) |
||||||||||||
| Network business |
||||||||||||
| IMAX DMR |
$ | 108,853 | $ | 106,403 | $ | 107,089 | ||||||
| Joint revenue sharing arrangements – contingent rent |
70,444 | 73,500 | 81,396 | |||||||||
| IMAX systems – contingent rent |
3,890 | 4,644 | 3,900 | |||||||||
|
|
|
|
|
|
|
|||||||
| 183,187 | 184,547 | 192,385 | ||||||||||
|
|
|
|
|
|
|
|||||||
| Theater business |
||||||||||||
| IMAX systems |
90,347 | 100,884 | 98,226 | |||||||||
| Joint revenue sharing arrangements – fixed fees |
10,118 | 17,913 | 17,724 | |||||||||
| Theater system maintenance |
45,383 | 40,430 | 36,944 | |||||||||
| Other theater |
9,145 | 10,888 | 10,482 | |||||||||
|
|
|
|
|
|
|
|||||||
| 154,993 | 170,115 | 163,376 | ||||||||||
|
|
|
|
|
|
|
|||||||
| New business (2) |
24,522 | 626 | — | |||||||||
|
|
|
|
|
|
|
|||||||
| Other |
||||||||||||
| Film post-production |
10,382 | 8,873 | 7,069 | |||||||||
| Film distribution |
2,790 | 5,254 | 3,876 | |||||||||
| Other |
4,893 | 7,919 | 7,099 | |||||||||
|
|
|
|
|
|
|
|||||||
| 18,065 | 22,046 | 18,044 | ||||||||||
|
|
|
|
|
|
|
|||||||
| Total |
$380,767 | $377,334 | $373,805 | |||||||||
|
|
|
|
|
|
|
|||||||
| Gross Margin |
||||||||||||
| Network business |
||||||||||||
| IMAX DMR (4) |
$ | 71,789 | $ | 69,196 | $ | 77,645 | ||||||
| Joint revenue sharing arrangements – contingent rent (4) |
47,337 | 54,705 | 63,500 | |||||||||
| IMAX systems – contingent rent |
3,890 | 4,644 | 3,900 | |||||||||
|
|
|
|
|
|
|
|||||||
| 123,016 | 128,545 | 145,045 | ||||||||||
|
|
|
|
|
|
|
|||||||
| Theater business |
||||||||||||
| IMAX systems (3) (4) |
57,734 | 55,448 | 55,265 | |||||||||
| Joint revenue sharing arrangements – fixed fees (4) |
2,349 | 5,132 | 4,873 | |||||||||
| Theater system maintenance (3) |
18,275 | 13,660 | 12,701 | |||||||||
| Other theater |
1,965 | 1,930 | 2,105 | |||||||||
|
|
|
|
|
|
|
|||||||
| 80,323 | 76,170 | 74,944 | ||||||||||
|
|
|
|
|
|
|
|||||||
| New business (2) |
(16,176 | ) | (2,199 | ) | — | |||||||
|
|
|
|
|
|
|
|||||||
| Other |
||||||||||||
| Film post-production |
4,791 | 3,729 | 1,381 | |||||||||
| Film distribution (4) |
(5,797 | ) | (3,909 | ) | (259 | ) | ||||||
| Other |
(911 | ) | 342 | (1,823 | ) | |||||||
|
|
|
|
|
|
|
|||||||
| (1,917 | ) | 162 | (701 | ) | ||||||||
|
|
|
|
|
|
|
|||||||
| Total |
$ | 185,246 | $ | 202,678 | $ | 219,288 | ||||||
|
|
|
|
|
|
|
|||||||
114
Table of Contents
| Years Ended December 31, | ||||||||||||
| 2017 | 2016 | 2015 | ||||||||||
| Depreciation and amortization |
||||||||||||
| Network business |
||||||||||||
| IMAX DMR |
$ | 15,779 | $ | 15,028 | $ | 14,330 | ||||||
| Joint revenue sharing arrangements - contingent rent |
19,092 | 16,724 | 14,443 | |||||||||
| Theater business |
||||||||||||
| IMAX systems |
3,551 | 4,165 | 5,685 | |||||||||
| Theater system maintenance |
173 | 72 | 72 | |||||||||
| New business (2) |
15,365 | 629 | 11 | |||||||||
| Other |
||||||||||||
| Film post-production |
1,845 | 2,769 | 1,465 | |||||||||
| Film distribution |
2,128 | 1,444 | 2,129 | |||||||||
| Other |
911 | 938 | 693 | |||||||||
| Corporate and other non-segment specific assets |
7,963 | 4,716 | 3,975 | |||||||||
|
|
|
|
|
|
|
|||||||
| Total |
$ | 66,807 | $ | 46,485 | $ | 42,803 | ||||||
|
|
|
|
|
|
|
|||||||
| Years Ended December 31, | ||||||||||||
| 2017 | 2016 | 2015 | ||||||||||
| Asset impairments and write-downs, net of recoveries |
||||||||||||
| Network business |
||||||||||||
| Joint revenue sharing arrangements - contingent rent |
$ | 944 | $ | 266 | $ | 528 | ||||||
| Theater business |
||||||||||||
| IMAX systems |
2,930 | 916 | 2,298 | |||||||||
| Theater system maintenance |
— | 1,002 | 277 | |||||||||
| New business (2) |
16,400 | — | — | |||||||||
| Other |
||||||||||||
| Film post-production |
— | 223 | — | |||||||||
| Film distribution |
5,865 | 3,020 | — | |||||||||
| Corporate and other non-segment specific assets |
3,429 | 513 | 622 | |||||||||
|
|
|
|
|
|
|
|||||||
| Total |
$ | 29,568 | $ | 5,940 | $ | 3,725 | ||||||
|
|
|
|
|
|
|
|||||||
115
Table of Contents
| Years Ended December 31, | ||||||||||||
| 2017 | 2016 | 2015 | ||||||||||
| Purchase of property, plant and equipment |
||||||||||||
| Network business |
||||||||||||
| IMAX DMR |
$ | 518 | $ | 1,121 | $ | 1,350 | ||||||
| Joint revenue sharing arrangements - contingent rent |
42,634 | 42,910 | 28,474 | |||||||||
| Theater business |
||||||||||||
| IMAX systems |
4,537 | 3,170 | 8,846 | |||||||||
| Theater system maintenance |
206 | 481 | 555 | |||||||||
| New business |
4,487 | 5,070 | 1,737 | |||||||||
| Other |
||||||||||||
| Film post-production |
810 | 1,746 | 16,337 | |||||||||
| Film distribution |
— | 21 | 830 | |||||||||
| Other |
367 | 804 | 249 | |||||||||
| Corporate and other non-segment specific assets |
13,218 | 2,865 | 13,353 | |||||||||
|
|
|
|
|
|
|
|||||||
| Total |
$ | 66,777 | $ | 58,188 | $ | 71,731 | ||||||
|
|
|
|
|
|
|
|||||||
| Years Ended December 31 | ||||||||
| 2017 | 2016 | |||||||
| Assets |
||||||||
| Network business |
||||||||
| IMAX DMR |
$ | 42,067 | $ | 39,688 | ||||
| Joint revenue sharing arrangements - contingent rent |
216,285 | 194,384 | ||||||
| IMAX systems - contingent rent |
457 | 573 | ||||||
| Theater business |
||||||||
| IMAX systems |
224,424 | 216,931 | ||||||
| Joint revenue sharing arrangements - fixed fees |
7,997 | 10,174 | ||||||
| Theater system maintenance |
27,256 | 28,763 | ||||||
| Other theater |
1,564 | 429 | ||||||
| New business |
27,450 | 13,661 | ||||||
| Other |
||||||||
| Film post-production |
34,480 | 35,865 | ||||||
| Film distribution |
9,444 | 21,059 | ||||||
| Other |
7,597 | 9,350 | ||||||
| Corporate and other non-segment specific assets |
267,591 | 286,457 | ||||||
|
|
|
|
|
|||||
| Total |
$ | 866,612 | $ | 857,334 | ||||
|
|
|
|
|
|||||
| (1) | The Company’s largest customer represents 13.2% of total revenues as at December 31, 2017 (2016 — 13.5%; 2015 — 16.0%). |
| (2) | The performance of the new business segment for the year ended December 31, 2017, was mostly driven by the investment in, and the theatrical premiere of the television series “Marvel’s Inhumans”. Episodic revenue, cost of revenue and negative gross margin recognized for the year ended December 31, 2017, were $20.4 million, $33.4 million and $13.0 million, respectively. The loss recognized in 2017 includes an $11.7 million impairment and amortization of $13.3 million. |
| (3) | In 2017, the Company recorded a charge of $0.5 million (2016 — $0.5 million; 2015 — $0.6 million, respectively) in costs and expenses applicable to revenues, primarily for its film-based projector inventories. Specifically, IMAX systems includes an |
116
Table of Contents
| inventory charge of $0.5 million (2016 — $0.2 million; 2015 — $0.5 million). Theater system maintenance includes inventory write-downs of $nil (2016 — $0.2 million; 2015 — less than $0.1 million). |
| (4) | IMAX DMR segment margins include marketing costs of $15.4 million, $17.5 million and $13.3 million in 2017, 2016 and 2015, respectively. Joint revenue sharing arrangements segment margins include advertising, marketing, and commission costs of $4.5 million, $4.1 million and $4.3 million in 2017, 2016 and 2015, respectively. IMAX systems segment margins include marketing and commission costs of $3.5 million, $3.0 million and $3.0 million in 2017, 2016 and 2015, respectively. Film distribution segment margins include a marketing recovery of $0.7 million, $2.2 million and recovery of $0.1 million in 2017, 2016 and 2015, respectively. |
| (5) | Goodwill is allocated on a relative fair market value basis to the IMAX systems segment, theater system maintenance segment and joint revenue sharing segment. There has been no change in the allocation of goodwill from the prior year. |
(b) Geographic Information
Revenue by geographic area is based on the location of the customer. Revenue related to IMAX DMR is presented based upon the geographic location of the theaters that exhibit the re-mastered films. IMAX DMR revenue is generated through contractual relationships with studios and other third parties and these may not be in the same geographical location as the theater.
| Years Ended December 31, | ||||||||||||
| 2017 | 2016 | 2015 | ||||||||||
| Revenue |
||||||||||||
| United States |
$ | 135,153 | $ | 129,844 | $ | 136,017 | ||||||
| Greater China |
126,474 | 118,532 | 110,591 | |||||||||
| Canada |
12,812 | 12,822 | 11,665 | |||||||||
| Western Europe |
32,765 | 36,286 | 39,569 | |||||||||
| Asia (excluding Greater China) |
35,896 | 35,283 | 38,143 | |||||||||
| Russia & the CIS |
11,054 | 14,908 | 12,412 | |||||||||
| Latin America |
10,963 | 12,191 | 10,179 | |||||||||
| Rest of the World |
15,650 | 17,468 | 15,229 | |||||||||
|
|
|
|
|
|
|
|||||||
| Total |
$ | 380,767 | $ | 377,334 | $ | 373,805 | ||||||
|
|
|
|
|
|
|
|||||||
No single country in the Rest of the World, Western Europe, Latin America and Asia (excluding Greater China) classifications comprise more than 10% of total revenue.
| As at December 31 | ||||||||
| 2017 | 2016 | |||||||
| Property, plant and equipment |
||||||||
| United States |
$ | 105,594 | $ | 104,083 | ||||
| Greater China |
84,619 | 69,751 | ||||||
| Canada |
51,862 | 39,467 | ||||||
| Western Europe |
19,480 | 19,308 | ||||||
| Asia (excluding Greater China) |
8,793 | 8,460 | ||||||
| Rest of the World |
6,433 | 4,346 | ||||||
|
|
|
|
|
|||||
| Total |
$ | 276,781 | $ | 245,415 | ||||
|
|
|
|
|
|||||
117
Table of Contents
19. Financial Instruments
(a) Financial Instruments
The Company maintains cash with various major financial institutions. The Company’s cash is invested with highly rated financial institutions.
The Company’s accounts receivables and financing receivables are subject to credit risk. The Company’s accounts receivable and financing receivables are concentrated with the theater exhibition industry and film entertainment industry. To minimize the Company’s credit risk, the Company retains title to underlying theater systems leased, performs initial and ongoing credit evaluations of its customers and makes ongoing provisions for its estimate of potentially uncollectible amounts. The Company believes it has adequately provided for related exposures surrounding receivables and contractual commitments.
(b) Fair Value Measurements
The carrying values of the Company’s cash and cash equivalents, accounts receivable, accounts payable and accrued liabilities due within one-year approximate fair values due to the short-term maturity of these instruments. The Company’s other financial instruments at December 31, are comprised of the following:
| As at December 31, 2017 | As at December 31, 2016 | |||||||||||||||
| Carrying Amount |
Estimated Fair Value |
Carrying Amount |
Estimated Fair Value |
|||||||||||||
| Cash and cash equivalents |
$ | 158,725 | $ | 158,725 | $ | 204,759 | $ | 204,759 | ||||||||
| Net financed sales receivable |
$ | 122,259 | $ | 122,918 | $ | 114,041 | $ | 115,014 | ||||||||
| Net investment in sales-type leases |
$ | 7,235 | $ | 7,409 | $ | 8,084 | $ | 8,372 | ||||||||
| Convertible loan receivable |
$ | 1,500 | $ | 1,500 | $ | 1,000 | $ | 1,000 | ||||||||
| Available-for-sale investment |
$ | 2,016 | $ | 2,016 | $ | 1,000 | $ | 1,007 | ||||||||
| Foreign exchange contracts — designated forwards |
$ | 1,425 | $ | 1,425 | $ | (296 | ) | $ | (296 | ) | ||||||
| Borrowings under the Playa Vista Loan |
$ | (25,667 | ) | $ | (25,667 | ) | $ | (27,667 | ) | $ | (27,667 | ) | ||||
Cash and cash equivalents are comprised of cash and interest-bearing investments with original maturity dates to the Company of 90 days or less. Cash and cash equivalents are recorded at cost, which approximates fair value (Level 1 input in accordance with the Fair Value Measurements Topic of the FASB ASC hierarchy) as at December 31, 2017 and 2016, respectively.
The estimated fair values of the net financed sales receivable and net investment in sales-type leases are estimated based on discounting future cash flows at currently available interest rates with comparable terms (Level 2 input in accordance with the Fair Value Measurements Topic of the FASB ASC hierarchy) as at December 31, 2017 and 2016, respectively.
The fair value of the Company’s available-for-sale investment is determined using quoted prices in active markets (Level 2 input in accordance with the Fair Value Measurements Topic of the FASB ASC hierarchy) as at December 31, 2017 and 2016, respectively.
The estimated fair value of the Company’s convertible loan receivable is based on discounting future cash flow at currently available interest rates with comparable terms as at December 31, 2017 and 2016, respectively (Level 2 input in accordance with the Fair Value Measurements Topic of the FASB ASC hierarchy).
The fair value of foreign currency derivatives are determined using quoted prices in active markets (Level 2 input in accordance with the Fair Value Measurements Topic of the FASB ASC hierarchy) as at December 31, 2017 and 2016, respectively. These identical instruments are traded on a closed exchange.
The carrying value of borrowings under the Playa Vista Loan approximates fair value as the interest rates offered under the loan are close to December 31, 2017 market rates for the Company for debt of the same remaining maturities (Level 2 input in accordance with the Fair Value Measurements Topic of the FASB ASC hierarchy) as at December 31, 2017.
There were no significant transfers between Level 1 and Level 2 during the year ended December 31, 2017 or 2016. When a determination is made to classify an asset or liability within Level 3, the determination is based upon the significance of the unobservable inputs to the overall fair value measurement.
118
Table of Contents
There were no transfers in or out of the Company’s Level 3 assets during the year ended December 31, 2017.
(c) Financing Receivables
The Company’s net investment in leases and its net financed sale receivables are subject to the disclosure requirements of ASC 310 “Receivables”. Due to differing risk profiles of its net investment in leases and its net financed sales receivables, the Company views its net investment in leases and its net financed sale receivables as separate classes of financing receivables. The Company does not aggregate financing receivables to assess impairment.
The Company monitors the credit quality of each customer on a frequent basis through collections and aging analyses. The Company also holds meetings monthly in order to identify credit concerns and whether a change in credit quality classification is required for the customer. A customer may improve in their credit quality classification once a substantial payment is made on overdue balances or the customer has agreed to a payment plan with the Company and payments have commenced in accordance to the payment plan. The change in credit quality indicator is dependent upon management approval.
The Company classifies its customers into four categories to indicate the credit quality worthiness of its financing receivables for internal purposes only:
Good standing — Theater continues to be in good standing with the Company as the client’s payments and reporting are up-to-date.
Credit Watch — Theater operator has begun to demonstrate a delay in payments, and has been placed on the Company’s credit watch list for continued monitoring, but active communication continues with the Company. Depending on the size of outstanding balance, length of time in arrears and other factors, transactions may need to be approved by management. These financing receivables are considered to be in better condition than those receivables related to theaters in the “Pre-approved transactions” category, but not in as good of condition as those receivables in “Good standing.”
Pre-approved transactions only — Theater operator is demonstrating a delay in payments with little or no communication with the Company. All service or shipments to the theater must be reviewed and approved by management. These financing receivables are considered to be in better condition than those receivables related to theaters in the “All transactions suspended” category, but not in as good of condition as those receivables in “Credit Watch.” Depending on the individual facts and circumstances of each customer, finance income recognition may be suspended if management believes the receivable to be impaired.
All transactions suspended — Theater is severely delinquent, non-responsive or not negotiating in good faith with the Company. Once a theater is classified as “All transactions suspended” the theater is placed on nonaccrual status and all revenue recognitions related to the theater are stopped.
119
Table of Contents
The following table discloses the recorded investment in financing receivables by credit quality indicator:
| As at December 31, 2017 | As at December 31, 2016 | |||||||||||||||||||||||
| Minimum Lease Payments |
Financed Sales Receivables |
Total | Minimum Lease Payments |
Financed Sales Receivables |
Total | |||||||||||||||||||
| In good standing |
$ | 6,265 | $ | 118,060 | $ | 124,325 | $ | 7,741 | $ | 111,568 | $ | 119,309 | ||||||||||||
| Credit Watch |
568 | 2,926 | 3,494 | — | 1,514 | 1,514 | ||||||||||||||||||
| Pre-approved transactions |
557 | 1,003 | 1,560 | — | 842 | 842 | ||||||||||||||||||
| Transactions suspended |
— | 1,192 | 1,192 | 1,015 | 611 | 1,626 | ||||||||||||||||||
|
|
|
|
|
|
|
|
|
|
|
|
|
|||||||||||||
| $ | 7,390 | $ | 123,181 | $ | 130,571 | $ | 8,756 | $ | 114,535 | $ | 123,291 | |||||||||||||
|
|
|
|
|
|
|
|
|
|
|
|
|
|||||||||||||
While recognition of finance income is suspended, payments received by a customer are applied against the outstanding balance owed. If payments are sufficient to cover any unreserved receivables, a recovery of provision taken on the billed amount, if applicable, is recorded to the extent of the residual cash received. Once the collectability issues are resolved and the customer has returned to being in good standing, the Company will resume recognition of finance income.
The Company’s investment in financing receivables on nonaccrual status is as follows:
| As at December 31, 2017 | As at December 31, 2016 | |||||||||||||||
| Recorded Investment |
Related Allowance |
Recorded Investment |
Related Allowance |
|||||||||||||
| Net investment in leases |
$ | — | $ | — | $ | 1,015 | $ | (672 | ) | |||||||
| Net financed sales receivables |
1,192 | (922 | ) | 611 | (494 | ) | ||||||||||
|
|
|
|
|
|
|
|
|
|||||||||
| Total |
$ | 1,192 | $ | (922 | ) | $ | 1,626 | $ | (1,166 | ) | ||||||
|
|
|
|
|
|
|
|
|
|||||||||
The Company considers financing receivables with aging between 60-89 days as indications of theaters with potential collection concerns. The Company will begin to focus its review on these financing receivables and increase its discussions internally and with the theater regarding payment status. Once a theater’s aging exceeds 90 days, the Company’s policy is to review and assess collectability on the theater’s past due accounts. Over 90 days past due is used by the Company as an indicator of potential impairment as invoices up to 90 days outstanding could be considered reasonable due to the time required for dispute resolution or for the provision of further information or supporting documentation to the customer.
120
Table of Contents
The Company’s aged financing receivables are as follows:
| As at December 31, 2017 | ||||||||||||||||||||||||||||||||
| Accrued and Current |
30-89 Days | 90+ Days | Billed Financing Receivables |
Related Unbilled Recorded Investment |
Total Recorded Investment |
Related Allowances |
Recorded Investment Net of Allowances |
|||||||||||||||||||||||||
| Net investment in leases |
$ | 103 | $ | 74 | $ | 376 | $ | 553 | $ | 6,837 | $ | 7,390 | $ | (155 | ) | $ | 7,235 | |||||||||||||||
| Net financed sales receivables |
3,285 | 1,399 | 3,763 | 8,447 | 114,734 | 123,181 | (922 | ) | 122,259 | |||||||||||||||||||||||
|
|
|
|
|
|
|
|
|
|
|
|
|
|
|
|
|
|||||||||||||||||
| Total |
$ | 3,388 | $ | 1,473 | $ | 4,139 | $ | 9,000 | $ | 121,571 | $ | 130,571 | $ | (1,077 | ) | $ | 129,494 | |||||||||||||||
|
|
|
|
|
|
|
|
|
|
|
|
|
|
|
|
|
|||||||||||||||||
| As at December 31, 2016 | ||||||||||||||||||||||||||||||||
| Accrued and Current |
30-89 Days | 90+ Days | Billed Financing Receivables |
Related Unbilled Recorded Investment |
Total Recorded Investment |
Related Allowances |
Recorded Investment Net of Allowances |
|||||||||||||||||||||||||
| Net investment in leases |
$ | 28 | $ | 159 | $ | 781 | $ | 968 | $ | 7,788 | $ | 8,756 | $ | (672 | ) | $ | 8,084 | |||||||||||||||
| Net financed sales receivables |
2,393 | 1,724 | 2,368 | 6,485 | 108,050 | 114,535 | (494 | ) | 114,041 | |||||||||||||||||||||||
|
|
|
|
|
|
|
|
|
|
|
|
|
|
|
|
|
|||||||||||||||||
| Total |
$ | 2,421 | $ | 1,883 | $ | 3,149 | $ | 7,453 | $ | 115,838 | $ | 123,291 | $ | (1,166 | ) | $ | 122,125 | |||||||||||||||
|
|
|
|
|
|
|
|
|
|
|
|
|
|
|
|
|
|||||||||||||||||
The Company’s recorded investment in past due financing receivables for which the Company continues to accrue finance income is as follows:
| As at December 31, 2017 | ||||||||||||||||||||||||||||
| Accrued and Current |
30-89 Days | 90+ Days | Billed Financing Receivables |
Related Unbilled Recorded Investment |
Related Allowance |
Recorded Investment Past Due and Accruing |
||||||||||||||||||||||
| Net investment in leases |
$ | 68 | $ | 70 | $ | 376 | $ | 514 | $ | 2,287 | $ | — | $ | 2,801 | ||||||||||||||
| Net financed sales receivables |
1,165 | 743 | 3,363 | 5,271 | 27,430 | — | 32,701 | |||||||||||||||||||||
|
|
|
|
|
|
|
|
|
|
|
|
|
|
|
|||||||||||||||
| Total |
$ | 1,233 | $ | 813 | $ | 3,739 | $ | 5,785 | $ | 29,717 | $ | — | $ | 35,502 | ||||||||||||||
|
|
|
|
|
|
|
|
|
|
|
|
|
|
|
|||||||||||||||
| As at December 31, 2016 | ||||||||||||||||||||||||||||
| Accrued and Current |
30-89 Days | 90+ Days | Billed Financing Receivables |
Related Unbilled Recorded Investment |
Related Allowance |
Recorded Investment Past Due and Accruing |
||||||||||||||||||||||
| Net investment in leases |
$ | — | $ | 54 | $ | 244 | $ | 298 | $ | 1,646 | $ | — | $ | 1,944 | ||||||||||||||
| Net financed sales receivables |
284 | 634 | 1,854 | 2,772 | 20,147 | — | 22,919 | |||||||||||||||||||||
|
|
|
|
|
|
|
|
|
|
|
|
|
|
|
|||||||||||||||
| Total |
$ | 284 | $ | 688 | $ | 2,098 | $ | 3,070 | $ | 21,793 | $ | — | $ | 24,863 | ||||||||||||||
|
|
|
|
|
|
|
|
|
|
|
|
|
|
|
|||||||||||||||
121
Table of Contents
The Company considers financing receivables to be impaired when it believes it to be probable that it will not recover the full amount of principal or interest owing under the arrangement. The Company uses its knowledge of the industry and economic trends, as well as its prior experiences to determine the amount recoverable for impaired financing receivables. The following table discloses information regarding the Company’s impaired financing receivables:
| Impaired Financing Receivables For the Year Ended December 31, 2017 |
||||||||||||||||||||
| Recorded Investment |
Unpaid Principal |
Related Allowance |
Average Recorded Investment |
Interest Income Recognized |
||||||||||||||||
| With an allowance recorded: |
||||||||||||||||||||
| Net investment in leases |
$ | — | $ | — | $ | — | $ | — | $ | — | ||||||||||
| Net financed sales receivables |
1,050 | 142 | (922 | ) | 684 | 89 | ||||||||||||||
| With no related allowance recorded: |
||||||||||||||||||||
| Net investment in leases |
— | — | — | — | — | |||||||||||||||
| Net financed sales receivables |
— | — | — | — | — | |||||||||||||||
| Total: |
||||||||||||||||||||
|
|
|
|
|
|
|
|
|
|
|
|||||||||||
| Net investment in leases |
$ | — | $ | — | $ | — | $ | — | $ | — | ||||||||||
|
|
|
|
|
|
|
|
|
|
|
|||||||||||
| Net financed sales receivables |
$ | 1,050 | $ | 142 | $ | (922 | ) | $ | 684 | $ | 89 | |||||||||
|
|
|
|
|
|
|
|
|
|
|
|||||||||||
| Impaired Financing Receivables For the Year Ended December 31, 2016 |
||||||||||||||||||||
| Recorded Investment |
Unpaid Principal |
Related Allowance |
Average Recorded Investment |
Interest Income Recognized |
||||||||||||||||
| With an allowance recorded: |
||||||||||||||||||||
| Net investment in leases |
$ | — | $ | — | $ | — | $ | — | $ | — | ||||||||||
| Net financed sales receivables |
525 | 75 | (494 | ) | 637 | — | ||||||||||||||
| With no related allowance recorded: |
||||||||||||||||||||
| Net investment in leases |
— | — | — | — | — | |||||||||||||||
| Net financed sales receivables |
— | — | — | — | — | |||||||||||||||
| Total: |
||||||||||||||||||||
|
|
|
|
|
|
|
|
|
|
|
|||||||||||
| Net investment in leases |
$ | — | $ | — | $ | — | $ | — | $ | — | ||||||||||
|
|
|
|
|
|
|
|
|
|
|
|||||||||||
| Net financed sales receivables |
$ | 525 | $ | 75 | $ | (494 | ) | $ | 637 | $ | — | |||||||||
|
|
|
|
|
|
|
|
|
|
|
|||||||||||
122
Table of Contents
The Company’s activity in the allowance for credit losses for the period and the Company’s recorded investment in financing receivables is as follows:
| Year Ended December 31, 2017 | ||||||||
| Net Investment in Leases |
Net Financed Sales Receivables |
|||||||
| Allowance for credit losses: |
||||||||
| Beginning balance |
$ | 672 | $ | 494 | ||||
| Charge-offs |
(517 | ) | (67 | ) | ||||
| Recoveries |
— | — | ||||||
| Provision |
— | 495 | ||||||
|
|
|
|
|
|||||
| Ending balance |
$ | 155 | $ | 922 | ||||
|
|
|
|
|
|||||
| Ending balance: individually evaluated for impairment |
$ | 155 | $ | 922 | ||||
|
|
|
|
|
|||||
| Financing receivables: |
||||||||
| Ending balance: individually evaluated for impairment |
$ | 7,390 | $ | 123,181 | ||||
|
|
|
|
|
|||||
| Year Ended December 31, 2016 | ||||||||
| Net Investment in Leases |
Net Financed Sales Receivables |
|||||||
| Allowance for credit losses: |
||||||||
| Beginning balance |
$ | 672 | $ | 568 | ||||
| Charge-offs |
— | — | ||||||
| Recoveries |
— | (74 | ) | |||||
| Provision |
— | — | ||||||
|
|
|
|
|
|||||
| Ending balance |
$ | 672 | $ | 494 | ||||
|
|
|
|
|
|||||
| Ending balance: individually evaluated for impairment |
$ | 672 | $ | 494 | ||||
|
|
|
|
|
|||||
| Financing receivables: |
||||||||
| Ending balance: individually evaluated for impairment |
$ | 8,756 | $ | 114,535 | ||||
|
|
|
|
|
|||||
(d) Foreign Exchange Risk Management
The Company is exposed to market risk from changes in foreign currency rates. A majority portion of the Company’s revenues is denominated in U.S. dollars while a substantial portion of its costs and expenses is denominated in Canadian dollars. A portion of the net U.S. dollar cash flows of the Company is periodically converted to Canadian dollars to fund Canadian dollar expenses through the spot market. In China and Japan, the Company has ongoing operating expenses related to its operations in Chinese Renminbi and Japanese yen, respectively. Net cash flows are converted to and from U.S. dollars through the spot market. The Company also has cash receipts under leases denominated in Chinese Renminbi, Japanese yen, Canadian dollars and Euros which are converted to U.S. dollars through the spot market. In addition, because IMAX films generate box-office in 75 different countries, unfavourable exchange rates between applicable local currencies, and the U.S. dollar affect the Company’s reported gross box-office and revenues, further impacting the Company’s results of operations. The Company’s policy is to not use any financial instruments for trading or other speculative purposes.
The Company entered into a series of foreign currency forward contracts to manage the Company’s risks associated with the volatility of foreign currencies. Certain of these foreign currency forward contracts met the criteria required for hedge accounting under the Derivatives and Hedging Topic of the FASB ASC at inception, and continue to meet hedge effectiveness tests at December 31, 2017 (the “Foreign Currency Hedges”), with settlement dates throughout 2018 and 2019. Foreign currency derivatives are recognized and
123
Table of Contents
measured in the balance sheet at fair value. Changes in the fair value (gains or losses) are recognized in the consolidated statement of operations except for derivatives designated and qualifying as foreign currency hedging instruments. For foreign currency hedging instruments, the effective portion of the gain or loss in a hedge of a forecasted transaction is reported in other comprehensive income and reclassified to the consolidated statement of operations when the forecasted transaction occurs. Any ineffective portion is recognized immediately in the consolidated statement of operations. The Company currently does not hold any derivatives which are not designated as hedging instruments and therefore no gain or loss pertaining to an ineffective portion has been recognized.
The following tabular disclosures reflect the impact that derivative instruments and hedging activities have on the Company’s consolidated financial statements:
Notional value of foreign exchange contracts:
| As at December 31, | ||||||||
| 2017 | 2016 | |||||||
| Derivatives designated as hedging instruments: |
||||||||
| Foreign exchange contracts — Forwards |
$ | 35,170 | $ | 37,825 | ||||
|
|
|
|
|
|||||
Fair value of derivatives in foreign exchange contracts:
| As at December 31, | ||||||||||
| Balance Sheet Location |
2017 | 2016 | ||||||||
| Derivatives designated as hedging instruments: |
||||||||||
| Foreign exchange contracts — Forwards |
Other assets |
$ | 1,447 | $ | 480 | |||||
| Accrued and other liabilities |
(22 | ) | (776 | ) | ||||||
|
|
|
|
|
|||||||
| $ | 1,425 | $ | (296 | ) | ||||||
|
|
|
|
|
|||||||
Derivatives in Foreign Currency Hedging relationships are as follows:
| Years Ended December 31, | ||||||||||||||||
| 2017 | 2016 | 2015 | ||||||||||||||
| Foreign exchange contracts - Forwards |
|
Derivative Gain (Loss) in OCI (Effective Portion) |
$ | 2,545 | $ | 1,049 | $ | (5,881 | ) | |||||||
|
|
|
|
|
|
|
|||||||||||
| $ | 2,545 | $ | 1,049 | $ | (5,881 | ) | ||||||||||
|
|
|
|
|
|
|
|||||||||||
| Location of Derivative Gain (Loss) | ||||||||||||||||
| Reclassified from AOCI | Years Ended December 31, | |||||||||||||||
| into Income (Effective Portion) | 2017 | 2016 | 2015 | |||||||||||||
| Foreign exchange contracts - Forwards |
Selling, general and administrative expenses | $ | 824 | $ | (3,078 | ) | $ | (3,217 | ) | |||||||
|
|
|
|
|
|
|
|||||||||||
| $ | 824 | $ | (3,078 | ) | $ | (3,217 | ) | |||||||||
|
|
|
|
|
|
|
|||||||||||
The Company’s estimated net amount of the existing gains as at December 31, 2017 is $1.2 million, which is expected to be reclassified to earnings within the next twelve months.
124
Table of Contents
(e) Investments in New Business Ventures
The Company accounts for investments in new business ventures using the guidance of the FASB ASC 323 and the FASB ASC 320, as appropriate.
As at December 31, 2017, the equity method of accounting is being utilized for investments with a total carrying value of $nil (December 31, 2016 — $nil). The Company’s accumulated losses in excess of its equity investment were $2.0 million as at December 31, 2017 (December 31, 2016 — $0.5 million), and are classified in Accrued and other liabilities. For the year ended December 31, 2017, gross revenues, cost of revenue and net loss for the investment were $2.5 million, $3.9 million and $2.5 million, respectively (2016 — $0.6 million, $6.8 million, and $6.2 million, respectively). The Company has determined it is not the primary beneficiary of this VIE, and therefore this entity has not been consolidated. In 2016, the Company issued a convertible loan of $1.0 million to this entity with a term of 3 years with an annual effective interest rate of 5.0%. In 2017, the Company issued an additional $0.5 million under this existing convertible loan. The instrument is classified as an available-for-sale investment due to certain features that allow for conversion to common stock in the entity in the event of certain triggers occurring.
In addition, the Company has an investment in preferred stock of another business venture of $1.5 million which meets the criteria for classification as a debt security under the FASB ASC 320 and is recorded at a fair value of $nil at December 31, 2017 (December 31, 2016 — $nil). This investment was classified as an available-for-sale investment.
Furthermore, the Company has an investment of $1.0 million (December 31, 2016 — $1.0 million) in the shares of an exchange traded fund. This investment is also classified as an available-for-sale investment.
For the year ended December 31, 2017, the Company held investments with a total value of $3.5 million in the preferred shares of enterprises which meet the criteria for classification as an equity security under FASB ASC 325, carried at historical cost, net of impairment charges. The carrying value of these equity security investments was $1.0 million at December 31, 2017 (December 31, 2016 — $nil).
The total carrying value of investments in new business ventures at December 31, 2017 and 2016 is $3.5 million and $2.0 million, respectively, and is recorded in Other Assets.
125
Table of Contents
20. Employee’s Pension and Postretirement Benefits
(a) Defined Benefit Plan
The Company has an unfunded U.S. defined benefit pension plan, the SERP, covering Richard L. Gelfond, Chief Executive Officer (“CEO”) of the Company. The SERP provides for a lifetime retirement benefit from age 55 determined as 75% of Mr. Gelfond’s best average 60 consecutive months of earnings over his employment history. The benefits were 50% vested as at July 2000, the SERP initiation date. The vesting percentage increased on a straight-line basis from inception until age 55. The benefits of Mr. Gelfond are 100% vested. Upon a termination for cause, prior to a change of control, Mr. Gelfond shall forfeit any and all benefits to which he may have been entitled, whether or not vested.
Under the terms of the SERP, if Mr. Gelfond’s employment terminated other than for cause (as defined in his employment agreement), he is entitled to receive SERP benefits in the form of a lump sum payment. SERP benefit payments to Mr. Gelfond are subject to a deferral for six months after the termination of his employment, at which time Mr. Gelfond will be entitled to receive interest on the deferred amount credited at the applicable federal rate for short-term obligations. Pursuant to an employment agreement dated November 8, 2016, the term of Mr. Gelfond’s employment was extended through December 31, 2019, although Mr. Gelfond has not informed the Company that he intends to retire at that time. Under the terms of the arrangement, no compensation earned beginning in 2011 is included in calculating his entitlement under the SERP.
The following assumptions were used to determine the obligation and cost of the Company’s SERP at the plan measurement dates:
| As at December 31, | ||||||||||||
| 2017 | 2016 | 2015 | ||||||||||
| Discount rate |
2.22 | % | 2.18 | % | 1.34 | % | ||||||
| Lump sum interest rate: |
||||||||||||
| First 20 years |
2.39 | % | 1.87 | % | 2.82 | % | ||||||
| Thereafter |
2.60 | % | 2.37 | % | 2.95 | % | ||||||
| Cost of living adjustment on benefits |
1.20 | % | 1.20 | % | 1.20 | % | ||||||
The amounts accrued for the SERP are determined as follows:
| Years Ended December 31, | ||||||||
| 2017 | 2016 | |||||||
| Projected benefit obligation: |
||||||||
| Obligation, beginning of year |
$ | 19,580 | $ | 19,478 | ||||
| Interest cost |
427 | 261 | ||||||
| Actuarial gain |
(1,004 | ) | (159 | ) | ||||
|
|
|
|
|
|||||
| Obligation, end of year and unfunded status |
$ | 19,003 | $ | 19,580 | ||||
|
|
|
|
|
|||||
126
Table of Contents
The following table provides disclosure of the pension benefit obligation recorded in the consolidated balance sheets:
| As at December 31, | ||||||||
| 2017 | 2016 | |||||||
| Accrued benefits cost |
$ | (19,003 | ) | $ | (19,580 | ) | ||
| Accumulated other comprehensive loss |
161 | 1,165 | ||||||
|
|
|
|
|
|||||
| Net amount recognized in the consolidated balance sheets |
$ | (18,842 | ) | $ | (18,415 | ) | ||
|
|
|
|
|
|||||
The following table provides disclosure of pension expense for the SERP for the years ended December 31:
| Years ended December 31, | ||||||||||||
| 2017 | 2016 | 2015 | ||||||||||
| Interest cost |
$ | 427 | $ | 261 | $ | 253 | ||||||
|
|
|
|
|
|
|
|||||||
| Pension expense |
$ | 427 | $ | 261 | $ | 253 | ||||||
|
|
|
|
|
|
|
|||||||
The accumulated benefit obligation for the SERP was $19.0 million at December 31, 2017 (2016 — $19.6 million).
The following amounts were included in accumulated other comprehensive income and will be recognized as components of net periodic benefit cost in future periods:
| As at December 31, | ||||||||||||
| 2017 | 2016 | 2015 | ||||||||||
| Unrealized actuarial loss |
$ | 161 | $ | 1,165 | $ | 1,323 | ||||||
|
|
|
|
|
|
|
|||||||
No contributions were made for the SERP during 2017. The Company expects interest costs of $0.4 million to be recognized as a component of net periodic benefit cost in 2018.
The following benefit payments are expected to be made as per the current SERP assumptions and the terms of the SERP in each of the next five years, and in the aggregate:
| 2018 |
$ | — | ||
| 2019 |
— | |||
| 2020 |
20,076 | |||
| 2021 |
— | |||
| 2022 |
— | |||
| Thereafter |
— | |||
|
|
|
|||
| $ | 20,076 | |||
|
|
|
(b) Defined Contribution Pension Plan
The Company also maintains defined contribution pension plans for its employees, including its executive officers. The Company makes contributions to these plans on behalf of employees in an amount up to 5% of their base salary subject to certain prescribed maximums. During 2017, the Company contributed and expensed an aggregate of $1.2 million (2016 — $1.2 million; 2015 — $1.1 million) to its Canadian plan and an aggregate of $0.7 million (2016 — $0.6 million; 2015 — $0.4 million) to its defined contribution employee pension plan under Section 401(k) of the U.S. Internal Revenue Code.
The Company also maintains a deferred compensation plan (the “Retirement Plan”) covering Greg Foster, CEO of IMAX Entertainment and Senior Executive Vice President of the Company. The Company has agreed to make a total contribution of $3.2 million over Mr. Foster’s employment term. The Retirement Plan is subject to a vesting schedule based on continued employment with the Company, such that 25% will vest July 2019; 50% will vest July 2022; 75% will vest July 2025; and Mr. Foster will be 100% vested in July 2027. During the year the Company contributed and expensed an aggregate of $0.7 million (2016 — $0.5 million) to this Retirement Plan. The Company expects to contribute and expense $0.7 million in 2018. As at December 31, 2017, the Company had an unfunded benefit obligation recorded of $1.0 million (December 31, 2016 — $0.5 million).
127
Table of Contents
(c) Postretirement Benefits - Executives
The Company has an unfunded postretirement plan for Messrs. Gelfond and Bradley J. Wechsler, Chairman of the Company’s Board of Directors. The plan provides that the Company will maintain health benefits for Messrs. Gelfond and Wechsler until they become eligible for Medicare and, thereafter, the Company will provide Medicare supplemental coverage as selected by Messrs. Gelfond and Wechsler.
The amounts accrued for the plan are determined as follows:
| As at December 31, | ||||||||
| 2017 | 2016 | |||||||
| Obligation, beginning of year |
$ | 647 | $ | 763 | ||||
| Interest cost |
26 | 31 | ||||||
| Benefits paid |
(21 | ) | (33 | ) | ||||
| Actuarial loss (gain) |
46 | (114 | ) | |||||
|
|
|
|
|
|||||
| Obligation, end of year |
$ | 698 | $ | 647 | ||||
|
|
|
|
|
|||||
The following details the net cost components, all related to continuing operations, and underlying assumptions of postretirement benefits other than pensions:
| Years Ended December 31, | ||||||||||||
| 2017 | 2016 | 2015 | ||||||||||
| Interest cost |
$ | 26 | $ | 31 | $ | 30 | ||||||
| Amortization of actuarial loss |
— | 69 | 135 | |||||||||
|
|
|
|
|
|
|
|||||||
| $ | 26 | $ | 100 | $ | 165 | |||||||
|
|
|
|
|
|
|
|||||||
The following amounts were included in accumulated other comprehensive income and will be recognized as components of net periodic benefit cost in future periods:
| As at December 31, | ||||||||||||
| 2017 | 2016 | 2015 | ||||||||||
| Unrealized actuarial loss (gain) |
$ | 9 | $ | (37 | ) | $ | 146 | |||||
|
|
|
|
|
|
|
|||||||
Weighted average assumptions used to determine the benefit obligation are:
| As at December 31, | ||||||||||||
| 2017 | 2016 | 2015 | ||||||||||
| Discount rate |
3.55 | % | 4.10 | % | 4.20 | % | ||||||
Weighted average assumption used to determine the net postretirement benefit expense are:
| Years Ended December 31, | ||||||||||||
| 2017 | 2016 | 2015 | ||||||||||
| Discount rate |
4.10 | % | 4.20 | % | 3.70 | % | ||||||
128
Table of Contents
The following benefit payments are expected to be made as per the current plan assumptions in each of the next five years:
| 2018 |
$ | 24 | ||
| 2019 |
26 | |||
| 2020 |
33 | |||
| 2021 |
37 | |||
| 2022 |
40 | |||
| Thereafter |
538 | |||
|
|
|
|||
| Total |
$ | 698 | ||
|
|
|
(d) Postretirement Benefits – Canadian Employees
The Company has an unfunded postretirement plan for its Canadian employees upon meeting specific eligibility requirements. The Company will provide eligible participants, upon retirement, with health and welfare benefits.
The amounts accrued for the plan are determined as follows:
| As at December 31, | ||||||||
| 2017 | 2016 | |||||||
| Obligation, beginning of year |
$ | 1,745 | $ | 1,778 | ||||
| Interest cost |
65 | 68 | ||||||
| Benefits paid |
(79 | ) | (88 | ) | ||||
| Actuarial gain |
(171 | ) | (70 | ) | ||||
| Unrealized foreign exchange loss |
118 | 57 | ||||||
|
|
|
|
|
|||||
| Obligation, end of year |
$ | 1,678 | $ | 1,745 | ||||
|
|
|
|
|
|||||
The following details the net cost components, all related to continuing operations, and underlying assumptions of postretirement benefits other than pensions:
| Years Ended December 31, | ||||||||||||
| 2017 | 2016 | 2015 | ||||||||||
| Interest cost |
$ | 65 | $ | 68 | $ | 71 | ||||||
| Service cost |
— | — | 1 | |||||||||
|
|
|
|
|
|
|
|||||||
| $ | 65 | $ | 68 | $ | 72 | |||||||
|
|
|
|
|
|
|
|||||||
The following amounts were included in accumulated other comprehensive income and will be recognized as components of net periodic benefit cost in future periods:
| As at December 31, | ||||||||||||
| 2017 | 2016 | 2015 | ||||||||||
| Unrealized actuarial loss |
$ | 182 | $ | 353 | $ | 423 | ||||||
|
|
|
|
|
|
|
|||||||
The Company expects interest costs of $0.1 million to be recognized as a component of net periodic benefit cost in 2018.
Weighted average assumptions used to determine the benefit obligation are:
| As at December 31, | ||||||||||||
| 2017 | 2016 | 2015 | ||||||||||
| Discount rate |
3.35 | % | 3.65 | % | 3.75 | % | ||||||
129
Table of Contents
Weighted average assumptions used to determine the net postretirement benefit expense are:
| Years Ended December 31, | ||||||||||||
| 2017 | 2016 | 2015 | ||||||||||
| Discount rate |
3.65 | % | 3.75 | % | 3.75 | % | ||||||
The following benefit payments are expected to be made as per the current plan assumptions in each of the next five years:
| 2018 |
$ | 98 | ||
| 2019 |
105 | |||
| 2020 |
111 | |||
| 2021 |
114 | |||
| 2022 |
116 | |||
| Thereafter |
1,134 | |||
|
|
|
|||
| Total |
$ | 1,678 | ||
|
|
|
21. Non-Controlling Interests
(a) IMAX China Non-Controlling Interest
In 2015, IMAX China completed the IMAX China IPO. Following the IMAX China IPO, the Company continues to indirectly own approximately 67.93% of IMAX China, which remains a consolidated subsidiary of the Company.
The following summarizes the movement of the non-controlling interest in temporary equity, in the Company’s subsidiary:
| Balance as at January 1, 2015 |
$ | 40,272 | ||
| Issuance of subsidiary shares to a non-controlling interest |
40,000 | |||
| Share issuance costs from the issuance of subsidiary shares to a non-controlling interest |
(2,000 | ) | ||
| Net income prior to IMAX China IPO |
5,401 | |||
| Other comprehensive income prior to IMAX China IPO |
164 | |||
| Accretion charges associated with redeemable common stock |
769 | |||
| Redemption of redeemable common stock upon qualified IPO |
(84,606 | ) | ||
|
|
|
|||
| Balance as at October 7, 2015 |
$ | — | ||
|
|
|
The following summarizes the movement of the non-controlling interest in shareholders’ equity, in the Company’s subsidiary:
| Balance as at October 8, 2015 |
$ | 84,606 | ||
| Net income after IMAX China IPO |
3,712 | |||
| Other comprehensive income after IMAX China IPO |
252 | |||
| Dividends paid to non-controlling shareholders |
(9,511 | ) | ||
| Reduction in value due to qualified initial public offering |
(29,100 | ) | ||
|
|
|
|||
| Balance as at December 31, 2015 |
$ | 49,959 | ||
| Net income |
11,338 | |||
| Other comprehensive loss, net of tax |
(1,735 | ) | ||
|
|
|
|||
| Balance as at December 31, 2016 |
$ | 59,562 | ||
| Net income |
13,801 | |||
| Other comprehensive income |
1,148 | |||
|
|
|
|||
| Balance as at December 31, 2017 |
$ | 74,511 | ||
|
|
|
130
Table of Contents
(b) Other Non-Controlling Interests
In 2014, the Company announced the creation of the Film Fund to co-finance a portfolio of 10 original large-format films. The Film Fund, which is intended to be capitalized with up to $50.0 million, will finance an ongoing supply of original films that the Company believes will be more exciting and compelling than traditional documentaries. The initial investment in the Film Fund was committed to by a third party in the amount of $25.0 million, with the possibility of contributing additional funds. The Company agreed to contribute $9.0 million to the Film Fund over five years starting in 2014 and sees the Film Fund as a self-perpetuating vehicle designed to generate a continuous, steady flow of high-quality documentary content. As at December 31, 2017, the Film Fund invested $13.4 million toward the development of original films. The related production, financing and distribution agreement includes put and call rights relating to change of control of the rights, title and interest in the co-financed pictures.
In 2016, the Company announced the creation of a VR Fund among the Company, its subsidiary IMAX China and other strategic investors. The VR Fund will help finance the creation of interactive VR content experiences over the next three years for use across all VR platforms, including in the pilot IMAX VR Centers. The VR Fund recently helped finance the production of one interactive VR experience, which debuted exclusively in the pilot IMAX VR Centers in November 2017 before being made available to other VR platforms. As at December 31, 2017, the Company invested $3.0 million toward the development of VR content.
| Balance as at January 1, 2015 |
$ | 3,640 | ||
| Net loss |
(333 | ) | ||
|
|
|
|||
| Balance as at January 1, 2016 |
$ | 3,307 | ||
| Issuance of subsidiary shares to non-controlling interests |
2,479 | |||
| Net loss |
(806 | ) | ||
|
|
|
|||
| Balance as at December 31, 2016 |
$ | 4,980 | ||
| Net loss |
(3,627 | ) | ||
|
|
|
|||
| Balance as at December 31, 2017 |
$ | 1,353 | ||
|
|
|
22. Exit costs, restructuring charges and associated impairments
The Company recognized the following charges in its consolidated statements of operations for the year ended December 31, 2017:
| Restructuring charges |
$ | 9,895 | ||
| Asset impairments |
5,553 | |||
| Costs to exit an operating lease |
726 | |||
|
|
|
|||
| $ | 16,174 | |||
|
|
|
(a) Costs to exit an operating lease
In September 2017, the Company relocated its New York office employees and operations as the existing leased space was not suitable to accommodate all current business needs. As the premises lease is non-cancellable to the end of the term, the Company entered into a sublease arrangement to reduce the expected losses over the remaining term of the lease. Pursuant to FASB ASC 420 “Exit or Disposal Cost Obligations”, the Company has recognized a corporate segment expense of $0.7 million for the year ended December 31, 2017.
131
Table of Contents
(b) Restructuring charges
In June 2017, the Company announced the implementation of a cost reduction plan with the goal of increasing profitability, operating leverage and free cash flow. The cost reduction plan included the exit from certain non-core businesses or initiatives, as well as a one-time reduction in workforce. Restructuring charges are comprised of employee severance costs including benefits and stock-based compensation, costs of consolidating facilities and contract termination costs. Restructuring charges are based upon plans that have been committed to by the Company, but may be refined in subsequent periods. These charges are recognized pursuant to FASB ASC 420. A liability for a cost associated with an exit or disposal activity is recognized and measured at its fair value in the consolidated statement of operations in the period in which the liability is incurred. When estimating the value of facility restructuring activities, assumptions are applied regarding estimated sub-lease payments to be received, which can differ from actual results.
In connection with the Company’s restructuring initiatives, the Company incurred $9.9 million in restructuring charges for the year ended December 31, 2017. A summary of the restructuring and other costs by reporting groups identified by nature of product sold, or service provided as disclosed in note 18 recognized during the year ended December 31, 2017 are as follows:
| Employee Severance and Benefits |
Other Exit Costs |
Total | ||||||||||
| Corporate |
$ | 5,354 | $ | 15 | $ | 5,369 | ||||||
| IMAX DMR |
1,699 | — | 1,699 | |||||||||
| Theater system maintenance |
930 | — | 930 | |||||||||
| New business |
364 | 298 | 662 | |||||||||
| Other |
548 | — | 548 | |||||||||
| IMAX systems |
264 | 282 | 546 | |||||||||
| Joint revenue sharing arrangements |
120 | — | 120 | |||||||||
| Film post-production |
21 | — | 21 | |||||||||
|
|
|
|
|
|
|
|||||||
| $ | 9,300 | $ | 595 | $ | 9,895 | |||||||
|
|
|
|
|
|
|
|||||||
The Company expects to recognize restructuring charges of $0.8 million in 2018.
The following table sets forth a summary of restructuring accrual activities for the year ended December 31, 2017:
| Employee Severance and Benefits |
Other Exit Costs |
Total | ||||||||||
| Balance as at December 31, 2016 |
$ | — | $ | — | $ | — | ||||||
| Restructuring charges |
9,300 | 595 | 9,895 | |||||||||
| Cash payments |
(6,719 | ) | (427 | ) | (7,146 | ) | ||||||
| Other movements |
(360 | ) | (168 | ) | (528 | ) | ||||||
|
|
|
|
|
|
|
|||||||
| Balance as at December 31, 2017 |
$ | 2,221 | $ | — | $ | 2,221 | ||||||
|
|
|
|
|
|
|
|||||||
132
Table of Contents
(c) Associated Impairments
As a result of the cost reduction plan discussed above, the Company recognized costs associated with the retirement of certain long-lived assets pursuant to the FASB ASC 410-20, “Asset retirement and environmental obligations” and ASC 360-10, “Property, plant and equipment”. The following impairments for the year ended December 31, 2017 are a direct result of the exit activities described in (a) above.
| Film assets |
$ | 335 | ||
| Property, plant and equipment |
3,696 | |||
| Other assets |
1,522 | |||
|
|
|
|||
| $ | 5,553 | |||
|
|
|
23. Selected Quarterly Financial Information (Unaudited)
| (in thousands of U.S. dollars, except per share amounts) | 2017 | |||||||||||||||
| Q1 | Q2 | Q3 | Q4 | |||||||||||||
| Revenues |
$ | 68,657 | $ | 87,758 | $ | 98,800 | $ | 125,552 | ||||||||
| Costs and expenses applicable to revenues |
32,886 | 38,299 | 58,932 | 65,404 | ||||||||||||
|
|
|
|
|
|
|
|
|
|||||||||
| Gross margin |
$ | 35,771 | $ | 49,459 | $ | 39,868 | $ | 60,148 | ||||||||
|
|
|
|
|
|
|
|
|
|||||||||
| Net (loss) income |
$ | (887 | ) | $ | 1,809 | $ | 2,898 | $ | 8,698 | |||||||
|
|
|
|
|
|
|
|
|
|||||||||
| Net income (loss) attributable to common shareholders |
$ | 75 | $ | (1,712 | ) | $ | (850 | ) | $ | 4,831 | ||||||
|
|
|
|
|
|
|
|
|
|||||||||
| Net income per share attributable to common shareholders: |
||||||||||||||||
| Net (loss) income per share - basic |
$ | — | $ | (0.03 | ) | $ | (0.01 | ) | $ | 0.08 | ||||||
| Net (loss) income per share - diluted |
$ | — | $ | (0.03 | ) | $ | (0.01 | ) | $ | 0.08 | ||||||
| 2016 | ||||||||||||||||
| Q1 | Q2 | Q3 | Q4 | |||||||||||||
| Revenues |
$ | 92,128 | $ | 91,743 | $ | 86,550 | $ | 106,913 | ||||||||
| Costs and expenses applicable to revenues |
39,952 | 41,466 | 41,651 | 51,587 | ||||||||||||
|
|
|
|
|
|
|
|
|
|||||||||
| Gross margin |
$ | 52,176 | $ | 50,277 | $ | 44,899 | $ | 55,326 | ||||||||
|
|
|
|
|
|
|
|
|
|||||||||
| Net income |
$ | 13,952 | $ | 8,908 | $ | 4,384 | $ | 12,076 | ||||||||
|
|
|
|
|
|
|
|
|
|||||||||
| Net income attributable to common shareholders |
$ | 11,302 | $ | 6,016 | $ | 2,525 | $ | 8,945 | ||||||||
|
|
|
|
|
|
|
|
|
|||||||||
| Net income per share attributable to common shareholders: |
||||||||||||||||
| Net income per share - basic |
$ | 0.16 | $ | 0.09 | $ | 0.04 | $ | 0.14 | ||||||||
| Net income per share - diluted |
$ | 0.16 | $ | 0.09 | $ | 0.04 | $ | 0.13 | ||||||||
133
Table of Contents
| Item 9. | Changes in and Disagreements with Accountants on Accounting and Financial Disclosure |
None
| Item 9A. | Controls and Procedures |
EVALUATION OF DISCLOSURE CONTROLS AND PROCEDURES
The Company maintains disclosure controls and procedures designed to ensure that information required to be disclosed in reports filed under the Securities Exchange Act of 1934, as amended, is recorded, processed, summarized and reported within the specified time periods and that such information is accumulated and communicated to management, including the CEO and Chief Financial Officer (“CFO”), to allow timely discussions regarding required disclosure. There are inherent limitations to the effectiveness of any system of disclosure controls and procedures, including the possibility of human error and the circumvention or overriding of the controls and procedures. Accordingly, even effective disclosure controls and procedures can only provide reasonable assurance of achieving their control objectives.
The Company’s management, with the participation of its CEO and its CFO, has evaluated the effectiveness of the Company’s “disclosure controls and procedures” (as defined in the Securities Exchange Act of 1934 Rules 13a-15(e) or 15d-15(e)) as at December 31, 2017 and has concluded that, as of the end of the period covered by this report, the Company’s disclosure controls and procedures were effective. The Company will continue to periodically evaluate its disclosure controls and procedures and will make modifications from time to time as deemed necessary to ensure that information is recorded, processed, summarized and reported within the time periods specified in the SEC’s rules and forms.
MANAGEMENT’S ANNUAL REPORT ON INTERNAL CONTROL OVER FINANCIAL REPORTING
Management is responsible for establishing and maintaining adequate internal control over financial reporting for the Company.
Management has used the Committee of Sponsoring Organizations of the Treadway Commission (“COSO”) framework in Internal Control-Integrated Framework (2013) to assess the effectiveness of the Company’s internal control over financial reporting.
Management has assessed the effectiveness of the Company’s internal control over financial reporting, as at December 31, 2017, and has concluded that such internal control over financial reporting were effective as at that date.
Because of its inherent limitations, internal control over financial reporting may not prevent or detect misstatements. Also, projections of any evaluation of effectiveness to future periods are subject to the risk that controls may become inadequate because of changes in conditions, or that the degree of compliance with the policies or procedures may deteriorate.
PricewaterhouseCoopers LLP has audited the effectiveness of the Company’s internal control over financial reporting as at December 31, 2017 as stated in their report in Item 8 of Part II of this 2017 Form 10-K.
CHANGES IN INTERNAL CONTROL OVER FINANCIAL REPORTING
There were no changes in the Company’s internal control over financial reporting which occurred during the three months ended December 31, 2017, that have materially affected, or are reasonably likely to materially affect, the Company’s internal control over financial reporting.
| Item 9B. | Other Information |
None.
134
Table of Contents
| Item 10. | Directors, Executive Officers and Corporate Governance |
The information required by Item 10 is incorporated by reference from the information under the following captions in the Company’s Proxy Statement: “Item No. 1 - Election of Directors;” “Executive Officers;” “Section 16(a) Beneficial Ownership Reporting Compliance;” “Code of Business Conduct and Ethics;” and “Audit Committee.”
| Item 11. | Executive Compensation |
The information required by Item 11 is incorporated by reference from the information under the following captions in the Company’s Proxy Statement: “Compensation Discussion and Analysis;” “Summary Compensation Table;” “Grants of Plan-Based Awards;” “Outstanding Equity Awards at Fiscal Year-End;” “Option Exercise and Stock Vested;” “Pension Benefits;” “Employment Agreements and Potential Payments upon Termination or Change-in-Control;” “Compensation of Directors;” and “Compensation Committee Interlocks and Insider Participation.”
| Item 12. | Security Ownership of Certain Beneficial Owners and Management and Related Stockholder Matters |
The information required by Item 12 is incorporated by reference from the information under the following captions in the Company’s Proxy Statement: “Equity Compensation Plans;” “Principal Shareholders of Voting Shares;” and “Security Ownership of Directors and Management.”
| Item 13. | Certain Relationships and Related Transactions, and Director Independence |
The information required by Item 13 is incorporated by reference from the information under the following caption in the Company’s Proxy Statement: “Certain Relationships and Related Transactions,” “Review, Approval or Ratification of Transactions with Related Persons,” and “Director Independence.”
| Item 14. | Principal Accounting Fees and Services |
The information required by Item 14 is incorporated by reference from the information under the following captions in the Company’s Proxy Statement: “Audit Fees;” “Audit-Related Fees;” “Tax Fees;” “All Other Fees;” and “Audit Committee’s Pre-Approval Policies and Procedures.”
| Item 15. | Exhibits and Financial Statement Schedules |
(a)(1) Financial Statements
The consolidated financial statements filed as part of this Report are included under Item 8 in Part II.
Report of Independent Registered Public Accounting Firm, which covers both the financial statements and financial statement
schedule in (a)(2), is included under Item 8 in Part II of this 2017 Form 10-K.
(a)(2) Financial Statement Schedules
Financial statement schedule for each year in the three-year period ended December 31, 2017.
II. Valuation and Qualifying Accounts.
135
Table of Contents
(a)(3) Exhibits
The items listed as Exhibits 10.1 to 10.35 relate to management contracts or compensatory plans or arrangements.
136
Table of Contents
137
Table of Contents
| * | Filed herewith |
| Item 16. | Form 10-K Summary |
Not applicable.
138
Table of Contents
Pursuant to the requirements of Section 13 or 15(d) of the Securities Exchange Act of 1934, the registrant has duly caused this report to be signed on its behalf by the undersigned, thereunto duly authorized.
| IMAX CORPORATION | ||
| By | /s/ PATRICK MCCLYMONT | |
| Patrick McClymont | ||
| Executive Vice-President & Chief Financial Officer | ||
Date: February 27, 2018
Pursuant to the requirements of the Securities Exchange Act of 1934, this report has been signed below by the following persons on behalf of the registrant and in the capacities indicated on February 27, 2018.
| /s/ RICHARD L. GELFOND Richard L. Gelfond Chief Executive Officer & Director (Principal Executive Officer) |
/s/ PATRICK MCCLYMONT Patrick McClymont Executive Vice President & Chief Financial Officer (Principal Financial Officer) |
/s/ JEFFREY VANCE Jeffrey Vance Senior Vice-President, Finance & Controller (Principal Accounting Officer) | ||
| * |
* |
* | ||
| Bradley J. Wechsler Chairman of the Board & Director |
Neil S. Braun Director |
Eric A. Demirian Director | ||
| * |
* |
* | ||
| David W. Leebron Director |
Michael Lynne Director |
Michael MacMillan Director | ||
| * |
* |
* | ||
| Greg Foster Director |
Dana Settle Director |
Darren D. Throop Director | ||
| * |
||||
| Kevin Douglas Director |
||||
| By | * /s/ PATRICK MCCLYMONT | |
| Patrick McClymont | ||
| (as attorney-in-fact) |
139
Table of Contents
IMAX CORPORATION
Schedule II
Valuation and Qualifying Accounts
(In thousands of U.S. dollars)
| Balance at beginning of year |
Additions/ (recoveries) charged to expenses |
Other additions/ (deductions)(1) |
Balance at end of year |
|||||||||||||
| Allowance for net investment in leases |
||||||||||||||||
| Year ended December 31, 2015 |
$ | 972 | $ | — | $ | (300 | ) | $ | 672 | |||||||
| Year ended December 31, 2016 |
$ | 672 | $ | — | $ | — | $ | 672 | ||||||||
| Year ended December 31, 2017 |
$ | 672 | $ | (517 | ) | $ | — | $ | 155 | |||||||
| Allowance for financed sale receivables |
||||||||||||||||
| Year ended December 31, 2015 |
$ | 494 | $ | 75 | $ | (1 | ) | $ | 568 | |||||||
| Year ended December 31, 2016 |
$ | 568 | $ | (75 | ) | $ | 1 | $ | 494 | |||||||
| Year ended December 31, 2017 |
$ | 494 | $ | 428 | $ | — | $ | 922 | ||||||||
| Allowance for doubtful accounts receivable |
||||||||||||||||
| Year ended December 31, 2015 |
$ | 947 | $ | 677 | $ | (478 | ) | $ | 1,146 | |||||||
| Year ended December 31, 2016 |
$ | 1,146 | $ | 771 | $ | (667 | ) | $ | 1,250 | |||||||
| Year ended December 31, 2017 |
$ | 1,250 | $ | 1,967 | $ | (1,604 | ) | $ | 1,613 | |||||||
| Inventories valuation allowance |
||||||||||||||||
| Year ended December 31, 2015 |
$ | 3,549 | $ | 572 | $ | (779 | ) | $ | 3,342 | |||||||
| Year ended December 31, 2016 |
$ | 3,342 | $ | — | $ | — | $ | 3,342 | ||||||||
| Year ended December 31, 2017 |
$ | 3,342 | $ | 500 | $ | 44 | $ | 3,886 | ||||||||
| Deferred income tax valuation allowance |
||||||||||||||||
| Year ended December 31, 2015 |
$ | 310 | $ | 16 | $ | — | $ | 326 | ||||||||
| Year ended December 31, 2016 |
$ | 326 | $ | (129 | ) | $ | — | $ | 197 | |||||||
| Year ended December 31, 2017 |
$ | 197 | $ | — | $ | — | $ | 197 | ||||||||
| (1) | Deductions represent write-offs of amounts previously charged to the provision. |
140