Attached files
| file | filename |
|---|---|
| EX-32.2 - EX-32.2 - CAI International, Inc. | cai-20171231xex32_2.htm |
| EX-32.1 - EX-32.1 - CAI International, Inc. | cai-20171231xex32_1.htm |
| EX-31.2 - EX-31.2 - CAI International, Inc. | cai-20171231xex31_2.htm |
| EX-31.1 - EX-31.1 - CAI International, Inc. | cai-20171231xex31_1.htm |
| EX-23.1 - EX-23.1 - CAI International, Inc. | cai-20171231xex23_1.htm |
| EX-21.1 - EX-21.1 - CAI International, Inc. | cai-20171231xex21_1.htm |
|
|
UNITED STATES
SECURITIES AND EXCHANGE COMMISSION
WASHINGTON, D.C. 20549
FORM 10-K
☒ANNUAL REPORT PURSUANT TO SECTION 13 OR 15(d) OF THE SECURITIES EXCHANGE ACT OF 1934
For the Fiscal Year Ended December 31, 2017
or
☐TRANSITION REPORT PURSUANT TO SECTION 13 OR 15(d) OF THE SECURITIES EXCHANGE ACT OF 1934
For the Transition Period from to
Commission file number: 001-33388
|
|
CAI International, Inc.
(Exact name of registrant as specified in its charter)
|
|
|
Delaware |
|
94-3109229 |
|
(State or other jurisdiction of incorporation or organization) |
|
(I.R.S. Employer Identification Number) |
|
|
|
|
|
Steuart Tower |
|
|
|
1 Market Plaza, Suite 900 San Francisco, California |
|
94105 |
|
(Address of principal executive office) |
|
(Zip Code) |
(415) 788-0100
(Registrant’s telephone number including area code)
Securities registered pursuant to Section 12(b) of the Act:
|
Title of each class |
|
Name of exchange on which registered |
|
Common Stock, par value $0.0001 per share |
|
New York Stock Exchange |
Securities registered pursuant to Section 12(g) of the Act: None
Indicate by check mark if the registrant is a well-known seasoned issuer, as defined in Rule 405 of the Securities Act. Yes ☐ No ☒
Indicate by check mark if the registrant is not required to file reports pursuant to Section 13 or Section 15(d) of the Act. Yes ☐ No ☒
Indicate by check mark whether the registrant (1) has filed all reports required to be filed by Section 13 or 15(d) of the Securities Exchange Act of 1934 during the preceding 12 months (or for such shorter period that the registrant was required to file such reports), and (2) has been subject to such filing requirement for the past 90 days. Yes ☒ No ☐
Indicate by check mark whether the registrant has submitted electronically and posted on its corporate Web site, if any, every Interactive Data File required to be submitted and posted pursuant to Rule 405 of Regulation S-T (§ 232.405 of this chapter) during the preceding 12 months (or for such shorter period that the registrant was required to submit and post such files). Yes ☒ No ☐
1
Indicate by check mark if disclosure of delinquent filers pursuant to Item 405 of Regulation S-K (§ 229.405 of this chapter) is not contained herein, and will not be contained, to the best of registrant’s knowledge, in definitive proxy or information statements incorporated by reference in Part III of this Form 10-K or any amendment to this Form 10-K. ☒
Indicate by check mark whether the registrant is a large accelerated filer, an accelerated filer, a non-accelerated filer, a smaller reporting company, or emerging growth company. See the definitions of “large accelerated filer,” “accelerated filer,” “smaller reporting company,” and “emerging growth company” in Rule 12b-2 of the Exchange Act
|
Large accelerated filer ☐ |
Accelerated filer ☒ |
|
Non-accelerated filer ☐ |
Smaller reporting company ☐ |
|
(Do not check if smaller reporting company) |
Emerging growth company ☐ |
If emerging growth company, indicate by check mark if the registrant has elected not to use the extended transition period for complying with any new or revised financial accounting standards provided pursuant to Section 13(a) of the Exchange Act. ☐
Indicate by check mark whether the registrant is a shell company (as defined in the Rule 12b-2 of the Act). Yes ☐ No ☒
As of June 30, 2017, the last business day of the registrant’s most recently completed second fiscal quarter, the aggregate market value of common stock held by non-affiliates of the registrant (based upon the closing sale price of such shares on the New York Stock Exchange on June 30, 2017) was approximately $274.9 million. Shares of registrant’s common stock held by each executive officer, director and beneficial holders of 10% or more of our common stock have been excluded in that such persons may be deemed to be affiliates of the registrant. This determination of affiliate status is not necessarily a conclusive determination for other purposes.
As of January 31, 2018, there were 20,490,622 shares of the registrant’s common stock outstanding.
DOCUMENTS INCORPORATED BY REFERENCE
Portions of the registrant’s definitive proxy statement relating to the registrant’s 2018 Annual Meeting of Stockholders, which will be filed no later than 120 days after the close of the registrant’s fiscal year ended December 31, 2017, are incorporated by reference into Part III hereof.
|
|
2
TABLE OF CONTENTS
Annual Report on Form 10-K for the year ended December 31, 2017
|
|
|
|
|
|
|
|
|
Item 1. |
5 | |
|
Item 1A. |
14 | |
|
Item 1B. |
32 | |
|
Item 2. |
32 | |
|
Item 3. |
33 | |
|
Item 4. |
33 | |
|
|
|
|
|
PART II |
|
|
|
Item 5. |
34 | |
|
Item 6. |
36 | |
|
Item 7. |
Management’s Discussion and Analysis of Financial Condition and Results of Operations |
39 |
|
Item 7A. |
52 | |
|
Item 8. |
53 | |
|
Item 9. |
Changes in and Disagreements with Accountants on Accounting and Financial Disclosure |
53 |
|
Item 9A. |
53 | |
|
Item 9B. |
56 | |
|
|
|
|
|
PART III |
|
|
|
Item 10. |
56 | |
|
Item 11. |
56 | |
|
Item 12. |
Security Ownership of Certain Beneficial Owners and Management and Related Stockholder Matters |
56 |
|
Item 13. |
Certain Relationships and Related Transactions, and Director Independence |
56 |
|
Item 14. |
56 | |
|
|
|
|
|
PART IV |
|
|
|
Item 15. |
57 | |
|
Item 16. |
57 | |
|
|
|
|
| 91 | ||
3
SPECIAL NOTE REGARDING FORWARD LOOKING STATEMENTS
This Annual Report on Form 10-K contains certain forward-looking statements, including, without limitation, statements concerning the conditions in our industry, our operations, our economic performance and financial condition, including, in particular, statements relating to our business, operations, and growth strategy and service development efforts. The Private Securities Litigation Reform Act of 1995 provides a “safe harbor” for certain forward-looking statements so long as such information is identified as forward-looking and is accompanied by meaningful cautionary statements identifying important factors that could cause actual results to differ materially from those projected in the information. When used in this Annual Report on Form 10-K, the words “may,” “might,” “should,” “estimate,” “project,” “plan,” “anticipate,” “expect,” “intend,” “outlook,” “believe” and other similar expressions are intended to identify forward-looking statements and information. You are cautioned not to place undue reliance on these forward-looking statements, which speak only as of their dates. These forward-looking statements are based on estimates and assumptions by our management that, although we believe to be reasonable, are inherently uncertain and subject to a number of risks and uncertainties. These risks and uncertainties include, without limitation, those identified under the caption Item 1A. “Risk Factors” in this Annual Report on Form 10-K and our other reports filed with the Securities and Exchange Commission (SEC). We undertake no obligation to publicly update or revise any forward-looking statement as a result of new information, future events or otherwise, except as otherwise required by law. Reference is also made to such risks and uncertainties detailed from time to time in our filings with the SEC.
Unless the context requires otherwise, references to “CAI,” the “Company,” “we,” “us” or “our” in this Annual Report on Form 10-K refer to CAI International, Inc. and its subsidiaries.
4
PART I
Our Company
We are one of the world’s leading transportation finance and logistics companies. We purchase equipment, primarily intermodal shipping containers and railcars, which we lease to our customers. We also manage equipment for third-party investors. In operating our fleet, we lease, re-lease and dispose of equipment and contract for the repair, repositioning and storage of equipment. We also provide domestic and international logistics services, through our subsidiaries, CAI Logistics Inc. (CAI Logistics), Challenger Overseas LLC and Hybrid Logistics, Inc.
The following table shows the composition of our fleet as of December 31, 2017 and our average utilization for the year ended December 31, 2017:
|
|
|||||
|
|
As of |
Percent of |
|||
|
|
December 31, |
Total |
|||
|
|
2017 |
Container Fleet |
|||
|
Owned container fleet in TEUs |
1,146,268 | 93% | |||
|
Managed container fleet in TEUs |
80,736 | 7% | |||
|
Total container fleet in TEUs |
1,227,004 | 100% | |||
|
|
|||||
|
Owned container fleet in CEUs |
1,209,209 | 94% | |||
|
Managed container fleet in CEUs |
73,530 | 6% | |||
|
Total container fleet in CEUs |
1,282,739 | 100% | |||
|
|
|||||
|
Owned railcar fleet in units |
7,172 | ||||
|
|
|||||
|
|
Year Ended |
||||
|
|
December 31, |
||||
|
|
2017 |
||||
|
Average container fleet utilization in CEUs |
97.4% | ||||
|
Average owned container fleet utilization in CEUs |
97.6% | ||||
|
Average railcar fleet utilization |
90.0% | ||||
The intermodal marine container industry-standard measurement unit is the 20-foot equivalent unit (TEU), which compares the size of a container to a standard 20-foot container. For example, a 20-foot container is equivalent to one TEU and a 40-foot container is equivalent to two TEUs. Containers can also be measured in cost equivalent units (CEUs), whereby the cost of each type of container is expressed as a ratio relative to the cost of a standard 20-foot dry van container. For example, the CEU ratio for a standard 40-foot dry van container is 1.6, and a 40-foot high cube container is 1.7.
Utilization of containers is computed by dividing the average total units on lease during the period in CEUs, by the average total CEUs in our container fleet during the period. Utilization of railcars is computed by dividing the average number of railcars on lease during the period by the average total number of railcars in our fleet during the period. In both cases, the total fleet excludes new units not yet leased and off-hire units designated for sale. If new units not yet leased are included in the total fleet, total container fleet utilization would be 96.4%, owned container fleet utilization would be 96.5%, and railcar fleet utilization would be 78.3%, for the year ended December 31, 2017.
Our revenue consists of container lease revenue and rail lease revenue from our owned container and railcar fleets, management fee revenue for managing containers for third-party investors and logistics revenue for the provision of logistics services. Substantially all of our revenue is denominated in U.S. dollars. For the year ended December 31, 2017, we recorded revenue of $348.4 million and net income attributable to CAI common stockholders of $72.1 million. A comparison of our 2017 financial results with those of the prior years can be found in Item 6. “Selected Financial Data” of this Annual Report on Form 10-K.
We earn container lease revenue from intermodal containers which are deployed by our customers in a wide variety of global trade routes. Virtually all of our containers are used internationally and no container is domiciled in one particular place for a prolonged period of time. As such, substantially all of our container assets are considered to be international with no single country of use. Our railcars are used by lessees on railroads in North America. Our logistics business provides both domestic and international logistics services.
5
History
We were founded in 1989, as a traditional container leasing company that leased containers owned by us to container shipping lines. We were originally incorporated under the name Container Applications International, Inc. in the State of Nevada in August 1989. In February 2007, we were reincorporated under our present name in the State of Delaware.
In December 2011, we formed CAI Rail Inc. (CAI Rail), as a wholly-owned subsidiary of the Company. CAI Rail purchases and leases our fleet of railcars in North America.
In July 2015, we purchased CAI Logistics (previously ClearPointt Logistics LLC), an intermodal logistics company focused on the domestic intermodal market, for approximately $4.1 million. CAI Logistics is headquartered in Everett, Washington.
In February 2016, we purchased Challenger Overseas, LLC (Challenger), a Non-Vessel Operating Common Carrier (NVOCC), for approximately $10.8 million. Challenger is headquartered in Eatontown, New Jersey.
In June 2016, we purchased Hybrid Logistics, Inc. and its affiliate General Transportation Services, Inc. (collectively, Hybrid), asset light truck brokers, for approximately $12.0 million. Hybrid is headquartered in Portland, Oregon.
Corporate Information
Our corporate headquarters and principal executive offices are located at Steuart Tower, 1 Market Plaza, Suite 900, San Francisco, California 94105. Our telephone number is (415) 788-0100 and our website address is http://www.capps.com. We operate our business in 23 offices in 14 countries including the United States, and have agents in Asia, Europe, South Africa, and South America. Our wholly-owned international subsidiaries are located in the United Kingdom, Japan, Malaysia, Sweden, Germany, Singapore, Luxembourg, Australia, Chile, South Korea, Barbados and Bermuda.
Segment Information
We organize our business by the nature of services we provide and separate our business into three reportable segments: container leasing, rail leasing and logistics.
The container leasing segment derives its revenue from the ownership and leasing of containers and fees earned for managing container portfolios on behalf of third party investors. The rail leasing segment derives its revenue from the ownership and leasing of railcars. The logistics segment derives its revenue from the provision of logistics services. There are no significant inter-segment revenues.
The operating results of each segment and details of our revenues for the years ended December 31, 2017, 2016 and 2015, and information regarding the geographic areas in which we do business are summarized in Note 17 to our consolidated financial statements in this Annual Report on Form 10-K.
Industry Overview
Container Leasing
We operate in the worldwide intermodal freight container leasing industry. Intermodal freight containers, or containers, are large, standardized steel boxes used to transport cargo by a number of means, including ship, truck and rail. Container shipping lines use containers as the primary means for packaging and transporting freight internationally, principally from export-oriented economies in Asia to other Asian countries, North America and Western Europe.
Containers are built in accordance with standard dimensions and weight specifications established by the International Standards Organization (ISO). Standard dry van containers are eight feet wide, either 20 or 40 feet long and are either 8 feet 6 inches or 9 feet 6 inches tall.
The three principal categories of containers are as follows:
Dry van containers. A dry van container is constructed of steel sides, roof and end panel with a set of doors on the other end, a wooden floor and a steel undercarriage. Dry van containers are the least expensive and most commonly used type of container. Dry van containers comprise approximately 90% of the worldwide container fleet, as measured in TEUs. They are used to carry general cargo, such as manufactured component parts, consumer staples, electronics and apparel.
Refrigerated containers. A refrigerated container has an integrated refrigeration unit on one end which plugs into a generator set or other outside power source and is used to transport perishable goods.
6
Specialized equipment. Specialized equipment includes open-top, flat-rack, palletwide and swapbody containers, roll trailers, and generator sets. An open-top container is similar in construction to a dry van container except that the roof is replaced with a tarpaulin supported by removable roof bows. A flat-rack container is a heavily reinforced steel platform with a wood deck and steel end panels. Open-top and flat-rack containers are generally used to move heavy or oversized cargo, such as marble slabs, building products or machinery. Palletwide containers are a type of dry-van container externally similar to ISO standard containers, but internally about two inches wider so as to accommodate two European-sized pallets side-by-side. Swapbody containers are a type of dry van container designed to be easily transferred between rail, truck, and barge and are equipped with legs under their frames. Roll trailers are a type of flat-bed trailer equipped with rubber wheels underneath for terminal haulage and stowage on board roll-on/roll-off vessels.
Containers provide a secure and cost-effective method of transportation because they can be used in multiple modes of transportation, making it possible to move cargo from a point of origin to a final destination without repeated unpacking and repacking. As a result, containers reduce transit time and freight and labor costs as they permit faster loading and unloading of shipping vessels and more efficient utilization of transportation containers than traditional bulk shipping methods. The protection provided by containers also reduces damage, loss and theft of cargo during shipment. While the life of containers varies based upon the damage and normal wear and tear suffered by a container, we estimate that the average useful life of a dry van container used in our fleet is 13.0 years.
Container shipping lines own and lease containers for their use. Based on container fleet information reported by Harrison Consulting, transportation companies (including container shipping lines and freight forwarders) own approximately 50% of the total worldwide container fleet and container leasing companies own approximately 50% of the total worldwide container fleet based on TEUs. Given the uncertainty and variability of export volumes and the fact that container shipping lines have difficulty in accurately forecasting their container requirements at different ports, the availability of containers for lease significantly reduces a container shipping line’s need to purchase and maintain excess container inventory. In addition, container leases allow the container shipping lines to adjust their container fleets both seasonally and over time and help to balance trade flows. The flexibility offered by container leasing helps container shipping lines improve their overall fleet management and provides the container shipping lines with an alternative source of financing.
Fleet Overview. The table below summarizes the composition of our container fleet as of December 31, 2017 by type of equipment:
|
|
|||||||||||||||
|
|
|||||||||||||||
|
|
Dry Van |
Percent of |
Refrigerated |
Percent of |
Specialized |
Percent of |
Percent of |
||||||||
|
|
Containers |
Total Fleet |
Containers |
Total Fleet |
Equipment |
Total Fleet |
Total |
Total Fleet |
|||||||
|
Owned container fleet in TEUs |
1,035,460 | 84% | 52,849 | 4% | 57,959 | 5% | 1,146,268 | 93% | |||||||
|
Managed container fleet in TEUs |
78,746 | 6% | 576 | 0% | 1,414 | 1% | 80,736 | 7% | |||||||
|
Total container fleet in TEUs |
1,114,206 | 90% | 53,425 | 4% | 59,373 | 6% | 1,227,004 | 100% | |||||||
|
|
|||||||||||||||
|
|
Dry Van |
Percent of |
Refrigerated |
Percent of |
Specialized |
Percent of |
Percent of |
||||||||
|
|
Containers |
Total Fleet |
Containers |
Total Fleet |
Equipment |
Total Fleet |
Total |
Total Fleet |
|||||||
|
Owned container fleet in CEUs |
919,084 | 72% | 191,366 | 14% | 98,759 | 8% | 1,209,209 | 94% | |||||||
|
Managed container fleet in CEUs |
70,056 | 5% | 2,016 | 1% | 1,458 | 0% | 73,530 | 6% | |||||||
|
Total container fleet in CEUs |
989,140 | 77% | 193,382 | 15% | 100,217 | 8% | 1,282,739 | 100% |
Marketing and Operations Overview. Our marketing and operations personnel are responsible for developing and maintaining relationships with our lessees, facilitating lease contracts and maintaining the day-to-day coordination of operational issues. This coordination allows us to negotiate lease contracts that satisfy both our financial return requirements and our lessees’ operating needs. It also facilitates our awareness of lessees’ potential equipment shortages and their awareness of our available equipment inventories. We have marketing and operations employees in twelve countries, supported by independent agents in a further seven countries.
Leases Overview. To meet the needs of our lessees and achieve a favorable utilization rate, we lease containers under three main types of leases:
Long-Term Leases. Our long-term leases have terms of one year or more and specify the number of containers to be leased, the pick-up and drop-off locations, the applicable per diem rate and the contract term. We typically enter into long-term leases for a fixed term ranging from three to eight years, with five-year term leases being most common. Our long-term leases generally require our lessees to maintain all units on lease for the duration of the lease, which provides us with scheduled lease payments. A small percentage of our long-term leases contain an early termination option and afford the lessee interchangeability of containers, and the ability to redeliver containers if the lessee’s fleet requirements change. Generally, leases with an early termination provision impose various economic penalties on the customer if the customer elects to exercise the early termination provision.
7
Short-Term Leases. Short-term leases include both master interchange leases and customized short-term leases. Master interchange leases provide a master framework pursuant to which lessees can lease containers on an as-needed basis, and thus command a higher per diem rate than long-term leases. The terms of master interchange leases are typically negotiated on an annual basis. Under our master interchange leases, lessees know in advance their per diem rates and drop-off locations, subject to monthly port limits. We also enter into other short-term leases that typically have a term of less than one year and are generally used for one-way leasing, typically for small quantities of containers. The terms of short-term leases are customized for the specific requirements of the lessee. Short-term leases are sometimes used to reposition containers to high-demand locations and accordingly may contain terms that provide incentives to lessees.
Finance Leases. Finance leases provide our lessees with an alternative method to finance their container acquisitions. Finance leases are long-term in nature and require relatively little customer service attention. They ordinarily require fixed payments over a defined period and generally provide lessees with a right to purchase the leased containers for a nominal amount at the end of the lease term. Per diem rates under finance leases include an element of repayment of capital and, therefore, typically are higher than per diem rates charged under long-term leases. Finance leases require the container lessee to keep the container on lease for the entire term of the lease.
The following table provides a summary of our container fleet by lease type as of December 31, 2017:
|
|
|||||
|
|
As of December 31, 2017 |
||||
|
|
TEUs |
CEUs |
|||
|
Long-term leases |
71% | 72% | |||
|
Short-term leases |
14% | 13% | |||
|
Finance leases |
15% | 15% | |||
|
Total |
100% | 100% | |||
Our lease agreements contain general terms and conditions detailing standard rights and obligations, including requirements that lessees pay a per diem rate, depot charges, taxes and other charges when due, maintain equipment in good condition, return equipment in good condition in accordance with return conditions set forth in the lease agreement, use equipment in compliance with all applicable laws, and pay us for the value of the equipment as determined by the lease agreement if the equipment is lost or destroyed. A default clause in our lease agreements gives us certain legal remedies in the event that an equipment lessee is in breach of lease terms.
Our lease agreements contain an exclusion of warranties clause and require lessees to defend and indemnify us in most instances from third-party claims arising out of the lessee’s use, operation, possession or lease of the equipment. Lessees are required to maintain physical damage and comprehensive general liability insurance, or be adequately self-insured, and to indemnify us against loss with respect to the equipment. We also maintain our own contingent physical damage and third-party liability insurance that covers our equipment during both on-lease and off-lease periods. All of our insurance coverage is subject to annual deductible provisions and per occurrence and aggregate limits.
Management Services Overview. We manage containers for third-party investors under management agreements that cover portfolios of containers. We lease, re-lease and dispose of the containers and contract for their repair, repositioning and storage. Our management agreements have multiple year terms and provide that we receive a management fee based upon the actual net operating income for each container, which is equal to the actual rental revenue for a container less the actual operating expenses directly attributable to that container. Management fees are collected monthly or quarterly, depending upon the agreement, and generally are not paid if net operating revenue is zero or less for a particular period. If operating expenses exceed revenue, third-party investors are required to pay the excess or we may deduct the excess, including our management fee, from future net operating revenue. Under these agreements, we also receive a commission for selling or otherwise disposing of containers for the third-party investor. Our management agreements generally require us to indemnify the third-party investor for liabilities or losses arising out of a breach of our obligations. In return, the third-party investor typically indemnifies us in our capacity as the manager of the container against a breach by the third-party investor, sales taxes on commencement of the arrangement, withholding taxes on payments to the third-party investor under the management agreement and any other taxes, other than our income taxes, incurred with respect to the containers that are not otherwise included as operating expenses deductible from revenue.
Re-leasing, Logistics Management and Depot Management. We believe that managing the period after lease termination, in particular after our containers’ first lease, is one of the most important aspects of our business. Successful management of this period requires disciplined re-leasing capabilities, logistics management and depot management.
8
Re-leasing. Since our leases generally allow our lessees to return their containers, we typically lease a container several times during its useful life. New containers can usually be leased with a limited marketing and customer service infrastructure because initial leases for new containers typically cover large volumes of units and are fairly standardized transactions. Used containers, on the other hand, are typically leased in smaller transactions that are structured to accommodate pick-ups and returns in a variety of locations. Our utilization rates depend on our re-leasing abilities. Factors that affect our ability to re-lease used containers include the size of our lessee base, ability to anticipate lessee needs, our presence in relevant geographic locations and the level of service we provide our lessees. We believe that our global presence and long-standing relationships with more than 300 container lessees as of December 31, 2017 provide us an advantage over our smaller competitors in re-leasing our containers.
Logistics Management. The shipping industry is characterized by large regional trade imbalances, with loaded containers generally flowing from export-oriented economies in Asia to other Asian countries, North America and Western Europe. Because of these trade imbalances, container shipping lines have an incentive to return leased containers in relatively low export areas to reduce the cost of shipping empty containers. We have managed this structural imbalance of inventories with the following approach:
Limiting or prohibiting container returns to low-demand areas. In order to minimize our repositioning costs, our leases typically include a list of the specific locations to which containers may be returned, limitations on the number of containers that may be returned to low-demand locations, high drop-off charges for returning containers to low-demand locations or a combination of these provisions;
Taking advantage of the secondary resale market. In order to maintain a younger fleet age profile, we have aggressively sold older containers when they are returned to low demand areas;
Developing country-specific leasing markets to utilize older containers in the portable storage market. In North America and Western Europe, we lease on a limited basis older containers for use as portable storage;
Seeking one-way lease opportunities to move containers from lower demand locations to higher demand locations. One-way leases may include incentives, such as free days, credits and damage waivers. The cost of offering these incentives is considerably less than the cost we would incur if we paid to reposition the containers; and
Paying to reposition our containers to higher demand locations. At locations where our inventories remain high, despite the efforts described above, we will selectively choose to ship excess containers to locations with higher demand.
Depot Management. As of December 31, 2017, we managed our equipment fleet through 219 independent equipment depot facilities located in 45 countries. Depot facilities are generally responsible for repairing containers when they are returned by lessees and for storing the containers while they are off-hire. Our operations group is responsible for managing our depot contracts and periodically visiting depot facilities to conduct inventory and repair audits. We also supplement our internal operations group with the use of independent inspection agents. As of December 31, 2017, a majority of our off-lease inventory was located at depots that are able to report notices of container activity and damage detail via electronic data interchange, or EDI.
Most of the depot agency agreements follow a standard form and generally provide that the depot will be liable for loss or damage of containers and, in the event of loss or damage, will pay us the previously agreed loss value of the applicable containers. The agreements require the depots to maintain insurance against container loss or damage and we carry insurance to cover the risk that a depot’s insurance proves insufficient.
Our container repair standards and processes are generally managed in accordance with standards and procedures specified by the Institute of International Container Lessors, or the IICL. The IICL establishes and documents the acceptable interchange condition for containers and the repair procedures required to return damaged containers in acceptable interchange condition. When containers are returned by lessees, the depot arranges an inspection of the containers to assess the repairs required to return the containers to acceptable IICL condition. As part of the inspection process, damages are categorized either as lessee damage or normal wear and tear. Items typically designated as lessee damage include dents in the container, while items such as rust are typically designated as normal wear and tear. In general, lessees are responsible for the lessee damage portion of repair costs and we are responsible for normal wear and tear.
Customer Concentration. Revenue from our ten largest container lessees represented 65.8% of container leasing revenue for the year ended December 31, 2017, with revenue from our two largest lessees, CMA CGM and MSC Mediterranean Shipping Co, accounting for 15.9% and 14.7%, respectively, of container leasing revenue, or $37.5 million and $34.7 million, respectively. The $37.5 million and $34.7 million of revenue represented 10.8% and 10.0%, respectively, of our total revenue for the period.
9
Proprietary Real-time Information Technology System. Our proprietary real-time information technology system tracks all of our containers individually by container number, provides design specifications for the containers, tracks on-lease and off-lease transactions, matches each on-lease unit to a lease contract and each off-lease unit to a depot contract, maintains the major terms for each lease contract, tracks accumulated depreciation, calculates the monthly bill for each container lessee and tracks and bills for container repairs. Most of our depot activity is reported electronically, which enables us to prepare container lessee bills and calculate financial reporting information more efficiently.
In addition, our system allows our lessees to conduct business with us through the Internet. This allows our lessees to review our container inventories, monitor their on-lease information, view design specifications and receive information on maintenance and repair. Many of our lessees receive billing and on- and off- lease information from us electronically.
Our Suppliers. We purchase most of our containers in China from manufacturers that have met our qualification requirements. We are currently not dependent on any single manufacturer. We have long-standing relationships with all of our major container suppliers. Our technical services personnel review the designs for our containers and periodically audit the production facilities of our suppliers. In addition, we contract with independent third-party inspectors to monitor production at factories while our containers are being produced. This provides an additional layer of quality control and helps ensure that our containers are produced in accordance with our specifications.
Our Competition. We compete primarily with other container leasing companies, including both larger and smaller lessors. We also compete with bank leasing companies offering long-term operating leases and finance leases, and container shipping lines, which sometimes lease their excess container inventory. Other participants in the shipping industry, such as container manufacturers, may also decide to enter the container leasing business. It is common for container shipping lines to utilize several leasing companies to meet their container needs and to minimize reliance on any one individual leasing company.
Our competitors compete with us in many ways, including pricing, lease flexibility, supply reliability, customer service and the quality and condition of containers. Some of our competitors have greater financial resources than we do, or are affiliates of larger companies. We emphasize the quality of our fleet, supply reliability and high level of customer service to our container lessees. We focus on ensuring adequate container availability in high-demand locations, dedicate large portions of our organization to building relationships with lessees, maintain close day-to-day coordination with lessees and have developed a proprietary information technology system that allows our lessees to access real-time information about their containers.
Seasonality. We have historically experienced increased seasonal demand for containers in the second and third quarters of the year. However, equipment rental revenue may fluctuate significantly in future periods based upon the level of demand by container shipping lines for leased containers, our ability to maintain a high utilization rate of containers in our total fleet, and changes in per diem rates for leases.
Rail Leasing
Fleet Overview. We own a fleet of railcars of various types including: 50ft and 60ft box cars for paper and forest products; covered hoppers for grain, cement, sand, plastic pellets and many other industrial products; general purpose tank cars that are used to transport food-grade and other liquid and gaseous commodities; gondolas for coal and steel; and general service flat cars. We owned 7,172 railcars as of December 31, 2017.
In 2015 we entered into a multi-year railcar order (the "Agreement") with a railcar manufacturer. Under the Agreement, we committed to purchase 2,000 railcars of various types for use on the North American rail system, for a total investment expected to be in excess of $200 million. In 2017, we entered into an amendment to the Agreement, by which we modified the type of railcars yet to be delivered as of the effective date of the amendment, reduced the overall baseline pricing and revised the amount and delivery dates for the various car types. As of December 31, 2017, 1,267 railcars had been delivered under the Agreement; the remaining 733 cars are to be delivered in 2018 at a cost of $78.5 million.
Overview of Our Leases. We offer multiple lease options to our railcar customers, including full service leases, net operating leases and per diem leases. Our full service leases provide our customers with comprehensive management services including maintenance and the payment of taxes. Net operating leases allow customers to manage and pay the cost of operating and maintaining railcars themselves. Our per diem lease product enables customers to pay through a settlement process on an hourly and mileage basis.
Customer Concentration. Our railcar customers are typically industrial companies who ship their products or raw materials by rail. Our customers are generally large, creditworthy, industrial companies. Additionally, we work with a number of North American Class I Railroads and regional carriers. Revenue from our ten largest customers represented 47.8% of rail leasing revenue for the year ended December 31, 2017, with no single customer generating more than 10% of our rail leasing revenue.
Our Competition. We function in a highly competitive marketplace that includes large and small operating lessors, financial institutions with passive leasing enterprises, captive leasing companies owned by manufacturers and at times with shippers holding large and diverse fleets of railcars. We compete on the basis of customer relationships, lease rate, maintenance expertise, service capability and availability of railcars.
10
Logistics
Overview of Our Services. We offer comprehensive logistics services including intermodal, truck brokerage, port drayage, warehousing, international ocean freight and freight forwarding, as well as the arrangement and coordination of international air freight services and customs brokerage. Through our network of transportation carriers and equipment providers, we arrange for the movement of our customers’ freight. We contract with railroads to provide transportation for the line-haul portion of the shipment and with local trucking companies, known as “drayage companies,” for pickup and delivery. We may also offer use of our own CAI equipment for domestic beneficial cargo owner (BCO) movements. As part of our intermodal and truck brokerage services, we negotiate and bundle rates for our customers, track shipments in transit, and facilitate the handling of claims for freight loss or damage on behalf of our customers. We also provide international export and import services for full container loads, less than container loads, perishable cargo, project cargo, and airfreight across the globe.
We have a network of logistics professionals dedicated to developing, implementing and operating customized logistics solutions. We offer a wide range of transportation management services and technology solutions including shipment optimization, load consolidation, mode selection, carrier management, load planning and execution and web-based shipment visibility.
Customer Concentration. We provide services to customers in a wide variety of industries, including consumer products, retail and durable goods. Revenue from our ten largest customers represented 39.7% of logistics revenue for the year ended December 31, 2017, with no single customer generating more than 10% of our logistics revenue.
Our Competition. The transportation services industry is highly competitive. We compete against other logistics companies, third party brokers, asset-backed trucking companies and shipping lines that market their own intermodal and international shipping services. Several large trucking companies have entered into agreements with railroads to market intermodal services nationwide. Competition is based primarily on freight rates, quality of services, reliability, transit time and scope of operations. We believe we have a strong competitive advantage being able to offer customers a variety of services under one organization. Few, if any, of our competitors can offer customers leasing of containers, sale of used containers, rail service, nationwide truck brokerage and international export/import services. This distinct advantage, along with the cross selling between all of our divisions, is expected to provide CAI with significant opportunities to increase market share.
Relationship with Railroads. A key element of our business strategy is to strengthen our close working relationship with the major railroads in the United States and Canada. Due to our size and relative importance, some railroads have dedicated support personnel to focus on our day-to-day service requirements. We have relationships with all seven of the Class 1 freight railroads, and our senior executives meet with each of the railroads on a regular basis to discuss major strategic issues concerning intermodal transportation.
Transportation rates are market driven. We sometimes negotiate with the railroads or other major service providers on a route or customer specific basis. Consistent with industry practice, some of the rates we negotiate are special commodity quotations (SCQs), which provide discounts from published price lists based on competitive market factors and are designed by the railroads or major service providers to attract new business or to retain existing business. SCQ rates are generally issued for the account of a single Intermodal Marketing Company (IMC). SCQ rates apply to specific customers in specified shipping lanes for a specific period of time, usually up to 12 months. Other transactional or spot market business is negotiated on a daily basis, dependent on capacity and dynamic pricing, consistent with existing market conditions.
Relationship with Drayage Companies. We have a “Quality Drayage Program,” under which participants commit to provide high quality drayage service along with clean and safe equipment, maintain a defined on-time performance level and follow specified procedures designed to minimize freight loss and damage. We negotiate drayage rates for transportation between specific origin and destination points.
Relationship with Trucking Companies. Our truck brokerage operation has relationships with more than 14,000 trucking companies that we use to transport freight. Our truck brokerage operation handles the administrative and regulatory aspects of the trucking company relationship including an eight-step vetting process. Our relationships with these trucking companies are important since these relationships determine pricing, load coverage and overall service.
Relationship with Shipping Lines. Our international division has relationships with every major shipping line providing a worldwide network of shipping options based on price and service for export and import cargoes. These relationships enable us to provide a basket of options that best suit the needs of our customers at any given moment. Supported by a world-wide agency network, we are able to provide the best price and service option anywhere in the world. Additional value and customized solutions can be accomplished by offering use of our own CAI equipment for domestic and international BCO movements.
Risk Management and Insurance. We require all drayage companies participating in our Quality Drayage Program to carry general liability insurance, truckman’s auto liability insurance and cargo insurance. Railroads, which are self-insured, provide limited cargo protection per shipment. To cover freight loss or damage our carriers are carefully vetted to ensure all cargo insurance requirements are in place and monitored. We also carry contingent cargo insurance to protect from any lapse in a carrier’s primary insurance.
11
Credit Control
We provide services for container shipping lines, freight forwarders, railroads and other companies that meet our credit criteria. Our credit policy sets different maximum exposure limits depending on our relationship and previous experience with each customer. Credit criteria may include, but are not limited to, trade route, country, business climate, social and political climate, assessments of net worth, asset ownership, bank and trade credit references, credit bureau reports (including those from Dynamar), operational history and financial strength. We monitor our customers’ performance on an ongoing basis. Our credit control processes are aided by the long payment experience we have with most of our customers, our broad network of relationships that provide current information about our customers’ market reputations and our focus on collections.
Environmental Matters
We are subject to federal, state, local and foreign laws and regulations relating to the protection of the environment, including those governing the discharge of pollutants to air and water, the management and disposal of hazardous substances and wastes and the cleanup of contaminated sites. We could incur substantial costs, including cleanup costs, fines and third-party claims for property or natural resource damage and personal injury, as a result of violations of environmental laws and regulations in connection with our or our lessees’ current or historical operations. Under some environmental laws in the United States and certain other countries, the owner or operator of equipment may be liable for environmental damage, cleanup or other costs in the event of a spill or discharge of material from the equipment without regard to the fault of the owner or operator. While we typically maintain liability insurance coverage and typically require our lessees to provide us with indemnity against certain losses, the insurance coverage is subject to large deductibles, limits on maximum coverage and significant exclusions and may not be sufficient or available to protect against any or all liabilities and such indemnities may not cover or be sufficient to protect us against losses arising from environmental damage.
Regulation
We are subject to regulations promulgated in various countries, including the United States, seeking to protect the integrity of international commerce and prevent the use of equipment for international terrorism or other illicit activities. For example, the Container Security Initiative, the Customs-Trade Partnership Against Terrorism and Operation Safe Commerce are among the programs administered by the U.S. Department of Homeland Security that are designed to enhance security for cargo moving throughout the international transportation system by identifying existing vulnerabilities in the supply chain and developing improved methods for ensuring the security of containerized cargo entering and leaving the United States. Moreover, the International Convention for Safe Containers, 1972, as amended, adopted by the International Maritime Organization, applies to new and existing containers and seeks to maintain a high-level of safety of human life in the transport and handling of containers by providing uniform international safety regulations. As these regulations develop and change, we may incur increased compliance costs due to the acquisition of new, compliant equipment and/or the adaptation of existing equipment to meet new requirements imposed by such regulations.
Our rail operations are subject to various laws, rules, and regulations administered by authorities in jurisdictions where we do business; the United States, Canada and Mexico. In the United States, for example, our railcar fleet is subject to safety, operations, maintenance, and mechanical standards, rules, and regulations enforced by various federal and state agencies and industry organizations, including the U.S. Department of Transportation, the Federal Railroad Administration, and the Association of American Railroads. State agencies regulate some health and safety matters related to rail operations not otherwise preempted by federal law. As these regulations develop and change, we may incur increased compliance costs due to additional maintenance or substantial modification or refurbishment of our railcars to meet new requirements imposed by such regulations. In addition, violations of these rules and regulations can result in substantial fines and penalties, including potential limitations on operations or forfeitures of assets.
Our domestic logistics business is licensed by the Department of Transportation as brokers in arranging for the transportation of general commodities by motor carriers and railroads. To the extent that we perform truck brokerage and intermodal services, we do so under these licenses. The Department of Transportation prescribes qualifications for acting in this capacity, including a surety bond that we have posted. To date, compliance with these regulations has not had a material adverse effect on our results of operations or financial condition. However, the transportation industry is subject to legislative or regulatory changes that can affect the economics of the industry by requiring changes in operating practices or influencing the demand for, and cost of providing, transportation services. Our international freight forwarding business is regulated by the Federal Maritime Commission (FMC). We have our own tariff on file with the FMC and are required to have a bond for both our freight forwarding and NVOCC businesses.
Employees
As of December 31, 2017, we had 215 employees worldwide. We are not a party to any collective bargaining agreements. We believe that relations with our employees are good.
12
Available Information
Our Internet website address is http://www.capps.com. Our Annual Reports on Form 10-K, Quarterly Reports on Form 10-Q, current reports on Form 8-K, and amendments to those reports filed or furnished pursuant to Section 13(a) or 15(d) of the Securities Exchange Act of 1934, as amended (Exchange Act) are available free of charge through our website as soon as reasonably practicable after they are electronically filed with, or furnished to, the SEC. Also, copies of our filings with the SEC will be made available, free of charge, upon written request to the Company. The information found on, or otherwise accessible through, our website is not incorporated by reference into, nor does it form a part of, this Annual Report on Form 10-K, or any other document that we file with the SEC.
13
In addition to the other information contained in this Annual Report on Form 10-K, we have identified the following risks and uncertainties that may have a material adverse effect on our business, financial condition, results of operations and cash flows. Investors should carefully consider the risks described below before making an investment decision. The risks described below are not the only ones we face. Additional risks not presently known to us or that we currently believe are immaterial may also impair our business operations. Our business could be harmed by any of these risks. The trading price of our common stock could decline due to any of these risks and investors may lose all or part of their investment. This section should be read in conjunction with our audited consolidated financial statements and related notes thereto, and “Management’s Discussion and Analysis of Financial Condition and Results of Operations” contained in this Annual Report on Form 10-K.
Risks Related to Container Leasing
The demand for leased containers is particularly tied to international trade. If international trade were to decrease, it could reduce demand for container leasing, which would materially adversely affect our business, financial condition and results of operations.
A substantial portion of our containers are used in trade involving goods being shipped from exporting countries (e.g., China and other Asian countries) to importing countries (e.g., the United States or European nations). The willingness and ability of international consumers to purchase foreign goods is dependent upon political support for an absence of government-imposed barriers to international trade in goods and services. For example, international consumer demand for foreign goods is related to price. Therefore, if the price differential between foreign goods and domestically-produced goods were to decrease due to increased tariffs on the import of foreign goods, strengthening in the applicable foreign currencies relative to domestic currencies, rising foreign wages, increasing input or energy costs or other factors, then demand for foreign goods could decrease. This in turn could result in reduced demand for container leasing. A similar reduction in demand for container leasing could result from an increased use of quotas or other technical barriers to restrict trade. The current regime of relatively free trade may not continue, which would materially adversely affect our business, financial condition and results of operations.
The current U.S. Government has withdrawn from certain international trade agreements (i.e. the Trans Pacific Partnership) and has announced its intention to renegotiate some existing trade agreements (i.e. NAFTA). Any changes in international trade agreements may lead to the implementation of tariffs, border taxes or other measures that could impact the level of trade between the U.S. and other countries, including countries in Asia and Mexico. Any such changes to trade agreements or the implementation of tariffs could have a material impact on the purchase of foreign goods, and negatively impact our customers and the volume of container and rail shipments, which would materially adversely affect our business, financial condition and results of operations.
Market conditions could weaken due to a combination of factors, including significant declines in steel prices, new container prices, used container prices and slower trade growth which could lead to lower demand for containers.
Market conditions could weaken leading to reduced investment, a lack of growth and a significant reduction in our profitability. For example, in recent years there was an overall decline in worldwide commodity prices and, in particular, steel prices, which declined approximately 40% from October 2014 through December 2015. World containerization trade growth decelerated significantly during 2015 and trade growth remained weak in 2016. The decline in steel prices, along with slower trade growth resulted in a reduced demand for containers and contributed to a significant decline in the price of new containers. New container prices declined during 2015 and reached a low point of approximately $1,250 in the first quarter of 2016. Sale prices for used containers decreased significantly in 2015 and into 2016, resulting in losses on the sale of equipment. If steel prices decline and the market conditions we saw in 2015 and 2016 return, our profitability will decline, which could limit the availability of our liquidity and capital resources and therefore constrain our ability to repay debt, invest in additional containers or repurchase our common shares.
Container leasing demand can be negatively affected by numerous market factors as well as external political and economic events that are beyond our control. Decreasing leasing demand could have a material adverse effect on our business, financial condition, results of operations and cash flows.
Demand for containers depends largely on the rate of world trade and economic growth. Demand for leased containers is also driven by our customers’ “lease vs. buy” decisions. Cyclical recessions can negatively affect lessors’ operating results because during economic downturns or periods of reduced trade, shipping lines tend to lease fewer containers, or lease containers only at reduced rates, and tend to rely more on their own fleets to satisfy a greater percentage of their requirements. As a result, during periods of weak global economic activity, container lessors like ourselves typically experience decreased leasing demand, decreased equipment utilization, lower average rental rates, decreased leasing revenue, decreased used container resale prices and significantly decreased profitability. These effects can be severe.
14
For example, our profitability decreased significantly from the third quarter of 2008 to the third quarter of 2009 due to the effects of the global financial crisis, and profitability would have decreased further if trade activity did not start to recover at the end of 2009. Starting in 2015 and continuing through 2016, our operating performance and profitability were also negatively impacted due to slower global trade growth resulting in reduced demand for leased containers, decreases in lease rental revenue, decreased used container sales prices, and higher operating costs. If these conditions return, our profitability will be negatively affected, which could constrain our ability to invest in additional containers or repurchase our common shares.
Other general factors affecting demand for leased containers, container utilization and per diem rental rates include:
available supply and prices of new and used containers;
changes in the operating efficiency of our customers;
economic conditions and competitive pressures in the shipping industry;
shifting trends and patterns of cargo traffic, including a reduction in exports from Asian nations or increased trade imbalances;
the availability and terms of container financing;
fluctuations in interest rates and foreign currency values;
overcapacity or undercapacity of the container manufacturers;
the lead times required to purchase containers;
the number of containers purchased by competitors and container lessees;
container ship fleet overcapacity or undercapacity;
increased repositioning by container shipping lines of their own empty containers to higher-demand locations in lieu of leasing containers from us;
consolidation or withdrawal of individual container lessees in the container shipping industry;
import/export tariffs and restrictions;
customs procedures, foreign exchange controls and other governmental regulations;
natural disasters that are severe enough to affect local and global economies;
political and economic factors, including any changes in international trade agreements; and
future regulations which could restrict our current business practices and increase our cost of doing business.
All of these factors are inherently unpredictable and beyond our control. These factors will vary over time, often quickly and unpredictably, and any change in one or more of these factors may have a material adverse effect on our business, financial condition, results of operations and cash flows. Many of these factors also influence decisions by our customers to lease or buy containers. Should one or more of these factors influence our customers to buy a larger percentage of the containers they operate, our utilization rate would decrease, resulting in decreased revenue and increased storage and repositioning costs.
Lease rates may decrease due to a decrease in new container prices, weak leasing demand, increased competition or other factors, resulting in reduced revenues, lower margins, and reduced profitability and cash flows.
Market lease rates are typically a function of, among other things, new equipment prices (which are heavily influenced by steel prices), interest rates, the type and length of the lease, the equipment supply and demand balance at a particular time and location, and other factors more fully described below. A decrease in lease rates can have a materially adverse effect on our leasing revenues, profitability and cash flow. For example, the low container prices experienced in 2016, together with low interest rates, resulted in market lease rates reaching historically low levels.
A decrease in market lease rates negatively impacts the lease rates on both new container investments and existing containers in our fleet. Most of our existing containers are on operating leases, which means that the lease term is shorter than the expected life of the container, so the lease rate we receive for the container is subject to change at the expiration of the current lease. Lower new container prices, widespread availability of attractively priced financing, and aggressive competition for new leasing transactions could put pressure on market lease rates. As a result, during periods of low market lease rates, the average lease rate received for our containers is negatively impacted by both the addition of new containers at low lease rates as well as, and more significantly, by the turnover of existing containers from leases with higher lease rates to leases with lower lease rates. We have a large number of historically high rate leases that expire between 2018 and 2020 and those that have expired or been renegotiated have been re-priced at today’s lower lease rates.
15
A reduction in the price of new containers could harm our business, results of operations and financial condition.
New container prices have been increasing since their lows in the first quarter of 2016. If new container prices decreased, however, the per diem lease rates for new leases of older, off-lease containers would also be expected to decrease and the prices obtained for containers sold at the end of their useful life would also be expected to decrease. Between the beginning of 2014 and the first quarter of 2016, due primarily to decreases in steel prices and other macro-economic factors outside of our control, new container pricing and the sale prices of containers sold at the end of their useful life declined. Although new and used container prices recovered during 2016 and 2017, if the price of new containers declines such that market per diem lease rates or resale values for containers are reduced, our revenue and income could decline. A continuation of these factors could harm our business, financial condition, results of operations and cash flows, even if a sustained reduction in price would allow us to purchase new containers at a lower cost.
We face risks associated with re-leasing containers after their initial long-term lease.
Containers used in our fleet have an average useful life that is generally between 12 and 15 years. When we purchase newly manufactured containers, we typically lease them out under long-term leases with terms of 3 to 8 years at a lease rate that is correlated to the price paid for the container. As containers leased under term leases are not leased out for their full economic life, we face risks associated with re-leasing containers after their initial long-term lease at a rate that continues to provide a reasonable economic return based on the initial purchase price of the container. If prevailing container lease rates decline significantly between the time a container is initially leased out and when its initial long-term lease expires, or if overall demand for containers declines, we may be unable to earn a sufficient lease rate from the re-leasing of containers when their initial term leases expire. This could adversely affect our business, financial condition, results of operations and cash flows.
Our customers may decide to lease fewer containers. Should shipping lines decide to buy a larger percentage of the containers they operate, our utilization rate and level of investment would decrease, resulting in decreased leasing revenues, increased storage costs, increased repositioning costs and lower growth.
We, like other suppliers of leased containers, are dependent upon decisions by shipping lines to lease rather than buy their container equipment. Should shipping lines decide to buy a larger percentage of the containers they operate, our utilization rate would decrease, resulting in decreased leasing revenues, increased storage costs and increased positioning costs. A decrease in the portion of leased containers operated by shipping lines would also reduce our investment opportunities and significantly constrain our growth. Most of the factors affecting the decisions of our customers are outside of our control.
Used container sale prices may decrease, leading to losses on the sale of used rental equipment.
Although our revenues primarily depend upon equipment leasing, our profitability is also affected by the gains or losses we realize on the sale of used containers because, in the ordinary course of our business, we sell certain containers when they are returned to us. The volatility of the selling prices and gains or losses from the disposal of such equipment may be significant. Used container selling prices, which can vary substantially, depend upon, among other factors, the cost of new containers, the global supply and demand balance for containers, the location of the containers, the supply and demand balance for used containers at a particular location, the repair condition of the container, refurbishment needs, materials and labor costs and equipment obsolescence. Most of these factors are outside of our control.
Containers are typically sold if it is in our best interest to do so, after taking into consideration earnings prospects, book value, remaining useful life, condition and repair costs, storage costs, suitability for leasing or other uses, and the prevailing local sales price for containers. Gains or losses on the disposition of used containers will fluctuate and may be significant if we sell large quantities of used containers.
Used container selling prices and the gains or losses that we have recognized from selling used containers have varied widely over recent years. Selling prices for used container and our disposal gains were exceptionally high from 2010 to 2012 due to a generally tight global supply and demand balance for containers. Since the beginning of 2013, due primarily to decreases in steel prices and other macro-economic factors outside of our control, new container pricing and the sale prices of containers sold at the end of their useful life declined. During 2015 and 2016, disposal prices were close to, and in many cases below, our residual values which resulted in losses being incurred on the sales of used equipment. As a result of consistent losses being recorded on the sale of 40-foot high cube dry van containers, we reduced the residual value for these containers from $1,650 to $1,400 per container, effective July 1, 2016, which resulted in an increase in depreciation expense of $4.4 million and $5.4 million for 2017 and 2016, respectively. During 2017, sales prices for used containers have recovered, resulting in gains being recognized on the sale of used equipment. If used container prices were to decrease once again, we may incur losses on the sale of used containers, our residual values may need to be reduced further, resulting in increased depreciation expense, and we may incur impairment charges on such equipment. A decline in these factors could have a material adverse effect on our business, financial condition, results of operations and cash flows.
16
We may incur significant costs to reposition containers.
When lessees return containers to locations where supply exceeds demand, we may make a decision to reposition containers to higher demand areas rather than sell the container and realize a loss on sale. Repositioning expenses vary depending on geographic location, distance, freight rates and other factors, and may not be fully covered by drop-off charges collected from the last lessee of the containers or pick-up charges paid by the new lessee. We seek to limit the number of units that can be returned and impose surcharges on containers returned to areas where demand for such containers is not expected to be strong. However, market conditions may not enable us to continue such practices. In addition, we may not accurately anticipate which port locations will be characterized by high or low demand in the future, and our current contracts will not protect us from repositioning costs if ports that we expect to be high-demand ports turn out to be low-demand ports at the time leases expire.
Lessee defaults may adversely affect our business, results of operations and financial condition by decreasing revenue and increasing storage, repositioning, collection and recovery expenses.
Our container equipment is leased to numerous lessees. Lessees are required to pay rent and indemnify us for damage to or loss of equipment. Lessees may default in paying rent and performing other obligations under their leases. A delay or diminution in amounts received under the leases (including leases on our managed equipment), or a default in the performance of maintenance or other lessee obligations under the leases could adversely affect our business, financial condition, results of operations and cash flows and our ability to make payments on our debt.
Our cash flows from container equipment, principally container rental revenue, management fee revenue, gain on disposition of used equipment and commissions earned on the sale of equipment on behalf of equipment investors, are affected significantly by the ability to collect payments under leases and the ability to replace cash flows from terminating leases by re-leasing or selling equipment on favorable terms. All of these factors are subject to external economic conditions and the performance by lessees and service providers that are not within our control.
In addition, when lessees default, we may fail to recover all of our equipment, and the equipment we do recover may be returned in damaged condition or to locations where we will not be able to efficiently re-lease or sell the equipment. As a result, we may have to repair and reposition the equipment to other places where we can re-lease or sell it, and we may lose revenue and incur additional operating expenses in repossessing, repositioning and storing the equipment.
We believe that the risk of lessee defaults remains high. Excess vessel capacity over the last several years has led to low ocean freight rates, which has resulted in large financial losses for certain carriers. For example, Hanjin Shipping Co. Ltd (Hanjin), previously the world’s 7th largest container shipping line, declared bankruptcy on August 31, 2016, and a second major shipping line entered into restructuring negotiations with its creditors, which was successfully completed in 2016. We expect excess vessel capacity, and future financial commitments for new capacity, to persist and freight rates to remain under pressure, which could adversely affect the credit worthiness of our customers. The Hanjin bankruptcy resulted in us recording bad debt expense of $2.5 million and an impairment charge of $2.0 million in 2016. Additional large lessee defaults could have a material adverse effect on our business, financial condition, results of operations and cash flow.
We maintain insurance to reimburse the Company and third-party investors for customer defaults. The insurance agreements are subject to deductibles of $3.0 million or $3.5 million per occurrence, depending on the customer’s credit rating, and have significant exclusions. In 2016, we filed a significant insurance claim as a result of the Hanjin bankruptcy. As a result of this claim, and other factors, our level of insurance cover in 2018 is limited to $11.5 million or $12.0 million per occurrence and $18.0 million or $19.0 million in aggregate, depending on the customer’s credit rating, and may not be sufficient to prevent us from suffering material losses. Additional insurance claims made by the Company may result in such insurance not being available to us in the future on commercially reasonable terms, or at all.
We may incur additional asset impairment charges and depreciation expense.
We incurred a charge of $24.5 million in 2015 to impair the carrying value of certain off-lease equipment. Additional asset impairment charges may result from the occurrence of unexpected adverse events or management decisions that impact our estimates of expected cash flows generated from our long-lived assets. We review our long-lived assets for impairment when events or changes in circumstances indicate the carrying value of an asset may not be recoverable. We may be required to recognize additional asset impairment charges in the future as a result of prolonged reductions in demand for specific container types, an extended weak economic environment, persistent challenging market conditions, events related to particular customers or asset type, or as a result of asset or portfolio sale decisions by management. If an asset, or group of assets, is considered to be impaired, it may also indicate that the residual value of the associated equipment type needs to be reduced. We reduced the residual value for 40-foot high cube dry van containers from $1,650 to $1,400 per container, effective July 1, 2016, which resulted in an increase in depreciation expense of $4.4 million and $5.4 million for 2017 and 2016, respectively. If residual values of our rental equipment are lowered further, then our depreciation expense will increase, which would have an adverse impact on our business, financial condition and results of operations.
17
We derive a substantial portion of our revenue from a limited number of container lessees. The loss of, or reduction in business by, any of these container lessees, or a default from any large container lessee, could result in a significant loss of revenue and cash flow.
We have derived, and believe that we will continue to derive, a significant portion of our revenue and cash flow from a limited number of container lessees. Revenue from our ten largest container lessees represented 65.8% of total revenue for this segment for the year ended December 31, 2017, with revenue from our two largest container lessees accounting for 15.9% and 14.7%, respectively, of container lease revenue, or $37.5 million and $34.7 million, respectively. As our business grows, and as consolidation continues among our shipping line customers, we expect the proportion of revenue generated by our larger customers to continue to increase. Recent consolidation among our major shipping line customers includes Cosco and China Shipping Container Lines in 2016, and between Maersk and Hamburg Süd in 2017. The loss of such a customer would have a material adverse impact on our business, financial condition, results of operations and cash flows. In addition, a default by any of our largest lessees would result in a major reduction in our leasing revenue, large repossession expenses, potentially large lost equipment charges and a material adverse impact on our performance and financial condition. Although we maintain insurance against customer defaults, our insurance is limited and may not be sufficient to cover such a default.
Sustained Asian economic, social or political instability could reduce demand for leasing.
Many of our customers are substantially dependent upon shipments of goods exported from Asia. From time to time, there have been economic disruptions, financial turmoil, natural disasters and political instability in this region. If these events were to occur in the future, they could adversely affect our equipment lessees and the general demand for shipping and lead to reduced demand for leased equipment or otherwise adversely affect us. Currently China is transitioning from an export based economy to a domestic demand economy. Any consequent reductions in demand for leased equipment could adversely impact our business, financial condition, results of operations and cash flows.
Consolidation and concentration in the container shipping industry could decrease the demand for leased containers.
We primarily lease containers to container shipping lines. The container shipping lines have historically relied on a large number of leased containers to satisfy their needs. Consolidation of major container shipping lines, such as between Cosco and China Shipping Container Lines in 2016, and between Maersk and Hamburg Süd in 2017, or the creation of additional operating alliances between shipping lines, could create efficiencies for the shipping lines and decrease demand for leased containers, because they may be able to fulfill a larger portion of their needs through their owned container fleets. It would also create increased concentration of credit risk if the number of our container lessees decreases due to consolidation. Additionally, large container shipping lines with significant resources could choose to manufacture their own containers, which would decrease their demand for leased containers and could have an adverse impact on our business, financial condition, results of operations and cash flows. Finally, decreased demand from shipping companies for leased containers could also occur due to consolidation caused by the financial failure of container shipping companies, such as the bankruptcy of Hanjin during 2016.
Changes in market price, availability or transportation costs of containers could adversely affect our ability to maintain our supply of containers.
We currently purchase almost all of our containers from manufacturers based in China. If it became more expensive for us to procure containers in China or to transport these units at a low cost from China to the locations where they are needed by our container lessees because of changes in exchange rates between the U.S. Dollar and Chinese Yuan, further consolidation among container suppliers, increased tariffs imposed by the United States or other governments or for any other reason, we may have to seek alternative sources of supply. While we are not currently dependent on any single current manufacturer of our containers, we may not be able to make alternative arrangements quickly enough to meet our container needs, and the alternative arrangements may increase our costs.
It may become more expensive for us to store our off-hire containers.
We are dependent on third-party depot operators to repair and store our equipment in port areas throughout the world. In many of these locations the land occupied by these depots is increasingly being considered as prime real estate. Accordingly, local communities are considering increasing restrictions on depot operations which may increase their costs of operation and in some cases force depots to relocate to sites further from port areas. Additionally, depots in prime locations may become filled to capacity based on market conditions and may refuse additional containers due to space constraints. This could require us to enter into higher-cost storage agreements with third-party depot operators in order to accommodate our customers’ turn-in requirements and could result in increased costs and expenses for us. If these changes affect a large number of our depots it could significantly increase the cost of maintaining and storing our off-hire containers.
18
We face extensive competition in the equipment leasing industry.
We may be unable to compete favorably in the highly competitive equipment leasing business. We compete with a number of major leasing companies, many smaller lessors, manufacturers of equipment, companies and financial institutions offering finance leases, promoters of equipment ownership and leasing as a tax-efficient investment, container shipping lines (which sometimes lease their excess container stocks), and suppliers of alternative types of containers for freight transport. Some of these competitors have greater financial resources and access to capital than we do. Additionally, some of these competitors may have large, underutilized inventories of equipment, which could lead to significant downward pressure on per diem rates, margins and prices of equipment.
Our business requires large amounts of working capital to fund our operations. We are aware that some of our competitors have had ownership changes and there has been consolidation in the industry in recent years. As a consequence, these competitors may have greater resources available to aggressively seek to expand their market share. This could include offering lease rates with which we may not be able to effectively compete. We may not be able to compete successfully against these competitors.
Competition among equipment leasing companies depends upon many factors, including, among others, per diem rates; lease terms, including lease duration, drop-off restrictions and repair provisions; customer service; and the location, availability, quality and individual characteristics of equipment units. The highly competitive nature of our industry may reduce lease rates and margins and undermine our ability to maintain our current level of container utilization or achieve our growth plans.
The international nature of our business exposes us to numerous risks.
Our ability to enforce lessees’ obligations will be subject to applicable law in the jurisdiction in which enforcement is sought. As containers are predominantly located on international waterways, it is not possible to predict, with any degree of certainty, the jurisdictions in which enforcement proceedings may be commenced. For example, repossession from defaulting lessees may be difficult and more expensive in jurisdictions in which laws do not confer the same security interests and rights to creditors and lessors as those in the United States and in jurisdictions where recovery of containers from defaulting lessees is more cumbersome. As a result, the relative success and expedience of enforcement proceedings with respect to containers in various jurisdictions cannot be predicted.
We are also subject to risks inherent in conducting business across national boundaries, any one of which could adversely impact our business. These risks include:
regional or local economic downturns;
changes in governmental policy or regulation;
restrictions on the transfer of funds into or out of the countries in which we operate;
value-added tax and other sales-type taxes which could result in additional costs to us if they are not properly collected or paid;
domestic and foreign customs and tariffs;
international incidents;
war, hostilities, terrorist attacks, piracy, or the threat of any of these events;
government instability;
nationalization of foreign assets;
government protectionism;
compliance with export controls, including those of the U.S. Department of Commerce;
compliance with import procedures and controls, including those of the U.S. Department of Homeland Security;
consequences from changes in tax laws, including tax laws pertaining to container investors;
potential liabilities relating to foreign withholding taxes;
labor or other disruptions at key ports;
difficulty in staffing and managing widespread operations;
|
· |
restrictive local employment laws; and |
restrictions on our ability to own or operate subsidiaries, make investments or acquire new businesses in these jurisdictions.
One or more of these factors could impair our current or future international operations and, as a result, harm our overall business, financial condition, results of operations and cash flows.
19
We may incur costs associated with new security regulations, which may adversely affect our business, financial condition and results of operations.
We may be subject to regulations promulgated in various countries, including the United States, seeking to protect the integrity of international commerce and prevent the use of equipment for international terrorism or other illicit activities. For example, the Container Security Initiative, the Customs-Trade Partnership Against Terrorism and Operation Safe Commerce are among the programs administered by the U.S. Department of Homeland Security that are designed to enhance security for cargo moving throughout the international transportation system by identifying existing vulnerabilities in the supply chain and developing improved methods for ensuring the security of containerized cargo entering and leaving the United States. Moreover, the International Convention for Safe Containers, 1972 (CSC), as amended, adopted by the International Maritime Organization, applies to new and existing containers and seeks to maintain a high level of safety of human life in the transport and handling of containers by providing uniform international safety regulations. As these regulations develop and change, we may incur compliance costs due to the acquisition of new, compliant equipment and/or the adaptation of existing equipment to meet new requirements imposed by such regulations. Additionally, certain companies are currently developing or may in the future develop products designed to enhance the security of equipment transported in international commerce. Regardless of the existence of current or future government regulations mandating the safety standards of intermodal shipping equipment, our competitors may adopt such products or our equipment lessees may require that we adopt such products. In responding to such market pressures, we may incur increased costs, which could have a material adverse effect on our business, financial condition, results of operations and cash flows.
We operate in numerous tax jurisdictions and a taxing authority within any of these jurisdictions may challenge our operating structure which could result in additional taxes, interest and penalties that could materially impact our financial conditions and our future financial results.
We have structured our Company and its domestic and international subsidiaries to minimize our income tax obligations in countries in which we operate. There can be no assurance that our tax structure and the amount of taxes we pay in any of these countries will not be challenged by the relevant taxing authorities. If the tax authorities challenge our tax positions or the amount of taxes paid for the purchase, lease or sale of equipment in each jurisdiction in which we operate, we could incur substantial expenses associated with defending our tax position as well as expenses associated with the payment of any additional taxes, penalties and interest that may be imposed on us. The payment of these amounts could have an adverse material effect on our business, financial condition, results of operations and cash flows.
Environmental liability may adversely affect our business and financial condition.
We are subject to federal, state, local and foreign laws and regulations relating to the protection of the environment, including those governing the discharge of pollutants to air, ground and water, the management and disposal of hazardous substances and wastes and the cleanup of contaminated sites. We could incur substantial costs, including cleanup costs, fines and costs arising out of third-party claims for property or natural resource damage and personal injury, as a result of violations of or liabilities under environmental laws and regulations in connection with our or our lessees’ current or historical operations. Under some environmental laws in the United States and certain other countries, the owner or operator of a container may be liable for environmental damage, cleanup or other costs in the event of a spill or discharge of material from a container without regard to whether or not the spill or discharge was the fault of the owner or operator. While we typically maintain liability insurance and typically require lessees to provide us with indemnity against certain losses, insurance coverage may not be sufficient, or available, to protect against any or all liabilities and such indemnities may not be sufficient to protect us against losses arising from environmental damage. Moreover, our lessees may not have adequate resources, or may refuse to honor their indemnity obligations and our insurance coverage is subject to large deductibles, coverage limits and significant exclusions.
Many countries, including the United States, restrict, prohibit or otherwise regulate the use of chemical refrigerants due to their ozone depleting and global warming effects. Our refrigerated containers currently use R134A or 404A refrigerant. While R134A and 404A do not contain CFCs (which have been restricted since 1995), the European Union has instituted regulations beginning in 2011 to phase out the use of R134A in automobile air conditioning systems due to concern that the release of R134A into the atmosphere may contribute to global warming. While the European Union regulations do not currently restrict the use of R134A or 404A in refrigerated containers or trailers, it has been proposed that, beginning in 2025, R134A and 404A usage in refrigerated containers will be banned, although the final decision has not yet been made. Further, certain manufacturers of refrigerated containers, including the largest manufacturer of cooling machines for refrigerated containers, have begun testing units that utilize alternative refrigerants, such as carbon dioxide, that may have less global warming potential than R134A and 404A. If future regulations prohibit the use or servicing of containers using R134A or 404A refrigerants, we could be forced to incur large retrofitting expenses. In addition, refrigerated containers that are not retrofitted may become difficult to lease, command lower rental rates and disposal prices, or may have to be scrapped.
20
Before 2010, foam insulation in the walls of intermodal refrigerated containers required the use of a blowing agent that contained hydrochlofluorcarbons (CFCs, specifically HCFC-141b). Since 2010, our manufacturers have phased out the use of this blowing agent in the manufacturing process, replacing that blowing agent with cyclopentane, which contains no CFCs. However, we may still have intermodal refrigerated containers in our fleet that used HCFC-141b in their production. The European Union (EU) prohibits the import and the placing on the market in the EU of intermodal containers with insulation made with HCFC-141b (EU Regulation). However, the European Commission has recognized that notwithstanding its regulation, under international conventions governing free movement of intermodal containers, the use of such intermodal refrigerated containers admitted into EU countries on temporary customs admission should be permitted. Each country in the EU has its own individual and different regulations to implement the EU Regulation. We have procedures in place that we believe comply with the EU and country regulations. However, if such intermodal refrigerated containers exceed their temporary customs admission period and/or their custom admissions status changes (e.g., should such container be off-hired) and such intermodal refrigerated containers are deemed placed on the market in the EU, or if our procedures are deemed not to comply with EU or a country’s regulation, we could be subject to fines and penalties. Also, if future international conventions or regulations prohibit the use or servicing of containers with foam insulation that utilized this blowing agent during the manufacturing process, we could be forced to incur large retrofitting expenses and those containers that are not retrofitted may become more difficult to lease and command lower rental rates and disposal prices.
An additional environmental concern affecting our operations relates to the construction materials used in our dry containers. The floors of dry containers are plywood, usually made from tropical hardwoods. Due to concerns about the de-forestation of tropical rain forests and climate change, many countries that have been the source of these hardwoods have implemented severe restrictions on the cutting and export of these woods. Accordingly, container manufacturers have switched a significant portion of production to more readily available alternatives such as birch, bamboo, and other farm grown wood species. Container users are also evaluating alternative designs that would limit the amount of plywood required and are also considering possible synthetic materials to replace the plywood. These new woods or other alternatives have not proven their durability over the typical 10 to 15 year life of a dry container, and if they cannot perform as well as the hardwoods have historically, the future repair and operating costs for these containers could be significantly higher and the useful life of the containers may be decreased.
Use of counterfeit and improper refrigerant in refrigeration machines for refrigerated containers could result in irreparable damage to the refrigeration machines, death or personal injury, and materially impair the value of our refrigerated container fleet.
There are reports of counterfeit and improper refrigerant gas being used to service refrigeration machines. The use of this counterfeit gas has led to the explosion of several refrigeration machines within the industry. A small number of these incidents have resulted in personal injury or death and, in all cases, the counterfeit gas has led to irreparable damage to the refrigeration machines.
A testing procedure has been developed and approved by the IICL to determine whether counterfeit gas has been used to service a refrigeration machine. These tests are carried out on our refrigeration machines when they are off-hired and returned to a depot. If such tests are not proven safe and effective or if the use of such counterfeit and improper refrigerant is more widespread than currently believed, the value of our refrigerated container fleet and our ability to lease refrigerated containers could be materially impaired and could therefore have a material adverse effect on our business, financial condition, results of operations and cash flows.
Certain liens may arise on our equipment.
Depot operators, repairmen and transporters may come into possession of our equipment from time to time and have sums due to them from lessees or sub-lessees of equipment. In the event of nonpayment of those charges by lessees or sub-lessees, we may be delayed in, or entirely barred from, repossessing equipment, or be required to make payments or incur expenses to discharge liens on our equipment.
The lack of an international title registry for containers increases the risk of ownership disputes.
There is no internationally recognized system of recordation or filing to evidence our title to containers nor is there an internationally recognized system for filing security interests in containers. Although we have not incurred material problems with respect to this lack of an internationally recognized system, the lack of an international title recordation system for containers could result in disputes with lessees, end-users, or third parties who may improperly claim ownership of the containers.
21
Risks Related to Railcar Leasing
Weak economic conditions, financial market volatility, and other factors may decrease customer demand for our assets and services and negatively impact our business and results of operations.
We rely on continued demand from our customers to lease our railcars. Demand for railcars depends on the markets for our customers’ products and services and the strength and growth of their businesses. Some of our customers operate in cyclical markets, such as the steel, chemical, energy and construction industries, which are susceptible to macroeconomic downturns and may experience significant changes in demand over time. Weakness in certain sectors of the economy in the United States and other parts of the world may make it more difficult for us to lease certain types of railcars that are either returned at the end of a lease term or returned as a result of a customer bankruptcy or default. We have experienced continued weakness in macroeconomic conditions in the railcar business over the last year.
In many cases, demand for our assets also depends on our customers’ desire to lease, rather than buy, the assets. Tax and accounting considerations, interest rates, and operational flexibility, among other factors, may influence a customer’s decision to lease or buy assets. We have no control over these external considerations, and changes in these factors, including potential changes to lease accounting rules, could negatively impact demand for our assets held for lease.
Additional factors, such as changes in harvest or production volumes, changes in supply chains, choices in types of transportation assets, availability of substitutes and other operational needs may also influence customer demand for our assets. Significant declines in customer demand for our assets and services or continued weakness in macroeconomic conditions in the railcar business could adversely affect our financial performance.
We may be unable to maintain assets on lease at satisfactory rates.
Our profitability depends on our ability to lease railcars at satisfactory rates, sell railcars, and to re-lease railcars upon lease expiration. Circumstances such as economic downturns, changes in customer behavior, excess capacity in particular railcar types or generally in the marketplace, or other changes in supply or demand can adversely affect asset utilization rates and lease rates. Economic uncertainty or a decline in customer demand for our railcars could cause customers to request shorter lease terms and lower lease rates, which may result in a decrease in our asset utilization rate and reduced revenues. Alternatively, customers may seek to lock-in relatively low lease rates for longer terms, which may result in an adverse impact on current or future revenues.
We enter long-term railcar purchase commitments that could subject us to material operational and financial risks.
In order to obtain committed access to a supply of newly built railcars on competitive terms, we have entered into long-term supply agreements with manufacturers to purchase significant numbers of newly built railcars over a multi-year period. In many cases, we cannot economically cancel or materially reduce or reschedule our orders under these purchase commitments. If economic conditions weaken during the term of a long-term supply agreement, it is possible that we may be required to continue to accept delivery of, and pay for, new railcars at times when it may be difficult for us to lease such railcars and our financing costs may be high, which could negatively affect our revenues and profitability. For example, in 2015 we entered into a multi-year railcar order (the “Agreement”) with a railcar manufacturer to purchase 2,000 new railcars. In 2017, we entered into an amendment to the Agreement, by which we modified the type of railcars yet to be delivered as of the date of the amendment. As of December 31, 2017, 1,267 railcars had been delivered under the Agreement; the remaining 733 railcars are to be delivered in 2018 at a cost of $78.5 million. Due to a weak and highly competitive railcar leasing environment, 598 of these cars currently remain off-lease. We intend to place all of these railcars on multi-year leases, but if we are not able to do so at rates that are sufficient to earn a return on our investment, it could have a material adverse effect on our business, financial condition, results of operations and cash flows.
A significant and sustained decrease in the price of crude oil and related products could reduce customer demand for our railcars.
Demand for railcars that are used to transport commodities used in drilling operations, including frac sand, is dependent on the demand for these commodities. Sustained low oil prices could cause oil producers to curtail the drilling of new wells or cease production at certain existing wells that are uneconomical to operate at current crude price levels. Reduced oil drilling activity could result in decreased demand for our railcars used to transport the commodities used in drilling operations, such as frac sand.
Changes in railroad efficiency may adversely affect demand for our railcars.
Railroad infrastructure investments that improve efficiency or declines in rail traffic due to decreased demand could increase the average speed at which railroads can operate their trains, which may reduce the number of railcars needed for railroads to haul the same amount of cargo. Adverse weather conditions, railroad mergers, and increase in rail traffic could result in slower transit times making rail transportation less attractive to shippers versus other modes of transport. In each case, these changes could reduce demand for our railcars and negatively impact revenue and our result of operations.
22
A significant decrease in lease renewals by our customers could negatively impact operations and substantially increase our costs.
Decreases in customer demand for our railcars could increase the number of leases that are not renewed upon expiration, resulting in the early return of railcars. Railcars that are returned by our customers often must undergo maintenance and service work before being leased to new customers. A significant increase in the number of railcars requiring maintenance may negatively affect our operations and substantially increase maintenance and other related costs. In addition, low demand for certain types of railcars in our fleet may make those railcars more difficult to lease to new customers if they are returned at the end of their existing leases or following a customer default, which could negatively affect our results of operations.
Our rail operations are subject to various laws, rules, and regulations. If these laws, rules, and regulations change or we fail to comply with them, it could have a significant negative effect on our business and profitability.
Our rail operations are subject to various laws, rules, and regulations administered by authorities in jurisdictions where we do business. In the United States, our railcar fleet is subject to safety, operations, maintenance, and mechanical standards, rules, and regulations enforced by various federal and state agencies and industry organizations, including the U.S. Department of Transportation, the Federal Railroad Administration, and the Association of American Railroads. State agencies regulate some health and safety matters related to rail operations not otherwise preempted by federal law. Our business and railcar fleet may be adversely impacted by new rules or regulations, or changes to existing rules or regulations, which could require additional maintenance or substantial modification or refurbishment of our railcars, or could make certain types of railcars inoperable or obsolete or require them to be phased out prior to the end of their useful lives. In addition, violations of these rules and regulations can result in substantial fines and penalties, including potential limitations on operations or forfeitures of assets.
We are subject to extensive environmental regulations and the costs of remediation may be material.
We are subject to extensive federal, state, and local environmental laws and regulations concerning, among other things, the discharge of hazardous materials. Under some environmental laws in the United States, the owner of a leased railcar may be liable for environmental damage, cleanup or other costs in the event of a spill or discharge of material from a railcar without regard to the owner’s fault. We routinely assess environmental liabilities, including our potential obligations and the possible amount of recoveries from other responsible parties. Due to the regulatory complexities and the potential liability for the operations of our lessees, it is possible environmental and remediation costs could adversely affect our financial performance.
We may incur future asset impairment charges.
We review long-lived assets for impairment regularly, or when circumstances indicate the carrying value of an asset or investment may not be recoverable. Among other circumstances, the following may change our estimates of the cash flows we expect our long-lived assets will generate, which could require us to recognize asset impairment charges:
a weak economic environment or challenging market conditions;
new laws, rules or regulations affecting our assets, or changes to existing laws, rules or regulations;
events related to particular customers or asset types; and
asset portfolio sale decisions by management.
Our assets may become obsolete.
In addition to changes in laws, rules, and regulations that may make assets obsolete, changes in the preferred method our customers use to ship their products, changes in demand for particular products, or a shift by customers toward purchasing assets rather than leasing them may adversely impact us. Our customers' industries are driven by dynamic market forces and trends, which are influenced by economic and political factors. Changes in our customers' markets may significantly affect demand for our rail assets. A reduction in customer demand or change in customers' preferred method of product transportation could result in the economic obsolescence of the assets leased by those customers.
Competition could result in decreased profitability.
We operate in a highly competitive business environment. In certain cases, our competitors are larger than we are and have greater financial resources, higher credit ratings, and a lower cost of capital. In addition, we compete against railcar manufacturers that have leasing subsidiaries. These factors may enable our competitors to offer leases to customers at lower rates than we can provide, thus negatively impacting our profitability, asset utilization and investment volume.
23
We derive a substantial portion of our revenue from a limited number of railcar lessees. The loss of, or reduction in business by, any of these railcar lessees, or a default from any large railcar lessee, could result in a significant loss of revenue and cash flow.
We have derived, and believe that we will continue to derive, a significant portion of our revenue and cash flow from a limited number of railcar lessees. Revenue from our ten largest railcar lessees represented 47.8% of total revenue for this segment for the year ended December 31, 2017. The loss of such customers would have a material adverse impact on our business, financial condition, results of operations and cash flows. In addition, a default by any of our largest railcar lessees would result in a major reduction in our leasing revenue, large repossession expenses, potentially large lost equipment charges and a material adverse impact on our performance and financial condition.
Lessee defaults may adversely affect our business, results of operations and financial condition by decreasing revenue and increasing storage, repositioning, collection and recovery expenses.
Our railcar equipment is leased to numerous lessees. Lessees are required to pay rent and indemnify us for damage to or loss of equipment. Lessees may default in paying rent and performing other obligations under their leases. A delay or diminution in amounts received under the leases, or a default in the performance of maintenance or other lessee obligations under the leases could adversely affect our business, financial condition, results of operations and cash flows and our ability to make payments on our debt.
Our cash flows from railcar equipment, principally railcar rental revenue, are affected significantly by the ability to collect payments under leases and the ability to replace cash flows from terminating leases by re-leasing or selling equipment on favorable terms. All of these factors are subject to external economic conditions and the performance by lessees and service providers that are not within our control.
In addition, when lessees default, we may fail to recover all of our equipment, and the equipment we do recover may be returned in damaged condition or to locations where we will not be able to efficiently re-lease or sell the equipment. As a result, we may have to repair and reposition the equipment to other places where we can re-lease or sell it, and we may lose revenue and incur additional operating expenses in repossessing, repositioning and storing the equipment.
We maintain insurance to reimburse the Company for customer defaults. The insurance agreements are subject to deductibles of $3.0 million or $3.5 million per occurrence, depending on the customer’s credit rating, and have significant exclusions and, therefore, may not be sufficient to prevent us from suffering material losses. Our level of insurance cover in 2018 is limited to $11.5 million or $12.0 million per occurrence and $18.0 million and $19.0 million in aggregate, depending on the customer’s credit rating. Additional insurance claims made by the Company may result in such insurance not being available to us in the future on commercially reasonable terms, or at all.
Certain liens may arise on our equipment.
Depot operators and repairmen may come into possession of our equipment from time to time and have sums due to them from lessees or sub-lessees of equipment. In the event of nonpayment of those charges by lessees or sub-lessees, we may be delayed in, or entirely barred from, repossessing equipment, or be required to make payments or incur expenses to discharge liens on our equipment.
Risk Related to Logistics
Because we depend on railroads for our operations, our operating results and financial condition are likely to be adversely affected by any reduction or deterioration in rail service.
We depend on the major railroads in the United States for virtually all of the intermodal services we provide. In many markets, rail service is limited to one or two railroads. Consequently, a reduction in, or elimination of, rail service to a particular market is likely to adversely affect our ability to provide intermodal transportation services to some of our customers. In addition, the railroads are relatively free to adjust shipping rates up or down as market conditions permit. Rate increases would result in higher intermodal transportation costs, reducing the attractiveness of intermodal transportation compared to truck or other transportation modes, which could cause a decrease in demand for our services. Further, our ability to continue to expand our intermodal transportation business is dependent upon the railroads’ ability to increase capacity for intermodal freight and provide consistent and reliable service. Our business could also be adversely affected by a work stoppage at one or more railroads or by adverse weather conditions or other factors that hinder the railroads’ ability to provide reliable transportation services. In the past, there have been service issues when railroads have merged. As a result, we cannot predict what effect, if any, further consolidations among railroads may have on intermodal transportation services or our results of operations.
Because our relationships with the major railroads are critical to our ability to provide intermodal transportation services, our business may be adversely affected by any change to those relationships.
We have important relationships with certain major U.S. railroads. To date, the railroads have chosen to rely on us, other IMCs and other intermodal competitors to market their intermodal services rather than fully developing their own marketing capabilities. If one or more of the major railroads were to decide to reduce their dependence on us, the volume of intermodal shipments we arrange would likely decline, which could adversely affect our results of operations and financial condition.
24
Because we rely on drayage companies in our intermodal operations, our ability to expand our business or maintain our profitability may be adversely affected by a shortage of drivers and drayage capacity.
In certain markets we serve, we use third-party drayage companies for pickup and delivery of some or all of our intermodal containers. Most drayage companies operate relatively small fleets and have limited access to capital for fleet expansion. In some of our markets, there are a limited number of drayage companies that can meet our quality standards. This could limit our ability to expand our intermodal business or require us to establish more of our own drayage operations in some markets, which could increase our operating costs and could adversely affect our profitability and financial condition. Also, the trucking industry periodically experiences a shortage of available drivers, which may limit the ability of third-party drayage companies to expand their fleets. This shortage also may require them to increase drivers’ compensation, thereby increasing our cost of providing drayage services to our customers. Therefore, the driver shortage could also adversely affect our profitability and limit our ability to expand our intermodal business.
Because we depend on trucking companies for our truck brokerage services, our ability to maintain or expand our truck brokerage business may be adversely affected by a shortage of trucking capacity.
We depend upon various third-party trucking companies for the transportation of our customers’ loads. Particularly during periods of economic expansion, trucking companies may be unable to expand their fleets due to capital constraints or chronic driver shortages, and these trucking companies also may raise their rates. If we face insufficient capacity among our third-party trucking companies, we may be unable to maintain or expand our truck brokerage business. Also, we may be unable to pass rate increases on to our customers, which could adversely affect our profitability.
Our results of operations are susceptible to changes in general economic conditions and cyclical fluctuations.
Economic recession, customers’ business cycles, changes in fuel prices and supply, interest rate fluctuations, increases in fuel or energy taxes and other general economic factors affect the demand for transportation services and the operating costs of railroads, trucking companies and drayage companies. We have little or no control over any of these factors or their effects on the transportation industry. Increases in the operating costs of railroads, trucking companies or drayage companies can be expected to result in higher freight rates. Our operating margins could be adversely affected if we were unable to pass through to our customers the full amount of higher freight rates. Economic recession or a downturn in customers’ business cycles also may have an adverse effect on our results of operations and growth by reducing demand for our services. Therefore, our results of operations, like the entire freight transportation industry, are cyclical and subject to significant period-to-period fluctuations.
Relatively small increases in our transportation costs that we are unable to pass through to our customers are likely to have a significant effect on our gross margin and operating income.
Because transportation costs represent such a significant portion of our costs, even relatively small increases in these transportation costs, if we are unable to pass them through to our customers, are likely to have a significant effect on our gross margin and operating income.
The transportation industry is subject to government regulation, and regulatory changes could have a material adverse effect on our operating results or financial condition.
We are licensed by the Department of Transportation as freight brokers. The Department of Transportation prescribes qualifications for acting in this capacity, including surety bond requirements. As freight brokers, we may become subject to new or more restrictive regulations relating to new laws and regulations specific to legal liability, such as motor carriers are today. Future laws and regulations may be more stringent and require changes in operating practices, influence the demand for transportation services or increase the cost of providing transportation services, any of which could adversely affect our business and results of operations.
We are not able to accurately predict how new governmental laws and regulations, or changes to existing laws and regulations, will affect the transportation industry generally, or us in particular. Although government regulation that affects us and our competitors may simply result in higher costs that can be passed along to customers, that may not be the case.
Our operations may be subject to various environmental laws and regulations, the violation of which could result in substantial fines or penalties.
From time to time, we arrange for the movement of hazardous materials at the request of our customers. As a result, we may be subject to various environmental laws and regulations relating to the handling of hazardous materials. If we are involved in a spill or other accident involving hazardous materials, or if we are found to be in violation of applicable laws or regulations, we could be subject to substantial fines or penalties and to civil and criminal liability, any of which could have an adverse effect on our business and results of operations.
25
We derive a significant portion of our logistics revenue from our largest customers and the loss of several of these customers could have a material adverse effect on our revenue and business.
Revenue from our ten largest customers represented 39.7% of total revenue for this segment for the year ended December 31, 2017. A reduction in or termination of our services by such customers could have a material adverse effect on our revenue and business.
Our obligation to pay our carriers is not contingent upon receipt of payment from our clients, and we extend credit to certain clients as part of our business model.
In most cases, we take full risk of credit loss for the transportation services we procure from carriers. Our obligation to pay our carriers is not contingent upon receipt of payments from our clients. If any of our key clients fail to pay for our services, our profitability would be negatively impacted.
We extend credit to certain clients in the ordinary course of business as part of our business model. By extending credit, we increase our exposure to uncollected receivables. A deterioration in the global or domestic economy could drive an increase in business failures, downsizing and delinquencies, which could cause an increase in our credit risk. If we fail to monitor and manage effectively any increased credit risk, our immediate and long-term liquidity may be adversely affected.
An economic downturn could materially adversely affect our business.
Our operations and performance depend significantly on economic conditions. Uncertainty about global economic conditions poses a risk as consumers and businesses may postpone spending in response to tighter credit, negative financial news and/or declines in income, which could have a material negative effect on demand for transportation services. We are unable to predict the likely duration and severity of disruptions in the financial markets and adverse global economic conditions. If economic conditions deteriorate, our business and results of operations could be materially and adversely affected. Other factors that could influence demand include fluctuations in fuel costs, labor costs, consumer confidence, international trade or military conflicts, and other macroeconomic factors affecting consumer spending behavior. There could be a number of follow-on effects from a credit crisis on our business, including the insolvency of key transportation providers and the inability of our customers to obtain credit to finance development and/or manufacture products resulting in a decreased demand for transportation services. Our revenues and gross margins are dependent upon this demand, and if demand for transportation services declines, our revenues and gross margins could be adversely affected.
Continued weakness in the logistics business could have an adverse effect on our overall business, results of operations and financial condition, and may require us to record an impairment charge with respect to the assets relating to our logistics business.
We have recently reported losses in our logistics business. Continued weakness or other disruptions in the logistics segment could have a material adverse effect on our overall business, results of operations or financial condition, and could require us to record impairment charges in the future with respect to the assets relating to our logistics business. Any impairment charge would result in an immediate reduction to our earnings in the period in which the charge is taken, which could have a material adverse effect on our results of operations and financial condition.
General Business Risks
Our level of indebtedness reduces our financial flexibility and could impede our ability to operate.
We have a significant amount of indebtedness and we intend to borrow additional amounts under our credit facilities to purchase equipment and make acquisitions and other investments. We expect that we will maintain a significant amount of indebtedness on an ongoing basis. As of December 31, 2017, our total outstanding debt was $1,714.5 million. Interest expense on such debt will be $13.3 million per quarter for 2018, assuming floating interest rates remain consistent with those as of December 31, 2017. There is no assurance that we will be able to refinance our outstanding indebtedness when it becomes due, or, if refinancing is available, that it can be obtained on terms that we can afford.
Some of our credit facilities require us to pay a variable rate of interest, which will increase or decrease based on variations in certain financial indexes, and increases in interest rates can significantly decrease our profits. We do not have any hedge or similar contracts that would protect us against changes in interest rates.
The amount of our indebtedness could have important consequences for us, including the following:
requiring us to dedicate a substantial portion of our cash flow from operations to make payments on our debt, thereby reducing funds available for operations, future business opportunities and other purposes;
limiting our flexibility in planning for, or reacting to, changes in our business and the industry in which we operate;
making it more difficult for us to satisfy our debt obligations, and any failure to comply with such obligations, including financial and other restrictive covenants, could result in an event of default under the agreements governing such indebtedness, which could lead to, among other things, an acceleration of our indebtedness or foreclosure on the assets
26
securing our indebtedness, which could have a material adverse effect on our business, financial condition, results of operations and cash flows;
making it difficult for us to pay dividends on, or repurchase, our common stock;
placing us at a competitive disadvantage compared to our competitors having less debt;
limiting our ability to borrow additional funds, or to sell assets to raise funds, if needed, for working capital, capital expenditures, acquisitions or other purposes; and
increasing our vulnerability to general adverse economic and industry conditions, including changes in interest rates.
We may not generate sufficient cash flow from operations to service and repay our debt and related obligations and have sufficient funds left over to achieve or sustain profitability in our operations, meet our working capital and capital expenditure needs or compete successfully in our industry.
We will require a significant amount of cash to service and repay our outstanding indebtedness and our ability to generate cash depends on many factors beyond our control.
Our ability to make payments on and repay our indebtedness and to fund planned capital expenditures will depend on our ability to generate cash in the future. As of December 31, 2017, our total outstanding debt was $1,714.5 million. Interest expense on such debt will be $13.3 million per quarter in 2018, assuming floating interest rates remain consistent with those at December 31, 2017. These amounts will increase to the extent we borrow additional funds and if interest rates increase. It is possible that:
our business will not generate sufficient cash flow from operations to service and repay our debt and to fund working capital requirements and planned capital expenditures;
future borrowings will not be available under our current or future credit facilities in an amount sufficient to enable us to refinance our debt; or
we will not be able to refinance any of our debt on commercially reasonable terms or at all.
Our credit facilities impose, and the terms of any future indebtedness may impose, significant operating, financial and other restrictions on us and our subsidiaries.
Restrictions imposed by our credit facilities or other indebtedness will limit or prohibit, among other things, our ability to:
incur additional indebtedness;
pay dividends on or redeem or repurchase our stock;
enter into new lines of business;
issue capital stock of our subsidiaries (except to the Company);
make loans and certain types of investments;
create liens;
sell certain assets or merge with or into other companies;
enter into certain transactions with stockholders and affiliates; and
restrict dividends, distributions or other payments from our subsidiaries.
These restrictions could adversely affect our ability to finance our future operations or capital needs and pursue available business opportunities. A breach of any of these restrictions, including a breach of financial covenants, could result in a default in respect of the related indebtedness. If a default occurs, the relevant lenders could elect to declare the indebtedness, together with accrued interest and fees, to be immediately due and payable and proceed against any collateral securing that indebtedness, which would constitute substantially all of our equipment assets.
27
Security breaches and other disruptions could compromise our information technology systems and expose us to a liability, which could have a material adverse effect on our business, results of operations and our reputation.
In the ordinary course of business, we collect and store sensitive data on our systems and networks, including our proprietary business information and that of our customers and suppliers, and personally identifiable information of our customers and employees. The secure storage, processing, maintenance and transmission of this information is critical to our operations. Despite security measures we employ, our information technology systems and networks may be vulnerable to attacks by hackers or breached due to employee error, malfeasance or other disruptions. Hackers and data thieves are increasingly sophisticated and operate large-scale and complex automated attacks. Any breach of our network may result in the loss of valuable business data, misappropriation of our consumers’ or employees’ personal information, or a disruption of our business. Despite our existing security procedures and controls, if our network becomes compromised, it could give rise to unwanted media attention, materially damage our customer relationships, harm our business, our reputation, and our financial results, which could result in fines or lawsuits, and may increase the costs we incur to protect against such information security breaches, such as increased investment in technology, the costs of compliance with consumer protection laws, and costs resulting from consumer fraud.
We are subject to legislative, regulatory, and legal developments involving taxes.
Taxes are a significant part of our expenses. We are subject to U.S. federal, state, and foreign income, payroll, property, sales and use, fuel, and other types of taxes. Changes in tax rates, such as those included in the recently enacted U.S. Tax Cuts and Jobs Act, enactment of new tax laws, revisions of tax regulations, and claims or litigation with taxing authorities could result in a material effect to our results of operations, financial condition, and liquidity. Higher tax rates could have a material adverse effect on our results of operations, financial condition, and liquidity.
Actual or threatened terrorist attacks, efforts to combat terrorism, or the outbreak of war and hostilities could negatively impact our operations and profitability and may expose us to liability.
Terrorist attacks and the threat of such attacks have contributed to economic instability in the United States and elsewhere, and further acts or threats of terrorism, violence, war or hostilities could similarly affect world trade and the industries in which we and our customers operate. In addition, terrorist attacks or hostilities may directly impact ports, depots, our facilities or those of our suppliers or customers, and could impact our sales and our supply chain. A severe disruption to the worldwide ports system and flow of goods could result in a reduction in the level of international trade and lower demand for our equipment or services. Any of these events could also negatively affect the economy and consumer confidence, which could cause a downturn in the transportation industry. The consequence of any terrorist attacks or hostilities are unpredictable, and we may not be able to foresee events that could have an adverse effect on our operations
It is also possible that our equipment could be involved in a terrorist attack. Although our lease agreements require our lessees to indemnify us against all damages arising out of the use of our containers, and we carry insurance to potentially offset any costs in the event that our customer indemnifications prove to be insufficient, our insurance does not cover certain types of terrorist attacks, and we may not be fully protected from liability of the reputational damage that could arise from a terrorist attack which utilizes one of our containers.
Our operations could be affected by natural or man-made events in the locations in which we or our customers or suppliers operate.
We have operations in locations subject to severe weather conditions, natural disasters, the outbreak of contagious disease, or man-made incidents such as chemical explosions, any of which could disrupt our operations. In addition, our suppliers and customers also have operations in such locations. For example, in 2015, a chemical explosion and fire in the port of Tianjin, China damaged or destroyed a small number of our containers and disrupted operations in the port. Similarly, outbreaks of pandemic or contagious diseases, such as H1N1 (swine) flu and the Ebola virus, could significantly reduce the demand for international shipping or could prevent our containers from being discharged in the affected areas or in other locations after having visited the affected areas. Any future natural or man-made disasters or health concerns in the world where we have business operations could lead to disruption of the regional and global economies, which could result in a decrease in demand for leased containers.
We may be affected by market or regulatory responses to climate change.
Changes in laws, rules, and regulations, or actions by authorities under existing laws, rules, or regulations, to address greenhouse gas emissions and climate change could negatively impact our customers and business. For example, restrictions on emissions could significantly increase costs for our customers whose production processes require significant amounts of energy. Customers' increased costs could reduce their demand to lease our assets. Potential consequences of laws, rules, or regulations addressing climate change could have an adverse effect on our financial position, results of operations, and cash flows.
28
Our business could be adversely affected by strikes or work stoppages by draymen, truckers, port workers and railroad workers.
There has been labor unrest, including strikes and work stoppages, among workers at various transportation providers and in industries affecting the transportation industry, such as port workers. We could lose business due to any significant work stoppage or slowdown and, if labor unrest results in increased rates for transportation providers such as draymen, we may not be able to pass these cost increases on to our customers. Strikes among longshoremen and clerical workers at ports in the past few years have slowed down the ports for a time, creating a major impact on the transportation industry. Work stoppages occurring among owner-operators in a specific market have increased our operating costs periodically over the past several years. In the past several years, there have been strikes involving railroad workers. Future strikes by railroad workers in the United States, Canada or anywhere else that our customers’ freight travels by railroad would impact our operations. Any significant work stoppage, slowdown or other disruption involving ports, railroads, truckers or draymen could adversely affect our business and results of operations.
Our senior executives are critical to the success of our business and our inability to retain them or recruit new personnel could adversely affect our business.
Most of our senior executives and other management-level employees have over fifteen years of industry experience. We rely on this knowledge and experience in our strategic planning and in our day-to-day business operations. Our success depends in large part upon our ability to retain our senior management, the loss of one or more of whom could have a material adverse effect on our business, financial condition, results of operations and cash flows. Our success also depends on our ability to retain our experienced sales force and technical personnel as well as recruiting new skilled sales, marketing and technical personnel. Competition for these individuals in our industry is intense and we may not be able to successfully recruit, train or retain qualified personnel. If we fail to retain and recruit the necessary personnel, our business and our ability to obtain new equipment lessees and provide acceptable levels of customer service could suffer.
We rely on our information technology systems to conduct our business. If these systems fail to adequately perform their functions, or if we experience an interruption in their operation, our business, results of operations and financial prospects could be adversely affected.
The efficient operation of our business is highly dependent on our information technology systems. We rely on our systems to track transactions, such as repair and depot charges and changes to book value, and movements associated with each of our owned or managed equipment units. We use the information provided by our systems in our day-to-day business decisions in order to effectively manage our lease portfolio and improve customer service. We also rely on them for the accurate tracking of the performance of our managed fleet for each third-party investor, and the tracking and billing of logistics moves. The failure of our systems to perform as we expect could disrupt our business, adversely affect our financial condition, results of operations and cash flows and cause our relationships with lessees and third-party investors to suffer. In addition, our information technology systems are vulnerable to damage or interruption from circumstances beyond our control, including fire, natural disasters, power loss and computer systems failures, unauthorized breach and viruses. Any such interruption could have a material adverse effect on our business, reputation, results of operations and financial prospects.
As a U.S. corporation, we are subject to U.S. Executive Orders and U.S. Treasury Sanctions Regulations regarding doing business in or with certain nations and specially designated nationals.
As a U.S. corporation, we are subject to U.S. Executive Orders and U.S. Treasury Sanctions Regulations restricting or prohibiting business dealings in or with certain nations and with certain specially designated nationals (individuals and legal entities). Any determination that we have violated such Executive Orders and U.S. Treasury Sanctions Regulations could have a material adverse effect on our business, financial condition, results of operations and cash flows.
As a U.S. corporation, we are subject to the Foreign Corrupt Practices Act, and a determination that we violated this act may affect our business and operations adversely.
As a U.S. corporation, we are subject to the regulations imposed by the Foreign Corrupt Practices Act (FCPA), which generally prohibits U.S. companies and their intermediaries from making improper payments to foreign officials for the purpose of obtaining or keeping business. Any determination that we have violated the FCPA could have a material adverse effect on our business, financial condition, results of operations and cash flows.
29
A failure to comply with export control or economic sanctions laws and regulations could have a material adverse effect on our business, results of operations or financial condition. We may be unable to ensure that our agents and/or customers comply with applicable sanctions and export control laws.
We face several risks inherent in conducting our business internationally, including compliance with applicable economic sanctions laws and regulations, such as laws and regulations administered by the U.S. Department of Treasury’s Office of Foreign Assets Control (OFAC), the U.S. Department of State and the U.S. Department of Commerce. We must also comply with all applicable export control laws and regulations of the United States (including but not limited to the U.S. Export Administration Regulations) and other countries. Any determination of a violation or an investigation into violations of export controls or economic sanctions laws and regulations could result in significant criminal or civil fines, penalties or other sanctions and repercussions, including reputational harm that could materially affect our business, results of operations or financial condition.
We may pursue acquisitions or joint ventures in the future that could present unforeseen integration obstacles or costs.
We have pursued, and may continue to pursue, acquisitions and joint ventures in the future. Acquisitions involve a number of risks and present financial, managerial and operational challenges, including:
potential disruption of our ongoing business and distraction of management;
customer retention;
difficulty integrating personnel and financial and other systems;
hiring additional management and other critical personnel; and
increasing the scope, geographic diversity and complexity of our operations.
In addition, we may encounter unforeseen obstacles or costs in the integration of acquired businesses. Also, the presence of one or more material liabilities of an acquired company that are unknown to us at the time of acquisition may have a material adverse effect on our business. Acquisitions or joint ventures may not be successful, we may not realize any anticipated benefits from acquisitions or joint ventures, we may realize dilutive earnings per share from such activities, and acquired businesses and joint ventures may incur losses.
Fluctuations in foreign exchange rates could reduce our profitability.
Most of our revenues and costs are billed in U.S. dollars. Our operations and used equipment sales in locations outside of the U.S. have some exposure to foreign currency fluctuations, and trade growth and the direction of trade flows can be influenced by large changes in relative currency values. In addition, most of our container equipment fleet is manufactured in China. Although the purchase price is in U.S. dollars, our manufacturers pay labor and other costs in the local currency, the Chinese yuan. To the extent that our manufacturers’ costs increase due to changes in the valuation of the Chinese yuan, the dollar price we pay for equipment could be affected. Adverse or large exchange rate fluctuations may negatively affect our financial condition, results of operations and cash flows.
Risks Related to our Stock
Our stock price has been volatile and may remain volatile.
The trading price of our common stock may be subject to wide fluctuations in response to quarter-to-quarter variations in operating results, new products or services by us or our competitors, general conditions in the shipping industry and the intermodal equipment sales and leasing markets, changes in earnings estimates by analysts, or other events or factors which may or may not be under our control. Broad market fluctuations may adversely affect the market price of our common stock. Since the initial public offering of our stock at $15.00 per share on May 16, 2007, the market price of our stock has fluctuated significantly from a high of $40.11 per share to a low of $2.12 per share through February 16, 2018. Since the trading volume of our stock is modest on a daily basis, shareholders may experience difficulties in liquidating our stock at an acceptable price. Factors affecting the trading price of our common stock may include:
variations in our financial results;
changes in financial estimates or investment recommendations by any securities analysts following our business;
the public’s response to our press releases, our other public announcements and our filings with the SEC;
our ability to successfully execute our business plan;
changes in accounting standards, policies, guidance, interpretations or principles;
future sales of common stock by us or our directors, officers or significant stockholders or the perception such sales may occur;
our ability to achieve operating results consistent with securities analysts’ projections;
30
the operating and stock price performance of other companies that investors may deem comparable to us;
recruitment or departure of key personnel;
our ability to timely address changing equipment lessee and third-party investor preferences;
equipment market and industry factors;
the size of our public float;
general stock market conditions; and
other events or factors, including those resulting from war, incidents of terrorism or responses to such events.
In addition, if the market for companies deemed similar to us or the stock market in general experiences loss of investor confidence, the trading price of our common stock could decline for reasons unrelated to our business or financial results. The trading price of our common stock might also decline in reaction to events that affect other companies in our industry even if these events do not directly affect us.
Future new sales of our common stock by us or outstanding shares by existing stockholders, or the perception that there will be future sales of new shares from the Company or existing stockholders, may cause our stock price to decline and impair our ability to obtain capital through future stock offerings.
A substantial number of shares of our common stock held by our current stockholders could be sold into the public market at any time. In addition, the perception of, or actual sale of, new shares by us may materially and adversely affect our stock price and could impair our ability to obtain future capital through an offering of equity securities.
We do not currently pay dividends to holders of our common stock, and we cannot assure you that we will pay dividends to holders of our common stock in the future.
Although our board of directors may consider a dividend policy under which we would pay cash dividends on our common stock, any determinations by us to pay cash dividends on our common stock in the future will be based primarily upon our financial condition, results of operations, business requirements, tax considerations and our board of directors’ continuing determination that the declaration of dividends under the dividend policy are in the best interests of our stockholders and are in compliance with all laws and agreements applicable to the dividend program. In addition, the terms of our credit agreements contain provisions restricting the payment of cash dividends subject to certain exceptions. Consequently, investors may be required to rely on sales of their common stock as the only way to realize any future gains on their investment.
If securities analysts do not publish research or reports about our business or if they decrease their financial estimates or investment recommendations, the price of our stock could decline.
The trading market for our common shares may rely in part on the research and reports that industry or financial analysts publish about us or our business. We do not control or influence the decisions or opinions of these analysts and analysts may not cover us.
If any analyst who covers us decreases his or her financial estimates or investment recommendation, the price of our stock could decline. If any analyst ceases coverage of our company, we could lose visibility in the market, which in turn could cause our stock price to decline.
Our certificate of incorporation and bylaws and Delaware law contain provisions that could discourage a third party from acquiring us and consequently decrease the market value of an investment in our common stock.
Our certificate of incorporation and bylaws and Delaware corporate law each contain provisions that could delay, defer or prevent a change in control of our company or changes in our management. Among other things, these provisions:
authorize us to issue preferred stock that can be created and issued by the board of directors without prior stockholder approval, with rights senior to those of our common stock;
permit removal of directors only for cause by the holders of a majority of the shares entitled to vote at the election of directors and allow only the directors to fill a vacancy on the board of directors;
prohibit stockholders from calling special meetings of stockholders;
prohibit stockholder action by written consent, thereby requiring all stockholder actions to be taken at a meeting of our stockholders;
require the affirmative vote of 66 2/3% of the shares entitled to vote to amend our bylaws and certain articles of our certificate of incorporation, including articles relating to the classified board, the size of the board, removal of directors, stockholder meetings and actions by written consent;
allow the authorized number of directors to be changed only by resolution of the board of directors;
31
establish advance notice requirements for submitting nominations for election to the board of directors and for proposing matters that can be acted upon by stockholders at a meeting;
classify our board of directors into three classes so that only a portion of our directors are elected each year; and
allow our directors to amend our bylaws.
These provisions could discourage proxy contests and make it more difficult for our stockholders to elect directors and take other corporate actions, which may prevent a change of control or changes in our management that a stockholder might consider favorable. In addition, Section 203 of the Delaware General Corporation Law, which makes unfriendly takeover more difficult, may discourage, delay or prevent a change in control of us, which shareholders not affiliated with the takeover group might favor. Any delay or prevention of a change in control or change in management that stockholders might otherwise consider to be favorable could cause the market price of our common stock to decline.
ITEM 1B: UNRESOLVED STAFF COMMENTS
None.
Office Locations. As of December 31, 2017, we operated our business in 23 offices in 14 different countries including the U.S. We have 9 offices in the U.S. including our headquarters in San Francisco, California. We have 14 offices outside the U.S., including offices operated by third-party corporate service providers in Bermuda and Luxembourg. In addition, we have agents in Asia, Europe, South Africa, and South America. Our headquarters is used for our container leasing, rail leasing and logistics segments. Our offices in Everett, WA, Eatontown, NJ, Portland, OR, Tampa, FL, Jacksonville, FL, Knoxville, TN and Kennesaw, GA are used for our logistics segment operations. Each one of our other offices is used for our container leasing segment. All of our offices, except those operated by third party corporate service providers, are leased.
The following table summarizes our office locations as of December 31, 2017:
Office Locations – U.S.
San Francisco, CA (Headquarters)
Charleston, SC
Everett, WA
Eatontown, NJ
Portland, OR
Tampa, FL
Jacksonville, FL
Knoxville, TN
Kennesaw, GA
Office Locations – International
Brentwood, United Kingdom
St. Michael, Barbados
Antwerp, Belgium
Hong Kong
Singapore
Delmenhorst, Germany
Hamburg, Germany
Tokyo, Japan
Kuala Lumpur, Malaysia
Taipei, Taiwan
Luxembourg
Hamilton, Bermuda
32
Seoul, South Korea
Sydney, Australia
From time to time we may become a party to litigation matters arising in connection with the normal course of our business, including in connection with enforcing our rights under our leases. While we cannot predict the outcome of these matters, in the opinion of our management, any liability arising from these matters will not have a material adverse effect on our business, financial condition, results of operations or cash flows. Nevertheless, unexpected adverse future events, such as an unforeseen development in our existing proceedings, a significant increase in the number of new cases or changes in our current insurance arrangements could result in liabilities that have a material adverse impact on our business, financial condition, results of operations or cash flows. We are currently not party to any material legal proceedings which are material to our business, financial condition, results of operations or cash flows.
ITEM 4: MINE SAFETY DISCLOSURES
Not applicable.
33
PART II
ITEM 5: MARKET FOR REGISTRANT’S COMMON EQUITY, RELATED STOCKHOLDER MATTERS AND ISSUER PURCHASES OF EQUITY SECURITIES
Our common stock is traded on the NYSE under the symbol “CAI.” The following table reflects the range of high and low sales prices of our common stock, as reported on the NYSE in each quarter of the years ended December 31, 2017 and 2016:
|
|
|||||
|
|
High |
Low |
|||
|
2017: |
|||||
|
Fourth Quarter |
$ |
40.11 |
$ |
28.04 | |
|
Third Quarter |
$ |
31.61 |
$ |
22.60 | |
|
Second Quarter |
$ |
24.50 |
$ |
14.43 | |
|
First Quarter |
$ |
17.92 |
$ |
8.70 | |
|
|
|||||
|
2016: |
|||||
|
Fourth Quarter |
$ |
10.40 |
$ |
6.75 | |
|
Third Quarter |
$ |
9.32 |
$ |
7.50 | |
|
Second Quarter |
$ |
10.49 |
$ |
6.88 | |
|
First Quarter |
$ |
10.35 |
$ |
4.83 | |
As of February 1, 2018, there were 40 registered holders of record of the common stock and 4,492 beneficial holders, based on information obtained from our transfer agent.
Dividends
We have never declared or paid dividends on our capital stock. Our board of directors may consider adopting a dividend policy in the future. Any determinations by us to pay cash dividends on our common stock in the future will be based primarily upon our financial condition, results of operations, business requirements, tax considerations and our board of directors’ continuing determination that the declaration of dividends under the dividend policy are in the best interests of our stockholders and are in compliance with all laws and agreements applicable to the dividend program. In the absence of such a policy, we intend to retain future earnings to finance the operation and expansion of our business, and to repurchase our common stock. Our financing arrangements also contain restrictions on our ability to pay cash dividends and repurchase our common stock.
34
Performance Graph
The graph below compares cumulative shareholder returns on our common stock as compared with the Russell 2000 Stock Index and the Dow Jones Transportation Stock Index for the period from December 31, 2012 to December 31, 2017. The graph assumes an investment of $100 as of December 31, 2012, and that all dividends were reinvested without the payment of any commissions. The stock performance shown on the performance graph below is not necessarily indicative of future performance.
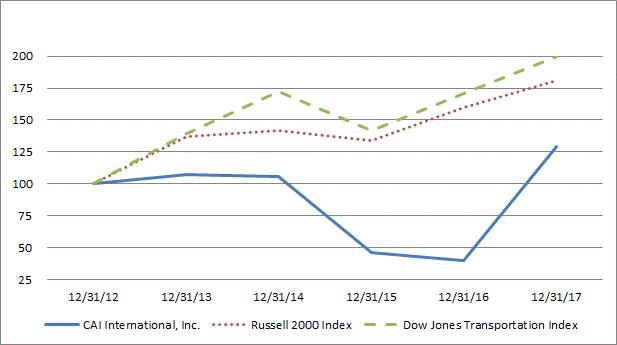
|
|
|||||||||||||||||
|
|
Returns as of December 31, |
||||||||||||||||
|
Company/Index |
Dec. 31, 2012 |
2013 |
2014 |
2015 |
2016 |
2017 |
|||||||||||
|
|
|||||||||||||||||
|
CAI International, Inc. |
$ |
100 |
$ |
107 |
$ |
106 |
$ |
46 |
$ |
39 |
$ |
129 | |||||
|
Russell 2000 Index |
100 | 137 |
142 |
134 |
160 | 181 | |||||||||||
|
Dow Jones Transportation Index |
100 | 139 |
172 |
141 |
170 | 200 | |||||||||||
35
ITEM 6: SELECTED FINANCIAL DATA
The selected financial data presented below have been derived from our audited consolidated financial statements. Historical results are not necessarily indicative of the results of operations to be expected in future periods. You should read the selected consolidated financial data and operating data presented below in conjunction with “Management’s Discussion and Analysis of Financial Condition and Results of Operations” and with our consolidated financial statements and related notes included elsewhere in this Annual Report on Form 10-K.
Consolidated Statement of Operations Data
|
|
||||||||||||||
|
|
Year Ended December 31, |
|||||||||||||
|
|
2017 |
2016 |
2015 |
2014 |
2013 |
|||||||||
|
(Dollars in thousands, except per share data) |
||||||||||||||
|
|
||||||||||||||
|
Revenue |
||||||||||||||
|
Container lease revenue |
$ |
235,365 |
$ |
202,328 |
$ |
220,732 |
$ |
217,253 |
$ |
205,226 | ||||
|
Rail lease revenue |
32,476 | 30,490 | 17,433 | 10,336 | 7,179 | |||||||||
|
Logistics revenue |
80,552 | 61,536 | 11,502 |
- |
- |
|||||||||
|
Total revenue |
348,393 | 294,354 | 249,667 | 227,589 | 212,405 | |||||||||
|
|
||||||||||||||
|
Operating expenses |
||||||||||||||
|
Depreciation of rental equipment |
110,952 | 104,877 | 113,590 | 77,976 | 67,109 | |||||||||
|
Storage, handling and other expenses |
20,918 | 35,862 | 30,194 | 26,043 | 19,257 | |||||||||
|
Logistics transportation costs |
68,155 | 51,980 | 10,172 |
- |
- |
|||||||||
|
(Gain) loss on sale of used rental equipment |
(5,347) | 12,671 | 654 | (6,522) | (7,356) | |||||||||
|
Administrative expenses |
42,699 | 35,678 | 27,617 | 26,538 | 24,628 | |||||||||
|
Total operating expenses |
237,377 | 241,068 | 182,227 | 124,035 | 103,638 | |||||||||
|
|
||||||||||||||
|
Operating income |
111,016 | 53,286 | 67,440 | 103,554 | 108,767 | |||||||||
|
|
||||||||||||||
|
Other expenses |
||||||||||||||
|
Net interest expense |
53,052 | 42,754 | 36,271 | 35,592 | 36,477 | |||||||||
|
Other expenses |
765 | 654 | 182 | 773 | 1,190 | |||||||||
|
Total other expenses |
53,817 | 43,408 | 36,453 | 36,365 | 37,667 | |||||||||
|
|
||||||||||||||
|
Income before income taxes and |
||||||||||||||
|
non-controlling interest |
57,199 | 9,878 | 30,987 | 67,189 | 71,100 | |||||||||
|
Income tax (benefit) expense |
(14,861) | 3,844 | 4,252 | 7,191 | 7,057 | |||||||||
|
|
||||||||||||||
|
Net income |
72,060 | 6,034 | 26,735 | 59,998 | 64,043 | |||||||||
|
Net income attributable to non-controlling interest |
- |
37 | 134 | 111 | 594 | |||||||||
|
Net income attributable to CAI common stockholders |
$ |
72,060 |
$ |
5,997 |
$ |
26,601 |
$ |
59,887 |
$ |
63,449 | ||||
|
|
||||||||||||||
|
Net income per share attributable to CAI |
||||||||||||||
|
common stockholders |
||||||||||||||
|
Basic |
$ |
3.74 |
$ |
0.31 |
$ |
1.28 |
$ |
2.89 |
$ |
2.86 | ||||
|
Diluted |
$ |
3.68 |
$ |
0.31 |
$ |
1.27 |
$ |
2.83 |
$ |
2.80 | ||||
|
|
||||||||||||||
|
Weighted average shares outstanding |
||||||||||||||
|
Basic |
19,253 | 19,318 | 20,773 | 20,732 | 22,157 | |||||||||
|
Diluted |
19,607 | 19,393 | 20,988 | 21,155 | 22,672 | |||||||||
|
|
||||||||||||||
|
Other Financial Data |
||||||||||||||
|
EBITDA (unaudited)(1) |
$ |
223,514 |
$ |
159,274 |
$ |
181,359 |
$ |
181,910 |
$ |
176,502 | ||||
|
Purchase of equipment |
502,050 | 251,165 | 389,331 | 307,283 | 312,144 | |||||||||
36
Consolidated Balance Sheet Data
|
|
||||||||||||||
|
|
As of December 31, |
|||||||||||||
|
|
2017 |
2016 |
2015 |
2014 |
2013 |
|||||||||
|
(Dollars in thousands) |
||||||||||||||
|
|
||||||||||||||
|
Cash* |
$ |
47,209 |
$ |
52,326 |
$ |
59,765 |
$ |
62,053 |
$ |
54,994 | ||||
|
Rental equipment, net |
2,004,961 | 1,807,010 | 1,748,211 | 1,564,777 | 1,465,092 | |||||||||
|
Net investment in direct finance leases |
276,513 | 100,541 | 103,368 | 94,964 | 81,208 | |||||||||
|
Total assets |
2,430,402 | 2,055,934 | 1,973,585 | 1,784,018 | 1,662,615 | |||||||||
|
Debt |
1,702,822 | 1,476,026 | 1,419,809 | 1,253,633 | 1,125,553 | |||||||||
|
Total liabilities |
1,866,557 | 1,598,430 | 1,513,480 | 1,342,032 | 1,248,021 | |||||||||
|
Total CAI stockholders' equity |
563,845 | 457,504 | 459,182 | 441,197 | 414,000 | |||||||||
|
*Includes restricted cash of $11,789, $6,192, $7,212, $8,232, and $9,253 and cash owned by variable interest entities of $20,685, $30,449, $35,106, |
||||||||||||||
|
$26,011, and $14,600 at December 31, 2017, 2016, 2015, 2014, and 2013, respectively. |
||||||||||||||
|
|
||||||||||||||
|
Selected Operating Data (unaudited): |
||||||||||||||
|
Owned container fleet in TEUs (2) |
1,146,268 | 921,694 | 984,085 | 934,101 | 860,729 | |||||||||
|
Managed container fleet in TEUs (2) |
80,736 | 162,582 | 198,093 | 235,538 | 283,725 | |||||||||
|
|
1,227,004 | 1,084,276 | 1,182,178 | 1,169,639 | 1,144,454 | |||||||||
|
|
||||||||||||||
|
Owned container fleet in CEUs (3) |
1,209,209 | 1,014,078 | 1,029,117 | 961,244 | 903,713 | |||||||||
|
Managed container fleet in CEUs (3) |
73,530 | 146,258 | 177,958 | 214,432 | 262,071 | |||||||||
|
|
1,282,739 | 1,160,336 | 1,207,075 | 1,175,676 | 1,165,784 | |||||||||
|
|
||||||||||||||
|
Owned railcar fleet in units |
7,172 | 6,459 | 5,096 | 2,361 | 1,804 | |||||||||
|
|
||||||||||||||
|
Percentage of on-lease container fleet on long-term leases (4) |
72% | 75% | 74% | 73% | 75% | |||||||||
|
Percentage of on-lease container fleet on short-term leases (4) |
13% | 16% | 17% | 20% | 20% | |||||||||
|
Percentage of on-lease container fleet on finance leases |
15% | 9% | 9% | 7% | 5% | |||||||||
|
|
100% | 100% | 100% | 100% | 100% | |||||||||
|
|
||||||||||||||
|
Average container fleet utilization in CEUs (5) |
97.4% | 92.8% | 92.5% | 92.3% | 92.7% | |||||||||
|
Average railcar fleet utilization (6) |
90.0% | 93.9% | 95.8% | 95.8% | 94.2% | |||||||||
(1)EBITDA is a non-GAAP measure, and is defined as net income before interest, income taxes, depreciation and amortization of intangible assets. We believe EBITDA is helpful in understanding our past financial performance as a supplement to net income and other performance measures calculated in conformity with accounting principles generally accepted in the United States (GAAP). Our management believes that EBITDA is useful to investors in evaluating our operating performance because it provides a measure of operating results unaffected by differences in capital structures, capital investment cycles and ages of related assets among otherwise comparable companies in our industry. EBITDA has limitations as an analytical tool, which you should not consider in isolation or as a substitute for any measure reported under GAAP; its usefulness as a performance measure as compared to net income is limited by the fact that EBITDA excludes the impact of interest expense, depreciation and amortization expense and taxes. We borrow money in order to finance our operations; therefore, interest expense is a necessary element of our costs and ability to generate revenue. Similarly, our use of capital assets makes depreciation and amortization expense a necessary element of our costs and ability to generate income. In addition, since we are subject to state and federal income taxes, any measure that excludes tax expense has material limitations.
37
The following table provides a reconciliation of EBITDA to net income, the most comparable performance measure under GAAP (in thousands):
|
|
||||||||||||||
|
|
Year Ended December 31, |
|||||||||||||
|
|
2017 |
2016 |
2015 |
2014 |
2013 |
|||||||||
|
Net income attributable to CAI common stockholders |
$ |
72,060 |
$ |
5,997 |
$ |
26,601 |
$ |
59,887 |
$ |
63,449 | ||||
|
Net interest expense |
53,052 | 42,754 | 36,271 | 35,998 | 37,585 | |||||||||
|
Depreciation |
111,294 | 105,236 | 114,003 | 78,451 | 67,631 | |||||||||
|
Amortization of intangible assets |
1,969 | 1,443 | 232 | 383 | 780 | |||||||||
|
Income tax (benefit) expense |
(14,861) | 3,844 | 4,252 | 7,191 | 7,057 | |||||||||
|
EBITDA |
$ |
223,514 |
$ |
159,274 |
$ |
181,359 |
$ |
181,910 |
$ |
176,502 | ||||
(2)Reflects the total number of TEUs in our managed or owned equipment fleet, as applicable, as of the end of the period indicated, including units for sale and units we have purchased but held at the manufacturer.
(3)Reflects the total number of CEUs in our managed or owned equipment fleet, as applicable, as of the end of the period indicated, including units for sale and units we have purchased but held at the manufacturer.
(4)Long-term leases comprise leases that had a contractual term in excess of twelve months at the time of inception of the leases, including leases that permit cancellation by the lessee within 12 months if penalties are paid, and leases that have exceeded their initial contractual term of 12 months or greater. Short-term leases comprise leases that had a contractual term of 12 months or less at the time of inception of the leases.
(5)Reflects the average number of CEUs in our equipment fleet on lease as a percentage of total CEUs available for lease. In calculating CEUs available for lease, we exclude units for sale and units held at the manufacturer that we have purchased.
(6)Reflects the average number of units in our railcar fleet on lease as a percentage of total units available for lease. In calculating units available for lease, we exclude units for sale and units held at the manufacturer that we have purchased. If new railcars not yet leased are included in the total railcar fleet, railcar fleet utilization would be 78.3% for the year ended December 31, 2017.
38
ITEM 7: MANAGEMENT’S DISCUSSION AND ANALYSIS OF FINANCIAL CONDITION AND RESULTS OF OPERATIONS
The following discussion and analysis of our financial condition and results of operations should be read in conjunction with our consolidated financial statements and related notes thereto, included elsewhere in this Annual Report on Form 10-K. In addition to historical consolidated financial information, the following discussion contains forward-looking statements that reflect our plans, estimates and beliefs. Our actual results may differ materially from those contained in or implied by any forward-looking statements. See “Special Note Regarding Forward-Looking Statements.” Factors that could cause or contribute to these differences include those discussed below and elsewhere in this Annual Report on Form 10-K, particularly in Item 1A. “Risk Factors.”
Unless the context requires otherwise, references to “CAI,” the “Company,” “we,” “us” or “our” in this Annual Report on Form 10-K refer to CAI International, Inc. and its subsidiaries.
Overview
We are one of the world’s leading transportation finance and logistics companies. We purchase equipment, primarily intermodal shipping containers and railcars, which we lease to our customers. We also manage equipment for third-party investors. In operating our fleet, we lease, re-lease and dispose of equipment and contract for the repair, repositioning and storage of equipment. We also provide domestic and international logistics services. As of December 31, 2017, our container fleet comprised 1,282,739 CEUs, 94% of which represented our owned fleet and 6% of which represented our managed fleet. In addition, we also own 7,172 railcars, which we lease within North America.
In July 2015, we purchased CAI Logistics (previously ClearPointt Logistics LLC), an intermodal logistics company focused on the domestic intermodal market, for approximately $4.1 million. CAI Logistics is headquartered in Everett, Washington.
In February 2016, we purchased Challenger, an NVOCC, for approximately $10.8 million. Challenger is headquartered in Eatontown, New Jersey.
In June 2016, we purchased Hybrid, asset light truck brokers, for approximately $12.0 million. Hybrid is headquartered in Portland, Oregon.
Our revenue comprises container lease revenue and rail lease revenue from our owned container and railcar fleets, management fee revenue for managing containers for third-party investors, and logistics revenue for the provision of logistics services.
Our container and rail lease revenue from our owned fleets depends primarily upon a combination of: (1) the number of units in our owned fleet; (2) the utilization level of equipment in our owned fleet; and (3) the per diem rates charged under each equipment lease. The same factors in our managed fleet affect the amount of our management fee income. The number of CEUs in our container fleet, and the number of cars in our railcar fleet, varies over time as we purchase new equipment based on prevailing market conditions during the year and sell used equipment to parties in the secondary resale market.
Key Metrics
Utilization. We measure container utilization on the basis of the average number of CEUs on lease expressed as a percentage of our total container fleet available for lease. We measure railcar utilization on the basis of the average number of railcars on lease expressed as a percentage of our total railcar fleet available for lease. In both cases, we calculate the total fleet available for lease by excluding new units that have been manufactured for us but either remain at the manufacturer or have not yet entered their first lease, and off-hire units that are likely to be sold. Our utilization is primarily driven by the overall level of equipment demand, the location of our available equipment and the quality of our relationships with equipment lessees. The location of available equipment is critical because equipment available in high-demand locations is more readily leased and is typically leased on more favorable terms than equipment available in low-demand locations.
The equipment leasing market is highly competitive. As such, our relationships with our customers are important to ensure that they continue to select us as one of their providers of leased equipment. Our average container fleet utilization rate in CEUs for the year ended December 31, 2017 was 97.4% compared to 92.8% and 92.5% for the years ended December 31, 2016 and 2015, respectively. The increase in our average fleet utilization from 2016 is primarily attributable to an increase in the volume of off-lease containers sold during 2016 and 2017 and an increase in demand for leased containers towards the end of 2016 that continued into 2017. Our average railcar fleet utilization rate for the year ended December 31, 2017 was 90.0% compared to 93.9% and 95.8% for the years ended December 31, 2016 and 2015, respectively. If new railcars not yet leased are included in the total railcar fleet, railcar fleet utilization would be 78.3% for the year ended December 31, 2017. The decrease in the utilization of our railcar fleet has been primarily caused by decreased demand and competitive pressure in the rail market. Our utilization rate may increase or decrease depending on future global economic conditions and the additional supply of new equipment.
39
Per Diem Rates. The per diem rate for a lease is set at the time we enter into a lease agreement. Our long-term per diem rates have historically been strongly influenced by new equipment pricing, interest rates, the balance of supply and demand for equipment at a particular time and location, our estimate of the residual value of the equipment at the end of the lease, the type and age of the equipment being leased, and, for container per diem rates, the purchase of equipment and efficiencies in container utilization by container shipping lines. The overall average per diem rates for equipment in our owned fleet and in the portfolios of equipment comprising our managed fleet do not change significantly in response to changes in new equipment prices because existing lease agreements can only be re-priced upon the expiration of the lease.
Revenue
Our revenue is comprised of container lease revenue, rail lease revenue, and logistics revenue.
Container Lease Revenue. We generate container lease revenue by leasing our owned containers primarily to container shipping lines. Approximately 89% of our container lease revenue is derived from rental of containers. Container lease revenue is comprised of monthly lease payments due under the lease agreements together with payments for other charges set forth in the leases, such as handling fees, drop-off charges and repair charges. Approximately 15% of our owned container fleet is subject to finance leases. Under a finance lease, the lessee’s payments consist of principal and interest components. The interest component is included within container lease revenue. Lessees under our finance leases have the substantive risks and rewards of equipment ownership and may have the option to purchase the equipment at the end of the lease term for a nominal amount.
Container lease revenue also includes management fee revenue generated by our management services, which include the leasing, re-leasing, repair, repositioning, storage and disposition of equipment. We provide these management services pursuant to management agreements with third-party investors. Under these agreements, which have multiple year terms, we earn fees for the management of the equipment and a commission, or a managed units’ sales fee, upon disposition of equipment under management.
Rail Lease Revenue. We generate rail lease revenue by leasing our railcars primarily for the transport of industrial goods, materials and other products on railroad tracks throughout North America. Rail lease revenue is comprised of monthly lease payments due under the lease agreements. Lease revenue may be based on a fixed monthly rate or may be recognized on an hourly or mileage basis. None of our railcars are subject to finance leases.
Logistics Revenue. We generate logistics revenue by arranging for the movement of our customers’ freight through our network of non-affiliated transportation carriers and equipment providers. Revenue is comprised of the gross price charged to our customers.
Operating Expenses
Our operating expenses include transportation costs, depreciation of rental equipment, storage, handling and other expenses applicable to our owned equipment, and administrative expenses.
We depreciate our containers on a straight-line basis over a period ranging from 12 to 15 years to a fixed estimated residual value depending on the type of container (see Note 2(d) in our consolidated financial statements included in this Annual Report on Form 10-K). We regularly assess both the estimated useful life of our containers and their expected residual values, and, when warranted, adjust our depreciation estimate accordingly. Railcar equipment is depreciated over its estimated useful life of 43 years to its estimated residual value using the straight-line method. Depreciation expense for rental equipment will vary over time based upon the size of our owned rental equipment fleet and the purchase price of new equipment. If our rental equipment is impaired, the equipment is written-down to its fair value and the amount of the write-down is recorded in depreciation expense.
Storage, handling and other expenses are operating costs of our owned rental equipment fleet. Storage and handling expenses occur when lessees drop off equipment at depots at the end of a lease. Storage and handling expenses vary significantly by location. Other expenses include repair expenses, which are the result of normal wear and tear on the equipment, and repositioning expenses, which are incurred when we contract to move equipment from locations where our inventories exceed actual or expected demand to locations with higher demand. Storage, handling and other expenses are directly related to the number of units in our owned fleet and inversely related to our utilization rate for those units: as utilization increases, we typically have lower storage, handling and repositioning expenses.
Logistics transportation costs represent the expenses we incur for providing logistics services to our customers. Such costs include shipping, pick-up and delivery charges, primarily from railroads and drayage companies we contract with to fulfill the movement of our customers’ freight.
Our administrative expenses are primarily employee-related costs such as salary, bonus and commission expenses, employee benefits, rent, allowance for doubtful accounts and travel and entertainment costs, as well as expenses incurred for outside services such as legal, consulting and audit-related fees.
Our operating expenses include the gain or loss on sale of used rental equipment. This gain or loss is the result of our sale of older used equipment in the secondary resale market and is the difference between: (1) the cash we receive for these units, less selling expenses; and (2) the net book value of the units.
40
Results of Operations
The following table summarizes our results of operations for the three years ended December 31, 2017, 2016 and 2015 (in thousands):
|
|
||||||||
|
|
Year Ended December 31, |
|||||||
|
|
2017 |
2016 |
2015 |
|||||
|
Revenue |
||||||||
|
Container lease revenue |
$ |
235,365 |
$ |
202,328 |
$ |
220,732 | ||
|
Rail lease revenue |
32,476 | 30,490 | 17,433 | |||||
|
Logistics revenue |
80,552 | 61,536 | 11,502 | |||||
|
Total revenue |
348,393 | 294,354 | 249,667 | |||||
|
|
||||||||
|
Operating expenses |
||||||||
|
Depreciation of rental equipment |
110,952 | 104,877 | 113,590 | |||||
|
Storage, handling and other expenses |
20,918 | 35,862 | 30,194 | |||||
|
Logistics transportation costs |
68,155 | 51,980 | 10,172 | |||||
|
(Gain) loss on sale of used rental equipment |
(5,347) | 12,671 | 654 | |||||
|
Administrative expenses |
42,699 | 35,678 | 27,617 | |||||
|
Total operating expenses |
237,377 | 241,068 | 182,227 | |||||
|
|
||||||||
|
Operating income |
111,016 | 53,286 | 67,440 | |||||
|
|
||||||||
|
Other expenses |
||||||||
|
Net interest expense |
53,052 | 42,754 | 36,271 | |||||
|
Other expense |
765 | 654 | 182 | |||||
|
Total other expenses |
53,817 | 43,408 | 36,453 | |||||
|
|
||||||||
|
Income before income taxes and non-controlling interest |
57,199 | 9,878 | 30,987 | |||||
|
Income tax (benefit) expense |
(14,861) | 3,844 | 4,252 | |||||
|
|
||||||||
|
Net income |
72,060 | 6,034 | 26,735 | |||||
|
Net income attributable to non-controlling interest |
- |
37 | 134 | |||||
|
Net income attributable to CAI common stockholders |
$ |
72,060 |
$ |
5,997 |
$ |
26,601 | ||
2017 Compared with 2016 and 2016 Compared with 2015
Container lease revenue
|
|
||||||||||||||||||||
|
|
Year Ended December 31, |
2017 vs 2016 |
2016 vs 2015 |
|||||||||||||||||
|
|
2017 |
2016 |
2015 |
$ Change |
% Change |
$ Change |
% Change |
|||||||||||||
|
($ in thousand) |
||||||||||||||||||||
|
Container lease revenue |
$ |
235,365 |
$ |
202,328 |
$ |
220,732 |
$ |
33,037 | 16% |
$ |
(18,404) |
-8% |
||||||||
The increase in container lease revenue between 2017 and 2016 was a result of a $35.2 million increase in rental revenue, primarily due to a 19% increase in the average number of CEUs of on-lease owned containers, partially offset by a $5.7 million decrease in rental revenue resulting from a 3% decrease in average owned container per diem rental rates, and a decrease of $1.4 million reflecting lost revenue related to the bankruptcy of Hanjin in 2016, net of $2.2 million of insurance proceeds for lost lease rental revenue, recognized during the year ended December 31, 2017. The reduction in average container per diem rental rates has been caused by competitive market pressure. Finance lease income increased by $5.0 million, primarily attributable to new finance lease contracts entered into during 2017.
The decrease in container lease revenue between 2016 and 2015 was a result of a $14.0 million decrease in rental revenue resulting from a 5% decrease in average owned container per diem rental rates, and a decrease of $3.6 million reflecting lost revenue related to the bankruptcy of Hanjin in 2016. The reduction in average container per diem rental rates has been caused by competitive market pressure. Management fee revenue decreased by $1.1 million, primarily due to a 21% reduction in the size of the on-lease managed container fleet and a decrease of 15% in the average per diem rates in our management, partially offset by a non-recurring charge of $0.8 million recorded during the year ended December 31, 2015, related to an adjustment of prior period management fees.
41
Rail lease revenue
|
|
||||||||||||||||||||
|
|
Year Ended December 31, |
2017 vs 2016 |
2016 vs 2015 |
|||||||||||||||||
|
|
2017 |
2016 |
2015 |
$ Change |
% Change |
$ Change |
% Change |
|||||||||||||
|
($ in thousand) |
||||||||||||||||||||
|
Rail lease revenue |
$ |
32,476 |
$ |
30,490 |
$ |
17,433 |
$ |
1,986 | 7% |
$ |
13,057 | 75% | ||||||||
Rail lease revenue increased between 2017 and 2016, primarily as a result of a $1.0 million settlement with a customer for damaged railcars, and a 2% increase in the average size of our on-lease railcar fleet during the last twelve months. The average lease revenue per railcar has also increased as new railcars, which command higher per diem rental rates than used railcars, now form a larger percentage of the fleet.
Rail lease revenue increased between 2016 and 2015, primarily as a result of a 74% increase in the average size of our on-lease railcar fleet between the two periods. The average lease revenue per railcar also increased as new railcars formed a larger percentage of the fleet.
Logistics revenue and transportation costs
|
|
||||||||||||||||||||
|
|
||||||||||||||||||||
|
|
Year Ended December 31, |
2017 vs 2016 |
2016 vs 2015 |
|||||||||||||||||
|
|
2017 |
2016 |
2015 |
$ Change |
% Change |
$ Change |
% Change |
|||||||||||||
|
($ in thousand) |
||||||||||||||||||||
|
Logistics revenue |
$ |
80,552 |
$ |
61,536 |
$ |
11,502 |
$ |
19,016 | 31% |
$ |
50,034 | 435% | ||||||||
|
Logistics transportation costs |
68,155 | 51,980 | 10,172 | 16,175 | 31% | 41,808 | 411% | |||||||||||||
|
Logistics gross margin |
$ |
12,397 |
$ |
9,556 |
$ |
1,330 |
$ |
2,841 | 30% |
$ |
8,226 | 619% | ||||||||
Logistics revenue
The increase in logistics revenue between 2017 and 2016 was primarily due to an additional $15.8 million of revenue from the acquisition of Challenger in February 2016 and Hybrid in June 2016, as well as new customers generating an additional $3.4 million of revenue at CAI Logistics.
The increase in logistics revenue between 2016 and 2015 was mainly attributable to the acquisition of Challenger in February 2016 and Hybrid in June 2016.
Logistics transportation costs
The increase in logistics transportation costs between 2017 and 2016 was mainly attributable to an additional $14.2 million of costs from the acquisition of Challenger in February 2016 and Hybrid in June 2016, as well as an increase of $1.8 million in CAI Logistics costs as a result of new customer activity.
The increase in logistics transportation costs between 2016 and 2015 was mainly attributable to the acquisition of Challenger in February 2016 and Hybrid in June 2016.
Logistics gross margin
The gross margin generated from our logistics business increased between 2017 and 2016, primarily due to the acquisitions made in the logistics business in 2016. The gross margin percentage of our logistics business for the year ended December 31, 2017 was 15.4%, consistent with the prior year.
The gross margin generated from our logistics business increased between 2016 and 2015, mainly due to the acquisition of Challenger in February 2016 and Hybrid in June 2016. The gross margin percentage of our logistics business for the year ended December 31, 2016 was 15.5%, which increased from a gross margin percentage of 11.6% for the year ended December 31, 2015. The increase was mainly attributable to the acquisition of Challenger in 2016, which operates at higher margins.
Depreciation of rental equipment
|
|
||||||||||||||||||||
|
|
Year Ended December 31, |
2017 vs 2016 |
2016 vs 2015 |
|||||||||||||||||
|
|
2017 |
2016 |
2015 |
$ Change |
% Change |
$ Change |
% Change |
|||||||||||||
|
($ in thousand) |
||||||||||||||||||||
|
Container Leasing |
$ |
99,753 |
$ |
95,755 |
$ |
108,996 |
$ |
3,998 | 4% |
$ |
(13,241) |
-12% |
||||||||
|
Rail Leasing |
11,199 | 9,122 | 4,594 | 2,077 | 23% | 4,528 | 99% | |||||||||||||
|
|
$ |
110,952 |
$ |
104,877 |
$ |
113,590 |
$ |
6,075 | 6% |
$ |
(8,713) |
-8% |
||||||||
42
Container Leasing
The increase in depreciation expense between 2017 and 2016 was primarily attributable to an increase of $4.4 million resulting from a decrease in the residual value estimates for 40-foot high cube dry van containers implemented in 2016, a $1.3 million write-off of rental equipment on lease to a bankrupt customer and a 7% increase in the average size of our owned fleet between the two periods, partially offset by a decrease due to a one-time impairment charge of $2.0 million, related to the Hanjin bankruptcy, recorded in 2016.
The decrease in depreciation expense between 2016 and 2015 was primarily attributable to a $24.5 million impairment charge recorded during 2015 for certain off-lease containers, partially offset by an increase of $5.4 million as a result of a decrease in our estimate of residual value for 40-foot high cube dry van containers implemented in 2016, a $2.0 million impairment charge, net of insurance recoveries, related to estimated irrecoverable equipment on lease to Hanjin, and a $3.1 million impairment charge recorded during the year for certain off-lease damaged containers that we intended to sell.
Rail Leasing
The increase in depreciation expense between 2017 and 2016 was primarily attributable to a 16% increase in the average size of the railcar fleet. There has also been an increase in the proportion of new railcars in the fleet leading to higher depreciation per railcar.
The increase in depreciation expense between 2016 and 2015 was primarily attributable to a 70% increase in the average size of the railcar fleet.
Storage, handling and other expenses
|
|
||||||||||||||||||||
|
|
Year Ended December 31, |
2017 vs 2016 |
2016 vs 2015 |
|||||||||||||||||
|
|
2017 |
2016 |
2015 |
$ Change |
% Change |
$ Change |
% Change |
|||||||||||||
|
($ in thousand) |
||||||||||||||||||||
|
Container Leasing |
$ |
15,207 |
$ |
32,465 |
$ |
27,653 |
$ |
(17,258) |
-53% |
$ |
4,812 | 17% | ||||||||
|
Rail Leasing |
5,615 | 3,386 | 2,540 | 2,229 | 66% | 846 | 33% | |||||||||||||
|
Logistics |
96 | 11 | 1 | 85 | 773% | 10 | 1000% | |||||||||||||
|
|
$ |
20,918 |
$ |
35,862 |
$ |
30,194 |
$ |
(14,944) |
-42% |
$ |
5,668 | 19% | ||||||||
Container Leasing
The decrease in storage, handling and other expenses between 2017 and 2016 was primarily attributable to a $13.7 million decrease in storage costs as the size of the off-lease fleet decreased compared to the prior year, a $2.7 million decrease in repair and maintenance costs, and $1.5 million of insurance proceeds recorded related to repair costs associated with the previously reported Hanjin bankruptcy, partially offset by an increase of $0.5 million in container liability insurance premium resulting from the Hanjin insurance claim.
The increase in storage, handling and other expenses between 2016 and 2015 was primarily attributable to a $3.1 million increase in storage costs and a $2.0 million increase in handling and positioning fees, both caused by the average volume of off-lease and for sale owned container equipment increasing by 24% compared to the prior year.
Rail Leasing
The increase in storage, handling and other expenses between 2017 and 2016 was primarily attributable to a $1.2 million increase in storage and handling expenses as the size of the railcar fleet increased, while utilization decreased by 4%, between the two periods, as well as a $0.7 million increase in repair related costs and positioning fees, reflecting our efforts to put railcars on lease.
The increase in storage, handling and other expenses between 2016 and 2015 was primarily attributable to a $0.6 million increase in repair related costs and positioning fees.
(Gain) loss on sale of used rental equipment
|
|
||||||||||||||||||||
|
|
Year Ended December 31, |
2017 vs 2016 |
2016 vs 2015 |
|||||||||||||||||
|
|
2017 |
2016 |
2015 |
$ Change |
% Change |
$ Change |
% Change |
|||||||||||||
|
($ in thousand) |
||||||||||||||||||||
|
Container Leasing |
$ |
(5,333) |
$ |
12,750 |
$ |
2,276 |
$ |
(18,083) |
-142% |
$ |
10,474 | 460% | ||||||||
|
Rail Leasing |
(14) | 33 | (1,622) | (47) |
-142% |
1,655 |
-102% |
|||||||||||||
|
Logistics |
- |
(112) |
- |
112 |
-100% |
(112) | 100% | |||||||||||||
|
|
$ |
(5,347) |
$ |
12,671 |
$ |
654 |
$ |
(18,018) |
-142% |
$ |
12,017 | 1837% | ||||||||
43
Container Leasing
While we sold 30% less used containers in 2017 compared to the prior year, there was an increase of 166% in the average margin per unit, reflecting the recovery in new equipment prices during the year, resulting in a gain on sale of used rental equipment.
While we sold approximately 62% more used containers in 2016 compared to the prior year, there was a reduction of 21% in the average sale price per unit, reflecting the decline in new equipment prices during the year, and an increase of 205% in the average loss per unit, resulting in a loss on sale of used rental equipment. The loss on sale in 2016 was also impacted by the strengthening of the U.S. dollar compared to other currencies, particularly the Euro.
Rail Leasing
We recorded a gain and a loss on the sale of used rental equipment of less than $0.1 million for the years ended December 31, 2017 and 2016, respectively, compared to a gain of $1.6 million for the year ended December 31, 2015. The $1.6 million gain in 2015 resulted from the sale of newly manufactured railcars.
Administrative expenses
|
|
||||||||||||||||||||
|
|
Year Ended December 31, |
2017 vs 2016 |
2016 vs 2015 |
|||||||||||||||||
|
|
2017 |
2016 |
2015 |
$ Change |
% Change |
$ Change |
% Change |
|||||||||||||
|
($ in thousand) |
||||||||||||||||||||
|
Container Leasing |
$ |
22,925 |
$ |
20,453 |
$ |
21,969 |
$ |
2,472 | 12% |
$ |
(1,516) |
-7% |
||||||||
|
Rail Leasing |
4,756 | 3,759 | 3,131 | 997 | 27% | 628 | 20% | |||||||||||||
|
Logistics |
15,018 | 11,466 | 2,517 | 3,552 | 31% | 8,949 | 356% | |||||||||||||
|
|
$ |
42,699 |
$ |
35,678 |
$ |
27,617 |
$ |
7,021 | 20% |
$ |
8,061 | 29% | ||||||||
Container Leasing
The increase in administrative expenses between 2017 and 2016 was primarily attributable to a $3.9 million increase in payroll related expenses, mainly bonus expense, and a $1.6 million decrease in credits related to adjustments to our estimated contingent consideration related to our acquisitions, partially offset by a $2.3 million decrease in bad debt expense resulting from the $2.5 million charge incurred in 2016 related to the bankruptcy of Hanjin.
The decrease in administrative expenses between 2016 and 2015 was primarily attributable to a $3.8 million credit related to an adjustment to our estimated contingent consideration related to our acquisitions, partially offset by $2.5 million of bad debt expense incurred during the year related to the bankruptcy of Hanjin.
Rail Leasing
The increase in administrative expenses between 2017 and 2016 was primarily a result of higher employee-related costs, as well as an increase in allocated overhead costs due to the increase in size of the railcar fleet between the two periods.
The increase in administrative expenses between 2016 and 2015 was primarily due to an increase in allocated overhead costs resulting from the increase in size of the railcar fleet between the two periods.
Logistics
The increase in administrative expenses between 2017 and 2016 was primarily a result of $3.9 million of additional administrative expenses and a $0.6 million increase in amortization expense incurred by the logistics companies acquired in February and June 2016, partially offset by a $0.9 million decrease in administrative expenses for CAI Logistics, mainly attributable to a decrease in payroll related expenses due to a reduction in headcount.
The increase in administrative expenses between 2016 and 2015 was primarily a result of $5.0 million of administrative expenses incurred by Challenger (acquired in February) and Hybrid (acquired in June 2016), $2.0 million of additional administrative expenses incurred by CAI Logistics (acquired in July 2015), and a $1.3 million increase in amortization expense related to all of the logistics acquisitions.
Other expenses
|
|
||||||||||||||||||||
|
|
Year Ended December 31, |
2017 vs 2016 |
2016 vs 2015 |
|||||||||||||||||
|
|
2017 |
2016 |
2015 |
$ Change |
% Change |
$ Change |
% Change |
|||||||||||||
|
($ in thousand) |
||||||||||||||||||||
|
Net interest expense |
$ |
53,052 |
$ |
42,754 |
$ |
36,271 |
$ |
10,298 | 24% |
$ |
6,483 | 18% | ||||||||
|
Other expense |
765 | 654 | 182 | 111 | 17% | 472 | 259% | |||||||||||||
|
|
$ |
53,817 |
$ |
43,408 |
$ |
36,453 |
$ |
10,409 | 24% |
$ |
6,955 | 19% | ||||||||
44
Net interest expense
The increase in net interest expense between 2017 and 2016 was due primarily to an increase in our average loan principal balance between the two periods, as we continue to increase our borrowings to finance our acquisition of additional rental equipment, as well as an increase in the average interest rate on our outstanding debt, caused by an increase in LIBOR, from approximately 2.7% to 3.2%.
The increase in net interest expense between 2016 and 2015 was due primarily to an increase in our average loan principal balance, as well as an increase in the average interest rate on our outstanding debt, caused by an increase in LIBOR, from approximately 2.3% to 2.7%.
Other expense
Other expense, being a loss on foreign exchange, of $0.8 million for the year ended December 31, 2017 remained relatively consistent with the loss on foreign exchange of $0.7 million for the year ended December 31, 2016. Gains and losses on foreign currency primarily occur when foreign denominated financial assets and liabilities are either settled or re-measured in U.S. dollars. The loss on foreign exchange for the years ended December 31, 2017 and 2016 were primarily the result of movements in the U.S. dollar exchange rate against the Euro.
Other expense, being a loss on foreign exchange, of $0.7 million for the year ended December 31, 2016 increased $0.5 million, or 259%, from a loss on foreign exchange of $0.2 million for the year ended December 31, 2015. The loss on foreign exchange for the years ended December 31, 2016 and 2015 were primarily the result of movements in the U.S. dollar exchange rate against the Euro.
Income tax (benefit) expense
|
|
||||||||||||||||||||
|
|
Year Ended December 31, |
2017 vs 2016 |
2016 vs 2015 |
|||||||||||||||||
|
|
2017 |
2016 |
2015 |
$ Change |
% Change |
$ Change |
% Change |
|||||||||||||
|
($ in thousand) |
||||||||||||||||||||
|
Income tax (benefit) expense |
$ |
(14,861) |
$ |
3,844 |
$ |
4,252 |
$ |
(18,705) |
-487% |
$ |
(408) |
-10% |
||||||||
The decrease in income tax expense between 2017 and 2016 is mainly attributable to a $16.9 million tax benefit arising from the U.S. Tax Cuts and Jobs Act (the Tax Act) that reduced the federal tax rate from 35% to 21%, resulting in the remeasurement of our net deferred tax liabilities, and a benefit of $1.8 million related to stock-based compensation excess tax benefits, partially offset by $1.9 million of tax expense related to prior year true-ups. Excluding these items, income tax expense was $2.0 million for the year ended December 31, 2017, a decrease of $1.8 million, or 47%, compared to the prior year. Excluding the items noted above, the effective tax rate for the year ended December 31, 2017 was 3.6% compared to an effective tax rate of 39% for the year ended December 31, 2016. The lower effective tax rate for the year ended December 31, 2017 was due to an increase in the proportion of pretax income generated in lower tax jurisdictions by our container leasing business, and a corresponding decrease in the proportion of pretax income generated in higher tax jurisdictions, primarily by our railcar business.
We have not completed our accounting for the income tax effects of certain elements of the Tax Act, including the new Global Intangible Low Taxed Income and base erosion anti-abuse taxes. Due to the complexity of these new tax rules, we are continuing to evaluate these provisions of the Tax Act and whether such taxes are recorded as a current period expense when incurred of whether such amounts should be factored into a company’s measurement of its deferred taxes. As a result, we have not included an estimate of the tax expense/benefit related to these items for the period ended December 31, 2017.
The increase in income tax expense between 2016 and 2015 was mainly attributable to an increase in the effective tax rate between the two periods. The effective tax rate for the year ended December 31, 2016 was 39% compared to an effective tax rate of 14% for the year ended December 31, 2015. The increase in rate is primarily attributable to the increase in the proportion of the railcar fleet’s pretax income, all of which is U.S. income, combined with a decrease in pretax income in lower tax jurisdictions that has led to a corresponding increase in the proportion of pretax income generated in higher tax jurisdictions. Net income was also impacted by our determination that foreign tax credits arising from the sale of a subsidiary could not be utilized, resulting in a non-cash tax charge of $1.4 million during the year.
Note 12 to our consolidated financial statements included in this Annual Report on Form 10-K includes a reconciliation between the tax expense calculated at the statutory U.S. income tax rate and the actual tax expense for the years ended December 31, 2017, 2016 and 2015.
Liquidity and Capital Resources
As of December 31, 2017, we had cash and cash equivalents of $35.4 million, including $20.7 million of cash held by variable interest entities (VIEs). Our principal sources of liquidity are cash in-flows provided by operating activities, proceeds from the sale of rental equipment, borrowings from financial institutions, and equity offerings. Our cash in-flows are used to finance capital expenditures and meet debt service requirements.
45
As of December 31, 2017, our outstanding indebtedness and the related maximum borrowing level was as follows (in thousands):
|
|
Amount |
Maximum |
||||
|
|
Outstanding |
Borrowing Level |
||||
|
Revolving credit facilities |
$ |
814,736 |
$ |
1,489,950 | ||
|
Term loans |
296,237 | 296,237 | ||||
|
Senior secured notes |
64,995 | 64,995 | ||||
|
Asset-backed notes |
443,291 | 443,291 | ||||
|
Collateralized financing obligations |
91,990 | 91,990 | ||||
|
Term loans held by VIE |
3,286 | 3,286 | ||||
|
|
1,714,535 | 2,389,749 | ||||
|
Debt issuance costs |
(11,713) |
- |
||||
|
Total |
$ |
1,702,822 |
$ |
2,389,749 | ||
As of December 31, 2017, we had $675.1 million in availability under our revolving credit facilities (net of $0.1 million in letters of credit) subject to our ability to meet the collateral requirements under the agreements governing the facilities. Based on the borrowing base and collateral requirements as of December 31, 2017, the borrowing availability under our revolving credit facilities was $100.2 million, assuming no additional contributions of assets.
As of December 31, 2017, we had $664.4 million of total debt outstanding on facilities with fixed interest rates. These fixed rate facilities are scheduled to mature between 2020 and 2042, and had a weighted average interest rate of 3.3% as of December 31, 2017.
As of December 31, 2017, we had $1,050.2 million of total debt outstanding on facilities with interest rates based on floating rate indices (primarily LIBOR). These floating rate facilities are schedule to mature between 2018 and 2021, and had a weighted average interest rate of 3.2% as of December 31, 2017.
We have typically funded a significant portion of the purchase price for new equipment through borrowings under our credit facilities. However, from time to time we have funded new equipment acquisitions through the use of working capital.
Revolving Credit Facilities
We have three revolving credit facilities which have a maximum borrowing capacity of $960.0 million, $500.0 million, and €25.0 million and maturity dates of March 2020, October 2020, and September 2020, respectively. The entire amount of the facilities drawn at any time plus accrued interest and fees is callable on demand in the event of certain specified events of default.
We use the revolving credit facilities primarily to fund the purchase of rental equipment. As of December 31, 2017, in addition to a rental equipment payable of $92.4 million, we had commitments to purchase $17.6 million of containers and $89.1 million of railcars in the twelve months ending December 31, 2018.
Term Loans
We utilize our term loans as an important funding source for the purchase of rental equipment. Our term loans amortize in monthly or quarterly installments and mature between April 2018 and August 2021.
Senior Secured Notes
We used the proceeds from the senior secured notes primarily to fund the purchase of rental equipment. The notes amortize in semi-annual installments and mature in September 2022.
Asset-Backed Notes
Our asset-backed notes were issued by two of our indirect wholly-owned subsidiaries, which were established to facilitate asset-backed note financings. We used the proceeds from the issuance of the asset-backed notes primarily to repay part of our borrowings under the senior revolving credit facility and to reduce the balance on one of our term loans.
Our borrowings under the asset-backed facilities amortize in monthly installments and mature in June 2042. We are required to maintain a restricted cash account to cover payments of the obligations. As of December 31, 2017, the restricted cash account had a balance of $11.8 million.
Other Debt Obligations
We have entered into a series of collateralized financing obligations with Japanese investor funds that are consolidated by us as VIEs (see Note 4 to our consolidated financial statements included in this Annual Report on Form 10-K). The obligations have maturity dates between March 2018 and December 2020.
46
One of our Japanese investor funds that is consolidated by us as a VIE entered into a term loan agreement with a bank. The VIE term loan matures in June 2019.
Our term loans, senior secured notes, asset-backed notes, collateralized financing obligations and term loans held by VIEs are secured by specific pools of rental equipment and other assets owned by the Company, the underlying leases thereon and the Company’s interest in any money received under such contracts.
In addition to customary events of default, our revolving credit facilities and term loans contain restrictive covenants, including limitations on certain liens, indebtedness and investments. In addition, all of our debt facilities contain various restrictive financial and other covenants. The financial covenants in our debt facilities require us to maintain (1) a consolidated funded debt to consolidated tangible net worth ratio of no more than 3.75:1.00, and in the case of our asset-backed notes, of no more than 4.50:1:00; and (2) a fixed charge coverage ratio of at least 1.20:1.00, and in the case of our asset-backed notes, of at least 1.10:1.00. As of December 31, 2017, we were in compliance with all of our debt covenants.
Under certain conditions, as defined in our credit agreements with our banks and/or note holders, we are subject to certain cross default provisions that may result in an acceleration of principal repayment under these credit facilities if an uncured default condition were to exist. Our asset-backed notes are not subject to any such cross-default provisions.
Cash Flow
The following table sets forth certain cash flow information for the years ended December 31, 2017, 2016 and 2015 (in thousands):
|
|
||||||||
|
|
Year Ended December 31, |
|||||||
|
|
2017 |
2016 |
2015 |
|||||
|
Net income |
$ |
72,060 |
$ |
6,034 |
$ |
26,735 | ||
|
Adjustments to income |
83,132 | 123,222 | 120,634 | |||||
|
Net cash provided by operating activities |
155,192 | 129,256 | 147,369 | |||||
|
Net cash used in investing activities |
(411,751) | (181,600) | (305,248) | |||||
|
Net cash provided by financing activities |
245,625 | 46,599 | 156,536 | |||||
|
Effect on cash of foreign currency translation |
220 | (674) | 75 | |||||
|
Net decrease in cash |
(10,714) | (6,419) | (1,268) | |||||
|
Cash at beginning of period |
46,134 | 52,553 | 53,821 | |||||
|
Cash at end of period |
$ |
35,420 |
$ |
46,134 |
$ |
52,553 | ||
Operating Activities Cash Flows
Net cash provided by operating activities of $155.2 million for the year ended December 31, 2017, increased $25.9 million from $129.3 million for the year ended December 31, 2016. The increase was due to a $37.7 million increase in net income as adjusted for depreciation, amortization and other non-cash items, partially offset by a decrease of $11.8 million in our net working capital adjustments. The increase in net income as adjusted for non-cash items was primarily due to a $66.0 million increase in net income, a $6.1 million increase in depreciation expense, and a $1.6 million reduction in contingent consideration, partially offset by an $18.0 million increase in gain on sale of used rental equipment, a $16.1 million decrease in deferred income taxes, and a $2.7 million decrease in bad debt expense as a result of the Hanjin bankruptcy. Net working capital used in operating activities of $13.5 million during the year ended December 31, 2017, was due to a $7.8 million increase in accounts receivable, primarily caused by an increase in lease and logistics activity, a $2.2 million decrease in accounts payable, accrued expenses and other current liabilities, primarily caused by a decrease in accrued tax expense as a result of excess tax benefits from share-based compensation awards, a $3.0 million decrease in due to container investors due to the decrease in our managed fleet, and a $1.3 million decrease in unearned revenue.
Net cash provided by operating activities of $129.2 million for the year ended December 31, 2016, decreased $18.1 million from $147.4 million for the year ended December 31, 2015. The decrease was due to a $21.1 million decrease in net income as adjusted for depreciation, amortization and other non-cash items, and a decrease of $3.0 million in our net working capital adjustments. The decrease in net income as adjusted for non-cash items was primarily due to a $20.7 million decrease in net income, an $8.8 million decrease in depreciation expense, a $3.8 million reduction in contingent consideration and a $3.8 million decrease in deferred income taxes, partially offset by an increase of $12.0 million in loss on sale of used rental equipment and a $2.7 million increase in bad debt expense as a result of the Hanjin bankruptcy. Net working capital used in operating activities of $1.8 million during the year ended December 31, 2016, was due to a $1.8 million increase in accounts receivable, primarily caused by an increase in rail and logistic billings and the timing of receipts, a $2.7 million increase in prepaid expenses and other assets, primarily due to an insurance receivable related to the Hanjin bankruptcy, and a $2.1 million decrease in unearned revenue, partially offset by an increase of $3.6 million in accounts payable, accrued expenses and other current liabilities, primarily caused by the timing of payments, and a $1.3 million increase in due to container investors.
47
Investing Activities Cash Flows
Net cash used in investing activities increased $230.2 million to $411.8 million for the year ended December 31, 2017 from $181.6 million for the year ended December 31, 2016. The increase in cash usage was primarily attributable to a $250.9 million increase in the purchase of rental equipment, partially offset by a $15.6 million decrease in acquisition costs and a $4.4 million increase in receipt of principal payments from direct financing leases.
Net cash used in investing activities decreased $123.6 million to $181.6 million for the year ended December 31, 2016 from $305.2 million for the year ended December 31, 2015. The decrease in cash usage was primarily attributable to a $138.2 million decrease in the purchase of rental equipment, partially offset by an increase of $11.5 million for the acquisition of our new logistics companies and a $2.5 million decrease in receipt of principal payments from direct financing leases.
Financing Activities Cash Flows
Net cash provided by financing activities of $245.6 million for the year ended December 31, 2017 increased $199.0 million compared to the year ended December 31, 2016, primarily as a result of higher net borrowings being required to finance the acquisition of rental equipment. During the year ended December 31, 2017, our net cash inflow from borrowings was $226.5 million compared to $56.3 million for the year ended December 31, 2016, reflecting an increase in investment in rental equipment during 2017 compared to 2016. The increase was also attributable to an increase of $28.0 million in proceeds received from the issuance of stock and a decrease of $9.2 million used to repurchase our stock pursuant to our previously announced stock repurchase plan, partially offset by a $6.6 million increase in restricted cash and a $1.9 million increase in debt issuance costs, both primarily related to the asset-backed notes issued in the current year.
Net cash provided by financing activities of $46.6 million for the year ended December 31, 2016 decreased $109.9 million compared to the year ended December 31, 2015, primarily as a result of lower net borrowings being required to finance the acquisition of rental equipment. During the year ended December 31, 2016, our net cash inflow from borrowings was $56.3 million compared to $167.0 million for the year ended December 31, 2015, reflecting a decrease in investment in rental equipment during 2016 compared to 2015. The decrease was also attributable to a decrease of $4.7 million in proceeds received from the exercise of stock options, partially offset by a decrease of $3.8 million used to repurchase our stock pursuant to our previously announced stock repurchase plan.
Stock Repurchase Plan
On December 14, 2015, we announced that our Board of Directors had approved the repurchase of up to one million shares of our outstanding common stock. On February 4, 2016, the Company’s Board of Directors approved a one million share increase in the previously approved share repurchase program bringing the total authorized for repurchase to two million shares of our outstanding common stock. The number, price, structure and timing of the repurchases, if any, will be at our sole discretion and future repurchases will be evaluated by us depending on market conditions, liquidity needs and other factors. Stock repurchases may be made in the open market, block trades or privately negotiated transactions. The repurchase authorization does not have an expiration date and does not oblige us to acquire any particular amount of our common stock. As of December 31, 2017, approximately 0.8 million shares remained available for repurchase under our share repurchase plan.
At-the-Market Offering Program
In October 2017, we commenced an at-the-market offering program, which allows us to sell and issue up to 2.0 million shares of our common stock. In the fourth quarter of 2017, we issued 888,453 shares of common stock under our at-the-market offering for gross proceeds of $30.0 million. We paid commissions to our sales agents of $0.6 million and incurred other offering related expenses of $0.3 million. Net proceeds of $29.1 million were used for general corporate purposes. We have remaining capacity to issue up to approximately 1.1 million of additional shares of common stock under the at-the-market offering program.
48
Contractual Obligations and Commercial Commitments
The following table sets forth our contractual obligations and commercial commitments by due date as of December 31, 2017 (in thousands):
|
|
||||||||||||||||||||
|
|
||||||||||||||||||||
|
|
Payments Due by Period |
|||||||||||||||||||
|
|
Less than |
1-2 |
2-3 |
3-4 |
4-5 |
More than |
||||||||||||||
|
|
Total |
1 year |
years |
years |
years |
years |
5 years |
|||||||||||||
|
Total debt obligations: |
||||||||||||||||||||
|
Revolving credit facilities |
$ |
814,736 |
$ |
- |
$ |
- |
$ |
814,736 |
$ |
- |
$ |
- |
$ |
- |
||||||
|
Term loans |
296,237 | 41,903 | 122,899 | 25,299 | 106,136 |
- |
- |
|||||||||||||
|
Senior secured notes |
64,995 | 6,110 | 6,110 | 6,110 | 6,110 | 40,555 |
- |
|||||||||||||
|
Asset-backed notes |
443,291 | 65,307 | 65,307 | 65,307 | 65,307 | 62,457 | 119,606 | |||||||||||||
|
Collateralized financing obligations |
91,990 | 22,549 | 39,666 | 21,775 | 8,000 |
- |
- |
|||||||||||||
|
Term loans held by VIE |
3,286 |
- |
3,286 |
- |
- |
- |
- |
|||||||||||||
|
Interest on debt and capital lease obligations (1) |
159,912 | 53,250 | 49,759 | 27,985 | 12,074 | 7,365 | 9,479 | |||||||||||||
|
Rental equipment payable |
92,415 | 92,415 |
- |
- |
- |
- |
- |
|||||||||||||
|
Rent, office facilities and equipment |
5,450 | 2,439 | 1,881 | 357 | 329 | 228 | 216 | |||||||||||||
|
Equipment purchase commitments - Containers |
17,594 | 17,594 |
- |
- |
- |
- |
- |
|||||||||||||
|
Equipment purchase commitments - Rail |
88,659 | 88,659 |
- |
- |
- |
- |
- |
|||||||||||||
|
Total contractual obligations |
$ |
2,078,565 |
$ |
390,226 |
$ |
288,908 |
$ |
961,569 |
$ |
197,956 |
$ |
110,605 |
$ |
129,301 | ||||||
(1)Our estimate of interest expense commitment includes $62.7 million relating to our revolving credit facilities, $23.1 million relating to our term loans, $12.6 million relating to our senior secured notes, $59.5 million relating to our asset backed notes, $2.0 million relating to our collateralized financing obligations, and $0.1 million related to our term loans held by VIEs. The calculation of interest commitment related to our debt assumes the following weighted average interest rates as of December 31, 2017: revolving credit facilities, 3.2%; term loans, 3.3%; senior secured notes, 4.9%; asset backed notes, 3.5%; collateralized financing obligations, 1.2%; and term loans held by VIEs, 2.7%. These calculations assume that interest rates will remain at the same level over the next five years. We expect that interest rates will vary over time based upon fluctuations in the underlying indexes upon which these interest rates are based.
See Note 10 to our consolidated financial statements included in this Annual Report on Form 10-K for a description of the terms of our revolving credit facilities, term loans and asset-based notes.
Off-Balance Sheet Arrangements
As of December 31, 2017, we had no material off-balance sheet arrangements or obligations that have or are reasonably likely to have a current or future effect on our financial condition, change in financial condition, revenue or expenses, results of operations, liquidity capital expenditure, or capital resources that are material to investors. An off-balance sheet arrangement includes any contractual obligation, agreement or transaction arrangement involving an unconsolidated entity under which we would have: (1) retained a contingent interest in transferred assets; (2) an obligation under derivative instruments classified as equity; (3) any obligation arising out of a material variable interest in an unconsolidated entity that provides financing, liquidity, market risk or credit risk support to us, or that engages in leasing, hedging or research and development services with us; or (4) made guarantees.
Critical Accounting Policies and Estimates
The preparation of financial statements in conformity with GAAP requires management to use judgment in making estimates and assumptions that affect reported amounts of assets and liabilities, the reported amounts of income and expenses during the reporting period and the disclosure of contingent assets and liabilities as of the date of the financial statements. We have identified the policies and estimates below as among those critical to our business operations and the understanding of our results of operations. These policies and estimates are considered critical due to the existence of uncertainty at the time the estimate is made, the likelihood of changes in estimates from period to period and the potential impact that these estimates can have on our financial statements. The following accounting policies and estimates include inherent risks and uncertainties related to judgments and assumptions made by us. Our estimates are based on the relevant information available at the end of each period. Actual results could differ from those estimates.
Revenue Recognition
We provide a range of services to our customers incorporating rental, sale and management of equipment, and the provision of logistics services. Revenue for all forms of service is recognized when earned following the guidelines under Financial Accounting Standards Board (FASB) Accounting Standards Codification (ASC) 605, Revenue Recognition and FASB ASC 840, Leases. Revenue is reported net of any related sales tax.
49
Container and Rail Lease Revenue. We recognize revenue from operating leases of our owned equipment as earned over the term of the lease. Where minimum lease payments vary over the lease term, revenue is recognized on a straight-line basis over the term of the lease. We recognize revenue on a cash basis for certain railcar leases that are billed on an hourly or mileage basis through a third-party railcar manager. Finance lease income is recognized using the effective interest method, which generates a constant rate of interest over the period of the lease. We cease recognition of lease revenue if and when a lessee defaults in making timely lease payments or we otherwise determine that future lease payments are not likely to be collected from the lessee. Our determination of the collectability of future lease payments is made by management on the basis of available information, including the current creditworthiness of lessees, historical collection results and review of specific past due receivables. If we experience unexpected payment defaults from our lessees, we will cease accruing rental revenue as earned and will recognize revenue as cash is received.
Revenue from management fees earned under management agreements is recognized on a monthly basis and included in container lease revenue. Fees are calculated as a percentage of net operating income, which is revenue from the equipment under management minus direct operating expense related to those units. If a lessee of a managed unit defaults in making timely lease payments or we otherwise determine that future lease payments are not likely to be collected from the lessee, then we will cease to record lease revenue for purposes of our internal record keeping in connection with determining the amount of management fees that we have earned, which in turn will result in reduced management fee revenue.
Logistics Revenue. Our logistics business derives its revenue from three principal sources: (1) truck brokerage services, (2) intermodal transportation services, and (3) international ocean freight and freight forwarding services. We recognize logistics revenue when these services are provided to our customers. For truck brokerage services, revenue is recognized when delivery has been completed due to the short transit time related to these services. Intermodal transportation services can take a longer time to complete; for any such services not completed at the end of a reporting period, we use a percentage of completion method to allocate the appropriate revenue to each separate reporting period using relative transit time. We provide international freight forwarding services as an indirect carrier, sometimes referred to as a Non-Vessel Operating Common Carrier (NVOCC). When we act as an NVOCC with respect to shipments of freight, a House Ocean Bill of Lading (HOBL) is typically issued to the customer. Based upon the terms in the contract of carriage (the HOBL), revenue and purchased transportation costs for these shipments are recognized at the time the freight departs the terminal of origin which is when the customer is billed and we have no further obligation to the customer.
We report logistics revenue on a gross basis as we are the primary obligor and responsible for providing the services desired by the customer. We are responsible for fulfillment, including the acceptability of the service, and have discretion in setting sales prices and as a result, our earnings may vary. We also have discretion in selecting vendors from multiple suppliers for the services ordered by our customers. Lastly, we have credit risk for our receivables.
Rental Equipment
Container
We purchase new container equipment from manufacturers to lease to our customers. We also purchase used container equipment through sale-leaseback transactions with our customers, or equipment that was previously owned by one of our third party investors. Used equipment is typically purchased with an existing lease in place.
Container rental equipment is recorded at original cost and depreciated to an estimated residual value on a straight-line basis over its estimated useful life. The estimated useful lives and residual values of our container equipment are based on historical disposal experience and our expectations for future used container sale prices. Depreciation estimates are reviewed on a regular basis to determine whether sustained changes have taken place in the useful lives of our equipment or assigned residual values, which would suggest that a change in depreciation estimates is warranted.
In considering changes to residual values for the three major dry van categories, we reviewed 3-year, 5-year, 7-year, and 12-year average disposition pricing trends. As with all estimates, particularly related to long-lived assets, current market performance may not necessarily be indicative of long-term residual values, so we do not adjust residual values to point-in-time prices. Rather, we consider the mix of data shown in the following tables and use the average over time to either confirm residual value estimates or support revisions to those estimates.
The sale-related unit proceeds by dry van container category that we considered as of October 31, 2017, when we performed our annual residual value analysis, are shown below:
|
Category |
3-year Avg. |
5-year Avg. |
7-year Avg. |
12-year Avg. |
|||||||
|
20-ft. standard dry van container |
$ |
927 |
$ |
1,038 |
$ |
1,122 |
$ |
1,110 | |||
|
40-ft. standard dry van container |
1,101 | 1,234 | 1,365 | 1,340 | |||||||
|
40-ft. high cube dry van container |
1,094 | 1,257 | 1,368 | 1,416 | |||||||
|
20-ft. refrigerated container |
2,998 | 3,219 |
N/A |
N/A |
|||||||
|
40-ft. high cube refrigerated container |
4,045 | 4,048 |
N/A |
N/A |
|||||||
50
Our residual value estimates ($1,050 for a 20-ft. dry van, $1,300 for a 40-ft. dry van, and $1,400 for a 40-ft. high cube dry van) are lower in each instance than the historical average, with the exception of the 3-year average for all equipment types and the 5-year average for 40-ft. high cube dry vans. While we experienced losses when selling certain of these assets during 2015 and 2016, there was a recovery in prices during 2017 that resulted in gains on sale of our equipment. Due to this cyclical nature in the container market, we do not adjust long-term residual value estimates based on short-term data points, such as current year sale results and the 3-year average shown above, as we do not believe they are indicative of a change in the long-term market value for these containers. As such, no change to the residual values of dry van containers was considered necessary during the year ended December 31, 2017. We regularly review this data and update our analysis, and will make revisions to residual value estimates as and when conditions warrant.
The largest segment of our non-dry van container fleet consists of 20-ft. refrigerated containers and 40-ft. high cube refrigerated containers. We regularly review the residual value estimates associated with our refrigerated containers. Given the specific nature of these assets and the lower volumes of containers that are sold each year in the secondary market, not always at the end of the container’s life, there is more variability in asset pricing. Similar to our dry van containers, we evaluate the relationship between sales prices and residual values over a long-term horizon. We excluded 7-year and 12-year historical averages from our analysis as we do not have a long enough history of sales for refrigerated containers. The current residual values for 20-ft. refrigerated and 40-ft. high cube refrigerated containers are set at $2,750 and $3,500, respectively. Based on the data trends, we believe that the residual value estimates for our refrigerated containers are appropriate and do not warrant revision.
After we conducted our regular depreciation policy review for 2016, we concluded that a change in the estimated residual value for 40-foot high cube dry van containers from $1,650 to $1,400 per container, effective July 1, 2016, was appropriate. The change increased our depreciation expense by $4.4 million and $5.4 million, decreased net income by $4.3 million and $5.2 million, and decreased diluted earnings per share by $0.22 and $0.27 for the years ended December 31, 2017 and 2016, respectively.
The estimated useful lives and residual values for the majority of our container equipment purchased new from the factory are as follows:
|
|
||||||
|
|
Depreciable Life |
|||||
|
|
Residual Value |
in Years |
||||
|
20-ft. standard dry van container |
$ |
1,050 |
13.0 |
|||
|
40-ft. standard dry van container |
$ |
1,300 |
13.0 |
|||
|
40-ft. high cube dry van container |
$ |
1,400 |
13.0 |
|||
|
20-ft. refrigerated container |
$ |
2,750 |
12.0 |
|||
|
40-ft. high cube refrigerated container |
$ |
3,500 |
12.0 |
|||
Other specialized equipment is depreciated to its estimated residual value, which ranges from $1,000 to $3,500, over its estimated useful life of between 12.5 years and 15 years.
For used container equipment acquired through sale-leaseback transactions, we often adjust our estimates for remaining useful life and residual values based on current conditions in the sale market for older containers and our expectations for how long the equipment will remain on-hire to the current lessee.
Rail
Railcar equipment is recorded at original cost and depreciated over its estimated useful life of 43 years to its estimated residual value of $8,700 using the straight-line method. We determine the useful life based on our estimate of the period over which the asset will generate revenue. Residual value is based on the average estimated scrap value of our railcars. We periodically review the appropriateness of our estimates of useful life and residual value based on changes in economic circumstances and other factors.
Our railcars may undergo refurbishment and upgrade programs to, for example, extend their useful life, meet higher car classification grades, enter new product or service segments, increase the tonnage carried, or to achieve higher utilization. The costs for these programs are capitalized.
Normal repairs and maintenance associated with our railcar assets are expensed as incurred.
Impairment of Long-Lived Assets
On at least an annual basis, we evaluate our rental equipment fleet to determine whether there have been any events or changes in circumstances indicating that the carrying amount of all, or part, of our fleet may not be recoverable. Events which would trigger an impairment review include, among others, a significant decrease in the long-term average market value of rental equipment, a significant decrease in the utilization rate of rental equipment resulting in an inability to generate income from operations and positive cash flow in future periods, or a change in market conditions resulting in a significant decrease in lease rates.
51
When testing for impairment, equipment is generally grouped by equipment type, and is tested separately from other groups of assets and liabilities. Potential impairment exists when the estimated future undiscounted cash flows generated by an asset group, comprised of lease proceeds and residual values, less related operating expenses, are less than the carrying value of that asset group. If potential impairment exists, the equipment is written down to its fair value. In determining the fair value of an asset group, we consider market trends, published value for similar assets, recent transactions of similar assets and in certain cases, quotes from third party appraisers. During the year ended December 31, 2015, our annual impairment review resulted in a charge for certain off-lease containers of $24.5 million, which is included in depreciation expense in our consolidated statement of income. No impairment charges were recorded in 2017 and 2016 as a result of our annual review.
Recent Accounting Pronouncements.
In August 2016, the FASB issued Accounting Standards Update (ASU) No. 2016-15, Statement of Cash Flows (Topic 230): Classification of Certain Cash Receipts and Cash Payments (ASU 2016-15). ASU 2016-15 is intended to reduce diversity in practice in how certain transactions are classified in the statement of cash flows. In November 2016, the FASB also issued ASU No. 2016-18, Statement of Cash Flows (Topic 230): Restricted Cash, which will require that the statement of cash flows explains the change during the period in the total of cash, cash equivalents, and amounts generally described as restricted cash or restricted cash equivalents. Companies will also be required to reconcile such total to amounts on the balance sheet and disclose the nature of the restrictions. ASU 2016-15 and ASU 2016-18 are effective for interim and annual periods beginning after December 15, 2017, with early adoption permitted, using a retrospective transition method to each period presented. We plan to adopt this guidance effective January 1, 2018 and do not believe adoption will have a material impact on our consolidated statements of cash flows.
In February 2016, the FASB issued ASU No. 2016-02, Leases (Topic 842) (ASU 2016-02). The FASB issued ASU 2016-02 to increase transparency and comparability among organizations recognizing lease assets and lease liabilities on the balance sheet and disclosing key information about leasing arrangements. Under ASU 2016-02, lessors will account for leases using an approach that is substantially equivalent to existing U.S. GAAP for sales-type leases, direct financing leases and operating leases. Unlike current guidance, however, a lease with collectability uncertainties may be classified as a sales-type lease. If collectability of lease payments, plus any amount necessary to satisfy a lessee residual value guarantee, is not probable, lease payments received will be recognized as a deposit liability and the underlying asset will not be derecognized until collectability of the remaining amounts becomes probable. ASU 2016-02 is effective for interim and annual periods beginning after December 15, 2018, with early adoption permitted, and must be adopted using a modified retrospective transition. We plan to adopt this guidance effective January 1, 2019 and are currently evaluating the potential impact the adoption will have on our consolidated financial statements and related disclosures.
In May 2014, the FASB issued ASU No. 2014-09, Revenue from Contracts with Customers (Topic 606) (ASU 2014-09), which supersedes previous revenue recognition guidance. Leasing revenue recognition is specifically excluded, and therefore, the new standard will only apply to logistics service agreements, management service agreements, and sale of used rental equipment. The new standard defines a five-step process to achieve the core principle of ASU 2014-09, which is to recognize revenue when promised goods or services are transferred to customers in amounts that reflect the consideration the Company expects to receive in exchange for those goods or services. Additional disclosures are also required to help users of financial statements understand the nature, amount and timing of revenue and cash flows arising from contracts.
In July 2016, the FASB deferred the effective date for interim and annual periods beginning after December 31, 2017. Early adoption is permitted to the original effective date of periods beginning after December 31, 2016. The amendments may be applied retrospectively to each prior period presented or retrospectively with the cumulative effect recognized as of the date of initial application.
We will be adopting this guidance effective January 1, 2018, using the modified retrospective approach. We have completed our full assessment of adopting the new standard and have determined that adoption will not have a material impact on the amount or timing of revenue recognized, or on our consolidated financial statements and related disclosures.
ITEM 7A: QUANTITATIVE AND QUALITATIVE DISCLOSURES ABOUT MARKET RISK
Market risk represents the risk of changes in value of a financial instrument, derivative or non-derivative, caused by fluctuations in foreign exchange rates and interest rates. Changes in these factors could cause fluctuations in our results of operations and cash flows. We are exposed to the market risks described below.
Interest Rate Risk. The nature of our business exposes us to market risk arising from changes in interest rates to which our variable-rate debt is linked. As of December 31, 2017, the principal amount of debt outstanding under variable-rate revolving credit facilities was $814.7 million. In addition, at December 31, 2017 we had balances on our variable rate term loans of $232.2 million, and $3.3 million of variable rate loans held by a VIE. As of December 31, 2017, our total outstanding variable-rate debt was $1,050.2 million, which represented 61% of our total debt at that date. The average interest rate on our variable-rate debt was 3.2% as of December 31, 2017 based on LIBOR plus a margin based on certain conditions.
A 1.0% increase or decrease in underlying interest rates for these obligations will increase or decrease interest expense by approximately $10.5 million annually assuming debt remains constant at December 31, 2017 levels.
We do not currently participate in hedging, interest rate swaps or other transactions to manage the market risks described above.
52
Foreign Exchange Rate Risk. Although we have significant foreign-based operations, the U.S. dollar is our primary operating currency. Thus, most of our revenue and expenses are denominated in U.S. Dollars. We have equipment sales in British Pound Sterling, Euros and Japanese Yen and incur overhead costs in foreign currencies, primarily in British Pound Sterling and Euros. During the year ended December 31, 2017, the U.S. Dollar decreased in value in relation to other major foreign currencies (such as the Euro and British Pound Sterling). The decrease in the value of the U.S. Dollar has decreased our revenues and expenses denominated in foreign currencies. The decrease in the value of the U.S. Dollar relative to foreign currencies will also result in U.S. dollar denominated assets held at some of our foreign subsidiaries to decrease in value relative to the foreign subsidiaries’ local currencies. For the year ended December 31, 2017, we recognized a loss on foreign exchange of $0.8 million. A 10% change in foreign exchange rates would not have a material impact on our business, financial position, results of operations or cash flows.
ITEM 8: FINANCIAL STATEMENTS AND SUPPLEMENTARY DATA
The consolidated financial statements and financial statement schedule are contained in Item 15 of this Annual Report on Form 10-K, and are incorporated herein by reference. See Part IV, Item 15(a) for an index to the consolidated financial statements and supplementary data.
ITEM 9: CHANGES IN AND DISAGREEMENTS WITH ACCOUNTANTS ON ACCOUNTING AND FINANCIAL DISCLOSURE
None.
ITEM 9A: CONTROLS AND PROCEDURES
Management’s Evaluation of Disclosure Controls and Procedures
In accordance with Rule 13a-15(b) under the Exchange Act, we carried out an evaluation, under the supervision and with the participation of our management, including our President and Chief Executive Officer and our Chief Financial Officer, of the effectiveness of the design and operation of our disclosure controls and procedures (as defined in Rule 13a-15(e) under the Exchange Act) as of the end of the period covered by this Annual Report on Form 10-K. Based upon their evaluation of these disclosure controls and procedures, our President and Chief Executive Officer and our Chief Financial Officer concluded that our disclosure controls and procedures were effective as of December 31, 2017.
Changes in Internal Control Over Financial Reporting
There were no changes in our internal control over financial reporting (as such term is defined in Rule 13a-15(f) and 15d-15(f) under the Exchange Act) during the quarter ended December 31, 2017 that have materially affected, or are reasonably likely to materially affect, our internal control over financial reporting.
53
Management’s Annual Report on Internal Control Over Financial Reporting
Our management is responsible for establishing and maintaining adequate internal control over financial reporting (as defined in Rules 13a-15(f) and 15d-15(f) under the Exchange Act). Our internal control over financial reporting is a process designed with the participation of our principal executive officer and principal financial officer or persons performing similar functions to provide reasonable assurance regarding the reliability of financial reporting and the preparation of our financial statements for external reporting purposes in accordance with U.S. generally accepted accounting principles. Our internal control over financial reporting includes policies and procedures that: (a) pertain to the maintenance of records that, in reasonable detail, accurately and fairly reflect our transactions and dispositions of assets; (b) provide reasonable assurance that transactions are recorded as necessary to permit preparation of financial statements in accordance with U.S. generally accepted accounting principles, and that our receipts and expenditures are being made only in accordance with authorizations of our management and Board of Directors; and (c) provide reasonable assurance regarding prevention or timely detection of unauthorized acquisition, use or disposition of our assets that could have a material effect on our financial statements.
Because of its inherent limitations, our internal controls and procedures may not prevent or detect misstatements. A control system, no matter how well conceived and operated, can only provide reasonable, not absolute, assurance that the objectives of the control system are met. Because of the inherent limitations in all control systems, no evaluation of controls can provide absolute assurance that all control issues and instances of fraud, if any, have been detected. Also, projections of any evaluation of effectiveness to future periods are subject to the risk that controls may become inadequate because of changes in conditions or that the degree of compliance with the policies or procedures may deteriorate.
As of December 31, 2017, our management, with the participation of our President and Chief Executive Officer and our Chief Financial Officer, conducted an evaluation of the effectiveness of our internal control over financial reporting based on the framework established in Internal Control—Integrated Framework (2013) issued by the Committee of Sponsoring Organizations of the Treadway Commission (COSO). Based on this evaluation, management has determined that our internal control over financial reporting is effective as of December 31, 2017.
KPMG LLP, the independent registered public accounting firm that audited our 2017 consolidated financial statements included in this Annual Report on Form 10-K, has issued an attestation report on our internal control over financial reporting. The report appears below.
54
Report of Independent Registered Public Accounting Firm
To the Stockholders and Board of Directors
CAI International, Inc.:
Opinion on Internal Control Over Financial Reporting
We have audited CAI International, Inc. and subsidiaries’ (the Company) internal control over financial reporting as of December 31, 2017, based on criteria established in Internal Control – Integrated Framework (2013) issued by the Committee of Sponsoring Organizations of the Treadway Commission. In our opinion, the Company maintained, in all material respects, effective internal control over financial reporting as of December 31, 2017, based on criteria established in Internal Control – Integrated Framework (2013) issued by the Committee of Sponsoring Organizations of the Treadway Commission.
We also have audited, in accordance with the standards of the Public Company Accounting Oversight Board (United States) (PCAOB), the consolidated balance sheets of the Company as of December 31, 2017 and 2016, the related consolidated statements of income, comprehensive income, stockholders’ equity, and cash flows for each of the years in the three-year period ended December 31, 2017, and the related notes and financial statement schedule II (collectively, the consolidated financial statements), and our report dated February 27, 2018 expressed an unqualified opinion on those consolidated financial statements.
Basis for Opinion
The Company’s management is responsible for maintaining effective internal control over financial reporting and for its assessment of the effectiveness of internal control over financial reporting, included in the accompanying Form 10-K. Our responsibility is to express an opinion on the Company’s internal control over financial reporting based on our audit. We are a public accounting firm registered with the PCAOB and are required to be independent with respect to the Company in accordance with the U.S. federal securities laws and the applicable rules and regulations of the Securities and Exchange Commission and the PCAOB.
We conducted our audit in accordance with the standards of the PCAOB. Those standards require that we plan and perform the audit to obtain reasonable assurance about whether effective internal control over financial reporting was maintained in all material respects. Our audit of internal control over financial reporting included obtaining an understanding of internal control over financial reporting, assessing the risk that a material weakness exists, and testing and evaluating the design and operating effectiveness of internal control based on the assessed risk. Our audit also included performing such other procedures as we considered necessary in the circumstances. We believe that our audit provides a reasonable basis for our opinion.
Definition and Limitations of Internal Control Over Financial Reporting
A company’s internal control over financial reporting is a process designed to provide reasonable assurance regarding the reliability of financial reporting and the preparation of financial statements for external purposes in accordance with generally accepted accounting principles. A company’s internal control over financial reporting includes those policies and procedures that (1) pertain to the maintenance of records that, in reasonable detail, accurately and fairly reflect the transactions and dispositions of the assets of the company; (2) provide reasonable assurance that transactions are recorded as necessary to permit preparation of financial statements in accordance with generally accepted accounting principles, and that receipts and expenditures of the company are being made only in accordance with authorizations of management and directors of the company; and (3) provide reasonable assurance regarding prevention or timely detection of unauthorized acquisition, use, or disposition of the company’s assets that could have a material effect on the financial statements.
Because of its inherent limitations, internal control over financial reporting may not prevent or detect misstatements. Also, projections of any evaluation of effectiveness to future periods are subject to the risk that controls may become inadequate because of changes in conditions, or that the degree of compliance with the policies or procedures may deteriorate.
|
/s/ KPMG LLP |
|
|
|
San Francisco, California |
|
February 27, 2018 |
55
None.
PART III
ITEM 10: DIRECTORS, EXECUTIVE OFFICERS AND CORPORATE GOVERNANCE
The information required by this item is incorporated herein by reference from our definitive proxy statement for our 2018 Annual Meeting of Stockholders, which will be filed no later than 120 days after December 31, 2017.
Code of Ethics
We have a written Code of Business Conduct and Ethics in place that applies to all our employees, including our principal executive officer, principal financial officer, principal accounting officer and controller, and persons performing similar functions. A copy of our Code of Business Conduct and Ethics is available on our website at http://www.capps.com. We intend to use our website as a method of disseminating any change to, or waiver from, our Code of Business Conduct and Ethics as permitted by the applicable SEC rules.
ITEM 11: EXECUTIVE COMPENSATION
The information required by this item is incorporated herein by reference from our definitive proxy statement for our 2018 Annual Meeting of Stockholders, which will be filed no later than 120 days after December 31, 2017.
ITEM 12: SECURITY OWNERSHIP OF CERTAIN BENEFICIAL OWNERS AND MANAGEMENT AND RELATED STOCKHOLDER MATTERS
The information required by this item is incorporated herein by reference from our definitive proxy statement for our 2018 Annual Meeting of Stockholders, which will be filed no later than 120 days after December 31, 2017.
ITEM 13: CERTAIN RELATIONSHIPS AND RELATED TRANSACTIONS, AND DIRECTOR INDEPENDENCE
The information required by this item is incorporated herein by reference from our definitive proxy statement for our 2018 Annual Meeting of Stockholders, which will be filed no later than 120 days after December 31, 2017.
ITEM 14: PRINCIPAL ACCOUNTING FEES AND SERVICES
The information required by this item is incorporated herein by reference from our definitive proxy statement for our 2018 Annual Meeting of Stockholders, which will be filed no later than 120 days after December 31, 2017.
56
PART IV
ITEM 15: EXHIBITS, FINANCIAL STATEMENT SCHEDULES
(a)(1)Financial Statements.
The following financial statements are included in Item 8 of this report:
(a)(2)Financial Statement Schedules.
The following financial statement schedule for the Company is filed as part of this report:
Schedules not listed above have been omitted because the information required to be set forth therein is not applicable or is shown in the accompanying Consolidated Financial Statements or notes thereto.
(a)(3)List of Exhibits.
|
The exhibits set forth on the accompanying Exhibit Index immediately following the financial statement schedule are filed as part of, or incorporated by reference into, this Annual Report on Form 10-K. |
88 |
None.
57
Report of Independent Registered Public Accounting Firm
To the Stockholders and Board of Directors
CAI International, Inc.:
Opinion on the Consolidated Financial Statements
We have audited the accompanying consolidated balance sheets of CAI International, Inc. and subsidiaries (the Company) as of December 31, 2017 and 2016, the related consolidated statements of income, comprehensive income, stockholders’ equity, and cash flows for each of the years in the three‑year period ended December 31, 2017, and the related notes and financial statement schedule II (collectively, the consolidated financial statements). In our opinion, the consolidated financial statements present fairly, in all material respects, the financial position of the Company as of December 31, 2017 and 2016, and the results of its operations and its cash flows for each of the years in the three‑year period ended December 31, 2017, in conformity with U.S. generally accepted accounting principles.
We also have audited, in accordance with the standards of the Public Company Accounting Oversight Board (United States) (PCAOB), the Company’s internal control over financial reporting as of December 31, 2017, based on criteria established in Internal Control – Integrated Framework (2013) issued by the Committee of Sponsoring Organizations of the Treadway Commission, and our report dated February 27, 2018 expressed an unqualified opinion on the effectiveness of the Company’s internal control over financial reporting.
Basis for Opinion
These consolidated financial statements are the responsibility of the Company’s management. Our responsibility is to express an opinion on these consolidated financial statements based on our audits. We are a public accounting firm registered with the PCAOB and are required to be independent with respect to the Company in accordance with the U.S. federal securities laws and the applicable rules and regulations of the Securities and Exchange Commission and the PCAOB.
We conducted our audits in accordance with the standards of the PCAOB. Those standards require that we plan and perform the audit to obtain reasonable assurance about whether the consolidated financial statements are free of material misstatement, whether due to error or fraud. Our audits included performing procedures to assess the risks of material misstatement of the consolidated financial statements, whether due to error or fraud, and performing procedures that respond to those risks. Such procedures included examining, on a test basis, evidence regarding the amounts and disclosures in the consolidated financial statements. Our audits also included evaluating the accounting principles used and significant estimates made by management, as well as evaluating the overall presentation of the consolidated financial statements. We believe that our audits provide a reasonable basis for our opinion.
|
/s/ KPMG LLP |
|
|
|
We have served as the Company’s auditor since 1989. |
|
|
|
San Francisco, California |
|
February 27, 2018 |
58
CONSOLIDATED BALANCE SHEETS
(In thousands, except share information)
|
|
|||||
|
|
December 31, |
December 31, |
|||
|
|
2017 |
2016 |
|||
|
Assets |
|||||
|
Current assets |
|||||
|
Cash |
$ |
14,735 |
$ |
15,685 | |
|
Cash held by variable interest entities |
20,685 | 30,449 | |||
|
Accounts receivable, net of allowance for doubtful accounts of $1,440 |
|||||
|
and $1,340 at December 31, 2017 and 2016, respectively |
70,598 | 63,745 | |||
|
Current portion of net investment in direct finance leases |
30,063 | 19,959 | |||
|
Prepaid expenses and other current assets |
4,258 | 5,315 | |||
|
Total current assets |
140,339 | 135,153 | |||
|
Restricted cash |
11,789 | 6,192 | |||
|
Rental equipment, net of accumulated depreciation of $505,546 |
|||||
|
and $421,153 at December 31, 2017 and 2016, respectively |
2,004,961 | 1,807,010 | |||
|
Net investment in direct finance leases |
246,450 | 80,582 | |||
|
Goodwill |
15,794 | 15,794 | |||
|
Intangible assets, net of accumulated amortization of $3,407 |
|||||
|
and $2,681 at December 31, 2017 and 2016, respectively |
7,723 | 9,691 | |||
|
Furniture, fixtures and equipment, net of accumulated depreciation of $3,201 |
|||||
|
and $2,833 at December 31, 2017 and 2016, respectively |
338 | 550 | |||
|
Other non-current assets |
3,008 | 962 | |||
|
Total assets (1) |
$ |
2,430,402 |
$ |
2,055,934 | |
|
|
|||||
|
Liabilities and Stockholders' Equity |
|||||
|
Current liabilities |
|||||
|
Accounts payable |
$ |
7,831 |
$ |
13,804 | |
|
Accrued expenses and other current liabilities |
15,706 | 11,778 | |||
|
Due to container investors |
4,119 | 7,077 | |||
|
Unearned revenue |
7,811 | 10,613 | |||
|
Current portion of debt |
132,049 | 95,527 | |||
|
Rental equipment payable |
92,415 | 25,207 | |||
|
Total current liabilities |
259,931 | 164,006 | |||
|
Debt |
1,570,773 | 1,380,499 | |||
|
Deferred income tax liability |
35,853 | 51,804 | |||
|
Other long term liabilities |
- |
2,121 | |||
|
Total liabilities (2) |
1,866,557 | 1,598,430 | |||
|
|
|||||
|
Stockholders' equity |
|||||
|
Common stock: par value $.0001 per share; authorized 84,000,000 shares; issued and outstanding |
|||||
|
20,390,622 and 19,057,217 shares at December 31, 2017 and 2016, respectively |
2 | 2 | |||
|
Additional paid-in capital |
172,325 | 141,058 | |||
|
Accumulated other comprehensive loss |
(6,122) | (8,132) | |||
|
Retained earnings |
397,640 | 324,576 | |||
|
Total stockholders' equity |
563,845 | 457,504 | |||
|
Total liabilities and stockholders' equity |
$ |
2,430,402 |
$ |
2,055,934 | |
|
(1) |
Total assets at December 31, 2017 and December 31, 2016 include the following assets of certain variable interest entities (VIEs) that can only be used to settle the liabilities of those VIEs: Cash, $20,685 and $30,449; Net investment in direct finance leases, $4,423 and $7,331; and Rental equipment net of accumulated depreciation, $61,842 and $62,477, respectively. |
|
(2) |
Total liabilities at December 31, 2016 and December 31, 2015 include the following VIE liabilities for which the VIE creditors do not have recourse to CAI International, Inc.: Current portion of debt, $22,549 and $30,980; Debt, $72,727 and $74,887, respectively. |
See accompanying notes to consolidated financial statements.
59
CONSOLIDATED STATEMENTS OF INCOME
(In thousands, except per share data)
|
|
||||||||
|
|
Year Ended December 31, |
|||||||
|
|
2017 |
2016 |
2015 |
|||||
|
Revenue |
||||||||
|
Container lease revenue |
$ |
235,365 |
$ |
202,328 |
$ |
220,732 | ||
|
Rail lease revenue |
32,476 | 30,490 | 17,433 | |||||
|
Logistics revenue |
80,552 | 61,536 | 11,502 | |||||
|
Total revenue |
348,393 | 294,354 | 249,667 | |||||
|
|
||||||||
|
Operating expenses |
||||||||
|
Depreciation of rental equipment |
110,952 | 104,877 | 113,590 | |||||
|
Storage, handling and other expenses |
20,918 | 35,862 | 30,194 | |||||
|
Logistics transportation costs |
68,155 | 51,980 | 10,172 | |||||
|
(Gain) loss on sale of used rental equipment |
(5,347) | 12,671 | 654 | |||||
|
Administrative expenses |
42,699 | 35,678 | 27,617 | |||||
|
Total operating expenses |
237,377 | 241,068 | 182,227 | |||||
|
|
||||||||
|
Operating income |
111,016 | 53,286 | 67,440 | |||||
|
|
||||||||
|
Other expenses |
||||||||
|
Net interest expense |
53,052 | 42,754 | 36,271 | |||||
|
Other expense |
765 | 654 | 182 | |||||
|
Total other expenses |
53,817 | 43,408 | 36,453 | |||||
|
|
||||||||
|
Income before income taxes and non-controlling interest |
57,199 | 9,878 | 30,987 | |||||
|
Income tax (benefit) expense |
(14,861) | 3,844 | 4,252 | |||||
|
|
||||||||
|
Net income |
72,060 | 6,034 | 26,735 | |||||
|
Net income attributable to non-controlling interest |
- |
37 | 134 | |||||
|
Net income attributable to CAI common stockholders |
$ |
72,060 |
$ |
5,997 |
$ |
26,601 | ||
|
|
||||||||
|
Net income per share attributable to CAI common stockholders |
||||||||
|
Basic |
$ |
3.74 |
$ |
0.31 |
$ |
1.28 | ||
|
Diluted |
$ |
3.68 |
$ |
0.31 |
$ |
1.27 | ||
|
|
||||||||
|
Weighted average shares outstanding |
||||||||
|
Basic |
19,253 | 19,318 | 20,773 | |||||
|
Diluted |
19,607 | 19,393 | 20,988 | |||||
See accompanying notes to consolidated financial statements.
60
CONSOLIDATED STATEMENTS OF COMPREHENSIVE INCOME
(In thousands)
|
|
||||||||
|
|
Year Ended December 31, |
|||||||
|
|
2017 |
2016 |
2015 |
|||||
|
|
||||||||
|
Net income |
$ |
72,060 |
$ |
6,034 |
$ |
26,735 | ||
|
Other comprehensive income, net of tax: |
||||||||
|
Foreign currency translation adjustments |
2,010 | (815) | (2,245) | |||||
|
Comprehensive income |
74,070 | 5,219 | 24,490 | |||||
|
Comprehensive income attributable to non-controlling interest |
- |
37 | 134 | |||||
|
Comprehensive income attributable to CAI common stockholders |
$ |
74,070 |
$ |
5,182 |
$ |
24,356 | ||
See accompanying notes to consolidated financial statements.
61
CONSOLIDATED STATEMENTS OF STOCKHOLDERS’ EQUITY
(In thousands)
|
|
||||||||||||||||||||
|
|
||||||||||||||||||||
|
|
Accumulated |
|||||||||||||||||||
|
|
Additional |
Other |
Non- |
|||||||||||||||||
|
|
Common Stock |
Paid-In |
Comprehensive |
Retained |
Controlling |
Total |
||||||||||||||
|
|
Shares |
Amount |
Capital |
Loss |
Earnings |
Interest |
Equity |
|||||||||||||
|
|
||||||||||||||||||||
|
Balances as of December 31, 2014 |
20,788 | 2 | 154,894 | (5,677) | 291,978 | 789 | 441,986 | |||||||||||||
|
Net income |
- |
- |
- |
- |
26,601 | 134 | 26,735 | |||||||||||||
|
Foreign currency translation adjustment |
- |
- |
- |
(2,245) |
- |
- |
(2,245) | |||||||||||||
|
Repurchase of common stock |
(1,089) |
- |
(12,997) |
- |
- |
- |
(12,997) | |||||||||||||
|
Exercise of stock options |
415 |
- |
4,744 |
- |
- |
- |
4,744 | |||||||||||||
|
Stock based compensation - options |
- |
- |
1,542 |
- |
- |
- |
1,542 | |||||||||||||
|
Stock based compensation - restricted stock |
21 |
- |
373 |
- |
- |
- |
373 | |||||||||||||
|
Excess tax benefit from share-based compensation awards |
- |
- |
3 |
- |
- |
- |
3 | |||||||||||||
|
Payment of income tax withheld on vested restricted stock |
(2) |
- |
(36) |
- |
- |
- |
(36) | |||||||||||||
|
Balances as of December 31, 2015 |
20,133 | 2 | 148,523 | (7,922) | 318,579 | 923 | 460,105 | |||||||||||||
|
Net income |
- |
- |
- |
- |
5,997 | 37 | 6,034 | |||||||||||||
|
Foreign currency translation adjustment |
- |
- |
- |
(815) |
- |
- |
(815) | |||||||||||||
|
Disposal of subsidiary |
- |
- |
- |
605 |
- |
(960) | (355) | |||||||||||||
|
Repurchase of common stock |
(1,104) |
- |
(9,176) |
- |
- |
- |
(9,176) | |||||||||||||
|
Stock based compensation - options |
- |
- |
1,292 |
- |
- |
- |
1,292 | |||||||||||||
|
Stock based compensation - restricted stock |
31 |
- |
440 |
- |
- |
- |
440 | |||||||||||||
|
Payment of income tax withheld on vested restricted stock |
(3) |
- |
(21) |
- |
- |
- |
(21) | |||||||||||||
|
Balances as of December 31, 2016 |
19,057 | 2 | 141,058 | (8,132) | 324,576 |
- |
457,504 | |||||||||||||
|
Net income |
- |
- |
- |
- |
72,060 |
- |
72,060 | |||||||||||||
|
Adoption of ASU 2016-09 (Note 2(p)) |
- |
- |
- |
- |
1,004 |
- |
1,004 | |||||||||||||
|
Foreign currency translation adjustment |
- |
- |
- |
2,010 |
- |
- |
2,010 | |||||||||||||
|
Issuance of common stock, net of offering costs |
889 |
- |
29,148 |
- |
- |
- |
29,148 | |||||||||||||
|
Exercise of stock options |
414 |
- |
145 |
- |
- |
- |
145 | |||||||||||||
|
Stock based compensation - options |
- |
- |
1,593 |
- |
- |
- |
1,593 | |||||||||||||
|
Stock based compensation - restricted stock |
37 |
- |
494 |
- |
- |
- |
494 | |||||||||||||
|
Payment of income tax withheld on vested restricted stock |
(6) |
- |
(113) |
- |
- |
- |
(113) | |||||||||||||
|
Balances as of December 31, 2017 |
20,391 |
$ |
2 |
$ |
172,325 |
$ |
(6,122) |
$ |
397,640 |
$ |
- |
$ |
563,845 | |||||||
See accompanying notes to consolidated financial statements.
62
CONSOLIDATED STATEMENTS OF CASH FLOWS
(in thousands)
|
|
Year Ended December 31, |
|||||||
|
|
2017 |
2016 |
2015 |
|||||
|
Cash flows from operating activities |
||||||||
|
Net income |
$ |
72,060 |
$ |
6,034 |
$ |
26,735 | ||
|
Adjustments to reconcile net income to net cash provided by operating activities: |
||||||||
|
Depreciation |
111,294 | 105,236 | 114,003 | |||||
|
Amortization of debt issuance costs |
3,306 | 2,975 | 2,943 | |||||
|
Amortization of intangible assets |
1,969 | 1,443 | 232 | |||||
|
Stock-based compensation expense |
2,087 | 1,732 | 1,915 | |||||
|
Reduction in contingent consideration |
(2,211) | (3,789) |
- |
|||||
|
Unrealized loss on foreign exchange |
106 | 276 | 251 | |||||
|
(Gain) loss on sale of used rental equipment |
(5,347) | 12,671 | 654 | |||||
|
Loss on disposal of subsidiary |
- |
146 |
- |
|||||
|
Deferred income taxes |
(14,947) | 1,138 | 4,967 | |||||
|
Bad debt expense |
402 | 3,151 | 448 | |||||
|
Changes in other operating assets and liabilities: |
||||||||
|
Accounts receivable |
(7,802) | (1,799) | 4,733 | |||||
|
Prepaid expenses and other assets |
735 | (2,691) | (81) | |||||
|
Accounts payable, accrued expenses and other current liabilities |
(2,206) | 3,572 | (3,654) | |||||
|
Due to container investors |
(2,958) | 1,276 | (7,183) | |||||
|
Unearned revenue |
(1,296) | (2,115) | 1,406 | |||||
|
Net cash provided by operating activities |
155,192 | 129,256 | 147,369 | |||||
|
Cash flows from investing activities |
||||||||
|
Purchase of rental equipment |
(502,050) | (251,165) | (389,331) | |||||
|
Acquisitions, net of cash acquired |
- |
(15,599) | (4,100) | |||||
|
Proceeds from sale of used rental equipment |
66,364 | 66,073 | 66,150 | |||||
|
Disposal of subsidiary, net of cash disposed of |
- |
(460) |
- |
|||||
|
Purchase of furniture, fixtures and equipment |
(126) | (82) | (83) | |||||
|
Receipt of principal payments from direct finance leases |
24,061 | 19,633 | 22,116 | |||||
|
Net cash used in investing activities |
(411,751) | (181,600) | (305,248) | |||||
|
Cash flows from financing activities |
||||||||
|
Proceeds from debt |
754,340 | 552,540 | 748,731 | |||||
|
Principal payments on debt |
(527,850) | (496,270) | (581,739) | |||||
|
Debt issuance costs |
(3,441) | (1,515) | (3,226) | |||||
|
(Increase) decrease in restricted cash |
(5,597) | 1,020 | 1,020 | |||||
|
Proceeds from issuance of stock |
28,028 |
- |
- |
|||||
|
Repurchase of stock |
- |
(9,176) | (12,997) | |||||
|
Exercise of stock options |
145 |
- |
4,747 | |||||
|
Net cash provided by financing activities |
245,625 | 46,599 | 156,536 | |||||
|
Effect on cash of foreign currency translation |
220 | (674) | 75 | |||||
|
Net decrease in cash |
(10,714) | (6,419) | (1,268) | |||||
|
Cash at beginning of the period |
46,134 | 52,553 | 53,821 | |||||
|
Cash at end of the period |
$ |
35,420 |
$ |
46,134 |
$ |
52,553 | ||
|
|
||||||||
|
Supplemental disclosure of cash flow information |
||||||||
|
Cash paid during the period for: |
||||||||
|
Income taxes |
$ |
194 |
$ |
889 |
$ |
2,340 | ||
|
Interest |
47,596 | 38,491 | 33,124 | |||||
|
Supplemental disclosure of non-cash investing and financing activity |
||||||||
|
Transfer of rental equipment to direct finance lease |
$ |
205,033 |
$ |
19,036 |
$ |
30,604 | ||
|
Transfer of direct finance lease to rental equipment |
413 | 732 |
- |
|||||
|
Rental equipment payable |
92,415 | 25,207 | 10,901 | |||||
See accompanying notes to consolidated financial statements.
63
(1)The Company and Nature of Operations
CAI International, Inc., together with its subsidiaries (collectively, CAI or the Company), is a transportation finance and logistics company. The Company purchases equipment, primarily intermodal shipping containers and railcars, which it leases to its customers. The Company also manages equipment for third-party investors. In operating its fleet, the Company leases, re-leases and disposes of equipment and contracts for the repair, repositioning and storage of equipment. The Company also provides domestic and international logistics services.
In July 2015, the Company purchased CAI Logistics (formerly ClearPointt Logistics LLC), an intermodal logistics company focused on the domestic intermodal market, for approximately $4.1 million. CAI Logistics is headquartered in Everett, Washington.
In February 2016, the Company purchased Challenger Overseas LLC (Challenger), a Non-Vessel Operating Common Carrier (NVOCC), for approximately $10.8 million. Challenger is headquartered in Eatontown, New Jersey.
In June 2016, the Company purchased Hybrid Logistics, Inc. and its affiliate, General Transportation Services, Inc. (collectively, Hybrid), asset light truck brokers, for approximately $12.0 million. Hybrid is headquartered in Portland, Oregon.
The Company’s common stock is traded on the New York Stock Exchange under the symbol “CAI”. The Company’s corporate headquarters are located in San Francisco, California.
(2)Summary of Significant Accounting Policies
(a) Principles of Consolidation
The consolidated financial statements include the financial statements of CAI International, Inc., its wholly-owned subsidiaries, and its previously 80%-owned subsidiary, CAIJ, Inc. (CAIJ), up to its date of disposal in April 2016. All significant intercompany balances and transactions have been eliminated in consolidation.
The Company regularly performs a review of its container fund arrangements with investors to determine whether or not it has a variable interest in the fund and if the fund is a variable interest entity (VIE). If it is determined that the Company does not have a variable interest in the fund, further analysis is not required and the Company does not consolidate the fund. If it is determined that the Company does have a variable interest in the fund and the fund is a VIE, further analysis is performed to determine if the Company is the primary beneficiary of the VIE and meets both of the following criteria under Financial Accounting Standards Board (FASB) Accounting Standards Codification (ASC) Topic 810:
it has power to direct the activities of the VIE that most significantly impact the VIE’s economic performance; and
it has the obligation to absorb losses of the VIE that could be potentially significant to the VIE or the right to receive benefits from the VIE that could potentially be significant to the VIE.
If in the Company’s judgment both of the above criteria are met, the VIE’s financial statements are included in the Company’s consolidated financial statements as required under FASB ASC Topic 810, Consolidation (see Note 4).
(b) Use of Estimates
Certain estimates and assumptions were made by the Company’s management that affect the reported amounts of assets and liabilities and disclosure of contingent assets and liabilities at the date of the financial statements and the reported amounts of revenue and expenses during the reporting periods. Significant items subject to such estimates and assumptions include revenue recognition, allowances for receivables, the carrying amount of rental equipment, the residual values and lives of rental equipment, and income tax uncertainties. Actual results could differ from those estimates.
(c) Furniture, Fixtures, and Equipment
Furniture, fixtures, office equipment and software, are depreciated on a straight-line basis over estimated useful lives of five years with no salvage value. Leasehold improvements are depreciated over the shorter of their useful lives or the respective lease life.
(d) Rental equipment
Container
The Company purchases new container equipment from manufacturers to lease to its customers. The Company also purchases used container equipment through sale-leaseback transactions with its customers, or equipment that was previously owned by one of the Company's third party investors. Used equipment is typically purchased with an existing lease in place.
64
Container rental equipment is recorded at original cost and depreciated to an estimated residual value on a straight-line basis over its estimated useful life. The estimated useful lives and residual values of the Company’s container equipment are based on historical disposal experience and the Company’s expectations for future used container sale prices. Depreciation estimates are reviewed on a regular basis to determine whether sustained changes have taken place in the useful lives of equipment or the assigned residual values, which would suggest that a change in depreciation estimates is warranted.
After the Company conducted its regular depreciation policy review for 2016, it concluded that a change in the estimated residual value for 40-foot high cube dry van containers from $1,650 to $1,400 per container, effective July 1, 2016, was appropriate. The change increased the Company’s depreciation expense by $4.4 million and $5.4 million, decreased net income by $4.3 million and $5.2 million, and decreased diluted earnings per share by $0.22 and $0.27, for the years ended December 31, 2017 and 2016, respectively. No change to residual values was considered necessary during the year ended December 31, 2017.
The estimated useful lives and residual values for the majority of the Company's container equipment purchased new from the factory are as follows:
|
|
||||||
|
|
Depreciable Life |
|||||
|
|
Residual Value |
in Years |
||||
|
20-ft. standard dry van container |
$ |
1,050 |
13.0 |
|||
|
40-ft. standard dry van container |
$ |
1,300 |
13.0 |
|||
|
40-ft. high cube dry van container |
$ |
1,400 |
13.0 |
|||
|
20-ft. refrigerated container |
$ |
2,750 |
12.0 |
|||
|
40-ft. high cube refrigerated container |
$ |
3,500 |
12.0 |
|||
Other specialized equipment is depreciated to its estimated residual value, which ranges from $1,000 to $3,500, over its estimated useful life of between 12.5 years and 15 years.
For used container equipment acquired through sale-leaseback transactions, we often adjust our estimates for remaining useful life and residual values based on current conditions in the sale market for older containers and our expectations for how long the equipment will remain on-hire to the current lessee.
Rail
Railcar equipment is recorded at original cost and depreciated over its estimated useful life of 43 years to its estimated residual value of $8,700 using the straight-line method. The useful life is based on an estimate of the period over which the asset will generate revenue for the Company. Residual value is based on the average estimated scrap value of the Company’s railcars. The Company periodically reviews the appropriateness of its estimates of useful life and residual value based on changes in economic circumstances and other factors.
The Company’s railcars may undergo refurbishment and upgrade programs to, for example, extend their useful life, meet higher car classification grades, enter new product or service segments, increase the tonnage carried, or to achieve higher utilization. The costs for these programs are capitalized.
Normal repairs and maintenance associated with the Company’s railcar assets are expensed as incurred.
(e) Impairment of Long-Lived Assets
On at least an annual basis, the Company evaluates its rental equipment fleet to determine whether there have been any events or changes in circumstances indicating that the carrying amount of all, or part, of its fleet may not be recoverable. Events which would trigger an impairment review include, among others, a significant decrease in the long-term average market value of rental equipment, a significant decrease in the utilization rate of rental equipment resulting in an inability to generate income from operations and positive cash flow in future periods, or a change in market conditions resulting in a significant decrease in lease rates.
When testing for impairment, equipment is generally grouped by rental type, and is tested separately from other groups of assets and liabilities. Potential impairment exists when the estimated future undiscounted cash flows generated by an asset group, comprised of lease proceeds and residual values, less related operating expenses, are less than the carrying value of that asset group. If potential impairment exists, the equipment is written down to its fair value. In determining the fair value of an asset group, the Company considers market trends, published value for similar assets, recent transactions of similar assets and in certain cases, quotes from third party appraisers. During the year ended December 31, 2015, the market conditions for certain off-lease containers changed which resulted in their carrying value exceeding their fair value. The fair value was estimated based on recent gross sales proceeds for sales of similar containers and management’s judgment of market conditions. The resulting impairment charge of $24.5 million relating to the container leasing segment is included in depreciation expense in the consolidated statement of income. No impairment charges were recorded in 2017 and 2016.
65
(f) Intangible Assets
Intangible assets with definite useful lives are reviewed for impairment whenever events or changes in circumstances indicate an asset’s carrying value may not be recoverable. The Company amortizes intangible assets on a straight-line basis over their estimated useful lives as follows:
|
Trademarks and tradenames |
2-3 years |
|
Customer relationships |
5-8 years |
(g) Goodwill
In connection with the acquisitions of CAI Logistics in 2015 and Challenger and Hybrid in 2016, the Company recorded $15.8 million of goodwill. Goodwill represents the excess of the purchase price over the fair value of the net assets acquired in a business combination. Goodwill is not amortized but is evaluated for impairment at the reporting unit level annually, or more frequently if events or changes in circumstances indicate that impairment may exist.
The Company assesses qualitative factors such as industry and market considerations, overall financial performance and other relevant events and factors affecting a reporting unit to determine if it is more likely than not that impairment may exist and whether it is necessary to perform the quantitative goodwill impairment test. This involves comparing the fair value to the carrying value of each reporting unit that has goodwill assigned to it. The Company recognizes an impairment charge for the amount by which the carrying value of the reporting unit exceeds the fair value. The Company performed the annual impairment test during the fourth quarter of 2017 and concluded that there was no impairment of goodwill.
(h) Direct Finance Leases
Interest on finance leases is recognized using the effective interest method. Lease income is recorded in decreasing amounts over the term of the contract, resulting in a level rate of return on the net investment in direct finance leases.
(i) Debt Issuance Costs
To the extent that the Company is required to pay issuance fees or direct costs relating to its debt and credit facilities, such fees are amortized over the lives of the related debt using the effective interest method and reflected in interest expense. Unamortized debt issuance costs of $11.7 million and $11.2 million are presented as a reduction of debt on the Company’s consolidated balance sheets as of December 31, 2017 and 2016, respectively.
(j) Foreign Currency Translation
The accounts of the Company’s foreign subsidiaries have been converted at rates of exchange in effect at year-end for balance sheet accounts and average exchange rates for the year for income statement accounts. The effects of changes in exchange rates in translating foreign subsidiaries’ financial statements are included in stockholders’ equity as accumulated other comprehensive income.
(k) Accounts Receivable
Amounts billed under leases for equipment owned by the Company, as well as amounts due from customers for the provision of logistics services, are recorded in accounts receivable. The Company estimates an allowance for doubtful accounts for accounts receivable it does not consider fully collectible. The allowance for doubtful accounts is developed based on two key components: (1) specific reserves for receivables for which management believes full collection is doubtful; and (2) a general reserve for estimated losses inherent in the receivables. The general reserve is estimated by applying certain percentages to receivables that have not been specifically reserved, ranging from 1.0% on accounts that are one to thirty days overdue, to 100% on accounts that are one year or more overdue. The allowance for doubtful accounts is reviewed regularly by management and is based on the risk profile of the receivables, credit quality indicators such as the level of past due amounts and non-performing accounts and economic conditions. Changes in economic conditions or other events may necessitate additions or deductions to the allowance for doubtful accounts. The allowance is intended to provide for losses inherent in the company’s accounts receivable, and requires the application of estimates and judgments as to the outcome of collection efforts and the realization of collateral, among other things.
Amounts billed under leases for equipment owned by third-party investors are also recorded in accounts receivable with a corresponding credit to due to container investors account. The credit risk on accounts receivable related to managed equipment is the responsibility of the third-party investors. Under the Company’s management agreements with investors, the third-party investors are obligated to reimburse the Company for any amounts the Company had previously paid to them in advance of receiving the amount from the equipment lessee if the Company is unable to ultimately collect any amount due from a managed equipment lessee. Accounts receivable attributable to the managed fleet included in accounts receivable as of December 31, 2017 and 2016 was $2.3 million and $5.1 million, respectively.
66
(l) Income Taxes
Income taxes are accounted for using the asset-and-liability method. Under this method, deferred income taxes are recognized for the future tax consequences of differences between the tax bases of assets and liabilities and their financial reporting amounts at each year-end. Deferred tax assets and liabilities are measured using enacted tax rates expected to apply to taxable income in the years in which those temporary differences are expected to be recovered or settled. Valuation allowances are established when it is more likely than not that deferred tax assets will not be recovered.
The Company recognizes the effect of income tax positions only if those positions are more likely than not of being sustained. Recognized income tax positions are measured at the largest amount that is greater than 50% likely of being realized. Changes in recognition or measurement are reflected in the period in which the change in judgment occurs. The Company records penalties and interest related to unrecognized tax benefits within income tax expense (see Note 12).
(m) Revenue Recognition
The Company provides a range of services to its customers incorporating rental, sale and management of equipment and the provision of logistics services. Revenue for all forms of service is recognized when earned following the guidelines under FASB ASC Topic 605, Revenue Recognition and FASB ASC Topic 840, Leases. Revenue is reported net of any related sales tax.
Container and Rail Lease Revenue
The Company recognizes revenue from operating leases of its owned equipment as earned over the term of the lease. Where minimum lease payments vary over the lease term, revenue is recognized on a straight-line basis over the term of the lease. The Company recognizes revenue on a cash basis for certain railcar leases that are billed on an hourly or mileage basis through a third-party railcar manager. Early termination of the rental contracts subjects the lessee to a penalty, which is included in lease revenue upon such termination. Finance lease income is recognized using the effective interest method, which generates a constant rate of interest over the period of the lease.
Included in lease revenue is revenue consisting primarily of fees charged to the lessee for handling, delivery, repairs, and fees relating to the Company’s damage protection plan, which are recognized as earned.
Also included in lease revenue is revenue from management fees earned under equipment management agreements as earned on a monthly basis. Management fees are typically a percentage of net operating income of each investor group’s fleet calculated on an accrual basis. Included in the Company’s balance sheet are accounts receivable from the managed fleet which are uncollected lease billings related to managed equipment. The Company’s financial statements include accounts payable and accruals of expenses related to managed equipment. The net amount of rentals billed less expenses payable, less management fees, is recorded in amounts due to container investors on the balance sheet.
Logistics Revenue
The Company’s logistics business derives its revenue from three principal sources: (1) truck brokerage services, (2) intermodal transportation services, and (3) international ocean freight and freight forwarding services. The Company recognizes logistics revenue when these services are provided to its customers. For truck brokerage services, revenue is recognized when delivery has been completed, due to the short transit time related to these services. Intermodal transportation services can take a longer time to complete; for any such services not completed at the end of a reporting period, a percentage of completion method is used to allocate the appropriate revenue to each separate reporting period using relative transit time. The Company provides international freight forwarding services as an indirect carrier, sometimes referred to as a Non-Vessel Operating Common Carrier (NVOCC). When the Company acts as an NVOCC with respect to shipments of freight, a House Ocean Bill of Lading (HOBL) is typically issued to the customer. Based upon the terms in the contract of carriage (the HOBL), revenue and purchased transportation costs for these shipments are recognized at the time the freight departs the terminal of origin, which is when the customer is billed and the Company has no further obligation to the customer.
The Company reports logistics revenue on a gross basis as it is the primary obligor and responsible for providing the services desired by the customer. The Company is responsible for fulfillment, including the acceptability of the service, and has discretion in setting sales prices and as a result, its earnings may vary. The Company also has discretion in selecting vendors from multiple suppliers for the services ordered by the customers. Lastly, the Company has credit risk for the related receivables.
(n) Stock-Based Compensation
The Company has granted stock options and restricted stock to certain directors and employees under its 2007 Equity Incentive Plan. The Company accounts for stock-based compensation in accordance with FASB ASC Topic 718, Compensation – Stock Compensation, which requires that compensation cost related to stock-based compensation be recognized in the financial statements. The cost is measured at the date the award is granted based on the fair value of the award. The fair value of stock options is calculated using the Black-Scholes-Merton option pricing model. The stock-based compensation expense is recognized over the vesting period of the grant on a straight-line basis (see Note 11). The company accounts for forfeitures as they occur.
67
(o) Repairs and Maintenance
The Company’s leases generally require the lessee to pay for any damage to the equipment beyond normal wear and tear at the end of the lease term. The Company accounts for repairs and maintenance expense on an accrual basis when an obligation to pay has been incurred.
(p) Recent Accounting Pronouncements
In March 2016, the Financial Accounting Standards Board (FASB) issued Accounting Standards Update (ASU) No. 2016-09, Improvements to Employee Share-Based Payment Accounting (ASU 2016-09) to simplify certain aspects of the accounting for share-based payment transactions to employees. The new standard requires excess tax benefits and tax deficiencies to be recorded in the statement of income as a component of the provision for income taxes when stock awards vest or are settled. In addition, it eliminates the requirement to reclassify cash flows related to excess tax benefits from operating activities to financing activities on the consolidated statements of cash flows. The standard also provides an accounting policy election to account for forfeitures as they occur. The Company adopted ASU 2016-09 effective January 1, 2017. Accordingly, excess tax benefits or deficiencies from stock-based compensation are now reflected in the consolidated statements of income as a component of the provision for income taxes, whereas they were previously recognized in equity. The Company also elected to account for forfeitures as they occur, rather than estimate expected forfeitures. As a result of the adoption of ASU 2016-09, the Company recognized $1.0 million in deferred tax assets associated with excess tax benefits not previously recognized in deferred taxes as a cumulative-effect adjustment to retained earnings as of January 1, 2017. Adoption of the new standard also resulted in a benefit of $1.8 million on our provision for income taxes for the year ended December 31, 2017. The Company elected to adopt the aspects of the standard affecting cash flow presentation prospectively, which did not have a material impact on the consolidated statements of cash flows.
In January 2017, the FASB issued ASU No. 2017-04, Intangibles – Goodwill and Other (Topic 350): Simplifying the Test for Goodwill Impairment (ASU 2017-04), which eliminates step two from the goodwill impairment test. Under ASU 2017-04, an entity should recognize an impairment charge for the amount by which the carrying amount of a reporting unit exceeds its fair value up to the amount of goodwill allocated to that reporting unit. The Company early adopted ASU 2017-04 effective January 1, 2017. Adoption of the standard did not have a material impact on the Company’s consolidated financial statements.
(3)Insurance Receivable and Impairment
In August 2016, Hanjin Shipping Co., Ltd. (Hanjin) filed for court protection from its creditors. Based on the recovery of Hanjin containers to date and prior experience, the Company believes that most of its containers will be recovered. As of December 31, 2017, the Company has recovered approximately 92% of the containers that were on lease to Hanjin. The Company maintains insurance to cover the value of containers that are unlikely to be recovered from its customers, the cost to recover and repair containers, and up to 180 days of lost lease rental income, subject to deductibles of $0.5 million and $2.0 million.
During the year ended December 31, 2016, the Company recorded an impairment of $3.2 million representing the book value of containers the Company estimated would not be recovered from Hanjin. As of December 31, 2016, an insurance receivable of $3.8 million was recorded for $1.2 million of estimated irrecoverable containers in excess of the insurance deductible, which was recorded in depreciation expense, and $2.6 million of recovery costs, which was recorded as a reduction to storage, handling and other expenses for the year ended December 31, 2016. During the year ended December 31, 2017, the Company recorded an additional insurance receivable of $7.6 million for $2.2 million of lost lease rental income, recognized as container lease revenue, and $1.5 million of repair costs and $3.9 million of recovery costs, recorded as a reduction to storage, handling and other expenses. The Company also received insurance proceeds of $9.5 million, which were recorded as a reduction to the insurance receivable. As of December 31, 2017, the insurance receivable related to this claim was $1.9 million.
(4)Consolidation of Variable Interest Entities as a Non-Controlling Interest
The Company regularly performs a review of its container fund arrangements with investors to determine whether or not it has a variable interest in the fund and if the fund is a VIE. If it is determined that the Company does not have a variable interest in the fund, further analysis is not required and the Company does not consolidate the fund. If it is determined that the Company does have a variable interest in the fund and the fund is a VIE, further analysis is performed to determine if the Company is a primary beneficiary of the VIE and meets both of the following criteria under FASB ASC Topic 810:
it has power to direct the activities of the VIE that most significantly impact the VIE’s economic performance; and
it has the obligation to absorb losses of the VIE that could be potentially significant to the VIE or the right to receive benefits from the VIE that could potentially be significant to the VIE.
If in the Company’s judgment both of the above criteria are met, the VIE’s financial statements are included in the Company’s consolidated financial statements as required under FASB ASC Topic 810, Consolidation.
68
The Company currently enters into two types of container fund arrangements with investors which are reviewed under FASB ASC Topic 810, Consolidation. These arrangements include container funds that the Company manages for investors and container funds that have entered into financing arrangements with investors. All of the funds under financing arrangements are Japanese container funds that were established under separate investment agreements allowed under Japanese commercial laws (see Note 15). Each of the funds is financed by unrelated Japanese third-party investors.
Managed Container Funds
The fees earned by the Company for arranging, managing and establishing container funds are commensurate with the level of effort required to provide those services, and are at or above the same level of seniority as other liabilities of the funds that are incurred in the normal course of business. As such, the Company does not have a variable interest in the managed container funds, and does not consolidate those funds. The Company recognizes gain on sale of containers to the unconsolidated funds as sales in the ordinary course of business. No container portfolios were sold to the funds in the years ended December 31, 2017, 2016 and 2015.
Collateralized Financing Obligations
The Company has transferred containers to Japanese investor funds while concurrently entering into lease agreements for the same containers, under which the Company leases the containers back from the Japanese investors. In accordance with FASB ASC Topic 840, Sale-Leaseback Transactions, the Company concluded these were financing transactions under which sale-leaseback accounting was not applicable.
The terms of the transactions with container funds under financing arrangements include options for the Company to purchase the containers from the funds at a fixed price. As a result of the residual interest resulting from the fixed price call option, the Company concluded that it may absorb a significant amount of the variability associated with the funds’ anticipated economic performance and, as a result, the Company has a variable interest in the funds. The funds are considered VIEs under FASB ASC Topic 810, Consolidation, because, as lessee of the funds, the Company has the power to direct the activities that most significantly impact each entity’s economic performance, including the leasing and managing of containers owned by the funds. As the Company has the power to direct the activities that most significantly impact the economic performance of the VIEs and the variable interest provides the Company with the right to receive benefits from the entity that could potentially be significant to the funds, the Company determined that it is the primary beneficiary of these VIEs and included the VIEs’ assets and liabilities as of December 31, 2017 and 2016, and the results of the VIEs’ operations and cash flows for the years ended December 31, 2017, 2016 and 2015 in the Company’s consolidated financial statements.
The containers that were transferred to the Japanese investor funds had a net book value of $70.0 million as of December 31, 2017. The container equipment, together with $20.7 million of cash held by the investor funds that can only be used to settle the liabilities of the VIEs, has been included on the Company’s consolidated balance sheet with the related liability presented in the debt section of the Company’s consolidated balance sheet as collateralized financing obligations of $92.0 million and term loans held by VIE of $3.3 million. See Note 10(e) and Note 10(f) for additional information. No gain or loss was recognized by the Company on the initial consolidation of the VIEs. Containers sold to the Japanese investor funds during the years ended December 31, 2017, 2016 and 2015, had book values of $20.5 million, $36.2 million and $30.4 million, respectively.
(5)Acquisitions
In 2016, the Company completed the acquisitions of Challenger and Hybrid, for total consideration of $22.8 million, $6.0 million of which was contingent and based on their future performance. The aggregate allocation of the combined purchase price included $1.2 million of cash, $9.9 million of identifiable intangible assets, $12.9 million of residual goodwill, and $1.2 million of net liabilities assumed.
The contingent consideration liability was $2.2 million as of December 31, 2016. Expected future payments of $2.1 million and $0.1 million were recorded in Other long-term liabilities and Accrued expenses and Other current liabilities, respectively, in the Company’s consolidated balance sheet at December 31, 2016. Based on the forecasted future performance of Challenger and Hybrid, it has been estimated that there will be no future payments made and, as a result, the fair value of the contingent consideration liability has been estimated to be zero at December 31, 2017.
69
The following table provides a reconciliation of the contingent consideration liability measured at estimated fair value based on the balance as of December 31, 2016 and updated quarterly for the year ended December 31, 2017 (in thousands):
|
|
2017 |
|||||
|
January 1 |
$ |
2,211 | ||||
|
Net decrease in estimated fair value of contingent consideration |
||||||
|
included in Administrative expenses |
(2,211) | |||||
|
December 31 |
$ |
- |
||||
(6)Rental Equipment
The following table provides a summary of the Company’s rental equipment (in thousands):
|
|
December 31, |
December 31, |
||||
|
|
2017 |
2016 |
||||
|
Dry containers |
$ |
1,533,063 |
$ |
1,322,508 | ||
|
Refrigerated containers |
345,744 | 350,776 | ||||
|
Other specialized equipment |
160,529 | 164,934 | ||||
|
Railcars |
471,171 | 389,945 | ||||
|
|
2,510,507 | 2,228,163 | ||||
|
Accumulated depreciation |
(505,546) | (421,153) | ||||
|
Rental equipment, net of accumulated depreciation |
$ |
2,004,961 |
$ |
1,807,010 | ||
2
(7)Net Investment in Direct Finance Leases
The following table represents the components of the Company’s net investment in direct finance leases (in thousands):
|
|
||||||
|
|
December 31, |
December 31, |
||||
|
|
2017 |
2016 |
||||
|
Gross finance lease receivables (1) |
$ |
412,489 |
$ |
123,563 | ||
|
Unearned income (2) |
(135,976) | (23,022) | ||||
|
Net investment in direct finance leases |
$ |
276,513 |
$ |
100,541 | ||
(1)At the inception of the lease, the Company records the total minimum lease payments, executory costs, if any, and unguaranteed residual value as gross finance lease receivables. The gross finance lease receivables are reduced as customer payments are received. There was $34.4 million and $2.1 million unguaranteed residual value at December 31, 2017 and 2016, respectively, included in gross finance lease receivables. There were no executory costs included in gross finance lease receivables as of December 31, 2017 and 2016.
(2)The difference between the gross finance lease receivables and the cost of the equipment or carrying amount at the lease inception is recorded as unearned income. Unearned income, together with initial direct costs, are amortized to income over the lease term so as to produce a constant periodic rate of return. There were no unamortized initial direct costs as of December 31, 2017 and 2016.
In order to estimate the allowance for losses contained in the gross finance lease receivables, the Company reviews the credit worthiness of its customers on an ongoing basis. The review includes monitoring credit quality indicators, the aging of customer receivables and general economic conditions.
The categories of gross finance lease receivables based on the Company's internal customer credit ratings can be described as follows:
Tier 1— These customers are typically large international shipping lines that have been in business for many years and have world-class operating capabilities and significant financial resources. In most cases, the Company has had a long commercial relationship with these customers and currently maintains regular communication with them at several levels of management, which provides the Company with insight into the customer's current operating and financial performance. In the Company's view, these customers have the greatest ability to withstand cyclical down turns and would likely have greater access to needed capital than lower-rated customers. The Company views the risk of default for Tier 1 customers to range from minimal to moderate.
70
Tier 2— These customers are typically either smaller shipping lines or freight forwarders with less operating scale or with a high degree of financial leverage, and accordingly the Company views these customers as subject to higher volatility in financial performance over the business cycle. The Company generally expects these customers to have less access to capital markets or other sources of financing during cyclical down turns. The Company views the risk of default for Tier 2 customers as moderate.
Tier 3— Customers in this category exhibit volatility in payments on a regular basis.
Based on the above categories, the Company's gross finance lease receivables were as follows (in thousands):
|
|
||||||
|
|
December 31, |
December 31, |
||||
|
|
2017 |
2016 |
||||
|
Tier 1 |
$ |
366,629 |
$ |
74,777 | ||
|
Tier 2 |
45,860 | 48,786 | ||||
|
Tier 3 |
- |
- |
||||
|
|
$ |
412,489 |
$ |
123,563 | ||
Contractual maturities of the Company’s gross finance lease receivables subsequent to December 31, 2017 for the years ending December 31 are as follows (in thousands):
|
|
||||||
|
2018 |
$ |
53,102 | ||||
|
2019 |
67,539 | |||||
|
2020 |
38,387 | |||||
|
2021 |
38,358 | |||||
|
2022 |
31,127 | |||||
|
2023 and thereafter |
183,976 | |||||
|
|
$ |
412,489 |
(8)Intangible Assets
The Company’s intangible assets as of December 31, 2017 and 2016 were as follows (in thousands):
|
|
||||||||
|
|
Gross Carrying Amount |
Accumulated Amortization |
Net Carrying Amount |
|||||
|
December 31, 2017 |
||||||||
|
Trademarks and tradenames |
$ |
1,786 |
$ |
(1,411) |
$ |
375 | ||
|
Customer relationships |
9,344 | (1,996) | 7,348 | |||||
|
|
$ |
11,130 |
$ |
(3,407) |
$ |
7,723 | ||
|
December 31, 2016 |
||||||||
|
Trademarks and tradenames |
$ |
3,028 |
$ |
(1,850) |
$ |
1,178 | ||
|
Customer relationships |
9,344 | (831) | 8,513 | |||||
|
|
$ |
12,372 |
$ |
(2,681) |
$ |
9,691 | ||
Amortization expense recorded for the years ended December 31, 2017, 2016 and 2015 was $2.0 million, $1.4 million and $0.2 million, respectively, and was included in administrative expenses in the consolidated statements of income.
As of December 31, 2017, estimated future amortization expenses are as follows (in thousands):
|
|
||||||
|
2018 |
$ |
1,984 | ||||
|
2019 |
1,609 | |||||
|
2020 |
1,609 | |||||
|
2021 |
1,518 | |||||
|
2022 |
474 | |||||
|
2023 and thereafter |
529 | |||||
|
|
$ |
7,723 |
71
(9)Equipment Leases
The Company leases its equipment on either short-term operating leases through master lease agreements, long-term non-cancelable operating leases, or finance leases. The following represents future minimum rents receivable under long-term non-cancelable operating leases as of December 31, 2017 (in thousands):
|
|
||||||
|
2018 |
$ |
174,369 | ||||
|
2019 |
128,418 | |||||
|
2020 |
98,614 | |||||
|
2021 |
76,239 | |||||
|
2022 |
54,290 | |||||
|
2023 and thereafter |
175,068 | |||||
|
|
$ |
706,998 |
See Note 7 for contractual maturities of the Company’s gross finance lease receivables.
(10)Debt
Details of the Company’s debt as of December 31, 2017 and 2016 were as follows (dollars in thousands):
|
|
||||||||||||||||||
|
|
December 31, 2017 |
December 31, 2016 |
||||||||||||||||
|
|
Outstanding |
Average |
Outstanding |
Average |
||||||||||||||
|
Reference |
Current |
Long-term |
Interest |
Current |
Long-term |
Interest |
Maturity |
|||||||||||
|
(a)(i) |
Revolving credit facility |
$ |
- |
$ |
528,000 |
3.2% |
$ |
- |
$ |
526,000 |
2.5% |
March 2020 |
||||||
|
(a)(ii) |
Revolving credit facility - Rail |
- |
272,000 |
3.2% |
- |
223,500 |
2.4% |
October 2020 |
||||||||||
|
(a)(iii) |
Revolving credit facility - Euro |
- |
14,736 |
2.0% |
- |
- |
0.0% |
September 2020 |
||||||||||
|
(b)(i) |
Term loan |
21,900 |
- |
3.4% |
1,800 | 21,900 |
2.9% |
April 2018 |
||||||||||
|
(b)(ii) |
Term loan |
9,000 | 111,750 |
3.1% |
9,000 | 120,750 |
2.3% |
October 2019 |
||||||||||
|
(b)(iii) |
Term loan |
7,000 | 82,500 |
3.3% |
7,000 | 89,500 |
2.5% |
June 2021 |
||||||||||
|
(b)(iv) |
Term loan |
1,198 | 16,524 |
3.4% |
1,158 | 17,723 |
3.4% |
December 2020 |
||||||||||
|
(b)(v) |
Term loan |
2,805 | 43,560 |
3.6% |
2,705 | 46,365 |
3.6% |
August 2021 |
||||||||||
|
(c) |
Senior secured notes |
6,110 | 58,885 |
4.9% |
6,110 | 64,995 |
4.9% |
September 2022 |
||||||||||
|
(d) |
Asset-backed notes |
65,307 | 377,984 |
3.5% |
40,000 | 202,875 |
3.4% |
June 2042 |
||||||||||
|
(e) |
Collateralized financing obligations |
22,549 | 69,441 |
1.2% |
28,693 | 71,346 |
1.1% |
December 2020 |
||||||||||
|
(f) |
Term loans held by VIE |
- |
3,286 |
2.7% |
2,287 | 3,541 |
2.5% |
June 2019 |
||||||||||
|
|
135,869 | 1,578,666 | 98,753 | 1,388,495 | ||||||||||||||
|
|
Debt issuance costs |
(3,820) | (7,893) | (3,226) | (7,996) | |||||||||||||
|
|
Total Debt |
$ |
132,049 |
$ |
1,570,773 |
$ |
95,527 |
$ |
1,380,499 | |||||||||
(a)Revolving Credit Facilities
Revolving credit facilities consist of the following:
(i) On March 15, 2013, the Company entered into a Third Amended and Restated Revolving Credit Agreement, as amended, with a consortium of banks to finance the acquisition of container rental equipment and for general working capital purposes. On June 16, 2017, the Company entered into an amendment to the Third Amended and Restated Revolving Credit Agreement, pursuant to which the revolving credit facility was amended to increase the commitment level from $775.0 million to $960.0 million.
As of December 31, 2017, the maximum commitment under the revolving credit facility was $960.0 million. There is a commitment fee on the unused amount of the total commitment, payable quarterly in arrears. The revolving credit facility provides that swing line loans (short-term borrowings of up to $25.0 million in the aggregate that are payable within 10 business days or at maturity date, whichever comes earlier) and standby letters of credit (up to $30.0 million in the aggregate) will be available to the Company. These credit commitments are part of, and not in addition to, the total commitment provided under the revolving credit facility. The interest rates vary depending upon whether the loans are characterized as Base Rate loans or Eurodollar rate loans, as defined in the revolving credit agreement. Interest rates are based on LIBOR for Eurodollar loans and Base Rate for Based Rate loans. In addition to various financial and other covenants, the Company’s revolving credit facility also includes certain restrictions on the Company’s ability to incur other indebtedness or pay dividends to stockholders. As of December 31, 2017, the Company was in compliance with the terms of the revolving credit facility.
72
As of December 31, 2017, the Company had $431.9 million in availability under the revolving credit facility (net of $0.1 million in letters of credit) subject to its ability to meet the collateral requirements under the agreement governing the facility. Based on the borrowing base and collateral requirements at December 31, 2017, the borrowing availability under the revolving credit facility was $95.8 million, assuming no additional contribution of assets. The entire amount of the facility drawn at any time plus accrued interest and fees is callable on demand in the event of certain specified events of default.
The Company’s revolving credit facility, including any amounts drawn on the facility, is secured by substantially all of the assets of the Company (not otherwise used as security for its other credit facilities) including containers owned by the Company, which had a net book value of $749.7 million as of December 31, 2017, the underlying leases and the Company’s interest in any money received under such contracts.
(ii) On October 22, 2015, the Company and CAI Rail Inc. (CAI Rail), a wholly-owned subsidiary of the Company, entered into the Second Amended and Restated Revolving Credit Agreement with a consortium of banks, pursuant to which the revolving credit facility for CAI Rail was amended to extend the maturity date to October 22, 2020, reduce the interest rate, increase the commitment level from $250.0 million to $500.0 million, which may be increased up to a maximum of $700.0 million subject to certain conditions, and revise certain of the covenants and restrictions under the prior facility to provide the Company with additional flexibility. As of December 31, 2017, the maximum credit commitment under the revolving line of credit was $500.0 million.
Borrowings under this revolving credit facility bear interest at a variable rate. The interest rates vary depending upon whether the loans are characterized as Base Rate loans or Eurodollar rate loans, as defined in the revolving credit agreement. Interest rates are based on LIBOR for Eurodollar loans, and Base Rate for Base Rate loans.
As of December 31, 2017, CAI Rail had $228.0 million in availability under the revolving credit facility, subject to its ability to meet the collateral requirements under the agreement governing the facility. Based on the borrowing base and collateral requirements at December 31, 2017, the borrowing availability under the revolving credit facility was $2.7 million, assuming no additional contribution of assets. The entire amount of the facility drawn at any time plus accrued interest and fees is callable on demand in the event of certain specified events of default.
The agreement governing CAI Rail’s revolving credit facility contains various financial and other covenants. As of December 31, 2017, CAI Rail was in compliance with the terms of the revolving credit facility. CAI Rail’s revolving credit facility, including any amounts drawn on the facility, is secured by all of the assets of CAI Rail, which had a net book value of $343.4 million as of December 31, 2017, and is guaranteed by the Company.
(iii) On September 23, 2016, the Company and CAI International GmbH (CAI GmbH), a wholly-owned subsidiary of the Company, entered into a Revolving Credit Agreement with a financial institution to finance the acquisition of rental equipment. As of December 31, 2017, the maximum credit commitment under the revolving credit facility was €25.0 million. Borrowings under this revolving credit facility bear interest at a variable rate. Interest rates are based on EURIBOR.
As of December 31, 2017, CAI GmbH had €12.7 million in availability under the revolving credit facility, subject to its ability to meet the collateral requirements under the agreement governing the facility. Based on the borrowing base and collateral requirements at December 31, 2017, the borrowing availability under the revolving credit facility was €1.4 million, assuming no additional contribution of assets. The entire amount of the facility drawn at any time plus accrued interest and fees is callable on demand in the event of certain specified events of default.
The agreement governing CAI GmbH’s revolving credit facility containers various financial and other covenants. As of December 31, 2017, CAI GmbH was in compliance with the terms of the revolving credit facility. CAI GmbH’s revolving credit facility, including any amounts drawn on the facility, is secured by all of the assets of CAI GmbH, which had a net book value of €18.3 million as of December 31, 2017, and is guaranteed by the Company.
(b)Term Loans
Term loans consist of the following:
(i) On March 22, 2013, the Company entered into a $30.0 million five-year term loan agreement with Development Bank of Japan (DBJ). The loan is payable in 19 quarterly installments of $0.5 million starting July 31, 2013 and a final payment of $21.5 million on April 30, 2018. The loan bears interest at variable rates based on LIBOR. As of December 31, 2017, the loan had a balance of $21.9 million.
73
The following are the estimated future principal and interest payments under these loans as of December 31, 2017 (in thousands). The payments were calculated assuming the interest rate remains 3.4% through maturity of the loan.
|
|
||||||
|
2018 |
$ |
22,268 | ||||
|
|
22,268 | |||||
|
Less: Amount representing interest |
(368) | |||||
|
Term loan |
$ |
21,900 |
(ii) On December 20, 2010, the Company entered into a term loan agreement with a consortium of banks. Under this loan agreement, the Company was eligible to borrow up to $300.0 million, subject to certain borrowing conditions, which amount is secured by certain assets of the Company’s wholly-owned foreign subsidiaries. The loan agreement is an amortizing facility with a term of six years. The interest rates vary depending upon whether the loans are characterized as Base Rate loans or Eurodollar rate loans, as defined in the term loan agreement. The loan bears a variable interest rate based on LIBOR for Eurodollar loans, and Base Rate for Base Rate loans.
On March 28, 2013, the term loan was amended which reduced the principal balance of the loan from $249.4 million to $125.0 million through payment of $124.4 million from the proceeds of the $229.0 million fixed-rate asset-backed notes issued by the Company’s indirect wholly-owned subsidiary, CAL Funding II Limited (CAL II) (see Note 10 (d) below).
On October 1, 2014, the Company entered into an amended and restated term loan agreement with a consortium of banks, pursuant to which the prior loan agreement was refinanced. The amended and restated term loan agreement, which contains similar terms to the prior loan agreement, was amended to, among other things: (a) reduce the borrowing rates from LIBOR plus 2.25% to LIBOR plus 1.6% (per annum) for Eurodollar loans, (b) increase the loan commitment from $115.0 million to $150.0 million, (c) extend the maturity date to October 1, 2019, and (d) revise certain of the covenants and restrictions under the prior loan agreement to provide the Company with additional flexibility. As of December 31, 2017, the term loan had a balance of $120.8 million.
The following are the estimated future principal and interest payments under this loan as of December 31, 2017 (in thousands). The payments were calculated assuming the interest rate remains 3.1% through maturity of the loan.
|
|
||||||
|
2018 |
$ |
12,690 | ||||
|
2019 |
114,436 | |||||
|
|
127,126 | |||||
|
Less: Amount representing interest |
(6,376) | |||||
|
Term loan |
$ |
120,750 |
(iii) On April 11, 2012, the Company entered into a term loan agreement with a consortium of banks. The agreement, as amended, provided for a five-year term loan of up to $142.0 million, subject to certain borrowing conditions, which amount is secured by certain assets of the Company.
On June 30, 2016, the Company entered into an amended and restated term loan agreement, pursuant to which the prior loan agreement was refinanced. The amended and restated term loan agreement, which contains similar terms to the prior loan agreement, was amended to, among other things: (a) provide the Company with the ability to increase the commitments under the facility to a maximum of $100.0 million, subject to certain conditions, (2) extend the maturity date to June 30, 2021, and (c) revise certain of the covenants and restrictions under the prior agreement to provide the Company with additional flexibility. The term loan’s outstanding principal is amortized quarterly, with quarterly payments equal to 1.75% multiplied by the original outstanding principal. The amended and restated term loan agreement bears a variable interest rate based on LIBOR for Eurodollar loans, and Base Rate for base rate loans. As of December 31, 2017, the loan had a balance of $89.5 million.
The following are the estimated future principal and interest payments under this loan as of December 31, 2017 (in thousands). The payments were calculated assuming the interest rate remains 3.3% through maturity of the loan.
|
|
||||||
|
2018 |
$ |
9,923 | ||||
|
2019 |
9,687 | |||||
|
2020 |
9,459 | |||||
|
2021 |
69,628 | |||||
|
|
98,697 | |||||
|
Less: Amount representing interest |
(9,197) | |||||
|
Term loan |
$ |
89,500 |
74
(iv) On December 22, 2015, the Company entered into a $20.0 million five-year term loan agreement for CAI Rail with a financial institution. The term loan’s outstanding principal bears interest at a fixed rate of 3.4% per annum and is amortized quarterly. Any unpaid principal and interest is due and payable on December 22, 2020. The proceeds from the term loan were primarily used to repay outstanding amounts under CAI Rail’s revolving credit facility. As of December 31, 2017, the loan had a balance of $17.7 million.
The following are the estimated future principal and interest payments under this loan as of December 31, 2017 (in thousands). The payments were calculated based on the fixed interest rate of 3.4%.
|
2018 |
$ |
1,793 | ||||
|
2019 |
1,793 | |||||
|
2020 |
15,793 | |||||
|
|
19,379 | |||||
|
Less: Amount representing interest |
(1,657) | |||||
|
Term loan |
$ |
17,722 |
(v) On August 30, 2016, CAI Rail entered into a term loan agreement of up to $100.0 million with a consortium of banks for the acquisition of railcars, subject to certain borrowing conditions, which is secured by certain railcars and other assets of CAI Rail. The loan agreement is an amortizing facility with a term of five years. Borrowings under the loan bear interest at a fixed rate as specified in the applicable term note entered into at the time a draw is made under the loan agreement. Principal and interest on the borrowings are payable monthly during the five-year term of the note. At closing of the loan agreement, CAI Rail made a draw of $50.0 million on the facility at a fixed interest rate of 3.6% per annum. Any unpaid principal and interest is due on August 30, 2021. As of December 31, 2017, the loan had a balance of $46.4 million.
The following are the estimated future principal and interest payments under this loan as of December 31, 2017 (in thousands). The payments were calculated based on the fixed interest rate of 3.6%.
|
|
||||||
|
2018 |
$ |
4,441 | ||||
|
2019 |
4,441 | |||||
|
2020 |
4,441 | |||||
|
2021 |
38,524 | |||||
|
|
51,847 | |||||
|
Less: Amount representing interest |
(5,482) | |||||
|
Term loan |
$ |
46,365 |
The Company's term loans are secured by rental equipment owned by the Company, which had a net book value of $356.0 million as of December 31, 2017.
(c)Senior Secured Notes
On September 13, 2012, Container Applications Limited (CAL), a wholly-owned subsidiary of the Company, entered into a Note Purchase Agreement with certain institutional investors, pursuant to which CAL issued $103.0 million of its 4.90% Senior Secured Notes due September 13, 2022 (the Notes) to the investors. The Notes are guaranteed by the Company and secured by certain assets of CAL and the Company.
The Notes bear interest at 4.9% per annum, due and payable semiannually on March 13 and September 13 of each year, commencing on March 13, 2013. In addition, CAL is required to make certain principal payments on March 13 and September 13 of each year, commencing on March 13, 2013. Any unpaid principal and interest is due and payable on September 13, 2022. The Note Purchase Agreement provides that CAL may prepay at any time all or any part of the Notes in an amount not less than 10% of the aggregate principal amount of the Notes then outstanding. As of December 31, 2017, the Notes had a balance of $65.0 million.
75
The following are the estimated future principal and interest payments under the Notes as of December 31, 2017 (in thousands). The payments were calculated based on the fixed interest rate of 4.9%.
|
|
||||||
|
2018 |
$ |
9,220 | ||||
|
2019 |
8,920 | |||||
|
2020 |
8,621 | |||||
|
2021 |
8,322 | |||||
|
2022 |
42,467 | |||||
|
|
77,550 | |||||
|
Less: Amount representing interest |
(12,555) | |||||
|
Senior secured notes |
$ |
64,995 |
The Company's senior secured notes are secured by rental equipment owned by the Company, which had a net book value of $85.2 million as of December 31, 2017.
(d)Asset-Backed Notes
On October 18, 2012, CAL II issued $171.0 million of 3.47% fixed rate asset-backed notes (Series 2012-1 Asset-Backed Notes). Principal and interest on the Series 2012-1 Asset-Backed Notes is payable monthly commencing on November 26, 2012, and the Series 2012-1 Asset-Backed Notes mature in October 2027. The proceeds from the Series 2012-1 Asset-Backed Notes were used to repay part of the Company’s borrowings under its senior revolving credit facility. As of December 31, 2017, the Series 2012-1 Asset-Backed Notes had a balance of $82.7 million.
On March 28, 2013, CAL II issued $229.0 million of 3.35% fixed rate asset-backed notes (Series 2013-1 Asset-Backed Notes). Principal and interest on the Series 2013-1 Asset-Backed Notes is payable monthly commencing on April 25, 2013, and the Series 2013-1 Asset-Backed Notes mature in March 2028. The proceeds from the Series 2013-1 Asset-Backed Notes were used partly to reduce the balance of the Company’s term loan as described in Note 10 (b)(ii) above, and to partially pay down the Company’s senior revolving credit facility. The Series 2013-1 Asset-Backed Notes had a balance of $120.2 million as of December 31, 2017.
On July 6, 2017, CAL Funding III Limited (CAL Funding III), a wholly-owned indirect subsidiary of CAI, issued $240.9 million of 3.6% Class A fixed rate asset-backed notes and $12.2 million of 4.6% Class B fixed rate asset-backed notes (collectively, the Series 2017-01 Asset-Backed Notes). Principal and interest on the Series 2017-01 Asset-Backed Notes is payable monthly commencing on July 25, 2017, with the Series 2017-01 Asset-Backed Notes maturing in June 2042. The proceeds from the Series 2017-01 Asset-Backed Notes were used for general corporate purposes, including repayment of debt by the Company. As of December 31, 2017, the Series 2017-01 Asset-Backed Notes had a balance of $240.4 million.
The following are the estimated future principal and interest payments under the Asset-Backed Notes as of December 31, 2017 (in thousands). The payments were calculated based on the weighted average fixed interest rate of 3.5%.
|
|
||||||
|
2018 |
$ |
79,862 | ||||
|
2019 |
77,585 | |||||
|
2020 |
75,309 | |||||
|
2021 |
73,032 | |||||
|
2022 |
67,910 | |||||
|
2023 and thereafter |
129,086 | |||||
|
|
502,784 | |||||
|
Less: Amount representing interest |
(59,493) | |||||
|
Asset-backed notes |
$ |
443,291 |
The Company's asset-backed notes are secured by rental equipment owned by the Company, which had a net book value of $566.1 million as of December 31, 2017.
The agreements under each of the asset-backed notes described above require the Company to maintain a restricted cash account to cover payment of the obligations. As of December 31, 2017, the restricted cash account had a balance of $11.8 million.
(e)Collateralized Financing Obligations
As of December 31, 2017, the Company had collateralized financing obligations of $92.0 million (see Note 4). The obligations had an average interest rate of 1.2% as of December 31, 2017 with maturity dates between March 2018 and December 2020. The debt is secured by a pool of containers covered under the financing arrangements.
76
The following are the estimated future principal and interest payments under the Company’s collateralized financing obligations as of December 31, 2017 (in thousands). The payments were calculated assuming an average interest rate of 1.2% through maturity of the obligations.
|
|
||||||
|
2018 |
$ |
22,978 | ||||
|
2019 |
40,840 | |||||
|
2020 |
22,086 | |||||
|
2021 |
8,120 | |||||
|
|
94,024 | |||||
|
Less: Amount representing interest |
(2,034) | |||||
|
Collateralized financing obligations |
$ |
91,990 |
(f)Term Loans Held by VIE
On June 25, 2014, one of the Japanese investor funds that is consolidated by the Company as a VIE (see Note 4) entered into a term loan agreement with a bank. Under the terms of the agreement, the Japanese investor fund entered into two loans; a five year, amortizing loan of $9.2 million at a fixed interest rate of 2.7%, and a five year, non-amortizing loan of $1.6 million at a variable interest rate based on LIBOR. The debt is secured by assets of the Japanese investor fund, and is subject to certain borrowing conditions set out in the loan agreement. As of December 31, 2017, the term loans held by the Japanese investor fund totaled $3.3 million and had an average interest rate of 2.7%.
The following are the estimated future principal and interest payments under this loan as of December 31, 2017 (in thousands). The payments were calculated assuming the interest rate remains 2.7% through maturity of the loan.
|
|
||||||
|
2018 |
$ |
- |
||||
|
2019 |
3,380 | |||||
|
|
3,380 | |||||
|
Less: Amount representing interest |
(94) | |||||
|
Term loans held by VIE |
$ |
3,286 |
The Company's term loans held by VIE are secured by rental equipment owned by the Japanese investor fund, which had a net book value of $9.6 million as of December 31, 2017.
The agreements relating to all of the Company’s debt contain various financial and other covenants. As of December 31, 2017, the Company was in compliance with all of its debt covenants.
(11)Stock–Based Compensation Plan
Stock Options
The Company grants stock options to certain employees and independent directors pursuant to its 2007 Equity Incentive Plan, as amended (Plan). Under the Plan, a maximum of 3,421,980 share awards may be granted.
Stock options granted to employees have a vesting period of four years from grant date, with 25% vesting after one year, and 1/48th vesting each month thereafter until fully vested. Stock options granted to independent directors vest in one year. All of the stock options have a contractual term of ten years.
77
The following table summarizes the Company’s stock option activities for the three years ended December 31, 2017:
|
|
||||||||||
|
|
Weighted |
|||||||||
|
|
Average |
|||||||||
|
|
Weighted |
Remaining |
Aggregate |
|||||||
|
|
Average |
Contractual |
Intrinsic |
|||||||
|
|
Number of |
Exercise |
Term |
Value |
||||||
|
|
Shares |
Price |
(in years) |
(in thousands) |
||||||
|
Options outstanding, December 31, 2014 |
1,420,749 |
$ |
15.67 | |||||||
|
Options granted |
183,000 |
$ |
21.72 | |||||||
|
Options exercised |
(414,494) |
$ |
11.45 | |||||||
|
Options outstanding, December 31, 2015 |
1,189,255 |
$ |
18.08 | |||||||
|
Options granted |
245,000 |
$ |
7.87 | |||||||
|
Options forfeited/cancelled |
(6,000) |
$ |
21.99 | |||||||
|
Options outstanding, December 31, 2016 |
1,428,255 |
$ |
16.31 | |||||||
|
Options granted |
230,500 |
$ |
16.80 | |||||||
|
Options exercised |
(799,195) |
$ |
16.31 | |||||||
|
Options outstanding, December 31, 2017 |
859,560 |
$ |
16.44 | 7.2 |
$ |
10,210 | ||||
|
Options exercisable at December 31, 2017 |
443,689 |
$ |
17.85 | 5.9 |
$ |
4,645 | ||||
|
Expected to vest after December 31, 2017 |
415,871 |
$ |
14.94 | 8.7 |
$ |
5,565 | ||||
The aggregate intrinsic value represents the value by which the Company’s closing stock price of $28.32 per share on the last trading day of the year ended December 31, 2017 exceeds the exercise price of the stock multiplied by the number of options outstanding or exercisable, excluding options that have a zero or negative intrinsic value. The aggregate intrinsic value of options exercised during 2017 and 2015, based on the closing share price on the date each option was exercised, was $11.7 million and $4.9 million, respectively.
The Company recorded stock-based compensation expense of $1.6 million, $1.3 million and $1.5 million relating to stock options for the years ended December 31, 2017, 2016 and 2015, respectively. As of December 31, 2017, the remaining unamortized stock-based compensation cost relating to stock options granted to the Company’s employees and independent directors was approximately $2.5 million which is to be recognized over the remaining weighted average vesting period of approximately 2.4 years.
The total fair value of stock options granted to the Company’s employees and independent directors at the time of grant was approximately $2.1 million, or $9.16 per share, $0.9 million, or $3.55 per share, and $1.7 million, or $9.20 per share for the years ended December 31, 2017, 2016 and 2015, respectively, calculated using the Black-Scholes-Merton pricing model under the following weighted average assumptions:
|
|
||||||||
|
|
2017 |
2016 |
2015 |
|||||
|
Stock price |
$ |
16.80 |
$ |
7.87 |
$ |
21.72 | ||
|
Exercise price |
$ |
16.80 |
$ |
7.87 |
$ |
21.72 | ||
|
|
||||||||
|
Expected term (years) |
5.5 - 6.25 |
5.5 - 6.25 |
5.5 - 6.25 |
|||||
|
Expected volatility (%) |
56.4 - 57.5 |
45.4 - 46.7 |
39.5 - 41.8 |
|||||
|
Risk-free interest rate (%) |
1.77 - 2.14 |
1.30 - 1.40 |
1.85 - 2.00 |
|||||
|
Dividend yield (%) |
- |
- |
- |
|||||
The expected option term is calculated using the simplified method in accordance with SEC guidance. The expected volatility was derived from the average volatility of the Company’s stock over a period approximating the expected term of the options. The risk-free rate is based on daily U.S. Treasury yield curve with a term approximating the expected term of the options. No forfeiture was estimated on all options granted during the years ended December 31, 2017, 2016 and 2015, as the Company accounts for forfeitures as they occur (see Note 2(p)).
78
Restricted Stock
The Company grants restricted stock to certain employees pursuant to the Plan. The restricted stock is valued based on the closing price of the Company’s stock on the date of grant and has a vesting period of four years. The following table summarizes the activity of restricted stock under the Plan:
|
|
||||||
|
|
Number of |
Weighted |
||||
|
|
Shares of |
Average |
||||
|
|
Restricted |
Grant Date |
||||
|
|
Stock |
Fair Value |
||||
|
Restricted stock outstanding, December 31, 2014 |
42,502 |
$ |
23.87 | |||
|
Restricted stock granted |
21,000 |
$ |
21.15 | |||
|
Restricted stock vested |
(15,477) |
$ |
23.81 | |||
|
Restricted stock outstanding, December 31, 2015 |
48,025 |
$ |
22.70 | |||
|
Restricted stock granted |
34,500 |
$ |
7.87 | |||
|
Restricted stock vested |
(14,379) |
$ |
23.61 | |||
|
Restricted stock forfeited |
(2,344) |
$ |
21.96 | |||
|
Restricted stock outstanding, December 31, 2016 |
65,802 |
$ |
14.75 | |||
|
Restricted stock granted |
37,414 |
$ |
17.14 | |||
|
Restricted stock vested |
(24,674) |
$ |
17.83 | |||
|
Restricted stock outstanding, December 31, 2017 |
78,542 |
$ |
14.92 | |||
The Company recognized stock-based compensation expense relating to restricted stock of $0.5 million for the year ended December 31, 2017 and $0.4 million for both the years ended December 31, 2016 and 2015. As of December 31, 2017, unamortized stock-based compensation expense relating to restricted stock was $0.8 million, which will be recognized over the remaining average vesting period of 2.5 years.
Stock-based compensation expense is recorded as a component of administrative expenses in the Company’s consolidated statements of income with a corresponding credit to additional paid-in capital in the Company’s consolidated balance sheets.
(12)Income Taxes
For the years ended December 31, 2017, 2016 and 2015, net income before income taxes and non-controlling interest consisted of the following (in thousands):
|
|
||||||||
|
|
Year Ended December 31, |
|||||||
|
|
2017 |
2016 |
2015 |
|||||
|
U.S. operations |
$ |
(2,080) |
$ |
8,996 |
$ |
6,682 | ||
|
Foreign operations |
59,279 | 882 | 24,305 | |||||
|
|
$ |
57,199 |
$ |
9,878 |
$ |
30,987 | ||
Income tax (benefit) expense attributable to income from operations consisted of (in thousands):
|
|
||||||||
|
|
Year Ended December 31, |
|||||||
|
|
2017 |
2016 |
2015 |
|||||
|
Current |
||||||||
|
Federal |
$ |
(531) |
$ |
312 |
$ |
(2,083) | ||
|
State |
86 | 56 | (4) | |||||
|
Foreign |
531 | 2,338 | 1,372 | |||||
|
|
86 | 2,706 | (715) | |||||
|
Deferred |
||||||||
|
Federal |
(19,304) | 3,090 | 5,406 | |||||
|
State |
3,172 | 238 | 19 | |||||
|
Foreign |
1,185 | (2,190) | (458) | |||||
|
|
(14,947) | 1,138 | 4,967 | |||||
|
Income tax (benefit) expense |
$ |
(14,861) |
$ |
3,844 |
$ |
4,252 | ||
79
The reconciliations between the Company’s income tax expense and the amounts computed by applying the U.S. federal income tax rate of 35.0% for the years ended December 31, 2017, 2016 and 2015 are as follows (in thousands):
|
|
||||||||
|
|
Year Ended December 31, |
|||||||
|
|
2017 |
2016 |
2015 |
|||||
|
Computed expected tax expense |
$ |
20,020 |
$ |
3,458 |
$ |
10,845 | ||
|
Increase (decrease) in income taxes resulting from: |
||||||||
|
Foreign tax differential |
(19,032) | (88) | (7,676) | |||||
|
State income tax expense, net of federal income tax benefit |
191 | 310 | 220 | |||||
|
Change in Federal tax rate |
(16,945) |
- |
- |
|||||
|
Subpart F income |
683 | 711 | 597 | |||||
|
Adjustment to contingent consideration |
(429) | (634) |
- |
|||||
|
Increase in uncertain tax positions |
61 | 36 | 17 | |||||
|
Non-deductible stock-based compensation |
218 | 155 | 134 | |||||
|
Excess tax benefit related to stock-based compensation |
(1,858) |
- |
- |
|||||
|
Prior year true-ups |
1,894 |
- |
- |
|||||
|
Change in valuation allowance |
- |
(15) | (152) | |||||
|
Other |
336 | (89) | 267 | |||||
|
|
$ |
(14,861) |
$ |
3,844 |
$ |
4,252 | ||
As of December 31, 2017, the Company had $136.9 million, $33.2 million and $93.2 million of net operating loss (NOL) carry forwards available to offset future federal, foreign and state taxable income, respectively. The NOL carry forwards will begin to expire in 2035, 2022 and 2018 for federal, foreign and state income tax purposes, respectively.
The tax effects of temporary differences that give rise to significant portions of the deferred tax assets and deferred tax liabilities as of December 31, 2017 and 2016 are presented below (in thousands):
|
|
||||||
|
|
Year Ended December 31, |
|||||
|
|
2017 |
2016 |
||||
|
Deferred tax assets: |
||||||
|
Accounts receivable |
$ |
68 |
$ |
307 | ||
|
Accrued expenses and other current liabilities |
886 | 423 | ||||
|
Unearned revenue |
198 | 856 | ||||
|
Stock-based compensation |
744 | 2,280 | ||||
|
Other |
89 | 616 | ||||
|
Net operating loss carry forwards |
34,758 | 27,225 | ||||
|
Gross deferred tax assets |
36,743 | 31,707 | ||||
|
Valuation allowance |
- |
- |
||||
|
Net deferred tax assets |
36,743 | 31,707 | ||||
|
Deferred tax liabilities: |
||||||
|
Intangible assets |
1,734 | 2,946 | ||||
|
Depreciation and amortization |
65,609 | 73,305 | ||||
|
Foreign deferred tax liabilities |
943 | 760 | ||||
|
Deferred subpart F income |
4,310 | 6,500 | ||||
|
Gross deferred tax liabilities |
72,596 | 83,511 | ||||
|
Net deferred tax liability |
$ |
35,853 |
$ |
51,804 | ||
The realization of deferred tax assets is dependent upon the generation of future taxable income during the periods in which those temporary differences become deductible. The Company’s management considers the projected future taxable income for making this assessment. Based upon the level of historical taxable income and projections for future taxable income over the periods in which the deferred tax assets are deductible, the Company’s management believes it is more likely than not the Company will realize the benefits of the deductible differences noted above.
80
The U.S Tax Cuts and Jobs Act of 2017 (the Tax Act) was signed into law on December 22, 2017. The most significant effects of the Tax Act on the Company were the U.S. federal corporate tax rate reduction from the current rate of 35% to a new flat rate of 21%, limitations on the deductibility of interest expense and executive compensation, and the creation of the base erosion anti-abuse tax (BEAT), a new minimum tax. A change in tax laws is accounted for in the period of enactment, which requires re-measurement of all of an entity’s U.S. deferred income tax assets and liabilities during this year-end. As the Company is in an overall net deferred tax liability position, the corporate tax rate reduction resulted in a net tax benefit of approximately $16.9 million in 2017 when the deferred tax assets and liabilities are revalued downward. The Company’s 2017 effective tax rate was favorably affected by 29.6% due to this law change. The Tax Act also imposes a one-time transition tax on accumulated undistributed foreign earnings. However, the Company did not have any transition tax due to its overall net foreign earnings deficit.
In response to the Tax Act, the SEC staff issued guidance on accounting for the tax effects of the Tax Act. The guidance provides for a one-year measurement period for companies to complete the accounting. The Company reflected the income tax effects of those aspects of the Tax Act for which the accounting is complete. To the extent the accounting for certain income tax effects of the Tax Act is incomplete but the Company is able to determine a reasonable estimate, the Company recorded a provisional estimate in the financial statements. If a company cannot determine a provisional estimate to be included in the financial statements, it should continue to apply the provisions of the tax law that were in effect immediately before the enactment of the Tax Act.
The Company has not completed its accounting for the income tax effects of certain elements of the Tax Act. The Tax Act creates a new requirement that certain income such as Global Intangible Low-Taxed Income (GILTI) earned by a controlled foreign corporation (CFC) must be included in the gross income of the CFC U.S. shareholder. Because of the complexity of the new GILTI and BEAT tax rules, the Company is continuing to evaluate these provisions of the Tax Act and whether taxes due on future U.S. inclusions related to GILTI or BEAT should be recorded as a current-period expense when incurred, or factored into the measurement of its deferred taxes. As a result, the Company has not included an estimate of the tax expense or benefit related to these items for the period ended December 31, 2017.
In March 2016, the FASB issued ASU 2016-09, which simplifies certain aspects of the accounting for share-based payment transactions, including income taxes. The Company adopted ASU 2016-09 effective January 1, 2017 (see Note 2 (p)). As a result of the adoption of ASU 2016-09, the Company recognized $1.0 million in deferred tax assets associated with excess tax benefits not previously recognized in deferred taxes as a cumulative-effect adjustment to retained earnings as of January 1, 2017.
Deferred income taxes have not been provided on the undistributed earnings of foreign subsidiaries. These earnings have been permanently reinvested and the Company does not plan to initiate any action that would precipitate the payment of income taxes thereon. While the Company has an overall foreign earnings deficit, as of December 31, 2017, the amount of positive foreign earnings totaled approximately $28.3 million related to certain subsidiaries. The amount of income taxes that would have resulted had such earnings been repatriated would be approximately $0.2 million due to withholding taxes.
The following table summarizes the activity related to the Company’s unrecognized tax benefits (in thousands):
|
|
||||||
|
Balance at January 1, 2016 |
$ |
220 | ||||
|
Increases related to current year tax positions |
77 | |||||
|
Decreases related to lapsing of statute |
(31) | |||||
|
Balance at December 31, 2016 |
266 | |||||
|
Increases related to current year tax positions |
11 | |||||
|
Balance at December 31, 2017 |
$ |
277 |
The unrecognized tax benefits of approximately $0.3 million at December 31, 2017, if recognized, would reduce the Company’s effective tax rate. The Company accrued potential interest and penalties of less than $0.1 million related to unrecognized tax benefits for each of the years ended December 31, 2017 and 2016.
The Company’s tax returns, including the United States, California, New Jersey and South Carolina, are subject to examination by the tax authorities. The Company accrues for unrecognized tax benefits based upon its best estimate of the additional taxes, interest and penalties expected to be paid. These estimates are updated over time as more definitive information becomes available from taxing authorities, completion of tax audits, expiration of statute of limitations, or upon occurrence of other events.
The Company does not believe the total amount of unrecognized tax benefit as of December 31, 2017 will increase or decrease significantly in the next twelve months. As of December 31, 2017, the statute of limitations for tax examinations in the United States has not expired for the years ended December 31, 2014 through 2016. California, New Jersey and South Carolina have not expired for tax returns filed for the years ended December 31, 2013 through 2016, and Barbados has not expired for tax returns filed for the years ended December 31, 2008 to 2016. The Company was notified on May 1, 2017 that its 2015 U.S. federal income tax return was selected for examination. The examination is in the information gathering stage.
81
(13)Fair Value of Financial Instruments
The carrying amounts reported in the consolidated balance sheets for cash, accounts receivable and accounts payable approximate fair value because of the immediate or short-term maturity of these financial instruments. The Company’s asset-backed notes of $443.3 million and collateralized financing obligations of $92.0 million as of December 31, 2017 were estimated to have a fair value of approximately $441.6 million and $93.5 million, respectively, based on the fair value of estimated future payments calculated using prevailing interest rates. The fair value of these financial instruments would be categorized as Level 2 of the fair value hierarchy. Management believes that the balances of the Company’s revolving credit facilities of $814.7 million, term loans totaling $296.2 million, senior secured notes of $65.0 million, term loans held by VIE of $3.3 million and net investment in direct finance leases of $276.5 million approximate their fair values as of December 31, 2017. The fair value of these financial instruments would be categorized as Level 2 of the fair value hierarchy.
(14)Commitments and Contingencies
The Company utilizes certain office facilities and office equipment under non-cancelable operating lease agreements which generally have original terms of up to five years. Future minimum lease payments required under non-cancellable operating leases having an original term of more than one year as of December 31, 2017 are as follows (in thousands):
|
|
||||||
|
|
Office |
|||||
|
|
Facilities |
|||||
|
|
and |
|||||
|
|
Equipment |
|||||
|
Year ending December 31: |
||||||
|
2018 |
$ |
2,439 | ||||
|
2019 |
1,881 | |||||
|
2020 |
357 | |||||
|
2021 |
329 | |||||
|
2022 |
228 | |||||
|
2023 and thereafter |
216 | |||||
|
|
$ |
5,450 | ||||
Office facility expense was $2.0 million, $1.7 million, and $1.5 million for the years ended December 31, 2017, 2016 and 2015, respectively, which was included in administrative expenses in the consolidated statements of income.
As of December 31, 2017 and 2016, the Company had one outstanding letter of credit of $0.1 million. The letter of credit guarantees the Company’s obligations under certain operating lease agreements.
In addition to the rental equipment payable of $92.4 million, the Company had commitments to purchase approximately $17.6 million of containers and $88.7 million railcars as of December 31, 2017; all in the twelve months ended December 31, 2018.
In the ordinary course of business, the Company executes contracts involving indemnifications standard in the industry and indemnifications specific to a transaction such as an assignment and assumption agreement. These indemnifications might include claims related to tax matters, governmental regulations, and contractual relationships. Performance under these indemnities would generally be triggered by a breach of terms of a contract or by a third-party claim. The Company regularly evaluates the probability of having to incur costs associated with these indemnifications and as of December 31, 2017 there were no claims outstanding under such indemnifications and the Company believes that no claims are probable of occurring in the future.
(15)Related Party Transactions
The Company has transferred legal ownership of certain containers to Japanese container funds that were established by Japan Investment Adviser Co., Ltd. (JIA) and CAIJ, Inc. (CAIJ). Prior to April 2016, CAIJ was an 80%-owned subsidiary of CAI with the remaining 20% owned by JIA. Prior to the transfer of containers from the Company, the Japanese container funds received contributions from unrelated Japanese investors, under separate Japanese investment agreements allowed under Japanese commercial laws. The contributions were used to purchase container equipment from the Company. Under the terms of the agreements, the Japanese container funds manage the activities of certain Japanese entities but may outsource all or part of each operation to a third party. Pursuant to its services agreements with investors, the Japanese container funds have outsourced the general management of their operations to CAIJ. The Japanese container funds have also entered into equipment management service agreements and financing arrangements whereby the Company managed the leasing activity of containers owned by the Japanese container funds.
82
As described in Note 4, the Japanese managed container funds and financing arrangements are considered VIEs. However, with the exception of the financing arrangements described in Note 4, the Company does not consider its interest in the managed Japanese container funds to be a variable interest. As such, the Company did not consolidate the assets and liabilities, results of operations or cash flows of these funds in its consolidated financial statements.
As described in Note 4, the Company has included in its consolidated financial statements, the assets and liabilities, results of operations, and cash flows of the financing arrangements, in accordance with FASB ASC Topic 810, Consolidation.
(16)Capital Stock
On May 12, 2017 the Company filed a universal shelf registration statement on Form S-3 with the SEC which was declared effective by the SEC on June 2, 2017. Under this shelf registration statement, the Company may sell various debt and equity securities, or a combination thereof, to be offered from time-to-time up to an aggregate offering price of $300.0 million for all securities, and the selling stockholders may sell up to 3,000,000 shares of common stock in one or more offerings.
In October 2017, the Company commenced an at-the-market offering program, which allows the Company to sell and issue up to 2.0 million shares of its common stock. In the three months ended December 41, 2017, the Company issued 888,453 shares of common stock under the at-the-market offering program for gross proceeds of $30.0 million. The Company paid commissions to the sales agent of $0.6 million and incurred other offering related expenses of $0.3 million. Net proceeds of $29.1 million were used for general corporate purposes. The Company has remaining capacity to issue up to approximately 1.1 million of additional shares of common stock under the at-the-market offering program.
(17)Segment and Geographic Information
The Company organizes itself by the nature of the services it provides which includes equipment leasing (consisting of container leasing and rail leasing) and logistics.
The container leasing segment is aggregated with equipment management and derives its revenue from the ownership and leasing of containers and fees earned for managing container portfolios on behalf of third party investors. The rail leasing segment derives its revenue from the ownership and leasing of railcars. The logistics segment derives its revenue from the provision of logistics services. There are no inter-segment revenues.
With the exception of administrative expenses, operating expenses are directly attributable to each segment. Administrative expenses that are not directly attributable to a segment are allocated to container or rail leasing based on the net book value of equipment in each segment.
83
The following tables show condensed segment information for the years ended December 31, 2017, 2016 and 2015, reconciled to the Company’s net income before income taxes and non-controlling interest as shown in its consolidated statements of income for such periods (in thousands):
|
|
Year Ended December 31, 2017 |
||||||||||
|
|
Container Leasing |
Rail Leasing |
Logistics |
Total |
|||||||
|
Container lease revenue |
$ |
235,365 |
$ |
- |
$ |
- |
$ |
235,365 | |||
|
Rail lease revenue |
- |
32,476 |
- |
32,476 | |||||||
|
Logistics revenue |
- |
- |
80,552 | 80,552 | |||||||
|
Total revenue |
235,365 | 32,476 | 80,552 | 348,393 | |||||||
|
Depreciation of rental equipment |
99,753 | 11,199 |
- |
110,952 | |||||||
|
Storage, handling and other expenses |
15,207 | 5,615 | 96 | 20,918 | |||||||
|
Logistics transportation costs |
- |
- |
68,155 | 68,155 | |||||||
|
Gain on sale of used rental equipment |
(5,333) | (14) |
- |
(5,347) | |||||||
|
Administrative expenses |
22,925 | 4,756 | 15,018 | 42,699 | |||||||
|
Total operating expenses |
132,552 | 21,556 | 83,269 | 237,377 | |||||||
|
Operating income (loss) |
102,813 | 10,920 | (2,717) | 111,016 | |||||||
|
Net interest expense |
41,815 | 11,237 |
- |
53,052 | |||||||
|
Other expense |
765 |
- |
- |
765 | |||||||
|
Total other expenses |
42,580 | 11,237 |
- |
53,817 | |||||||
|
Net income (loss) before income taxes and non-controlling interest |
$ |
60,233 |
$ |
(317) |
$ |
(2,717) |
$ |
57,199 | |||
|
Goodwill |
$ |
- |
$ |
- |
$ |
15,794 |
$ |
15,794 | |||
|
Total assets |
$ |
1,940,997 |
$ |
449,376 |
$ |
40,029 |
$ |
2,430,402 | |||
|
Purchase of rental equipment (1) |
$ |
445,168 |
$ |
56,882 |
$ |
- |
$ |
502,050 | |||
|
|
Year Ended December 31, 2016 |
||||||||||
|
|
Container Leasing |
Rail Leasing |
Logistics |
Total |
|||||||
|
Container lease revenue |
$ |
202,328 |
$ |
- |
$ |
- |
$ |
202,328 | |||
|
Rail lease revenue |
- |
30,490 |
- |
30,490 | |||||||
|
Logistics revenue |
- |
- |
61,536 | 61,536 | |||||||
|
Total revenue |
202,328 | 30,490 | 61,536 | 294,354 | |||||||
|
Depreciation of rental equipment |
95,755 | 9,122 |
- |
104,877 | |||||||
|
Storage, handling and other expenses |
32,465 | 3,386 | 11 | 35,862 | |||||||
|
Logistics transportation costs |
- |
- |
51,980 | 51,980 | |||||||
|
Loss (gain) on sale of used rental equipment |
12,750 | 33 | (112) | 12,671 | |||||||
|
Administrative expenses |
20,453 | 3,759 | 11,466 | 35,678 | |||||||
|
Total operating expenses |
161,423 | 16,300 | 63,345 | 241,068 | |||||||
|
Operating income (loss) |
40,905 | 14,190 | (1,809) | 53,286 | |||||||
|
Net interest expense |
35,784 | 6,970 |
- |
42,754 | |||||||
|
Other expense |
654 |
- |
- |
654 | |||||||
|
Total other expenses |
36,438 | 6,970 |
- |
43,408 | |||||||
|
Income (loss) before income taxes and non-controlling interest |
$ |
4,467 |
$ |
7,220 |
$ |
(1,809) |
$ |
9,878 | |||
|
Goodwill |
$ |
- |
$ |
- |
$ |
15,794 |
$ |
15,794 | |||
|
Total assets |
$ |
1,638,263 |
$ |
378,059 |
$ |
39,612 |
$ |
2,055,934 | |||
|
Purchase of rental equipment (1) |
$ |
118,374 |
$ |
132,791 |
$ |
- |
$ |
251,165 | |||
84
|
|
Year Ended December 31, 2015 |
||||||||||
|
|
Container Leasing |
Rail Leasing |
Logistics |
Total |
|||||||
|
Container lease revenue |
$ |
220,732 |
$ |
- |
$ |
- |
$ |
220,732 | |||
|
Rail lease revenue |
- |
17,433 |
- |
17,433 | |||||||
|
Logistics revenue |
- |
- |
11,502 | 11,502 | |||||||
|
Total revenue |
220,732 | 17,433 | 11,502 | 249,667 | |||||||
|
Depreciation of rental equipment |
108,996 | 4,594 |
- |
113,590 | |||||||
|
Storage, handling and other expenses |
27,653 | 2,540 | 1 | 30,194 | |||||||
|
Logistics transportation costs |
- |
- |
10,172 | 10,172 | |||||||
|
Loss (gain) on sale of used rental equipment |
2,276 | (1,622) |
- |
654 | |||||||
|
Administrative expenses |
21,969 | 3,131 | 2,517 | 27,617 | |||||||
|
Total operating expenses |
160,894 | 8,643 | 12,690 | 182,227 | |||||||
|
Operating income (loss) |
59,838 | 8,790 | (1,188) | 67,440 | |||||||
|
Net interest expense |
33,156 | 3,109 | 6 | 36,271 | |||||||
|
Other expense |
182 |
- |
- |
182 | |||||||
|
Total other expenses |
33,338 | 3,109 | 6 | 36,453 | |||||||
|
Income (loss) before income taxes and non-controlling interest |
$ |
26,500 |
$ |
5,681 |
$ |
(1,194) |
$ |
30,987 | |||
|
Purchase of rental equipment (1) |
$ |
226,469 |
$ |
162,862 |
$ |
- |
$ |
389,331 | |||
|
(1) |
Represents cash disbursements for purchasing of rental equipment as reflected in the consolidated statements of cash flows for the periods indicated. |
Geographic Data
The Company earns its revenue primarily from intermodal containers which are deployed by its customers in a wide variety of global trade routes. Virtually all of the Company’s containers are used internationally and typically no container is domiciled in one particular place for a prolonged period of time. As such, substantially all of the Company’s long-lived assets are considered to be international, with no single country of use.
The Company’s railcars, with a net book value of $440.8 million as of December 31, 2017, are used to transport cargo within North America.
The following table represents the geographic allocation of revenue for the periods indicated based on customers’ primary domicile (in thousands):
|
|
Year Ended December 31, |
|||||||
|
|
2017 |
2016 |
2015 |
|||||
|
United States |
$ |
120,558 |
$ |
99,824 |
$ |
36,197 | ||
|
France |
34,862 | 29,273 | 27,603 | |||||
|
Switzerland |
32,430 | 19,636 | 20,215 | |||||
|
Korea |
20,755 | 14,904 | 18,933 | |||||
|
Japan |
20,388 | 21,717 | 26,559 | |||||
|
Singapore |
19,856 | 16,172 | 18,627 | |||||
|
Other Europe |
45,176 | 40,170 | 41,034 | |||||
|
Other Asia |
43,709 | 41,473 | 47,301 | |||||
|
Other International |
10,659 | 11,185 | 13,198 | |||||
|
Total revenue |
$ |
348,393 |
$ |
294,354 |
$ |
249,667 | ||
(18)Revenue Concentration
Revenue from the Company’s ten largest lessees represented 44.5%, 41.5% and 51.9% of total revenue for the years ended December 31, 2017, 2016 and 2015, respectively. Revenue from the Company’s single largest lessee accounted for 10.8%, or $37.5 million, 10.8%, or $31.7 million, and 11.6%, or $29.0 million, of total revenue for the years ended December 31, 2017, 2016 and 2015, respectively. Revenue from the Company’s second largest lessee accounted for 10.0%, or $34.7 million, 7.0%, or $20.6 million, and 8.4%, or $21.1 million, of total revenue for the years ended December 31, 2017, 2016 and 2015, respectively.
85
(19)Earnings per Share
Basic earnings per share is computed by dividing income available to common stockholders by the weighted average number of common shares outstanding for the period. Diluted earnings per share reflects the potential dilution that would occur if securities or other contracts to issue common stock were exercised or converted into common stock; however, potential common equivalent shares are excluded if their effect is anti-dilutive.
The following table sets forth the reconciliation of basic and diluted net income per share for the years ended December 31, 2017, 2016 and 2015 (in thousands, except per share data):
|
|
||||||||
|
|
Year Ended December 31, |
|||||||
|
|
2017 |
2016 |
2015 |
|||||
|
Numerator |
||||||||
|
Net income attributable to CAI common stockholders used in the calculation |
||||||||
|
of basic and diluted earnings per share |
$ |
72,060 |
$ |
5,997 |
$ |
26,601 | ||
|
Denominator |
||||||||
|
Weighted-average shares used in the calculation of basic earnings per share |
19,253 | 19,318 | 20,773 | |||||
|
Effect of dilutive securities: |
||||||||
|
Stock options and restricted stock |
354 | 75 | 215 | |||||
|
Weighted-average shares used in the calculation of diluted earnings per share |
19,607 | 19,393 | 20,988 | |||||
|
|
||||||||
|
Net income per share attributable to CAI common stockholders: |
||||||||
|
Basic |
$ |
3.74 |
$ |
0.31 |
$ |
1.28 | ||
|
Diluted |
$ |
3.68 |
$ |
0.31 |
$ |
1.27 | ||
The calculation of diluted income per share for the years ended December 31, 2017, 2016 and 2015, excluded from the denominator 458,857 shares, 1,135,711 shares and 763,847 shares, respectively, of common stock options because their effect would have been anti-dilutive.
(20)Selected Quarterly Financial Data (Unaudited)
The following table sets forth key interim financial information for the years ended December 31, 2017 and 2016 (in thousands, except per share amount):
|
|
|||||||||||||||||||||||
|
|
|||||||||||||||||||||||
|
|
2017 Quarters Ended |
2016 Quarters Ended |
|||||||||||||||||||||
|
|
Dec. 31 |
Sept. 30 |
June 30 |
Mar. 31 |
Dec. 31 |
Sept. 30 |
June 30 |
Mar. 31 |
|||||||||||||||
|
Revenue |
$ |
94,034 |
$ |
90,161 |
$ |
82,692 |
$ |
81,506 |
$ |
77,274 |
$ |
78,472 |
$ |
71,642 |
$ |
66,966 | |||||||
|
Operating expenses |
57,631 | 58,267 | 57,924 | 63,555 | 64,664 | 71,110 | 56,784 | 48,510 | |||||||||||||||
|
Operating income |
36,403 | 31,894 | 24,768 | 17,951 | 12,610 | 7,362 | 14,858 | 18,456 | |||||||||||||||
|
Net income (loss) attributable to |
|||||||||||||||||||||||
|
CAI common stockholders |
36,563 | 17,587 | 12,638 | 5,272 | 620 | (5,451) | 3,711 | 7,117 | |||||||||||||||
|
|
|||||||||||||||||||||||
|
Net income (loss) per share attributable |
|||||||||||||||||||||||
|
to CAI common stockholders: |
|||||||||||||||||||||||
|
Basic |
$ |
1.86 |
$ |
0.92 |
$ |
0.66 |
$ |
0.28 |
$ |
0.03 |
$ |
(0.28) |
$ |
0.19 |
$ |
0.36 | |||||||
|
Diluted |
$ |
1.81 |
$ |
0.90 |
$ |
0.65 |
$ |
0.27 |
$ |
0.03 |
$ |
(0.28) |
$ |
0.19 |
$ |
0.36 | |||||||
86
Schedule II
Valuation Accounts
(In thousands)
|
|
|||||||||||
|
|
Balance at |
Balance at |
|||||||||
|
|
Beginning |
Net Additions |
End of |
||||||||
|
|
of Period |
to Expense |
Deductions* |
Period |
|||||||
|
December 31, 2015 |
|||||||||||
|
Accounts receivable, allowance for doubtful accounts |
$ |
680 |
$ |
448 |
$ |
(580) |
$ |
548 | |||
|
December 31, 2016 |
|||||||||||
|
Accounts receivable, allowance for doubtful accounts |
$ |
548 |
$ |
3,151 |
$ |
(2,359) |
$ |
1,340 | |||
|
December 31, 2017 |
|||||||||||
|
Accounts receivable, allowance for doubtful accounts |
$ |
1,340 |
$ |
402 |
$ |
(302) |
$ |
1,440 | |||
|
|
|||||||||||
*Primarily consists of write-offs, net of recoveries and other adjustments
87
|
|
|
|
|
Exhibit No. |
|
Description |
|
|
|
|
|
2.1 |
|
|
|
|
|
|
|
3.1 |
|
|
|
|
|
|
|
3.2 |
|
|
|
|
|
|
|
4.1 |
|
|
|
|
|
|
|
4.2 |
|
|
|
|
|
|
|
4.3 |
|
|
|
|
|
|
|
4.4 |
|
|
|
|
|
|
|
4.5 |
|
|
|
|
|
|
|
4.6 |
|
|
|
|
|
|
|
10.1 |
|
|
|
|
|
|
|
10.2* |
|
|
|
|
|
|
|
10.3* |
|
|
|
|
|
|
|
10.4‡‡ |
|
|
|
|
|
|
|
10.5 |
|
88
89
|
|
|
|
|
|
||
|
|
|
|
|
10.16* |
|
|
|
|
|
|
|
10.17* |
|
|
|
|
|
|
|
10.18* |
|
|
|
|
|
|
|
10.19* |
|
|
|
|
|
|
|
10.20* |
|
|
|
|
|
|
|
10.21* |
|
|
|
|
|
|
|
10.22‡‡ |
|
|
|
|
|
|
|
|
||
|
|
|
|
|
21.1 |
|
|
|
|
|
|
|
23.1 |
|
|
|
|
|
|
|
31.1 |
|
Certification of Chief Executive Officer Pursuant to Exchange Act Rule 13a-14(a). |
|
|
|
|
|
31.2 |
|
Certification of Chief Financial Officer Pursuant to Exchange Act Rule 13a-14(a). |
|
|
|
|
|
32.1 |
|
|
|
|
|
|
|
32.2 |
|
|
|
|
|
|
|
101 |
|
The following financial statements, formatted in XBRL: (i) Consolidated Balance Sheets as of December 31, 2017 and 2016, (ii) Consolidated Statements of Income for the years ended December 31, 2017, 2016 and 2015; (iii) Consolidated Statements of Comprehensive Income for the years ended December 31, 2017, 2016 and 2015; (iv) Consolidated Statements of Stockholders’ Equity for the years ended December 31, 2017, 2016 and 2015; (v) Consolidated Statements of Cash Flows for the years ended December 31, 2017, 2016 and 2015; and (vi) Notes to Consolidated Financial Statements. |
____________________________________
|
* |
|
Management contract or compensatory plan. |
|
‡‡ |
|
Confidential treatment granted as to portions of this exhibit. Confidential information has been omitted and filed separately with the Securities and Exchange Commission. |
90
Pursuant to the requirements of Section 13 or 15(d) of the Securities Exchange Act of 1934, the registrant has duly caused this report to be signed on its behalf by the undersigned, thereunto duly authorized.
|
Date: |
February 27, 2018 |
CAI International, Inc. |
|
|
|
|
|
|
|
|
|
By: |
/s/ VICTOR M. GARCIA |
|
|
|
|
Victor M. Garcia |
|
|
|
|
President and Chief Executive Officer |
Pursuant to the requirements of the Securities Exchange Act of 1934, this report has been signed below by the following persons on behalf of the registrant, in the capacities indicated, on the 27th day of February, 2018.
|
Signature |
|
Title(s) |
|
|
|
|
|
/s/ VICTOR M. GARCIA |
|
President and Chief Executive Officer, Director |
|
Victor M. Garcia |
|
(Principal Executive Officer) |
|
|
|
|
|
/s/ TIMOTHY B. PAGE |
|
Chief Financial Officer |
|
Timothy B. Page |
|
(Principal Financial and Accounting Officer) |
|
|
|
|
|
/s/ DAVID REMINGTON |
|
Chairman of the Board of Directors |
|
David Remington |
|
|
|
|
|
|
|
/s/ MARVIN DENNIS |
|
Director |
|
Marvin Dennis |
|
|
|
|
|
|
|
/s/ KATHRYN G. JACKSON |
|
Director |
|
Kathryn G. Jackson |
|
|
|
|
|
|
|
/s/ MASAAKI (JOHN) NISHIBORI |
|
Director |
|
Masaaki (John) Nishibori |
|
|
|
|
|
|
|
/s/ GARY M. SAWKA |
|
Director |
|
Gary M. Sawka |
|
|
|
|
|
|
|
|
|
|
91