Attached files
| file | filename |
|---|---|
| EX-32 - EX-32 - PEGASYSTEMS INC | d521822dex32.htm |
| EX-31.2 - EX-31.2 - PEGASYSTEMS INC | d521822dex312.htm |
| EX-31.1 - EX-31.1 - PEGASYSTEMS INC | d521822dex311.htm |
| EX-23.1 - EX-23.1 - PEGASYSTEMS INC | d521822dex231.htm |
| EX-21.1 - EX-21.1 - PEGASYSTEMS INC | d521822dex211.htm |
| EX-10.1 - EX-10.1 - PEGASYSTEMS INC | d521822dex101.htm |
Table of Contents
UNITED STATES
SECURITIES AND EXCHANGE COMMISSION
Washington, D.C. 20549
FORM 10-K
| ☒ | ANNUAL REPORT PURSUANT TO SECTION 13 OR 15(d) OF THE SECURITIES EXCHANGE ACT of 1934 |
For the fiscal year ended December 31, 2017
OR
| ☐ | TRANSITION REPORT PURSUANT TO SECTION 13 OR 15(d) OF THE SECURITIES EXCHANGE ACT of 1934 |
Commission File No. 1-11859
PEGASYSTEMS INC.
(Exact name of Registrant as specified in its charter)
| Massachusetts | 04-2787865 | |
| (State or other jurisdiction of incorporation or organization)
|
(IRS Employer Identification No.)
| |
| One Rogers Street, Cambridge, MA | 02142-1209 | |
| (Address of principal executive offices) | (zip code) |
(617) 374-9600
(Registrant’s telephone number, including area code)
Securities registered pursuant to Section 12(b) of the Act:
| Title of Each Class |
Name of Each Exchange on Which Registered | |
| Common Stock, $0.01 par value per share | NASDAQ Global Select Market |
Securities registered pursuant to Section 12(g) of the Act:
None
Indicate by check mark if the Registrant is a well-known seasoned issuer, as defined in Rule 405 of the Securities Act. Yes ☒ No ☐
Indicate by check mark if the Registrant is not required to file reports pursuant to Section 13 or Section 15(d) of the Exchange Act. Yes ☐ No ☒
Indicate by check mark whether the Registrant (1) has filed all reports required to be filed by Section 13 or 15(d) of the Securities Exchange Act of 1934 during the preceding 12 months (or for such shorter period that the Registrant was required to file such reports) and (2) has been subject to such filing requirements for the past 90 days. Yes ☒ No ☐
Indicate by check mark whether the registrant has submitted electronically and posted on its corporate Web site, if any, every Interactive Data File required to be submitted and posted pursuant to Rule 405 of Regulation S-T during the preceding 12 months (or for such shorter period that the registrant was required to submit and post such files). Yes ☒ No ☐
Indicate by check mark if disclosure of delinquent filers pursuant to Item 405 of Regulation S-K is not contained herein, and will not be contained, to the best of the Registrant’s knowledge, in definitive proxy or information statements incorporated by reference in Part III of this Form 10-K or any amendment to this Form 10-K. ☐
Indicate by check mark whether the Registrant is a large accelerated filer, an accelerated filer, a non-accelerated filer, a smaller reporting company, or emerging growth company. See the definitions of “large accelerated filer,” “accelerated filer,” “smaller reporting company,” and “emerging company,” in Rule 12b-2 of the Exchange Act.
| Large accelerated filer | ☒ | Accelerated filer | ☐ | |||
| Non-accelerated filer | ☐ (Do not check if smaller reporting company) | Smaller reporting company | ☐ | |||
| Emerging growth company | ☐ | |||||
If an emerging growth company, indicate by check mark if the Registrant has elected not to use the extended transition period for complying with any new or revised financial accounting standards provided pursuant to Section 13(a) of the Exchange Act. ☐
Indicate by check mark whether the Registrant is a shell company (as defined in Rule 12b-2 of the Exchange Act). Yes ☐ No ☒
The aggregate market value of the Registrant’s common stock held by non-affiliates, based upon the closing price of the Registrant’s common stock on the NASDAQ Global Select Market of $58.35, on June 30, 2017 was approximately $2.2 billion.
There were 78,099,419 shares of the Registrant’s common stock, $0.01 par value per share, outstanding on February 14, 2018.
DOCUMENTS INCORPORATED BY REFERENCE
Portions of the Registrant’s definitive proxy statement related to its 2018 annual meeting of stockholders to be filed subsequently are incorporated by reference into Part III of this report.
Table of Contents
PEGASYSTEMS INC.
ANNUAL REPORT ON FORM 10-K
2
Table of Contents
PART I
Forward-looking statements
This Annual Report on Form 10-K (“Annual Report”), including without limitation, Item 1. “Business”, Item 1A. “Risk Factors”. Item 5. “Market For Registrant’s Common Equity, Related Stockholder Matters and Issuer Purchases of Equity Securities” and Item 7. “Management’s Discussion and Analysis of Financial Condition and Results of Operations,” contains or incorporates forward-looking statements within the meaning of Section 27A of the Securities Act of 1933, as amended, Section 21E of the Securities Exchange Act of 1934 and the Private Securities Litigation Reform Act of 1995. We claim the protection of the safe harbor for forward-looking statements contained in the Private Securities Litigation Reform Act of 1995 for all forward-looking statements. In addition, other written or oral statements that constitute forward-looking statements may be made by us or on our behalf. Words such as “expect,” “anticipate,” “intend,” “plan,” “believe,” “could,” “estimate,” “may,” “target,” “strategy,” “is intended to,” “project,” “guidance,” “likely,” “usually,” or variations of such words and similar expressions are intended to identify such forward-looking statements. These forward-looking statements are based on current expectations, estimates, forecasts, and projections about the industry and markets in which we operate, and management’s beliefs and assumptions. These statements are not guarantees of future performance and involve certain risks, uncertainties, and assumptions that are difficult to predict. These statements include, among other things, statements regarding:
| • | our future financial performance and business plans; |
| • | the adequacy of our liquidity and capital resources; |
| • | the continued payment of our quarterly dividends; |
| • | the timing of revenue recognition under license and cloud arrangements; |
| • | the expected benefits to our clients and potential clients of our product and service offerings; |
| • | the growth of our business and revenues and our expectations about the factors that influence our success and trends in our business; |
| • | our expectation that revenue will continue to shift from perpetual licenses towards term licenses and cloud arrangements; |
| • | our international operations providing a significant portion of our total revenues; |
| • | our backlog of license, maintenance, cloud, and services agreements and the timing of future cash receipts from committed license and cloud arrangements; |
| • | our belief that our acquisitions should allow us to grow and continue to make investments in research and development; |
| • | our expectation that research and development expenses and sales and marketing expenses will continue to increase in absolute dollar values and may increase as a percentage of revenues; |
| • | our expectations regarding the impact of recent accounting pronouncements on our consolidated financial statements; |
| • | our beliefs regarding the impact of the Tax Cuts and Jobs Act (the “Tax Reform Act”), including its impact on income tax expense and deferred tax assets; |
| • | our beliefs that our net deferred tax assets will be realized in the foreseeable future, that we have adequately provided under U.S. generally accepted accounting principles for uncertain tax benefits, and that the undistributed earnings of our foreign subsidiaries are considered permanently reinvested; and |
| • | exposure to foreign currency exchange rates and continued realization of gains or losses with respect to our foreign currency exposures. |
3
Table of Contents
Factors that could cause our actual results to differ from those expressed in forward-looking statements include, but are not limited to, those identified in Item 1A. “Risk Factors” of this Annual Report.
Except as required by law, we have no obligation to publicly update or revise any forward-looking statements, whether as a result of new information, future events or risks. New information, future events or risks may cause actual results to differ materially from future results expressed or implied by such forward-looking statements.
| ITEM 1. | BUSINESS |
Our Business
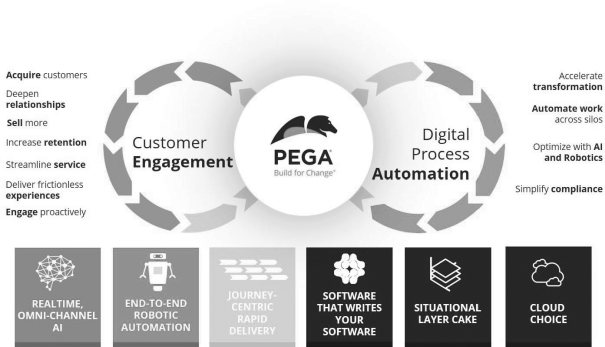
We develop, market, license, and support software applications for customer engagement and digital process automation, in addition to licensing our Pega® Platform application development product for clients that wish to build and extend their own applications. We are helping our clients accelerate digital transformation, by realizing high customer engagement and achieving operational excellence, and leveraging our artificial intelligence (AI) and Robotics technology. Our cloud-architecture customer engagement and digital process automation applications—built on our unified Pega Platform—empower businesses with comprehensive no-code tools to design, extend, and scale their enterprise applications to meet strategic business needs.
To grow our business, we intend to:
| • | Grow market share by developing and delivering market-leading applications for marketing, sales, service, and operations that can work together seamlessly with maximum differentiation and minimal customization; |
| • | Execute new-market growth initiatives, further expanding coverage within the Global 3000; and |
| • | Continue to scale our digital platform and invest in awareness marketing to support the way today’s clients want to buy. |
Whether or not we are successful depends, in part, on our ability to:
| • | Successfully execute our marketing and sales strategies; |
| • | Appropriately manage our expenses as we grow our organization; |
| • | Effectively develop new products and enhance our existing product; and |
| • | Successfully incorporate acquired technologies into our customer relationship management (“CRM”) applications and unified Pega Platform. |
4
Table of Contents
Our Products
The Pega Platform and applications help connect enterprises to their customers in real-time across channels, streamline business operations, and adapt to meet changing requirements.
Our applications and platform intersect with and encompass several software markets, including:
| • | Customer Relationship Management (“CRM”), |
| • | Business Process Management (“BPM”) and Digital Process Automation (“DPA”), |
| • | Robotic Process Automation (“RPA”), |
| • | Business Rules Management Systems (“BRMS”), |
| • | Dynamic Case Management (“DCM”), |
| • | Decision Management, including Predictive and Adaptive analytics, |
| • | No-code and low-code application development platforms, including Mobile Application Development Platforms (“MADP”), and |
| • | Vertical Specific Software (“VSS”) market of industry solutions and packaged applications. |
5
Table of Contents
Customer engagement
Our omni-channel customer engagement applications are designed to maximize the lifetime value of customers and help reduce the costs of serving customers while ensuring a consistent, unified, and personalized customer experience. At the center of our customer engagement-or CRM-applications is the Customer Decision Hub, our real-time AI engine, which leads the industry in its ability to predict a customer’s behavior and recommend the “Next-best-action” to take across channels in real-time.
| • | The Pega® Marketing application is designed to enable enterprises to improve customer acquisition and experiences across inbound, outbound, and paid media channels. It incorporates AI in the form of predictive and machine-learning analytics, as well as business rules, and executes these decisions in real-time to evaluate the context of each customer interaction and dynamically deliver the most relevant action, offer, content, and channel. |
| • | The Pega® Sales Automation application automates and manages the entire sales process, from prospecting to product fulfillment. Our software allows enterprises to capture best practices, and leverages AI to guide sales teams through the sales and customer onboarding processes. |
| • | The Pega® Customer Service application is designed to anticipate customer needs, connect customers to the right people and systems, and automate or intelligently guide customer interactions, to rapidly and continuously evolve the customer service experience and to allow enterprises to deliver consistent interactions across channels and improve employee productivity. The application consists of a contact center desktop, case management for customer service, chat, knowledge management, mobile field service, omni-channel self-service, AI-powered virtual assistants, and industry-specific processes and data models. |
Digital process automation
Pegasystems offers industry-specific software applications built on the Pega Platform. These applications provide businesses with robust capabilities to automate industry-specific business processes. As they are built on the Pega Platform, these applications deliver flexibility beyond traditional, “off the shelf” products. Our applications allow our clients to offer differentiated service and value to their customers. The Pega Platform empowers organizations to implement new processes quickly, refine customer experiences, bring new offerings to market, and provide customized or specialized automated processing.
Our capabilities
Real-time, Omni-channel AI
AI has been around for many years, in many forms, yet only in the past decade businesses have started experiencing its practical applications fueled by the new abundance of data to power decisions and ever-increasing customer expectations. Our CRM and other applications built on the Pega platform, leverage predictive and adaptive analytics to deliver more personalized customer experiences and maximize business objectives. The Pega Customer Decision Hub®, a centralized, always-on “brain” unleashes the power of predictive analytics, machine learning, and real-time decisioning across our clients’ data, systems, and touchpoints—orchestrating engagement on and across customer interactions channels.
End-to-end robotic automation
Pega brings together Robotic Automation capabilities-for both human-assisted robotic desktop automation and unattended robotic process automation-with our unified BPM, and case management capabilities. This gives our applications and platform the ability to automate both customer-facing processes and back-office operational processes from “end-to-end,” connecting across organizational and system silos to seamlessly and efficiently connect customers and employees to outcomes.
6
Table of Contents
Journey-centric rapid delivery
Our CRM and DPA solutions are designed to improve targeted customer outcomes, quickly and with out-of-the-box functionality that connects enterprise data and systems to customer experience channels. From there, organizations can scale, one customer journey-at-a-time, to realize greater value while delivering increasingly consistent and personalized customer experiences.
Software that writes your software
Our approach bypasses the error-prone and time-consuming process of manually translating requirements into code. Users design software in no-code visual models that reflect the needs of the business. The software application is created and optimized automatically and directly from the model, helping to close the costly gap between vision and execution. Changes to the code are made by changing the model, and application documentation is generated directly from the model. The Pega Platform is standards-based and can leverage a client’s existing technology to create new business applications that cross technology silos and bridge front and back-office.
Unified future-proof platform
Pega offers a unified digital process automation platform, combining robotics, process automation, and case management together in a unified architecture. We build in powerful decision analytics, designed to allow our clients to automate any process while working faster and smarter. Our no-code architecture is designed to empower organizations to scale across all dimensions of their business, including product lines, departments, and geographies, by reusing components and avoiding the traditional method of deploying multiple CRM and BPM instances that lead to even more silos and disjointed customer experiences.
Cloud choice
Pega Cloud® Services allow clients to develop, test, and deploy, on an accelerated basis, our CRM applications and Pega Platform using a secure, flexible internet-based infrastructure. Pega Cloud provides production, development, and testing (“Dev/Test”) services to accelerate the development and deployment of Pega applications and the Pega Platform. This allows our clients to minimize infrastructure cost while focusing on core revenue generating competencies.
Additionally, the Pega Platform and CRM applications are deployable on other cloud architectures, including client or partner-managed clouds. This cloud choice gives our clients the ability to select, and change as needed, the best cloud architecture for the security, data access, speed-to-market, and budget requirements of each application they deploy.
Our Services and Support
We offer services and support through our Global Customer Success group, our Global Customer Support group, and our Pega® Academy training services group. We also use third-party contractors to assist us in providing these services.
Global Customer Success
Our Global Customer Success group combines our sales and Pega consulting groups and provides guidance and implementation services to our clients and partners on how to best apply our technology and develop strong implementation expertise.
Global Customer Support
Our Global Customer Support group oversees technical support of our products and Pega Cloud. Support services include managing the online support community, proactive problem prevention through information and knowledge sharing, and problem tracking, prioritization, escalation, diagnosis, and resolution.
7
Table of Contents
PegaAcademy—Training Services
The success of our sales strategy for repeat sales to target clients depends on our ability to train a large number of partners and clients to implement our technology.
We offer training for our staff, clients, and partners through the following means:
| • | Instructor-led training is offered at our regional training facilities in the Americas, the United Kingdom (the “U.K.”), Asia Pacific, and at third-party facilities in numerous other locations, including client sites. |
| • | Online training is a convenient way to learn our software anytime, anywhere. We expect online training to continue to help expand the number of trained and certified experts globally. |
We have also partnered with universities to offer Pega courseware as part of the student curriculum, taught by Pega instructors and university professors to expand our ecosystem.
Our Partners
We collaborate with global systems integrators and technology consulting firms that provide consulting services to our clients. Strategic partnerships with technology consulting firms and systems integrators are important to our sales efforts because they influence buying decisions, help us to identify sales opportunities, and complement our software with their domain expertise and services capabilities. These partners may deliver strategic business planning, consulting, project management, and implementation services to our clients.
Currently, our partners include well-respected, major firms such as Accenture PLC, Atos SE, Capgemini SA, Cognizant Technology Solutions Corporation, EY, Infosys Limited, PwC, Tata Consultancy Services Limited, Tech Mahindra Limited, Virtusa Corporation, and Wipro Limited.
Our Markets
Target Clients
Our target clients are industry-leading Global 3000 organizations and government agencies that require applications to differentiate themselves in the markets they serve. This is achieved by increasing business agility, driving growth, improving productivity, attracting and retaining customers, and reducing risk. We deliver applications tailored to our clients’ specific industry needs. We also enable enterprise transformation initiatives by providing an application development platform that digitizes end-to-end processes and allows for multi-channel customer interactions, all enhanced by Pega Next-Best-Action analytics.
Our clients represent a number of industries including:
| • | Financial Services—Financial services organizations rely on software to market, onboard, cross-sell, retain, and service their customers as well as automate the operations that support these customer interactions. Our customer service, sales and new account onboarding, Know Your Customer (“KYC”), marketing, collections, and dispute management applications allow clients to be responsive to changing business requirements. |
| • | Healthcare—Healthcare organizations seek software that integrates their front and back-offices and helps them deliver personalized care and customer service while reducing cost, automating processes, and increasing operational efficiency. Our applications allow healthcare clients to address sales, service, operations, financial, administrative, and coverage requirements of healthcare consumerism and reform. |
| • | Manufacturing and high tech—Manufacturers worldwide are transforming their businesses to better engage customers and suppliers, as well as to directly manage product performance throughout the product life-cycle. Our manufacturing applications address customer service and field service; manage warranties, recalls, repairs, and returns; improve the performance of direct sales forces; and extend existing enterprise resource planning system capabilities. |
8
Table of Contents
| • | Communications and media—Communications and media organizations need to address high levels of customer churn, growing pressure to increase revenue, and an ability to respond quickly to changing market conditions. Our applications enable organizations to reshape the way they engage with customers and increase customer lifetime value throughout the customer lifecycle by delivering omni-channel, personalized customer journeys. Our applications are designed to solve the most critical business issues from acquiring more customers at higher margin, increasing cross-sell/up-sell, improving the efficiency and effectiveness of customer service, and streamlining sales and quoting. |
| • | Insurance—Insurance companies, whether competing globally or nationally, need software to automate the key activities of distribution management, quoting, underwriting, claims, and policy servicing. Insurers are also becoming increasingly sensitive to ways to improve customer service and the overall customer experience. Our applications for insurance carriers are designed to help increase business value by delivering customer-focused experiences and personalized interactions that help drive higher sales, lower expense ratios, and mitigate risk. |
| • | Government—Government agencies need to modernize legacy systems and processes to meet the growing demands for improved constituent service, lower costs, reduced fraud, and greater levels of transparency. Our applications deliver advanced capabilities to help streamline operations and optimize service delivery through an agile, omni-channel approach. |
| • | Consumer Services—Organizations that provide services to a range of consumers in industries such as airlines/transportation, utilities, consumer-focused internet companies, retail, and hospitality and entertainment. Our marketing, customer service, and sales applications allow these organizations to personalize their customer engagement to acquire more customers, drive revenue through cross-sell/up-sell, and increase service efficiency while increasing customer satisfaction. |
| • | Life Sciences—Life sciences organizations are looking for solutions to improve customer engagement as well as increase efficiencies and transparency across the product development life-cycle. Our customer engagement, clinical, and pharmacovigilance applications are designed to deliver customer engagement, safety and risk management, and regulatory transparency. |
We also offer software to a broad range of other types of companies and industries. For example, we license our applications and platform to clients in travel, transportation, retail, and other services.
Competition
The markets for our offerings are intensely competitive, rapidly changing, and highly fragmented, as current competitors expand their product offerings and new companies enter the market.
We encounter competition from:
| • | CRM application vendors; |
| • | BPM vendors, including no-code and low-code application development platforms, and service-oriented architecture middleware vendors; |
| • | Case management vendors; |
| • | Decision management, data science and AI vendors, as well as vendors of solutions that leverage decision making and data science in managing customer relationships and marketing; |
| • | Robotic automation and workforce intelligence software providers; |
| • | Companies that provide application specific software for the financial services, healthcare, insurance, and other specific markets; |
| • | Mobile application platform vendors; |
9
Table of Contents
| • | Co-browsing software providers; |
| • | Social listening, text analytics, and natural language processing vendors; |
| • | Professional service organizations that develop their own products or create custom software in conjunction with rendering consulting services; and |
| • | Clients’ in-house information technology departments, which may seek to modify their existing systems or develop their own proprietary systems. |
Competitors vary in size, scope and breadth of the products and services they offer and include some of the largest companies in the world, such as Salesforce.com, Microsoft Corporation, Oracle Corporation, SAP SE, and International Business Machines Corporation (IBM).
We have been most successful competing for clients whose businesses are characterized by a high degree of change, complexity, or regulation. We believe the principal competitive factors within our market include:
| • | Product adaptability, scalability, functionality, and performance; |
| • | Proven success in delivering cost-savings and efficiency improvements; |
| • | Proven success in enabling improved customer interactions; |
| • | Ease-of-use for developers, business units, and end-users; |
| • | Timely development and introduction of new products and product enhancements; |
| • | Establishment of a significant base of reference clients; |
| • | Ability to integrate with other products and technologies; |
| • | Customer service and support; |
| • | Product price; |
| • | Vendor reputation; and |
| • | Relationships with systems integrators. |
We believe we are competitively differentiated as our unified Pega Platform is designed to allow both client business and IT staff, using a single, intuitive user interface, to build and evolve enterprise applications in a fraction of the time it would take with disjointed architectures and tools offered by our competitors. In addition, our applications, built on the Pega Platform, provide the same level of flexibility and ability to adapt to our clients’ needs. We believe we compete favorably due to our expertise in our target industries and our long-standing client relationships. We believe we compete less favorably on the basis of some of these factors with respect to our larger competitors, many of which have greater sales, marketing, and financial resources, more extensive geographical presence, and greater name recognition than we do. In addition, we may be at a disadvantage with respect to our ability to provide expertise outside our target industries. See “Risk Factors—The market for our offerings is intensely and increasingly competitive, rapidly changing, and highly fragmented.” in Item 1A of this Annual Report.
Intellectual Property
We rely primarily on a combination of copyright, patent, trademark, and trade secrets laws, as well as confidentiality and intellectual property agreements to protect our proprietary rights. We have obtained patents relating to our system architecture and products in strategic global markets. We enter into confidentiality, intellectual property ownership, and license agreements with our employees, partners, clients, and other third parties. We also control access to and ownership of software, services, documentation, and other proprietary information as means to protect our proprietary rights.
10
Table of Contents
Sales and Marketing
We sell our software and services primarily through a direct sales force. In addition, strategic partnerships with management consulting firms and major systems integrators are important to our sales efforts because they influence buying decisions, help us identify sales opportunities, and complement our software and services with their domain expertise and consulting capabilities. We also partner with technology providers and application developers.
To support our sales efforts, we conduct a broad range of marketing programs, including awareness advertising, client and industry-targeted solution campaigns, trade shows, including our PegaWorld® user conference, solution seminars and webinars, industry analyst and press relations, Web and digital marketing, community development, social media, and other direct and indirect marketing efforts. Our consulting staff, business partners, and other third parties also conduct joint and separate marketing campaigns that generate sales leads.
Sales by Geography
See Note 17, “Geographic Information and Major Clients,” included in Item 8 and “Risk Factors—We face risks from operations and clients based outside of the U.S.” in Item 1A of this Annual Report.
Research and Development
Our development organization is responsible for product architecture, core technology development, product testing, and quality assurance. Our product development priority is to continue expanding the capabilities of our technology. We intend to maintain and extend the support of our existing applications, and we may choose to invest in additional strategic applications which incorporate the latest business innovations. We also intend to maintain and extend the support of popular hardware platforms, operating systems, databases, and connectivity options to facilitate easy and rapid deployment in diverse IT infrastructures. Our goal with all of our products is to enhance product capabilities, ease of implementation, long-term flexibility, and the ability to provide improved client service.
During 2017, 2016, and 2015, research and development expenses were approximately $162.9 million, $145.5 million, and $126.4 million, respectively. See Item 7 “Management’s Discussion and Analysis of Financial Condition and Results of Operations” of this Annual Report. We expect that we will continue to commit significant resources to our product research and development in the future to maintain our leadership position.
Employees
As of January 31, 2018 we had 4,237 employees worldwide, of which 1,768 were based in North America, 834 were based in Europe, and 1,635 were based in Asia Pacific.
Backlog
As of December 31, 2017, we had software license, maintenance, cloud, and services agreements with clients not yet recognized in revenue (“backlog”) of approximately $850.3 million. As of December 31, 2016, we had approximately $707.8 million in backlog.
Under some of these agreements, we must fulfill certain conditions prior to recognizing revenue, and there can be no assurance when, if ever, we will be able to satisfy all such conditions in each instance. Additionally, some backlog amounts may not be recognized as revenue in future periods as a result of the adoption of the new revenue recognition standard (“ASC 606”) effective January 1, 2018. See Note 2. “Significant Accounting Polices” in Item 8 of this Annual Report.
11
Table of Contents
Backlog may vary in any given period depending on the amount and timing of when arrangements are executed, as well as the mix between perpetual license, term license, and cloud arrangements. See Item 7 “Management’s Discussion and Analysis of Financial Condition and Results of Operations” of this Annual Report for a discussion on license and cloud backlog, which excludes future revenue from maintenance and service arrangements.
Available Information
Pegasystems Inc. was incorporated in Massachusetts in 1983. Our stock is traded on the NASDAQ Global Select Market under the symbol PEGA. Our website is located at www.pega.com and our investor relations website is located at www.pega.com/about/investors.
We make available our Annual Reports on Form 10-K, Quarterly Reports on Form 10-Q, and Current Reports on Form 8-K, and amendments to these reports, free of charge through our website (www.pega.com) as soon as reasonably practicable after we electronically file such material with, or furnish such material to, the Securities and Exchange Commission (“SEC”). We also make available on our website reports filed by our executive officers and Directors on Forms 3, 4, and 5 regarding their ownership of our securities. Our Code of Conduct, and any amendments to our Code of Conduct, are also available on our website at www.pega.com/about/leadership on the “Governance” tab.
The SEC maintains a website that contains reports, proxy and information statements, and other information regarding issuers that file electronically with the SEC at www.sec.gov.
| ITEM 1A. | RISK FACTORS |
The risks and uncertainties described below are not the only ones facing us. Other events that we do not currently anticipate or that we currently deem immaterial also may affect our results of operations, cash flows and financial condition.
Factors relating to our financial results
We may not be able to achieve the key elements of our strategy and grow our business as anticipated.
We currently intend to grow our business by pursuing strategic initiatives. Key elements of our strategy include continuing to grow our market share by developing and delivering robust applications for marketing, sales automation, customer service, and operations that can work together seamlessly with maximum differentiation and minimal customization, offering versatility in our Pega Platform and application deployment and licensing options to meet the specific needs of our clients, growing our network of partner alliances, and developing the talent and organizational structure capable of supporting our revenue and earnings growth targets. We may not be able to achieve one or more of our key initiatives. Our success depends on our ability to appropriately manage our expenses as we grow our organization; successfully execute our marketing and sales strategies; successfully incorporate acquired technologies into our unified Pega Platform; and develop new products or product enhancements. If we are not able to execute on these actions, our business may not grow as we anticipated, and our operating results could be adversely affected.
Security of our systems and of global client data is a growing challenge on many fronts. Cyber-attacks and security breaches may expose us to significant legal and financial liabilities.
Our cloud offering provides Pega Platform environments that are provisioned, monitored, and maintained for individual clients to create and deploy Pega-based applications using an Internet-based infrastructure. These services involve the storage and transmission of clients’ data and potential proprietary information. Security breaches could expose us and our clients to a risk of loss or misuse of this information. Any security breach
12
Table of Contents
could result in a loss of confidence in the security of our services, damage our reputation, disrupt our business, lead to legal liability, and negatively impact our future sales. High-profile security breaches at other companies have increased in recent years, and security industry experts and government officials have warned about the risks of hackers and cyber-attackers targeting information technology products and businesses. Threats to IT security can take a variety of forms. Individual hackers, groups of hackers, and sophisticated organizations including state-sponsored organizations or nation-states themselves, may take steps that pose threats to our clients and to our IT structure.
Our security measures, and those of our clients, may be breached as a result of third-party actions, or that of employees, consultants, or others, including intentional misconduct by computer hackers, system error, human error, technical flaws in our products, or otherwise. The techniques used to obtain unauthorized access or to sabotage systems change frequently and generally are not recognized until launched against a target. While we have invested in the protection of our data and systems and of our clients’ data to reduce these risks, there can be no assurance that our efforts will prevent breaches. We carry data breach insurance coverage to mitigate the financial impact of potential legal liability, though this may prove insufficient in the event of a breach.
Our cloud offering involves the hosting of clients’ applications on the servers of third-party technology providers. We also rely on third-party systems and technology including encryption, virtualized infrastructure and support, and we employ a shared security model with our clients and our third-party technology providers. Because we do not control the configuration of Pega applications by our clients, the transmissions between our clients and our third-party technology providers, the processing of data on the servers at third-party technology providers, or the internal controls maintained by our clients and third-party technology providers that could prevent unauthorized access or provide appropriate data encryption, we cannot fully ensure the complete integrity or security of such transmissions processing, or controls. In addition, privacy, security, and data transmission concerns in some parts of the world may inhibit demand for our cloud offering or lead to requirements to provide our products or services in configurations that may increase the cost of serving such markets.
In order to defend against security threats, we need to continuously engineer products and services with enhanced security and reliability features; improve the deployment of software updates to address security vulnerabilities; apply technologies which mitigate the risk of attacks; and maintain a digital security infrastructure that protects the integrity of our network, products, and services. The cost of these steps could negatively impact our operating margins.
The timing of our license and cloud revenue is difficult to predict accurately, which may cause our operating results to vary considerably.
A change in the number or size of high value license and cloud arrangements, or a change in the mix between perpetual licenses, term licenses, and cloud arrangements can cause our revenues to fluctuate materially between periods.
Factors which may influence the predictability of our license and cloud revenue include:
| • | changes in client budgets and decision-making processes that could affect both the timing and size of transactions; |
| • | deferral of license revenue to future periods due to the timing of the execution of an agreement or our ability to deliver the products or services; |
| • | changes in our business model; and/or |
| • | our ability to execute on our marketing and sales strategies. |
We budget for our selling and marketing, product development, and other expenses based upon anticipated future bookings and revenue. If the timing or amount of revenue fails to meet our expectations in a given period,
13
Table of Contents
our financial performance is likely to be adversely affected because only a small portion of our expenses vary with revenue. Other factors which may cause our operating results to vary considerably include changes in foreign currency exchange rates, income tax effects, and the impact of new accounting pronouncements.
As a result, period-to-period comparisons of our operating results are not necessarily meaningful and should not be relied upon to predict future performance. If our revenues and operating results do not meet the expectations of our investors or securities analysts or fall below guidance we may provide to the market or due to other factors discussed elsewhere in this section, the price of our common stock may decline.
The number of our license and cloud arrangements has been increasing, and we may not be able to sustain this growth unless we and our partners can provide sufficient high quality consulting, training, and maintenance resources to enable our clients to realize significant business value from our software.
Our clients typically request consulting and training to assist them in implementing our license and cloud offerings. Our clients also purchase maintenance on our perpetual and term licenses. As a result, an increase in the number of license and cloud arrangements is likely to increase demand for consulting, training, and maintenance related to our offerings. Given that the number of our license and cloud arrangements has been increasing, we will need to provide our clients with more consulting, training, and maintenance to enable our clients to realize significant business value from our software. We have been increasing our partner and client enablement through training to create an expanded ecosystem of people that are skilled in the implementation of our products. However, if we and our partners are unable to provide sufficient high quality consulting, training, or maintenance resources to our clients, our clients may not realize sufficient business value from our offerings to justify follow-on sales, which could impact our future financial performance. In addition, the investments required to meet the increased demand for our consulting services could strain our ability to deliver our consulting engagements at desired levels of profitability, thereby impacting our overall profitability and financial results.
We frequently enter into a series of license or cloud arrangements that are each focused on a specific purpose or area of operations. If we are not successful in obtaining follow-on business from these clients, our financial performance could be adversely affected.
Once a client has realized the value of our software, we work with the client to identify opportunities for follow-on sales. However, we may not be successful in demonstrating this value to some clients, for reasons relating to the performance of our products, the quality of the services and support provided by our partners and us, or external reasons. Also, some of our smaller clients may have limited additional sales opportunities available. For any of these clients, we may not obtain follow-on sales or the follow-on sales may be delayed, and our future revenue could be limited. This could lower the total value of all transactions and adversely affect our financial performance.
Our consulting revenue is dependent to a significant extent on closing new license transactions with clients.
We derive a substantial portion of our consulting revenue from implementations of new licenses and cloud arrangements led by our consulting staff and where we provide consulting for partner-led and client-led implementation efforts. Accordingly, if we do not continue to close more license and cloud arrangements transactions with our clients, we may be unable to maintain or grow our consulting revenue, which could have an adverse effect on our results of operations.
Our financial results may be adversely affected if we are required to change certain estimates, judgments, and/or positions relative to our income and other taxes.
In the ordinary course of conducting our global business enterprise, we cannot be certain of the ultimate tax outcome related to many transactions and calculations. Some of these uncertainties arise as a consequence of
14
Table of Contents
positions we have taken regarding valuation of deferred tax assets, transfer pricing for transactions with our subsidiaries, and potential challenges to nexus and tax credit estimates. We estimate our exposure to unfavorable outcomes related to these uncertainties and estimate the probability of such outcomes. Future realization of our deferred tax assets ultimately depends on the existence of sufficient taxable income within the available carryback or carryforward periods. We record a valuation allowance to reduce our deferred tax assets to an amount we believe is more likely than not to be realized. If our taxable income is not consistent with our expectations or the timing of income is not within the applicable carryforward period, we may be required to establish a valuation allowance on all or a portion of these deferred tax assets. Changes in our valuation allowance impact our income tax expense in the period of adjustment. Although we believe our estimates are reasonable, no assurance can be given that the final tax outcome of these matters or our current estimates regarding these matters will not be different from what is reflected in our historical income tax provisions, returns, and accruals. Such differences, or changes in estimates relating to potential differences, could have a material impact, unfavorable or favorable, on our income tax provisions and effective tax rate, require us to change the recorded value of deferred tax assets, and adversely affect our financial results. Our effective tax rate may also be adversely affected by changes in the mix of taxable income derived by jurisdictions with varied statutory tax rates, changes in tax laws, regulations and interpretations, changes to the financial accounting rules for income taxes and assessments, and any interest or penalties, by taxing authorities.
We are also subject to non-income taxes such as payroll, sales and use, value-added, net worth, property, and goods and services taxes in the U.S. and in various foreign jurisdictions. We are regularly under audit by tax authorities with respect to these non-income taxes and may have exposure to additional non-income tax liabilities which could have an adverse effect on our results of operations and financial condition.
Uncertainties in the interpretation and application of the Tax Reform Act could materially affect our tax obligations and effective tax rate.
On December 22, 2017, the President of the United States signed into law the Tax Reform Act, which significantly changed the U.S. tax code. The U.S. Department of the Treasury has broad authority to issue regulations and interpretive guidance that may significantly affect the application of the Tax Reform Act. The Tax Reform Act requires complex computations not previously required under U.S. tax law. As such, the application of accounting guidance for such items is currently uncertain. Further, compliance with the Tax Reform Act and the accounting for such provisions require accumulation of information not previously required or regularly gathered. As a result, we have recognized provisional tax impacts of the Tax Reform Act in our financial statements. As additional regulatory guidance is issued by the U.S. Department of the Treasury, the Internal Revenue Service, and/or state taxing authorities, as accounting treatment is clarified, and as we perform additional analysis on the application of the law, the final amounts may differ from our current provisional amounts.
If it became necessary to repatriate any of our foreign cash balances to the United States, we may be subject to increased income taxes, other restrictions, and limitations.
As of December 31, 2017, approximately $87.3 million of our cash and cash equivalents was held in our foreign subsidiaries. If we are unable to reinvest this cash outside of the U.S., we may have to repatriate some of our foreign cash to the U.S. which would increase our income tax liability. If it became necessary to repatriate these funds, we may be required to pay U.S. state and local taxes, as well as foreign taxes, upon repatriation. We consider the earnings of our foreign subsidiaries to be permanently reinvested and, as a result, U.S. state, U.S. local and foreign taxes on such earnings have not been provided. It is impractical to estimate the amount of U.S. state, U.S. local and foreign tax we would have to pay upon repatriation due to the complexity of the income tax laws and the effects of the Tax Reform Act and other factors.
15
Table of Contents
We are investing heavily in sales and marketing, research and development, and support in anticipation of a continued increase in license and cloud arrangements, and we may experience decreased profitability or losses if we do not continue to increase the value of our license and cloud arrangements to balance our growth in expenses.
We have been expanding our sales and marketing capacity to meet increasing demand for our software and to broaden our market coverage by hiring additional sales and marketing personnel. We anticipate that we will need to provide our clients with more maintenance support as a result of this increase in demand, and also have been hiring additional personnel in this area. We continue to invest significantly in research and development to expand and improve the Pega Platform and applications. These investments have resulted in increased fixed costs that do not vary with the level of revenue. If the increased demand for our offerings does not continue, we could experience decreased profitability or losses as a result of these increased fixed costs. Conversely, if we are unable to hire sales and marketing personnel to meet future demand or research and development personnel to enhance our current or develop new products, we may not be able to achieve our sales and profitability targets.
We will need to acquire or develop new products, evolve existing ones, address any defects or errors, and adapt to technology changes.
Technical developments, client requirements, programming languages, and industry standards change frequently in our markets. As a result, success in current markets and new markets will depend upon our ability to enhance current products, address any product defects or errors, acquire or develop and introduce new products that meet client needs, keep pace with technology changes, respond to competitive products, and achieve market acceptance. Product development requires substantial investments for research, refinement, and testing. We may not have sufficient resources to make necessary product development investments. We may experience technical or other difficulties that will delay or prevent the successful development, introduction, or implementation of new or enhanced products. We may also experience technical or other difficulties in the integration of acquired technologies into our existing platform and applications. Inability to introduce or implement new or enhanced products in a timely manner could result in loss of market share if competitors are able to provide solutions to meet client needs before we do, give rise to unanticipated expenses related to further development or modification of acquired technologies, and adversely affect future financial performance.
The market for our offerings is intensely and increasingly competitive, rapidly changing, and highly fragmented.
We compete in the CRM (which includes marketing, sales, and customer service), BPM, case management, decision management, robotic automation, co-browsing, social engagement, and mobile application development platform software markets, as well as in markets for the vertical applications we provide (e.g. Pega® KYC for Financial Services, Pega® Underwriting for Insurance). These markets are intensely competitive, rapidly changing, and highly fragmented, as current competitors expand their product offerings and new companies enter the market.
We encounter significant competition from other technology vendors, as well as clients’ internal information systems departments, that seek to modify their existing systems or develop their own proprietary systems, and professional service organizations that develop their own products or create custom software in conjunction with rendering consulting services. Competition for market share and pressure to reduce prices and make sales concessions are likely to increase. Many of our competitors, such as IBM, Oracle, and Salesforce, have far greater resources than we do and may be able to respond more quickly and efficiently to new or emerging technologies, programming languages, or standards, or to changes in client requirements or preferences. Competitors may also be able to devote greater managerial and financial resources to develop, promote, and distribute products and to provide related consulting and training services. There can be no assurance that we will be able to compete successfully against current or future competitors or that the competitive pressures faced by us will not materially adversely affect our business, operating results, and financial condition. See “Competition” in Item 1 “Business” of this Annual Report.
16
Table of Contents
The continued uncertainties in the global economy may negatively impact our sales to, and the collection of receivables from, our clients.
Our sales to, and our collection of receivables from, our clients may be impacted by adverse changes in global economic conditions. The U.S. and other key international economies have experienced cyclical downturns from time to time during which economic activity has been impacted by falling demand for goods and services, restricted credit, poor liquidity, reduced corporate profitability, volatility in credit, equity, and foreign exchange markets, bankruptcies, and economic uncertainty. These changes in global economic conditions could impact the ability and willingness of our clients to make investments in technology, which in turn may delay or reduce the purchases of our software and services. These factors could also impact the ability and willingness of these clients to pay their trade obligations and honor their contractual commitments. These clients may also become subject to increasingly restrictive regulatory requirements, which could limit or delay their ability to proceed with technology purchases and may result in longer sales cycles, increased price competition, and reductions in sales of our products and services. The financial uncertainties facing many of our clients and the industries in which they operate could negatively impact our business, operating results, and financial condition.
We have historically sold to the financial services, healthcare, insurance, and communications markets, and rapid changes or consolidation in these markets could affect the level of demand for our products.
We have historically derived a significant portion of our revenue from clients in the financial services, healthcare, insurance, and communications markets, and sales to these markets are important for our future growth. Competitive pressures, industry consolidation, decreasing operating margins, regulatory changes, and privacy concerns affect the financial condition of our clients and their willingness to buy. In addition, clients’ purchasing patterns in these industries for large technology projects are somewhat discretionary. The financial services and insurance markets continue to undergo intense domestic and international consolidation, and consolidation has increased in the healthcare and communications markets. Consolidation may interrupt normal buying behaviors and increase the volatility of our operating results. In recent years, several of our clients have been merged or consolidated, and we expect this to continue in the near future. Future mergers or consolidations may cause a decline in revenues and adversely affect our future financial performance. All of these factors affect the level of demand for our products from clients in these industries, and could adversely affect our business, operating results, and financial condition.
We rely on certain third-party relationships.
We have a number of relationships with third parties that are significant to our sales, marketing and support activities, and to product development efforts, including hosting facilities for our cloud offering. We rely on software and hardware vendors, large system integrators, and technology consulting firms to provide marketing and sales opportunities for our direct sales force and to strengthen our products through the use of industry-standard tools and utilities. We also have relationships with third parties that distribute our products. There can be no assurance that these companies, many of which have far greater financial and marketing resources than we do, will not develop or market offerings that compete with ours in the future or will not otherwise end or limit their relationships with us. Further, the use of third-party hosting facilities requires us to rely on the functionality and availability of the third parties’ services, as well as their data security as it is provided by such third parties, which despite our due diligence may be or become less than adequate.
We face risks from operations and clients based outside of the U.S.
Sales to clients based outside of the U.S. represent an average of 44% of our total revenue over the last three fiscal years. We market our products and services to clients based outside of the U.S. including clients based in Canada, Europe, Latin America, Asia, and Australia. We have established offices in the Americas, Europe (including Russia and Turkey), Asia (including India), and Australia. We believe that growth will necessitate expanded international operations, requiring increased managerial attention and costs. We anticipate hiring
17
Table of Contents
additional personnel to accommodate international growth, and we may also enter into agreements with local distributors, representatives, or resellers. If we are unable to do one or more of these things in a timely and effective manner, the growth, if any, of our foreign operations may be restricted, and our business, operating results, and financial condition could be materially and adversely affected.
In addition, we may not be able to maintain or increase international market demand for our offerings. Additional risks inherent in our international business activities generally include:
| • | laws and business practices favoring local competitors; |
| • | compliance with multiple, conflicting, and changing governmental laws and regulations, including employment, tax, privacy and data privacy and protection, and increased tariffs and other trade barriers; |
| • | the costs of localizing offerings for local markets, including translation into foreign languages and associated expenses; |
| • | longer payment cycles and credit and collectability risk on our foreign trade receivables; |
| • | economic and political uncertainty around the world, such as the United Kingdom’s referendum in June 2016 in which voters approved an exit from the European Union, commonly referred to as “Brexit”; |
| • | difficulties in enforcing contractual and intellectual property rights; |
| • | heightened fraud and anti-bribery awareness risks; |
| • | treatment of revenue from international sources and changes to tax codes, including being subject to foreign tax laws, being liable for paying withholding income or other taxes in foreign jurisdictions, and other potentially adverse tax consequences (including restrictions on repatriating earnings and the threat of “double taxation”); |
| • | managing our international operations, including increased accounting, internal control, and compliance expenses; |
| • | heightened risks of political and economic instability; and |
| • | foreign currency exchange rate fluctuations and controls. |
There can be no assurance that one or more of these factors will not have a material adverse effect on our international operations, and, consequently, on our business, operating results, and financial condition.
We are exposed to fluctuations in currency exchange rates that could negatively impact our financial results and cash flows.
Because a significant portion of our business is conducted outside the U.S., we face exposure to adverse movements in foreign currency exchange rates. Our international sales are usually denominated in foreign currencies. The operating expenses of our foreign operations are also primarily denominated in foreign currencies, which partially offset our foreign currency exposure on our international sales. Our results of operations and cash flows are subject to fluctuations due to changes in foreign currency exchange rates, particularly changes in the U.S. dollar, the Euro, and the Australian dollar relative to the British Pound. These exposures may change over time as business practices evolve, and they could have a material adverse impact on our financial results and cash flows. In the past we have used, but do not currently use, foreign currency forward contracts (“forward contracts”) to hedge our exposure to changes in foreign currency exchange rates associated with our foreign currency denominated cash, accounts receivable, and intercompany receivables and payables held by our U.S. parent company and its U.K. subsidiary. We may in the future again enter into hedging contracts if we feel that it is appropriate. We do not enter into any hedging contracts for trading or speculative purposes. Our realized gain or loss with respect to foreign currency fluctuations will generally depend on the size
18
Table of Contents
and type of cross-currency exposures that we enter into; the currency exchange rates associated with these exposures and changes in those rates; whether we have entered into forward contracts to offset these exposures; and other factors. All of these factors could materially impact our operating results, financial condition, and cash flows.
Factors relating to our internal operations and potential liabilities
We depend on a number of key personnel, and must be able to attract and retain qualified personnel in the future.
The business is dependent on key, highly skilled technical, managerial, consulting, sales, and marketing personnel, including our Chief Executive Officer who is also our founder and majority stockholder. The loss of key personnel could be disruptive to our operations and adversely affect financial performance. We do not have any significant key-man life insurance on any officers or employees and do not plan to obtain any. Our success will depend in large part on the ability to attract and retain qualified personnel, and rapidly replace and develop new management. The number of potential employees who have the extensive knowledge needed to develop, sell, and maintain our offerings is limited, and competition for their services is intense, and there can be no assurance that we will be able to attract and retain such personnel. If we are unable to do so, our business, operating results, and financial condition could be materially adversely affected.
The acquisition of other businesses and technologies may present new risks.
We have undertaken acquisitions in the past, and we continue to evaluate and consider other potential strategic transactions, including domestic and international acquisitions of businesses, technologies, services, products, and other assets. These acquisitions, if undertaken, may involve significant new risks and uncertainties, including distraction of management attention away from our current business operations, insufficient new revenue to offset expenses, inadequate return on capital, integration challenges, new regulatory and/or legal requirements, new third-party intellectual property infringement claims related to the acquired technology and/or services, dilution of shareholder value, cross border legal issues, and issues not discovered in our due diligence process. No assurance can be given that such acquisitions will be successful and will not adversely affect our profitability or operations.
We may experience significant errors or security flaws in our product and services, and could face privacy, product liability, and/or warranty claims as a result.
Despite quality testing prior to its release, our software frequently contains errors or security flaws, especially when first introduced or when new versions are released. Errors in our software could affect its ability to work with hardware or other software, or could delay the development or release of new products or new versions of our software. Additionally, the detection and correction of any security flaws can be time consuming and costly. Errors or security flaws in our software could result in the inadvertent disclosure of confidential information or personal data relating to our clients, employees, or third parties. Software errors and security flaws in our products or services could expose us to privacy, product liability, and/or warranty claims as well as harm our reputation, which could impact our future sales of products and services. Typically, we enter into license agreements that contain provisions intended to limit the nature and extent of our risk of product liability and warranty claims. There is a risk that a court might interpret these terms in a limited way or could hold part or all of these terms to be unenforceable. Also, there is a risk that these contract terms might not bind a party other than the direct client. Furthermore, some of our licenses with our clients are governed by non-U.S. law, and there is a risk that foreign law might give us less or different protection. Although we have not experienced any material product liability claims to date, a product liability suit or action claiming a breach of warranty, whether or not meritorious, could result in substantial costs and a diversion of management’s attention and our resources.
19
Table of Contents
We face risks related to intellectual property claims or appropriation of our intellectual property rights.
We rely primarily on a combination of copyright, trademark, and trade secrets laws, as well as intellectual property and confidentiality agreements to protect our proprietary rights. We also try to control access to and distribution of our technologies and other proprietary information. We have obtained patents in strategically important global markets relating to the architecture of our systems. We cannot assure that such patents will not be challenged, invalidated, or circumvented or that rights granted thereunder or the claims contained therein will provide us with competitive advantages. Moreover, despite our efforts to protect our proprietary rights, unauthorized parties may attempt to copy aspects of our software or to obtain the use of information that we regard as proprietary. Although we generally enter into intellectual property and confidentiality agreements with our employees and strategic partners, despite our efforts our former employees may seek employment with our business partners, clients, or competitors, and there can be no assurance that the confidential nature of our proprietary information will be maintained. In addition, the laws of some foreign countries do not protect our proprietary rights to as great an extent as do the laws of the U.S. There can be no assurance that our means of protecting our proprietary rights will be adequate or that our competitors will not independently develop similar technology.
Other companies or individuals have obtained proprietary rights covering a variety of designs, processes, and systems. There can be no assurance that third parties, including clients, will not claim infringement by us with respect to current or future products. Although we attempt to limit the amount and type of our contractual liability for infringement of the proprietary rights of third parties, and also assert ownership of work product and intellectual property rights as appropriate, there are often exceptions, and limitations may not be applicable and enforceable in all cases. Even if limitations are found to be applicable and enforceable, our liability to our clients for these types of claims could be material given the size of certain of our transactions. We expect that software product developers will increasingly be subject to infringement claims as the number of products and competitors in our industry segment grows and the functionality of products in different industry segments overlaps. Any such claims, with or without merit, could be time-consuming, result in costly litigation, cause product shipment and delivery delays, require us to enter into royalty or licensing agreements, or be precluded from making and selling the infringing software, if such proprietary rights are found to be valid. Royalty or licensing agreements, if required, may not be available on terms acceptable to us or at all, which could have a material adverse effect upon our business, operating results, and financial condition.
We are subject to increasingly complex and burdensome U.S. and foreign laws and regulations, and any failure to comply with these laws and regulations could subject us to, among other things, penalties and legal expenses that could harm our reputation or have a material adverse effect on our business, financial condition and results of operations.
We are subject to extensive federal, state, and foreign laws and regulations, including but not limited to the U.S. Foreign Corrupt Practices Act, the U.K. Bribery Act, data privacy and security laws, and similar laws and regulations. The Foreign Corrupt Practices Act, the U.K. Bribery Act, and similar foreign anti-bribery laws generally prohibit companies and their intermediaries from making improper payments for the purpose of obtaining or retaining business. Similar laws and regulations exist in many other countries throughout the world in which we do or intend to do business. Data privacy laws and regulations in Europe, Australia, Latin America and elsewhere are undergoing rapid transformation towards increased restrictions. For example, in October 2015, the European Court of Justice invalidated the U.S.-EU Safe Harbor framework that had been in place since 2000, which allowed companies to meet certain European legal requirements for the transfer of personal data from the European Economic Area to the United States. In April 2016, the European Parliament adopted the General Data Protection Regulation (“GDPR”). The GDPR has a two-year phase-in period, with an effective date of May 25, 2018 and extends the scope of European privacy laws to any entity which controls or processes personal data of E.U. residents in connection with the offer of goods or services or the monitoring of behavior. Complying with the GDPR and other emerging and changing requirements may cause us to incur substantial costs or require us to change our business practices.
20
Table of Contents
We have developed and implemented a compliance program based on what we believe are current best practices, including the background checking of our current partners and prospective clients and partners, but we cannot guarantee that we, our employees, our consultants, our partners, or our contractors are or will be in compliance with all federal, state, and foreign regulations, particularly as we expand our operations outside of the U.S. If we or our representatives fail to comply with any of these laws or regulations, a range of fines, penalties, and/or other sanctions could be imposed on us, which could have a material adverse effect on our business, financial condition, and results of operations. Even if we are determined not to have violated these laws, government investigations into these issues typically require the expenditure of significant resources and generate negative publicity, which could also have an adverse effect on our business, financial condition, and results of operations. In addition, regulation of data privacy and security laws is increasing worldwide, including various restrictions on cross-border access or transfer of data, including personal data of our employees, our clients, and customers of our clients. Compliance with such regulations may increase our costs and there is a risk of enforcement of such laws resulting in damage to our brand as well as financial penalties and potential loss of business, which could be significant.
We face risks related to outages, data losses, and disruptions of our online services if we fail to maintain an adequate operations infrastructure.
The increasing user traffic for our cloud offering demands more computing power. It requires that we maintain an Internet connectivity infrastructure that is robust and reliable within competitive and regulatory constraints that continue to evolve. Inefficiencies or operational failures, including temporary or permanent loss of client data, power outages, or telecommunications infrastructure outages, by us or our third party service providers could diminish the quality of our user experience resulting in contractual liability, claims by clients and other third parties, damage to our reputation, loss of current and potential clients, and harm to our operating results and financial condition.
Our implementation of significant modifications to our enterprise resource planning (“ERP”) system may adversely affect our business and results of operations or the effectiveness of internal control over financial reporting.
During 2016, we implemented the billing and revenue recognition modules in our existing ERP system. The new revenue recognition module was implemented to facilitate the preparation of our financial statements under both the current revenue recognition guidance under Accounting Standards Codification 985-605, Software—Revenue Recognition and the new guidance under Accounting Standard Update No. 2014-09, “Revenue from Contracts with Customers (Topic 606)”. See Note 2, “Significant Accounting Policies—New accounting pronouncements,” included in Item 8 of this Annual Report for further discussion of new guidance. Implementations of a project of this size and complexity involve risks inherent in the conversion to a new computer system, including loss of information and potential disruption of normal operations. The implementation was completed in the fourth quarter of 2016; however, post-implementation support activities are still ongoing. Our business and results of operations may be adversely affected if we experience operating problems with the new system that result in increased costs to correct post-implementation issues identified. Additionally, if the new system and the associated process changes do not give rise to the benefits that we expect, or if the new system does not operate as intended, it could adversely affect our financial reporting systems and processes, our ability to produce timely and accurate financial reports, and/or the effectiveness of internal control over financial reporting. We have assessed, and continue to monitor, our processes and procedures as a result of the implementation, as well as the impact on our internal controls over financial reporting.
| ITEM 1B. | UNRESOLVED STAFF COMMENTS |
None.
21
Table of Contents
| ITEM 2. | PROPERTIES |
Our principal administrative, sales, marketing, support, and research and development operations are located in Cambridge, Massachusetts in an approximately 185,000 square foot leased facility. Our lease expires in 2023, subject to our option to extend for two additional five-year periods. A significant portion of our research and development is conducted in Hyderabad, India in an approximately 238,000 square foot leased facility. Our Hyderabad facility is subject to two leases which expire in 2019 and 2020 and are subject to our option to extend for two additional five-year periods.
We also lease space for smaller offices in the Americas, Europe, and the Asia Pacific under leases that expire at various dates through 2022. We periodically evaluate the adequacy of existing facilities and we believe that additional or alternative space will be available as needed in the future on commercially reasonable terms.
See Note 12 “Commitments and Contingencies,” in Item 8 of this Annual Report for more information about our lease commitments.
| ITEM 3. | LEGAL PROCEEDINGS |
None.
| ITEM 4. | MINE SAFETY DISCLOSURES |
Not applicable.
22
Table of Contents
PART II
| ITEM 5. | MARKET FOR REGISTRANT’S COMMON EQUITY, RELATED STOCKHOLDER MATTERS AND ISSUER PURCHASES OF EQUITY SECURITIES |
Market Information
Our common stock is quoted on the NASDAQ Global Select Market (“NASDAQ”) under the symbol “PEGA.” The following table sets forth the range of high and low sales prices of our common stock on NASDAQ for each quarter in 2017 and 2016:
| Common Stock Price | ||||||||||||||||
| 2017 | 2016 | |||||||||||||||
| High | Low | High | Low | |||||||||||||
| First Quarter |
$ | 45.20 | $ | 35.50 | $ | 27.19 | $ | 20.62 | ||||||||
| Second Quarter |
$ | 63.65 | $ | 43.00 | $ | 29.00 | $ | 24.32 | ||||||||
| Third Quarter |
$ | 62.35 | $ | 52.00 | $ | 29.61 | $ | 25.02 | ||||||||
| Fourth Quarter |
$ | 60.30 | $ | 46.55 | $ | 36.65 | $ | 28.76 | ||||||||
Holders
As of February 14, 2018, we had approximately 23 stockholders of record and approximately 21,100 beneficial owners of our common stock.
Dividends
In 2017 and 2016, we paid quarterly cash dividends of $0.03 per share of common stock. It is our current intention to pay a quarterly cash dividend of $0.03 per share, however, the Board of Directors may terminate or modify this dividend program at any time without prior notice.
Issuer Purchases of Equity Securities
The following table sets forth information regarding repurchases of our common stock during the three months ended December 31, 2017:
| Period |
Total Number of Shares Purchased (1)(2) (in thousands) |
Average Price Paid per Share (1)(2) |
Total Number of Shares Purchased as Part of Publicly Announced Share Repurchase Program (2) (in thousands) |
Approximate Dollar Value of Shares That May Yet Be Purchased at Period End Under Publicly Announced Share Repurchased Programs (2) (in thousands) |
||||||||||||
| October 1, 2017 – October 31, 2017 |
14 | $ | 58.56 | — | $ | 36,399 | ||||||||||
| November 1, 2017 – November 30, 2017 |
93 | $ | 52.72 | 1 | $ | 36,355 | ||||||||||
| December 1, 2017 – December 31, 2017 |
146 | $ | 49.24 | 30 | $ | 34,892 | ||||||||||
|
|
|
|||||||||||||||
| Total |
253 | $ | 51.03 | |||||||||||||
|
|
|
|||||||||||||||
| (1) | We net settle the majority of our employee stock option exercises and restricted stock unit (“RSU”) vestings, which results in the withholding of shares to cover the option exercise price and the minimum statutory withholding tax obligations that we are required to pay in cash to the applicable taxing authorities on behalf of our employees. Shares withheld to cover the option exercise price and statutory tax withholding obligations under the net settlement provisions of the company’s stock compensation awards have been included in the above table. |
23
Table of Contents
| (2) | Since 2004, our Board of Directors has approved stock repurchase programs that have authorized the repurchase, in the aggregate, of up to $195 million of our common stock. On May 30, 2017, we announced that our Board of Directors extended the expiration date of the current stock repurchase program to June 30, 2018 (the “Current Program”). Under the Current Program, purchases may be made from time to time on the open market or in privately negotiated transactions. Shares may be repurchased in such amounts as market conditions warrant, subject to regulatory and other considerations. We have established a pre-arranged stock repurchase plan, intended to comply with the requirements of Rule 10b5-1 under the Securities Exchange Act of 1934, as amended (the “Exchange Act”), and Rule 10b-18 under the Exchange Act (the “10b5-1 Plan”). All share repurchases under the Current Program during closed trading window periods will be made pursuant to the 10b5-1 Plan. |
Stock Performance Graph and Cumulative Total Stockholder Return
The following performance graph represents a comparison of the cumulative total stockholder return (assuming the reinvestment of dividends) for a $100 investment on December 31, 2012 in our common stock, the Total Return Index for the NASDAQ Composite (“NASDAQ Composite”), a broad market index, and the Standard & Poor’s (“S&P”) North American Technology Sector—Software Index™ (“S&P NA Tech Software”), a published industry index. The graph lines merely connect measurement dates and do not reflect fluctuations between those dates.
We paid dividends of $0.12 per share during 2017, 2016, and 2015, $0.09 per share during 2014, and $0.045 per share during 2013, respectively. The dividends paid per share have been adjusted for the two-for-one common stock split effected in the form of a common stock dividend on April 1, 2014.
Comparison of 5 Year Cumulative Total Return
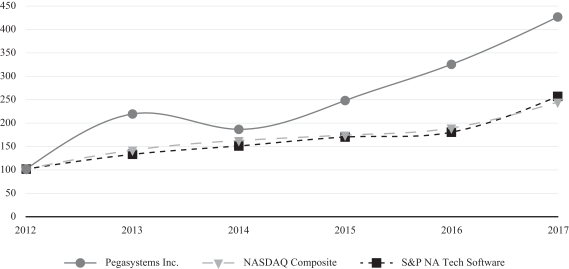
| December 31, | ||||||||||||||||||||||||
| 2012 | 2013 | 2014 | 2015 | 2016 | 2017 | |||||||||||||||||||
| Pegasystems Inc. |
$ | 100.00 | $ | 217.56 | $ | 184.71 | $ | 245.78 | $ | 323.10 | $ | 424.16 | ||||||||||||
| NASDAQ Composite |
100.00 | 140.12 | 160.78 | 171.97 | 187.22 | 242.71 | ||||||||||||||||||
| S&P NA Tech Software |
$ | 100.00 | $ | 131.10 | $ | 149.30 | $ | 167.95 | $ | 178.37 | $ | 254.71 | ||||||||||||
24
Table of Contents
| ITEM 6. | SELECTED FINANCIAL DATA |
The selected financial data presented below has been derived from our audited consolidated financial statements. This data should be read in conjunction with Item 7. “Management’s Discussion and Analysis of Financial Condition and Results of Operations” and Item 8. “Financial Statements and Supplementary Data” of this Annual Report.
| Year Ended December 31, | ||||||||||||||||||||
| (in thousands, except per share amounts) | 2017 | 2016 | 2015 | 2014 | 2013 | |||||||||||||||
| Consolidated Statements of Operations Data: (1)(2) |
||||||||||||||||||||
| Revenue: |
||||||||||||||||||||
| Perpetual license |
$ | 141,819 | $ | 147,529 | $ | 166,305 | $ | 136,154 | $ | 122,644 | ||||||||||
| Term license |
146,515 | 132,466 | 109,283 | 96,182 | 69,232 | |||||||||||||||
| Maintenance |
244,347 | 220,336 | 202,802 | 186,239 | 157,309 | |||||||||||||||
| Cloud |
51,892 | 41,438 | 30,626 | 16,614 | 8,720 | |||||||||||||||
| Consulting and training |
256,009 | 208,497 | 173,679 | 154,815 | 151,049 | |||||||||||||||
|
|
|
|
|
|
|
|
|
|
|
|||||||||||
| Total revenue |
840,582 | 750,266 | 682,695 | 590,004 | 508,954 | |||||||||||||||
| Income from operations |
38,660 | 37,759 | 64,661 | 51,539 | 58,097 | |||||||||||||||
| Income before provision for income taxes |
37,100 | 35,202 | 60,505 | 47,994 | 56,393 | |||||||||||||||
| Net income |
$ | 32,934 | $ | 26,986 | $ | 36,322 | $ | 33,255 | $ | 38,043 | ||||||||||
| Earnings per share: |
||||||||||||||||||||
| Basic |
$ | 0.43 | $ | 0.35 | $ | 0.47 | $ | 0.44 | $ | 0.50 | ||||||||||
|
|
|
|
|
|
|
|
|
|
|
|||||||||||
| Diluted |
0.40 | 0.34 | 0.46 | 0.42 | 0.49 | |||||||||||||||
|
|
|
|
|
|
|
|
|
|
|
|||||||||||
| Cash dividends declared per common share |
$ | 0.12 | $ | 0.12 | $ | 0.12 | $ | 0.105 | $ | 0.06 | ||||||||||
|
|
|
|
|
|
|
|
|
|
|
|||||||||||
| (1) | We elected to early adopt Accounting Standards Update (“ASU”) 2016-09 “Compensation—Stock Compensation (Topic 718): Improvements to Employee Share-Based Payment Accounting” (“ASU 2016-09”) in 2016, which requires us, among other things to record excess tax benefits as a reduction of the provision for income taxes in the consolidated statement of operations, whereas they were previously recognized in equity. We are required to reflect any adoption adjustments as of January 1, 2016, the beginning of the annual period that includes the period of adoption. As such, certain information above for 2016 included the impact of the ASU 2016-09 adoption. |
| (2) | The per share amounts have been retroactively restated for all prior periods presented to reflect the two-for-one common stock split effected in the form of a common stock dividend distributed on April 1, 2014. |
| December 31, | ||||||||||||||||||||
| (in thousands) | 2017 | 2016 | 2015 | 2014 | 2013 | |||||||||||||||
| Consolidated Balance Sheet Data: (1) |
||||||||||||||||||||
| Total cash, cash equivalents, and marketable securities |
$ | 223,748 | $ | 133,761 | $ | 219,078 | $ | 211,216 | $ | 156,692 | ||||||||||
| Working capital |
188,309 | 137,660 | 179,297 | 150,474 | 145,487 | |||||||||||||||
| Property and equipment, net |
40,359 | 38,281 | 31,319 | 30,156 | 28,957 | |||||||||||||||
| Intangible assets, net |
31,899 | 44,191 | 33,418 | 45,664 | 56,574 | |||||||||||||||
| Goodwill |
72,952 | 73,164 | 46,776 | 46,860 | 43,469 | |||||||||||||||
| Total assets |
721,606 | 654,656 | 627,758 | 587,801 | 536,480 | |||||||||||||||
| Total stockholders’ equity |
$ | 371,078 | $ | 335,889 | $ | 322,859 | $ | 294,705 | $ | 271,788 | ||||||||||
| (1) | We retrospectively adopted ASU 2015-17 “Income Taxes (Topic 740): Balance Sheet Classification of Deferred Taxes” in 2016. As a result, all net deferred income taxes assets are classified as long-term deferred income tax assets in the consolidated balance sheets for all periods presented. The amounts reclassified as of December 31, 2015, 2014, and 2013, were $12.4 million, $13 million, and $12.3 million, respectively. |
25
Table of Contents
| ITEM 7. | MANAGEMENT’S DISCUSSION AND ANALYSIS OF FINANCIAL CONDITION AND RESULTS OF OPERATIONS |
BUSINESS OVERVIEW
We develop, market, license, and support software applications for customer engagement and digital process automation, in addition to licensing our Pega Platform application development product for clients that wish to build and extend their own applications. The Pega Platform and applications help connect enterprises to their customers in real-time across channels, streamline business operations, and adapt to meet changing requirements.
Our clients include Global 3000 companies and government agencies that seek to manage complex enterprise systems and customer service issues with greater agility and cost-effectiveness. Our strategy is to sell a client a series of licenses, each focused on a specific purpose or area of operations in support of longer term enterprise-wide digital transformation initiatives.
Our license revenue is primarily derived from sales of our applications and our Pega Platform.
Our cloud revenue is derived from our hosted Pega Platform and software application environments.
Our consulting services revenue is primarily related to new license implementations.
Financial and Performance Metrics
Management evaluates our financial performance based on a number of financial and performance metrics. The metrics are periodically reviewed and revised to reflect any changes in our business. Historically, recurring revenue and license and cloud backlog have been our primary performance metrics. However, due to the change in the timing of revenue recognition for term license arrangements as a result of the expected implementation of the new revenue accounting standard (See Note 2. “Significant Accounting Polices”), we are utilizing annual contract value (ACV) as a key performance metric.
Select Financial Metrics
| Year Ended December 31, | % Change | |||||||||||||||||||
| (Dollars in thousands, except per share amounts) | 2017 | 2016 | 2015 | 2017 vs. 2016 | 2016 vs. 2015 | |||||||||||||||
| Total revenue |
$ | 840,582 | $ | 750,266 | $ | 682,695 | 12 | % | 10 | % | ||||||||||
| Operating margin |
5 | % | 5 | % | 9 | % | 0 | % | (44 | )% | ||||||||||
| Diluted earnings per share |
$ | 0.40 | $ | 0.34 | $ | 0.46 | 18 | % | (26 | )% | ||||||||||
| Cash flow provided by operating activities |
$ | 158,235 | $ | 39,874 | $ | 67,803 | 297 | % | (41 | )% | ||||||||||
Select Performance Metrics
ACV
The change in ACV measures the growth and predictability of future cash flows from committed term license, cloud, and maintenance arrangements as of the end of the particular reporting period.
26
Table of Contents
ACV, as of a given date, is the sum of the following two components:
| • | The sum of the annual value of each term and cloud contract in effect on such date, with the annual value of a term or cloud contract being equal to the total value of the contract divided by the total number of years of the contract. |
| • | Maintenance revenue reported for the quarter ended on such date, multiplied by four. |
| December 31, | Change | |||||||||||||||
| (Dollars in thousands) | 2017 | 2016 | ||||||||||||||
| Term License and Cloud ACV |
$ | 215,122 | $ | 178,965 | $ | 36,157 | 20 | % | ||||||||
| Maintenance ACV |
254,352 | 228,648 | $ | 25,704 | 11 | % | ||||||||||
|
|
|
|
|
|||||||||||||
| Term License, cloud and Maintenance ACV |
$ | 469,474 | $ | 407,613 | $ | 61,861 | 15 | % | ||||||||
|
|
|
|
|
|||||||||||||
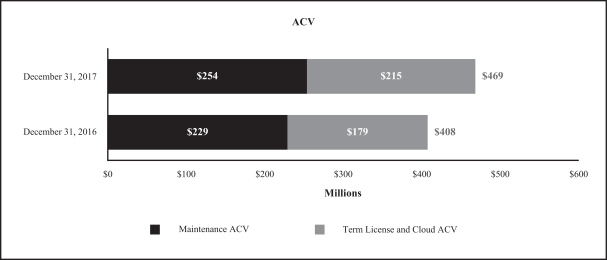
License and Cloud Backlog
A measure of the continued growth of our business as a result of future contractual commitments by our clients.
License and cloud backlog is the sum of the following two components:
| • | Deferred license and cloud revenue as recorded on our balance sheet. (See Note 11 “Deferred Revenue”) |
| • | License and cloud contractual commitments, which are not recorded on our balance sheet because we have not yet invoiced our clients, nor have we recognized the associated revenue. (See “Future Cash Receipts from Committed License and Cloud Arrangements” for additional information) |
27
Table of Contents
License and cloud backlog may vary in any given period depending on the amount and timing of when the arrangements are executed, as well as the mix between perpetual, term, and cloud license arrangements, which may depend on our clients’ deployment preferences. A change in the mix may cause our revenues to vary materially from period to period. Under U.S. GAAP as of December 31, 2017, a higher proportion of term and cloud license arrangements executed will generally result in revenue being recognized over longer periods. For a discussion about how changes in U.S. GAAP will affect our recognition of revenue, please see Note 2. “Significant Accounting Polices” in Item 8 of this Annual Report for additional information.
| December 31, | Change | |||||||||||||||||||
| (Dollars in thousands) | 2017 | 2016 | ||||||||||||||||||
| Deferred license and cloud revenue on the balance sheet |
||||||||||||||||||||
| Term license and cloud |
$ | 41,407 | 65 | % | $ | 30,725 | 50 | % | 35 | % | ||||||||||
| Perpetual license |
21,845 | 35 | % | 31,098 | 50 | % | (30 | )% | ||||||||||||
|
|
|
|
|
|||||||||||||||||
| Total deferred license and cloud revenue |
63,252 | 100 | % | 61,823 | 100 | % | 2 | % | ||||||||||||
|
|
|
|
|
|||||||||||||||||
| License and cloud contractual commitments not on the balance sheet |
||||||||||||||||||||
| Term license and cloud |
522,077 | 89 | % | 434,323 | 93 | % | 20 | % | ||||||||||||
| Perpetual license |
63,176 | 11 | % | 31,652 | 7 | % | 100 | % | ||||||||||||
|
|
|
|
|
|||||||||||||||||
| Total license and cloud commitments |
585,253 | 100 | % | 465,975 | 100 | % | 26 | % | ||||||||||||
|
|
|
|
|
|||||||||||||||||
| Total license (term and perpetual) and cloud backlog |
$ | 648,505 | $ | 527,798 | 23 | % | ||||||||||||||
|
|
|
|
|
|||||||||||||||||
| Total term license and cloud backlog |
$ | 563,484 | 87 | % | $ | 465,048 | 88 | % | 21 | % | ||||||||||
|
|
|
|
|
|||||||||||||||||
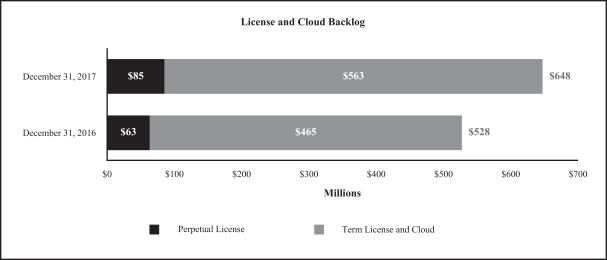
28
Table of Contents
Recurring Revenue
A measure of the predictability and repeatability of our revenue.
| Year Ended December 31, | % Change | |||||||||||||||||||
| (Dollars in thousands) | 2017 | 2016 | 2015 | 2017 vs. 2016 | 2016 vs. 2015 | |||||||||||||||
| Recurring revenue |
||||||||||||||||||||
| Term license |
$ | 146,515 | $ | 132,466 | $ | 109,283 | 11 | % | 21 | % | ||||||||||
| Maintenance |
244,347 | 220,336 | 202,802 | 11 | % | 9 | % | |||||||||||||
| Cloud |
51,892 | 41,438 | 30,626 | 25 | % | 35 | % | |||||||||||||
|
|
|
|
|
|
|
|
|
|
|
|||||||||||
| Total recurring revenue |
$ | 442,754 | $ | 394,240 | $ | 342,711 | 12 | % | 15 | % | ||||||||||
|
|
|
|
|
|
|
|
|
|
|
|||||||||||
RESULTS OF OPERATIONS
| Year Ended December 31, | % Change | |||||||||||||||||||
| (Dollars in thousands) | 2017 | 2016 | 2015 | 2017 vs. 2016 | 2016 vs. 2015 | |||||||||||||||
| Total revenue |
$ | 840,582 | $ | 750,266 | $ | 682,695 | 12 | % | 10 | % | ||||||||||
| Gross profit |
$ | 560,909 | $ | 511,010 | $ | 469,249 | 10 | % | 9 | % | ||||||||||
| Income from operations |
$ | 38,660 | $ | 37,759 | $ | 64,661 | 2 | % | (42 | )% | ||||||||||
| Income before provision for income taxes |
$ | 37,100 | $ | 35,202 | $ | 60,505 | 5 | % | (42 | )% | ||||||||||
| Net Income |
$ | 32,934 | $ | 26,986 | $ | 36,322 | 22 | % | (26 | )% | ||||||||||
Revenue
The adoption of the new revenue recognition standard (“ASC 606”) in the first quarter of 2018 will have a material impact primarily on our term license revenue. See Note 2. “Significant Accounting Polices” in Item 8 of this Annual Report for additional information.
Software license
| Year Ended December 31, | % Change | |||||||||||||||||||||||||||||||
| (Dollars in thousands) | 2017 | 2016 | 2015 | 2017 vs. 2016 | 2016 vs. 2015 | |||||||||||||||||||||||||||
| Perpetual license |
$ | 141,819 | 49 | % | $ | 147,529 | 53 | % | $ | 166,305 | 60 | % | (4 | )% | (11 | )% | ||||||||||||||||
| Term license |
146,515 | 51 | % | 132,466 | 47 | % | 109,283 | 40 | % | 11 | % | 21 | % | |||||||||||||||||||
|
|
|
|
|
|
|
|
|
|
|
|
|
|||||||||||||||||||||
| Software license |
$ | 288,334 | 100 | % | $ | 279,995 | 100 | % | $ | 275,588 | 100 | % | 3 | % | 2 | % | ||||||||||||||||
|
|
|
|
|
|
|
|
|
|
|
|
|
|||||||||||||||||||||
Under U.S. GAAP applicable to 2017, a higher proportion of term license arrangements executed would result in more term license revenue being recognized over longer periods. However, with the adoption of the new revenue standard effective January 1, 2018, term license revenue will be recognized in full in the year that control of the license is transferred to the client instead of over the term of the agreement.
The mix between perpetual and term license arrangements executed in a particular period varies based on client needs. A change in the mix may cause our revenues to vary materially from period to period. Additionally, some of our perpetual license arrangements include extended payment terms or additional rights of use, which also result in the recognition of revenue over longer periods.
During 2017 and 2016, revenue from term licenses continued to grow as a proportion of our total license revenue reflecting a possible shift of our client preferences towards recurring arrangements.
29
Table of Contents
2017 Compared to 2016
The decrease in perpetual license revenue in the current period was primarily due to a lower proportion of perpetual arrangements for which revenue was recognized in the same period that they were executed.
The increase in term license revenue was primarily due to an increase in revenue recognized in the current period for term arrangements executed in the preceding two years.
2016 Compared to 2015
The decrease in perpetual license revenue was primarily due to the lower average value of perpetual license arrangements executed during 2016 compared to 2015 and the acceleration of the recognition of $4.6 million in revenue in the fourth quarter of 2015 from an existing license arrangement which was being recognized ratably.
The increase in term license revenue was primarily due to a term license arrangement greater than $10 million for which the license fee for the three year license term was paid and recognized in full in the first quarter of 2016 as well as the increase in term license arrangements executed during 2016 and 2015, reflecting the shift towards recurring revenue streams.
Maintenance
| (Dollars in thousands) | Year Ended December 31, | % Change | ||||||||||||||||||
| 2017 | 2016 | 2015 | 2017 vs. 2016 | 2016 vs. 2015 | ||||||||||||||||
| Maintenance |
$ | 244,347 | $ | 220,336 | $ | 202,802 | 11 | % | 9 | % | ||||||||||
The increases in maintenance revenue were primarily due to the growth in the aggregate value of the installed base of our software and continued renewal rates in excess of 90%.
Services
| (Dollars in thousands) | Year Ended December 31, | % Change | ||||||||||||||||||||||||||||||
| 2017 | 2016 | 2015 | 2017 vs. 2016 | 2016 vs. 2015 | ||||||||||||||||||||||||||||
| Consulting and Training |
$ | 256,009 | 83 | % | $ | 208,497 | 83 | % | $ | 173,679 | 85 | % | 23 | % | 20 | % | ||||||||||||||||
| Cloud |
51,892 | 17 | % | 41,438 | 17 | % | 30,626 | 15 | % | 25 | % | 35 | % | |||||||||||||||||||
|
|
|
|
|
|
|
|
|
|
|
|
|
|||||||||||||||||||||
| Services |
$ | 307,901 | 100 | % | $ | 249,935 | 100 | % | $ | 204,305 | 100 | % | 23 | % | 22 | % | ||||||||||||||||
|
|
|
|
|
|
|
|
|
|
|
|
|
|||||||||||||||||||||
Consulting revenue represents revenue primarily from new license implementations. Our consulting revenue may fluctuate in future periods depending on the mix of new implementation projects we perform as compared to those performed by our enabled clients or led by our partners.
2017 Compared to 2016
The increase in consulting revenue was primarily due to increased billable hours driven by a large project which began in the second half of 2016.
The increase in cloud revenue was primarily due to growth of our cloud client base.
2016 Compared to 2015
The increase in consulting revenue was due to higher realization rates and increased billable hours primarily related to two large projects in 2016, compared to unusually low demand in Europe in the first half of 2015.
The increase in cloud revenue was primarily due to growth of our cloud client base.
30
Table of Contents
Gross Profit
| (Dollars in thousands) | Year Ended December 31, | % Change | ||||||||||||||||||
| 2017 | 2016 | 2015 | 2017 vs. 2016 | 2016 vs. 2015 | ||||||||||||||||
| Software license |
$ | 283,249 | $ | 275,052 | $ | 271,463 | 3 | % | 1 | % | ||||||||||
| Maintenance |
216,442 | 194,831 | 180,899 | 11 | % | 8 | % | |||||||||||||
| Consulting and Training |
33,097 | 21,996 | 7,687 | 50 | % | 186 | % | |||||||||||||
| Cloud |
28,121 | 19,131 | 9,200 | 47 | % | 108 | % | |||||||||||||
| Services |
61,218 | 41,127 | 16,887 | 49 | % | 144 | % | |||||||||||||
|
|
|
|
|
|
|
|||||||||||||||
| Total gross profit |
$ | 560,909 | $ | 511,010 | $ | 469,249 | 10 | % | 9 | % | ||||||||||
|
|
|
|
|
|
|
|||||||||||||||
| Software license |
98 | % | 98 | % | 99 | % | ||||||||||||||
| Maintenance |
89 | % | 88 | % | 89 | % | ||||||||||||||
| Consulting and Training |
13 | % | 11 | % | 4 | % | ||||||||||||||
| Cloud |
54 | % | 46 | % | 30 | % | ||||||||||||||
| Services |
20 | % | 16 | % | 8 | % | ||||||||||||||
| Total gross profit % |
67 | % | 68 | % | 69 | % | ||||||||||||||
2017 Compared to 2016
The increase in total gross profit was primarily due to increases in maintenance and services revenue.
The increase in services gross profit percent was primarily due to the recognition of revenue in 2017 related to a large cloud project which had been delayed from prior periods for which the majority of the associated costs had already been recognized in 2016, a large project which began in the second half of 2016, and a decrease in amortization expense due to the full amortization in 2016 of certain cloud-related intangibles acquired through past acquisitions.
2016 Compared to 2015
The increase in total gross profit was primarily due to increases in maintenance and services revenue.
The increase in services gross profit percent was primarily due to higher realization rates in 2016 compared to 2015 and the recognition of revenue in 2016 related to several large projects which had been delayed from prior periods, for which the majority of the associated costs had already been recognized in 2015.
Operating expenses
Selling and marketing
| (Dollars in thousands) | Year Ended December 31, | % Change | ||||||||||||||||||
| 2017 | 2016 | 2015 | 2017 vs. 2016 | 2016 vs. 2015 | ||||||||||||||||
| Selling and marketing |
$ | 307,210 | $ | 278,849 | $ | 241,387 | 10 | % | 16 | % | ||||||||||
| As a percent of total revenue |
37 | % | 37 | % | 35 | % | ||||||||||||||
| Selling and marketing headcount, end of period |
984 | 898 | 750 | 10 | % | 20 | % | |||||||||||||
Selling and marketing expenses include compensation, benefits, and other headcount-related expenses associated with our selling and marketing personnel as well as advertising, promotions, trade shows, seminars, and other programs. Selling and marketing expenses also include the amortization of client related intangibles.
The increases in headcount reflect our efforts to increase our sales capacity to deepen relationships at existing accounts and industries while also expanding our coverage in new industries and geographies.
31
Table of Contents
2017 Compared to 2016
The increase was primarily due to an $18.5 million increase in compensation and benefits expenses associated with higher headcount and increased equity compensation costs primarily from the increased value of our annual periodic equity awards, a $2.4 million increase in travel and entertainment driven by our increased sales headcount, a $2 million increase in partner and marketing contractor compensation, and a $1.5 million increase in sales and marketing programs expenses primarily related to our annual PegaWorld user conference.
2016 Compared to 2015
The increase was primarily due to a $29.4 million increase in compensation and benefit expenses associated with higher headcount and sales commission, a $2 million increase in sales and marketing programs expenses primarily related to our digital advertising and brand awareness campaigns and our PegaWorld annual user conference, and a $1 million increase in amortization expense due to the client-related intangible assets acquired from OpenSpan.
Research and development
| (Dollars in thousands) | Year Ended December 31, | % Change | ||||||||||||||||||
| 2017 | 2016 | 2015 | 2017 vs. 2016 | 2016 vs. 2015 | ||||||||||||||||
| Research and development |
$ | 162,886 | $ | 145,548 | $ | 126,374 | 12 | % | 15 | % | ||||||||||
| As a percent of total revenue |
19 | % | 19 | % | 19 | % | ||||||||||||||
| Research and development headcount, end of period |
1,479 | 1,431 | 1,222 | 3 | % | 17 | % | |||||||||||||
Research and development expenses include compensation, benefits, contracted services, and other headcount-related expenses associated with the creation and development of our products as well as enhancements and engineering changes to existing products and integration of acquired technologies.
2017 Compared to 2016
The increase was primarily due to a $16.5 million increase in compensation and benefit expenses associated with higher headcount, higher stock-based compensation expense primarily from the increased value of our annual periodic equity awards, and annual merit salary increases.
2016 Compared to 2015
The increase was primarily due to a $16.1 million increase in compensation and benefit expenses associated with higher headcount and a $1.5 million increase in expendable equipment and software license expenses.
General and administrative
| (Dollars in thousands) | % Change | |||||||||||||||||||
| 2017 | 2016 | 2015 | 2017 vs. 2016 | 2016 vs. 2015 | ||||||||||||||||
| General and administrative |
$ | 52,153 | $ | 45,951 | $ | 36,738 | 13 | % | 25 | % | ||||||||||
| As a percent of total revenue |
6 | % | 6 | % | 5 | % | ||||||||||||||
| General and administrative headcount, end of period |
425 | 378 | 353 | 12 | % | 7 | % | |||||||||||||
General and administrative expenses include compensation, benefits, and other headcount-related expenses associated with finance, legal, corporate governance, and other administrative headcount. They also include accounting, legal, and other professional consulting and administrative fees. The general and administrative headcount includes employees in human resources, information technology, and corporate services departments whose costs are allocated to our other functional departments.
32
Table of Contents
2017 Compared to 2016
The increase was primarily due to a $5.1 million increase in compensation and benefits due to higher stock-based compensation expense primarily from the increased value of our annual periodic equity awards and increased facilities costs due to our expansion in Poland and India.
2016 Compared to 2015
The increase was primarily due to a $4.9 million increase in compensation and benefits expenses associated with higher headcount, of which $2.2 million was due to higher stock-based compensation expense primarily from the increased value of our annual periodic equity awards. The increase was also due to the fact that 2016 did not include a $1.8 million benefit from the settlement of our indemnification claims against the former Antenna, Inc. shareholders and a $1.6 million benefit from the settlement of certain indirect tax liabilities, which reduced our general and administrative expense in 2015.
Stock-based compensation
We recognize stock-based compensation expense associated with equity awards in our consolidated statements of operations based on the fair value of these awards at the date of grant using the accelerated recognition method, while treating each vesting tranche as if it were an individual grant.
| (Dollars in thousands) | Year Ended December 31, | % Change | ||||||||||||||||||
| 2017 | 2016 | 2015 | 2017 vs. 2016 | 2016 vs. 2015 | ||||||||||||||||
| Cost of revenues |
$ | 14,573 | $ | 11,459 | $ | 8,772 | 27 | % | 31 | % | ||||||||||
| Selling and marketing |
15,720 | 12,464 | 8,911 | 26 | % | 40 | % | |||||||||||||
| Research and development |
13,618 | 10,043 | 8,116 | 36 | % | 24 | % | |||||||||||||
| General and administrative |
9,402 | 6,513 | 4,255 | 44 | % | 53 | % | |||||||||||||
| Acquisition-related |
— | 342 | — | (100 | )% | n/m | ||||||||||||||
|
|
|
|
|
|
|
|||||||||||||||
| Total stock-based compensation before tax |
$ | 53,313 | $ | 40,821 | $ | 30,054 | 31 | % | 36 | % | ||||||||||
|
|
|
|
|
|
|
|||||||||||||||
| Income tax benefit |
(12,113 | ) | (12,198 | ) | (8,098 | ) | (1 | )% | 51 | % | ||||||||||
The increases were primarily due to the increased value of our annual periodic equity awards granted in March 2017 and 2016. These awards generally have a five-year vesting schedule.
See Note 14 “Stock-Based Compensation” in Item 8 of this Annual Report for further information.
Amortization of intangibles
| (Dollars in thousands) | % Change | |||||||||||||||||||
| 2017 | 2016 | 2015 | 2017 vs. 2016 | 2016 vs. 2015 | ||||||||||||||||
| Cost of revenue |
$ | 5,103 | $ | 5,986 | $ | 5,392 | (15 | )% | 11 | % | ||||||||||
| Selling and marketing |
7,235 | 7,145 | 6,127 | 1 | % | 17 | % | |||||||||||||
| General and administrative |
— | 277 | 683 | (100 | )% | (59 | )% | |||||||||||||
|
|
|
|
|
|
|
|||||||||||||||
| $ | 12,338 | $ | 13,408 | $ | 12,202 | (8 | )% | 10 | % | |||||||||||
|
|
|
|
|
|
|
|||||||||||||||
2017 Compared to 2016
The decrease was primarily due to the full amortization of certain intangibles acquired through past acquisitions.
33
Table of Contents
2016 Compared to 2015
The increase was primarily due to the amortization associated with the $24.3 million of intangible assets acquired from OpenSpan in April 2016.
Non-operating income and expenses, net
| (Dollars in thousands) | Year Ended December 31, | % Change | ||||||||||||||||||
| 2017 | 2016 | 2015 | 2017 vs. 2016 | 2016 vs. 2015 | ||||||||||||||||
| Foreign currency transaction (loss)/gain |
$ | (900 | ) | $ | 2,247 | $ | (4,168 | ) | (140 | )% | (154 | )% | ||||||||
| Interest income, net |
731 | 776 | 1,056 | (6 | )% | (27 | )% | |||||||||||||
| Other expense, net |
(1,391 | ) | (5,580 | ) | (1,044 | ) | (75 | )% | 434 | % | ||||||||||
|
|
|
|
|
|
|
|||||||||||||||
| $ | (1,560 | ) | $ | (2,557 | ) | $ | (4,156 | ) | (39 | )% | (38 | )% | ||||||||
|
|
|
|
|
|
|
|||||||||||||||
In May 2017, we discontinued our forward contracts program; however, we continue to periodically evaluate our foreign exchange exposures and may re-initiate this program if deemed necessary. We have historically used foreign currency forward contracts (“forward contracts”) to hedge our exposure to fluctuations in foreign currency exchange rates associated with our foreign currency denominated cash, accounts receivable, and intercompany receivables and payables held primarily by our U.S. parent company and its United Kingdom (“U.K.”) subsidiary.
The total change in the fair value of our foreign currency forward contracts recorded in other expense, net, during 2017, 2016, and 2015 was a gain of $0.3 million, a loss of $5.6 million, and a loss of $1 million, respectively. The gain on forward contracts in 2017 was offset by $1.7 million in professional fees for capital advisory services.
Provision for income taxes
| (Dollars in thousands) | % Change | |||||||||||||||||||
| 2017 | 2016 | 2015 | 2017 vs. 2016 | 2016 vs. 2015 | ||||||||||||||||
| Provision for income taxes |
$ | 4,166 | $ | 8,216 | $ | 24,183 | (49 | )% | (66 | )% | ||||||||||
| Effective income tax rate |
11 | % | 23 | % | 40 | % | ||||||||||||||
The provision for income taxes represents current and future amounts owed for federal, state, and foreign taxes.
2017 Compared to 2016
The decrease in our effective income tax rate was primarily due to a $24.5 million increase in excess tax benefits on share-based payments recognized in the provision for income taxes, partially offset by an additional expense of $20.4 million recorded in 2017 to re-measure our deferred income taxes to the new U.S. statutory tax rate as a result of the Tax Reform Act.
We have estimated the impact of the Tax Reform Act as part of our 2017 income tax provision; however, the ultimate impact may differ from these provisional amounts, possibly materially, due to, among other things, additional analysis, changes in interpretations and assumptions the we have made, additional regulatory guidance that may be issued, and actions we may undertake as a result of the Tax Reform Act. The accounting is expected to be complete during 2018. See Note 15 “Income Taxes” in Item 8 of this Annual report for more information.
As of December 31, 2017, we had approximately $19.2 million of total unrecognized tax benefits, which would decrease our effective tax rate if recognized. Due to the expiration of the applicable statute of limitations, we expect that the change in the unrecognized benefits in the next twelve months will be approximately $0.5 million, which will reduce our effective tax rate if recognized.
34
Table of Contents
2016 Compared to 2015
The decrease in the effective income tax rate for 2016 compared to 2015 was primarily due to the impact of the adoption of ASU 2016-09, which decreased income tax expense by $6.7 million. The adoption of ASU 2016-09 significantly impacts both the timing and method of how the tax effects of share-based awards are recognized. ASU 2016-09 requires the income tax effects to be recognized in the provision for income taxes when the awards vest or are settled whereas previously such income tax benefits were recognized as part of additional paid-in capital and could not be recognized until they were realized through a reduction in income taxes payable.
As of December 31, 2016 and 2015, we had $22.7 million and $24 million, respectively, of total unrecognized tax benefits, which would decrease our effective tax rate if recognized.
LIQUIDITY AND CAPITAL RESOURCES
| Year Ended December 31, | ||||||||||||
| (in thousands) | 2017 | 2016 | 2015 | |||||||||
| Cash provided by (used in): |
||||||||||||
| Operating activities |
$ | 158,235 | $ | 39,874 | $ | 67,803 | ||||||
| Investing activities |
(14,759 | ) | (7,172 | ) | (44,452 | ) | ||||||
| Financing activities |
(54,229 | ) | (51,716 | ) | (40,659 | ) | ||||||
| Effect of exchange rate on cash |
2,438 | (3,418 | ) | (4,251 | ) | |||||||
|
|
|
|
|
|
|
|||||||
| Net increase (decrease) in cash and cash equivalents |
$ | 91,685 | $ | (22,432 | ) | $ | (21,559 | ) | ||||
|
|
|
|
|
|
|
|||||||
| As of December 31, | ||||||||||||
| (in thousands) | 2017 | 2016 | 2015 | |||||||||
| Held in US Entities |
$ | 136,444 | $ | 82,008 | $ | 165,625 | ||||||
| Held in Foreign Entities |
87,304 | 51,753 | 53,453 | |||||||||
|
|
|
|
|
|
|
|||||||
| Total cash, cash equivalents, and marketable securities |
$ | 223,748 | $ | 133,761 | $ | 219,078 | ||||||
|
|
|
|
|
|
|
|||||||
We believe that our current cash, cash equivalents, and cash flow from operations will be sufficient to fund our operations and our share repurchase program for at least the next 12 months.
If it became necessary to repatriate foreign funds, we may be required to pay U.S. state and local taxes as well as foreign taxes upon repatriation. Due to the complexity of the income tax laws and the effects of the Tax Reform Act, it is impracticable to estimate the amount of U.S state, U.S. local, and foreign tax we would have to pay. See “Risk Factors—If it became necessary to repatriate any of our foreign cash balances to the United States, we may be subject to increased income taxes, other restrictions, and limitations” in Item 1A of this Annual Report.
Cash provided by operating activities
The primary drivers during 2017 were net income of $32.9 million and $23.8 million from trade accounts receivable, largely due to increased cash collections and the timing of billings.
The primary driver during 2016 was net income of $27.0 million.
The primary drivers during 2015 were net income of $36.3 million and a $17.7 million increase in deferred revenue primarily resulting from the difference in timing of billings and revenue recognition.
35
Table of Contents
Future Cash Receipts from Committed License and Cloud Arrangements
As of December 31, 2017, none of the amounts shown in the table below had been billed and no revenue had been recognized.
The below amounts for 2018 and subsequent periods may not be recognized in the periods shown below as a result of the adoption of the new revenue recognition standard, ASC 606. See Note 2. ”Significant Accounting Polices” in Item 8 of this Annual Report for additional information.
| December 31, 2017 | ||||||||||||
| (in thousands) | Term and cloud contracts |
Perpetual contracts (1) | Total | |||||||||
| 2018 |
$ | 166,619 | $ | 46,195 | $ | 212,814 | ||||||
| 2019 |
158,428 | 14,630 | 173,058 | |||||||||
| 2020 |
110,588 | 1,979 | 112,567 | |||||||||
| 2021 |
57,890 | 372 | 58,262 | |||||||||
| 2022 and thereafter |
28,552 | — | 28,552 | |||||||||
|
|
|
|
|
|
|
|||||||
| Total |
$ | 522,077 | $ | 63,176 | $ | 585,253 | ||||||
|
|
|
|
|
|
|
|||||||
| (1) | These amounts are for perpetual licenses with extended payment terms and/or additional rights of use. |
Total contractual future cash receipts due from our existing license agreements was approximately $466 million as of December 31, 2016 and $356.4 million as of December 31, 2015.
Cash used in investing activities
During 2017, we purchased $27.7 million of investments, primarily marketable debt securities, and made investments of $13.7 million in property and equipment, partially offset by proceeds received from maturities of investments, including called investment securities of $27 million.
During 2016, we acquired OpenSpan for $48.8 million, net of cash acquired, and invested $19.1 million primarily in internally developed software and leasehold improvements at our corporate headquarters and our office in Hyderabad, India, partially offset by proceeds received from the sales of investments of $62.2 million.
During 2015, we purchased investments for $75.7 million, partially offset by the proceeds received from sales, maturities and called investments of $43.9 million. In 2015, we paid additional cash consideration of $1.6 million to the selling shareholders of companies acquired in 2014 based on the achievement of certain performance milestones. We also invested $11 million primarily in leasehold improvements for the build-out of our office in Hyderabad, India and purchases of computer equipment for our U.S. and India offices.
Cash used in financing activities
Net cash used in financing activities during 2017, 2016, and 2015 was primarily for repurchases of our common stock and the payment of our quarterly dividend. Since 2004, our Board of Directors has approved annual stock repurchase programs that have authorized the repurchase of up to $195 million of our common stock. On May 30, 2017, we announced that our Board of Directors extended the expiration date of the current stock repurchase program to June 30, 2018 (the “Current Program”).
As of December 31, 2017, $153.5 million had been repurchased, $34.9 million remained available for repurchase, and $6.4 million had expired. Purchases under these programs have been made on the open market.
36
Table of Contents
Common stock repurchases
The following table is a summary of our repurchase activity:
| Year Ended December 31, | ||||||||||||||||||||||||
| 2017 | 2016 | 2015 | ||||||||||||||||||||||
| (in thousands) | Shares | Amount | Shares | Amount | Shares | Amount | ||||||||||||||||||
| Net settlement of tax under stock-based compensation |
818 | $ | 41,825 | 572 | $ | 16,183 | 411 | $ | 9,776 | |||||||||||||||
| Share repurchase program (1) |
||||||||||||||||||||||||
| Repurchases paid |
96 | $ | 4,335 | 1,078 | $ | 27,028 | 944 | $ | 22,530 | |||||||||||||||
| Repurchases unsettled at period end |
3 | $ | 158 | — | $ | — | 8 | $ | 220 | |||||||||||||||
|
|
|
|
|
|
|
|
|
|
|
|
|
|||||||||||||
| Activity in Period |
917 | $ | 46,318 | 1,650 | $ | 43,211 | 1,363 | $ | 32,526 | |||||||||||||||
|
|
|
|
|
|
|
|
|
|
|
|
|
|||||||||||||
| (1) | Represents activity under our publicly announced share repurchase program. |
During 2017, 2016, and 2015, instead of receiving cash from the equity holders, we withheld shares with a value of $28.1 million, $18.1 million, and $11.9 million, respectively, for the exercise price of options. These amounts have been excluded from the table above.
Dividends
| (per share) | 2017 | 2016 | 2015 | |||||||||
| Dividends Declared |
$ | 0.12 | $ | 0.12 | $ | 0.12 | ||||||
For 2017, 2016, and 2015, we paid cash dividends of $9.3 million, $9.2 million, and $9.2 million, respectively. It is our current intention to pay a quarterly cash dividend of $0.03 per share, however, the Board of Directors may terminate or modify this dividend program at any time without prior notice.
Contractual obligations
As of December 31, 2017, we had purchase obligations for client support and sales and marketing programs, and payments under operating leases. Our lease arrangement for our office headquarters expires in 2023, subject to our option to extend for two additional five-year periods. We also lease space for our other offices under noncancellable operating leases that expire at various dates through 2022.
| Payments due by period | ||||||||||||||||||||||||
| (in thousands) | Total | 2018 | 2019-2020 | 2021-2022 | 2023 and thereafter |
Other | ||||||||||||||||||
| Purchase obligations (1) |
$ | 40,085 | $ | 17,085 | $ | 23,000 | $ | — | $ | — | $ | — | ||||||||||||
| Investment commitments (2) |
2,060 | 2,060 | — | — | — | — | ||||||||||||||||||
| Liability for uncertain tax positions (3) |
4,717 | — | — | — | — | 4,717 | ||||||||||||||||||
| Operating lease obligations (4) |
71,975 | 15,395 | 26,618 | 21,002 | 8,960 | — | ||||||||||||||||||
|
|
|
|
|
|
|
|
|
|
|
|
|
|||||||||||||
| Total |
$ | 118,837 | $ | 34,540 | $ | 49,618 | $ | 21,002 | $ | 8,960 | $ | 4,717 | ||||||||||||
|
|
|
|
|
|
|
|
|
|
|
|
|
|||||||||||||
| (1) | Represents the fixed or minimum amounts due under purchase obligations for client support and sales and marketing programs. |
| (2) | Represents the maximum funding that would be required under existing investment agreements with privately-held companies. |
| (3) | As of December 31, 2017, our recorded liability for uncertain tax positions was approximately $4.7 million. We are unable to reasonably estimate the timing of the cash outflow due to uncertainties in the timing of the effective settlement of tax positions. |
| (4) | Includes deferred rent of approximately $2.3 million included in accrued expenses and approximately $8.5 million in other long-term liabilities as of December 31, 2017 in the Consolidated Balance Sheet in Item 8 of this Annual Report. |
37
Table of Contents
CRITICAL ACCOUNTING ESTIMATES AND SIGNIFICANT JUDGMENTS
Management’s discussion and analysis of the financial condition and results of operations is based upon our consolidated financial statements, which have been prepared in accordance with accounting principles generally accepted in the U.S. and the rules and regulations of the SEC for annual financial reporting. The preparation of these financial statements requires us to make estimates and judgments that affect the reported amounts of assets, liabilities, revenues and expenses, and related disclosure of contingent assets and liabilities. We base our estimates and judgments on historical experience, knowledge of current conditions and beliefs of what could occur in the future given available information.
We believe that, of our significant accounting policies, which are described in Note 2, “Significant Accounting Policies,” in Item 8 of this Annual Report, the following accounting policies are most important to the portrayal of our financial condition and require the most subjective judgment. Accordingly, these are the policies we believe are the most critical to aid in fully understanding and evaluating our consolidated financial condition and results of operations. If actual results differ significantly from management’s estimates and projections, there could be a material effect on our financial statements.
Revenue recognition
Our revenue is derived primarily from software licenses and related maintenance fees, cloud arrangements, and consulting services. Our arrangements, whether involving licenses or cloud, generally also contain multiple other elements, including consulting services, training, and in the case of licenses, software maintenance services. See Note 2, “Significant Accounting Policies” in Item 8 of this Annual Report for our full revenue recognition accounting policy.
Software revenue recognition requires judgment, including whether a software arrangement includes multiple elements, and if so, whether VSOE of fair value exists for those elements. The amount of consideration allocated to undelivered elements is based on the VSOE of fair value for those elements and is recognized as those elements are delivered. Any remaining portion of the total arrangement fee is allocated to the software license—the first element delivered. Revenue is recognized for each element when all of the revenue recognition criteria have been met. Changes in the mix of the elements in a software arrangement, the ability to identify VSOE for those elements, the fair value of the respective elements, and changes to a product’s estimated life cycle could materially impact the amount of earned and unearned revenue.
Goodwill and Intangible Assets Impairment
Our goodwill and intangible assets result from our previous business acquisitions. Goodwill and intangible assets with indefinite useful lives are not amortized, but are tested for impairment at least annually or as circumstances indicate their value may no longer be recoverable. We do not carry any intangible assets with indefinite useful lives other than goodwill. We perform our annual goodwill impairment as of November 30th of each fiscal year. To assess if goodwill is impaired, we first perform a qualitative assessment to determine whether further impairment testing is necessary. If, as a result of the qualitative assessment, we consider it more-likely-than-not that the fair value of our reporting unit is less than its carrying amount, we perform a quantitative impairment test in a two-step process. For the first step, we screen for impairment, and if any possible impairment exists, we undertake a second step of measuring such impairment by performing discounted cash flow analysis. This analysis is based on cash flow assumptions that are consistent with the plans and estimates being used to manage our business. In the first step, we review the carrying amount of our reporting unit compared to the “fair value” of the reporting unit. An excess carrying value over fair value would indicate that goodwill may be impaired. If we determined that goodwill may be impaired, then we would compare the “implied fair value” to the carrying value of the goodwill. We periodically re-evaluate our business and have determined that we have one operating segment and one reporting unit. If our assumptions change in the future, we may be required to record impairment charges to reduce the carrying value of our goodwill. Changes in the
38
Table of Contents
valuation of goodwill could materially impact our operating results and financial position. We evaluate our intangible assets for impairment whenever events or changes in circumstances indicate that the carrying amount of such assets may not be recoverable. In evaluating potential impairment of these assets, we specifically consider whether any indicators of impairment are present, including, but not limited to:
| • | whether there has been a significant adverse change in the business climate that affects the value of an asset; |
| • | whether there has been a significant change in the extent or manner in which an asset is used; and |
| • | whether there is an expectation that the asset will be sold or disposed of before the end of its originally estimated useful life. |
If indicators of impairment are present, we compare the estimated undiscounted cash flows that the specific asset is expected to generate to its carrying value. The key assumptions of the cash flow model involve significant subjectivity. If such assets are considered to be impaired, the impairment recognized is measured by the amount by which the carrying amount of the asset exceeds its fair value.
As of December 31, 2017, we had $73.0 million of goodwill and $31.9 million of intangible assets. If our estimates or the related assumptions change in the future, we may be required to record impairment charges to reduce or eliminate the carrying value of these assets. Changes in the valuation of long-lived assets could materially impact our operating results and financial position. To date, there have been no impairments of goodwill or intangible assets.
Accounting for Income Taxes
Significant judgment is required in determining our provision for income taxes and income tax assets and liabilities, including evaluating uncertainties in the application of accounting principles and complex tax laws. Changes in tax laws or our interpretation of tax laws and the resolution of any tax audits could significantly impact our financial statements.
We regularly assess the need for a valuation allowance against our deferred tax assets. Future realization of our deferred tax assets ultimately depends on the existence of sufficient taxable income within the available carryback or carryforward periods. We record a valuation allowance to reduce our deferred tax assets to an amount we believe is more likely than not to be realized. Changes in our valuation allowance impact income tax expense in the period of adjustment. Our deferred tax valuation allowance requires significant judgment and uncertainties, including assumptions about future taxable income that are based on historical and projected information.
We assess our income tax positions and record tax benefits based upon management’s evaluation of the facts, circumstances, and information available at the reporting date. For those tax positions where it is more-likely-than-not that a tax benefit will be sustained, we record the largest amount of tax benefit with a greater than 50 percent likelihood of being realized upon ultimate settlement with a taxing authority having full knowledge of all relevant information. For those income tax positions where it is not more-likely-than-not that a tax benefit will be sustained, no tax benefit is recognized in the financial statements.
As a global company, we use significant judgment to calculate and provide for income taxes in each of the tax jurisdictions in which we operate. In the ordinary course of our business, there are transactions and calculations undertaken whose ultimate tax outcome cannot be certain. Some of these uncertainties arise as a consequence of transfer pricing for transactions with our subsidiaries and nexus and tax credit estimates. In addition, the calculation of acquired tax attributes and the associated limitations are complex. We estimate our exposure to unfavorable outcomes related to these uncertainties and estimate the probability of such outcomes.
Although we believe our estimates are reasonable, no assurance can be given that the final tax outcome will not be different from what is reflected in our historical income tax provisions, returns, and accruals. Such
39
Table of Contents
differences, or changes in estimates relating to potential differences, could have a material impact on our income tax provision and operating results in the period in which such a determination is made.
See Note 15 “Income Taxes” in Item 8 of this Annual Report for additional information.
NEW ACCOUNTING PRONOUNCEMENTS
New Accounting Pronouncements are detailed in Note 2, “Significant Accounting Policies,” in Item 8 of this Annual Report.
| ITEM 7A. | QUANTITATIVE AND QUALITATIVE DISCLOSURE ABOUT MARKET RISK |
Market risk represents the risk of loss that may affect us due to adverse changes in financial market prices and rates. Our market risk exposure is primarily related to fluctuations in foreign exchange rates and interest rates.
Foreign currency exposure
Our international sales are usually denominated in foreign currencies. However, the operating expenses of our foreign operations are also primarily denominated in foreign currencies, which partially offset our foreign currency exposure. A hypothetical 10% strengthening in the U.S. dollar against other currencies would result in an approximately 4%, 3%, and 3% decrease in revenues for 2017, 2016, and 2015, respectively, but would not have a material impact on our results of operations. See “Risk Factors—We are exposed to fluctuations in currency exchange rates that could negatively impact our financial results and cash flows” in Item 1A “Risk Factors” of this Annual Report.
We have experienced and expect to continue to experience fluctuations in our net income as a result of transaction gains or losses related to remeasuring monetary assets and liabilities that are denominated in currencies other than the functional currency of the entities in which they are recorded. We are primarily exposed to changes in foreign currency exchange rates associated with Australian dollar, Euro, and U.S. dollar denominated cash, accounts receivable, and intercompany receivables and payables held by our U.K. subsidiary, a British pound functional entity.
We recognized a net foreign currency transaction (loss)/gain of $(0.9) million, $2.2 million, and $(4.2) million for the 2017, 2016, and 2015, respectively. We have historically used, but do not currently use, forward contracts to manage our exposure to changes in foreign currency exchange rates. These forward contracts were not designated as hedging instruments, and changes in the fair value of these forward contracts are recognized in other expense, net, in the Consolidated Statements of Operations in Item 8 of this Annual Report.
If the British pound exchange rate in comparison to the Australian dollar, Euro, and U.S. dollar at December 31, 2017 and December 31, 2016 uniformly strengthened by 10%, the total impact to foreign currency transaction (loss)/gain and other expense would have decreased our results of operations by $1.6 million for both periods.
Interest rate exposure
As of December 31, 2017, we had $61.5 million of marketable debt securities, which consisted primarily of corporate and municipal bonds, with a weighted-average remaining maturity of 12 months. Due to the overall short-term remaining maturities of our marketable debt securities, our interest rate exposure is not significant. As of December 31, 2017, a 200 basis point increase in market interest rates would have reduced the fair value of our fixed rate marketable debt securities by approximately $1.2 million.
40
Table of Contents
| ITEM 8. | FINANCIAL STATEMENTS AND SUPPLEMENTARY DATA |
INDEX TO CONSOLIDATED FINANCIAL STATEMENTS
41
Table of Contents
REPORT OF INDEPENDENT REGISTERED PUBLIC ACCOUNTING FIRM
To the Stockholders and the Board of Directors of Pegasystems Inc.
Cambridge, Massachusetts
Opinions on the Financial Statements and Internal Control over Financial Reporting
We have audited the accompanying consolidated balance sheets of Pegasystems Inc. and subsidiaries (the “Company”) as of December 31, 2017 and 2016, the related consolidated statements of operations, comprehensive income, stockholders’ equity, and cash flows for each of the three years in the period ended December 31, 2017, and the related notes (collectively referred to as the “financial statements”). We also have audited the Company’s internal control over financial reporting as of December 31, 2017, based on criteria established in Internal Control—Integrated Framework (2013) issued by the Committee of Sponsoring Organizations of the Treadway Commission (COSO).
In our opinion, the financial statements referred to above present fairly, in all material respects, the financial position of the Company as of December 31, 2017 and 2016, and the results of its operations and its cash flows for each of the three years in the period ended December 31, 2017, in conformity with accounting principles generally accepted in the United States of America. Also, in our opinion, the Company maintained, in all material respects, effective internal control over financial reporting as of December 31, 2017, based on criteria established in Internal Control—Integrated Framework (2013) issued by COSO.
Basis for Opinions
The Company’s management is responsible for these financial statements, for maintaining effective internal control over financial reporting, and for its assessment of the effectiveness of internal control over financial reporting, included in the accompanying Management’s Report on and Changes in Internal Control over Financial Reporting. Our responsibility is to express an opinion on these financial statements and an opinion on the Company’s internal control over financial reporting based on our audits. We are a public accounting firm registered with the Public Company Accounting Oversight Board (United States) (PCAOB) and are required to be independent with respect to the Company in accordance with the U.S. federal securities laws and the applicable rules and regulations of the Securities and Exchange Commission and the PCAOB.
We conducted our audits in accordance with the standards of the PCAOB. Those standards require that we plan and perform the audits to obtain reasonable assurance about whether the financial statements are free of material misstatement, whether due to error or fraud, and whether effective internal control over financial reporting was maintained in all material respects. Our audits of the financial statements included performing procedures to assess the risks of material misstatement of the financial statements, whether due to error or fraud, and performing procedures to respond to those risks. Such procedures included examining, on a test basis, evidence regarding the amounts and disclosures in the financial statements.
Our audits also included evaluating the accounting principles used and significant estimates made by management, as well as evaluating the overall presentation of the financial statements. Our audit of internal control over financial reporting included obtaining an understanding of internal control over financial reporting, assessing the risk that a material weakness exists, and testing and evaluating the design and operating effectiveness of internal control based on the assessed risk. Our audits also included performing such other procedures as we considered necessary in the circumstances. We believe that our audits provide a reasonable basis for our opinions.
Definition and Limitations of Internal Control over Financial Reporting
A company’s internal control over financial reporting is a process designed to provide reasonable assurance regarding the reliability of financial reporting and the preparation of financial statements for external purposes in accordance with generally accepted accounting principles. A company’s internal control over financial reporting includes those policies and procedures that (1) pertain to the maintenance of records that, in reasonable detail, accurately and fairly reflect the transactions and dispositions of the assets of the company; (2) provide reasonable assurance that transactions are recorded as necessary to permit preparation of financial statements in accordance with generally accepted accounting principles, and that receipts and expenditures of the company are being made
42
Table of Contents
only in accordance with authorizations of management and directors of the company; and (3) provide reasonable assurance regarding prevention or timely detection of unauthorized acquisition, use, or disposition of the company’s assets that could have a material effect on the financial statements.
Because of its inherent limitations, internal control over financial reporting may not prevent or detect misstatements. Also, projections of any evaluation of effectiveness to future periods are subject to the risk that controls may become inadequate because of changes in conditions, or that the degree of compliance with the policies or procedures may deteriorate.
/s/ DELOITTE & TOUCHE LLP
Boston, Massachusetts
February 26, 2018
We have served as the Company’s auditor since 2000.
43
Table of Contents
CONSOLIDATED BALANCE SHEETS
(in thousands, except per share amounts)
| As of December 31, | ||||||||
| 2017 | 2016 | |||||||
| Assets |
||||||||
| Current assets: |
||||||||
| Cash and cash equivalents |
$ | 162,279 | $ | 70,594 | ||||
| Marketable securities |
61,469 | 63,167 | ||||||
|
|
|
|
|
|||||
| Total cash, cash equivalents, and marketable securities |
223,748 | 133,761 | ||||||
| Trade accounts receivable, net of allowance of $7,655 and $4,126 |
248,331 | 265,028 | ||||||
| Income taxes receivable |
25,662 | 14,155 | ||||||
| Other current assets |
14,559 | 12,188 | ||||||
|
|
|
|
|
|||||
| Total current assets |
512,300 | 425,132 | ||||||
| Property and equipment, net |
40,359 | 38,281 | ||||||
| Deferred income taxes |
57,127 | 69,898 | ||||||
| Other long-term assets |
6,969 | 3,990 | ||||||
| Intangible assets, net |
31,899 | 44,191 | ||||||
| Goodwill |
72,952 | 73,164 | ||||||
|
|
|
|
|
|||||
| Total assets |
$ | 721,606 | $ | 654,656 | ||||
|
|
|
|
|
|||||
| Liabilities and Stockholders’ Equity |
||||||||
| Current liabilities: |
||||||||
| Accounts payable |
$ | 17,370 | $ | 14,414 | ||||
| Accrued expenses |
45,508 | 36,751 | ||||||
| Accrued compensation and related expenses |
66,040 | 60,660 | ||||||
| Deferred revenue |
195,073 | 175,647 | ||||||
|
|
|
|
|
|||||
| Total current liabilities |
323,991 | 287,472 | ||||||
| Income taxes payable |
4,717 | 4,263 | ||||||
| Long-term Deferred revenue |
6,591 | 10,989 | ||||||
| Other long-term liabilities |
15,229 | 16,043 | ||||||
|
|
|
|
|
|||||
| Total liabilities |
350,528 | 318,767 | ||||||
|
|
|
|
|
|||||
| Commitments and contingencies (Note 12) |
||||||||
| Stockholders’ equity: |
||||||||
| Preferred stock, $0.01 par value, 1,000 shares authorized; no shares issued and outstanding |
— | — | ||||||
| Common stock, $0.01 par value, 200,000 shares authorized; 78,081 and 76,591 shares issued and outstanding at December 31, 2017 and 2016, respectively |
781 | 766 | ||||||
| Additional paid-in capital |
152,097 | 143,903 | ||||||
| Retained earnings |
221,926 | 198,315 | ||||||
| Accumulated other comprehensive loss: |
||||||||
| Net unrealized loss on available-for-sale marketable securities, net of tax |
(232 | ) | (169 | ) | ||||
| Foreign currency translation adjustments |
(3,494 | ) | (6,926 | ) | ||||
|
|
|
|
|
|||||
| Total stockholders’ equity |
371,078 | 335,889 | ||||||
|
|
|
|
|
|||||
| Total liabilities and stockholders’ equity |
$ | 721,606 | $ | 654,656 | ||||
|
|
|
|
|
|||||
See notes to consolidated financial statements.
44
Table of Contents
CONSOLIDATED STATEMENTS OF OPERATIONS
(in thousands, except per share amounts)
| Year Ended December 31, | ||||||||||||
| 2017 | 2016 | 2015 | ||||||||||
| Revenue: |
||||||||||||
| Software license |
$ | 288,334 | $ | 279,995 | $ | 275,588 | ||||||
| Maintenance |
244,347 | 220,336 | 202,802 | |||||||||
| Services |
307,901 | 249,935 | 204,305 | |||||||||
|
|
|
|
|
|
|
|||||||
| Total revenue |
840,582 | 750,266 | 682,695 | |||||||||
|
|
|
|
|
|
|
|||||||
| Cost of revenue: |
||||||||||||
| Software license |
5,085 | 4,943 | 4,125 | |||||||||
| Maintenance |
27,905 | 25,505 | 21,903 | |||||||||
| Services |
246,683 | 208,808 | 187,418 | |||||||||
|
|
|
|
|
|
|
|||||||
| Total cost of revenue |
279,673 | 239,256 | 213,446 | |||||||||
|
|
|
|
|
|
|
|||||||
| Gross profit |
560,909 | 511,010 | 469,249 | |||||||||
|
|
|
|
|
|
|
|||||||
| Operating expenses: |
||||||||||||
| Selling and marketing |
307,210 | 278,849 | 241,387 | |||||||||
| Research and development |
162,886 | 145,548 | 126,374 | |||||||||
| General and administrative |
52,153 | 45,951 | 36,738 | |||||||||
| Acquisition-related |
— | 2,903 | 89 | |||||||||
|
|
|
|
|
|
|
|||||||
| Total operating expenses |
522,249 | 473,251 | 404,588 | |||||||||
|
|
|
|
|
|
|
|||||||
| Income from operations |
38,660 | 37,759 | 64,661 | |||||||||
| Foreign currency transaction (loss)/gain |
(900 | ) | 2,247 | (4,168 | ) | |||||||
| Interest income, net |
731 | 776 | 1,056 | |||||||||
| Other expense, net |
(1,391 | ) | (5,580 | ) | (1,044 | ) | ||||||
|
|
|
|
|
|
|
|||||||
| Income before provision for income taxes |
37,100 | 35,202 | 60,505 | |||||||||
| Provision for income taxes |
4,166 | 8,216 | 24,183 | |||||||||
|
|
|
|
|
|
|
|||||||
| Net income |
$ | 32,934 | $ | 26,986 | $ | 36,322 | ||||||
|
|
|
|
|
|
|
|||||||
| Earnings per share: |
||||||||||||
| Basic |
$ | 0.43 | $ | 0.35 | $ | 0.47 | ||||||
|
|
|
|
|
|
|
|||||||
| Diluted |
$ | 0.40 | $ | 0.34 | $ | 0.46 | ||||||
|
|
|
|
|
|
|
|||||||
| Weighted-average number of common shares outstanding: |
||||||||||||
| Basic |
77,431 | 76,343 | 76,507 | |||||||||
| Diluted |
82,832 | 79,732 | 79,043 | |||||||||
See notes to consolidated financial statements.
45
Table of Contents
CONSOLIDATED STATEMENTS OF COMPREHENSIVE INCOME
(in thousands)
| Year Ended December 31, | ||||||||||||
| 2017 | 2016 | 2015 | ||||||||||
| Net income |
$ | 32,934 | $ | 26,986 | $ | 36,322 | ||||||
| Other comprehensive income/(loss), net of tax |
||||||||||||
| Unrealized loss on available-for-sale marketable securities, net of tax |
(63 | ) | (19 | ) | (85 | ) | ||||||
| Foreign currency translation adjustments |
3,432 | (3,569 | ) | (2,810 | ) | |||||||
|
|
|
|
|
|
|
|||||||
| Total other comprehensive income/(loss), net of tax |
3,369 | (3,588 | ) | (2,895 | ) | |||||||
|
|
|
|
|
|
|
|||||||
| Comprehensive income |
$ | 36,303 | $ | 23,398 | $ | 33,427 | ||||||
|
|
|
|
|
|
|
|||||||
See notes to consolidated financial statements.
46
Table of Contents
CONSOLIDATED STATEMENTS OF STOCKHOLDERS’ EQUITY
(in thousands, except per share amounts)
|
Common Stock |
Additional Paid-In Capital |
Retained Earnings |
Accumulated Other Comprehensive (Loss) Income |
Total Stockholders’ Equity |
||||||||||||||||||||
| Number of Shares |
Amount | |||||||||||||||||||||||
| Balance at January 1, 2015 |
76,357 | $ | 764 | $ | 141,495 | $ | 153,058 | $ | (612 | ) | $ | 294,705 | ||||||||||||
| Repurchase of common stock |
(952 | ) | (10 | ) | (22,740 | ) | — | — | (22,750 | ) | ||||||||||||||
| Issuance of common stock for share-based compensation plans |
1,059 | 11 | (9,201 | ) | — | — | (9,190 | ) | ||||||||||||||||
| Issuance of common stock under Employee Stock Purchase Plan |
24 | — | 550 | — | — | 550 | ||||||||||||||||||
| Stock-based compensation expense |
— | — | 30,078 | — | — | 30,078 | ||||||||||||||||||
| Tax benefit from exercise or vesting of equity awards, net of deferred tax asset deficiencies of $105 |
— | — | 5,236 | — | — | 5,236 | ||||||||||||||||||
| Cash dividends declared ($0.12 per share) |
— | — | — | (9,197 | ) | — | (9,197 | ) | ||||||||||||||||
| Other comprehensive loss |
— | — | — | — | (2,895 | ) | (2,895 | ) | ||||||||||||||||
| Net income |
— | — | — | 36,322 | — | 36,322 | ||||||||||||||||||
|
|
|
|
|
|
|
|
|
|
|
|
|
|||||||||||||
| December 31, 2015 |
76,488 | $ | 765 | $ | 145,418 | $ | 180,183 | $ | (3,507 | ) | $ | 322,859 | ||||||||||||
|
|
|
|
|
|
|
|
|
|
|
|
|
|||||||||||||
| Cumulative-effect adjustment from adoption of ASU 2016-09 |
— | — | — | 321 | — | 321 | ||||||||||||||||||
| Repurchase of common stock |
(1,078 | ) | (11 | ) | (27,017 | ) | — | — | (27,028 | ) | ||||||||||||||
| Issuance of common stock for share-based compensation plans |
1,161 | 12 | (15,868 | ) | — | — | (15,856 | ) | ||||||||||||||||
| Issuance of common stock under Employee Stock Purchase Plan |
20 | — | 562 | — | — | 562 | ||||||||||||||||||
| Stock-based compensation expense |
— | — | 40,808 | — | — | 40,808 | ||||||||||||||||||
| Cash dividends declared ($0.12 per share) |
— | — | — | (9,175 | ) | — | (9,175 | ) | ||||||||||||||||
| Other comprehensive loss |
— | — | — | — | (3,588 | ) | (3,588 | ) | ||||||||||||||||
| Net income |
— | — | — | 26,986 | — | 26,986 | ||||||||||||||||||
|
|
|
|
|
|
|
|
|
|
|
|
|
|||||||||||||
| December 31, 2016 |
76,591 | $ | 766 | $ | 143,903 | $ | 198,315 | $ | (7,095 | ) | $ | 335,889 | ||||||||||||
|
|
|
|
|
|
|
|
|
|
|
|
|
|||||||||||||
| Repurchase of common stock |
(99 | ) | — | (4,493 | ) | — | — | (4,493 | ) | |||||||||||||||
| Issuance of common stock for share-based compensation plans |
1,568 | 15 | (41,642 | ) | — | — | (41,627 | ) | ||||||||||||||||
| Issuance of common stock under Employee Stock Purchase Plan |
21 | — | 1,009 | — | — | 1,009 | ||||||||||||||||||
| Stock-based compensation expense |
— | — | 53,320 | — | — | 53,320 | ||||||||||||||||||
| Cash dividends declared ($0.12 per share) |
— | — | — | (9,323 | ) | — | (9,323 | ) | ||||||||||||||||
| Other comprehensive income |
— | — | — | — | 3,369 | 3,369 | ||||||||||||||||||
| Net income |
— | — | — | 32,934 | — | 32,934 | ||||||||||||||||||
|
|
|
|
|
|
|
|
|
|
|
|
|
|||||||||||||
| December 31, 2017 |
78,081 | $ | 781 | $ | 152,097 | $ | 221,926 | $ | (3,726 | ) | $ | 371,078 | ||||||||||||
|
|
|
|
|
|
|
|
|
|
|
|
|
|||||||||||||
See notes to consolidated financial statements.
47
Table of Contents
CONSOLIDATED STATEMENTS OF CASH FLOWS
(in thousands)
| Year Ended December 31, | ||||||||||||
| 2017 | 2016 | 2015 | ||||||||||
| Operating activities: |
||||||||||||
| Net income |
$ | 32,934 | $ | 26,986 | $ | 36,322 | ||||||
| Adjustment to reconcile net income to cash provided by operating activities: |
||||||||||||
| Deferred income taxes |
13,795 | (5,810 | ) | (2,099 | ) | |||||||
| Depreciation and amortization |
24,713 | 24,137 | 23,093 | |||||||||
| Stock-based compensation expense |
53,313 | 40,821 | 30,054 | |||||||||
| Foreign currency transaction loss (gain) |
900 | (2,247 | ) | 4,168 | ||||||||
| Amortization of investments |
1,381 | 1,862 | 2,238 | |||||||||
| Other non-cash |
(1,383 | ) | (1,382 | ) | 822 | |||||||
| Change in operating assets and liabilities: |
||||||||||||
| Trade accounts receivable |
23,814 | (56,730 | ) | (62,235 | ) | |||||||
| Income taxes receivable and other current assets |
(13,393 | ) | (10,818 | ) | 3,223 | |||||||
| Accounts payable and accrued expenses |
14,473 | 1,531 | 16,572 | |||||||||
| Deferred revenue |
8,363 | 21,271 | 17,668 | |||||||||
| Other long-term assets and liabilities |
(675 | ) | 253 | (2,023 | ) | |||||||
|
|
|
|
|
|
|
|||||||
| Cash provided by operating activities |
158,235 | 39,874 | 67,803 | |||||||||
|
|
|
|
|
|
|
|||||||
| Investing activities: |
||||||||||||
| Purchases of investments |
(27,718 | ) | (23,969 | ) | (75,702 | ) | ||||||
| Proceeds from maturities and called investments |
26,997 | 22,788 | 42,026 | |||||||||
| Sales of investments |
— | 62,210 | 1,915 | |||||||||
| Payments for acquisitions, net of cash acquired |
(297 | ) | (49,113 | ) | (1,671 | ) | ||||||
| Investment in property and equipment |
(13,741 | ) | (19,088 | ) | (11,020 | ) | ||||||
|
|
|
|
|
|
|
|||||||
| Cash used in investing activities |
(14,759 | ) | (7,172 | ) | (44,452 | ) | ||||||
|
|
|
|
|
|
|
|||||||
| Financing activities: |
||||||||||||
| Dividend payments to shareholders |
(9,277 | ) | (9,174 | ) | (9,194 | ) | ||||||
| Common stock repurchases for tax withholdings for net settlement of equity awards |
(40,617 | ) | (15,294 | ) | (8,640 | ) | ||||||
| Common stock repurchases under share repurchase program |
(4,335 | ) | (27,248 | ) | (22,825 | ) | ||||||
|
|
|
|
|
|
|
|||||||
| Cash used in financing activities |
(54,229 | ) | (51,716 | ) | (40,659 | ) | ||||||
|
|
|
|
|
|
|
|||||||
| Effect of exchange rates on cash and cash equivalents |
2,438 | (3,418 | ) | (4,251 | ) | |||||||
|
|
|
|
|
|
|
|||||||
| Net increase/(decrease) in cash and cash equivalents |
91,685 | (22,432 | ) | (21,559 | ) | |||||||
| Cash and cash equivalents, beginning of period |
70,594 | 93,026 | 114,585 | |||||||||
|
|
|
|
|
|
|
|||||||
| Cash and cash equivalents, end of period |
$ | 162,279 | $ | 70,594 | $ | 93,026 | ||||||
|
|
|
|
|
|
|
|||||||
| Supplemental disclosures: |
||||||||||||
| Income taxes (refunded)/paid |
$ | (2,322 | ) | $ | 28,844 | $ | 30,215 | |||||
| Non-cash investing and financing activity: |
||||||||||||
| Dividends payable |
$ | 2,344 | $ | 2,298 | $ | 2,297 | ||||||
See notes to consolidated financial statements.
48
Table of Contents
PEGASYSTEMS INC.
NOTES TO CONSOLIDATED FINANCIAL STATEMENTS
1. BASIS OF PRESENTATION
Business
The Company develops, markets, licenses, and supports software applications for marketing, sales automation, customer service, and operations, in addition to the Pega Platform for clients that wish to build and extend their own applications. The Company provides implementation, consulting, training, technical support, and hosting services to facilitate the use of its software.
Management estimates and reporting
The preparation of financial statements in conformity with accounting principles generally accepted in the United States of America (“U.S.”) requires management to make estimates and judgments that affect the reported amounts of assets and liabilities and disclosure of contingent assets and liabilities at the date of the financial statements and the reported amounts of revenues and expenses during the periods presented. Actual results could differ from those estimates. Accounts with reported amounts based on significant estimates and judgments include, but are not limited to, revenue, deferred revenue, deferred income taxes, income taxes payable, intangible assets, and goodwill.
Principles of consolidation
The Company’s consolidated financial statements reflect Pegasystems Inc. and subsidiaries in which the Company holds a controlling financial interest.
2. SIGNIFICANT ACCOUNTING POLICIES
Revenue recognition
The Company’s revenue is derived primarily from software licenses, cloud arrangements, maintenance fees related to the Company’s software licenses, and consulting services. The Company’s license arrangements, whether involving a perpetual license or a term license, generally also contain multiple elements, including consulting services, training, and software maintenance services.
Software revenue recognition requires judgment, including whether a software arrangement includes multiple elements, and if so, whether vendor-specific objective evidence (“VSOE”) of fair value exists for those elements. The amount of arrangement consideration allocated to undelivered elements is based on the VSOE of fair value for those elements and recognized as those elements are delivered. Any remaining portion of the total arrangement fee is allocated to the software license—the first delivered element. Revenue is recognized for each element when all of the revenue recognition criteria have been met. Revenue is recognized net of any taxes collected from clients and subsequently remitted to governmental authorities.
Changes in the mix of the elements in a software arrangement, the ability to identify VSOE for those elements, the fair value of the respective elements, and changes to a product’s estimated life cycle could materially impact the amount of earned and unearned revenue.
Before the Company can recognize revenue, the following four basic criteria must be met:
| • | Persuasive evidence of an arrangement—As evidence of the existence of an arrangement, the Company uses a contract or purchase order signed by the client and the Company for software, including cloud, and maintenance, and a statement of work for consulting services. In the event the client is a reseller, the Company ensures a binding agreement exists between the reseller and end user of the software. |
49
Table of Contents
| • | Delivery of product and services—The Company delivers its software electronically and/or ships it via disc media. Services are considered delivered as the work is performed or, in the case of maintenance, over the contractual service period. |
| • | Fee is fixed or determinable—The Company assesses whether a fee is fixed or determinable at the onset of the arrangement. In addition, the Company assesses whether contract modifications to an existing arrangement constitute a concession or whether extended payment terms exist. The Company’s agreements do not include a right of return. |
| • | Collection of fee is probable—The Company assesses the probability of collecting from each client at the onset of the arrangement based on a number of factors, including the client’s payment history, its current creditworthiness, economic conditions in the client’s industry and geographic location, and general economic conditions. If, in the Company’s judgment, collection of a fee is not probable, revenue is recognized as cash is collected, provided all other conditions for revenue recognition have been met. |
Software license revenues
Perpetual software license fees are recognized as revenue when the software is delivered, any acceptance required by the contract that is not perfunctory is obtained, no significant obligations or contingencies exist related to the software, all other undelivered elements in a multiple element arrangement possess VSOE, and all other revenue recognition criteria are met.
Term software license fees are usually payable on a monthly, quarterly, or annual basis under license agreements that typically have a three to five-year term and may be renewed for additional terms at the client’s option. The Company recognizes term license revenue over the term of the agreement as payments become due or earlier if prepaid, provided all other criteria for revenue recognition have been met.
Maintenance revenues
First-year maintenance typically is sold with the related software license and renewed on an annual basis thereafter. Maintenance revenue is deferred and recognized ratably over the term of the support period, which is generally one year and subject to annual renewals. Perpetual software maintenance obligations are based on separately stated renewal rates in the arrangement that are substantive and therefore represent VSOE of fair value. Term license arrangements include separately stated maintenance fees and the Company uses stand-alone sales to determine VSOE of fair value.
Services revenues
The Company’s services revenue is comprised of fees for consulting services including software implementation, training, reimbursable expenses, and for sales of its Pega Cloud as-a-platform offering (“Pega Cloud”), which includes the Pega Cloud Dev/Test environment and the Pega Cloud Production environment. Consulting services may be provided on a “stand-alone” basis or bundled with a license and software maintenance services.
Revenue from training services and consulting services under time and materials contracts is recognized as services are performed. The Company has VSOE of fair value for its training services and consulting services under time and materials contracts in the Americas, Europe, and certain regions of Asia.
Consulting services may sometimes be provided on a fixed-price basis. The Company does not have VSOE of fair value for fixed-price services or time and materials services in certain geographical regions. When these services are part of a multiple element arrangement, and the services are not essential to the functionality of the software, and when services, including maintenance, are the only undelivered element, the Company recognizes
50
Table of Contents
the revenue from the total arrangement ratably over the longer of the software maintenance period or the service period. Revenue from fixed-price services that are not bundled with a software license is generally recognized ratably over the service period, which is typically less than four months.
Revenue from stand-alone sales of the Pega Cloud Dev/Test environment is recognized as services are performed because the Company has VSOE of fair value.
Revenue from stand-alone sales of the Pega Cloud Production environment is recognized ratably over the term of the service. When implementation services are sold together with the Company’s Pega Cloud offering and these services have stand-alone value to the client, the Company accounts for these services separately from this offering. Stand-alone value is established through the client’s ability to buy these services from many trained partner system integrators and from transactions sold independently from the sale of Pega Cloud. Since these multiple-element arrangements are not software license sales, the Company applies a selling price hierarchy to determine the fair value of each element in the arrangement. Under the selling price hierarchy, each element’s fair value is determined based on its VSOE, if available. If VSOE does not exist, third-party evidence of fair value (“TPE”) will be considered, and estimated selling price (“ESP”) will be used if neither VSOE nor TPE is available. The Company generally does not have VSOE of its Pega Cloud offering and is not able to determine TPE as its sales strategy is customized to the needs of its clients and the Company’s products and services are dissimilar to comparable products or services in the marketplace. In determining ESP, the Company applies significant judgment as it weighs a variety of factors, based on the facts and circumstances of the arrangement. The Company typically arrives at an ESP for a service without VSOE or TPE by considering company-specific factors such as geographies, competitive landscape, and pricing practices used to establish bundled pricing and discounting.
Deferred revenue
Deferred software license revenue typically results from client billings for which all of the criteria to recognize revenue have not been met. Deferred maintenance revenue represents software license updates and product support contracts that are typically billed in advance and are recognized ratably over the support periods. Deferred services revenue represents advanced billings for consulting, hosting, and training services that are recognized as the services are performed.
Fair value of financial instruments
The principal financial instruments held by the Company consist of cash equivalents, marketable securities, derivative instruments, accounts receivable, and accounts payable. See Note 3 “Marketable Securities”, Note 4 “Derivative Instruments”, and Note 5 “Fair Value Measurements” for further discussion of financial instruments that are carried at fair value on a recurring basis.
Derivative instruments
The Company has in the past used, but does not currently use, foreign currency forward contracts (“forward contracts”) to manage its exposures to changes in foreign currency exchange rates associated with its foreign currency denominated accounts receivable, intercompany receivable and payables, and cash. See Note 4 “Derivative Instruments” for further discussion.
Property and equipment
Property and equipment are recorded at cost. Depreciation and amortization are computed using the straight-line method over the estimated useful lives of the assets, which are three years for computer equipment and five years for furniture and fixtures. Leasehold improvements are amortized over the lesser of the term of the lease or the useful life of the asset. Repairs and maintenance costs are expensed as incurred.
51
Table of Contents
Internal-use software
The Company capitalizes and amortizes certain direct costs associated with computer software developed or purchased for internal use incurred during the application development stage. Costs related to preliminary project activities and post implementation activities are expensed as incurred. The Company amortizes capitalized software costs generally over three to five years commencing on the date the software is placed into service.
During 2016, the Company placed into service computer software developed for internal use of $11.3 million, of which $1.1 million was capitalized in 2015 and $10.2 million was capitalized in 2016.
Goodwill
Goodwill represents the residual purchase price paid in a business combination after the fair value of all identified assets and liabilities have been recorded. Goodwill is not amortized. The Company operates as a single reporting unit. The Company performed its qualitative assessment as of November 30, 2017, 2016, and 2015, and concluded it was not more likely than not that the fair value of its reporting unit was less than its carrying value.
Intangible and long-lived assets
All of the Company’s intangible assets are amortized using the straight-line method over their estimated useful life. The Company evaluates its long-lived tangible and intangible assets for impairment whenever events or changes in circumstances indicate that the carrying amount of such assets may not be recoverable. Impairment is assessed by comparing the undiscounted cash flows expected to be generated by the intangible asset to its carrying value. If impairment exists, the Company calculates the impairment by comparing the carrying value of the intangible asset to its fair value as determined by discounted expected cash flows. The Company did not record any impairments in 2017, 2016, or 2015.
Business combinations
The Company uses its best estimates and assumptions to accurately assign fair value to the tangible and intangible assets acquired and liabilities assumed at the acquisition date. The Company’s estimates are inherently uncertain and subject to refinement. During the measurement period, which may be up to one year from the acquisition date, the Company may record adjustments to the fair value of these tangible and intangible assets acquired and liabilities assumed, with the corresponding offset to goodwill. In addition, uncertain tax positions and tax-related valuation allowances are initially established in connection with a business combination as of the acquisition date. The Company continues to collect information and reevaluates these estimates and assumptions quarterly and records any adjustments to the Company’s preliminary estimates to goodwill provided that the Company is within the measurement period. Upon the conclusion of the measurement period or final determination of the fair value of assets acquired or liabilities assumed, whichever comes first, any subsequent adjustments are recorded to the Company’s consolidated statements of operations.
Research and development and software development costs
Research and development costs are expensed as incurred. Capitalization of computer software developed for resale begins upon the establishment of technological feasibility, generally demonstrated by a working model or an operative version of the computer software product. Such costs have not been material to date as technological feasibility is established within a short time frame from the software’s general availability and, as a result, no costs were capitalized in 2017, 2016, or 2015.
Stock-based compensation
The Company recognizes stock-based compensation expense associated with equity awards based on the fair value of these awards at the grant date. Stock-based compensation is recognized over the requisite service
52
Table of Contents
period, which is generally the vesting period of the equity award, and is adjusted each period for anticipated forfeitures. See Note 14 “Stock-based Compensation” for discussion of the Company’s key assumptions included in determining the fair value of its equity awards at the grant date.
Foreign currency translation
The translation of assets and liabilities for the Company’s subsidiaries with functional currencies other than the U.S. Dollar are made at period-end exchange rates. Revenue and expense accounts are translated at the average exchange rates during the period transactions occurred. The resulting translation adjustments are reflected in accumulated other comprehensive income. Realized and unrealized exchange gains or losses from transactions and remeasurement adjustments are reflected in foreign currency transaction loss in the accompanying consolidated statements of operations.
Accounting for income taxes
The Company uses the asset and liability method of accounting for income taxes. Under this method, deferred tax assets and liabilities are determined based on temporary differences between the financial statement and tax basis of assets and liabilities using enacted tax rates in effect for the year in which the differences are expected to reverse. The Company regularly assesses the need for a valuation allowance against its deferred tax assets. Future realization of the Company’s deferred tax assets ultimately depends on the existence of sufficient taxable income within the available carryback or carryforward periods. Sources of taxable income include taxable income in prior carryback years, future reversals of existing taxable temporary differences, tax planning strategies, and future taxable income. The Company records a valuation allowance to reduce its deferred tax assets to an amount it believes is more-likely-than-not to be realized. Changes in the valuation allowance impacts income tax expense in the period of adjustment. The Company’s deferred tax valuation allowance requires significant judgment and uncertainties, including assumptions about future taxable income that are based on historical and projected information. The Company recognizes excess tax benefits when they are realized, through a reduction in income taxes payable using the with-and-without stock option method.
The Company assesses its income tax positions and records tax benefits based upon management’s evaluation of the facts, circumstances, and information available at the reporting date. For those tax positions where it is more-likely-than-not that a tax benefit will be sustained, the Company records the largest amount of tax benefit with a greater than 50 percent likelihood of being realized upon ultimate settlement with a taxing authority having full knowledge of all relevant information. For those income tax positions where it is not more-likely-than-not that a tax benefit will be sustained, no tax benefit is recognized in the financial statements. The Company classifies liabilities for uncertain tax positions as non-current liabilities unless the uncertainty is expected to be resolved within one year. The Company classifies interest and penalties on uncertain tax positions as income tax expense.
As a global company, the Company uses significant judgment to calculate and provide for income taxes in each of the tax jurisdictions in which it operates. In the ordinary course of the Company’s business, there are transactions and calculations undertaken whose ultimate tax outcome cannot be certain. Some of these uncertainties arise as a consequence of transfer pricing for transactions with the Company’s subsidiaries and nexus and tax credit estimates. In addition, the calculation of acquired tax attributes and the associated limitations are complex. See Note 15 “Income Taxes” for further information.
Advertising expense
Advertising costs are expensed as incurred. Advertising costs were $6.1 million, $8.9 million, and $9.8 million during 2017, 2016, and 2015, respectively.
53
Table of Contents
New accounting pronouncements
Stock-Based Compensation
In May 2017, the Financial Accounting Standards Board (“FASB”) issued Accounting Standards Update (“ASU”) No. 2017-09 “Stock Compensation (Topic 718), Scope of Modification Accounting” to clarify when to account for a change to the terms or conditions of a share-based payment award as a modification. Under the new guidance, modification accounting is required only if the fair value, the vesting conditions, or the classification of the award (as equity or liability) changes as a result of the change in terms or conditions. The effective date for the Company will be January 1, 2018. The Company does not expect the adoption of this standard to have a material effect on its financial position or results of operations.
Financial Instruments
In June 2016, the FASB issued ASU No. 2016-13, “Financial Instruments—Credit Losses (Topic 326): Measurement of Credit Losses on Financial Instruments,” which requires measurement and recognition of expected credit losses for financial assets measured at amortized cost, including trade accounts receivable, upon initial recognition of that financial asset using a forward-looking expected loss model, rather than an incurred loss model for credit losses. Credit losses relating to available-for-sale debt securities should be recorded through an allowance for credit losses when the fair value is below the amortized cost of the asset, removing the concept of “other-than-temporary” impairments. The effective date for the Company will be January 1, 2020, with early adoption permitted. The Company is currently evaluating the effect this ASU will have on its consolidated financial statements and related disclosures.
Leases
In February 2016, the FASB issued ASU No. 2016-02, “Leases (Topic 842),” which requires lessees to record most leases on their balance sheets, recognizing a lease liability for the obligation to make lease payments and a right-of-use asset for the right to use the underlying asset for the lease term. The effective date for the Company will be January 1, 2019, with early adoption permitted. The Company expects that most of its operating lease commitments will be subject to this ASU and recognized as operating lease liabilities and right-of-use assets upon adoption with no material impact to its results of operations and cash flows.
Revenue
In May 2014, the FASB issued ASU No. 2014-09, “Revenue from Contracts with Customers (Topic 606)”. This ASU amends the guidance for revenue recognition, creating the new ASC Topic 606 (“ASC 606”). ASC 606 requires entities to apportion consideration from contracts to performance obligations on a relative standalone selling price basis, based on a five-step model. Under ASC 606, revenue is recognized when a client obtains control of a promised good or service and is recognized in an amount that reflects the consideration which the entity expects to receive in exchange for the good or service. In addition, ASC 606 requires disclosure of the nature, amount, timing, and uncertainty of revenue and cash flows arising from contracts with clients.
The Company has elected the full retrospective adoption model, effective January 1, 2018. The Company’s quarterly results beginning with the quarter ending March 31, 2018 and comparative prior periods will be compliant with ASC 606. The Company’s Annual Report on Form 10-K for the year ended December 31, 2018 will be the Company’s first Annual Report that will be issued in compliance with ASC 606.
The Company has substantially completed the implementation of ASC 606 and has identified the necessary changes to its policies, processes, systems, and controls. However, due to the complex nature of the Company’s arrangements and recent updates to interpretive guidance, which were made as recently as the fall of 2017, the Company has not yet completed all of its internal control procedures.
54
Table of Contents
Based upon the work performed to date, the Company expects to record a cumulative-effect adjustment as of December 31, 2015 to increase retained earnings by approximately $205 million which includes a $30 million increase in retained earnings due to deferred commission expense and a $97 million decrease in retained earnings due to the resulting tax impact. We expect to fully disclose the impacts of the new standard in connection with our 10Q filing for the first quarter of 2018.
The Company expects the following impacts upon adoption of the standard:
| • | Currently, the Company recognizes revenue from term licenses and perpetual licenses with extended payment terms over the term of the agreement as payments become due or earlier if prepaid, provided all other criteria for revenue recognition have been met, and any corresponding maintenance over the term of the agreement. The adoption of ASC 606 will result in revenue for performance obligations being recognized as they are satisfied, which will typically occur upon delivery. Therefore, revenue from the term and perpetual license performance obligations with extended payment terms is recognized when control is transferred to the client. Any unrecognized license revenue from these arrangements, included in deferred revenue at December 31, 2015, will not be recognized in revenue in future periods but as a cumulative adjustment to retained earnings. Further, term license revenue from new arrangements executed in 2016 and 2017 will be recognized in full in the year that control of the license is transferred to the client instead of over the term of the agreement. Revenue from the maintenance performance obligations is expected to be recognized on a straight-line basis over the contractual term, consistent with the previous treatment. Due to the revenue from term and perpetual licenses with extended payment terms being recognized prior to amounts being billed to the client, the Company expects to recognize a material unbilled receivable on the balance sheet. |
| • | Currently, the Company allocates revenue to licenses under the residual method when it has Vendor Specific Objective Evidence (“VSOE”) for the remaining undelivered elements, which allocates any future credits or significant discounts entirely to the license. The adoption of ASC 606 will result in future credits, significant discounts, and material rights under ASC 606, generally allocated to all performance obligations based upon their relative selling price. Under ASC 606, additional license revenue from the reallocation of such arrangement considerations will be recognized when control is transferred to the client, which is generally upon delivery of the license. |
| • | Currently, the Company does not have VSOE, in software bundled arrangements, for fixed price services, time and materials services in certain geographical areas, and unspecified future products, which results in revenue being deferred in such instances until such time as VSOE exists for all undelivered elements or recognized ratably over the longest performance period. The adoption of ASC 606 eliminates the requirement for VSOE and replaces it with the concept of a stand-alone selling price. Once the transaction price is allocated to each of the performance obligations based on their relative stand-alone selling prices, the Company can recognize revenue as the performance obligations are delivered, either at a point in time or over time. Under ASC 606, license revenue will be recognized when control is transferred to the client, consulting revenue will be recognized over time based on input measures that reflect the Company’s performance on the contract. This will result in the acceleration of consulting revenue when compared to the current practice of ratable recognition for consulting when there is a lack of VSOE. |
| • | Sales commissions and other third party acquisition costs resulting directly from securing contracts with clients are currently expensed when incurred. ASC 340-40 “Accounting for Other Assets and Deferred Costs” will require these costs to be recognized as an asset when incurred and to be expensed over the associated contract term or estimated client life depending on the nature of the underlying contract. The Company expects this change to impact its commissions related to multi-year cloud offerings and term and perpetual licenses with additional rights of use that extend beyond one year which will require the allocation of a portion of the commission paid for term and perpetual licenses to future maintenance obligations when the commission rates within each arrangement are not commensurate. This change will impact retained earnings as of December 31, 2015 but will not have a significant impact in future periods. |
55
Table of Contents
| • | ASC 606 provides additional accounting guidance for contract modifications whereby changes must be accounted for either as a retrospective change (creating either a catch up or deferral of past revenues), prospectively with a reallocation of revenues amongst identified performance obligations, or prospectively as separate contracts which will not require any reallocation. This may result in a difference in the timing of the recognition of revenue as compared to how contract modifications are recognized currently. |
| • | There will be a corresponding effect on tax liabilities in relation to all of the above impacts. |
3. MARKETABLE SECURITIES
| (in thousands) | December 31, 2017 | |||||||||||||||
| Amortized Cost |
Unrealized Gains |
Unrealized Losses |
Fair Value | |||||||||||||
| Municipal bonds |
$ | 32,996 | $ | — | $ | (148 | ) | $ | 32,848 | |||||||
| Corporate bonds |
28,757 | 1 | (137 | ) | 28,621 | |||||||||||
|
|
|
|
|
|
|
|
|
|||||||||
| $ | 61,753 | $ | 1 | $ | (285 | ) | $ | 61,469 | ||||||||
|
|
|
|
|
|
|
|
|
|||||||||
| (in thousands) | December 31, 2016 | |||||||||||||||
| Amortized Cost |
Unrealized Gains |
Unrealized Losses |
Fair Value | |||||||||||||
| Municipal bonds |
$ | 36,746 | $ | — | $ | (139 | ) | $ | 36,607 | |||||||
| Corporate bonds |
26,610 | 1 | (51 | ) | 26,560 | |||||||||||
|
|
|
|
|
|
|
|
|
|||||||||
| $ | 63,356 | $ | 1 | $ | (190 | ) | $ | 63,167 | ||||||||
|
|
|
|
|
|
|
|
|
|||||||||
The Company considers debt securities with maturities of three months or less from the purchase date to be cash equivalents. Interest is recorded when earned. All of the Company’s investments are classified as available-for-sale and are carried at fair value. Unrealized gains and losses considered to be temporary in nature are recorded as a component of accumulated other comprehensive loss, net of related income taxes. The Company reviews all investments for reductions in fair value that are other-than-temporary. When such reductions occur, the cost of the investment is adjusted to fair value through recording a loss on investments in the consolidated statements of operations. Gains and losses on investments are calculated on the basis of specific identification.
As of December 31, 2017, the Company did not hold any investments with unrealized losses considered to be other than temporary.
As of December 31, 2017, remaining maturities of marketable debt securities ranged from January 2018 to October 2020, with a weighted-average remaining maturity of approximately 12 months.
4. DERIVATIVE INSTRUMENTS
The Company historically used, but does not currently use, foreign currency forward contracts (“forward contracts”) to reduce its exposure to fluctuations in foreign currency exchange rates associated with its foreign currency denominated cash, accounts receivable, and intercompany receivables and payables held primarily by the U.S. parent company and its United Kingdom (“U.K.”) subsidiary. The cash flows related to these forward contracts are classified as operating activities in the accompanying consolidated statements of cash flows. The Company does not enter into any forward contracts for trading or speculative purposes.
At December 31, 2016, the total notional value of the Company’s outstanding forward contracts was $128.4 million.
56
Table of Contents
The fair value of the Company’s outstanding forward contracts was as follows:
| (in thousands) | December 31, 2016 | |||||||
| Recorded In: | Fair Value | |||||||
| Asset Derivatives |
||||||||
| Foreign currency forward contracts |
Other current assets | $ | 628 | |||||
| Liability Derivatives |
||||||||
| Foreign currency forward contracts |
Accrued expenses | $ | 883 | |||||
The Company had forward contracts outstanding with total notional values as of December 31, 2016 as follows:
| (in thousands) | ||||
| Euro |
€ | 29,820 | ||
| British pound |
£ | 6,440 | ||
| Australian dollar |
A$ | 22,010 | ||
| United States dollar |
$ | 73,125 | ||
The income statement impact of the Company’s outstanding forward contracts and foreign currency transactions was as follows:
| 2017 | 2016 | 2015 | ||||||||||
| Gain (loss) from the change in the fair value of forward contracts included in other expense, net |
$ | 286 | $ | (5,643 | ) | $ | (1,047 | ) | ||||
| Foreign currency transaction (losses) gains from the remeasurement of foreign currency assets and liabilities |
(900 | ) | 2,247 | (4,168 | ) | |||||||
5. FAIR VALUE MEASUREMENTS
Assets and Liabilities Measured at Fair Value on a Recurring Basis
The Company records its marketable securities, forward contracts and investments in privately-held companies at fair value on a recurring basis. Fair value is an exit price, representing the amount that would be received from the sale of an asset or paid to transfer a liability in an orderly transaction between market participants based on assumptions that market participants would use in pricing an asset or liability. As a basis for classifying the fair value measurements, a three-tier fair value hierarchy, which classifies the fair value measurements based on the inputs used in measuring fair value, was established as follows: (Level 1) observable inputs such as quoted prices in active markets for identical assets or liabilities; (Level 2) significant other inputs that are observable either directly or indirectly; and (Level 3) significant unobservable inputs on which there is little or no market data, which require the Company to develop its own assumptions. This hierarchy requires the Company to use observable market data, when available, and to minimize the use of unobservable inputs when determining fair value.
The Company’s cash equivalents are composed of money market funds and time deposits which are classified as Level 1 and Level 2, respectively, in the fair value hierarchy. The Company’s marketable securities are classified within Level 2 of the fair value hierarchy are valued based on a market approach using quoted prices, when available, or matrix pricing compiled by third party pricing vendors, using observable market inputs such as interest rates, yield curves, and credit risk. The Company’s foreign currency forward contracts, which are all classified within Level 2 of the fair value hierarchy, are valued based on the notional amounts and rates under the contracts and observable market inputs such as currency exchange rates and credit risk. The Company’s investments in privately-held companies are classified within Level 3 of the fair value hierarchy and are valued using model-based techniques, including option pricing models and discounted cash flow models.
57
Table of Contents
If applicable, the Company will recognize transfers into and out of levels within the fair value hierarchy at the end of the reporting period in which the actual event or change in circumstance occurs. There were no transfers of investments between Level 1 and Level 2 during 2017 and 2016.
The Company’s assets and liabilities measured at fair value on a recurring basis consisted of the following:
| (in thousands) | Fair Value Measurements at Reporting Date Using | Total | ||||||||||||||
| Level 1 | Level 2 | Level 3 | ||||||||||||||
| December 31, 2017 |
||||||||||||||||
| Fair Value Assets: |
||||||||||||||||
| Cash equivalents (1) |
$ | 2,720 | $ | 40,051 | $ | — | $ | 42,771 | ||||||||
| Marketable securities: |
||||||||||||||||
| Municipal bonds |
$ | — | $ | 32,848 | $ | — | $ | 32,848 | ||||||||
| Corporate bonds |
— | 28,621 | — | 28,621 | ||||||||||||
|
|
|
|
|
|
|
|
|
|||||||||
| Total marketable securities |
$ | — | $ | 61,469 | $ | — | $ | 61,469 | ||||||||
| Investments in privately-held companies (2) |
$ | — | $ | — | $ | 1,030 | $ | 1,030 | ||||||||
| December 31, 2016 |
||||||||||||||||
| Fair Value Assets: |
||||||||||||||||
| Money market funds (1) |
$ | 458 | $ | — | $ | — | $ | 458 | ||||||||
| Marketable securities: |
||||||||||||||||
| Municipal bonds |
$ | — | $ | 36,607 | $ | — | $ | 36,607 | ||||||||
| Corporate bonds |
— | 26,560 | — | 26,560 | ||||||||||||
|
|
|
|
|
|
|
|
|
|||||||||
| Total marketable securities |
$ | — | $ | 63,167 | $ | — | $ | 63,167 | ||||||||
| Foreign currency forward contracts |
$ | — | $ | 628 | $ | — | $ | 628 | ||||||||
| Fair Value Liabilities: |
||||||||||||||||
| Foreign currency forward contracts |
$ | — | $ | 883 | $ | — | $ | 883 | ||||||||
| (1) | Included in cash and cash equivalents in the consolidated balance sheets. |
| (2) | Included in other long-term assets in the consolidated balance sheets. |
For certain other financial instruments, including accounts receivable and accounts payable, the carrying value approximates their fair value due to the relatively short maturity of these items.
Assets Measured at Fair Value on a Nonrecurring Basis
Assets recorded at fair value on a nonrecurring basis, such as property and equipment, and intangible assets are recognized at fair value when they are impaired. During 2017, 2016, and 2015, the Company did not recognize any impairments on its assets measured at fair value on a nonrecurring basis.
58
Table of Contents
6. TRADE ACCOUNTS RECEIVABLE, NET OF ALLOWANCE
Unbilled trade accounts receivable primarily relate to services earned under time and materials arrangements and to license, maintenance, and cloud arrangements that have commenced or been delivered in excess of scheduled invoicing.
| (in thousands) | December 31, | |||||||
| 2017 | 2016 | |||||||
| Trade accounts receivable |
$ | 225,923 | $ | 234,473 | ||||
| Unbilled accounts receivable |
30,063 | 34,681 | ||||||
|
|
|
|
|
|||||
| Total accounts receivable |
255,986 | 269,154 | ||||||
|
|
|
|
|
|||||
| Allowance for sales credit memos |
(7,655 | ) | (4,126 | ) | ||||
|
|
|
|
|
|||||
| $ | 248,331 | $ | 265,028 | |||||
|
|
|
|
|
|||||
The Company records an allowance for estimates of potential sales credit memos when the related revenue is recorded and reviews this allowance periodically.
The following reflects the activity of the allowance for sales credit memos:
| (in thousands) | 2017 | 2016 | 2015 | |||||||||
| Balance at beginning of year |
$ | 4,126 | $ | 4,631 | $ | 1,540 | ||||||
| Provision for credit memos |
7,052 | 3,290 | 8,005 | |||||||||
| Credit memos issued |
(3,523 | ) | (3,795 | ) | (4,914 | ) | ||||||
|
|
|
|
|
|
|
|||||||
| $ | 7,655 | $ | 4,126 | $ | 4,631 | |||||||
|
|
|
|
|
|
|
|||||||
7. PROPERTY AND EQUIPMENT
| (in thousands) | December 31, | |||||||
| 2017 | 2016 | |||||||
| Leasehold improvements |
$ | 38,650 | $ | 32,852 | ||||
| Computer equipment |
23,783 | 21,522 | ||||||
| Furniture and fixtures |
8,517 | 6,127 | ||||||
| Computer software purchased |
6,690 | 6,083 | ||||||
| Computer software developed for internal use |
12,596 | 12,069 | ||||||
| Fixed assets in progress |
2,167 | 772 | ||||||
|
|
|
|
|
|||||
| 92,403 | 79,425 | |||||||
| Less: accumulated depreciation and amortization |
(52,044 | ) | (41,144 | ) | ||||
|
|
|
|
|
|||||
| Property and equipment, net |
$ | 40,359 | $ | 38,281 | ||||
|
|
|
|
|
|||||
Depreciation expense was approximately $12.4 million, $11.2 million, and $10.6 million for 2017, 2016, and 2015, respectively.
8. ACQUISITIONS
On April 11, 2016, the Company acquired OpenSpan, Inc. (“OpenSpan”), a privately held software provider of robotic process automation and workforce analytics software for $48.8 million in cash, net of $1.8 million in cash acquired.
59
Table of Contents
9. GOODWILL AND OTHER INTANGIBLE ASSETS
As discussed in Note 17 “Geographic Information and Major Clients”, the Company operates in one reportable segment and has one reporting unit.
The following table presents the changes in the carrying amount of goodwill:
| (in thousands) | 2017 | 2016 | ||||||
| Balance as of January 1, |
$ | 73,164 | $ | 46,776 | ||||
| Acquisitions |
— | 26,689 | ||||||
| Purchase price adjustments to goodwill |
(354 | ) | — | |||||
| Translation adjustments |
142 | (301 | ) | |||||
|
|
|
|
|
|||||
| Balance as of December 31, |
$ | 72,952 | $ | 73,164 | ||||
|
|
|
|
|
|||||
Intangible assets are recorded at cost and are amortized using the straight-line method over their estimated useful lives.
| (in thousands) | Range of Useful Lives |
Cost | Accumulated Amortization |
Net book value |
||||||||||||
| December 31, 2017 |
||||||||||||||||
| Client related intangibles |
9-10 years | $ | 63,164 | $ | (44,835 | ) | $ | 18,329 | ||||||||
| Technology |
7-10 years | 58,942 | (45,372 | ) | 13,570 | |||||||||||
| Other intangibles |
— | 5,361 | (5,361 | ) | — | |||||||||||
|
|
|
|
|
|
|
|||||||||||
| Total |
$ | 127,467 | $ | (95,568 | ) | $ | 31,899 | |||||||||
|
|
|
|
|
|
|
|||||||||||
| December 31, 2016 |
||||||||||||||||
| Client related intangibles |
4-10 years | $ | 63,091 | $ | (37,573 | ) | $ | 25,518 | ||||||||
| Technology |
3-10 years | 58,942 | (40,269 | ) | 18,673 | |||||||||||
| Other intangibles |
— | 5,361 | (5,361 | ) | — | |||||||||||
|
|
|
|
|
|
|
|||||||||||
| Total |
$ | 127,394 | $ | (83,203 | ) | $ | 44,191 | |||||||||
|
|
|
|
|
|
|
|||||||||||
Amortization expense of acquired intangibles was reflected in the Company’s consolidated statements of operations as follows:
| (in thousands) | 2017 | 2016 | 2015 | |||||||||
| Cost of revenue |
$ | 5,103 | $ | 5,986 | $ | 5,392 | ||||||
| Selling and marketing |
7,235 | 7,145 | 6,127 | |||||||||
| General and administrative |
— | 277 | 683 | |||||||||
|
|
|
|
|
|
|
|||||||
| $ | 12,338 | $ | 13,408 | $ | 12,202 | |||||||
|
|
|
|
|
|
|
|||||||
Future estimated amortization expense related to intangible assets as of December 31, 2017 was as follows:
| (in thousands) |
Future estimated amortization expense |
|||
| 2018 |
$ | 11,345 | ||
| 2019 |
5,553 | |||
| 2020 |
2,657 | |||
| 2021 |
2,633 | |||
| 2022 and thereafter |
9,711 | |||
|
|
|
|||
| $ | 31,899 | |||
|
|
|
|||
60
Table of Contents
10. ACCRUED EXPENSES
| (in thousands) | December 31, | |||||||
| 2017 | 2016 | |||||||
| Outside professional services |
$ | 14,468 | $ | 10,204 | ||||
| Income and other taxes |
7,420 | 10,422 | ||||||
| Marketing and sales program expenses |
6,444 | 3,707 | ||||||
| Dividends payable |
2,344 | 2,298 | ||||||
| Employee related expenses |
4,065 | 3,806 | ||||||
| Other |
10,767 | 6,314 | ||||||
|
|
|
|
|
|||||
| $ | 45,508 | $ | 36,751 | |||||
|
|
|
|
|
|||||
11. DEFERRED REVENUE
| (in thousands) | December 31, 2017 |
December 31, 2016 |
||||||
| Term license |
$ | 16,853 | $ | 15,843 | ||||
| Perpetual license |
19,277 | 23,189 | ||||||
| Maintenance |
126,083 | 112,397 | ||||||
| Cloud |
23,276 | 13,604 | ||||||
| Consulting and Training |
9,584 | 10,614 | ||||||
|
|
|
|
|
|||||
| Current deferred revenue |
195,073 | 175,647 | ||||||
| Perpetual license |
2,568 | 7,909 | ||||||
| Maintenance |
2,745 | 1,802 | ||||||
| Cloud |
1,278 | 1,278 | ||||||
|
|
|
|
|
|||||
| Long-term deferred revenue |
6,591 | 10,989 | ||||||
|
|
|
|
|
|||||
| $ | 201,664 | $ | 186,636 | |||||
|
|
|
|
|
|||||
12. COMMITMENTS AND CONTINGENCIES
Commitments
The Company leases space for its offices under noncancellable operating leases that expire at various dates through 2023.
As of December 31, 2017, the Company’s future minimum rental payments required under operating leases with noncancellable terms in excess of one year were as follows:
| (in thousands) |
Operating Leases (1) | |||
| 2018 |
$ | 15,395 | ||
| 2019 |
13,881 | |||
| 2020 |
12,737 | |||
| 2021 |
11,066 | |||
| 2022 and thereafter |
18,896 | |||
|
|
|
|||
| $ | 71,975 | |||
|
|
|
|||
| (1) | Operating leases include future minimum rent payments, net of estimated sublease income for facilities that the Company has vacated pursuant to its restructuring activities. |
61
Table of Contents
Rent expense under operating leases is recognized on a straight-line basis to account for scheduled rent increases and landlord tenant allowances. In connection with the Company’s amended lease for its office headquarters dated November 11, 2014, the Company has a landlord tenant allowance totaling approximately $9.4 million, all of which was used and reimbursed to the Company as of December 31, 2016 and will be amortized as a reduction to rent expense on a straight-line basis over the term of the lease. Total rent expense under operating leases was approximately $14.7 million, $13.4 million, and $12.3 million for 2017, 2016 and 2015, respectively.
Contingencies
The Company is a party in various contractual disputes, litigation and potential claims arising in the ordinary course of business. The Company does not believe that the resolution of these matters will have a material adverse effect on its financial position or results of operations.
13. STOCKHOLDERS’ EQUITY
Preferred stock
The Company has authorized 1 million shares of preferred stock. The Board of Directors has the authority to issue the shares of preferred stock in one or more series, to establish the number of shares to be included in each series, and to fix the designation, powers, preferences and rights of the shares of each series and the qualifications, limitations or restrictions thereof, without any further vote or action by the stockholders. The issuance of preferred stock could decrease the amount of earnings and assets available for distribution to holders of common stock, and may have the effect of delaying, deferring or defeating a change in control of the Company. The Company had not issued any shares of preferred stock through December 31, 2017.
Common stock
The Company has 200 million authorized shares of common stock, $0.01 par value per share, of which 78.1 million shares were issued and outstanding at December 31, 2017.
Since 2004, the Company’s Board of Directors has approved stock repurchase programs that have authorized the Company to repurchase in the aggregate up to $195 million of its common stock. On May 30, 2017, we announced that our Board of Directors extended the expiration date of the current stock repurchase program to June 30, 2018. Purchases under these programs have been made on the open market.
| (in thousands) | 2017 | 2016 | 2015 | |||||||||||||||||||||
| Shares | Amount | Shares | Amount | Shares | Amount | |||||||||||||||||||
| Authorization remaining, beginning of period |
$ | 39,385 | $ | 40,534 | $ | 13,284 | ||||||||||||||||||
| Authorizations |
— | 25,879 | 50,000 | |||||||||||||||||||||
| Repurchases paid |
96 | (4,335 | ) | 1,078 | (27,028 | ) | 944 | (22,530 | ) | |||||||||||||||
| Repurchases unsettled |
3 | (158 | ) | — | — | 8 | (220 | ) | ||||||||||||||||
|
|
|
|
|
|
|
|||||||||||||||||||
| Authorization remaining, end of period |
$ | 34,892 | $ | 39,385 | $ | 40,534 | ||||||||||||||||||
|
|
|
|
|
|
|
|||||||||||||||||||
Dividends
For 2017, 2016, and 2015, the Company paid cash dividends of $9.3 million, $9.2 million, and $9.2 million, respectively.
| (per share) | 2017 | 2016 | 2015 | |||||||||
| Dividends Declared |
$ | 0.12 | $ | 0.12 | $ | 0.12 | ||||||
62
Table of Contents
It is the Company’s current intention to pay a quarterly cash dividend of $0.03 per share, however, the Board of Directors may terminate or modify this dividend program at any time without notice.
14. STOCK-BASED COMPENSATION
The following table presents the stock-based compensation expense included in the Company’s consolidated statements of operations:
| (in thousands) | 2017 | 2016 | 2015 | |||||||||
| Cost of revenues |
$ | 14,573 | $ | 11,459 | $ | 8,772 | ||||||
| Selling and marketing |
15,720 | 12,464 | 8,911 | |||||||||
| Research and development |
13,618 | 10,043 | 8,116 | |||||||||
| General and administrative |
9,402 | 6,513 | 4,255 | |||||||||
| Acquisition-related |
— | 342 | — | |||||||||
|
|
|
|
|
|
|
|||||||
| Total stock-based compensation before tax |
$ | 53,313 | $ | 40,821 | $ | 30,054 | ||||||
|
|
|
|
|
|
|
|||||||
| Income tax benefit |
$ | (12,113 | ) | $ | (12,198 | ) | $ | (8,098 | ) | |||
The majority of the Company’s stock-based compensation arrangements generally vest over five years with 20% vesting after one year and the remaining 80% vesting in equal quarterly installments over the remaining four years. The Company’s stock options have a ten-year term. The Company recognizes stock-based compensation using the accelerated attribution method, treating each vesting tranche as if it were an individual grant.
The Company periodically grants stock options and restricted stock units (“RSUs”) for a fixed number of shares upon vesting to employees and non-employee Directors. The exercise price for stock options is greater than or equal to the fair market value of the shares at the grant date. RSUs deliver to the recipient a right to receive a specified number of shares of the Company’s common stock upon vesting. The Company values its RSUs at the fair value of its common stock on the grant date, which is the closing price of its common stock on the grant date, less the present value of expected dividends during the vesting period, as the recipient is not entitled to dividends during the requisite service period. Upon vesting of the RSUs, the Company withholds shares of common stock in an amount sufficient to cover the minimum statutory tax withholding obligations and issues shares of its common stock for the remaining amount.
Employees may elect to receive 50% of their target incentive compensation under the Company’s Corporate Incentive Compensation Plan (the “CICP”) in the form of RSUs instead of cash. If elected by an employee, the equity amount is equal in value on the date of grant to 50% of his or her target incentive opportunity, based on the employee’s base salary. The number of RSUs granted is determined by dividing 50% of the employee’s target incentive opportunity by 85% of the closing price of its common stock on the grant date, less the present value of expected dividends during the vesting period. If elected, the award vests 100% on the CICP payout date of the following year for all participants. Vesting is conditioned upon the performance conditions of the CICP and on continued employment; if threshold funding does not occur, the RSU will not vest. The Company considers vesting to be probable on the grant date and recognizes the associated stock-based compensation expense over the requisite service period beginning on the grant date and ending on the vesting date.
The Company grants awards that allow for the settlement of vested stock options RSUs on a net share basis (“net settled awards”). With net settled awards, the employee does not surrender any cash or shares upon exercise. Rather, the Company withholds the number of shares to cover the option exercise price (in the case of stock options) and the minimum statutory tax withholding obligations (in the case of stock options and RSUs) from the shares that would otherwise be issued upon exercise or settlement. The exercise of stock options and settlement of RSUs on a net share basis results in fewer shares issued by the Company.
63
Table of Contents
Share-Based Compensation Plans:
2004 Long-Term Incentive Plan (as amended and restated)
In 2004, the Company adopted the 2004 Long-Term Incentive Plan (as amended and restated, the “2004 Plan”) to provide employees, non-employee Directors, and consultants with opportunities to purchase stock through incentive stock options and non-qualified stock options. Subsequent amendments to the plan in 2016 and 2011 increased the number of shares authorized for issuance under the plan to 30 million, extended the term of the plan to 2026, and limited annual compensation to any non-employee Director to $0.5 million.
As of December 31, 2017, approximately 10 million shares were subject to outstanding options and stock-based awards under the 2004 Plan.
2006 Employee Stock Purchase Plan
In 2006, the Company adopted the 2006 Employee Stock Purchase Plan (the “2006 ESPP”) pursuant to which the Company’s employees are entitled to purchase up to an aggregate of 1 million shares, of common stock at a price equal to at least 85% of the fair market value of the Company’s common stock on either the commencement date or completion date for offerings under the plan, whichever is less, or such higher price as the Company’s Board of Directors may establish from time to time. Until the Company’s Board of Directors determines otherwise, the Board has set the purchase price at 95% of the fair market value on the completion date of the offering period. As a result, the 2006 ESPP is non-compensatory and is tax qualified. Therefore, as of December 31, 2017, no compensation expense related to shares issued under the plan had been recognized. In October 2012, the Company’s Board of Directors amended the term of the 2006 ESPP such that it will continue until there are no shares remaining to be issued under the plan or until the plan is terminated by the Board of Directors, whichever occurs first.
As of December 31, 2017, approximately 0.4 million shares had been issued thereunder.
Shares Available for Issuance
As of December 31, 2017, there were approximately 9.2 million shares available for issuance for future equity grants under the Company’s stock plans, consisting of approximately 8.6 million shares under the 2004 Plan and approximately 0.6 million shares under the 2006 ESPP.
Equity grants, assumptions and activity
During 2017, the Company issued approximately 1.6 million shares to its employees and directors under the Company’s share-based compensation plans.
Stock Options
The Company estimates the fair value of stock options using a Black-Scholes option valuation model. Key inputs used to estimate the fair value of stock options include the exercise price of the award, expected term of the option, expected volatility of the Company’s common stock over the option’s expected term, risk-free interest rate over the option’s expected term, and the Company’s expected annual dividend yield. The amount of stock-based compensation recognized during a period is based on the value of the awards that are ultimately expected to vest. Forfeitures are estimated at the time of grant and revised, if necessary, in subsequent periods if actual forfeitures differ from those estimates. Ultimately, the Company recognizes the actual expense over the vesting period only for the shares that vest.
The weighted-average grant-date fair value for stock options granted in 2017, 2016, and 2015, was $13.79, $8.31 and $7.62 per share, respectively.
64
Table of Contents
The weighted-average assumptions used in the Black-Scholes option valuation model are as follows:
| 2017 | 2016 | 2015 | ||||||||||
| Expected annual volatility (1) |
35 | % | 40 | % | 45 | % | ||||||
| Expected term in years (2) |
4.5 | 4.4 | 4.5 | |||||||||
| Risk-free interest rate (3) |
1.85 | % | 1.21 | % | 1.34 | % | ||||||
| Expected annual dividend yield (4) |
0.53 | % | 0.63 | % | 0.68 | % | ||||||
| • | The expected annual volatility for each grant is determined based on the average of historical daily price changes of the Company’s common stock over a period of time which approximates the expected option term. |
| • | The expected option term for each grant is determined based on the historical exercise behavior of employees and post-vesting employment termination behavior. |
| • | The risk-free interest rate is based on the yield of U.S. Treasury securities with a maturity that is commensurate with the expected option term at the time of grant. |
| • | The expected annual dividend yield is based on the weighted-average of the dividend yield assumptions used for options granted during the applicable period. |
The following table summarizes the combined stock option activity under the Company’s stock option plans for 2017:
| Shares (in thousands) | Weighted-average exercise price |
Weighted-average remaining contractual term (in years) |
Aggregate intrinsic value (in thousands) |
|||||||||||||
| Options outstanding as of January 1, 2017 |
7,463 | $ | 19.45 | |||||||||||||
| Granted |
1,639 | 45.78 | ||||||||||||||
| Exercised |
(1,741 | ) | 16.25 | |||||||||||||
| Forfeited |
(231 | ) | 25.30 | |||||||||||||
|
|
|
|||||||||||||||
| Options outstanding as of December 31, 2017 |
7,130 | $ | 26.10 | |||||||||||||
|
|
|
|||||||||||||||
| Vested and expected to vest as December 31, 2017 |
5,926 | $ | 25.20 | 7.2 | $ | 131,599 | ||||||||||
|
|
|
|||||||||||||||
| Exercisable as of December 31, 2017 |
2,800 | $ | 16.98 | 5.8 | $ | 84,479 | ||||||||||
|
|
|
|||||||||||||||
The aggregate intrinsic value of stock options exercised (i.e., the difference between the market price at exercise and the price paid by the employee at exercise) in 2017, 2016, and 2015 was $62.6 million, $19.9 million and $18.6 million, respectively. The aggregate intrinsic value of stock options outstanding and exercisable as of December 31, 2017 is based on the difference between the closing price of the Company’s stock of $47.15 and the exercise price of the applicable stock options.
As of December 31, 2017, the Company had unrecognized stock-based compensation expense related to the unvested portion of stock options of approximately $16.8 million that is expected to be recognized as expense over a weighted-average period of approximately 2.2 years.
RSUs
The weighted-average grant-date fair value for RSUs granted in 2017, 2016, and 2015 was $46.07, $25.54, and $20.49, respectively.
65
Table of Contents
The following table summarizes the combined RSU activity for periodic grants and the CICP under the 2004 Plan for 2017:
| Shares (in thousands) |
Weighted- Average Grant-Date Fair Value |
Aggregate Intrinsic Value (in thousands) |
||||||||||
| Nonvested as of January 1, 2017 |
3,161 | $ | 23.39 | |||||||||
| Granted |
1,148 | 46.07 | ||||||||||
| Vested |
(1,188 | ) | 23.66 | |||||||||
| Forfeited |
(220 | ) | 27.06 | |||||||||
|
|
|
|||||||||||
| Nonvested as of December 31, 2017 |
2,901 | $ | 31.97 | $ | 136,771 | |||||||
|
|
|
|||||||||||
| Expected to vest as of December 31, 2017 |
2,113 | $ | 32.74 | $ | 99,628 | |||||||
|
|
|
|||||||||||
The fair value of RSUs vested in 2017, 2016, and 2015 was $59.0 million, $29.2 million, and $14.9 million, respectively. The aggregate intrinsic value of RSUs outstanding and expected to vest as of December 31, 2017 is based on the closing price of the Company’s stock of $47.15 on December 31, 2017.
As of December 31, 2017, the Company had approximately $32.4 million of unrecognized stock-based compensation expense related to all unvested RSUs that is expected to be recognized as expense over a weighted-average period of approximately 2.1 years.
15. INCOME TAXES
Effective income tax rate
The components of income before provision for income taxes are as follows:
| (in thousands) | 2017 | 2016 | 2015 | |||||||||
| Domestic |
$ | 18,605 | $ | 37,329 | $ | 63,124 | ||||||
| Foreign |
18,495 | (2,127 | ) | (2,619 | ) | |||||||
|
|
|
|
|
|
|
|||||||
| Income before provision for income taxes |
$ | 37,100 | $ | 35,202 | $ | 60,505 | ||||||
|
|
|
|
|
|
|
|||||||
The components of the provision for income taxes are as follows:
| (in thousands) | 2017 | 2016 | 2015 | |||||||||
| Current: |
||||||||||||
| Federal |
$ | (18,205 | ) | $ | 6,741 | $ | 17,864 | |||||
| State |
97 | 2,963 | 4,565 | |||||||||
| Foreign |
8,479 | 4,322 | 3,853 | |||||||||
|
|
|
|
|
|
|
|||||||
| Total current (benefits)/provision |
(9,629 | ) | 14,026 | 26,282 | ||||||||
|
|
|
|
|
|
|
|||||||
| Deferred: |
||||||||||||
| Federal |
19,683 | (1,120 | ) | 2,075 | ||||||||
| State |
(2,158 | ) | (480 | ) | (466 | ) | ||||||
| Foreign |
(3,730 | ) | (4,210 | ) | (3,708 | ) | ||||||
|
|
|
|
|
|
|
|||||||
| Total deferred provision/(benefit) |
13,795 | (5,810 | ) | (2,099 | ) | |||||||
|
|
|
|
|
|
|
|||||||
| Provision for income taxes |
$ | 4,166 | $ | 8,216 | $ | 24,183 | ||||||
|
|
|
|
|
|
|
|||||||
66
Table of Contents
The effective income tax rate differed from the statutory federal income tax rate due to the following:
| 2017 | 2016 | 2015 | ||||||||||
| Statutory federal income tax rate |
35.0 | % | 35.0 | % | 35.0 | % | ||||||
| Valuation allowance |
1.2 | 0.3 | 0.7 | |||||||||
| Transaction costs |
— | 1.1 | — | |||||||||
| State income taxes, net of federal benefit and tax credits |
(4.5 | ) | 3.7 | 4.6 | ||||||||
| Permanent differences |
2.7 | 2.2 | 1.1 | |||||||||
| Domestic production activities |
— | (3.2 | ) | (3.1 | ) | |||||||
| Federal research and experimentation credits |
(9.1 | ) | (2.3 | ) | (1.2 | ) | ||||||
| Tax effects of foreign activities |
(1.1 | ) | 5.2 | 2.0 | ||||||||
| Tax-exempt income |
(0.3 | ) | (0.3 | ) | (0.1 | ) | ||||||
| Provision to return adjustments |
(5.2 | ) | 0.3 | 0.3 | ||||||||
| Non-deductible compensation |
5.0 | 6.2 | 3.3 | |||||||||
| Provision for uncertain tax positions |
0.7 | (2.3 | ) | (2.6 | ) | |||||||
| Excess tax benefits related to share-based compensation |
(66.0 | ) | (20.1 | ) | — | |||||||
| Net deferred tax assets re-measurement (1) |
51.8 | — | — | |||||||||
| Other |
1.0 | (2.5 | ) | — | ||||||||
|
|
|
|
|
|
|
|||||||
| Effective income tax rate |
11.2 | % | 23.3 | % | 40.0 | % | ||||||
|
|
|
|
|
|
|
|||||||
| (1) | Due to the impact of the Tax Reform Act. |
On December 22, 2017, the President of the United States signed into law the Tax Cuts and Jobs Act (the “Tax Reform Act”). The Tax Reform Act makes significant changes in the U.S. tax code including the following:
| • | reduction of the corporate federal income tax rate from 35% to 21%; |
| • | repeal of the domestic manufacturing deduction; |
| • | repeal of the corporate alternative minimum tax; |
| • | a one-time transition tax on accumulated foreign earnings (if any); |
| • | a move to a territorial tax system; and |
| • | acceleration of business asset expensing. |
In December 2017, the SEC staff issued Staff Accounting Bulletin No. 118 (“SAB 118”) to address the application of U.S. GAAP in situations when a registrant does not have the necessary information available, prepared, or analyzed (including computations) in reasonable detail to complete the accounting for income tax effects of the Tax Reform Act. The Company has recognized the provisional tax impacts in 2017, including $20.4 million in additional income tax expense in the fourth quarter of 2017 to re-measure its deferred tax assets to the 21% enacted rate. The final amounts may differ from these provisional amounts, possibly materially, due to, among other things, additional analysis, changes in interpretations and assumptions the Company has made, additional regulatory guidance that may be issued, and actions the Company may take as a result of the Tax Reform Act.
The Tax Reform Act provided for a one-time deemed mandatory repatriation of post-1986 undistributed foreign subsidiary earnings and profits through December 31, 2017. Based on the Company’s provisional analysis performed to date, the Company does not expect to be subject to the one-time transition tax due to our foreign subsidiaries being in a net accumulated deficit position.
While the Tax Reform Act provides for a territorial tax system, beginning in 2018, it includes the following new anti-abuse provisions:
| • | The global intangible low-taxed income (“GILTI”) provisions require the Company to include in its U.S. income tax base foreign subsidiary earnings in excess of an allowable return on the foreign |
67
Table of Contents
| subsidiary’s tangible assets. The Company expects that it will be subject to incremental U.S. tax resulting from GILTI inclusions beginning in 2018. However, our analysis and accounting for the effects of the GILTI provision is incomplete and an accounting policy on whether we will account for impact of GILTI inclusions in the period in which it is incurred or record deferred taxes for anticipated GILTI inclusions has not been made. |
| • | The base-erosion and anti-abuse tax (“BEAT”) provisions in the Tax Reform Act impose an alternative minimum tax on taxpayers with substantial base-erosion payments. Our preliminary assessment is that the company will not be subject to the BEAT; however, our analysis is incomplete and we will continue to analyze the impact of the BEAT provisions to determine if these would be material to the company’s effective tax rate. |
Deferred income taxes
Significant components of net deferred tax assets and liabilities are as follows:
| December 31, | ||||||||
| (in thousands) | 2017 | 2016 | ||||||
| Deferred tax assets: |
||||||||
| Net operating loss carryforwards |
$ | 52,311 | $ | 69,307 | ||||
| Accruals and reserves |
22,984 | 34,021 | ||||||
| Software revenue |
2,686 | 6,559 | ||||||
| Depreciation |
2,558 | 3,593 | ||||||
| Tax credit carryforwards |
13,056 | 8,094 | ||||||
| Other |
52 | 19 | ||||||
|
|
|
|
|
|||||
| Total deferred tax assets |
93,647 | 121,593 | ||||||
| Less valuation allowances |
(27,993 | ) | (34,054 | ) | ||||
|
|
|
|
|
|||||
| Total net deferred tax assets |
65,654 | 87,539 | ||||||
|
|
|
|
|
|||||
| Deferred tax liabilities: |
||||||||
| Intangibles |
(8,527 | ) | (17,641 | ) | ||||
|
|
|
|
|
|||||
| Total deferred tax liabilities |
(8,527 | ) | (17,641 | ) | ||||
|
|
|
|
|
|||||
| Deferred income taxes |
$ | 57,127 | $ | 69,898 | ||||
|
|
|
|
|
|||||
Due to the Tax Reform Act U.S. deferred tax assets and liabilities were re-measured from 35% to 21% resulting in an additional $20.4 million income tax expense in the fourth quarter of 2017.
The Company regularly assesses the need for a valuation allowance against its deferred tax assets. In making that assessment, the Company considers both positive and negative evidence related to the likelihood of realization of the deferred tax assets to determine, based on the weight of available evidence, whether it is more-likely-than-not that some or all of the deferred tax assets will not be realized. This determination requires significant judgment, including assumptions about future taxable income that are based on historical and projected information. The $6.1 million net change in the valuation allowance during the period primarily relates to a $7.4 million decrease due to the re-measurement our deferred income taxes to the new U.S. statutory tax rate offset by $0.8 million increase for movements in foreign exchange rates and $0.5 million valuation allowance recorded against certain state R&D credits generated in the period.
At December 31, 2017, the Company had $99.2 million and $3.3 million in federal and state net operating losses, respectively, and $3.4 million and $1.8 million in federal and state credit carryforwards, respectively. These amounts include $99.2 million and $1 million in federal and state net operating losses carryforwards, respectively, from acquisitions and $0.6 million and $0.3 million in federal and state credit carryforwards,
68
Table of Contents
respectively, from acquisitions. The carryforward losses and credits expire between 2018 and 2037, except for $0.6 million in state credits that have unlimited carryforward periods. The federal and state net operating losses exclude $60.2 million and $0.8 million, respectively, in net operating losses that the Company expects will expire unutilized, and the federal and state tax credits exclude $0.1 million and $6.7 million, respectively, in tax credits that the Company expects will expire unutilized.
As of December 31, 2017, the Company had available $33.5 million of foreign NOLS which have an unlimited carryover period.
The Company’s India subsidiary is a development center in an area designated as a Special Economic Zone (“SEZ”) and is entitled to a tax holiday in India. The tax holiday reduces or eliminates income tax in that country and is scheduled to expire in 2022. For 2017, 2016 and 2015, the effect of the income tax holiday was to reduce the Company’s provision for income taxes by approximately $1.3 million, $1 million, and $0.9 million, respectively. The benefit of the tax holiday on net income per share (diluted) was $0.02 for 2017 and $0.01 for 2016 and 2015.
The Company adopted ASU 2016-09 in 2016, which required, among other things, excess tax benefits to be recorded as a reduction of the provision for income taxes, whereas they were previously recognized in equity. The Company was required to reflect any adoption adjustments as of January 1, 2016, the beginning of the annual period that included the period of adoption. Upon adoption the Company recorded a $0.3 million increase to retained earnings as of January 1, 2016, with an offsetting increase to long-term deferred income tax assets.
Uncertain tax benefits and other considerations
A reconciliation of the beginning and ending balances of the total amounts of gross unrecognized tax benefits is as follows:
| (in thousands) | 2017 | 2016 | 2015 | |||||||||
| Balance as of January 1, |
$ | 22,671 | $ | 23,972 | $ | 43,396 | ||||||
| Additions based on tax positions related to the current year |
452 | 80 | 817 | |||||||||
| Additions for tax positions of prior years |
238 | 110 | 183 | |||||||||
| Additions for acquired uncertain tax benefits |
— | 387 | — | |||||||||
| Reductions for change in US federal tax rate |
(2,424 | ) | — | — | ||||||||
| Reductions for tax positions of prior years |
(1,500 | ) | (1,541 | ) | (19,855 | ) | ||||||
| Reductions for a lapse of the applicable statute of limitations |
(287 | ) | (337 | ) | (569 | ) | ||||||
|
|
|
|
|
|
|
|||||||
| Balance as of December 31, |
$ | 19,150 | $ | 22,671 | $ | 23,972 | ||||||
|
|
|
|
|
|
|
|||||||
As of December 31, 2017, the Company had approximately $19.2 million of total unrecognized tax benefits, which would decrease the Company’s effective tax rate if recognized. The $2.4 million reduction for change in U.S. federal tax rate relates to a decrease in the uncertain tax benefits recorded against deferred tax items (e.g., net operating losses) corresponding with the re-measurement of the associated deferred tax assets to the new U.S. statutory tax rate. The $1.5 million reduction for tax positions of prior years primarily relates the lapse in the applicable statute of limitations, change in estimates, and the impact of foreign currency exchange rates. The Company expects that the changes in the unrecognized benefits within the next twelve months will be approximately $0.5 million due to a lapse of applicable statute of limitations.
The Company recognizes interest accrued and penalties related to unrecognized tax benefits in the income tax provision. For 2017 the Company did not recognize any significant change in net interest expense. For the 2016 and 2015, the Company recognized a decrease of approximately $0.6 million and an increase of $0.3 million, respectively, of interest expense. As of December 31, 2017, 2016 and 2015, the company did not recognize any significant penalties. As of December 31, 2017, 2016 and 2015, the Company had accrued approximately $1.5 million, $1.2 million, and $1.2 million, respectively, for interest and penalties.
69
Table of Contents
The Company files income tax returns in the U.S. and in foreign jurisdictions. We have no tax returns under examination by the Internal Revenue Service or state taxing authorities as of December 31, 2017. However, certain foreign jurisdictions are auditing our income tax returns for periods ranging from 2010 through 2014. The Company does not expect the results of these audits to have a material effect on our financial condition, results of operations, or cash flows. With few exceptions, the statute of limitations remains open in all jurisdictions for the tax years 2014 to the present.
16. EARNINGS PER SHARE
Basic earnings per share is computed using the weighted-average number of common shares outstanding during the applicable period. Diluted earnings per share is computed using the weighted-average number of common shares outstanding during the applicable period, plus the dilutive effect of outstanding options and RSUs, using the treasury stock method and the average market price of the Company’s common stock during the applicable period. Certain shares related to some of the Company’s outstanding stock options and RSUs were excluded from the computation of diluted earnings per share because they were antidilutive in the periods presented, but could be dilutive in the future.
| (in thousands except per share amounts) | 2017 | 2016 | 2015 | |||||||||
| Basic |
||||||||||||
| Net income |
$ | 32,934 | $ | 26,986 | $ | 36,322 | ||||||
|
|
|
|
|
|
|
|||||||
| Weighted-average common shares outstanding |
77,431 | 76,343 | 76,507 | |||||||||
|
|
|
|
|
|
|
|||||||
| Earnings per share, basic |
$ | 0.43 | $ | 0.35 | $ | 0.47 | ||||||
|
|
|
|
|
|
|
|||||||
| Diluted |
||||||||||||
| Net income |
$ | 32,934 | $ | 26,986 | $ | 36,322 | ||||||
|
|
|
|
|
|
|
|||||||
| Weighted-average effect of dilutive securities: |
||||||||||||
| Stock options |
3,471 | 2,025 | 1,601 | |||||||||
| RSUs |
1,930 | 1,364 | 935 | |||||||||
|
|
|
|
|
|
|
|||||||
| Effect of assumed exercise of stock options and RSUs |
5,401 | 3,389 | 2,536 | |||||||||
|
|
|
|
|
|
|
|||||||
| Weighted-average common shares outstanding, assuming dilution |
82,832 | 79,732 | 79,043 | |||||||||
|
|
|
|
|
|
|
|||||||
| Earnings per share, diluted |
$ | 0.40 | $ | 0.34 | $ | 0.46 | ||||||
|
|
|
|
|
|
|
|||||||
| Outstanding options and RSUs excluded as impact would be antidilutive |
221 | 322 | 182 | |||||||||
17. GEOGRAPHIC INFORMATION AND MAJOR CLIENTS
Geographic Information
Operating segments are defined as components of an enterprise about which separate financial information is available that is evaluated regularly by the chief operating decision maker (“CODM”) in deciding how to allocate resources and in assessing performance.
The Company develops and licenses its strategic software applications and Pega Platform, and provides consulting services, maintenance, and training related to its offerings. The Company derives substantially all of its revenue from the sale and support of one group of similar products and services—software that provides case management, business process management, and real-time decisioning solutions to improve customer engagement and operational excellence in the enterprise applications market. To assess performance, the Company’s CODM, who is the chief executive officer, reviews financial information on a consolidated basis. Therefore, the Company determined it has one reportable segment and one reporting unit.
70
Table of Contents
The Company’s international revenue is from clients based outside of the U.S. The Company derived its revenue from the following geographic areas:
| (Dollars in thousands) | 2017 | 2016 | 2015 | |||||||||||||||||||||
| U.S. |
$ | 474,819 | 56 | % | $ | 430,562 | 57 | % | $ | 379,936 | 56 | % | ||||||||||||
| Other Americas |
39,490 | 5 | % | 59,160 | 8 | % | 57,892 | 8 | % | |||||||||||||||
| U.K. |
90,817 | 11 | % | 101,733 | 14 | % | 96,314 | 14 | % | |||||||||||||||
| Other EMEA (1) |
130,889 | 16 | % | 92,540 | 12 | % | 87,240 | 13 | % | |||||||||||||||
| Asia Pacific |
104,567 | 12 | % | 66,271 | 9 | % | 61,313 | 9 | % | |||||||||||||||
|
|
|
|
|
|
|
|
|
|
|
|
|
|||||||||||||
| $ | 840,582 | 100 | % | $ | 750,266 | 100 | % | $ | 682,695 | 100 | % | |||||||||||||
|
|
|
|
|
|
|
|
|
|
|
|
|
|||||||||||||
| (1) | Includes the Middle East, Africa, and Europe excluding the U.K. |
Long-lived assets related to the Company’s U.S. and international operations were as follows:
| December 31, | ||||||||||||||||
| (Dollars in thousands) | 2017 | 2016 | ||||||||||||||
| U.S. |
$ | 27,590 | 68 | % | $ | 27,993 | 73 | % | ||||||||
| India |
6,703 | 17 | % | 7,158 | 19 | % | ||||||||||
| International, other |
6,066 | 15 | % | 3,130 | 8 | % | ||||||||||
|
|
|
|
|
|
|
|
|
|||||||||
| $ | 40,359 | 100 | % | $ | 38,281 | 100 | % | |||||||||
|
|
|
|
|
|
|
|
|
|||||||||
Major Clients
Clients accounting for 10% or more of the Company’s total revenue were as follows:
| (Dollars in thousands) | 2017 | 2016 | 2015 | |||||||||
| Total revenue |
$ | 840,582 | $ | 750,266 | $ | 682,695 | ||||||
| Client A |
10 | % | * | * | ||||||||
Clients accounting for 10% or more of the Company’s trade accounts receivable were as follows:
| (Dollars in thousands) | December 31, | |||||||
| 2017 | 2016 | |||||||
| Trade accounts receivable |
$ | 248,331 | $ | 265,028 | ||||
| Client A |
12 | % | * | |||||
| * | Client accounted for less than 10% of total revenue and trade accounts receivable |
The Company’s financial services, healthcare, and insurance clients as a group represent a significant amount of the Company’s revenues and receivables. However, the Company determined this concentration did not have a material impact on its allowance for sales credit memos as of December 31, 2017
In addition to accounts receivable, the Company is potentially subject to concentrations of credit risk from the Company’s cash, cash equivalents, and marketable securities. The Company’s cash and cash equivalents are generally held with large, diverse financial institutions worldwide to reduce the credit risk exposure. Investment policies have been implemented that limit purchases of marketable debt securities to investment-grade securities. Note 3 “Marketable Securities” and Note 5 “Fair Value Measurements” for further discussion.
18. EMPLOYEE BENEFIT PLANS
The Company sponsors defined contribution plans for quantifying employees, including a 401(k) plan in the United States to which the Company makes discretionary matching contributions.
71
Table of Contents
The following expenses related to defined contribution plans were recorded in the Company’s consolidated statements of operations:
| (in thousands) | 2017 | 2016 | 2015 | |||||||||
| U.S. 401(k) Plan |
$ | 5,003 | $ | 4,510 | $ | 4,061 | ||||||
| International Plans |
9,096 | 7,635 | 6,428 | |||||||||
|
|
|
|
|
|
|
|||||||
| $ | 14,099 | $ | 12,145 | $ | 10,489 | |||||||
|
|
|
|
|
|
|
|||||||
19. SELECTED QUARTERLY INFORMATION (UNAUDITED)
| 2017 | ||||||||||||||||
| (in thousands, except per share amounts) | 1st Quarter | 2nd Quarter | 3rd Quarter | 4th Quarter | ||||||||||||
| Revenue |
$ | 223,247 | $ | 197,980 | $ | 179,815 | $ | 239,540 | ||||||||
| Gross profit |
155,157 | 130,105 | 110,084 | 165,563 | ||||||||||||
| Income/(loss) from operations |
31,238 | 1,750 | (14,289 | ) | 19,961 | |||||||||||
| Income/(loss) before provision for income taxes |
31,800 | 1,560 | (14,697 | ) | 18,437 | |||||||||||
| Net income/(loss) |
27,021 | 11,406 | (1,812 | ) | (3,681 | ) | ||||||||||
| Net income/(loss) per share, basic |
$ | 0.35 | $ | 0.15 | $ | (0.03 | ) | $ | (0.04 | ) | ||||||
|
|
|
|
|
|
|
|
|
|||||||||
| Net income/(loss) per share, diluted |
$ | 0.33 | $ | 0.14 | $ | (0.03 | ) | $ | (0.04 | ) | ||||||
|
|
|
|
|
|
|
|
|
|||||||||
| 2016 (1) | ||||||||||||||||
| (in thousands, except per share amounts) | 1st Quarter | 2nd Quarter | 3rd Quarter | 4th Quarter | ||||||||||||
| Revenue |
$ | 178,858 | $ | 188,996 | $ | 182,802 | $ | 199,610 | ||||||||
| Gross profit |
122,348 | 128,896 | 122,365 | 137,401 | ||||||||||||
| Income from operations |
14,125 | 6,360 | 5,498 | 11,776 | ||||||||||||
| Income before provision for income taxes |
13,493 | 5,498 | 5,515 | 10,696 | ||||||||||||
| Net income |
10,400 | 4,536 | 3,301 | 8,749 | ||||||||||||
| Net income per share, basic |
$ | 0.14 | $ | 0.06 | $ | 0.04 | $ | 0.11 | ||||||||
|
|
|
|
|
|
|
|
|
|||||||||
| Net income per share, diluted |
$ | 0.13 | $ | 0.06 | $ | 0.04 | $ | 0.11 | ||||||||
|
|
|
|
|
|
|
|
|
|||||||||
| (1) | The Company elected to early adopt ASU 2016-09 in the fourth quarter of 2016, which requires, among other things, excess tax benefits to be recorded as a reduction of the provision for income taxes in the consolidated statement of operations, whereas they were previously recognized in equity. The Company is required to reflect any adoption adjustments as of January 1, 2016, the beginning of the annual period that includes the period of adoption. As such, certain information above includes the impact of the ASU 2016-09 adoption. |
72
Table of Contents
| ITEM 9. | Changes In and Disagreements with Accountants on Accounting and Financial Disclosure |
None.
| ITEM 9A. | Controls and Procedures |
Evaluation of Disclosure Controls and Procedures
Our management, with the participation of our Chief Executive Officer, or CEO, and Chief Financial Officer, or CFO, evaluated the effectiveness of our disclosure controls and procedures (as defined in Rules 13a-15(e) and 15d-15(e) under the Securities Exchange Act) as of December 31, 2017. In designing and evaluating our disclosure controls and procedures, our management recognized that any controls and procedures, no matter how well designed and operated, can provide only reasonable assurance of achieving their objectives, and our management necessarily applied its judgment in evaluating the cost-benefit relationship of possible controls and procedures. Based on this evaluation, our CEO and CFO concluded that our disclosure controls and procedures were effective as of December 31, 2017.
Management’s Report on and Changes in Internal Control over Financial Reporting
Our management is responsible for establishing and maintaining adequate internal control over financial reporting, as such term is defined in Rules 13a-15(f) and 15d-15(f) under the Securities Exchange Act. Under the supervision and with the participation of our management, including our CEO and CFO, we conducted an evaluation of the effectiveness of our internal control over financial reporting as of December 31, 2017 based on the framework in the updated Internal Control—Integrated Framework (2013) issued by the Committee of Sponsoring Organizations of the Treadway Commission (“COSO”) on May 14, 2013. Based on this evaluation, management has concluded that (i) our internal control over financial reporting was effective as of December 31, 2017 and (ii) no change in our internal control over financial reporting (as defined in Rules 13a-15(f) and 15d-15(f) under the Securities Exchange Act) occurred during the quarter ended December 31, 2017 that has materially affected, or is reasonably likely to materially affect, our internal control over financial reporting.
Deloitte & Touche LLP, our independent registered public accounting firm which also audited our consolidated financial statements, has issued an attestation report on our internal control over financial reporting, which is included in Item 8 “Financial Statements and Supplementary Data”
| ITEM 9B. | Other Information |
None.
73
Table of Contents
PART III
| ITEM 10. | Directors, Executive Officers, and Corporate Governance |
Except as set forth below, the information required by this Item is contained in our proxy statement for our 2018 annual stockholders meeting (the 2018 proxy statement”) under the heading “Election of Directors,” and is incorporated herein by reference. Information relating to certain filings on Forms 3, 4, and 5 is contained in our 2018 proxy statement under the heading “Section 16(a) Beneficial Ownership Reporting Compliance,” and is incorporated herein by reference. Information required by this item pursuant to Items 407(c) (3), 407(d) (4), and 407(d) (5) of Regulation S-K relating to an audit committee financial expert, the identification of the audit committee of our Board of Directors and procedures of security holders to recommend nominees to our Board of Directors is contained in the 2018 proxy statement under the heading “Corporate Governance” and is incorporated herein by reference.
We have adopted a written code of conduct that applies to our Board of Directors and all of our employees, including our principal executive officer, principal financial officer, principal accounting officer, or persons performing similar functions. A copy of our code of conduct can be found on our website, www.pega.com. We intend to satisfy the disclosure requirements under Item 5.05 of Form 8-K and under the applicable the NASDAQ Global Select Market rules by posting such information on our website in accordance with such requirements.
EXECUTIVE OFFICERS
The names of our executive officers and certain information about them are set forth below as of February 1, 2018:
Alan Trefler, age 61, a founder of Pegasystems, has served as Chief Executive Officer and Chairman of the Board of Directors since the Company was organized in 1983. Prior to 1983, he managed an electronic funds transfer product for TMI Systems Corporation, a software and services company. Mr. Trefler holds a B.A. degree in economics and computer science from Dartmouth College.
Kenneth Stillwell, age 47, joined Pegasystems in July 2016 as SVP, Chief Financial Officer and Chief Administrative Officer. Mr. Stillwell served as Senior Vice President and Chief Financial Officer of Dynatrace, a digital performance management solutions provider. Mr. Stillwell served as Executive Vice President and Chief Financial Officer of SOVOS, a financial compliance software as a service company. Prior to SOVOS, Mr. Stillwell spent time at PTC, a publicly traded software provider, where he served as the divisional CFO of two major segments. Mr. Stillwell holds a B.S. in business/economics from the University of Pittsburgh and a M.S. in accounting and finance from the University of South Carolina, and he is a certified public accountant.
Efstathios Kouninis, age 56, joined Pegasystems in April 2008 as Vice President of Finance. The Board of Directors appointed Mr. Kouninis as the Company’s Chief Accounting Officer in May 2008 and Treasurer in January 2014. From February 2006 to April 2008, Mr. Kouninis served as Chief Financial Officer and Treasurer of Tasker Products Corporation, a publicly traded manufacturer of antimicrobial chemicals. From November 2004 to February 2006, Mr. Kouninis served on the Staff of the Division of Corporation Finance of the U. S. Securities and Exchange Commission. Mr. Kouninis holds a B.S. from the University of Massachusetts, a Post Baccalaureate in accounting, and a M.S. in taxation from Bentley College.
Douglas Kra, age 55, joined Pegasystems in November 2004 as Vice President of Global Services. In January 2010, Mr. Kra was promoted to Senior Vice President of Global Services. In July 2014, the Company re-organized its sales and consulting services functions under one responsibility for specific geographic regions, and Mr. Kra was promoted to Senior Vice President of Global Customer Success for international regions. From 2002 to 2004, Mr. Kra served as Vice President at eLoyalty Corp., a consulting company specializing in customer relationship management. From 2000 to 2001, Mr. Kra served as President of Zefer Corp., an internet consulting firm. Prior to Zefer, Mr. Kra spent ten years at Cambridge Technology Partners Inc. in a variety of senior roles. Mr. Kra holds a B.A. in computer science from Brandeis University and an M.B.A. in finance from the New York University Stern School of Business.
74
Table of Contents
Michael Pyle, age 63, joined Pegasystems in 1985 and has served as Senior Vice President of Engineering since August 2000. Including his positions with Pegasystems, Mr. Pyle’s professional background encompasses more than forty years of software development and managerial experience throughout Europe and the U.S. Mr. Pyle completed his B.C.S. specializing in computer science and systems programming at the Civil Service College in London.
Leon Trefler, age 57, joined Pegasystems in April 1998 as an Account Executive for Strategic Business Development. Since then he has held various senior sales management positions across the Company and in Channel Sales. In 2002, he launched the commercialization of PegaRULES Process Commander, the predecessor to the Pega Platform. From April 2007 to January 2010, Mr. Trefler served as Vice President of Sales, North America and in January 2010, Mr. Trefler was promoted to Senior Vice President of Sales. In July 2014, the Company re-organized its sales and consulting services functions under one responsibility for specific geographic regions, and Mr. Trefler was promoted to Senior Vice President of Global Customer Success for the Americas region. Mr. Trefler holds a B.A. degree from Dartmouth College.
Alan Trefler and Leon Trefler are brothers. There are no other family relationships among any of our executive officers or Directors.
| ITEM 11. | Executive Compensation |
The information required by this item is contained in the 2018 proxy statement under the headings “Director Compensation”, “Compensation Discussion and Analysis”, and “Executive Compensation” and is incorporated herein by reference.
| ITEM 12. | Security Ownership of Certain Beneficial Owners and Management and Related Stockholder Matters |
Information required by this item with respect to stock ownership of certain beneficial owners and management is contained in the 2018 proxy statement under the heading “Security Ownership of Certain Beneficial Owners and Management” and is incorporated herein by reference.
Equity Compensation Plan Information
The following table provides certain information with respect to our equity compensation plans in effect as of December 31, 2017:
| (In thousands, except per share amounts) | Number of shares of common stock to be issued upon exercise of outstanding stock options and vesting of RSUs (3) |
Weighted-average exercise price per share of outstanding stock options (4) |
Number of shares of common stock remaining available for future issuance (excluding those in column (a)) (5) |
|||||||||
| Equity compensation plans approved by stockholders(1) |
10,010 | $ | 26.14 | 9,234 | ||||||||
| Equity compensation plans not approved by stockholders(2) |
21 | $ | 11.99 | — | ||||||||
| (1) | We currently maintain two equity compensation plans: the 2004 Long-Term Incentive Plan (as amended and restated, the “2004 Plan”) and the 2006 Employee Stock Purchase Plan as amended, (the “2006 ESPP”). In addition to the issuance of stock options, the 2004 Plan allows for the issuance of stock purchase rights and other stock-based awards, including RSUs. Since 2006, the Company has granted unrestricted shares of its common stock to its non-employee directors under the 2004 Plan. Our stockholders previously approved each of these plans and all amendments that were subject to stockholder approval. See Note 14 “Stock-Based Compensation” in Item 8 of this Annual Report for further information and description of our equity compensation plans. |
75
Table of Contents
| (2) | These stock options were assumed in connection with our acquisition of Chordiant in 2010 and were originally granted under the Chordiant Software, Inc. 2005 Equity Incentive Plan (the “2005 Plan”). No additional awards were or may be granted under the 2005 Plan following the date of acquisition. This plan was not approved by our stockholders since it was adopted on the date of acquisition. In connection with our acquisition of Chordiant, all outstanding equity awards issued under the 2005 Plan with an exercise price of $3.00, on a post-split basis, or lower were assumed by us and converted into the right to receive 0.13 shares of Pegasystems common stock for every one share of Chordiant common stock covered by such awards. All other outstanding equity awards issued under the 2005 Plan were cancelled. The 2005 Plan was approved by Chordiant’s stockholders and provided for the grant of incentive stock options, nonstatutory stock options, stock purchase awards, RSAs, RSUs, and other forms of equity compensation. Awards granted under the 2005 Plan generally expire four to ten years after the grant date and generally become exercisable over a period of two to four years, with either yearly or monthly vesting. |
| (3) | The number of shares of common stock issued upon exercise of vested stock options and vesting of RSUs will be less than 10 million because of the “net settlement” feature of most of these stock options and RSUs. This feature enables the Company to withhold shares to cover the cost to exercise (in the case of stock options) and, if applicable, taxes due (in the case of stock options and RSUs) based on the fair value of the shares at the exercise date (in the case of stock options) or vesting date (in the case of RSUs), instead of selling all of the shares on the open market to satisfy these obligations. The settlement of exercised stock options and vested RSUs on a net share basis will result in fewer shares issued by the Company. During 2017, stock option and RSU holders net settled stock options and RSUs representing the right to purchase a total of 2.9 million shares, of which only 1.5 million were issued to the stock option and RSU holders and the balance of the shares were surrendered to the Company to pay for the exercise price and the applicable taxes. |
| (4) | The weighted-average exercise price does not take into account the shares issuable upon vesting of outstanding RSUs, which have no exercise price. |
| (5) | Includes approximately 0.6 million shares remaining available for issuance as of December 31, 2017 under the 2006 ESPP. |
| ITEM 13. | Certain Relationships and Related Transactions, and Director Independence |
The information required by this item is contained in the 2018 proxy statement under the headings “Certain Relationships and Related Transactions” and “Determination of Independence” and is incorporated herein by reference.
| ITEM 14. | Principal Accounting Fees and Services |
The information required by this item is contained in the 2018 proxy statement under the heading “Independent Registered Public Accounting Firm Fees and Services” and is incorporated herein by reference.
76
Table of Contents
PART IV
| ITEM 15. | Exhibits, Financial Statement Schedules |
(a) The following are filed as part of this Annual Report:
(1) Financial Statements
The following consolidated financial statements are included in Item 8:
(b) Exhibits
77
Table of Contents
| + | Filed herewith |
| ++ | Management contracts and compensatory plan or arrangements required to be filed pursuant to Item 15(b) of Form 10-K. |
| ** | Submitted electronically herewith |
78
Table of Contents
(c) Financial Statement Schedules
All financial statement schedules are omitted because the required information is not present or not present in sufficient amounts to require submission of the schedule or because the information is reflected in the consolidated financial statements or notes thereto.
| ITEM 16. | Form 10-K Summary |
Omitted at registrant’s option
79
Table of Contents
Pursuant to the requirements of Section 13 or 15(d) of the Securities Exchange Act of 1934, the Registrant has duly caused this Annual Report on Form 10-K to be signed on its behalf by the undersigned, thereunto duly authorized.
| Pegasystems Inc. | ||||||
| Date: February 26, 2018 | By: | /s/ KENNETH STILLWELL | ||||
| Kenneth Stillwell | ||||||
| Chief Financial Officer and Chief Administrative Officer (Principal Financial Officer) | ||||||
Pursuant to the requirements of the Securities Exchange Act of 1934, this Annual Report on Form 10-K has been signed below on February 26, 2018 by the following persons on behalf of the Registrant and in the capacities indicated.
| Signature |
Title | |
| /S/ ALAN TREFLER |
Chairman and Chief Executive Officer (Principal Executive Officer) | |
| Alan Trefler | ||
| /S/ KENNETH STILLWELL |
Chief Financial Officer and Chief Administrative Officer (Principal Financial Officer) | |
| Kenneth Stillwell | ||
| /S/ EFSTATHIOS KOUNINIS |
Vice President of Finance, Chief Accounting Officer and Treasurer (Principal Accounting Officer) | |
| Efstathios Kouninis | ||
| /S/ RICHARD JONES |
Director | |
| Richard Jones | ||
| /S/ PETER GYENES |
Director | |
| Peter Gyenes | ||
| /S/ STEVEN KAPLAN |
Director | |
| Steven Kaplan | ||
| /S/ DIANNE LEDINGHAM |
Director | |
| Dianne Ledingham | ||
| /S/ JAMES O’HALLORAN |
Director | |
| James O’Halloran | ||
| /S/ SHARON ROWLANDS |
Director | |
| Sharon Rowlands | ||
| /S/ LARRY WEBER |
Director | |
| Larry Weber | ||
| /S/ WILLIAM WYMAN |
Director | |
| William Wyman | ||
80