Attached files
| file | filename |
|---|---|
| EX-10.12 - EXHIBIT 10.12 - DCP Midstream, LP | dpm-20171231xexhibit1012.htm |
| EX-32.2 - EXHIBIT 32.2 - DCP Midstream, LP | dpm-20171231xexhibit322.htm |
| EX-32.1 - EXHIBIT 32.1 - DCP Midstream, LP | dpm-20171231xexhibit321.htm |
| EX-31.2 - EXHIBIT 31.2 - DCP Midstream, LP | dpm-20171231xexhibit312.htm |
| EX-31.1 - EXHIBIT 31.1 - DCP Midstream, LP | dpm-20171231xexhibit311.htm |
| EX-23.3 - EXHIBIT 23.3 - DCP Midstream, LP | dpm-20171231xexhibit233.htm |
| EX-23.2 - EXHIBIT 23.2 - DCP Midstream, LP | dpm-20171231xexhibit232.htm |
| EX-23.1 - EXHIBIT 23.1 - DCP Midstream, LP | dpm-20171231xexhibit231.htm |
| EX-21.1 - EXHIBIT 21.1 - DCP Midstream, LP | dpm-20171231xexhibit211.htm |
| EX-12.1 - EXHIBIT 12.1 - DCP Midstream, LP | dpm-20171231xexhibit121.htm |
| EX-10.17 - EXHIBIT 10.17 - DCP Midstream, LP | dpm-20171231xexhibit1017.htm |
| EX-10.16 - EXHIBIT 10.16 - DCP Midstream, LP | dpm-20171231xexhibit1016.htm |
| EX-10.13 - EXHIBIT 10.13 - DCP Midstream, LP | dpm-20171231xexhibit1013.htm |
UNITED STATES
SECURITIES AND EXCHANGE COMMISSION
Washington, D.C. 20549
FORM 10-K
(Mark One)
ý | ANNUAL REPORT PURSUANT TO SECTION 13 OR 15(d) OF THE SECURITIES EXCHANGE ACT OF 1934 |
For the fiscal year ended December 31, 2017
or
¨ | TRANSITION REPORT PURSUANT TO SECTION 13 OR 15(d) OF THE SECURITIES EXCHANGE ACT OF 1934 |
For the transition period from to
Commission File Number: 001-32678
DCP MIDSTREAM, LP
(Exact name of registrant as specified in its charter)
Delaware | 03-0567133 | |
(State or other jurisdiction of incorporation or organization) | (I.R.S. Employer Identification No.) | |
370 17th Street, Suite 2500 Denver, Colorado | 80202 | |
(Address of principal executive offices) | (Zip Code) | |
Registrant’s telephone number, including area code: (303) 595-3331
Securities registered pursuant to Section 12(b) of the Act:
Title of Each Class: | Name of Each Exchange on Which Registered: |
Common Units Representing Limited Partner Interests | New York Stock Exchange |
Securities registered pursuant to Section 12(g) of the Act:
None.
Indicate by check mark if the registrant is a well-known seasoned issuer, as defined in Rule 405 of the Securities Exchange Act of 1934, or the Act. Yesý No¨
Indicate by check mark if the registrant is not required to file reports pursuant to Section 13 or Section 15(d) of the Act. Yes ¨ No ý
Indicate by check mark whether the registrant (1) has filed all reports required to be filed by Section 13 or 15(d) of the Act during the preceding 12 months (or for such shorter period that the registrant was required to file such reports), and (2) has been subject to such filing requirements for the past 90 days. Yesý No¨
Indicate by check mark whether the registrant has submitted electronically and posted on its corporate Web site, if any, every Interactive Data File required to be submitted and posted pursuant to Rule 405 of regulation S-T (§232.405 of this chapter) during the preceding 12 months (or for such shorter period that the registrant was required to submit and post such files). Yes ý No ¨
Indicate by check mark if disclosure of delinquent filers pursuant to Item 405 of Regulation S-K is not contained herein, and will not be contained, to the best of registrant's knowledge, in definitive proxy or information statements incorporated by reference in Part III of this Form 10-K or any amendment to this Form 10-K. ý
Indicate by check mark whether the registrant is a large accelerated filer, an accelerated filer, a non-accelerated filer, a smaller reporting company, or an emerging growth company. See the definitions of “large accelerated filer,” “accelerated filer,” “smaller reporting company,” and “emerging growth company” in Rule 12b-2 of the Exchange Act. (Check one):
Large accelerated filer | ý | Accelerated filer | ¨ | |
Non-accelerated filer | ¨ | (Do not check if a smaller reporting company) | Smaller reporting company | ¨ |
Emerging Growth Company | ¨ | |||
If an emerging growth company, indicate by check mark if the registrant has elected not to use the extended transition period for complying with any new or revised financial accounting standards provided pursuant to Section 13(a) of the Exchange Act. ¨
Indicate by check mark whether the registrant is a shell company (as defined in Rule 12b-2 of the Exchange Act). Yes ¨ No ý
The aggregate market value of common units held by non-affiliates of the registrant on June 30, 2017, was approximately $3,060,364,000. The aggregate market value was computed by reference to the last sale price of the registrant’s common units on the New York Stock Exchange on June 30, 2017.
As of February 22, 2018, there were 143,309,828 common units representing limited partner interests outstanding.
DOCUMENTS INCORPORATED BY REFERENCE:
None.
DCP MIDSTREAM, LP
FORM 10-K FOR THE YEAR ENDED DECEMBER 31, 2017
TABLE OF CONTENTS
Item | Page | |
PART I | ||
1. | Business | |
1A. | Risk Factors | |
1B. | Unresolved Staff Comments | |
2. | Properties | |
3. | Legal Proceedings | |
4. | Mine Safety Disclosures | |
PART II | ||
5. | Market for Registrant's Common Units, Related Unitholder Matters and Issuer Purchases of Common Units | |
6. | Selected Financial Data | |
7. | Management's Discussion and Analysis of Financial Condition and Results of Operations | |
7A. | Quantitative and Qualitative Disclosures about Market Risk | |
8. | Financial Statements and Supplementary Data | |
9. | Changes in and Disagreements with Accountants on Accounting and Financial Disclosure | |
9A. | Controls and Procedures | |
9B. | Other Information | |
PART III | ||
10. | Directors, Executive Officers and Corporate Governance | |
11. | Executive Compensation | |
12. | Security Ownership of Certain Beneficial Owners and Management and Related Unitholder Matters | |
13. | Certain Relationships and Related Transactions, and Director Independence | |
14. | Principal Accountant Fees and Services | |
PART IV | ||
15. | Exhibits and Financial Statement Schedules | |
16. | Form 10-K Summary | |
Signatures | ||
i
GLOSSARY OF TERMS
The following is a list of certain industry terms used throughout this report:
Bbl | barrel | |
Bbls/d | barrels per day | |
Bcf | billion cubic feet | |
Bcf/d | billion cubic feet per day | |
Btu | British thermal unit, a measurement of energy | |
Fractionation | the process by which natural gas liquids are separated into individual components | |
MBbls | thousand barrels | |
MBbls/d | thousand barrels per day | |
MMBtu | million Btus | |
MMBtu/d | million Btus per day | |
MMcf | million cubic feet | |
MMcf/d | million cubic feet per day | |
NGLs | natural gas liquids | |
Throughput | the volume of product transported or passing through a pipeline or other facility | |
ii
CAUTIONARY STATEMENT ABOUT FORWARD-LOOKING STATEMENTS
Our reports, filings and other public announcements may from time to time contain statements that do not directly or exclusively relate to historical facts. Such statements are “forward-looking statements” within the meaning of the Private Securities Litigation Reform Act of 1995. You can typically identify forward-looking statements by the use of forward-looking words, such as “may,” “could,” “should,” “intend,” “assume,” “project,” “believe,” “anticipate,” “expect,” “estimate,” “potential,” “plan,” “forecast” and other similar words.
All statements that are not statements of historical facts, including, but not limited to, statements regarding our future financial position, business strategy, budgets, projected costs and plans and objectives of management for future operations, are forward-looking statements.
These forward-looking statements reflect our intentions, plans, expectations, assumptions and beliefs about future events and are subject to risks, uncertainties and other factors, many of which are outside our control. Important factors that could cause actual results to differ materially from the expectations expressed or implied in the forward-looking statements include known and unknown risks. Known risks and uncertainties include, but are not limited to, the risks set forth in Item 1A. "Risk Factors" in this Annual Report on Form 10-K, including the following risks and uncertainties:
• | the extent of changes in commodity prices and the demand for our products and services, our ability to effectively limit a portion of the adverse impact of potential changes in commodity prices through derivative financial instruments, and the potential impact of price, and of producers’ access to capital on natural gas drilling, demand for our services, and the volume of NGLs and condensate extracted; |
• | the demand for crude oil, residue gas and NGL products; |
• | the level and success of drilling and quality of production volumes around our assets and our ability to connect supplies to our gathering and processing systems, as well as our residue gas and NGL infrastructure; |
• | volatility in the price of our common units; |
• | general economic, market and business conditions; |
• | our ability to continue the safe and reliable operation of our assets; |
• | our ability to construct and start up facilities on budget and in a timely fashion, which is partially dependent on obtaining required construction, environmental and other permits issued by federal, state and municipal governments, or agencies thereof, the availability of specialized contractors and laborers, and the price of and demand for materials; |
• | our ability to access the debt and equity markets and the resulting cost of capital, which will depend on general market conditions, our financial and operating results, inflation rates, interest rates, our ability to comply with the covenants in our credit agreement and the indentures governing our notes, as well as our ability to maintain our credit ratings; |
• | the creditworthiness of our customers and the counterparties to our transactions; |
• | the amount of collateral we may be required to post from time to time in our transactions; |
• | industry changes, including the impact of bankruptcies, consolidations, alternative energy sources, technological advances and changes in competition; |
• | our ability to grow through organic growth projects, or acquisitions, and the successful integration and future performance of such assets; |
• | our ability to hire, train, and retain qualified personnel and key management to execute our business strategy; |
• | new, additions to, and changes in, laws and regulations, particularly with regard to taxes, safety and protection of the environment, including, but not limited to, climate change legislation, regulation of over-the-counter derivatives market and entities, and hydraulic fracturing regulations, or the increased regulation of our industry, and their impact on producers and customers served by our systems; |
• | weather, weather-related conditions and other natural phenomena, including, but not limited to, their potential impact on demand for the commodities we sell and the operation of company-owned and third party-owned infrastructure; |
• | security threats such as military campaigns, terrorist attacks, and cybersecurity breaches, against, or otherwise impacting, our facilities and systems; |
• | our ability to obtain insurance on commercially reasonable terms, if at all, as well as the adequacy of insurance to cover our losses; and |
• | the amount of natural gas we gather, compress, treat, process, transport, store and sell, or the NGLs we produce, fractionate, transport, store and sell, may be reduced if the pipelines and storage and fractionation facilities to which we deliver the natural gas or NGLs are capacity constrained and cannot, or will not, accept the natural gas or NGLs. |
In light of these risks, uncertainties and assumptions, the events described in the forward-looking statements might not occur or might occur to a different extent or at a different time than we have described. The forward-looking statements in this report speak as of the filing date of this report. We undertake no obligation to publicly update or revise any forward-looking statements, whether as a result of new information, future events or otherwise, except as required by applicable securities laws.
iii
PART I
Item 1. Business
OVERVIEW
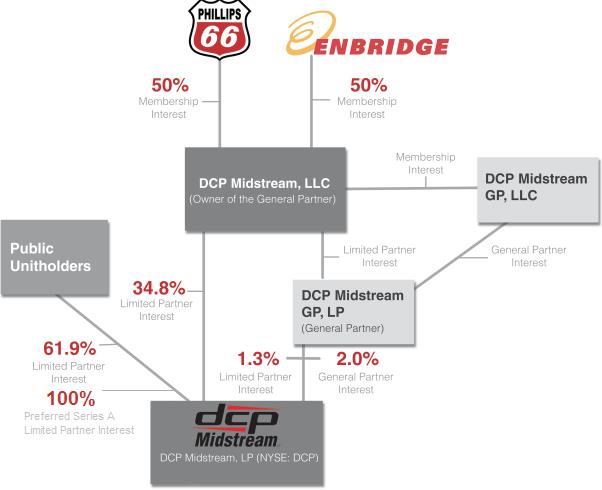
DCP Midstream, LP (together with its consolidated subsidiaries, “we”, “our”, “us”, the “registrant”, or the “Partnership”) is a Delaware limited Partnership formed in 2005 by DCP Midstream, LLC to own, operate, acquire and develop a diversified portfolio of complementary midstream energy assets. DCP Midstream, LLC and its subsidiaries and affiliates, collectively referred to as DCP Midstream, LLC is owned 50% by Phillips 66 and 50% by Enbridge Inc. and its affiliates, or Enbridge.
The diagram below depicts our organizational structure as of December 31, 2017.
Our operations are organized into two reportable segments: (i) Gathering and Processing and (ii) Logistics and Marketing. Our Gathering and Processing segment consists of gathering, compressing, treating, and processing natural gas, producing and fractionating NGLs, and recovering condensate. Our Logistics and Marketing segment includes transporting, trading, marketing, and storing natural gas and NGLs, fractionating NGLs, and wholesale propane logistics. The remainder of our business operations are presented as “Other,” and consist of unallocated corporate costs.
1
OUR BUSINESS STRATEGY
Our primary business objectives are to achieve sustained company profitability, a strong balance sheet and profitable growth, thereby sustaining and ultimately growing our cash distribution per unit. We intend to accomplish these objectives by prudently executing the following business strategies:
Operational Performance. We believe our operating efficiency and reliability enhance our ability to attract new natural gas supplies by enabling us to offer more competitive terms, services and service flexibility to producers. Our gathering and processing systems and logistics assets consist of high-quality, well-maintained facilities, resulting in low-cost, efficient operations. Our goal is to establish a reputation in the midstream industry as a reliable, safe and low cost supplier of services to our customers. We will continue to pursue new contracts, cost efficiencies and operating improvements of our assets through process and technology improvements. We seek to increase the utilization of our existing facilities by providing additional services to our existing customers and by establishing relationships with new customers. In addition, we maximize efficiency by coordinating the completion of new facilities in a manner that is consistent with the expected production that supports them.
Organic Growth. We intend to use our strategic asset base in the United States and our position as one of the largest gatherers of natural gas, and as one of the largest producers and marketers of NGLs in the United States, as a platform for future growth. We plan to grow our business by constructing new NGL and natural gas pipeline infrastructure, expanding existing infrastructure, and constructing new gathering lines and processing facilities.
Strategic Partnerships and Acquisitions. We intend to pursue economically attractive and strategic partnership and acquisition opportunities within the midstream energy industry, both in new and existing lines of business, and areas of operation.
OUR COMPETITIVE STRENGTHS
We are one of the largest gatherers of natural gas and one of the largest producers and marketers of NGLs in the United States. In 2017, our total wellhead volume was approximately 4.5 Bcf/d of natural gas and we produced an average of approximately 375 MBbls/d of NGLs. We provide natural gas gathering services to the wellhead, and leverage our strategic footprint to extend the value chain through our integrated NGL and natural gas pipelines and marketing infrastructure. We believe our ability to provide all of these services gives us an advantage in competing for new supplies of natural gas because we can provide substantially all services to move natural gas and NGLs from wellhead to market and creates value for our customers. We believe that we are well positioned to execute our business strategies and achieve one of our primary business objectives of sustaining our cash distribution per unit because of the following competitive strengths:
Strategically Located Gas Gathering and Processing Operations. Our assets are strategically located in areas with the potential for increasing our wellhead volumes and cash flow generation. We have operations in some of the largest producing regions in the United States: Denver-Julesburg Basin (“DJ Basin”), Permian Basin, Midcontinent, and Eagle Ford. In addition, we operate one of the largest portfolios of natural gas processing plants in the United States. Our gathering systems and processing plants are connected to numerous key natural gas pipeline systems that provide producers with access to a variety of natural gas market hubs.
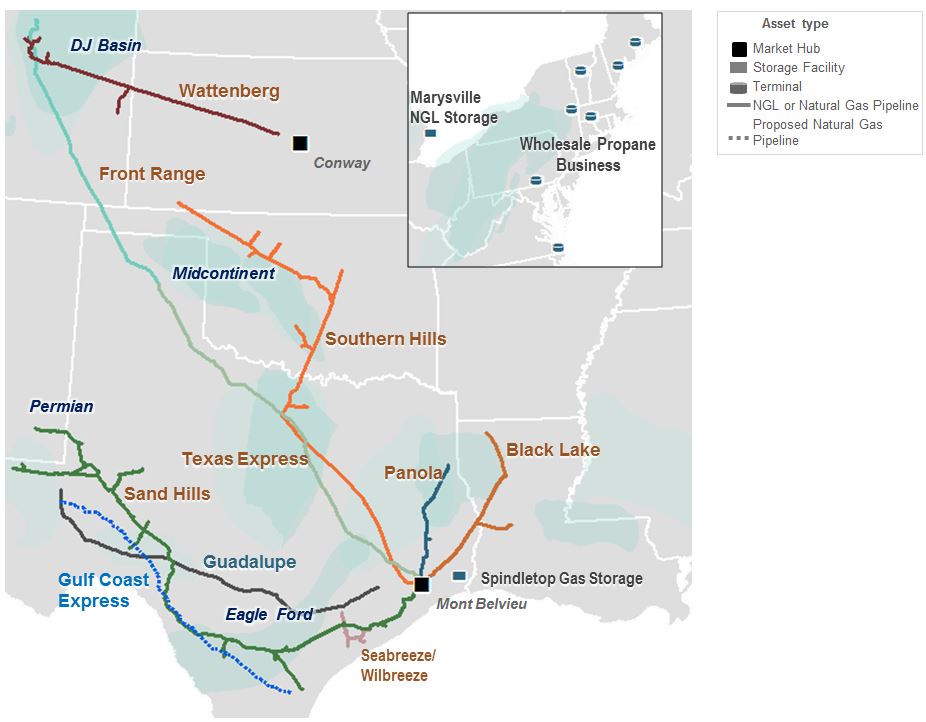
Integrated Logistics and Marketing Operations. We believe the strategic location of our assets coupled with their geographic diversity and our reputation for running our business reliably and effectively, presents us with continuing opportunities to provide competitive services to our customers and attract new natural gas production to our gathering and processing operations. We have connected our gathering and processing operations to key markets with NGL pipelines that we own or operate to offer our customers a competitive, integrated midstream service. We have strategically located NGL transportation pipelines that provide takeaway capabilities for our gathering and processing operations in the Permian Basin, DJ Basin, Midcontinent, East Texas, Gulf Coast, South Texas, and Central Texas. Our NGL pipelines connect to various natural gas processing plants and transport the NGLs to large fractionation facilities, a petrochemical plant, a third party underground NGL storage facility and other markets along the Gulf Coast. Our Logistics and Marketing operations also consists of multiple downstream assets including NGL fractionation facilities, an NGL storage facility and a residue gas storage facility.
Stable Cash Flows. Our operations consist of a mix of fee-based and commodity-based services, which together with our commodity hedging program, are intended to generate relatively stable cash flows. Growth in our fee-based earnings will reduce the impact of unhedged margins. Additionally, while certain of our gathering and processing contracts subject us to commodity price risk, we have mitigated a portion of our currently anticipated commodity price risk associated with the equity volumes from our gathering and processing operations with fixed price commodity swaps, settling through the first quarter of 2019.
Established Relationships with Oil, Natural Gas and Petrochemical Companies. We have long-term relationships with many of our suppliers and customers, and we expect that we will continue to benefit from these relationships.
2
Experienced Management Team. Our senior management team and board of directors have extensive experience in the midstream industry. We believe our management team has a proven track record of enhancing value through organic growth and the acquisition, optimization and integration of midstream assets.
Affiliation with DCP Midstream, LLC and its owners. Our relationship with DCP Midstream, LLC and its owners, Phillips 66 and Enbridge, should continue to provide us with significant business opportunities. Through our relationship with DCP Midstream, LLC and its owners, we believe our strong commercial relationships throughout the energy industry, including with major producers of natural gas and NGLs in the United States, will help facilitate the implementation of our strategies.
DCP Midstream, LLC has a significant interest in us through its ownership of an approximately 2% general partner interest, an approximately 36% limited partner interest and all of our incentive distribution rights.
OUR OPERATING SEGMENTS
Gathering and Processing Segment
General
Our Gathering and Processing segment consists of a geographically diverse complement of assets and ownership interests that provide a varied array of wellhead to market services for our producer customers in Alabama, Colorado, Kansas, Louisiana, Michigan, New Mexico, Oklahoma, Texas and Wyoming. These services include gathering, compressing, treating, and processing natural gas, producing and fractionating NGLs, and recovering condensate. Our Gathering and Processing segment’s operations are organized into four regions: North, Permian, Midcontinent and South. Our geographic diversity helps to mitigate our natural gas supply risk in that we are not tied to one natural gas resource type or producing area. We believe our current geographic mix of assets is an important factor for maintaining and growing overall volumes and cash flow for this segment. Our assets are positioned in certain areas with active drilling programs and opportunities for organic growth.
We provide our producer customers with gathering and processing services that allow them to move their raw (unprocessed) natural gas to market. Raw natural gas is gathered, compressed and transported through pipelines to our processing facilities. In order for the raw natural gas to be accepted by the downstream market, we remove water, nitrogen and carbon dioxide and separate NGLs for further processing. Processed natural gas, usually referred to as residue natural gas, is then recompressed and delivered to natural gas pipelines and end users. The separated NGLs are in a mixed, unfractionated form and are sold and delivered through natural gas liquids pipelines to fractionation facilities for further separation.
We own or operate 61 natural gas processing plants and an interest in one additional plant through our 40% equity interest in Discovery Producer Services, LLC, or Discovery. At some of these facilities, we fractionate NGLs into individual components (ethane, propane, butane and natural gasoline).
We receive natural gas from a diverse group of producers under contracts with varying durations, and we receive fees or commodities from the producers to transport the natural gas from the wellhead to the processing plant. We receive fees or commodities as payment for our natural gas processing services, depending on the types of contracts we enter into with each supplier. We purchase or take custody of substantially all of our natural gas from producers, principally under fee-based or percent-of-proceeds/index processing contracts.
We actively seek new producing customers of natural gas on all of our systems to increase throughput volume and to offset natural declines in the production from connected wells. We obtain new natural gas supplies in our operating areas by contracting for production from new wells, by connecting new wells drilled on dedicated acreage and by obtaining natural gas that has been directly received or released from other gathering systems.
Our contracts with our producing customers in our Gathering and Processing segment are a mix of non-commodity sensitive fee-based contracts and commodity sensitive percent-of-proceeds and percent-of-liquids contracts. Percent-of-proceeds contracts are directly related to the price of natural gas, NGLs and condensate and percent-of-liquids contracts are directly related to the price of NGLs and condensate. Additionally, these contracts may include fee-based components. Generally, the initial term of these purchase agreements is three to five years and in some cases, the life of the lease. As we negotiate new agreements and renegotiate existing agreements, this may result in a change in contract mix period over period.
We enter into derivative financial instruments to mitigate a portion of the risk of weakening natural gas, NGL and condensate prices associated with our gathering, processing and sales activities, thereby stabilizing our cash flows. Our commodity derivative instruments used for our hedging program are a combination of direct NGL product, crude oil, and natural gas hedges.
During 2017, total wellhead volume on our assets was approximately 4.5 Bcf/d, originating from a diversified mix of customers. Our systems each have significant customer acreage dedications that we expect will continue to provide
3
opportunities for growth as those customers execute their drilling plans over time. Our gathering systems also attract new natural gas volumes through numerous smaller acreage dedications and also by contracting with undedicated producers who are operating in or around our gathering footprint. During 2017, the combined NGL production from our processing facilities was approximately 375 MBbls/d and was delivered and sold into various NGL takeaway pipelines.
The following is operating data for our Gathering and Processing segment by region:
Operating Data | |||||||||||||||
Year Ended December 31, 2017 | |||||||||||||||
Regions | Plants | Approximate Gathering and Transmission Systems (Miles) | Approximate Net Nameplate Plant Capacity (MMcf/d) (a) | Natural Gas Wellhead Volume (MMcf/d) (a) | NGL Production (MBbls/d) (a) | ||||||||||
North | 13 | 4,000 | 1,260 | 1,121 | 86 | ||||||||||
Permian | 16 | 16,500 | 1,460 | 941 | 103 | ||||||||||
Midcontinent | 12 | 29,000 | 1,765 | 1,229 | 94 | ||||||||||
South | 20 | 7,500 | 3,295 | 1,240 | 92 | ||||||||||
Total | 61 | 57,000 | 7,780 | 4,531 | 375 | ||||||||||
(a) Represents total capacity or total volumes allocated to our proportionate ownership share.
4
North Region
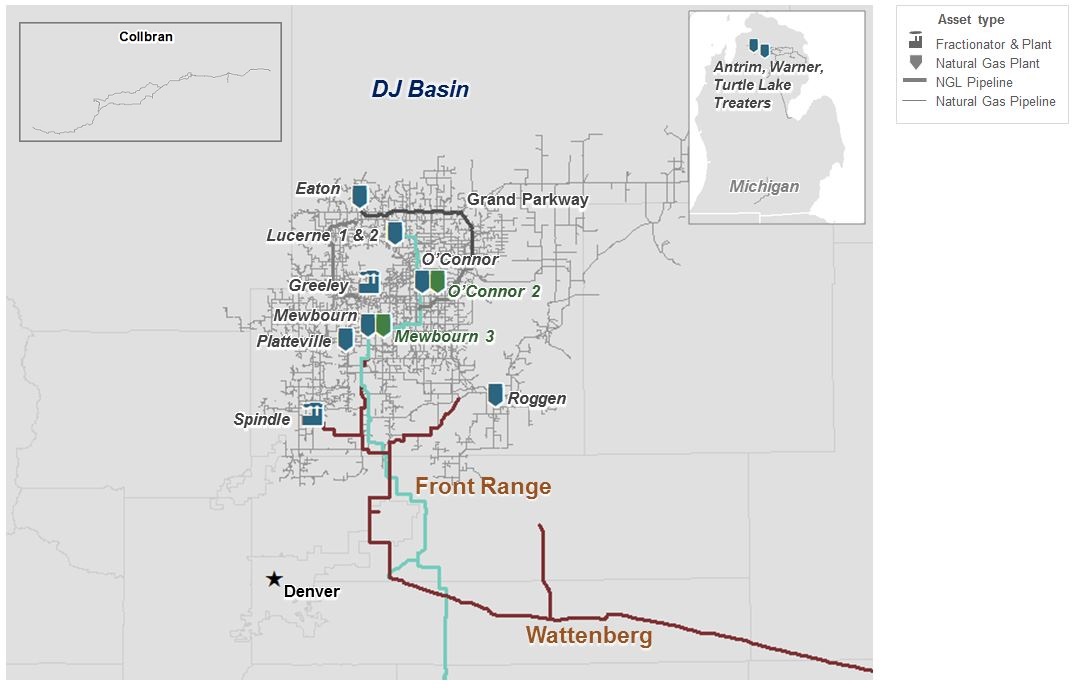
Our North region primarily consists of our DJ Basin system. We have a broad network of gathering and processing facilities in Weld County, Colorado that provide significant optionality and flexibility.
We are constructing a new 200 MMcf/d cryogenic natural gas processing plant, Mewbourn 3, and further expanding our Grand Parkway gathering system, both of which are expected to be placed in service in the third quarter of 2018. Our Mewbourn 3 plant will increase capacity to support the growing processing needs of producers in the DJ Basin. Our 200 MMcf/d O'Connor 2 plant and associated gathering infrastructure is progressing and expected to be in service in 2019.
Our DJ Basin system delivers to the Mont Belvieu hub in Mont Belvieu, Texas via the Front Range and Texas Express pipelines, owned 33.33% and 10% by us, respectively, and to the Conway hub in Bushton, Kansas via our Wattenberg pipeline in our Logistics and Marketing segment.
5
Permian Region
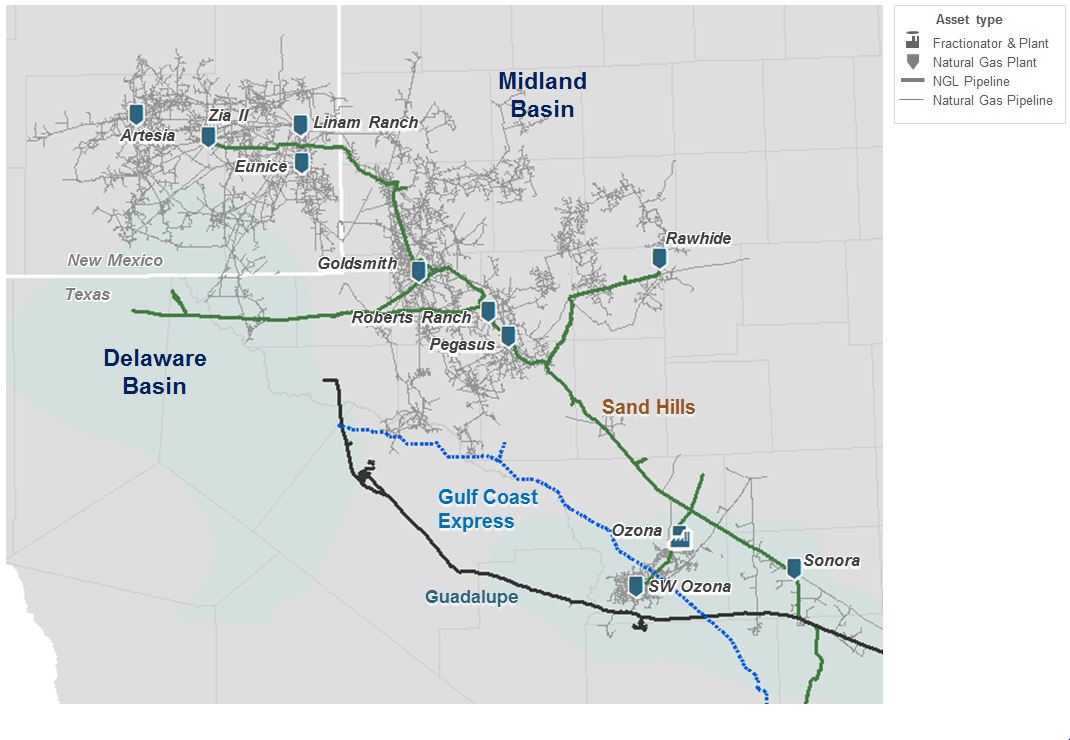
Our Permian region primarily includes our West Texas system in the Midland Basin and our Southeast New Mexico system in the Delaware Basin. Producers continue to focus drilling activity on the most attractive acreage in the Midland and Delaware Basins. Our gathering and processing assets in the Permian region provide NGL takeaway service via our Sand Hills pipeline, which is owned 66.67% by us and 33.33% by Phillips 66, to fractionation facilities along the Gulf Coast and to the Mont Belvieu hub.
6
Midcontinent Region
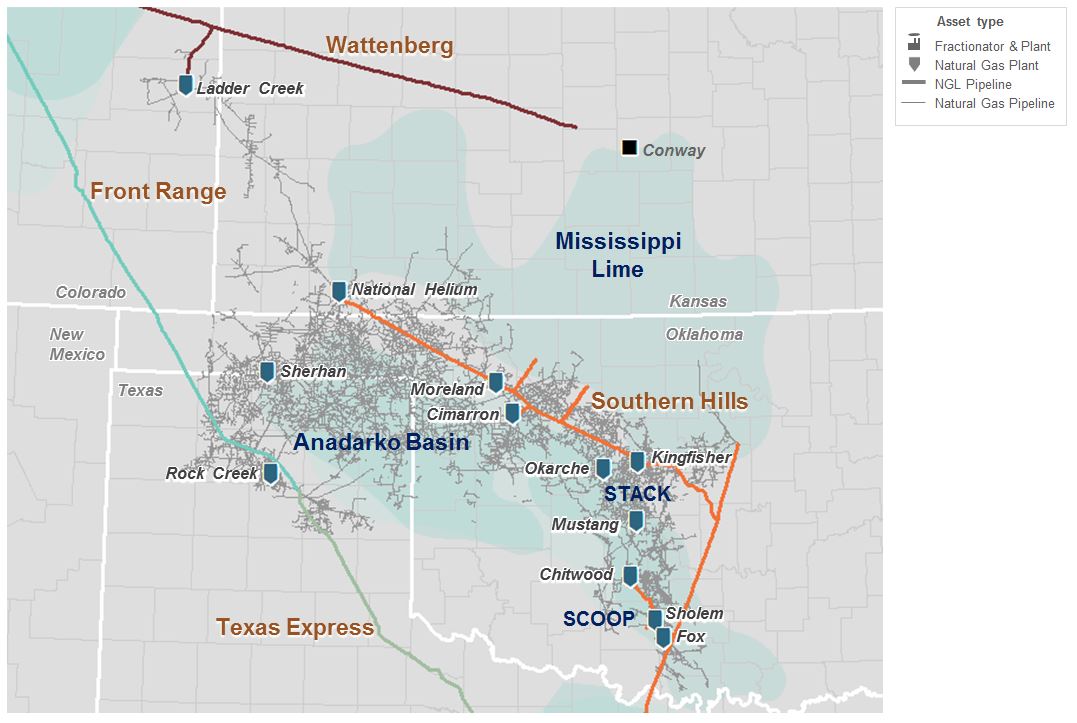
Our Midcontinent region primarily includes our Liberal system, Panhandle system, and our South Central Oklahoma system. We gather and process raw natural gas primarily from the Ardmore and Anadarko Basins, including the South Central Oklahoma Oil Province (“SCOOP”) play and the Sooner Trend Anadarko Basin Canadian and Kingfisher (“STACK”) play.
Existing production in the western Midcontinent region, which includes our Liberal and Panhandle systems, is typically from mature fields with shallow decline profiles that we expect will provide our plants with a dependable source of raw natural gas over a long term. We believe the infrastructure of our plants and gathering facilities is uniquely positioned to pursue our consolidation strategy in the western Midcontinent region. Our gathering system footprint in the eastern Midcontinent region, which includes our South Central Oklahoma system, serves the SCOOP and STACK plays.
Our gathering and processing assets in the Midcontinent region deliver NGLs primarily to the Gulf Coast and Mont Belvieu via our Southern Hills pipeline, owned 66.67% by us and 33.33% by Phillips 66.
7
South Region
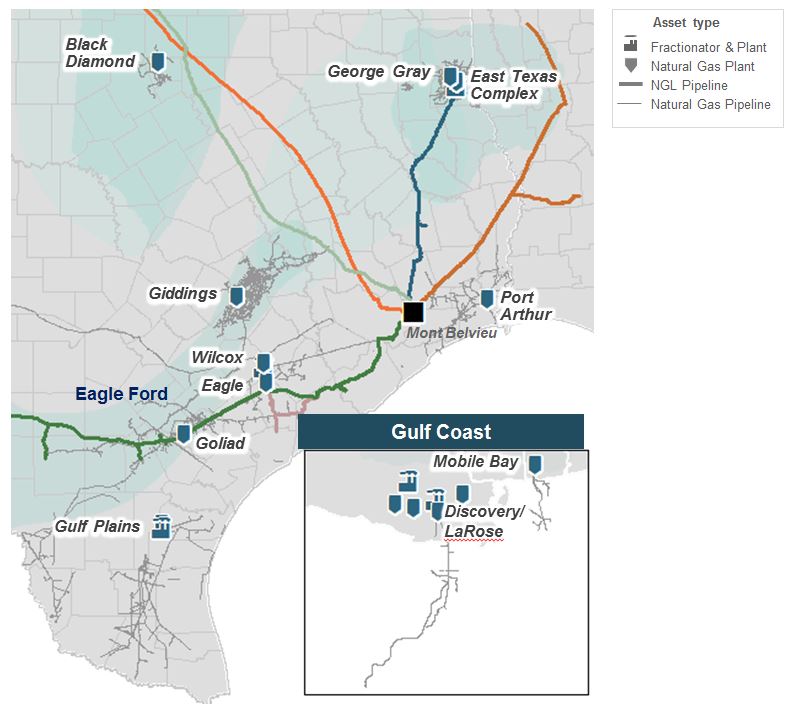
Our South region primarily includes our Eagle Ford system, East Texas system, and our 40% interest in the Discovery system. We are pursuing cost efficiencies and increasing the utilization of our existing assets.
Our Eagle Ford system delivers NGLs to the Gulf Coast petrochemical markets and to Mont Belvieu through our Sand Hills pipeline and other third party NGL pipelines. Our East Texas system provides NGL takeaway service through the Panola pipeline, owned 15% by us, and delivers gas primarily through its Carthage Hub which delivers residue gas to multiple interstate and intrastate pipelines.
The Discovery system is operated by Williams Partners L.P., which owns a 60% interest, and offers a full range of wellhead-to-market services to both onshore and offshore natural gas producers. The assets are primarily located in the eastern Gulf of Mexico and Louisiana, and have access to downstream pipelines and markets.
Competition
We face strong competition in acquiring raw natural gas supplies. Our competitors in obtaining additional gas supplies and in gathering and processing raw natural gas includes major integrated oil and gas companies, interstate and intrastate pipelines, and companies that gather, compress, treat, process, transport, store and/or market natural gas. Competition is often the greatest in geographic areas experiencing robust drilling by producers and during periods of high commodity prices for crude oil, natural gas and/or NGLs. Competition is also increased in those geographic areas where our commercial contracts with our customers are shorter term and therefore must be renegotiated on a more frequent basis.
8
Logistics and Marketing Segment
General
We market our NGLs, residue gas and condensate and provide logistics and marketing services to third-party NGL producers and sales customers in significant NGL production and market centers in the United States. This includes purchasing NGLs on behalf of third-party NGL producers for shipment on our NGL pipelines and resale in key markets.
Our NGL services include plant tailgate purchases, transportation, fractionation, flexible pricing options, price risk management and product-in-kind agreements. Our primary NGL operations are located in close proximity to our Gathering and Processing assets in each of the operating regions.
Our NGL pipelines transport NGLs from natural gas processing plants to fractionation facilities, a petrochemical plant and a third party underground NGL storage facility. Our pipelines provide transportation services to customers primarily on a fee basis. Therefore, the results of operations for this business are generally dependent upon the volume of product transported and the level of fees charged to customers. The volumes of NGLs transported on our pipelines are dependent on the level of production of NGLs from processing plants connected to our NGL pipelines. When natural gas prices are high relative to NGL prices, it is less profitable to recover NGLs from natural gas because of the higher value of natural gas compared to the value of NGLs. As a result, we have experienced periods, and will likely experience periods in the future, when higher relative natural gas prices reduce the volume of NGLs produced at plants connected to our NGL pipelines.
Our natural gas systems have the ability to deliver gas into numerous downstream transportation pipelines and markets. We sell residue gas on behalf of our producer customers and residue gas which we earn under our gas supply agreements, supplying the residue gas demands of end-use customers physically attached to our pipeline systems and managing excess capacity of our owned storage and transportation assets. End-users include large industrial companies, natural gas distribution companies and electric utilities. We are focused on extracting the highest possible value for the residue gas that results from our processing and transportation operations. We sell the residue gas at market-based prices.
9
Our ownership in various intrastate natural gas pipelines give us access to market centers/hubs such as Waha, Texas; Katy, Texas and the Houston Ship Channel and are used in our natural gas asset based trading activities.
The following is operating data for our Logistics and Marketing segment:
Operating Data | |||||||||||||||||||||
Year Ended December 31, 2017 | |||||||||||||||||||||
System | Approximate System Length (Miles) | Fractionators | Approximate Throughput Capacity (MBbls/d) (a) | Approximate NGL Storage Capacity (MMBbls) | Approximate Natural Gas Storage Capacity (Bcf) | Pipeline Throughput (MBbls/d) (a) | Fractionator Throughput (MBbls/d) (a) | ||||||||||||||
Sand Hills pipeline | 1,300 | — | 227 | — | — | 192 | — | ||||||||||||||
Southern Hills pipeline | 950 | — | 117 | — | — | 69 | — | ||||||||||||||
Front Range pipeline | 455 | — | 50 | — | — | 36 | — | ||||||||||||||
Texas Express pipeline | 595 | — | 28 | — | — | 15 | — | ||||||||||||||
Other pipelines | 1,200 | — | 241 | — | — | 148 | — | ||||||||||||||
Mont Belvieu fractionators | — | 2 | 60 | — | — | — | 48 | ||||||||||||||
Storage facilities | — | — | — | 8 | 12 | — | — | ||||||||||||||
Total | 4,500 | 2 | 722 | 8 | 12 | 460 | 48 | ||||||||||||||
(a) | Represents total NGL capacity or throughput allocated to our proportionate ownership share for 2017 divided by 365 days. |
NGL Pipelines
DCP Sand Hills Pipeline, LLC, or the Sand Hills pipeline, an interstate NGL pipeline in which we own a 66.67% interest, is a common carrier pipeline which provides takeaway service from plants in the Permian and the Eagle Ford basins to fractionation facilities along the Texas Gulf Coast and at the Mont Belvieu, Texas market hub. We have completed the expansion of the Sand Hills pipeline to 365 MBbls/d in the first quarter of 2018. Further Sand Hills pipeline expansion to 450 MBbls/d is progressing and includes a partial looping of the pipeline and the addition of new pump stations, and is expected to be in service in the second half of 2018.
DCP Southern Hills Pipeline, LLC, or the Southern Hills pipeline, an interstate NGL pipeline in which we own a 66.67% interest, provides takeaway service from the Midcontinent to fractionation facilities at the Mont Belvieu, Texas market hub.
Front Range Pipeline LLC, or the Front Range pipeline, an interstate NGL pipeline in which we own a 33.33% interest, originates in the DJ Basin and extends to Skellytown, Texas. The Front Range pipeline connects to our O'Connor, Lucerne 1, Lucerne 2, and Mewbourn plants as well as third party plants in the DJ Basin. Enterprise Products Partners L.P., or Enterprise, is the operator of the pipeline.
Texas Express Pipeline LLC, or the Texas Express pipeline, an intrastate NGL pipeline in which we own a 10% interest, originates near Skellytown in Carson County, Texas, and extends to Enterprise's natural gas liquids fractionation and storage complex at Mont Belvieu, Texas. The pipeline also provides access to other third party facilities in the area. Enterprise is the operator of the pipeline.
The Southern Hills, Sand Hills, Texas Express, and Front Range pipelines have in place long-term, fee-based transportation agreements, a portion of which are ship-or-pay, with us as well as third party shippers. These NGL pipelines collect fee-based transportation revenue under regulated tariffs.
NGL Fractionation Facilities
We own a 12.5% interest in the Enterprise fractionator operated by Enterprise and a 20% interest in the Mont Belvieu 1 fractionator operated by ONEOK Partners, both located in Mont Belvieu, Texas. The fractionation facilities separate NGLs received from processing plants into their individual components. These fractionation services are provided on a fee basis. The
10
results of operations for this business are generally dependent upon the volume of NGLs fractionated and the level of fees charged to customers.
Storage Facilities
Our NGL storage facility, which stores ethane, propane and butane, is located in Marysville, Michigan and has strategic access to the Marcellus, Utica and Canadian NGLs. Our facility includes 11 underground salt caverns with approximately 8 MMBbls of storage capacity. Our facility serves regional refining and petrochemical demand, and helps to balance the seasonality of propane distribution in the Midwestern and Northeastern United States and in Sarnia, Canada. We provide services to customers primarily on a fee basis under multi-year storage agreements. The results of operations for this business are generally dependent upon the volume stored and the level of fees charged to customers.
Our Spindletop natural gas storage facility is located in Texas and plays an important role in our ability to act as a full-service natural gas marketer. The facility has capacity for residue gas of approximately 12 Bcf. We may lease a portion of the facility’s capacity to third-party customers, and use the balance to manage relatively constant natural gas supply volumes with uneven demand levels, provide “backup” service to our customers and support our asset based trading activities. Our asset based trading activities are designed to realize margins related to fluctuations in commodity prices, time spreads and basis differentials and to maximize the value of our storage facility.
Wholesale Propane
We operate a wholesale propane logistics business in the mid-Atlantic, upper Midwest and Northeastern United States. We purchase large volumes of propane supply from fractionation facilities and crude oil refineries, primarily located in the Marcellus/Utica area, Canada and other international sources, and transport these volumes of propane supply by pipeline, rail or ship to our terminals and storage facilities. We primarily sell propane on a wholesale basis to propane distributors under annual sales agreements who in turn resell propane to their customers. Our operations include one owned marine terminal, five owned propane rail terminals and one joint venture rail terminal, with access to several open access pipeline terminals.
The wholesale propane marketing business is significantly impacted by seasonal and weather-driven demand, particularly in the winter, which can impact the price and volume of propane sold in the markets we serve.
Trading and Marketing
Our energy trading operations are exposed to market variables and commodity price risk. We manage commodity price risk related to our natural gas storage and pipeline assets by engaging in natural gas asset based trading and marketing. We may enter into physical contracts and financial instruments with the objective of realizing a positive margin from the purchase and sale of commodity-based instruments.
Our NGL proprietary trading activity includes trading energy related products and services. We undertake these activities through the use of fixed forward sales and purchases, basis and spread trades, storage opportunities, put/call options, term contracts and spot market trading. These energy trading operations are exposed to market variables and commodity price risk with respect to these products and services, and these operations may enter into physical contracts and financial instruments with the objective of realizing a positive margin from the purchase and sale of commodity-based instruments.
We may execute a time spread transaction when the difference between the current price of natural gas (cash or futures) and the futures market price for natural gas exceeds our cost of storing physical gas in our owned and/or leased storage facilities. The time spread transaction allows us to lock in a margin when this market condition exists. A time spread transaction is executed by establishing a long gas position at one point in time and establishing an equal short gas position at a different point in time.
We may execute basis spread transactions when the market price differential between locations on a pipeline asset exceeds our cost of transporting physical gas through our owned and/or leased pipeline asset. When this market condition exists, we may execute derivative instruments around this differential at the market price. This basis spread transaction allows us to lock in a margin on our physical purchases and sales of gas.
Customers and Contracts
We sell our commodities to a variety of customers ranging from large, multi-national petrochemical and refining companies to small regional retail propane distributors. Substantially all of our NGL sales are made at market-based prices, including approximately 22% of our NGL production which was committed to Phillips 66 and Chevron Phillips Chemical, or CPChem as of December 31, 2017. The primary production commitment on certain contracts began a ratable wind down period in December 2014 and expires in January 2019. We anticipate continuing to purchase and sell commodities with Phillips 66 and CPChem in the ordinary course of business.
11
Competition
The Logistics and Marketing business is highly competitive in our markets and includes interstate and intrastate pipelines, integrated oil and gas companies that produce, fractionate, transport, store and sell natural gas and NGLs, and underground storage facilities. Competition is often the greatest in geographic areas experiencing robust drilling by producers and strong petrochemical demand and during periods of high NGL prices relative to natural gas. Competition is also increased in those geographic areas where our contracts with our customers are shorter term and therefore must be renegotiated on a more frequent basis.
Competition in the NGLs marketing area comes from other midstream NGL marketing companies, international producers/traders, chemical companies, refineries and other asset owners. Along with numerous marketing competitors, we offer price risk management and other services. We believe it is important that we tailor our services to the end-use customer to remain competitive.
Other Segment Information
For additional information on our segments, please see Item 7. “Management’s Discussion and Analysis of Financial Condition and Results of Operations,” and Note 21 of the Notes to Consolidated Financial Statements in Item 8. “Financial Statements and Supplementary Data."
We have no revenue attributable to international activities.
REGULATORY AND ENVIRONMENTAL MATTERS
Safety and Maintenance Regulation
We are subject to regulation by the United States Department of Transportation, or DOT, under the Hazardous Liquids Pipeline Safety Act of 1979, as amended, or HLPSA, and comparable state statutes with respect to design, installation, testing, construction, operation, replacement and management of pipeline facilities. HLPSA applies to interstate and intrastate pipeline facilities and the pipeline transportation of liquid petroleum and petroleum products, including NGLs and condensate, and requires any entity that owns or operates pipeline facilities to comply with such regulations, to permit access to and copying of records and to file certain reports and provide information as required by the United States Secretary of Transportation. These regulations include potential fines and penalties for violations. We believe that we are in compliance in all material respects with these HLPSA regulations.
We are also subject to the Natural Gas Pipeline Safety Act of 1968, as amended, or NGPSA, and the Pipeline Safety Improvement Act of 2002. The NGPSA regulates safety requirements in the design, construction, operation and maintenance of gas pipeline facilities while the Pipeline Safety Improvement Act establishes mandatory inspections for all United States oil and natural gas transportation pipelines in high-consequence areas within 10 years. DOT, through the Pipeline and Hazardous Materials Safety Administration (PHMSA), has developed regulations implementing the Pipeline Safety Improvement Act that requires pipeline operators to implement integrity management programs, including more frequent inspections and other safety protections in areas where the consequences of potential pipeline accidents pose the greatest risk to people and their property.
Pipeline safety legislation enacted in 2012, the Pipeline Safety, Regulatory Certainty, and Job Creation Act of 2011, (the Pipeline Safety and Job Creations Act) reauthorizes funding for federal pipeline safety programs through 2015, increases penalties for safety violations, establishes additional safety requirements for newly constructed pipelines, and requires studies of certain safety issues that could result in the adoption of new regulatory requirements for existing pipelines, including the expansion of integrity management, use of automatic and remote-controlled shut-off valves, leak detection systems, sufficiency of existing regulation of gathering pipelines, use of excess flow valves, verification of maximum allowable operating pressure, incident notification, and other pipeline-safety related requirements. New rules proposed by DOT’s PHMSA address many areas of this legislation. Extending the integrity management requirements to our gathering lines would impose additional obligations on us and could add material cost to our operations.
The Pipeline Safety and Job Creation Act requires more stringent oversight of pipelines and increased civil penalties for violations of pipeline safety rules. The legislation gives PHMSA civil penalty authority up to $200,000 per day per violation, with a maximum of $2 million for any related series of violations. Any material penalties or fines under these or other statutes, rules, regulations or orders could have a material adverse impact on our business, financial condition, results of operation and cash flows.
We currently estimate we will incur approximately $47 million between 2018 and 2022 to implement integrity management program testing along certain segments of our natural gas transmission and NGL pipelines. We believe that we are in compliance in all material respects with the NGPSA and the Pipeline Safety Improvement Act of 2002 and the Pipeline Safety and Job Creation Act.
12
States are largely preempted by federal law from regulating pipeline safety but may assume responsibility for enforcing intrastate pipeline regulations at least as stringent as the federal standards. In practice, states vary considerably in their authority and capacity to address pipeline safety. We do not anticipate any significant problems in complying with applicable state laws and regulations in those states in which we or the entities in which we own an interest operate. Our natural gas transmission and regulated gathering pipelines have ongoing inspection and compliance programs designed to keep the facilities in compliance with pipeline safety and pollution control requirements.
In addition, we are subject to the requirements of the federal Occupational Safety and Health Act, or OSHA, and comparable state statutes, whose purpose is to protect the health and safety of workers, both generally and within the pipeline industry. In addition, the OSHA hazard communication standard, the Environmental Protection Agency, or EPA, community right-to-know regulations under Title III of the federal Superfund Amendment and Reauthorization Act and comparable state statutes require that information be maintained concerning hazardous materials used or produced in our operations and that this information be provided to employees, state and local government authorities and citizens. We and the entities in which we own an interest are also subject to OSHA Process Safety Management and EPA Risk Management Program regulations, which are designed to prevent or minimize the consequences of catastrophic releases of toxic, reactive, flammable or explosive chemicals. The OSHA regulations apply to any process which involves a chemical at or above specified thresholds, or any process which involves flammable liquid or gas, pressurized tanks, caverns and wells holding or handling these materials in quantities in excess of 10,000 pounds at various locations. Flammable liquids stored in atmospheric tanks below their normal boiling point without the benefit of chilling or refrigeration are exempt from these standards. The EPA regulations have similar applicability thresholds. We have an internal program of inspection designed to monitor and enforce compliance with worker safety requirements. We believe that we are in compliance in all material respects with all applicable laws and regulations relating to worker health and safety.
Propane Regulation
National Fire Protection Association Codes No. 54 and No. 58, which establish rules and procedures governing the safe handling of propane, or comparable regulations, have been adopted as the industry standard in all of the states in which we operate. In some states these laws are administered by state agencies, and in others they are administered on a municipal level. The transportation of propane by rail is regulated by the Federal Railroad Administration. We conduct ongoing training programs to help ensure that our operations are in compliance with applicable regulations. We maintain various permits that are necessary to operate our facilities, some of which may be material to our propane operations. We believe that the procedures currently in effect at all of our facilities for the handling, storage and distribution of propane are consistent with industry standards and are in compliance in all material respects with applicable laws and regulations.
FERC and State Regulation of Operations
FERC regulation of interstate natural gas pipelines, the marketing and sale of natural gas in interstate commerce and the transportation of NGLs in interstate commerce may affect certain aspects of our business and the market for our products and services. Regulation of gathering systems and intrastate transportation of natural gas and NGLs by state agencies may also affect our business.
Interstate Natural Gas Pipeline Regulation
Our Cimarron River, Discovery, and Dauphin Island Gathering Partners systems, or portions thereof, are some of our natural gas pipeline assets that are subject to regulation by FERC, under the Natural Gas Act of 1938, as amended, or NGA. Natural gas companies subject to the NGA may only charge rates that have been determined to be just and reasonable. In addition, FERC authority over natural gas companies that provide natural gas pipeline transportation services in interstate commerce includes:
• | certification and construction of new facilities; |
• | abandonment of services and facilities; |
• | maintenance of accounts and records; |
• | acquisition and disposition of facilities; |
• | initiation and discontinuation of transportation services; |
• | terms and conditions of transportation services and service contracts with customers; |
• | depreciation and amortization policies; |
• | conduct and relationship with certain affiliates; and |
• | various other matters. |
Generally, the maximum filed recourse rates for an interstate natural gas pipeline's transportation services are based on the pipeline's cost of service including recovery of and a return on the pipeline’s actual prudent investment cost. Key determinants in the ratemaking process are costs of providing service, including an income tax allowance, allowed rate of return and volume
13
throughput and contractual capacity commitment assumptions. The allocation of costs to various pipeline services and the manner in which rates are designed also can impact a pipeline's profitability. The maximum applicable recourse rates and terms and conditions for service are set forth in each pipeline’s FERC-approved gas tariff. FERC-regulated natural gas pipelines are permitted to discount their firm and interruptible rates without further FERC authorization down to the minimum rate or variable cost of performing service, provided they do not “unduly discriminate.”
Tariff changes can only be implemented upon approval by FERC. Two primary methods are available for changing the rates, terms and conditions of service of an interstate natural gas pipeline. Under the first method, the pipeline voluntarily seeks a tariff change by making a tariff filing with FERC justifying the proposed tariff change and providing notice, generally 30 days, to the appropriate parties. If FERC determines, as required by the NGA, that a proposed change is just and reasonable, FERC will accept the proposed change and the pipeline will implement such change in its tariff. However, if FERC determines that a proposed change may not be just and reasonable as required by NGA, then FERC may suspend such change for up to five months beyond the date on which the change would otherwise go into effect and set the matter for an administrative hearing. Subsequent to any suspension period ordered by FERC, the proposed change may be placed into effect by the company, pending final FERC approval. In most cases, a proposed rate increase is placed into effect before a final FERC determination on such rate increase, and the proposed increase is collected subject to refund (plus interest). Under the second method, FERC may, on its own motion or based on a complaint, initiate a proceeding to compel the company to change or justify its rates, terms and/or conditions of service. If FERC determines that the existing rates, terms and/or conditions of service are unjust, unreasonable, unduly discriminatory or preferential, then any rate reduction or change that it orders generally will be effective prospectively from the date of the FERC order requiring this change.
The natural gas industry historically has been heavily regulated; therefore, there is no assurance that a more stringent regulatory approach will not be pursued by FERC and Congress, especially in light of potential market power abuse by marketing companies engaged in interstate commerce. In the Energy Policy Act of 2005, or EPACT 2005, Congress amended the NGA and Federal Power Act to add anti-fraud and anti-manipulation requirements. EPACT 2005 prohibits the use of any “manipulative or deceptive device or contrivance” in connection with the purchase or sale of natural gas, electric energy or transportation subject to FERC jurisdiction. FERC adopted market manipulation and market behavior rules to implement the authority granted under EPACT 2005. These rules, which prohibit fraud and manipulation in wholesale energy markets, are subject to broad interpretation. Given FERC's broad mandate granted in EPACT 2005, if energy prices are high, or exhibit what FERC deems to be "unusual" trading patterns, FERC may investigate energy markets to determine if behavior unduly impacted or "manipulated" energy prices.
In addition, EPACT 2005 gave FERC increased penalty authority for violations of the NGA and FERC's rules and regulations thereunder. FERC may issue civil penalties of up to $1 million per day per violation, and violators may be subject to criminal penalties of up to $1 million per violation and five years in prison. FERC may also order disgorgement of profits obtained in violation of FERC rules. FERC relies on its enforcement authority in issuing a number of natural gas enforcement actions. Failure to comply with the NGA and FERC's rules and regulations thereunder could result in the imposition of civil penalties and disgorgement of profits.
Intrastate Natural Gas Pipeline Regulation
Intrastate natural gas pipeline operations are not generally subject to rate regulation by FERC, but they are subject to regulation by various agencies in the respective states where they are located. While the regulatory regime varies from state to state, state agencies typically require intrastate gas pipelines to provide service that is not unduly discriminatory and to file and/or seek approval of their rates with the agencies and permit shippers to challenge existing rates or proposed rate increases. For example, our Guadalupe system is an intrastate pipeline regulated as a gas utility by the Railroad Commission of Texas. To the extent that an intrastate pipeline system transports natural gas in interstate commerce, the rates and terms and conditions of such interstate transportation service are subject to FERC rules and regulations under Section 311 of the Natural Gas Policy Act, or NGPA. Certain of our systems are subject to FERC jurisdiction under Section 311 of the NGPA for their interstate transportation services. Section 311 regulates, among other things, the provision of transportation services by an intrastate natural gas pipeline on behalf of a local distribution company or an interstate natural gas pipeline. Under Section 311, rates charged for transportation must be fair and equitable, and amounts collected in excess of fair and equitable rates are subject to refund with interest. Rates for service pursuant to Section 311 of the NGPA are generally subject to review and approval by FERC at least once every five years. Additionally, the terms and conditions of service set forth in the intrastate pipeline’s Statement of Operating Conditions are subject to FERC approval. Non-compliance with FERC's rules and regulations established under Section 311 of the NGPA, including failure to observe the service limitations applicable to transportation services provided under Section 311, failure to comply with the rates approved by FERC for Section 311 service, and failure to comply with the terms and conditions of service established in the pipeline’s FERC-approved Statement of Operating Conditions could result in the imposition of civil and criminal penalties. Among other matters, EPACT 2005 also amended the
14
NGPA to give FERC authority to impose civil penalties for violations of the NGPA up to $1 million for any one violation and violators may be subject to criminal penalties of up to $1 million per violation and five years in prison.
Gathering Pipeline Regulation
Section 1(b) of the NGA exempts natural gas gathering facilities from the jurisdiction of FERC under the NGA. We believe that our natural gas gathering facilities meet the traditional tests FERC has used to establish a pipeline’s status as a gatherer not subject to FERC jurisdiction. However, the distinction between FERC-regulated transmission services and federally unregulated gathering services continues to be a current issue in various FERC proceedings with respect to facilities that interconnect gathering and processing plants with nearby interstate pipelines, so the classification and regulation of our gathering facilities may be subject to change based on future determinations by FERC and the courts. State regulation of gathering facilities generally includes various safety, environmental, and, in many circumstances, nondiscriminatory take requirements and complaint-based rate regulation.
Our purchasing, gathering and intrastate transportation operations are subject to ratable take and common purchaser statutes in the states in which they operate. The ratable take statutes generally require gatherers to take, without undue discrimination, natural gas production that may be tendered to the gatherer for handling. Similarly, common purchaser statutes generally require gatherers to purchase without undue discrimination as to source of supply or producer. These statutes are designed to prohibit discrimination in favor of one producer over another producer or one source of supply over another source of supply. These statutes have the effect of restricting our right as an owner of gathering facilities to decide with whom we contract to purchase or transport natural gas.
Natural gas gathering may receive greater regulatory scrutiny at both the state and federal levels where FERC has recognized a jurisdictional exemption for the gathering activities of interstate pipeline transmission companies and a number of such companies have transferred gathering facilities to unregulated affiliates. Many of the producing states have adopted some form of complaint-based regulation that generally allows natural gas producers and shippers to file complaints with state regulators in an effort to resolve grievances relating to natural gas gathering access and rate discrimination. Our gathering operations could be adversely affected should they be subject in the future to the application of state or federal regulation of rates and services. Additional rules and legislation pertaining to these matters are considered or adopted from time to time. We cannot predict what effect, if any, such changes might have on our operations, but the industry could be required to incur additional capital expenditures and increased costs depending on future legislative and regulatory changes.
Sales of Natural Gas
The price at which we buy and sell natural gas currently is not subject to federal regulation and, for the most part, is not subject to state regulation. However, with regard to our interstate purchases and sales of natural gas, and any related hedging activities that we undertake, we are required to observe anti-market manipulation laws and related regulations enforced by FERC and/or the Commodity Futures Trading Commission, or CFTC. Should we violate the anti-market manipulation laws and regulations, in additional to civil and criminal penalties, we could be subject to related third party damage claims by, among others, market participants, sellers, royalty owners and taxing authorities.
Our sales of natural gas are affected by the availability, terms and cost of pipeline transportation. As noted above, the price and terms of access to pipeline transportation are subject to extensive federal and state regulation. FERC is continually proposing and implementing new rules and regulations affecting those segments of the natural gas industry, most notably interstate natural gas transmission companies that remain subject to FERC jurisdiction. These initiatives also may affect the intrastate transportation of natural gas under certain circumstances. The stated purpose of many of these regulatory changes is to promote competition among the various sectors of the natural gas industry. We cannot predict the ultimate impact of these regulatory changes to our natural gas marketing operations.
Interstate NGL Pipeline Regulation
Certain of our pipelines, including Sand Hills and Southern Hills, are common carriers that provide interstate NGL transportation services subject to FERC regulation. FERC regulates interstate common carriers under its Oil Pipeline Regulations, the Interstate Commerce Act of 1887, as amended, or ICA, and the Elkins Act of 1903, as amended. FERC requires that common carriers file tariffs containing all the rates, charges and other terms for services provided by such pipelines. The ICA requires that tariffs apply to the interstate movement of NGLs, as is the case with the Sand Hills, Southern Hills, Black Lake, Wattenberg and Front Range pipelines. Pursuant to the ICA, rates must be just, reasonable, and nondiscriminatory, and can be challenged at FERC either by protest when they are initially filed or increased or by complaint at any time they remain on file with FERC.
In October 1992, Congress passed EPACT, which among other things, required FERC to issue rules establishing a
15
simplified and generally applicable ratemaking methodology for pipelines regulated by FERC pursuant to the ICA. FERC responded to this mandate by issuing several orders, including Order No. 561 that enables common carrier pipelines to charge rates up to their ceiling levels, which are adjusted annually based on an inflation index. Specifically, the indexing methodology requires a pipeline to adjust the ceiling level for its rates annually by the inflation index established by the FERC. FERC reviews the indexing methodology every five years, and in 2015, the indexing methodology for the five years beginning July 1, 2016 was changed to be the Producer Price Index for Finished Goods plus 1.23 percent. Rate increases made pursuant to the indexing methodology are subject to protest, but such protests must show that the portion of the rate increase resulting from application of the index is substantially in excess of the pipeline’s increase in costs from the previous year. If the indexing methodology results in a reduced ceiling level that is lower than a pipeline’s filed rate, the pipeline is required to reduce its rate to comply with the lower ceiling unless doing so would reduce a rate “grandfathered” under EPACT below the grandfathered level. A pipeline must, as a general rule, utilize the indexing methodology to change its rates. FERC, however, retained cost-of-service ratemaking, market-based rates, and settlement as alternatives to the indexing approach, which alternatives may be used in certain specified circumstances. The ceiling levels calculated for our interstate NGL pipelines are typically increased each year pursuant to the indexing methodology, but may be subject to decrease, which occurred in 2016 and resulted in the decrease in the tariff rates for many such pipelines.
On October 20, 2016, FERC issued an Advance Notice of Proposed Rulemaking, which presented significant changes to the indexing mechanism and reporting requirements of common carriers subject to FERC’s jurisdiction under the ICA. The proposed changes to the indexing methodology, would prohibit an increase in a common carrier’s ceiling level and rates if a complaint was filed and the return as reported by the common carrier in two previous annual reports exceeded a predetermined threshold. Additionally, the FERC proposed multiple changes to its annual reporting requirements. We cannot predict the outcome of the proceeding, but the proposal, if implemented, could adversely impact future rate increases of our common carriers and place additional administration and reporting burdens on our business.
Intrastate NGL Pipeline Regulation
NGL and other common carrier petroleum pipelines that provide intrastate transportation services are subject to regulation by various agencies in the respective states where they are located. While the regulatory regime varies from state to state, state agencies typically require intrastate petroleum pipelines to file tariffs and their rates with the agencies and permit shippers to challenge existing rates or proposed rate increases. For example, certain of our pipelines have tariffs filed with the Railroad Commission of Texas for their intrastate NGL transportation services.
Environmental Matters
General
Our operation of pipelines, plants and other facilities for gathering, compressing, treating, processing, transporting, fractionating, storing or selling natural gas, NGLs and other products is subject to stringent and complex federal, state and local laws and regulations governing the emission or discharge of materials into the environment or otherwise relating to the protection of the environment.
As an owner or operator of these facilities, we must comply with these laws and regulations at the federal, state and local levels. These laws and regulations can restrict or impact our business activities in many ways, such as:
• | requiring the acquisition of permits or authorizations to conduct regulated activities and imposing obligations in those permits, potentially including capital expenditures or operational requirements, that reduce or limit impacts to the environment; |
• | restricting the ways that we can handle or dispose of our wastes; |
• | limiting or prohibiting construction or operational activities in sensitive areas such as wetlands, coastal regions or areas inhabited by threatened and endangered species; |
• | requiring remedial action to mitigate pollution conditions caused by our operations or attributable to former operations; and |
• | enjoining, or compelling changes to, the operations of facilities deemed not to be in compliance with permits issued pursuant to such environmental laws and regulations. |
Failure to comply with these laws and regulations may trigger a variety of administrative, civil, or potentially criminal enforcement measures, including the assessment of monetary penalties, the imposition of remedial requirements, potential citizen lawsuits, and the issuance of orders enjoining or affecting future operations. Certain environmental statutes impose strict liability or joint and several liability for costs required to clean up and restore sites where hazardous substances, or in some cases hydrocarbons, have been disposed or otherwise released. Moreover, it is not uncommon for neighboring landowners and
16
other third parties to file claims for property damage or personal injury allegedly caused by the release of substances or other waste products into the environment.
The overall trend in federal and state environmental programs is to expand regulatory requirements, placing more restrictions and limitations on activities that may affect the environment. Thus, there can be no assurance as to the amount or timing of future expenditures for environmental compliance or remediation, and actual future expenditures may be different from the amounts we currently anticipate. We try to anticipate future regulatory requirements that might be imposed and plan accordingly to remain in compliance with changing environmental laws and regulations, participate as applicable in the public process to ensure such new requirements are well founded and reasonable or to revise them if they are not, and to manage the costs of such compliance. We also actively participate in industry groups that help formulate recommendations for addressing existing or future regulations.
We do not believe that compliance with federal, state or local environmental laws and regulations will have a material adverse effect on our business, financial position or results of operations. Below is a discussion of the more significant environmental laws and regulations that relate to our business.
Impact of Air Quality Standards and Climate Change
A number of states have adopted or considered programs to reduce “greenhouse gases,” or GHGs, which can include methane, and, depending on the particular program or jurisdiction, we could be required to purchase and surrender allowances, either for GHG emissions resulting from our operations (e.g., compressor units) or from downstream combustion of fuels (e.g., oil or natural gas) that we process, or we may otherwise be required by regulation to take steps to reduce emissions of GHGs. Also, the EPA has declared that GHGs “endanger” public health and welfare, and is regulating GHG emissions from mobile sources such as cars and trucks. The EPA's 2010 action on the GHG vehicle emission rule triggered regulation of carbon dioxide and other GHG emissions from stationary sources under certain Clean Air Act programs at both the federal and state levels, including the Prevention of Significant Deterioration (“PSD”) program and Title V permitting. In 2016 EPA proposed a rule to revise the PSD and Title V permitting regulations applicable to GHGs in response to a 2014 U.S. Supreme Court decision and subsequent D.C. Circuit decision striking down its 2011 rules. The proposed revisions required that major sources of non-GHG air pollutants, such as volatile organic compounds or nitrogen oxides, which also emit 100,000 tons per year or more of CO2 equivalent (or modifications of these sources that result in an emissions increase of 75,000 tons per year or more of CO2 equivalent), obtain permits addressing emissions of greenhouse gases. The EPA has not acted to finalize this proposed rule. The EPA also has published various rules relating to the mandatory reporting of GHG emissions, including mandatory reporting requirements of GHGs from petroleum and natural gas systems. In October 2015, the EPA amended and expanded greenhouse gas reporting requirements to all segments of the oil and gas sector starting with the 2016 reporting year. In June 2016, the EPA published final new source performance standards (“NSPS”) for methane (a greenhouse gas) from new and modified oil and gas sector sources. These regulations expand upon the 2012 EPA rulemaking for oil and gas equipment-specific emissions controls, for example, regulating well head production emissions with leak detection and repair requirements, pneumatic controllers and pumps requirements, compressor requirements, and instituting leak detection and repair requirements for natural gas compressor and booster stations for the first time. In June 2017, EPA published a proposed rule to stay certain requirements of the 2016 NSPS rule for two years while it completes reconsideration of certain aspects of the rule and reviews the entire rule. In October 2015, the EPA finalized a reduction of the ambient ozone standard from 75 parts per billion to 70 parts per billion under the Clean Air Act. At EPA’s request, the judicial challenge to the ozone standard in the D.C. Circuit was put in abeyance while EPA reviews the standard. The EPA has also indicated that it will request comments on entirely withdrawing the October 2016 Control Techniques Guidelines for emissions of volatile organic compounds from oil and gas sector sources that were to be implemented or utilized by states in ozone nonattainment areas, with an expected co-benefit of reduced methane emissions. The permitting, regulatory compliance and reporting programs, taken as a whole, increase the costs and complexity of oil and gas operations with potential to adversely affect the cost of doing business for our customers resulting in reduced demand for our gas processing and transportation services, and which may also require us to incur certain capital and operating expenditures in the future to meet regulatory requirements or for air pollution control equipment, for example, in connection with obtaining and maintaining operating permits and approvals for air emissions associated with our facilities and operations.
Hazardous Substances and Waste
Our operations are subject to environmental laws and regulations relating to the management and release of hazardous substances, or solid or hazardous wastes, including petroleum hydrocarbons. These laws generally regulate the generation, storage, treatment, transportation and disposal of solid and hazardous waste, and may impose strict liability or joint and several liability for the investigation and remediation of areas at a facility where hazardous substances, or in some cases hydrocarbons, may have been released or disposed. For instance, the Comprehensive Environmental Response, Compensation, and Liability Act, as amended, or CERCLA, also known as the Superfund law, and comparable state laws impose liability, without regard to
17
fault or the legality of the original conduct, on certain classes of persons that contributed to the release of a hazardous substance into the environment. These persons include current and prior owners or operators of the site where the release occurred and companies that disposed or arranged for the disposal of the hazardous substances found at the site. Under CERCLA, these persons may be subject to joint and several liability for the costs of cleaning up the hazardous substances that have been released into the environment, for damages to natural resources and for the costs of certain health studies. CERCLA also authorizes the EPA and, in some instances, third parties to act in response to threats to the public health or the environment and to seek to recover from the responsible parties the costs that the agency incurs. Despite the “petroleum exclusion” of CERCLA Section 101(14), which encompasses natural gas, we may nonetheless handle hazardous substances within the meaning of CERCLA, or similar state statutes, in the course of our ordinary operations and, as a result, may be jointly and severally liable under CERCLA for all or part of the costs required to clean up sites at which these hazardous substances have been released into the environment.
We also generate solid wastes, including hazardous wastes that are subject to the requirements of the Resource Conservation and Recovery Act, as amended, or RCRA, and comparable state statutes. While RCRA regulates both solid and hazardous wastes, it imposes strict requirements on the generation, storage, treatment, transportation and disposal of hazardous wastes. Certain petroleum and natural gas production wastes are excluded from RCRA’s hazardous waste regulations. However, it is possible that these wastes, which could include wastes currently generated during our operations, may in the future be designated by the EPA as hazardous wastes and therefore be subject to more rigorous and costly disposal requirements. Any such changes in the laws and regulations could have a material adverse effect on our maintenance capital expenditures and operating expenses.
We currently own or lease properties where petroleum hydrocarbons are being or have been handled for many years. Although we have utilized operating and disposal practices that were standard in the industry at the time, petroleum hydrocarbons or other wastes may have been disposed of or released on or under the properties owned or leased by us, or on or under the other locations where these petroleum hydrocarbons and wastes have been taken for treatment or disposal. In addition, certain of these properties may have been operated by third parties whose treatment and disposal or release of petroleum hydrocarbons or other wastes was not under our control. These properties and wastes disposed or released thereon may be subject to CERCLA, RCRA and analogous state laws, or separate state laws that address hydrocarbon releases. Under these laws, we could be required to remove or remediate releases of hydrocarbon materials, or previously disposed wastes (including wastes disposed of or released by prior owners or operators), or to clean up contaminated property (including contaminated groundwater) or to perform remedial operations to prevent future contamination. We are not currently aware of any facts, events or conditions relating to the application of such requirements that could reasonably have a material impact on our operations or financial condition.
Water
The Federal Water Pollution Control Act of 1972, as amended, also referred to as the Clean Water Act, or CWA, and analogous state laws impose restrictions and strict controls regarding the discharge of pollutants into navigable waters. Pursuant to the CWA and analogous state laws, permits must be obtained to discharge pollutants into state and federal waters. The CWA also requires implementation of spill prevention, control and countermeasure plans, also referred to as "SPCC plans," in connection with on-site storage of threshold quantities of oil or certain other materials. The CWA imposes substantial potential civil and criminal penalties for non-compliance. State laws for the control of water pollution also provide varying civil and criminal penalties and liabilities. In addition, some states maintain groundwater protection programs that require permits for discharges or operations that may impact groundwater. The EPA has also promulgated regulations that require us to have permits in order to discharge certain storm water. The EPA has entered into agreements with certain states in which we operate whereby the permits are issued and administered by the respective states. These permits may require us to monitor and sample the storm water discharges. We believe that compliance with existing permits and compliance with foreseeable new permit requirements will not have a material adverse effect on our financial condition or results of operations.
The Oil Pollution Act of 1990, or OPA, which is part of the Clean Water Act, addresses prevention, containment and cleanup, and liability associated with oil pollution. OPA applies to vessels, offshore platforms, and onshore facilities, including natural gas gathering and processing facilities, terminals, pipelines, and transfer facilities. OPA subjects owners of such facilities to strict liability for containment and removal costs, natural resource damages, and certain other consequences of oil spills into jurisdictional waters. Any unpermitted release of petroleum or other pollutants from our operations could result in government penalties and civil liability. We are not currently aware of any facts, events or conditions relating to the application of such requirements that could reasonably have a material impact on our operations or financial condition.
18
Anti-Terrorism Measures
The federal Department of Homeland Security regulates the security of chemical and industrial facilities pursuant to regulations known as the Chemical Facility Anti-Terrorism Standards. These regulations apply to oil and gas facilities, among others, that are deemed to present “high levels of security risk.” Pursuant to these regulations, certain of our facilities are required to comply with certain regulatory provisions, including requirements regarding inspections, audits, recordkeeping, and protection of chemical-terrorism vulnerability information.
Employees
We do not have any employees. Our operations and activities are managed by our general partner, DCP Midstream GP, LP, which is managed by its general partner, DCP Midstream GP, LLC, or the General Partner, which is 100% owned by DCP Midstream, LLC. As of December 31, 2017, approximately 2,650 employees of DCP Services, LLC, a wholly-owned subsidiary of DCP Midstream, LLC, provided support for our operations pursuant to the Services and Employee Secondment Agreement between DCP Services, LLC and us. For additional information, refer to Item 10. "Directors, Executive Officers and Corporate Governance” and Item 13. "Certain Relationships and Related Transactions, and Director Independence" in this Annual Report on Form 10-K.
General
We make certain filings with the Securities and Exchange Commission ("SEC"), including our annual report on Form 10-K, quarterly reports on Form 10-Q, current reports on Form 8-K, and all amendments and exhibits to those reports, which are available free of charge through our website, www.dcpmidstream.com, as soon as reasonably practicable after they are filed with the SEC. Our website and the information contained on that site, or connected to that site, are not incorporated by reference into this report. The filings are also available through the SEC at the SEC’s Public Reference Room at 100 F Street, N.E., Washington, D.C. 20549 or by calling 1-800-SEC-0330. Also, these filings are available on the internet at www.sec.gov. Our annual reports to unitholders, press releases and recent analyst presentations are also available on our website. We have also posted our code of business ethics on our website.
Item 1A. Risk Factors
Limited partner interests are inherently different from capital stock of a corporation, although many of the business risks to which we are subject are similar to those that would be faced by a corporation engaged in similar businesses. You should consider carefully the following risk factors together with all of the other information included in this Annual Report on Form 10-K in evaluating an investment in our common units.
If any of the following risks were actually to occur, our business, financial condition or results of operations could be materially affected. In that case, we might not be able to pay the minimum quarterly distribution on our common units, the trading price of our common units could decline and you could lose all or part of your investment.
Risks Related to Our Business
Our cash flow is affected by natural gas, NGL and crude oil prices.
Our business is affected by natural gas, NGL and crude oil prices. In the past, the prices of natural gas, NGLs and crude oil have been volatile, and we expect this volatility to continue.
The level of drilling activity is dependent on economic and business factors beyond our control. Among the factors that impact drilling decisions are commodity prices, the liquids content of the natural gas production, drilling requirements for producers to hold leases, the cost of finding and producing natural gas and crude oil and the general condition of the financial markets. Commodity prices experienced significant volatility during 2017, as illustrated by the following table:
Year Ended December 31, 2017 | December 31, 2017 | |||||||||||
Daily High | Daily Low | |||||||||||
Commodity: | ||||||||||||
NYMEX Natural Gas ($/MMBtu) | $ | 3.42 | $ | 2.56 | $ | 2.95 | ||||||
NGLs ($/Gallon) | $ | 0.76 | $ | 0.50 | $ | 0.76 | ||||||
Crude Oil ($/Bbl) | $ | 60.42 | $ | 42.53 | $ | 60.42 | ||||||
19
During periods of natural gas price decline and/or if the price of NGLs and crude oil declines, the level of drilling activity could decrease further. When combined with a reduction of cash flow resulting from lower commodity prices, a reduction in our producers’ borrowing base under reserve-based credit facilities and lack of availability of debt or equity financing for our producers may result in a significant reduction in our producers’ spending for crude oil and natural gas drilling activity, which could result in lower volumes being transported on our pipeline systems. Other factors that impact production decisions include the ability of producers to obtain necessary drilling and other governmental permits and regulatory changes. Because of these factors, even if new natural gas reserves are discovered in areas served by our assets, producers may choose not to develop those reserves. If we are not able to obtain new supplies of natural gas to replace the declines resulting from reductions in drilling activity, throughput on our pipelines and the utilization rates of our treating and processing facilities would decline, which could have a material adverse effect on our business, results of operations, financial position and cash flows and our ability to make cash distributions.
Market conditions, including commodity prices, may impact our earnings, financial condition and cash flows.
The markets and prices for natural gas, NGLs, condensate and crude oil depend upon factors beyond our control and may not always have a close relationship. These factors include supply of and demand for these commodities, which fluctuate with changes in domestic and export markets and economic conditions and other factors, including:
• | the level of domestic and offshore production; |
• | the availability of natural gas, NGLs and crude oil and the demand in the U.S. and globally for these commodities; |
• | a general downturn in economic conditions; |
• | the impact of weather, including abnormally mild winter or summer weather that cause lower energy usage for heating or cooling purposes, respectively, or extreme weather that may disrupt our operations or related upstream or downstream operations; |
• | actions taken by foreign oil and gas producing and importing nations; |
• | the availability of local, intrastate and interstate transportation systems and condensate and NGL export facilities; |
• | the availability and marketing of competitive fuels; and |
• | the extent of governmental regulation and taxation. |
Our primary natural gas gathering and processing arrangements that expose us to commodity price risk are our percent-of-proceeds arrangements. Under percent-of-proceeds arrangements, we generally purchase natural gas from producers for an agreed percentage of the proceeds from the sale of residue gas and/or NGLs resulting from our processing activities, and then sell the resulting residue gas and NGLs at market prices. Under these types of arrangements, our revenues and our cash flows increase or decrease, whichever is applicable, as the price of natural gas and NGLs fluctuate.
Our NGL pipelines could be adversely affected by any decrease in NGL prices relative to the price of natural gas.
The profitability of our NGL pipelines is dependent on the level of production of NGLs from processing plants. When natural gas prices are high relative to NGL prices, it is less profitable to process natural gas because of the higher value of natural gas compared to the value of NGLs and because of the increased cost (principally that of natural gas as a feedstock and fuel) of separating the NGLs from the natural gas. As a result, we may experience periods in which higher natural gas prices relative to NGL prices reduce the volume of natural gas processed at plants connected to our NGL pipelines, as well as reducing the amount of NGL extraction, which would reduce the volumes and gross margins attributable to our NGL pipelines and NGL storage facilities.
Our hedging activities and the application of fair value measurements may have a material adverse effect on our earnings, profitability, cash flows, liquidity and financial condition.
We are exposed to risks associated with fluctuations in commodity prices. The extent of our commodity price risk is related largely to the effectiveness and scope of our hedging activities. For example, the derivative instruments we utilize are based on posted market prices, which may differ significantly from the actual natural gas, NGL and condensate prices that we realize in our operations. To mitigate a portion of our cash flow exposure to fluctuations in the price of natural gas and NGLs, we have entered into derivative financial instruments relating to the future price of natural gas and NGLs, as well as crude oil. Furthermore, we have entered into derivative transactions related to only a portion of the volume of our expected natural gas supply and production of NGLs and condensate from our processing plants; as a result, we will continue to have direct commodity price risk to the portion not covered by derivative transactions. Our actual future production may be significantly higher or lower than we estimate at the time we entered into the derivative transactions for that period. If the actual amount is higher than we estimate, we will have greater commodity price risk than we intended. If the actual amount is lower than the amount that is subject to our derivative financial instruments, we might be forced to satisfy all or a portion of our derivative transactions without the benefit of the cash flow from our sale of the underlying physical commodity, reducing our liquidity.
20
We record all of our derivative financial instruments at fair value on our balance sheet primarily using information readily observable within the marketplace. In situations where market observable information is not available, we may use a variety of data points that are market observable, or in certain instances, develop our own expectation of fair value. We will continue to use market observable information as the basis for our fair value calculations; however, there is no assurance that such information will continue to be available in the future. In such instances, we may be required to exercise a higher level of judgment in developing our own expectation of fair value, which may be significantly different from the historical fair values, and may increase the volatility of our earnings.
We will continue to evaluate whether to enter into any new derivative arrangements, but there can be no assurance that we will enter into any new derivative arrangement or that our future derivative arrangements will be on terms similar to our existing derivative arrangements. Additionally, although we enter into derivative instruments to mitigate a portion of our commodity price and interest rate risk, we also forego the benefits we would otherwise experience if commodity prices or interest rates were to change in our favor.
Our derivative instruments may require us to post collateral based on predetermined collateral thresholds. Depending on the movement in commodity prices, the amount of posted collateral required may increase, reducing our liquidity.
Our hedging activities may not be as effective as we intend and may actually increase the volatility of our earnings and cash flows. In addition, even though our management monitors our hedging activities, these activities can result in material losses. Such losses could occur under various circumstances, including if a counterparty does not or is unable to perform its obligations under the applicable derivative arrangement, the derivative arrangement is imperfect or ineffective, or our risk management policies and procedures are not properly followed or do not work as planned.
We could incur losses due to impairment in the carrying value of our goodwill or long-lived assets.
We periodically evaluate goodwill and long-lived assets for impairment. Our impairment analyses for long-lived assets require management to apply judgment in evaluating whether events and circumstances are present that indicate an impairment may have occurred. If we believe an impairment may have occurred judgments are then applied in estimating future cash flows as well as asset fair values, including forecasting useful lives of the assets, assessing the probability of different outcomes, and selecting the discount rate that reflects the risk inherent in future cash flows. To perform the impairment assessment for goodwill, we primarily use a discounted cash flow analysis, supplemented by a market approach analysis. Key assumptions in the analysis include the use of an appropriate discount rate, terminal year multiples, and estimated future cash flows including an estimate of operating and general and administrative costs. In estimating cash flows, we incorporate current market information (including forecasted volumes and commodity prices), as well as historical and other factors. If actual results are not consistent with our assumptions and estimates, or our assumptions and estimates change due to new information, we may be exposed to impairment charges. Adverse changes in our business or the overall operating environment, such as lower commodity prices, may affect our estimate of future operating results, which could result in future impairment due to the potential impact on our operations and cash flows.
A reduction in demand for NGL products by the petrochemical, refining or other industries or by the fuel markets could materially adversely affect our results of operations and financial condition.
The NGL products we produce have a variety of applications, including as heating fuels, petrochemical feedstocks and refining blend stocks. A reduction in demand for NGL products, whether because of general or industry specific economic conditions, new government regulations, global competition, reduced demand by consumers for products made with NGL products (for example, reduced petrochemical demand observed due to lower activity in the automobile and construction industries), increased competition from petroleum-based feedstocks due to pricing differences, mild winter weather for some NGL applications or other reasons, could result in a decline in the volume of NGL products we handle or reduce the fees we charge for our services.
Volumes of natural gas dedicated to our systems in the future may be less than we anticipate.
If the reserves connected to our gathering systems are less than we anticipate and we are unable to secure additional sources of natural gas, then the volumes of natural gas on our systems in the future could be less than we anticipate.
21
We depend on certain natural gas producer customers for a significant portion of our supply of natural gas and NGLs.
We identify as primary natural gas suppliers those suppliers individually representing 10% or more of our total natural gas and NGLs supply. We have no natural gas supplier representing 10% or more of our total natural gas supply during the year ended December 31, 2017. While some of these customers are subject to long-term contracts, we may be unable to negotiate extensions or replacements of these contracts on favorable terms, if at all. The loss of all or even a portion of the natural gas and NGL volumes supplied by these customers, as a result of competition or otherwise, could have a material adverse effect on our business.
Because of the natural decline in production from existing wells, our success depends on our ability to obtain new sources of supplies of natural gas and NGLs.
Our gathering and transportation pipeline systems are connected to or dependent on the level of production from natural gas and crude wells, from which production will naturally decline over time. As a result, our cash flows associated with these wells will also decline over time. In order to maintain or increase throughput levels on our gathering and transportation pipeline systems and NGL pipelines and the asset utilization rates at our natural gas processing plants, we must continually obtain new supplies. The primary factors affecting our ability to obtain new supplies of natural gas and NGLs, and to attract new customers to our assets include the level of successful drilling activity near these assets, the demand for natural gas, crude oil and NGLs, producers’ desire and ability to obtain necessary permits in an efficient manner, natural gas field characteristics and production performance, surface access and infrastructure issues, and our ability to compete for volumes from successful new wells. If we are not able to obtain new supplies of natural gas to replace the natural decline in volumes from existing wells or because of competition, throughput on our pipelines and the utilization rates of our treating and processing facilities would decline, which could have a material adverse effect on our business, results of operations, financial position and cash flows, and our ability to make cash distributions.
Third party pipelines and other facilities interconnected to our natural gas and NGL pipelines and facilities may become unavailable to transport, process or produce natural gas and NGLs.
We depend upon third party pipelines and other facilities that provide delivery options to and from our pipelines and facilities for the benefit of our customers. Since we do not own or operate any of these third-party pipelines or other facilities, their continuing operation is not within our control and may become unavailable to transport, process or produce natural gas and NGLs.
We may not successfully balance our purchases and sales of natural gas and propane.
We purchase from producers and other customers a substantial amount of the natural gas that flows through our natural gas gathering, processing and transportation systems for resale to third parties, including natural gas marketers and end-users. In addition, in our wholesale propane logistics business, we purchase propane from a variety of sources and resell the propane to distributors. We may not be successful in balancing our purchases and sales. A producer or supplier could fail to deliver contracted volumes or deliver in excess of contracted volumes, or a purchaser could purchase less than contracted volumes. Any of these actions could cause our purchases and sales to be unbalanced. While we attempt to balance our purchases and sales, if our purchases and sales are unbalanced, we will face increased exposure to commodity price risks and could have increased volatility in our operating income and cash flows.
Our ability to manage and grow our business effectively could be adversely affected if we or DCP Midstream, LLC and its subsidiaries fail to attract and retain key management personnel and skilled employees.
We rely on our executive management team to manage our day-to-day affairs and establish and execute our strategic business and operational plans. This executive management team has significant experience in the midstream energy industry. The loss of any of our executives or the failure to fill new positions created by expansion, turnover or retirement could adversely affect our ability to implement our business strategy. In addition, our operations require engineers, operational and field technicians and other highly skilled employees. Competition for experienced executives and skilled employees is intense and increases when the demand from other energy companies for such personnel is high. Our ability to execute on our business strategy and to grow or continue our level of service to our current customers may be impaired and our business may be adversely impacted if we or DCP Midstream, LLC and its subsidiaries are unable to attract, train and retain such personnel, which may have an adverse effect on our results of operations and ability to make cash distributions.
22
A downgrade of our credit rating could impact our liquidity, access to capital and our costs of doing business, and independent third parties determine our credit ratings outside of our control.
In January 2017, our credit rating was lowered and the cost of borrowing under our Credit Agreement increased. The further lowering of our credit rating could further increase our cost of borrowing under our Credit Agreement and could require us to post collateral with third parties, including our hedging arrangements, which could negatively impact our available liquidity and increase our cost of debt.
Credit rating agencies perform independent analysis when assigning credit ratings. The analysis includes a number of criteria including, but not limited to, business composition, market and operational risks, as well as various financial tests. Credit rating agencies continue to review the criteria for industry sectors and various debt ratings and may make changes to those criteria from time to time. Credit ratings are not recommendations to buy, sell or hold our securities, although such credit ratings may affect the market value of our debt instruments. Ratings are subject to revision or withdrawal at any time by the ratings agencies.
Our debt levels may limit our flexibility in obtaining additional financing and in pursuing other business opportunities.
We continue to have the ability to incur additional debt, subject to limitations within our Credit Agreement. Our level of debt could have important consequences to us, including the following:
• | our ability to obtain additional financing, if necessary, for working capital, capital expenditures, acquisitions or other purposes may be impaired or such financing may not be available on favorable terms; |
• | an increased amount of cash flow will be required to make interest payments on our debt; |
• | our debt level will make us more vulnerable to competitive pressures or a downturn in our business or the economy generally; and |
• | our debt level may limit our flexibility in responding to changing business and economic conditions. |
Our ability to obtain new debt funding or service our existing debt will depend upon, among other things, our future financial and operating performance, which will be affected by prevailing economic conditions and financial, business, regulatory and other factors. In addition, our ability to service debt under our Credit Agreement will depend on market interest rates. If our operating results are not sufficient to service our current or future indebtedness, we may take actions such as reducing distributions, reducing or delaying our business activities, acquisitions, investments or capital expenditures, selling assets, restructuring or refinancing our debt, or seeking additional equity capital. We may not be able to effect any of these actions on satisfactory terms, or at all.
Restrictions in our Credit Agreement and the indentures governing our notes may limit our ability to make distributions to unitholders and may limit our ability to capitalize on acquisitions and other business opportunities.
Our Credit Agreement and the indentures governing our notes contain covenants limiting our ability to make distributions, incur indebtedness, grant liens, make acquisitions, investments or dispositions and engage in transactions with affiliates. Furthermore, our Credit Agreement contains covenants requiring us to maintain a certain leverage ratio and certain other tests. Any subsequent replacement of our Credit Agreement or any new indebtedness could have similar or greater restrictions. If our covenants are not met, whether as a result of reduced production levels of natural gas and NGLs as described above or otherwise, our financial condition, results of operations and ability to make distributions to our unitholders could be materially adversely affected.
Changes in interest rates may adversely impact our ability to issue additional equity or incur debt, as well as the ability of exploration and production companies to finance new drilling programs around our systems.
Interest rates on future credit facilities and debt offerings could be higher than current levels, causing our financing costs to increase. As with other yield-oriented securities, our unit price is impacted by the level of our cash distributions and implied distribution yield. The distribution yield is often used by investors to compare and rank related yield-oriented securities for investment decision-making purposes. Therefore, changes in interest rates, either positive or negative, may affect the yield requirements of investors who invest in our units, and a rising interest rate environment could impair our ability to issue additional equity or incur debt to make acquisitions, for other purposes. Increased interest costs could also inhibit the financing of new capital drilling programs by exploration and production companies served by our systems.
23
The outstanding senior notes and junior subordinated notes, or notes, are unsecured obligations of our operating subsidiary, DCP Midstream Operating, LP, or DCP Operating, and are not guaranteed by any of our subsidiaries. As a result, our notes are effectively junior to DCP Operating’s existing and future secured debt and to all debt and other liabilities of its subsidiaries.
The 2.70% Senior Notes due 2019, 9.75% Senior Notes due 2019, 5.35% Senior Notes due 2020, 4.75% Senior Notes due 2021, 4.95% Senior Notes due 2022, 3.875% Senior Notes due 2023, 8.125% Senior Notes due 2030, 6.450% Senior Notes due 2036, 6.750% Senior Notes due 2037, and 5.60% Senior Notes due 2044, or the Senior Notes, are senior unsecured obligations of DCP Operating and rank equally in right of payment with all of its other existing and future senior unsecured debt and effectively junior to any of its future secured indebtedness to the extent of the collateral securing such indebtedness. The 5.85% Fixed-to-Floating Rate Junior Subordinated Notes due 2043 are junior subordinated obligations of DCP Operating and rank junior in right of payment with all of its other existing and future senior unsecured debt. All of our operating assets are owned by our subsidiaries, and none of these subsidiaries guarantee DCP Operating’s obligations with respect to the notes. Creditors of DCP Operating’s subsidiaries may have claims with respect to the assets of those subsidiaries that rank effectively senior to the notes. In the event of any distribution or payment of assets of such subsidiaries in any dissolution, winding up, liquidation, reorganization or bankruptcy proceeding, the claims of those creditors would be satisfied prior to making any such distribution or payment to DCP Operating in respect of its direct or indirect equity interests in such subsidiaries. Consequently, after satisfaction of the claims of such creditors, there may be little or no amounts left available to make payments in respect of our notes. As of December 31, 2017, DCP Operating’s subsidiaries had no debt for borrowed money owing to any unaffiliated third parties. However, such subsidiaries are not prohibited under the indentures governing the notes from incurring indebtedness in the future.
In addition, because our notes and our guarantees of our notes are unsecured, holders of any secured indebtedness of us would have claims with respect to the assets constituting collateral for such indebtedness that are senior to the claims of the holders of our notes. Currently, we do not have any secured indebtedness. Although the indentures governing our notes places some limitations on our ability to create liens securing debt, there are significant exceptions to these limitations that will allow us to secure significant amounts of indebtedness without equally and ratably securing the notes. If we incur secured indebtedness and such indebtedness is either accelerated or becomes subject to a bankruptcy, liquidation or reorganization, our assets would be used to satisfy obligations with respect to the indebtedness secured thereby before any payment could be made on our notes. Consequently, any such secured indebtedness would effectively be senior to our notes and our guarantee of our notes, to the extent of the value of the collateral securing the secured indebtedness. In that event, our noteholders may not be able to recover all the principal or interest due under our notes.
Our significant indebtedness and the restrictions in our debt agreements may adversely affect our future financial and operating flexibility.
As of December 31, 2017, our consolidated principal indebtedness was $4,725 million. Our significant indebtedness and the additional debt we may incur in the future for potential acquisitions may adversely affect our liquidity and therefore our ability to make interest payments on our notes and distributions on our units.
Debt service obligations and restrictive covenants in our Credit Agreement, and the indentures governing our notes may adversely affect our ability to finance future operations, pursue acquisitions and fund other capital needs as well as our ability to make cash distributions to our unitholders. In addition, this leverage may make our results of operations more susceptible to adverse economic or operating conditions by limiting our flexibility in planning for, or reacting to, changes in our business and the industry in which we operate and may place us at a competitive disadvantage as compared to our competitors that have less debt.
If we incur any additional indebtedness, including trade payables, that ranks equally with our notes, the holders of that debt will be entitled to share ratably with the holders of our notes in any proceeds distributed in connection with any insolvency, liquidation, reorganization, dissolution or other winding up of us or DCP Operating. This may have the effect of reducing the amount of proceeds paid to our noteholders. If new debt is added to our current debt levels, the related risks that we now face could intensify.
The adoption of financial reform legislation by the United States Congress could have an adverse effect on our ability to use derivative instruments to hedge risks associated with our business.
We hedge a portion of our commodity risk and our interest rate risk. In its rulemaking under the Dodd-Frank Wall Street Reform and Consumer Protection Act, or the Act, the Commodities Futures Trading Commission, or CFTC, adopted regulations
24
to set position limits for certain futures and option contracts in the major energy markets and for swaps that are their economic equivalents, but these rules were successfully challenged in Federal district court by the Securities Industry Financial Markets Association and the International Swaps and Derivatives Association and largely vacated by the court. In December 2016, the CFTC reproposed rules that place limits on speculative positions in certain physical commodity futures and options contracts and their "economically equivalent" swaps, including NYMEX Henry Hub Natural Gas and NYMEX Light Sweet Crude Oil contracts, subject to exceptions for certain bona fide hedging transactions. The CFTC has sought comment on the position limits rules as reproposed, but since these rules are not yet final, the impact of those provisions on us is uncertain at this time. Under the reproposed rules, we believe our hedging transactions will qualify for the non-financial, commercial end user exception, which exempts derivatives intended to hedge or mitigate commercial risk from the mandatory swap clearing requirement, and as a result, we do not expect our hedging activity to be subject to mandatory clearing. The Act may also require us to comply with margin requirements in connection with our hedging activities, although the application of those provisions to us is uncertain at this time. The Act may also require the counterparties to our derivative instruments to spin off some of their hedging activities to a separate entity, which may not be as creditworthy as the current counterparty. The new legislation and related regulations could significantly increase the cost of derivatives contracts for our industry (including requirements to post collateral which could adversely affect our available liquidity), materially alter the terms of derivatives contracts, reduce the availability of derivatives to protect against risks we encounter, reduce our ability to monetize or restructure our existing derivatives contracts, and increase our exposure to less creditworthy counterparties, particularly if we are unable to utilize the commercial end user exception with respect to certain of our hedging transactions. If we reduce our use of hedging as a result of the legislation and regulations, our results of operations may become more volatile and our cash flows may be less predictable, which could adversely affect our ability to plan for and fund capital expenditures and fund unitholder distributions. Finally, the legislation was intended, in part, to reduce the volatility of oil and natural gas prices, which some legislators attributed to speculative trading in derivatives and commodity instruments related to oil and natural gas. Our revenues could therefore be adversely affected if a consequence of the legislation and regulations is to lower commodity prices. Any of these consequences could have a material adverse effect on our business, our financial condition, and our results of operations.
Future disruptions in the global credit markets may make equity and debt markets less accessible and capital markets more costly, create a shortage in the availability of credit and lead to credit market volatility, which could disrupt our financing plans and limit our ability to grow.
From time to time, public equity markets experience significant declines, and global credit markets experience a shortage in overall liquidity and a resulting disruption in the availability of credit. Future disruptions in the global financial marketplace, including the bankruptcy or restructuring of financial institutions, could make equity and debt markets inaccessible, and adversely affect the availability of credit already arranged and the availability and cost of credit in the future. We have availability under our Credit Agreement to borrow additional capital, but our ability to borrow under that facility could be impaired if one or more of our lenders fails to honor its contractual obligation to lend to us.
As a publicly traded partnership, these developments could significantly impair our ability to make acquisitions or finance growth projects. We distribute all of our available cash, as defined in our Partnership Agreement ("Partnership Agreement"), to our common unitholders on a quarterly basis. We rely upon external financing sources, including the issuance of debt and equity securities and bank borrowings, to fund acquisitions or expansion capital expenditures or fund routine periodic working capital needs. Any limitations on our access to external capital, including limitations caused by illiquidity or volatility in the capital markets, may impair our ability to complete future acquisitions and construction projects on favorable terms, if at all. As a result, we may be at a competitive disadvantage as compared to businesses that reinvest all of their available cash to expand ongoing operations, particularly under adverse economic conditions.
Volatility in the capital markets may adversely impact our liquidity.
The capital markets may experience volatility, which may lead to financial uncertainty. Our access to funds under the Credit Agreement is dependent on the ability of the lenders that are party to the Credit Agreement to meet their funding obligations. Those lenders may not be able to meet their funding commitments if they experience shortages of capital and liquidity. If lenders under the Credit Agreement were to fail to fund their share of the Credit Agreement, our available borrowings could be further reduced. In addition, our borrowing capacity may be further limited by the Credit Agreement’s financial covenants.
A significant downturn in the economy could adversely affect our results of operations, financial position or cash flows. In the event that our results were negatively impacted, we could require additional borrowings. A deterioration of the capital markets could adversely affect our ability to access funds on reasonable terms in a timely manner.
25
We have a holding company structure in which our subsidiaries conduct our operations and own our operating assets.
The partnership is a holding company, and our subsidiaries conduct all of our operations and own all of our operating assets. We do not have significant assets other than equity in our subsidiaries and equity investees. As a result, our ability to make required payments on our notes depends on the performance of our subsidiaries and their ability to distribute funds to us. The ability of our subsidiaries to make distributions to us may be restricted by, among other things, credit instruments, applicable state business organization laws and other laws and regulations. If our subsidiaries are prevented from distributing funds to us, we may be unable to pay all the principal and interest on the notes when due.
We may incur significant costs and liabilities resulting from implementing and administering pipeline and asset integrity programs and related repairs.
Pursuant to the Pipeline Safety Improvement Act of 2002, PHMSA has adopted regulations requiring pipeline operators to develop integrity management programs for transportation pipelines located where a leak or rupture could do the most harm in “high consequence areas.” The regulations require operators to:
• | perform ongoing assessments of pipeline integrity; |
• | identify threats to pipeline segments that could impact a high consequence area and assess the risks that such threats pose to pipeline integrity; |
• | collect, integrate, and analyze data regarding threats and risks posed to the pipeline; |
• | repair and remediate the pipeline as necessary; and |
• | implement preventive and mitigating actions. |
Pipeline safety legislation enacted in 2012, the Pipeline Safety, Regulatory Certainty, and Job Creation Act of 2011, or the Pipeline Safety and Job Creations Act, reauthorizes funding for federal pipeline safety programs through 2015, increases penalties for safety violations, establishes additional safety requirements for newly constructed pipelines, and requires studies of certain safety issues that could result in the adoption of new regulatory requirements for existing pipelines, including the expansion of integrity management, use of automatic and remote-controlled shut-off valves, leak detection systems, sufficiency of existing regulation of gathering pipelines, use of excess flow valves, verification of maximum allowable operating pressure, incident notification, and other pipeline-safety related requirements. New rules proposed by PHMSA, address many areas of this legislation. Extending the integrity management requirements to our gathering lines would impose additional obligations on us and could add material cost to our operations.
Although many of our natural gas facilities currently are not subject to pipeline integrity requirements, we may incur significant costs and liabilities associated with repair, remediation, preventative or mitigation measures associated with non-exempt pipelines. Such costs and liabilities might relate to repair, remediation, preventative or mitigating actions that may be determined to be necessary as a result of the testing program, or new requirements that may be imposed as a result of the Pipeline Safety and Job Creation Act, as well as lost cash flows resulting from shutting down our pipelines during the pendency of such repairs. Additionally, we may be affected by the testing, maintenance and repair of pipeline facilities downstream from our own facilities. With the exception of our Wattenberg pipeline, our NGL pipelines are also subject to integrity management and other safety regulations imposed by the Texas Railroad Commission, or TRRC.
We currently estimate that we will incur approximately $47 million between 2018 and 2022 to implement pipeline integrity management program testing along certain segments of our natural gas and NGL pipelines. This does not include the costs, if any, of any repair, remediation, preventative or mitigating actions that may be determined to be necessary as a result of the testing program, or new requirements that may be imposed as a result of the Pipeline Safety and Job Creation Act, which costs could be substantial.
We currently transport NGLs produced at our processing plants on our owned and third party NGL pipelines. Accordingly, in the event that an owned or third party NGL pipeline becomes inoperable due to any necessary repairs resulting from integrity testing programs or for any other reason for any significant period of time, we would need to transport NGLs by other means. There can be no assurance that we will be able to enter into alternative transportation arrangements under comparable terms.
Any new or expanded pipeline integrity requirements or the adoption of other asset integrity requirements could also increase our cost of operation and impair our ability to provide service during the period in which assessments and repairs take place, adversely affecting our business. Further, execution of and compliance with such integrity programs may cause us to
26
incur greater than expected capital and operating expenditures for repairs and upgrades that are necessary to ensure the continued safe and reliable operation of our assets.
State and local legislative and regulatory initiatives relating to oil and gas operations could adversely affect our third-party customers’ production and, therefore, adversely impact our midstream operations.
Certain states in which we operate have adopted or are considering adopting measures that could impose new or more stringent requirements on oil and gas exploration and production activities. For example, the potential for adverse impacts to our business is present where local governments have enacted ordinances directly regulating pipeline assets and operations, and and private individuals have sponsored citizen initiatives to limit hydraulic fracturing, increase mandatory setbacks of oil and gas operations from occupied structures, and achieve more restrictive state or local control over such activities.
In the event state or local restrictions or prohibitions are adopted in our areas of operations, our customers may incur significant compliance costs or may experience delays or curtailment in the pursuit of their exploration, development, or production activities, and possibly be limited or precluded in the drilling of certain wells altogether. Any adverse impact on our customers’ activities would have a corresponding negative impact on our throughput volumes. In addition, while the general focus of debate is on upstream development activities, certain proposals may, if adopted, directly impact our ability to competitively locate, construct, maintain, and operate our own assets. Accordingly, such restrictions or prohibitions could have a material adverse effect on our business, prospects, results of operations, financial condition, cash flows and ability to make distributions to our unitholders.
We may incur significant costs and liabilities in the future resulting from a failure to comply with existing or new environmental regulations or an accidental release of hazardous substances or hydrocarbons into the environment.
Our operations are subject to stringent and complex federal, state and local environmental laws and regulations. These include, for example, (1) the federal Clean Air Act and comparable state laws and regulations, including federal and state air permits, that impose obligations related to air emissions; (2) the federal Resource Conservation and Recovery Act, as amended, or RCRA, and comparable state laws that impose requirements for the management, storage and disposal of solid and hazardous waste from our facilities; (3) the Comprehensive Environmental Response, Compensation, and Liability Act of 1980, or CERCLA, also known as “Superfund,” and comparable state laws that regulate the cleanup of hazardous substances that may have been released at properties currently or previously owned or operated by us or locations to which we have sent waste for disposal; (4) the Clean Water Act and the Oil Pollution Act, and comparable state laws that impose requirements on discharges to waters as well as requirements to prevent and respond to releases of hydrocarbons to waters of the United States and regulated state waters; and (5) state laws that impose requirements on the response to and remediation of hydrocarbon releases to soil and managing related wastes. Failure to comply with these laws and regulations or newly adopted laws or regulations may trigger a variety of administrative, civil and potentially criminal enforcement measures, including the assessment of monetary penalties, the imposition of remedial requirements, and the issuance of orders enjoining or affecting future operations. Certain environmental regulations, including CERCLA and analogous state laws and regulations, impose strict liability and joint and several liability for costs required to clean up and restore sites where hazardous substances, and in some cases hydrocarbons, have been disposed or otherwise released.
There is inherent risk of the incurrence of environmental costs and liabilities in our business due to our handling of natural gas, NGLs and other petroleum products, air emissions related to our operations, and historical industry operations and waste management and disposal practices. For example, an accidental release from one of our facilities could subject us to substantial liabilities arising from environmental cleanup and restoration costs, claims made by neighboring landowners and other third parties for personal injury and property damage, governmental claims for natural resource damages or imposing fines or penalties for related violations of environmental laws, permits or regulations. In addition, it is possible that stricter laws, regulations or enforcement policies could significantly increase our compliance costs and the cost of any remediation that may become necessary. We may not be able to recover some or any of these costs from insurance or third-party indemnification.
A change in the jurisdictional characterization of some of our assets by federal, state or local regulatory agencies or a change in policy by those agencies may result in increased regulation of our assets.
The majority of our natural gas gathering and intrastate transportation operations are exempt from FERC regulation under the NGA but FERC regulation still affects these businesses and the markets for products derived from these businesses. FERC’s policies and practices across the range of its oil and natural gas regulatory activities, including, for example, its policies on open access transportation, ratemaking, capacity release and market center promotion, indirectly affect intrastate markets. In recent years, FERC has pursued pro-competitive policies in its regulation of interstate oil and natural gas pipelines. However, we cannot assure that FERC will continue this approach as it considers matters such as pipeline rates and rules and policies that
27
may affect rights of access to oil and natural gas transportation capacity. In addition, the distinction between FERC-regulated transportation services and federally unregulated gathering services has been the subject of regular litigation, so the classification and regulation of some of our gathering facilities and intrastate transportation pipelines may be subject to change based on any reassessment by us of the jurisdictional status of our facilities or on future determinations by FERC and the courts.
In addition, the rates, terms and conditions of some of the transportation services we provide on certain of our pipeline systems are subject to FERC regulation under Section 311 of the NGPA. Under Section 311, rates charged for transportation must be fair and equitable, and amounts collected in excess of fair and equitable rates are subject to refund with interest.
Several of our pipelines are interstate transporters of NGLs and are subject to FERC jurisdiction under the Interstate Commerce Act and the Elkins Act. The base interstate tariff rates for our NGL pipelines are determined either by a FERC cost-of-service proceeding or by agreement with an unaffiliated party, and adjusted annually through the FERC’s indexing methodology. The NGL pipelines may also provide incentive rates, which offer tariff rates below the base tariff rates for high volume shipments.
Should we fail to comply with all applicable FERC-administered statutes, rules, regulations and orders, we could be subject to substantial penalties and fines. Under EPACT 2005, FERC has civil penalty authority under the NGA to impose penalties of up to $1 million per day for each violation and possible criminal penalties of up to $1 million per violation and five years in prison. Under the NGPA, FERC may impose civil penalties of up to $1 million for any one violation and may impose criminal penalties of up to $1 million and five years in prison.
Other state and local regulations also affect our business. Our non-proprietary gathering lines are subject to ratable take and common purchaser statutes. Ratable take statutes generally require gatherers to take, without undue discrimination, oil or natural gas production that may be tendered to the gatherer for handling. Similarly, common purchaser statutes generally require gatherers to purchase without undue discrimination as to source of supply or producer. These statutes restrict our right as an owner of gathering facilities to decide with whom we contract to purchase or transport oil or natural gas. Federal law leaves any economic regulation of natural gas gathering to the states. The states in which we operate have adopted complaint-based regulation of oil and natural gas gathering activities, which allows oil and natural gas producers and shippers to file complaints with state regulators in an effort to resolve grievances relating to oil and natural gas gathering access and rate discrimination. Other state regulations may not directly regulate our business, but may nonetheless affect the availability of natural gas for purchase, processing and sale, including state regulation of production rates and maximum daily production allowable from gas wells. While our proprietary gathering lines are currently subject to limited state regulation, there is a risk that state laws will be changed, which may give producers a stronger basis to challenge the proprietary status of a line, or the rates, terms and conditions of a gathering line providing transportation service.
The interstate tariff rates of certain of our pipelines are subject to review and possible adjustment by federal regulators.
FERC, pursuant to the NGA, regulates many aspects of our interstate natural gas pipeline transportation service, including the rates our pipelines are permitted to charge for such service. Under the NGA, interstate transportation rates must be just and reasonable and not unduly discriminatory. If FERC fails to permit our requested tariff rate increases, or if FERC lowers the tariff rates we are permitted to charge, on its own initiative, or as a result of challenges raised by customers or third parties, our tariff rates may be insufficient to recover the full cost of providing interstate transportation service. In certain circumstances, FERC also has the power to order refunds.
Should we fail to comply with all applicable FERC-administered statutes, rules, regulations and orders, we could be subject to substantial penalties and the disgorgement of profits. Under EPACT 2005, FERC has civil penalty authority under the NGA to impose penalties for current violations of up to $1 million per day for each violation and possible criminal penalties of up to $1 million per violation and five years in prison.
The transportation rates for our NGL pipelines that provide interstate transportation services, our interstate natural gas pipelines, and our intrastate pipelines that provide interstate services under Section 311 of the NGPA could be adversely impacted by potential changes to FERC’s income tax allowance policy for partnership pipelines.
Under current policy, FERC permits pipelines to include, in the cost-of-service used as the basis for calculating the pipeline’s regulated rates, a tax allowance reflecting the actual or potential income tax liability on public utility income attributable to all partnership or limited liability company interests, if the ultimate owner of the interest has an actual or potential income tax liability on such income. Under current policy, whether a pipeline’s owners have such actual or potential income tax liability is reviewed by FERC on a case-by-case basis, and our pipelines’ ability to recover an income tax allowance
28
in a cost-of-service proceeding before FERC is subject to this review and potentially impacted by ultimate partnership ownership. On December 15, 2016, FERC issued a Notice of Inquiry (NOI) regarding its income tax recovery policy following a decision by the U.S. Court of Appeals for the D.C. Circuit, issued in July 2016, that found FERC did not demonstrate there is no double recovery of income taxes for a partnership owned pipeline as a result of the income tax allowance and return on equity policies in a cost-of-service proceeding for an oil pipeline. While the Court of Appeals remand to FERC focused on a specific case, FERC’s issuance of an NOI seeks comments on how to address any double-recovery of income taxes and also broader industry comments related to the impact on all regulated industries, including natural gas pipelines, oil pipelines and electric utilities. We cannot predict the outcome of this proceeding, but any shift in policy could impact future rate proceedings for our pipelines organized as partnerships and could adversely affect our revenues for our rates calculated using a cost-of-service methodology.
Moreover, in the NOI proceeding, parties have requested that FERC adjust the rates for interstate pipeline services based on the reduction in the federal income tax rates for corporations, as well as partners and other owners of pass-through entities, in the recently enacted Law to Provide for Reconciliation Pursuant to Titles II and V of the Concurrent Resolution on the Budget for Fiscal Year 2018. While we believe there is considerable regulatory precedent and laws that afford pipelines due process rights if their rates are contested, FERC has not yet responded to the motions and we cannot predict the outcome. Any action by FERC could impact the rates for our regulated interstate pipeline services. Additionally, the reduction in the federal income tax rates for corporations and individuals could impact the income tax allowance included in the cost-of-service calculations in future rate proceedings for our regulated interstate pipeline services.
Recently proposed or finalized rules imposing more stringent requirements on the oil and gas industry could cause our customers and us to incur increased capital expenditures and operating costs as well as reduce the demand for our services.
On August 16, 2012, the EPA issued final regulations under the Clean Air Act that, among other things, require additional emissions controls for natural gas and natural gas liquids production, including New Source Performance Standards, or NSPS, to address emissions of sulfur dioxide and volatile organic compounds, or VOCs, and a separate set of emission standards to address hazardous air pollutants frequently associated with such production activities. The final regulations require, among other things, the reduction of VOC emissions from existing natural gas wells that are re-fractured, as well as newly-drilled and fractured wells through the use of reduced emission completions or “green completions” and well completion combustion devices, such as flaring, as of January 1, 2015. In addition, these rules establish specific requirements regarding emissions from compressors and controllers at natural gas gathering and boosting stations and processing plants together with emissions reduction requirements for dehydrators and storage tanks at natural gas processing plants, compressor stations and gathering and boosting stations. The rules further establish new requirements for detection and repair of VOC leaks exceeding 500 parts per million in concentration at new or modified natural gas processing plants. The EPA made certain revisions to the regulation from 2013 to 2015, and the regulation is also the subject of Petitions for Review before the U.S. Circuit Court of Appeals for the District of Columbia. In addition, in June 2016, the EPA expanded the NSPS regulations for new or modified sources of VOCs to include methane emissions. Among other things, this regulation imposes leak detection and repair requirements for VOCs and methane on producer well site equipment and on midstream equipment such as compressor and booster stations, impose additional emission reduction requirements on specific pieces of oil and gas equipment, and is a regulatory pre-condition to EPA acting to regulate existing oil and gas methane sources in the future under Section 111(d) of the Clean Air Act. This regulation is the subject of a Petition for Review before the U.S. Circuit Court of Appeals for the District of Columbia. This regulation is also the subject of review pursuant to the March 28, 2017, Presidential Executive Order on Promoting Energy Independence and Economic Growth, which ordered the EPA Administrator to review this regulation for consistency with the Executive Order’s policy to review existing regulations impacting natural gas development and, if appropriate, “suspend, revise, or rescind the guidance or publish for notice and comment proposed rules suspending, revising or rescinding those rules.” In response to the Executive Order, in June 2017, EPA published a proposed rule to stay the compliance requirements of the regulation while it reviews the rule. The EPA separately withdrew the information request that it had issued in November 2016 as part of an effort to develop standards for methane and other emissions from existing sources in the oil and natural gas industry. The EPA, in October 2015, revised and lowered the ambient air quality standard for ozone in the U.S. under the Clean Air Act, from 75 parts per billion to 70 parts per billion, which is likely to result in more, and expanded, ozone non-attainment areas, which in turn will require states to adopt implementation plans to reduce emissions of ozone-forming pollutants, like VOCs and nitrogen oxides, that are emitted from, among others, the oil and gas industry. Persistent non-attainment status, such as for ozone, can result in lower major source permitting thresholds (making it more costly and complex to site and permit major new or modified facilities) and additional control requirements. In October 2016, the EPA also finalized Control Techniques Guidelines for VOC emissions from existing oil and natural gas equipment and processes in moderate ozone non-attainment areas. These Control Techniques Guidelines provide recommendations for states and local air agencies to consider when determining what emissions control requirements apply to sources in the non-attainment areas. In late 2017, however, EPA indicated that it will request comments on withdrawing the guidelines in their entirety. Collectively, these regulations
29
could require modifications to the operations of our exploration and production customers, as well as our operations, including the installation of new equipment and new emissions management practices, which could result in significant additional costs, both increased capital expenditures and operating costs. The incurrence of such expenditures and costs by our customers could also result in reduced production by those customers and thus translate into reduced demand for our services, which could in turn have an adverse effect on our business and cash available for distributions.
We may incur significant costs in the future associated with proposed climate change regulation and legislation.
The United States Congress and some states where we have operations may consider legislation related to greenhouse gas emissions, including methane emissions, which may compel reductions of such emissions. In addition, there have been international conventions and efforts to establish standards for the reduction of greenhouse gases globally, including the Paris accords in December 2015. The conditions for entry into force of the Paris accords were met on October 5, 2016 and the Agreement went into force 30 days later on November 4, 2016. In August 2017, however, the U.S. notified the United Nations Secretary-General that it intends to withdraw from the agreement as soon as it is able to do so, or November 2019. Legislative proposals have included or could include limitations, or caps, on the amount of greenhouse gas that can be emitted, as well as a system of emissions allowances. For example, legislation passed by the U.S. House of Representatives in 2010, which was not taken up by the Senate, would have placed the entire burden of obtaining allowances for the carbon content of NGLs on the owners of NGLs at the point of fractionation. In June 2013, President Obama announced a climate action plan that targets methane emissions from the oil and gas industry as part of a comprehensive interagency methane reduction strategy. Many of the actions taken under the Obama Administration have been targeted by the Trump Administration. For instance, in June 2017 EPA proposed a two-year stay of the compliance requirements for the new source performance standards for methane emissions (a greenhouse gas) from new and modified oil and gas industry sources that EPA has finalized in 2016. The EPA also indicated that it will request comments on entirely withdrawing the October 2016 Control Techniques Guidelines for emissions of VOCs from existing oil and gas industry sources in ozone nonattainment areas, which had an expected co-benefit of reduced methane emissions. Relatedly, the D.C. Circuit Court challenge to the October 2015 EPA regulation reducing the ambient ozone standard from 75 parts per billion to 70 parts per billion under the Clean Air Act was put in abeyance while the EPA reviews the regulation. Separately, the EPA in 2011 issued permitting rules for sources of greenhouse gases; however, in June 2014, the U.S. Supreme Court reversed a D.C. Circuit Court of Appeals decision upholding these rules and struck down the EPA’s greenhouse gas permitting rules to the extent they impose a requirement to obtain a permit based solely on emissions of greenhouse gases. Under the Court ruling and the EPA's subsequent proposed rules, major sources of other air pollutants, such as VOCs or nitrogen oxides, could still be required to implement process or technology controls and obtain permits regarding emissions of greenhouse gases. These proposed rules have not been finalized. The EPA has issued rules requiring reporting of greenhouse gas, on an annual basis, for certain onshore natural gas and oil production facilities, and in October 2015, the EPA amended and expanded those greenhouse gas reporting requirements to all segments of the oil and gas industry effective January 1, 2016. To the extent legislation is enacted or additional regulations are promulgated that regulate greenhouse gas emissions, it could significantly increase our costs to (i) acquire allowances; (ii) permit new large facilities; (iii) operate and maintain our facilities; (iv) install new emission controls or institute emission reduction measures; and (v) manage a greenhouse gas emissions program. If such legislation becomes law or additional rules are promulgated in the United States or any states in which we have operations and we are unable to pass these costs through as part of our services, it could have an adverse effect on our business and cash available for distributions.
Increased regulation of hydraulic fracturing could result in reductions, delays or increased costs in drilling and completing new oil and natural gas wells, which could adversely impact our revenues by decreasing the volumes of natural gas that we gather, process and transport.
Certain of our customers' natural gas is developed from formations requiring hydraulic fracturing as part of the completion process. Fracturing is a process where water, sand, and chemicals are injected under pressure into subsurface formations to stimulate hydrocarbon production. While the underground injection of fluids is regulated by the EPA under the Safe Drinking Water Act, or SDWA, fracturing is excluded from regulation unless the injection fluid is diesel fuel. The EPA has published an interpretive memorandum and permitting guidance related to regulation of fracturing fluids using this regulatory authority. The EPA has finalized various regulatory programs directed at hydraulic fracturing. For example, in June 2016, the EPA issued regulations under the federal Clean Water Act to further regulate wastewater discharges from hydraulic fracturing and other natural gas production to publicly-owned treatment works. The EPA also expanded, as discussed herein, existing Clean Air Act new source performance standards for new and modified air emissions sources, and finalized Control Techniques Guidelines for existing sources in ozone non-attainment areas, to reduce emissions of methane or VOCs from oil and gas sources, including drilling and production processes. The adoption of new laws or regulations imposing reporting obligations on, or otherwise limiting or regulating, the hydraulic fracturing process could make it more difficult for our customers to complete oil and natural gas wells in shale formations and increase their costs of compliance. In addition, the EPA has studied the potential adverse impact that each stage of hydraulic fracturing may have on the environment; the EPA released a final assessment report
30
of the potential impacts of hydraulic fracturing on drinking water resources in December 2016. Several states in which our customers operate have also adopted regulations requiring disclosure of fracturing fluid components or otherwise regulate their use more closely. In Oklahoma, induced seismicity from injection of fluids in wastewater disposal wells has resulted in regulatory limitations on wastewater disposal into such wells. Under a recent settlement agreement, the EPA will decide by March 2019 whether to initiate rulemaking governing the disposal of wastewater from oil and gas development. The implementation of rules relating to hydraulic fracturing could result in increased expenditures for our exploration and production customers, which could cause them to reduce their production and thereby result in reduced demand for our services by these customers.
On March 28, 2017, President Trump issued Executive Order 13783 entitled “Promoting Energy Independence and Economic Growth.” Executive Order 13783 directed executive departments and agencies to review regulations that potentially burden the development or use of domestically produced energy resources and, as appropriate, suspend, revise, or rescind those that unduly burden domestic energy resources development. On March 26, 2015, the federal Bureau of Land Management (“BLM”) finalized regulations requiring disclosure of chemicals used in hydraulic fracturing activities upon Native American Indian and other federal lands, and added requirements on the use of hydraulic fracturing techniques and management of produced water on these lands. The rule was never implemented due to court challenges. On December 29, 2017, the BLM rescinded the rule. On November 18, 2016, the BLM finalized regulations to, among other things, curtail the flaring during the production of natural gas and oil on Native American Indian and other federal lands, which affects how hydraulically fractured wells are developed and operated. The U.S. District Court denied a preliminary injunction sought by industry groups and the regulation went into effect on January 17, 2017; however, on December 8, 2017, the BLM finalized a rule suspending or delaying many of the provisions of the regulation while it reviews the regulation. Our customers will continue to be subject to uncertainty associated with new regulatory suspensions, revisions, or rescissions and conflicting state and federal regulatory mandates, which could adversely affect their production and thereby result in reduced demand for our services by these customers.
Construction of new assets is subject to regulatory, environmental, political, legal, economic, civil protest, and other risks that may adversely affect our financial results.
The construction of new midstream facilities or additions or modifications to our existing midstream asset systems or propane terminals involves numerous regulatory, environmental, political, legal, and economic uncertainties beyond our control and may require the expenditure of significant amounts of capital. For example, public participation in review and permitting processes can introduce uncertainty and additional costs associated with project timing and completion. Relatedly, civil protests regarding environmental and social issues, including construction of infrastructure associated with fossil fuels, may lead to increased legislative and regulatory initiatives and review at federal, state, and local levels of government that could prevent or delay the construction of such infrastructure and realization of associated revenues. Construction expenditures may occur over an extended period of time, yet we will not receive any material increases in cash flow until the project is completed and fully operational. Moreover, our cash flow from a project may be delayed or may not meet our expectations. These projects may not be completed on schedule or within budgeted cost, or at all. We may construct facilities to capture anticipated future growth in production in a region in which such growth does not materialize. Since we are not engaged in the exploration for and development of natural gas and oil reserves, we often do not have access to third party estimates of potential reserves in an area prior to constructing facilities in such area. To the extent we rely on estimates of future production in our decision to construct new systems or additions to our systems, such estimates may prove to be inaccurate because there are numerous uncertainties inherent in estimating quantities of future production. As a result, these facilities may not be able to attract enough throughput to achieve our expected investment return, which could adversely affect our results of operations and financial condition. The construction of new systems or additions to our existing gathering, transportation and propane terminal assets may require us to obtain new rights-of-way prior to constructing these facilities. We may be unable to obtain such rights-of-way to connect new natural gas supplies to our existing gathering lines, expand our network of propane terminals, or capitalize on other attractive expansion opportunities. The construction of new systems or additions to our existing gathering, transportation and propane terminal assets may require us to rely on third parties downstream of our facilities to have available capacity for our delivered natural gas, NGLs, or propane. If such third party facilities are not constructed or operational at the time that the addition to our facilities is completed, we may experience adverse effects on our results of operations and financial condition. The construction of additional systems may require greater capital investment if the commodity prices of certain supplies such as steel increase. Construction also subjects us to risks related to the ability to construct projects within anticipated costs, including the risk of cost overruns resulting from inflation or increased costs of equipment, materials, labor, or other factors beyond our control that could adversely affect results of operations, financial position or cash flows.
31
We are exposed to the credit risks of our key producer customers and propane purchasers, and any material nonpayment or nonperformance by our key producer customers or our propane purchasers could reduce our ability to make distributions to our unitholders.
We are subject to risks of loss resulting from nonpayment or nonperformance by our producer customers and propane purchasers. Any material nonpayment or nonperformance by our key producer customers or our propane purchasers could reduce our ability to make distributions to our unitholders. Furthermore, some of our producer customers or our propane purchasers may be highly leveraged and subject to their own operating and regulatory risks, which could increase the risk that they may default on their obligations to us. Additionally, a decline in the availability of credit to producers in and surrounding our geographic footprint could decrease the level of capital investment and growth that would otherwise bring new volumes to our existing assets and facilities.
If we do not make acquisitions on economically acceptable terms, our future growth could be limited.
Our ability to make acquisitions that are accretive to our cash generated from operations per unit is based upon our ability to identify attractive acquisition candidates or negotiate acceptable purchase contracts with them and obtain financing for these acquisitions on economically acceptable terms. Furthermore, even if we do make acquisitions that we believe will be accretive, these acquisitions may nevertheless result in a decrease in the cash generated from operations per unit. Additionally, net assets contributed by DCP Midstream, LLC represent a transfer of net assets between entities under common control, and are recognized at DCP Midstream, LLC’s basis in the net assets transferred. The amount of the purchase price in excess of DCP Midstream, LLC’s basis in the net assets, if any, is recognized as a reduction to partners’ equity. Conversely, the amount of the purchase price less than DCP Midstream’s basis in the net assets, if any, is recognized as an increase to partners’ equity.
Any acquisition involves potential risks, including, among other things:
• | mistaken assumptions about volumes, future contract terms with customers, revenues and costs, including synergies; |
• | an inability to successfully integrate the businesses we acquire; |
• | the assumption of unknown liabilities; |
• | limitations on rights to indemnity from the seller; |
• | mistaken assumptions about the overall costs of equity or debt; |
• | the diversion of management’s and employees’ attention from other business concerns; |
• | change in competitive landscape; |
• | unforeseen difficulties operating in new product areas or new geographic areas; and |
• | customer or key employee losses at the acquired businesses. |
If we consummate any future acquisitions, our capitalization and results of operations may change significantly, and unitholders will not have the opportunity to evaluate the economic, financial and other relevant information that we will consider in determining the application of these funds and other resources.
In addition, any limitations on our access to substantial new capital to finance strategic acquisitions will impair our ability to execute this component of our growth strategy. If the cost of such capital becomes too expensive, our ability to develop or acquire accretive assets will be limited. We may not be able to raise the necessary funds on satisfactory terms, if at all. The primary factors that influence our cost of capital include market conditions and offering or borrowing costs such as interest rates or underwriting discounts.
We may not be able to grow or effectively manage our growth.
Historically, a principal focus of our strategy was to continue to grow the per unit distribution on our units by expanding our business. The Transaction resulted in significant growth of the Partnership, but also in the loss of certain future drop down opportunities from DCP Midstream, LLC. Our future growth will depend upon a number of factors, some of which we can control and some of which we cannot. These factors include our ability to:
• | complete construction projects and consummate accretive acquisitions or joint ventures; |
• | identify businesses engaged in managing, operating or owning pipelines, processing and storage assets or other midstream assets for acquisitions, joint ventures and construction projects; |
• | appropriately identify liabilities associated with acquired businesses or assets; |
• | integrate acquired or constructed businesses or assets successfully with our existing operations and into our operating and financial systems and controls; |
• | hire, train and retain qualified personnel to manage and operate our growing business; and |
• | obtain required financing for our existing and new operations at reasonable rates. |
32
A deficiency in any of these factors could adversely affect our ability to sustain the level of our cash flows or realize benefits from acquisitions, joint ventures or construction projects. In addition, competition from other buyers could reduce our acquisition opportunities. DCP Midstream, LLC and its affiliates are not restricted from competing with us. DCP Midstream, LLC and its affiliates may acquire, construct or dispose of midstream or other assets in the future without any obligation to offer us the opportunity to purchase or construct those assets. Furthermore, in recent years we have grown through organic projects, dropdowns and acquisitions. If we fail to properly integrate these assets successfully with our existing operations, if the future performance of these assets does not meet our expectations, if we did not properly value the assets, or we did not identify significant liabilities associated with acquired assets, the anticipated benefits from these transactions may not be fully realized.
Acquisitions may not be beneficial to us.
Acquisitions involve numerous risks, including:
• | the failure to realize expected profitability, growth or accretion; |
• | an increase in indebtedness and borrowing costs; |
• | potential environmental or regulatory compliance matters or liabilities; |
• | potential title issues; |
• | the incurrence of unanticipated liabilities and costs; and |
• | the temporary diversion of management’s attention from managing the remainder of our assets to the process of integrating the acquired businesses. |
Assets recently acquired will also be subject to many of the same risks as our existing assets. If any of these risks or unanticipated liabilities or costs were to materialize, any desired benefits of these acquisitions may not be fully realized, if at all, and our future financial performance and results of operations could be negatively impacted.
Our assets and operations can be affected by weather, weather-related conditions and other natural phenomena.
Our assets and operations can be adversely affected by hurricanes, floods, tornadoes, wind, lightning, cold weather and other natural phenomena, which could impact our results of operations and make it more difficult for us to realize historic rates of return. Although we carry insurance on the vast majority of our assets, insurance may be inadequate to cover our loss and in some instances, we have been unable to obtain insurance on some of our assets on commercially reasonable terms, if at all. If we incur a significant disruption in our operations or a significant liability for which we were not fully insured, our financial condition, results of operations and ability to make distributions to our unitholders could be materially adversely affected.
We may not have sufficient cash from operations following the establishment of cash reserves and payment of fees and expenses, including cost reimbursements to our general partner, to enable us to continue to make cash distributions to our unitholders.
The amount of cash we can distribute on our units principally depends upon the amount of cash we generate from our operations, which will fluctuate from quarter to quarter based on, among other things:
• | the fees we charge and the margins we realize for our services; |
• | the prices of, level of production of, and demand for natural gas, condensate, NGLs and propane; |
• | the success of our commodity and interest rate hedging programs in mitigating fluctuations in commodity prices and interest rates; |
• | the volume and quality of natural gas we gather, compress, treat, process, transport and sell, and the volume of NGLs we process, transport, sell and store, and the volume of propane we transport, sell and store; |
• | the operational performance and efficiency of our assets, including our plants and equipment; |
• | the operational performance and efficiency of third-party processing, fractionation or other facilities that provide services to us; |
• | the relationship between natural gas, NGL and crude oil prices; |
• | the level of competition from other energy companies; |
• | the impact of weather conditions on the demand for natural gas, NGLs and propane; |
• | the level of our operating and maintenance and general and administrative costs; and |
• | prevailing economic conditions. |
In addition, the actual amount of cash we will have available for distribution will depend on other factors, some of which are beyond our control, including:
• | the level of capital expenditures we make; |
33
• | the cost and form of payment for acquisitions; |
• | our debt service requirements and other liabilities; |
• | fluctuations in our working capital needs; |
• | our ability to borrow funds and access capital markets at reasonable rates; |
• | restrictions contained in our Credit Agreement and the indentures governing our notes; |
• | the timing of our producers' obligations to make volume deficiency payments to us; |
• | the amount of cash distributions we receive from our equity interests; |
• | the amount of cost reimbursements to our general partner; |
• | the amount of cash reserves established by our general partner; and |
• | new, additions to and changes in laws and regulations. |
We have partial ownership interests in various joint ventures, which could adversely affect our ability to operate and control these entities. In addition, we may be unable to control the amount of cash we will receive from the operation of these entities and we could be required to contribute significant cash to fund our share of their operations, which could adversely affect our ability to distribute cash to our unitholders.
Our inability, or limited ability, to control the operations and management of joint ventures in which we have a partial ownership interest may mean that we will not receive the amount of cash we expect to be distributed to us. In addition, for joint ventures in which we have a minority ownership interest, we will be unable to control ongoing operational decisions, including the incurrence of capital expenditures that we may be required to fund. Specifically,
• | we have limited ability to control decisions with respect to the operations of these joint ventures, including decisions with respect to incurrence of expenses and distributions to us; |
• | these joint ventures may establish reserves for working capital, capital projects, environmental matters and legal proceedings which would otherwise reduce cash available for distribution to us; |
• | these joint ventures may incur additional indebtedness, and principal and interest made on such indebtedness may reduce cash otherwise available for distribution to us; and |
• | these joint ventures may require us to make additional capital contributions to fund working capital and capital expenditures, our funding of which could reduce the amount of cash otherwise available for distribution. |
All of these items could significantly and adversely impact our ability to distribute cash to our unitholders.
The amount of cash we have available for distribution to our unitholders depends primarily on our cash flow and not solely on profitability.
Profitability may be significantly affected by non-cash items. As a result, we may make cash distributions during periods when we record losses for financial accounting purposes and may not make cash distributions during periods when we record net earnings for financial accounting purposes.
We do not own all of the land on which our pipelines, facilities and rail terminals are located, which may subject us to increased costs.
Upon contract lease renewal, we may be subject to more onerous terms and/or increased costs to retain necessary land use if we do not have valid rights of way or if such rights of way lapse or terminate. Certain of our leases contain renewal provisions that allow for our continued use and access of the subject land and, although we review and renew our leases as a routine business matter, there may be instances where we may not be able to renew our contract leases on commercially reasonable terms or may have to commence eminent domain proceedings to establish our right to continue to use the land. We obtain the rights to construct and operate our pipelines, surface sites and rail terminals on land owned by third parties and governmental agencies for a specific period of time.
Our business involves many hazards and operational risks, some of which may not be fully covered by insurance.
Our operations, and the operations of third parties, are subject to many hazards inherent in the gathering, compressing, treating, processing, storing, transporting and fractionating, as applicable, of natural gas, propane and NGLs, including:
• | damage to pipelines, plants, terminals, storage facilities and related equipment and surrounding properties caused by hurricanes, tornadoes, floods, fires and other natural disasters and acts of terrorism; |
• | inadvertent damage from construction, farm and utility equipment; |
• | leaks of natural gas, propane, NGLs and other hydrocarbons from our pipelines, plants, terminals, or storage facilities, or losses of natural gas, propane or NGLs as a result of the malfunction of equipment or facilities; |
• | contaminants in the pipeline system; |
34
• | fires and explosions; and |
• | other hazards that could also result in personal injury and loss of life, pollution and suspension of operations. |
These risks could result in substantial losses due to personal injury and/or loss of life, severe damage to and destruction of property and equipment and pollution or other environmental damage and may result in curtailment or suspension of our related operations. We are not fully insured against all risks inherent to our business, including offshore wind. Although we insure most of our underground pipeline systems against property damage, certain of our gathering pipelines are not covered. We are not insured against all environmental accidents that might occur, which may include toxic tort claims, other than those considered to be sudden and accidental. In some instances, certain insurance could become unavailable or available only for reduced amounts of coverage, or may become prohibitively expensive, and we may elect not to carry such a policy.
Our business could be negatively impacted by security threats, including cybersecurity threats, terrorist attacks, the threat of terrorist attacks, sustained military campaigns and related disruptions.
We face cybersecurity threats to gain unauthorized access to sensitive information or to render data or systems unusable. Cybersecurity threats are evolving and include, but are not limited to, malicious software, attempts to gain unauthorized access to data, and other electronic security breaches that could lead to disruptions in critical systems, unauthorized release of confidential or otherwise protected information and corruption of data. These events could damage our reputation and lead to financial losses from remedial actions, loss of business or potential liability.
We face the threat of future terrorist attacks on both our industry in general and on us, including the possibility that infrastructure facilities could be direct targets of, or indirect casualties of, an act of terror. The increased security measures we have taken as a precaution against possible terrorist attacks have resulted in increased costs to our business. Any physical damage to facilities resulting from acts of terrorism may not be covered, or covered fully, by insurance. We may be required to expend material amounts of capital to repair any facilities, the expenditure of which could adversely affect our business and cash flows. Changes in the insurance markets attributable to terrorist attacks may make certain types of insurance more difficult for us to obtain. Moreover, the insurance that may be available to us may be significantly more expensive than our existing insurance coverage. Instability in the financial markets as a result of terrorism or war could also affect our ability to raise capital.
The amount of natural gas we gather, compress, treat, process, transport, sell and store, or the NGLs we produce, fractionate, transport, sell and store, may be reduced if the pipelines and storage fractionation facilities to which we deliver the natural gas or NGLs are capacity constrained and cannot, or will not, accept the natural gas or NGLs.
The natural gas we gather, compress, treat, process, transport, sell and store is delivered into pipelines for further delivery to end-users. If these pipelines are capacity constrained and cannot, or will not, accept delivery of the gas due to downstream constraints on the pipeline or changes in interstate pipeline gas quality specifications, we may be forced to limit or stop the flow of gas through our pipelines and processing and treating facilities. In addition, interruption of pipeline service upstream of our processing facilities would limit or stop flow through our processing and fractionation facilities. Likewise, if the pipelines into which we deliver NGLs are interrupted, we may be limited in, or prevented from conducting, our NGL transportation operations. Any number of factors beyond our control could cause such interruptions or constraints on pipeline service, including necessary and scheduled maintenance, or unexpected damage to the pipelines. Because our revenues and net operating margins depend upon (i) the volumes of natural gas we process, gather and transmit, (ii) the throughput of NGLs through our transportation, fractionation and storage facilities and (iii) the volume of natural gas we gather and transport, any reduction of volumes could adversely affect our operations and cash flows available for distribution to our unitholders.
Risks Inherent in an Investment in Our Common Units
Conflicts of interest may exist between our individual unitholders and DCP Midstream, LLC, our general partner, which has sole responsibility for conducting our business and managing our operations.
DCP Midstream, LLC owns and controls our general partner. Some of our general partner’s directors and all of its executive officers are directors or executive officers of DCP Midstream, LLC or its owners. Therefore, conflicts of interest may arise between DCP Midstream, LLC and its affiliates and our unitholders. In resolving these conflicts of interest, our general partner may favor its own interests and the interests of its affiliates over the interests of our unitholders. These conflicts include, among others, the following situations:
• | neither our Partnership Agreement nor any other agreement requires DCP Midstream, LLC to pursue a business strategy that favors us. DCP Midstream, LLC’s directors and officers have a fiduciary duty to make these decisions in the best interests of the owners of DCP Midstream, LLC, which may be contrary to our interests; |
35
• | our general partner is allowed to take into account the interests of parties other than us, such as DCP Midstream, LLC and its affiliates, in resolving conflicts of interest; |
• | DCP Midstream, LLC and its affiliates, including Phillips 66 and Enbridge, are not limited in their ability to compete with us. Please read “DCP Midstream, LLC and its affiliates are not limited in their ability to compete with us” below; |
• | once certain requirements are met, our general partner may make a determination to receive a quantity of our Class B units in exchange for resetting the target distribution levels related to its incentive distribution rights without the approval of the special committee of our general partner or our unitholders; |
• | our general partner has limited its liability and reduced its fiduciary duties, and has also restricted the remedies available to our unitholders for actions that, without the limitations, might constitute breaches of fiduciary duty; |
• | our general partner determines the amount and timing of asset purchases and sales, borrowings, issuance of additional partnership securities and reserves, each of which can affect the amount of cash that is distributed to unitholders; |
• | our general partner determines the amount and timing of any capital expenditures and whether a capital expenditure is a maintenance capital expenditure, which reduces operating surplus, or an expansion capital expenditure, which does not reduce operating surplus. This determination can affect the amount of cash that is distributed to our unitholders; |
• | our general partner determines which costs incurred by it and its affiliates are reimbursable by us; |
• | our Partnership Agreement does not restrict our general partner from causing us to pay it or its affiliates for any services rendered to us or entering into additional contractual arrangements with any of these entities on our behalf; |
• | our general partner intends to limit its liability regarding our contractual and other obligations and, in some circumstances, is entitled to be indemnified by us; |
• | our general partner may exercise its limited right to call and purchase common units if it and its affiliates own more than 80% of the common units; |
• | our general partner controls the enforcement of obligations owed to us by our general partner and its affiliates; and |
• | our general partner decides whether to retain separate counsel, accountants or others to perform services for us. |
DCP Midstream, LLC and its affiliates are not limited in their ability to compete with us, which could cause conflicts of interest and limit our ability to acquire additional assets or businesses, which in turn could adversely affect our results of operations and cash available for distribution to our unitholders.
Neither our Partnership Agreement nor the Services and Employee Secondment Agreement, or the Services Agreement, between us and DCP Midstream, LLC prohibits DCP Midstream, LLC and its affiliates, including Phillips 66 and Enbridge, from owning assets or engaging in businesses that compete directly or indirectly with us. In addition, DCP Midstream, LLC and its affiliates, including Phillips 66 and Enbridge, may acquire, construct or dispose of additional midstream or other assets in the future, without any obligation to offer us the opportunity to purchase or construct any of those assets. Each of these entities is a large, established participant in the midstream energy business, and each has significantly greater resources than we have, which factors may make it more difficult for us to compete with these entities with respect to commercial activities as well as for acquisition candidates. As a result, competition from these entities could adversely impact our results of operations and cash available for distribution.
Cost reimbursements due to our general partner and its affiliates for services provided, which will be determined by our general partner, will be material.
Pursuant to the Services Agreement, DCP Midstream, LLC and its affiliates will receive reimbursement for the payment of operating expenses related to our operations and for the provision of various general and administrative services for our benefit. Payments for these services will be material. In addition, under Delaware partnership law, our general partner has unlimited liability for our obligations, such as our debts and environmental liabilities, except for our contractual obligations that are expressly made without recourse to our general partner. To the extent our general partner incurs obligations on our behalf, we are obligated to reimburse or indemnify it. If we are unable or unwilling to reimburse or indemnify our general partner, our general partner may take actions to cause us to make payments of these obligations and liabilities. These factors may reduce the amount of cash otherwise available for distribution to our unitholders.
Our Partnership Agreement limits our general partner’s fiduciary duties to holders of our common units.
Although our general partner has a fiduciary duty to manage us in a manner beneficial to us and our unitholders, the directors and officers of our general partner have a fiduciary duty to manage our general partner in a manner beneficial to its
36
owner, DCP Midstream, LLC. Our Partnership Agreement contains provisions that reduce the standards to which our general partner would otherwise be held by state fiduciary duty laws. For example, our Partnership Agreement permits our general partner to make a number of decisions either in its individual capacity, as opposed to in its capacity as our general partner or otherwise free of fiduciary duties to us and our unitholders. This entitles our general partner to consider only the interests and factors that it desires, and it has no duty or obligation to give any consideration to any interest of, or factors affecting, us, our affiliates or any limited partner. Examples include:
• | the exercise of its right to reset the target distribution levels of its incentive distribution rights at higher levels and receive, in connection with this reset, a number of Class B units that are convertible at any time following the first anniversary of the issuance of these Class B units into common units; |
• | its limited call right; |
• | its voting rights with respect to the units it owns; |
• | its registration rights; and |
• | its determination whether or not to consent to any merger or consolidation of the partnership or amendment to the Partnership Agreement. |
By purchasing a common unit, a common unitholder will agree to become bound by the provisions in the Partnership Agreement, including the provisions discussed above.
Our Partnership Agreement restricts the remedies available to holders of our common units for actions taken by our general partner that might otherwise constitute breaches of fiduciary duty.
Our Partnership Agreement contains provisions that restrict the remedies available to our unitholders for actions taken by our general partner that might otherwise constitute breaches of fiduciary duty. For example, our Partnership Agreement:
• | provides that our general partner will not have any liability to us or our unitholders for decisions made in its capacity as a general partner so long as it acted in good faith, meaning it believed the decision was in the best interests of our partnership; |
• | generally provides that affiliated transactions and resolutions of conflicts of interest not approved by the special committee of the board of directors of our general partner and not involving a vote of our unitholders must be on terms no less favorable to us than those generally being provided to or available from unrelated third parties or must be “fair and reasonable” to us, as determined by our general partner in good faith and that, in determining whether a transaction or resolution is “fair and reasonable,” our general partner may consider the totality of the relationships between the parties involved, including other transactions that may be particularly advantageous or beneficial to us; and provides that our general partner and its officers and directors will not be liable for monetary damages to us, our limited partners or assignees for any acts or omissions unless there has been a final and non-appealable judgment entered by a court of competent jurisdiction determining that the general partner or those other persons acted in bad faith or engaged in fraud or willful misconduct or, in the case of a criminal matter, acted with knowledge that the conduct was criminal. |
Our general partner may elect to cause us to issue Class B units to it in connection with a resetting of the target distribution levels related to our general partner’s incentive distribution rights without the approval of the special committee of our general partner or holders of our common units. This may result in lower distributions to holders of our common units in certain situations.
Our general partner currently has the right to reset the initial cash target distribution levels at higher levels based on the distribution at the time of the exercise of the reset election. Following a reset election by our general partner, the minimum quarterly distribution amount will be reset to an amount equal to the average cash distribution amount per common unit for the two fiscal quarters immediately preceding the reset election, or the reset minimum quarterly distribution, and the target distribution levels will be reset to correspondingly higher levels based on percentage increases above the reset minimum quarterly distribution amount. Currently, our distribution to our general partner related to its incentive distribution rights is at the highest level.
In connection with resetting these target distribution levels, our general partner will be entitled to receive a number of Class B units. The Class B units will be entitled to the same cash distributions per unit as our common units and will be convertible into an equal number of common units. The number of Class B units to be issued will be equal to that number of common units whose aggregate quarterly cash distributions equaled the average of the distributions to our general partner on the incentive distribution rights in the prior two quarters. We anticipate that our general partner would exercise this reset right in order to facilitate acquisitions or internal growth projects that would not be sufficiently accretive to cash distributions per common unit without such conversion; however, it is possible that our general partner could exercise this reset election at a time when it is experiencing, or may be expected to experience, declines in the cash distributions it receives related to its
37
incentive distribution rights and may therefore desire to be issued our Class B units, which are entitled to receive cash distributions from us on the same priority as our common units, rather than retain the right to receive incentive distributions based on the initial target distribution levels. As a result, in certain situations, a reset election may cause our common unitholders to experience dilution in the amount of cash distributions that they would have otherwise received had we not issued new Class B units to our general partner in connection with resetting the target distribution levels related to our general partner incentive distribution rights.
Holders of our common units have limited voting rights and are not entitled to elect our general partner or its directors.
Unlike the holders of common stock in a corporation, unitholders have only limited voting rights on matters affecting our business and, therefore, limited ability to influence management’s decisions regarding our business. Our unitholders do not elect our general partner or its board of directors, and have no right to elect our general partner or its board of directors on an annual or other continuing basis. The board of directors of our general partner are chosen by the members of our general partner. As a result of these limitations, the price at which the common units trade could be diminished because of the absence or reduction of a takeover premium in the trading price.
Our common units may experience price volatility.
Our common unit price has experienced volatility in the past, and volatility in the price of our common units may occur in the future as a result of any of the risk factors contained herein and the risks described in our other public filings with the SEC. For instance, our common units may experience price volatility as a result of changes in investor sentiment with respect to our competitors, our business partners and our industry in general, which may be influenced by volatility in prices for NGLs, natural gas and crude oil. In addition, the securities markets have from time to time experienced significant price and volume fluctuations that are unrelated to the operating performance of particular companies but affect the market price of their securities. These market fluctuations may also materially and adversely affect the market price of our common units.
Even if our unitholders are dissatisfied, they may be unable to remove our general partner without its consent.
The unitholders may be unable to remove our general partner without its consent because our general partner and its affiliates own a significant percentage of our outstanding units. The vote of the holders of at least 66 2/3% of all outstanding common units is required to remove the general partner. As of December 31, 2017, our general partner and its affiliates owned approximately 36% of our outstanding common units.
Our Partnership Agreement restricts the voting rights of our unitholders owning 20% or more of any class of our units.
Our unitholders’ voting rights are further restricted by the Partnership Agreement provision providing that any units held by a person that owns 20% or more of any class of units then outstanding, other than our general partner, its affiliates, their transferees and persons who acquired such units with the prior approval of the board of directors of our general partner, cannot vote on any matter. Our Partnership Agreement also contains provisions limiting the ability of our unitholders to call meetings or to acquire information about our operations, as well as other provisions limiting our unitholders’ ability to influence the manner or direction of management.
If we are deemed an “investment company” under the Investment Company Act of 1940, it would adversely affect the price of our common units and could have a material adverse effect on our business.
Our assets include certain equity investments, such as minority ownership interests in joint ventures, which may be deemed to be “investment securities” within the meaning of the Investment Company Act of 1940, as amended (the "Investment Company Act"). In the future, we may acquire additional minority-owned interests in joint ventures that could be deemed "investment securities." If a sufficient amount of our assets are deemed to be “investment securities” within the meaning of the Investment Company Act, we would either have to register as an investment company under the Investment Company Act, obtain exemptive relief from the SEC or modify our organizational structure or our contract rights to fall outside the definition of an investment company. Registering as an investment company could, among other things, materially limit our ability to engage in transactions with affiliates, including the purchase and sale of certain securities or other property to or from our affiliates, restrict our ability to borrow funds or engage in other transactions involving leverage and require us to add additional directors who are independent of us or our affiliates. The occurrence of some or all of these events may have a material adverse effect on our business.
Moreover, treatment of us as an investment company would prevent our qualification as a partnership for federal income tax purposes in which case we would be treated as a corporation for federal income tax purposes, and be subject to federal
38
income tax at the corporate tax rate, which could significantly reduce the cash available for distributions. Additionally, distributions to our unitholders would be taxed again as corporate distributions and none of our income, gains, losses or deductions would flow through to our unitholders.
Additionally, as a result of our desire to avoid having to register as an investment company under the Investment Company Act, we may have to forgo potential future acquisitions of interests in companies that may be deemed to be investment securities within the meaning of the Investment Company Act or dispose of our current interests in any of our assets that are deemed to be “investment securities.”
Control of our general partner may be transferred to a third party without unitholder consent.
Our general partner may transfer its general partner interest to a third party in a merger or in a sale of all or substantially all of its assets without the consent of our unitholders. Furthermore, under our Partnership Agreement the owners of our general partner may pledge, impose a lien or transfer all or a portion of their respective ownership interest in our general partner to a third party. Any new owners of our general partner would then be in a position to replace the board of directors and officers of the general partner with its own choices and thereby influence the decisions taken by the board of directors and officers.
We may generally issue additional units, including units that are senior to our common units, without our unitholders’ approval, which would dilute our unitholders’ existing ownership interests.
Our Partnership Agreement does not limit the number of additional common units that we may issue at any time without the approval of our unitholders. The issuance by us of additional common units, preferred units, or other equity securities of equal or senior rank will have the following effects:
• | our unitholders’ proportionate ownership interest in us will decrease, including a relative dilution of any voting rights; |
• | the amount of cash available for distribution on each unit may decrease; |
• | the ratio of taxable income to distributions may increase; |
• | the relative voting strength of each previously outstanding unit may be diminished; and |
• | the market price of the common units may decline. |
We are prohibited from paying distributions on our common units if distributions on our Series A Preferred Units are in arrears.
The holders of our Series A Preferred Units are entitled to certain rights that are senior to the rights of holders of common units, such as rights to distributions and rights upon liquidation of the Partnership. If we do not pay the required distributions on our Series A Preferred Units, we will be unable to pay distributions on our common units. Additionally, because distributions to our Series A Preferred Unitholders are cumulative, we will have to pay all unpaid accumulated preferred distributions before we can pay any distributions to our common unitholders. Also, because distributions to our common unitholders are not cumulative, if we do not pay distributions on our common units with respect to any quarter, our common unitholders will not be entitled to receive distributions covering any prior periods if we later commence paying distributions on our common units. The preferences and privileges of the Series A Preferred Units could adversely affect the market price for our common units, or could make it more difficult for us to sell our common units in the future.
Our Series A Preferred Units are subordinated to our existing and future debt obligations, and your interests could be diluted by the issuance of additional units, including additional Series A Preferred Units, and by other transactions.
The Series A Preferred Units are subordinated to all of our existing and future indebtedness. The payment of principal and interest on our debt reduces cash available for distribution to our limited partners, including the holders of Series A Preferred Units. The issuance of additional units on parity with or senior to the Series A Preferred Units (including additional Series A Preferred Units) would dilute the interests of the holders of the Series A Preferred Units, and any issuance of equal or senior ranking securities or additional indebtedness could affect our ability to pay distributions on, redeem or pay the liquidation preference on the Series A Preferred Units.
We distribute all of our available cash to our common unitholders and are not required to accumulate cash for the purpose of meeting our future obligations to holders of the Series A Preferred Units, which may limit the cash available to make distributions on the Series A Preferred Units.
Our Partnership Agreement requires us to distribute all of our “available cash” each quarter to our common unitholders. “Available cash” is defined in our Partnership Agreement and described below under “Item 5. Market for Registrant’s Common
39
Equity, Related Unitholder Matters and Issuer Purchases of Common Units—Distributions of Available Cash—Definition of Available Cash.” As a result, we do not expect to accumulate significant amounts of cash. Depending on the timing and amount of our cash distributions, these distributions could significantly reduce the cash available to us in subsequent periods to make payments on the Series A Preferred Units.
Our general partner including its affiliates may sell units in the public or private markets, which could reduce the market price of our outstanding common units.
If our general partner or its affiliates holding unregistered common units were to dispose of a substantial portion of these units in the public market, whether in a single transaction or series of transactions, it could reduce the market price of our outstanding common units. In addition, these sales, or the possibility that these sales may occur, could make it more difficult for us to sell our common units in the future.
Our general partner has a limited call right that may require our unitholders to sell their units at an undesirable time or price.
If at any time our general partner and its affiliates own more than 80% of the common units, our general partner will have the right, but not the obligation, which it may assign to any of its affiliates or to us, to acquire all, but not less than all, of the common units held by unaffiliated persons at a price not less than their then-current market price. As a result, our common unitholders may be required to sell their common units at an undesirable time or price and may not receive any return on their investment. Our common unitholders may also incur a tax liability upon a sale of their common units.
The liability of holders of limited partner interests may not be limited if a court finds that unitholder action constitutes control of our business.
A general partner of a partnership generally has unlimited liability for the obligations of the partnership, except for those contractual obligations of the partnership that are expressly made without recourse to the general partner. Our partnership is organized under Delaware law and we conduct business in a number of other states. The limitations on the liability of holders of limited partner interests for the obligations of a limited partnership have not been clearly established in some of the other states in which we do business. Holders of limited partner interests could be liable for any and all of our obligations as if such holder were a general partner if:
• | a court or government agency determined that we were conducting business in a state but had not complied with that particular state’s partnership statute; or |
• | the right of holders of limited partner interests to act with other unitholders to remove or replace the general partner, to approve some amendments to our Partnership Agreement or to take other actions under our Partnership Agreement constitute “control” of our business. |
Unitholders may have liability to repay distributions that were wrongfully distributed to them.
Under certain circumstances, our unitholders may have to repay amounts wrongfully returned or distributed to them. Under Section 17-607 of the Delaware Revised Uniform Limited Partnership Act, we may not make a distribution to our unitholders if the distribution would cause our liabilities to exceed the fair value of our assets. Delaware law provides that for a period of three years from the date of the impermissible distribution, limited partners who received the distribution and who knew at the time of the distribution that it violated Delaware law will be liable to the limited partnership for the distribution amount. Substituted limited partners are liable for the obligations of the assignor to make contributions to the partnership that are known to the substituted limited partner at the time it became a limited partner and for unknown obligations if the liabilities could be determined from the Partnership Agreement. Liabilities to partners on account of their partnership interest and liabilities that are non-recourse to the partnership are not counted for purposes of determining whether a distribution is permitted.
Tax Risks to Unitholders
Our tax treatment depends on our status as a partnership for federal income tax purposes, as well as our being subject to minimal entity-level taxation by individual states. If the Internal Revenue Service, or IRS, were to treat us as a corporation for federal income tax purposes, or we become subject to a material amount of entity-level taxation for state tax purposes, it would substantially reduce the amount of cash available for distribution to our unitholders.
The anticipated after-tax economic benefit of an investment in the common units depends largely on our being treated as a partnership for federal income tax purposes. We have not requested, and do not plan to request, a ruling from the IRS regarding our status as a partnership.
40
Despite the fact that we are a limited partnership under Delaware law, it is possible in certain circumstances for a partnership such as ours to be treated as a corporation for federal income tax purposes. Although we do not believe based upon our current operations that we will be treated as a corporation, the IRS could disagree with the positions we take or a change in our business (or a change in current law) could cause us to be treated as a corporation for federal income tax purposes or otherwise subject us to taxation as an entity.
If we were treated as a corporation for federal income tax purposes, we would pay federal income tax on our taxable income at the corporate tax rate, which is currently 21% for taxable years beginning after December 31, 2017, and would likely pay state income tax at varying rates. Distributions to a unitholder would generally be taxed again as corporate dividends (to the extent of our current and accumulated earnings and profits), and no income, gains, losses, deductions, or credits would flow through to the unitholder. Because a tax would be imposed upon us as a corporation, our cash available for distribution to a unitholder would be substantially reduced. Therefore, treatment of us as a corporation for federal tax purposes would result in a material reduction in the anticipated cash flow and after-tax return to a unitholder, likely causing a substantial reduction in the value of our units.
The Partnership Agreement provides that if a law is enacted or existing law is modified or interpreted in a manner that subjects us to taxation as a corporation or otherwise subjects us to entity level taxation for federal, state or local income tax purposes, the minimum quarterly distribution amount and the target distribution levels will be adjusted to reflect the impact of that law on us.
The tax treatment of publicly traded partnerships or an investment in our units could be subject to potential legislative, judicial or administrative changes and differing interpretations, possibly on a retroactive basis.
The present federal income tax treatment of publicly traded partnerships, including us, or an investment in our units, may be modified by administrative, legislative or judicial interpretation at any time. Any modification to the federal income tax laws and interpretations thereof may or may not be applied retroactively. Moreover, any such modification could make it more difficult or impossible for us to meet the exception that allows publicly traded partnerships that generate qualifying income to be treated as partnerships (rather than corporations) for federal income tax purposes, affect or cause us to change our business activities, or affect the tax consequences of an investment in our units. The U.S. Treasury Department issued final regulations interpreting the scope of activities that generate qualifying income under Section 7704 of the Internal Revenue Code of 1986, as amended, or the Code. We believe that the income we currently treat as qualifying income satisfies the requirements for qualifying income under the final regulations.
Recently enacted legislation provides a deduction to a non-corporate common unitholder, for taxable years beginning after December 31, 2017 and ending on or before December 31, 2025, equal to 20% of his or her allocable share of our “qualified business income.” For purposes of this deduction, our “qualified business income” is equal to the sum of the net amount of our items of income, gain, deduction and loss to the extent such items are included or allowed in the determination of taxable income for the year, excluding, however, certain specified types of passive investment income (such as capital gains and dividends); and any gain recognized upon a disposition of our units to the extent such gain is attributable to certain assets, such as depreciation recapture and our “inventory items,” and is thus treated as ordinary income under Section 751 of the Code. This legislation also includes certain new limitations on the use of losses and other deductions to offset taxable income. Various aspects of this deduction and these limitations may be modified by administrative, legislative or judicial interpretations at any time, which may or may not be applied retroactively.
Because of widespread state budget deficits and other reasons, several states are evaluating ways to subject partnerships to entity-level taxation through the imposition of state income, franchise and other forms of taxation, which would reduce the cash available for distribution to our unitholders. For example, we are required to pay the State of Texas a margin tax that is assessed at 0.75% of taxable margin apportioned to Texas. The Partnership Agreement provides that if a law is enacted or existing law is modified or interpreted in a manner that subjects us to taxation as a corporation or otherwise subjects us to entity-level taxation for federal, state or local income tax purposes, the minimum quarterly distribution amount and the target distribution levels will be adjusted to reflect the impact of that law on us.
Changes in tax laws could adversely affect our performance.
We are subject to extensive tax laws and regulations, with respect to federal, state and foreign income taxes and transactional taxes such as excise, sales/use, payroll, franchise and ad valorem taxes. New tax laws and regulations and changes in existing tax laws and regulations are continuously being enacted that could result in increased tax expenditures in the future.
41
If tax authorities contest the tax positions we take, the market for our units may be adversely impacted, and the cost of any contest with a tax authority would reduce our cash available for distribution to our unitholders.
We have not requested a ruling from the IRS with respect to our treatment as a partnership for federal income tax purposes. Tax authorities may adopt positions that differ from the conclusions of our counsel or from the positions we take, and the tax authority's positions may ultimately be sustained. It may be necessary to resort to administrative or court proceedings to sustain some or all of our counsel’s conclusions or the positions we take. A court may not agree with some or all of our counsel’s conclusions or positions we take. Any contest with a tax authority, and the outcome of any such contest, may increase a unitholder’s tax liability and result in adjustment to items unrelated to us and could materially and adversely impact the market for our units and the price at which they trade. In addition, our costs of any contest with any tax authority will be borne indirectly by our unitholders and our general partner because such costs will reduce our cash available for distribution.
For taxable years beginning after December 31, 2017, the procedures for auditing large partnerships and the procedures for assessing and collecting taxes due (including applicable penalties and interest) as a result of an audit have changed. Unless we are eligible to (and choose to) elect to issue revised Schedules K-1 to our partners with respect to an audited and adjusted return, the IRS may assess and collect taxes (including any applicable penalties and interest) directly from us in the year in which the audit is completed under the new procedures. If we are required to pay taxes, penalties and interest as the result of audit adjustments, cash available for distribution to our unitholders may be substantially reduced. In addition, because payment would be due for the taxable year in which the audit is completed, unitholders during that taxable year would bear the expense of the adjustment even if they were not unitholders during the audited taxable year.
Our unitholders may be required to pay taxes on income from us even if the unitholders do not receive any cash distributions from us.
Because our unitholders will be treated as partners to whom we will allocate taxable income, which could be different in amount than the cash we distribute, unitholders will be required to pay any federal income taxes and, in some cases, state and local income taxes on their share of our taxable income even if they receive no cash distributions from us. Unitholders may not receive cash distributions from us equal to their share of our taxable income or even equal to the tax liability that results from that income.
Certain actions that we may take, such as issuing additional units, may increase the federal income tax liability of unitholders.
In the event we issue additional units or engage in certain other transactions in the future, the allocable share of nonrecourse liabilities allocated to the unitholders will be recalculated to take into account our issuance of any additional units. Any reduction in a unitholder’s share of our nonrecourse liabilities will be treated as a distribution of cash to that unitholder and will result in a corresponding tax basis reduction in a unitholder’s units. A deemed cash distribution may, under certain circumstances, result in the recognition of taxable gain by a unitholder, to the extent that the deemed cash distribution exceeds such unitholder’s tax basis in its units.
In addition, the federal income tax liability of a unitholder could be increased if we dispose of assets or make a future offering of units and use the proceeds in a manner that does not produce substantial additional deductions, such as to repay indebtedness currently outstanding or to acquire property that is not eligible for depreciation or amortization for federal income tax purposes or that is depreciable or amortizable at a rate significantly slower than the rate currently applicable to our assets.
Tax gain or loss on disposition of common units could be more or less than expected.
If a unitholder sells its common units, the unitholder will recognize a gain or loss equal to the difference between the amount realized and the unitholder's tax basis in those common units. Because distributions to a unitholder in excess of the total net taxable income allocated to it for a common unit decreases its tax basis in that common unit, the amount, if any, of such prior excess distributions with respect to the units sold will, in effect, become taxable income to the unitholder if the common unit is sold at a price greater than their tax basis in that common unit, even if the price is less than their original cost. Furthermore, a substantial portion of the amount realized, whether or not representing gain, may be taxed as ordinary income due to potential recapture items, including depreciation recapture. In addition, because the amount realized includes a unitholder’s share of our nonrecourse liabilities, if a unitholder sells its units, the unitholder may incur a tax liability in excess of the amount of cash the unitholder receives from the sale.
42
Tax-exempt entities and non-U.S. persons face unique tax issues from owning units that may result in adverse tax consequences to them.
Investment in units by tax-exempt entities, such as individual retirement accounts, or IRAs, other retirement plans and non-U.S. persons raises issues unique to them. For example, virtually all of our income allocated to organizations that are exempt from federal income tax, including IRAs and other retirement plans, will be unrelated business taxable income, which may be taxable to them.
Distributions to non-U.S. persons will be reduced by withholding taxes at the highest applicable effective tax rate, and non-U.S. persons will be required to file United States federal tax returns and pay tax on their share of our taxable income. Gain recognized from a sale or other disposition of our units by a non-U.S. person will be subject to federal income tax as income effectively connected with a U.S. trade or business. Moreover, the transferee of our units is generally required to withhold 10% of the amount realized by the transferor unless the transferor certifies that it is not a foreign person, and we are required to deduct and withhold from the transferee amounts that should have been withheld by the transferees but were not withheld. Because the “amount realized” includes a partner's share of the partnership's liabilities, 10% of the amount realized could exceed the total cash purchase price for the units. However, the IRS has suspended the application of this withholding rule to open market transfers of interest in publicly traded partnerships, pending promulgation of regulations or other guidance that address the amount to be withheld, the reporting necessary to determine such amount and the appropriate party to withhold such amounts. It is not clear if or when such regulations or other guidance will be issued.
If a unitholder is a tax-exempt entity or a non-U.S. person, the unitholder should consult its tax advisor before investing in our units.
We treat each purchaser of our common units as having the same tax benefits without regard to the actual common units purchased. The IRS may challenge this treatment, which could adversely affect the value of the common units.
Because we cannot match transferors and transferees of common units and because of other reasons, we have adopted depreciation and amortization positions that may not conform to all aspects of existing Treasury regulations. A successful IRS challenge to those positions could adversely affect the amount of tax benefits available to the unitholders. It also could affect the timing of these tax benefits or the amount of gain from the sale of common units and could have a negative impact on the value of our common units or result in audit adjustments to our unitholders’ tax returns.
We prorate our items of income, gain, loss and deduction between transferors and transferees of our units each month based upon the ownership of our units on the first day of each month, instead of on the basis of the date a particular unit is transferred. The IRS may challenge this treatment, which could change the allocation of items of income, gain, loss and deduction among our unitholders.
We prorate our items of income, gain, loss and deduction between transferors and transferees of our units each month based upon the ownership of our units on the first day of each month, instead of on the basis of the date a particular unit is transferred. The U.S. Treasury Department has adopted final regulations that provide a safe harbor pursuant to which publicly traded partnerships may use a similar monthly simplifying convention to allocate tax items among transferor and transferee unitholders. These regulations do not specifically authorize the proration method we have previously used. If the IRS were to challenge our proration method or new Treasury regulations were issued, we may be required to change the allocation of items of income, gain, loss and deduction among our unitholders.
43
A unitholder whose units are loaned to a “short seller” to cover a short sale of units may be considered as having disposed of those units. If so, the unitholder would no longer be treated for tax purposes as a partner with respect to those units during the period of the loan and may be required to recognize gain or loss from the disposition.
Because a unitholder whose units are loaned to a “short seller” to cover a short sale of units may be considered as having disposed of the loaned units, the unitholder may no longer be treated for tax purposes as a partner with respect to those units during the period of the loan to the short seller and such unitholder may be required to recognize gain or loss from such disposition. Moreover, during the period of the loan to the short seller, any of our income, gain, loss or deduction with respect to those units may not be reportable by the unitholder and any cash distributions received by the unitholder as to those units could be fully taxable as ordinary income. Unitholders desiring to assure their status as partners and avoid the risk of gain recognition from a loan to a short seller are urged to modify any applicable brokerage account agreements to prohibit their brokers from borrowing and lending their units.
We have adopted certain valuation methodologies that may result in a shift of income, gain, loss and deduction between the general partner and the unitholders. The IRS may challenge this treatment, which could adversely affect the value of the units.
When we issue additional units or engage in certain other transactions, we determine the fair market value of our assets and allocate any unrealized gain or loss attributable to our assets to the capital accounts of our unitholders and our general partner. Our methodology may be viewed as understating the value of our assets. In that case, there may be a shift of income, gain, loss and deduction between certain unitholders and the general partner, which may be unfavorable to such unitholders. Moreover, subsequent purchasers of our units may have a greater portion of their adjustment under Section 743(b) of the Code allocated to our tangible assets and a lesser portion allocated to our intangible assets. The IRS may challenge our valuation methods, or our allocation of the Section 743(b) adjustment attributable to our tangible and intangible assets, and allocations of income, gain, loss and deduction between the general partner and certain of our unitholders.
A successful IRS challenge to these methods or allocations could adversely affect the amount of taxable income or loss being allocated to our unitholders. It also could affect the amount of gain from our unitholders’ sale of our units and could have a negative impact on the value of our units or result in audit adjustments to our unitholders’ tax returns without the benefit of additional deductions.
Treatment of distributions on our Series A Preferred Units as guaranteed payments for the use of capital creates a different tax treatment for the holders of Series A Preferred Units than the holders of our common units.
The tax treatment of distributions on our Series A Preferred Units is uncertain. We will treat the holders of our Series A Preferred Units as partners for tax purposes and will treat distributions on our Series A Preferred Units as guaranteed payments for the use of capital that will generally be taxable to the holders of our Series A Preferred Units as ordinary income and will not be eligible for the deduction provided for under Code Section 199A. Although a holder of our Series A Preferred Units could recognize taxable income from the accrual of such a guaranteed payment even in the absence of a contemporaneous distribution, we anticipate accruing and making the guaranteed payment distributions semi-annually through and including December 15, 2022 and quarterly thereafter. Because the guaranteed payment for each unit must accrue as income to a holder during the taxable year of the accrual, the guaranteed payment attributable to the period beginning December 15 and ending December 31 will accrue as income to the holder of record of a Series A Preferred Unit on December 31 for such period, regardless of whether such holder continues to own the Series A Preferred Unit at the time the actual distribution is made. Otherwise, the holders of our Series A Preferred Units are generally not anticipated to share in our items of income, gain, loss or deduction, except to the extent necessary to provide, to the extent possible, the Series A Preferred Units with the benefit of the liquidation preference. We will not allocate any share of our nonrecourse liabilities to the holders of our Series A Preferred Units. If our Series A Preferred Units were treated as indebtedness for tax purposes, rather than as partnership interests, distributions on our Series A Preferred Units likely would be treated as payments of interest by us to the holders of our Series A Preferred Units, rather than as guaranteed payments for the use of capital.
A holder of our Series A Preferred Units will be required to recognize gain or loss on a sale of its Series A Preferred Units equal to the difference between the amount realized by such holder and tax basis in the Series A Preferred Units sold. The amount realized generally will equal the sum of the cash and the fair market value of other property such holder receives in exchange for such Series A Preferred Units. Subject to general rules requiring a blended basis among multiple partnership interests, the tax basis of a Series A Preferred Unit will generally be equal to the sum of the cash and the fair market value of other property paid by the holder of the Series A Preferred Unit to acquire such Series A Preferred Unit. Gain or loss recognized by a holder of a Series A Preferred Unit on the sale or exchange of a Series A Preferred Unit held for more than one year generally will be taxable as long-term capital gain or loss. Because holders of our Series A Preferred Units will generally not be
44
allocated a share of our items of depreciation, depletion or amortization, it is not anticipated that such holders would be required to recharacterize any portion of their gain as ordinary income as a result of the recapture rules.
Unitholders may be subject to state and local taxes and return filing requirements in states where they do not live as a result of investing in our units.
In addition to federal income taxes, unitholders may be subject to other taxes, including foreign, state and local taxes, unincorporated business taxes and estate, inheritance or intangible taxes that are imposed by the various jurisdictions in which we do business or own property, even if the unitholders do not live in any of those jurisdictions. Unitholders may be required to file foreign, state and local income tax returns and pay state and local income taxes in some or all of these jurisdictions. Further, the unitholder may be subject to penalties for failure to comply with those requirements. As we make acquisitions or expand our business, we may own assets or do business in additional states that impose a personal income tax or an entity level tax. It is each unitholder’s responsibility to file all United States federal, foreign, state and local tax returns. Our counsel has not rendered an opinion on the foreign, state or local tax consequences of an investment in our units.
Item 1B. Unresolved Staff Comments
None.
Item 2. Properties
For details on our plants, fractionation and storage facilities, propane terminals and pipeline systems, please read Item 1. "Business - Our Operating Segments”. We believe that our properties are generally in good condition, well maintained and are suitable and adequate to carry on our business at capacity for the foreseeable future.
Our real property falls into two categories: (1) parcels that we own in fee; and (2) parcels in which our interest derives from leases, easements, rights-of-way, permits or licenses from landowners or governmental authorities permitting the use of such land for our operations. Portions of the land on which our plants and other major facilities are located are owned by us in fee title, and we believe that we have satisfactory title to these lands. The remainder of the land on which our plant sites and major facilities are located are held by us pursuant to ground leases between us, as lessee, and the fee owner of the lands, as lessors. We, or our predecessors, have leased these lands for many years without any material challenge known to us relating to the title to the land upon which the assets are located, and we believe that we have satisfactory leasehold estates to such lands. We have no knowledge of any challenge to the underlying fee title of any material lease, easement, right-of-way, permit or license held by us or to our title to any material lease, easement, right-of-way, permit or lease, and we believe that we have satisfactory title to all of our material leases, easements, rights-of-way, permits and licenses.
Our principal executive offices are located at 370 17th Street, Suite 2500, Denver, Colorado 80202, our telephone number is 303-595-3331 and our website address is www.dcpmidstream.com.
Item 3. Legal Proceedings
We are not a party to any significant legal proceedings, but are a party to various administrative and regulatory proceedings and commercial disputes that have arisen in the ordinary course of our business. Management currently believes that the ultimate resolution of these matters, taken as a whole, and after consideration of amounts accrued, insurance coverage or other indemnification arrangements, will not have a material adverse effect upon our consolidated results of operations, financial position or cash flows. For more information, please read “Environmental Matters.”
Environmental — The operation of pipelines, plants and other facilities for gathering, transporting, processing, treating, fractionating, or storing natural gas, NGLs and other products is subject to stringent and complex laws and regulations pertaining to health, safety and the environment. As an owner or operator of these facilities, we must comply with laws and regulations at the federal, state and, in some cases, local levels that relate to worker safety, air and water quality, solid and hazardous waste management and disposal, and other environmental matters. The cost of planning, designing, constructing and operating pipelines, plants, and other facilities incorporates compliance with environmental laws and regulations, worker safety standards, and safety standards applicable to our various facilities. In addition, there is increasing focus from (i) city, state and federal regulatory officials and through litigation, on hydraulic fracturing and the real or perceived environmental impacts of this technique, which indirectly presents some risk to our available supply of natural gas and the resulting supply of NGLs, (ii) from federal regulatory agencies regarding pipeline system safety which could impose additional regulatory burdens and increase the cost of our operations, and (iii) from state and federal regulatory officials regarding the emission of greenhouse gases which could impose regulatory burdens and increase the cost of our operations, and (iv) regulatory bodies and communities that could prevent or delay the development of fossil fuel energy infrastructure such as pipelines, plants, and other
45
facilities used in our business. Failure to comply with these various health, safety and environmental laws and regulations may trigger a variety of administrative, civil and potentially criminal enforcement measures, including citizen suits, which can include the assessment of monetary penalties, the imposition of remedial requirements, and the issuance of injunctions or restrictions on operation. Management believes that, based on currently known information, compliance with these existing laws and regulations will not have a material adverse effect on our results of operations, financial position or cash flows.
Item 4. Mine Safety Disclosures
Not applicable.
PART II
Item 5. Market for Registrant’s Common Units, Related Unitholder Matters and Issuer Purchases of Common Units
Market Information
Our common units are listed on the New York Stock Exchange ("NYSE") under the symbol "DCP". The following table sets forth intra-day high and low sales prices of the common units, as reported by the NYSE, as well as the amount of cash distributions declared per quarter for 2017 and 2016.
Quarter Ended | High | Low | Distribution Per Common Unit | ||||||
December 31, 2017 | 38.03 | 32.08 | 0.78 | ||||||
September 30, 2017 | 36.10 | 29.95 | 0.78 | ||||||
June 30, 2017 | 40.29 | 29.70 | 0.78 | ||||||
March 31, 2017 | 42.45 | 35.64 | 0.78 | ||||||
December 31, 2016 | 39.43 | 31.03 | 0.78 | ||||||
September 30, 2016 | 36.21 | 31.23 | 0.78 | ||||||
June 30, 2016 | 38.15 | 24.70 | 0.78 | ||||||
March 31, 2016 | 28.53 | 15.09 | 0.78 | ||||||
As of February 22, 2018, there were approximately 40 unitholders of record of our common units. This number does not include unitholders whose common units are held in trust by other entities.
Distributions of Available Cash
General - Our Partnership Agreement requires that, within 45 days after the end of each quarter, we distribute all of our Available Cash (defined below) to unitholders of record on the applicable record date, as determined by our general partner.
Definition of Available Cash - Available Cash, for any quarter, consists of all cash and cash equivalents on the date of determination of available cash for that quarter:
• | less the amount of cash reserves established by our general partner to: |
• | provide for the proper conduct of our business, including reserves for future capital expenditures and anticipated credit needs; |
• | comply with applicable law or any debt instrument or other agreement or obligation; |
• | provide funds to make payments on the 7.375% Series A Fixed-to-Floating Rate Cumulative Redeemable Perpetual Preferred Units; or |
• | provide funds for distributions to our common unitholders and to our general partner for any one or more of the next four quarters. |
• | plus, if our general partner so determines, all or a portion of cash and cash equivalents on hand on the date of determination of Available Cash for the quarter. |
Minimum Quarterly Distribution - The Minimum Quarterly Distribution, as set forth in the Partnership Agreement, is $0.35 per unit per quarter, or $1.40 per unit per year. Our current quarterly distribution is $0.78 per unit, or $3.12 per unit
46
annualized. There is no guarantee that we will maintain our current distribution or pay the Minimum Quarterly Distribution on the units in any quarter. Even if our cash distribution policy is not modified or revoked, the amount of distributions paid under our policy and the decision to make any distribution is determined by our general partner, taking into consideration the terms of our Partnership Agreement. Please read “Management’s Discussion and Analysis of Financial Condition and Results of Operations - Capital Requirements - Liquidity and Capital Resources” for a discussion of the restrictions included in our Credit Agreement that may restrict our ability to make distributions.
General Partner Interest and Incentive Distribution Rights - As of December 31, 2017, the General Partner was entitled to a percentage of all quarterly distributions equal to its General Partner interest of approximately 2% and limited partner interest of 36%. The General Partner has the right, but not the obligation, to contribute a proportionate amount of capital to us to maintain its current General Partner interest. The General Partner’s interest may be reduced if we issue additional units in the future and our General Partner does not contribute a proportionate amount of capital to us to maintain its current General Partner interest.
The incentive distribution rights held by our General Partner entitle it to receive an increasing share of Available Cash as pre-defined distribution targets have been achieved. Currently, our distribution to our General Partner related to its incentive distribution rights is at the highest level. Our General Partner’s incentive distribution rights have not been reduced as a result of our common unit offerings, and will not be reduced if we issue additional units in the future and the General Partner does not contribute a proportionate amount of capital to us to maintain its current General Partner interest.
As part of the Transaction, Phillips 66 and Enbridge agreed, if required, to provide a reduction to incentive distributions payable to our General Partner under our Partnership Agreement of up to $100 million annually through 2019 to target an approximate 1.0 times distribution coverage ratio. Under the terms of our amended Partnership Agreement, the amount of incentive distributions paid to our General Partner will be evaluated by our General Partner on both a quarterly and annual basis and may be reduced each quarter by an amount determined by our General Partner (the “IDR giveback”). If no determination is made by our General Partner, the quarterly IDR giveback will be $20 million. The IDR giveback, of up to $100 million annually, will be subject to a true-up at the end of the year by taking our total distributable cash flow (as adjusted under our amended Partnership Agreement) less the total annual distribution payable to our unitholders, adjusted to target an approximate 1.0 times coverage ratio.
Please read the Distributions of Available Cash section in Note 14 of the Notes to Consolidated Financial Statements in Item 8. “Financial Statements and Supplementary Data” for more details about the distribution targets and their impact on the General Partner’s incentive distribution rights.
On January 23, 2018, we announced that the board of directors of DCP Midstream GP, LLC declared a quarterly distribution of $0.78 per unit, which was paid on February 14, 2018, to unitholders of record on February 7, 2018.
Preferred Unit Distributions - On November 20, 2017, we issued 500,000 of our Series A Preferred Units ("Series A Preferred Units"), representing limited partnership interests at a price of $1,000 per unit. We used the net proceeds of $487 million from the issuance of the Series A Preferred Units to partially repay the $500 million 2.50% Senior Notes which were due on December 1, 2017.
Distributions of the Series A Preferred Units are payable out of available cash, accrue and are cumulative from the date of original issuance of the Series A Preferred Units and are payable in arrears on June 15th and December 15th through and including December 15, 2022, and, after December 15, 2022, quarterly in arrears on March 15th, June 15th, September 15th, and December 15th of each year to holders of record as of the close of business on the first business day of the month. The initial distribution rate will be 7.375% per year of the $1,000 liquidation preference per unit (equal to $73.75 per unit). On and after December 15, 2022, distributions will accumulate at a percentage of the $1,000 liquidation preference equal to an annual floating rate of the three-month LIBOR plus a spread of 5.148%. The Series A Preferred Units rank senior to our common units with respect to distribution rights and rights upon liquidation.
At any time prior to December 15, 2022, within 120 days of a ratings event (as described in our Partnership Agreement), we may, at our option, redeem the Series A Preferred Units in whole, but not in part, at a redemption price per unit equal to $1,020 (102% of the liquidation preference), plus an amount equal to all accumulated and unpaid distributions. At any time on or after December 15, 2022, we may redeem, in whole or in part, the units at a redemption price of $1,000 per unit, plus an amount equal to all accumulated and unpaid distributions. Upon occurrence of a change in control triggering event (as described in our Partnership Agreement), we may, at our option, (i) redeem the Series A Preferred Units, in whole or in part, within 120 days, by paying $1,000 per unit, plus all accumulated and unpaid distributions, and (ii) each holder of Series A Preferred Units will have the right (unless the Partnership provided notice of its election to redeem such holder’s Series A
47
Preferred Units) to convert some or all of the Series A Preferred Units held by such holder on the change of control conversion date into a number of the Partnership’s common units per Series A Preferred Unit as defined in our Partnership Agreement. Holders of the Series A Preferred Units have no voting rights except for limited protective voting rights set forth in our Partnership Agreement.
Securities Authorized for Issuance Under Equity Compensation Plans
The information relating to our equity compensation plans required by Item 5 is incorporated by reference to such information as set forth in Item 12. “Security Ownership of Certain Beneficial Owners and Management and Related Unitholder Matters” contained herein.
Item 6. Selected Financial Data
The following table shows our selected financial data for the periods and as of the dates indicated, which is derived from our consolidated financial statements. The information contained herein should be read together with, and is qualified in its entirety by reference to, the consolidated financial statements and the accompanying notes included elsewhere in this Form 10-K.
Our operating results incorporate a number of significant estimates and uncertainties. Such matters could cause the data included herein to not be indicative of our future financial condition or results of operations. The table should also be read together with Item 7. “Management’s Discussion and Analysis of Financial Condition and Results of Operations.”
The following table shows our selected financial and operating data for the periods and as of the dates indicated, which is derived from our consolidated financial statements.
48
Year Ended December 31, | ||||||||||||||||||||
2017 | 2016 | 2015 | 2014 | 2013 | ||||||||||||||||
(millions, except per unit amounts) | ||||||||||||||||||||
Statements of Operations Data: | ||||||||||||||||||||
Sales of natural gas, NGLs and condensate | $ | 7,850 | $ | 6,269 | $ | 6,779 | $ | 13,420 | $ | 11,539 | ||||||||||
Transportation, processing and other | 652 | 647 | 532 | 517 | 463 | |||||||||||||||
Trading and marketing (losses) gains, net | (40 | ) | (23 | ) | 119 | 88 | 36 | |||||||||||||
Total operating revenues | 8,462 | 6,893 | 7,430 | 14,025 | 12,038 | |||||||||||||||
Operating costs and expenses: | ||||||||||||||||||||
Purchases and related costs | 6,885 | 5,461 | 5,981 | 11,828 | 9,967 | |||||||||||||||
Operating and maintenance expense | 661 | 670 | 732 | 773 | 691 | |||||||||||||||
Depreciation and amortization expense | 379 | 378 | 377 | 348 | 314 | |||||||||||||||
General and administrative expense | 290 | 292 | 281 | 277 | 280 | |||||||||||||||
Asset impairments | 48 | — | 912 | 18 | — | |||||||||||||||
Other expense (income), net | 11 | (65 | ) | 10 | 7 | — | ||||||||||||||
(Gain) loss on sale of assets, net | (34 | ) | (35 | ) | (42 | ) | 7 | (22 | ) | |||||||||||
Restructuring costs | — | 13 | 11 | — | — | |||||||||||||||
Total operating costs and expenses | 8,240 | 6,714 | 8,262 | 13,258 | 11,230 | |||||||||||||||
Operating income (loss) | 222 | 179 | (832 | ) | 767 | 808 | ||||||||||||||
Interest expense | (289 | ) | (321 | ) | (320 | ) | (287 | ) | (249 | ) | ||||||||||
Earnings from unconsolidated affiliates (a) | 303 | 282 | 184 | 82 | 35 | |||||||||||||||
Income (loss) before income taxes | 236 | 140 | (968 | ) | 562 | 594 | ||||||||||||||
Income tax (expense) benefit | (2 | ) | (46 | ) | 102 | (11 | ) | (10 | ) | |||||||||||
Net income (loss) | 234 | 94 | (866 | ) | 551 | 584 | ||||||||||||||
Net income attributable to noncontrolling interests | (5 | ) | (6 | ) | (5 | ) | (4 | ) | (5 | ) | ||||||||||
Net income (loss) attributable to partners | 229 | 88 | (871 | ) | 547 | 579 | ||||||||||||||
Net loss (income) attributable to predecessor operations (b) | — | 224 | 1,099 | (130 | ) | (404 | ) | |||||||||||||
General partner interest in net income | (164 | ) | (124 | ) | (124 | ) | (114 | ) | (70 | ) | ||||||||||
Series A preferred limited partners' interest in net income | (4 | ) | — | — | — | — | — | |||||||||||||
Net income allocable to limited partners | $ | 61 | $ | 188 | $ | 104 | $ | 303 | $ | 105 | ||||||||||
Net income per limited partner unit-basic and diluted | $ | 0.43 | $ | 1.64 | $ | 0.91 | $ | 2.84 | $ | 1.34 | ||||||||||
Year Ended December 31, | |||||||||||||||||||
2017 | 2016 | 2015 | 2014 | 2013 | |||||||||||||||
(millions, except per unit amounts) | |||||||||||||||||||
Balance Sheet Data (at period end): | |||||||||||||||||||
Property, plant and equipment, net | $ | 8,983 | $ | 9,069 | $ | 9,428 | $ | 9,537 | $ | 8,420 | |||||||||
Total assets | $ | 13,878 | $ | 13,611 | $ | 13,885 | $ | 13,628 | $ | 12,684 | |||||||||
Accounts payable | $ | 1,076 | $ | 735 | $ | 545 | $ | 977 | $ | 1,413 | |||||||||
Long-term debt | $ | 4,707 | $ | 4,907 | $ | 5,669 | $ | 5,191 | $ | 4,925 | |||||||||
Partners’ equity | $ | 7,408 | $ | 2,601 | $ | 2,772 | $ | 2,993 | $ | 1,945 | |||||||||
Predecessor equity | $ | — | $ | 4,220 | $ | 4,287 | $ | 2,189 | $ | 2,410 | |||||||||
Noncontrolling interests | $ | 30 | $ | 32 | $ | 33 | $ | 33 | $ | 34 | |||||||||
Total equity | $ | 7,438 | $ | 6,853 | $ | 7,092 | $ | 5,215 | $ | 4,389 | |||||||||
Other Information: | |||||||||||||||||||
Cash distributions declared per unit | $ | 3.1200 | $ | 3.1200 | $ | 3.1200 | $ | 3.0525 | $ | 2.8630 | |||||||||
Cash distributions paid per unit | $ | 3.1200 | $ | 3.1200 | $ | 3.1200 | $ | 3.0050 | $ | 2.8200 | |||||||||
(a) | Includes our proportionate share of the earnings of our unconsolidated affiliates. Earnings include the amortization of the net difference between the carrying amount of the investments and the underlying equity of the entities. |
49
(b) | Includes net (loss) income attributable to the DCP Midstream Business prior to the date of our acquisition from DCP Midstream, LLC. For additional details, please read Footnote 1 in Item 8. "Financial Statements" in this Annual Report on Form 10-K. |
Item 7. Management’s Discussion and Analysis of Financial Condition and Results of Operations
The following discussion analyzes our financial condition and results of operations. You should read the following discussion of our financial condition and results of operations in conjunction with our consolidated financial statements and notes included elsewhere in this Annual Report on Form 10-K.
Overview
We are a Delaware limited partnership formed by DCP Midstream, LLC to own, operate, acquire and develop a diversified portfolio of complementary midstream energy assets. Our operations are organized into two reportable segments: (i) Gathering and Processing and (ii) Logistics and Marketing. Our Gathering and Processing segment consists of gathering, compressing, treating, and processing natural gas, producing and fractionating NGLs, and recovering condensate. Our Logistics and Marketing segment includes transporting, trading, marketing and storing natural gas and NGLs, fractionating NGLs and wholesale propane logistics.
50
General Trends and Outlook
We anticipate our business will continue to be affected by the following key trends. Our expectations are based on assumptions made by us and information currently available to us. To the extent our underlying assumptions about or interpretations of available information prove to be incorrect, our actual results may vary materially from our expected results.
Our business is impacted by commodity prices and volumes. We mitigate a portion of commodity price risk on an overall Partnership basis by growing our fee based assets and by executing on our hedging program, in which we hedge commodity prices associated with a portion of our expected natural gas, NGL and condensate equity volumes in our Gathering and Processing segment. Various factors impact both commodity prices and volumes, and as indicated in Item 7A. "Quantitative and Qualitative Disclosures about Market Risk," we have sensitivities to certain cash and non-cash changes in commodity prices. Drilling activity levels vary by geographic area; we will continue to target our strategy in geographic areas where we expect producer drilling activity.
In the long-term, our belief is that commodity prices will be at levels we believe will support growth in natural gas, condensate and NGL production. We expect future commodity prices will be influenced by the severity of winter and summer weather, the level of North American production and drilling activity by exploration and production companies and the balance of trade between imports and exports of liquid natural gas, NGLs and crude oil.
NGL prices are impacted by the demand from petrochemical and refining industries and export facilities. The petrochemical industry has been making significant investment in building and expanding facilities to convert chemical plants from a heavier oil-based feedstock to lighter NGL-based feedstocks, including ethane. We believe this will cause increased demand in the next year, which should provide support for the increasing supply of ethane. As these facilities commence operations, ethane prices could remain weak with supply in excess of demand. In addition, export facilities are being expanded and built, which provide support for the increasing supply of NGLs. Although there can be, and has been, volatility in NGL prices, longer term we believe there will be sufficient demand in NGLs to support increasing supply.
We believe our contract structure with our producers provides us with significant protection from credit risk since we generally hold the product, sell it and withhold our fees prior to remittance of payments to the producer. Currently, our top 20 producers account for a majority of the total natural gas that we gather and process and of these top 20 producers, eight have investment grade credit ratings while the remainder do not.
In addition to the U.S. financial markets, many businesses and investors continue to monitor global economic conditions. Uncertainty abroad may contribute to volatility in domestic financial and commodity markets.
We believe we are positioned to withstand current and future commodity price volatility as a result of the following:
• | Our growing fee-based business represents a significant portion of our margins. |
• | We have positive operating cash flow from our well-positioned and diversified assets. |
• | We have a well-defined and targeted hedging program. |
• | We manage our disciplined capital growth program with a significant focus on fee-based agreements and projects with long term volume outlooks. |
• | We believe we have a solid capital structure and balance sheet. |
• | We believe we have access to sufficient capital to fund our growth. |
During 2018, our strategic objectives will continue to focus on maintaining stable Distributable Cash Flows from our existing assets and executing on opportunities to sustain and ultimately grow our long-term Distributable Cash Flows. We believe the key elements to stable Distributable Cash Flows are the diversity of our asset portfolio, our fee-based business which represents a significant portion of our estimated margins, plus our hedged commodity position, the objective of which is to protect against downside risk in our Distributable Cash Flows.
We have engaged in a disciplined growth strategy in recent years focusing on our key areas of operations. Our targeted strategy may take numerous forms such as organic build opportunities within our footprint, joint venture opportunities, and acquisitions. Growth opportunities will be evaluated in cooperation with producers and customers based on the expected level of drilling activity in these geographic regions and the impacts of higher costs of capital.
51
Some of our growth projects include the following:
• | Within our Gathering and Processing segment, we increased capacity in the DJ Basin by up to 40 MMcf/d starting in June 2017 by placing additional field compression and plant bypass infrastructure in service. |
• | We are constructing a 200 MMcf/d natural gas processing plant, the Mewbourn 3 plant, and further expanding our Grand Parkway gathering system, both of which are located in the DJ Basin and expected to be in service in the third quarter of 2018. |
• | Our 200 MMcf/d O'Connor 2 plant and associated gathering infrastructure, located in the DJ Basin, is also approved and expected to be in service in 2019. Engineering and permitting are underway, and we have begun purchasing equipment for the construction of the plant. |
• | Within our Logistics and Marketing segment, we have completed the expansion of the Sand Hills pipeline to 365 MBbls/d. |
• | Further Sand Hills pipeline expansion to 450 MBbls/d is progressing and includes a partial looping of the pipeline and the addition of new pump stations, and is expected to be in service in the second half of 2018. |
• | We executed definitive joint venture agreements on our 25% interest in the joint development of the Gulf Coast Express pipeline project, or the "GCX project". The approximately $1.75 billion GCX project is designed to transport up to 1.98 Bcf/d of natural gas. The gas takeaway pipeline is expected to be in service in 2019, pending regulatory approvals. |
• | We are jointly developing the Cheyenne Connector pipeline (“Cheyenne Connector”) with Tallgrass Energy Partners, LP (operator), and Western Gas Partners, LP and hold an option to invest in this project at a later date. Cheyenne Connector will provide gas takeaway for the DJ Basin, connecting to the Rockies Express Pipeline's Cheyenne Hub where it can then be delivered to numerous demand markets across the country. It will have an initial capacity of at least 600 MMcf/day and is expected to be in service in the second half of 2019, subject to certain conditions, including required approvals from the Federal Energy Regulatory Commission. |
We incur capital expenditures for our consolidated entities and our unconsolidated affiliates. Our 2018 plan includes maintenance capital expenditures of between $100 million and $120 million, and expansion capital expenditures between $650 million and $750 million associated with approved projects. Expansion capital expenditures include the construction of the Mewbourn 3 plant, Grand Parkway Phase 2 and O'Connor bypass in our DJ Basin system, and the capacity expansions of the Sand Hills pipeline, which are shown as an investment in unconsolidated affiliates in our consolidated statements of cash flows.
Our 2018 earnings from unconsolidated affiliates and distributions from unconsolidated affiliates from our investment in Discovery in our Gathering and Processing segment are forecasted to be lower than 2017 by approximately $60 million to $70 million. Approximately $30 million to $40 million of this decrease is associated with significant volume declines from two offshore wells and an additional $30 million is associated with a contractual dispute with certain producers regarding demand charges, which is being challenged by Discovery.
Recent Events
On November 20, 2017, we issued 500,000 of our Series A Preferred Units representing limited partnership interests at a price of $1,000 per unit. We used the net proceeds of $487 million from the issuance of the Series A Preferred Units to partially repay the $500 million 2.50% Senior Notes which were due on December 1, 2017.
We announced a quarterly distribution of $0.78 per unit for the fourth quarter of 2017. This distribution per common unit remains unchanged from the previous quarter and the fourth quarter of 2016.
On February 14, 2018, the Partnership distributed $40 million of IDR givebacks to our owners, in conjunction with the quarterly distribution, that were previously withheld under the amended Partnership agreement.
52
Factors That May Significantly Affect Our Results
Gathering and Processing Segment
Our results of operations for our Gathering and Processing segment are impacted by (1) the prices of and relationship between commodities such as NGLs, crude oil and natural gas, (2) increases and decreases in the wellhead volume and quality of natural gas that we gather, (3) the associated Btu content of our system throughput and our related processing volumes, (4) the operating efficiency and reliability of our processing facilities, (5) potential limitations on throughput volumes arising from downstream and infrastructure capacity constraints, and (6) the terms of our processing contract arrangements with producers. This is not a complete list of factors that may impact our results of operations but, rather, are those we believe are most likely to impact those results.
Volume and operating efficiency generally are driven by wellhead production, plant recoveries, operating availability of our facilities, physical integrity and our competitive position on a regional basis, and more broadly by demand for natural gas, NGLs and condensate. Historical and current trends in the price changes of commodities may not be indicative of future trends. Volume and prices are also driven by demand and take-away capacity for residue natural gas and NGLs.
Our processing contract arrangements can have a significant impact on our profitability and cash flow. Our actual contract terms are based upon a variety of factors, including the commodity pricing environment at the time the contract is executed, natural gas quality, geographic location, customer requirements and competition from other midstream service providers. Our gathering and processing contract mix and, accordingly, our exposure to natural gas, NGL and condensate prices, may change as a result of producer preferences, impacting our expansion in regions where certain types of contracts are more common as well as other market factors. We generate our revenues and our gross margin for our Gathering and Processing segment principally from contracts that contain a combination of fee based arrangements and percent-of-proceeds/liquids arrangements.
Our Gathering and Processing segment operating results are impacted by market conditions causing variability in natural gas, crude oil and NGL prices. The midstream natural gas industry is cyclical, with the operating results of companies in the industry significantly affected by drilling activity, which may be impacted by prevailing commodity prices. The number of active oil and gas drilling rigs in the United States has increased, from 563 on December 31, 2016 to 882 on December 31, 2017 (Source: IHS). Although the prevailing price of residue natural gas has less short-term significance to our operating results than the price of NGLs, in the long-term, the growth and sustainability of our business depends on commodity prices being at levels sufficient to provide incentives and capital for producers to explore for and produce natural gas.
The prices of NGLs, crude oil and natural gas can be extremely volatile for periods of time, and may not always have a close relationship. Due to our hedging program, changes in the relationship of the price of NGLs and crude oil may cause our commodity price exposure to vary, which we have attempted to capture in our commodity price sensitivities in Item 7A in this 2017 Form 10-K, “Quantitative and Qualitative Disclosures about Market Risk.” Our results may also be impacted as a result of non-cash lower of cost or market inventory or imbalance adjustments, which occur when the market value of commodities decline below our carrying value.
We face strong competition in acquiring raw natural gas supplies. Our competitors in obtaining additional gas supplies and in gathering and processing raw natural gas includes major integrated oil and gas companies, interstate and intrastate pipelines, and companies that gather, compress, treat, process, transport, store and/or market natural gas. Competition is often the greatest in geographic areas experiencing robust drilling by producers and during periods of high commodity prices for crude oil, natural gas and/or NGLs. Competition is also increased in those geographic areas where our commercial contracts with our customers are shorter term and therefore must be renegotiated on a more frequent basis.
Logistics and Marketing Segment
Our Logistics and Marketing segment operating results are impacted by, among other things, the throughput volumes of the NGLs we transport on our NGL pipelines and the volumes of NGLs we fractionate and store. We transport, fractionate and store NGLs primarily on a fee basis. Throughput may be negatively impacted as a result of our customers operating their processing plants in ethane rejection mode, often as a result of low ethane prices relative to natural gas prices. Factors that impact the supply and demand of NGLs, as described above in our Gathering and Processing segment, may also impact the throughput and volume for our Logistics and Marketing segment.
53
These contractual arrangements may require our customers to commit a minimum level of volumes to our pipelines and facilities, thereby mitigating our exposure to volume risk. However, the results of operations for this business segment are generally dependent upon the volume of product transported, fractionated or stored and the level of fees charged to customers. We do not take title to the products transported on our NGL pipelines, fractionated in our fractionation facilities or stored in our storage facility; rather, the customer retains title and the associated commodity price risk. The volumes of NGLs transported on our pipelines are dependent on the level of production of NGLs from processing plants connected to our NGL pipelines. When natural gas prices are high relative to NGL prices, it is less profitable to process natural gas because of the higher value of natural gas compared to the value of NGLs and because of the increased cost of separating the NGLs from the natural gas. As a result, we have experienced periods in the past, in which higher natural gas or lower NGL prices reduce the volume of NGLs extracted at plants connected to our NGL pipelines and, in turn, lower the NGL throughput on our assets.
Our results of operations for our Logistics and Marketing segment are also impacted by increases and decreases in the volume, price and basis differentials of natural gas associated with our natural gas storage and pipeline assets, as well as our underlying derivatives associated with these assets. We manage commodity price risk related to our natural gas storage and pipeline assets through our commodity derivative program. The commercial activities related to our natural gas storage and pipeline assets primarily consist of the purchase and sale of gas and associated time spreads and basis spreads. A time spread transaction is executed by establishing a long gas position at one point in time and establishing an equal short gas position at a different point in time. Time spread transactions allow us to lock in a margin supported by the injection, withdrawal, and storage capacity of our natural gas storage assets. We may execute basis spread transactions to mitigate the risk of sale and purchase price differentials across our system. A basis spread transaction allows us to lock in a margin on our physical purchases and sales of gas, including injections and withdrawals from storage.
We manage our wholesale propane margins by selling propane to propane distributors under annual sales agreements negotiated each spring which specify floating price terms that provide us a margin in excess of our floating index-based supply costs under our supply purchase arrangements. Our portfolio of multiple supply sources and storage capabilities allows us to actively manage our propane supply purchases and to lower the aggregate cost of supplies. Based on the carrying value of our inventory, timing of inventory transactions and the volatility of the market value of propane, we have historically and may continue to periodically recognize non-cash lower of cost or market inventory adjustments. In addition, we may use financial derivatives to manage the value of our propane inventories.
Weather
The economic impact of severe weather may negatively affect the nation’s short-term energy supply and demand, and may result in commodity price volatility. Additionally, severe weather may restrict or prevent us from fully utilizing our assets, by damaging our assets, interrupting utilities, and through possible NGL and natural gas curtailments downstream of our facilities, which restricts our production. These impacts may linger past the time of the actual weather event. Although we carry insurance on the vast majority of our assets, insurance may be inadequate to cover our loss in some instances, and in certain circumstances we have been unable to obtain insurance on commercially reasonable terms, if at all.
Capital Markets
Volatility in the capital markets may impact our business in multiple ways, including limiting our producers’ ability to finance their drilling programs and operations and limiting our ability to support or fund our operations and growth. These events may impact our counterparties’ ability to perform under their credit or commercial obligations. Where possible, we have obtained additional collateral agreements, letters of credit from highly rated banks, or have managed credit lines to mitigate a portion of these risks.
Impact of Inflation
Inflation has been relatively low in the United States in recent years. However, the inflation rates impacting our business fluctuate throughout the broad economic and energy business cycles. Consequently, our costs for chemicals, utilities, materials and supplies, labor and major equipment purchases may increase during periods of general business inflation or periods of relatively high energy commodity prices.
54
Other
The above factors, including sustained deterioration in commodity prices and volumes, other market declines or a decline in our common unit price, may negatively impact our results of operations, and may increase the likelihood of a non-cash impairment charge or non-cash lower of cost or market inventory adjustments.
How We Evaluate Our Operations
Our management uses a variety of financial and operational measurements to analyze our performance. These measurements include the following: (1) volumes; (2) gross margin and segment gross margin; (3) operating and maintenance expense, and general and administrative expense; (4) adjusted EBITDA; (5) adjusted segment EBITDA; and (6) Distributable Cash Flow. Gross margin, segment gross margin, adjusted EBITDA, adjusted segment EBITDA, and Distributable Cash Flow are not measures under accounting principles generally accepted in the United States of America, or GAAP. To the extent permitted, we present certain non-GAAP measures and reconciliations of those measures to their most directly comparable financial measures as calculated and presented in accordance with GAAP. These non-GAAP measures may not be comparable to a similarly titled measure of another company because other entities may not calculate these non-GAAP measures in the same manner.
Volumes - We view wellhead, throughput and storage volumes as important factors affecting our profitability. We gather and transport some of the natural gas and NGLs under fee-based transportation contracts. Revenue from these contracts is derived by applying the rates stipulated to the volumes transported. Pipeline throughput volumes from existing wells connected to our pipelines will naturally decline over time as wells deplete. Accordingly, to maintain or to increase throughput levels on these pipelines and the utilization rate of our natural gas processing plants, we must continually obtain new supplies of natural gas and NGLs. Our ability to maintain existing supplies of natural gas and NGLs and obtain new supplies are impacted by: (1) the level of workovers or recompletions of existing connected wells and successful drilling activity in areas currently dedicated to our pipelines; and (2) our ability to compete for volumes from successful new wells in other areas. The throughput volumes of NGLs and gas on our pipelines are substantially dependent upon the quantities of NGLs and gas produced at our processing plants, as well as NGLs and gas produced at other processing plants that have pipeline connections with our NGL and gas pipelines. We regularly monitor producer activity in the areas we serve and in which our pipelines are located, and pursue opportunities to connect new supply to these pipelines. We also monitor our inventory in our NGL and gas storage facilities, as well as overall demand for storage based on seasonal patterns and other market factors such as weather and overall demand.
55
Results of Operations
Consolidated Overview
The following table and discussion is a summary of our consolidated results of operations for the years ended December 31, 2017, 2016 and 2015. The results of operations by segment are discussed in further detail following this consolidated overview discussion.
Year Ended December 31, | Variance 2017 vs. 2016 | Variance 2016 vs. 2015 | |||||||||||||||||||||||||
2017 | 2016 | 2015 | Increase (Decrease) | Percent | Increase (Decrease) | Percent | |||||||||||||||||||||
(millions, except operating data) | |||||||||||||||||||||||||||
Operating revenues (a): | |||||||||||||||||||||||||||
Gathering and Processing | $ | 5,467 | $ | 4,490 | $ | 4,910 | $ | 977 | 22 | % | $ | (420 | ) | (9 | )% | ||||||||||||
Logistics and Marketing | 7,757 | 6,186 | 6,487 | 1,571 | 25 | % | (301 | ) | (5 | )% | |||||||||||||||||
Inter-segment eliminations | (4,762 | ) | (3,783 | ) | (3,967 | ) | (979 | ) | (26 | )% | 184 | 5 | % | ||||||||||||||
Total operating revenues | 8,462 | 6,893 | 7,430 | 1,569 | 23 | % | (537 | ) | (7 | )% | |||||||||||||||||
Purchases and related costs | |||||||||||||||||||||||||||
Gathering and Processing | (4,090 | ) | (3,263 | ) | (3,697 | ) | 827 | 25 | % | (434 | ) | (12 | )% | ||||||||||||||
Logistics and Marketing | (7,557 | ) | (5,981 | ) | (6,251 | ) | 1,576 | 26 | % | (270 | ) | (4 | )% | ||||||||||||||
Inter-segment eliminations | 4,762 | 3,783 | 3,967 | (979 | ) | (26 | )% | 184 | 5 | % | |||||||||||||||||
Total purchases | (6,885 | ) | (5,461 | ) | (5,981 | ) | 1,424 | 26 | % | (520 | ) | (9 | )% | ||||||||||||||
Operating and maintenance expense | (661 | ) | (670 | ) | (732 | ) | (9 | ) | (1 | )% | (62 | ) | (8 | )% | |||||||||||||
Depreciation and amortization expense | (379 | ) | (378 | ) | (377 | ) | 1 | — | % | 1 | — | % | |||||||||||||||
General and administrative expense | (290 | ) | (292 | ) | (281 | ) | (2 | ) | (1 | )% | 11 | 4 | % | ||||||||||||||
Asset impairments | (48 | ) | — | (912 | ) | 48 | * | (912 | ) | * | |||||||||||||||||
Other (expense) income, net | (11 | ) | 65 | (10 | ) | (76 | ) | * | 75 | * | |||||||||||||||||
Gain on sale of assets, net | 34 | 35 | 42 | (1 | ) | (3 | )% | (7 | ) | (17 | )% | ||||||||||||||||
Restructuring costs | — | (13 | ) | (11 | ) | (13 | ) | * | 2 | 18 | % | ||||||||||||||||
Earnings from unconsolidated affiliates (b) | 303 | 282 | 184 | 21 | 7 | % | 98 | 53 | % | ||||||||||||||||||
Interest expense | (289 | ) | (321 | ) | (320 | ) | (32 | ) | (10 | )% | 1 | — | % | ||||||||||||||
Income tax (expense) benefit | (2 | ) | (46 | ) | 102 | (44 | ) | (96 | )% | (148 | ) | * | |||||||||||||||
Net income attributable to noncontrolling interests | (5 | ) | (6 | ) | (5 | ) | (1 | ) | (17 | )% | 1 | 20 | % | ||||||||||||||
Net income (loss) attributable to partners | $ | 229 | $ | 88 | $ | (871 | ) | $ | 141 | * | $ | 959 | * | ||||||||||||||
Other data: | |||||||||||||||||||||||||||
Gross margin (c): | |||||||||||||||||||||||||||
Gathering and Processing | $ | 1,377 | $ | 1,227 | $ | 1,213 | $ | 150 | 12 | % | $ | 14 | 1 | % | |||||||||||||
Logistics and Marketing | 200 | 205 | 236 | (5 | ) | (2 | )% | (31 | ) | (13 | )% | ||||||||||||||||
Total gross margin | $ | 1,577 | $ | 1,432 | $ | 1,449 | $ | 145 | 10 | % | $ | (17 | ) | (1 | )% | ||||||||||||
Non-cash commodity derivative mark-to-market | $ | (28 | ) | $ | (139 | ) | $ | 46 | $ | 111 | * | $ | (185 | ) | * | ||||||||||||
Natural gas wellhead (MMcf/d) (d) | 4,531 | 5,124 | 5,604 | (593 | ) | (12 | )% | (480 | ) | (9 | )% | ||||||||||||||||
NGL gross production (MBbls/d) (d) | 375 | 393 | 408 | (18 | ) | (5 | )% | (15 | ) | (4 | )% | ||||||||||||||||
NGL pipelines throughput (MBbls/d) (d) | 460 | 420 | 298 | 40 | 10 | % | 122 | 41 | % | ||||||||||||||||||
* Percentage change is not meaningful.
56
(a) | Operating revenues include the impact of trading and marketing gains (losses), net. |
(b) | Earnings for Discovery, Sand Hills, Southern Hills, Front Range, Mont Belvieu 1 and Texas Express include the amortization of the net difference between the carrying amount of the investments and the underlying equity of the entities. |
(c) | Gross margin consists of total operating revenues less purchases and related costs. Segment gross margin for each segment consists of total operating revenues for that segment less purchases and related costs for that segment. Please read “Reconciliation of Non-GAAP Measures”. |
(d) | For entities not wholly-owned by us, includes our share, based on our ownership percentage, of the wellhead and throughput volumes and NGL production. |
Year ended December 31, 2017 vs. Year ended December 31, 2016
Total Operating Revenues — Total operating revenues increased $1,569 million in 2017 compared to 2016 primarily as a result of the following:
• | $1,571 million increase for our Logistics and Marketing segment primarily due to increased commodity prices and favorable commodity derivative activity, partially offset by lower gas and NGL sales volumes and the sale of our Northern Louisiana System; |
• | $977 million increase for our Gathering and Processing segment primarily due to higher commodity prices, higher gas and NGL sales volumes primarily related to our North region which impacts both sales and purchases, and higher transportation, processing and other, primarily related to fee based contract realignment efforts. These increases were partially offset by lower gas and NGL sales volumes in the South, Midcontinent and Permian regions, unfavorable commodity derivative activity and the sale of our Northern Louisiana system and Douglas gathering system; |
These increases were partially offset by:
• | $979 million increase in inter-segment eliminations, which relate to sales of gas and NGL volumes from our Gathering and Processing segment to our Logistics and Marketing segment, primarily due to higher commodity prices, partially offset by lower gas and NGL sales volumes. |
Total Purchases — Total purchases increased $1,424 million in 2017 compared to 2016 primarily as a result of the following:
• | $1,576 million increase for our Logistics and Marketing segment for the reasons discussed above; |
• | $827 million increase for our Gathering and Processing segment for the reasons discussed above; |
These increases were partially offset by:
• | $979 million increase in inter-segment eliminations, which relate to sales of gas and NGL volumes from our Gathering and Processing segment to our Logistics and Marketing segment, primarily due to higher commodity prices, partially offset by lower gas and NGL sales volumes. |
Operating and Maintenance Expense — Operating and maintenance expense decreased in 2017 compared to 2016 primarily as a result of the sale of our Northern Louisiana system in July 2016 and Douglas gathering system in June 2017, decreased base operating costs resulting from cost savings initiatives, partially offset by increased gathering pipeline remediation spending, planned maintenance spending associated with anticipated volume growth and additional expenses related to Hurricane Harvey.
General and Administrative Expense - General and administrative expense increased in 2017 compared to 2016, primarily due to investment in digital transformation, offset by nonrecurring costs in 2016 driven by the closing of the Transaction as described in Item 8. "Financial Statements."
Asset impairments — Asset impairments in 2017 represent the impairment of property, plant and equipment and intangible assets in our South region.
Other (Expense) Income — Other expense in 2017 primarily represents the write-off of property, plant and equipment associated with the expiration of a lease. Other income in 2016 primarily represents a producer settlement, net of legal fees, partially offset by the write-off of property, plant and equipment and other long-term assets.
57
Gain on Sale of Assets, net — The gain on sale in 2017 represents the sale of our Douglas gathering system. The gain on sale in 2016 represents the sale of our Northern Louisiana system, partially offset by a loss on sale of non-core assets.
Restructuring Costs - Restructuring costs in 2016 related to our headcount reduction in April of 2016.
Earnings from Unconsolidated Affiliates — Earnings from unconsolidated affiliates increased in 2017 compared to 2016 primarily as a result of the expansion and volume ramp up of the Sand Hills NGL pipeline in our Logistics and Marketing segment partially offset by a decrease from Discovery in our Gathering and Processing segment primarily due to lower production volumes from two offshore wells at Discovery. We expect continued volume declines from these wells to impact future earnings.
Interest Expense - Interest expense decreased in 2017 compared to 2016 as a result of lower average outstanding debt balances.
Income Tax (Expense) Benefit — Income tax expense decreased in 2017 compared to 2016 primarily due to the conversion of a subsidiary from a corporation to a limited liability company for federal income tax purposes in 2016.
Net Income Attributable to Partners — Net income attributable to partners increased in 2017 compared to 2016 for the reasons discussed above.
Gross Margin — Gross margin increased $145 million in 2017 compared to 2016 primarily as a result of the following:
• | $150 million increase for our Gathering and Processing segment primarily related to higher commodity prices, increased volume from growth projects, higher margins associated with a specific producer arrangement, higher NGL recoveries and a producer settlement in our North region, and contract realignment efforts in our Permian and Midcontinent regions. These increases were partially offset by lower volumes across our South, Midcontinent, and Permian regions due to reduced drilling activity in prior periods, the impact of Hurricane Harvey primarily in the South and Permian regions, the sale of our Northern Louisiana system, the sale of our Douglas gathering system and unfavorable commodity derivative activity. |
These increases were partially offset by:
• | $5 million decrease for our Logistics and Marketing segment primarily related to lower margins on wholesale propane and the expiration of a contract, the sale of our Northern Louisiana system, lower gas storage margins and lower transportation volumes on certain of our NGL pipelines, partially offset by higher NGL marketing margins, higher gas marketing margins and favorable commodity derivative activity. |
Year ended December 31, 2016 vs. Year ended December 31, 2015
Total Operating Revenues — Total operating revenues decreased $537 million in 2016 compared to 2015 primarily as a result of the following:
• | $420 million decrease for our Gathering and Processing segment primarily due to lower commodity prices, lower gas and NGL volumes in the South, Midcontinent and Permian regions which impacted both sales and purchases, and unfavorable commodity derivative activity, which was partially offset by higher gas and NGL volumes in our North region and fee based contract realignment efforts; and improved operational efficiencies in the Permian and Midcontinent regions; and |
• | $301 million decrease for our Logistics and Marketing segment primarily due to lower commodity prices, lower gas and NGL sales volumes, unfavorable commodity derivative activity and lower wholesale propane fees partially offset by new connections on certain of our NGL pipelines. |
These decreases were partially offset by:
• | $184 million decrease in inter-segment eliminations, which related to sales of gas and NGL volumes from our Gathering and Processing segment to our Logistics and Marketing segment, primarily due to lower commodity prices and lower gas and NGL sales volumes. |
Total Purchases — Total purchases decreased $520 million in 2016 compared to 2015 primarily as a result of the following:
• | $434 million decrease for our Gathering and Processing segment for the reasons discussed above; and |
58
• | $270 million decrease for our Logistics and Marketing segment for the reasons discussed above. |
These decreases were partially offset by:
• | $184 million decrease in inter-segment eliminations, which related to sales of gas and NGL volumes from our Gathering and Processing segment to our Logistics and Marketing segment, primarily due to lower commodity prices and lower gas and NGL sales volumes. |
Operating and Maintenance Expense — Operating and maintenance expense decreased in 2016 compared to 2015 primarily as a result of our headcount reduction in April 2016, plant consolidations and other cost savings initiatives, the disposition of our Northern Louisiana system in July 2016, the sale of certain gas processing plants and gathering systems in the Permian region in 2015, partially offset by the completion of our Lucerne 2 plant in the DJ Basin system in July 2015 and the completion of our Zia II plant in the Southeast New Mexico system in August 2015.
General and Administrative Expense — General and administrative expense increased in 2016, compared to 2015, primarily due to nonrecurring costs driven by the closing of the Transaction as described in Item 8. "Financial Statements," partially offset by our headcount reduction in April 2016 and other cost savings initiatives.
Asset Impairments - Asset impairments in 2015 represented impairments of goodwill, property, plant and equipment and intangible assets.
Other Income (Expense), net — Other income, net in 2016 represented a producer settlement net of legal fees, partially offset by charges for discontinued construction projects. Other expense, net in 2015 primarily represented charges for discontinued construction projects.
Earnings from Unconsolidated Affiliates — Earnings from unconsolidated affiliates increased in 2016 compared to 2015, primarily as a result of Enbridge’s contribution of its interests in Sand Hills and Southern Hills in November 2015, higher pipeline throughput volumes on Southern Hills, Sand Hills and Front Range due to growth in NGL production from new plants placed into service in 2015 and as a result of the ramp-up of the Keathley Canyon volumes at Discovery.
Income Tax (Expense) Benefit — Income tax benefit decreased in 2016 compared to 2015 primarily due to impairments of property, plant and equipment and intangible assets recorded in the fourth quarter of 2015.
Gain (loss) on Sale of Assets, Net — Gain on sale of assets during 2016 primarily related to the sale of our Northern Louisiana system. During 2015, we recognized gains related to the sale of certain gas processing plants and gathering systems.
Net Income Attributable to Partners — Net income attributable to partners increased in 2016 compared to 2015 for the reasons discussed above.
Gross Margin — Gross margin decreased $17 million in 2016 compared to 2015 primarily as a result of the following:
• | $31 million decrease for our Logistics and Marketing segment primarily related to unfavorable commodity derivative activity, the sale of our Northern Louisiana system in July 2016 and lower wholesale propane fees, partially offset by new connections on certain of our NGL pipelines. |
These decreases were partially offset by:
• | $14 million increase for our Gathering and Processing segment primarily due to the ramp-up of the Lucerne 2 plant in June 2015, completion of the Grand Parkway gathering system in January 2016, higher margins on a specific producer arrangement, higher NGL recoveries in our North region, completion of the Zia II plant in August 2015 in our Permian region, ramp-up of the National Helium plant in September 2015 in our Midcontinent region, fee based contract realignment efforts and improved operational efficiencies in our Permian and Midcontinent regions, partially offset by lower commodity prices, lower volumes across our South, Midcontinent and Permian regions due to reduced drilling activity in prior periods, unfavorable derivative activity and the sale of our Northern Louisiana system. |
59
Supplemental Information on Unconsolidated Affiliates
The following table presents financial information related to unconsolidated affiliates:
Earnings from investments in unconsolidated affiliates were as follows:
Year Ended December 31, | |||||||||||
2017 | 2016 | 2015 | |||||||||
(Millions) | |||||||||||
DCP Sand Hills Pipeline, LLC | $ | 148 | $ | 110 | $ | 63 | |||||
Discovery Producer Services LLC | 61 | 73 | 54 | ||||||||
DCP Southern Hills Pipeline, LLC | 47 | 44 | 18 | ||||||||
Front Range Pipeline LLC | 17 | 19 | 17 | ||||||||
Texas Express Pipeline LLC | 9 | 9 | 8 | ||||||||
Mont Belvieu Enterprise Fractionator | 13 | 16 | 15 | ||||||||
Mont Belvieu 1 Fractionator | 6 | 9 | 9 | ||||||||
Other | 2 | 2 | — | ||||||||
Total earnings from unconsolidated affiliates | $ | 303 | $ | 282 | $ | 184 | |||||
Distributions received from unconsolidated affiliates were as follows:
Year Ended December 31, | |||||||||||
2017 | 2016 | 2015 | |||||||||
(Millions) | |||||||||||
DCP Sand Hills Pipeline, LLC | $ | 169 | $ | 139 | $ | 71 | |||||
Discovery Producer Services LLC | 85 | 94 | 69 | ||||||||
DCP Southern Hills Pipeline, LLC | 62 | 56 | 24 | ||||||||
Front Range Pipeline LLC | 17 | 24 | 17 | ||||||||
Texas Express Pipeline LLC | 12 | 11 | 11 | ||||||||
Mont Belvieu Enterprise Fractionator | 13 | 18 | 13 | ||||||||
Mont Belvieu 1 Fractionator | 6 | 11 | 12 | ||||||||
Other | 3 | 3 | — | ||||||||
Total distributions from unconsolidated affiliates | $ | 367 | $ | 356 | $ | 217 | |||||
60
Results of Operations — Gathering and Processing Segment
The results of operations for our Gathering and Processing segment are as follows:
_____________
Year Ended December 31, | Variance 2017 vs. 2016 | Variance 2016 vs. 2015 | |||||||||||||||||||||||||
2017 | 2016 | 2015 | Increase (Decrease) | Percent | Increase (Decrease) | Percent | |||||||||||||||||||||
(millions, except operating data) | |||||||||||||||||||||||||||
Operating revenues: | |||||||||||||||||||||||||||
Sales of natural gas, NGLs and condensate | $ | 4,943 | $ | 3,955 | $ | 4,377 | $ | 988 | 25 | % | $ | (422 | ) | (10 | )% | ||||||||||||
Transportation, processing and other | 590 | 580 | 465 | 10 | 2 | % | 115 | 25 | % | ||||||||||||||||||
Trading and marketing (losses) gains, net | (66 | ) | (45 | ) | 68 | (21 | ) | * | (113 | ) | * | ||||||||||||||||
Total operating revenues | 5,467 | 4,490 | 4,910 | 977 | 22 | % | (420 | ) | (9 | )% | |||||||||||||||||
Purchases and related costs | (4,090 | ) | (3,263 | ) | (3,697 | ) | 827 | 25 | % | (434 | ) | (12 | )% | ||||||||||||||
Operating and maintenance expense | (602 | ) | (611 | ) | (668 | ) | (9 | ) | (1 | )% | (57 | ) | (9 | )% | |||||||||||||
Depreciation and amortization expense | (343 | ) | (344 | ) | (343 | ) | (1 | ) | — | % | 1 | — | % | ||||||||||||||
General and administrative expense | (19 | ) | (14 | ) | (22 | ) | 5 | 36 | % | (8 | ) | (36 | )% | ||||||||||||||
Asset impairments | (48 | ) | — | (876 | ) | (48 | ) | * | (876 | ) | * | ||||||||||||||||
Other income (expense), net | — | 73 | (1 | ) | (73 | ) | * | 74 | * | ||||||||||||||||||
Gain on sale of assets, net | 34 | 19 | 42 | 15 | 79 | % | (23 | ) | (55 | )% | |||||||||||||||||
Earnings from unconsolidated affiliates (a) | 60 | 73 | 54 | (13 | ) | (18 | )% | 19 | 35 | % | |||||||||||||||||
Segment net income (loss) | 459 | 423 | (601 | ) | 36 | 9 | % | 1,024 | * | ||||||||||||||||||
Segment net income attributable to noncontrolling interests | (5 | ) | (6 | ) | (5 | ) | (1 | ) | (17 | )% | 1 | 20 | % | ||||||||||||||
Segment net income (loss) attributable to partners | $ | 454 | $ | 417 | $ | (606 | ) | $ | 37 | 9 | % | $ | 1,023 | * | |||||||||||||
Other data: | |||||||||||||||||||||||||||
Segment gross margin (b) | $ | 1,377 | $ | 1,227 | $ | 1,213 | $ | 150 | 12 | % | $ | 14 | 1 | % | |||||||||||||
Non-cash commodity derivative mark-to-market | $ | (24 | ) | $ | (119 | ) | $ | 47 | $ | 95 | (80 | )% | $ | (166 | ) | * | |||||||||||
Natural gas wellhead (MMcf/d) (c) | 4,531 | 5,124 | 5,604 | (593 | ) | (12 | )% | (480 | ) | (9 | )% | ||||||||||||||||
NGL gross production (MBbls/d) (c) | 375 | 393 | 408 | (18 | ) | (5 | )% | (15 | ) | (4 | )% | ||||||||||||||||
* Percentage change is not meaningful.
(a) | Earnings from unconsolidated affiliates includes our 40% ownership of Discovery. Earnings for Discovery include the amortization of the net difference between the carrying amount of our investment and the underlying equity of the entity. |
(b) | Segment gross margin consists of total operating revenues, less purchases and related costs. Please read “Reconciliation of Non-GAAP Measures”. |
(c) | For entities not wholly-owned by us, includes our share, based on our ownership percentage, of the wellhead volume and NGL production. |
61
Year Ended December 31, 2017 vs. Year Ended December 31, 2016
Total Operating Revenues — Total operating revenues increased $977 million in 2017 compared to 2016, primarily as a result of the following:
• | $1,280 million increase attributable to higher commodity prices, which impacted both sales and purchases, before the impact of derivative activity; |
• | $100 million increase attributable to higher gas and NGL sales volumes due to the impact of a specific producer arrangement and growth projects primarily related to our DJ Basin system in our North region; |
• | $10 million increase in transportation, processing and other primarily related to fee based contract realignment efforts, partially offset by lower volumes in the South region and the sale of our Northern Louisiana system and Douglas gathering system; |
These increases were partially offset by:
• | $392 million decrease primarily as a result of lower volumes across our South, Midcontinent and Permian regions due to reduced drilling activity in prior periods and the impact of Hurricane Harvey primarily related to the South and Permian regions; and |
• | $21 million decrease as a result of commodity derivative activity attributable to a $116 million increase in realized cash settlement losses, partially offset by a decrease in unrealized commodity derivative losses of $95 million due to movements in forward prices of commodities in 2017. |
Purchases and Related Costs — Purchases and related costs increased $827 million in 2017 compared to 2016 as a result of higher commodity prices and higher gas and NGL sales volumes in our North region, partially offset by decreased volumes in our South, Midcontinent and Permian regions.
Operating and Maintenance Expense — Operating and maintenance expense decreased in 2017 compared to 2016 primarily as a result of the sale of our Northern Louisiana system in July 2016 and Douglas gathering system in June 2017, decreased base operating costs resulting from cost savings initiatives, partially offset by increased gathering pipeline remediation spending, planned maintenance spending associated with anticipated volume growth and additional expenses related to Hurricane Harvey.
General and Administrative Expense — General and administrative expense increased in 2017 compared to 2016 primarily as a result higher sales tax refunds in 2016 from cost savings initiatives.
Asset impairments — Asset impairments in 2017 represent the impairment of property, plant and equipment and intangible assets in our South region.
Other Income (Expense) — Other income in 2016 represents a producer settlement, net of legal fees partially offset by the write-off of property, plant and equipment.
Gain on sale of assets, net - The gain on sale in 2017 represents the sale of our Douglas gathering system. The gain on sale in 2016 represents the sale of our Northern Louisiana system partially offset by a loss on sale of non-core assets.
Earnings from Unconsolidated Affiliates — Earnings from unconsolidated affiliates decreased in 2017 compared to 2016 primarily due to lower production volumes from two offshore wells at Discovery. We expect continued volume declines from these wells to impact future earnings.
Segment Gross Margin — Segment gross margin increased $150 million in 2017 compared to 2016, primarily as a result of the following:
• | $231 million increase as a result of higher commodity prices; |
• | $35 million increase as a result of increased volume from growth projects, higher margins associated with a specific producer arrangement, and higher NGL recoveries primarily related to our DJ Basin system and a producer settlement in our North region; |
These increases were partially offset by:
• | $79 million decrease primarily as a result of lower volumes across our South, Midcontinent and Permian regions due to reduced drilling activity in prior periods and the impact of Hurricane Harvey, partially offset by fee based |
62
contract realignment efforts in the Permian and Midcontinent regions and operational efficiencies associated with our investment in digital transformation;
• | $16 million decrease as a result of the sale of our Northern Louisiana system in our South region and Douglas gathering system in our North region; and |
• | $21 million decrease as a result of commodity derivative activity as discussed above. |
Total Wellhead — Natural gas wellhead decreased in 2017 compared to 2016 reflecting lower volumes primarily from (i) lower volumes associated with general declines within the South, Permian and Midcontinent regions (ii) the sale of our Northern Louisiana system within our South region and (iii) the sale of our Douglas gathering system within our North region and (iv) the impact of Hurricane Harvey primarily related to the South and Permian regions, partially offset by (v) general volume increases due to maximizing capacity utilization and growth projects within the North region.
NGL Gross Production — NGL production decreased in 2017 compared to 2016 primarily as a result of (i) lower volumes associated with general declines within the South, Permian and Midcontinent regions, (ii) the sale of our Northern Louisiana system within our South region and (iii) the sale of our Douglas gathering system within our North region and (iv) the impact of Hurricane Harvey primarily related to the South and Permian regions, partially offset by (v) general volume increases due to maximizing capacity utilization within the North region and (vi) intermittent higher ethane recoveries across all regions.
Year Ended December 31, 2016 vs. Year Ended December 31, 2015
Total Operating Revenues — Total operating revenues decreased $420 million in 2016 compared to 2015, primarily as a result of the following:
• | $163 million decrease attributable to lower commodity prices, which impacted both sales and purchases, before the impact of derivative activity; |
• | $444 million decrease attributable to lower volumes across our South, Midcontinent and Permian regions due to reduced drilling activity in prior periods, partially offset by improved operational efficiencies in the Permian and Midcontinent regions; and |
• | $113 million decrease as a result of commodity derivative activity attributable to an increase in unrealized commodity derivative losses of $166 million in 2016 which were partially offset by a $53 million increase in realized cash settlement gains due to movements in forward prices of commodities. |
These decreases were partially offset by:
• | $185 million increase attributable to higher gas and NGL sales volumes and the impact of a specific producer arrangement primarily related to our DJ Basin system in our North region; |
• | $115 million increase in transportation, processing and other primarily related to fee based contract realignment efforts, partially offset by lower volumes in the South region and the sale of our Northern Louisiana System. |
Purchases and Related Costs — Purchases and related costs decreased $434 million in 2016 compared to 2015 as a result of decreased commodity prices and lower gas and NGL sales volumes in our South, Midcontinent and Permian regions, partially offset by increased volumes in our North region.
Operating and Maintenance Expense — Operating and maintenance expense decreased in 2016 compared to 2015 primarily as a result of our headcount reduction in April 2016, plant consolidations and other cost savings initiatives, the disposition of our Northern Louisiana system in July 2016 and the sale of certain gas processing plants and gathering systems in the Permian region in 2015, partially offset by the completion of our Lucerne 2 plant in the DJ Basin system in July 2015 and the completion of our Zia II plant in the Southeast New Mexico system in August 2015.
General and Administrative Expense — General and administrative expense decreased in 2016 compared to 2015 primarily as a result of our headcount reduction in April 2016 and other cost savings initiatives.
63
Asset Impairments — Asset impairments in 2015 represented impairments of goodwill, property, plant and equipment and intangible assets.
Other Income (Expense), net — Other income, net in 2016 represented a producer settlement net of legal fees, partially offset by charges from discontinued construction projects.
Earnings from Unconsolidated Affiliates — Earnings from unconsolidated affiliates increased in 2016 compared to 2015 primarily as a result of the ramp-up of the Keathley Canyon volumes at Discovery.
Gain on Sale of Assets, net — Gain on sale of assets during 2016 primarily related to the sale of our Northern Louisiana system in our South region. During 2015, we recognized gains related to the sale of certain gas processing plants and gathering systems in our Midcontinent and Permian regions.
Segment Gross Margin — Segment gross margin increased $14 million in 2016 compared to 2015, primarily as a result of the following:
• | $76 million increase primarily as a result of higher volumes following the ramp-up of the Lucerne 2 plant, completion of the Grand Parkway gathering system in January 2016, higher margins on specific producer arrangements and higher NGL recoveries primarily related to our DJ Basin system in our North region; |
• | $77 million increase primarily as a result of the completion of the Zia II plant in the Southeast New Mexico system in our Permian region in August 2015, ramp-up of the National Helium plant in the Liberal system in our Midcontinent region in September 2015 and improved operational efficiencies in the Permian and Midcontinent regions; and |
• | $12 million increase primarily as a result of fee based contract realignment efforts in the Permian and Midcontinent regions, partially offset by lower volumes across our South, Midcontinent and Permian regions due to reduced drilling activity in prior periods. |
These increases were partially offset by:
• | $113 million decrease as a result of commodity derivative activity as discussed above; |
• | $30 million decrease as a result of lower commodity prices; and |
• | $8 million decrease as a result of the sale of our Northern Louisiana system in our South Region. |
Total Wellhead Volumes - Natural gas wellhead throughput decreased in 2016 compared to 2015 reflecting lower volumes primarily from (i) our Eagle Ford and East Texas systems within our South region (ii) lower volumes associated with the general declines within the Permian and Midcontinent regions (iii) the disposition of our Northern Louisiana system within our South region and (iv) disposition of certain gas processing plants and gathering systems in the Midcontinent and Permian regions, which were partially offset by (iv) the ramp-up of the Lucerne 2 plant in our North region which commenced operations in June 2015 (v) completion of the Zia II plant in August 2015 and (vi) ramp-up of the National Helium plant in September 2015.
NGL Gross Production - NGL production decreased in 2016 compared to 2015 reflecting lower volumes primarily from (i) our Eagle Ford and East Texas systems within our South region (ii) lower volumes associated with the general declines within the Permian and Midcontinent regions (iii) the disposition of our Northern Louisiana system within our South region (iv) disposition of certain gas processing plants in the Midcontinent and Permian regions and (v) higher ethane rejection, which were partially offset by (vi) the ramp-up of the Lucerne 2 plant in our North region which commenced operations in June 2015 (vii) completion of the Zia II plant in August 2015 and (viii) ramp-up of the National Helium plant in September 2015.
64
Results of Operations — Logistics and Marketing Segment
The results of operations for our Logistics and Marketing segment are as follows:
Year Ended December 31, | Variance 2017 vs. 2016 | Variance 2016 vs. 2015 | ||||||||||||||||||||||||
2017 | 2016 | 2015 | Increase (Decrease) | Percent | Increase (Decrease) | Percent | ||||||||||||||||||||
(millions, except operating data) | ||||||||||||||||||||||||||
Operating revenues: | ||||||||||||||||||||||||||
Sales of natural gas and NGLs | $ | 7,667 | $ | 6,094 | $ | 6,364 | $ | 1,573 | 26 | % | $ | (270 | ) | (4 | )% | |||||||||||
Transportation, processing and other | 64 | 70 | 72 | (6 | ) | (9 | )% | (2 | ) | (3 | )% | |||||||||||||||
Trading and marketing gains, net | 26 | 22 | 51 | 4 | 18 | % | (29 | ) | (57 | )% | ||||||||||||||||
Total operating revenues | 7,757 | 6,186 | 6,487 | 1,571 | 25 | % | (301 | ) | (5 | )% | ||||||||||||||||
Purchases and related costs | (7,557 | ) | (5,981 | ) | (6,251 | ) | 1,576 | 26 | % | (270 | ) | (4 | )% | |||||||||||||
Operating and maintenance expense | (41 | ) | (43 | ) | (49 | ) | (2 | ) | (5 | )% | (6 | ) | (12 | )% | ||||||||||||
Depreciation and amortization expense | (14 | ) | (15 | ) | (16 | ) | (1 | ) | (7 | )% | (1 | ) | (6 | )% | ||||||||||||
General and administrative expense | (11 | ) | (9 | ) | (11 | ) | 2 | 22 | % | (2 | ) | (18 | )% | |||||||||||||
Asset impairments | — | — | (9 | ) | — | * | (9 | ) | * | |||||||||||||||||
Other expense | (11 | ) | (5 | ) | (8 | ) | 6 | * | (3 | ) | (38 | )% | ||||||||||||||
Earnings from unconsolidated affiliates (a) | 243 | 209 | 130 | 34 | 16 | % | 79 | 61 | % | |||||||||||||||||
Gain on sale of assets, net | — | 16 | — | (16 | ) | * | 16 | * | ||||||||||||||||||
Segment net income attributable to partners | $ | 366 | $ | 358 | $ | 273 | $ | 8 | 2 | % | $ | 85 | 31 | % | ||||||||||||
Other data: | ||||||||||||||||||||||||||
Segment gross margin (b) | $ | 200 | $ | 205 | $ | 236 | $ | (5 | ) | (2 | )% | $ | (31 | ) | (13 | )% | ||||||||||
Non-cash commodity derivative mark-to-market | $ | (4 | ) | $ | (20 | ) | $ | (1 | ) | $ | 16 | (80 | )% | $ | (19 | ) | * | |||||||||
NGL pipelines throughput (MBbls/d) (c) | 460 | 420 | 298 | 40 | 10 | % | 122 | 41 | % | |||||||||||||||||
(a) | Earnings from unconsolidated affiliates for Sand Hills, Southern Hills, Front Range, Mont Belvieu 1 and Texas Express include the amortization of the net difference between the carrying amount of our investments and the underlying equity of the entities. |
(b) | Segment gross margin consists of total operating revenues less purchases and related costs. Please read “Reconciliation of Non-GAAP Measures”. |
(c) | For entities not wholly-owned by us, includes our share, based on our ownership percentage, of the throughput volume. |
65
Year Ended December 31, 2017 vs. Year Ended December 31, 2016
Total Operating Revenues — Total operating revenues increased $1,571 million in 2017 compared to 2016, primarily as a result of the following:
• | $1,934 million increase as a result of higher commodity prices, which impacted both sales and purchases, before the impact of derivative activity; |
• | $4 million increase as a result of commodity derivative activity attributable to an decrease in unrealized commodity derivative losses of $16 million partially offset by a $12 million decrease in realized cash settlement gains due to movements in forward prices of commodities in 2017; |
These increases were partially offset by:
• | $325 million decrease attributable to lower gas and NGL sales volumes, which impacted both sales and purchases; |
• | $36 million decrease due to the sale of our Northern Louisiana system, and; |
• | $6 million decrease in transportation, processing and other primarily related to lower gas storage margins and lower transportation volumes on certain of our NGL pipelines. |
Purchases and related costs — Purchases and related costs increased $1,576 million in 2017 compared to 2016, primarily as a result of higher commodity prices, partially offset by lower gas and NGL sales volumes.
Other expense — Other expense in 2017 primarily represents the write-off of property, plant and equipment associated with the expiration of a lease while other expense in 2016 primarily represents the write-off of property, plant and equipment and other long term assets.
Earnings from Unconsolidated Affiliates — Earnings from unconsolidated affiliates increased in 2017 compared to 2016 primarily as a result of higher throughput volumes on Sand Hills due to continued NGL production growth from the Permian basin and ongoing capacity expansions, partially offset by lower volumes and planned maintenance on the Mont Belvieu fractionators.
Gain on sale of assets, net — The gain on sale in 2016 primarily represents the sale of our Northern Louisiana system.
Segment Gross Margin — Segment gross margin decreased $5 million in 2017 compared to 2016, primarily as a result of the following:
• | $11 million decrease as a result of lower margins and the expiration of a contract in our wholesale propane business; |
• | $8 million decrease as a result of lower gas storage margins and lower transportation volumes on certain of our NGL pipelines; and |
• | $7 million decrease as a result of the sale of our Northern Louisiana system; |
These decreases are partially offset by;
• | $9 million increase as a result of higher NGL marketing margins; |
• | $8 million increase as a result of higher gas marketing margins; and |
• | $4 million increase as a result of commodity derivative activity discussed above. |
NGL Pipelines Throughput — NGL pipelines throughput increased in 2017 compared to 2016 primarily as a result of higher throughput volumes on Sand Hills due to continued NGL production growth from the Permian basin and ongoing capacity expansions on the Sand Hills pipeline.
66
Year Ended December 31, 2016 vs. Year Ended December 31, 2015
Total Operating Revenues — Total operating revenues decreased $301 million in 2016 compared to 2015, primarily as a result of the following:
• | $250 million decrease attributable to lower commodity prices, which impacted both sales and purchases, before the impact of derivative activity; |
• | $20 million decrease attributable to lower gas and NGL sales volumes, which impacted both sales and purchases |
• | $29 million decrease as a result of commodity derivative activity attributable to a $10 million decrease in realized cash settlement gains in 2016 and an increase in unrealized commodity derivative losses of $19 million due to movements in forward prices of commodities; and |
• | $2 million decrease primarily due to the sale of our Northern Louisiana system in July 2016 and lower wholesale propane fees partially offset by new connections on certain of our NGL pipelines. |
Purchases and Related Costs — Purchases and related costs decreased $270 million in 2016 compared to 2015 as a result of lower commodity prices and lower gas and NGL sales volumes.
Operating and Maintenance Expense — Operating and maintenance expense decreased in 2016 compared to 2015 primarily as a result of our headcount reduction in April 2016, other cost savings initiatives and the sale of our Northern Louisiana system in July 2016.
General and Administrative Expense — General and administrative expense decreased in 2016 compared to 2015 primarily as a result of our headcount reduction in April 2016 and other cost savings initiatives.
Asset Impairments — Asset impairments for the year ended December 31, 2015 primarily related to impairments of property, plant and equipment and intangible assets.
Other Expense, net — Other expense, net in 2016 and 2015 primarily represents charges for discontinued construction projects.
Gain on Sale of Assets, net — Gain on sale of assets for the year ended December 31, 2016 primarily related to the sale of our Northern Louisiana system.
Earnings from Unconsolidated Affiliates — Earnings from unconsolidated affiliates increased in 2016 compared to 2015 primarily as a result of Enbridge’s contribution of its interests in Sand Hills and Southern Hills in November 2015, higher pipeline throughput volumes on Southern Hills, Sand Hills and Front Range due to growth in NGL production from new plants placed into service in 2015 and earnings on the Panola pipeline beginning in February 2016.
Segment Gross Margin — Segment gross margin decreased $31 million in 2016 compared to 2015, primarily as a result of the following:
• | $29 million decrease as a result of commodity derivative activity attributable to a $10 million decrease in realized cash settlement gains in 2016 and an increase in unrealized commodity derivative losses of $19 million due to movements in forward prices of commodities; |
• | $2 million decrease primarily due to the sale of our Northern Louisiana system in July 2016 and lower wholesale propane fees, partially offset by new connections on certain of our NGL pipeline. |
NGL Pipelines Throughput — NGL pipelines throughput increased in 2016 compared to 2015 primarily as a result of Enbridge’s contribution of its interests in Sand Hills and Southern Hills in November 2015, higher throughput volumes on Sand Hills, Southern Hills and Front Range due to growth in NGL production from new plants placed into service in 2015 and the throughput volumes on Panola commencing February 2016.
67
Liquidity and Capital Resources
We expect our sources of liquidity to include:
• | cash generated from operations; |
• | cash distributions from our unconsolidated affiliates; |
• | borrowings under our Credit Agreement; |
• | proceeds from asset rationalization; |
• | reduction of incentive distribution right payments during 2018 and 2019; |
• | debt offerings; |
• | issuances of additional common units, preferred units or other securities; |
• | borrowings under term loans; and |
• | letters of credit. |
We anticipate our more significant uses of resources to include:
• | quarterly distributions to our common unitholders and General Partner, and semi annual distributions to our preferred unitholders; |
• | payments to service our debt; |
• | growth capital expenditures; |
• | contributions to our unconsolidated affiliates to finance our share of their capital expenditures; |
• | business and asset acquisitions; and |
• | collateral with counterparties to our swap contracts to secure potential exposure under these contracts, which may, at times, be significant depending on commodity price movements. |
We believe that cash generated from these sources will be sufficient to meet our short-term working capital requirements, long-term capital expenditure and acquisition requirements and quarterly cash distributions for the next twelve months.
We routinely evaluate opportunities for strategic investments or acquisitions. Future material investments or acquisitions may require that we obtain additional capital, assume third party debt or incur other long-term obligations. We have the option to utilize both equity and debt instruments as vehicles for the long-term financing of our investment activities and acquisitions.
Based on current and anticipated levels of operations, we believe we have adequate committed financial resources to conduct our ongoing business, although deterioration in our operating environment could limit our borrowing capacity, further impact our credit ratings, raise our financing costs, as well as impact our compliance with our financial covenant requirements under the Credit Agreement and the indentures governing our notes.
Credit Agreement — In December 2017, we amended our $1.4 billion Credit Agreement (the "Credit Agreement"), to extend the maturity date to December 6, 2022. The Credit Agreement is used for working capital requirements and other general partnership purposes including acquisitions.
As of December 31, 2017, there were no outstanding borrowings on the revolving credit facility under the Credit Agreement. We had unused borrowing capacity of $1,375 million, net of $25 million of letters of credit, under the Credit Agreement and the financial covenants set forth in the Credit Agreement limit the Partnership's ability to incur incremental debt by this amount as of December 31, 2017. Our cost of borrowing under the Credit Agreement is determined by a ratings-based pricing grid. In the first quarter of 2017, our credit rating was lowered. As a result of this action, interest rates on outstanding borrowings under the Credit Agreement increased. As of February 22, 2018, we had no outstanding borrowings on the revolving credit facility and had approximately $1,375 million, net of $25 million of letters of credit, of unused borrowing capacity under the Credit Agreement.
68
Issuance of Units — In November 2017, we issued 500,000 of our 7.375% Series A Preferred Units representing limited partner interests at a price of $1,000 per unit. We used the net proceeds of $487 million from this issuance for general partnership purposes, including the partial repayment of the $500 million 2.50% Senior Notes which were due on December 1, 2017.
In November 2017, we filed a shelf registration statement with the SEC that became effective upon filing and allows us to issue an indeterminate amount of common units, preferred units, and debt securities. During the year ended December 31, 2017, we issued $500 million of our Series A Preferred Units under this shelf registration statement and no other securities. This shelf registration statement replaced the shelf registration statement that we filed in April 2015 pursuant to which we issued no securities.
In August 2017, we filed a shelf registration statement with the SEC which allows us to issue up to $750 million in common units pursuant to our at-the-market program. During the year ended December 31, 2017, we issued no common units pursuant to this registration statement.
Commodity Swaps and Collateral — Changes in natural gas, NGL and condensate prices and the terms of our processing arrangements have a direct impact on our generation and use of cash from operations due to their impact on net income, along with the resulting changes in working capital. We have mitigated a portion of our anticipated commodity price risk associated with the equity volumes from our gathering and processing activities through the first quarter of 2019 with fixed price commodity swaps. For additional information regarding our derivative activities, please read Item 7A. "Quantitative and Qualitative Disclosures about Market Risk."
When we enter into commodity swap contracts we may be required to provide collateral to the counterparties in the event that our potential payment exposure exceeds a predetermined collateral threshold. Collateral thresholds are set by us and each counterparty, as applicable, in the master contract that governs our financial transactions based on our and the counterparty’s assessment of creditworthiness. The assessment of our position with respect to the collateral thresholds are determined on a counterparty by counterparty basis, and are impacted by the representative forward price curves and notional quantities under our swap contracts. Due to the interrelation between the representative crude oil and natural gas forward price curves, it is not practical to determine a pricing point at which our swap contracts will meet the collateral thresholds as we may transact multiple commodities with the same counterparty. Depending on daily commodity prices, the amount of collateral posted can go up or down on a daily basis.
Working Capital — Working capital is the amount by which current assets exceed current liabilities. Current assets are reduced by our quarterly distributions, which are required under the terms of our Partnership Agreement based on Available Cash, as defined in the Partnership Agreement. In general, our working capital is impacted by changes in the prices of commodities that we buy and sell, inventory levels, and other business factors that affect our net income and cash flows. Our working capital is also impacted by the timing of operating cash receipts and disbursements, cash collateral we may be required to post with counterparties to our commodity derivative instruments, borrowings of and payments on debt, capital expenditures, and increases or decreases in other long-term assets. We expect that our future working capital requirements will be impacted by these same recurring factors.
We had working capital deficits of $166 million and $629 million as of December 31, 2017 and December 31, 2016, respectively. The change in working capital is primarily attributable to the cash received in the Transaction and from the issuance of the Series A Preferred Units offset by the repayment of the 2.50% Senior Notes and long-term debt outstanding on the revolving credit facility. We had a net derivative working capital deficit of $46 million and $49 million as of December 31, 2017 and December 31, 2016, respectively.
As of December 31, 2017, we had $156 million in cash and cash equivalents, of which $1 million was held by consolidated subsidiaries we did not wholly own.
69
Cash Flow — Operating, investing and financing activities were as follows:
Year Ended December 31, | |||||||||||
2017 | 2016 | 2015 | |||||||||
(millions) | |||||||||||
Net cash provided by operating activities | $ | 896 | $ | 645 | $ | 442 | |||||
Net cash used in investing activities | $ | (391 | ) | $ | (34 | ) | $ | (711 | ) | ||
Net cash (used in) provided by financing activities | $ | (350 | ) | $ | (613 | ) | $ | 245 | |||
Year Ended December 31, 2017 vs. Year Ended December 31, 2016
Operating Activities - Net cash provided by operating activities increased $251 million in 2017 compared to the same period in 2016. The changes in net cash provided by operating activities are attributable to our net income adjusted for non-cash charges and changes in working capital as presented in the consolidated statements of cash flows. In addition, we received $10 million less of cash distributions in excess of earnings from unconsolidated affiliates during the year ended December 31, 2017. For additional information regarding fluctuations in our earnings from unconsolidated affiliates, please read "Results of Operations".
Investing Activities - Net cash used in investing activities increased $357 million in 2017 compared to the same period in 2016 primarily as a result of higher capital expenditures used for construction of the Mewbourn 3 plant, Grand Parkway Phase 2 and O'Connor bypass projects and higher investments in unconsolidated affiliates for the capacity expansion of the Sand Hills pipeline. In addition, less proceeds were received in 2017 from the sale of Douglas gathering system compared to proceeds received from the sale of our Northern Louisiana system in 2016.
Financing Activities - Net cash used in financing activities decreased $263 million in 2017 compared to the same period in 2016 primarily as a result of cash received from the the issuance of Series A preferred limited partner units and from the Transaction in 2017 partially offset by higher net payments of long-term debt and higher distributions paid to limited partners and the general partner due to a higher number of outstanding common units and general partner units following the Transaction.
Year Ended December 31, 2016 vs. Year Ended December 31, 2015
Operating Activities - Net cash provided by operating activities increased $203 million in 2016 compared to the same period in 2015. The changes in net cash provided by operating activities are attributable to our net income adjusted for non-cash charges and changes in working capital as presented in the consolidated statements of cash flows. In addition, we received $41 million more of cash distributions in excess of earnings from unconsolidated affiliates during the year ended December 31, 2016. For additional information regarding fluctuations in our earnings from unconsolidated affiliates, please read "Results of Operations".
Investing Activities - Net cash used in investing activities decreased $677 million in 2016 compared to the same period in 2015 primarily as a result of higher capital expenditures in 2015 attributable to the Lucerne 2 plant, the Zia II plant, the National Helium plant expansion and the Grand Parkway gathering projects, as well as decreases in cash contributions to our unconsolidated affiliates and lower proceeds received from sale of assets in 2016.
Financing Activities - Net cash used in financing activities increased $858 million in 2016 compared to the same period in 2015 primarily as a result of the decrease in advances from DCP Midstream, LLC attributable to the $1,500 contribution received from Phillips 66 in 2015, and the decrease in proceeds from issuance of common units to the public, partially offset by the decrease in net debt payments primarily attributable to the repayment of outstanding commercial paper in 2015.
Capital Requirements — The midstream energy business can be capital intensive, requiring significant investment to maintain and upgrade existing operations. Our capital requirements have consisted primarily of, and we anticipate will continue to consist of the following:
• | maintenance capital expenditures, which are cash expenditures to maintain our cash flows, operating or earnings capacity. These expenditures add on to or improve capital assets owned, including certain system integrity, |
70
compliance and safety improvements. Maintenance capital expenditures also include certain well connects, and may include the acquisition or construction of new capital assets; and
• | expansion capital expenditures, which are cash expenditures to increase our cash flows, operating or earnings capacity. Expansion capital expenditures include acquisitions or capital improvements (where we add on to or improve the capital assets owned, or acquire or construct new gathering lines and well connects, treating facilities, processing plants, fractionation facilities, pipelines, terminals, docks, truck racks, tankage and other storage, distribution or transportation facilities and related or similar midstream assets). |
We incur capital expenditures for our consolidated entities and our unconsolidated affiliates. Our 2018 plan includes maintenance capital expenditures of between $100 million and $120 million, and expansion capital expenditures between $650 million and $750 million associated with approved projects. Expansion capital expenditures include the construction of the Mewbourn 3 plant, Grand Parkway Phase 2 and O'Connor bypass in our DJ Basin system, and the capacity expansions of the Sand Hills pipeline, which are shown as an investment in unconsolidated affiliates in our consolidated statements of cash flows.
The following table summarizes our maintenance and expansion capital expenditures for our consolidated entities for the years ended December 31, 2017, 2016 and 2015:
Year Ended December 31, 2017 | Year Ended December 31, 2016 | ||||||||||||||||||||||
Maintenance Capital Expenditures | Expansion Capital Expenditures | Total Consolidated Capital Expenditures | Maintenance Capital Expenditures | Expansion Capital Expenditures | Total Consolidated Capital Expenditures | ||||||||||||||||||
(millions) | |||||||||||||||||||||||
Our portion | $ | 90 | $ | 279 | $ | 369 | $ | 86 | $ | 57 | $ | 143 | |||||||||||
Noncontrolling interest portion and reimbursable projects (a) | 2 | 4 | 6 | 3 | (2 | ) | 1 | ||||||||||||||||
Total | $ | 92 | $ | 283 | $ | 375 | $ | 89 | $ | 55 | $ | 144 | |||||||||||
Year Ended December 31, 2015 | ||||||||||||
Maintenance Capital Expenditures | Expansion Capital Expenditures | Total Consolidated Capital Expenditures | ||||||||||
Our portion | $ | 181 | $ | 633 | $ | 814 | ||||||
Noncontrolling interest portion and reimbursable projects (a) | (3 | ) | — | (3 | ) | |||||||
Total | $ | 178 | $ | 633 | $ | 811 | ||||||
(a) | Represents the noncontrolling interest and reimbursable portion of our capital expenditures. We have entered into agreements with third parties whereby we will be reimbursed for certain expenditures. Depending on the timing of these payments, we may be reimbursed prior to incurring the capital expenditure. |
In addition, we invested cash in unconsolidated affiliates of $148 million and $53 million during the years ended December 31, 2017 and 2016, respectively, to fund our share of capital expansion projects.
We intend to make cash distributions to our unitholders and our general partner. Due to our cash distribution policy, we expect that we will distribute to our unitholders most of the cash generated by our operations. As a result, we expect that we will rely upon external financing sources, to fund future acquisitions and capital expenditures.
We expect to fund future capital expenditures with funds generated from our operations, borrowings under our Credit Agreement, the issuance of additional equity securities and the issuance of long-term debt.
Cash Distributions to Unitholders — Our Partnership Agreement requires that, within 45 days after the end of each quarter, we distribute all Available Cash, as defined in the Partnership Agreement. We made cash distributions to our unitholders and general partner of $545 million and $483 million during the years ended December 31, 2017 and 2016, respectively. We intend to continue making quarterly distribution payments to our unitholders and general partner to the extent we have sufficient cash from operations after the establishment of reserves.
71
In accordance with our amended Partnership Agreement, distributions declared were $618 million for the year ended December 31, 2017. Distributions declared reflect the distribution of $40 million of IDR givebacks to our owners, in conjunction with the quarterly distribution, that were previously withheld under the amended Partnership agreement.
We expect to continue to use cash provided by operating activities for the payment of distributions to our unitholders and general partner. See Note 14. "Partnership Equity and Distributions" in the Notes to the Consolidated Financial Statements in Item 8. “Financial Statements.”
Total Contractual Cash Obligations
A summary of our total contractual cash obligations as of December 31, 2017, was as follows:
Payments Due by Period | |||||||||||||||||||
Total | Less than 1 year | 1-3 years | 3-5 years | Thereafter | |||||||||||||||
(millions) | |||||||||||||||||||
Debt (a) | $ | 7,837 | $ | 274 | $ | 1,828 | $ | 1,196 | $ | 4,539 | |||||||||
Operating lease obligations | 164 | 37 | 64 | 35 | 28 | ||||||||||||||
Purchase obligations (b) | 4,485 | 828 | 1,325 | 1,093 | 1,239 | ||||||||||||||
Other long-term liabilities (c) | 144 | — | 17 | 15 | 112 | ||||||||||||||
Total | $ | 12,630 | $ | 1,139 | $ | 3,234 | $ | 2,339 | $ | 5,918 | |||||||||
(a) | Includes interest payments on debt securities that have been issued. These interest payments are $274 million, $453 million, $346 million, and $2,039 million for less than one year, one to three years, three to five years, and thereafter, respectively. |
(b) | Our purchase obligations are contractual obligations and include purchase orders and non-cancelable construction agreements for capital expenditures, various non-cancelable commitments to purchase physical quantities of commodities in future periods and other items, including long-term fractionation agreements. For contracts where the price paid is based on an index or other market-based rates, the amount is based on the forward market prices or current market rates as of December 31, 2017. Purchase obligations exclude accounts payable, accrued taxes and other current |
liabilities recognized in the consolidated balance sheets. Purchase obligations also exclude current and long-term unrealized losses on derivative instruments included in the consolidated balance sheets, which represent the current fair value of various derivative contracts and do not represent future cash purchase obligations. These contracts may be settled financially at the difference between the future market price and the contractual price and may result in cash payments or cash receipts in the future, but generally do not require delivery of physical quantities of the underlying commodity. In addition, many of our gas purchase contracts include short and long-term commitments to purchase produced gas at market prices. These contracts, which have no minimum quantities, are excluded from
the table.
(c) | Other long-term liabilities include asset retirement obligations, long-term environmental remediation liabilities, gas purchase liabilities, and other miscellaneous liabilities recognized in the December 31, 2017 consolidated balance sheet. The table above excludes non-cash obligations as well as $29 million of Executive Deferred Compensation Plan contributions and $14 million of long-term incentive plans as the amount and timing of any payments are not subject to reasonable estimation. |
Off-Balance Sheet Obligations
As of December 31, 2017, we had no items that were classified as off-balance sheet obligations.
72
Reconciliation of Non-GAAP Measures
Gross Margin and Segment Gross Margin — In addition to net income, we view our gross margin as an important performance measure of the core profitability of our operations. We review our gross margin monthly for consistency and trend analysis.
We define gross margin as total operating revenues, less purchases and related costs, and we define segment gross margin for each segment as total operating revenues for that segment less commodity purchases for that segment. Our gross margin equals the sum of our segment gross margins. Gross margin and segment gross margin are primary performance measures used by management, as these measures represent the results of product sales and purchases, a key component of our operations. As an indicator of our operating performance, gross margin and segment gross margin should not be considered an alternative to, or more meaningful than, operating revenues, net income or loss, net income or loss attributable to partners, operating income, cash flows from operating activities or any other measure of financial performance presented in accordance with GAAP.
Adjusted EBITDA — We define adjusted EBITDA as net income or loss attributable to partners adjusted for (i) distributions from unconsolidated affiliates, net of earnings (ii) depreciation and amortization expense, (iii) net interest expense, (iv) noncontrolling interest in depreciation and income tax expense, (v) unrealized gains and losses from commodity derivatives (vi) income tax expense or benefit, (vii) impairment expense and (viii) certain other non-cash items. Adjusted EBITDA further excludes items of income or loss that we characterize as unrepresentative of our ongoing operations. Management believes these measures provide investors meaningful insight into results from ongoing operations.
Adjusted EBITDA should not be considered an alternative to, or more meaningful than, net income or loss, net income or loss attributable to partners, operating income, cash flows from operating activities or any other measure of financial performance presented in accordance with GAAP as measures of operating performance, liquidity or ability to service debt obligations.
Adjusted EBITDA is used as a supplemental liquidity and performance measure and adjusted segment EBITDA is used as a supplemental performance measure by our management and by external users of our financial statements, such as investors, commercial banks, research analysts and others to assess:
• | financial performance of our assets without regard to financing methods, capital structure or historical cost basis; |
• | our operating performance and return on capital as compared to those of other companies in the midstream energy industry, without regard to financing methods or capital structure; |
• | viability and performance of acquisitions and capital expenditure projects and the overall rates of return on investment opportunities; and |
• | in the case of Adjusted EBITDA, the ability of our assets to generate cash sufficient to pay interest costs, support our indebtedness, make cash distributions to our unitholders and general partner, and finance maintenance capital expenditures. |
Adjusted Segment EBITDA — We define adjusted segment EBITDA for each segment as segment net income or loss attributable to partners adjusted for (i) distributions from unconsolidated affiliates, net of earnings (ii) depreciation and amortization expense, (iii) net interest expense, (iv) noncontrolling interest in depreciation and income tax expense, (v) unrealized gains and losses from commodity derivatives (vi) income tax expense or benefit, (vii) impairment expense and (viii) certain other non-cash items. Adjusted EBITDA further excludes items of income or loss that we characterize as unrepresentative of our ongoing operations for that segment. Our adjusted segment EBITDA may not be comparable to similarly titled measures of other companies because they may not calculate adjusted segment EBITDA in the same manner.
Adjusted segment EBITDA should not be considered in isolation or as an alternative to our financial measures presented in accordance with GAAP, including operating revenues, net income or loss attributable to partners, or any other measure of performance presented in accordance with GAAP.
Our gross margin, segment gross margin, adjusted EBITDA and adjusted segment EBITDA may not be comparable to a similarly titled measure of another company because other entities may not calculate these measures in the same manner. The accompanying schedules provide reconciliations of gross margin, segment gross margin and adjusted segment EBITDA to their most directly comparable GAAP financial measures.
Distributable Cash Flow — We define Distributable Cash Flow as adjusted EBITDA, as defined above, less maintenance capital expenditures, net of reimbursable projects, less interest expense, less income attributable to preferred units, and certain other items. Maintenance capital expenditures are cash expenditures made to maintain our cash flows, operating or earnings
73
capacity. These expenditures add on to or improve capital assets owned, including certain system integrity, compliance and safety improvements. Maintenance capital expenditures also include certain well connects, and may include the acquisition or construction of new capital assets. Income attributable to preferred units represent cash distributions earned by the Series A Preferred Units. Cash distributions to be paid to the holders of the Series A Preferred units, assuming a distribution is declared by our board of directors, are not available to common unit holders. Non-cash mark-to-market of derivative instruments is considered to be non-cash for the purpose of computing Distributable Cash Flow because settlement will not occur until future periods, and will be impacted by future changes in commodity prices and interest rates. We compare the Distributable Cash Flow we generate to the cash distributions we expect to pay our partners. Using this metric, we compute our distribution coverage ratio. Distributable Cash Flow is used as a supplemental liquidity and performance measure by our management and by external users of our financial statements, such as investors, commercial banks, research analysts and others, to assess our ability to make cash distributions to our unitholders and our general partner.
Our Distributable Cash Flow may not be comparable to a similarly titled measure of another company because other entities may not calculate Distributable Cash Flow in the same manner.
74
The following table sets forth our reconciliation of certain non-GAAP measures:
Year Ended December 31, | ||||||||||||
2017 | 2016 | 2015 | ||||||||||
Reconciliation of Non-GAAP Measures | (Millions) | |||||||||||
Reconciliation of net income (loss) attributable to partners to gross margin: | ||||||||||||
Net income (loss) attributable to partners | $ | 229 | $ | 88 | $ | (871 | ) | |||||
Interest expense | 289 | 321 | 320 | |||||||||
Income tax expense | 2 | 46 | (102 | ) | ||||||||
Operating and maintenance expense | 661 | 670 | 732 | |||||||||
Depreciation and amortization expense | 379 | 378 | 377 | |||||||||
General and administrative expense | 290 | 292 | 281 | |||||||||
Asset impairments | 48 | — | 912 | |||||||||
Other expense (income), net | 11 | (65 | ) | 10 | ||||||||
Restructuring costs | — | 13 | 11 | |||||||||
Earnings from unconsolidated affiliates | (303 | ) | (282 | ) | (184 | ) | ||||||
Gain on sale of assets, net | (34 | ) | (35 | ) | (42 | ) | ||||||
Net income attributable to noncontrolling interests | 5 | 6 | 5 | |||||||||
Gross margin | $ | 1,577 | $ | 1,432 | $ | 1,449 | ||||||
Non-cash commodity derivative mark-to-market (a) | $ | (28 | ) | $ | (139 | ) | $ | 46 | ||||
Reconciliation of segment net income (loss) attributable to partners to segment gross margin: | ||||||||||||
Gathering and Processing segment: | ||||||||||||
Segment net income (loss) attributable to partners | $ | 454 | $ | 417 | $ | (606 | ) | |||||
Operating and maintenance expense | 602 | 611 | 668 | |||||||||
Depreciation and amortization expense | 343 | 344 | 343 | |||||||||
General and administrative expense | 19 | 14 | 22 | |||||||||
Asset impairments | 48 | — | 876 | |||||||||
Other expense (income), net | — | (73 | ) | 1 | ||||||||
Earnings from unconsolidated affiliates | (60 | ) | (73 | ) | (54 | ) | ||||||
Gain on sale of assets, net | (34 | ) | (19 | ) | (42 | ) | ||||||
Net income attributable to noncontrolling interests | 5 | 6 | 5 | |||||||||
Segment gross margin | $ | 1,377 | $ | 1,227 | $ | 1,213 | ||||||
Non-cash commodity derivative mark-to-market (a) | $ | (24 | ) | $ | (119 | ) | $ | 47 | ||||
Logistics and Marketing segment: | ||||||||||||
Segment net income attributable to partners | $ | 366 | $ | 358 | $ | 273 | ||||||
Operating and maintenance expense | 41 | 43 | 49 | |||||||||
Depreciation and amortization expense | 14 | 15 | 16 | |||||||||
Other expense, net | 11 | 5 | 8 | |||||||||
General and administrative expense | 11 | 9 | 11 | |||||||||
Earnings from unconsolidated affiliates | (243 | ) | (209 | ) | (130 | ) | ||||||
Gain on sale of assets, net | — | (16 | ) | — | ||||||||
Asset impairments | — | — | 9 | |||||||||
Segment gross margin | $ | 200 | $ | 205 | $ | 236 | ||||||
Non-cash commodity derivative mark-to-market (a) | $ | (4 | ) | $ | (20 | ) | $ | (1 | ) | |||
75
(a) | Non-cash commodity derivative mark-to-market is included in gross margin and segment gross margin, along with cash settlements for our commodity derivative contracts. |
Year Ended December 31, | ||||||||||||
2017 | 2016 | 2015 | ||||||||||
(Millions) | ||||||||||||
Reconciliation of net income (loss) attributable to partners to adjusted segment EBITDA: | ||||||||||||
Gathering and Processing segment: | ||||||||||||
Segment net income (loss) attributable to partners | $ | 454 | $ | 417 | $ | (606 | ) | |||||
Non-cash commodity derivative mark-to-market | 24 | 119 | (47 | ) | ||||||||
Depreciation and amortization expense, net of noncontrolling interest | 342 | 343 | 342 | |||||||||
Asset impairments | 48 | — | 876 | |||||||||
Gain on sale of assets, net | (34 | ) | (19 | ) | (42 | ) | ||||||
Distributions from unconsolidated affiliates, net of earnings | 24 | 21 | 15 | |||||||||
Other expense | 4 | 14 | 2 | |||||||||
Adjusted segment EBITDA | $ | 862 | $ | 895 | $ | 540 | ||||||
Logistics and Marketing segment: | ||||||||||||
Segment net income attributable to partners (a) | $ | 366 | $ | 358 | $ | 273 | ||||||
Non-cash commodity derivative mark-to-market | 4 | 20 | 1 | |||||||||
Depreciation and amortization expense, net of noncontrolling interest | 14 | 15 | 16 | |||||||||
Distributions from unconsolidated affiliates, net of earnings | 40 | 53 | 18 | |||||||||
Gain on sale of assets, net | — | (16 | ) | — | ||||||||
Asset impairments | — | — | 9 | |||||||||
Other expense | 9 | — | — | |||||||||
Adjusted segment EBITDA | $ | 433 | $ | 430 | $ | 317 | ||||||
(a) | There were lower of cost or market adjustments of $2 million, $3 million and $8 million for the years ended December 31, 2017, 2016 and 2015, respectively. |
Operating and Maintenance and General and Administrative Expense
Pursuant to the Contribution Agreement, on January 1, 2017, the Partnership entered into the Services and Employee Secondment Agreement (the “Services Agreement”), which replaced the services agreement between the Partnership and DCP Midstream, LLC, dated February 14, 2013, as amended. Under the Services Agreement, we are required to reimburse DCP Midstream, LLC for salaries of personnel and employee benefits, as well as capital expenditures, maintenance and repair costs, taxes and other direct costs incurred by DCP Midstream, LLC on our behalf. There is no limit on the reimbursements we make to DCP Midstream, LLC under the Services Agreement for other expenses and expenditures incurred or payments made on our behalf.
Operating and maintenance expenses are costs associated with the operation of a specific asset and are primarily comprised of direct labor, ad valorem taxes, repairs and maintenance, lease expenses, utilities and contract services. These expenses fluctuate depending on the activities performed during a specific period.
76
General and administrative expense represents costs incurred to manage the business. This expense includes cost of centralized corporate functions performed by DCP Midstream, LLC, including legal, accounting, cash management, insurance administration and claims processing, risk management, health, safety and environmental, information technology, human resources, credit, payroll and engineering and all other expenses necessary or appropriate to the conduct of the business.
We also incurred third party general and administrative expenses, which were primarily related to compensation and benefit expenses of the personnel who provide direct support to our operations. Also included are expenses associated with annual and quarterly reports to unitholders, tax return and Schedule K-1 preparation and distribution, independent auditor fees, due diligence and acquisition costs, costs associated with the Sarbanes-Oxley Act of 2002, investor relations activities, registrar and transfer agent fees, incremental director and officer liability insurance costs, and director compensation.
77
Critical Accounting Policies and Estimates
Our financial statements reflect the selection and application of accounting policies that require management to make estimates and assumptions. We believe that the following are the more critical judgment areas in the application of our accounting policies that currently affect our financial condition and results of operations. These accounting policies are described further in Note 2 of the Notes to Consolidated Financial Statements in Item 8. "Financial Statements and Supplementary Data."
Description | Judgments and Uncertainties | Effect if Actual Results Differ from Assumptions | ||
Impairment of Goodwill | ||||
We evaluate goodwill for impairment annually in the third quarter, and whenever events or changes in circumstances indicate it is more likely than not that the fair value of a reporting unit is less than its carrying amount. | We determine fair value using widely accepted valuation techniques, namely discounted cash flow and market multiple analyses. These techniques are also used when assigning the purchase price to acquired assets and liabilities. These types of analyses require us to make assumptions and estimates regarding industry and economic factors and the profitability of future business strategies. It is our policy to conduct impairment testing based on our current business strategy in light of present industry and economic conditions, as well as future expectations. | We primarily use a discounted cash flow analysis, supplemented by a market approach analysis, to perform the assessment. Key assumptions in the analysis include the use of an appropriate discount rate, terminal year multiples, and estimated future cash flows including an estimate of operating and general and administrative costs. In estimating cash flows, we incorporate current market information (including forecasted commodity prices and volumes), as well as historical and other factors. If our assumptions are not appropriate, or future events indicate that our goodwill is impaired, our net income would be impacted by the amount by which the carrying value exceeds the fair value of the reporting unit, to the extent of the balance of goodwill. Two of the three reporting units that contain goodwill are not significantly impacted by the prices of commodities. Rather, they are volume based businesses that have the potential to be impacted by commodity prices should such prices remain depressed for a period of such duration that NGLs cease to be produced at levels requiring storage and distribution to end users. The fair value of goodwill substantially exceeded its carrying value in our North reporting unit, the only reporting unit allocated goodwill included within our Gathering and Processing reportable segment and in our Marysville reporting unit included within our Logistics and Marketing reportable segment. For our Wholesale Propane reporting unit, which is included in our Logistics and Marketing reportable segment, the fair value exceeded the carrying value (including approximately $37 million of allocated goodwill) by approximately 5%. We did not record any goodwill impairment during the year ended December 31, 2017. | ||
78
Description | Judgments and Uncertainties | Effect if Actual Results Differ from Assumptions | ||
Impairment of Long-Lived Assets | ||||
We periodically evaluate whether the carrying value of long-lived assets has been impaired when circumstances indicate the carrying value of those assets may not be recoverable. For purposes of this evaluation, long-lived assets with recovery periods in excess of the weighted average remaining useful life of our fixed assets are further analyzed to determine if a triggering event occurred. If it is determined that a triggering event has occurred, we prepare a quantitative evaluation based on undiscounted cash flow projections expected to be realized over the remaining useful life of the primary asset. The carrying amount is not recoverable if it exceeds the sum of undiscounted cash flows expected to result from the use and eventual disposition of the asset. If the carrying value is not recoverable, the impairment loss is measured as the excess of the asset’s carrying value over its fair value. | Our impairment analyses require management to apply judgment in estimating future cash flows as well as asset fair values, including forecasting useful lives of the assets, future commodity prices, volumes, and operating costs, and selecting the discount rate that reflects the risk inherent in future cash flows. If the carrying value is not recoverable, we assess the fair value of long-lived assets using commonly accepted techniques, and may use more than one method, including, but not limited to, recent third party comparable sales and discounted cash flow models. | Using the impairment review methodology described herein, we recorded a $47 million impairment charge on long-lived assets during the year ended December 31, 2017 when it was determined that the carrying value of an asset group was not recoverable. If actual results are not consistent with our assumptions and estimates or our assumptions and estimates change due to new information, we may be exposed to additional impairment charges. If our forecast indicates lower commodity prices in future periods at a level and duration that results in producers curtailing or redirecting drilling in areas where we operate this may adversely affect our estimate of future operating results, which could result in future impairment due to the potential impact on our operations and cash flows. | ||
Impairment of Investments in Unconsolidated Affiliates | ||||
We evaluate our investments in unconsolidated affiliates for impairment whenever events or changes in circumstances indicate, in management’s judgment, that the carrying value of such investment may have experienced a decline in value. When evidence of loss in value has occurred, we compare the estimated fair value of the investment to the carrying value of the investment to determine whether an impairment has occurred. We would then evaluate if the impairment is other than temporary. | Our impairment analyses require management to apply judgment in estimating future cash flows and asset fair values, including forecasting useful lives of the assets, assessing the probability of differing estimated outcomes, and selecting the discount rate that reflects the risk inherent in future cash flows. When there is evidence of an other than temporary loss in value, we assess the fair value of our unconsolidated affiliates using commonly accepted techniques, and may use more than one method, including, but not limited to, recent third party comparable sales and discounted cash flow models. | Using the impairment review methodology described herein, we have not recorded any significant impairment charges on investments in unconsolidated affiliates during the year ended December 31, 2017. If the estimated fair value of our unconsolidated affiliates is less than the carrying value, we would recognize an impairment loss for the excess of the carrying value over the estimated fair value only if the loss is other than temporary. A period of lower commodity prices may adversely affect our estimate of future operating results, which could result in future impairment due to the potential impact on the investee's operations and cash flows. | ||
79
Description | Judgments and Uncertainties | Effect if Actual Results Differ from Assumptions | ||
Accounting for Risk Management Activities and Financial Instruments | ||||
Each derivative not qualifying for the normal purchases and normal sales exception is recorded on a gross basis in the consolidated balance sheets at its fair value as unrealized gains or unrealized losses on derivative instruments. Derivative assets and liabilities remain classified in our consolidated balance sheets as unrealized gains or unrealized losses on derivative instruments at fair value until the end of the contractual settlement period. Values are adjusted to reflect the credit risk inherent in the transaction as well as the potential impact of liquidating open positions in an orderly manner over a reasonable time period under current conditions. | When available, quoted market prices or prices obtained through external sources are used to determine a contract’s fair value. For contracts with a delivery location or duration for which quoted market prices are not available, fair value is determined based on pricing models developed primarily from historical information and the expected relationship with quoted market prices. | If our estimates of fair value are inaccurate, we may be exposed to losses or gains that could be material. A 10% difference in our estimated fair value of derivatives at December 31, 2017 would have affected net income by approximately $1 million based on our net derivative position for the year ended December 31, 2017. | ||
Item 7A. Quantitative and Qualitative Disclosures about Market Risk
Market risk is the risk of loss arising from adverse changes in market prices and rates. We are exposed to market risks, including changes in commodity prices and interest rates. We may use financial instruments such as forward contracts, swaps and futures to mitigate a portion of the effects of identified risks. In general, we attempt to mitigate a portion of the risks related to the variability of future earnings and cash flows resulting from changes in applicable commodity prices or interest rates so that we can maintain cash flows sufficient to meet debt service, required capital expenditures, distribution objectives and similar requirements.
Risk Management Policy
We have established a comprehensive risk management policy, or Risk Management Policy, and a risk management committee, or the Risk Management Committee, to monitor and manage market risks associated with commodity prices and counterparty credit. Our Risk Management Committee is composed of senior executives who receive regular briefings on positions and exposures, credit exposures and overall risk management in the context of market activities. The Risk Management Committee is responsible for the overall management of commodity price risk and counterparty credit risk, including monitoring exposure limits.
See Note 13, Risk Management and Hedging Activities, of the Notes to Consolidated Financial Statements in Item 8. “Financial Statements and Supplementary Data” for further discussion of the accounting for derivative contracts.
80
Commodity Price Risk
We are exposed to the impact of market fluctuations in the prices of natural gas, NGLs and condensate as a result of our gathering, processing, sales and storage activities. For gathering services, we receive fees or commodities from producers to bring the natural gas from the wellhead to the processing plant. For processing and storage services, we either receive fees or commodities as payment for these services, depending on the types of contracts. We employ established policies and procedures to manage our risks associated with these market fluctuations using various commodity derivatives, including forward contracts, swaps and futures.
Commodity Cash Flow Protection Activities - We closely monitor the risks associated with commodity price changes on our future operations and, where appropriate, use various fixed price swaps arrangements to mitigate a portion of the effect pricing fluctuations may have on the value of our assets and operations. Depending on our risk management objectives, we may periodically settle a portion of these instruments prior to their maturity.
We enter into derivative financial instruments to mitigate a portion of the risk of weakening natural gas, NGL and condensate prices associated with our gathering, processing and sales activities, thereby stabilizing our cash flows. Our commodity derivative instruments used for our hedging program are a combination of direct NGL product, crude oil, and natural gas hedges.
Commodity prices experienced significant volatility during 2017, as illustrated in Item 1A. Risk Factors - “Our cash flow is affected by natural gas, NGL and condensate prices.” A decline in commodity prices has resulted in a decrease in exploration and development activities in certain fields served by our gas gathering and residue gas and NGL pipeline transportation systems, and our natural gas processing and treating plants, which could lead to further reduced utilization of these assets.
The derivative financial instruments we have entered into are typically referred to as “swap” contracts. The swap contracts entitle us to receive payment at settlement from the counterparty to the contract to the extent that the reference price is below the swap price stated in the contract, and we are required to make payment at settlement to the counterparty to the extent that the reference price is higher than the swap price stated in the contract.
We use the mark-to-market method of accounting for all commodity cash flow protection activities, which has significantly increased the volatility of our results of operations as we recognize, in current earnings, all non-cash gains and losses from the mark-to-market on derivative activity.
The following tables set forth additional information about our fixed price swaps used to mitigate a portion of our natural gas and NGL price risk associated with our percent-of-proceeds arrangements and our condensate price risk associated with our gathering and processing operations. Our positions as of February 22, 2018 were as follows:
Commodity Swaps
Period | Commodity | Notional Volume - Short Positions | Reference Price | Price Range | ||||
January 2018 — March 2018 | Natural Gas | (37,500) MMBtu/d | NYMEX Final Settlement Price (b) | $3.30-$3.68/MMBtu | ||||
January 2018 — December 2018 | NGLs | (16,080) Bbls/d (d) | Mt.Belvieu (c) | $.29-$.96/Gal | ||||
January 2018 — December 2018 | Crude Oil | (7,751) Bbls/d (d) | NYMEX crude oil futures (a) | $51.20-$66.00/Bbl | ||||
January 2019 — February 2019 | Crude Oil | (6,249) Bbls/d (d) | NYMEX crude oil futures (a) | $51.26-$61.51/Bbl | ||||
(a) | Monthly average of the daily close prices for the prompt month NYMEX light, sweet crude oil futures contract. |
(b) | NYMEX final settlement price for natural gas futures contracts. |
(c) | The average monthly OPIS price for Mt. Belvieu TET/Non-TET. |
(d) | Average Bbls/d per time period. |
Our sensitivities for 2018 as shown in the table below are estimated based on our average estimated commodity price exposure and commodity cash flow protection activities for the calendar year 2018, and exclude the impact of non-cash mark-to-market changes on our commodity derivatives. We utilize direct product crude oil, natural gas and NGL derivatives to mitigate a portion of our condensate, natural gas and NGL commodity price exposure. These sensitivities are associated with our condensate, natural gas and NGL volumes that are currently unhedged.
81
Commodity Sensitivities Net of Cash Flow Protection Activities
Per Unit Decrease | Unit of Measurement | Estimated Decrease in Annual Net Income Attributable to Partners | |||||||
(millions) | |||||||||
Natural gas prices | $ | 0.10 | MMBtu | $ | 8 | ||||
Crude oil prices | $ | 1.00 | Barrel | $ | 2 | ||||
NGL prices | $ | 0.01 | Gallon | $ | 4 | ||||
In addition to the linear relationships in our commodity sensitivities above, additional factors may cause us to be less sensitive to commodity price declines. A portion of our net income is derived from fee-based contracts and a portion from percentage-of-proceeds and percentage-of-liquids processing arrangements that contain minimum fee clauses in which our processing margins convert to fee-based arrangements as commodity prices decline.
The above sensitivities exclude the impact from arrangements where producers on a monthly basis may elect to not process their natural gas in which case we retain a portion of the customers’ natural gas in lieu of NGLs as a fee. The above sensitivities also exclude certain related processing arrangements where we control the processing or by-pass of the production based upon individual economic processing conditions. Under each of these types of arrangements, our processing of the natural gas would yield favorable processing margins.
We estimate the following sensitivities related to the non-cash mark-to-market on our commodity derivatives associated with our open position on our commodity cash flow protection activities:
Non-Cash Mark-To-Market Commodity Sensitivities
Per Unit Increase | Unit of Measurement | Estimated Mark-to- Market Impact (Decrease in Net Income Attributable to Partners) | |||||||
(millions) | |||||||||
Natural gas prices | $ | 0.10 | MMBtu | $ | — | ||||
Crude oil prices | $ | 1.00 | Barrel | $ | 3 | ||||
NGL prices | $ | 0.01 | Gallon | $ | 3 | ||||
While the above commodity price sensitivities are indicative of the impact that changes in commodity prices may have on our annualized net income, changes during certain periods of extreme price volatility and market conditions or changes in the relationship of the price of NGLs and crude oil may cause our commodity price sensitivities to vary significantly from these estimates.
The midstream natural gas industry is cyclical, with the operating results of companies in the industry significantly affected by the prevailing price of NGLs, which in turn has been generally related to the price of crude oil. Although the prevailing price of residue natural gas has less short-term significance to our operating results than the price of NGLs, in the long-term the growth and sustainability of our business depends on natural gas prices being at levels sufficient to provide incentives and capital for producers to increase natural gas exploration and production. To minimize potential future commodity-based pricing and cash flow volatility, we have entered into a series of derivative financial instruments. As a result of these transactions, we have mitigated a portion of our expected commodity price risk relating to the equity volumes associated with our gathering and processing activities through the first quarter of 2019.
Based on historical trends, we generally expect NGL prices to directionally follow changes in crude oil prices over the long-term. However, the pricing relationship between NGLs and crude oil may vary, as we believe crude oil prices will in large part be determined by the level of production from major crude oil exporting countries and the demand generated by growth in the world economy, whereas NGL prices are more correlated to supply and U.S. petrochemical demand. However, the level of
82
NGL exports has increased in recent years. We believe that future natural gas prices will be influenced by the severity of winter and summer weather, the level of North American production and drilling activity of exploration and production companies and the balance of trade between imports and exports of liquid natural gas and NGLs. Drilling activity can be adversely affected as natural gas prices decrease. Energy market uncertainty could also reduce North American drilling activity. Limited access to capital could also decrease drilling. Lower drilling levels over a sustained period would reduce natural gas volumes gathered and processed, but could increase commodity prices, if supply were to fall relative to demand levels.
Natural Gas Storage and Pipeline Asset Based Commodity Derivative Program — Our natural gas storage and pipeline assets are exposed to certain risks including changes in commodity prices. We manage commodity price risk related to our natural gas storage and pipeline assets through our commodity derivative program. The commercial activities related to our natural gas storage and pipeline assets primarily consist of the purchase and sale of gas and associated time spreads and basis spreads.
A time spread transaction is executed by establishing a long gas position at one point in time and establishing an equal short gas position at a different point in time. Time spread transactions allow us to lock in a margin supported by the injection, withdrawal, and storage capacity of our natural gas storage assets. We may execute basis spread transactions to mitigate the risk of sale and purchase price differentials across our system. A basis spread transaction allows us to lock in a margin on our physical purchases and sales of gas, including injections and withdrawals from storage. We typically use swaps to execute these transactions, which are not designated as hedging instruments and are recorded at fair value with changes in fair value recorded in the current period consolidated statements of operations. While gas held in our storage locations is recorded at the lower of average cost or market, the derivative instruments that are used to manage our storage facilities are recorded at fair value and any changes in fair value are currently recorded in our consolidated statements of operations. Even though we may have economically hedged our exposure and locked in a future margin, the use of lower-of-cost-or-market accounting for our physical inventory and the use of mark-to-market accounting for our derivative instruments may subject our earnings to market volatility.
The following tables set forth additional information about our derivative instruments, used to mitigate a portion of our natural gas price risk associated with our inventory within our natural gas storage operations as of December 31, 2017:
Inventory
Period ended | Commodity | Notional Volume - Long Positions | Fair Value (millions) | Weighted Average Price | |||||||||
December 31, 2017 | Natural Gas | 11,163,515 | MMBtu | $ | 30 | $2.66/MMBtu | |||||||
Commodity Swaps
Period | Commodity | Notional Volume - (Short)/Long Positions | Fair Value (millions) | Price Range | |||||||||
January 2018-December 2018 | Natural Gas | (28,427,500 | ) | MMBtu | $ | 5 | $2.64-$3.58/MMBtu | ||||||
January 2018-December 2018 | Natural Gas | 17,605,000 | MMBtu | $ | — | $2.63-$3.22/MMBtu | |||||||
Our wholesale propane logistics business is generally designed to establish stable margins by entering into supply arrangements that specify prices based on established floating price indices and by entering into sales agreements that provide for floating prices that are tied to our variable supply costs plus a margin. Occasionally, we may enter into fixed price sales agreements in the event that a propane distributor desires to purchase propane from us on a fixed price basis. We manage this risk with both physical and financial transactions, sometimes using non-trading derivative instruments, which generally allow us to swap our fixed price risk to market index prices that are matched to our market index supply costs. In addition, we may on occasion use financial derivatives to manage the value of our propane inventories.
We manage our commodity derivative activities in accordance with our Risk Management Policy which limits exposure to market risk and requires regular reporting to management of potential financial exposure.
Valuation - Valuation of a contract’s fair value is validated by an internal group independent of the marketing group. While common industry practices are used to develop valuation techniques, changes in pricing methodologies or the underlying
83
assumptions could result in significantly different fair values and income recognition. When available, quoted market prices or prices obtained through external sources are used to determine a contract’s fair value. For contracts with a delivery location or duration for which quoted market prices are not available, fair value is determined based on pricing models developed primarily from historical and expected relationships with quoted market prices.
Values are adjusted to reflect the credit risk inherent in the transaction as well as the potential impact of liquidating open positions in an orderly manner over a reasonable time period under current conditions. Changes in market prices and management estimates directly affect the estimated fair value of these contracts. Accordingly, it is reasonably possible that such estimates may change in the near term.
The fair value of our commodity non-trading derivatives is expected to be realized in future periods, as detailed in the following table. The amount of cash ultimately realized for these contracts will differ from the amounts shown in the following table due to factors such as market volatility, counterparty default and other unforeseen events that could impact the amount and/or realization of these values.
Fair Value of Contracts as of December 31, 2017 | ||||||||
Sources of Fair Value | Total | Maturity in 2018 | ||||||
(millions) | ||||||||
Prices supported by quoted market prices and other external sources | $ | (48 | ) | $ | (36 | ) | ||
Prices based on models or other valuation techniques | (10 | ) | (11 | ) | ||||
Total | $ | (58 | ) | $ | (47 | ) | ||
The “prices supported by quoted market prices and other external sources” category includes our commodity positions in natural gas, NGLs and crude oil. In addition, this category includes our forward positions in natural gas for which our forward price curves are obtained from a third party pricing service and then validated through an internal process which includes the use of independent broker quotes. This category also includes our forward positions in NGLs at points for which over-the-counter, or OTC, broker quotes for similar assets or liabilities are available for the full term of the instrument. This category also includes “strip” transactions whose pricing inputs are directly or indirectly observable from external sources and then modeled to daily or monthly prices as appropriate.
The “prices based on models and other valuation techniques” category includes the value of transactions for which inputs to the fair value of the instrument are unobservable in the marketplace and are considered significant to the overall fair value of the instrument. The fair value of these instruments may be based upon an internally developed price curve, which was constructed as a result of the long dated nature of the transaction or the illiquidity of the market point.
Credit Risk
Our customers include large multi-national petrochemical and refining companies, natural gas marketers, as well as commodity producers. Substantially all of our natural gas, propane and NGL sales are made at market-based prices. This concentration of credit risk may affect our overall credit risk, as these customers may be similarly affected by changes in economic, regulatory or other factors. Where exposed to credit risk, we analyze the counterparties’ financial condition prior to entering into an agreement, establish credit limits, and monitor the appropriateness of these limits on an ongoing basis. Our corporate credit policy, as well as the standard terms and conditions of our agreements, prescribe the use of financial responsibility and reasonable grounds for adequate assurances. These provisions allow our credit department to request that a counterparty remedy credit limit violations by posting cash or letters of credit for exposure in excess of an established credit line. The credit line represents an open credit limit, determined in accordance with our credit policy. Our standard agreements also provide that the inability of a counterparty to post collateral is sufficient cause to terminate a contract and liquidate all positions. The adequate assurance provisions also allow us to suspend deliveries, cancel agreements or continue deliveries to the buyer after the buyer provides security for payment to us in a satisfactory form.
84
Interest Rate Risk
Interest rates on future Credit Agreement draws and debt offerings could be higher than current levels, causing our financing costs to increase accordingly. Although this could limit our ability to raise funds in the debt capital markets, we expect to remain competitive with respect to acquisitions and capital projects, as our competitors would face similar circumstances. We may mitigate a portion of our future interest rate risk with interest rate swaps that reduce our exposure to market rate fluctuations by converting variable interest rates on our debt to fixed interest rates and locking in rates on our anticipated future fixed-rate debt, respectively.
At December 31, 2017, the effective weighted-average interest rate on our outstanding debt was 5.80%.
85
Item 8. Financial Statements and Supplementary Data
INDEX TO FINANCIAL STATEMENTS
DCP MIDSTREAM, LP CONSOLIDATED FINANCIAL STATEMENTS: | |
Report of Independent Registered Public Accounting Firm | |
Consolidated Balance Sheets as of December 31, 2017 and 2016 | |
Consolidated Statements of Operations for the years ended December 31, 2017, 2016 and 2015 | |
Consolidated Statements of Comprehensive Income (Loss) for the years ended December 31, 2017, 2016 and 2015 | |
Consolidated Statements of Changes in Equity for the years ended December 31, 2017, 2016 and 2015 | |
Consolidated Statements of Cash Flows for the years ended December 31, 2017, 2016 and 2015 | |
Notes to Consolidated Financial Statements | |
86
REPORT OF INDEPENDENT REGISTERED PUBLIC ACCOUNTING FIRM
To the Board of Directors of
DCP Midstream GP, LLC
Denver, Colorado
Opinion on the Financial Statements
We have audited the accompanying consolidated balance sheets of DCP Midstream, LP and subsidiaries (the "Partnership") as of December 31, 2017 and 2016, the related consolidated statements of operations, comprehensive income (loss), changes in equity, and cash flows for each of the three years in the period ended December 31, 2017, and the related notes (collectively referred to as the financial statements). In our opinion, based on our audits and the report of the other auditors, the financial statements present fairly, in all material respects, the financial position of the Partnership as of December 31, 2017 and 2016, and the results of its operations and its cash flows for each of the three years in the period ended December 31, 2017, in conformity with accounting principles generally accepted in the United States of America.
We did not audit the financial statements of Discovery Producer Services, LLC (Discovery), the Partnership’s investment which is accounted for by the use of the equity method. The accompanying consolidated financial statements of the Partnership include its equity investment in Discovery of $362 million and $385 million as of December 31, 2017 and 2016, respectively, and its equity earnings in Discovery of $61 million, $73 million and $54 million for the years ended December 31, 2017, 2016, and 2015, respectively. Those statements were audited by other auditors whose report has been furnished to us, and our opinion, insofar as it relates to the amounts included for Discovery, is based solely on the report of the other auditors.
We have also audited, in accordance with the standards of the Public Company Accounting Oversight Board (United States) (PCAOB), the Partnership’s internal control over financial reporting as of December 31, 2017, based on the criteria established in the Internal Control - Integrated Framework (2013) issued by the Committee of Sponsoring Organizations of the Treadway Commission and our report dated February 26, 2018, expressed an unqualified opinion on the Partnership’s internal control over financial reporting based on our audit.
Basis for Opinion
These financial statements are the responsibility of the Partnership’s management. Our responsibility is to express an opinion on the Partnership’s financial statements based on our audits. We are a public accounting firm registered with the PCAOB and are required to be independent with respect to the Partnership in accordance with the U.S. federal securities laws and the applicable rules and regulations of the Securities and Exchange Commission and the PCAOB.
We conducted our audits in accordance with the standards of the PCAOB. Those standards require that we plan and perform the audit to obtain reasonable assurance about whether the financial statements are free of material misstatement, whether due to error or fraud. Our audits included performing procedures to assess the risks of material misstatement, whether due to error of fraud, and performing procedures that respond to those risks. Such procedures included examining, on a test basis, evidence regarding the amounts and disclosures in the financial statements. Our audits also included evaluating the accounting principles used and significant estimates made by management, as well as evaluating the overall presentation of the financial statements. We believe that our audits provide a reasonable basis for our opinion.
/s/ Deloitte & Touche LLP
Denver, Colorado
February 26, 2018
We have served as the Partnership’s auditor since 2004.
87
DCP MIDSTREAM, LP
CONSOLIDATED BALANCE SHEETS
December 31, 2017 | December 31, 2016 | ||||||
(millions) | |||||||
ASSETS | |||||||
Current assets: | |||||||
Cash and cash equivalents | $ | 156 | $ | 1 | |||
Accounts receivable: | |||||||
Trade, net of allowance for doubtful accounts of $8 and $4 million, respectively | 773 | 652 | |||||
Affiliates | 191 | 134 | |||||
Other | 17 | 6 | |||||
Inventories | 68 | 72 | |||||
Unrealized gains on derivative instruments | 30 | 42 | |||||
Collateral cash deposits | 75 | 71 | |||||
Other | 12 | 16 | |||||
Total current assets | 1,322 | 994 | |||||
Property, plant and equipment, net | 8,983 | 9,069 | |||||
Goodwill | 231 | 236 | |||||
Intangible assets, net | 106 | 137 | |||||
Investments in unconsolidated affiliates | 3,050 | 2,969 | |||||
Unrealized gains on derivative instruments | 3 | 5 | |||||
Other long-term assets | 183 | 201 | |||||
Total assets | $ | 13,878 | $ | 13,611 | |||
LIABILITIES AND EQUITY | |||||||
Current liabilities: | |||||||
Accounts payable: | |||||||
Trade | $ | 989 | $ | 677 | |||
Affiliates | 68 | 48 | |||||
Other | 19 | 10 | |||||
Current maturities of long-term debt | — | 500 | |||||
Unrealized losses on derivative instruments | 76 | 91 | |||||
Accrued interest | 71 | 72 | |||||
Accrued taxes | 58 | 49 | |||||
Accrued wages and benefits | 65 | 72 | |||||
Capital spending accrual | 39 | 20 | |||||
Other | 103 | 84 | |||||
Total current liabilities | 1,488 | 1,623 | |||||
Long-term debt | 4,707 | 4,907 | |||||
Unrealized losses on derivative instruments | 15 | 1 | |||||
Deferred income taxes | 29 | 28 | |||||
Other long-term liabilities | 201 | 199 | |||||
Total liabilities | 6,440 | 6,758 | |||||
Commitments and contingent liabilities | |||||||
Equity: | |||||||
Predecessor equity | — | 4,220 | |||||
Limited partners (143,309,828 and 114,749,848 common units authorized, issued and outstanding, respectively) | 6,772 | 2,591 | |||||
Series A preferred limited partners (500,000 preferred units authorized, issued and outstanding, respectively) | 491 | — | |||||
General partner | 154 | 18 | |||||
Accumulated other comprehensive loss | (9 | ) | (8 | ) | |||
Total partners’ equity | 7,408 | 6,821 | |||||
Noncontrolling interests | 30 | 32 | |||||
Total equity | 7,438 | 6,853 | |||||
Total liabilities and equity | $ | 13,878 | $ | 13,611 | |||
See accompanying notes to consolidated financial statements.
88
DCP MIDSTREAM, LP
CONSOLIDATED STATEMENTS OF OPERATIONS
Year Ended December 31, | ||||||||||||
2017 | 2016 | 2015 | ||||||||||
(millions, except per unit amounts) | ||||||||||||
Operating revenues: | ||||||||||||
Sales of natural gas, NGLs and condensate | $ | 6,576 | $ | 5,317 | $ | 6,014 | ||||||
Sales of natural gas, NGLs and condensate to affiliates | 1,274 | 952 | 765 | |||||||||
Transportation, processing and other | 652 | 647 | 532 | |||||||||
Trading and marketing (losses) gains, net | (40 | ) | (23 | ) | 119 | |||||||
Total operating revenues | 8,462 | 6,893 | 7,430 | |||||||||
Operating costs and expenses: | ||||||||||||
Purchases and related costs | 6,308 | 4,978 | 5,563 | |||||||||
Purchases and related costs from affiliates | 577 | 483 | 418 | |||||||||
Operating and maintenance expense | 661 | 670 | 732 | |||||||||
Depreciation and amortization expense | 379 | 378 | 377 | |||||||||
General and administrative expense | 290 | 292 | 281 | |||||||||
Asset impairments | 48 | — | 912 | |||||||||
Other expense (income), net | 11 | (65 | ) | 10 | ||||||||
Gain on sale of assets, net | (34 | ) | (35 | ) | (42 | ) | ||||||
Restructuring costs | — | 13 | 11 | |||||||||
Total operating costs and expenses | 8,240 | 6,714 | 8,262 | |||||||||
Operating income (loss) | 222 | 179 | (832 | ) | ||||||||
Earnings from unconsolidated affiliates | 303 | 282 | 184 | |||||||||
Interest expense, net | (289 | ) | (321 | ) | (320 | ) | ||||||
Income (loss) before income taxes | 236 | 140 | (968 | ) | ||||||||
Income tax (expense) benefit | (2 | ) | (46 | ) | 102 | |||||||
Net income (loss) | 234 | 94 | (866 | ) | ||||||||
Net income attributable to noncontrolling interests | (5 | ) | (6 | ) | (5 | ) | ||||||
Net income (loss) attributable to partners | 229 | 88 | (871 | ) | ||||||||
Net loss attributable to predecessor operations | — | 224 | 1,099 | |||||||||
General partner’s interest in net income | (164 | ) | (124 | ) | (124 | ) | ||||||
Series A preferred limited partners' interest in net income | (4 | ) | — | — | ||||||||
Net income allocable to limited partners | $ | 61 | $ | 188 | $ | 104 | ||||||
Net income per limited partner unit — basic and diluted | $ | 0.43 | $ | 1.64 | $ | 0.91 | ||||||
Weighted-average limited partner units outstanding — basic and diluted | 143.3 | 114.7 | 114.6 | |||||||||
See accompanying notes to consolidated financial statements.
89
DCP MIDSTREAM, LP
CONSOLIDATED STATEMENTS OF COMPREHENSIVE INCOME (LOSS)
Year Ended December 31, | ||||||||||||
2017 | 2016 | 2015 | ||||||||||
(millions) | ||||||||||||
Net income (loss) | $ | 234 | $ | 94 | $ | (866 | ) | |||||
Other comprehensive income: | ||||||||||||
Reclassification of cash flow hedge losses into earnings | 1 | — | 1 | |||||||||
Total other comprehensive income | 1 | — | 1 | |||||||||
Total comprehensive income (loss) | 235 | 94 | (865 | ) | ||||||||
Total comprehensive income attributable to noncontrolling interests | (5 | ) | (6 | ) | (5 | ) | ||||||
Total comprehensive income (loss) attributable to partners | $ | 230 | $ | 88 | $ | (870 | ) | |||||
See accompanying notes to consolidated financial statements.
90
DCP MIDSTREAM, LP
CONSOLIDATED STATEMENT OF CHANGES IN EQUITY
Partners’ Equity | |||||||||||||||||||||||||||
Predecessor Equity | Limited Partners | Series A Preferred Limited Partners | General Partner | Accumulated Other Comprehensive (Loss) Income | Noncontrolling Interests | Total Equity | |||||||||||||||||||||
(millions) | |||||||||||||||||||||||||||
Balance, January 1, 2017 | $ | 4,220 | $ | 2,591 | $ | — | $ | 18 | $ | (8 | ) | $ | 32 | $ | 6,853 | ||||||||||||
Net income | — | 61 | 4 | 164 | — | 5 | 234 | ||||||||||||||||||||
Other comprehensive income | — | — | — | — | 1 | — | 1 | ||||||||||||||||||||
Net change in parent advances | — | 418 | — | — | — | — | 418 | ||||||||||||||||||||
Acquisition of the DCP Midstream Business | (4,220 | ) | — | — | — | — | — | (4,220 | ) | ||||||||||||||||||
Deficit purchase price under carrying value of the Transaction | — | 3,094 | — | — | (2 | ) | — | 3,092 | |||||||||||||||||||
Issuance of 28,552,480 common units and 2,550,644 general partner units to DCP Midstream, LLC and affiliates | — | 1,033 | — | 92 | — | — | 1,125 | ||||||||||||||||||||
Issuance of 500,000 Series A Preferred Units | — | — | 487 | — | — | — | 487 | ||||||||||||||||||||
Distributions to limited partners and general partner | — | (425 | ) | — | (120 | ) | — | — | (545 | ) | |||||||||||||||||
Distributions to noncontrolling interests | — | — | — | — | — | (7 | ) | (7 | ) | ||||||||||||||||||
Balance, December 31, 2017 | $ | — | $ | 6,772 | $ | 491 | $ | 154 | $ | (9 | ) | $ | 30 | $ | 7,438 | ||||||||||||
See accompanying notes to consolidated financial statements.
91
DCP MIDSTREAM, LP
CONSOLIDATED STATEMENT OF CHANGES IN EQUITY
Partners’ Equity | |||||||||||||||||||||||
Predecessor Equity | Limited Partners | General Partner | Accumulated Other Comprehensive Loss | Noncontrolling Interests | Total Equity | ||||||||||||||||||
(millions) | |||||||||||||||||||||||
Balance, January 1, 2016 | $ | 4,287 | $ | 2,762 | $ | 18 | $ | (8 | ) | $ | 33 | $ | 7,092 | ||||||||||
Net (loss) income | (224 | ) | 188 | 124 | — | 6 | 94 | ||||||||||||||||
Net change in parent advances | 157 | — | — | — | — | 157 | |||||||||||||||||
Distributions to limited partners and general partner | — | (359 | ) | (124 | ) | — | — | (483 | ) | ||||||||||||||
Distributions to noncontrolling interests | — | — | — | — | (7 | ) | (7 | ) | |||||||||||||||
Balance, December 31, 2016 | $ | 4,220 | $ | 2,591 | $ | 18 | $ | (8 | ) | $ | 32 | $ | 6,853 | ||||||||||
Partners’ Equity | |||||||||||||||||||||||
Predecessor Equity | Limited Partners | General Partner | Accumulated Other Comprehensive (Loss) Income | Noncontrolling Interests | Total Equity | ||||||||||||||||||
(millions) | |||||||||||||||||||||||
Balance, January 1, 2015 | $ | 2,189 | $ | 2,984 | $ | 18 | $ | (9 | ) | $ | 33 | $ | 5,215 | ||||||||||
Net (loss) income | (1,099 | ) | 104 | 124 | — | 5 | (866 | ) | |||||||||||||||
Other comprehensive income | — | — | — | 1 | — | 1 | |||||||||||||||||
Net change in parent advances | 3,197 | — | — | — | — | 3,197 | |||||||||||||||||
Issuance of 793,080 common units to the public | — | 31 | — | — | — | 31 | |||||||||||||||||
Distributions to limited partners and general partner | — | (358 | ) | (124 | ) | — | — | (482 | ) | ||||||||||||||
Distributions to noncontrolling interests | — | — | — | — | (5 | ) | (5 | ) | |||||||||||||||
Contributions from DCP Midstream, LLC | — | 1 | — | — | — | 1 | |||||||||||||||||
Balance, December 31, 2015 | $ | 4,287 | $ | 2,762 | $ | 18 | $ | (8 | ) | $ | 33 | $ | 7,092 | ||||||||||
See accompanying notes to consolidated financial statements.
92
DCP MIDSTREAM, LP
CONSOLIDATED STATEMENTS OF CASH FLOWS
Year Ended December 31, | |||||||||||
2017 | 2016 | 2015 | |||||||||
(millions) | |||||||||||
OPERATING ACTIVITIES: | |||||||||||
Net income (loss) | $ | 234 | $ | 94 | $ | (866 | ) | ||||
Adjustments to reconcile net income (loss) to net cash provided by operating activities: | |||||||||||
Depreciation and amortization expense | 379 | 378 | 377 | ||||||||
Earnings from unconsolidated affiliates | (303 | ) | (282 | ) | (184 | ) | |||||
Distributions from unconsolidated affiliates | 367 | 356 | 217 | ||||||||
Net unrealized losses (gains) on derivative instruments | 28 | 139 | (46 | ) | |||||||
Gain on sale of assets, net | (34 | ) | (35 | ) | (42 | ) | |||||
Asset impairments | 48 | — | 912 | ||||||||
Other, net | 32 | 68 | (68 | ) | |||||||
Change in operating assets and liabilities, which provided (used) cash, net of effects of acquisitions: | |||||||||||
Accounts receivable | (194 | ) | (247 | ) | 479 | ||||||
Inventories | 4 | (21 | ) | 29 | |||||||
Accounts payable | 328 | 199 | (381 | ) | |||||||
Other assets and liabilities | 7 | (4 | ) | 15 | |||||||
Net cash provided by operating activities | 896 | 645 | 442 | ||||||||
INVESTING ACTIVITIES: | |||||||||||
Capital expenditures | (375 | ) | (144 | ) | (811 | ) | |||||
Investments in unconsolidated affiliates, net | (148 | ) | (53 | ) | (64 | ) | |||||
Proceeds from sale of assets | 132 | 163 | 164 | ||||||||
Net cash used in investing activities | (391 | ) | (34 | ) | (711 | ) | |||||
FINANCING ACTIVITIES: | |||||||||||
Proceeds from long-term debt | 116 | 3,353 | 7,216 | ||||||||
Payments of long-term debt | (811 | ) | (3,628 | ) | (7,196 | ) | |||||
Payments of commercial paper, net | — | — | (1,012 | ) | |||||||
Proceeds from issuance of common units, net of offering costs | — | — | 31 | ||||||||
Proceeds from issuance of Series A preferred limited partner units, net of offering costs | 487 | — | — | ||||||||
Net change in advances to predecessor from DCP Midstream, LLC | 418 | 157 | 1,697 | ||||||||
Distributions to limited partners and general partner | (545 | ) | (483 | ) | (482 | ) | |||||
Distributions to noncontrolling interests | (7 | ) | (7 | ) | (5 | ) | |||||
Other | (8 | ) | (5 | ) | (4 | ) | |||||
Net cash (used in) provided by financing activities | (350 | ) | (613 | ) | 245 | ||||||
Net change in cash and cash equivalents | 155 | (2 | ) | (24 | ) | ||||||
Cash and cash equivalents, beginning of period | 1 | 3 | 27 | ||||||||
Cash and cash equivalents, end of period | $ | 156 | $ | 1 | $ | 3 | |||||
See accompanying notes to consolidated financial statements.
93
DCP MIDSTREAM, LP
NOTES TO CONSOLIDATED FINANCIAL STATEMENTS
Years Ended December 31, 2017, 2016 and 2015
1. Description of Business and Basis of Presentation
DCP Midstream, LP, with its consolidated subsidiaries, or "us", "we", "our" or the "Partnership" is a Delaware limited partnership formed in 2005 by DCP Midstream, LLC to own, operate, acquire and develop a diversified portfolio of complementary midstream energy assets.
Our Partnership includes our Gathering and Processing and Logistics and Marketing segments. For additional information regarding these segments, see Note 21 - Business Segments.
Our operations and activities are managed by our general partner, DCP Midstream GP, LP, which in turn is managed by its general partner, DCP Midstream GP, LLC, which we refer to as the General Partner, and is 100% owned by DCP Midstream, LLC. DCP Midstream, LLC and its subsidiaries and affiliates, collectively referred to as DCP Midstream, LLC, is owned 50% by Phillips 66 and 50% by Enbridge Inc. and its affiliates, or Enbridge. Spectra Energy Corp owned 50% of DCP Midstream, LLC prior to the completion of its merger with Enbridge in the first quarter of 2017. DCP Midstream, LLC directs our business operations through its ownership and control of the General Partner. As of December 31, 2017, DCP Midstream, LLC owned approximately 38.1% of us, including limited partner and general partner interests.
On December 30, 2016, we entered into a Contribution Agreement (the “Contribution Agreement”) with DCP Midstream, LLC and DCP Midstream Operating, LP (the “Operating Partnership”), a 100% owned subsidiary of the Partnership, which closed effective January 1, 2017. The transactions and documents contemplated by the Contribution Agreement are collectively referred to hereafter as the “Transaction.” Our predecessor results consist of all of the ownership interests of DCP Midstream, LLC in all of its subsidiaries that owned operating assets ("The DCP Midstream Business"), which we acquired from DCP Midstream, LLC on January 1, 2017. This transfer of net assets between entities under common control was accounted for as if the transfer occurred at the beginning of the period, and prior years were retrospectively adjusted to furnish comparative information, similar to the pooling method. Accordingly, our consolidated financial statements include the historical results of The DCP Midstream Business for all periods presented. For additional information regarding the Transaction, see Note 4 - Acquisitions.
The consolidated financial statements include the accounts of the Partnership and all majority-owned subsidiaries where we have the ability to exercise control. Investments in greater than 20% owned affiliates that are not variable interest entities and where we do not have the ability to exercise control, and investments in less than 20% owned affiliates where we have the ability to exercise significant influence, are accounted for using the equity method.
The consolidated financial statements have been prepared in accordance with accounting principles generally accepted in the United States of America, or GAAP. All intercompany balances and transactions have been eliminated in consolidation.
94
DCP MIDSTREAM, LP
NOTES TO CONSOLIDATED FINANCIAL STATEMENTS
Years Ended December 31, 2017, 2016 and 2015 - (Continued)
2. Summary of Significant Accounting Policies
Use of Estimates - Conformity with GAAP requires management to make estimates and assumptions that affect the amounts reported in the consolidated financial statements and notes. Although these estimates are based on management’s best available knowledge of current and expected future events, actual results could differ from those estimates.
Cash and Cash Equivalents - We consider investments in highly liquid financial instruments purchased with an original stated maturity of 90 days or less and temporary investments of cash in short-term money market securities to be cash equivalents.
Allowance for Doubtful Accounts - Management estimates the amount of required allowances for the potential non-collectability of accounts receivable generally based upon the number of days past due, past collection experience and consideration of other relevant factors. However, past experience may not be indicative of future collections and therefore additional charges could be incurred in the future to reflect differences between estimated and actual collections.
Inventories - Inventories, which consist primarily of NGLs and natural gas, are recorded at the lower of weighted-average cost or market value. Transportation costs are included in inventory.
Accounting for Risk Management Activities and Financial Instruments - Non-trading energy commodity derivatives are designated as a hedge of a forecasted transaction or future cash flow (cash flow hedge), a hedge of a recognized asset, liability or firm commitment (fair value hedge), or normal purchases or normal sales. The remaining non-trading derivatives, which are related to asset-based activities for which the normal purchase or normal sale exception is not elected, are recorded at fair value in the consolidated balance sheets as unrealized gains or unrealized losses in derivative instruments, with changes in the fair value recognized in the consolidated statements of operations. For each derivative, the accounting method and presentation of gains and losses or revenue and expense in the consolidated statements of operations are as follows:
Classification of Contract | Accounting Method | Presentation of Gains & Losses or Revenue & Expense |
Trading Derivatives | Mark-to-market method (a) | Net basis in trading and marketing gains and losses |
Non-Trading Derivatives: | ||
Cash Flow Hedge | Hedge method (b) | Gross basis in the same consolidated statements of operations category as the related hedged item |
Fair Value Hedge | Hedge method (b) | Gross basis in the same consolidated statements of operations category as the related hedged item |
Normal Purchases or Normal Sales | Accrual method (c) | Gross basis upon settlement in the corresponding consolidated statements of operations category based on purchase or sale |
Other Non-Trading Derivative Activity | Mark-to-market method (a) | Net basis in trading and marketing gains and losses, net |
(a) | Mark-to-market method - An accounting method whereby the change in the fair value of the asset or liability is recognized in the consolidated statements of operations in trading and marketing gains and losses, net during the current period. |
(b) | Hedge method - An accounting method whereby the change in the fair value of the asset or liability is recorded in the consolidated balance sheets as unrealized gains or unrealized losses on derivative instruments. For cash flow hedges, there is no recognition in the consolidated statements of operations for the effective portion until the service is provided or the associated delivery impacts earnings. For fair value hedges, the change in the fair value of the asset or liability, as well as the offsetting changes in value of the hedged item, are recognized in the consolidated statements of operations in the same category as the related hedged item. |
(c) | Accrual method - An accounting method whereby there is no recognition in the consolidated balance sheets or consolidated statements of operations for changes in fair value of a contract until the service is provided or the associated delivery impacts earnings. |
Cash Flow and Fair Value Hedges - For derivatives designated as a cash flow hedge or a fair value hedge, we maintain formal documentation of the hedge. In addition, we formally assess both at the inception of the hedging relationship and on an
95
DCP MIDSTREAM, LP
NOTES TO CONSOLIDATED FINANCIAL STATEMENTS
Years Ended December 31, 2017, 2016 and 2015 - (Continued)
ongoing basis, whether the hedge contract is highly effective in offsetting changes in cash flows or fair values of hedged items. All components of each derivative gain or loss are included in the assessment of hedge effectiveness, unless otherwise noted.
The fair value of a derivative designated as a cash flow hedge is recorded in the consolidated balance sheets as unrealized gains or unrealized losses on derivative instruments. The change in fair value of the effective portion of a derivative designated as a cash flow hedge is recorded in partners’ equity in accumulated other comprehensive income, or AOCI, and the ineffective portion is recorded in the consolidated statements of operations. During the period in which the hedged transaction impacts earnings, amounts in AOCI associated with the hedged transaction are reclassified to the consolidated statements of operations in the same line item as the item being hedged. Hedge accounting is discontinued prospectively when it is determined that the derivative no longer qualifies as an effective hedge, or when it is probable that the hedged transaction will not occur. When hedge accounting is discontinued because the derivative no longer qualifies as an effective hedge, the derivative is subject to the mark-to-market accounting method prospectively. The derivative continues to be carried on the consolidated balance sheets at its fair value; however, subsequent changes in its fair value are recognized in current period earnings. Gains and losses related to discontinued hedges that were previously accumulated in AOCI will remain in AOCI until the hedged transaction impacts earnings, unless it is probable that the hedged transaction will not occur, in which case, the gains and losses that were previously deferred in AOCI will be immediately recognized in current period earnings.
The fair value of a derivative designated as a fair value hedge is recorded for balance sheet purposes as unrealized gains or unrealized losses on derivative instruments. We recognize the gain or loss on the derivative instrument, as well as the offsetting loss or gain on the hedged item in earnings in the current period. All derivatives designated and accounted for as fair value hedges are classified in the same category as the item being hedged in the results of operations.
Valuation - When available, quoted market prices or prices obtained through external sources are used to determine a contract’s fair value. For contracts with a delivery location or duration for which quoted market prices are not available, fair value is determined based on pricing models developed primarily from historical relationships with quoted market prices and the expected relationship with quoted market prices.
Values are adjusted to reflect the credit risk inherent in the transaction as well as the potential impact of liquidating open positions in an orderly manner over a reasonable time period under current conditions. Changes in market prices and management estimates directly affect the estimated fair value of these contracts. Accordingly, it is reasonably possible that such estimates may change in the near term.
Property, Plant and Equipment - Property, plant and equipment are recorded at historical cost. The cost of maintenance and repairs, which are not significant improvements, are expensed when incurred. Depreciation is computed using the straight-line method over the estimated useful lives of the assets.
Capitalized Interest - We capitalize interest during construction of major projects. Interest is calculated on the monthly outstanding capital balance and ceases in the month that the asset is placed into service. We also capitalize interest on our equity method investments which are devoting substantially all efforts to establishing a new business and have not yet begun planned principal operations. Capitalization ceases when the investee commences planned principal operations. The rates used to calculate capitalized interest are the weighted-average cost of debt, including the impact of interest rate swaps.
Asset Retirement Obligations - Our asset retirement obligations relate primarily to the retirement of various gathering pipelines and processing facilities, obligations related to right-of-way easement agreements, and contractual leases for land use. We adjust our asset retirement obligation each quarter for any liabilities incurred or settled during the period, accretion expense and any revisions made to the estimated cash flows.
Asset retirement obligations associated with tangible long-lived assets are recorded at fair value in the period in which they are incurred, if a reasonable estimate of fair value can be made, and added to the carrying amount of the associated asset. This additional carrying amount is then depreciated over the life of the asset. The liability is determined using a credit-adjusted risk free interest rate, and accretes due to the passage of time based on the time value of money until the obligation is settled.
Goodwill and Intangible Assets - Goodwill is the cost of an acquisition less the fair value of the net assets of the acquired business. We perform an annual impairment test of goodwill at the reporting unit level during the third quarter, and update the test during interim periods when we believe events or changes in circumstances indicate that we may not be able to recover the carrying value of a reporting unit. We primarily use a discounted cash flow analysis, supplemented by a market approach analysis, to perform the assessment. Key assumptions in the analysis include the use of an appropriate discount rate, terminal year multiples, and estimated future cash flows including an estimate of operating and general and administrative costs. In estimating cash flows, we incorporate current market information, as well as historical and other factors, into our forecasted
96
DCP MIDSTREAM, LP
NOTES TO CONSOLIDATED FINANCIAL STATEMENTS
Years Ended December 31, 2017, 2016 and 2015 - (Continued)
commodity prices. A period of lower commodity prices may adversely affect our estimate of future operating results, which could result in future goodwill and intangible assets impairment due to the potential impact on our operations and cash flows.
Intangible assets consist of customer contracts, including commodity purchase, transportation and processing contracts, and related relationships. These intangible assets are amortized on a straight-line basis over the period of expected future benefit. Intangible assets are removed from the gross carrying amount and the total of accumulated amortization in the period in which they become fully amortized.
Investments in Unconsolidated Affiliates - We use the equity method to account for investments in greater than 20% owned affiliates.
We evaluate our investments in unconsolidated affiliates for impairment whenever events or changes in circumstances indicate that the carrying value of such investments may have experienced a decline in value. When there is evidence of loss in value that is other than temporary, we compare the estimated fair value of the investment to the carrying value of the investment to determine whether impairment has occurred. We assess the fair value of our investments in unconsolidated affiliates using commonly accepted techniques, and may use more than one method, including, but not limited to, recent third party comparable sales and discounted cash flow models. If the estimated fair value is less than the carrying value, the excess of the carrying value over the estimated fair value is recognized as an impairment loss.
Long-Lived Assets - We periodically evaluate whether the carrying value of long-lived assets, including intangible assets, has been impaired when circumstances indicate the carrying value of those assets may not be recoverable. This evaluation is based on undiscounted cash flow projections. The carrying amount is not recoverable if it exceeds the sum of the undiscounted cash flows expected to result from the use and eventual disposition of the asset. We consider various factors when determining if these assets should be evaluated for impairment, including but not limited to:
• | significant adverse change in legal factors or business climate; |
• | a current-period operating or cash flow loss combined with a history of operating or cash flow losses, or a projection or forecast that demonstrates continuing losses associated with the use of a long-lived asset; |
• | an accumulation of costs significantly in excess of the amount originally expected for the acquisition or construction of a long-lived asset; |
• | significant adverse changes in the extent or manner in which an asset is used, or in its physical condition; |
• | a significant adverse change in the market value of an asset; or |
• | a current expectation that, more likely than not, an asset will be sold or otherwise disposed of before the end of its estimated useful life. |
If the carrying value is not recoverable, the impairment loss is measured as the excess of the asset’s carrying value over its fair value. We assess the fair value of long-lived assets using commonly accepted techniques, and may use more than one method, including, but not limited to, recent third party comparable sales and discounted cash flow models. Significant changes in market conditions resulting from events such as the condition of an asset or a change in management’s intent to utilize the asset would generally require management to reassess the cash flows related to the long-lived assets. A period of lower commodity prices may adversely affect our estimate of future operating results, which could result in future impairment due to the potential impact on our operations and cash flows.
Unamortized Debt Discount and Expense - Discounts and expenses incurred with the issuance of long-term debt are amortized over the term of the debt using the effective interest method. The discounts and unamortized expenses are recorded on the consolidated balance sheets within the carrying amount of long-term debt.
Noncontrolling Interest - Noncontrolling interest represents any third party or affiliate interest in non-wholly owned entities that we consolidate. For financial reporting purposes, the assets and liabilities of these entities are consolidated with those of our own, with any third party or affiliate interest in our consolidated balance sheet amounts shown as noncontrolling interest in equity. Distributions to and contributions from noncontrolling interests represent cash payments to and cash contributions from, respectively, such third party and affiliate investors.
Revenue Recognition - We generate the majority of our revenues from gathering, compressing, treating, processing, transporting, storing and selling of natural gas, and producing, fractionating, transporting, storing and selling NGLs and
97
DCP MIDSTREAM, LP
NOTES TO CONSOLIDATED FINANCIAL STATEMENTS
Years Ended December 31, 2017, 2016 and 2015 - (Continued)
recovering and selling condensate. Once natural gas is produced from wells, producers then seek to deliver the natural gas and its components to end-use markets. We realize revenues either by selling the residue natural gas, NGLs and condensate, or by receiving fees. We also generate revenue from transporting, storing and selling propane.
We obtain access to commodities and provide our midstream services principally under contracts that contain a combination of one or more of the following arrangements:
• | Fee-based arrangements - Under fee-based arrangements, we receive a fee or fees for one or more of the following services: gathering, compressing, treating, processing, transporting or storing natural gas; and fractionating, storing and transporting NGLs. The revenues we earn are directly related to the volume of natural gas or NGLs that flows through our systems and are not directly dependent on commodity prices. However, to the extent a sustained decline in commodity prices results in a decline in volumes, our revenues from these arrangements would be reduced. |
• | Percent-of-proceeds/index arrangements - Under percent-of-proceeds arrangements, we generally purchase natural gas from producers at the wellhead, or other receipt points, gather the wellhead natural gas through our gathering system, treat and process the natural gas, and then sell the resulting residue natural gas, NGLs and condensate based on published index market prices. We remit to the producers either an agreed-upon percentage of the actual proceeds that we receive from our sales of the residue natural gas, NGLs and condensate, or an agreed-upon percentage of the proceeds based on index related prices for the natural gas, NGLs and condensate, regardless of the actual amount of the sales proceeds we receive. We keep the difference between the proceeds received and the amount remitted back to the producer. Under percent-of-liquids arrangements, we do not keep any amounts related to residue natural gas proceeds and only keep amounts related to the difference between the proceeds received and the amount remitted back to the producer related to NGLs and condensate. Certain of these arrangements may also result in the producer retaining title to all or a portion of the residue natural gas and/or the NGLs, in lieu of us returning sales proceeds to the producer. Additionally, these arrangements may include fee-based components. Our revenues under percent-of-proceeds/index arrangements relate directly with the price of natural gas, NGLs and condensate. Our revenues under percent-of-liquids arrangements relate directly with the price of NGLs and condensate. |
• | Keep-whole and wellhead purchase arrangements - Under the terms of a keep-whole processing contract, natural gas is gathered from the producer for processing, the NGLs and condensate are sold and the residue natural gas is returned to the producer with a British thermal unit, or Btu, content equivalent to the Btu content of the natural gas gathered. This arrangement keeps the producer whole to the thermal value of the natural gas received. Under the terms of a wellhead purchase contract, we purchase natural gas from the producer at the wellhead or defined receipt point for processing and then market the resulting NGLs and residue gas at market prices. Under these types of contracts, we are exposed to the difference between the value of the NGLs extracted from processing and the value of the Btu equivalent of residue natural gas, or frac spread. We benefit in periods when NGL prices are higher relative to natural gas prices when that frac spread exceeds our operating costs. |
Our trading and marketing of natural gas and NGLs consists of physical purchases and sales, as well as financial derivative instruments.
We recognize revenues for sales and services under the four revenue recognition criteria, as follows:
• | Persuasive evidence of an arrangement exists - Our customary practice is to enter into a written contract. |
• | Delivery - Delivery is deemed to have occurred at the time custody is transferred, or in the case of fee-based arrangements, when the services are rendered. To the extent we retain product as inventory, delivery occurs when the inventory is subsequently sold and custody is transferred to the third party purchaser. |
• | The fee is fixed or determinable - We negotiate the fee for our services at the outset of our fee-based arrangements. In these arrangements, the fees are nonrefundable. For other arrangements, the amount of revenue, based on contractual terms, is determinable when the sale of the applicable product has been completed upon delivery and transfer of custody. |
• | Collectability is reasonably assured - Collectability is evaluated on a customer-by-customer basis. New and existing customers are subject to a credit review process, which evaluates the customers’ financial position (for example, credit |
98
DCP MIDSTREAM, LP
NOTES TO CONSOLIDATED FINANCIAL STATEMENTS
Years Ended December 31, 2017, 2016 and 2015 - (Continued)
metrics, liquidity and credit rating) and their ability to pay. If collectability is not considered probable at the outset of an arrangement in accordance with our credit review process, revenue is not recognized until the cash is collected.
We generally report revenues gross in the consolidated statements of operations, as we typically act as the principal in these transactions, take custody to the product, and incur the risks and rewards of ownership. New or amended contracts for certain sales and purchases of inventory with the same counterparty, when entered into in contemplation of one another, are reported net as one transaction. We recognize revenues for commodity derivative activity net in the consolidated statements of operations as trading and marketing gains and losses. These activities include mark-to-market gains and losses on energy trading contracts and the settlement of financial and physical energy trading contracts.
Quantities of natural gas or NGLs over-delivered or under-delivered related to imbalance agreements with customers, producers or pipelines are recorded monthly as accounts receivable or accounts payable using current market prices or the weighted-average prices of natural gas or NGLs at the plant or system. These balances are settled with deliveries of natural gas or NGLs, or with cash.
Purchases and related costs - Purchases and related costs primarily includes (i) the cost of purchased commodities, including NGLs, natural gas and condensate, and (ii) fees incurred for transportation and fractionation of commodities.
Significant Customers - There were no third party customers that accounted for more than 10% of total operating revenues for the years ended December 31, 2017, 2016 and 2015. We had significant transactions with affiliates for the years ended December 31, 2017, 2016 and 2015. See Note 6, Agreements and Transactions with Related Parties and Affiliates.
Environmental Expenditures - Environmental expenditures are expensed or capitalized as appropriate, depending upon the future economic benefit. Expenditures that relate to an existing condition caused by past operations and that do not generate current or future revenue are expensed. Liabilities for these expenditures are recorded on an undiscounted basis when environmental assessments and/or clean-ups are probable and the costs can be reasonably estimated.
Equity-Based Compensation — Liability classified equity-based compensation cost is remeasured at each reporting date at fair value, based on the closing security price, and is recognized as expense over the requisite service period. Compensation expense for awards with graded vesting provisions is recognized on a straight-line basis over the requisite service period of each separately vesting portion of the award.
Income Taxes - We are structured as a master limited partnership which is a pass-through entity for federal income tax purposes. We owned a corporation that filed its own federal and state corporate income tax returns, which we elected to convert to a limited liability company in 2016. Our income tax expense includes certain jurisdictions, including state, local, franchise and margin taxes of the master limited partnership and subsidiaries. We follow the asset and liability method of accounting for income taxes. Under this method, deferred income taxes are recognized for the tax consequences of temporary differences between the financial statement carrying amounts and the tax basis of the assets and liabilities. Our taxable income or loss, which may vary substantially from the net income or loss reported in the consolidated statements of operations, is proportionately included in the federal income tax returns of each partner.
Net Income or Loss per Limited Partner Unit - Basic and diluted net income or loss per limited partner unit, or LPU, is calculated by dividing net income or loss allocable to limited partners, by the weighted-average number of outstanding LPUs during the period. Diluted net income or loss per limited partner unit is computed based on the weighted average number of limited partner units, plus the effect of dilutive potential units outstanding during the period using the two-class method.
3. New Accounting Pronouncements
Financial Accounting Standards Board, or FASB, Accounting Standards Update, or ASU, 2016-15 “Statement of Cash Flows (Topic 230): Classification of Certain Cash Receipts and Cash Payments,” or ASU 2016-15 - In August 2016, the FASB issued ASU 2016-15, which amends certain cash flow statement classification guidance. We adopted this ASU for interim and annual reporting periods beginning after December 15, 2017. The adoption of this ASU will have no impact on our consolidated cash flows.
FASB ASU, 2016-02 “Leases (Topic 842),” or ASU 2016-02 - In February 2016, the FASB issued ASU 2016-02, which requires lessees to recognize a lease liability on a discounted basis and the right of use of a specified asset at the commencement date for all leases. This ASU is effective for interim and annual reporting periods beginning after December 15,
99
DCP MIDSTREAM, LP
NOTES TO CONSOLIDATED FINANCIAL STATEMENTS
Years Ended December 31, 2017, 2016 and 2015 - (Continued)
2018, with the option to early adopt for financial statements that have not been issued. We are currently evaluating the potential impact this standard will have on our consolidated financial statements and related disclosures.
FASB ASU 2014-09 “Revenue from Contracts with Customers (Topic 606),” or ASU 2014-09 and related interpretations and amendments - In May 2014, the FASB issued ASU 2014-09, which supersedes the revenue recognition requirements of Accounting Standards Codification Topic 605 “Revenue Recognition.” This ASU is effective for annual reporting periods beginning after December 15, 2017, with the option to adopt as early as annual reporting periods beginning after December 15, 2016. Under the new standard, revenue is recognized when a customer obtains control of promised goods or services in an amount that reflects the consideration the entity expects to receive in exchange for those goods or services. Although the new revenue recognition model is based on control, which differs from the previous model which was based a transfer of risks and rewards, we expect to identify similar performance obligations under Topic 606 as compared with deliverables and units of account previously identified under Topic 605. As a result, we expect the timing of our revenue to remain the same with respect to the majority of our contracts. There are certain contracts within our Gathering and Processing reportable segment where we previously recognized revenue for services provided to producers whereby under Topic 606 we have concluded that those contracts are not within the scope of Topic 606 and thus such amounts which were previously presented gross will now be presented net within ‘Purchases and related costs’. However, this change will not have any impact on our net income (loss), operating income (loss), cash flows, or the amount we present as gross margin in our Business Segments footnote. We also have certain contracts with customers whereby the customer reimburses us for costs to construct certain logistical connections to our operating assets which we own and operate. We previously accounted for these arrangements as a reduction to the cost basis of our long-lived assets which were amortized as a reduction to depreciation expense over the estimated useful life of the related assets. Under Topic 606 we will record these payments as deferred revenue which will be amortized into revenue over the contract term. Accordingly, we anticipate an increase to the amounts we present as gross margin within our Business Segment footnote, but do not anticipate a material impact to net income (loss), operating income (loss), or cash flows because the increase to depreciation expense will be offset by the increase to revenues.
In addition, the standard requires disclosure of the nature, amount, timing, and uncertainty of revenue and cash flows arising from contracts with customers. The FASB issued several amendments to the standard which provided additional implementation guidance and deferred the effective date of the standard. We adopted the guidance using the modified retrospective method on the effective date of January 1, 2018. Based on these assessments we do not believe these changes will have a significant impact on the information presented to the users of our financial statements.
4. Acquisitions
On January 1, 2017, DCP Midstream, LLC contributed to us: (i) its ownership interests in all of its subsidiaries owning operating assets, and (ii) $424 million of cash (together the “Contributions”). In consideration of the Partnership’s receipt of the Contributions, (i) the Partnership issued 28,552,480 common units to DCP Midstream, LLC and 2,550,644 general partner units to the General Partner in a private placement and (ii) the Operating Partnership assumed $3,150 million of DCP Midstream, LLC’s debt.
Pursuant to the Contribution Agreement, DCP Midstream, LLC agreed to cause the General Partner to enter into Amendment No. 3 (the “Third Amendment to the Partnership Agreement”) to the Second Amended and Restated Agreement of Limited Partnership of the Partnership, dated November 1, 2006, as amended (the “Partnership Agreement”). The Third Amendment to the Partnership Agreement includes terms that amend the Partnership Agreement to cause the incentive distributions payable to the holders of the Partnership’s incentive distribution rights with respect to the fiscal years 2017, 2018 and 2019 to, in certain circumstances, be reduced in an amount up to $100 million per fiscal year as necessary to provide that the distributable cash flow of the Partnership (as adjusted) during such year meets or exceeds the amount of distributions made by the Partnership (as adjusted) to the partners of the Partnership with respect to such year.
5. Dispositions
In June 2017, we closed a transaction with Tallgrass Midstream, LLC to sell our 100% interest in our Douglas gathering system, which primarily consisted of approximately 1,500 miles of gathering lines within our Gathering and Processing segment, for approximately $129 million, subject to customary purchase price adjustments. As a result of this transaction, we recognized a gain of approximately $34 million, net of goodwill allocation, in the second quarter of 2017.
100
DCP MIDSTREAM, LP
NOTES TO CONSOLIDATED FINANCIAL STATEMENTS
Years Ended December 31, 2017, 2016 and 2015 - (Continued)
6. Agreements and Transactions with Affiliates
DCP Midstream, LLC
Services Agreement and Other General and Administrative Charges
Pursuant to the Contribution Agreement, on January 1, 2017, the Partnership entered into the Services and Employee Secondment Agreement (the “Services Agreement”), which replaced the services agreement between the Partnership and DCP Midstream, LLC, dated February 14, 2013, as amended. Under the Services Agreement, we are required to reimburse DCP Midstream, LLC for costs, expenses, and expenditures incurred or payments made on our behalf for general and administrative functions including, but not limited to, legal, accounting, compliance, treasury, insurance administration and claims processing, risk management, health, safety and environmental, information technology, human resources, benefit plan maintenance and administration, credit, payroll, internal audit, taxes and engineering, as well as salaries and benefits of seconded employees, insurance coverage and claims, capital expenditures, maintenance and repair costs and taxes. There is no limit on the reimbursements we make to DCP Midstream, LLC under the Services Agreement for costs, expenses and expenditures incurred or payments made on our behalf. The following table summarizes employee related costs that were charged by DCP Midstream, LLC to the Partnership that are included in the consolidated statements of operations:
Year Ended December 31, | ||||||||||||
2017 | 2016 | 2015 | ||||||||||
(millions) | ||||||||||||
Employee related costs charged by DCP Midstream, LLC | ||||||||||||
Operating and maintenance expense | $ | 197 | $ | 206 | $ | 224 | ||||||
General and administrative expense (including restructuring charges) | $ | 182 | $ | 197 | $ | 194 | ||||||
Phillips 66 and its Affiliates
We sell a portion of our residue gas and NGLs to Phillips 66 and Chevron Phillips Chemical LLC, or CPChem. In addition, we purchase NGLs from CPChem. CPChem is owned 50% by Phillips 66, and is considered a related party. Approximately 22% of our NGL production was committed to Phillips 66 and CPChem as of December 31, 2017. The primary production commitment on certain contracts began a ratable wind down period in December 2014 and expires in January 2019. We anticipate continuing to purchase and sell commodities with Phillips 66 and CPChem in the ordinary course of business.
Enbridge and its Affiliates
We sell NGLs to and purchase NGLs from Enbridge and its affiliates. We anticipate continuing to sell commodities to and purchase commodities from Enbridge and its affiliates in the ordinary course of business.
Unconsolidated Affiliates
We have entered into 10 to 15-year transportation agreements, with Sand Hills Pipeline, LLC, or Sand Hills, Southern Hills Pipeline, LLC, or Southern Hills, Front Range Pipeline LLC, or Front Range, Texas Express Pipeline LLC, or Texas Express and Gulf Coast Express Pipeline, LLC, or Gulf Coast. Under the terms of these agreements, which commenced at each of the pipelines’ respective in-service dates and expire between 2028 and 2029, we have committed to transport minimum throughput volumes at rates defined in each of the pipelines’ respective tariffs.
We also sell a portion of our residue gas and NGLs to, purchase natural gas and other NGL products from, and provide gathering and transportation services to other unconsolidated affiliates. We anticipate continuing to purchase and sell commodities and provide services to unconsolidated affiliates in the ordinary course of business.
101
DCP MIDSTREAM, LP
NOTES TO CONSOLIDATED FINANCIAL STATEMENTS
Years Ended December 31, 2017, 2016 and 2015 - (Continued)
Under the terms of the Sand Hills LLC Agreement and the Southern Hills LLC Agreement, or the Sand Hills and Southern Hills LLC Agreements, Sand Hills and Southern Hills are required to reimburse us for any direct costs or expenses (other than general and administration services) which we incur on behalf of Sand Hills and Southern Hills. Additionally, Sand Hills and Southern Hills each pay us an annual service fee of $5 million, for centralized corporate functions provided by us as operator of Sand Hills and Southern Hills, including legal, accounting, cash management, insurance administration and claims processing, risk management, health, safety and environmental, information technology, human resources, credit, payroll, taxes and engineering. Except with respect to the annual service fee, there is no limit on the reimbursements Sand Hills and Southern Hills make to us under the Sand Hills and Southern Hills LLC Agreements for other expenses and expenditures which we incur on behalf of Sand Hills or Southern Hills.
Summary of Transactions with Affiliates
The following table summarizes our transactions with affiliates:
Year Ended December 31, | ||||||||||||
2017 | 2016 | 2015 | ||||||||||
(millions) | ||||||||||||
Phillips 66 (including its affiliates): | ||||||||||||
Sales of natural gas, NGLs and condensate to affiliates | $ | 1,172 | $ | 909 | $ | 695 | ||||||
Purchases and related costs from affiliates | $ | 30 | $ | 18 | $ | — | ||||||
Operating and maintenance and general administrative expenses | $ | 2 | $ | 2 | $ | 4 | ||||||
Enbridge (including its affiliates): | ||||||||||||
Sales of natural gas, NGLs and condensate to affiliates | $ | 48 | $ | — | $ | — | ||||||
Purchases and related costs from affiliates | $ | 43 | $ | 33 | $ | 50 | ||||||
Operating and maintenance and general administrative expenses | $ | 2 | $ | 4 | $ | 6 | ||||||
Unconsolidated affiliates: | ||||||||||||
Sales of natural gas, NGLs and condensate to affiliates | $ | 54 | $ | 43 | $ | 70 | ||||||
Transportation, processing, and other to affiliates | $ | 5 | $ | 5 | $ | 3 | ||||||
Purchases and related costs from affiliates | $ | 504 | $ | 432 | $ | 368 | ||||||
We had balances with affiliates as follows:
December 31, 2017 | December 31, 2016 | ||||||
(millions) | |||||||
Phillips 66 (including its affiliates): | |||||||
Accounts receivable | $ | 156 | $ | 115 | |||
Accounts payable | $ | 6 | $ | 4 | |||
Other assets | $ | — | $ | 2 | |||
Enbridge (including its affiliates): | |||||||
Accounts receivable | $ | 11 | $ | 1 | |||
Accounts payable | $ | 9 | $ | 3 | |||
Other assets | $ | — | $ | 1 | |||
Other liabilities | $ | — | $ | 1 | |||
Unconsolidated affiliates: | |||||||
Accounts receivable | $ | 24 | $ | 18 | |||
Accounts payable | $ | 53 | $ | 41 | |||
Other assets | $ | 4 | $ | 5 | |||
102
DCP MIDSTREAM, LP
NOTES TO CONSOLIDATED FINANCIAL STATEMENTS
Years Ended December 31, 2017, 2016 and 2015 - (Continued)
7. Inventories
Inventories were as follows:
December 31, 2017 | December 31, 2016 | ||||||
(millions) | |||||||
Natural gas | $ | 30 | $ | 28 | |||
NGLs | 38 | 44 | |||||
Total inventories | $ | 68 | $ | 72 | |||
We recognize lower of cost or market adjustments when the carrying value of our inventories exceeds their estimated market value. These non-cash charges are a component of purchases and related costs in the consolidated statements of operations. We recognized lower of cost or market adjustments of $2 million, $3 million and $8 million during the years ended December 31, 2017, 2016 and 2015, respectively.
8. Property, Plant and Equipment
A summary of property, plant and equipment by classification is as follows:
Depreciable Life | December 31, 2017 | December 31, 2016 | |||||||
(millions) | |||||||||
Gathering and transmission systems | 20 — 50 Years | $ | 8,473 | $ | 8,560 | ||||
Processing, storage and terminal facilities | 35 — 60 Years | 5,128 | 5,134 | ||||||
Other | 3 — 30 Years | 557 | 502 | ||||||
Construction work in progress | 374 | 171 | |||||||
Property, plant and equipment | 14,532 | 14,367 | |||||||
Accumulated depreciation | (5,549 | ) | (5,298 | ) | |||||
Property, plant and equipment, net | $ | 8,983 | $ | 9,069 | |||||
Interest capitalized on construction projects was $7 million, less than $1 million and $32 million for the years ended December 31, 2017, 2016 and 2015, respectively.
Depreciation expense was $367 million, $366 million and $358 million for the years ended December 31, 2017, 2016 and 2015, respectively.
Asset Retirement Obligations
We identified various assets as having an indeterminate life, for which there is no requirement to establish a fair value for future retirement obligations associated with such assets. These assets include certain pipelines, gathering systems and processing facilities. A liability for these asset retirement obligations will be recorded only if and when a future retirement obligation with a determinable life is identified. These assets have an indeterminate life because they are owned and will operate for an indeterminate future period when properly maintained. Additionally, if the portion of an owned plant containing asbestos were to be modified or dismantled, we would be legally required to remove the asbestos. We currently have no plans to take actions that would require the removal of the asbestos in these assets. Accordingly, the fair value of the asset retirement obligation related to this asbestos cannot be estimated and no obligation has been recorded.
The following table summarizes changes in the asset retirement obligations included in our balance sheets:
103
DCP MIDSTREAM, LP
NOTES TO CONSOLIDATED FINANCIAL STATEMENTS
Years Ended December 31, 2017, 2016 and 2015 - (Continued)
December 31, | |||||||
2017 (a) | 2016 (a) | ||||||
(millions) | |||||||
Balance, beginning of period | $ | 124 | $ | 120 | |||
Accretion expense | 8 | 7 | |||||
Change in ARO Estimate | (6 | ) | (3 | ) | |||
Balance, end of period | $ | 126 | $ | 124 | |||
(a) Asset retirement obligations are included in other long-term liabilities in the consolidated balance sheets. Accretion expense is recorded within operating and maintenance expense in our consolidated statement of operations. Accretion expense for the year ended December 31, 2015 was $7 million.
9. Goodwill
We performed our annual goodwill assessment during the third quarter of 2017 at the reporting unit level, which is identified by assessing whether the components of our operating segments constitute businesses for which discrete financial information is available, whether segment management regularly reviews the operating results of those components and whether the economic and regulatory characteristics are similar. As a result of our assessment, we concluded that the fair value of goodwill substantially exceeded its carrying value in our North reporting unit, the only reporting unit allocated goodwill included within our Gathering and Processing reportable segment and in our Marysville reporting unit included within our Logistics and Marketing reportable segment. For our Wholesale Propane reporting unit, which is included in our Logistics and Marketing reportable segment, the fair value exceeded the carrying value (including approximately $37 million of allocated goodwill) by approximately 5%. We concluded that the entire amount of goodwill disclosed on the consolidated balance sheet is recoverable.
We primarily used a discounted cash flow analysis, supplemented by a market approach analysis, to perform the assessment. Key assumptions in the analysis include the use of an appropriate discount rate, terminal year multiples, and estimated future cash flows, including an estimate of operating and general and administrative costs. In estimating cash flows, we incorporate current market information (including forecasted volumes and commodity prices), as well as historical and other factors. If actual results are not consistent with our assumptions and estimates, or our assumptions and estimates change due to new information, we may be exposed to goodwill impairment charges, which would be recognized in the period in which the carrying value exceeds fair value.
We expect that the fair value of our Wholesale Propane reporting unit will continue to exceed carrying value so long as our estimate of future cash flows and the market valuation remain consistent with current levels. A continued period of volatile propane prices could result in further deterioration of market multiples, comparable sales transactions prices, weighted average costs of capital, and our cash flow estimates. Changes to any one or combination of these factors, would result in changes to the reporting unit fair values discussed above which could lead to future impairment charges. Such potential impairment could impact our results of operations.
The change in carrying amount of goodwill in each of our reportable segments was as follows:
Year Ended December 31 | |||||||||||||||||||||||
2017 | 2016 | ||||||||||||||||||||||
(millions) | |||||||||||||||||||||||
Gathering and Processing | Logistics and Marketing | Total | Gathering and Processing | Logistics and Marketing | Total | ||||||||||||||||||
Balance, beginning of period | $ | 164 | $ | 72 | $ | 236 | $ | 170 | $ | 72 | $ | 242 | |||||||||||
Dispositions | (5 | ) | — | (5 | ) | (6 | ) | — | (6 | ) | |||||||||||||
Balance, end of period | $ | 159 | $ | 72 | $ | 231 | $ | 164 | $ | 72 | $ | 236 | |||||||||||
104
DCP MIDSTREAM, LP
NOTES TO CONSOLIDATED FINANCIAL STATEMENTS
Years Ended December 31, 2017, 2016 and 2015 - (Continued)
Intangible assets consist of customer contracts, including commodity purchase, transportation and processing contracts and related relationships. The gross carrying amount and accumulated amortization of these intangible assets are included in the accompanying consolidated balance sheets as intangible assets, net, and are as follows:
December 31, | |||||||
2017 | 2016 | ||||||
(millions) | |||||||
Gross carrying amount | $ | 410 | $ | 410 | |||
Accumulated amortization | (161 | ) | (151 | ) | |||
Accumulated impairment | (143 | ) | (122 | ) | |||
Intangible assets, net | $ | 106 | $ | 137 | |||
We recorded amortization expense of $10 million, $12 million and $19 million for the years ended December 31, 2017, 2016 and 2015, respectively. As of December 31, 2017, the remaining amortization periods ranged from approximately less than 1 year to 18 years, with a weighted-average remaining period of approximately 13 years.
Estimated future amortization for these intangible assets is as follows:
Estimated Future Amortization | |||||
(millions) | |||||
2018 | $ | 10 | |||
2019 | 9 | ||||
2020 | 9 | ||||
2021 | 9 | ||||
2022 | 9 | ||||
Thereafter | 60 | ||||
Total | $ | 106 | |||
10. Investments in Unconsolidated Affiliates
The following table summarizes our investments in unconsolidated affiliates:
Carrying Value as of | |||||||||
Percentage Ownership | December 31, 2017 | December 31, 2016 | |||||||
(millions) | |||||||||
DCP Sand Hills Pipeline, LLC | 66.67% | $ | 1,633 | $ | 1,507 | ||||
Discovery Producer Services LLC | 40.00% | 362 | 385 | ||||||
DCP Southern Hills Pipeline, LLC | 66.67% | 739 | 754 | ||||||
Front Range Pipeline LLC | 33.33% | 165 | 165 | ||||||
Texas Express Pipeline LLC | 10.00% | 90 | 93 | ||||||
Panola Pipeline Company, LLC | 15.00% | 24 | 25 | ||||||
Mont Belvieu Enterprise Fractionator | 12.50% | 23 | 23 | ||||||
Mont Belvieu 1 Fractionator | 20.00% | 10 | 10 | ||||||
Other | Various | 4 | 7 | ||||||
Total investments in unconsolidated affiliates | $ | 3,050 | $ | 2,969 | |||||
The following table represents the excess (deficit) of the carrying amount of the investment over (under) the underlying equity of our investments in unconsolidated affiliates as of December 31, 2017 and 2016:
105
DCP MIDSTREAM, LP
NOTES TO CONSOLIDATED FINANCIAL STATEMENTS
Years Ended December 31, 2017, 2016 and 2015 - (Continued)
Excess (deficit) of Carrying Value over (under) Underlying Equity in Unconsolidated Affiliates | ||||||||
December 31, 2017 | December 31, 2016 | |||||||
(millions) | ||||||||
DCP Sand Hills Pipeline, LLC | $ | 648 | $ | 662 | ||||
Discovery Producer Services LLC | (18 | ) | (20 | ) | ||||
DCP Southern Hills Pipeline, LLC | 145 | 148 | ||||||
Front Range Pipeline LLC | 4 | 5 | ||||||
Texas Express Pipeline LLC | 3 | 3 | ||||||
Mont Belvieu 1 Fractionator | (1 | ) | (2 | ) | ||||
Carrying amounts in excess or deficit of the underlying equity of our unconsolidated affiliates are amortized over the life of the underlying long-lived assets of the affiliate.
Earnings from investments in unconsolidated affiliates were as follows:
Year Ended December 31, | |||||||||||
2017 | 2016 | 2015 | |||||||||
(millions) | |||||||||||
DCP Sand Hills Pipeline, LLC | $ | 148 | $ | 110 | 63 | ||||||
Discovery Producer Services LLC | 61 | 73 | 54 | ||||||||
DCP Southern Hills Pipeline, LLC | 47 | 44 | 18 | ||||||||
Front Range Pipeline LLC | 17 | 19 | 17 | ||||||||
Texas Express Pipeline LLC | 9 | 9 | 8 | ||||||||
Mont Belvieu Enterprise Fractionator | 13 | 16 | 15 | ||||||||
Mont Belvieu 1 Fractionator | 6 | 9 | 9 | ||||||||
Other | 2 | 2 | — | ||||||||
Total earnings from unconsolidated affiliates | $ | 303 | $ | 282 | $ | 184 | |||||
The following tables summarize the combined financial information of our investments in unconsolidated affiliates:
Year Ended December 31, | |||||||||||
2017 | 2016 | 2015 | |||||||||
(millions) | |||||||||||
Statements of operations: | |||||||||||
Operating revenue | $ | 1,397 | $ | 1,311 | $ | 1,142 | |||||
Operating expenses | $ | 647 | $ | 539 | $ | 541 | |||||
Net income | $ | 747 | $ | 768 | $ | 600 | |||||
December 31, 2017 | December 31, 2016 | ||||||
(millions) | |||||||
Balance sheets: | |||||||
Current assets | $ | 244 | $ | 232 | |||
Long-term assets | 5,319 | 5,274 | |||||
Current liabilities | (196 | ) | (156 | ) | |||
Long-term liabilities | (200 | ) | (205 | ) | |||
Net assets | $ | 5,167 | $ | 5,145 | |||
106
DCP MIDSTREAM, LP
NOTES TO CONSOLIDATED FINANCIAL STATEMENTS
Years Ended December 31, 2017, 2016 and 2015 - (Continued)
11. Fair Value Measurement
Determination of Fair Value
Below is a general description of our valuation methodologies for derivative financial assets and liabilities which are measured at fair value. Fair values are generally based upon quoted market prices or prices obtained through external sources, where available. If listed market prices or quotes are not available, we determine fair value based upon a market quote, adjusted by other market-based or independently sourced market data such as historical commodity volatilities, crude oil future yield curves, and/or counterparty specific considerations. These adjustments result in a fair value for each asset or liability under an “exit price” methodology, in line with how we believe a marketplace participant would value that asset or liability. Fair values are adjusted to reflect the credit risk inherent in the transaction as well as the potential impact of liquidating open positions in an orderly manner over a reasonable time period under current conditions. These adjustments may include amounts to reflect counterparty credit quality, the effect of our own creditworthiness, and/or the liquidity of the market.
• | Counterparty credit valuation adjustments are necessary when the market price of an instrument is not indicative of the fair value as a result of the credit quality of the counterparty. Generally, market quotes assume that all counterparties have near zero, or low, default rates and have equal credit quality. Therefore, an adjustment may be necessary to reflect the credit quality of a specific counterparty to determine the fair value of the instrument. We record counterparty credit valuation adjustments on all derivatives that are in a net asset position as of the measurement date in accordance with our established counterparty credit policy, which takes into account any collateral margin that a counterparty may have posted with us as well as any letters of credit that they have provided. |
• | Entity valuation adjustments are necessary to reflect the effect of our own credit quality on the fair value of our net liability positions with each counterparty. This adjustment takes into account any credit enhancements, such as collateral margin we may have posted with a counterparty, as well as any letters of credit that we have provided. The methodology to determine this adjustment is consistent with how we evaluate counterparty credit risk, taking into account our own credit rating, current credit spreads, as well as any change in such spreads since the last measurement date. |
• | Liquidity valuation adjustments are necessary when we are not able to observe a recent market price for financial instruments that trade in less active markets for the fair value to reflect the cost of exiting the position. Exchange traded contracts are valued at market value without making any additional valuation adjustments and, therefore, no liquidity reserve is applied. For contracts other than exchange traded instruments, we mark our positions to the midpoint of the bid/ask spread, and record a liquidity reserve based upon our total net position. We believe that such practice results in the most reliable fair value measurement as viewed by a market participant. |
We manage our derivative instruments on a portfolio basis and the valuation adjustments described above are calculated on this basis. We believe that the portfolio level approach represents the highest and best use for these assets as there are benefits inherent in naturally offsetting positions within the portfolio at any given time, and this approach is consistent with how a market participant would view and value the assets and liabilities. Although we take a portfolio approach to managing these assets/liabilities, in order to reflect the fair value of any one individual contract within the portfolio, we allocate all valuation adjustments down to the contract level, to the extent deemed necessary, based upon either the notional contract volume, or the contract value, whichever is more applicable.
The methods described above may produce a fair value calculation that may not be indicative of net realizable value or reflective of future fair values. While we believe that our valuation methods are appropriate and consistent with other market participants, we recognize that the use of different methodologies or assumptions to determine the fair value of certain financial instruments could result in a different estimate of fair value at the reporting date. We review our fair value policies on a regular basis taking into consideration changes in the marketplace and, if necessary, will adjust our policies accordingly. See Note 13 - Risk Management and Hedging Activities.
Valuation Hierarchy
Our fair value measurements are grouped into a three-level valuation hierarchy and are categorized in their entirety in the same level of the fair value hierarchy as the lowest level input that is significant to the entire measurement. The valuation hierarchy is based upon the transparency of inputs to the valuation of an asset or liability as of the measurement date. The three levels are defined as follows.
• | Level 1 — inputs are unadjusted quoted prices for identical assets or liabilities in active markets. |
107
DCP MIDSTREAM, LP
NOTES TO CONSOLIDATED FINANCIAL STATEMENTS
Years Ended December 31, 2017, 2016 and 2015 - (Continued)
• | Level 2 — inputs include quoted prices for similar assets and liabilities in active markets, and inputs that are observable for the asset or liability, either directly or indirectly, for substantially the full term of the financial instrument. |
• | Level 3 — inputs are unobservable and considered significant to the fair value measurement. |
A financial instrument’s categorization within the hierarchy is based upon the level of judgment involved in the most significant input in the determination of the instrument’s fair value. Following is a description of the valuation methodologies used as well as the general classification of such instruments pursuant to the hierarchy.
Commodity Derivative Assets and Liabilities
We enter into a variety of derivative financial instruments, which may include exchange traded instruments (such as New York Mercantile Exchange, or NYMEX, crude oil or natural gas futures) or over-the-counter, or OTC, instruments (such as natural gas contracts, crude oil or NGL swaps). The exchange traded instruments are generally executed with a highly rated broker dealer serving as the clearinghouse for individual transactions.
Our activities expose us to varying degrees of commodity price risk. To mitigate a portion of this risk and to manage commodity price risk related primarily to owned natural gas storage and pipeline assets, we engage in natural gas asset based trading and marketing, and we may enter into natural gas and crude oil derivatives to lock in a specific margin when market conditions are favorable. A portion of this may be accomplished through the use of exchange traded derivative contracts. Such instruments are generally classified as Level 1 since the value is equal to the quoted market price of the exchange traded instrument as of our balance sheet date, and no adjustments are required. Depending upon market conditions and our strategy we may enter into exchange traded derivative positions with a significant time horizon to maturity. Although such instruments are exchange traded, market prices may only be readily observable for a portion of the duration of the instrument. In order to calculate the fair value of these instruments, readily observable market information is utilized to the extent it is available; however, in the event that readily observable market data is not available, we may interpolate or extrapolate based upon observable data. In instances where we utilize an interpolated or extrapolated value, and it is considered significant to the valuation of the contract as a whole, we would classify the instrument within Level 3.
We also engage in the business of trading energy related products and services, which exposes us to market variables and commodity price risk. We may enter into physical contracts or financial instruments with the objective of realizing a positive margin from the purchase and sale of these commodity-based instruments. We may enter into derivative instruments for NGLs or other energy related products, primarily using the OTC derivative instrument markets, which are not as active and liquid as exchange traded instruments. Market quotes for such contracts may only be available for short dated positions (up to six months), and an active market itself may not exist beyond such time horizon. Contracts entered into with a relatively short time horizon for which prices are readily observable in the OTC market are generally classified within Level 2. Contracts with a longer time horizon, for which we internally generate a forward curve to value such instruments, are generally classified within Level 3. The internally generated curve may utilize a variety of assumptions including, but not limited to, data obtained from third-party pricing services, historical and future expected relationship of NGL prices to crude oil prices, the knowledge of expected supply sources coming on line, expected weather trends within certain regions of the United States, and the future expected demand for NGLs.
Each instrument is assigned to a level within the hierarchy at the end of each financial quarter depending upon the extent to which the valuation inputs are observable. Generally, an instrument will move toward a level within the hierarchy that requires a lower degree of judgment as the time to maturity approaches, and as the markets in which the asset trades will likely become more liquid and prices more readily available in the market, thus reducing the need to rely upon our internally developed assumptions. However, the level of a given instrument may change, in either direction, depending upon market conditions and the availability of market observable data.
Benefits
We offer certain eligible DCP Midstream, LLC executives the opportunity to participate in our DCP Midstream LP’s Non-Qualified Executive Deferred Compensation Plan, or the EDC Plan. All amounts contributed to and earned by the EDC Plan’s investments are held in a trust account, which is managed by a third-party service provider. The trust account is invested in short-term money market securities and mutual funds. These investments are recorded at fair value, with any changes in fair value being recorded as a gain or loss in our consolidated statements of operations. Given that the value of the short-term
108
DCP MIDSTREAM, LP
NOTES TO CONSOLIDATED FINANCIAL STATEMENTS
Years Ended December 31, 2017, 2016 and 2015 - (Continued)
money market securities and mutual funds are publicly traded and for which market prices are readily available, these investments are classified within Level 1.
Interest Rate Derivative Assets and Liabilities
We periodically use interest rate swap agreements as part of our overall capital strategy. These instruments effectively exchange a portion of our fixed-rate debt for floating rate debt or floating rate debt for fixed-rate debt. The swaps are generally priced based upon a London Interbank Offered Rate, or LIBOR, instrument with similar duration, adjusted by the credit spread between the Partnership and the LIBOR instrument. Given that a portion of the swap value is derived from the credit spread, which may be observed by comparing similar assets in the market, these instruments are classified within Level 2. Default risk on either side of the swap transaction is also considered in the valuation. We record counterparty credit and entity valuation adjustments in the valuation of interest rate swaps; however, these reserves are not considered to be a significant input to the overall valuation.
Nonfinancial Assets and Liabilities
We utilize fair value to perform impairment tests as required on our property, plant and equipment, goodwill, and other long-lived intangible assets. Assets and liabilities acquired in third party business combinations are recorded at their fair value as of the date of acquisition. The inputs used to determine such fair value are primarily based upon internally developed cash flow models and would generally be classified within Level 3 in the event that we were required to measure and record such assets at fair value within our consolidated financial statements. Additionally, we use fair value to determine the inception value of our asset retirement obligations. The inputs used to determine such fair value are primarily based upon costs incurred historically for similar work, as well as estimates from independent third parties for costs that would be incurred to restore leased property to the contractually stipulated condition, and would generally be classified within Level 3.
During the year ended December 31, 2017, we recognized impairments of property, plant and equipment, intangible assets and investment in unconsolidated affiliates of $48 million in our consolidated statement of operations as summarized in the table below. Our impairment determinations involved significant assumptions and judgments. Differing assumptions regarding any of these inputs could have a significant effect on the various valuations. As such, the fair value measurements utilized within these models are classified as non-recurring Level 3 measurements in the fair value hierarchy because they are not observable from objective sources.
Asset Impairments | ||||
(millions) | ||||
Property, plant and equipment | $ | 26 | ||
Intangible assets | 21 | |||
Investment in unconsolidated affiliates | 1 | |||
Total impairments | $ | 48 | ||
On January 3, 2017, the Chicago Mercantile Exchange ("CME") modified its exchange rules to characterize daily variation margin amounts as "final settlement" values. The modified rule ("CME Rule 814") impacts derivative financial instruments traded on exchanges administered by the CME, including the New York Mercantile Exchange. As a result of this rule change, we are reporting the affected derivative instruments on a net basis on our balance sheet. The netting process results in the elimination of offsetting derivative assets, derivative liabilities and associated collateral cash deposits as if the underlying derivative instruments had settled on the balance sheet date. Through December 31, 2016, we historically reported such derivatives and associated collateral balances on a gross basis. Derivative transactions and associated collateral balances cleared on exchanges other than the CME continue to be reported on a gross basis.
109
DCP MIDSTREAM, LP
NOTES TO CONSOLIDATED FINANCIAL STATEMENTS
Years Ended December 31, 2017, 2016 and 2015 - (Continued)
The following table presents the financial instruments carried at fair value as of December 31, 2017 and 2016, by consolidated balance sheet caption and by valuation hierarchy, as described above:
December 31, 2017 | December 31, 2016 | ||||||||||||||||||||||||||||||
Level 1 | Level 2 | Level 3 | Total Carrying Value | Level 1 | Level 2 | Level 3 | Total Carrying Value | ||||||||||||||||||||||||
(millions) | |||||||||||||||||||||||||||||||
Current assets: | |||||||||||||||||||||||||||||||
Commodity derivatives (a) | $ | 10 | $ | 17 | $ | 3 | $ | 30 | $ | 5 | $ | 28 | $ | 9 | $ | 42 | |||||||||||||||
Short-term investments (b) | $ | 156 | $ | — | $ | — | $ | 156 | $ | — | $ | — | $ | — | $ | — | |||||||||||||||
Long-term assets: | |||||||||||||||||||||||||||||||
Commodity derivatives (c) | $ | 1 | $ | 1 | $ | 1 | $ | 3 | $ | — | $ | — | $ | 5 | $ | 5 | |||||||||||||||
Current liabilities: | |||||||||||||||||||||||||||||||
Commodity derivatives (d) | $ | (29 | ) | $ | (34 | ) | $ | (13 | ) | $ | (76 | ) | $ | (11 | ) | $ | (57 | ) | $ | (23 | ) | $ | (91 | ) | |||||||
Long-term liabilities: | |||||||||||||||||||||||||||||||
Commodity derivatives (e) | $ | (3 | ) | $ | (11 | ) | $ | (1 | ) | $ | (15 | ) | $ | (1 | ) | $ | — | $ | — | $ | (1 | ) | |||||||||
(a) | Included in current unrealized gains on derivative instruments in our consolidated balance sheets. |
(b) | Includes short-term money market securities included in cash and cash equivalents in our consolidated balance sheets. |
(c) | Included in long-term unrealized gains on derivative instruments in our balance sheets. |
(d) | Included in current unrealized losses on derivative instruments in our consolidated balance sheets. |
(e) | Included in long-term unrealized losses on derivative instruments in our consolidated balance sheets. |
Changes in Levels 1 and 2 Fair Value Measurements
The determination to classify a financial instrument within Level 1 or Level 2 is based upon the availability of quoted prices for identical or similar assets and liabilities in active markets. Depending upon the information readily observable in the market, and/or the use of identical or similar quoted prices, which are significant to the overall valuation, the classification of any individual financial instrument may differ from one measurement date to the next. To qualify as a transfer, the asset or liability must have existed in the previous reporting period and moved into a different level during the current period. In the event that there is a movement between the classification of an instrument as Level 1 or 2, the transfer would be reflected in a table as Transfers into or out of Level 1 and Level 2. During the years ended December 31, 2017 and 2016, there were no transfers between Level 1 and Level 2 of the fair value hierarchy.
Changes in Level 3 Fair Value Measurements
The tables below illustrate a rollforward of the amounts included in our consolidated balance sheets for derivative financial instruments that we have classified within Level 3. Since financial instruments classified as Level 3 typically include a combination of observable components (that is, components that are actively quoted and can be validated to external sources) and unobservable components, the gains and losses in the table below may include changes in fair value due in part to observable market factors, or changes to our assumptions on the unobservable components. Depending upon the information readily observable in the market, and/or the use of unobservable inputs, which are significant to the overall valuation, the classification of any individual financial instrument may differ from one measurement date to the next. The significant unobservable inputs used in determining fair value include adjustments by other market-based or independently sourced market data such as historical commodity volatilities, crude oil future yield curves, and/or counterparty specific considerations. In the event that there is a movement to/from the classification of an instrument as Level 3, we would reflect such items in the table below within the “Transfers into/out of Level 3” captions.
We manage our overall risk at the portfolio level and in the execution of our strategy, we may use a combination of financial instruments, which may be classified within any level. Since Level 1 and Level 2 risk management instruments are not included in the rollforward below, the gains or losses in the table do not reflect the effect of our total risk management activities.
110
DCP MIDSTREAM, LP
NOTES TO CONSOLIDATED FINANCIAL STATEMENTS
Years Ended December 31, 2017, 2016 and 2015 - (Continued)
Commodity Derivative Instruments | |||||||||||||||
Current Assets | Long-Term Assets | Current Liabilities | Long-Term Liabilities | ||||||||||||
(millions) | |||||||||||||||
Year ended December 31, 2017 (a): | |||||||||||||||
Beginning balance | $ | 9 | $ | 5 | $ | (23 | ) | $ | — | ||||||
Net unrealized gains (losses) included in earnings (b) | 14 | 1 | (44 | ) | (3 | ) | |||||||||
Transfers out of Level 3 (c) | — | — | — | 2 | |||||||||||
Settlements | (13 | ) | — | 36 | — | ||||||||||
CME Rule 814 adjustment | (7 | ) | (5 | ) | 18 | — | |||||||||
Ending balance | $ | 3 | $ | 1 | $ | (13 | ) | $ | (1 | ) | |||||
Net unrealized gains (losses) on derivatives still held included in earnings (b) | $ | 3 | $ | (4 | ) | $ | (13 | ) | $ | (1 | ) | ||||
Year ended December 31, 2016 (a): | |||||||||||||||
Beginning balance | $ | 35 | $ | 4 | $ | (23 | ) | $ | (6 | ) | |||||
Net unrealized gains (losses) included in earnings (b) | 3 | 1 | (15 | ) | 6 | ||||||||||
Settlements | (29 | ) | — | 15 | — | ||||||||||
Ending balance | $ | 9 | $ | 5 | $ | (23 | ) | $ | — | ||||||
Net unrealized gains (losses) on derivatives still held included in earnings (b) | $ | 9 | $ | 3 | $ | (23 | ) | $ | 6 | ||||||
(a) | There were no purchases, issuances or sales of derivatives or transfers into Level 3 for the years ended December 31, 2017 and 2016. |
(b) | Represents the amount of unrealized gains or losses for the period, included in trading and marketing gains (losses), net. |
(c) | Amounts transferred out of Level 3 are reflected at fair value at the end of the period. |
Quantitative Information and Fair Value Sensitivities Related to Level 3 Unobservable Inputs
We utilize the market approach to measure the fair value of our commodity contracts. The significant unobservable inputs used in this approach to fair value are longer dated price quotes. Our sensitivity to these longer dated forward curve prices are presented in the table below. Significant changes in any of those inputs in isolation would result in significantly different fair value measurements, depending on our short or long position in contracts.
December 31, 2017 | |||||||
Product Group | Fair Value | Forward Curve Range | |||||
(millions) | |||||||
Assets | |||||||
NGLs | $ | 4 | $0.28-$0.82 | Per gallon | |||
Liabilities | |||||||
NGLs | $ | (14 | ) | $0.20-$1.08 | Per gallon | ||
Estimated Fair Value of Financial Instruments
Valuation of a contract’s fair value is validated by an internal group independent of the marketing group. While common industry practices are used to develop valuation techniques, changes in pricing methodologies or the underlying assumptions could result in significantly different fair values and income recognition. When available, quoted market prices or prices obtained through external sources are used to determine a contract’s fair value. For contracts with a delivery location or duration for which quoted market prices are not available, fair value is determined based on pricing models developed primarily from historical and expected relationship with quoted market prices.
111
DCP MIDSTREAM, LP
NOTES TO CONSOLIDATED FINANCIAL STATEMENTS
Years Ended December 31, 2017, 2016 and 2015 - (Continued)
Values are adjusted to reflect the credit risk inherent in the transaction as well as the potential impact of liquidating open positions in an orderly manner over a reasonable time period under current conditions. Changes in market prices and management estimates directly affect the estimated fair value of these contracts. Accordingly, it is reasonably possible that such estimates may change in the near term.
The fair value of our interest rate swaps, if any, and commodity non-trading derivatives is based on prices supported by quoted market prices and other external sources and prices based on models and other valuation methods. The “prices supported by quoted market prices and other external sources” category includes our interest rate swaps, if any, our NGL and crude oil swaps and our NYMEX positions in natural gas. In addition, this category includes our forward positions in natural gas for which our forward price curves are obtained from a third party pricing service and then validated through an internal process which includes the use of independent broker quotes. This category also includes our forward positions in NGLs at points for which OTC broker quotes for similar assets or liabilities are available for the full term of the instrument. This category also includes “strip” transactions whose pricing inputs are directly or indirectly observable from external sources and then modeled to daily or monthly prices as appropriate. The “prices based on models and other valuation methods” category includes the value of transactions for which inputs to the fair value of the instrument are unobservable in the marketplace and are considered significant to the overall fair value of the instrument. The fair value of these instruments may be based upon an internally developed price curve, which was constructed as a result of the long dated nature of the transaction or the illiquidity of the specific market point.
We have determined fair value amounts using available market information and appropriate valuation methodologies. However, considerable judgment is required in interpreting market data to develop the estimates of fair value. Accordingly, the estimates presented herein are not necessarily indicative of the amounts that we could realize in a current market exchange. The use of different market assumptions and/or estimation methods may have a material effect on the estimated fair value amounts.
The fair value of accounts receivable, accounts payable and short-term borrowings are not materially different from their carrying amounts because of the short-term nature of these instruments or the stated rates approximating market rates. Derivative instruments are carried at fair value.
We determine the fair value of our fixed-rate senior notes and junior subordinated notes based on quotes obtained from bond dealers. We determine the fair value of borrowings under our Credit Agreement based upon the discounted present value of expected future cash flows, taking into account the difference between the contractual borrowing spread and the spread for similar credit facilities available in the marketplace. We classify the fair values of our outstanding debt balances within Level 2 of the valuation hierarchy. As of December 31, 2017 and December 31, 2016, the carrying value and fair value of our total debt, including current maturities, were as follows:
December 31, 2017 | December 31, 2016 | |||||||||||||||
Carrying Value (a) | Fair Value | Carrying Value (a) | Fair Value | |||||||||||||
(millions) | ||||||||||||||||
Total debt | $ | 4,736 | $ | 4,885 | $ | 5,430 | $ | 5,395 | ||||||||
(a) Excludes unamortized issuance costs.
112
DCP MIDSTREAM, LP
NOTES TO CONSOLIDATED FINANCIAL STATEMENTS
Years Ended December 31, 2017, 2016 and 2015 - (Continued)
12. Debt
December 31, 2017 | December 31, 2016 | ||||||
(millions) | |||||||
Senior notes: | |||||||
Issued November 2012, interest at 2.500% payable semi-annually, due December 2017 | $ | — | $ | 500 | |||
Issued February 2009, interest at 9.750% payable semiannually, due March 2019 (a) | 450 | 450 | |||||
Issued March 2014, interest at 2.700% payable semi-annually, due April 2019 | 325 | 325 | |||||
Issued March 2010, interest at 5.350% payable semiannually, due March 2020 (a) | 600 | 600 | |||||
Issued September 2011, interest at 4.750% payable semiannually, due September 2021 | 500 | 500 | |||||
Issued March 2012, interest at 4.950% payable semi-annually, due April 2022 | 350 | 350 | |||||
Issued March 2013, interest at 3.875% payable semi-annually, due March 2023 | 500 | 500 | |||||
Issued August 2000, interest at 8.125% payable semi-annually, due August 2030 (a) | 300 | 300 | |||||
Issued October 2006, interest at 6.450% payable semi-annually, due November 2036 | 300 | 300 | |||||
Issued September 2007, interest at 6.750% payable semi-annually, due September 2037 | 450 | 450 | |||||
Issued March 2014, interest at 5.600% payable semi-annually, due April 2044 | 400 | 400 | |||||
Junior subordinated notes: | |||||||
Issued May 2013, interest at 5.850% payable semi-annually, due May 2043 | 550 | 550 | |||||
Credit agreement: | |||||||
Revolving credit facility, weighted-average variable interest rate of 2.010%, as of December 31, 2016, due December 2022 | — | 195 | |||||
Fair value adjustments related to interest rate swap fair value hedges (a) | 23 | 24 | |||||
Unamortized issuance costs | (29 | ) | (23 | ) | |||
Unamortized discount | (12 | ) | (14 | ) | |||
Total debt | 4,707 | 5,407 | |||||
Current maturities of long-term debt | — | 500 | |||||
Total long-term debt | $ | 4,707 | $ | 4,907 | |||
(a) The swaps associated with this debt were previously terminated. The remaining long-term fair value of approximately
$23 million related to the swaps is being amortized as a reduction to interest expense through 2019, 2020 and 2030, the original maturity dates of the debt.
Credit Agreement
We are a party to a $1.4 billion unsecured revolving Credit Agreement which matures on December 6, 2022. The Credit Agreement also grants us the option to increase the revolving loan commitment by an aggregate principal amount of up to $500 million, subject to requisite lender approval. The Credit Agreement may be extended for up to two additional one-year periods subject to requisite lender approval. Loans under the Credit Agreement may be used for working capital and other general partnership purposes including acquisitions.
The Credit Agreement allows for unrestricted cash and cash equivalents to be netted against consolidated indebtedness for purposes of calculating the Partnership’s Consolidated Leverage Ratio (as defined in the Credit Agreement). Additionally, under the Credit Agreement, the Consolidated Leverage Ratio of the Partnership as of the end of any fiscal quarter shall not exceed: (a) 5.75 to 1.0 for the fiscal quarter ended December 31, 2017 (b) 5.50 to 1.0 for the fiscal quarter ending March 31, 2018, (c) 5.25 to 1.0 for the fiscal quarter ending June 30, 2018, and (d) 5.00 to 1.0 for each fiscal quarter ending thereafter; provided that, if there is a Qualified Acquisition (as defined in the Credit Agreement) during any fiscal quarter ending June 30, 2018 or thereafter, the maximum Consolidated Leverage Ratio shall not exceed 5.50 to 1.0 at the end of the three consecutive fiscal quarters, including the fiscal quarter in which the Qualified Acquisition occurs.
113
DCP MIDSTREAM, LP
NOTES TO CONSOLIDATED FINANCIAL STATEMENTS
Years Ended December 31, 2017, 2016 and 2015 - (Continued)
Our cost of borrowing under the Credit Agreement is determined by a ratings-based pricing grid. Indebtedness under the Credit Agreement bears interest at either: (1) LIBOR, plus an applicable margin of 1.45% based on our current credit rating; or (2) (a) the base rate which shall be the higher of the prime rate, the Federal Funds rate plus 0.50% or the LIBOR Market Index rate plus 1%, plus (b) an applicable margin of 0.45% based on our current credit rating. The Credit Agreement incurs an annual facility fee of 0.30% based on our current credit rating. This fee is paid on drawn and undrawn portions of the approximately $1.4 billion revolving credit facility.
As of December 31, 2017, we had unused borrowing capacity of $1,375 million, net of $25 million of letters of credit, under the Credit Agreement. Our borrowing capacity may be limited by financial covenants set forth in the Credit Agreement. The financial covenants set forth in the Credit Agreement limit the Partnership's ability to incur incremental debt by the unused borrowing capacity of $1,375 million as of December 31, 2017. Except in the case of a default, amounts borrowed under our Credit Agreement will not become due prior to the December 6, 2022 maturity date.
Senior Notes and Junior Subordinated Notes
Our senior notes and junior subordinated notes, collectively referred to as our debt securities, mature and become payable on their respective due dates, and are not subject to any sinking fund or mandatory redemption provisions. The senior notes are senior unsecured obligations that are guaranteed by the Partnership and rank equally in a right of payment with our other senior unsecured indebtedness, including indebtedness under our Credit Agreement, and the junior subordinated notes are unsecured and rank subordinate in right of payment to all of our existing and future senior indebtedness. The debt securities include an optional redemption whereby we may elect to redeem the notes, in whole or in part from time-to-time for a premium. Additionally, we may defer the payment of all or part of the interest on the junior subordinated notes for one or more periods up to five consecutive years. The underwriters’ fees and related expenses are recorded in our consolidated balance sheets within the carrying amount of long-term debt and will be amortized over the term of the notes.
The maturities of our long-term debt are as follows:
Debt Maturities | |||
(millions) | |||
2018 | $ | — | |
2019 | 775 | ||
2020 | 600 | ||
2021 | 500 | ||
2022 | 350 | ||
Thereafter | 2,500 | ||
Total long-term debt | $ | 4,725 | |
13. Risk Management and Hedging Activities
Our operations expose us to a variety of risks including but not limited to changes in the prices of commodities that we buy or sell, changes in interest rates, and the creditworthiness of each of our counterparties. We manage certain of these exposures with either physical or financial transactions. We have established a comprehensive risk management policy and a risk management committee, or the Risk Management Committee, to monitor and manage market risks associated with commodity prices and counterparty credit. The Risk Management Committee is composed of senior executives who receive regular briefings on positions and exposures, credit exposures and overall risk management in the context of market activities. The Risk Management Committee is responsible for the overall management of credit risk and commodity price risk, including monitoring exposure limits. The following describes each of the risks that we manage.
Commodity Price Risk
Our portfolio of commodity derivative activity is primarily accounted for using the mark-to-market method of accounting; however, depending upon our risk profile and objectives, in certain limited cases, we may execute transactions that qualify for the hedge method of accounting. The risks, strategies and instruments used to mitigate such risks, as well as the method of accounting are discussed and summarized below.
114
DCP MIDSTREAM, LP
NOTES TO CONSOLIDATED FINANCIAL STATEMENTS
Years Ended December 31, 2017, 2016 and 2015 - (Continued)
Natural Gas Asset Based Trading and Marketing
Our natural gas storage and pipeline assets are exposed to certain risks including changes in commodity prices. We manage commodity price risk related to our natural gas storage and pipeline assets through our commodity derivative program. The commercial activities related to our natural gas storage and pipeline assets primarily consist of the purchase and sale of gas and associated time spreads and basis spreads.
A time spread transaction is executed by establishing a long gas position at one point in time and establishing an equal short gas position at a different point in time. Time spread transactions allow us to lock in a margin supported by the injection, withdrawal, and storage capacity of our natural gas storage assets. We may execute basis spread transactions to mitigate the risk of sale and purchase price differentials across our system. A basis spread transaction allows us to lock in a margin on our physical purchases and sales of gas, including injections and withdrawals from storage. We typically use swaps to execute these transactions, which are not designated as hedging instruments and are recorded at fair value with changes in fair value recorded in the current period consolidated statements of operations. While gas held in our storage locations is recorded at the lower of average cost or market, the derivative instruments that are used to manage our storage facilities are recorded at fair value and any changes in fair value are currently recorded in our consolidated statements of operations. Even though we may have economically hedged our exposure and locked in a future margin, the use of lower-of-cost-or-market accounting for our physical inventory and the use of mark-to-market accounting for our derivative instruments may subject our earnings to market volatility.
Commodity Cash Flow Hedges
In order for our natural gas storage facility to remain operational, a minimum level of base gas must be maintained in each storage cavern, which is capitalized on our consolidated balance sheets as a component of property, plant and equipment, net. During construction or expansion of our storage caverns, we may execute a series of derivative financial instruments to mitigate a portion of the risk associated with the forecasted purchase of natural gas when we bring the storage caverns into operation. These derivative financial instruments may be designated as cash flow hedges. While the cash paid upon settlement of these hedges economically fixes the cash required to purchase base gas, the deferred losses or gains would remain in accumulated other comprehensive income, or AOCI, until the cavern is emptied and the base gas is sold. The balance in AOCI of our previously settled base gas cash flow hedges was in a loss position of $6 million as of December 31, 2017.
Commodity Cash Flow Protection Activities
We are exposed to the impact of market fluctuations in the prices of natural gas, NGLs and condensate as a result of our gathering, processing, sales and storage activities. For gathering, processing and storage services, we may receive cash or commodities as payment for these services, depending on the contract type. We may enter into derivative financial instruments to mitigate a portion of the risk of weakening natural gas, NGL and condensate prices associated with our gathering, processing and sales activities, thereby stabilizing our cash flows. Our derivative financial instruments used to mitigate a portion of the risk of weakening natural gas, NGL and condensate prices extend through the first quarter of 2019. The commodity derivative instruments used for our hedging programs are a combination of direct NGL product, crude oil and natural gas hedges. Crude oil and NGL transactions are primarily accomplished through the use of forward contracts that effectively exchange floating price risk for a fixed price. The type of instrument used to mitigate a portion of the risk may vary depending on our risk management objectives. These transactions are not designated as hedging instruments for accounting purposes and the change in fair value is reflected in the current period within our consolidated statements of operations as trading and marketing gains and (losses), net.
NGL Proprietary Trading
Our NGL proprietary trading activity includes trading energy related products and services. We undertake these activities through the use of fixed forward sales and purchases, basis and spread trades, storage opportunities, put/call options, term contracts and spot market trading. These energy trading operations are exposed to market variables and commodity price risk with respect to these products and services, and these operations may enter into physical contracts and financial instruments with the objective of realizing a positive margin from the purchase and sale of commodity-based instruments. These physical and financial instruments are not designated as hedging instruments and are recorded at fair value with changes in fair value recorded in the current period consolidated statements of operations.
115
DCP MIDSTREAM, LP
NOTES TO CONSOLIDATED FINANCIAL STATEMENTS
Years Ended December 31, 2017, 2016 and 2015 - (Continued)
We employ established risk limits, policies and procedures to manage risks associated with our natural gas asset based trading and marketing and NGL proprietary trading.
Interest Rate Risk
We enter into debt arrangements that have either fixed or floating rates, therefore we are exposed to market risks related to changes in interest rates. We periodically use interest rate swaps to convert our floating rate debt to fixed-rate debt or to convert our fixed-rate debt to floating rate debt. Our primary goals include: (1) maintaining an appropriate ratio of fixed-rate debt to floating-rate debt; (2) reducing volatility of earnings resulting from interest rate fluctuations; and (3) locking in attractive interest rates.
We previously had interest rate cash flow hedges and fair value hedges in place that were terminated. As the underlying transactions impact earnings, the remaining net loss deferred in AOCI relative to these cash flow hedges will be reclassified to interest expense, net from 2022 through 2030 and the remaining net loss included in long-term debt relative to these fair value hedges will be reclassified to interest expense, net from 2019 through 2030, the original maturity dates of the debt.
Credit Risk
Our principal customers range from large, natural gas marketers to industrial end-users for our natural gas products and services, as well as large multi-national petrochemical and refining companies, to small regional propane distributors for our NGL products and services. Substantially all of our natural gas and NGL sales are made at market-based prices. Approximately 22% of our NGL production was committed to Phillips 66 and CPChem as of December 31, 2017. This concentration of credit risk may affect our overall credit risk, in that these customers may be similarly affected by changes in economic, regulatory or other factors. Where exposed to credit risk, we analyze the counterparties’ financial condition prior to entering into an agreement, establish credit limits and monitor the appropriateness of these limits on an ongoing basis. We may use various master agreements that include language giving us the right to request collateral to mitigate credit exposure. The collateral language provides for a counterparty to post cash or letters of credit for exposure in excess of the established threshold. The threshold amount represents an open credit limit, determined in accordance with our credit policy. The collateral language also provides that the inability to post collateral is sufficient cause to terminate a contract and liquidate all positions. In addition, our master agreements and our standard gas and NGL sales contracts contain adequate assurance provisions, which allow us to suspend deliveries and cancel agreements, or continue deliveries to the buyer after the buyer provides security for payment in a satisfactory form.
Contingent Credit Features
Each of the above risks is managed through the execution of individual contracts with a variety of counterparties. Certain of our derivative contracts may contain credit-risk related contingent provisions that may require us to take certain actions in certain circumstances.
We have International Swaps and Derivatives Association, or ISDA, contracts which are standardized master legal arrangements that establish key terms and conditions which govern certain derivative transactions. These ISDA contracts contain standard credit-risk related contingent provisions. Some of the provisions we are subject to are outlined below.
• | If we were to have an effective event of default under our Credit Agreement that occurs and is continuing, our ISDA counterparties may have the right to request early termination and net settlement of any outstanding derivative liability positions. |
• | Our ISDA counterparties generally have collateral thresholds of zero, requiring us to fully collateralize any commodity contracts in a net liability position, when our credit rating is below investment grade. |
• | Additionally, in some cases, our ISDA contracts contain cross-default provisions that could constitute a credit-risk related contingent feature. These provisions apply if we default in making timely payments under other credit arrangements and the amount of the default is above certain predefined thresholds, which are significantly high and are generally consistent with the terms of our Credit Agreement. As of December 31, 2017, we were not a party to any agreements that would trigger the cross-default provisions. |
Our commodity derivative contracts that are not governed by ISDA contracts do not have any credit-risk related contingent features. Depending upon the movement of commodity prices and interest rates, each of our individual contracts
116
DCP MIDSTREAM, LP
NOTES TO CONSOLIDATED FINANCIAL STATEMENTS
Years Ended December 31, 2017, 2016 and 2015 - (Continued)
with counterparties to our commodity derivative instruments or interest rate swap instruments are in either a net asset or net liability position. As of December 31, 2017, we had less than $1 million of individual commodity derivative contracts that contain credit-risk related contingent features that were in a net liability position. If we were required to net settle our position with an individual counterparty, due to a credit-risk related event, our ISDA contracts may permit us to net all outstanding contracts with that counterparty, whether in a net asset or net liability position, as well as any cash collateral already posted. As of December 31, 2017, we have not been required to post additional collateral. Although our commodity derivative contracts that contain credit-risk related contingent features were in a net liability position as of December 31, 2017, the net liability position would be offset by contracts in a net asset position.
Collateral
As of December 31, 2017, we had cash deposits of $75 million, included in collateral cash deposits in our consolidated balance sheets, and letters of credit of $13 million with counterparties to secure our obligations to provide future services or to perform under financial contracts. Additionally, as of December 31, 2017, we held cash of $18 million, included in other current liabilities in our consolidated balance sheet, related to cash postings by third parties and letters of credit of $53 million from counterparties to secure their future performance under financial or physical contracts. Collateral amounts held or posted may be fixed or may vary, depending on the value of the underlying contracts, and could cover normal purchases and sales, services, trading and hedging contracts. In many cases, we and our counterparties have publicly disclosed credit ratings, which may impact the amounts of collateral requirements.
Physical forward contracts and financial derivatives are generally cash settled at the expiration of the contract term. These transactions are generally subject to specific credit provisions within the contracts that would allow the seller, at its discretion, to suspend deliveries, cancel agreements or continue deliveries to the buyer after the buyer provides security for payment satisfactory to the seller.
Offsetting
Certain of our derivative instruments are subject to a master netting or similar arrangement, whereby we may elect to settle multiple positions with an individual counterparty through a single net payment. Each of our individual derivative instruments are presented on a gross basis on the consolidated balance sheets, regardless of our ability to net settle our positions. Instruments that are governed by agreements that include net settle provisions allow final settlement, when presented with a termination event, of outstanding amounts by extinguishing the mutual debts owed between the parties in exchange for a net amount due. We have trade receivables and payables associated with derivative instruments, subject to master netting or similar agreements, which are not included in the table below. The following summarizes the gross and net amounts of our derivative instruments:
December 31, 2017 | December 31, 2016 | ||||||||||||||||||||||
Gross Amounts of Assets and (Liabilities) Presented in the Balance Sheet | Amounts Not Offset in the Balance Sheet - Financial Instruments | Net Amount | Gross Amounts of Assets and (Liabilities) Presented in the Balance Sheet | Amounts Not Offset in the Balance Sheet - Financial Instruments | Net Amount | ||||||||||||||||||
(millions) | |||||||||||||||||||||||
Assets: | |||||||||||||||||||||||
Commodity derivatives | $ | 33 | $ | — | $ | 33 | $ | 47 | $ | — | $ | 47 | |||||||||||
Liabilities: | |||||||||||||||||||||||
Commodity derivatives | $ | (91 | ) | $ | — | $ | (91 | ) | $ | (92 | ) | $ | — | $ | (92 | ) | |||||||
117
DCP MIDSTREAM, LP
NOTES TO CONSOLIDATED FINANCIAL STATEMENTS
Years Ended December 31, 2017, 2016 and 2015 - (Continued)
Summarized Derivative Information
The fair value of our derivative instruments that are marked-to-market each period, as well as the location of each within our consolidated balance sheets, by major category, is summarized below. We have no derivative instruments that are designated as hedging instruments for accounting purposes as of December 31, 2017 and December 31, 2016.
Balance Sheet Line Item | December 31, 2017 | December 31, 2016 | Balance Sheet Line Item | December 31, 2017 | December 31, 2016 | ||||||||||||
(millions) | (millions) | ||||||||||||||||
Derivative Assets Not Designated as Hedging Instruments: | Derivative Liabilities Not Designated as Hedging Instruments: | ||||||||||||||||
Commodity derivatives: | Commodity derivatives: | ||||||||||||||||
Unrealized gains on derivative instruments — current | $ | 30 | $ | 42 | Unrealized losses on derivative instruments — current | $ | (76 | ) | $ | (91 | ) | ||||||
Unrealized gains on derivative instruments — long-term | 3 | 5 | Unrealized losses on derivative instruments — long-term | (15 | ) | (1 | ) | ||||||||||
Total | $ | 33 | $ | 47 | Total | $ | (91 | ) | $ | (92 | ) | ||||||
The following summarizes the balance and activity within AOCI relative to our interest rate, commodity and foreign currency cash flow hedges as of and for the year ended December 31, 2017:
Interest Rate Cash Flow Hedges | Commodity Cash Flow Hedges | Foreign Currency Cash Flow Hedges (a) | Total | ||||||||||||
(millions) | |||||||||||||||
Net deferred (losses) gains in AOCI (beginning balance) | $ | (3 | ) | $ | (6 | ) | $ | 1 | $ | (8 | ) | ||||
Losses reclassified from AOCI to earnings — effective portion | 1 | — | — | 1 | |||||||||||
Deficit purchase price under carrying value of the Transaction | $ | (2 | ) | $ | — | $ | — | $ | (2 | ) | |||||
Net deferred (losses) gains in AOCI (ending balance) | $ | (4 | ) | $ | (6 | ) | $ | 1 | $ | (9 | ) | ||||
(a)Relates to Discovery, an unconsolidated affiliate
The following summarizes the balance and activity within AOCI relative to our interest rate, commodity and foreign currency cash flow hedges as of and for the year ended December 31, 2016:
Interest Rate Cash Flow Hedges | Commodity Cash Flow Hedges | Foreign Currency Cash Flow Hedges (a) | Total | ||||||||||||
(millions) | |||||||||||||||
Net deferred (losses) gains in AOCI (beginning balance) | $ | (3 | ) | $ | (6 | ) | $ | 1 | $ | (8 | ) | ||||
Net deferred (losses) gains in AOCI (ending balance) | $ | (3 | ) | $ | (6 | ) | $ | 1 | $ | (8 | ) | ||||
(a) | Relates to Discovery, an unconsolidated affiliate. |
For the years ended December 31, 2017 and 2016, no derivative losses attributable to the ineffective portion or to amounts excluded from effectiveness testing were recognized in trading and marketing gains or losses, net or interest expense in our consolidated statements of operations. For the years ended December 31, 2017 and 2016, no derivative losses were reclassified from AOCI to trading and marketing gains or losses, net or interest expense as a result of the discontinuance of cash flow hedges related to certain forecasted transactions that are not probable of occurring.
118
DCP MIDSTREAM, LP
NOTES TO CONSOLIDATED FINANCIAL STATEMENTS
Years Ended December 31, 2017, 2016 and 2015 - (Continued)
Changes in the value of derivative instruments, for which the hedge method of accounting has not been elected from one period to the next, are recorded in the consolidated statements of operations. The following summarizes these amounts and the location within the consolidated statements of operations that such amounts are reflected:
Commodity Derivatives: Statements of Operations Line Item | Year Ended December 31, | |||||||||||
2017 | 2016 | 2015 | ||||||||||
(millions) | ||||||||||||
Realized (losses) gains | $ | (12 | ) | $ | 116 | $ | 73 | |||||
Unrealized (losses) gains | (28 | ) | (139 | ) | 46 | |||||||
Trading and marketing (losses) gains, net | $ | (40 | ) | $ | (23 | ) | $ | 119 | ||||
We do not have any derivative financial instruments that qualify as a hedge of a net investment.
The following tables represent, by commodity type, our net long or short positions that are expected to partially or entirely settle in each respective year. To the extent that we have long dated derivative positions that span multiple calendar years, the contract will appear in more than one line item in the tables below.
December 31, 2017 | |||||||||||
Crude Oil | Natural Gas | Natural Gas Liquids | Natural Gas Basis Swaps | ||||||||
Year of Expiration | Net Short Position (Bbls) | Net Short Position (MMBtu) | Net (Short) Long Position (Bbls) | Net Long Position (MMBtu) | |||||||
2018 | (2,701,000 | ) | (35,977,400 | ) | (19,656,392 | ) | 3,202,500 | ||||
2019 | (631,000 | ) | — | (2,357,156 | ) | 7,177,500 | |||||
2020 | (50,000 | ) | — | 238,548 | 3,660,000 | ||||||
December 31, 2016 | |||||||||||
Crude Oil | Natural Gas | Natural Gas Liquids | Natural Gas Basis Swaps | ||||||||
Year of Expiration | Net Short Position (Bbls) | Net Short Position (MMBtu) | Net (Short) Long Position (Bbls) | Net (Short) Long Position (MMBtu) | |||||||
2017 | (1,470,000 | ) | (44,981,850 | ) | (22,225,821 | ) | 6,510,000 | ||||
2018 | (251,000 | ) | — | 144,805 | 912,500 | ||||||
2019 | (40,000 | ) | — | (2,203 | ) | — | |||||
2020 | (50,000 | ) | — | 240,000 | — | ||||||
14. Partnership Equity and Distributions
Preferred Units — On November 20, 2017, we issued 500,000 of our Series A Preferred Units representing limited partnership interests at a price of $1,000 per unit. We used the net proceeds of $487 million from the issuance of the Series A Preferred Units to partially repay the $500 million 2.50% Senior Notes which were due on December 1, 2017.
Distributions of the Series A Preferred Units are payable out of available cash, accrue and are cumulative from the date of original issuance of the Series A Preferred Units and are payable in arrears on June 15th and December 15th through and including December 15, 2022, and, after December 15, 2022, quarterly in arrears on March 15th, June 15th, September 15th, and December 15th of each year to holders of record as of the close of business on the first business day of the month. The initial distribution rate will be 7.375% per year of the $1,000 liquidation preference per unit (equal to $73.75 per unit). On and after December 15, 2022, distributions will accumulate at a percentage of the $1,000 liquidation preference equal to an annual floating rate of the three-month LIBOR plus a spread of 5.148%. The Series A Preferred Units rank senior to our common units with respect to distribution rights and rights upon liquidation.
At any time prior to December 15, 2022, within 120 days of a ratings event, we may, at our option, redeem the Series A Preferred Units in whole, but not in part, at a redemption price per unit equal to $1,020 (102% of the liquidation preference), plus an amount equal to all accumulated and unpaid distributions. At any time on or after December 15, 2022, we may redeem, in whole or in part, the units at a redemption price of $1,000 per unit, plus an amount equal to all accumulated and unpaid
119
DCP MIDSTREAM, LP
NOTES TO CONSOLIDATED FINANCIAL STATEMENTS
Years Ended December 31, 2017, 2016 and 2015 - (Continued)
distributions. Upon occurrence of a change in control triggering event, we may, at our option, (i) redeem the Series A Preferred Units, in whole or in part, within 120 days, by paying $1,000 per unit, plus all accumulated and unpaid distributions, and (ii) each holder of Series A Preferred Units will have the right (unless the Partnership provided notice of its election to redeem such holder’s Series A Preferred Units) to convert some or all of the Series A Preferred Units held by such holder on the change of control conversion date into a number of the Partnership’s common units per Series A Preferred Unit as defined in our Partnership Agreement. Holders of the Series A Preferred Units have no voting rights except for certain limited protective voting rights set forth in our Partnership Agreement.
Common Units — In January 2017, we issued 28,552,480 common units to DCP Midstream, LLC and 2,550,644 general partner units to the General Partner in a private placement as consideration for the Transaction that closed on January 1, 2017. For additional information regarding the Transaction, see Note 4 - Acquisitions.
During the years ended December 31, 2017 and 2016, we issued no common units pursuant to our 2014 equity distribution agreement. As of December 31, 2017, approximately $750 million of common units remained available for sale pursuant to our at-the-market program. During the year ended December 31, 2015, we issued 788,033 common units pursuant to our 2014 equity distribution agreement and received proceeds of $31 million, net of commissions and offering costs of less than $1 million.
Definition of Available Cash — Our Partnership Agreement requires that, within 45 days after the end of each quarter, we distribute all of our Available Cash, as defined in the Partnership Agreement, to unitholders of record on the applicable record date, as determined by our general partner. Available Cash, for any quarter, consists of all cash and cash equivalents on hand at the end of that quarter:
• | less the amount of cash reserves established by our general partner to: |
• | provide for the proper conduct of our business, including reserves for future capital expenditures and anticipated credit needs; |
• | comply with applicable law or any debt instrument or other agreement or obligation; |
• | provide funds to make payments on the 7.375% Series A Fixed-to-Floating Rate Cumulative Redeemable Perpetual Preferred Units; or |
• | provide funds for distributions to our common unitholders and to our general partner for any one or more of the next four quarters. |
• | plus, if our general partner so determines, all or a portion of cash and cash equivalents on hand on the date of determination of Available Cash for the quarter. |
General Partner Interest and Incentive Distribution Rights - The general partner is entitled to a percentage of all quarterly distributions equal to its general partner interest of approximately 2% and limited partner interest of approximately 36% as of December 31, 2017. The general partner has the right, but not the obligation, to contribute a proportionate amount of capital to us to maintain its current general partner or limited partner interest.
The incentive distribution rights held by the general partner entitle it to receive an increasing share of Available Cash when pre-defined distribution targets are achieved. Currently, our distribution to our general partner related to its incentive distribution rights is at the highest level. The general partner’s incentive distribution rights were not reduced as a result of our common unit issuances, and will not be reduced if we issue additional units in the future and the general partner does not contribute a proportionate amount of capital to us to maintain its current general partner interest. Please read the Distributions of Available Cash sections below for more details about the distribution targets and their impact on the general partner’s incentive distribution rights.
As part of the Transaction, Phillips 66 and Enbridge agreed, if required, to provide a reduction to incentive distributions payable to our General Partner under our Partnership Agreement of up to $100 million annually through 2019 to target an approximate 1.0 times distribution coverage ratio. Under the terms of our amended Partnership Agreement, the amount of incentive distributions paid to our General Partner will be evaluated by our General Partner on both a quarterly and annual basis and may be reduced each quarter by an amount determined by our General Partner (the “IDR giveback”). If no determination is made by our General Partner, the quarterly IDR giveback will be $20 million. The IDR giveback, of up to $100 million annually, will be subject to a true-up at the end of the year by taking our total distributable cash flow (as adjusted under our
120
DCP MIDSTREAM, LP
NOTES TO CONSOLIDATED FINANCIAL STATEMENTS
Years Ended December 31, 2017, 2016 and 2015 - (Continued)
amended Partnership Agreement) less the total annual distribution payable to our unitholders, adjusted to target an approximate 1.0 times coverage ratio. Distributions paid to the holders of the Partnership's incentive distribution rights were reduced by $40 million during the year ended December 31, 2017, in accordance with the Third Amendment to the Partnership Agreement.
Distributions of Available Cash - Our Partnership Agreement, after adjustment for the general partner’s relative ownership level, requires that we make distributions of Available Cash from operating surplus for any quarter in the following manner:
• | first, to all unitholders and the general partner, in accordance with their pro rata interest, until each unitholder receives a total of $0.4025 per unit for that quarter; |
• | second, 13% to the general partner, plus the general partner’s pro rata interest, and the remainder to all unitholders pro rata until each unitholder receives a total of $0.4375 per unit for that quarter; |
• | third, 23% to the general partner, plus the general partner’s pro rata interest, and the remainder to all unitholders pro rata until each unitholder receives a total of $0.525 per unit for that quarter; and |
• | thereafter, 48% to the general partner, plus the general partner’s pro rata interest, and the remainder to all unitholders. |
The following table presents our cash distributions paid in 2017, 2016 and 2015:
Payment Date | Per Unit Distribution | Total Cash Distribution | |||||
(millions) | |||||||
November 14, 2017 | $ | 0.7800 | $ | 155 | |||
August 14, 2017 | $ | 0.7800 | $ | 134 | |||
May 15, 2017 | $ | 0.7800 | $ | 135 | |||
February 14, 2017 | $ | 0.7800 | $ | 121 | |||
November 14, 2016 | $ | 0.7800 | $ | 120 | |||
August 12, 2016 | $ | 0.7800 | $ | 121 | |||
May 13, 2016 | $ | 0.7800 | $ | 121 | |||
February 12, 2016 | $ | 0.7800 | $ | 121 | |||
November 13, 2015 | $ | 0.7800 | $ | 120 | |||
August 14, 2015 | $ | 0.7800 | $ | 121 | |||
May 15, 2015 | $ | 0.7800 | $ | 121 | |||
February 13, 2015 | $ | 0.7800 | $ | 120 | |||
15. Equity-Based Compensation
On April 28, 2016, the unitholders of the Partnership approved the 2016 Long-Term Incentive Plan (the “2016 LTIP”), which replaced the 2005 Long-Term Incentive Plan that expired pursuant to its terms at the end of 2015 (the “2005 LTIP” and, together with the 2012 LTIP and the 2016 LTIP, the “LTIP”). Any outstanding awards under the 2005 LTIP will remain outstanding and settle according to the terms of such grant. The 2016 plan authorizes up to 900,000 common units to be available for issuance under awards to employees, officers, and non-employee directors of the General Partner and its affiliates. Awards under the 2016 LTIP may include unit options, phantom units, restricted units, distribution equivalent rights, unit bonuses, common unit awards, and performance awards. The 2016 LTIP will expire on the earlier of the date it is terminated by the board of directors of the General Partner or the date that all common units available under the plan have been paid or issued.
On November 28, 2005, the board of directors of the General Partner adopted the 2005 LTIP, for employees, consultants and directors of our General Partner and its affiliates who perform services for us. The 2005 LTIP provides for the grant of limited partner units, or LPUs, phantom units, unit options and substitute awards, and, with respect to unit options and phantom units, the grant of dividend equivalent rights, or DERs. The 2005 LTIP phantom units consist of a notional unit based on the value of the Partnership's common units. Subject to adjustment for certain events, an aggregate of 850,000 LPUs may be issued and delivered pursuant to awards under the 2005 LTIP. Awards that are canceled or forfeited, or are withheld to satisfy the General Partner’s tax withholding obligations, are available for delivery pursuant to other awards. On February 15, 2012, the board of directors of our General Partner adopted the 2012 LTIP (the "2012 LTIP") for employees, consultants and directors of our General Partner and its affiliates who perform services for us. The 2012 LTIP provided for the grant of phantom units and
121
DCP MIDSTREAM, LP
NOTES TO CONSOLIDATED FINANCIAL STATEMENTS
Years Ended December 31, 2017, 2016 and 2015 - (Continued)
DERs. The 2012 LTIP phantom units consist of a notional unit based on the value of common units or shares of Phillips 66 and Spectra Energy. The LTIPs were administered by the compensation committee of the General Partner’s board of directors through 2012, and by the General Partner’s board of directors beginning in 2013. All awards under the LTIPs are subject to cliff vesting.
Since we have the intent and ability to settle certain awards within our control in units, we classify them as equity awards based on their fair value. The fair value of our equity awards is determined based on the closing price of our common units on the grant date. Compensation expense on equity awards is recognized ratably over each vesting period. We account for other awards which are subject to settlement in cash, including DERs, as liability awards. Compensation expense on these awards is recognized ratably over each vesting period, and will be re-measured each reporting period for all awards outstanding until the units are vested. The fair value of all liability awards is determined based on the closing price of our common units at each measurement date.
Under DCP Midstream, LLC's Long-Term Incentive Plan ("DCP Midstream LTIP"), awards may be granted to key employees. The DCP Midstream LTIP provides for the grant of Strategic Performance Units ("SPUs") and Phantom Units. The SPUs and Phantom Units consist of a notional unit based on the weighted average value of common shares of Phillips 66 and Enbridge as of the grant date. Each award provides for the grant of dividend or distribution equivalent rights, or DERs. The DCP Midstream LTIP is administered by the compensation committee of DCP Midstream, LLC's board of directors. All awards are subject to cliff vesting.
Liability classified equity-based compensation expense was $23 million, $18 million and $8 million for the years ended December 31, 2017, 2016 and 2015, respectively.
122
DCP MIDSTREAM, LP
NOTES TO CONSOLIDATED FINANCIAL STATEMENTS
Years Ended December 31, 2017, 2016 and 2015 - (Continued)
The following table presents the fair value of unvested unit-based awards related to the strategic performance units and phantom units:
Vesting Period (years) | Unrecognized Compensation Expense at December 31, 2017 (millions) | Estimated Forfeiture Rate | Weighted-Average Remaining Vesting (years) | ||||||
DCP Midstream LTIP: | |||||||||
SPUs | 3 | $ | 7 | 0%-11% | 2 | ||||
Phantom Units | 1-3 | $ | 4 | 0%-11% | 2 | ||||
Strategic Performance Units - The number of SPUs that will ultimately vest range in value of up to 200% of the outstanding SPUs, depending on the achievement of specified performance targets over a three year period. The final performance payout is determined by the compensation committee of our General Partner. The DERs are paid in cash at the end of the performance period. The following table presents information related to SPUs:
Units | Grant Date Weighted-Average Price Per Unit | Measurement Date Weighted-Average Price Per Unit | |||||||||
Outstanding at January 1, 2015 | 219,363 | $ | 47.89 | ||||||||
Granted | 111,930 | $ | 43.25 | ||||||||
Forfeited | (29,283 | ) | $ | 48.02 | |||||||
Vested (a) | (93,551 | ) | $ | 41.02 | |||||||
Outstanding at December 31, 2015 | 208,459 | $ | 48.46 | ||||||||
Granted | 131,610 | $ | 45.31 | ||||||||
Forfeited | (8,463 | ) | $ | 46.27 | |||||||
Vested (b) | (98,295 | ) | $ | 54.05 | |||||||
Outstanding at December 31, 2016 | 233,311 | $ | 44.41 | ||||||||
Granted | 98,628 | $ | 76.38 | ||||||||
Forfeited | (18,577 | ) | $ | 50.31 | |||||||
Vested (c) | (98,627 | ) | $ | 58.80 | |||||||
Outstanding at December 31, 2017 | 214,735 | $ | 51.98 | $ | 55.61 | ||||||
Expected to vest | 161,909 | $ | 54.52 | $ | 59.37 | ||||||
(a) The 2013 grants vested at 115%.
(b) The 2014 grants vested at 130%.
(c) The 2015 grants vested at 180%.
The estimate of SPUs that are expected to vest is based on highly subjective assumptions that could change over time, including the expected forfeiture rate and achievement of performance targets.
The following table presents the fair value of units vested and the unit-based liabilities paid for unit-based awards related to the strategic performance units:
Units | Fair Value of Units Vested | Unit-Based Liabilities Paid | ||||||||
(millions) | ||||||||||
Vested or paid in cash in 2015 | 93,551 | $ | 4 | $ | 7 | |||||
Vested or paid in cash in 2016 | 98,295 | $ | 7 | $ | 4 | |||||
Vested or paid in cash in 2017 | 98,627 | $ | 11 | $ | 7 | |||||
123
DCP MIDSTREAM, LP
NOTES TO CONSOLIDATED FINANCIAL STATEMENTS
Years Ended December 31, 2017, 2016 and 2015 - (Continued)
Phantom Units - The DERs are paid quarterly in arrears. The following table presents information related to Phantom Units:
Units | Grant Date Weighted-Average Price Per Unit | Measurement Date Weighted-Average Price Per Unit | ||||||||
Outstanding at January 1, 2015 | 171,202 | $ | 48.11 | |||||||
Granted | 147,540 | $ | 47.84 | |||||||
Forfeited | (17,400 | ) | $ | 48.40 | ||||||
Vested | (96,974 | ) | $ | 44.00 | ||||||
Outstanding at December 31, 2015 | 204,368 | $ | 49.85 | |||||||
Granted | 132,870 | $ | 45.33 | |||||||
Forfeited | (3,240 | ) | $ | 48.62 | ||||||
Vested | (126,681 | ) | $ | 50.13 | ||||||
Outstanding at December 31, 2016 | 207,317 | $ | 46.80 | |||||||
Granted | 180,337 | $ | 59.43 | |||||||
Forfeited | (16,677 | ) | $ | 51.73 | ||||||
Vested | (169,896 | ) | $ | 53.35 | ||||||
Outstanding at December 31, 2017 | 201,081 | $ | 52.18 | $ | 62.56 | |||||
Expected to vest | 188,605 | $ | 52.13 | $ | 62.99 | |||||
The following table presents the fair value of units vested and the unit-based liabilities paid for unit based awards related to the phantom units:
Units | Fair Value of Units Vested | Unit-Based Liabilities Paid | ||||||||
(millions) | ||||||||||
Vested or paid in cash in 2015 | 96,974 | $ | 3 | $ | 5 | |||||
Vested or paid in cash in 2016 | 126,681 | $ | 4 | $ | 5 | |||||
Vested or paid in cash in 2017 | 169,896 | $ | 7 | $ | 4 | |||||
16. Benefits
We do not have our own employees. The employees supporting our operations are employees of DCP Services, LLC, for which we incur charges under the Services Agreement. All DCP Services, LLC employees who have reached the age of 18 and work at least 20 hours per week are eligible for participation in the 401(k) and retirement plan, to which a range of 4% to 7% of each eligible employee’s qualified earnings is contributed to the retirement plan, based on years of service. All new employees are automatically enrolled in the 401(k) plan at a 6% contribution level. Employees can opt out of these contribution level or change it at any time. Additionally, DCP Services, LLC matches employees’ contributions in the 401(k) plan up to 6% of qualified earnings. During the years ended December 31, 2017, 2016 and 2015, we expensed plan contributions of $29 million, $29 million and $32 million, respectively.
DCP Services, LLC offers certain eligible executives the opportunity to participate in the EDC Plan. The EDC Plan allows participants to defer current compensation on a pre-tax basis and to receive tax deferred earnings on such contributions. The EDC Plan also has make-whole provisions for plan participants who may otherwise be limited in the amount that we can contribute to the 401(k) plan on the participant’s behalf.
124
DCP MIDSTREAM, LP
NOTES TO CONSOLIDATED FINANCIAL STATEMENTS
Years Ended December 31, 2017, 2016 and 2015 - (Continued)
17. Net Income or Loss per Limited Partner Unit
Our net income or loss is allocated to the general partner and the limited partners in accordance with their respective ownership percentages, after allocating Available Cash generated during the period in accordance with our Partnership Agreement.
Securities that meet the definition of a participating security are required to be considered for inclusion in the computation of basic earnings per unit using the two-class method. Under the two-class method, earnings per unit is calculated as if all of the earnings for the period were distributed under the terms of the Partnership Agreement, regardless of whether the general partner has discretion over the amount of distributions to be made in any particular period, whether those earnings would actually be distributed during a particular period from an economic or practical perspective, or whether the general partner has other legal or contractual limitations on its ability to pay distributions that would prevent it from distributing all of the earnings for a particular period.
These required disclosures do not impact our overall net income or loss or other financial results; however, in periods in which aggregate net income exceeds our Available Cash it will have the impact of reducing net income per LPU.
Basic and diluted net income or loss per LPU is calculated by dividing net income or loss allocable to limited partners, by the weighted-average number of outstanding LPUs during the period. Diluted net income or loss per LPU is computed based on the weighted average number of units plus the effect of dilutive potential units outstanding during the period using the two-class method. Dilutive potential units include outstanding awards under the LTIP.
18. Income Taxes
We are structured as a master limited partnership with sufficient qualifying income, which is a pass-through entity for federal income tax purposes. We owned a corporation that filed its own federal, foreign and state corporate income tax returns. During the year ended December 31, 2016, we elected to convert the corporation to a limited liability company for federal income tax purposes. The income tax (expense) benefit related to this corporation is included in our income tax (expense) benefit, along with state and local taxes of the limited liability entities.
Income tax (expense) benefit consists of the following:
Year Ended December 31, | |||||||||||
2017 | 2016 | 2015 | |||||||||
(millions) | |||||||||||
Current: | |||||||||||
Federal income tax expense | $ | — | $ | (19 | ) | $ | — | ||||
State income tax expense | (1 | ) | (2 | ) | — | ||||||
Deferred: | |||||||||||
Federal income tax (expense) benefit | — | (22 | ) | 97 | |||||||
State income tax (expense) benefit | (1 | ) | (3 | ) | 5 | ||||||
Total income tax (expense) benefit | $ | (2 | ) | $ | (46 | ) | $ | 102 | |||
As of December 31, 2017 and 2016, we had state deferred tax liabilities of $29 million and $28 million, respectively. The state deferred tax liabilities are primarily associated with Texas franchise taxes. During the year ended December 31, 2016, we recorded a reduction to our net federal deferred tax asset of $58 million resulting from the conversion of our corporation to a limited liability company.
Our effective tax rate differs from statutory rates, primarily due to being structured as a master limited partnership, which is a pass-through entity for federal income tax purposes, while being treated as a taxable entity in certain states, primarily Texas. The State of Texas imposes a margin tax that is assessed at 0.75%, of taxable margin apportioned to Texas for each year ended December 31, 2017, 2016 and 2015.
125
DCP MIDSTREAM, LP
NOTES TO CONSOLIDATED FINANCIAL STATEMENTS
Years Ended December 31, 2017, 2016 and 2015 - (Continued)
19. Commitments and Contingent Liabilities
Litigation — We are not a party to any significant legal proceedings, but are a party to various administrative and regulatory proceedings and commercial disputes that have arisen in the ordinary course of our business. Management currently believes that the ultimate resolution of the foregoing matters, taken as a whole, and after consideration of amounts accrued, insurance coverage or other indemnification arrangements, will not have a material adverse effect on our results of operations, financial position, or cash flow.
Insurance — Our insurance coverage is carried with third-party insurers and with an affiliate of Phillips 66. Our insurance coverage includes: (1) general liability insurance covering third-party exposures; (2) statutory workers’ compensation insurance; (3) automobile liability insurance for all owned, non-owned and hired vehicles; (4) excess liability insurance above the established primary limits for general liability and automobile liability insurance; (5) property insurance, which covers the replacement value of real and personal property and includes business interruption; and (6) insurance covering our directors and officers for acts related to our business activities. All coverage is subject to certain limits and deductibles, the terms and conditions of which are common for companies with similar types of operations.
Environmental — The operation of pipelines, plants and other facilities for gathering, transporting, processing, treating, fractionating, or storing natural gas, NGLs and other products is subject to stringent and complex laws and regulations pertaining to health, safety and the environment. As an owner or operator of these facilities, we must comply with laws and regulations at the federal, state and, in some cases, local levels that relate to worker safety, air and water quality, solid and hazardous waste management and disposal, and other environmental matters. The cost of planning, designing, constructing and operating pipelines, plants, and other facilities incorporates compliance with environmental laws and regulations, worker safety standards, and safety standards applicable to our various facilities. In addition, there is increasing focus from (i) city, state and federal regulatory officials and through litigation, on hydraulic fracturing and the real or perceived environmental impacts of this technique, which indirectly presents some risk to our available supply of natural gas and the resulting supply of NGLs, (ii) from federal regulatory agencies regarding pipeline system safety which could impose additional regulatory burdens and increase the cost of our operations, and (iii) from state and federal regulatory officials regarding the emission of greenhouse gases which could impose regulatory burdens and increase the cost of our operations, and (iv) regulatory bodies and communities that could prevent or delay the development of fossil fuel energy infrastructure such as pipelines, plants, and other facilities used in our business. Failure to comply with these various health, safety and environmental laws and regulations may trigger a variety of administrative, civil and potentially criminal enforcement measures, including citizen suits, which can include the assessment of monetary penalties, the imposition of remedial requirements, and the issuance of injunctions or restrictions on operation. Management believes that, based on currently known information, compliance with these existing laws and regulations will not have a material adverse effect on our results of operations, financial position or cash flows.
126
DCP MIDSTREAM, LP
NOTES TO CONSOLIDATED FINANCIAL STATEMENTS
Years Ended December 31, 2017, 2016 and 2015 - (Continued)
We make expenditures in connection with environmental matters as part of our normal operations. As of December 31, 2017 and 2016, environmental liabilities included in our consolidated balance sheets as other current liabilities were $4 million and $4 million, respectively. As of December 31, 2017 and 2016, environmental liabilities included in our consolidated balance sheets as other long-term liabilities were $8 million and $9 million, respectively.
Other Commitments and Contingencies — We utilize assets under operating leases in several areas of operation. Consolidated rental expense, including leases with no continuing commitment, totaled $33 million, $37 million and $34 million for the years ended December 31, 2017, 2016, and 2015, respectively. Rental expense for leases with escalation clauses is recognized on a straight line basis over the initial lease term.
Minimum rental payments under our various operating leases in the year indicated are as follows at December 31, 2017:
Future Minimum Rental Payments as of December 31, 2017 | ||||
(millions) | ||||
2018 | $ | 37 | ||
2019 | 34 | |||
2020 | 30 | |||
2021 | 20 | |||
2022 | 15 | |||
Thereafter | 28 | |||
Total minimum rental payments | $ | 164 | ||
127
DCP MIDSTREAM, LP
NOTES TO CONSOLIDATED FINANCIAL STATEMENTS
Years Ended December 31, 2017, 2016 and 2015 - (Continued)
20. Restructuring Costs
In April 2016, we announced an approximate 10 percent headcount reduction, which involved the elimination of certain operational and corporate positions, as part of ongoing effort to create efficiencies, reduce costs and transform our business. As a result of this headcount reduction, we recorded one-time employee termination costs of approximately $13 million, which are included in restructuring costs in our consolidated statements of operations for the year ended December 31, 2016.
In January 2015, we announced the initial phase of this cost reduction plan, which involved the elimination of certain corporate employee positions. As a result, we recorded employee termination costs of approximately $11 million, all of which were paid during the year ended December 31, 2015, and are included in restructuring costs in the consolidated statement of operations for the year ended December 31, 2015.
21. Business Segments
Our operations are organized into two reportable segments: (i) Gathering and Processing and (ii) Logistics and Marketing. These segments are monitored separately by management for performance against our internal forecast and are consistent with internal financial reporting. These segments have been identified based on the differing products and services, regulatory environment and the expertise required for these operations. Our Gathering and Processing reportable segment includes operating segments that have been aggregated based on the nature of the products and services provided. Gross margin is a performance measure utilized by management to monitor the operations of each segment. The accounting policies of the reportable segments are the same as those described in the summary of significant accounting policies included in Note 2 - Summary of Significant Accounting Policies.
Our Gathering and Processing segment consists of gathering, compressing, treating, processing natural gas, producing and fractionating NGLs, and recovering condensate. Our Logistics and Marketing segment includes transporting, trading, marketing, and storing natural gas and NGLs, fractionating NGLs, and wholesale propane logistics. The remainder of our business operations is presented as “Other,” and consists of unallocated corporate costs. Elimination of inter-segment transactions are reflected in the eliminations column.
The following tables set forth our segment information:
Year Ended December 31, 2017:
Gathering and Processing | Logistics and Marketing | Other | Eliminations | Total | |||||||||||||||
(millions) | |||||||||||||||||||
Total operating revenue | $ | 5,467 | $ | 7,757 | $ | — | $ | (4,762 | ) | $ | 8,462 | ||||||||
Gross margin (a) | $ | 1,377 | $ | 200 | $ | — | $ | — | $ | 1,577 | |||||||||
Operating and maintenance expense | (602 | ) | (41 | ) | (18 | ) | — | (661 | ) | ||||||||||
Depreciation and amortization expense | (343 | ) | (14 | ) | (22 | ) | — | (379 | ) | ||||||||||
General and administrative expense | (19 | ) | (11 | ) | (260 | ) | — | (290 | ) | ||||||||||
Asset impairments | (48 | ) | — | — | — | (48 | ) | ||||||||||||
Other expense | — | (11 | ) | — | — | (11 | ) | ||||||||||||
Gain on sale of assets, net | 34 | — | — | — | 34 | ||||||||||||||
Earnings from unconsolidated affiliates | 60 | 243 | — | — | 303 | ||||||||||||||
Interest expense | — | — | (289 | ) | — | (289 | ) | ||||||||||||
Income tax expense | — | — | (2 | ) | — | (2 | ) | ||||||||||||
Net income (loss) | $ | 459 | $ | 366 | $ | (591 | ) | $ | — | $ | 234 | ||||||||
Net income attributable to noncontrolling interests | (5 | ) | — | — | — | (5 | ) | ||||||||||||
Net income (loss) attributable to partners | $ | 454 | $ | 366 | $ | (591 | ) | $ | — | $ | 229 | ||||||||
Non-cash derivative mark-to-market (b) | $ | (24 | ) | $ | (4 | ) | $ | — | $ | — | $ | (28 | ) | ||||||
Non-cash lower of cost or market adjustments | $ | — | $ | 2 | $ | — | $ | — | $ | 2 | |||||||||
Capital expenditures | $ | 350 | $ | 3 | $ | 22 | $ | — | $ | 375 | |||||||||
Investments in unconsolidated affiliates, net | $ | 1 | $ | 147 | $ | — | $ | — | $ | 148 | |||||||||
128
DCP MIDSTREAM, LP
NOTES TO CONSOLIDATED FINANCIAL STATEMENTS
Years Ended December 31, 2017, 2016 and 2015 - (Continued)
Year Ended December 31, 2016:
Gathering and Processing | Logistics and Marketing | Other | Eliminations | Total | |||||||||||||||
(millions) | |||||||||||||||||||
Total operating revenue | $ | 4,490 | $ | 6,186 | $ | — | $ | (3,783 | ) | $ | 6,893 | ||||||||
Gross margin (a) | $ | 1,227 | $ | 205 | $ | — | $ | — | $ | 1,432 | |||||||||
Operating and maintenance expense | (611 | ) | (43 | ) | (16 | ) | — | (670 | ) | ||||||||||
Depreciation and amortization expense | (344 | ) | (15 | ) | (19 | ) | — | (378 | ) | ||||||||||
General and administrative expense | (14 | ) | (9 | ) | (269 | ) | — | (292 | ) | ||||||||||
Other income (expense), net | 73 | (5 | ) | (3 | ) | — | 65 | ||||||||||||
Gain on sale of assets, net | 19 | 16 | — | — | 35 | ||||||||||||||
Restructuring costs | — | — | (13 | ) | — | (13 | ) | ||||||||||||
Earnings from unconsolidated affiliates | 73 | 209 | — | — | 282 | ||||||||||||||
Interest expense | — | — | (321 | ) | — | (321 | ) | ||||||||||||
Income tax expense | — | — | (46 | ) | — | (46 | ) | ||||||||||||
Net income (loss) | $ | 423 | $ | 358 | $ | (687 | ) | $ | — | $ | 94 | ||||||||
Net income attributable to noncontrolling interests | (6 | ) | — | — | — | (6 | ) | ||||||||||||
Net income (loss) attributable to partners | $ | 417 | $ | 358 | $ | (687 | ) | $ | — | $ | 88 | ||||||||
Non-cash derivative mark-to-market (b) | $ | (119 | ) | $ | (20 | ) | $ | — | $ | — | $ | (139 | ) | ||||||
Non-cash lower of cost or market adjustments | $ | — | $ | 3 | $ | — | $ | — | $ | 3 | |||||||||
Capital expenditures | $ | 107 | $ | 10 | $ | 27 | $ | — | $ | 144 | |||||||||
Investments in unconsolidated affiliates, net | $ | 1 | $ | 52 | $ | — | $ | — | $ | 53 | |||||||||
Year Ended December 31, 2015:
Gathering and Processing | Logistics and Marketing | Other | Eliminations | Total | |||||||||||||||
(millions) | |||||||||||||||||||
Total operating revenue | $ | 4,910 | $ | 6,487 | $ | — | $ | (3,967 | ) | $ | 7,430 | ||||||||
Gross margin (a) | $ | 1,213 | $ | 236 | $ | — | $ | — | $ | 1,449 | |||||||||
Operating and maintenance expense | (668 | ) | (49 | ) | (15 | ) | — | (732 | ) | ||||||||||
Depreciation and amortization expense | (343 | ) | (16 | ) | (18 | ) | — | (377 | ) | ||||||||||
General and administrative expense | (22 | ) | (11 | ) | (248 | ) | — | (281 | ) | ||||||||||
Asset impairment | (876 | ) | (9 | ) | (27 | ) | — | (912 | ) | ||||||||||
Other expense | (1 | ) | (8 | ) | (1 | ) | — | (10 | ) | ||||||||||
Gain on sale of assets, net | 42 | — | — | — | 42 | ||||||||||||||
Restructuring costs | — | — | (11 | ) | — | (11 | ) | ||||||||||||
Earnings from unconsolidated affiliates | 54 | 130 | — | — | 184 | ||||||||||||||
Interest expense | — | — | (320 | ) | — | (320 | ) | ||||||||||||
Income tax benefit | — | — | 102 | — | 102 | ||||||||||||||
Net (loss) income | $ | (601 | ) | $ | 273 | $ | (538 | ) | $ | — | $ | (866 | ) | ||||||
Net income attributable to noncontrolling interests | (5 | ) | — | — | — | (5 | ) | ||||||||||||
Net (loss) income attributable to partners | $ | (606 | ) | $ | 273 | $ | (538 | ) | $ | — | $ | (871 | ) | ||||||
Non-cash derivative mark-to-market (b) | $ | 47 | $ | (1 | ) | $ | — | $ | — | $ | 46 | ||||||||
Non-cash lower of cost or market adjustments | $ | — | $ | 8 | $ | — | $ | — | $ | 8 | |||||||||
Capital expenditures | $ | 729 | $ | 52 | $ | 30 | $ | — | $ | 811 | |||||||||
Investments in unconsolidated affiliates, net | $ | 15 | $ | 49 | $ | — | $ | — | $ | 64 | |||||||||
129
DCP MIDSTREAM, LP
NOTES TO CONSOLIDATED FINANCIAL STATEMENTS
Years Ended December 31, 2017, 2016 and 2015 - (Continued)
December 31, | December 31, | ||||||
2017 | 2016 | ||||||
(millions) | |||||||
Segment long-term assets: | |||||||
Gathering and Processing | $ | 8,943 | $ | 9,053 | |||
Logistics and Marketing | 3,348 | 3,278 | |||||
Other (c) | 265 | 286 | |||||
Total long-term assets | 12,556 | 12,617 | |||||
Current assets | 1,322 | 994 | |||||
Total assets | $ | 13,878 | $ | 13,611 | |||
(a) | Gross margin consists of total operating revenues, including commodity derivative activity, less purchases and related costs. Gross margin is viewed as a non-GAAP financial measure under the rules of the SEC, but is included as a supplemental disclosure because it is a primary performance measure used by management as it represents the results of product sales versus product purchases. As an indicator of our operating performance, gross margin should not be considered an alternative to, or more meaningful than, net income or cash flow as determined in accordance with GAAP. Our gross margin may not be comparable to a similarly titled measure of another company because other entities may not calculate gross margin in the same manner. |
(b) | Non-cash commodity derivative mark-to-market is included in gross margin, along with cash settlements for our commodity derivative contracts. |
(c) | Other long-term assets not allocable to segments consist of corporate leasehold improvements and other long-term assets. |
22. Supplemental Cash Flow Information
Year Ended December 31, | |||||||||||
2017 | 2016 | 2015 | |||||||||
(millions) | |||||||||||
Cash paid for interest: | |||||||||||
Cash paid for interest, net of amounts capitalized | $ | 290 | $ | 306 | $ | 293 | |||||
Cash paid for income taxes, net of income tax refunds | $ | 2 | $ | 2 | $ | 3 | |||||
Non-cash investing and financing activities: | |||||||||||
Property, plant and equipment acquired with accounts payable and accrued liabilities | $ | 58 | $ | 27 | $ | 35 | |||||
Other non-cash changes in property, plant and equipment | $ | 5 | $ | (3 | ) | $ | (19 | ) | |||
Contribution of assets from our predecessor | $ | — | $ | — | $ | 1,500 | |||||
130
DCP MIDSTREAM, LP
NOTES TO CONSOLIDATED FINANCIAL STATEMENTS
Years Ended December 31, 2017, 2016 and 2015 - (Continued)
23. Quarterly Financial Data (Unaudited)
Our consolidated results of operations by quarter for the years ended December 31, 2017 and 2016 were as follows (millions, except per unit amounts):
2017 | First | Second | Third | Fourth | Year Ended December 31, 2017 | |||||||||||||||
Total operating revenues | $ | 2,121 | $ | 1,949 | $ | 2,055 | $ | 2,337 | $ | 8,462 | ||||||||||
Operating income (loss) | $ | 101 | $ | 78 | $ | (19 | ) | $ | 62 | $ | 222 | |||||||||
Net income (loss) | $ | 101 | $ | 89 | $ | (20 | ) | $ | 64 | $ | 234 | |||||||||
Net income attributable to noncontrolling interests | $ | — | $ | (1 | ) | $ | — | $ | (4 | ) | $ | (5 | ) | |||||||
Net income (loss) attributable to partners | $ | 101 | $ | 88 | $ | (20 | ) | $ | 60 | $ | 229 | |||||||||
Net income (loss) allocable to limited partners | $ | 59 | $ | 47 | $ | (59 | ) | $ | 14 | $ | 61 | |||||||||
Basic and diluted net income (loss) per limited partner unit | $ | 0.41 | $ | 0.33 | $ | (0.41 | ) | $ | 0.10 | $ | 0.43 | |||||||||
2016 | First | Second | Third | Fourth | Year Ended December 31, 2016 | |||||||||||||||
Total operating revenues | $ | 1,464 | $ | 1,623 | $ | 1,823 | $ | 1,983 | $ | 6,893 | ||||||||||
Operating income (loss) | $ | 80 | $ | (12 | ) | $ | 92 | $ | 19 | $ | 179 | |||||||||
Net income (loss) | $ | 65 | $ | (21 | ) | $ | 89 | $ | (39 | ) | $ | 94 | ||||||||
Net income attributable to noncontrolling interests | $ | — | $ | (1 | ) | $ | — | $ | (5 | ) | $ | (6 | ) | |||||||
Net income (loss) attributable to partners | $ | 65 | $ | (22 | ) | $ | 89 | $ | (44 | ) | $ | 88 | ||||||||
Net loss attributable to predecessor operations | $ | (7 | ) | $ | (67 | ) | $ | (31 | ) | $ | (119 | ) | $ | (224 | ) | |||||
Net income allocable to limited partners | $ | 41 | $ | 14 | $ | 89 | $ | 44 | $ | 188 | ||||||||||
Basic and diluted net income per limited partner unit | $ | 0.36 | $ | 0.12 | $ | 0.78 | $ | 0.38 | $ | 1.64 | ||||||||||
24. Supplementary Information - Condensed Consolidating Financial Information
The following condensed consolidating financial information presents the results of operations, financial position and cash flows of DCP Midstream, LP, or parent guarantor, DCP Midstream Operating LP, or subsidiary issuer, which is a 100% owned subsidiary, and non-guarantor subsidiaries, as well as the consolidating adjustments necessary to present DCP Midstream, LP’s results on a consolidated basis. The parent guarantor has agreed to fully and unconditionally guarantee debt securities of the subsidiary issuer. For the purpose of the following financial information, investments in subsidiaries are reflected in accordance with the equity method of accounting. The financial information may not necessarily be indicative of results of operations, cash flows, or financial position had the subsidiaries operated as independent entities.
131
DCP MIDSTREAM, LP
NOTES TO CONSOLIDATED FINANCIAL STATEMENTS
Years Ended December 31, 2017, 2016 and 2015 - (Continued)
Condensed Consolidating Balance Sheet | |||||||||||||||||||
December 31, 2017 | |||||||||||||||||||
Parent Guarantor | Subsidiary Issuer | Non-Guarantor Subsidiaries | Consolidating Adjustments | Consolidated | |||||||||||||||
(millions) | |||||||||||||||||||
ASSETS | |||||||||||||||||||
Current assets: | |||||||||||||||||||
Cash and cash equivalents | $ | — | $ | 155 | $ | 1 | $ | — | $ | 156 | |||||||||
Accounts receivable, net | — | — | 981 | — | 981 | ||||||||||||||
Inventories | — | — | 68 | — | 68 | ||||||||||||||
Other | — | — | 117 | — | 117 | ||||||||||||||
Total current assets | — | 155 | 1,167 | — | 1,322 | ||||||||||||||
Property, plant and equipment, net | — | — | 8,983 | — | 8,983 | ||||||||||||||
Goodwill and intangible assets, net | — | — | 337 | — | 337 | ||||||||||||||
Advances receivable — consolidated subsidiaries | 2,895 | 1,614 | — | (4,509 | ) | — | |||||||||||||
Investments in consolidated subsidiaries | 4,513 | 7,522 | — | (12,035 | ) | — | |||||||||||||
Investments in unconsolidated affiliates | — | — | 3,050 | — | 3,050 | ||||||||||||||
Other long-term assets | — | — | 186 | — | 186 | ||||||||||||||
Total assets | $ | 7,408 | $ | 9,291 | $ | 13,723 | $ | (16,544 | ) | $ | 13,878 | ||||||||
LIABILITIES AND EQUITY | |||||||||||||||||||
Accounts payable and other current liabilities | $ | — | $ | 71 | $ | 1,417 | $ | — | $ | 1,488 | |||||||||
Advances payable — consolidated subsidiaries | — | — | 4,509 | (4,509 | ) | — | |||||||||||||
Long-term debt | — | 4,707 | — | — | 4,707 | ||||||||||||||
Other long-term liabilities | — | — | 245 | — | 245 | ||||||||||||||
Total liabilities | — | 4,778 | 6,171 | (4,509 | ) | 6,440 | |||||||||||||
Commitments and contingent liabilities | |||||||||||||||||||
Equity: | |||||||||||||||||||
Partners’ equity: | |||||||||||||||||||
Net equity | 7,408 | 4,517 | 7,527 | (12,035 | ) | 7,417 | |||||||||||||
Accumulated other comprehensive loss | — | (4 | ) | (5 | ) | — | (9 | ) | |||||||||||
Total partners’ equity | 7,408 | 4,513 | 7,522 | (12,035 | ) | 7,408 | |||||||||||||
Noncontrolling interests | — | — | 30 | — | 30 | ||||||||||||||
Total equity | 7,408 | 4,513 | 7,552 | (12,035 | ) | 7,438 | |||||||||||||
Total liabilities and equity | $ | 7,408 | $ | 9,291 | $ | 13,723 | $ | (16,544 | ) | $ | 13,878 | ||||||||
132
DCP MIDSTREAM, LP
NOTES TO CONSOLIDATED FINANCIAL STATEMENTS
Years Ended December 31, 2017, 2016 and 2015 - (Continued)
Condensed Consolidating Balance Sheet | |||||||||||||||||||
December 31, 2016 | |||||||||||||||||||
Parent Guarantor | Subsidiary Issuer | Non-Guarantor Subsidiaries | Consolidating Adjustments | Consolidated | |||||||||||||||
(millions) | |||||||||||||||||||
ASSETS | |||||||||||||||||||
Current assets: | |||||||||||||||||||
Cash and cash equivalents | $ | — | $ | — | $ | 1 | $ | — | $ | 1 | |||||||||
Accounts receivable, net | — | — | 792 | — | 792 | ||||||||||||||
Inventories | — | — | 72 | — | 72 | ||||||||||||||
Other | — | — | 129 | — | 129 | ||||||||||||||
Total current assets | — | — | 994 | — | 994 | ||||||||||||||
Property, plant and equipment, net | — | — | 9,069 | — | 9,069 | ||||||||||||||
Goodwill and intangible assets, net | — | — | 373 | — | 373 | ||||||||||||||
Advances receivable — consolidated subsidiaries | 2,953 | 2,760 | — | (5,713 | ) | — | |||||||||||||
Investments in consolidated subsidiaries | 3,868 | 6,587 | — | (10,455 | ) | — | |||||||||||||
Investments in unconsolidated affiliates | — | — | 2,969 | — | 2,969 | ||||||||||||||
Other long-term assets | — | — | 206 | — | 206 | ||||||||||||||
Total assets | $ | 6,821 | $ | 9,347 | $ | 13,611 | $ | (16,168 | ) | $ | 13,611 | ||||||||
LIABILITIES AND EQUITY | |||||||||||||||||||
Accounts payable and other current liabilities | $ | — | $ | 72 | $ | 1,051 | $ | — | $ | 1,123 | |||||||||
Current maturities of long-term debt | — | 500 | — | — | 500 | ||||||||||||||
Advances payable — consolidated subsidiaries | — | — | 5,713 | (5,713 | ) | — | |||||||||||||
Long-term debt | — | 4,907 | — | — | 4,907 | ||||||||||||||
Other long-term liabilities | — | — | 228 | — | 228 | ||||||||||||||
Total liabilities | — | 5,479 | 6,992 | (5,713 | ) | 6,758 | |||||||||||||
Commitments and contingent liabilities | |||||||||||||||||||
Equity: | |||||||||||||||||||
Partners’ equity: | |||||||||||||||||||
Net equity | 6,821 | 3,871 | 6,592 | (10,455 | ) | 6,829 | |||||||||||||
Accumulated other comprehensive loss | — | (3 | ) | (5 | ) | — | (8 | ) | |||||||||||
Total partners’ equity | 6,821 | 3,868 | 6,587 | (10,455 | ) | 6,821 | |||||||||||||
Noncontrolling interests | — | — | 32 | — | 32 | ||||||||||||||
Total equity | 6,821 | 3,868 | 6,619 | (10,455 | ) | 6,853 | |||||||||||||
Total liabilities and equity | $ | 6,821 | $ | 9,347 | $ | 13,611 | $ | (16,168 | ) | $ | 13,611 | ||||||||
133
DCP MIDSTREAM, LP
NOTES TO CONSOLIDATED FINANCIAL STATEMENTS
Years Ended December 31, 2017, 2016 and 2015 - (Continued)
Condensed Consolidating Statement of Operations | |||||||||||||||||||
Year Ended December 31, 2017 | |||||||||||||||||||
Parent Guarantor | Subsidiary Issuer | Non- Guarantor Subsidiaries | Consolidating Adjustments | Consolidated | |||||||||||||||
(millions) | |||||||||||||||||||
Operating revenues: | |||||||||||||||||||
Sales of natural gas, NGLs and condensate | $ | — | $ | — | $ | 7,850 | $ | — | $ | 7,850 | |||||||||
Transportation, processing and other | — | — | 652 | — | 652 | ||||||||||||||
Trading and marketing losses, net | — | — | (40 | ) | — | (40 | ) | ||||||||||||
Total operating revenues | — | — | 8,462 | — | 8,462 | ||||||||||||||
Operating costs and expenses: | |||||||||||||||||||
Purchases and related costs | — | — | 6,885 | — | 6,885 | ||||||||||||||
Operating and maintenance expense | — | — | 661 | — | 661 | ||||||||||||||
Depreciation and amortization expense | — | — | 379 | — | 379 | ||||||||||||||
General and administrative expense | — | — | 290 | — | 290 | ||||||||||||||
Asset impairments | — | — | 48 | — | 48 | ||||||||||||||
Gain on sale of assets, net | — | — | (34 | ) | — | (34 | ) | ||||||||||||
Other expense, net | — | — | 11 | — | 11 | ||||||||||||||
Total operating costs and expenses | — | — | 8,240 | — | 8,240 | ||||||||||||||
Operating income | — | — | 222 | — | 222 | ||||||||||||||
Interest expense, net | — | (289 | ) | — | — | (289 | ) | ||||||||||||
Income from consolidated subsidiaries | 229 | 518 | — | (747 | ) | — | |||||||||||||
Earnings from unconsolidated affiliates | — | — | 303 | — | 303 | ||||||||||||||
Income before income taxes | 229 | 229 | 525 | (747 | ) | 236 | |||||||||||||
Income tax expense | — | — | (2 | ) | — | (2 | ) | ||||||||||||
Net income | 229 | 229 | 523 | (747 | ) | 234 | |||||||||||||
Net income attributable to noncontrolling interests | — | — | (5 | ) | — | (5 | ) | ||||||||||||
Net income attributable to partners | $ | 229 | $ | 229 | $ | 518 | $ | (747 | ) | $ | 229 | ||||||||
Condensed Consolidating Statement of Comprehensive Income | |||||||||||||||||||
Year Ended December 31, 2017 | |||||||||||||||||||
Parent Guarantor | Subsidiary Issuer | Non-Guarantor Subsidiaries | Consolidating Adjustments | Consolidated | |||||||||||||||
(millions) | |||||||||||||||||||
Net income | $ | 229 | $ | 229 | $ | 523 | $ | (747 | ) | $ | 234 | ||||||||
Other comprehensive income: | |||||||||||||||||||
Reclassification of cash flow hedge losses into earnings | — | 1 | — | — | 1 | ||||||||||||||
Other comprehensive income from consolidated subsidiaries | 1 | — | — | (1 | ) | — | |||||||||||||
Total other comprehensive income | 1 | 1 | — | (1 | ) | 1 | |||||||||||||
Total comprehensive income | 230 | 230 | 523 | (748 | ) | 235 | |||||||||||||
Total comprehensive income attributable to noncontrolling interests | — | — | (5 | ) | — | (5 | ) | ||||||||||||
Total comprehensive income attributable to partners | $ | 230 | $ | 230 | $ | 518 | $ | (748 | ) | $ | 230 | ||||||||
134
DCP MIDSTREAM, LP
NOTES TO CONSOLIDATED FINANCIAL STATEMENTS
Years Ended December 31, 2017, 2016 and 2015 - (Continued)
Condensed Consolidating Statement of Operations | |||||||||||||||||||
Year Ended December 31, 2016 | |||||||||||||||||||
Parent Guarantor | Subsidiary Issuer | Non- Guarantor Subsidiaries | Consolidating Adjustments | Consolidated | |||||||||||||||
(millions) | |||||||||||||||||||
Operating revenues: | |||||||||||||||||||
Sales of natural gas, NGLs and condensate | $ | — | $ | — | $ | 6,269 | $ | — | $ | 6,269 | |||||||||
Transportation, processing and other | — | — | 647 | — | 647 | ||||||||||||||
Trading and marketing losses, net | — | — | (23 | ) | — | (23 | ) | ||||||||||||
Total operating revenues | — | — | 6,893 | — | 6,893 | ||||||||||||||
Operating costs and expenses: | |||||||||||||||||||
Purchases and related costs | — | — | 5,461 | — | 5,461 | ||||||||||||||
Operating and maintenance expense | — | — | 670 | — | 670 | ||||||||||||||
Depreciation and amortization expense | — | — | 378 | — | 378 | ||||||||||||||
General and administrative expense | — | — | 292 | — | 292 | ||||||||||||||
Gain on sale of assets, net | — | — | (35 | ) | — | (35 | ) | ||||||||||||
Restructuring costs | — | — | 13 | — | 13 | ||||||||||||||
Other income, net | — | — | (65 | ) | — | (65 | ) | ||||||||||||
Total operating costs and expenses | — | — | 6,714 | — | 6,714 | ||||||||||||||
Operating income | — | — | 179 | — | 179 | ||||||||||||||
Interest expense, net | — | (321 | ) | — | — | (321 | ) | ||||||||||||
Income from consolidated subsidiaries | 88 | 409 | — | (497 | ) | — | |||||||||||||
Earnings from unconsolidated affiliates | — | — | 282 | — | 282 | ||||||||||||||
Income before income taxes | 88 | 88 | 461 | (497 | ) | 140 | |||||||||||||
Income tax expense | — | — | (46 | ) | — | (46 | ) | ||||||||||||
Net income | 88 | 88 | 415 | (497 | ) | 94 | |||||||||||||
Net income attributable to noncontrolling interests | — | — | (6 | ) | — | (6 | ) | ||||||||||||
Net income attributable to partners | $ | 88 | $ | 88 | $ | 409 | $ | (497 | ) | $ | 88 | ||||||||
Condensed Consolidating Statement of Comprehensive Income | |||||||||||||||||||
Year Ended December 31, 2016 | |||||||||||||||||||
Parent Guarantor | Subsidiary Issuer | Non-Guarantor Subsidiaries | Consolidating Adjustments | Consolidated | |||||||||||||||
(millions) | |||||||||||||||||||
Net income | $ | 88 | $ | 88 | $ | 415 | $ | (497 | ) | $ | 94 | ||||||||
Other comprehensive income: | |||||||||||||||||||
Reclassification of cash flow hedge losses into earnings | — | — | — | — | — | ||||||||||||||
Other comprehensive income from consolidated subsidiaries | — | — | — | — | — | ||||||||||||||
Total other comprehensive income | — | — | — | — | — | ||||||||||||||
Total comprehensive income | 88 | 88 | 415 | (497 | ) | 94 | |||||||||||||
Total comprehensive income attributable to noncontrolling interests | — | — | (6 | ) | — | (6 | ) | ||||||||||||
Total comprehensive income attributable to partners | $ | 88 | $ | 88 | $ | 409 | $ | (497 | ) | $ | 88 | ||||||||
135
DCP MIDSTREAM, LP
NOTES TO CONSOLIDATED FINANCIAL STATEMENTS
Years Ended December 31, 2017, 2016 and 2015 - (Continued)
Condensed Consolidating Statement of Operations | |||||||||||||||||||
Year Ended December 31, 2015 | |||||||||||||||||||
Parent Guarantor | Subsidiary Issuer | Non-Guarantor Subsidiaries | Consolidating Adjustments | Consolidated | |||||||||||||||
(millions) | |||||||||||||||||||
Operating revenues: | |||||||||||||||||||
Sales of natural gas, propane, NGLs and condensate | $ | — | $ | — | $ | 6,779 | $ | — | $ | 6,779 | |||||||||
Transportation, processing and other | — | — | 532 | — | 532 | ||||||||||||||
Trading and marketing gains, net | — | — | 119 | — | 119 | ||||||||||||||
Total operating revenues | — | — | 7,430 | — | 7,430 | ||||||||||||||
Operating costs and expenses: | |||||||||||||||||||
Purchases and related costs | — | — | 5,981 | — | 5,981 | ||||||||||||||
Operating and maintenance expense | — | — | 732 | — | 732 | ||||||||||||||
Depreciation and amortization expense | — | — | 377 | — | 377 | ||||||||||||||
General and administrative expense | — | — | 281 | — | 281 | ||||||||||||||
Asset impairments | — | — | 912 | — | 912 | ||||||||||||||
Gain on sale of assets, net | — | — | (42 | ) | — | (42 | ) | ||||||||||||
Restructuring costs | — | — | 11 | — | 11 | ||||||||||||||
Other expense, net | — | — | 10 | — | 10 | ||||||||||||||
Total operating costs and expenses | — | — | 8,262 | — | 8,262 | ||||||||||||||
Operating loss | — | — | (832 | ) | — | (832 | ) | ||||||||||||
Interest expense, net | — | (320 | ) | — | — | (320 | ) | ||||||||||||
Income from consolidated subsidiaries | (871 | ) | (551 | ) | — | 1,422 | — | ||||||||||||
Earnings from unconsolidated affiliates | — | — | 184 | — | 184 | ||||||||||||||
Loss before income taxes | (871 | ) | (871 | ) | (648 | ) | 1,422 | (968 | ) | ||||||||||
Income tax benefit | — | — | 102 | — | 102 | ||||||||||||||
Net loss | (871 | ) | (871 | ) | (546 | ) | 1,422 | (866 | ) | ||||||||||
Net income attributable to noncontrolling interests | — | — | (5 | ) | — | (5 | ) | ||||||||||||
Net loss attributable to partners | $ | (871 | ) | $ | (871 | ) | $ | (551 | ) | $ | 1,422 | $ | (871 | ) | |||||
Condensed Consolidating Statement of Comprehensive Income | |||||||||||||||||||
Year Ended December 31, 2015 | |||||||||||||||||||
Parent Guarantor | Subsidiary Issuer | Non-Guarantor Subsidiaries | Consolidating Adjustments | Consolidated | |||||||||||||||
(millions) | |||||||||||||||||||
Net income | $ | (871 | ) | $ | (871 | ) | $ | (546 | ) | $ | 1,422 | $ | (866 | ) | |||||
Other comprehensive income: | |||||||||||||||||||
Reclassification of cash flow hedge losses into earnings | — | 1 | — | — | 1 | ||||||||||||||
Other comprehensive income from consolidated subsidiaries | 1 | — | — | (1 | ) | — | |||||||||||||
Total other comprehensive income | 1 | 1 | — | (1 | ) | 1 | |||||||||||||
Total comprehensive loss | (870 | ) | (870 | ) | (546 | ) | 1,421 | (865 | ) | ||||||||||
Total comprehensive income attributable to noncontrolling interests | — | — | (5 | ) | — | (5 | ) | ||||||||||||
Total comprehensive loss attributable to partners | $ | (870 | ) | $ | (870 | ) | $ | (551 | ) | $ | 1,421 | $ | (870 | ) | |||||
136
DCP MIDSTREAM, LP
NOTES TO CONSOLIDATED FINANCIAL STATEMENTS
Years Ended December 31, 2017, 2016 and 2015 - (Continued)
Condensed Consolidating Statement of Cash Flows | |||||||||||||||||||
Year Ended December 31, 2017 | |||||||||||||||||||
Parent Guarantor | Subsidiary Issuer | Non-Guarantor Subsidiaries | Consolidating Adjustments | Consolidated | |||||||||||||||
(millions) | |||||||||||||||||||
OPERATING ACTIVITIES | |||||||||||||||||||
Net cash (used in) provided by operating activities | $ | — | $ | (283 | ) | $ | 1,179 | $ | — | $ | 896 | ||||||||
INVESTING ACTIVITIES: | |||||||||||||||||||
Intercompany transfers | 58 | 1,141 | — | (1,199 | ) | — | |||||||||||||
Capital expenditures | — | — | (375 | ) | — | (375 | ) | ||||||||||||
Investments in unconsolidated affiliates | — | — | (148 | ) | — | (148 | ) | ||||||||||||
Proceeds from sale of assets | — | — | 132 | — | 132 | ||||||||||||||
Net cash provided by (used in) investing activities | 58 | 1,141 | (391 | ) | (1,199 | ) | (391 | ) | |||||||||||
FINANCING ACTIVITIES: | |||||||||||||||||||
Intercompany transfers | — | — | (1,199 | ) | 1,199 | — | |||||||||||||
Proceeds from long-term debt | — | 116 | — | — | 116 | ||||||||||||||
Payments of long-term debt | — | (811 | ) | — | — | (811 | ) | ||||||||||||
Proceeds from issuance of preferred Series A units, net of offering costs | 487 | — | — | — | 487 | ||||||||||||||
Net change in advances to predecessor from DCP Midstream, LLC | — | — | 418 | — | 418 | ||||||||||||||
Distributions to limited partners and general partner | (545 | ) | — | — | — | (545 | ) | ||||||||||||
Distributions to noncontrolling interests | — | — | (7 | ) | — | (7 | ) | ||||||||||||
Other | — | (8 | ) | — | — | (8 | ) | ||||||||||||
Net cash used in financing activities | (58 | ) | (703 | ) | (788 | ) | 1,199 | (350 | ) | ||||||||||
Net change in cash and cash equivalents | — | 155 | — | — | 155 | ||||||||||||||
Cash and cash equivalents, beginning of period | — | — | 1 | — | 1 | ||||||||||||||
Cash and cash equivalents, end of period | $ | — | $ | 155 | $ | 1 | $ | — | $ | 156 | |||||||||
137
DCP MIDSTREAM, LP
NOTES TO CONSOLIDATED FINANCIAL STATEMENTS
Years Ended December 31, 2017, 2016 and 2015 - (Continued)
Condensed Consolidating Statements of Cash Flows | |||||||||||||||||||
Year Ended December 31, 2016 | |||||||||||||||||||
Parent Guarantor | Subsidiary Issuer | Non-Guarantor Subsidiaries | Consolidating Adjustments | Consolidated | |||||||||||||||
(millions) | |||||||||||||||||||
OPERATING ACTIVITIES | |||||||||||||||||||
Net cash (used in) provided by operating activities | $ | — | $ | (305 | ) | $ | 950 | $ | — | $ | 645 | ||||||||
INVESTING ACTIVITIES: | |||||||||||||||||||
Intercompany transfers | 483 | 585 | — | (1,068 | ) | — | |||||||||||||
Capital expenditures | — | — | (144 | ) | — | (144 | ) | ||||||||||||
Investments in unconsolidated affiliates, net | — | — | (53 | ) | — | (53 | ) | ||||||||||||
Proceeds from sale of assets | — | — | 163 | — | 163 | ||||||||||||||
Net cash provided by (used in) investing activities | 483 | 585 | (34 | ) | (1,068 | ) | (34 | ) | |||||||||||
FINANCING ACTIVITIES: | |||||||||||||||||||
Intercompany transfers | — | — | (1,068 | ) | 1,068 | — | |||||||||||||
Proceeds from long-term debt | — | 3,353 | — | — | 3,353 | ||||||||||||||
Payments of long-term debt | — | (3,628 | ) | — | — | (3,628 | ) | ||||||||||||
Net change in advances to predecessor from DCP Midstream, LLC | — | — | 157 | — | 157 | ||||||||||||||
Distributions to limited partners and general partner | (483 | ) | — | — | — | (483 | ) | ||||||||||||
Distributions to noncontrolling interests | — | — | (7 | ) | — | (7 | ) | ||||||||||||
Other | — | (5 | ) | — | — | (5 | ) | ||||||||||||
Net cash used in financing activities | (483 | ) | (280 | ) | (918 | ) | 1,068 | (613 | ) | ||||||||||
Net change in cash and cash equivalents | — | — | (2 | ) | — | (2 | ) | ||||||||||||
Cash and cash equivalents, beginning of period | — | — | 3 | — | 3 | ||||||||||||||
Cash and cash equivalents, end of period | $ | — | $ | — | $ | 1 | $ | — | $ | 1 | |||||||||
138
DCP MIDSTREAM, LP
NOTES TO CONSOLIDATED FINANCIAL STATEMENTS
Years Ended December 31, 2017, 2016 and 2015 - (Continued)
Condensed Consolidating Statements of Cash Flows | |||||||||||||||||||
Year Ended December 31, 2015 (a) | |||||||||||||||||||
Parent Guarantor | Subsidiary Issuer | Non-Guarantor Subsidiaries | Consolidating Adjustments | Consolidated | |||||||||||||||
(millions) | |||||||||||||||||||
OPERATING ACTIVITIES | |||||||||||||||||||
Net cash (used in) provided by operating activities | $ | — | $ | (311 | ) | $ | 753 | $ | — | $ | 442 | ||||||||
INVESTING ACTIVITIES: | |||||||||||||||||||
Intercompany transfers | (1,049 | ) | 1,283 | — | (234 | ) | — | ||||||||||||
Capital expenditures | — | — | (811 | ) | — | (811 | ) | ||||||||||||
Investments in unconsolidated affiliates, net | — | — | (64 | ) | — | (64 | ) | ||||||||||||
Proceeds from sale of assets | — | — | 164 | — | 164 | ||||||||||||||
Net cash (used in) provided by investing activities | (1,049 | ) | 1,283 | (711 | ) | (234 | ) | (711 | ) | ||||||||||
FINANCING ACTIVITIES: | |||||||||||||||||||
Intercompany transfers | — | — | (234 | ) | 234 | — | |||||||||||||
Proceeds from long-term debt | — | 7,216 | — | — | 7,216 | ||||||||||||||
Payments of long-term debt | — | (7,196 | ) | — | — | (7,196 | ) | ||||||||||||
Payments of commercial paper, net | — | (1,012 | ) | — | — | (1,012 | ) | ||||||||||||
Proceeds from issuance of common units, net of offering costs | 31 | — | — | — | 31 | ||||||||||||||
Net change in advances to predecessor from DCP Midstream, LLC | 1,500 | — | 197 | — | 1,697 | ||||||||||||||
Distributions to limited partners and general partner | (482 | ) | — | — | — | (482 | ) | ||||||||||||
Distributions to noncontrolling interests | — | — | (5 | ) | — | (5 | ) | ||||||||||||
Other | — | (4 | ) | — | — | (4 | ) | ||||||||||||
Net cash provided by (used in) financing activities | 1,049 | (996 | ) | (42 | ) | 234 | 245 | ||||||||||||
Net change in cash and cash equivalents | — | (24 | ) | — | — | (24 | ) | ||||||||||||
Cash and cash equivalents, beginning of year | — | 24 | 3 | — | 27 | ||||||||||||||
Cash and cash equivalents, end of year | $ | — | $ | — | $ | 3 | $ | — | $ | 3 | |||||||||
25. Subsequent Events
On January 23, 2018, we announced that the board of directors of the General Partner declared a quarterly distribution of $0.78 per unit. The distribution was paid on February 14, 2018 to unitholders of record on February 7, 2018.
On February 14, 2018, the Partnership distributed $40 million of IDR givebacks to our owners, in conjunction with the quarterly distribution, that were previously withheld under the amended Partnership agreement.
139
Item 9. Changes in and Disagreements with Accountants on Accounting and Financial Disclosure
There were no changes in or disagreements with accountants on accounting and financial disclosures during the year ended December 31, 2017.
Item 9A. Controls and Procedures
Evaluation of Disclosure Controls and Procedures
We maintain disclosure controls and procedures that are designed to ensure that information required to be disclosed by us in the reports that we file or submit to the SEC under the Securities Exchange Act of 1934, as amended (the "Exchange Act"), is recorded, processed, summarized and reported within the time periods specified by the SEC’s rules and forms, and that information is accumulated and communicated to the management of our general partner, including our general partner’s principal executive and principal financial officers (whom we refer to as the "Certifying Officers"), as appropriate to allow timely decisions regarding required disclosure. The management of our general partner evaluated, with the participation of the Certifying Officers, the effectiveness of our disclosure controls and procedures as of December 31, 2017, pursuant to Rule 13a-15(b) under the Exchange Act. Based upon that evaluation, the Certifying Officers concluded that, as of December 31, 2017, our disclosure controls and procedures were effective at a reasonable assurance level.
Changes in Internal Control Over Financial Reporting
There were no changes in internal control over financial reporting (as defined in Rule 13a-15(f) under the Exchange Act) that occurred during the quarter ended December 31, 2017 that have materially affected, or are reasonably likely to materially affect, our internal control over financial reporting.
Management’s Annual Report On Internal Control Over Financial Reporting
Our general partner is responsible for establishing and maintaining an adequate system of internal control over financial reporting, as such term is defined in Exchange Act Rules 13a-15(f) and 15d-15(f). Our internal control system was designed to provide reasonable assurance to our management and board of directors of our general partner regarding the preparation and fair presentation of published financial statements.
All internal control systems, no matter how well designed, have inherent limitations. Therefore, internal control over financial reporting may not prevent or detect misstatements. Projections of any evaluation of effectiveness to future periods are subject to the risk that controls may become inadequate because of changes in conditions, or that the degree of compliance with policies and procedures may deteriorate.
Our management, including our Chief Executive Officer and Chief Financial Officer, has conducted an evaluation of the effectiveness of our internal control over financial reporting as of December 31, 2017 based on the "Internal Control-Integrated Framework" issued by the Committee of Sponsoring Organizations of the Treadway Commission. Based on that evaluation, management concluded that our internal control over financial reporting was effective at the reasonable assurance level as of December 31, 2017.
Deloitte & Touche, LLP, an independent registered public accounting firm, has issued their report, included immediately following, regarding our internal control over financial reporting.
140
REPORT OF INDEPENDENT REGISTERED PUBLIC ACCOUNTING FIRM
To the Board of Directors of
DCP Midstream GP, LLC
Denver, Colorado
Opinion on Internal Control over Financial Reporting
We have audited the internal control over financial reporting of DCP Midstream, LP and subsidiaries (the "Partnership") as of December 31, 2017, based on criteria established in Internal Control - Integrated Framework (2013) issued by the Committee of Sponsoring Organizations of the Treadway Commission (COSO). In our opinion, the Partnership maintained, in all material respects, effective internal control over financial reporting as of December 31, 2017, based on the criteria established in Internal Control - Integrated Framework (2013) issued by COSO.
We have also audited, in accordance with the standards of the Public Company Accounting Oversight Board (United States) (PCAOB), consolidated balance sheets of the Partnership as of December 31, 2017, the related consolidated statements of operations, comprehensive income (loss), changes in equity, and cash flows for the year then ended, and the related notes (collectively referred to as the financial statements) and our report dated February 26, 2018, expressed an unqualified opinion on those consolidated financial statements.
Basis for Opinion
The Partnership's management is responsible for maintaining effective internal control over financial reporting and for its assessment of the effectiveness of internal control over financial reporting, included in the accompanying Management’s Annual Report on Internal Control over Financial Reporting. Our responsibility is to express an opinion on the Partnership's internal control over financial reporting based on our audit. We are a public accounting firm registered with the PCAOB and are required to be independent with respect to the Partnership in accordance with the U.S. federal securities laws and the applicable rules and regulations of the Securities and Exchange Commission and the PCAOB.
We conducted our audit in accordance with the standards of the PCAOB. Those standards require that we plan and perform the audit to obtain reasonable assurance about whether effective internal control over financial reporting was maintained in all material respects. Our audit included obtaining an understanding of internal control over financial reporting, assessing the risk that a material weakness exists, testing and evaluating the design and operating effectiveness of internal control based on the assessed risk, and performing such other procedures as we considered necessary in the circumstances. We believe that our audit provides a reasonable basis for our opinion.
Definition and Limitations of Internal Control over Financial Reporting
A company's internal control over financial reporting is a process designed to provide reasonable assurance regarding the reliability of financial reporting and the preparation of financial statements for external purposes in accordance with generally accepted accounting principles. A company's internal control over financial reporting includes those policies and procedures that (1) pertain to the maintenance of records that, in reasonable detail, accurately and fairly reflect the transactions and dispositions of the assets of the company; (2) provide reasonable assurance that transactions are recorded as necessary to permit preparation of financial statements in accordance with generally accepted accounting principles, and that receipts and expenditures of the company are being made only in accordance with authorizations of management and directors of the company; and (3) provide reasonable assurance regarding prevention or timely detection of unauthorized acquisition, use, or disposition of the company's assets that could have a material effect on the financial statements.
Because of its inherent limitations, internal control over financial reporting may not prevent or detect misstatements. Also, projections of any evaluation of effectiveness to future periods are subject to the risk that controls may become inadequate because of changes in conditions, or that the degree of compliance with the policies or procedures may deteriorate.
/s/ Deloitte & Touche LLP
Denver, Colorado
February 26, 2018
141
Item 9B. Other Information
2018 Compensatory Arrangements
On February 23, 2018, the Compensation Committee of the Board of Directors of DCP Midstream, LLC, the owner of the general partner (the “General Partner”) of the general partner of DCP Midstream, LP (the “Partnership”), established compensation levels for named executive officers of the General Partner (the “Officers”) for the 2018 fiscal year as shown below:
Name | Base Salary | Short-Term Incentive Target | Long-Term Incentive Target | Total | ||||
Wouter T. Van Kempen | $682,900 | 100% | 275% | $3,243,775 | ||||
Sean P. O'Brien | $437,850 | 75% | 200% | $1,641,938 | ||||
Brent L. Backes | $423,840 | 65% | 140% | $1,292,712 | ||||
Don A. Baldridge | $390,000 | 75% | 175% | $1,365,000 | ||||
Brian S. Frederick | $402,220 | 75% | 175% | $1,407,770 | ||||
The Compensation Committee also established the performance criteria for certain compensation arrangements for the Officers for the 2018 fiscal year. The performance criteria relate to grants to the Officers under the DCP Services, LLC 2008 Long-Term Incentive Plan (the “LTI Plan”) and awards to the Officers under the short term cash incentive program (“STI”).
The LTI Plan provides for the grant of cash-settled phantom units and cash-settled dividend equivalent rights. The phantom units consist of a notional unit based on the fair market value of a common unit of the Partnership. The phantom units will be granted equally in restricted phantom units (“RPUs”) and strategic performance units (“SPUs”). RPUs will vest at the end of a three-year vesting period. SPUs will vest at a range of 0% to 200% depending on the level of achievement, as determined by the Compensation Committee of DCP Midstream, LLC, during a three-year performance period measured equally by (i) distributable cash flow per common unit of the Partnership and (ii) relative total shareholder return of the Partnership as compared to the following peer group:
Boardwalk Pipeline Partners, LP | Magellan Midstream Partners, L.P. | Tallgrass Energy GP, LP |
Crestwood Equity Partners LP | NuStar Energy L.P. | Targa Resources Corp. |
Enable Midstream Partners, LP | ONEOK, Inc. | Western Gas Partners, LP |
EnLink Midstream Partners, LP | Summit Midstream Partners, LP | Williams Partners L.P. |
Enterprise Products Partners L.P. | ||
The foregoing description of the SPU and RPU grants is qualified in its entirety by reference to the terms of the grant agreements, the forms of which are filed herewith as Exhibits 10.12 and 10.13, respectively.
The 2018 payout opportunity for STI awards will be based on the level of performance achieved by the Partnership in objectives that are substantially the same as those used for the prior fiscal year.
PART III
Item 10. Directors, Executive Officers and Corporate Governance
Management of DCP Midstream, LP
We do not have directors or officers, which is commonly the case with publicly traded partnerships. Our operations and activities are managed by our general partner, DCP Midstream GP, LP, which in turn is managed by its general partner, DCP Midstream GP, LLC, which we refer to as our General Partner. Our General Partner is 100% owned by DCP Midstream, LLC. The officers and directors of our General Partner are responsible for managing us. All of the directors of our General Partner are appointed annually by DCP Midstream, LLC and all of the officers of our General Partner serve at the discretion of the directors. Unitholders are not entitled to elect the directors of our General Partner or participate, directly or indirectly, in our management or operations.
142
Board of Directors and Executive Officers of DCP Midstream GP, LLC
The board of directors of our General Partner currently has eight members, three of whom are independent as defined under the independence standards established by the NYSE. Because we are a listed limited partnership and a controlled company, we are not required by the NYSE rules to have a majority of independent directors on the board of directors of our General Partner or to establish a compensation committee or a nominating/corporate governance committee. However, the board of directors of our General Partner has established an audit committee consisting of three independent members of the board and a special committee to address conflict situations.
Our General Partner’s board of directors annually reviews the independence of directors and affirmatively makes a determination that each director expected to be independent has no material relationship with our General Partner, either directly or indirectly as a partner, unitholder or officer of an organization that has a relationship with our General Partner. Our General Partner’s board of directors has affirmatively determined that Messrs. Fowler, Kimble, and Waycaster satisfy the SEC and NYSE independence standards.
The executive officers of our General Partner are responsible for establishing and executing strategic business and operation plans and managing the day-to-day affairs of our business. All of our executive officers are also executive officers of DCP Midstream, LLC. We utilize employees of DCP Midstream, LLC, including the executive officers, to operate our business and provide us with general and administrative services that are reimbursed to DCP Midstream, LLC pursuant to the terms of the Services and Employee Secondment Agreement (the “Services and Employee Secondment Agreement”).
The following table shows information regarding the current directors and executive officers of our General Partner, DCP Midstream GP, LLC. Directors are appointed annually by DCP Midstream, LLC and hold office for one year or until their successors have been elected and qualified or until the earlier of their death, resignation, removal or disqualification. Officers serve at the discretion of the board of directors of our general partner. There are no family relationships among any of the directors or executive officers.
Name | Age | Position with DCP Midstream GP, LLC | ||
Wouter T. van Kempen | 48 | Chairman of the Board, President, Chief Executive Officer, and Director | ||
Sean P. O'Brien | 48 | Group Vice President and Chief Financial Officer | ||
Brent L. Backes | 58 | Group Vice President and General Counsel | ||
Don Baldridge | 48 | President, Commercial | ||
Brian S. Frederick | 52 | President, Asset Operations | ||
Allen C. Capps | 47 | Director | ||
Fred J. Fowler | 71 | Director | ||
William F. Kimble | 58 | Director | ||
Brian Mandell | 54 | Director | ||
Bill W. Waycaster | 79 | Director | ||
Vern Yu | 51 | Director | ||
John Zuklic | 50 | Director | ||
Wouter T. van Kempen was appointed as DCP Midstream GP, LLC’s Chief Executive Officer ("CEO") in January 2013, Chairman of the Board in January 2014, and President in February 2016. Mr. van Kempen is also the Chairman of the Board, President and Chief Executive Officer for DCP Midstream, LLC, which is the owner of DCP Midstream GP, LLC, since January 2013. Mr. van Kempen was previously DCP Midstream, LLC’s President and Chief Operating Officer from September 2012 until January 2013, where he led the gathering and processing and the marketing and logistics business units and oversaw all corporate functions of the organization; President, Gathering and Processing, from January 2012 to August 2012; President, Midcontinent Business Unit, and Chief Development Officer, from August 2010 to December 2011. Prior to joining DCP Midstream, LLC in August 2010, Mr. van Kempen was President of Duke Energy Generation Services from September 2006 to July 2010 and Vice President of Mergers and Acquisitions from December 2005 to September 2006. Mr. van Kempen joined Duke Energy in 2003 and served in a number of management positions. Prior to Duke Energy, Mr. van Kempen was employed by General Electric, where he served in increasing roles of responsibility becoming the staff executive for corporate mergers and acquisitions in 1999.
143
Sean P. O'Brien was appointed Group Vice President and Chief Financial Officer of DCP Midstream GP, LLC in January 2014. Mr. O'Brien is also the Group Vice President and Chief Financial Officer for DCP Midstream, LLC and has served in that position since May 2012. Prior to that time, Mr. O’Brien was Senior Vice President and Treasurer of DCP Midstream, LLC from May 2011 and prior to that, he served as Vice President, Financial Planning and Analysis from September 2009. Prior to joining DCP Midstream, LLC in September 2009, Mr. O’Brien was with Duke Energy Corporation where he served as General Manager of Financial Planning and Forecasting for Duke Energy’s Commercial Business Unit from May 2006, and prior to that, he was Vice President and Controller of Duke Energy Generation Services from May 2005. Mr. O’Brien joined Duke Energy in 1997. Mr. O’Brien is a certified public accountant with over 25 years of experience in the finance area and over 20 years of experience in the energy industry.
Brent L. Backes was appointed Group Vice President and General Counsel of DCP Midstream GP, LLC in February 2017. Mr. Backes has also served as the Group Vice President and General Counsel of DCP Midstream, LLC since February 2002. Prior to joining DCP Midstream, LLC in 1998, Mr. Backes was an attorney in private practice focusing on mergers and acquisitions and regulatory matters in the energy industry since 1987.
Don Baldridge was appointed President, Commercial of DCP Midstream GP, LLC in February 2017. Mr. Baldridge has also been a President of DCP Midstream, LLC overseeing the commercial, marketing, and logistics businesses since March 2013 and before that was Vice President, Natural Gas and NGL Marketing since February 2011. Mr. Baldridge previously served as our Vice President, Business Development from January 2009 until February 2011. Mr. Baldridge joined DCP Midstream, LLC in March 2005. Mr. Baldridge brings more than 25 years of experience in the energy industry, including commercial, trading and business development activities.
Brian S. Frederick was appointed President, Asset Operations of DCP Midstream GP, LLC in February 2017. Mr. Frederick has also been President, Asset Operations of DCP Midstream, LLC since February 2014 and prior to that was President of the Southern and Midcontinent business units of DCP Midstream, LLC since March 2013. Mr. Frederick joined DCP Midstream, LLC in 1999 and previously served as Vice President of Corporate Development and Vice President of Gas Marketing. Mr. Frederick has more than 25 years of experience in the energy industry leading operations, commercial, trading and business development teams.
Allen C. Capps was appointed a director of DCP Midstream GP, LLC in August 2016. Mr. Capps is currently the Vice President and Chief Accounting Officer of Enbridge. Prior to assuming his current role in February 2017, Mr. Capps served in a similar capacity as vice president and controller of Spectra Energy since January 2012. From April 2010 until January 2012, Mr. Capps served as Vice President, Business Development, Storage and Transmission, for Union Gas Limited, Spectra Energy’s Canadian natural gas utility, and as Vice President and Treasurer of Spectra Energy from December 2007 to April 2010. Mr. Capps has broad experience in the energy industry having served in various senior level finance and accounting roles since 2003.
Fred J. Fowler was appointed a director of DCP Midstream GP, LLC in March 2015. Mr. Fowler is the former president and chief executive officer of Spectra Energy, retiring from that position in December 2008. Prior to Spectra Energy’s separation from Duke Energy Corporation in December 2006, Mr. Fowler served as group president for Duke Energy’s gas transmission business since April 2006. Prior to that, Mr. Fowler served as president and chief operating officer of Duke Energy Corporation since November 2002. Mr. Fowler began his career in the energy industry in 1968. Mr. Fowler served as vice chairman of the board of directors of TEPPCO Partners, L.P. from March 1998 to February 2003 and as chairman of the board of directors of our General Partner from April 2007 to January 2009. Mr. Fowler currently serves on the boards of directors of Encana Corp. and PG&E Corporation.
William F. Kimble was appointed a director of DCP Midstream GP, LLC in June 2015. Mr. Kimble retired in February 2015 from KPMG LLP (“KPMG”), one of the largest audit, tax and advisory services firms in the world. Mr. Kimble served as KPMG’s Office Managing Partner for the Atlanta office and Managing Partner - Southeastern United States, where he was responsible for the firm’s audit, advisory and tax operations from 2009 until his retirement. Mr. Kimble was also responsible for moderating KPMG’s Audit Committee Institute and Audit Committee Chair Sessions. Until his retirement, Mr. Kimble had been with KPMG or its predecessor firm since 1986. During his tenure with KPMG, Mr. Kimble held numerous senior leadership positions, including Global Chairman of Industrial Markets. Mr. Kimble also served as KPMG’s Energy Sector Leader for approximately 10 years and was the executive director of KPMG’s Global Energy Institute. Mr. Kimble currently serves on the board of directors of PRGX Global, Inc. and its audit committee and Liberty Oilfield Services Inc. and its audit committee.
Brian Mandell was appointed a director of DCP Midstream GP, LLC in May 2015. Mr. Mandell has 27 years of oil and gas industry experience serving in various marketing, commercial, and midstream roles. He is currently Senior Vice President,
144
Commercial, for Phillips 66. He previously served as Phillips 66's President, Global Marketing, and prior to that, Global Trading Lead, Clean Products, Commercial. Prior to joining Phillips 66 in May 2012, he worked for ConocoPhillips as Manager, U.S. Gasoline Trading since 2011. Previously, Mr. Mandell served in the Commercial NGL group and was named Manager of NGL Trading after working as Manager of Processing Assets and Business Development in 2006. Mr. Mandell began his career with Conoco in 1991 working in various marketing roles.
Bill W. Waycaster was appointed a director of DCP Midstream GP, LLC in June 2015. Mr. Waycaster retired in April 2003 from Texas Petrochemicals LLC (“Texas Petrochemicals”) after working in the hydrocarbon process industries for over 45 years. Mr. Waycaster was President and Chief Executive Officer of Texas Petrochemicals from April 1992 until his retirement. Prior to that, Mr. Waycaster spent 27 years at The Dow Chemical Company (“Dow”) serving as Vice President and General Manager of Hydrocarbons and Energy Resources when he left to join Texas Petrochemicals. Mr. Waycaster held positions at Dow ranging from Project Engineer to Vice President of Business and Asset Management. Mr. Waycaster previously served on the board of directors of the National Petrochemical and Refiners Association, where he served as Chairman of the Petrochemicals Committee and Executive Committee, and also served on the board of directors of the American Chemistry Council. Mr. Waycaster has previously served on the board of directors of each of Destec Energy, Inc. and Enterprise Products GP, LLC.
Vern Yu was appointed a director of DCP Midstream, GP, LLC in March 2017. Mr. Yu is currently Executive Vice President and Chief Development Officer of Enbridge. From July 2014 until assuming his current role in May 2016, Mr. Yu served as Senior Vice President, Corporate Planning, and Chief Development Officer and prior to that served as Senior Vice President of Business and Market Development for Enbridge’s Liquids Pipelines division where he was responsible for all business and market development activities for Enbridge’s crude oil infrastructure business. Since joining Enbridge in 1993, Mr. Yu has held a series of roles with increasing responsibility in the corporate and financial areas. Mr. Yu currently serves on the board of directors of Spectra Energy Partners, LP, the general partner of which is controlled by Enbridge, which is an owner of DCP Midstream, LLC, the owner of our General Partner.
John Zuklic was appointed a director of DCP Midstream GP, LLC in May 2015. Mr. Zuklic has more than 20 years of oil and gas industry experience serving in various finance and commercial roles. He is currently Vice President and Treasurer of Phillips 66 and prior to assuming that role in May 2015 was General Manager, Global Commercial Risk and Compliance. Before joining Phillips 66 and assuming the role of Assistant Treasurer in May 2012, Mr. Zuklic worked for ConocoPhillips as Manager, Treasury Services, since 2008. In 2004, he was named Principal Consultant, Treasury, and prior to that he was Director, Midstream Finance, from 2000 to 2004. Prior to joining ConocoPhillips in 2000, Mr. Zuklic worked at BP p.l.c. for five years in various treasury, finance, and commercial positions.
Director Experience and Qualifications
DCP Midstream, LLC evaluates and recommends candidates for membership on the board of directors of our General Partner based on established criteria. When evaluating director candidates, nominees and incumbent directors, DCP Midstream, LLC has informed us that it considers, among other things, educational background, knowledge of our business and industry, professional reputation, independence, and ability to represent the best interests of our unitholders. DCP Midstream, LLC and the board of directors of our General Partner believe that the above-mentioned attributes, along with the leadership skills and experience in the midstream natural gas industry, provide the Partnership with a capable and knowledgeable board of directors.
Wouter T. van Kempen - Mr. van Kempen was appointed a director because of his extensive knowledge of and experience with our assets as Chairman, President, and Chief Executive Officer of DCP Midstream GP, LLC and as Chairman, President and Chief Executive Officer of DCP Midstream, LLC. Mr. van Kempen brings strong management experience having served in positions of increasing responsibility at Duke Energy and General Electric.
Allen C. Capps - Mr. Capps was appointed a director because of his strong background in the energy industry including his leadership roles in accounting, finance, and business development with Enbridge and Spectra Energy.
Fred J. Fowler - Mr. Fowler was appointed a director because of his extensive knowledge and experience of the energy industry, including a strong understanding of our assets, customers, regulatory environment, and competitive landscape. Mr. Fowler brings leadership, management, and business skills developed as an executive and a director at public and privately held companies.
William F. Kimble - Mr. Kimble was appointed a director because of his extensive accounting background and experience as a director of other public companies. Mr. Kimble brings significant knowledge of the most current and pressing audit and financial compliance matters and reporting obligations faced by public companies.
145
Brian Mandell - Mr. Mandell was appointed a director because of his strong background and knowledge with over two decades of senior leadership experience in a variety of roles including commercial and marketing within the industry.
Bill W. Waycaster - Mr. Waycaster was appointed a director because of his lengthy tenure in the energy industry and executive management experience, spanning over a period of 50 years. Mr. Waycaster contributes valuable insight into strategic, corporate governance, and compliance matters with his prior public company leadership and board experience.
Vern Yu - Mr. Yu was appointed a director because of his valuable industry and executive management experience with corporate and financial matters including mergers and acquisitions, corporate planning and development, and business and market development.
John Zuklic - Mr. Zuklic was appointed a director because of his strong knowledge and extensive experience in the energy industry gained through his current and past roles in treasury, finance, commercial, and risk management.
Section 16(a) Beneficial Ownership Reporting Compliance
Section 16(a) of the Exchange Act requires DCP Midstream GP, LLC’s directors and executive officers, and persons who own more than 10% of a registered class of our equity securities to file with the SEC and the NYSE initial reports of ownership and reports of changes in ownership of our common units and our other equity securities and to furnish us with copies of such reports. To our knowledge, based solely on a review of the copies of reports and amendments thereto furnished to us and written representations that no other reports were required, all Section 16(a) filing requirements applicable to such reporting persons were complied with on a timely basis during the fiscal year ended December 31, 2017.
Audit Committee
The board of directors of our General Partner has a standing audit committee. The audit committee is composed of three independent directors, William F. Kimble (chairman), Fred J. Fowler, and Bill W. Waycaster, each of whom is able to understand fundamental financial statements and at least one of whom has past experience in accounting or related financial management experience. Mr. Kimble has been designated by the board as the audit committee’s financial expert meeting the requirements promulgated by the SEC as set forth in Item 407(d) of Regulation S-K of the Exchange Act based upon his education and employment experience as more fully detailed in Mr. Kimble’s biography set forth above.
The board has determined that each member of the audit committee is independent under Section 303A.02 of the NYSE listing standards and Section 10A(m)(3) of the Exchange Act. In making the independence determination, the board considered the requirements of the NYSE and our Corporate Governance Guidelines. Among other factors, the board considered current or previous employment with us, our auditors or their affiliates by the director or his immediate family members, ownership of our voting securities, and other material relationships with us.
The audit committee has adopted a charter, which has been ratified and approved by the board of directors. The primary purpose of the audit committee is to assist the board of directors in its oversight of (1) the integrity of the financial statements of the Partnership, (2) the compliance by the General Partner and the Partnership with legal and regulatory requirements, and the General Partner’s and the Partnership’s Code of Business Ethics, (3) the independent auditor’s qualifications and independence and (4) the performance of the Partnership’s internal audit function and independent auditors.
Special Committee
The board of directors of our General Partner has a standing special committee, which is comprised of two independent directors, Bill W. Waycaster (chairman) and William F. Kimble. The special committee will review specific matters that the board believes may involve conflicts of interest, including transactions between us and DCP Midstream, LLC or its affiliates. The special committee will determine if the resolution of the conflict of interest is fair and reasonable to us, or on grounds no less favorable to us than generally available from unrelated third parties. The special committee meets as requested by the board of directors. The members of the special committee may not be officers or employees of our General Partner or directors, officers or employees of its affiliates. Each of the members of the special committee meet the independence and experience standards established by the NYSE and the Exchange Act. Any matters approved by the special committee will be conclusively deemed to be fair and reasonable to us, approved by all of our partners, and not a breach by our General Partner of any duties it may owe us or our unitholders.
146
Corporate Governance Guidelines, Code of Business Ethics, and Audit Committee Charter
The board of directors of our general partner adopted Corporate Governance Guidelines that outline the important policies and practices regarding our governance.
We have adopted a Code of Business Ethics applicable to all persons serving as our directors, officers (including without limitation, our principal executive officer, principal financial officer and principal accounting officer) and employees. We intend to disclose any amendment to or waiver of our Code of Business Ethics that applies to our executive officers or directors on our website at www.dcpmidstream.com in order to satisfy disclosure requirements under SEC and NYSE rules relating to such information.
Copies of our Corporate Governance Guidelines, Code of Business Ethics and Audit Committee Charter are available on our website at www.dcpmidstream.com. Copies of these items are also available free of charge in print to any person who sends a request to the office of the Secretary of DCP Midstream, LP at 370 17th Street, Suite 2500, Denver, Colorado 80202. The information contained on, or connected to, our website is not incorporated by reference into this annual report on Form 10-K and should not be considered part of this or any other report that we file with or furnish to the SEC.
Meeting of Non-Management Directors and Communications with Directors
At each quarterly meeting of the board of directors of our general partner, the independent directors meet in an executive session, which executive sessions are presided over by William F. Kimble. In addition, at each quarterly meeting of the board of directors, the non-management members of the board meet in executive session, which executive sessions are presided over by Fred J. Fowler.
Unitholders or interested parties may communicate with any and all members of our board, including our non-management directors, or any committee of our board, by transmitting correspondence by mail or facsimile addressed to one or more directors by name or to the chairman of the board or any committee of the board at the following address and fax number: Name of the Director(s), c/o Corporate Secretary, DCP Midstream, LP, 370 17th Street, Suite 2500, Denver, Colorado 80202, fax number 303-605-2226.
Report of the Audit Committee
The audit committee oversees our financial reporting process on behalf of the board of directors. Management has the primary responsibility for the financial statements and the reporting process including the systems of internal controls over financial reporting. The audit committee operates under a written charter approved by the board of directors. The charter, among other things, provides that the audit committee is responsible for the appointment, compensation, oversight, retention, and termination of the independent auditor. In this context, the audit committee:
• | reviewed and discussed quarterly and annual earnings press releases, quarterly unaudited financial statements, and the annual audited financial statements included in this Annual Report on Form 10-K with management and Deloitte & Touche LLP, our independent auditors, including a discussion of the quality, not just the acceptability, of the accounting principles, the reasonableness of significant judgments and the clarity of disclosures in the financial statements; |
• | reviewed with Deloitte & Touche LLP, who are responsible for expressing an opinion on the conformity of the audited financial statements with generally accepted accounting principles, their judgments as to the quality and acceptability of our accounting principles and such other matters as are required to be discussed with the audit committee under generally accepted auditing standards; |
• | received the written disclosures and the letter required by standard No. 1 of the independence standards board (independence discussions with audit committees) provided to the audit committee by Deloitte & Touche LLP; |
• | discussed with Deloitte & Touche LLP its independence from management and us and considered the compatibility of the provision of nonaudit service by the independent auditors with the auditors’ independence; |
• | discussed with Deloitte & Touche LLP the matters required to be discussed by statement on auditing standards No. 16 (PCAOB Auditing Standard No. 16, Communications With Audit Committees, Related Amendments to PCAOB Standards and Transitional Amendments to AU Section 380); |
• | discussed with our internal auditors and Deloitte & Touche LLP the overall scope and plans for their respective audits. The audit committee meets with the internal auditors and Deloitte & Touche LLP, with and without management present, to discuss the results of their examinations, their evaluations of our internal controls and the overall quality of our financial reporting; |
147
• | based on the foregoing reviews and discussions, recommended to the board of directors that the audited financial statements be included in the Annual Report on Form 10-K for the year ended December 31, 2017, for filing with the SEC; and |
• | approved the reappointment of Deloitte & Touche LLP to serve as our independent auditors based on an annual consideration of, among other factors, the following: their historical and recent performance on our audit, the quality and candor of their communications with the audit committee and management, the depth of expertise of their audit team and the value provided by their national office, the appropriateness of their fees, how effectively they maintained their independence, their tenure as our independent auditors, their knowledge of our operations, accounting policies and practices, and internal control over financial reporting, and external data relating to audit quality and performance by them and their peer firms. |
This report has been furnished by the members of the audit committee of the board of directors:
Audit Committee
William F. Kimble (Chairman)
Fred J. Fowler
Bill W. Waycaster
The report of the audit committee in this report shall not be deemed incorporated by reference into any other filing by DCP Midstream, LP under the Securities Act of 1933, as amended, or the Exchange Act, except to the extent that we specifically incorporate this information by reference, and shall not otherwise be deemed filed under such laws.
148
Item 11. Executive Compensation
Compensation Discussion and Analysis
General
We were formed in 2005. Similar to other publicly traded partnerships, our operations are managed by our general partner, DCP Midstream GP, LP, which in turn is managed by its general partner, DCP Midstream LLC, which we refer to as our General Partner. Our General Partner is 100% owned by DCP Midstream, GP, LLC. When we refer herein to the board of directors, we are referring to the board of directors of our General Partner. Additionally, when we refer herein to the compensation committee, we are referring to the compensation committee of the board of directors of DCP Midstream, LLC, comprised of Chairman Greg C. Garland, Chairman and CEO of Phillips 66 and Al Monaco, President and CEO of Enbridge Inc.
We have entered into the Services Agreement with DCP Midstream, LLC pursuant to which, among other matters, DCP Services, LLC makes available its employees who manage and operate our assets and serve as the executive officers, including the named executive officers, or NEOs, of our General Partner. For the year ended December 31, 2017, the NEOs of our General Partner were Wouter T. van Kempen, Chairman of the Board, President, and Chief Executive Officer (Principal Executive Officer); Sean P. O’Brien, Group Vice President and Chief Financial Officer (Principal Financial Officer); Brent L. Backes, Group Vice President and General Counsel, Don A. Baldridge, President, Commercial and Brian S. Frederick, President, Asset Operations.
The NEOs prior to the Transaction allocated their time between managing our business and the business of DCP Midstream, LLC. Following the closing of the Transaction, each of the current NEOs devotes all of their time to our business.
The General Partner has not entered into employment agreements with any of the NEOs. The NEOs do not receive any separate compensation from us for their services to our business or as executive officers of our General Partner. We pay DCP Midstream, LLC the full cost for the compensation of our NEOs. The compensation committee has the ultimate decision-making authority with respect to the total compensation that DCP Midstream, LLC pays to the NEOs.
Compensation Decisions
All compensation decisions concerning the officers and employees dedicated to our operations and management are made by the compensation committee. The compensation committee’s responsibilities on compensation matters include the following:
• | annually review the Partnership’s goals and objectives relevant to compensation of the NEOs; |
• | annually evaluate the NEO’s performance in light of the Partnership’s goals and objectives, and approve the compensation levels for the NEOs; |
• | periodically evaluate the terms and administration of short-term and long-term incentive plans to assure that they are structured and administered in a manner consistent with the Partnership’s goals and objectives; |
• | periodically evaluate incentive compensation and equity-related plans and consider amendments if appropriate; |
• | retain and terminate any compensation consultant to assist in the evaluation of compensation for directors who are not officers or employees of the General Partner or its affiliates, or our non-employee directors, and NEOs; and |
• | periodically review the compensation of the non-employee directors. |
149
Compensation Philosophy
The Partnership’s compensation program is structured to provide the following benefits:
• | attract, retain and reward talented executive officers and key management employees by providing total compensation competitive with that of other executive officers in our industry; |
• | motivate executive officers and key management employees to achieve strong financial and operational performance; |
• | emphasize performance-based compensation, balancing short-term and long-term results; and |
• | reward individual performance. |
Methodology - Advisors and Peer Companies
The compensation committee reviews data from market surveys provided by independent consultants to assess our competitive position with respect to base salary, annual short-term incentives and long-term incentive compensation for our NEOs as well as the compensation package for our non-employee directors. With respect to NEO compensation, the compensation committee also considers individual performance, levels of responsibility, skills and experience. In 2016, management, on behalf of the compensation committee, engaged the services of Mercer, a compensation consultant, to conduct a study to assist us in establishing overall compensation packages for the NEOs for 2017. We consider Mercer to be independent of the Partnership and therefore, the work performed by Mercer does not create a conflict of interest. The Mercer study was based on compensation for a group of peer companies with similar operations obtained from public documents as well as multiple survey sources, including the 2016 Mercer Benchmark Database and the 2016 Mercer Total Compensation Survey for the Energy Sector.
The Mercer study was comprised of the following peer companies:
Boardwalk Pipeline Partners, LP | Magellan Midstream Partners, LP |
Buckeye Partners, LP | MPLX, LP |
Crestwood Equity Partners, LP | NuStar Energy, LP |
Enable Midstream Partners, LP | ONEOK Partners, LP |
EnLink Midstream Partners, LP | Targa Resources Corp. |
Genesis Energy, LP | Western Gas Partners, LP |
Studies such as this generally include only the most highly compensated officers of each company, which correlates with most of the NEOs. The results of this study as well as other factors such as targeted performance objectives served as a benchmark for establishing total annual direct compensation packages for the NEOs. Peer data from the Mercer study and the data point that represents the 50th percentile of the market in the surveys were used to assess the competitiveness of the total annual direct compensation packages for the NEOs.
Components of Compensation
The total annual direct compensation program for the NEOs consists of three components: (1) base salary; (2) a short-term cash incentive, or STI, which is based on a percentage of annual base salary; and (3) the present value of a grant of phantom units payable in cash upon vesting under the DCP Services, LLC 2008 Long-Term Incentive Plan, or LTIP, which is based on a percentage of annual base salary. Effective March 27, 2017, the base salary, short-term incentive targets, and long-term incentive targets for our NEOs were as follows:
150
Name and Principal Position | Base Salary | Short-Term Incentive Target | Long-Term Incentive Target | Total | ||||
Wouter T. Van Kempen, CEO, President & Chairman | $669,500 | 100% | 225% | $2,845,375 | ||||
Sean P. O'Brien, Group Vice President & Chief Financial Officer | $401,700 | 70% | 165% | $1,345,695 | ||||
Brent L. Backes, Group Vice President & General Counsel | $411,500 | 65% | 140% | $1,255,075 | ||||
Don A. Baldridge, President, Commercial | $376,400 | 65% | 125% | $1,091,560 | ||||
Brian S. Frederick, President, Asset Operations | $390,500 | 65% | 125% | $1,132,450 | ||||
In allocating compensation among these components, we believe a significant portion of the compensation of the NEOs should be performance-based since these individuals have a greater opportunity to influence our performance. In making this allocation, we have relied in part on the Mercer study and considered each component of compensation as described below.
Base Salary - Base salaries for NEOs are determined based upon job responsibilities, level of experience, individual performance, and comparisons to the salaries of individuals in similar positions obtained from the Mercer study. The goal of the base salary component is to compensate NEOs at a level that approximates the median salaries of individuals in comparable positions at comparably sized companies in our industry.
The base salaries for NEOs are generally reevaluated annually as part of our performance review process, or when there is a change in the level of job responsibility. The compensation committee annually considers and approves a merit increase in base salary based upon the results of this performance review process. Merit increases are based on industry trends and a review of individual performance in certain categories, such as business values, environmental, health & safety performance, leadership, financial results, project results, attitude, ability and knowledge.
Annual Short-Term Cash Incentive - Under the STI plan, annual cash incentives are provided to executives to promote the achievement of our performance objectives. Target incentive opportunities for executives under the STI are established as a percentage of base salary. Incentive amounts are intended to provide total cash compensation at the market median for executive officers in comparable positions when target performance is achieved, below the market median when performance is less than target and above the market median when performance exceeds target. The Mercer study was used to determine the competitiveness of the incentive opportunity for comparable positions. STI payments are generally paid in cash in March of each year for the prior fiscal year’s performance.
The 2017 STI objectives were initially designed and proposed by our CEO and Chairman of the Board and subsequently approved by the compensation committee. All STI objectives are tied to the performance of the Partnership and are subject to change each year based on annual strategic priorities and goals. The 2017 objectives comprising the total STI opportunity for the NEOs are described below.
Financial objectives (65% of total STI):
1. | Distributable Cash Flow. An objective intended to capture the annual amount of cash that is available for the quarterly distributions to our unitholders. For this objective, the level of performance is based on our annual budget. |
2. | Constant Price Cash Generation. An objective intended to capture the cash generated from operations for the Partnership excluding the effect of commodity prices. For this objective, we established a range of performance from a minimum of $805 million to a maximum of $875 million. |
3. | Cost. An objective intended to capture the ongoing operating and general and administrative costs of the Partnership. For this objective, we established a range of performance from a minimum of $940 million to a maximum of $890 million. |
Operational objectives (20% of total STI):
1. | Capacity Utilization. An objective intended to drive asset efficiency by measuring gas volume per compressor. |
2. | Customer Gas Curtailed. An objective to measure the impact of reliability on customer volume with the intent to maximize our customers’ productivity. |
151
3. | DCP 2.0 EBITDA Contribution. An objective intended to capture the additional EBITDA from the DCP 2.0 innovation strategies. |
Safety & Environmental Objectives (15% of total STI):
1. | Total Recordable Injury Rate (TRIR). An objective of both employee and contractor injury rates covering the assets of the Partnership. For this objective, the maximum level of performance is a TRIR of 0.35 and the minimum level of performance is a TRIR of 0.75. |
2. | Process Safety Event Ratio (PSE Ratio). An objective using a broad definition of process safety events covering the assets of the Partnership. For this objective, the maximum level of performance is a PSE Ratio of 3.0 and a minimum level of performance is a PSE Ratio of 5.64. |
3. | Total Emissions. An objective of air emissions, natural gas vented or flared, covering the assets of the Partnership. For this objective, we have established certain levels of emissions at such assets. |
The payout on the Partnership objectives range from 0% if the minimum level of performance is not achieved, 50% if the minimum level of performance is achieved, 100% if the target level of performance is achieved and 200% if the maximum level of performance is achieved. When the performance level falls between these percentages, payout will be evaluated using straight-line interpolation with the final percentages determined by the compensation committee.
Early in 2018, management prepared a report on the achievement of the Partnership objectives during 2017. These results were then reviewed and approved by the compensation committee. The level of performance achieved in 2017 for each of the STI objectives was as follows:
STI Objectives | Level of Performance Achieved | |
Distributable Cash Flow | Between Target & Maximum | |
Constant Price Cash Generation | At Maximum | |
Cost | Between Target & Maximum | |
Capacity Utilization | Between Target & Maximum | |
Customer Gas Curtailed | Between Target & Maximum | |
DCP 2.0 EBITDA Contribution | Between Target & Maximum | |
Total Recordable Injury Rate (TRIR) | At Target | |
Process Safety Event Ratio (PSE Ratio) | Between Target & Maximum | |
Total Emissions | At Maximum | |
Long-Term Incentive Plan - The LTIP has the objective of providing a focus on long-term value creation and enhancing executive retention. Under the LTIP, phantom units are issued where half of such phantom units are strategic performance units, or SPUs, and half are restricted phantom units, or RPUs. The SPUs will vest based upon the level of achievement of certain performance objectives over a three-year performance period, or the Performance Period. The RPUs will vest if the executive officer remains employed at the end of a three-year vesting period, or the Vesting Period. We believe this program promotes retention of the executive officers, and focuses the executive officers on the goal of long-term value creation.
For 2017, the SPUs had the following three performance measures: (1) constant price earnings before interest and taxes return on capital employed, or EBIT ROCE, by the Partnership over the Performance Period; (2) total shareholder return, or TSR, over the Performance Period of DCP Midstream, LLC’s owner, Phillips 66, relative to their peer group; and (3) risk-adjusted total shareholder return or R-TSR, defined as total shareholder return divided by volatility, over the Performance Period of DCP Midstream, LLC’s owner, Enbridge Inc. relative to their peer group. Half of the SPUs will be measured against the EBIT ROCE performance measure, one quarter of the SPUs will be measured against the TSR performance objective, and one quarter of the SPUs will be measured against the R-TSR performance objective. The compensation committee believes utilizing EBIT ROCE of the Partnership, which is a financial performance measure of the Partnership that measures management’s effectiveness, directly aligns the performance of the NEOs with the success of the Partnership. We believe these performance measures provide management with appropriate incentives for our disciplined and steady growth.
For the EBIT ROCE performance measure, EBIT for the Partnership will be as calculated from its financial statements. Capital employed will be determined each year during the annual budget process as approved by our board of directors. The
152
EBIT ROCE targets are reset each year, based on our annual budget, and the final result will be based on the average of the three one-year periods running from 2017 through 2019.
The TSR result for the LTIP will equal the TSR results paid by Phillips 66 under their long-term incentive plan. For 2017, the companies included in the Phillips 66 peer group that will be compared against Phillips 66 are as follows:
Phillips 66 peer group: | ||
Andeavor | Enterprise Products Partners, LP | S&P 100 |
Celanese Corporation | HollyFrontier Corporation | Targa Resources Corp |
Delek US Holdings, Inc | Huntsman Corporation | Valero Energy Corporation |
DowDuPont Inc | Marathon Petroleum Corporation | Westlake Chemical Corporation |
Eastman Chemical Company | ONEOK, Inc | |
Energy Transfer Equity, LP | PBF Energy, Inc | |
The R-TSR result for the LTIP will equal the R-TSR results paid by Enbridge under their long-term incentive plan. For 2017, the companies included in the Enbridge peer group that will be compared against Enbridge are as follows:
Enbridge peer group: | ||
Canadian Utilities: | US Peers: | |
Fortis Inc | Dominion Resources | ONEOK, Inc |
Inter Pipeline Ltd | DTE Energy Company | PG&E Corporation |
Pembina Pipeline Corporation | Energy Transfer Equity, LP | Plains All American Pipeline, LP |
TransCanada Corporation | Enterprise Products Partners, LP | Sempra Energy |
Kinder Morgan, Inc | Williams Companies, Inc | |
Magellan Midstream Partners, LP | ||
These SPU and RPU awards are granted as of January 1st each year. Award recipients also receive the right to receive dividend equivalent rights, or DERs, on the number of common units earned during the Vesting Period. The DERs on the SPUs are paid in cash at the end of the Performance Period and the DERs on the RPUs are paid quarterly in cash during the Vesting Period. The amount paid on the DERs is equal to the quarterly distributions actually paid on the underlying securities during the Performance Period and the Vesting Period on the number of SPUs earned or RPUs granted, respectively.
Our practice is to determine the dollar amount of long-term incentive compensation that we want to provide, and to then grant a number of SPUs and RPUs that have a fair market value equal to that amount on the date of grant, which is based on the average closing prices of Enbridge and Phillips 66 common stock on the NYSE for the 20 trading days prior to the date of grant under the LTIP. Target long-term incentive opportunities for executives under the plan are established as a percentage of base salary, using the Mercer study data for individuals in comparable positions.
In the event an award recipient’s employment is terminated after the first anniversary of the grant date for reasons of death, disability, retirement, or layoff, the recipient’s: (i) SPUs will contingently vest on a pro rata basis for time worked over the Performance Period and final performance, measured at the end of the Performance Period, will determine the payout and (ii) RPUs will become fully vested and payable. Termination of employment for any other reason will result in the forfeiture of any unvested units and unpaid DERs.
On February 23, 2018 the compensation committee determined that the RPUs and SPUs issued in 2018 will be based on the value of DCP units and will be paid in cash. The compensation committee also approved a change in the LTI performance criteria for the 2018 SPU grants. The performance criteria for 2018 SPUs will be as follows: (1) 50% distributable cash flow per unit of the Partnership and (2) 50% relative total shareholder return of the Partnership. See Item 9b for a complete description of the changes approved by the compensation committee.
Other Compensation - In addition, executives are eligible to participate in other compensation programs, which include but are not limited to:
153
Company Matching and Retirement Contributions to Defined Contribution Plans - Executives may elect to participate in a 401(k) and retirement plan. Under the plan, executives may elect to defer up to 75% of their eligible compensation, or up to the limits specified by the Internal Revenue Service. We match the first 6% of eligible compensation contributed by the executive to the plan. In addition, we make retirement contributions ranging from 4% to 7% of the eligible compensation of qualifying participants to the plan, based on years of service, up to the limits specified by the Internal Revenue Service. We have no defined benefit plans.
Miscellaneous Compensation - Executive officers are eligible to participate in a non-qualified deferred compensation program. Executive officers are allowed to defer up to 75% of their base salary, up to 90% of their STI and up to 100% of their LTIP or other compensation. Executive officers elect either to receive amounts contributed during specific plan years as a lump sum at a specific date, subject to Internal Revenue Service rules, as an annuity (up to five years) at a specific date, subject to Internal Revenue Service rules, or in a lump sum or annual annuity (over three to ten years) at termination.
Within the non-qualified deferred compensation program is a non-qualified, defined contribution retirement plan in which benefits earned under the plan are attributable to compensation in excess of the annual compensation limits under Section 401(k) of the Code. Under this part of the plan, we make a contribution of up to 13% of compensation, as defined by the plan, to the non-qualified deferred compensation program.
Benefit Programs - We provide employees, including the executive officers, with a variety of health and welfare benefit programs. The health and welfare programs are intended to protect employees against catastrophic loss and promote well-being. These programs include medical, pharmacy, dental, life insurance, and accidental death and disability. We also provide all employees with a monthly parking pass or a pass to be used on public transportation systems.
We do not provide any material perquisites or any other personal benefits to our executives.
We are a partnership and not a corporation for U.S. federal income tax purposes, and therefore, are not subject to the executive compensation tax deductible limitations of Section 162(m) of the Code. Accordingly, none of the compensation paid to NEOs is subject to the limitation.
154
Board of Directors Report on Compensation
Our General Partner’s board of directors does not have a compensation committee. The board of directors of the General Partner has reviewed and discussed with management the “Compensation Discussion and Analysis” presented above. Members of management with whom the board of directors had discussions are the Chairman, Chief Executive Officer, and President of the General Partner and the Group Vice President and Chief Human Resources Officer of DCP Midstream, LLC. In addition, we engaged the services of Mercer, a compensation consultant, to conduct a study to assist us in establishing overall compensation packages for the executives. Based on this review and discussion, the board of directors of the General Partner recommended that the “Compensation Discussion and Analysis” referred to above be included in this Annual Report on Form 10-K for the year ended December 31, 2017.
The information contained in this Board of Directors Report on Compensation shall not be deemed to be “soliciting material” or to be “filed” with the SEC, nor shall such information be incorporated by reference into any filing with the SEC, or subject to the liabilities of Section 18 of the Exchange Act, except to the extent that we specifically incorporate it by reference into a document filed under the Securities Act of 1933, as amended (the "Securities Act"), or the Exchange Act.
Board of Directors
Wouter T. van Kempen (Chairman)
Allen C. Capps
Fred J. Fowler
William F. Kimble
Brian Mandell
Bill W. Waycaster
Vern Yu
John Zuklic
155
Executive Compensation Tables
The following tables and accompanying narrative disclosures provide information regarding compensation of our named executive officers, or NEOs, as of December 31, 2017.
Summary Compensation Table
The following table summarizes the compensation awarded to, earned by or paid to the named executive officers of our General Partner for the services they provided to our business:
Name and Principal Position | Year | Salary | LTI Awards (c) | Non-Equity Incentive Plan Compensation (d) | All Other Compensation (e) | Total | |||||||||||||||||
Wouter T. van Kempen, Chairman of the Board, President and Chief Executive Officer | |||||||||||||||||||||||
2017 | $ | 664,250 | $ | 1,506,735 | $ | 1,074,511 | $ | 442,250 | $ | 3,687,746 | |||||||||||||
2016 | $ | — | $ | — | $ | — | $ | — | $ | 1,303,012 | (a) | ||||||||||||
2015 | $ | — | $ | — | $ | — | $ | — | $ | 1,000,000 | (a) | ||||||||||||
Sean P. O’Brien, Group Vice President and Chief Financial Officer | |||||||||||||||||||||||
2017 | $ | 398,550 | $ | 662,999 | $ | 451,295 | $ | 204,895 | $ | 1,717,739 | |||||||||||||
2016 | $ | — | $ | — | $ | — | $ | — | $ | 545,503 | (a) | ||||||||||||
2015 | $ | — | $ | — | $ | — | $ | — | $ | 400,000 | (a) | ||||||||||||
Brent L. Backes, Group Vice President and General Counsel (b) | |||||||||||||||||||||||
2017 | $ | 408,538 | $ | 576,480 | $ | 429,562 | $ | 215,903 | $ | 1,630,483 | |||||||||||||
Don A. Baldridge, President, Commercial (b) | |||||||||||||||||||||||
2017 | $ | 373,438 | $ | 469,399 | $ | 392,655 | $ | 175,427 | $ | 1,410,919 | |||||||||||||
Brian S. Frederick, President, Operations (b) | |||||||||||||||||||||||
2017 | $ | 387,673 | $ | 489,116 | $ | 407,623 | $ | 172,112 | $ | 1,456,524 | |||||||||||||
(a) Prior to the Transaction, this NEO allocated 40% of his time between managing our business and the business of DCP Midstream, LLC where the time devoted to our business was driven by the needs and demands of our ongoing business and business development efforts. This amount represents the portion of the fixed general and administrative fee we paid to DCP Midstream, LLC under the Services Agreement as reimbursement for the time this NEO allocated to our business.
(b) This individual was first appointed an executive officer of our General Partner on February 9, 2017.
(c) The amounts in this column reflect the grant date fair value of strategic performance units, or SPUs, and restricted phantom units, or RPUs granted under the LTIP, and are computed in accordance with the provisions of the FASB Accounting Standards Codification, or ASC, 718 “Compensation-Stock Compensation”, or ASC 718. SPU awards are subject to performance conditions and the amounts shown are for target performance because target is the probable outcome. For SPUs granted in 2017, the performance conditions are between 0% if the minimum level of performance is not achieved to 200% if the maximum level of performance is achieved. The maximum value payable on the SPUs based on the 2017 grant date fair value, assuming the SPUs vested at the highest level of performance conditions, would be $1,506,735 for Wouter T. van Kempen, $662,999 for Sean P. O’Brien, $576,480 for Brent L. Backes, $469,399 for Don A. Baldridge, and $489,116 for Brian S. Frederick.
(d) Includes amounts payable under the STI Plan, including any amounts voluntarily deferred. These amounts are expected to be paid in March 2018.
(e) Includes DERs, Partnership contributions to the defined contribution plan and Partnership contributions to the nonqualified deferred compensation plan, as described in more detail below.
156
All Other Compensation
“All Other Compensation” in the summary compensation table includes the following for 2017:
Company retirement contributions to defined contribution plans | Nonqualified deferred compensation program contributions | DERs | Total | ||||||||||||
Wouter T. van Kempen | $ | 27,000 | $ | 191,499 | $ | 223,751 | $ | 442,250 | |||||||
Sean P. O’Brien | $ | 27,000 | $ | 71,004 | $ | 106,891 | $ | 204,895 | |||||||
Brent L. Backes | $ | 32,400 | $ | 96,878 | $ | 86,625 | $ | 215,903 | |||||||
Don A. Baldridge | $ | 29,700 | $ | 61,319 | $ | 84,408 | $ | 175,427 | |||||||
Brian S. Frederick | $ | 35,100 | $ | 73,344 | $ | 63,668 | $ | 172,112 | |||||||
157
Grants of Plan-Based Awards
Following are the grants of plan-based awards to the NEOs during the year ended December 31, 2017:
Estimated Future Payouts under Non-Equity Incentive Plan Awards (a) | Estimated Future Payouts under Equity Incentive Plan Awards | ||||||||||||||||||||||||||
Name | Grant Date | Minimum ($) | Target ($) | Maximum ($) | Minimum (#) | Target (#) | Maximum (#) | Grant Date Fair Value of LTIP Awards ($) | |||||||||||||||||||
Wouter T. van Kempen | NA | $ | — | $ | 664,250 | $ | 1,328,500 | — | — | — | $ | — | |||||||||||||||
SPUs | (b) | $ | — | $ | — | $ | — | — | 13,250 | 26,500 | $ | 753,367 | |||||||||||||||
RPUs | (c) | $ | — | $ | — | $ | — | 13,250 | 13,250 | 13,250 | $ | 753,367 | |||||||||||||||
Sean P. O’Brien | NA | $ | — | $ | 278,985 | $ | 557,970 | — | — | — | $ | — | |||||||||||||||
SPUs | (b) | $ | — | $ | — | $ | — | — | 5,830 | 11,660 | $ | 331,499 | |||||||||||||||
RPUs | (c) | $ | — | $ | — | $ | — | 5,830 | 5,830 | 5,830 | $ | 331,499 | |||||||||||||||
Brent L. Backes | NA | $ | — | $ | 265,550 | $ | 531,100 | — | — | — | $ | — | |||||||||||||||
SPUs | (b) | $ | — | $ | — | $ | — | — | 5,070 | 10,140 | $ | 288,240 | |||||||||||||||
RPUs | (c) | $ | — | $ | — | $ | — | 5,070 | 5,070 | 5,070 | $ | 288,240 | |||||||||||||||
Don A. Baldridge | NA | $ | — | $ | 242,735 | $ | 485,470 | — | — | — | $ | — | |||||||||||||||
SPUs | (b) | $ | — | $ | — | $ | — | — | 4,130 | 8,260 | $ | 234,700 | |||||||||||||||
RPUs | (c) | $ | — | $ | — | $ | — | 4,130 | 4,130 | 4,130 | $ | 234,700 | |||||||||||||||
Brian S. Frederick | NA | $ | — | $ | 251,988 | $ | 503,975 | — | — | — | $ | — | |||||||||||||||
SPUs | (b) | $ | — | $ | — | $ | — | — | 4,300 | 8,600 | $ | 244,558 | |||||||||||||||
RPUs | (c) | $ | — | $ | — | $ | — | 4,300 | 4,300 | 4,300 | $ | 244,558 | |||||||||||||||
(a) Amounts shown represent amounts under the STI. If minimum levels of performance are not met, then the payout for one or more of the components of the STI may be zero.
(b) The number of units shown represents units awarded under the LTIP as of January 1, 2017. If minimum levels of performance are not met, then the payout may be zero.
(c) The number of units shown represents units awarded under the LTIP as of January 1, 2017 and these units vest at the end of the Vesting Period provided the individual is still employed by the Partnership.
The SPUs awarded on January 1, 2017 will vest in their entirety on December 31, 2019 if the specified performance conditions are satisfied and the RPUs awarded on January 1, 2017 will vest in their entirety on December 31, 2019 if the NEO is still employed by the Partnership, or earlier in the case of death, disability, retirement or layoff.
158
Outstanding Equity Awards at Fiscal Year-End
Following are the outstanding equity awards for the NEOs as of December 31, 2017:
Outstanding LTIP Awards | |||||||
Name | Equity Incentive Plan Awards: Unearned Units That Have Not Vested(a) | Equity Incentive Plan Awards: Market Value of Unearned Units That Have Not Vested(b) | |||||
Wouter T. van Kempen | 104,297 | $ | 5,801,286 | ||||
Sean P. O’Brien | 51,407 | $ | 2,861,717 | ||||
Brent L. Backes | 25,326 | $ | 1,403,686 | ||||
Don A. Baldridge | 38,960 | $ | 2,170,182 | ||||
Brian S. Frederick | 29,904 | $ | 1,664,625 | ||||
(a) SPUs awarded in 2016 and 2017 vest in their entirety over a range of 0% to 200% on December 31, 2018 and 2019, respectively, if the specified performance conditions are satisfied. RPUs awarded in 2015, 2016 and 2017 vest in their entirety on October 21, 2018, December 31, 2018 and 2019, respectively. To determine the outstanding awards, the calculation of the number of SPUs that are expected to vest is based on assumed performance of 200% as the previous fiscal year performance has exceeded target performance.
(b) Value calculated based on the closing price on the NYSE on December 29, 2017 of Enbridge’s common stock of $39.11 and Phillips 66’s common stock of $101.15.
Stock Awards Vested
Following are the stock awards vested for the NEOs for the year ended December 31, 2017:
Stock Awards | |||||||
Name | Number of Units Acquired on Vesting | Value Realized on Vesting (a) | |||||
Wouter T. van Kempen | 32,896 | $ | 1,957,834 | ||||
Sean P. O’Brien | 12,705 | $ | 756,200 | ||||
Brent L. Backes (b) | 15,112 | $ | 898,711 | ||||
Don A. Baldridge | 10,285 | $ | 612,322 | ||||
Brian S. Frederick | 10,285 | $ | 612,322 | ||||
(a) Value calculated based on the average closing prices on the NYSE for the last 20 trading days in 2017 of Enbridge’s common stock of $38.63 and Phillips 66’s common stock of $99.71.
(b) Includes 5,070 units that vested on December 31, 2017 due to his retirement eligibility, the value of which is based on the closing price on the NYSE on December 29, 2017 of Enbridge’s common stock of $39.11 and Phillips 66’s common stock of $101.15.
159
Nonqualified Deferred Compensation
Following is the nonqualified deferred compensation for the NEOs for the year ended December 31, 2017:
Name | Executive Contributions in Last Fiscal Year(a) | Registrant Contributions in Last Fiscal Year(a) | Aggregate Earnings in Last Fiscal Year(b) | Aggregate Withdrawal/ Distributions | Aggregate Balance at December 31, 2017 | |||||||||||||||
Wouter T. van Kempen | $ | 381,654 | $ | 191,499 | $ | 85,894 | $ | — | $ | 1,915,776 | ||||||||||
Sean P. O’Brien | $ | 176,187 | $ | 71,004 | $ | 18,849 | $ | (111,214 | ) | $ | 435,622 | |||||||||
Brent L. Backes | $ | 61,281 | $ | 96,878 | $ | 125,326 | $ | — | $ | 2,718,510 | ||||||||||
Don A. Baldridge | $ | 111,673 | $ | 61,319 | $ | 36,984 | $ | (20,739 | ) | $ | 685,328 | |||||||||
Brian S. Frederick | $ | 37,849 | $ | 73,344 | $ | 234,701 | $ | — | $ | 2,212,728 | ||||||||||
(a) These amounts are included in the Summary Compensation Table for the year 2017.
(b) At the election of each executive officer, the performance of non-qualified deferred compensation is linked to certain mutual funds or to the US High Yield BB rated Bond Index specific to the Energy sector.
160
Potential Payments upon Termination or Change in Control
The General Partner has not entered into any employment agreements with any of our executive officers. The NEOs participate in executive severance arrangements maintained by DCP Services, LLC in the event of termination of employment that is involuntary or not for cause. Mr. Backes is retirement eligible and any voluntary termination would be treated as a retirement.
As noted above, the SPUs, RPUs and the related dividend equivalent rights, or DERs, will become payable to executive officers under certain circumstance related to termination. When an employee terminates employment with the Partnership, they are entitled to a cash payment for the amount of unused vacation hours at the date of their termination.
In the event of a change in control, the disposition of SPUs, RPUs and the related DERs will be determined by the board of directors of DCP Midstream, LLC. There are no formal plans for severance in the event of a change in control.
The following table presents payments in the event of termination for reasons of death, disability, or if the recipient is terminated by the General Partner for reasons other than cause as of the last business day of 2017:
2017 STI | Severance | 2015 LTI | Accelerated LTIP | Total | |||||||||||||||
Wouter T. van Kempen | $ | 1,074,511 | $ | 1,004,250 | $ | 2,079,394 | $ | 3,262,105 | $ | 7,420,260 | |||||||||
Sean P. O’Brien | $ | 451,295 | $ | 401,700 | $ | 803,155 | $ | 1,763,801 | $ | 3,419,951 | |||||||||
Brent L. Backes (a) | $ | 429,562 | $ | 411,500 | $ | 997,125 | $ | 1,078,503 | $ | 2,916,690 | |||||||||
Don A. Baldridge | $ | 392,655 | $ | 376,400 | $ | 650,332 | $ | 1,410,409 | $ | 2,829,796 | |||||||||
Brian S. Frederick | $ | 407,623 | $ | 390,500 | $ | 650,332 | $ | 846,301 | $ | 2,294,756 | |||||||||
(a) Also applicable for retirement
CEO Pay Ratio
We are providing the following information about the relationship of the annual total compensation of our employees and the annual total compensation of Wouter T. van Kempen, the Chairman of the Board, President, and Chief Executive Officer of our General Partner (our “CEO”):
For 2017, our last completed fiscal year, the median of the annual total compensation of all employees of our company (other than our CEO) was $106,213, and the annual total compensation of our CEO, as reported in the Summary Compensation Table above, was $3,687,746. Based on this information, for 2017, Mr. van Kempen’s total annual compensation was 35 times that of the median of the annual total compensation of all employees.
To identify the median of the annual total compensation of all our employees (other than our CEO), as well as to determine the annual total compensation of our median employee and our CEO, we took the following steps:
1. | We determined that, as of December 31, 2017, our employee population consisted of approximately 2,650 individuals with all of these individuals located in the United States (as reported in Item 1, Business, in this Annual Report on Form 10-K). This population consisted of our full-time, part-time, and temporary employees. |
2. | To identify the “median employee” from our employee population, we compared the 2017 earnings eligible in the short-term incentive plan plus the 2016 actual incentive paid in 2017 of our employees as reflected in our payroll records for 2017. |
3. | We identified our median employee using this compensation measure, which was consistently applied to all our employees included in the calculation. Since all our employees are located in the United States, as is our CEO, we did not make any cost-of-living adjustments in identifying the “median employee.” |
4. | Once we identified our median employee, we combined all of the elements of such employee’s total compensation for 2017. |
5. | With respect to the annual total compensation of our CEO, we used the amount reported in the “Total” column of our 2017 Summary Compensation Table above. |
161
The pay ratio disclosed above is a reasonable estimate calculated in accordance with SEC rules, based on our records and the methodologies described above. The SEC rules for identifying the median compensated employee and calculating the pay ratio allow companies to use a variety of methodologies and apply various assumptions. The application of various methodologies may result in significant differences in the results reported by other SEC reporting companies. As a result the pay ratio reported by other SEC reporting companies may differ substantially from, and may not be comparable to, the pay ratio we disclose above.
Director Compensation
General - Members of the board of directors who are officers or employees of the General Partner or its affiliates do not receive compensation for serving as directors.
For 2017, the board approved an annual compensation package for non-employee directors, consisting of an annual $70,000 cash retainer and an annual grant of common units that approximate $80,000 of value on the date of grant. Chairpersons of committees of the board received an additional annual cash retainer of $20,000. All cash retainers were paid on a quarterly basis in arrears. Directors did not receive additional fees for attending meetings of the board or its committees. The directors were reimbursed for out-of-pocket expenses associated with their membership on the board of directors.
Following is the compensation of the General Partner’s non-employee directors for the year ended December 31, 2017:
Name | Fees Earned or Paid in Cash | Unit Awards (a) | Total | |||||||||
Fred J. Fowler | $ | 70,000 | $ | 79,600 | $ | 149,600 | ||||||
William F. Kimble (b) | $ | 90,000 | $ | 79,600 | $ | 169,600 | ||||||
Bill W. Waycaster (c) | $ | 90,000 | $ | 79,600 | $ | 169,600 | ||||||
(a) | The amounts in this column reflect the grant date fair value of common unit awards computed in accordance with ASC 718. |
(b) | Mr. Kimble received an additional $20,000 annually as the audit committee chair. |
(c) | Mr. Waycaster received an additional $20,000 annually as the special committee chair. |
Each director is entitled to be fully indemnified by us for his actions associated with being a director to the fullest extent permitted under Delaware law.
Compensation Committee Interlocks and Insider Participation
As discussed above, our General Partner’s board of directors does not maintain a compensation committee. In 2017, the compensation committee of the board of directors of DCP Midstream, LLC, the owner of our General Partner, determined all elements of compensation for our NEOs. Only Mr. van Kempen was a director and a NEO of our General Partner. Further Mr. van Kempen is a non-voting member of the board of directors of DCP Midstream, LLC; however, he is not a member of the compensation committee thereof, nor did he participate in deliberations of such board with regard to his own compensation. During 2017, none of our NEOs served as a director or member of a compensation committee of another entity that has or has had an executive officer who served as a member of our board of directors, the board of directors of DCP Midstream, LLC, or the compensation committee of the board of directors of DCP Midstream, LLC.
162
Item 12. Security Ownership of Certain Beneficial Owners and Management and Related Unitholder Matters
The following table sets forth the beneficial ownership of our common units as of February 22, 2018 for:
• | each person known by us to be the beneficial owner of more than 5% of our common units; |
• | each director of DCP Midstream GP, LLC; |
• | each NEO of DCP Midstream GP, LLC; and |
• | all directors and executive officers of DCP Midstream GP, LLC as a group. |
Percentage of total common units beneficially owned is based on 143,309,828 common units outstanding.
Name of Beneficial Owner (a) | Common Units Beneficially Owned | Percentage of Common Units Beneficially Owned | ||
DCP Midstream, LLC (b) | 52,762,526 | 36.8% | ||
Advisory Research, Inc. (c) | 8,985,266 | 6.3% | ||
ALPS Advisors, Inc. (d) | 7,510,182 | 5.2% | ||
Alerian MLP ETF (d) | 7,484,706 | 5.2% | ||
Wouter T. van Kempen | 2,540 | * | ||
Sean P. O'Brien | — | — | ||
Brent L. Backes | 10,406 | * | ||
Don Baldridge | 10,689 | * | ||
Brian Frederick | 5,500 | * | ||
Allen C. Capps | — | — | ||
Fred J. Fowler | 21,800 | * | ||
William F. Kimble | 6,200 | * | ||
Brian Mandell | — | — | ||
Bill W. Waycaster | 6,200 | * | ||
Vern Yu | — | — | ||
John Zuklic | — | — | ||
All directors and executive officers as a group (10 persons) | 63,335 | * | ||
* Less than 1%.
(a) | Unless otherwise indicated, the address for all beneficial owners in this table is 370 17th Street, Suite 2500, Denver, Colorado 80202. |
(b) | Includes 1,887,618 common units held by DCP Midstream GP, LP. DCP Midstream, LLC is the sole member of the general partner of DCP Midstream GP, LP and may be deemed to indirectly beneficially own such securities, but disclaims beneficial ownership except to the extent of its pecuniary interest therein. |
(c) | As reported on Schedule 13G/A filed with the SEC on February 13, 2017 by Advisory Research, Inc. with an address of 180 North Stetson Avenue, Suite 5500, Chicago, Illinois 60601 and Piper Jaffray Companies with an address of 800 Nicollet Mall, Suite 800, Minneapolis, Minnesota 55402. The Schedule 13G/A reports that Advisory Research, Inc. has sole voting power over 8,922,931 of the reported units and sole dispositive power over all of the reported units and Piper Jaffray Companies has shared voting power over 8,922,931 of the reported units and shared dispositive power over all of the reported units. |
(d) | As reported on Schedule 13G/A filed with the SEC on February 6, 2018 by ALPS Advisors, Inc. and Alerian MLP ETF each with an address of 1290 Broadway, Suite 1100, Denver, Colorado 80203. The Schedule 13G/A reports that ALPS Advisors, Inc. (“AAI”), an investment adviser registered under the Investment Advisors Act of 1940, furnishes investment advice to investment companies registered under the Investment Company Act of 1940 (collectively referred to as the “Funds”). In its role as investment advisor, AAI has voting and/or investment power over the registrant's common units that are owned by the Funds, and may be deemed to be the beneficial owner of such common units held by the Funds. The Funds have the right to receive or the power to direct the receipt of dividends from, or the proceeds from the sale of the common units held in their respective accounts. Alerian MLP ETF is an investment company registered under the Investment Company Act of 1940 and is one of the Funds to which AAI provides investment advice. The common units reported herein are owned by the Funds and AAI disclaims beneficial ownership of such common units. |
163
Equity Compensation Plan Information
The following table sets forth information about our equity compensation plans as of December 31, 2017.
Plan Category | Number of securities to be issued upon exercise of outstanding options, warrants and rights | Weighted-average exercise price of outstanding options, warrants and rights | Number of securities remaining available for future issuance under equity compensation plans (excluding securities reflected in column (a)) | ||||
(a) | (b) | (c) | |||||
Equity compensation plans approved by unitholders (1) | — | $ | — | 885,600 | |||
Equity compensation plans not approved by unitholders (2) | — | — | — | ||||
Total | — | $ | — | 885,600 | |||
(1) | This information relates to our 2016 LTIP, which was approved by unitholders at a special meeting on April 28, 2016. For more information on our 2016 LTIP, refer to Note 15. "Equity-Based Compensation" in the Notes to Consolidated Financial Statements in Item 8. “Financial Statements and Supplementary Data.” |
(2) | This information relates to our 2005 LTIP, which expired pursuant to its terms at the end of 2015, and therefore no equity securities remain available for issuance thereunder. For more information on our 2005 LTIP, refer to Note 15. "Equity-Based Compensation" in the Notes to Consolidated Financial Statements in Item 8. “Financial Statements and Supplementary Data. |
Item 13. Certain Relationships and Related Transactions, and Director Independence
Distributions and Payments to our General Partner and its Affiliates
The following table summarizes the distributions and payments to be made by us to our General Partner and its affiliates in connection with our formation, ongoing operation, and liquidation. These distributions and payments are determined by and among affiliated entities and, consequently, are not the result of arm’s-length negotiations.
Operational Stage: | ||
Distributions of Available Cash to our General Partner and its affiliates | We will generally make cash distributions to the unitholders and to our General Partner, in accordance with their pro rata interest. In addition, if distributions exceed the minimum quarterly distribution and other higher target levels, our General Partner will be entitled to increasing percentages of the distributions, up to 48% of the distributions above the highest target level. Currently, our distribution to our general partner related to its incentive distribution rights is at the highest level. | |
Payments to our General Partner and its affiliates | For further information regarding payments to our General Partner, please see the “Services Agreement” section below. | |
Withdrawal or removal of our General Partner | If our General Partner withdraws or is removed, its general partner interest and its incentive distribution rights will either be sold to the new general partner for cash or converted into common units, in each case for an amount equal to the fair market value of those interests. | |
Liquidation Stage: | ||
Liquidation | Upon our liquidation, the partners, including our General Partner, will be entitled to receive liquidating distributions according to their respective capital account balances. | |
Contribution Agreement
On December 30, 2016, the Partnership entered into a Contribution Agreement with DCP Midstream, LLC and DCP Midstream Operating, LP (the “Operating Partnership”), a wholly owned subsidiary of the Partnership. On January 1, 2017, DCP Midstream, LLC contributed to us: (i) its ownership interests in all of its subsidiaries owning operating assets, and (ii) $424 million of cash (together the “Contributions”). In consideration of the Partnership’s receipt of the Contributions, (i) the Partnership issued 28,552,480 common units to DCP Midstream, LLC and 2,550,644 general partner units to DCP Midstream GP, LP, the General Partner in a private placement and (ii) the Operating Partnership assumed $3,150 million of DCP Midstream, LLC’s debt.
164
Services Agreement
Pursuant to the Contribution Agreement, on January 1, 2017, the Partnership entered into the Services and Employee Secondment Agreement (the “Services Agreement”), which replaced the services agreement between the Partnership and DCP Midstream, LLC, dated February 14, 2013, as amended. Under the Services Agreement, we are required to reimburse DCP Midstream, LLC for costs, expenses, and expenditures incurred or payments made on our behalf for general and administrative functions including, but not limited to, legal, accounting, compliance, treasury, insurance administration and claims processing, risk management, health, safety and environmental, information technology, human resources, benefit plan maintenance and administration, credit, payroll, internal audit, taxes and engineering, as well as salaries of and benefits of seconded employees, insurance coverage and claims, capital expenditures, maintenance and repair costs and taxes. There is no limit on the reimbursements we make to DCP Midstream, LLC under the Services Agreement for costs, expenses and expenditures incurred or payments made on our behalf.
Our General Partner and its affiliates will also receive payments from us pursuant to the contractual arrangements described below under the caption “Contracts with Affiliates.”
The Services Agreement, other than the indemnification provisions, will be terminable by DCP Midstream, LLC at its option if our general partner is removed without cause and units held by our general partner and its affiliates are not voted in favor of that removal. The Services Agreement will also terminate in the event of a change of control of us, our General Partner or DCP Midstream, LLC.
Competition
None of DCP Midstream, LLC, or any of its affiliates, including Phillips 66 and Enbridge, is restricted, under either the Partnership Agreement or the Services Agreement, from competing with us. DCP Midstream, LLC and any of its affiliates, including Phillips 66 and Enbridge, may acquire, construct or dispose of additional midstream energy or other assets in the future without any obligation to offer us the opportunity to purchase or construct those assets.
Contracts with Affiliates
We sell NGLs and a portion of our residue gas to and purchase NGLs from Phillips 66 and its respective affiliates. We anticipate continuing to purchase and sell these commodities to Phillips 66 and its respective affiliates in the ordinary course of business.
We sell NGLs to and purchase NGLs from Enbridge and its affiliates. We anticipate continuing to sell commodities to and purchase commodities from Enbridge and its affiliates in the ordinary course of business.
Unconsolidated Affiliates
Under the terms of their respective operating agreements, Sand Hills and Southern Hills are required to reimburse us for any direct costs or expenses (other than general and administration services) which we incur on behalf of Sand Hills and Southern Hills. Additionally, Sand Hills and Southern Hills each pay us an annual service fee of $5 million, for centralized corporate functions provided by us as operator of Sand Hills and Southern Hills, including legal, accounting, cash management, insurance administration and claims processing, risk management, health, safety and environmental, information technology, human resources, credit, payroll, taxes and engineering. Except with respect to the annual service fee, there is no limit on the reimbursements Sand Hills and Southern Hills make to us under the respective operating agreements for other expenses and expenditures which we incur on behalf of Sand Hills or Southern Hills.
Transportation Arrangements
The Texas Express, Front Range, Sand Hills, Southern Hills and Gulf Coast Express pipelines have in place 10 to 15-year transportation agreements, commencing at the pipelines' respective in-service dates, with us pursuant to which we have committed to transport minimum throughput volumes at rates defined in each respective pipeline’s tariffs.
Review, Approval or Ratification of Transactions with Related Persons
Our Partnership Agreement contains specific provisions that address potential conflicts of interest between the owner of our general partner and its affiliates, including DCP Midstream, LLC on one hand, and us and our subsidiaries, on the other hand. Whenever such a conflict of interest arises, our general partner will resolve the conflict. Our general partner may, but is not required to, seek the approval of such resolution from the special committee of the board of directors of our general partner, which committee is comprised of independent directors and acts as our conflicts committee. The Partnership Agreement
165
provides that our general partner will not be in breach of its obligations under the Partnership Agreement or its duties to us or to our unitholders if the resolution of the conflict is:
• | approved by the conflicts committee; |
• | approved by the vote of a majority of the outstanding common units, excluding any common units owned by our general partner or any of its affiliates; |
• | on terms no less favorable to us than those generally being provided to or available from unrelated third parties; or |
• | fair and reasonable to us, taking into account the totality of the relationships between the parties involved, including other transactions that may be particularly favorable or advantageous to us. |
If our general partner does not seek approval from the special committee and the board of directors of our general partner determines that the resolution or course of action taken with respect to the conflict of interest satisfies either of the standards set forth in the third and fourth bullet points above, then it will be presumed that, in making its decision, the board of directors acted in good faith, and in any proceeding brought by or on behalf of any limited partner or the Partnership, the person bringing or prosecuting such proceeding will have the burden of overcoming such presumption. Unless the resolution of a conflict is specifically provided for in our Partnership Agreement, our general partner or the conflicts committee may consider any factors it determines in good faith to consider when resolving a conflict. When our Partnership Agreement requires someone to act in good faith, it requires that person to reasonably believe that he is acting in the best interests of the Partnership, unless the context otherwise requires.
In addition, our code of business ethics requires that all employees, including employees of affiliates of DCP Midstream, LLC who perform services for us and our general partner, avoid or disclose any activity that may interfere, or have the appearance of interfering, with their responsibilities to us.
Director Independence
Please see Item 10. “Directors, Executive Officers and Corporate Governance” in this Annual Report on Form 10-K for information about the independence of our general partner’s board of directors and its committees.
Item 14. Principal Accountant Fees and Services
The following table presents fees for professional services rendered by Deloitte & Touche LLP, or Deloitte, our principal accountant, for the audit of our financial statements, and the fees billed for other services rendered by Deloitte:
Year Ended December 31, | ||||||||
Type of Fees | 2017 | 2016 | ||||||
(millions) | ||||||||
Audit Fees (a) | $ | 4 | $ | 2 | ||||
(a) | Audit Fees are fees billed by Deloitte for professional services for the audit of our consolidated financial statements included in our annual report on Form 10-K and review of financial statements included in our quarterly reports on Form 10-Q, services that are normally provided by Deloitte in connection with statutory and regulatory filings or engagements or any other service performed by Deloitte to comply with generally accepted auditing standards and include comfort and consent letters in connection with SEC filings and financing transactions. |
For the last two fiscal years, Deloitte has not billed us for assurance and related services, unless such services were reasonably related to the performance of the audit or review of our financial statements, which are included in the table above. Deloitte has not provided any services to us over the last two fiscal years related to tax compliance, tax services and tax planning.
Audit Committee Pre-Approval Policy
The audit committee pre-approves all audit and permissible non-audit services provided by the independent auditors on a case-by-case basis. These services may include audit services, audit-related services, tax services and other services. The audit committee does not delegate its responsibilities to pre-approve services performed by the independent auditor to management or to an individual member of the audit committee. The audit committee has, however, pre-approved audit related services that do not impair the independence of the independent auditors for up to $50,000 per engagement, and up to an aggregate of $100,000 annually, provided the audit committee is notified of such audit-related services in a timely manner. The audit committee may, however, from time to time delegate its authority to any audit committee member, who will report on the independent auditor services that were approved at the next audit committee meeting.
166
PART IV
167
Item 15. Exhibits, Financial Statement Schedules
(a) Financial Statement Schedules
Consolidated Financial Statements and Financial Statement Schedules included in this Item 15:
Consolidated Financial Statements of Discovery Producer Services LLC
Consolidated Financial Statements of DCP Sand Hills Pipeline, LLC
168
FINANCIAL STATEMENTS
Discovery Producer Services LLC
Years Ended December 31, 2017, 2016 and 2015
169
REPORT OF INDEPENDENT REGISTERED PUBLIC ACCOUNTING FIRM
To the Management Committee of
Discovery Producer Services LLC
Opinion on the Financial Statements
We have audited the accompanying consolidated balance sheets of Discovery Producer Services LLC (the “Company”) as of December 31, 2017 and 2016, the related consolidated statements of operations and comprehensive income, members’ capital, and cash flows for each of the three years in the period ended December 31, 2017, and the related notes (collectively referred to as the “consolidated financial statements”). In our opinion, the consolidated financial statements present fairly, in all material respects, the financial position of the Company at December 31, 2017 and 2016, and the results of its operations and its cash flows for each of the three years in the period ended December 31, 2017, in conformity with U.S. generally accepted accounting principles.
Basis for Opinion
These financial statements are the responsibility of the Company's management. Our responsibility is to express an opinion on the Company’s financial statements based on our audits. We are a public accounting firm registered with the Public Company Accounting Oversight Board (United States) (PCAOB) and are required to be independent with respect to the Company in accordance with the U.S. federal securities laws and the applicable rules and regulations of the Securities and Exchange Commission and the PCAOB.
We conducted our audits in accordance with the standards of the PCAOB and in accordance with auditing standards generally accepted in the United States of America. Those standards require that we plan and perform the audit to obtain reasonable assurance about whether the financial statements are free of material misstatement, whether due to error or fraud. The Company is not required to have, nor were we engaged to perform, an audit of its internal control over financial reporting. As part of our audits we are required to obtain an understanding of internal control over financial reporting but not for the purpose of expressing an opinion on the effectiveness of the Company’s internal control over financial reporting. Accordingly, we express no such opinion.
Our audits included performing procedures to assess the risks of material misstatement of the financial statements, whether due to error or fraud, and performing procedures that respond to those risks. Such procedures included examining, on a test basis, evidence regarding the amounts and disclosures in the consolidated financial statements. Our audits also included evaluating the accounting principles used and significant estimates made by management, as well as evaluating the overall presentation of the financial statements. We believe that our audits provide a reasonable basis for our opinion.
/s/ Ernst & Young LLP
We have served as the Company’s auditor since 2002
Tulsa, Oklahoma
February 22, 2018
170
DISCOVERY PRODUCER SERVICES LLC
CONSOLIDATED BALANCE SHEETS
December 31, | |||||||
2017 | 2016 | ||||||
ASSETS | (In thousands) | ||||||
Current assets: | |||||||
Cash and cash equivalents | $ | 22,827 | $ | 11,124 | |||
Trade accounts receivable: | |||||||
Affiliate | 13,339 | 14,234 | |||||
Other | 3,911 | 28,742 | |||||
Prepaid insurance | 2,886 | 2,923 | |||||
Inventory | 2,923 | 2,723 | |||||
Total current assets | 45,886 | 59,746 | |||||
Property, plant and equipment, net | 1,124,864 | 1,196,537 | |||||
Intangible assets, net | 13,084 | 15,108 | |||||
Total assets | $ | 1,183,834 | $ | 1,271,391 | |||
LIABILITIES AND MEMBERS’ CAPITAL | |||||||
Current liabilities: | |||||||
Accounts payable: | |||||||
Affiliate | $ | 1,110 | $ | 1,357 | |||
Other | 16,602 | 9,222 | |||||
Asset retirement obligations | 24,184 | 3,398 | |||||
Deferred revenue | 19,784 | 41,436 | |||||
Other current liabilities | 209 | 259 | |||||
Total current liabilities | 61,889 | 55,672 | |||||
Non Current liabilities | |||||||
Asset retirement obligations | 97,896 | 120,042 | |||||
Deferred revenue | 71,135 | 74,634 | |||||
Customer deposits | 3,491 | 3,345 | |||||
Commitments and contingent liabilities (Note 6) | |||||||
Members' capital | |||||||
Members' capital accounts | 948,030 | 1,016,242 | |||||
Other comprehensive income | 1,393 | 1,456 | |||||
Total members’ capital | 949,423 | 1,017,698 | |||||
Total liabilities and members’ capital | $ | 1,183,834 | $ | 1,271,391 | |||
See accompanying notes to the financial statements.
171
DISCOVERY PRODUCER SERVICES LLC
CONSOLIDATED STATEMENTS OF OPERATIONS AND COMPREHENSIVE INCOME
Year Ended December 31, | |||||||||||
2017 | 2016 | 2015 | |||||||||
(In thousands) | |||||||||||
Revenues: | |||||||||||
Product sales: | |||||||||||
Affiliate | $ | 165,525 | $ | 129,609 | $ | 143,483 | |||||
Third-party | 93 | 120 | 243 | ||||||||
Transportation services | 46,395 | 60,112 | 53,770 | ||||||||
Gathering and processing services: | |||||||||||
Affiliate | 687 | 330 | 423 | ||||||||
Third-party | 191,351 | 200,723 | 160,150 | ||||||||
Other revenues | 8,793 | 9,012 | 10,344 | ||||||||
Total revenues | 412,844 | 399,906 | 368,413 | ||||||||
Costs and expenses: | |||||||||||
Product cost and shrink replacement: | |||||||||||
Affiliate | 8,750 | 6,168 | 8,356 | ||||||||
Third-party | 126,610 | 95,364 | 109,782 | ||||||||
Operating and maintenance expenses: | |||||||||||
Affiliate | 9,510 | 8,679 | 9,196 | ||||||||
Third-party | 28,719 | 23,479 | 24,378 | ||||||||
Depreciation, amortization and accretion | 93,110 | 76,110 | 75,333 | ||||||||
Taxes other than income | 2,913 | 2,702 | 2,869 | ||||||||
General and administrative expenses- affiliate | 7,454 | 7,219 | 7,320 | ||||||||
Other (income) expense, net | (6,553 | ) | 129 | 3 | |||||||
Total costs and expenses | 270,513 | 219,850 | 237,237 | ||||||||
Operating income | 142,331 | 180,056 | 131,176 | ||||||||
Interest income (expense) | 177 | (46 | ) | 37 | |||||||
Foreign currency loss | — | — | (62 | ) | |||||||
Net income | 142,508 | 180,010 | 131,151 | ||||||||
Net loss from derivative instruments, including amounts reclassified into earnings | (63 | ) | (63 | ) | (57 | ) | |||||
Comprehensive income | $ | 142,445 | $ | 179,947 | $ | 131,094 | |||||
See accompanying notes to the financial statements.
172
DISCOVERY PRODUCER SERVICES LLC
CONSOLIDATED STATEMENT OF MEMBERS' CAPITAL
Williams Field Services Group, LLC | DCP Assets Holding, LP | Accumulated Other Comprehensive Income | Total | ||||||||||||
(In thousands) | |||||||||||||||
Balance December 31, 2014 | $ | 645,961 | $ | 430,138 | $ | 1,576 | $ | 1,077,675 | |||||||
Non-cash contributions * | 787 | — | — | 787 | |||||||||||
Contributions | 32,999 | 22,000 | — | 54,999 | |||||||||||
Distributions | (115,542 | ) | (77,028 | ) | — | (192,570 | ) | ||||||||
Net income | 78,691 | 52,460 | — | 131,151 | |||||||||||
Other comprehensive loss | — | — | (57 | ) | (57 | ) | |||||||||
Balance December 31, 2015 | $ | 642,896 | $ | 427,570 | $ | 1,519 | $ | 1,071,985 | |||||||
Distributions | (140,540 | ) | (93,694 | ) | — | (234,234 | ) | ||||||||
Net income | 108,006 | 72,004 | — | 180,010 | |||||||||||
Other comprehensive loss | — | — | (63 | ) | (63 | ) | |||||||||
Balance December 31, 2016 | $ | 610,362 | $ | 405,880 | $ | 1,456 | $ | 1,017,698 | |||||||
Contributions | 834 | 556 | — | 1,390 | |||||||||||
Distributions | (127,266 | ) | (84,844 | ) | — | (212,110 | ) | ||||||||
Net income | 85,504 | 57,004 | — | 142,508 | |||||||||||
Other comprehensive loss | — | — | (63 | ) | (63 | ) | |||||||||
Balance December 31, 2017 | $ | 569,434 | $ | 378,596 | $ | 1,393 | $ | 949,423 | |||||||
* Non-cash contributions disclosed in Note 5
See accompanying notes to financial statements.
173
DISCOVERY PRODUCER SERVICES LLC
CONSOLIDATED STATEMENTS OF CASH FLOWS
Year Ended December 31, | |||||||||||
2017 | 2016 | 2015 | |||||||||
(In thousands) | |||||||||||
OPERATING ACTIVITIES: | |||||||||||
Net income | $ | 142,508 | $ | 180,010 | $ | 131,151 | |||||
Adjustments to reconcile cash provided by operations: | |||||||||||
Depreciation, amortization, and accretion | 93,110 | 76,109 | 75,333 | ||||||||
Net loss on retirement of equipment | — | 140 | 28 | ||||||||
Other non-cash item | (6,556 | ) | — | — | |||||||
Cash provided (used) by changes in assets and liabilities: | |||||||||||
Trade accounts receivable | 25,726 | (1,136 | ) | (28,209 | ) | ||||||
Prepaid insurance | 37 | 440 | (757 | ) | |||||||
Inventory | (199 | ) | (10 | ) | 230 | ||||||
Accounts payable | 6,221 | 2,369 | (8,637 | ) | |||||||
Asset retirement obligation | (679 | ) | — | (789 | ) | ||||||
Customer deposits | 147 | 2,683 | 363 | ||||||||
Other current liabilities | (50 | ) | (94 | ) | 159 | ||||||
Deferred revenue | (30,452 | ) | (15,908 | ) | (6,221 | ) | |||||
Net cash provided by operating activities | 229,813 | 244,603 | 162,651 | ||||||||
INVESTING ACTIVITIES: | |||||||||||
Property, plant and equipment - capital expenditures * | (7,390 | ) | (8,594 | ) | (34,121 | ) | |||||
Purchase of business (Note 9) | — | — | (23,500 | ) | |||||||
Net cash used by investing activities | (7,390 | ) | (8,594 | ) | (57,621 | ) | |||||
FINANCING ACTIVITIES: | |||||||||||
Distributions to members | (212,110 | ) | (234,234 | ) | (192,570 | ) | |||||
Capital contributions | 1,390 | — | 54,999 | ||||||||
Net cash used by financing activities | (210,720 | ) | (234,234 | ) | (137,571 | ) | |||||
Increase (decrease) in cash and cash equivalents | 11,703 | 1,775 | (32,541 | ) | |||||||
Cash and cash equivalents beginning of period | 11,124 | 9,349 | 41,890 | ||||||||
Cash and cash equivalents end of period | $ | 22,827 | $ | 11,124 | $ | 9,349 | |||||
Supplemental Disclosures | |||||||||||
Non cash additions to PP&E | $ | 5,300 | $ | — | $ | — | |||||
* Increase to property, plant and equipment | $ | (8,300 | ) | $ | (8,756 | ) | $ | (15,965 | ) | ||
Changes in related accounts payable - affiliate, accounts payable, and construction retainage payable | 910 | 162 | (18,156 | ) | |||||||
Capital expenditures | $ | (7,390 | ) | $ | (8,594 | ) | $ | (34,121 | ) | ||
See accompanying notes to financial statements.
174
DISCOVERY PRODUCER SERVICES LLC
NOTES TO CONSOLIDATED FINANCIAL STATEMENTS
Note 1. Organization and Description of Business
Unless the context clearly indicates otherwise, references in this report to “we”, “our”, “us” or similar language refers to Discovery Producer Services LLC and its wholly-owned subsidiary, Discovery Gas Transmission LLC (DGT). We are a Delaware limited liability company formed on June 24, 1996 for the purpose of constructing and operating a cryogenic natural gas processing plant near Larose, Louisiana and a natural gas liquids fractionator near Paradis, Louisiana. DGT is a Delaware Limited Liability Company formed on June 24, 1996 for the purpose of constructing and operating an offshore natural gas deep water pipeline in the Gulf of Mexico which connects to our gas processing plant in Larose, Louisiana. We have since connected several laterals to the DGT pipeline to expand our presence in the Gulf of Mexico.
We are owned 60% by Williams Field Services Group, LLC (WFS) (a wholly-owned subsidiary of Williams Partners L.P. (WPZ)) and 40% by DCP Assets Holding, LP (a wholly-owned subsidiary of DCP Midstream Partners, LP (DCP)). WFS is our operator. Herein, The Williams Companies, Inc., who controls WPZ through its general partner interest, WPZ and WFS are collectively referred to as “Williams.”
We evaluated our disclosure of subsequent events through the date, February 15, 2018, the date our financial statements were issued.
Note 2. Summary of Significant Accounting Policies
Basis of Presentation. The consolidated financial statements have been prepared based upon accounting principles generally accepted in the United States and include the accounts of the parent and our wholly-owned subsidiary, DGT. Intercompany accounts and transactions have been eliminated.
New Accounting Standards Issued Not yet Adopted. In May 2014, the FASB issued ASU 2014-09 establishing Accounting Standards Codification (ASC) Topic 606, “Revenue from Contracts with Customers” (ASC 606). ASC 606 establishes a comprehensive new revenue recognition model designed to depict the transfer of goods or services to a customer in an amount that reflects the consideration the entity expects to be entitled to receive in exchange for those goods or services and requires significantly enhanced revenue disclosures. In August 2015, the FASB issued ASU 2015-14 “Revenue from Contracts with Customers (Topic 606): Deferral of the Effective Date” (ASU 2015-14). Per ASU 2015-14, the standard is effective for interim and annual reporting periods beginning after December 15, 2017. ASC 606 allows either full retrospective or modified retrospective transition and early adoption is permitted for annual periods beginning after December 15, 2016. We are adopting the new revenue recognition standard utilizing the modified retrospective transition approach, effective January 1, 2018, by recognizing the cumulative effect of initially applying the new standard for periods prior to January 1, 2018, to the opening balance of Members’ capital.
We are in the final stages of evaluating the impact the new revenue standard will have on our financial statements. For each revenue contract type, we have conducted a formal contract review process to evaluate the impact of the new revenue standard. We have substantially completed our evaluation. Under the new standard, our revenues will increase in situations where we receive noncash consideration, which exists primarily in certain of our gas processing contracts where we receive commodities as full or partial consideration for services provided. This increase in revenues will be offset by a similar increase in costs and expenses when the commodities received are subsequently sold. We continue to evaluate the treatment of Hurricane Mitigation Reliability Enhancement (HMRE) surcharges (See Note 8) on our revenue recognition. Financial systems and internal controls necessary for adoption have been implemented effective as of January 1, 2018.
In February 2016, the FASB issued ASU 2016-02 “Leases (Topic 842)” (ASU 2016-02). ASU 2016-02 establishes a comprehensive new lease accounting model. ASU 2016-02 modifies the definition of a lease, requires a dual approach to lease classification similar to current lease accounting, and causes lessees to recognize leases on the balance sheet as a lease liability measured as the present value of the future lease payments with a corresponding right-of-use asset, with an exception for leases with a term of one year or less. Additional disclosures will also be required regarding the amount, timing, and uncertainty of cash flows arising from leases. In November 2017, the FASB approved, pending the final drafting and issuance, a proposed accounting standard update titled “Leases (Topic 842): Land Easement Practical Expedient for Transition to Topic 842”. Per the proposed accounting standard update, land easements and rights-of-way are required to be assessed under ASU 2016-02 to determine whether the arrangements are or contain a lease and permits an entity to elect a transition practical expedient to
175
not apply ASU 2016-02 to land easements that exist or expired before the effective date of ASU 2016-02 and that were not previously assessed under the previous lease guidance in Accounting Standards Codification Topic 840 “Leases”. ASU 2016-02 is effective for interim and annual periods beginning after December 15, 2018. Early adoption is permitted. ASU 2016-02 currently requires a modified retrospective transition for financing or operating leases existing at or entered into after the beginning of the earliest comparative period presented in the financial statements. In January 2018, the FASB proposed an accounting standard update titled “Leases (Topic 842): Targeted Improvements”, which is an update to ASU 2016-02 allowing entities an additional transition method to the existing requirements whereby an entity could adopt the provisions of ASU 2016-02 by recognizing a cumulative-effect adjustment to the opening balance of retained earnings in the period of adoption without adjustment to the financial statements for periods prior to adoption.
We expect to adopt ASU 2016-02 effective January 1, 2019. We are in the process of reviewing contracts to identify leases based on the modified definition of a lease, implementing a financial lease accounting system, and evaluating internal control changes to support management in the accounting for and disclosure of leasing activities. While we are still in the process of completing our implementation evaluation of ASU 2016-02, we currently believe the most significant changes relate to the recognition of a lease liability and offsetting right-of-use asset in our consolidated balance sheet for operating leases. We are also evaluating ASU 2016-02’s currently available and proposed practical expedients on adoption.
In June 2016, the FASB issued ASU 2016-13 “Financial Instruments - Credit Losses (Topic 326): Measurement of Credit Losses on Financial Instruments” (ASU 2016-13). ASU 2016-13 changes the impairment model for most financial assets and certain other instruments. For trade and other receivables, held-to-maturity debt securities, loans, and other instruments, entities will be required to use a new forward-looking “expected loss” model that generally will result in the earlier recognition of allowances for losses. The guidance also requires increased disclosures. ASU 2016-13 is effective for interim and annual periods beginning after December 15, 2019. Early adoption is permitted. ASU 2016-13 requires varying transition methods for the different categories of amendments. We are evaluating the impact of ASU 2016-13 on our consolidated financial statements. Although we do not expect ASU 2016-13 to have a significant impact, it will impact our trade receivables as the related allowance for credit losses will be recognized earlier under the expected loss model than under our current policy.
Use of Estimates. The preparation of consolidated financial statements in conformity with accounting principles generally accepted in the United States requires management to make estimates and assumptions that affect the amounts reported in the consolidated financial statements and accompanying notes. Actual results could differ from those estimates.
Significant estimates and assumptions include:
• | Asset retirement obligations |
• | Depreciable asset lives |
Cash and Cash Equivalents. The cash and cash equivalents balance includes cash equivalents which are invested in funds with high-quality, short-term securities and instruments that are issued or guaranteed by the U.S. government. These securities have maturities of three months or less when acquired.
Trade Accounts Receivable. Trade accounts receivable are carried on a gross basis, with no discounting, less an allowance for doubtful accounts. We do not recognize an allowance for doubtful accounts at the time the revenue that generates the accounts receivable is recognized. We estimate the allowance for doubtful accounts based on existing economic conditions, the financial condition of the customers and the amount and age of past due accounts. Receivables are considered past due if full payment is not received by the contractual due date. Past due accounts are generally written off against the allowance for doubtful accounts only after all collection attempts have been exhausted. There is no allowance for doubtful accounts as of December 31, 2017 and 2016.
Prepaid Insurance. Prepaid insurance represents the unamortized balance of insurance premiums. These payments are amortized on a straight-line basis over the policy term.
Gas Imbalances. In the course of providing transportation services to customers, we may receive different quantities of gas from shippers than the quantities delivered on behalf of those shippers. This results in gas transportation imbalance receivables and payables. The imbalance is recovered or repaid in cash, based on market-based prices, or through the receipt or delivery of gas in the future. Imbalance receivables are valued based on the lower of the current market prices; or the weighted average cost of natural gas in the system. Imbalance payables are valued at current market prices. Settlement of imbalances requires an agreement between the pipelines and shippers as to the allocations of volumes to specific transportation contracts, and the timing of delivery of gas based on operational conditions. Pursuant to a settlement with our shippers issued by the Federal Energy Regulatory Commission (FERC) on February 5, 2008, if a cash-out refund is due and payable to a shipper during any
176
year pursuant to our FERC Gas Tariff, the shipper will be deemed to have immediately assigned its right to the refund amount to us.
Inventory. Inventories in the Consolidated Balance Sheet primarily consist of natural gas liquids and materials and supplies, and are stated at the lower of cost or net realized value. The cost of inventories is primarily determined using the average-cost method.
Property, Plant and Equipment. Property, plant and equipment is recorded at cost. We base the carrying value of these assets on estimates, assumptions and judgments relative to capitalized costs, useful lives and salvage values. The natural gas and natural gas liquids maintained in the pipeline facilities necessary for their operation (line fill) are included in property, plant and equipment. Depreciation of property, plant and equipment is provided on a straight-line basis over the estimated useful lives of 25 to 35 years. Expenditures for maintenance and repairs are expensed as incurred. Expenditures that extend the useful lives of the assets or increase their functionality are capitalized. The cost of property, plant and equipment sold or retired and the related accumulated depreciation is removed from the accounts in the period of sale or disposition. Gains and losses on the disposal of property, plant and equipment are recorded in operating income.
We record an asset and a liability equal to the present value of each expected future asset retirement obligation (ARO). The ARO asset increases the carrying value of the underlying physical asset and is depreciated with the underlying physical asset. We measure changes in the liability due to passage of time by applying an interest method of allocation. This amount is recognized as an increase in the carrying amount of the liability and as corresponding accretion expense included in operating income.
Intangible Assets. Our intangible assets are primarily related to our Raceland lateral project as further described in Note 5. Our intangible assets are amortized on a straight-line basis over the period in which these assets contribute to our cash flows. We evaluate these assets for changes in the expected remaining useful lives and would reflect any changes prospectively through amortization over the revised remaining useful life.
Impairment of Long-Lived Assets. We evaluate long-lived assets for impairment when events or changes in circumstances indicate that, in our management’s judgment, the carrying value of such assets may not be recoverable. When such a determination has been made, we compare our estimate of undiscounted future cash flows attributable to the assets to the carrying value of the assets to determine whether the carrying value is recoverable. If the carrying value is not recoverable, we determine the amount of the impairment recognized in the financial statements by estimating the fair value of the assets and recording a loss for the amount by which the carrying value exceeds the estimated fair value. There were no impairments recorded during 2017, 2016 and 2015.
Customer Deposits. We extend credit to customers in the normal course of business and perform ongoing credit evaluations of our customers. We may require cash deposit from our customers based on their overall creditworthiness. The dollars are recorded as a non -current liability on the consolidated balance sheet.
Revenue Recognition. Revenue for sales of products is recognized in the period of delivery, and revenues from the gathering, transportation, and processing of gas are recognized in the period the service is provided based on contractual terms and the related natural gas and liquid volumes. DGT is subject to FERC regulations, and accordingly, certain revenues collected may be subject to possible refunds upon final orders in pending cases. DGT records rate refund liabilities considering its and other third parties’ regulatory proceedings, advice of counsel, estimated total exposure as discounted and risk weighted, and collection and other risks. There was no rate refund liability accrued at December 31, 2017 or 2016.
Deferred Revenues Our deferred revenues represent up-front payments from customers associated with gas gathering and fractionation and are recognized as we provide the service to which the payments relate.
Income Taxes. For federal tax purposes, we have elected to be treated as a partnership with each member being separately taxed on its ratable share of our taxable income. This election, to be treated as a pass-through entity, also applies to our wholly-owned subsidiary, DGT. Therefore, no income taxes or deferred income taxes are reflected in the consolidated financial statements.
Foreign Currency Transactions. Transactions denominated in currencies other than the functional currency are recorded based on exchange rates at the time such transactions arise. Subsequent changes in exchange rates result in transaction gains or losses which are reflected in net income.
177
Other Comprehensive loss. Amounts recorded in other comprehensive loss relate to cash flow hedges we entered into to hedge forecasted foreign currency-denominated payments for pipeline construction. We recorded the effective portion of changes in the fair value of those hedges in other comprehensive loss, and reclassify such amounts into income on a straight-line basis over the period that we are depreciating the assets to which the hedges related.
Note 3. Related Party Transactions
We have various business transactions with our members and subsidiaries and affiliates of our members. Revenues include sales to Williams of natural gas liquids (NGLs) to which we take title and excess natural gas. The related-party revenues associated with Williams in 2017, 2016, and 2015 were $166.1 million, $129.9 million, and $143.9 million, respectively. Revenues from Phillips 66 (an affiliate of DCP) in 2017 amounted to $0.1 million.
Product cost and shrink replacement- affiliate includes natural gas purchases from Williams for fuel and shrink requirements.
We have no employees. Pipeline and plant operations are performed under operation and maintenance agreements with Williams. Most costs for materials, services and other charges are third-party charges and are invoiced directly to us. Operating and maintenance expenses- affiliate includes the following:
• | Direct payroll and employee benefit costs incurred on our behalf by Williams; |
• | Transportation expense under a 10-year transportation agreement for pipeline capacity through 2020 from Texas Eastern Transmission, LP (an affiliate of DCP); and |
• | Storage expense under a 20-year agreement to store parts, tools and equipment in a warehouse owned by Williams PERK, LLC (an affiliate of WFS) through 2033. |
General and administrative expenses - affiliate includes a monthly operation and management fee paid to Williams to cover the cost of accounting services, computer systems and management services provided to us.
We also pay Williams a project management fee to cover the cost of managing capital projects. This fee is determined on a project by project basis and is capitalized as part of the construction costs. A summary of the payroll costs and project fees charged to us by Williams and capitalized are as follows:
Years Ended December 31, | |||||||||||
2017 | 2016 | 2015 | |||||||||
(In thousands) | |||||||||||
Capitalized labor | $ | 464 | $ | 754 | $ | 1,224 | |||||
Capitalized project fee | 179 | 249 | 213 | ||||||||
Total | $ | 643 | $ | 1,003 | $ | 1,437 | |||||
178
Note 4. Property, Plant, and Equipment
Property, plant, and equipment consisted of the following at December 31, 2017 and 2016:
Estimated | |||||||||
Years Ended December 31, | Depreciable | ||||||||
2017 | 2016 | Lives | |||||||
(In thousands) | |||||||||
Property, plant, and equipment: | |||||||||
Pipelines | $ | 1,108,031 | $ | 1,108,062 | 25 - 35 years | ||||
Plant and other equipment | 532,502 | 522,297 | 25 - 35 years | ||||||
Buildings | 31,521 | 31,521 | 25 - 35 years | ||||||
Land and land rights | 8,544 | 8,035 | 0 - 35 years | ||||||
Construction work in progress | 4,012 | 5,465 | |||||||
Total property, plant, and equipment | 1,684,610 | 1,675,380 | |||||||
Less accumulated depreciation | 559,746 | 478,843 | |||||||
Net property, plant, and equipment | $ | 1,124,864 | $ | 1,196,537 | |||||
Depreciation expense in 2017, 2016 and 2015 was $83.5 million, $66.8 million and $66.1 million, respectively, depreciable lives of specific assets were accelerated during 2017 due to the expectation that they would no longer be used in operations.
Commitments for construction and acquisition of property, plant and equipment totaled $2.6 million at December 31, 2017.
Our asset retirement obligations relate primarily to our offshore platforms and pipelines and our onshore processing and fractionation facilities. At the end of the useful life of each respective asset, we are legally or contractually obligated to dismantle the offshore platforms, properly abandon the offshore pipelines, remove the onshore facilities and related surface equipment and restore the surface of the property.
A rollforward of our asset retirement obligation for 2017 and 2016 is presented below:
Years Ended December 31, | |||||||
2017 | 2016 | ||||||
(In thousands) | |||||||
Balance at January 1 | $ | 123,440 | $ | 116,933 | |||
Accretion expense | 7,553 | 7,296 | |||||
Estimate revisions* | (10,909 | ) | (1,225 | ) | |||
New obligation incurred | 2,675 | 436 | |||||
Settlements | (679 | ) | — | ||||
Balance at December 31 | $ | 122,080 | $ | 123,440 | |||
*Includes a $12.3 million reduction related to assets determined not to have a retirement obligation.
Note 5. Intangible Assets
We have two intangible assets, first is Raceland valued at $20 million with useful life of ten years and second is ST 311 with value of $.5 million with useful life of 20 years. The amortization expense for 2017, 2016 and 2015 were $2.0 million each year, Accumulated amortization at December 31 2017 and 2016 was $7.6 million and $5.6 million, respectively. The intangible assets are being amortized on a straight-line basis.
Below is estimated amortization expense for the next five years:
179
(In thousands) | |||
2018 | $ | 2,024 | |
2019 | 2,024 | ||
2020 | 2,024 | ||
2021 | 2,024 | ||
2022 | 2,024 | ||
Total | $ | 10,120 | |
Note 6. Commitments and Contingent Liabilities
We lease the land on which the Paradis fractionator and the Larose processing plant are located. The term for the leases were renewed for an additional 10 years beginning in 2017. The future minimum annual rentals under this non-cancelable lease as of December 31, 2017 are payable as follows:
(In thousands) | |||
2018 | $ | 115 | |
2019 | 115 | ||
2020 | 115 | ||
2021 | 115 | ||
2022 | 115 | ||
Thereafter | 598 | ||
Total | $ | 1,173 | |
Total rent and lease expense for 2017, 2016, and 2015, including a cancelable platform space lease and miscellaneous month-to-month leases, was $2.8 million, $2.5 million, and $2.4 million, respectively.
Environmental Matters. We are subject to extensive federal, state, and local environmental laws and regulations which affect our operations related to the construction and operation of our facilities. Appropriate governmental authorities may enforce these laws and regulations with a variety of civil and criminal enforcement measures, including monetary penalties, assessment and remediation requirements and injunctions as to future compliance. We have not been notified and are not currently aware of any material noncompliance under the various environmental laws and regulations.
Other. We are party to various other claims, legal actions and complaints arising in the ordinary course of business. We estimate that, for all matters for which we are able to reasonably estimate a range of loss, our aggregate reasonably possible losses beyond amounts accrued for all of our contingent liabilities are immaterial to our expected future annual results of operations, liquidity, and financial position. These calculations have been made without consideration of any potential recovery from third parties. There are no significant matters for which we are unable to reasonably estimate a range of possible loss.
Note 7. Financial Instruments, Concentrations of Credit Risk and Major Customers
Fair Value of Financial Instruments
Fair value is defined as the price which would be received to sell an asset or paid to transfer a liability in an orderly transaction between market participants at the measurement date. Assets and liabilities recorded or disclosed at fair value are categorized based upon the level of judgment associated with the inputs used to measure their fair values. These categories include (in descending order of priority): Level 1, defined as observable inputs such as quoted prices in active markets; Level 2, defined as inputs other than quoted prices in active markets that are either directly or indirectly observable; and Level 3, defined as unobservable inputs in which little or no market data exists, therefore requiring an entity to develop its own assumptions.
The carrying value of cash and cash equivalents (classified as Level 1), accounts receivable, accounts payable, other current assets and other current liabilities approximate their fair value because of their short term nature.
Concentrations of Credit Risk
180
Our cash equivalents balance is primarily invested in funds with high-quality, short-term securities and instruments that are issued or guaranteed by the U.S. government.
At December 31, 2017, substantially all of customer accounts receivable result from product sales and gathering from our largest customers. This concentration may impact our overall credit risk either positively or negatively, in that the entity may be similarly affected by industry-wide changes in economic or other conditions. As a general policy, collateral is not required for receivables, but customers’ financial condition and credit worthiness are evaluated regularly. Our credit policy and the relatively short duration of receivables mitigate the risk of uncollected receivables. We incurred no gain/loss on receivables in 2017, 2016 or 2015.
Major Customers
Williams accounted for $166.1 million (40%), $129.9 million (32%), and $143.9 million (39%) respectively, of our total revenues in 2017, 2016, and 2015. These revenues were for the sale of NGLs purchased from or received as compensation under processing contracts with third-party producers.
During 2017, ExxonMobil Corporation accounted for $68.6 million (16.6%), and Anadarko accounted for $53.7 million (13.0%), of our total revenues. These revenues were for gathering, processing, transportation and other services.
During 2016, ExxonMobil Corporation accounted for $81.9 million (20.5%), and ENI Petroleum accounted for $50.5 million (12.6%), of our total revenues. These revenues were for gathering, processing, transportation and other services.
Note 8. Rate and Regulatory Matters
Rate and Regulatory Matters. Pursuant to the terms of its FERC Gas Tariff, DGT has the right to file, on an annual basis, a request with the FERC for a fuel lost-and-unaccounted-for gas (FL&U) percentage to be assessed shippers for the upcoming fiscal year beginning July 1. On May 31, 2016, DGT filed to reduce the FL&U retention rate from 0.3 percent to 0.0 (zero) percent per dekatherm (Dt) of gas received based upon the actual fuel use, system loss and gas retained experienced in 2015. On June 17, 2016, the FERC issued a letter order approving the requested retention rate revision. The actual system gain for 2016 was $1.1 million with FL&U recovered of $0.6 million. On May 31, 2017, a report was filed with the FERC stating that DGT was not revising its currently effective FL&U retention rate of 0.0 percent at this time based upon the actual fuel use, system loss and gas retained experienced in 2016. On December 21, 2017, the FERC issued a letter order accepting the May 31, 2017 report. The actual system loss for 2017 was $2.3 million. The above amounts were recognized in each year’s respective operating income.
On November 15, 2016, DGT filed its annual HMRE surcharge adjustment to maintain the $0.0500 per Dt surcharge effective January 1, 2017. The HMRE surcharge allows for the recovery of certain capital and operating costs associated with DGT’s efforts to maintain and enhance system reliability and repair and remediate facilities damaged by hurricanes. The filing reflected an additional $0.2 million of qualifying HMRE costs to be recovered by the surcharge. As reflected in the application, the total HMRE amount to be recovered over future periods was $24.4 million as of September 30, 2016. The Commission approved the requested surcharge by letter order dated December 7, 2016.
On November 15, 2017, DGT filed its annual HMRE surcharge adjustment to maintain the $0.0500 per Dt surcharge effective January 1, 2018. The filing reflected an additional $0.1 million of qualifying HMRE costs to be recovered by the surcharge. As reflected in the application, the total HMRE amount to be recovered over future periods was $14.5 million as of September 30, 2017. The Commission approved the requested surcharge by letter order dated December 22, 2017.
Note 9. Business Combination
On July 2, 2015, we completed the acquisition of the ST 311 pipeline from Walter Oil and Gas Corporation, Castex Offshore Inc., Fieldwood Energy LLC, and Apache Shelf Exploration LLC. The pipeline acquired is a 25 mile 14” gathering lateral starting from the ST 311 block to the ST 200 block connection to our 18” regulated lateral line that connects to DGT’s 30” regulated mainline. We paid $23.5 million for the pipeline, net of refunds for a pre-closing settlement. No material liabilities were assumed besides the initial recording of an asset retirement obligation.
181
The following table presents the allocation of the acquisition-date fair value of the major classes of the net assets:
(In thousands) | |||
Property, plant and equipment | $ | 25,900 | |
Intangible asset | 470 | ||
Asset retirement obligation | (2,870 | ) | |
Total cash | $ | 23,500 | |
Note 10. Subsequent Events
During February 2018, we made distributions to our partners totaling $10.7 million and received $1.9 million for capital funding.
182
DCP SAND HILLS PIPELINE, LLC
Consolidated Financial Statements for the
Years Ended December 31, 2017, 2016 and 2015
183
INDEPENDENT AUDITORS' REPORT
To the Members of
DCP Sand Hills Pipeline, LLC
Denver, Colorado
We have audited the accompanying consolidated financial statements of DCP Sand Hills Pipeline, LLC and subsidiary (the "Company"), which comprise the consolidated balance sheets as of December 31, 2017 and 2016, and the related consolidated statements of operations, changes in members’ equity, and cash flows for each of the three years in the period ended December 31, 2017, and the related notes to the consolidated financial statements.
Management's Responsibility for the Consolidated Financial Statements
Management is responsible for the preparation and fair presentation of these consolidated financial statements in accordance with accounting principles generally accepted in the United States of America; this includes the design, implementation, and maintenance of internal control relevant to the preparation and fair presentation of consolidated financial statements that are free from material misstatement, whether due to fraud or error.
Auditors' Responsibility
Our responsibility is to express an opinion on these consolidated financial statements based on our audits. We conducted our audits in accordance with auditing standards generally accepted in the United States of America. Those standards require that we plan and perform the audit to obtain reasonable assurance about whether the consolidated financial statements are free from material misstatement.
An audit involves performing procedures to obtain audit evidence about the amounts and disclosures in the consolidated financial statements. The procedures selected depend on the auditor's judgment, including the assessment of the risks of material misstatement of the consolidated financial statements, whether due to fraud or error. In making those risk assessments, the auditor considers internal control relevant to the Company's preparation and fair presentation of the consolidated financial statements in order to design audit procedures that are appropriate in the circumstances, but not for the purpose of expressing an opinion on the effectiveness of the Company's internal control. Accordingly, we express no such opinion. An audit also includes evaluating the appropriateness of accounting policies used and the reasonableness of significant accounting estimates made by management, as well as evaluating the overall presentation of the consolidated financial statements.
We believe that the audit evidence we have obtained is sufficient and appropriate to provide a basis for our audit opinion.
Opinion
In our opinion, the consolidated financial statements referred to above present fairly, in all material respects, the financial position of DCP Sand Hills Pipeline, LLC and its subsidiary as of December 31, 2017 and 2016, and the results of their operations and their cash flows for each of the three years in the period ended December 31, 2017 in accordance with accounting principles generally accepted in the United States of America.
/s/ Deloitte & Touche LLP
Denver, Colorado
February 9, 2018
184
DCP SAND HILLS PIPELINE, LLC
CONSOLIDATED BALANCE SHEETS
(millions)
December 31, | |||||||
2017 | 2016 | ||||||
ASSETS | |||||||
Current assets: | |||||||
Cash and cash equivalents | $ | 17.5 | $ | 8.0 | |||
Accounts receivable: | |||||||
Affiliates | 25.0 | 14.8 | |||||
Trade and other | 9.2 | 6.1 | |||||
Other | 0.2 | 0.2 | |||||
Total current assets | 51.9 | 29.1 | |||||
Property, plant and equipment, net | 1,547.0 | 1,355.1 | |||||
Other long-term assets | 3.5 | 3.9 | |||||
Total assets | $ | 1,602.4 | $ | 1,388.1 | |||
LIABILITIES AND MEMBERS’ EQUITY | |||||||
Current liabilities: | |||||||
Accounts payable: | |||||||
Affiliates | $ | 4.5 | $ | 2.7 | |||
Trade and other | 14.4 | 10.5 | |||||
Deferred revenues: | |||||||
Affiliates | 3.5 | 4.7 | |||||
Third party | — | 10.0 | |||||
Accrued taxes | 8.4 | 8.2 | |||||
Accrued capital expenditures | 12.9 | 10.2 | |||||
Accrued liabilities and other | 8.6 | 2.6 | |||||
Total current liabilities | 52.3 | 48.9 | |||||
Other long-term liabilities | 4.5 | 3.8 | |||||
Total liabilities | 56.8 | 52.7 | |||||
Total members’ equity | 1,545.6 | 1,335.4 | |||||
Total liabilities and members’ equity | $ | 1,602.4 | $ | 1,388.1 | |||
See Notes to Consolidated Financial Statements.
185
DCP SAND HILLS PIPELINE, LLC
CONSOLIDATED STATEMENTS OF OPERATIONS
(millions)
Year Ended December 31, | |||||||||||
2017 | 2016 | 2015 | |||||||||
Operating revenues: | |||||||||||
Transportation - affiliates | $ | 246.4 | $ | 182.5 | $ | 157.3 | |||||
Transportation | 85.6 | 86.3 | 81.2 | ||||||||
Other revenues | — | 0.2 | — | ||||||||
Total operating revenues | 332.0 | 269 | 238.5 | ||||||||
Operating costs and expenses: | |||||||||||
Cost of transportation - affiliates | 3.6 | 6.8 | 4.2 | ||||||||
Cost of transportation | 3.0 | 3.8 | 3.4 | ||||||||
Operating and maintenance expense | 42.9 | 35.9 | 27.5 | ||||||||
Depreciation expense | 30.1 | 28.9 | 27.3 | ||||||||
General and administrative expense - affiliates | 5.2 | 5.2 | 5.4 | ||||||||
General and administrative expense | 2.5 | 2.5 | 2.6 | ||||||||
Total operating costs and expenses | 87.3 | 83.1 | 70.4 | ||||||||
Operating income | 244.7 | 185.9 | 168.1 | ||||||||
Interest income | 0.4 | 0.1 | — | ||||||||
Income tax expense | (1.7 | ) | (1.6 | ) | (1.4 | ) | |||||
Net income | $ | 243.4 | $ | 184.4 | $ | 166.7 | |||||
See Notes to Consolidated Financial Statements.
186
DCP SAND HILLS PIPELINE, LLC
CONSOLIDATED STATEMENTS OF CHANGES IN MEMBERS’ EQUITY
(millions)
DCP Sand Holding, LLC | DCP Pipeline Holding LLC | Phillips 66 Sand Hills LLC | Spectra Energy Sand Hills Holding, LLC | Total Members’ Equity | |||||||||||||||
Balance, January 1, 2015 | $ | — | $ | 403.6 | $ | 403.7 | $ | 403.7 | $ | 1,211.0 | |||||||||
Contributions from members | 2.7 | 28.7 | 28.6 | 26.0 | 86.0 | ||||||||||||||
Distributions to members | (12.8 | ) | (56.5 | ) | (56.5 | ) | (43.8 | ) | (169.6 | ) | |||||||||
Transfer of interest in DCP Sand Hills Pipeline, LLC | 431.3 | — | — | (431.3 | ) | — | |||||||||||||
Net income | 10.1 | 55.6 | 55.6 | 45.4 | 166.7 | ||||||||||||||
Balance, December 31, 2015 | 431.3 | 431.4 | 431.4 | — | 1,294.1 | ||||||||||||||
Contributions from members | 22.0 | 21.8 | 21.9 | — | 65.7 | ||||||||||||||
Distributions to members | (69.6 | ) | (69.6 | ) | (69.6 | ) | — | (208.8 | ) | ||||||||||
Net income | 61.5 | 61.4 | 61.5 | — | 184.4 | ||||||||||||||
Balance, December 31, 2016 | 445.2 | 445.0 | 445.2 | — | 1,335.4 | ||||||||||||||
Contributions from members | 73.3 | 73.2 | 73.3 | — | 219.8 | ||||||||||||||
Distributions to members | (84.3 | ) | (84.4 | ) | (84.3 | ) | — | (253.0 | ) | ||||||||||
Net income | 81.1 | 81.2 | 81.1 | — | 243.4 | ||||||||||||||
Balance, December 31, 2017 | $ | 515.3 | $ | 515.0 | $ | 515.3 | $ | — | $ | 1,545.6 | |||||||||
See Notes to Consolidated Financial Statements.
187
DCP SAND HILLS PIPELINE, LLC
CONSOLIDATED STATEMENTS OF CASH FLOWS
(millions)
Year Ended December 31, | |||||||||||
2017 | 2016 | 2015 | |||||||||
OPERATING ACTIVITIES: | |||||||||||
Net income | $ | 243.4 | $ | 184.4 | $ | 166.7 | |||||
Adjustments to reconcile net income to net cash provided by operating activities: | |||||||||||
Depreciation expense | 30.1 | 28.9 | 27.3 | ||||||||
Other, net | 0.7 | 1.0 | 2.7 | ||||||||
Change in operating assets and liabilities: | |||||||||||
Accounts receivable | (13.3 | ) | (0.9 | ) | (6.5 | ) | |||||
Accounts payable | 2.9 | (1.7 | ) | 4.6 | |||||||
Deferred revenues | (11.2 | ) | (19 | ) | (1.7 | ) | |||||
Other current assets | — | 0.1 | — | ||||||||
Other long-term assets | 0.4 | (2.7 | ) | 0.2 | |||||||
Other current liabilities | 1 | 5.9 | (0.3 | ) | |||||||
Other long-term liabilities | (0.1 | ) | (0.6 | ) | (0.6 | ) | |||||
Net cash provided by operating activities | 253.9 | 195.4 | 192.4 | ||||||||
INVESTING ACTIVITIES: | |||||||||||
Capital expenditures | (211.2 | ) | (57.3 | ) | (110.6 | ) | |||||
Proceeds from sale of assets | — | 0.1 | 1.2 | ||||||||
Net cash used in investing activities | (211.2 | ) | (57.2 | ) | (109.4 | ) | |||||
FINANCING ACTIVITIES: | |||||||||||
Contributions from members | 219.8 | 65.7 | 86.0 | ||||||||
Distributions to members | (253 | ) | (208.8 | ) | (169.6 | ) | |||||
Net cash used in financing activities | (33.2 | ) | (143.1 | ) | (83.6 | ) | |||||
Net change in cash and cash equivalents | 9.5 | (4.9 | ) | (0.6 | ) | ||||||
Cash and cash equivalents, beginning of period | 8 | 12.9 | 13.5 | ||||||||
Cash and cash equivalents, end of period | $ | 17.5 | $ | 8.0 | $ | 12.9 | |||||
See Notes to Consolidated Financial Statements.
188
DCP SAND HILLS PIPELINE, LLC
NOTES TO CONSOLIDATED FINANCIAL STATEMENTS
Years Ended December 31, 2017, 2016, and 2015
1. Description of Business and Basis of Presentation
DCP Sand Hills Pipeline, LLC, with its consolidated subsidiary, or Sand Hills, we, our, the Company, or us, is engaged in the business of transporting natural gas liquids, or NGLs. The Sand Hills pipeline is a common carrier pipeline which provides takeaway service from plants in the Permian and the Eagle Ford basins to fractionation facilities along the Texas Gulf Coast and the Mont Belvieu, Texas market hub. The Sand Hills pipeline was placed into service in June 2013.
We are a limited liability company owned 33.330% by DCP Pipeline Holding LLC, and 33.335% by DCP Sand Holding, LLC, both 100% owned subsidiaries of DCP Midstream, LP, or DCP Midstream, and 33.335% by Phillips 66 Sand Hills LLC, a 100% owned subsidiary of Phillips 66 Partners LP, or Phillips 66 Partners. Throughout these consolidated financial statements, DCP Midstream and Phillips 66 Partners will together be referenced as the members. DCP Midstream is a joint venture owned 50% by Phillips 66 and 50% by Enbridge, Inc., and is the operator of the Sand Hills pipeline.
Prior to October 2015, we were owned 33.335% by Spectra Energy Sand Hills Holding, LLC, a 100% owned subsidiary of Spectra Energy Partners, LP, or Spectra Energy Partners. In October 2015, Spectra Energy entered into an agreement with Spectra Energy Partners to acquire its ownership interest of 33.335% in the Company. On October 30, 2015, Spectra Energy contributed its ownership of 33.335% interest in the Company to DCP Midstream.
The Company allocates revenues, costs, and expenses in accordance with the terms of the Second Amended and Restated LLC Agreement, which became effective on September 3, 2013, or the LLC Agreement, to each of the three members based on each member’s ownership interest. Under terms of the LLC Agreement, the members are required to fund capital calls necessary to fund the capital requirements of the Company, including capital expansion and working capital requirements. Under the terms of the LLC Agreement, cash calls and cash distributions from operations are allocated to the members based upon each member’s respective ownership interest.
The consolidated financial statements include the accounts of Sand Hills and its 100% owned subsidiary and have been prepared in accordance with accounting principles generally accepted in the United States of America, or GAAP. Intercompany balances and transactions have been eliminated. Transactions between us and the members have been identified in the consolidated financial statements as transactions between affiliates.
2. Summary of Significant Accounting Policies
Use of Estimates - Conformity with GAAP requires management to make estimates and assumptions that affect the amounts reported in the consolidated financial statements and notes. Although these estimates are based on management’s best available knowledge of current and expected future events, actual results could differ from those estimates.
Cash and Cash Equivalents - Cash and cash equivalents include all cash balances and investments in highly liquid financial instruments purchased with an original stated maturity of 90 days or less and temporary investments of cash in short-term money market securities.
Distributions - Under the terms of the LLC Agreement, we are required to make quarterly distributions to the members based on Available Cash, as the term is defined in the LLC Agreement. Available Cash distributions are paid pursuant to the members’ respective ownership percentages at the date the distributions are due.
Estimated Fair Value of Financial Instruments - The fair value of cash and cash equivalents, accounts receivable and accounts payable included in the consolidated balance sheets are not materially different from their carrying amounts because of the short-term nature of these instruments. We may invest available cash balances in short-term money market securities. As of December 31, 2017 and 2016, we invested $17.5 million and $8.0 million, respectively, in short-term money market securities which are included in cash and cash equivalents in our consolidated balance sheets. Given that the value of the short-term money market securities is publicly traded and market prices are readily available, these investments are considered Level 1 fair value measurements.
Concentration of Credit Risk - Financial instruments that potentially subject us to concentrations of credit risk consist principally of cash and accounts receivable. We extend credit to customers and other parties in the normal course of business
189
and have established various procedures to manage our credit exposure, including initial credit approvals, credit limits and rights of offset.
Property, Plant and Equipment - Property, plant and equipment are recorded at historical cost. The cost of maintenance and repairs, which are not significant improvements, are expensed when incurred. Depreciation is computed using the straight-line method over the estimated useful lives of the assets.
Asset Retirement Obligations - Our asset retirement obligations, or AROs, relate primarily to the contractual obligations relating to the retirement or abandonment of our transportation pipelines, obligations related to right-of-way easement agreements, and contractual leases for land use. We adjust our AROs each quarter for any liabilities incurred or settled during the period, accretion expense and any revisions made to the estimated cash flows. Asset retirement obligations associated with tangible long-lived assets are recorded at fair value in the period in which they are incurred, if a reasonable estimate of fair value can be made, and added to the carrying amount of the associated asset. This additional carrying amount is then depreciated over the life of the asset. The liability is determined using a credit-adjusted risk-free interest rate and accretes due to the passage of time based on the time value of money until the obligation is settled. None of our assets are legally restricted for purposes of settling AROs.
Long-Lived Assets - We periodically evaluate whether the carrying value of long-lived assets has been impaired when circumstances indicate the carrying value of those assets may not be recoverable. This evaluation is based on undiscounted cash flow projections. The carrying amount is not recoverable if it exceeds the sum of the undiscounted cash flows expected to result from the use and eventual disposition of the asset. We consider various factors when determining if these assets should be evaluated for impairment, including but not limited to:
• | a significant adverse change in legal factors or business climate; |
• | a current-period operating or cash flow loss combined with a history of operating or cash flow losses, or a projection or forecast that demonstrates continuing losses associated with the use of a long-lived asset; |
• | an accumulation of costs significantly in excess of the amount originally expected for the acquisition or construction of a long-lived asset; |
• | significant adverse changes in the extent or manner in which an asset is used, or in its physical condition; |
• | a significant adverse change in the market value of an asset; or |
• | a current expectation that, more likely than not, an asset will be sold or otherwise disposed of before the end of its estimated useful life. |
If the carrying value is not recoverable, the impairment loss is measured as the excess of the asset’s carrying value over its fair value. We assess the fair value of long-lived assets using commonly accepted techniques, and may use more than one method, including, but not limited to, recent third party comparable sales and discounted cash flow models. Significant changes in market conditions resulting from events such as the condition of an asset or a change in management’s intent to utilize the asset would generally require management to reassess the cash flows related to the long-lived assets.
Revenue Recognition - We generate the majority of our revenues from fee-based arrangements. The revenues we earn are from long-term contracts relating to the transportation of NGLs and generally are not dependent on commodity prices. Certain demand contracts state that we will collect our monthly fee based on committed volumes, regardless of the actual volumes transported. In some instances, revenue is deferred for any payments received in excess of actual volumes transported and revenue is recognized once the committed volumes are transported, or certain contractual provisions have expired, and all other revenue recognition criteria are met.
We recognize revenues under the four revenue recognition criteria, as follows:
• | Persuasive evidence of an arrangement exists - Our customary practice is to enter into a written contract. |
• | Delivery - Delivery is deemed to have occurred when the services are rendered. |
• | The fee is fixed or determinable - We negotiate the fee for our services at the outset of our fee-based arrangements. In these arrangements, the fees are nonrefundable. |
190
• | Collectability is reasonably assured - Collectability is evaluated on a customer-by-customer basis. New and existing customers are subject to a credit review process, which evaluates the customers’ financial position (for example, credit metrics, liquidity and credit rating) and their ability to pay. If collectability is not considered probable at the outset of an arrangement in accordance with our credit review process, revenue is not recognized until the cash is collected. |
Revenue for services provided, but not invoiced, is estimated each month. These estimates are generally based on preliminary throughput measurements and contract data.
Significant Customers - There was one third party customer that accounted for more than 10% of total operating revenue for the years ended December 31, 2017 and 2016. There was no third party customers that accounted for more than 10% of total operating revenue for the year ended December 31, 2015. There were significant transactions with affiliates for each of the years ended December 31, 2017, 2016 and 2015. See Note 4, Agreements and Transactions with Affiliates.
Environmental Expenditures - Environmental expenditures are expensed or capitalized as appropriate, depending upon the future economic benefit. Expenditures that relate to an existing condition caused by past operations and that do not generate current or future revenue are expensed. Liabilities for these expenditures are recorded on an undiscounted basis when environmental assessments and/or clean-ups are probable and the costs can be reasonably estimated.
Income Taxes - We are structured as a limited liability company, which is a pass-through entity for federal income tax purposes. As a limited liability company, we do not pay federal income taxes. Instead, our income or loss for tax purposes is allocated to each of the members for inclusion in their respective tax returns. Consequently, no provision for federal income taxes has been reflected in these consolidated financial statements. We are subject to the Texas margin tax, which is treated as a state income tax. We follow the asset and liability method of accounting for state income taxes. Under this method, deferred income taxes are recognized for the tax consequences of temporary differences between the consolidated financial statement carrying amounts and the tax basis of the assets and liabilities. For the years ended December 31, 2017, 2016 and 2015, deferred state income tax expense totaled $0.5 million, $0.7 million and $0.7 million, respectively. For the years ended December 31, 2017, 2016 and 2015, current state income tax expense totaled $1.2 million, $0.9 million and $0.7 million, respectively.
3. Recent Accounting Pronouncements
Financial Accounting Standards Board, or FASB, Accounting Standards Update, or ASU, 2016-15 “Statement of Cash Flows (Topic 230): Classification of Certain Cash Receipts and Cash Payments,” or ASU 2016-15 - In August 2016, the FASB issued ASU 2016-15, which amends certain cash flow statement classification guidance. We intend to adopt this ASU when it is effective for public entities, which is for interim and annual reporting periods beginning after December 15, 2017. The adoption of this ASU will have no impact on our consolidated cash flows.
FASB ASU, 2016-02 “Leases (Topic 842),” or ASU 2016-02 - In February 2016, the FASB issued ASU 2016-02, which requires lessees to recognize a lease liability on a discounted basis and the right of use of a specified asset at the commencement date for all leases. We intend to adopt this ASU when it is effective for public entities, which is for annual reporting periods beginning after December 15, 2018, and we are currently assessing the impact of adoption on our consolidated results of operations, cash flows and financial position.
FASB ASU, 2014-09 “Revenue from Contracts with Customers (Topic 606),” or ASU 2014-09 and related interpretations and amendments - In May 2014, the FASB issued ASU 2014-09, which supersedes the revenue recognition requirements of Accounting Standards Codification, or ASC, Topic 605 “Revenue Recognition.” This ASU is effective for annual reporting periods beginning after December 15, 2017, with the option to adopt as early as annual reporting periods beginning after December 15, 2016. Under the new standard, revenue is recognized when a customer obtains control of promised goods or services in an amount that reflects the consideration the entity expects to receive in exchange for those goods or services. Although the new revenue recognition model is based on control, which differs from the previous model which was based a transfer of risks and rewards, we expect to identify similar performance obligations under Topic 606 as compared with deliverables and units of account previously identified under Topic 605. As a result, we expect the timing of our revenue to remain the same with respect to the majority of our contracts. We also have certain contracts with customers whereby the customer reimburses us for costs to construct certain logistical connections to our operating assets which we own and operate. We previously accounted for these arrangements as a reduction to the cost basis of our long-lived assets which were amortized as a reduction to depreciation expense over the estimated useful life of the related assets. Under Topic 606 we will record these payments as deferred revenue which will be amortized into revenue over the contract term. We do not anticipate a material impact to net income, operating income, or cash flows because the increase to depreciation expense will be offset by the increase to revenues.
191
In addition, the standard requires disclosure of the nature, amount, timing, and uncertainty of revenue and cash flows arising from contracts with customers. We adopted the guidance using the modified retrospective method on the effective date of January 1, 2018.
4. Agreements and Transactions with Affiliates
DCP Midstream
Under the LLC Agreement, we are required to reimburse DCP Midstream for any direct costs or expenses (other than general and administration services) incurred by DCP Midstream on our behalf. Additionally, we pay DCP Midstream an annual service fee of $5.0 million, for centralized corporate functions provided by DCP Midstream on our behalf, including legal, accounting, cash management, insurance administration and claims processing, risk management, health, safety and environmental, information technology, human resources, credit, payroll, taxes and engineering. These expenses are included in general and administrative expense - affiliates in the consolidated statements of operations. Except with respect to the annual service fee, there is no limit on the reimbursements we make to DCP Midstream under the LLC Agreement for other expenses and expenditures incurred or payments made on our behalf.
We have entered into transportation agreements with DCP Midstream, which include a commitment to transport volumes at rates defined in our tariffs. These 15-year transportation agreements became effective in June 2013. We currently, and anticipate to continue to, transact with DCP Midstream in the ordinary course of business. DCP Midstream was a significant customer during the years ended December 31, 2017, 2016 and 2015.
DCP Southern Hills Pipeline, LLC
We have a long-term capacity lease with DCP Southern Hills Pipeline, LLC, or Southern Hills, which expires in March 2023. Under the terms of this agreement, Southern Hills has the right to transport minimum throughput volumes on the Sand Hills pipeline at rates defined in the transportation agreement.
Summary of Transactions with Affiliates
The following table summarizes our transactions with affiliates:
Year Ended December 31, | |||||||||||
2017 | 2016 | 2015 | |||||||||
(millions) | |||||||||||
DCP Midstream, LLC and its affiliates: | |||||||||||
Transportation - affiliates | $ | 236.7 | $ | 169.8 | $ | 150.6 | |||||
Cost of transportation - affiliates | $ | 3.6 | $ | 6.8 | $ | 4.2 | |||||
General and administrative expense - affiliates | $ | 5.0 | $ | 5.0 | $ | 5.0 | |||||
Southern Hills: | |||||||||||
Transportation - affiliates | $ | 3.2 | $ | 3.2 | $ | 3.2 | |||||
Phillips 66: | |||||||||||
Transportation - affiliates | $ | 6.5 | $ | 9.5 | $ | 3.5 | |||||
General and administrative expense - affiliates | $ | 0.2 | $ | 0.2 | $ | 0.2 | |||||
Enbridge: | |||||||||||
General and administrative expense - affiliates | $ | — | $ | — | $ | 0.2 | |||||
192
We had balances with affiliates as follows:
December 31, | |||||||
2017 | 2016 | ||||||
(millions) | |||||||
DCP Midstream, LLC and its affiliates: | |||||||
Accounts receivable | $ | 23.8 | $ | 14.0 | |||
Accounts payable | $ | (4.5 | ) | $ | (2.5 | ) | |
Deferred revenue | $ | (3.5 | ) | $ | (4.7 | ) | |
Southern Hills: | |||||||
Accounts receivable | $ | 0.3 | $ | 0.2 | |||
Phillips 66: | |||||||
Accounts receivable | $ | 0.9 | $ | 0.6 | |||
Accounts payable | $ | — | $ | (0.2 | ) | ||
5. Property, Plant and Equipment
Property, plant and equipment by classification is as follows:
Depreciable | December 31, | |||||||
Life | 2017 | 2016 | ||||||
(millions) | ||||||||
Transmission systems | 20 - 50 Years | $ | 1,530.3 | $ | 1,399.1 | |||
Processing Facilities | 35 - 60 Years | 0.3 | — | |||||
Other | 3 - 30 Years | 3.2 | 3.3 | |||||
Land | 0.2 | 0.2 | ||||||
Construction work in progress | 140.9 | 50.4 | ||||||
Property, plant and equipment | 1,674.9 | 1,453.0 | ||||||
Accumulated depreciation | (127.9 | ) | (97.9 | ) | ||||
Property, plant and equipment, net | $ | 1,547.0 | $ | 1,355.1 | ||||
Asset Retirement Obligations - As of December 31, 2017 and 2016, we had AROs of $1.7 million and $1.4 million, respectively, included in other long-term liabilities in our consolidated balance sheets. For each of the years ended December 31, 2017, 2016 and 2015 accretion expense was less than $0.1 million. Accretion expense is recorded within operating and maintenance expense in our consolidated statements of operations.
6. Commitments and Contingent Liabilities
Regulatory Compliance - In the ordinary course of business, we are subject to various laws and regulations. In the opinion of our management, compliance with existing laws and regulations will not materially affect our consolidated results of operations, financial position, or cash flows.
Litigation - We are not party to any significant legal proceedings, but are a party to various administrative and regulatory proceedings and various commercial disputes that arose during the development of the Sand Hills pipeline and in the ordinary course of our business. Management currently believes that the ultimate resolution of the foregoing matters, taken as a whole and after consideration of amounts accrued, insurance coverage and other indemnification arrangements, will not have a material adverse effect on our consolidated results of operations, financial position, or cash flows.
General Insurance - Insurance for Sand Hills is written in the commercial markets and through affiliate companies, which management believes is consistent with companies engaged in similar commercial operations with similar assets. Our insurance coverage includes general liability and excess liability insurance above the established primary limits for general liability. All coverage is subject to certain limits and deductibles, the terms and conditions of which are common for companies with similar types of operations.
193
Environmental - The operation of pipelines for transporting NGLs is subject to stringent and complex laws and regulations pertaining to health, safety, and the environment. As an owner or operator of these facilities, we must comply with United States laws and regulations at the federal, state, and, in some cases, local levels that relate to worker safety, air and water quality, solid and hazardous waste storage, management, transportation and disposal, and other environmental matters. The cost of planning, designing, constructing, and operating pipelines incorporates compliance with environmental laws and regulations, worker safety standards, and safety standards applicable to our various facilities. In addition, there is increasing focus from (i) city, state and federal regulatory officials and through litigation, on hydraulic fracturing and the real or perceived environmental impacts of this technique, which indirectly presents some risk to the available supply of natural gas and the resulting supply of NGLs, (ii) federal regulatory agencies regarding pipeline system safety which could impose additional regulatory burdens and increase the cost of our operations, and (iii) regulatory bodies and communities that could prevent or delay the development of fossil fuel energy infrastructure such as pipeline and associated facilities used in our business. Failure to comply with various health, safety and environmental laws and regulations may trigger a variety of administrative, civil, and potentially criminal enforcement measures, including citizen suits, which can include the assessment of monetary penalties, the imposition of remedial requirements, and the issuance of injunctions or restrictions on operation. Management believes that, based on currently known information, compliance with these existing laws and regulations will not have a material adverse effect on our consolidated results of operations, financial position, or cash flows.
Operating Leases - Consolidated rental expense, including leases with no continuing commitment, was $3.9 million, $3.5 million, and $4.1 million, respectively, for the years ended December 31, 2017, 2016 and 2015. Rental expense for leases with escalation clauses is recognized on a straight line basis over the initial lease term.
Minimum rental payments under our various operating leases in the year indicated are as follows:
Minimum Rental Payments | |||
(millions) | |||
2018 | $ | 3.6 | |
2019 | 3.7 | ||
2020 | 3.7 | ||
2021 | 3.8 | ||
2022 | 2.0 | ||
Total | $ | 16.8 | |
7. Supplemental Cash Flow Information
Year Ended December 31, | |||||||||||
2017 | 2016 | 2015 | |||||||||
(millions) | |||||||||||
Non-cash investing and financing activities: | |||||||||||
Property, plant and equipment acquired with accrued liabilities | $ | 20.6 | $ | 15.1 | $ | 2.6 | |||||
Other non-cash changes in property, plant and equipment, net | $ | 0.1 | $ | (0.3 | ) | $ | (1.4 | ) | |||
8. Subsequent Events
We have evaluated subsequent events occurring through February 9, 2018, the date the consolidated financial statements were available to be issued.
194
(b) Exhibits
Exhibit Number | Description | |||
*# | ||||
*# | ||||
*# | ||||
*# | ||||
*# | ||||
*# | ||||
*# | ||||
*# | ||||
*# | ||||
*# | ||||
* | ||||
*# | ||||
*# | ||||
*# | ||||
* | ||||
*# | ||||
195
Exhibit Number | Description | |||
*# | ||||
*# | ||||
*# | ||||
* | ||||
* | ||||
*# | ||||
* | ||||
* | ||||
* | ||||
* | ||||
* | ||||
* | ||||
* | ||||
* | ||||
* | ||||
* | ||||
* | ||||
196
Exhibit Number | Description | |||
* | ||||
* | ||||
* | ||||
* | ||||
* | ||||
* | ||||
* | ||||
* | ||||
* | ||||
* | ||||
* | ||||
* | ||||
* | ||||
197
Exhibit Number | Description | |||
* | ||||
* | ||||
* | ||||
* | ||||
* | ||||
* | ||||
* | ||||
*+ | ||||
*+ | ||||
*+ | ||||
*+ | ||||
*+ | ||||
*+ | ||||
+ | ||||
+ | ||||
*+ | ||||
*+ | ||||
+ | ||||
+ | ||||
* | ||||
198
Exhibit Number | Description | |||
* | ||||
101 | Financial statements from the Annual Report on Form 10-K of DCP Midstream, LP for the year ended December 31, 2017, formatted in XBRL: (i) the Consolidated Balance Sheets, (ii) the Consolidated Statements of Operations, (iii) the Consolidated Statements of Comprehensive Income, (iv) the Consolidated Statements of Cash Flows, (v) the Consolidated Statements of Changes in Equity, and (vi) the Notes to the Consolidated Financial Statements. | |||
* Such exhibit has heretofore been filed with the SEC as part of the filing indicated and is incorporated herein by reference.
+ Denotes management contract or compensatory plan or arrangement.
# Pursuant to Item 601(b)(2) of Regulation S-K, the Partnership agrees to furnish supplementally a copy of any omitted
schedule to the Securities and Exchange Commission upon request.
199
Item 16. Form 10-K Summary
None.
200
SIGNATURES
Pursuant to the requirements of Section 13 or 15(d) of the Securities Exchange Act of 1934, the registrant has duly caused this report to be signed on its behalf by the undersigned, thereunto duly authorized.
DCP Midstream, LP | ||||
By: | DCP Midstream GP, LP its General Partner | |||
By: | DCP Midstream GP, LLC its General Partner | |||
Date: February 26, 2018 | By: | /s/ Wouter T. van Kempen | ||
Name: | Wouter T. van Kempen | |||
Title: | President and Chief Executive Officer | |||
(Principal Executive Officer) | ||||
201
POWER OF ATTORNEY
KNOW ALL PERSONS BY THESE PRESENTS, that each person whose signature appears below constitutes and appoints each of Wouter T. van Kempen and Sean P. O'Brien as his true and lawful attorney-in-fact and agent with full power of substitution and resubstitution, for him and in his name, place, and stead, in any and all capacities, to sign any and all amendments to this annual report, and to file the same, with all exhibits thereto and other documents in connection therewith, with the Securities and Exchange Commission, granting unto said attorneys-in-fact and agents, and each of them, full power and authority to do and perform each and every act and thing requisite and necessary to be done in connection therewith, as fully to all intents and purposes as he might or could do in person, hereby ratifying and confirming all that said attorneys-in-fact and agents, and each of them, or their or his substitute or substitutes, may lawfully do or cause to be done by virtue hereof.
Pursuant to the requirements of the Securities Exchange Act of 1934, this report has been signed below by the following persons on behalf of the registrant and in the capacities and on the dates indicated.
Signature | Title (Position with DCP Midstream GP, LLC) | Date |
/s/ Wouter T. van Kempen | Chief Executive Officer, President, Chairman of the Board and Director | February 26, 2018 |
Wouter T. van Kempen | (Principal Executive Officer) | |
/s/ Sean P. O'Brien | Group Vice President and Chief Financial Officer | February 26, 2018 |
Sean P. O'Brien | (Principal Financial Officer) | |
/s/ Richard A. Loving | Chief Accounting Officer | February 26, 2018 |
Richard A. Loving | (Principal Accounting Officer) | |
/s/ Allen C. Capps | Director | February 26, 2018 |
Allen C. Capps | ||
/s/ Fred J. Fowler | Director | February 26, 2018 |
Fred J. Fowler | ||
/s/ William F. Kimble | Director | February 26, 2018 |
William F. Kimble | ||
/s/ Brian Mandell | Director | February 26, 2018 |
Brian Mandell | ||
/s/ Bill Waycaster | Director | February 26, 2018 |
Bill Waycaster | ||
/s/ Vern Yu | Director | February 26, 2018 |
Vern Yu | ||
/s/ John Zuklic | Director | February 26, 2018 |
John Zuklic | ||
202