Attached files
| file | filename |
|---|---|
| EX-32 - EXHIBIT 32 - TERADATA CORP /DE/ | tdc-12311710kex32.htm |
| EX-31.2 - EXHIBIT 31.2 - TERADATA CORP /DE/ | tdc-12311710kex312.htm |
| EX-31.1 - EXHIBIT 31.1 - TERADATA CORP /DE/ | tdc-12311710kex311.htm |
| EX-23.1 - EXHIBIT 23.1 - TERADATA CORP /DE/ | tdc-12311710kexhibit231.htm |
| EX-21 - EXHIBIT 21 - TERADATA CORP /DE/ | tdc123117exhibit21.htm |
| EX-10.17 - EXHIBIT 10.17 - TERADATA CORP /DE/ | exhibit1017erictom-offerle.htm |
| EX-10.16 - EXHIBIT 10.16 - TERADATA CORP /DE/ | exhibit1016markculhane-off.htm |
| EX-10.8.28 - EXHIBIT 10.8.28 - TERADATA CORP /DE/ | exhibit10828formofspecialr.htm |
| EX-10.8.27 - EXHIBIT 10.8.27 - TERADATA CORP /DE/ | exhibit10827formofpbrsuagr.htm |
| EX-10.8.26 - EXHIBIT 10.8.26 - TERADATA CORP /DE/ | exhibit10826formsofnon-usr.htm |
| EX-10.8.25 - EXHIBIT 10.8.25 - TERADATA CORP /DE/ | exhibit10825formsofusrsuag.htm |
| EX-10.3 - EXHIBIT 10.3 - TERADATA CORP /DE/ | exhibit103-teradatamip2018.htm |
UNITED STATES
SECURITIES AND EXCHANGE COMMISSION
Washington, D.C. 20549
FORM 10-K
ý | ANNUAL REPORT PURSUANT TO SECTION 13 OR 15 (d) OF THE SECURITIES EXCHANGE ACT OF 1934 |
For the fiscal year ended December 31, 2017
OR
¨ | TRANSITION REPORT PURSUANT TO SECTION 13 OR 15(d) OF THE SECURITIES EXCHANGE ACT OF 1934 |
For the transition period from to
Commission File Number 001-33458
TERADATA CORPORATION
(Exact name of registrant as specified in its charter)
Delaware | 75-3236470 | |
(State or other jurisdiction of incorporation or organization) | (I.R.S. Employer Identification No.) | |
10000 Innovation Drive
Dayton, Ohio 45342
(Address of principal executive offices) (Zip Code)
Registrant’s telephone number, including area code: (866) 548-8348
Securities registered pursuant to Section 12(b) of the Act:
Title of Each Class | Name of Each Exchange on which Registered | |
Common Stock, $0.01 par value | New York Stock Exchange | |
Indicate by check mark if the registrant is a well-known seasoned issuer, as defined in Rule 405 of the Securities Act. Yes ý No ¨
Indicate by check mark if the registrant is not required to file reports pursuant to Section 13 or Section 15 (d) of the Act. Yes ¨ No ý
Indicate by check mark whether the registrant (1) has filed all reports required to be filed by Section 13 or 15 (d) of the Securities Exchange Act of 1934 during the preceding 12 months (or for such shorter period that the registrant was required to file such reports), and (2) has been subject to such filing requirements for the past 90 days. Yes ý No ¨
Indicate by check mark whether the registrant has submitted electronically and posted on its corporate Web site, if any, every Interactive Data File required to be submitted and posted pursuant to Rule 405 of Regulations S-T (§232.405 of this chapter) during the preceding 12 months (or for such shorter period that the registrant was required to submit and post such files). Yes ý No ¨
Indicate by check mark if disclosure of delinquent filers pursuant to Item 405 of Regulation S-K (§229.405 of this chapter) is not contained herein, and will not be contained, to the best of the registrant’s knowledge, in definitive proxy or information statements incorporated by reference in Part III of this Form 10-K or any amendment to this Form 10-K. ¨
Indicate by check mark whether the registrant is a large accelerated filer, an accelerated filer, a non-accelerated filer, or a smaller reporting company. See definition of “large accelerated filer,” “accelerated filer” and “smaller reporting company” in Rule 12b-2 of the Exchange Act.
Large accelerated filer | ý | Accelerated filer | ¨ | ||
Non-accelerated filer | ¨ | Smaller reporting company | ¨ | ||
Emerging growth company | ¨ | ||||
Indicate by check mark whether the registrant is a shell company (as defined in Rule 12b-2 of the Exchange Act). Yes ¨ No ý
The aggregate market value of voting stock held by non-affiliates of the registrant as of June 30, 2017, was approximately $3.7 billion.
At January 31, 2018, there were approximately 122.0 million shares of common stock outstanding.
DOCUMENTS INCORPORATED BY REFERENCE
Part III: | Portions of the registrant’s Notice of Annual Meeting of Stockholders and Proxy Statement, to be filed with the Securities and Exchange Commission pursuant to Regulation 14A within 120 days after registrant’s fiscal year end of December 31, 2017 are incorporated herein by reference. |
TABLE OF CONTENTS
Item | Description | Page |
1. | ||
1A. | ||
1B. | ||
2. | ||
3. | ||
4. | ||
5. | ||
6. | ||
7. | ||
7A. | ||
8. | ||
9. | ||
9A. | ||
9B. | ||
10. | ||
11. | ||
12. | ||
13. | ||
14. | ||
15. | ||
16. | ||
This report contains trademarks, service marks, and registered marks of Teradata Corporation and its subsidiaries, and other companies, as indicated.
3
PART I
FORWARD-LOOKING STATEMENTS
Forward-looking statements in our public filings or other public statements are subject to known and unknown risks, uncertainties and other factors that may cause our actual results, performance or achievements to be materially different from any future results, performance or achievements expressed or implied by such forward-looking statements or other public statements. These forward-looking statements were based on various facts and were derived utilizing numerous important assumptions and other important factors, and changes in such facts, assumptions or factors could cause actual results to differ materially from those in the forward-looking statements. Forward-looking statements include the information concerning our future financial performance, business strategy, projected plans and objectives. Statements preceded by, followed by or that otherwise include the words “believes,” “expects,” “anticipates,” “intends,” “projects,” “estimates,” “plans,” “may increase,” “may fluctuate,” and similar expressions or future or conditional verbs such as “will,” “should,” “would,” “may” and “could” are generally forward-looking in nature and not historical facts. You should understand that the factors described under “Risk Factors” and the following important factors could affect our future results and could cause actual results to differ materially from those expressed in such forward-looking statements:
• | Our ability to timely and effectively implement our business transformation plan and the execution of our new strategy; |
• | The rapidly changing and intensely competitive nature of the information technology (“IT”) industry and the analytic data platform business, including the ongoing consolidation activity, threats from new and emerging analytic data technologies and competitors, and pressure on achieving continued price/performance gains for analytic data solutions; |
• | Fluctuations in our operating results, timing of transactions, unanticipated delays or accelerations in our sales cycles and the difficulty of accurately estimating revenues, particularly the pace and extent to which customers shift from perpetual licenses to subscription-based licenses; |
• | Our ability to successfully leverage acquisitions; |
• | The impact of global economic fluctuations on the markets in general or on the ability of our suppliers and customers to meet their commitments to us, or the timing of purchases by our current and potential customers; and |
• | Risks inherent in operating in foreign countries, including the impact of foreign currency fluctuations, economic, political, legal, regulatory, compliance, cultural and other conditions abroad. |
Other factors not identified above, including the risk factors described in the section entitled “Risk Factors” included elsewhere in this Annual Report on Form 10-K (“Annual Report”), may also cause actual results to differ materially from those projected by our forward-looking statements. Most of these factors are difficult to anticipate and are generally beyond our reasonable control. We undertake no obligation to release publicly any revisions to any forward-looking statements, to report events or to report the occurrence of unanticipated events.
Item 1. BUSINESS
Overview. Teradata Corporation ("we," "us," "Teradata," or the "Company") is a global leader in analytic data solutions and services. Our analytic data solutions comprise software, hardware, and related business consulting and support services for analytics across a company’s entire analytical ecosystem. We help customers access and manage data and use analytics to extract business value and insight from their data. We work with our customers enabling them to leverage data and analytics to drive business outcomes such as, but not limited to:
• | Improving a customer’s experience through understanding behavioral patterns, |
4
• | Driving financial transformation with accurate and timely data, and |
• | Creating more efficient utilization of assets through machine learning of sensor data. |
Our consulting services include a broad range of offerings, including consulting to help organizations establish an analytic vision, to enable an analytical ecosystem architecture and to ensure value delivery of their analytical infrastructure, among other things. We do this through flexible deployment options, including the Teradata Cloud and public clouds, as well as on-premises on Teradata hardware or commodity hardware.
We serve customers around the world across a broad set of industries with offerings for the world’s largest analytic data opportunities. Teradata operates from numerous locations within the United States ("U.S.") with the primary locations being Rancho Bernardo (San Diego), California, Dayton, Ohio; and Johns Creek (Atlanta), Georgia. In addition, we have sales, services, research and development, and administrative offices located in 44 countries.
For the full year ended December 31, 2017, we had total revenues of $2.156 billion, of which approximately 55% was derived from the Americas Data and Analytics segment and 45% from the International Data and Analytics segment. For financial information about these segments and geographic information, see “Note 11—Segment, Other Supplemental Information and Concentrations” in the Notes to Consolidated Financial Statements elsewhere in this Annual Report.
History. Teradata started in a garage in Brentwood California and was incorporated in 1979 as a Delaware corporation, driven by the need for robust computing power to harness the value of aggregated data. In 1984, Teradata established a massively parallel relational database management system that enabled companies to easily scale their data management needs, revolutionizing data analysis for customers. In 1991, Teradata was acquired and operated as a division of another company until it was spun off as an independent, publicly-traded company, Teradata Corporation (NYSE: TDC) on September 30, 2007.
Industry and Market Opportunity. Our view is that analytics is and will continue to be a management priority for leading companies. We believe Teradata’s strategy positions us to address a large market opportunity within the multi-billion dollar and growing data management and analytics markets. Organizations are going through a digital transformation and data and analytics are at the core of this evolution, and we believe that companies need help leveraging analytics and data to deliver high-impact business outcomes. We also believe that companies need help in designing and implementing the right analytical ecosystem for their needs. We have tailored Teradata's offerings to meet these needs and to help companies navigate the multitude of ecosystem options, as well as various alternatives for deployment.
Our Strategy. Teradata’s strategy is based around our core belief that analytics and data unleash the potential of great companies allowing them to make better and faster decisions and attain competitive advantage. We empower companies to achieve high-impact business outcomes through analytics at scale on an agile data foundation. With our focus to lead with business outcomes and a consultative approach, our goal is to serve as a trusted advisor to both the business and technical leaders in our customers’ organizations. Our business analytics solutions and technology are ideally suited for the world’s largest companies that have the largest and most complex analytics challenges, where scale and performance of such solutions matter.
Our strategy is to provide a differentiated set of offerings to this target market through a portfolio of data and analytics solutions, including the following:
• | Teradata IntelliCloudTM: Through this "as-a-service" offering, we manage the software and infrastructure for our customers, so they can focus on successful business outcomes. This includes management of performance, security, availability and operations all delivered with a "pay-as-you-go" price model. Teradata's IntelliCloud can be deployed on-premises, in private clouds as well as in public clouds; |
• | Teradata Analytics Platform: Our market-leading integrated data warehouse engine has evolved to include access to the best analytic functions and leading analytic engines, leveraging preferred tools and languages against multiple data types integrated at scale; |
• | Business Analytics Consulting and Solutions: By engaging with business users through solution-based selling that leverages analytic consulting, our customers can realize high-value business outcomes; and |
• | Ecosystem Architecture Consulting: Our best-in-class architecture consulting expertise helps customers build optimized analytical ecosystems, leveraging both open source and commercial solutions. |
5
A foundational element of the Teradata strategy is Teradata Everywhere™ which brings together our expanded offerings across cloud and on-premises deployments with a flexible pricing and licensing model to de-risk customer purchase decisions enabling customers to move forward with confidence knowing their investments are protected no matter where or how they deploy in the future.
Through Teradata Everywhere, customers can:
• | Analyze Anything - enables analytic users throughout the organization to use their preferred analytic tools and engines across data sources, at scale; |
• | Deploy Anywhere - provides analytic processing in the Teradata Cloud, in public clouds, as well as on-premises, providing flexibility to change as business needs evolve; |
• | Buy Any Way - allows companies to purchase our software on a subscription-basis as well as on a perpetual basis at different price points; and |
• | Move Anytime - includes software license portability that provides flexibility to run analytics and move their software as needed across deployment options, such as moving from on-premises to cloud. |
In support of our strategy, we continue to optimize our go-to-market and sales approach to improve effectiveness in demand creation and address new and expanded market opportunities, such as with our consultative business solutions and cloud offerings. We will continue investing in partnerships to increase the number of solutions available on Teradata software, maximize customer value, and increase our market coverage.
We believe our consultative business outcome-led approach and our portfolio of offerings that provide customers choice in how they procure and deploy analytics will best position us to be our customers’ trusted advisor and partner of choice for architecting, implementing, and managing their analytic environments.
Our long-term strategic objectives are to:
• | Deliver business outcomes for our customers through analytics at scale, by |
• | Focusing on companies with the largest analytic opportunities, by |
• | Offering market-leading technology, that is enabled by a |
• | World-class go-to-market sales, consulting and support team, with the goal of |
• | Generating recurring revenue, earnings, and cash flow growth. |
Customers. Teradata is focused on both business users and technology buyers at the 500 companies with the largest analytic opportunities. We believe that not only does this segment of the market have the most challenging needs where scale and performance matter, but also where Teradata provides the most business value to the customer. We plan to grow revenue in this market segment by expanding our existing customers' analytical ecosystems as well as adding new customers. We believe that key differentiators for Teradata in this segment include:
• | Proven experience in delivering business outcomes which require complex analytics at scale; |
• | Real-world expertise developing and deploying analytical platforms and ecosystems; and |
• | Leading enterprise-class deployments at large scale. |
We are focused on a broad set of industries, including communications, ecommerce, financial services, government, gaming, healthcare, insurance, manufacturing, media and entertainment, oil and gas, retail, travel and transportation, and utilities. These industries provide a good fit for our analytics solutions and services, as they tend to have the greatest analytic potential, with large and growing data volumes and expanding sources of data, complex data management requirements, or large and varied groups of users.
The extent to which any given customer contributes to our revenues generally varies significantly from year to year and quarter to quarter. Historically, a customer with a large order in one period generated additional revenue for Teradata in subsequent periods as we provide support services and additional capacity as their analytical ecosystem evolves and grows to meet their business requirements. Moreover, Teradata’s revenue can vary considerably from period to period given the different growth and purchasing patterns of our existing customers’ analytical environments as well as the variable timing of new customer orders. Due to the size and complexity of these transactions (purchases), the sales cycle for a new analytic solution is often long (typically more than a year). Historically, our results in any quarter have generally been dependent on our ability to generate a relatively small number of large orders for that quarter. However, we are actively converting customers from perpetual to subscription-based purchasing options, which will result in more ratable revenue recognition and will likely increase the predictability of our revenue.
6
Seasonality. Historically our sales are seasonal, in line with capital spending patterns of our customers, with lower revenue typically in the first quarter and higher revenue generally in the fourth quarter of each calendar year. Such seasonality causes our working capital cash flow requirements to vary from quarter to quarter depending on the variability in the volume, timing and mix of product sales. Typically, cash provided by operating activities is higher in the first half of the year due to collections of the higher receivable balances at December 31 and receipts from annual renewals of our maintenance support agreements. In addition, revenue in the third month of each quarter has historically been significantly higher than in the first and second months. However, we are actively converting customers from perpetual to subscription-based purchasing options, which will likely increase the predictability of our revenue and will over time reduce the seasonal variability. These factors, among others as more fully described in Item 1A, Risk Factors, elsewhere in this Annual Report, make forecasting more difficult and may adversely affect our ability to accurately predict financial results.
Backlog. Our backlog was approximately $1.6 billion at December 31, 2017 and $1.1 billion at December 31, 2016. Approximately $1.1 billion of the backlog at December 31, 2017 is expected to be recognized as revenue in 2018. Backlog includes firm contracts for which work has not been performed or goods have not been delivered. Backlog includes $499 million at December 31, 2017 and $383 million at December 31, 2016 for backlog that that has been invoiced and therefore is included in deferred revenue. Although we believe that the contract value included in backlog is firm, some contracts may include general cancellation for convenience terms that the Company is contractually obligated to perform unless the customer notifies Teradata. Customers typically do not cancel before the end of the contractual term and historically Teradata has seen very little churn in its customer base. Further, we have a historically large portion of our business each quarter generated by orders that are sold and fulfilled within the same reporting period. Therefore, the amount of backlog may not be a meaningful indicator of future results.
Sales, Marketing and Partners
Sales and Marketing. We primarily sell and market our solutions and services through a direct sales force, and have aligned our sales teams to best address the 500 largest analytic opportunities globally. We have approximately 80% of our employees in customer-facing and/or revenue driving roles (including sales, consulting and customer service, and product engineering).
We support our sales force with marketing and training programs which are designed to:
• | Grow awareness, highlighting our technology leadership, differentiation and consulting expertise; |
• | Create demand for our products and services; |
• | Educate the sales force to build skills and knowledge; and, |
• | Provide a robust set of tools for use by our direct sales force. |
We employ a broad range of marketing strategies including programs to inform and educate customers and prospects, the media, industry analysts, academics and other third-party influencers. These strategies include targeted, account-based marketing, our global website, webinars, physical and virtual trade shows and conferences, public and media relations, social media, and an extensive customer reference program.
Strategic Partnerships. We seek to leverage our sales and marketing reach by partnering with leading global and regional systems integrators, independent software vendors, open source software distributors, consultants, and universities which we believe complement our analytic offerings. Strategic partnerships are a key factor in our ability to leverage the value and expand the scope of our analytic offerings in the marketplace.
• | Alliance Partners: Our partner program is focused on working collaboratively with independent software vendors in several areas, including tools, data and application integration solutions, data mining, analytics, business intelligence, specific analytic and industry solutions. Our goal is to provide choices to our customers with partner offerings that are optimized and certified to deliver end-to-end analytic and data solutions, and fit within the customer’s analytic environment. |
• | Systems Integrators: In some cases, we also work with a range of systems integrators and consultants that engage in the design, implementation and integration of analytic solutions and analytic applications for our joint clients. Our strategic partnerships with select global consulting and systems integration firms provide broad industry and technology expertise in the design of business solutions that leverage Teradata technology to enable enterprise analytics. |
7
Competition. We compete in a large and growing market that is attractive to both current and new competitors. Our competition includes new analytics services companies, cloud vendors and open source providers, as well as large traditional competitors, such as IBM, SAP and Oracle. We believe our focus on business outcomes and proven success will enable us to successfully compete with the largest analytic opportunities in the market. Our software is highly differentiated and delivers significant value at scale. This coupled with our ability to deploy across cloud and on-premises options, with flexible purchasing and licensing options, provides our customers the ability to de-risk their buying decisions. Our proven consulting capabilities delivers value to our customers to enable them to be successful in their markets. We believe that our technology, flexibility and consulting will collectively enable us to continue to compete successfully. For more information, see Item 1A, Risk Factors, elsewhere in this Annual Report.
Key factors used to evaluate competitors in these markets include: data and analytics experience; business outcome delivery; hybrid cloud offerings and experience; customer references; technology leadership; product quality; performance, scalability, availability and manageability; support and consulting services capabilities; management of technologies in a complex analytical ecosystem; industry knowledge; and total cost of ownership. We believe we have a competitive advantage in providing complete, integrated, and optimized analytic data platforms and analytic
services that address customers’ business, technical and architecture requirements. Our differentiation is especially strong with customers that have mission critical, complex, large scale environments and requirements.
Research and Development ("R&D"). We remain focused on designing and developing data and analytic technologies that anticipate our customers' evolving needs. As we seek improvements in our products and services, we also consider our customers' current, as well as future needs as we design our new technology so that new generations of the Teradata software and platform technology are compatible with prior generations of our technology. We believe our extensive R&D workforce is one of our core strengths. Our global R&D team is located in multiple facilities around the world to take advantage of global engineering talent. We anticipate that we will continue to have significant R&D expenditures, which may include complementary strategic acquisitions, to help support the flow of innovative, high-quality products, cloud-based offerings, services and applications, which is vital to our leading competitive position. For information regarding the accounting and costs included in R&D activities see “Note 1-Description of Business, Basis of Presentation and Significant Accounting Policies” in the Notes to Consolidated Financial Statements elsewhere in this Annual Report.
Intellectual Property and Technology. The Company owns 684 patents in the U.S. and 38 patents in foreign countries. The foreign patents are generally counterparts of the Company’s U.S. patents. Many of the patents that we own are licensed to others, and we are licensed to use certain patents owned by others. While our portfolio of patents and patent applications in aggregate is of significant value to our Company, we do not believe that any individual patent is by itself of material importance to our business.
In addition, the Company owns copyrights and trade secrets in its vast code base which makes up all of the Teradata software products including analytic data platforms and analytic applications. Teradata’s software products reflect the investment of hundreds of person-years of development work.
The source code versions of our products are protected as trade secrets and, in all major markets, as unpublished copyright works. We also take great efforts to protect our rights in all software products and related intellectual property; however, there can be no assurance that these measures will be successful. The Company owns the Teradata® and Aster® trademarks, which are registered in the U.S. and in many foreign countries, as well as other trade names, service marks, and trademarks.
Sources of Materials. Our hardware components are assembled and configured by Flex Ltd. (“Flex”). Our platform line is designed to leverage the components from industry leaders. Our data storage devices and memory components utilize industry-standard technologies but are selected and configured to work optimally with our software and hardware platform. Flex also procures a wide variety of components used in the assembly process on our behalf. Although many of these components are available from multiple sources, Teradata utilizes preferred supplier relationships to better ensure more consistent quality, cost and delivery. Typically, these preferred suppliers maintain alternative processes and/or facilities to ensure business continuity of supply. Given our strategy to outsource product assembly activities to Flex and to source certain components from single suppliers, a disruption in production at Flex or at a supplier, or a global shortage of components, could impact the timing or profitability of
8
customer shipments. In addition, a significant change in the forecasts to any of these preferred suppliers could result in purchase obligations for components that may be in excess of demand.
Employees. As of December 31, 2017, we had approximately 10,615 employees globally. We believe that our future success will depend, in part, on our ability to continue to attract, hire and retain skilled and experienced personnel.
Properties and Facilities. Our corporate headquarters is currently located in Dayton, Ohio, although our Rancho Bernardo (San Diego), California and Johns Creek (Atlanta), Georgia facilities are also primary locations (within the U.S.). As of December 31, 2017, we operated 112 facilities in 44 countries throughout the world. We own our Rancho Bernardo complex, while all other facilities are leased.
Executive Officers of the Registrant. The following table and biographies sets forth information as of February 23, 2018 regarding the individuals who are serving as our executive officers.
Name | Age | Position(s) |
Victor Lund | 70 | President and Chief Executive Officer |
Mark Culhane | 58 | Executive Vice President and Chief Financial Officer |
Dan Harrington | 54 | Executive Vice President, Customer Support and Services |
Laura Nyquist | 64 | General Counsel and Secretary |
Oliver Ratzesberger | 47 | Chief Operating Officer |
Eric Tom | 60 | Executive Vice President and Chief Revenue Officer |
Suzanne Zoumaras | 54 | Executive Vice President and Chief Human Resources Officer |
Victor Lund. Victor Lund has been the President and Chief Executive Officer of Teradata since May 2016 and has served on the Company’s Board of Directors since 2007. Mr. Lund also served as chair of its Audit Committee from 2007 until May 2016. Previously, Mr. Lund was the non-executive chairman of the board of DemandTec, Inc., a publicly-held, on-demand applications company, from December 2006 until February 2012. Prior to that, Mr. Lund was non-executive chairman of the board of Mariner Health Care, Inc., a long-term health care services company, from 2002 to 2004, and he was vice chairman of Albertson’s, Inc. from 1999 to 2002. He was also chairman of the board of American Stores Company from 1995 until 1999 and its chief executive officer from 1992 until 1999. During his 22-year career with American Stores, Mr. Lund also held many operating executive positions. He also serves as a director of Service Corporation International and has served on a number of publicly-traded company boards, including Del Monte Foods Company and Delta Airlines.
Mark Culhane. Mark Culhane is the Executive Vice President and Chief Financial Officer and has served in this role since joining Teradata in November 2017. He served as the Chief Financial Officer for Lithium Technologies from 2012 to 2016 and as Executive Vice President and Chief Financial Officer at DemandTec from 2001 to 2012. He currently serves on the board of directors of Callidus Software, Inc., a cloud software company and global leader in sales performance management software, where he is the chair of the Audit Committee and on the board of directors of a private cloud-based software company, UserZoom, Inc. From 2016 until November 2017, Mr. Culhane ran Culhane Advisory Services which provided management consulting to several venture and private-equity-backed cloud software companies on go-to-market and financial strategies, financial reporting, supporting and scaling companies for growth, as well as operating as a public company and corporate governance.
Dan Harrington. Dan Harrington is the Executive Vice President, Customer Support and Services, and has served as head of Teradata’s global services organization, including both consulting and support services since 2012, with added responsibility for the international sales region on an interim basis from June 2015 until August 2016. Previously, Mr. Harrington served as Executive Vice President, Technology and Support Services of Teradata from 2007 to 2012. He served as Vice President, Customer Services, Teradata Division of NCR Corporation, from 2005 until 2007. From 1999 to 2004, he was Vice President, Northern Europe, Teradata Division with responsibility for Europe sales. Mr. Harrington joined NCR in 1985 and held a number of positions of increasing responsibility in the areas of sales, marketing and product management.
9
Laura Nyquist. Laura Nyquist is the General Counsel and Secretary of Teradata and has served in this role since joining Teradata in 2007. Ms. Nyquist also had responsibilities for the Company’s human resources organization on an interim basis from May to October 2016. Prior to joining Teradata, Ms. Nyquist held a number of senior management roles at NCR after joining that company in 1986, including Deputy General Counsel and Chief Counsel of NCR’s financial and retail solutions businesses from 2006 to 2007, Chief Counsel, Financial Solutions Division from 2004 to 2006, and Vice President, Corporate Affairs, and Secretary to the NCR Board of Directors from 1999 to 2004.
Oliver Ratzesberger. Oliver Ratzesberger serves as the Chief Operating Officer of Teradata with responsibility for the Company’s operations and strategies for go-to-market, product development and innovation, marketing, and customer support and services. From August 2016 to February 4, 2018, he served as the Executive Vice President and Chief Product Officer with responsibility for the research and development of the Company’s data and analytics solutions. Previously, from June 2015 to August 2016, he was President, Teradata Labs and, from 2013 to June 2015, led the software teams for Teradata Labs. Before joining Teradata, Mr. Ratzesberger served as Vice President, Information Analytics and Innovation at Sears Holdings Corporation from 2011 until 2013. Prior to that, from 2004 until 2011, he was Senior Director, Analytics Platform at eBay, Inc. where he was responsible for their data warehouse and big data platforms. Before joining eBay, Mr. Ratzesberger worked for both Fortune 500 and early-stage companies, holding positions of increasing responsibility in software development and information technology.
Eric Tom. Eric Tom has served as the Company’s Executive Vice President and Chief Revenue Officer since joining Teradata in November 2017. Previously, he served as the Executive Vice President, Global Sales, for International Game Technology from 2012 to 2015, and prior to that held a number of senior management positions including Executive Vice President, North America Sales and Global Services from 2011 to 2012, Chief Operating Officer from 2010 to 2011, and Executive Vice President, North American Sales and Global Marketing from 2009 to 2010. Since 2015, Mr. Tom has served as a business advisor for various start-up companies.
Suzanne Zoumaras. Suzanne Zoumaras is Teradata’s Executive Vice President and Chief Human Resources Officer and has served in this role since joining Teradata in October 2016. Ms. Zoumaras is responsible for the Company’s human capital organization and strategies, including talent acquisition and talent development, rewards and recognition, HR technology, employee engagement and retention, employee communications, and global learning. Most recently, from 2015 until its sale in May 2016, Ms. Zoumaras served as Senior Vice President, Global Human Resources at Atmel Corporation, a $1.2 billion, San Jose, CA-based public company and a leader in the design and manufacture of semiconductors at the center of the Internet of Things. Prior to that, from 2007 to 2015, Ms. Zoumaras was the Senior Vice President, Global Human Resources at Entropic Communications, Inc., a fabless semiconductor company that designed, developed and marketed semiconductor solutions for the connected home. Previously, Ms. Zoumaras held management positions in human resources at several public and private technology and life science companies.
There are no family relationships between any of the executive officers or directors of Teradata.
There are no contractual obligations regarding the election of our executive officers or directors.
Information. Teradata makes available through its website, free of charge, its Annual Report on Form 10-K, Quarterly Reports on Form 10-Q, and Current Reports on Form 8-K, and all amendments to such reports, as soon as reasonably practicable after these reports are electronically filed or furnished to the U.S. Securities and Exchange Commission (“SEC”) pursuant to Section 13(a) or 15(d) of the Securities Exchange Act of 1934 (the “Exchange Act”). These reports and other information are also available, free of charge, at www.sec.gov. Alternatively, the public may read and copy any materials we file with the SEC at the SEC’s Public Reference Room at 100 F Street, N.E., Washington, D.C. 20549. Information on the operation of the Public Reference Room may be obtained by calling the SEC at 1-800-SEC-0330. Teradata will furnish, without charge to a security holder upon written request, the Notice of Meeting and Proxy Statement for the 2017 Annual Meeting of Stockholders. Teradata will furnish the Code of Conduct and any other exhibit at cost (the Code of Conduct is also available through Teradata’s website at http://www.teradata.com/code-of-conduct/). Document requests are available by calling or writing to:
10
Teradata - Shareholder Relations
10000 Innovation Drive
Dayton, OH 45342
Phone: 937-242-4878
Website: http://www.teradata.com
Item 1A. RISK FACTORS
You should carefully consider each of the following risk factors and all of the other information set forth in this Annual Report. Based on the information currently known to us, we believe that the following information identifies the most significant risk factors affecting our company in each of these categories of risks. However, the risks and uncertainties our Company faces are not limited to those set forth in the risk factors described below. Additional risks and uncertainties not presently known to us or that we currently believe to be immaterial may also adversely affect our business.
In addition, past financial performance may not be a reliable indicator of future performance, and historical trends should not be used to anticipate results or trends in future periods.
If any of the following risks and uncertainties develops into actual events or occurrences, these events could have a material adverse effect on our business, financial condition or results of operations. In such case, the trading price of our common stock could decline.
Business Transformation - The failure to realize the anticipated benefits of our business transformation plan and execution of our new strategy including transition to new business focus areas and delivery models, revenue streams, sales structures, and talent management restructuring, and cost rationalization initiatives could adversely impact our business and financial results.
The successful implementation of our business transformation plan to evolve with the market in selling data analytics that enable business outcome-led solutions and change our deployment models presents significant organizational and infrastructure challenges. We may not be able to implement and realize the anticipated benefits from our transformation plan. Events and circumstances, such as financial or unforeseen difficulties, delays and unexpected costs, may occur that could result in our not realizing desired outcomes. Any failure to implement the transformation of the Company in accordance with our expectations could have a material adverse effect on our financial results. Even if the anticipated benefits and savings are substantially realized, there may be consequences, internal control issues, or business impacts that were not expected. Additionally, as a result of our restructuring efforts in connection with our business transformation plan, we may experience a loss of continuity, loss of accumulated knowledge or loss of efficiency during transitional periods. Reorganization and restructuring can require a significant amount of management and other employees' time and focus, which may divert attention from operating activities and growing our business. If we fail to achieve some or all of the expected benefits of these activities, it could have a material adverse effect on our competitive position, business, financial condition, results of operations and cash flows.
As part of our transformation strategy, the Company has released new offerings and new purchase and deployment options, such as software-only, software-as-a-service, and cloud offerings that are based on a subscription pricing model. As a result, during this transformation, our business is shifting from traditional, perpetual pricing and revenue to a subscription-based model in which less revenue is recognized upfront at the time the customer enters into a transaction. The pace and extent to which customers will purchase our products on a subscription basis is unknown and impacts our results of operations. In addition, it is uncertain whether these new offerings and deployment models will prove successful or whether we will be able to develop the necessary business models, infrastructure and systems to support the business. This includes having or hiring the right talent to execute our business strategy. Market acceptance of new product and service offerings will be dependent in part on our ability to include functionality and usability that address customer requirements, and optimally price our products and services to meet customer demand and cover our costs. Our go-to-market strategy also must adjust to customers' changing buying preferences, as well as our new purchase and deployment options, and there can be no assurance that our new go-to-market plans will adequately and completely address such preferences. New product and services offerings may increase our risk of liability and cause us to incur significant technical, legal or other costs. For example, with our cloud-based offerings, market acceptance is affected by a variety of factors, including
11
information security, reliability, performance, the sufficiency of technological infrastructure to support our products and services in certain geographies, customer concerns with entrusting a third party to store and manage its data as well as the customer's ability to access this data once a contract has expired, and consumer concerns regarding data privacy and the enactment of laws or regulations that restrict our ability to provide such services to customers. If we are unable to correctly respond to these issues, our business could be harmed. Additionally, the investments we are making in our consulting business, may not result in additional service revenue or improved sales, as expected, resulting in short term margin erosion as well as lower long term returns on investments.
Competition - The IT industry is intensely competitive and evolving, and competitive pressures could adversely affect our pricing practices or demand for our products and services.
We operate in the intensely competitive IT industry, which is characterized by rapidly changing technology, evolving industry standards and models for consuming and delivering business and IT services, frequent new product introductions, and frequent price and cost reductions. In general, as a participant in the analytic data solutions market, we face:
• | Changes in customer IT spending preferences and other shifts in market demands, which drive changes in the Company's competition; |
• | Continued pressure on price/performance for analytic data platform solutions due to constant technology improvements in processor capacity and speed; |
• | Changes in pricing, marketing and product strategies, such as potential aggressive price discounting and the use of different pricing models by our competitors; |
• | Rapid changes in computing technology and capabilities that challenge our ability to maintain differentiation at the lower range of business intelligence analytic functions; |
• | New and emerging analytic data technologies, competitors, and business models; |
• | Continued emergence of open source software that often rivals current technology offerings at a much lower cost despite its limited functionality; |
• | Rapid changes in product delivery models, such as on-premises solutions versus cloud solutions; |
• | Changing competitive requirements and deliverables in developing and emerging markets; and |
• | Continuing trend toward consolidation of companies, which could adversely affect our ability to compete, including if our key partners merge or partner with our competitors. |
To compete successfully in this environment, we must rapidly and continually design, develop and market solutions and related products and services that are valued in the marketplace. To do this, we must react on a timely basis to shifts in market demands. Our market position depends on our ability to continually improve the delivery models and price/performance of our solutions, while maintaining efficient operations to sustain our competitive operating margins. We must also maintain the quality of our products and services throughout these shifts in market demand. If we are unable to react quickly when and as needed to improve the value of our product offerings our operating results could be negatively impacted.
Our competitors include certain larger companies, such as IBM, Oracle, SAP, and Amazon, which are well-capitalized companies with widespread distribution, brand recognition and penetration of platforms and service offerings. The significant purchasing and market power of these larger competitors, which have greater financial resources than we do, could allow them to surpass our market penetration and marketing efforts to promote and sell their products and services. In addition, many other companies participate in specific areas of our business, such as enterprise applications, analytic data platforms and business intelligence software. In some cases, we may partner with a company in one area of our business and compete with them in another. The status of our business relationships with these companies can influence our ability to compete for analytic data solutions opportunities in such areas. We also expect additional competition from both established and emerging companies. Failure to compete successfully with new or existing competitors in these and other areas could have a material adverse impact on our ability to generate additional revenues or sustain existing revenue levels.
Information Systems and Security - A breach of security, disruption or failure of our information systems or those of our third party providers could adversely impact our business and financial results.
12
Our operations are dependent on our ability to protect our computer equipment and the information stored in our databases (and the computer equipment and database information of certain suppliers and other third parties) from damage by, among other things, earthquake, fire, natural disaster, cyber-attacks, power loss, telecommunications failures, unauthorized intrusions, malicious or unintended insider actions that cause loss of data or loss of systems, including phishing schemes, and other events. Despite our contingency planning, events of this nature may still result in system failures and other interruptions in our operations, which could have a material adverse effect on our business, financial condition or results of operations.
We generally operate pursuant to a business-to-business model, such that our customers buy or lease hardware systems used in connection with our solutions and the customers deploy and operate those solutions. With respect to these kinds of customer on-premises solutions, the customer, directly or through its selected services providers, manages all aspects of the data controls and security with respect to any confidential, private or otherwise sensitive information stored or processed through these solutions, including any personally identifiable data or information - such as non-public data regarding our customers’ employees, customer’s customers, consumers, data subjects, individuals’ identities, individual financial accounts and health information regulated by the Health Insurance Portability and Accountability Act of 1996. However, some of our services, including our software-as-a-service or cloud offerings, may require us to deploy or operate solutions for our customers, directly or through the use of third party services providers, either on-premises at customer-selected data center facilities or at third-party-hosted data center facilities selected by us. With respect to these kinds of cloud and new solution deployment options and operations, we and such service providers have increased roles, responsibilities and risk exposures regarding some or all aspects of the data controls and security with respect to any confidential, private or otherwise sensitive information stored or processed through these solutions on our systems or those of selected third-party providers. If unauthorized access to or use of such information or systems occurs, despite data security measures and third party commitments to protect them, our results of operation, reputation, and relationships with our customers could be adversely impacted.
Additionally, experienced computer programmers, Nation State Sponsored Advanced Persistent Code (“NSSAPC”) attackers (from countries such as Iran, China and certain European Eastern Bloc countries) and hackers may be able to penetrate our network security or that of our third party providers and misappropriate or compromise our intellectual property or other confidential information or that of our customers, create system disruptions or cause shutdowns. Computer programmers and hackers also may be able to develop and deploy viruses, worms, and other malicious software programs that attack our products or otherwise exploit any security vulnerabilities of our products. In addition, phishing-scheme-perpetrators may be able to lure employees or contractors into providing such perpetrators with information that may enable them to avoid some of our network security controls or those of third-party providers which could result in system disruptions or a loss of confidential and proprietary information.
We have reason to believe that at least one attempted NSSAPC cyber-attack occurred against our systems in 2012, although we do not believe that it was successful or that there was any adverse impact to the Company in connection with the incident. Despite the fact that our preventative and remediation tools and actions may have mitigated or preempted this attack, we have since taken additional steps designed to further improve the security of our networks and computer systems; however, there can be no assurance that our defensive measures will be adequate to prevent them in the future. Also, like many other companies, our workstations are regularly subject to penetration attempts and malicious threats by hackers and our employees and contractors are regularly subject to phishing attempts by phishing-scheme-perpetrators. Despite our defensive measures, we may not always be able to detect, mitigate or preempt them all. Breaches of security and disruptions of our information systems have not historically had a material impact on our results of operations and we have no reason to believe that attempts by hackers and phishing-scheme-perpetrators such as those described above have negatively impacted our IT infrastructure, operations, confidential information or intellectual property. However, there is risk that these types of activities will recur and persist, that one or more of them may be successful in the future, that one or more of them may have been or will be successful but not detected, prevented, remediated or mitigated by us, and the costs to us to eliminate, detect, prevent, remediate, mitigate or alleviate cyber or other security problems, viruses, worms, malicious software programs, phishing schemes and security vulnerabilities could be significant, and our efforts to address these problems may not be successful and could adversely impact our future results of operations.
13
Operating Result and Stock Price Fluctuations - Our financial results are subject to fluctuations caused by many factors that could result in our failing to achieve anticipated financial results and adversely affect our stock price.
Our quarterly and annual financial results have varied in the past and are likely to continue to vary in the future due to a number of factors, many of which are beyond our control. In particular, our results have historically been subject to seasonal buying patterns and the timing of transactions in a particular quarter. For example, if transactions that we expect to close by the end of a quarter are not closed until a later date, our revenue and/or net income for that quarter could be substantially below expectations, especially given the large size of our transactions. Although our business is shifting to more subscription-based transactions, it is difficult to predict the pace at which we expect to move to a subscription-based model and we could still see a large portion of our revenues recognized on a perpetual, upfront basis. These and any one or more of the factors listed below or other factors could cause us not to achieve our revenue or profitability expectations. The resulting failure to meet market expectations could cause a decrease in our stock price. These factors include the risks discussed elsewhere in this section and the following:
• | The speed at which customers move to our subscription-based offerings. |
• | Downturns in our customers’ businesses, in the domestic economy or in international economies where our customers do substantial business; |
• | Changes in demand for our products and services, including changes in growth rates in the analytic data solutions market; |
• | The size, timing and contractual terms of large orders for our products and services, which may impact in particular our quarterly operating results (either positively or negatively); |
• | Possible delays in our ability to recognize revenue as the result of contract terms; |
• | The budgeting cycles of our customers and potential customers; |
• | Changes in pricing policies resulting from competitive pressures, such as aggressive price discounting by our competitors, new pricing strategies, or other factors; |
• | Changes in how customers prefer to purchase analytical solutions; |
• | Our ability to develop, and introduce on a timely basis, new or enhanced versions of our products and services; |
• | Changes in the mix of pre-tax earnings attributable to domestic versus international sales; |
• | Future acquisitions and divestitures of technologies, products and businesses; |
• | Unexpected needs for capital expenditures or other unanticipated expenses; and |
• | Changes in certain assumptions, estimates and judgments of management (which are required in connection with the preparation of the Company’s financial statements) that could affect the reported amounts of assets, liabilities, revenues, costs, expenses and the related disclosure of contingent liabilities. |
In addition, fluctuations in seasonal buying patterns can result in lower revenue in the first quarter and higher revenue in the fourth quarter of each year which also causes our working capital cash flow requirements to vary from quarter to quarter depending on the variability in the volume, timing and mix of product sales. Furthermore, revenue in the third month of each quarter has historically been significantly higher than in the first and second months, which further impacts our ability to predict financial results accurately and enhances the enterprise risks inherent in our business. These and other factors make forecasting more difficult and may adversely affect our ability to predict financial results accurately.
All of the above risk factors could negatively impact our revenue or earnings and cause our stock price to decline. Additionally, our results may fail to meet or exceed the expectations of securities analysts and investors, or such analysts may change their recommendation regarding our stock, which could cause our stock price to decline. Our stock price has been, and may continue to be, volatile, which may make it harder for our stockholders to sell their shares at a time or a price that is favorable to them.
International Operations - Generating substantial revenues from our multinational operations poses a number of risks.
14
In 2017, the percentage of our total revenues from outside of the U.S. was 45%. We have exposure to more than 30 functional currencies. We believe that our geographic diversity helps to mitigate some risks associated with geographic concentrations of operations. These risks include adverse changes in foreign currency exchange rates, deteriorating economic environments, business disruptions due to economic or political uncertainties as well as corruption and security risks, including the following risks, among others:
• | General economic and political conditions in each country that could adversely affect demand for our solutions in these markets; |
• | Currency exchange rate fluctuations that could result in lower demand for our offerings as well as generate currency translation losses; |
• | Currency fluctuations can affect margins on sales of our offerings in countries outside of the U.S. and margins on sales of products that include components obtained from suppliers located outside of the U.S.; |
• | The impact of civil and political unrest (relating to war, terrorist activity or other turmoil) on the economy or markets in general, or on our ability, or that of our suppliers, to meet commitments, which may occur in other countries where we have significant operations; |
• | Changes to and compliance with a variety of local laws and regulations that may increase our cost of doing business in these markets or otherwise prevent us from effectively competing in these markets; |
• | Cultural and management challenges with managing new and growing consulting services and engineering functions overseas in developing countries; |
• | Difficulties in staffing and managing our foreign offices and the increased travel, infrastructure and legal and compliance costs associated with multiple international locations; |
• | Longer payment cycles for sales in foreign countries and difficulties in enforcing contracts and collecting accounts receivable; |
• | Tariffs or other restrictions on foreign trade or investment; |
• | Costs and delays associated with developing offerings in multiple languages; |
• | The impact of catastrophic weather or other negative effects of climate change on our facilities, operations and/or workforce, as well as those of our customers, supply chains and distribution channels, throughout the world, particularly those in coastal areas; and |
• | Changing competitive requirements and deliverables in developing and emerging markets. |
Our products are subject to U.S. export controls and, when exported from the U.S., or re-exported to another country, must be authorized under applicable U.S. export regulations. Changes in our products or changes in export regulations may create delays in the introduction of our products in international markets, prevent our customers with international operations from deploying our products throughout their global systems or, in some cases, prevent the export of our products to certain countries or customers altogether. Any change in export regulations or related legislation, shift in approach to the enforcement or scope of existing regulations, or change in the countries, persons or technologies targeted by these regulations could result in decreased use of our products by, or in our decreased ability to export or sell our products to, existing or potential customers with international operations.
There is active enforcement and ongoing focus by the SEC and other governmental authorities on the U.S. Foreign Corrupt Practices Act (“FCPA”), the U.K. Bribery Act of 2010 (the “Bribery Act”) and similar anti-bribery, anti-corruption laws in other countries. Given the breadth and scope of our international operations, we may not be able to detect improper or unlawful conduct by our international partners and employees, despite our high ethics, governance and compliance standards, which could put the Company at risk regarding possible violations of such laws, including the FCPA or the Bribery Act.
Analytic Data Solutions Market-If the overall market for analytic data solutions declines or does not grow, we may generate less revenue, and our business may not be able to sustain and/or grow its current level of operations.
If market pressures result in reduced IT spending, there could be fewer customer transactions, or smaller transactions, or customers delaying investments in our products and services. In the past, we have seen periodic
15
breaks in the buying patterns from some of our larger customers, which indicate a shifting of IT priorities when these customers are still leveraging the investments they have made in their core analytic infrastructures from prior periods. In addition, reduced prices and improvements in analytic data solutions may increase pressure on our product revenues and margins, as well as on the annuity streams we receive from our maintenance business. If the growth rates for the analytic data solutions market decline for any reason, there could be a decrease in demand for our products and services, which could have a material adverse effect on our financial results.
Advancement of Our Solutions - We need to rapidly and successfully develop and introduce new solutions in a competitive, demanding and rapidly changing environment.
To succeed in the intensely competitive IT industry, we must continually improve, refresh and expand our product and service offerings to include newer features, functionality, deployment options, and keep pace with price-to-performance gains in the IT industry. Shortened product life cycles due to customer demands and competitive pressures impact the pace at which we must introduce and implement new technology. This requires a high level of innovation by both our software developers and the suppliers of the third-party software components included in our systems. In addition, bringing new solutions to the market entails a costly and lengthy process, and requires us to accurately anticipate customer needs and technology trends. We must continue to respond to market demands, develop leading technologies and maintain leadership in analytic data solutions performance and scalability, or our business operations may be adversely affected.
We must also anticipate and respond to customer demands regarding the compatibility of our current and prior offerings. These demands could hinder the pace of introducing and implementing new technology. Our future results may be affected if our products cannot effectively interface and perform well with software products of other companies and with our customers’ existing IT infrastructures, or if we are unsuccessful in our efforts to enter into agreements allowing integration of third-party technology with the Teradata database and software platforms. Our efforts to develop the interoperability of our products may require significant investments of capital and employee resources. In addition, many of our principal offerings are used with products offered by third parties and, in the future, some vendors of non-Teradata products may become less willing to provide us with access to their offerings, technical information and marketing and sales support.
As a result of these and other factors, our ability to introduce new or improved solutions could be adversely impacted. There can be no assurance that our innovations will be profitable, and if we cannot successfully market and sell both existing and newly developed solutions, our business and operating results could be impacted. If we were to lose our significant technology advantage, our market share and growth could be adversely affected. In addition, if we are unable to deliver our solutions, features, and functionality as projected, we may be unable to meet our commitments to customers, which could have an adverse effect on our reputation and business.
Open Source Software - The growing market acceptance of open source software and lower cost alternatives present challenges for our industry.
We have developed Teradata's analytic software to work with open source software and alternative platforms and have incorporated other types of open source software into our products, allowing us to enhance certain solutions without incurring substantial additional research and development costs and expand our solution offerings. “Open source” software is made widely available by its authors and is licensed for a nominal fee or, in some cases, at no charge.
Open source licenses typically mandate that proprietary software, when combined in specific ways with open source software, becomes subject to the open source license. We take steps to ensure that our proprietary software is not combined with, or does not incorporate, open source software in ways that would require our proprietary software to be subject to an open source license. However, few courts have interpreted the open source licenses, and the manner in which these licenses may be interpreted and enforced is therefore subject to uncertainty.
Additionally, there are certain open source software applications in the data analytics market that are being offered free of charge or for a nominal fee. Open source software offerings available in the marketplace such as Hadoop and others, can place additional competitive pressure on Teradata, and we may have difficulty in marketing our products to certain customers against available open source options, even though we believe our offerings are unique and provide unparalleled performance and capability and add value through our software enhancements and services.
16
Economic Pressures and Uncertainty - Our business is affected by the global economies in which we operate and the economic climate of the industries we serve.
Our business and results of operations are affected by international, national and regional economic conditions. In particular, the IT industry in which we operate is susceptible to significant changes in the strength of the economy and the financial health of companies and governmental entities that make capital commitments for new technologies. Accordingly, global economic and market conditions, including certain economic sectors (such as retail, manufacturing, financial services or government) may adversely impact our business. For example, adverse changes to the economy could impact the timing of purchases by our current and potential customers or the ability of our customers to fulfill their obligations to us. In addition, decreased or more closely scrutinized capital spending in our customers’ businesses and in the industries, we serve may adversely impact our business. Uncertainty about future economic conditions may make it difficult for us to forecast operating results and to make decisions about future investments. Accordingly, global economic and market conditions may cause material impacts on our results of operations, prospects and financial condition. The Company’s success in periods of economic uncertainty may also be dependent, in part, on our ability to reduce costs in response to changes in demand and other activity.
Legal Contingencies and Regulatory Matters - We face uncertainties with regard to lawsuits, regulations and other related matters.
In the normal course of business, we are subject to proceedings, lawsuits, claims and other matters, including those that relate to the environment, health and safety, employee benefits, export compliance, intellectual property, and other regulatory compliance and general matters. See “Note 8-Commitments and Contingencies” in the Notes to Consolidated Financial Statements elsewhere in this Annual Report. Because such matters are subject to many uncertainties, their outcomes are not predictable. While we believe that amounts provided in our consolidated financial statements are currently adequate in light of the probable and estimable liabilities, there can be no assurances that the amounts required to satisfy alleged liabilities from such matters will not impact future operating results.
In addition, we are subject to diverse and complex laws and regulations, including those relating to corporate governance, public disclosure and reporting, which are rapidly changing and subject to many possible changes in the future. From time to time, we may conduct internal investigations in connection with our efforts to ensure compliance with such laws and regulations, the costs or results of which could impact our financial results. In addition, we may be subject to unexpected costs in connection with new public disclosure or other regulatory requirements that are issued from time to time. Laws and regulations impacting our customers, such as those relating to privacy, data protection and digital marketing, could also impact our future business. Because we do business in the government sector, we are generally subject to audits and investigations which could result in various civil or criminal fines, penalties or administrative sanctions, including debarment from future government business, which could negatively impact the Company’s results of operations or financial condition.
In addition, our facilities and operations, including former facilities and former operations for which we may have liabilities, are subject to a wide range of environmental protection laws. There can be no assurances that the costs required to comply with applicable environmental laws will not adversely impact future operating results.
There is active enforcement and ongoing focus by the SEC and other governmental authorities on the FCPA and the Bribery Act and similar anti-bribery, anti-corruption laws in other countries. Given the breadth and scope of our international operations, we may not be able to detect improper or unlawful conduct by our international partners and employees, despite our high ethics, governance and compliance standards, which could put the Company at risk regarding possible violations of such laws, including the FCPA or the Bribery Act.
Management time and resources are spent to understand and comply with changing laws, regulations and standards relating to such matters as corporate governance, accounting principles, public disclosure, SEC regulations, Basel III and the rules of the New York Stock Exchange (“NYSE”) where our shares are listed. Although we do not believe that recent regulatory and legal initiatives will result in significant changes to our internal practices or our operations, rapid changes in accounting standards, and federal securities laws and regulations, among others, may substantially increase costs to our organization, challenge our ability to timely comply with all of them and could have an impact on our future operating results.
17
Revenue and Margin Mix Variability - Our revenue and margins are variable depending on the mix of products and services in any given period, and changes in the mix of products and services that we sell could materially adversely affect our operating results.
Our business model is based on our anticipated mix of products and services and the corresponding profit margins for such products and services. Unfavorable shifts in such mix could adversely impact our results of operations and require changes to our business model. Consulting services margins are generally lower than the other elements of our analytic data solutions. In addition, when we use third parties to supplement some consulting services we provide to customers, this generally results in lower margin rates. As a result, increases in consulting services revenues as a percentage of our total revenues may decrease overall margins.
In the near term, we expect revenue growth to be impacted as we transition to subscription-based offerings where revenue is recognized over time. This shift has an impact on margins and cash flow as we continue to invest in these new go-to-market offerings, but have less upfront revenue and cash collected than from our traditional perpetual sales.
In addition, we also realize different average selling prices and margins on different versions of our analytic data platforms, as well as certain components we re-sell as part of our solutions, and the mix of such hardware and software varies from quarter to quarter depending on customer requirements. In addition, changes in the price and performance of our analytic data platforms, particularly for certain hardware components, could negatively impact maintenance and support services revenues. Additionally, as we implement part of our business transformation plan and shift from upfront perpetual licenses to recurring over time models for both on-premises and cloud offerings, our revenue mix may be impacted.
Renewal Rates and Support Services - If our existing customers fail to renew or cancel their subscription license arrangements or support agreements, or if customers do not license updates to software products on terms favorable to us, our revenues could be adversely affected.
Teradata’s solution offerings have been expanded to include subscription licenses, rentals, cloud and software-as-a-service options, which impact the timing of when revenues are recognized. Additionally, future revenue streams could be adversely affected if customers do not renew or cancel their subscription licenses, rentals, cloud or software-as-a service arrangements.
In addition, we currently derive a significant portion of our overall revenues from maintenance services and unspecified when-and-if-available software upgrades (collectively referred to as "support"), and we depend on our installed customer base for future revenue from support services. The terms of our standard support arrangements generally provide for the prepayment of first-year support fees and are generally renewable on an annual basis. The IT industry generally has been experiencing increasing pricing pressure from customers when purchasing or renewing support agreements. Mergers and acquisitions in certain industries that we serve could result in a reduction of the software and hardware being supported and put pressure on our support terms with customers who have merged. Given this environment, there can be no assurance that our current customers will renew their support agreements or agree to the same terms when they renew, which could result in our reducing or losing support fees which could adversely impact operating results.
Replacements of older Teradata systems often result in less hardware maintenance revenue since Teradata’s newer hardware is designed to be more powerful, use less energy and require less floor space. As a result, less hardware is needed for the same workload, and therefore less maintenance may be required on the newer generation systems.
Sales Cycle Variations - Unanticipated delays or accelerations in our sales cycles make accurate estimation of our revenues difficult and could result in significant fluctuations in our quarterly operating results.
Although we are beginning to see a shift to customers purchasing subscription-based contracts, we still expect some customers will continue to purchase perpetual licenses. The size, mix and timing of large orders for our products and services varies considerably, which can impact results from quarter to quarter. The process we use to forecast sales and trends in our business relies heavily on estimates of closure on a transaction-specific basis. It is very difficult to predict sales in a particular quarter or over a longer period of time. Unanticipated delays or accelerations in our sales cycles make accurate estimation of our revenues difficult and could result in significant fluctuations in our quarterly operating results, including the pace at which our customers move to the new subscription-based offerings.
18
The length of our sales cycle varies depending on a number of factors over which we may have little or no control, including the size and complexity of a potential transaction, the level of competition that we encounter in our selling activities and our current and potential customers’ internal budgeting and approval process, as well as overall macro-economic conditions. As a result of a generally long sales cycle, we may expend significant effort over a long period of time in an attempt to obtain an order, but ultimately not complete the sale, or the order ultimately received may be smaller than anticipated. Our revenue from different customers varies from quarter to quarter, and a customer with a large order in one quarter may generate significantly lower revenue in subsequent periods. Our results in any particular quarter have generally been dependent on the timing of a relatively small number of large transactions.
Due to resulting fluctuations, we believe that quarter-to-quarter comparisons of our revenue, margins, and operating results may not be meaningful, and that these comparisons may not be an accurate indicator of our future performance.
In addition, the budgeting and IT capital spending cycles of our customers and potential customers make forecasting more difficult and may adversely affect our ability to accurately predict financial results. Spending may be particularly heavy in our fourth quarter because of large enterprise customers placing orders before the expiration of IT budgets tied to that calendar year.
Our operating expense budgets (including such categories as headcount, real estate, and technology resources) are based on projected annual and quarterly revenue levels and are generally incurred ratably throughout each quarter. Since our operating expenses are relatively fixed in the short term, failure to generate projected revenues for a specified period could adversely impact our operating results, reducing net income or causing an operating loss for that period. The deferral or non-occurrence of such sales revenues could adversely affect our operating results for that quarter and could negatively impact our business in future periods.
R&D - We make significant investments in research and development and cannot assure that these investments will be profitable.
As part of our business strategy, we must continue to dedicate a significant amount of resources to our R&D efforts in order to maintain and advance our competitive position, including our initiatives to provide our offerings for cloud environments. However, we may not receive significant revenues from these investments for several years, if at all. Research and development expenses represent a significant portion of our discretionary fixed costs. If we invest in R&D inappropriately, our results of operations could be adversely affected.
Dependence on Key Employees - We depend on key employees and face competition in hiring and retaining qualified employees.
Our employees and access to talent are critical to our success. Our future success depends on our ability to attract and retain the services of senior management and key personnel in all functional areas of our Company, including engineering and development, marketing and sales professionals, and consultants. Competition for highly skilled personnel and acquired talent in the IT industry is intense. No assurance can be made that key personnel will remain with us, and it may be difficult and costly to replace such employees and/or obtain qualified talent who are not employees. Our failure to hire, retain and replace our key personnel could have a material adverse impact on our business operations.
Highly Advanced Products - Our products include highly advanced technology, and as we develop new products with greater capacity and performance capabilities, the increased difficulty and complexity associated with producing these products increases the likelihood of reliability, quality or operability problems.
Our software and hardware products may contain undetected errors or security flaws, which may be found after the products are introduced and shipped. This risk is enhanced when products are first introduced or when new versions are released, as well as when we develop products with more advanced technology, since the increased difficulty and complexity associated with producing these products increases the likelihood of reliability, quality or operability problems. The correction and detection of errors may cause delays, lost revenues and incremental costs. Errors in our software products could also affect the ability of our products to work with other software or hardware products, could delay the development or release of new products or new versions of products, and could adversely affect market acceptance of our products. While we attempt to remedy errors that we believe would be considered critical by our customers prior to shipment, we may not be able to detect or remedy all such errors.
19
Our customers who rely on our solutions for business-critical applications are more sensitive to product errors, which could expose us to product liability, performance and warranty claims, as well as harm our reputation. These and other risks associated with new product and service offerings may have a material adverse impact on our results of operations and future performance.
Product introductions and certain enhancements of existing products by us in future periods may also reduce demand for our existing products or could delay purchases by customers awaiting arrival of our new products. As new or enhanced products are introduced, we must successfully manage the transition from older products.
In the ordinary course of business, we continually evaluate opportunities for new product and service offerings, new markets and new geographic sectors, and development of such opportunities could entail certain business risks which could affect our financial condition. In addition, due to the complexity of many of our offerings, we may not be able to meet customer requirements with respect to consulting services without incurring costs greater than expected levels.
Reliance on Third Parties - Our future results depend in part on our relationships with key suppliers, strategic partners and other third parties.
Our development, marketing and distribution strategies depend in part on our ability to form strategic alliances with third parties that have complementary products, software, services and skills. Our strategic partners include consultants and system integrators, software and technology providers, and indirect channel distributors in certain countries. These relationships create risks beyond our control of our partners changing their business focus, entering into strategic alliance with other companies, being acquired by our competitors, failing to meet performance criteria or improperly using our confidential information. If we fail to maintain or expand our relationships with strategic partners, or if we are forced to seek alternative technology, or technology for new solutions, that may not be available on commercially reasonable terms our business may be adversely affected.
Third-party vendors provide important elements to our solutions; if we do not maintain our relationships with these vendors or if these vendors cease to be going concerns, interruptions in the supply of our products may result. There are some components of our solutions that we purchase from single sources due to price, quality, technology or other reasons. For example, we have relied on Flex as a key single source contract manufacturer for our hardware systems for the last several years. In addition, we buy silicon computer chips and microprocessors from Intel Corporation, and storage disk systems from NetApp, Inc. Some components supplied by third parties may be critical to our solutions, and several of our suppliers may terminate their agreements with us without cause with 180-days notice. If we were unable to purchase necessary services, parts, components or products from a particular vendor and had to find an alternative supplier, our shipments and deliveries could be delayed. Also, disruption in our supply chain or the need to find alternative suppliers could impact the costs and/or timing associated with procuring necessary products, components and services. In either case, our operations could be adversely impacted. Similarly, our suppliers’ products and services have certain dependencies with respect to their own supply chain networks, and supply issues among our suppliers’ suppliers may also adversely impact our business.
In addition, smaller suppliers have operating risks that could impact our business. These risks could create product time delays, inventory and invoicing problems, staging delays, and other operational difficulties. We could also be impacted by their inability to provide high-quality products or services that conform to required specifications or contractual arrangements, which could negatively impact our business and operating results.
Internal Controls - Inadequate internal control over financial reporting and accounting practices could lead to errors, which could adversely impact our ability to assure timely and accurate financial reporting.
Internal control over financial reporting, no matter how well designed and operated, can provide only reasonable, not absolute, assurance that the control objectives will be met. These inherent limitations include system errors, the potential for human error and unauthorized actions of employees or contractors, inadequacy of controls, temporary lapses in controls due to shortfalls in transition planning and oversight or resources, and other factors. Consequently, such controls may not prevent or detect misstatements in our reported financial results as required under SEC and NYSE rules, which could increase our operating costs or impair our ability to operate our business. Controls may also become inadequate due to changes in circumstances, and it is necessary to replace, upgrade or modify our internal information systems from time to time. In addition, unforeseen risks may arise in connection with financial reporting systems due to inefficient business processes, business process reengineering projects, or changes in accounting standards.
20
If management is not successful in maintaining a strong internal control environment, material weaknesses could occur, causing investors to lose confidence in our reported financial information. This could lead to a decline in our stock price, limit our ability to access the capital markets in the future, and require us to incur additional costs to improve our internal control systems and procedures.
Intellectual Property - Inadequate protection of Teradata’s intellectual property or infringement of intellectual property that is owned by others could impact our business and financial condition.
As a technology company, our intellectual property portfolio is crucial to our continuing ability to be a leading analytic solutions provider. We strive to protect and enhance our proprietary intellectual property rights through patent, copyright, trademark and trade secret laws, as well as through technological safeguards. These efforts include protection of the products and application, diagnostic and other software we develop.
To the extent we are not successful our business could be materially adversely impacted. We may be unable to prevent third parties from using our technology without our authorization or independently developing technology that is similar to ours, particularly in those countries where the laws do not protect our proprietary rights as fully as in the U.S. (such as Iran, China and certain European Eastern Bloc countries who may use NSSAPC to advance their own industries). With respect to our pending patent applications, we may not be successful in securing patents for these claims, and our competitors may already have applied for patents that, once issued, will prevail over our patent rights or otherwise limit our ability to sell our products.
While we take steps to provide for confidentiality obligations of employees and third parties with whom we do business (including customers, suppliers and strategic partners), there is a risk that such parties will breach such obligations and jeopardize our intellectual property rights. Many customers have outsourced the administration and management of their data warehouses to third parties, including some of our competitors, who then have access to our confidential information. Although we have agreements in place to mitigate this risk, there can be no assurance that such protections will be sufficient. In addition, our ability to capture and re-use field-based developed intellectual property is important to future business opportunities and margins.
We have seen a trend towards aggressive enforcement of intellectual property rights as the functionality of products in our industry increasingly overlaps and the volume of issued software patents continues to grow. As a result, there is a risk that we could be subject to infringement claims which, regardless of their validity, could:
• | Be expensive, time consuming and divert management attention away from normal business operations; |
• | Require us to pay monetary damages or enter into non-standard royalty and licensing agreements; |
• | Require us to modify our product sales and development plans; or |
• | Require us to satisfy indemnification obligations to our customers. |
Regardless of whether these claims have any merit, they can be burdensome to defend or settle and can harm our business and reputation.
Changing Tax Rates - A change in our effective tax rate can have a significant adverse impact on our business.
A number of factors may adversely impact our future effective tax rates, such as the jurisdictions in which our profits are determined to be earned and taxed; the resolution of issues arising from tax audits with various tax authorities; changes in the valuation of our deferred tax assets and liabilities; adjustments to estimated taxes upon finalization of various tax returns; changes in available tax credits, especially surrounding tax credits in the U.S. for our research and development activities. Tax authorities may disagree with certain positions we have taken and assess additional taxes. We regularly assess the likely outcomes of these audits in order to determine the appropriateness of our tax provision, however, there can be no assurance that we will accurately predict the outcomes of these audits, and the actual outcomes of these audits could have a material impact on our net income or financial condition.
Changes in U.S. or international tax laws or tax rulings could materially impact our effective tax rate. For example, on December 22, 2017 the U.S. government enacted comprehensive tax legislation in the Tax Cuts and Jobs Act (the “Tax Act”), which included broad and complex changes to the way multinational corporations are taxed in the U.S. The legislation is highly complex and unclear in certain respects, and will require interpretations, technical clarifications and/or amendments by the IRS and state tax authorities, which could change the estimates recorded in
21
the fourth quarter of 2017 and our projections of our forward-looking effective tax rate. In addition, unilateral or multi-jurisdictional actions by various countries and organizations such as the Organization for Economic Cooperation and Development, including an increase in tax audit activity in certain jurisdictions to address “base erosion and profit shifting” by multinational companies could also have an adverse impact on our tax liabilities. Although we cannot predict whether or in what form any proposed legislation may pass, if enacted, it could have a material adverse impact on our tax expense and cash flows.
UK Operations - Risks Relating to the Referendum of the United Kingdom’s Membership of the European Union
In June 2016, a majority of voters in the United Kingdom elected to withdraw from the European Union in a national referendum ("Brexit"). In March 2017, the United Kingdom formally notified the European Union of its intention to withdraw and withdrawal negotiations began in June 2017. European Union rules provide for a two-year negotiation period, beginning on the withdrawal notification date, unless an extension is agreed to by the parties. The negotiations between the parties have yet to produce an overall structure for their ongoing relationship following Brexit. We have operations in both the United Kingdom and the European Union. The ongoing uncertainty could negatively impact our competitive position, supplier and customer relationships and financial performance. The ultimate effects of Brexit on us will depend on the specific terms of any agreement the United Kingdom and the European Union reach to provide access to each other’s respective markets.
Acquisitions and Alliances - Our ability to successfully complete and integrate acquisitions and effectively manage alliances may be an important element of future growth.
We are continually evaluating the most effective ways to extend Teradata’s core technology and expand our analytic platforms and solutions to address multiple market segments and solution offerings. From time to time, this includes acquisitions, equity investments or joint ventures. Such transactions entail various risks, including risks associated with:
• | Assimilating and integrating different business operations, corporate cultures, personnel, infrastructure and technologies or products acquired or licensed; |
• | Retaining key employees and maintaining relationships with employees, customers, clients or suppliers of the acquired companies, |
• | Recurring revenue of the acquired company may decline or fail to be renewed; |
• | The potential for unknown liabilities, as well as undetected internal control, compliance or quality issues within the acquired or combined business or additional costs not anticipated at the time of acquisition; |
• | Disruptions of our ongoing business or inability to successfully incorporate acquired products, services or technologies into our solutions and maintain quality; |
• | Failure to achieve the projected synergies after integration of acquired companies or a decline in value of the acquired business and related impairments; |
• | Funding acquisition activities, whether through the use of existing cash reserves, or through the use of debt, and the related impact on our liquidity and financial condition; and |
• | Failure to realize all the economic benefits from these acquisitions, equity investments or joint ventures could result in an impairment of goodwill, intangible assets or other assets, which could result in a significant adverse impact to our results of operations. |
Our strategic partnerships with Amazon and Microsoft for our IntelliCloud offerings on their AWS and Azure public clouds, will require significant upfront investments to ensure that our solutions are optimized in these cloud environments. If we are unsuccessful in meeting performance requirements or obtaining future returns on these investments, our financial results may be adversely impacted. Our operating results may fluctuate as a result of acquisitions and related integration activities, as well as other strategic growth transactions, and there is a risk that our financial results may be adversely affected.
Indebtedness - Our indebtedness could adversely affect our financial condition and limit our financial flexibility.
The Company's indebtedness could:
• | Expose us to interest rate risk since our indebtedness is at variable rates; |
22
• | Increase our vulnerability to general adverse economic and industry conditions; |
• | Limit our ability to obtain additional financing or refinancing at attractive rates; |
• | Require the dedication of a substantial portion of our cash flow from operations to the payment of principal of, and interest on, our indebtedness, thereby reducing the availability of such cash flow to fund our growth strategy, working capital, capital expenditures, share repurchases and other general corporate purposes; |
• | Limit our flexibility in planning for, or reacting to, changes in our business and the industry; and |
• | Place us at a competitive disadvantage relative to our competitors with less debt. |
Further, our outstanding indebtedness is subject to financial and other covenants, which may be affected by changes in economic or business conditions or other events that are beyond our control. If we fail to comply with the covenants under any of our indebtedness, we may be in default under the loan, which may entitle the lenders to accelerate the debt obligations. In order to avoid defaulting on our indebtedness, we may be required to take actions such as reducing or delaying capital expenditures, reducing or eliminating stock repurchases, selling assets, restructuring or refinancing all or part of our existing debt, or seeking additional equity capital, any of which may not be available on terms that are favorable to us, if at all.
Item 1B. | UNRESOLVED STAFF COMMENTS |
None.
Item 2. | PROPERTIES |
As of December 31, 2017, Teradata operated 112 facilities in 44 countries consisting of approximately 1.7 million square feet throughout the world. Approximately 27% of this square footage is owned and the rest is leased. Within the total facility portfolio, Teradata operates 14 research and development facilities totaling approximately 650 thousand square feet, of which approximately 71% is owned. The remaining approximately 1 million square feet of space includes office, repair, warehouse and other miscellaneous sites, and is 100% leased. Teradata believes its facilities are suitable and more than adequate to meet its current needs. Teradata’s corporate headquarters is currently located in Dayton, Ohio.
Item 3. | LEGAL PROCEEDINGS |
Information regarding legal proceedings is included in Item 8 of Part II of this Annual Report as part of “Note 8—Commitments and Contingencies” in the Notes to Consolidated Financial Statements, and is incorporated herein by reference.
Item 4. | MINE SAFETY DISCLOSURES |
N/A.
23
PART II
Item 5. | MARKET FOR THE REGISTRANT’S COMMON EQUITY, RELATED STOCKHOLDER MATTERS AND ISSUER PURCHASES OF EQUITY SECURITIES |
Teradata common stock trades on the New York Stock Exchange under the symbol “TDC.” There were approximately 44,625 registered holders of Teradata common stock as of February 8, 2018. The following table presents the high and low closing per share prices of Teradata common stock traded on the New York Stock Exchange during the calendar quarter indicated.
Common Stock Closing Market Price | |||||||
High | Low | ||||||
2017 | |||||||
Fourth quarter | $ | 39.20 | $ | 32.11 | |||
Third quarter | $ | 33.79 | $ | 28.38 | |||
Second quarter | $ | 32.00 | $ | 27.26 | |||
First quarter | $ | 32.74 | $ | 27.58 | |||
2016 | |||||||
Fourth quarter | $ | 30.63 | $ | 26.42 | |||
Third quarter | $ | 32.62 | $ | 24.78 | |||
Second quarter | $ | 29.05 | $ | 24.40 | |||
First quarter | $ | 27.48 | $ | 22.60 | |||
Teradata has not paid cash dividends and does not anticipate the payment of cash dividends to holders of Teradata common stock in the immediate future. The declaration of dividends in the future would be subject to the discretion of Teradata’s Board of Directors.
The information under the heading “Equity Compensation Plan Information” in Part III Item 12 of this Annual Report on Form 10-K is also incorporated by reference in this section.
24
The following graph compares the relative performance of Teradata stock, the Standard & Poor’s ("S&P") 500 Stock Index and the S&P Information Technology Index. This graph covers the five-year period from December 31, 2012 to December 31, 2017.
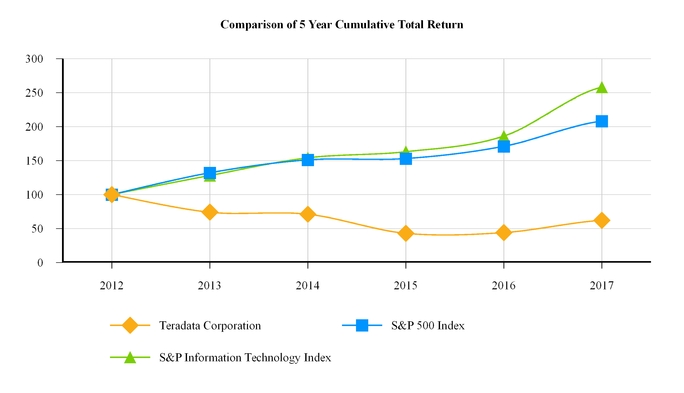
As of December 31, | ||||||||||||||||||||||||
Company/Index | 2012 | 2013 | 2014 | 2015 | 2016 | 2017 | ||||||||||||||||||
Teradata Corporation | $ | 100 | $ | 74 | $ | 71 | $ | 43 | $ | 44 | $ | 62 | ||||||||||||
S&P 500 Index | $ | 100 | $ | 132 | $ | 151 | $ | 153 | $ | 171 | $ | 208 | ||||||||||||
S&P Information Technology Index | $ | 100 | $ | 128 | $ | 154 | $ | 163 | $ | 186 | $ | 258 | ||||||||||||
In each case, assumes a $100 investment on December 31, 2012, and reinvestment of all dividends, if any.
Purchases of Equity Securities by the Issuer and Affiliated Purchases
For the year ended December 31, 2017, the Company executed purchases of approximately 11.5 million shares of its common stock at an average price per share of $30.59 under the two share repurchase programs authorized by our Board of Directors in 2008. The first program (the “dilution offset program”) authorizes the Company to repurchase Teradata common stock to the extent of cash received from the exercise of stock options and under the Teradata Employee Stock Purchase Plan (“ESPP”) to offset dilution from shares issued pursuant to these plans. As of December 31, 2017, the Company had $190 million of authorization remaining to repurchase outstanding shares of Teradata common stock under the Company's second share repurchase program ("general share repurchase program"). On February 5, 2018, Teradata's Board of Directors approved an additional $310 million of authorization, for a total of $500 million for share repurchases, which authority expires on February 5, 2021. Share repurchases made by the Company are reported on a trade date basis.
In addition to the share repurchase programs, Section 16 officers occasionally transfer vested shares earned under restricted stock awards to the Company at the current market price to cover their withholding taxes. For the year ended December 31, 2017, the total of these purchases was 46,017 shares at an average price of $32.37 per share.
The following table provides information relating to the Company’s repurchase of common stock for the year ended December 31, 2017:
25
Total Number of Shares Purchased | Average Price Paid per Share | Total Number of Shares Purchased as Part of Publicly Announced Dilution Offset Program | Total Number of Shares Purchased as Part of Publicly Announced General Share Repurchase Program | Maximum Dollar Value that May Yet Be Purchased Under the Dilution Offset Program | Maximum Dollar Value that May Yet Be Purchased Under the General Share Repurchase Program | |||||||||||||||
Period | ||||||||||||||||||||
First quarter total | 1,386,710 | $ | 31.21 | 536,710 | 850,000 | $ | 4,285,712 | $ | 485,012,249 | |||||||||||
Second quarter total | 3,747,388 | $ | 28.74 | 150,000 | 3,597,388 | $ | 4,143,214 | $ | 381,678,537 | |||||||||||
Third quarter total | 6,346,980 | $ | 31.55 | 281,500 | 6,065,480 | $ | 6,717,747 | $ | 190,109,377 | |||||||||||
October 2017 | — | $ | — | — | — | $ | 8,025,199 | $ | 190,109,377 | |||||||||||
November 2017 | — | $ | — | — | — | $ | 12,939,653 | $ | 190,109,377 | |||||||||||
December 2017 | — | $ | — | — | — | $ | 16,143,982 | $ | 190,109,377 | |||||||||||
Fourth quarter total | — | $ | — | — | — | $ | 16,143,982 | $ | 190,109,377 | |||||||||||
2017 Full year total | 11,481,078 | $ | 30.59 | 968,210 | 10,512,868 | $ | 16,143,982 | $ | 190,109,377 | |||||||||||
Item 6. | SELECTED FINANCIAL DATA |
For the Years Ended December 31 | ||||||||||||||||||||
In millions, except per share and employee amounts | 2017 (1) | 2016 (2) | 2015 (3) | 2014 | 2013 | |||||||||||||||
Revenue | $ | 2,156 | $ | 2,322 | $ | 2,530 | $ | 2,732 | $ | 2,692 | ||||||||||
Income (loss) from operations | $ | 64 | $ | 232 | $ | (195 | ) | $ | 503 | $ | 532 | |||||||||
Other (expense) income, net | $ | (6 | ) | $ | (11 | ) | $ | 51 | $ | (9 | ) | $ | (24 | ) | ||||||
Income tax expense | $ | 125 | $ | 96 | $ | 70 | $ | 127 | $ | 131 | ||||||||||
Net (loss) income | $ | (67 | ) | $ | 125 | $ | (214 | ) | $ | 367 | $ | 377 | ||||||||
Net (loss) income per common share | ||||||||||||||||||||
Basic | $ | (0.53 | ) | $ | 0.96 | $ | (1.53 | ) | $ | 2.36 | $ | 2.31 | ||||||||
Diluted | $ | (0.53 | ) | $ | 0.95 | $ | (1.53 | ) | $ | 2.33 | $ | 2.27 | ||||||||
At December 31 | ||||||||||||||||||||
2017 | 2016 | 2015 | 2014 | 2013 | ||||||||||||||||
Total assets | $ | 2,556 | $ | 2,413 | $ | 2,527 | $ | 3,132 | $ | 3,096 | ||||||||||
Debt, including current portion | $ | 780 | $ | 570 | $ | 780 | $ | 468 | $ | 274 | ||||||||||
Total stockholders’ equity | $ | 668 | $ | 971 | $ | 849 | $ | 1,707 | $ | 1,857 | ||||||||||
Number of employees | 10,615 | 10,093 | 11,300 | 11,500 | 10,800 | |||||||||||||||
1. | Includes $126 million tax impact related to the Tax Cuts and Job Act of 2017 |
2. | Includes $76 million ($70 million after-tax) for impairment of goodwill and acquired intangibles |
3. | Includes $478 million ($457 million after-tax) for impairment of goodwill and acquired intangibles |
26
Item 7. | MANAGEMENT’S DISCUSSION AND ANALYSIS OF FINANCIAL CONDITION AND RESULTS OF OPERATIONS ("MD&A") |
You should read the following discussion in conjunction with the consolidated financial statements and the notes to those statements included elsewhere in this Annual Report on Form 10-K (“Annual Report”). This Annual Report contains certain statements that are forward-looking within the meaning of the Private Securities Litigation Reform Act of 1995. Certain statements contained in the MD&A are forward-looking statements that involve risks and uncertainties. The forward-looking statements are not historical facts, but rather are based on current expectations, estimates, assumptions and projections about our industry, business and future financial results. Our actual results could differ materially from the results contemplated by these forward-looking statements due to several factors, including those discussed in other sections of this Annual Report. See “Risk Factors” and “Forward-looking Statements.”
OVERVIEW
Teradata Corporation is a global leader in analytic data solutions and services. Our analytic data solutions comprise software, hardware, and related business consulting and support services. We help customers access and manage data and extract business value and insight from data analytics across their entire enterprise.
Teradata’s strategy is based around our core belief that analytics and data unleash the potential of great companies allowing them to make better and faster decisions and attain competitive advantage. We empower companies to achieve high-impact business outcomes through analytics at scale on an agile data foundation. Through our focus on leading with business outcomes and a consultative approach, our goal is to serve as a trusted advisor to both the business and technical leaders in our customers’ organizations. Our business analytics solutions and technologies are ideally suited for the world’s largest companies as they have the largest and most complex analytics challenges, where scale and performance of such solutions matter. These large and complex analytics challenges also provide the largest revenue opportunities for Teradata.
Analytical environments are increasing in complexity. There is more choice around analytic tools and technology than ever before, including commercial and open source solutions, as well as on-premises and cloud subscription-based options. As a result, we introduced new purchasing and deployment options with our Teradata Everywhere strategy in early 2017, providing purchasing options for our customers, which includes the ability for customers to purchase Teradata software as a subscription-based license across a range of simpler software bundles at different price points for different use cases. Customer buying behavior continues to move from predominantly capital purchases to these subscription-based purchasing options.
Cloud momentum is also driving new buying and consumption expectations, shifts in data importance or significance, and a move toward hybrid architectures. This trend puts pressure on our on-premises business, however, it opens opportunities for growth within our IntelliCloud offering family, which can be deployed on the Teradata cloud and on public clouds (AWS and Azure). IntelliCloud is a comprehensive as-a-service offering that is purchased with subscription-based pricing. All subscription-based Teradata software licenses enable portability of the software license between cloud and on-premises deployment options, which de-risks customer decisions, particularly for customers with future plans to move to the cloud.
Near term, the movement to subscription-based transactions will negatively impact our revenue as revenue will be recognized over time versus upfront as was the case with the capital purchase model. Over time, the business transition to a subscription-based model is expected to increase our recurring revenue. Near term impacts can fluctuate based on the speed of customer adoption, which can be difficult to predict. Longer term, we expect the year-over-year mix of revenues to normalize as more customers transition to these new purchasing models.
Teradata continues to execute the Company's business transformation plan. We have realigned and continue to optimize our business outcome-led go-to-market approach to improve sales effectiveness relating to our top 500 targeted customer opportunities. We will continue to invest in and prioritize initiatives that strengthen our ability to be our customers’ trusted advisor for data and analytics.
In 2017, we reinvested to support our transformation strategy after significantly reducing our cost structure in 2016. We are continuing to invest for Teradata’s future, including investments to support our cloud-based initiatives, analytical consulting and solutions, realignment of our go-to-market approach, and modernizing our infrastructure.
27
Teradata has introduced additional financial and performance metrics to allow for greater transparency regarding the progress we are making toward achieving our strategic objectives. These metrics will continue to evolve as our business transformation progresses and include the following:
• | TCore - is a metric that tracks a consistent unit of consumption across all of Teradata’s products over the wide variety of configuration and deployment options, both on-premises and in the cloud. It is determined from the number of physical central processing unit ("CPU") cores in a system and adjusted/reduced by the underlying hardware platform's input/output ("I/O") throughput performance capabilities. |
• | Annual Recurring Revenue ("ARR") - is the annual value at a point in time of all recurring contracts, including subscription licenses, rental, cloud, software upgrade rights, and maintenance and excluding managed services. |
• | Recurring Revenue as a Percentage of Total Revenue - revenue recognized in the period from all recurring contracts, including subscription licenses, rental, cloud, software upgrade rights, and maintenance (excluding managed services) divided by total Company revenue. |
• | Bookings Mix - subscription bookings divided by the sum of subscription bookings plus perpetual bookings. |
Recurring revenue is intended to depict the over-time revenue recognition model for these revenue streams. The recurrence of these revenue streams in future periods depends on a number of factors including contractual term periods and customers’ renewal decisions.
2017 FINANCIAL OVERVIEW
As more fully discussed in later sections of this MD&A, the following are the financial highlights for 2017:
• | Revenue decreased 7% in 2017 from 2016 to $2,156 million. The year-over-year revenue comparison was negatively impacted by the sale of the marketing applications business in 2016 as well as revenue from subscription-based transactions being recognized over time versus upfront as was largely the case for Teradata's transactions in 2016. |
• | Gross margin was 47.4% in 2017, down from 51.2% in 2016, which was largely due to investments in our consulting business related to Teradata's transformation and the higher mix of services revenue. |
• | Operating income was $64 million in 2017, down from $232 million in 2016. The year-over-year decrease was primarily due to less revenue in 2017 as a result of revenue recognized over time from subscription-based transactions and investments related to Teradata's transformation. |
• | Net loss of $67 million in 2017 versus net income of $125 million in 2016. Net loss per share was $0.53 in 2017 compared to net income per diluted share of $0.95 in 2016. Net loss for 2017 included a $126 million tax charge due to the enactment of The Tax Cuts and Jobs Act of 2017. Net income for 2016 included a $70 million after-tax impairment loss for goodwill and acquired intangibles, and approximately $47 million in after-tax impacts of acquisition-related transaction, integration and reorganization expenses, and amortization of acquired intangible assets. |
RESULTS FROM OPERATIONS FOR THE YEARS ENDED DECEMBER 31, 2017, 2016 AND 2015
Revenue
% of | % of | % of | ||||||||||||||||||
In millions | 2017 | Revenue | 2016 | Revenue | 2015 | Revenue | ||||||||||||||
Product and Cloud revenue | $ | 747 | 34.6 | % | $ | 923 | 39.8 | % | $ | 1,115 | 44.1 | % | ||||||||
Service revenue | 1,409 | 65.4 | % | 1,399 | 60.2 | % | 1,415 | 55.9 | % | |||||||||||
Total revenue | $ | 2,156 | 100 | % | $ | 2,322 | 100 | % | $ | 2,530 | 100 | % | ||||||||
Total revenue decreased 7% in 2017 as compared to 2016. The revenue decline was primarily due to the sale of the marketing applications business in 2016, which generated $69 million in revenue in 2016, and due to customers increasingly opting for subscription-based licenses, rental of hardware, and cloud adoption. This shift is being propelled by our business transformation strategy and continues to impact our prior period revenue comparisons as
28
some revenue that we would normally recognize in a given period is now spread over a number of years. Product and Cloud revenue decreased 19% in 2017 from 2016 due to the sale of the marketing applications business and customers increasingly opting for our subscription-based purchase options. Service revenue increased 1% in 2017 from 2016. The increase was primarily driven by a 4% increase in maintenance revenue. Consulting revenue was up 1%.
Total revenue decreased 8% in 2016 as compared to 2015. The revenue decrease included a 1% adverse impact from foreign currency fluctuations as well as the sale of the marketing applications business in 2016. The revenue decline was also due to customers increasingly opting for subscription-based licenses, rental of hardware, and cloud offerings. The sale of the marketing applications business, which generated $69 million in revenue in 2016 (before the sale on July 1, 2016) compared to $153 million in 2015, had a negative impact on total revenue of 3%. Product and cloud revenue decreased 17% in 2016 from 2015 primarily due to the sale of the marketing applications business and customers increasingly opting for our subscription-based purchase options. Service revenue decreased 1% in 2016 from 2015, with an underlying 1% decrease in consulting services revenue and 3% increase in maintenance services revenue compared to 2015. Services revenue declined primarily due to the sale of the marketing applications business.
Included below are financial and performance metrics for 2017 that Teradata tracked as part of its business transformation strategy:
• | We had $1,047 million (49% of total revenue) of recurring revenue in 2017, which is 7% growth from $978 million (42% of total revenue) in 2016. |
• | Total ARR at December 31, 2017 was $1.1 billion, an increase of $126 million, or 13% over December 31, 2016. |
• | TCore increased 17% in 2017 in line with our expectations. About one-third of our increase in TCore was booked via subscription-based contracts. |
Gross Profit
The Company often uses specific terms/definitions to describe variances in gross profit. The terms and definitions most often used are as follows:
• | Revenue Mix - The proportion of products and services that generates the total revenue of the Company. Changes in revenue mix can have an impact on gross profit even if total revenue remains unchanged. |
• | Services Mix - The proportion of higher-profit maintenance revenue versus lower-profit consulting revenue that comprises the total services revenue of the Company. |
• | Product Mix - The proportion of various products that generate the total revenue of the Company. For example, a higher mix of data warehouse products versus Hadoop products would have a positive impact on gross profits. This also includes the mix of Company sourced and third-party products. |
• | Deal Mix - Refers to the type of transactions closed within the period and includes such transactions as capacity on demand (“COD”), floor sweeps versus capacity additions, enterprise license agreements ("ELA"), hardware versus software, and discounting (new customers versus existing customers, large customers versus smaller customers). |
◦ | COD is a common offering used by Teradata and other information technology vendors that allows the customer to purchase extra capacity in the future, which is already delivered and integrated into their existing systems, and typically sold within 12-18 months. COD enables customers to "activate" or add capacity quickly. Product cost is recognized upon delivery with no corresponding revenue. When customers activate the COD, we record and recognize the revenue associated with the added capacity and the gross profit is recovered. |
◦ | Floor sweeps take place when an existing customer replaces their older Teradata hardware platform with a new Teradata hardware platform, which can result in a large revenue transaction, but typically also results in a higher mix of lower-profit hardware revenue versus higher-profit software revenue. |
29
◦ | ELA transactions allow customers to add software capacity as needed for current production use for a period of time in exchange for a fixed fee. Additions to capacity during the term of the ELA result in lower-profit hardware-only revenue, as the software is being recognized separately through the ELA. |
Gross profit for the following years ended December 31 was as follows:
% of | % of | % of | ||||||||||||||||||
In millions | 2017 | Revenue | 2016 | Revenue | 2015 | Revenue | ||||||||||||||
Gross profit | ||||||||||||||||||||
Product and Cloud gross profit | $ | 422 | 56.5 | % | $ | 540 | 58.5 | % | $ | 626 | 56.1 | % | ||||||||
Service gross profit | 600 | 42.6 | % | 648 | 46.3 | % | 650 | 45.9 | % | |||||||||||
Total gross profit | $ | 1,022 | 47.4 | % | $ | 1,188 | 51.2 | % | $ | 1,276 | 50.4 | % | ||||||||
In 2017, Product and Cloud gross profit as a percentage of revenue decreased primarily due to the impact of higher capitalized software amortization. Service gross profit as a percentage of revenue decreased largely due to investments we made in our consulting organization to facilitate our new strategy.
In 2016, Product and Cloud profit increased as a percentage of revenue due to favorable deal and product mix. Service gross profit improved as a percentage of revenue driven by the exiting of the marketing applications business, which had a lower service profit rate than the Data and Analytics service rate.
Operating Expenses
% of | % of | % of | ||||||||||||||||||
In millions | 2017 | Revenue | 2016 | Revenue | 2015 | Revenue | ||||||||||||||
Operating expenses | ||||||||||||||||||||
Selling, general and administrative expenses | $ | 652 | 30.2 | % | $ | 664 | 28.6 | % | $ | 765 | 30.2 | % | ||||||||
Research and development expenses | 306 | 14.2 | % | 212 | 9.1 | % | 228 | 9.0 | % | |||||||||||
Impairment of goodwill, acquired intangibles and other assets | — | — | % | 80 | 18.9 | % | 478 | 76.4 | % | |||||||||||
Total operating expenses | $ | 958 | 44.4 | % | $ | 956 | 41.2 | % | $ | 1,471 | 58.1 | % | ||||||||
In 2017, selling, general and administrative ("SG&A") expense decreased by $12 million or 2% compared to 2016. The decrease was driven by the exiting of the marketing applications business. This was partially offset by an increase in marketing spend and regional selling expense due to investments in demand creation, primarily in the Americas region.
Research and development ("R&D") expenses increased $94 million or 44% in 2017 compared to 2016 due the Company no longer capitalizing certain software development costs as a result of a movement to agile development methodologies. The Company did not capitalize any R&D costs in 2017 compared to $59 million in 2016. These development costs are now expensed as incurred as R&D expense. The increase in R&D expense was also due to new strategic initiatives relating to our managed and public cloud offerings.
In 2016, SG&A expense decreased by $101 million or 13% compared to 2015. The decrease is driven by the exiting of the marketing applications business and cost reduction initiatives, partially offset by higher annual incentive payment accruals.
R&D expenses decreased $16 million or 7% in 2016 compared to 2015 due to the exit of the marketing applications business and cost reduction initiatives partially offset by additional spending for strategic initiatives including further investment in our managed and public cloud offerings, Teradata software-only and our IntelliFlex™ platform.
The Company recognized an impairment of goodwill of $57 million and acquired intangibles of $19 million in 2016 to adjust the marketing applications business, which was sold on July 1, 2016, to its fair value less cost to sell. In addition, the Company recorded a $4 million impairment charge related to the sale of its corporate airplane. The
30
Company recorded a goodwill impairment of $437 million and an impairment of acquired intangibles of $41 million in 2015, also related to the marketing applications business.
Other (Expense) Income, net
In millions | 2017 | 2016 | 2015 | ||||||||
Gain on securities | $ | — | $ | 2 | $ | 57 | |||||
Interest income | 11 | 7 | 5 | ||||||||
Interest expense | (15 | ) | (12 | ) | (9 | ) | |||||
Other | (2 | ) | (8 | ) | (2 | ) | |||||
Total Other (Expense) Income, net | $ | (6 | ) | $ | (11 | ) | $ | 51 | |||
In 2017, the increase in interest expense and interest income compared to 2016 was due to an increase in interest rates. Interest expense also increased due to the use of our credit facility.
In 2016, other expense included a foreign exchange loss of $9 million related to the devaluation of the Egyptian pound. The increase in interest expense and interest income compared to 2015 was due to an increase in interest rates. In 2015, other income primarily included a gain of $57 million from sale of equity investments.
Income Taxes
The effective income tax rate for the following years ended December 31 was as follows:
2017 | 2016 | 2015 | ||||||
Effective Tax Rate | 215.5 | % | 43.4 | % | (48.6 | )% | ||
The 2017 effective tax rate was impacted by the passage of the Tax Cuts and Jobs Act of 2017 (the “Tax Act”), which was signed into law on December 22, 2017, making significant changes to the U.S. Internal Revenue Code. Changes include, but are not limited to, a corporate tax rate decrease from 35% to 21% effective for tax years beginning after December 31, 2017; the transition of U.S international taxation from a worldwide tax system to a modified territorial tax system, and a one-time transition tax on the mandatory deemed repatriation of cumulative foreign earnings as of December 31, 2017. On December 22, 2017, Staff Accounting Bulletin No. 118 ("SAB 118") was issued to address the application of U.S. generally accepted accounting principles ("GAAP") in situations when a registrant does not have the necessary information available, prepared, or analyzed (including computations) in reasonable detail to complete the accounting for certain income tax effects of the Tax Act.
In accordance with SAB 118, the Company has made its best estimate of the impact of the Tax Act in its year end income tax provision in accordance with its understanding of the Tax Act and guidance available as of the date of this filing and has recorded a net $126 million of additional income tax expense in the fourth quarter of 2017. The provisional amount related to the one-time transition tax expense of $145 million on the mandatory deemed repatriation of foreign earnings was based on cumulative foreign earnings of $1.3 billion, which the Company expects to pay over an 8-year period. The Company also recorded a provisional benefit of $19 million, a majority of which related to the re-measurement of certain deferred tax assets and liabilities based on the rates at which they are expected to reverse in the future. The ultimate impact may differ materially from these provisional amounts due to, among other things, additional analysis, changes in interpretations and assumptions the Company has made, additional regulatory guidance that may be issued, and actions the Company may take as a result of the Tax Act.
The 2016 effective tax rate was impacted by the $57 million of goodwill impairment charge recorded in the first quarter of 2016, all of which was treated as a permanent non-deductible tax item. In addition, a discrete tax charge of $22 million was recorded in the third quarter of 2016 for the tax impact of the sale of the marketing applications business, which occurred on July 1, 2016. In the fourth quarter of 2016, the Company recorded $8 million of tax expense associated with the issuance of new U.S. Treasury Regulations under Internal Revenue Code Section 987 on December 7, 2016, which clarified how companies calculate foreign currency translation gains and losses for income tax purposes for branches whose accounting records are kept in a currency other than the currency of the company. Also in the fourth quarter of 2016, the Company elected to early adopt Accounting Standards Update 2016-09, Improvements to Employee Share-Based Payment Accounting. As a result, the Company incurred a $5
31
million discrete tax expense associated with the net shortfall arising from 2016 equity compensation vestings and exercises.
The 2015 effective tax rate was impacted by the $437 million of goodwill impairment charges recorded for 2015, of which $414 million was treated as a permanent non-deductible tax item. This resulted in full-year income tax expense in 2015 of $70 million, on a pre-tax net loss of $(144) million, causing a negative tax rate of 48.6%.
Revenue and Gross Profit by Operating Segment
Effective July 1, 2016, following the sale of the marketing applications business, Teradata is managing its business in two operating segments: (1) Americas region (North America and Latin America); and (2) International region (Europe, Middle East, Africa, Asia Pacific and Japan). For purposes of discussing results by segment, management excludes the impact of certain items, consistent with how management evaluates the performance of each segment. This format is useful to investors because it allows analysis and comparability of operating trends. It also includes the same information that is used by Teradata management to make decisions regarding the segments and to assess financial performance. The chief operating decision maker, who is our President and Chief Executive Officer, evaluates the performance of the segments based on revenue and multiple profit measures, including segment gross profit. For management reporting purposes, assets are not allocated to the segments. Our segment results are reconciled to total Company results reported under GAAP in Note 11 of Notes to Consolidated Financial Statements. Prior period segment information has been reclassified to conform to the current period presentation.
The following table presents revenue and operating performance by segment for the years ended December 31:
% of | % of | % of | ||||||||||||||||||
In millions | 2017 | Revenue | 2016 | Revenue | 2015 | Revenue | ||||||||||||||
Segment revenue | ||||||||||||||||||||
Americas Data and Analytics | $ | 1,195 | 55.4 | % | $ | 1,334 | 57.4 | % | $ | 1,470 | 58.2 | % | ||||||||
International Data and Analytics | 961 | 44.6 | % | 919 | 39.6 | % | 907 | 35.8 | % | |||||||||||
Total Data and Analytics | 2,156 | 100.0 | % | 2,253 | 97.0 | % | 2,377 | 94.0 | % | |||||||||||
Marketing Applications | — | — | % | $ | 69 | 3.0 | % | 153 | 6.0 | % | ||||||||||
Total segment revenue | $ | 2,156 | 100 | % | $ | 2,322 | 100 | % | $ | 2,530 | 100 | % | ||||||||
Segment gross profit | ||||||||||||||||||||
Americas Data and Analytics | $ | 676 | 56.6 | % | $ | 796 | 59.7 | % | $ | 871 | 59.3 | % | ||||||||
International Data and Analytics | 434 | 45.2 | % | 445 | 48.4 | % | 452 | 49.8 | % | |||||||||||
Total Data and Analytics | 1,110 | 51.5 | % | 1,241 | 55.1 | % | 1,323 | 55.7 | % | |||||||||||
Marketing Applications | — | — | % | 34 | 49.3 | % | 63 | 41.2 | % | |||||||||||
Total segment gross profit | $ | 1,110 | 51.5 | % | $ | 1,275 | 54.9 | % | $ | 1,386 | 54.8 | % | ||||||||
Americas Data and Analytics: In 2017, revenue decreased 10% as compared to 2016. The revenue decline was driven by our customers' focus on subscription-based contract options like cloud, subscription licenses, rental and usage-based models, which results in revenue being recognized over time instead of upfront. The majority of subscription-based transactions signed in 2017 were in the Americas region. Segment gross profit as a percentage of revenues was lower, driven by a higher mix of services versus product revenue and a lower services margin rate. Service margins were impacted by investments that we are making in our consulting business to drive increased consumption of Teradata's products. In addition, service gross profit was also impacted by a decrease in maintenance margin due to higher support and parts costs.
In 2016, revenue decreased 9%, driven by customers' focus on less subscription-based contract options like cloud, subscription licenses, rental and usage-based models. Segment gross profits as a percentage of revenue were higher driven by an increase in product rates. The increase in the product rate was driven by favorable deal and product mix.
International Data and Analytics: In 2017, revenue increased 5% as compared to 2016. The revenue increase was driven by improved revenues in Europe, Middle East and Africa as well as the Asia Pacific regions. Segment gross profit as a percentage of revenues was down in 2017 driven by investments that we are making in our consulting business to drive increased consumption of Teradata's products.
32
In 2016, revenue increased by 1%, which included a 2% adverse impact from foreign currency fluctuations. The revenue increase was led by growth in Western Europe and China. Gross profits were down due to a higher mix of service revenue, which has a lower margin profile versus product revenue.
Marketing Applications: The marketing applications business was sold on July 1, 2016.
In 2016, marketing applications revenue decreased by $84 million or 55% from 2015. The decline in revenue was driven by the divestiture of the marketing applications business on July 1, 2016. Prior to its divestiture, the overall increase in segment gross profit as a percentage of revenue was primarily driven by higher rates on product and professional services. In 2015, the Company made investments to help better position the Company to go broader in the market, which resulted in lower service rates in 2015.
FINANCIAL CONDITION, LIQUIDITY AND CAPITAL RESOURCES
Teradata ended 2017 with $1,089 million in cash and cash equivalents, a $115 million increase from the December 31, 2016 balance, after using approximately $351 million for repurchases of Company common stock, and approximately $21 million for acquisitions and investment activities which were completed during the year. Cash provided by operating activities decreased by $122 million to $324 million in 2017. The decrease in cash provided by operating activities was primarily due to the company's transition to subscription-based purchasing options as well as investments to support the company's transformation.
Teradata’s management uses a non-GAAP measure called “free cash flow,” which is not a measure defined under GAAP. We define free cash flow as net cash provided by operating activities less capital expenditures for property and equipment, and additions to capitalized software. Free cash flow is one measure of assessing the financial performance of the Company, and this may differ from the definition used by other companies. The components that are used to calculate free cash flow are GAAP measures taken directly from the Consolidated Statements of Cash Flows. We believe that free cash flow information is useful for investors because it relates the operating cash flow of the Company to the capital that is spent to continue and improve business operations. In particular, free cash flow indicates the amount of cash available after capital expenditures for, among other things, investments in the Company’s existing businesses, strategic acquisitions and repurchase of Teradata common stock. Free cash flow does not represent the residual cash flow available for discretionary expenditures since there may be other non-discretionary expenditures that are not deducted from the measure. This non-GAAP measure should not be considered a substitute for, or superior to, cash flows from operating activities under GAAP.
The table below shows net cash provided by operating activities and capital expenditures for the following periods:
In millions | 2017 | 2016 | 2015 | ||||||||
Net cash provided by operating activities | $ | 324 | $ | 446 | $ | 401 | |||||
Less: | |||||||||||
Expenditures for property and equipment | (78 | ) | (53 | ) | (52 | ) | |||||
Additions to capitalized software | (9 | ) | (65 | ) | (68 | ) | |||||
Free cash flow | $ | 237 | $ | 328 | $ | 281 | |||||
Financing activities and certain other investing activities are not included in our calculation of free cash flow. In 2017 and 2016, these other investing activities primarily consisted of immaterial complementary business acquisitions and equity investment activities that were closed during these years along with the sale of the marketing applications business on July 1, 2016.
Teradata’s financing activities for the years ended December 31, 2017 primarily consisted of cash outflows of $351 million for share repurchases, net proceeds of credit facility borrowings of $240 million, repayment of existing term loan of $30 million and $32 million from other financing activities.
Teradata's financing activities for the year ended December 31, 2016 primarily consisted of cash outflows of $82 million for share repurchases, repayments of credit facility borrowings of $180 million, repayment of existing term loan of $30 million and $30 million from other financing activities. The Company purchased 11.5 million shares of its common stock at an average price per share of $30.59 in 2017, 3.4 million shares at an average price per share of $24.25 in 2016, and 19 million shares at an average price per share of $34.15 in 2015.
33
Share repurchases were made under two share repurchase programs initially authorized by our Board of Directors in 2008. The first program (the “dilution offset program”) authorizes the Company to repurchase Teradata common stock to the extent of cash received from the exercise of stock options and the Teradata Employee Stock Purchase Plan (“ESPP”) to offset dilution from shares issued pursuant to these plans. As of December 31, 2017, the Company had $190 million of authorization remaining to repurchase outstanding shares of Teradata common stock under the Company's second share repurchase program ("general share repurchase program"). On February 5, 2018, Teradata's Board of Directors approved an additional $310 million of authorization, for a total of $500 million for share repurchases, which authority expires on February 5, 2021. Share repurchases made by the Company are reported on a trade date basis. Our share repurchase activity depends on factors such as our working capital needs, our cash requirements for capital investments, our stock price, and economic and market conditions, as well as merger and acquisition opportunities. Proceeds from the ESPP and the exercise of stock options, net of tax paid for shares withheld upon equity award settlement, were $32 million in 2017, $31 million in 2016 and $24 million in 2015. These proceeds are included in other financing activities, net in the Consolidated Statements of Cash Flows.
Our total cash and cash equivalents held outside the U.S. in various foreign subsidiaries was $1,044 million as of December 31, 2017 and $957 million as of December 31, 2016. The remaining balance held in the U.S. was $45 million as of December 31, 2017 and $17 million as of December 31, 2016. Prior to the enactment of the Tax Act, the Company either reinvested or intended to reinvest its earnings outside of the U.S. As a result of the 2017 Tax Act, the Company has changed its indefinite reinvestment assertion related to foreign earnings that have been taxed in the U.S. and now considers a majority of these earnings no longer indefinitely reinvested. The Company plans to repatriate a majority of its offshore cash, and intends to use repatriated funds to pay down its revolving credit facility, repurchase shares and retain the remainder for general corporate purposes. Effective in 2018, the U.S. has moved to a territorial system of international taxation, and as such will not subject future foreign earnings to U.S. taxation upon repatriation in future years.
On March 25, 2015, Teradata replaced its existing five-year, $300 million revolving credit facility with a new $400 million revolving credit facility (the “Credit Facility”). The Credit Facility ends on March 25, 2020 at which point any remaining outstanding borrowings would be due for repayment unless extended by agreement of the parties for up to two additional one-year periods. The interest rate charged on borrowings pursuant to the Credit Facility can vary depending on the interest rate option the Company chooses to utilize and the Company’s leverage ratio at the time of the borrowing. In 2017, Teradata chose a floating rate based on the London Interbank Offered Rate (“LIBOR”). The Credit Facility is unsecured and contains certain representations and warranties, conditions, affirmative, negative and financial covenants, and events of default customary for such facilities. As of December 31, 2017, the Company had $240 million in borrowings outstanding under the Credit Facility, which carried an interest rate of 5.0%, leaving $160 million in additional borrowing capacity available. Borrowings under the Credit Facility are reported under current liabilities and are expected to be paid in the short term. The Company was in compliance with all covenants as of December 31, 2017.
Also on March 25, 2015, Teradata closed on a new senior unsecured $600 million five-year term loan, the proceeds of which were used to pay off the remaining $247 million of principal on its existing term loan, pay off the $220 million outstanding balance on the prior credit facility, and fund share repurchases. The $600 million term loan is payable in quarterly installments, which commenced on March 31, 2016, with all remaining principal due in March 2020. The outstanding principal amount under the term loan agreement bears interest at a floating rate based upon a negotiated base rate or a Eurodollar rate plus in each case a margin based on the leverage ratio of the Company. As of December 31, 2017, the term loan principal outstanding was $540 million and carried an interest rate of 3.375%. The Company was in compliance with all covenants as of December 31, 2017.
Management believes current cash, cash flows from operations and the $160 million available under the Credit Facility will be sufficient to satisfy future working capital, research and development activities, capital expenditures, pension contributions, severance benefits and other financing requirements for at least the next twelve months. The Company principally holds its cash and cash equivalents in bank deposits and highly-rated money market funds.
The Company’s ability to generate positive cash flows from operations is dependent on general economic conditions, competitive pressures, and other business and risk factors described elsewhere in this Annual Report. If
34
the Company is unable to generate sufficient cash flows from operations, or otherwise to comply with the terms of the credit facility and term loan agreement, the Company may be required to seek additional financing alternatives.
Contractual and Other Commercial Commitments. In the normal course of business, we enter into various contractual obligations that impact, or could impact, our liquidity. The following table and discussion outlines our material obligations at December 31, 2017, with projected cash payments in the periods shown:
Total | 2019- | 2021- | 2023 and | ||||||||||||||||
In millions | Amounts | 2018 | 2020 | 2022 | Thereafter | ||||||||||||||
Principal payments on long-term debt | $ | 540 | $ | 60 | $ | 480 | $ | — | $ | — | |||||||||
Interest payments on long-term debt | 36 | 18 | 18 | — | — | ||||||||||||||
Principal payments on short-term debt | 240 | 240 | — | — | — | ||||||||||||||
Transition tax | 145 | 18 | 36 | 36 | 55 | ||||||||||||||
Lease obligations | 80 | 27 | 35 | 15 | 3 | ||||||||||||||
Purchase obligations | 30 | 14 | 16 | — | — | ||||||||||||||
Total debt, lease and purchase obligations | $ | 1,071 | $ | 359 | $ | 585 | $ | 51 | $ | 58 | |||||||||
Our principal payments on long-term debt represent the expected cash payments on our $600 million term loan and do not include any fair value adjustments or discounts and premiums. Our interest payments on long-term debt represent the estimated cash interest payments based on the prevailing interest rate as of December 31, 2017. Our principal payments on short-term debt represent the expected cash payment on our $400 million Credit Facility, of which $240 million is currently outstanding and $160 million is available. Transition tax includes one-time tax on accumulated foreign earnings of $145 million. The payments associated with this deemed repatriation will be paid over eight years. Our lease obligations in the above table include Company facilities in various domestic and international locations. Purchase obligations are committed purchase orders and other contractual commitments for goods and services, and include non-cancelable contractual payments for fixed or minimum amounts to be purchased in relation to service agreements with various vendors for ongoing telecommunications, information technology, hosting and other services.
Additionally, the Company has $28 million in total uncertain tax positions recorded as non-current liabilities on its balance sheet as of December 31, 2017. These items are not included in the table of obligations shown above. The settlement period for the non-current income tax liabilities cannot be reasonably estimated as the timing and the amount of the payments, if any, will depend on possible future tax examinations with the various tax authorities. However, it is not expected that any payments will be due within the next 12 months.
We also have product warranties and guarantees to third parties, as well as postemployment and international pension obligations that may affect future cash flow. These items are not included in the table of obligations shown above. The Company is also potentially subject to concentrations of supplier risk. Our hardware components are assembled exclusively by Flex Ltd. (“Flex”). Flex procures a wide variety of components used in the manufacturing process on our behalf. Although many of these components are available from multiple sources, Teradata utilizes preferred supplier relationships to better ensure more consistent quality, cost and delivery. Typically, these preferred suppliers maintain alternative processes and/or facilities to ensure continuity of supply. Given the Company’s strategy to outsource its manufacturing activities to Flex and to source certain components from single suppliers, a disruption in production at Flex or at a supplier could impact the timing of customer shipments and/or Teradata’s operating results. In addition, a significant change in the forecasts to any of these preferred suppliers could result in purchase obligations or components that may be in excess of demand. Product warranties and third-party guarantees are described in detail in “Note 8—Commitments and Contingencies” in the Notes to Consolidated Financial Statements. Postemployment and pension obligations are described in detail in “Note 6—Employee Benefit Plans” in the Notes to Consolidated Financial Statements.
Off-Balance Sheet Arrangements. We do not participate in transactions that generate relationships with unconsolidated entities or financial partnerships, such as entities often referred to as structured finance or special purpose entities, which would have been established for the purpose of facilitating off-balance sheet arrangements or for other contractually narrow or limited purposes.
35
CRITICAL ACCOUNTING POLICIES AND ESTIMATES
Our financial statements are prepared in accordance with GAAP. In connection with the preparation of these financial statements, we are required to make assumptions, estimates and judgments that affect the reported amounts of assets, liabilities, revenues, expenses and the related disclosure of contingent liabilities. These assumptions, estimates and judgments are based on historical experience and assumptions that are believed to be reasonable at the time. However, because future events and their effects cannot be determined with certainty, the determination of estimates requires the exercise of judgment. Our critical accounting policies are those that require assumptions to be made about matters that are highly uncertain. Different estimates could have a material impact on our financial results. Judgments and uncertainties affecting the application of these policies and estimates may result in materially different amounts being reported under different conditions or circumstances. Our management periodically reviews these estimates and assumptions to ensure that our financial statements are presented fairly and are materially correct.
In many cases, the accounting treatment of a particular transaction is specifically dictated by GAAP and does not require significant management judgment in its application. There are also areas in which management’s judgment in selecting among available alternatives would not produce a materially different result. The significant accounting policies and estimates that we believe are the most critical to aid in fully understanding and evaluating our reported financial results are discussed in the paragraphs below. Teradata’s senior management has reviewed these critical accounting policies and related disclosures with the Audit Committee of Teradata’s Board of Directors. For additional information regarding our accounting policies and other disclosures required by GAAP, see “Note 1—Description of Business, Basis of Presentation and Significant Accounting Policies” in the Notes to Consolidated Financial Statements.
Revenue Recognition
The following discussion of our revenue recognition accounting policies is based on the accounting principles that were used to prepare the fiscal year 2017 consolidated financial statements included in this Annual Report on Form 10-K. On January 1, 2018, we adopted ASC Topic 606, Revenue from Contracts with Customers ("ASC 606"). This standard replaces existing revenue recognition rules with a comprehensive revenue measurement and recognition standard and expanded disclosure requirements. Refer to Note 1, of our audited consolidated financial statements included elsewhere in this Annual Report on Form 10-K for discussion of recently issued accounting standards.
Revenue recognition for complex contractual arrangements requires judgment, including a review of specific contracts, past experience, creditworthiness of customers, international laws and other factors. Specifically, complex arrangements with nonstandard terms and conditions may require significant contract interpretation to determine the appropriate accounting. We must also apply judgment in determining all deliverables of the arrangement, and in determining the relative selling price of each deliverable, considering the price charged for each product when sold on a standalone basis, and applicable renewal rates for services. Changes in judgments about these factors could impact the timing and amount of revenue recognized between periods.
The Company reviews the relative selling price on a periodic basis and updates it, when appropriate, to ensure that the practices employed reflect the Company’s recent pricing experience. The Company maintains internal controls over the establishment and updates of these estimates, which includes review and approval by the Company’s management. For the year ended December 31, 2017 there was no material impact to revenue resulting from changes in the relative selling price, nor does the Company expect a material impact from such changes in the near term.
Capitalized Software
Costs incurred in researching and developing a computer software product that will be sold, leased or otherwise marketed are charged to expense until technological feasibility has been established. Technological feasibility is established when planning, designing and initial coding activities that are necessary to establish that the product can be produced to meet its design specifications are complete. In the absence of a detailed program design or for agile development activities, a working model is used to establish technological feasibility. Once technological feasibility is established, all development costs are capitalized until the product is available for general release to customers. Judgment is required in determining when technological feasibility of a product is established. The timing of when various research and development projects become technologically feasible or ready for release can cause
36
fluctuations in the amount of research and development costs that are expensed or capitalized in any given period, thus impacting our reported profitability for that period.
In the fourth quarter of 2016, the Company began moving towards more frequent releases of its products, which significantly shortens the opportunity to capitalize software development costs. Our research and development efforts have become more driven by market requirements and rapidly changing customers' needs. In addition, the Company started applying agile development methodologies to help respond to new technologies and trends. Agile development methodologies are characterized by a more dynamic development process with more frequent and iterative revisions to a product releases' features and functions as the software is being developed. Due to the shorter development cycle and focus on rapid production associated with agile development, the Company did not capitalize any external use software development costs in 2017 periods due to the relatively short duration between the completion of the working model and the point at which a product was ready for general release. Prior capitalized costs will continue to be amortized under the greater of revenue-based or straight-line method over the estimated useful life.
Income Taxes
In accounting for income taxes, we recognize deferred tax assets and liabilities based on the differences between the financial statement carrying amounts and the tax basis of assets and liabilities. The deferred tax assets and liabilities are determined based on the enacted tax rates expected to apply in the periods in which the deferred tax assets or liabilities are expected to be settled or realized.
Prior to the enactment of the Tax Act in December 2017, the Company had not provided for taxes on the undistributed earnings of its foreign subsidiaries as the Company either reinvested or intended to reinvest those earnings outside of the U.S. As a result of the Tax Act, the Company has changed its indefinite reinvestment assertion related to foreign earnings that have been taxed in the U.S. and now considers a majority of these earnings no longer indefinitely reinvested. Additional information and analysis are needed to determine the final amount, if any, of the deferred tax liability considering factors such as whether non-U.S. entities are subject to withholding taxes, have reserve requirements, or have projected working capital and other capital needs in the country where the earnings were generated that would result in a decision to indefinitely reinvest a portion or all their earnings. The Company will disclose the future impact, if any, in the reporting period in which the accounting is completed, which will not exceed one year from the date of enactment of the Tax Act.
We account for uncertainty in income taxes by prescribing thresholds and attributes for the financial statement recognition and measurement of a tax position taken or expected to be taken in a tax return. We may recognize the tax benefit from an uncertain tax position only if it is more likely than not that the tax position will be sustained on examination by the taxing authorities, based on the technical merits of the position. We record any interest and/or penalties related to uncertain tax positions in the income tax expense line on our Consolidated Statements of Income. As of December 31, 2017, the Company has a total of $28 million of unrecognized tax benefits, of which $2 million is included in current taxes payable and $14 million is included in the other liabilities section of the Company’s consolidated balance sheet as a non-current liability. The remaining balance of $12 million of uncertain tax positions relates to certain tax attributes generated by the Company which are netted against the underlying deferred tax assets recorded on the balance sheet.
We regularly review our deferred tax assets for recoverability and establish a valuation allowance if it is more likely than not that some portion or all of a deferred tax asset will not be realized. We recorded $32 million in 2017 and $26 million in 2016 for valuation allowances. Due to a change in tax law enacted in the state of California in the fourth quarter of 2012, the Company established a valuation allowance to partially offset its California R&D tax credit carryforward deferred tax asset, as the Company expects to continue to generate excess California R&D tax credits into the foreseeable future.
Stock-based Compensation
We measure compensation cost for stock awards at fair value and recognize compensation expense over the service period. We utilize pricing models, including the Black-Scholes option pricing model and Monte Carlo simulation model, to estimate the fair value of stock-based compensation at the date of grant. These valuation models require the input of subjective assumptions, including expected volatility and expected term. In addition, we issue performance-based awards that vest only if specific performance conditions are satisfied. The number of shares that
37
will be earned can vary based on actual performance. No shares will vest if the threshold objectives are not met. In the event the objectives are exceeded, additional shares will vest up to a maximum payout. The cost of these awards is expensed over the performance period based upon management’s estimate and analysis of the probability of meeting the performance criteria. Because the actual number of shares to be awarded is not known until the end of the performance period, the actual compensation expense related to these awards could differ from our current expectations. As a result of the adoption of the FASB Accounting Standards Update - Improvements to Employee Share-Based Payment Accounting, effective January 1, 2016, we account for forfeitures as they occur instead of estimating forfeitures at the time of grant and revising those estimates in subsequent periods if actual forfeitures differ from our estimates.
Goodwill and Acquired Intangible Assets
The Company reviews goodwill for impairment annually and whenever events or changes in circumstances indicate the carrying value of goodwill may not be recoverable. The Company tests goodwill by first performing a qualitative analysis to determine if it is more likely than not that the fair value of the reporting unit is below its carrying value. Qualitative factors may include, but are not limited to, economic, market and industry conditions, and overall financial performance of the reporting unit. If the Company determines that it is more likely than not that the fair value of the reporting unit is below its carrying value after assessing these qualitative factors, then the guidance on goodwill impairment requires the company to perform a quantitative impairment test. In this test, the Company compares the fair value of each reporting unit to its carrying value. The Company typically determines the fair value of its reporting units using a weighting of fair values derived from the income and market approaches. Under the income approach, the Company calculates the fair value of a reporting unit based on the present value of estimated future cash flows. The market approach estimates fair value based on market multiples of revenue and earnings derived from comparable companies with similar operating and investment characteristics as the reporting unit. If the fair value of the reporting unit exceeds the carrying value of the net assets assigned to that unit, goodwill is not impaired. If the carrying value of the net assets assigned to the reporting unit exceeds the fair value of the reporting unit, then the company records an impairment loss equal to the difference. Teradata reviewed two reporting units in its 2017 goodwill impairment assessment, as each operating segment was deemed as a reporting unit for purposes of testing. Based on the Company's evaluation and weighting of the events and circumstances that have occurred since the most recent quantitative test, the Company concluded that it was not more likely than not that each reporting unit's fair value was below its carrying value. Therefore, the Company determined that it was not necessary to perform a quantitative goodwill impairment test for the reporting units in 2017. See “Note 3—Goodwill and Acquired Intangible Assets" for additional information.
Determining the fair value of goodwill and acquired intangibles is judgmental in nature and involves the use of significant estimates and assumptions. These estimates and assumptions include revenue growth rates and operating margins used to calculate projected future cash flows, discount rates and future economic and market conditions. The company’s estimates are based upon assumptions believed to be reasonable, but which are inherently uncertain and unpredictable. These valuations require the use of management’s assumptions, which may not reflect unanticipated events and circumstances that may occur.
Pension and Postemployment Benefits
We measure pension and postemployment benefit costs and credits using actuarial valuations. Actuarial assumptions attempt to anticipate future events and are used in calculating the expense and liability relating to these plans. These factors include assumptions we make about interest rates, expected investment return on plan assets, total and involuntary turnover rates, and rates of future compensation increases. In addition, our actuarial consultants also use subjective factors such as withdrawal rates and mortality rates to develop our valuations. We review and update these assumptions on an annual basis at the beginning of each fiscal year. We are required to consider current market conditions, including changes in interest rates, in making these assumptions. The actuarial assumptions that we use may differ materially from actual results due to changing market and economic conditions, higher or lower withdrawal rates, or longer or shorter life spans of participants. These differences may result in a significant impact to the measurement of our pension and postemployment benefit obligations, and to the amount of pension and postemployment benefits expense we have recorded or may record. For example, as of December 31, 2017, a one-half percent increase/decrease in the discount rate would change the projected benefit obligation of our
38
pension plans by approximately $7 million, and a one-half percent increase/decrease in our involuntary turnover assumption would change our postemployment benefit obligation by approximately $10 million.
RECENTLY ISSUED ACCOUNTING PRONOUNCEMENTS
A discussion of recently issued accounting pronouncements is described in “Note 1—Description of Business, Basis of Presentation and Significant Accounting Policies” in the Notes to Consolidated Financial Statements elsewhere in this Annual Report, and we incorporate such discussion by reference.
Item 7A. | QUANTITATIVE AND QUALITATIVE DISCLOSURES ABOUT MARKET RISK |
The Company employs a foreign currency hedging strategy to limit potential losses in earnings or cash flows from adverse foreign currency exchange rate movements. Foreign currency exposures arise from transactions denominated in a currency other than the Company’s functional currency and from foreign denominated revenue and profit translated into U.S. dollars. The primary currencies to which the Company is exposed include the euro, the British pound, the Japanese yen, the Australian dollar, the Canadian dollar and other Asian and South American currencies. Exposures are hedged with foreign currency forward contracts with maturity dates of twelve months or less. The potential loss in fair value at December 31, 2017, for such contracts resulting from a hypothetical 10% adverse change in all foreign currency exchange rates is approximately $2 million. This loss would be mitigated by corresponding gains on the underlying exposures. For additional information regarding the Company’s foreign currency hedging strategy, see “Note 7— Derivative Instruments and Hedging Activities” in the Notes to Consolidated Financial Statements elsewhere in this Annual Report.
39
Item 8. | FINANCIAL STATEMENTS AND SUPPLEMENTARY DATA |
Report of Independent Registered Public Accounting Firm
To the Board of Directors and Stockholders of Teradata Corporation:
Opinions on the Financial Statements and Internal Control over Financial Reporting
We have audited the accompanying consolidated balance sheets of Teradata Corporation and its subsidiaries as of December 31, 2017 and December 31, 2016, and the related consolidated statements of (loss) income, comprehensive (loss) income, changes in stockholders’ equity and cash flows for each of the three years in the period ended December 31, 2017, including the related notes and financial statement schedule listed in the index appearing under Item 15(a)(2) of Teradata Corporation (collectively referred to as the “consolidated financial statements”). We also have audited the Company's internal control over financial reporting as of December 31, 2017, based on criteria established in Internal Control - Integrated Framework (2013) issued by the Committee of Sponsoring Organizations of the Treadway Commission (COSO).
In our opinion, the consolidated financial statements referred to above present fairly, in all material respects, the financial position of the Company as of December 31, 2017 and December 31, 2016, and the results of its operations and its cash flows for each of the three years in the period ended December 31, 2017 in conformity with accounting principles generally accepted in the United States of America. Also in our opinion, the Company maintained, in all material respects, effective internal control over financial reporting as of December 31, 2017, based on criteria established in Internal Control - Integrated Framework (2013) issued by the COSO.
Basis for Opinions
The Company's management is responsible for these consolidated financial statements, for maintaining effective internal control over financial reporting, and for its assessment of the effectiveness of internal control over financial reporting, included in Management's Annual Report on Internal Control over Financial Reporting appearing under Item 9A. Our responsibility is to express opinions on the Company’s consolidated financial statements and on the Company's internal control over financial reporting based on our audits. We are a public accounting firm registered with the Public Company Accounting Oversight Board (United States) ("PCAOB") and are required to be independent with respect to the Company in accordance with the U.S. federal securities laws and the applicable rules and regulations of the Securities and Exchange Commission and the PCAOB.
We conducted our audits in accordance with the standards of the PCAOB. Those standards require that we plan and perform the audits to obtain reasonable assurance about whether the consolidated financial statements are free of material misstatement, whether due to error or fraud, and whether effective internal control over financial reporting was maintained in all material respects.
Our audits of the consolidated financial statements included performing procedures to assess the risks of material misstatement of the consolidated financial statements, whether due to error or fraud, and performing procedures that respond to those risks. Such procedures included examining, on a test basis, evidence regarding the amounts and disclosures in the consolidated financial statements. Our audits also included evaluating the accounting principles used and significant estimates made by management, as well as evaluating the overall presentation of the consolidated financial statements. Our audit of internal control over financial reporting included obtaining an understanding of internal control over financial reporting, assessing the risk that a material weakness exists, and testing and evaluating the design and operating effectiveness of internal control based on the assessed risk. Our audits also included performing such other procedures as we considered necessary in the circumstances. We believe that our audits provide a reasonable basis for our opinions.
Definition and Limitations of Internal Control over Financial Reporting
A company’s internal control over financial reporting is a process designed to provide reasonable assurance regarding the reliability of financial reporting and the preparation of financial statements for external purposes in accordance with generally accepted accounting principles. A company’s internal control over financial reporting includes those policies and procedures that (i) pertain to the maintenance of records that, in reasonable detail, accurately and fairly reflect the transactions and dispositions of the assets of the company; (ii) provide reasonable assurance that transactions are recorded as necessary to permit preparation of financial statements in accordance with generally accepted accounting principles, and that receipts and expenditures of the company are being made only in accordance with authorizations of management and directors of the company; and (iii) provide reasonable assurance regarding prevention or timely detection of unauthorized acquisition, use, or disposition of the company’s assets that could have a material effect on the financial statements.
40
Because of its inherent limitations, internal control over financial reporting may not prevent or detect misstatements. Also, projections of any evaluation of effectiveness to future periods are subject to the risk that controls may become inadequate because of changes in conditions, or that the degree of compliance with the policies or procedures may deteriorate.
/s/ PricewaterhouseCoopers LLP |
Atlanta, GA |
February 23, 2018 |
We have served as the Company’s auditor since 2007.
41
TERADATA CORPORATION
Consolidated Statements of (Loss) Income
In millions, except per share amounts
For the Years Ended December 31 | |||||||||||
2017 | 2016 | 2015 | |||||||||
Revenue | |||||||||||
Product and cloud revenue | $ | 747 | $ | 923 | $ | 1,115 | |||||
Service revenue | 1,409 | 1,399 | 1,415 | ||||||||
Total revenue | 2,156 | 2,322 | 2,530 | ||||||||
Costs and operating expenses | |||||||||||
Cost of product and cloud | 325 | 383 | 489 | ||||||||
Cost of services | 809 | 751 | 765 | ||||||||
Selling, general and administrative expenses | 652 | 664 | 765 | ||||||||
Research and development expenses | 306 | 212 | 228 | ||||||||
Impairment of goodwill, acquired intangibles and other assets | — | 80 | 478 | ||||||||
Total costs and operating expenses | 2,092 | 2,090 | 2,725 | ||||||||
Income (loss) from operations | 64 | 232 | (195 | ) | |||||||
Other (expense) income, net | |||||||||||
Interest expense | (15 | ) | (12 | ) | (9 | ) | |||||
Other income, net | 9 | 1 | 60 | ||||||||
Total other (expense) income, net | (6 | ) | (11 | ) | 51 | ||||||
Income (loss) before income taxes | 58 | 221 | (144 | ) | |||||||
Income tax expense | 125 | 96 | 70 | ||||||||
Net (loss) income | $ | (67 | ) | $ | 125 | $ | (214 | ) | |||
Net (loss) income per common share | |||||||||||
Basic | $ | (0.53 | ) | $ | 0.96 | $ | (1.53 | ) | |||
Diluted | $ | (0.53 | ) | $ | 0.95 | $ | (1.53 | ) | |||
Weighted average common shares outstanding | |||||||||||
Basic | 125.8 | 129.7 | 139.6 | ||||||||
Diluted | 125.8 | 131.5 | 139.6 | ||||||||
The accompanying notes are an integral part of the consolidated financial statements.
42
TERADATA CORPORATION
Consolidated Statements of Comprehensive (Loss) Income
In millions
For the Years Ended December 31 | |||||||||||
2017 | 2016 | 2015 | |||||||||
Net (loss) income | $ | (67 | ) | $ | 125 | $ | (214 | ) | |||
Other comprehensive income (loss): | |||||||||||
Foreign currency translation adjustments | 16 | (7 | ) | (36 | ) | ||||||
Securities: | |||||||||||
Reclassification of gain to net income (loss) | — | — | (26 | ) | |||||||
Unrealized loss on securities, before tax | — | — | (7 | ) | |||||||
Tax impact on securities | — | — | 2 | ||||||||
Net change in securities | — | — | (31 | ) | |||||||
Defined benefit plans: | |||||||||||
Reclassification of loss to net income (loss) | 4 | 3 | 3 | ||||||||
Defined benefit plan adjustment, before tax | (6 | ) | (12 | ) | (9 | ) | |||||
Defined benefit plan adjustment, tax portion | 1 | 3 | 1 | ||||||||
Defined benefit plan adjustment, net of tax | (1 | ) | (6 | ) | (5 | ) | |||||
Other comprehensive income (loss) | 15 | (13 | ) | (72 | ) | ||||||
Comprehensive (loss) income | $ | (52 | ) | $ | 112 | $ | (286 | ) | |||
The accompanying notes are an integral part of the consolidated financial statements.
43
TERADATA CORPORATION
Consolidated Balance Sheets
In millions, except per share amounts
At December 31 | |||||||
2017 | 2016 | ||||||
Assets | |||||||
Current assets | |||||||
Cash and cash equivalents | $ | 1,089 | $ | 974 | |||
Accounts receivable, net | 554 | 548 | |||||
Inventories | 30 | 34 | |||||
Other current assets | 77 | 65 | |||||
Total current assets | 1,750 | 1,621 | |||||
Property and equipment, net | 162 | 138 | |||||
Capitalized software, net | 121 | 187 | |||||
Goodwill | 399 | 390 | |||||
Acquired intangible assets, net | 23 | 11 | |||||
Deferred income taxes | 57 | 49 | |||||
Other assets | 44 | 17 | |||||
Total assets | $ | 2,556 | $ | 2,413 | |||
Liabilities and stockholders’ equity | |||||||
Current liabilities | |||||||
Current portion of long-term debt | $ | 60 | $ | 30 | |||
Short-term borrowings | 240 | — | |||||
Accounts payable | 74 | 103 | |||||
Payroll and benefits liabilities | 173 | 139 | |||||
Deferred revenue | 414 | 369 | |||||
Other current liabilities | 102 | 88 | |||||
Total current liabilities | 1,063 | 729 | |||||
Long-term debt | 478 | 538 | |||||
Pension and other postemployment plan liabilities | 109 | 96 | |||||
Long-term deferred revenue | 85 | 14 | |||||
Deferred tax liabilities | 4 | 33 | |||||
Other liabilities | 149 | 32 | |||||
Total liabilities | 1,888 | 1,442 | |||||
Commitments and contingencies (Note 8) | |||||||
Stockholders’ equity | |||||||
Preferred stock: par value $0.01 per share, 100.0 shares authorized, no shares issued and outstanding at December 31, 2017 and 2016, respectively | — | — | |||||
Common stock: par value $0.01 per share, 500.0 shares authorized, 121.9 and 130.6 shares issued at December 31, 2017 and 2016, respectively | 1 | 1 | |||||
Paid-in capital | 1,320 | 1,220 | |||||
Accumulated deficit | (579 | ) | (161 | ) | |||
Accumulated other comprehensive loss | (74 | ) | (89 | ) | |||
Total stockholders’ equity | 668 | 971 | |||||
Total liabilities and stockholders’ equity | $ | 2,556 | $ | 2,413 | |||
The accompanying notes are an integral part of the consolidated financial statements.
44
TERADATA CORPORATION
Consolidated Statements of Cash Flows
In millions
For the Years Ended December 31 | |||||||||||
2017 | 2016 | 2015 | |||||||||
Operating activities | |||||||||||
Net (loss) income | $ | (67 | ) | $ | 125 | $ | (214 | ) | |||
Adjustments to reconcile net (loss) income to net cash provided by operating activities: | |||||||||||
Depreciation and amortization | 138 | 128 | 170 | ||||||||
Stock-based compensation expense | 68 | 62 | 56 | ||||||||
Excess tax benefit from stock-based compensation | — | — | (2 | ) | |||||||
Deferred income taxes | (34 | ) | (3 | ) | (39 | ) | |||||
Gain on investments | — | (2 | ) | (57 | ) | ||||||
Impairment of goodwill, acquired intangibles and other assets | — | 80 | 478 | ||||||||
Changes in assets and liabilities, net of acquisitions: | |||||||||||
Receivables | (6 | ) | 40 | 1 | |||||||
Inventories | 3 | 14 | (11 | ) | |||||||
Account payables and accrued expenses | 12 | 11 | (8 | ) | |||||||
Deferred revenue | 115 | 1 | 24 | ||||||||
Other assets and liabilities | 95 | (10 | ) | 3 | |||||||
Net cash provided by operating activities | 324 | 446 | 401 | ||||||||
Investing activities | |||||||||||
Expenditures for property and equipment | (78 | ) | (53 | ) | (52 | ) | |||||
Additions to capitalized software | (9 | ) | (65 | ) | (68 | ) | |||||
Proceeds from sales of property and equipment | — | 5 | — | ||||||||
Proceeds from disposition of investments | — | 2 | 85 | ||||||||
Proceeds from sale of business | — | 92 | — | ||||||||
Business acquisitions and other investing activities, net | (21 | ) | (16 | ) | (17 | ) | |||||
Net cash used in investing activities | (108 | ) | (35 | ) | (52 | ) | |||||
Financing activities | |||||||||||
Proceeds from long-term borrowings | — | — | 600 | ||||||||
Repayments of long-term borrowings | (30 | ) | (30 | ) | (247 | ) | |||||
Proceeds from credit facility borrowings | 420 | — | 180 | ||||||||
Repayments of credit-facility borrowings | (180 | ) | (180 | ) | (220 | ) | |||||
Repurchases of common stock | (351 | ) | (82 | ) | (657 | ) | |||||
Excess tax benefit from stock-based compensation | — | — | 2 | ||||||||
Other financing activities, net | 32 | 30 | 18 | ||||||||
Net cash used in financing activities | (109 | ) | (262 | ) | (324 | ) | |||||
Effect of exchange rate changes on cash and cash equivalents | 8 | (14 | ) | (20 | ) | ||||||
Increase in cash and cash equivalents | 115 | 135 | 5 | ||||||||
Cash and cash equivalents at beginning of year | 974 | 839 | 834 | ||||||||
Cash and cash equivalents at end of year | $ | 1,089 | $ | 974 | $ | 839 | |||||
Supplemental data | |||||||||||
Cash paid during the year for: | |||||||||||
Income taxes | $ | 25 | $ | 105 | $ | 98 | |||||
Interest | $ | 14 | $ | 12 | $ | 8 | |||||
The accompanying notes are an integral part of the consolidated financial statements.
45
TERADATA CORPORATION
Consolidated Statements of Changes in Stockholders’ Equity
In millions
Common Stock | Paid-in | Retained Earnings (Accumulated | Accumulated Other Comprehensive | |||||||||||||||||||
Shares | Amount | Capital | Deficit) | Income (Loss) | Total | |||||||||||||||||
December 31, 2014 | 148 | $ | 1 | $ | 1,054 | $ | 656 | $ | (4 | ) | $ | 1,707 | ||||||||||
Net income | (214 | ) | (214 | ) | ||||||||||||||||||
Employee stock compensation, employee stock purchase programs and option exercises | 2 | 78 | 78 | |||||||||||||||||||
Income tax benefit from stock compensation plans | (4 | ) | (4 | ) | ||||||||||||||||||
Repurchases of common stock, retired | (19 | ) | (646 | ) | (646 | ) | ||||||||||||||||
Pension and postemployment benefit plans, net of tax | (5 | ) | (5 | ) | ||||||||||||||||||
Unrealized gain on securities | (31 | ) | (31 | ) | ||||||||||||||||||
Currency translation adjustment | (36 | ) | (36 | ) | ||||||||||||||||||
December 31, 2015 | 131 | $ | 1 | $ | 1,128 | $ | (204 | ) | $ | (76 | ) | $ | 849 | |||||||||
Net loss | 125 | 125 | ||||||||||||||||||||
Employee stock compensation, employee stock purchase programs and option exercises | 3 | 92 | 92 | |||||||||||||||||||
Repurchases of common stock, retired | (3 | ) | (82 | ) | (82 | ) | ||||||||||||||||
Pension and postemployment benefit plans, net of tax | (6 | ) | (6 | ) | ||||||||||||||||||
Currency translation adjustment | (7 | ) | (7 | ) | ||||||||||||||||||
December 31, 2016 | 131 | $ | 1 | $ | 1,220 | $ | (161 | ) | $ | (89 | ) | $ | 971 | |||||||||
Net loss | (67 | ) | (67 | ) | ||||||||||||||||||
Employee stock compensation, employee stock purchase programs and option exercises | 2 | 100 | 100 | |||||||||||||||||||
Repurchases of common stock, retired | (11 | ) | (351 | ) | (351 | ) | ||||||||||||||||
Pension and postemployment benefit plans, net of tax | (1 | ) | (1 | ) | ||||||||||||||||||
Currency translation adjustment | 16 | 16 | ||||||||||||||||||||
December 31, 2017 | 122 | $ | 1 | $ | 1,320 | $ | (579 | ) | $ | (74 | ) | $ | 668 | |||||||||
The accompanying notes are an integral part of the consolidated financial statements.
46
NOTES TO CONSOLIDATED FINANCIAL STATEMENTS
Note 1 Description of Business, Basis of Presentation and Significant Accounting Policies
Description of the Business. Teradata Corporation (“Teradata” or the “Company”) is a global leader in analytic data solutions and services. Our analytic data solutions comprise software, hardware, and related business consulting and support services for analytics across a company’s entire analytical ecosystem.
Basis of Presentation. The financial statements are presented on a consolidated basis and include the accounts of the Company and its wholly-owned subsidiaries in accordance with accounting principles generally accepted in the United States of America (“GAAP”).
Use of Estimates. The preparation of financial statements in conformity with GAAP requires management to make estimates and judgments that affect the reported amounts of assets and liabilities, the disclosure of contingent assets and liabilities at the date of the financial statements, and revenues and expenses during the period reported. On an ongoing basis, management evaluates these estimates and judgments, including those related to allowances for doubtful accounts, the valuation of inventory to net realizable value, impairments of goodwill and other intangibles, stock-based compensation, pension and other postemployment benefits, and income taxes and any changes will be accounted for on a prospective basis. Actual results could differ from those estimates.
Revenue Recognition. Teradata’s solution offerings typically include software, unspecified when-and-if-available software upgrades, hardware, maintenance support services, and other consulting, implementation and installation-related (“consulting”) services. Teradata records revenue when it is realized, or realizable, and earned. Teradata considers these requirements met when:
• | Persuasive evidence of an arrangement exists |
• | The products or services have been delivered to the customer |
• | The sales price is fixed or determinable and free of contingencies or significant uncertainties |
• | Collectibility is reasonably assured |
Teradata reports revenue net of any taxes assessed by governmental authorities that are imposed on and concurrent with specific revenue-producing transactions. The Company assesses whether fees are fixed or determinable at the time of sale. Standard payment terms may vary based on the country in which the agreement is executed, but are generally between 30 days and 90 days. Payments that are due within six months are generally deemed to be fixed or determinable based on a successful collection history on such arrangements, and thereby satisfy the required criteria for revenue recognition. Teradata delivers its solutions primarily through direct sales channels, as well as through alliances with system integrators, other independent software vendors and distributors, and value-added resellers (collectively referred to as “resellers”). In assessing whether the sales price to a reseller is fixed or determinable, the Company considers, among other things, past business practices with the reseller, the reseller’s operating history, payment terms, return rights and the financial wherewithal of the reseller. When Teradata determines that the contract fee to a reseller is not fixed or determinable, that transaction is deferred and recognized upon sell-through to the end customer.
The Company’s deliverables often involve delivery or performance at different periods of time. Revenue for perpetual software is generally recognized upon delivery with the hardware once title and risk of loss have been transferred. Revenue for unspecified software upgrades or enhancements on a when-and-if-available basis are recognized straight-line over the term of the arrangement. Revenue for maintenance support services is also recognized on a straight-line basis over the term of the contract. Revenue for other consulting, implementation and installation services is recognized as services are provided. In certain instances, acceptance of the product or service is specified by the customer. In such cases, revenue is deferred until the acceptance criteria have been met. Delivery and acceptance generally occur in the same reporting period. The Company’s arrangements generally do not include any customer negotiated provisions for cancellation, termination or refunds that would significantly impact recognized revenue.
The Company evaluates all deliverables in an arrangement to determine whether they represent separate units of accounting. A deliverable constitutes a separate unit of accounting when it has standalone value, and if the contract includes a general right of return relative to the delivered item, delivery or performance of the undelivered items is
47
considered probable and substantially in the control of Teradata. Most of the Company’s products and services qualify as separate units of accounting and are recognized upon meeting the criteria as described above.
For multiple deliverable arrangements that contain non-software related deliverables, the Company allocates revenue to each deliverable based upon the relative selling price hierarchy and if software and software-related deliverables are also included in the arrangement, to those deliverables as a group based on the best estimate of selling price (“BESP”) for the group. The selling price for a deliverable is based on its vendor-specific objective evidence of selling price (“VSOE”) if available, third-party evidence of selling price (“TPE”) if VSOE is not available, or BESP if neither VSOE nor TPE is available. The Company then recognizes revenue when the remaining revenue recognition criteria are met for each deliverable. For the software group or arrangements that contain only software and software-related deliverables, the revenue is allocated utilizing the residual or fair value method. Under the residual method, the VSOE of the undelivered elements is deferred and accounted for under the applicable revenue recognition guidance, and the remaining portion of the software arrangement fee is allocated to the delivered elements and is recognized as revenue. The fair value method is similar to the relative selling price method used for non-software deliverables except that the allocation of each deliverable is based on VSOE. For software groups or arrangements that contain only software and software-related deliverables in which VSOE does not exist for each deliverable (fair value method) or does not exist for each undelivered element (residual method), revenue for the entire software arrangement or group is deferred and not recognized until delivery of all elements without VSOE has occurred, unless the only undelivered element is postcontract customer support (“PCS”) in which case the entire software arrangement or group is recognized ratably over the PCS period.
Teradata’s analytic software and hardware products are sold and delivered together in the form of a “Node” of capacity as an integrated technology solution. Because both the analytic software and hardware platform are necessary to deliver the analytic data platform’s essential functionality, the analytic software and hardware (Node) are excluded from the software rules and considered a non-software related deliverable. Teradata software applications and related support are considered software-related deliverables. Additionally, the amount of revenue allocated to the delivered items utilizing the relative selling price or fair value method is limited to the amount that is not contingent upon the delivery of additional items or meeting other specified performance conditions (the non-contingent amount).
VSOE is based upon the normal pricing and discounting practices for those products and services when sold separately. Teradata uses the stated renewal rate approach in establishing VSOE for maintenance and when-and-if-available software upgrades (collectively referred to as PCS). Under this approach, the Company assesses whether the contractually stated renewal rates are substantive and consistent with the Company’s normal pricing practices. Renewal rates greater than the lower level of our targeted pricing ranges are substantive and, therefore, meet the requirements to support VSOE. In instances where there is not a substantive renewal rate in the arrangement, the Company allocates revenue based upon BESP, using the minimum established pricing targets as supported by the renewal rates for similar customers utilizing the bell-curve method. Teradata also offers consulting and installation-related services to its customers, which are considered non-software deliverables if they relate to the nodes. These services are rarely considered essential to the functionality of the analytics solution deliverable and there is never software customization of the proprietary database software. VSOE for consulting services is based on the hourly rates for standalone consulting services projects by geographic region and are indicative of the Company’s customary pricing practices. Pricing in each market is structured to obtain a reasonable margin based on input costs.
In nearly all multiple-deliverable arrangements, the Company is unable to establish VSOE for all deliverables in the arrangement. This is due to infrequently selling each deliverable separately (such is the case with our nodes), not pricing products or services within a narrow range, or only having a limited sales history. When VSOE cannot be established, attempts are made to establish TPE of the selling price for each deliverable. TPE is determined based on competitor prices for similar deliverables when sold separately. However, Teradata’s offerings contain significant differentiation such that the comparable pricing of products with similar functionality cannot typically be obtained. This is because Teradata’s products contain a significant amount of proprietary technology and its solutions offer substantially different features and functionality than other available products. As Teradata’s products are significantly different from those of its competitors, the Company is unable to establish TPE for the vast majority of its products.
When the Company is unable to establish selling prices using VSOE or TPE, the Company uses BESP in its allocation of arrangement consideration. The objective of BESP is to determine the price at which the Company
48
would transact a sale if the product or service was sold on a standalone basis. The Company determines BESP for a product or service by considering multiple factors including, but not limited to, geographies, market conditions, product life cycles, competitive landscape, internal costs, gross margin objectives, purchase volumes and pricing practices.
The primary consideration in developing BESP for the Company’s nodes is the bell-curve method based on historical transactions. The BESP analysis is at the geography level to align it with the way in which the Company goes to market and establishes pricing for its products. The Company has established discount ranges off published list prices for different geographies based on strategy and maturity of Teradata’s presence in the respective geography. There are distinctions in each geography and product group which support the use of geographies and markets for the determination of BESP. For example, the Company’s U.S. market is relatively mature and most of the large transactions are captured in this market, whereas the International markets are less mature with generally smaller deal size. Additionally, the prices and margins for the Company’s products vary by geography and by product class. BESP is analyzed on a semi-annual basis using data from the four previous quarters, which the Company believes best reflects most recent pricing practices in a changing marketplace.
The Company reviews VSOE, TPE and its determination of BESP on a periodic basis and updates it, when appropriate, to ensure that the practices employed reflect the Company’s recent pricing experience. The Company maintains internal controls over the establishment and updates of these estimates, which includes review and approval by the Company’s management. For the year ended December 31, 2017 there was no material impact to revenue resulting from changes in VSOE, TPE or BESP.
Teradata’s new go-to-market offerings introduced in the second half of 2016, which are part of the overall business transformation strategy, include the following offerings:
• | Subscription license - Teradata’s subscription licenses include a right-to-use license and are typically sold with PCS. The revenue for these arrangements is typically recognized ratably over the contract term. The term of these arrangements varies between one and five years. |
• | Cloud - These arrangements include a right-to-access software license that the customer does not have a right to take possession of without significant penalty during the hosting period and the services can be delivered through a managed or public cloud. These arrangements are recognized outside the software rules and revenue is recognized ratably over the contract term. The term of these arrangements typically varies between one and five years. |
• | Rentals - Teradata owns the equipment and may or may not provide managed services. The revenue for these arrangements is generally recognized straight-line over the term of the contract. The term of these arrangements typically varies between one and three years and are generally accounted for as operating leases. |
• | Service model - Teradata owns the equipment to provide the service on-premises. Service models typically include a minimum fixed amount that is recognized ratably over the contract term and may include an elastic amount for usage above the minimum, which is recognized monthly based on actual utilization. The term of these arrangements varies between one and five years. |
Shipping and Handling. Product shipping and handling costs are included in cost of products in the Consolidated Statements of (Loss) Income.
Cash and Cash Equivalents. All short-term, highly-liquid investments having original maturities of three months or less are considered to be cash equivalents.
Allowance for Doubtful Accounts. Teradata establishes provisions for doubtful accounts using both percentages of accounts receivable balances to reflect historical average credit losses and specific provisions for known issues.
Inventories. Inventories are stated at the lower of cost or market. Cost of service parts is determined using the average cost method. Finished goods inventory is determined using actual cost.
Available-for-sale Securities. Available-for-sale securities are reported at fair value. Unrealized holding gains and losses are excluded from earnings and reported in other comprehensive (loss) income. Realized gains and losses are included in other income and expense in the Consolidated Statements of (Loss) Income.
49
Long-Lived Assets
Property and Equipment. Property and equipment, leasehold improvements and rental equipment are stated at cost less accumulated depreciation. Depreciation is computed over the estimated useful lives of the related assets primarily on a straight-line basis. Equipment is depreciated over 3 to 20 years and buildings over 25 to 45 years. Leasehold improvements are depreciated over the life of the lease or the asset, whichever is shorter. Total depreciation expense on the Company’s property and equipment for December 31 was as follows:
In millions | 2017 | 2016 | 2015 | ||||||||
Depreciation expense | $ | 55 | $ | 49 | $ | 53 | |||||
Capitalized Software. Direct development costs associated with internal-use software are capitalized and amortized over the estimated useful lives of the resulting software. The costs are capitalized when both the preliminary project stage is completed and it is probable that computer software being developed will be completed and placed in service. Teradata typically amortizes capitalized internal-use software on a straight-line basis over three years beginning when the asset is substantially ready for use.
Costs incurred for the development of analytic applications are expensed as incurred based on the frequency and agile nature of development. Prior to December 31, 2016, costs incurred for the development of analytic database software that will be sold, leased or otherwise marketed were capitalized between technological feasibility and the point at which a product was ready for general release. Technological feasibility is established when planning, designing and initial coding activities that are necessary to establish the product can be produced to meet its design specifications are complete. In the absence of a program design, a working model is used to establish technological feasibility. These costs are included within capitalized software and are amortized over the estimated useful lives of four years using the greater of the ratio that current gross revenues for a product bear to the total of current and anticipated future gross revenues for that product or the straight-line method over the remaining estimated economic life of the product beginning when the product is available for general release. Costs capitalized include direct labor and related overhead costs. Costs incurred prior to technological feasibility and after general release are expensed as incurred.
Our research and development efforts have recently become more driven by market requirements and rapidly changing customers' needs. In addition, the Company started applying agile development methodologies to help respond to new technologies and trends. Agile development methodologies are characterized by a more dynamic development process with more frequent and iterative revisions to a product release features and functions as the software is being developed. Due to the shorter development cycle and focus on rapid production associated with agile development, the Company did not capitalize any amounts for external-use software development costs in 2017 due to the relatively short duration between the completion of the working model and the point at which a product is ready for general release. Prior capitalized costs will continue to be amortized under the greater of revenue-based or straight-line method over the estimated useful life.
The following table identifies the activity relating to capitalized software:
Internal-use Software | External-use Software | ||||||||||||||||||||||
In millions | 2017 | 2016 | 2015 | 2017 | 2016 | 2015 | |||||||||||||||||
Beginning balance at January 1 | $ | 13 | $ | 13 | $ | 13 | $ | 174 | $ | 177 | $ | 186 | |||||||||||
Capitalized | 9 | 6 | 6 | — | 59 | 61 | |||||||||||||||||
Amortization | (6 | ) | (6 | ) | (6 | ) | (69 | ) | (62 | ) | (70 | ) | |||||||||||
Ending balance at December 31 | $ | 16 | $ | 13 | $ | 13 | $ | 105 | $ | 174 | $ | 177 | |||||||||||
The aggregate amortization expense (actual and estimated) for internal-use and external-use software for the following periods is:
Actual | For the years ended (estimated) | ||||||||||||||||||||||
In millions | 2017 | 2018 | 2019 | 2020 | 2021 | 2022 | |||||||||||||||||
Internal-use software amortization expense | $ | 6 | $ | 7 | $ | 7 | $ | 7 | $ | 7 | $ | 6 | |||||||||||
External-use software amortization expense | $ | 69 | $ | 49 | $ | 34 | $ | 22 | $ | — | $ | — | |||||||||||
50
Estimated expense, which is recorded to cost of sales for external use software, is based on capitalized software at December 31, 2017 and does not include any new capitalization for future periods.
Valuation of Long-Lived Assets. Long-lived assets such as property and equipment, acquired intangible assets and internal capitalized software are reviewed for impairment when events or changes in circumstances indicate that the carrying amount of the assets may not be recoverable. An impairment loss would be recognized when estimated future undiscounted cash flows expected to result from the use of the asset and its eventual disposition are less than the carrying amount. No impairment was recognized during 2017.
Goodwill. Goodwill represents the excess of the purchase price in a business combination over the fair value of net tangible and intangible assets acquired. Goodwill amounts are not amortized, but rather are tested for impairment annually or upon occurrence of an event or change in circumstances that would more likely than not reduce the fair value of a reporting unit below its carrying amount. See Note 3 - Goodwill and Acquired Intangibles for additional information.
Warranty. Provisions for product warranties are recorded in the period in which the related revenue is recognized. The Company accrues warranty reserves using percentages of revenue to reflect the Company’s historical average warranty claims.
Research and Development Costs. Research and development costs are expensed as incurred (except for the capitalized software development costs discussed above). Research and development costs primarily include labor-related costs, contractor fees, and overhead expenses directly related to research and development support.
Pension and Postemployment Benefits. The Company accounts for its pension and postemployment benefit obligations using actuarial models. The measurement of plan obligations was made as of December 31, 2017. Liabilities are computed using the projected unit credit method. The objective under this method is to expense each participant’s benefits under the plan as they accrue, taking into consideration salary increases and the plan’s benefit allocation formula. Thus, the total pension or postemployment benefit to which each participant is expected to become entitled is broken down into units, each associated with a year of past or future credited service.
The Company recognizes the funded status of its pension and postemployment plan obligations in its consolidated balance sheet and records in other comprehensive income certain gains and losses that arise during the period, but are deferred under pension and postemployment accounting rules.
Foreign Currency. Assets and liabilities of non-U.S. subsidiaries that operate in a local currency environment are translated into U.S. dollars at period-end exchange rates. Income and expense accounts are translated at daily exchange rates prevailing during the period. Adjustments arising from the translation are included in accumulated other comprehensive income, a separate component of stockholders’ equity. Gains and losses resulting from foreign currency transactions are included in determining net income.
Income Taxes. Income tax expense is provided based on income before income taxes in the various jurisdictions in which the Company conducts its business. Deferred income taxes reflect the impact of temporary differences between assets and liabilities recognized for financial reporting purposes and such amounts recognized for tax purposes. These deferred taxes are determined based on the enacted tax rates expected to apply in the periods in which the deferred assets or liabilities are expected to be settled or realized. For the Global Intangible Low-Taxed Income (“GILTI”) provisions of the Tax Act, a provisional estimate could not be made as the Company has not yet completed its assessment of or elected an accounting policy to either recognize deferred taxes for basis differences expected to reverse as GILTI or to record GILTI as period costs if and when incurred. In accordance with SEC guidance, provisional amounts may be refined as a result of additional guidance from, and interpretations by, U.S. regulatory and standard-setting bodies and changes in assumptions. Teradata recognizes tax benefits from uncertain tax positions only if it is more likely than not the tax position will be sustained on examination by taxing authorities, based on the technical merits of the position. The Company records valuation allowances related to its deferred income tax assets when it is more likely than not that some portion or all of the deferred income tax assets will not be realized.
Stock-based Compensation. Stock-based payments to employees, including grants of stock options, restricted shares and restricted share units, are recognized in the financial statements based on their fair value. The fair value of each stock option award on the grant date is estimated using the Black-Scholes option-pricing model with the following assumptions: expected dividend yield, expected stock price volatility, weighted-average risk-free interest
51
rate and weighted average expected term of the options. The Company’s expected volatility assumption used in the Black-Scholes option-pricing model is based on Teradata's historical volatility. The expected term for options granted is based upon historical observation of actual time elapsed between date of grant and exercise of options for all employees. The risk-free interest rate used in the Black-Scholes model is based on the implied yield curve available on U.S. Treasury issues at the date of grant with a remaining term equal to the Company’s expected term assumption. The Company has never declared or paid a cash dividend.
Earnings (Loss) Per Share. Basic earnings (loss) per share is calculated by dividing net income (loss) by the weighted-average number of shares outstanding during the reported period. The calculation of diluted earnings per share is similar to basic earnings per share, except that the weighted-average number of shares outstanding includes the dilution from potential shares added from stock options, restricted share awards and other stock awards. Refer to Note 5 for share information on the Company’s stock compensation plans.
The components of basic and diluted earnings (loss) per share are as follows:
For the years ended December 31 | |||||||||||
In millions, except (loss) earnings per share | 2017 | 2016 | 2015 | ||||||||
Net (loss) income attributable to common stockholders | $ | (67 | ) | $ | 125 | $ | (214 | ) | |||
Weighted average outstanding shares of common stock | 125.8 | 129.7 | 139.6 | ||||||||
Dilutive effect of employee stock options, restricted shares and other stock awards | — | 1.8 | — | ||||||||
Common stock and common stock equivalents | 125.8 | 131.5 | 139.6 | ||||||||
Earnings (loss) per share: | |||||||||||
Basic | $ | (0.53 | ) | $ | 0.96 | $ | (1.53 | ) | |||
Diluted | $ | (0.53 | ) | $ | 0.95 | $ | (1.53 | ) | |||
For 2017, due to the net loss attributable to Teradata common stockholders, largely due to the tax expense recorded as a result of the Tax Cuts and Jobs Act of 2017, potential common shares that would cause dilution, such as employee stock options, restricted shares and other stock awards, have been excluded from the diluted share count because their effect would have been anti-dilutive. For 2017, the fully diluted shares would have been 127.8 million
For 2015, due to the net loss attributable to Teradata common stockholders, largely due to the goodwill and acquired intangibles impairment charges, potential common shares that would cause dilution, such as employee stock options, restricted shares and other stock awards, have been excluded from the diluted share count because their effect would have been anti-dilutive. For 2015, the fully diluted shares would have been 141.9 million.
Options to purchase 2.7 million in 2017, 5.2 million shares in 2016 and 4.5 million shares in 2015 of common stock, were not included in the computation of diluted earnings per share because their exercise prices were greater than the average market price of the common shares and, therefore, the effect would have been anti-dilutive.
Recently Issued Accounting Pronouncements
Revenue Recognition. In May 2014, the Financial Accounting Standards Board ("FASB") issued new guidance that affects any entity that either enters into contracts with customers to transfer goods or services or enters into contracts for the transfer of nonfinancial assets unless those contracts are within the scope of other standards. The new guidance will supersede the revenue recognition requirements in the current revenue recognition guidance, and most industry-specific guidance. In addition, the existing requirements for the recognition of a gain or loss on the transfer of nonfinancial assets that are not in a contract with a customer are amended to be consistent with the guidance on recognition and measurement in this update. The core principle of the guidance is that an entity should recognize revenue to depict the transfer of promised goods or services to customers in an amount that reflects the consideration to which the entity expects to be entitled in exchange for those goods or services. To achieve that core principle, the FASB defines a five-step process which includes the following: (1) identify the contract with a customer, (2) identify the performance obligations in the contract, (3) determine the transaction price, (4) allocate the transaction price to the performance obligations in the contract, and (5) recognize revenue when (or as) the entity satisfies a performance obligation.
The new revenue standard will be effective for annual reporting periods beginning after December 15, 2017, with early application permitted. The standard allows entities to apply the standard retrospectively for all periods presented or alternatively an entity is permitted to recognize the cumulative effect of initially applying the guidance
52
as an opening balance sheet adjustment to retained earnings in the period of initial application (modified retrospective method).
The Company will adopt the new accounting guidance effective January 1, 2018 by utilizing the modified retrospective method. The Company is still evaluating and finalizing the impact on its consolidated financial position, results of operations and cash flows.
Although the Company is still evaluating the impact on its consolidated financial statements, the Company believes the most significant impacts will likely include the following items:
• | As the Company transitions to the new go-to-market offerings, such as subscription-based licenses rather than perpetual licenses, the Company could potentially see a more significant impact in the amount of revenue recognized over time under the current rules but upfront under the new rules. This impact will result in revenue that is adjusted to retained earnings in the period of adoption and therefore not recognized in future periods or restated to prior periods due to the Company applying the modified retrospective method of adoption. |
• | The Company currently expenses contract acquisition costs and believes that the requirement to defer incremental contract acquisition costs and recognize them over the term of the contract to which the costs relate will have an impact, especially as the Company transitions to longer-term, over-time revenue contracts. |
• | The amount of revenue allocated to the delivered items and recognized upfront utilizing the relative selling price model is limited to the amount that is not contingent upon the delivery of additional items or meeting other specified performance conditions (i.e., the non-contingent amount) under current rules. Under the new rules, the amounts allocated to delivered items and recognized upfront could be higher if it is probable that a significant reversal in the amount of revenue recognized will not occur in future periods upon the delivery of additional items or meeting other specified performance conditions; and |
• | The new standard will impact our internal control environment, including our financial statement disclosure controls, business process controls, new systems and processes, and enhancements to existing systems and processes. |
The Company expects to record approximately $20 million of adjustments to retained earnings for the revenue-related items discussed above. The Company also expects to record approximately $15 million of deferred compensation costs upon adoption that will then be amortized in future periods.
The Company does not expect that the new standard will result in substantive changes in our performance obligations or the amounts of revenue allocated between multiple performance obligations, with the exception of contingent revenue discussed above. The Company is still in the process of evaluating and finalizing these impacts, and our initial assessment may change as the Company continues with implementing new systems, processes, accounting policies and internal controls.
Leases. In February 2016, the FASB issued new guidance which requires a lessee to account for leases as finance or operating leases. Both leases will result in the lessee recognizing a right-of-use asset and a corresponding lease liability on its balance sheet, with differing methodology for income statement recognition. For lessors, the standard modifies the classification criteria and the accounting for sales-type and direct financing leases. Entities will classify leases to determine how to recognize lease-related revenue and expense. This standard is effective for public entities for fiscal years, and interim periods within those years, beginning after December 15, 2018, and early adoption is permitted. A modified retrospective approach is required for leases existing or entered into after the beginning of the earliest comparative period in the consolidated financial statements. The Company is currently assessing the impact of this update on its consolidated financial statements. We currently believe that the most significant changes will be related to the recognition of right-of-use assets and lease liabilities on our consolidated balance sheets for real estate and equipment leases that are currently classified as operating leases and therefore not recorded on the consolidated balance sheets.
Statement of Cash Flows: Classification of Certain Cash Receipts and Cash Payments. In August 2016, the FASB issued an update addressing eight specific cash flow issues to reduce diversity in practice. The amended guidance is effective for fiscal years beginning after December 31, 2017, and for interim periods within those years.
53
Early adoption is permitted. The Company will adopt this amended guidance in the first quarter of 2018 and does not expect the impact on its consolidated financial statements to be material.
Financial Instruments. In January 2016, the FASB issued new guidance which enhances the reporting model for financial instruments and related disclosures. This update requires equity securities to be measured at fair value with changes in fair value recognized through net income and will eliminate the cost method for equity securities without readily determinable fair values. The provisions are effective for public entities with fiscal years beginning after December 15, 2017, including interim periods within those fiscal years. Early adoption is permitted, in certain circumstances. The Company will adopt this amended guidance in the first quarter of 2018 and does not expect the impact on its consolidated financial statements to be material.
Intra-entity asset transfers. In October 2016, the FASB issued accounting guidance to simplify the accounting for income tax consequences of intra-entity transfers of assets other than inventory. Under this guidance, companies will be required to recognize the income tax consequences of an intra-entity asset transfer when the transfer occurs. Current guidance prohibits companies from recognizing current and deferred income taxes for an intra-entity asset transfer until the asset has been sold to an outside party. The guidance must be applied on a modified retrospective basis through a cumulative-effect adjustment to retained earnings as of the period of adoption. The guidance is effective for periods beginning after December 15, 2017 and early adoption is permitted. The Company will adopt this amended guidance in the first quarter of 2018 and does not expect the impact on its consolidated financial statements to be material.
Classification of restricted cash. In December 2016, the FASB issued accounting guidance to address diversity in the classification and presentation of changes in restricted cash on the statement of cash flows. Under this guidance, companies will be required to present restricted cash and restricted cash equivalents with cash and cash equivalents when reconciling the beginning-of-period and end-of-period amounts shown on the statement of cash flows. The guidance is required to be applied retrospectively and is effective for periods beginning after December 15, 2017, with early adoption permitted. The Company will adopt this amended guidance in the first quarter of 2018 and does not expect the impact on its consolidated financial statements to be material.
Clarification on the definition of a business. In January 2017, the FASB issued accounting guidance to clarify the definition of a business with the objective of adding guidance to assist entities with evaluating whether transactions should be accounted for as acquisitions (or disposals) of assets or businesses. This new guidance is effective for reporting periods beginning after December 15, 2017 with early adoption permitted. The Company will adopt this amended guidance in the first quarter of 2018 and does not expect the impact on its consolidated financial statements to be material.
Presentation of Net Periodic Pension Cost and Net Periodic Post-retirement Benefit Cost. In March 2017, the FASB issued accounting guidance for “Compensation – Retirement Benefits (Topic 715): Improving the Presentation of Net Periodic Pension Cost and Net Periodic Post-retirement Benefit Cost”. The amendment requires the service cost component of net periodic benefit cost be presented in the same income statement line item as other employee compensation costs arising from services rendered during the period and other components of the net periodic benefit cost be presented separately from the line item that includes the service cost and outside of any subtotal of operating income. For public entities, the amendments are effective for interim and annual reporting periods beginning after December 15, 2017. The Company will adopt this amended guidance in the first quarter of 2018. The retroactive adoption of this standard will result in an increase in operating income and a corresponding decrease in other income (primarily related to the return on pension assets) for the years ended December 31 of $4 million in 2017 and $3 million in 2016.
Stock Compensation. In May 2017, the FASB issued accounting guidance for "Compensation—Stock Compensation (Topic 718) - Scope of Modification Accounting". The amendments in this update provide guidance about which changes to the terms or conditions of a share-based payment award require an entity to apply modification accounting. The current disclosure requirements in Topic 718 apply regardless of whether an entity is required to apply modification accounting under the amendments in this update. The amendments in this update are effective for all entities for annual periods, and interim periods within those annual periods, beginning after December 15, 2017. Early adoption is permitted, including adoption in any interim period. The Company will adopt this amended guidance in the first quarter of 2018 and does not expect any impact on its consolidated financial statements.
54
Derivatives and Hedging. In August 2017, the FASB issued amendments to hedge accounting guidance. These amendments are intended to better align a company’s risk management strategies and financial reporting for hedging relationships. Under the new guidance, more hedging strategies will be eligible for hedge accounting and the application of hedge accounting is simplified. In addition, the new guidance amends presentation and disclosure requirements. The guidance is effective for fiscal years beginning after December 15, 2018 with early adoption permitted, including the interim periods within those years. The guidance requires the use of a modified retrospective approach. The Company is currently evaluating the impact of the guidance on our consolidated financial statements.
Reclassification of Certain Tax Effects from Accumulated Other Comprehensive Income. In February 2018, the FASB issued guidance allowing companies the option to reclassify to retained earnings the tax effects related to items in Accumulated other comprehensive income (loss) as a result of the Tax Cuts and Jobs Act that was enacted on December 22, 2017. This update is effective in fiscal years, including interim periods, beginning after December 15, 2018, and early adoption is permitted. This guidance should be applied either in the period of adoption or retrospectively to each period in which the effects of the change in the U.S. federal income tax rate in the Tax Cuts and Jobs Act is recognized. The Company is currently evaluating the impact of the guidance on our consolidated financial statements.
Recently Adopted Guidance
Simplifying the measurement for goodwill. In January 2017, the FASB issued guidance to simplify the accounting for the impairment of goodwill. The guidance removes Step 2 of the goodwill impairment test, which requires a hypothetical purchase price allocation. A goodwill impairment will now be the amount by which a reporting unit’s carrying value exceeds its fair value, not to exceed the carrying amount of goodwill. The Company early adopted this accounting guidance effective January 1, 2017. This amendment did not have an impact on the Company's consolidated financial statements.
55
Note 2 Supplemental Financial Information
At December 31 | |||||||
In millions | 2017 | 2016 | |||||
Accounts receivable | |||||||
Trade | $ | 559 | $ | 561 | |||
Other | 7 | 6 | |||||
Accounts receivable, gross | 566 | 567 | |||||
Less: allowance for doubtful accounts | (12 | ) | (19 | ) | |||
Total accounts receivable, net | $ | 554 | $ | 548 | |||
Inventories | |||||||
Finished goods | $ | 18 | $ | 20 | |||
Service parts | 12 | 14 | |||||
Total inventories | $ | 30 | $ | 34 | |||
Property and equipment | |||||||
Land | $ | 8 | $ | 8 | |||
Buildings and improvements | 82 | 77 | |||||
Machinery and other equipment | 404 | 354 | |||||
Property and equipment, gross | 494 | 439 | |||||
Less: accumulated depreciation | (332 | ) | (301 | ) | |||
Total property and equipment, net | $ | 162 | $ | 138 | |||
Other current liabilities | |||||||
Sales and value-added taxes | $ | 30 | $ | 28 | |||
Pension and other postemployment plan liabilities | 2 | 7 | |||||
Other | 70 | 53 | |||||
Total other current liabilities | $ | 102 | $ | 88 | |||
Deferred revenue | |||||||
Deferred revenue, current | $ | 414 | $ | 369 | |||
Long-term deferred revenue | 85 | 14 | |||||
Total deferred revenue | $ | 499 | $ | 383 | |||
Other long-term liabilities | |||||||
Transition tax | $ | 133 | $ | — | |||
Uncertain tax positions | 14 | 20 | |||||
Other | 2 | 12 | |||||
Total other long-term liabilities | $ | 149 | $ | 32 | |||
56
Note 3 Goodwill and Acquired Intangible Assets
The following table identifies the activity relating to goodwill by operating segment:
In millions | Balance at December 31, 2016 | Additions | Currency Translation Adjustments | Balance at December 31, 2017 | |||||||||||
Goodwill | |||||||||||||||
Americas Data and Analytics | $ | 251 | $ | 2 | $ | — | $ | 253 | |||||||
International Data and Analytics | 139 | — | 7 | 146 | |||||||||||
Total goodwill | $ | 390 | $ | 2 | $ | 7 | $ | 399 | |||||||
During 2017, the Company recorded additional goodwill of $2 million, for an immaterial acquisition that occurred during the period.
In the fourth quarter of 2017, the Company performed its annual impairment test of goodwill and determined that no impairment to the carrying value of goodwill was necessary. The Company reviewed two reporting units in its 2017 goodwill impairment assessment, as both geographic operating segments were considered separate reporting units for purposes of testing. Based on the Company's evaluation and weighting of the events and circumstances that have occurred since the most recent quantitative test, the Company concluded that it was not more likely than not that each reporting unit's fair value was below its carrying value. Therefore, the Company determined that it was not necessary to perform a quantitative goodwill impairment test for the reporting units in 2017.
Acquired intangible assets were specifically identified when acquired, and are deemed to have finite lives. The gross carrying amount and accumulated amortization for Teradata’s acquired intangible assets were as follows:
December 31, 2017 | December 31, 2016 | ||||||||||||||||
In millions | Amortization Life (in Years) | Gross Carrying Amount | Accumulated Amortization and Currency Translation Adjustments | Gross Carrying Amount | Accumulated Amortization and Currency Translation Adjustments | ||||||||||||
Acquired intangible assets | |||||||||||||||||
Intellectual property/developed technology | 1 to 7 | $ | 43 | $ | (20 | ) | $ | 71 | $ | (61 | ) | ||||||
Trademarks/trade names | 5 | — | — | 1 | (1 | ) | |||||||||||
In-process research and development | 5 | — | — | 5 | (4 | ) | |||||||||||
Total | $ | 43 | $ | (20 | ) | $ | 77 | $ | (66 | ) | |||||||
During 2017, the Company recorded additional intangibles of $18 million, for intellectual property related to an immaterial acquisition that occurred during the period. The gross carrying amount of acquired intangibles was reduced by certain intangible assets previously acquired that became fully amortized and were removed from the balance sheet.
The aggregate amortization expense (actual and estimated) for acquired intangible assets for the following periods is:
Actual | For the years ended (estimated) | |||||||||||||||||||||||||||||||
In millions | 2015 | 2016 | 2017 | 2018 | 2019 | 2020 | 2021 | 2022 | ||||||||||||||||||||||||
Amortization expense | $ | 40 | $ | 10 | $ | 8 | $ | 7 | $ | 6 | $ | 4 | $ | 4 | $ | 2 | ||||||||||||||||
57
Note 4 Income Taxes
For the years ended December 31, income (loss) before income taxes consisted of the following:
In millions | 2017 | 2016 | 2015 | ||||||||
Income (loss) before income taxes | |||||||||||
United States | $ | (26 | ) | $ | 93 | $ | (88 | ) | |||
Foreign | 84 | 128 | (56 | ) | |||||||
Total income (loss) before income taxes | $ | 58 | $ | 221 | $ | (144 | ) | ||||
For the years ended December 31, income tax expense consisted of the following:
In millions | 2017 | 2016 | 2015 | ||||||||
Income tax expense | |||||||||||
Current | |||||||||||
Federal | $ | 132 | $ | 67 | $ | 74 | |||||
State and local | 2 | 7 | 9 | ||||||||
Foreign | 25 | 25 | 26 | ||||||||
Deferred | |||||||||||
Federal | (22 | ) | 7 | (19 | ) | ||||||
State and local | (4 | ) | 1 | (3 | ) | ||||||
Foreign | (8 | ) | (11 | ) | (17 | ) | |||||
Total income tax expense | $ | 125 | $ | 96 | $ | 70 | |||||
Effective income tax rate | 215.5 | % | 43.4 | % | (48.6 | %) | |||||
The following table presents the principal components of the difference between the effective tax rate and the U.S. federal statutory income tax rate for the years ended December 31:
In millions | 2017 | 2016 | 2015 | |||||
Income tax expense at the U.S. federal tax rate | 35.0 | % | 35.0 | % | 35.0 | % | ||
Foreign income tax differential | (18.0 | )% | (13.2 | )% | 14.0 | % | ||
State and local income taxes | (11.0 | )% | 0.2 | % | 0.5 | % | ||
U.S. permanent book/tax differences | (12.0 | )% | (0.1 | )% | 3.1 | % | ||
Change in valuation allowance for California R&D credit | 10.0 | % | 0.8 | % | (3.4 | )% | ||
U.S. manufacturing deduction permanent difference | (8.0 | )% | (3.5 | )% | 5.5 | % | ||
Goodwill impairment | — | % | 8.9 | % | (100.1 | )% | ||
Tax impact of sale of marketing applications business | — | % | 9.9 | % | — | % | ||
Impact of excess tax benefits and tax deficiencies | — | % | 2.2 | % | — | % | ||
Tax impact of U.S. tax law change - IRC Section 987 | — | % | 3.5 | % | — | % | ||
Deferred tax impact from U.S. rate change | (27.0 | )% | — | % | — | % | ||
Tax impact of transition Tax- U.S. tax reform | 250.0 | % | — | % | — | % | ||
Other, net | (3.5 | )% | (0.3 | )% | (3.2 | )% | ||
Effective income tax rate | 215.5 | % | 43.4 | % | (48.6 | )% | ||
The 2017 effective tax rate was impacted by the Tax Act, which was signed into law on December 22, 2017, making significant changes to the U.S. Internal Revenue Code. Changes include, but are not limited to, a corporate tax rate decrease from 35% to 21% effective for tax years beginning after December 31, 2017, the transition of U.S. international taxation from a worldwide tax system to a modified territorial tax system, and a one-time transition tax on the mandatory deemed repatriation of cumulative foreign earnings as of December 31, 2017. On December 22, 2017, Staff Accounting Bulletin No. 118 ("SAB 118") was issued to address the application of GAAP in situations when a registrant does not have the necessary information available, prepared, or analyzed (including computations) in reasonable detail to complete the accounting for certain income tax effects of the Tax Act.
In accordance with SAB 118, the Company has determined its best estimate of the impact of the Tax Act in its year-end income tax provision in accordance with its understanding of the Tax Act and guidance available as of the date
58
of this filing and has recorded $126 million as additional income tax expense in the fourth quarter of 2017. The provisional amount related to the one-time transition tax on the mandatory deemed repatriation of foreign earnings was $145 million of tax expense based on cumulative foreign earnings of $1.3 billion, which the Company expects to pay over an 8-year period. In addition, a tax benefit of $19 million was recorded, a majority of which related to the re-measurement of certain deferred tax assets and liabilities based on the rates at which they are expected to reverse in the future. The ultimate impact may differ materially from these provisional amounts, due to, among other things, additional analysis, changes in interpretations and assumptions the Company has made, additional regulatory guidance that may be issued, and actions the Company may take as a result of the Tax Act.
The 2016 effective tax rate was impacted by the $57 million of goodwill impairment charges recorded in the first quarter of 2016, all of which was treated as a permanent, non-deductible tax item. In addition, a discrete tax charge of $22 million was recorded in the third quarter of 2016 related to the tax impact of the sale of the marketing applications business, which occurred on July 1, 2016. In the fourth quarter of 2016, the Company recorded $8 million of tax expense associated with the issuance of new U.S. Treasury Regulations under Internal Revenue Code Section 987 on December 7, 2016, which clarified how companies calculate foreign currency translation gains and losses for income tax purposes for branches whose accounting records are kept in a currency other than the currency of the Company. Also in the fourth quarter of 2016, the Company elected to early adopt Accounting Standards Update 2016-09, Improvements to Employee Share-based Payment Accounting. As a result, the Company incurred a $5 million discrete tax expense associated with the net shortfall arising from 2016 equity compensation vestings and exercises.
The 2015 effective tax rate was impacted by the $437 million of goodwill impairment charges recorded for 2015, of which $414 million was treated as a permanent non-deductible tax item. This resulted in full-year income tax expense in 2015 of $70 million, on a pre-tax net loss of $(144) million, causing a negative tax rate of (48.6)%.
Deferred income tax assets and liabilities included in the balance sheets at December 31 were as follows:
In millions | 2017 | 2016 | |||||
Deferred income tax assets | |||||||
Employee pensions and other liabilities | $ | 50 | $ | 59 | |||
Other balance sheet reserves and allowances | 13 | 18 | |||||
Tax loss and credit carryforwards | 59 | 53 | |||||
Deferred revenue | 3 | 3 | |||||
Other | 2 | — | |||||
Total deferred income tax assets | 127 | 133 | |||||
Valuation allowance | (32 | ) | (26 | ) | |||
Net deferred income tax assets | 95 | 107 | |||||
Deferred income tax liabilities | |||||||
Intangibles and capitalized software | 30 | 63 | |||||
Property and equipment | 12 | 22 | |||||
Other | — | 6 | |||||
Total deferred income tax liabilities | 42 | 91 | |||||
Total net deferred income tax assets | $ | 53 | $ | 16 | |||
As of December 31, 2017, Teradata has net operating loss ("NOL") and tax credit carryforwards totaling $59 million (tax effected and before any valuation allowance offset and application of recognition criteria for uncertain tax positions). Of the total tax carryforwards, $15 million are NOL's in the U.S. and certain foreign jurisdictions, a small portion of which will begin to expire in 2019 and $44 million are California R&D tax credits that have an indefinite carryforward period (which has a $32 million valuation allowance offset recorded).
Prior to the enactment of the Tax Act, the Company had not provided for taxes on the undistributed earnings of its foreign subsidiaries as the Company either reinvested or intended to reinvest those earnings outside of the U.S. As a result of the 2017 Tax Act, the Company has changed its indefinite reinvestment assertion related to foreign earnings that have been taxed in the U.S. and now considers a majority of these earnings no longer indefinitely reinvested. As a result of U.S. tax reform legislation, distributions of profits from non-U.S. subsidiaries are not expected to cause a significant U.S. tax impact in the future. However, these distributions may be subject to non-
59
U.S. withholding taxes if profits are distributed from certain jurisdictions. The Company has not recorded any provisional foreign or state tax expense with respect to earnings which have been subject to federal income tax as they either would not be taxable upon remittance or they are considered permanently reinvested. Additional information and analysis are needed to determine the final amount of deferred tax liability considering factors such as whether non-U.S. entities are subject to withholding taxes, have reserve requirements, or have projected working capital and other capital needs in the country where the earnings were generated that would result in a decision to indefinitely reinvest a portion or all their earnings. The Company will disclose any future impact, if any, in the reporting period in which the accounting is completed, which will not exceed one year from the date of enactment of the Tax Act in accordance with SAB 118.
The Company may recognize the tax benefit from an uncertain tax position only if it is more likely than not that the tax position will be sustained on examination by the taxing authorities, based on the technical merits of the position. The Company reflects any interest and penalties recorded in connection with its uncertain tax positions as a component of income tax expense.
As of December 31, 2017, the Company’s uncertain tax positions totaled approximately $28 million, of which $2 million is reflected in current taxes payable as it is anticipated the liability will be settled within the next twelve months, and $14 million is reflected in the other liabilities section of the Company’s balance sheet as a non-current liability. The remaining balance of $12 million of uncertain tax positions relates to certain tax attributes both generated by the Company and acquired in various acquisitions, which are netted against the underlying deferred tax assets recorded on the balance sheet. The entire balance of $28 million in uncertain tax positions would cause a decrease in the effective income tax rate upon recognition. Teradata has recorded $2 million of interest accruals related to its uncertain tax liabilities as of December 31, 2017.
Below is a roll-forward of the Company’s liability related to uncertain tax positions at December 31:
In millions | 2017 | 2016 | |||||
Balance at January 1 | $ | 30 | $ | 38 | |||
Gross decreases for prior period tax positions | (1 | ) | (7 | ) | |||
Gross increases for current period tax positions | 3 | 3 | |||||
Decreases due to the lapse of applicable statute of limitations | (4 | ) | (4 | ) | |||
Balance at December 31 | $ | 28 | $ | 30 | |||
The Company and its subsidiaries file income tax returns in the U.S. and various state jurisdictions, as well as numerous foreign jurisdictions. As of December 31, 2017, the Company has ongoing tax audits in a limited number of state and foreign jurisdictions. However, no material adjustments have been proposed or made in any of these examinations to date, which would result in any incremental income tax expense in future periods to the Company. The Company's tax returns for years 2014-2017 are still open for assessment by tax authorities in its major jurisdictions.
Note 5 Employee Stock-based Compensation Plans
The Company recorded stock-based compensation expense for the years ended December 31 as follows:
In millions | 2017 | 2016 | 2015 | ||||||||
Stock options | $ | 9 | $ | 9 | $ | 12 | |||||
Restricted shares | 56 | 51 | 41 | ||||||||
Employee share repurchase program | 3 | 2 | 3 | ||||||||
Total stock-based compensation before income taxes | 68 | 62 | 56 | ||||||||
Tax benefit | (21 | ) | (13 | ) | (17 | ) | |||||
Total stock-based compensation, net of tax | $ | 47 | $ | 49 | $ | 39 | |||||
The Teradata Corporation 2007 Stock Incentive Plan (the “2007 SIP”), as amended, and the Teradata 2012 Stock Incentive Plan (the “2012 SIP”) provide for the grant of several different forms of stock-based compensation. The 2012 SIP was adopted and approved by stockholders in April 2012 and no further awards may be made under the 2007 SIP after that time. A total of approximately 17.5 million shares were authorized to be issued under the 2012
60
SIP. New shares of the Company’s common stock are issued as a result of the vesting of restricted share units and stock option exercises, and at the time of grant for restricted shares, for awards under both plans.
As of December 31, 2017, the Company’s primary types of stock-based compensation were stock options, restricted shares, restricted share units and the employee stock purchase program (the “ESPP”).
Stock Options
The Compensation and Human Resource Committee of Teradata’s Board of Directors has discretion to determine the material terms and conditions of option awards under both the 2007 SIP and the 2012 SIP (collectively, the “Teradata SIP”), provided that (i) the exercise price must be no less than the fair market value of Teradata common stock (as defined in both plans) on the date of grant, and (ii) the term must be no longer than ten years. Option grants generally have a four-year vesting period.
The weighted-average fair value of options granted for Teradata equity awards was $11.08 in 2017, $10.68 in 2016 and $11.37 in 2015. The fair value of each option award on the grant date was estimated using the Black-Scholes option-pricing model with the following assumptions:
2017 | 2016 | 2015 | ||||||
Dividend yield | — | % | — | % | — | % | ||
Risk-free interest rate | 1.99 | % | 2.08 | % | 1.76 | % | ||
Expected volatility | 35.0 | % | 35.2 | % | 34.4 | % | ||
Expected term (years) | 6.3 | 6.3 | 6.3 | |||||
The following table summarizes the Company’s stock option activity for the year ended December 31, 2017:
Shares in thousands | Shares Under Option | Weighted- Average Exercise Price per Share | Weighted- Average Remaining Contractual Term (in years) | Aggregate Intrinsic Value (in millions) | ||||||||
Outstanding at January 1, 2017 | 6,509 | $ | 36.22 | 5.3 | $ | 8 | ||||||
Granted | 10 | $ | 29.04 | |||||||||
Exercised | (746 | ) | $ | 25.28 | ||||||||
Canceled | (153 | ) | $ | 46.56 | ||||||||
Forfeited | (247 | ) | $ | 32.97 | ||||||||
Outstanding at December 31, 2017 | 5,373 | $ | 37.63 | 4.5 | $ | 30 | ||||||
Fully vested and expected to vest at December 31, 2017 | 5,373 | $ | 37.63 | 4.5 | $ | 30 | ||||||
Exercisable at December 31, 2017 | 4,220 | $ | 39.60 | 3.4 | $ | 21 | ||||||
The following table summarizes the total intrinsic value of options exercised and the cash received by the Company from option exercises under all share-based payment arrangements at December 31:
In millions | 2017 | 2016 | 2015 | ||||||||
Intrinsic value of options exercised | $ | 6 | $ | 13 | $ | 8 | |||||
Cash received from option exercises | $ | 19 | $ | 18 | $ | 9 | |||||
Tax benefit realized from option exercises | $ | 2 | $ | 5 | $ | 3 | |||||
As of December 31, 2017, there was $13 million of total unrecognized compensation cost related to unvested stock option grants. That cost is expected to be recognized over a weighted-average period of 2.4 years.
Restricted Shares and Restricted Share Units
The Teradata SIP provides for the issuance of restricted shares, as well as restricted share units. These grants consist of both service-based and performance-based awards. Service-based awards typically vest over a three-year period beginning on the effective date of grant. These grants are not subject to future performance measures. The cost of these awards, determined to be the fair market value at the date of grant, is expensed ratably over the vesting period. For substantially all restricted share grants, at the date of grant, the recipient has all rights of a stockholder, subject to certain restrictions on transferability and a risk of forfeiture. A recipient of restricted share units does not have the
61
rights of a stockholder and is subject to restrictions on transferability and risk of forfeiture. For both restricted share grants and restricted share units, any potential dividend rights would be subject to the same vesting requirements as the underlying equity award. As a result, such rights are considered a contingent transfer of value and consequently these equity awards are not considered participating securities. Performance-based grants are subject to future performance measurements over a one-to four-year period. All performance-based shares that are earned in respect of an award will become vested at the end of the performance and/or service period provided the employee is continuously employed by the Company and applicable performance measures and other vesting conditions are met. The fair value of each performance-based award is determined on the grant date, based on the Company’s stock price, and assumes that performance targets will be achieved. Over the performance period, the number of shares of stock that will be issued is adjusted upward or downward based upon management’s assessment of the probability of achievement of performance targets. The ultimate number of shares issued and the related compensation cost recognized as expense will be based on a comparison of the final achievement of performance metrics to the specified targets.
The following table reports restricted shares and restricted share unit activity during the year ended December 31, 2017:
Shares in thousands | Number of Shares | Weighted- Average Grant Date Fair Value per Share | ||||
Unvested shares at January 1, 2017 | 4,042 | $ | 31.57 | |||
Granted | 2,044 | $ | 34.88 | |||
Vested | (1,487 | ) | $ | 33.55 | ||
Forfeited/canceled | (373 | ) | $ | 29.05 | ||
Unvested shares at December 31, 2017 | 4,226 | $ | 32.76 | |||
The following table summarizes the weighted-average fair value of restricted share units granted for Teradata equity awards and the total fair value of shares vested.
2017 | 2016 | 2015 | |||||||||
Weighted-average fair value of restricted share units granted | $ | 34.88 | $ | 26.61 | $ | 32.82 | |||||
Total fair value of shares vested (in millions) | $ | 50 | $ | 61 | $ | 45 | |||||
As of December 31, 2017, there was $98 million of unrecognized compensation cost related to unvested restricted share grants. The unrecognized compensation cost is expected to be recognized over a remaining weighted-average period of 2.4 years.
The following table represents the composition of Teradata restricted share unit grants in 2017:
Shares in thousands | Number of Shares | Weighted- Average Grant Date Fair Value | ||||
Service-based shares | 1,736 | $ | 36.33 | |||
Performance-based shares | 308 | $ | 26.68 | |||
Total stock grants | 2,044 | $ | 34.88 | |||
Performance-based share units granted as part of our long-term incentive program for certain corporate officers and key executives will be earned based on Teradata's total shareholder return ("TSR") over a three-year performance period relative to the other companies in the S&P 1500 Technology Index. The number of shares issued, as a percentage of the amount subject to the performance share award, could range from 0% to 200%. The grant date fair value of the non-vested performance-based awards was determined using a Monte Carlo simulation model, which utilized multiple input variables that determined the probability of satisfying the market condition requirements
62
applicable to each award. The compensation expense for the award will be recognized if the requisite service is rendered, regardless of whether the market conditions are achieved.
Employee Stock Purchase Program
The Company’s ESPP, effective on October 1, 2007, and as amended effective as of January 1, 2013, provides eligible employees of Teradata and its designated subsidiaries an opportunity to purchase the Company’s common stock at a discount to the average of the highest and lowest sale prices on the last trading day of each month. The ESPP discount was 15% of the average market price and is considered compensatory.
Employees may authorize payroll deductions of up to 10% of eligible compensation for common stock purchases. A total of 4 million shares were authorized to be issued under the ESPP, with approximately 0.2 million shares remaining under that authorization at December 31, 2017. The shares of Teradata common stock purchased by a participant on an exercise date (the last day of each month), for all purposes, are deemed to have been issued and sold at the close of business on such exercise date. Prior to that time, none of the rights or privileges of a stockholder exists with respect to such shares. Employee purchases and aggregate cost were as follows at December 31:
In millions | 2017 | 2016 | 2015 | ||||||||
Employee share purchases | 0.6 | 0.6 | 0.5 | ||||||||
Aggregate cost | $ | 15 | $ | 13 | $ | 17 | |||||
Note 6 Employee Benefit Plans
Pension and Postemployment Plans. Teradata currently sponsors defined benefit pension plans for certain of its international employees. For those international pension plans for which the Company holds asset balances, those assets are primarily invested in common/collective trust funds (which include publicly traded common stocks, corporate and government debt securities, real estate indirect investments, cash or cash equivalents) and insurance contracts.
Postemployment obligations relate to benefits provided to involuntarily terminated employees and certain inactive employees after employment but before retirement. These benefits are paid in accordance with various foreign statutory laws and regulations, and Teradata’s established postemployment benefit practices and policies. Postemployment benefits may include disability benefits, supplemental unemployment benefits, severance, workers’ compensation benefits, continuation of health care benefits and life insurance coverage, and are funded on a pay-as-you-go basis.
Pension and postemployment benefit costs for the years ended December 31 were as follows:
2017 | 2016 | 2015 | |||||||||||||||||||||
In millions | Pension | Postemployment | Pension | Postemployment | Pension | Postemployment | |||||||||||||||||
Service cost | $ | 9 | $ | 7 | $ | 8 | $ | 6 | $ | 8 | $ | 6 | |||||||||||
Interest cost | 3 | 1 | 3 | 1 | 3 | 1 | |||||||||||||||||
Expected return on plan assets | (2 | ) | — | (2 | ) | — | (2 | ) | — | ||||||||||||||
Settlement charge | — | — | 1 | — | 1 | — | |||||||||||||||||
Amortization of actuarial loss | 1 | 2 | 1 | 1 | 2 | — | |||||||||||||||||
Amortization of prior service (credit) cost | (1 | ) | 1 | — | 2 | — | — | ||||||||||||||||
Divestiture | — | — | (2 | ) | (1 | ) | — | — | |||||||||||||||
Total costs | $ | 10 | $ | 11 | $ | 9 | $ | 9 | $ | 12 | $ | 7 | |||||||||||
63
The underfunded amount of pension and postemployment obligations is recorded as a liability in the Company’s consolidated balance sheet. The following tables present the changes in benefit obligations, plan assets, funded status and the reconciliation of the funded status to amounts recognized in the consolidated balance sheets and in accumulated other comprehensive income at December 31:
Pension | Postemployment | ||||||||||||||
In millions | 2017 | 2016 | 2017 | 2016 | |||||||||||
Change in benefit obligation | |||||||||||||||
Benefit obligation at January 1 | $ | 120 | $ | 115 | $ | 42 | $ | 49 | |||||||
Service cost | 9 | 8 | 7 | 6 | |||||||||||
Interest cost | 3 | 3 | 1 | 1 | |||||||||||
Plan participant contributions | 1 | 1 | — | — | |||||||||||
Actuarial (gain) loss | (3 | ) | 5 | 12 | 12 | ||||||||||
Benefits paid | (4 | ) | (8 | ) | (15 | ) | (20 | ) | |||||||
Currency translation adjustments | 10 | (2 | ) | — | (1 | ) | |||||||||
Divestiture | — | (2 | ) | — | (5 | ) | |||||||||
Benefit obligation at December 31 | $ | 136 | $ | 120 | $ | 47 | $ | 42 | |||||||
Change in plan assets | |||||||||||||||
Fair value of plan assets at January 1 | $ | 64 | $ | 63 | $ | — | $ | — | |||||||
Actual return on plan assets | 5 | 2 | — | — | |||||||||||
Company contributions | 5 | 6 | — | — | |||||||||||
Benefits paid | (4 | ) | (8 | ) | — | — | |||||||||
Currency translation adjustments | 4 | — | — | — | |||||||||||
Plan participant contribution | 1 | 1 | — | — | |||||||||||
Fair value of plan assets at December 31 | 75 | 64 | — | — | |||||||||||
Funded status (underfunded) | $ | (61 | ) | $ | (56 | ) | $ | (47 | ) | $ | (42 | ) | |||
Amounts Recognized in the Balance Sheet | |||||||||||||||
Non-current assets | $ | 10 | $ | 5 | $ | — | $ | — | |||||||
Current liabilities | (2 | ) | (1 | ) | (7 | ) | (6 | ) | |||||||
Non-current liabilities | (69 | ) | (60 | ) | (40 | ) | (36 | ) | |||||||
Net amounts recognized | $ | (61 | ) | $ | (56 | ) | $ | (47 | ) | $ | (42 | ) | |||
Amounts Recognized in Accumulated Other Comprehensive (Loss) Income | |||||||||||||||
Unrecognized Net actuarial loss | $ | 15 | $ | 21 | $ | 37 | $ | 26 | |||||||
Unrecognized Prior service (credit) cost | (1 | ) | (1 | ) | 3 | 4 | |||||||||
Total | $ | 14 | $ | 20 | $ | 40 | $ | 30 | |||||||
The following table presents the accumulated pension benefit obligation at December 31:
In millions | 2017 | 2016 | |||||
Accumulated pension benefit obligation | $ | 125 | $ | 110 | |||
The following table presents pension plans with accumulated benefit obligations in excess of plan assets at December 31:
In millions | 2017 | 2016 | |||||
Projected benefit obligation | $ | 69 | $ | 60 | |||
Accumulated benefit obligation | $ | 63 | $ | 53 | |||
Fair value of plan assets | $ | — | $ | — | |||
64
The following table presents the pre-tax net changes in projected benefit obligations recognized in other comprehensive income:
Pension | Postemployment | ||||||||||||||
In millions | 2017 | 2016 | 2017 | 2016 | |||||||||||
Actuarial (gain) loss arising during the year | $ | (7 | ) | $ | 5 | $ | 13 | $ | 4 | ||||||
Amortization of loss included in net periodic benefit cost | (1 | ) | (1 | ) | (2 | ) | (1 | ) | |||||||
Prior service (credit) cost arising during the year | — | — | (1 | ) | 2 | ||||||||||
Recognition of loss due to settlement | — | (1 | ) | — | — | ||||||||||
Foreign currency exchange | 2 | (1 | ) | — | — | ||||||||||
Total recognized in other comprehensive (loss) income | $ | (6 | ) | $ | 2 | $ | 10 | $ | 5 | ||||||
The following table presents the amounts in accumulated other comprehensive loss expected to be recognized as components of net periodic benefit cost during 2018:
In millions | Pension | Postemployment | |||||
Net loss to be recognized in other comprehensive income | $ | 1 | $ | 4 | |||
The weighted-average rates and assumptions used to determine benefit obligations at December 31, and net periodic benefit cost for the years ended December 31, were as follows:
Pension Benefit Obligations | Pension Benefit Cost | ||||||||
2017 | 2016 | 2017 | 2016 | 2015 | |||||
Discount rate | 2.1% | 2.0% | 2.0% | 2.4% | 2.3% | ||||
Rate of compensation increase | 3.3% | 3.3% | 3.3% | 3.2% | 3.3% | ||||
Expected return on plan assets | N/A | N/A | 2.9% | 3.0% | 3.3% | ||||
Postemployment Benefit Obligations | Postemployment Benefit Cost | ||||||||
2017 | 2016 | 2017 | 2016 | 2015 | |||||
Discount rate | 2.6% | 3.4% | 2.6% | 3.4% | 3.5% | ||||
Rate of compensation increase | 3.0% | 3.0% | 3.0% | 3.0% | 3.0% | ||||
Involuntary turnover rate | 2.3% | 2.0% | 2.3% | 2.0% | 1.3% | ||||
The Company determines the expected return on assets based on individual plan asset allocations, historical capital market returns, and long-term interest rate assumptions, with input from its actuaries, investment managers, and independent investment advisors. The company emphasizes long-term expectations in its evaluation of return factors, discounting or ignoring short-term market fluctuations. Expected asset returns are reviewed annually, but are generally modified only when asset allocation strategies change or long-term economic trends are identified.
International discount rates were determined by examining interest rate levels and trends within each country, particularly yields on high-quality long-term corporate bonds, relative to our future expected cash flows. The discount rate used for countries with individually insignificant benefit obligation at year-end was derived by matching the plans’ expected future cash flows to the corresponding yields from the Citigroup Pension Liability Index. This yield curve has been constructed to represent the available yields on high-quality fixed-income investments across a broad range of future maturities.
Gains and losses have resulted from changes in actuarial assumptions and from differences between assumed and actual experience, including, among other items, changes in discount rates and differences between actual and assumed asset returns. These gains and losses (except those differences being amortized to the market-related value) are only amortized to the extent that they exceed 10% of the higher of the market-related value of plan assets or the projected benefit obligation of each respective plan.
65
Plan Assets. The weighted-average asset allocations at December 31, by asset category are as follows:
Actual Asset Allocation as of December 31 | Target Asset | ||||
2017 | 2016 | Allocation | |||
Equity securities | 32% | 32% | 31% | ||
Debt securities | 41% | 42% | 47% | ||
Insurance (annuity) contracts | 17% | 17% | 16% | ||
Real-estate | 8% | 7% | 3% | ||
Other | 2% | 2% | 3% | ||
Total | 100% | 100% | 100% | ||
Fair Value. Fair value measurements are established utilizing a three-tier fair value hierarchy, which prioritizes the inputs used in measuring fair value. These tiers are more fully described in Note 9.
The following is a description of the valuation methodologies used for pension assets as of December 31, 2017.
Common/collective trust funds (which include money market funds, equity funds, bond funds, real-estate indirect investments, etc.): Valued at the net asset value (“NAV”) of shares held by the Plan at year end, as reported to the Plan by the trustee, which represents the fair value of shares held by the Plan. Because the NAV of the shares held in the common/collective trust funds are derived by the value of the underlying investments, the Company has classified these underlying investments as Level 2 fair value measurements.
Insurance contracts: Valued by discounting the related future benefit payments using a current year-end market discount rate, which represents the fair value of the insurance contract. The Company has classified these contracts as Level 3 assets for fair value measurement purposes.
The following table sets forth by level, within the fair value hierarchy, the pension plan assets at fair value as of December 31, 2017:
Fair Value Measurements at Reporting Date Using | |||||||||||||||
Quoted Prices in Active Markets for Identical Assets | Significant Other Observable Inputs | Significant Unobservable Inputs | |||||||||||||
In millions | December 31, 2017 | (Level 1) | (Level 2) | (Level 3) | |||||||||||
Money market funds | $ | 2 | $ | — | $ | 2 | $ | — | |||||||
Equity funds | 24 | — | 24 | — | |||||||||||
Bond/fixed-income funds | 31 | — | 31 | — | |||||||||||
Real-estate indirect investments | 6 | — | 6 | — | |||||||||||
Insurance contracts | 12 | — | — | 12 | |||||||||||
Total assets at fair value | $ | 75 | $ | — | $ | 63 | $ | 12 | |||||||
66
The table below sets forth a summary of changes in the fair value of the pension plan level 3 assets for the year ended December 31, 2017:
In millions | Insurance Contracts | ||
Balance as of January 1, 2017 | $ | 11 | |
Purchases, sales and settlements, net | 1 | ||
Balance as of December 31, 2017 | $ | 12 | |
The following table sets forth by level, within the fair value hierarchy, the pension plan assets at fair value as of December 31, 2016:
Fair Value Measurements at Reporting Date Using | |||||||||||||||
Quoted Prices in Active Markets for Identical Assets | Significant Other Observable Inputs | Significant Unobservable Inputs | |||||||||||||
In millions | December 31, 2016 | (Level 1) | (Level 2) | (Level 3) | |||||||||||
Money market funds | $ | 1 | $ | — | $ | 1 | $ | — | |||||||
Equity funds | 21 | — | 21 | — | |||||||||||
Bond/fixed-income funds | 27 | — | 27 | — | |||||||||||
Real-estate indirect investments | 4 | — | 4 | — | |||||||||||
Insurance contracts | 11 | — | — | 11 | |||||||||||
Total assets at fair value | $ | 64 | $ | — | $ | 53 | $ | 11 | |||||||
The table below sets forth a summary of changes in the fair value of the pension plan level 3 assets for the year ended December 31, 2016:
In millions | Insurance Contracts | ||
Balance as of January 1, 2016 | $ | 10 | |
Purchases, sales and settlements, net | 1 | ||
December 31, 2016 | $ | 11 | |
Investment Strategy. Teradata employs several investment strategies across its various international pension plans. In some countries, particularly where Teradata does not have a large employee base, the Company may use insurance (annuity) contracts to satisfy its future pension payment obligations, whereby the Company makes pension plan contributions to an insurance company in exchange for which the pension plan benefits will be paid when the members reach a specified retirement age or on earlier exit of members from the plan. In other countries, the Company may employ local asset managers to manage investment portfolios according to the investment policies and guidelines established by the Company, and with consideration to individual plan liability structure and local market environment and risk tolerances. The Company’s investment policies and guidelines primarily emphasize diversification across and within asset classes to maximize long-term returns subject to prudent levels of risk, with the overall objective of enabling the plans to meet their future obligations. The investment portfolios contain a diversified blend of equity and fixed-income investments. Furthermore, equity investments are diversified across domestic and international stocks, small and large capitalization stocks, and growth and value stocks. Fixed-income assets are diversified across government and corporate bonds. Where applicable, real estate investments are made through real estate securities, partnership interests or direct investment, and are diversified by property type and location.
Cash Flows Related to Employee Benefit Plans
Cash Contributions. In 2018, the Company expects to contribute approximately $6 million to the international pension plans.
67
Estimated Future Benefit Payments. The Company expects to make the following benefit payments reflecting past and future service from its pension and postemployment plans:
Pension | Postemployment | ||||||
In millions | Benefits | Benefits | |||||
Year | |||||||
2018 | $ | 5 | $ | 7 | |||
2019 | $ | 5 | $ | 6 | |||
2020 | $ | 5 | $ | 6 | |||
2021 | $ | 6 | $ | 6 | |||
2022 | $ | 6 | $ | 6 | |||
2023 - 2027 | $ | 34 | $ | 24 | |||
Savings Plans. U.S. employees and many international employees participate in defined contribution savings plans. These plans generally provide either a specified percent of pay or a matching contribution on participating employees’ voluntary elections. The Company’s matching contributions typically are subject to a maximum percentage or level of compensation. Employee contributions can be made pre-tax, after-tax or a combination thereof. The following table identifies the expense for the U.S. and International subsidiary savings plans for the years ended December 31:
In millions | 2017 | 2016 | 2015 | ||||||||
U.S. savings plan | $ | 21 | $ | 19 | $ | 22 | |||||
International subsidiary savings plans | $ | 17 | $ | 16 | $ | 18 | |||||
Note 7 Derivative Instruments and Hedging Activities
As a portion of the Company’s operations and revenue occur outside the U.S. and in currencies other than the U.S. dollar, the Company is exposed to potential gains and losses from changes in foreign currency exchange rates. To mitigate the impact of currency fluctuations, the Company uses foreign exchange forward contracts to hedge transactional exposures resulting predominantly from foreign currency denominated inter-company receivables and payables. The forward contracts are designated as fair value hedges of specified foreign currency denominated inter-company receivables and payables and generally mature in three months or less. The Company does not hold or issue derivative financial instruments for trading purposes, nor does it hold or issue leveraged derivative instruments. By using derivative financial instruments to hedge exposures to changes in exchange rates, the Company exposes itself to credit risk. The Company manages exposure to counterparty credit risk by entering into derivative financial instruments with highly rated institutions that can be expected to fully perform under the terms of the applicable contracts.
All derivatives are recognized in the Consolidated Balance Sheets at their fair value. The fair values of foreign exchange contracts are based on market spot and forward exchange rates and represent estimates of possible value that may not be realized in the future. Changes in the fair value of derivative financial instruments, along with the loss or gain on the hedged asset or liability, are recorded in current period earnings. The notional amounts represent agreed-upon amounts on which calculations of dollars to be exchanged are based, and are an indication of the extent of Teradata’s involvement in such instruments. These notional amounts do not represent amounts exchanged by the parties and, therefore, are not a measure of the instruments. Across its portfolio of contracts, Teradata has both long and short positions relative to the U.S. dollar. As a result, Teradata’s net involvement is less than the total contract notional amount of the Company’s foreign exchange forward contracts.
The following table identifies the contract notional amount of the Company’s foreign exchange forward contracts at December 31:
In millions | 2017 | 2016 | |||||
Contract notional amount of foreign exchange forward contracts | $ | 147 | $ | 156 | |||
Net contract notional amount of foreign exchange forward contracts | $ | 23 | $ | 16 | |||
The fair value derivative assets and liabilities recorded in other current assets and accrued liabilities at December 31, 2017 and 2016, were not material.
68
Gains and losses from the Company’s fair value hedges (foreign currency forward contracts and related hedged items) were immaterial for the years ended December 31, 2017, 2016 and 2015. Gains and losses from foreign exchange forward contracts are fully recognized each period and reported along with the offsetting gain or loss of the related hedged item, either in cost of products or in other income, depending on the nature of the related hedged item.
Note 8 Commitments and Contingencies
In the normal course of business, the Company is subject to proceedings, lawsuits, governmental investigations, claims and other matters, including those that relate to the environment, health and safety, employee benefits, export compliance, intellectual property, tax matters, and other regulatory compliance and general matters.
As first disclosed in the Company’s Form 10-Q for the second quarter of 2017, through internal processes, the Company discovered certain questionable expenditures for travel, gifts and other expenses at one of its international subsidiaries doing business in a single foreign country, Turkey. Teradata promptly initiated an internal investigation into the matter, with the assistance of outside counsel and forensic accountants, to determine whether the expenditures may have violated the U.S. Foreign Corrupt Practices Act (“FCPA”) or other potentially applicable anti-corruption laws. In February 2017, the Company voluntarily contacted the SEC and the U.S. Department of Justice (“DOJ”) to alert them to the relevant events and the Company's internal investigation. Teradata has fully cooperated with the government regarding the status of the Company's internal investigation and findings, including remedial actions and terminations.
On January 16, 2018, the SEC advised that its staff will not recommend any enforcement action by the SEC against Teradata and that its investigation into this matter is closed. On February 20, 2018, the DOJ also advised the Company that it will not take any enforcement action and that its investigation into this matter is closed.
Guarantees and Product Warranties.
Guarantees associated with the Company’s business activities are reviewed for appropriateness and impact to the Company’s financial statements. Periodically, the Company’s customers enter into various leasing arrangements coordinated with a leasing company. In some instances, the Company guarantees the leasing company a minimum value at the end of the lease term on the leased equipment. As of December 31, 2017, the maximum future payment obligation of this guaranteed value and the associated liability balance was $4 million.
The Company provides its customers a standard manufacturer’s warranty and records, at the time of the sale, a corresponding estimated liability for potential warranty costs. Estimated future obligations due to warranty claims are based upon historical factors such as labor rates, average repair time, travel time, number of service calls and cost of replacement parts. For each consummated sale, the Company recognizes the total customer revenue and records the associated warranty liability using pre-established warranty percentages for that product class.
The following table identifies the activity relating to the warranty reserve liability for the years ended December 31:
In millions | 2017 | 2016 | 2015 | ||||||||
Beginning balance at January 1 | $ | 5 | $ | 6 | $ | 7 | |||||
Accruals for warranties issued | 6 | 8 | 9 | ||||||||
Settlements (in cash or kind) | (7 | ) | (9 | ) | (10 | ) | |||||
Balance at end of period | $ | 4 | $ | 5 | $ | 6 | |||||
The Company also offers extended and/or enhanced coverage to its customers in the form of maintenance contracts. The Company accounts for these contracts by deferring the related maintenance revenue over the extended and/or enhanced coverage period. Costs associated with maintenance support are expensed as incurred. Amounts associated with these maintenance contracts are not included in the table above.
In addition, the Company provides its customers with certain indemnification rights. In general, the Company agrees to indemnify the customer if a third party asserts patent or other infringement on the part of the customer for its use of the Company’s products. The Company has indemnification obligations under its charter and bylaws to its officers and directors, and has entered into indemnification agreements with the officers and directors of its subsidiaries. From time to time, the Company also enters into agreements in connection with its acquisition and divesture activities that include indemnification obligations by the Company, including the sale of the marketing
69
applications business. The fair value of these indemnification obligations is typically not readily determinable due to the conditional nature of the Company’s potential obligations and the specific facts and circumstances involved with each particular agreement. As such, the Company has generally not recorded a liability in connection with these indemnification arrangements. Historically, payments made by the Company under these types of agreements have not had a material effect on the Company’s consolidated financial condition, results of operations or cash flows.
Leases. Teradata conducts certain of its sales and administrative operations using leased facilities, the initial lease terms of which vary in length. Many of the leases contain renewal options and escalation clauses that are not material to the overall lease portfolio. Future minimum operating lease payments and committed subleases under non-cancelable leases as of December 31, 2017, for the following fiscal years were:
In millions | Total Amounts | 2018 | 2019 | 2020 | 2021 | 2022 and Thereafter | |||||||||||||||||
Operating lease obligations | $ | 81 | $ | 27 | $ | 20 | $ | 16 | $ | 8 | $ | 10 | |||||||||||
Sublease rentals | (14 | ) | (6 | ) | (5 | ) | (3 | ) | — | — | |||||||||||||
Total committed operating leases less sublease rentals | $ | 67 | $ | 21 | $ | 15 | $ | 13 | $ | 8 | $ | 10 | |||||||||||
The following table represents the Company’s actual rental expense and sublease rental income for the years ended December 31:
In millions | 2017 | 2016 | 2015 | ||||||||
Rental expense | $ | 24 | $ | 24 | $ | 26 | |||||
Sublease rental income | $ | 5 | $ | 3 | $ | 3 | |||||
The Company had no contingent rentals for these periods.
Concentrations of Risk. The Company is potentially subject to concentrations of credit risk on accounts receivable and financial instruments such as hedging instruments, and cash and cash equivalents. Credit risk includes the risk of nonperformance by counterparties. The maximum potential loss may exceed the amount recognized on the balance sheet. Exposure to credit risk is managed through credit approvals, credit limits, selecting major international financial institutions (as counterparties to hedging transactions) and monitoring procedures. Teradata’s business often involves large transactions with customers, and if one or more of those customers were to default in its obligations under applicable contractual arrangements, the Company could be exposed to potentially significant losses. However, management believes that the reserves for potential losses were adequate at December 31, 2017 and 2016.
The Company is also potentially subject to concentrations of supplier risk. Our hardware components are assembled exclusively by Flex Ltd. (“Flex”). Flex procures a wide variety of components used in the manufacturing process on our behalf. Although many of these components are available from multiple sources, Teradata utilizes preferred supplier relationships to better ensure more consistent quality, cost and delivery. Typically, these preferred suppliers maintain alternative processes and/or facilities to ensure continuity of supply. Given the Company’s strategy to outsource its manufacturing activities to Flex and to source certain components from single suppliers, a disruption in production at Flex or at a supplier could impact the timing of customer shipments and/or Teradata’s operating results. In addition, a significant change in the forecasts to any of these preferred suppliers could result in purchase obligations or components that may be in excess of demand.
Note 9 Fair Value Measurements
Fair value measurements are established utilizing a three-tier fair value hierarchy, which prioritizes the inputs used in measuring fair value. These tiers include: Level 1, defined as observable inputs such as quoted prices in active markets for identical assets or liabilities; Level 2, defined as significant other observable inputs, such as quoted prices in active markets for similar assets or liabilities, or quoted prices in less-active markets for identical assets; and Level 3, defined as unobservable inputs in which little or no market data exists, therefore requiring an entity to develop its own assumptions. Financial assets and liabilities are classified in their entirety based on the lowest level of input that is significant to the fair value measurement.
70
The Company’s assets and liabilities measured at fair value on a recurring basis include money market funds and foreign currency exchange contracts. A portion of the Company’s excess cash reserves are held in money market funds which generate interest income based on the prevailing market rates. Money market funds are included in cash and cash equivalents in the Company’s balance sheet. Money market fund holdings are measured at fair value using quoted market prices and are classified within Level 1 of the valuation hierarchy.
When deemed appropriate, the Company minimizes its exposure to changes in foreign currency exchange rates through the use of derivative financial instruments, specifically, forward foreign exchange contracts. The fair value of these contracts are measured at the end of each interim reporting period using observable inputs other than quoted prices, specifically market spot and forward exchange rates. As such, these derivative instruments are classified within Level 2 of the valuation hierarchy. Fair value gains for open contracts are recognized as assets and fair value losses are recognized as liabilities. The fair value derivative assets and liabilities recorded in other current assets and accrued liabilities at December 31, 2017 and 2016, were not material. Any realized gains or losses would be mitigated by corresponding gains or losses on the underlying exposures. Further information on the Company’s use of forward foreign exchange contracts is included in Note 7.
The Company’s assets measured at fair value on a recurring basis and subject to fair value disclosure requirements at December 31, were as follows:
Fair Value Measurements at Reporting Date Using | |||||||||||||||
Quoted Prices in Active Markets for Identical Assets | Significant Other Observable Inputs | Significant Unobservable Inputs | |||||||||||||
In millions | Total | (Level 1) | (Level 2) | (Level 3) | |||||||||||
Assets | |||||||||||||||
Money market funds at December 31, 2017 | $ | 501 | $ | 501 | $ | — | $ | — | |||||||
Money market funds at December 31, 2016 | $ | 473 | $ | 473 | $ | — | $ | — | |||||||
Note 10 Debt
Teradata's $600 million term loan is payable in quarterly installments, which commenced on March 31, 2016, with all remaining principal due in March 2020. The outstanding principal amount under the term loan agreement bears interest at a floating rate based upon a negotiated base rate or a Eurodollar rate plus a margin based on the leverage ratio of the Company.
As of December 31, 2017, the term loan principal outstanding was $540 million and carried an interest rate of 3.375%. Unamortized deferred issuance costs of approximately $1 million are being amortized over the five-year term of the loan. The Company was in compliance with all covenants as of December 31, 2017.
Annual contractual maturities of outstanding principal on the term loan at December 31, 2017, are as follows:
In millions | |||
2018 | $ | 60 | |
2019 | 68 | ||
2020 | 412 | ||
Total | $ | 540 | |
71
The following table presents interest expense on borrowings for the years ended December 31:
In millions | 2017 | 2016 | 2015 | ||||||||
Interest expense | $ | 15 | $ | 12 | $ | 9 | |||||
Teradata’s term loan is recognized on the Company’s balance sheet at its unpaid principal balance, and is not subject to fair value measurement. However, given that the loan carries a variable rate, the Company estimates that the unpaid principal balance of the term loan would approximate its fair value. If measured at fair value in the financial statements, the Company’s term loan would be classified as Level 2 in the fair value hierarchy.
Teradata's revolving credit facility (the “Credit Facility”) has a borrowing capacity of $400 million. The Credit Facility ends on March 25, 2020 at which point any remaining outstanding borrowings would be due for repayment unless extended by agreement of the parties for up to two additional one-year periods. The interest rate charged on borrowings pursuant to the Credit Facility can vary depending on the interest rate option the Company chooses to utilize and the Company’s leverage ratio at the time of the borrowing. In the near term, Teradata would anticipate choosing a floating rate based on the London Interbank Offered Rate (“LIBOR”). The Credit Facility is unsecured and contains certain representations and warranties, conditions, affirmative, negative and financial covenants, and events of default customary for such facilities.
As of December 31, 2017, the Company had $240 million in borrowings outstanding under the Credit Facility, which carried an interest rate of 5.0%, leaving $160 million in additional borrowing capacity available. Unamortized deferred costs on the original credit facility and new lender fees of approximately $1 million are being amortized over the five-year term of the credit facility. The Company was in compliance with all covenants as of December 31, 2017.
Note 11 Segment, Other Supplemental Information and Concentrations
Effective July 1, 2016, following the sale of the marketing applications business, Teradata is managing its business in two operating segments: (1) Americas region (North America and Latin America); and (2) International region (Europe, Middle East, Africa, Asia Pacific and Japan). For purposes of discussing results by segment, management excludes the impact of certain items, consistent with how management evaluates the performance of each segment. This format is useful to investors because it allows analysis and comparability of operating trends. It also includes the same information that is used by Teradata management to make decisions regarding the segments and to assess financial performance. The chief operating decision maker evaluates the performance of the segments based on revenue and multiple profit measures, including segment gross profit. For management reporting purposes assets are not allocated to the segments.
72
The following table presents segment revenue and segment gross profit for the Company for the years ended December 31:
In millions | 2017 | 2016 | 2015 | ||||||||
Segment revenue | |||||||||||
Americas Data and Analytics | $ | 1,195 | $ | 1,334 | $ | 1,470 | |||||
International Data and Analytics | 961 | 919 | 907 | ||||||||
Total Data and Analytics | 2,156 | 2,253 | 2,377 | ||||||||
Marketing Applications | — | 69 | 153 | ||||||||
Total revenue | 2,156 | 2,322 | 2,530 | ||||||||
Segment gross profit | |||||||||||
Americas Data and Analytics | 676 | 796 | 871 | ||||||||
International Data and Analytics | 434 | 445 | 452 | ||||||||
Total Data and Analytics | 1,110 | 1,241 | 1,323 | ||||||||
Marketing Application | — | 34 | 63 | ||||||||
Total segment gross profit | 1,110 | 1,275 | 1,386 | ||||||||
Stock-based compensation expense | 13 | 14 | 13 | ||||||||
Amortization of acquisition-related intangible assets | 1 | 2 | 16 | ||||||||
Acquisition, integration and reorganization-related costs | 6 | 9 | 11 | ||||||||
Amortization of capitalized software costs | 68 | 62 | 70 | ||||||||
Selling, general and administrative expenses | 652 | 664 | 765 | ||||||||
Research and development expenses | 306 | 212 | 228 | ||||||||
Impairment of goodwill, acquired intangibles and other assets | — | 80 | 478 | ||||||||
Total income (loss) from operations | $ | 64 | $ | 232 | $ | (195 | ) | ||||
Prior period segment information has been reclassified to conform to the current period presentation. Certain items, including amortization of certain capitalized software costs, were excluded from segment gross profit to conform to the way the Company manages and reviews the results by segment.
The following table presents a further disaggregation of revenue for the Company for the years ended December 31:
In millions | 2017 | 2016 | 2015 | ||||||||
Recurring revenue | $ | 1,047 | $ | 978 | $ | 956 | |||||
Product - perpetual licenses and hardware | 429 | 600 | 752 | ||||||||
Consulting services | 680 | 675 | 669 | ||||||||
Marketing applications | — | 69 | 153 | ||||||||
Total revenue | $ | 2,156 | $ | 2,322 | $ | 2,530 | |||||
Recurring revenue is intended to depict the over-time revenue recognition model for these revenue streams. The recurrence of these revenue streams in future periods depends on a number of factors including contractual term periods and customers’ renewal decisions.
The following table presents revenues by geographic area for the years ended December 31:
In millions | 2017 | 2016 | 2015 | ||||||||
United States | $ | 1,089 | $ | 1,246 | $ | 1,428 | |||||
Americas (excluding United States) | 107 | 123 | 125 | ||||||||
International | 960 | 953 | 977 | ||||||||
Total revenue | $ | 2,156 | $ | 2,322 | $ | 2,530 | |||||
The following table presents property and equipment by geographic area at December 31:
73
In millions | 2017 | 2016 | |||||
United States | $ | 119 | $ | 113 | |||
Americas (excluding United States) | 11 | 4 | |||||
International | 32 | 21 | |||||
Property and equipment, net | $ | 162 | $ | 138 | |||
Concentrations. No single customer accounts for more than 10% of the Company's revenue. As of December 31, 2017, the Company is not aware of any significant concentration of business transacted with a particular customer that could, if suddenly eliminated, have a material adverse effect on the Company’s operations. The Company's hardware components are assembled exclusively by Flex. In addition, the Company utilizes preferred supplier relationships to better ensure more consistent quality, cost and delivery. There can be no assurances that a disruption in production at Flex or at a supplier would not have a material adverse effect on the Company's operations.
Note 12 Business Combinations and Other Investment Activities
During 2017, the Company completed one immaterial business acquisition, which complements and strengthens the Company's research and development department, and released hold-back amounts from prior-year acquisitions for $21 million.
During 2016, the Company completed one immaterial business acquisition, which complements and strengthens the Company's global portfolio, and released hold-back amounts from several prior-year acquisitions for $16 million. The Company also sold the marketing applications business on July 1, 2016 (see Note 15).
During 2015, the Company completed two immaterial business acquisitions for $17 million, which complemented and strengthened the Company's global portfolio. One of the acquisitions pertained to the marketing applications business, which the Company exited on July 1, 2016. In addition, the Company sold two equity investments for $85 million and recognized a gain of $57 million.
Note 13 Accumulated Other Comprehensive (Loss) Income
The following table provides information on changes in accumulated other comprehensive (loss) income (“AOCI”), net of tax, for the years ended December 31:
In millions | Available-for-sale securities | Defined benefit plans | Foreign currency translation adjustments | Total AOCI | |||||||||||
Balance as of December 31, 2014 | $ | 31 | $ | (24 | ) | $ | (11 | ) | $ | (4 | ) | ||||
Other comprehensive loss before reclassifications | (5 | ) | (8 | ) | (36 | ) | (49 | ) | |||||||
Amounts reclassified from AOCI | (26 | ) | 3 | — | (23 | ) | |||||||||
Net other comprehensive loss | (31 | ) | (5 | ) | (36 | ) | (72 | ) | |||||||
Balance as of December 31, 2015 | $ | — | $ | (29 | ) | $ | (47 | ) | $ | (76 | ) | ||||
Other comprehensive loss before reclassifications | — | (9 | ) | (7 | ) | (16 | ) | ||||||||
Amounts reclassified from AOCI | — | 3 | — | 3 | |||||||||||
Net other comprehensive loss | — | (6 | ) | (7 | ) | (13 | ) | ||||||||
Balance as of December 31, 2016 | $ | — | $ | (35 | ) | $ | (54 | ) | $ | (89 | ) | ||||
Other comprehensive (loss) income before reclassifications | — | (5 | ) | 16 | 11 | ||||||||||
Amounts reclassified from AOCI | — | 4 | — | 4 | |||||||||||
Net other comprehensive (loss) income | — | (1 | ) | 16 | 15 | ||||||||||
Balance as of December 31, 2017 | $ | — | $ | (36 | ) | $ | (38 | ) | $ | (74 | ) | ||||
The following table presents the impact and respective location of AOCI reclassifications in the Consolidated Statements of Income for the years ended December 31:
74
In millions | ||||||||||||||
AOCI Component | Location | 2017 | 2016 | 2015 | ||||||||||
Defined benefit plans | Cost of services | $ | (3 | ) | $ | (3 | ) | $ | (2 | ) | ||||
Defined benefit plans | Selling, general and administrative expenses | (2 | ) | (1 | ) | (1 | ) | |||||||
Available for sale securities | Other income | — | — | 42 | ||||||||||
Tax portion | Income tax benefit (expense) | 1 | 1 | (16 | ) | |||||||||
Total reclassifications | Net (loss) income | $ | (4 | ) | $ | (3 | ) | $ | 23 | |||||
Further information on the Company’s defined benefit plans is included in Note 6.
Note 14 Reorganization and Business Transformation
In the fourth quarter of 2015 the Company announced a plan to realign Teradata’s business by reducing its cost structure and focusing on the Company’s core data and analytics business. This business transformation included exiting the marketing applications business (see Note 15), rationalizing costs, and modifying the Company’s go-to-market approach. The Company incurred the following costs related to these actions for the years ended December 31:
In millions | 2017 | 2016 | 2015 | |||||||||
Employee severance and other employee related cost | $ | 2 | $ | 14 | $ | 4 | ||||||
Asset write-downs | — | 80 | 140 | |||||||||
Professional services, legal and other associated cost | 24 | 35 | 8 | |||||||||
Total reorganization and business transformation cost | $ | 26 | $ | 129 | $ | 152 | ||||||
The charges for asset write-downs were for non-cash write-downs of goodwill, acquired intangibles and other assets. In addition to the costs and charges incurred above, the Company made cash payments of less than $1 million in 2017, $20 million in 2016, and $14 million in 2015 for employee severance that did not have a material impact on its Statement of Operations due to Teradata accounting for its postemployment benefits under Accounting Standards Codification 712, Compensation - Nonretirement Postemployment Benefits (“ASC 712”), which uses actuarial estimates and defers the immediate recognition of gains or losses. As of December 31, 2017, the Company does not have any significant liabilities associated with these transformation activities.
Note 15 Impairment and Sale of the Marketing Applications Business
The Company reviews goodwill for impairment annually in the fourth quarter and whenever events or changes in circumstances indicate it is more likely than not that the fair value of the reporting unit is less than its carrying amount. During the second quarter of 2015, the Company determined that indicators were present in the marketing applications business which would suggest the fair value may have declined below the carrying value. The indicators were primarily lower than forecasted revenue and profitability levels for 2015 and future periods. Based on our analysis, the implied fair value of goodwill was substantially lower than the carrying value of goodwill. As a result, the Company recorded an impairment charge of $340 million during the second quarter of 2015.
In the fourth quarter of 2015, the Company committed to a plan to exit the marketing applications business. The assets and liabilities for this business, which were included within our marketing applications segment, were classified as held for sale in the fourth quarter of 2015 and, therefore, the corresponding depreciation and amortization expense ceased at that time. The divestiture was not presented as discontinued operations in our consolidated financial statements because it did not have a major effect on the Company's operations and financial results. The Company then performed a goodwill impairment analysis of the business to be disposed of. As a result of this analysis, the Company recognized an additional goodwill impairment of $97 million in the fourth quarter of 2015. In addition, acquired intangible assets were reduced by $41 million to adjust the carrying amount of the disposal group's net assets and liabilities down to its fair value less cost to sell.
On April 22, 2016, the Company entered into a definitive Asset Purchase Agreement (the “Purchase Agreement”) with TMA Solutions, L.P., a Cayman Islands exempted limited partnership and affiliate of Marlin Equity Partners (“Marlin Equity”), to sell the marketing applications business for $90 million in cash, subject to a post-closing adjustment for working capital, debt and other metrics. We recognized an impairment of goodwill of $57
75
million and acquired intangibles of $19 million in the first quarter of 2016 to adjust the carrying value of the net assets of our marketing applications business to fair value less cost to sell.
Prior to the sale that occurred on July 1, 2016, the marketing applications business that was classified as held for sale generated revenue of $69 million and an operating loss of $112 million (which includes loss from impairment of goodwill and acquired intangibles of $76 million) for the six months ended June 30, 2016. For the year ended December 31, 2015, the Company generated revenue of $153 million and an operating loss of $561 million (which includes loss from impairment of goodwill and acquired intangibles of $478 million). The net assets held for sale as of July 1, 2016 were $87 million.
On July 1, 2016, pursuant to the Purchase Agreement, Teradata completed the sale of Teradata’s marketing applications business to Marlin Equity. The purchase price received for this business was approximately $92 million in cash, after a post-closing adjustment for working capital, debt and other metrics. Transaction costs and post-closing obligations were approximately $5 million. Upon completion of the divestiture of the held for sale assets in July 2016, no material gain or loss was recognized as the carrying value of the held for sale assets was equal to the purchase price received less costs to sell.
The Company recorded tax expense of approximately $22 million in the third quarter of 2016 related to this transaction. The total tax expense, of which $14 million was cash taxes due to having zero tax basis in goodwill, was calculated based on the amount of proceeds allocated to the various jurisdictions in accordance with the Purchase Agreement at the local statutory rates.
Note 16 Quarterly Information (unaudited)
In millions, except per share amounts | First (1) | Second | Third | Fourth (2) | |||||||||||
2017 | |||||||||||||||
Total revenues | $ | 491 | $ | 513 | $ | 526 | $ | 626 | |||||||
Gross profit | $ | 224 | $ | 242 | $ | 250 | $ | 306 | |||||||
Operating (loss) income | $ | (1 | ) | $ | (1 | ) | $ | 7 | $ | 59 | |||||
Net (loss) income | $ | (2 | ) | $ | (4 | ) | $ | 13 | $ | (74 | ) | ||||
Net (loss) income per share: | |||||||||||||||
Basic | $ | (0.02 | ) | $ | (0.03 | ) | $ | 0.11 | $ | (0.61 | ) | ||||
Diluted | $ | (0.02 | ) | $ | (0.03 | ) | $ | 0.10 | $ | (0.61 | ) | ||||
2016 | |||||||||||||||
Total revenues | $ | 545 | $ | 599 | $ | 552 | $ | 626 | |||||||
Gross profit | $ | 269 | $ | 310 | $ | 294 | $ | 315 | |||||||
Operating (loss) income | $ | (42 | ) | $ | 87 | $ | 89 | $ | 98 | ||||||
Net (loss) income | $ | (46 | ) | $ | 64 | $ | 49 | $ | 58 | ||||||
Net (loss) income per share: | |||||||||||||||
Basic | $ | (0.36 | ) | $ | 0.49 | $ | 0.38 | $ | 0.45 | ||||||
Diluted | $ | (0.36 | ) | $ | 0.49 | $ | 0.37 | $ | 0.44 | ||||||
(1) Loss from operation for the three months ended March 31, 2016 includes goodwill and acquired intangibles impairment charges of $76 million for the marketing application business.
(2) Loss from operations for the three months ended December 31, 2017 includes $126 million tax impact related to 2017 U.S. Tax Reform.
Note 17 Subsequent Events
From February 8, 2018 through February 22, 2018, the Company purchased approximately 1.4 million shares for approximately $49 million. As of February 23, 2018, the Company had approximately $462 million of share repurchase authorization remaining under its general share repurchase program.
76
Item 9. | CHANGES IN AND DISAGREEMENTS WITH ACCOUNTANTS ON ACCOUNTING AND FINANCIAL DISCLOSURE |
None.
Item 9A. | CONTROLS AND PROCEDURES |
Evaluation of Disclosure Controls and Procedures
Teradata maintains a system of disclosure controls and procedures (as defined in Rules 13a-15(e) and 15d-15(e) of the Securities Exchange Act of 1934 (the “Exchange Act”)) that are designed to provide reasonable assurance that information required to be disclosed in its reports filed or submitted under the Exchange Act is recorded, processed, summarized and reported, within the time periods specified in the SEC’s rules and forms, and that such information is accumulated and communicated to management, including, as appropriate, the chief executive officer and the chief financial officer, to allow timely decisions regarding required disclosures. In designing and evaluating the disclosure controls and procedures, management recognizes that any controls and procedures, no matter how well designed and operated, can provide only reasonable assurance of achieving the desired control objectives.
Based on their evaluation, our Chief Executive Officer and Chief Financial Officer have concluded that our disclosure controls and procedures were effective to provide reasonable assurance as of December 31, 2017.
Management’s Annual Report on Internal Control Over Financial Reporting
Our management is responsible for establishing and maintaining adequate internal control over financial reporting as such term is defined in Rule 13a-15(f) under the Exchange Act. Teradata’s internal control over financial reporting is designed to provide reasonable assurance regarding the reliability of financial reporting and the preparation of financial statements for external purposes in accordance with generally accepted accounting principles. A company’s internal control over financial reporting includes those policies and procedures that (i) pertain to the maintenance of records that, in reasonable detail, accurately and fairly reflect the transactions and dispositions of the assets of the company; (ii) provide reasonable assurance that transactions are recorded as necessary to permit preparation of financial statements in accordance with generally accepted accounting principles, and that receipts and expenditures of the Company are being made only in accordance with authorizations of management and directors of the company; and (iii) provide reasonable assurance regarding prevention or timely detection of unauthorized acquisition, use, or disposition of the company’s assets that could have a material effect on the financial statements.
Because of its inherent limitations, internal control over financial reporting may not prevent or detect misstatements. Also, projections of any evaluation of effectiveness to future periods are subject to the risk that controls may become inadequate because of changes in conditions, or that the degree or compliance with the policies or procedures may deteriorate.
Management assessed the effectiveness of Teradata’s internal control over financial reporting as of the end of the period covered by this report. In making this assessment, management used the criteria set forth by the Committee of Sponsoring Organizations of the Treadway Commission (“COSO”) in Internal Control – Integrated Framework (2013). Based on our assessment and those criteria, management concluded that Teradata’s internal control over financial reporting was effective as of December 31, 2017.
Teradata’s independent registered public accounting firm has issued their report on the effectiveness of Teradata’s internal control over financial reporting as of December 31, 2017, which appears in this Annual Report.
Changes in Internal Control over Financial Reporting
There have been no changes in our internal control over financial reporting that occurred during the last fiscal quarter ended December 31, 2017 that have materially affected, or are reasonably likely to materially affect, our internal control over financial reporting.
Item 9B. | OTHER INFORMATION |
77
None.
PART III
Item 10. | DIRECTORS, EXECUTIVE OFFICERS AND CORPORATE GOVERNANCE |
Information required to be included in Part III Item 10 is set forth under the captions “Election of Directors” and “Additional Information Concerning the Board of Directors” in Teradata’s Notice of Annual Meeting of Stockholders and Proxy Statement to be filed with the SEC within 120 days after the end of our fiscal 2017 year (the “2018 Proxy Statement”) and is incorporated herein by reference. The information under the heading “Executive Officers of the Registrant” in Part I Item 1 of this Annual Report on Form 10-K is also incorporated by reference in this section.
Item 11. | EXECUTIVE COMPENSATION |
Information required to be included in Part III Item 11 is set forth under the captions “Director Compensation,” “Compensation Discussion and Analysis,” “Compensation Tables,” “Potential Payments Upon Termination or Change in Control,” “Compensation and Human Resource Committee” and “Board Compensation and Human Resource Committee Report on Executive Compensation” in Teradata’s 2018 Proxy Statement and incorporated herein by reference.
Item 12. | SECURITY OWNERSHIP OF CERTAIN BENEFICIAL OWNERS AND MANAGEMENT AND RELATED STOCKHOLDER MATTERS |
Information required to be included in Part III Item 12 is set forth under the caption “Stock Ownership” in Teradata’s 2018 Proxy Statement and incorporated herein by reference.
Item 13. | CERTAIN RELATIONSHIPS AND RELATED TRANSACTIONS, AND DIRECTOR INDEPENDENCE |
Information required to be included in Part III Item 13 is set forth under the captions “Related Person Transactions” and “Board Independence and Related Transactions” in Teradata’s 2018 Proxy Statement and incorporated herein by reference.
Item 14. | PRINCIPAL ACCOUNTING FEES AND SERVICES |
Information required to be included in Part III Item 14 is set forth under the caption “Fees Paid to Independent Registered Public Accounting Firm” in Teradata’s 2018 Proxy Statement and incorporated herein by reference.
78
PART IV
Item 15. | EXHIBITS, FINANCIAL STATEMENT SCHEDULES |
(a) | Index |
1. Financial Statements: The consolidated financial statements of the Company and the Report of Independent Registered Public Accounting Firm as set forth in Part II, Item 8 of this Annual Report:
2. Financial Statement Schedule: Financial Statement Schedule II – Valuation and Qualifying Accounts is included in this Annual Report on page 85. All other schedules are not required under the related instructions or are not applicable.
Exhibits: See Index of Exhibits below for a listing of all exhibits to this Annual Report.
(b) Exhibits identified in parentheses below, on file with the SEC, are incorporated herein by reference as exhibits hereto.
Reference Number per Item 601 of Regulation S-K | Description | |
79
80
81
82
83
101 | Interactive data files pursuant to Rule 405 of Regulation S-T: (i) the Consolidated Statement of (Loss) Income for the twelve month periods ended December 31, 2017, 2016 and 2015, (ii) the Consolidated Statement of Comprehensive (Loss) Income for the twelve month periods ended December 31, 2017, 2017 and 2016, (iii) the Consolidated Balance Sheets at December 31, 2016 and 2015, (iv) the Consolidated Statement of Cash Flows for the twelve month periods ended December 31, 2017, 2016 and 2015, (v) the Consolidated Statement of Changes in Stockholders’ Equity for the twelve month periods ended December 31, 2017, 2016 and 2015, (vi) Financial Statement Schedule II, and (vii) the notes to the Condensed Consolidated Financial Statements. | |
* | Management contracts or compensatory plans, contracts or arrangements. |
** | Schedules have been omitted pursuant to Item 601(b)(2) of Regulation S-K. The Company hereby undertakes to furnish supplemental copies of any of the omitted schedules upon request by the U.S. Securities and Exchange Commission. |
84
TERADATA CORPORATION
SCHEDULE II—VALUATION AND QUALIFYING ACCOUNTS
(In millions)
Column A | Column B | Column C | Column D | Column E | ||||||||||||||||
Description | Balance at Beginning of Period | Provision/reversals Charged to Costs & Expenses | Charged to Other Accounts | Deductions | Balance at End of Period | |||||||||||||||
Allowance for doubtful accounts | ||||||||||||||||||||
Year ended December 31, 2017 | $ | 19 | $ | (6 | ) | $ | — | $ | 1 | $ | 12 | |||||||||
Year ended December 31, 2016* | $ | 22 | $ | 3 | $ | — | $ | 6 | $ | 19 | ||||||||||
Year ended December 31, 2015** | $ | 19 | $ | 5 | $ | — | $ | 2 | $ | 22 | ||||||||||
Deferred tax valuation allowance | ||||||||||||||||||||
Year ended December 31, 2017 | $ | 26 | $ | 6 | $ | — | $ | — | $ | 32 | ||||||||||
Year ended December 31, 2016 | $ | 25 | $ | 1 | $ | — | $ | — | $ | 26 | ||||||||||
Year ended December 31, 2015 | $ | 20 | $ | 5 | $ | — | $ | — | $ | 25 | ||||||||||
* Above amount included in the deductions within column D is $5 million of reserves transferred in the sale of the marketing application business.
** Above amounts include allowances classified as held for sale.
85
SIGNATURES
Pursuant to the requirements of Section 13 or 15 (d) of the Securities Exchange Act of 1934, the registrant has duly caused this report to be signed on its behalf by the undersigned, thereunto duly authorized.
TERADATA CORPORATION | ||||
Date: February 23, 2018 | By: | /s/ Mark A. Culhane | ||
Mark A. Culhane | ||||
Executive Vice President and Chief Financial Officer | ||||
Pursuant to the requirements of the Securities Exchange Act of 1934, this report has been signed below by the following persons on behalf of the registrant and in the capacities and on the date indicated.
Signature | Title | |
/s/ Victor L. Lund | Director, President and Chief Executive Officer | |
Victor L. Lund | ||
/s/ Mark A. Culhane | Executive Vice President and Chief Financial Officer | |
Mark A. Culhane | (Principal Financial and Accounting Officer) | |
/s/ James M. Ringler | Chairman of the Board of Directors | |
James M. Ringler | ||
/s/ Lisa R. Bacus | Director | |
Lisa R. Bacus | ||
/s/ Timothy C.K. Chou | Director | |
Timothy C.K. Chou | ||
/s/ Daniel R. Fishback | ||
Daniel R. Fishback | Director | |
/s/ Cary T. Fu | Director | |
Cary T. Fu | ||
/s/ Michael P. Gianoni | Director | |
Michael P. Gianoni | ||
/s/ David E. Kepler | Director | |
David E. Kepler | ||
/s/ John G. Schwarz | Director | |
John G. Schwarz | ||
/s/ William S. Stavropoulos | Director | |
William S. Stavropoulos | ||
Date: February 23, 2018
86
Item 16. | FORM 10-K SUMMARY |
None.
87