Attached files
| file | filename |
|---|---|
| EX-32.2 - EX-32.2 - AV Homes, Inc. | avhi-20171231ex32240c184.htm |
| EX-32.1 - EX-32.1 - AV Homes, Inc. | avhi-20171231ex321491d45.htm |
| EX-31.2 - EX-31.2 - AV Homes, Inc. | avhi-20171231ex31293d281.htm |
| EX-31.1 - EX-31.1 - AV Homes, Inc. | avhi-20171231ex311d6f653.htm |
| EX-23.2 - EX-23.2 - AV Homes, Inc. | avhi-20171231ex232ddc6ab.htm |
| EX-23.1 - EX-23.1 - AV Homes, Inc. | avhi-20171231ex2319e4770.htm |
| EX-21 - EX-21 - AV Homes, Inc. | avhi-20171231ex21e075a6b.htm |
| EX-12.1 - EX-12.1 - AV Homes, Inc. | avhi-20171231ex121108e98.htm |
| EX-10.13 - EX-10.13 - AV Homes, Inc. | avhi-20171231ex1013f68dc.htm |
UNITED STATES
SECURITIES AND EXCHANGE COMMISSION
Washington, D.C. 20549
FORM 10-K
(Mark One)
|
☒ |
ANNUAL REPORT PURSUANT TO SECTION 13 OR 15(d) OF THE SECURITIES EXCHANGE ACT OF 1934 |
For the fiscal year ended December 31, 2017.
|
☐ |
TRANSITION REPORT PURSUANT TO SECTION 13 OR 15(d) OF THE SECURITIES EXCHANGE ACT OF 1934 |
For the transition period from ____________ to _____________.
001-07395
Commission File Number
AV HOMES, INC.
(Exact name of registrant as specified in its charter)
|
Delaware |
23-1739078 |
|
|
(State or other Jurisdiction of Incorporation or Organization) |
(I.R.S. Employer Identification No.) |
|
8601 N. Scottsdale Rd., Suite 225, Scottsdale, Arizona |
85253 |
|
|
(Address of Principal Executive Offices) |
(Zip Code ) |
(480) 214-7400
(Registrant’s telephone number, including area code)
Securities registered pursuant to Section 12(b) of the Act:
|
Title of each class |
Name of exchange on which registered |
|
|
Common Stock, $1.00 Par Value |
The NASDAQ Stock Market |
Securities registered pursuant to Section 12(g) of the Act:
NONE
Indicate by check mark if the registrant is a well-known seasoned issuer, as defined in Rule 405 of the Securities Act.
Yes ☐ No ☒
Indicate by check mark if the registrant is not required to file reports pursuant to Section 13 or Section 15(d) of the Act.
Yes ☐ No ☒
Indicate by check mark whether the registrant: (1) has filed all reports required to be filed by Section 13 or 15(d) of the Securities Exchange Act of 1934 during the preceding 12 months (or for such shorter period that the registrant was required to file such reports), and (2) has been subject to such filing requirements for the past 90 days.
Yes ☒ No ☐
Indicate by check mark whether the registrant has submitted electronically and posted on its corporate Web site, if any, every Interactive Data File required to be submitted and posted pursuant to Rule 405 of Regulation S-T (§232.405 of this chapter) during the preceding 12 months (or for such shorter period that the registrant was required to submit and post such files).
Yes ☒ No ☐
Indicate by check mark if disclosure of delinquent filers pursuant to Item 405 of Regulation S-K (§229.405 of this chapter) is not contained herein, and will not be contained, to the best of registrant’s knowledge, in definitive proxy or information statements incorporated by reference in Part III of the Form 10-K or any amendment to this Form 10-K.
☒
Indicate by check mark whether the registrant is a large accelerated filer, an accelerated filer, a non-accelerated filer, a smaller reporting company or an emerging growth company. See the definitions of “large accelerated filer,” “accelerated filer,” “smaller reporting company” and “emerging growth company” in Rule 12b-2 of the Exchange Act.
|
Large Accelerated filer ☐ |
Accelerated filer ☒ |
Non-accelerated filer ☐ |
Smaller reporting company ☐ |
|
|
|
(Do not check if smaller reporting company) |
Emerging growth company ☐ |
If an emerging growth company, indicate by check mark if the registrant has elected not to use the extended transition period for complying with any new or revised financial accounting standards provided pursuant to Section 13(a) of the Exchange Act.
☐
Indicate by check mark whether the registrant is a shell company (as defined in Rule 12b-2 of the Act).
Yes ☐ No ☒
Aggregate market value of the voting and non-voting common equity held by non-affiliates of the registrant was $241,478,230 as of June 30, 2017.
As of February 15, 2018, there were 22,348,223 shares of common stock, $1.00 par value, issued and outstanding.
DOCUMENTS INCORPORATED BY REFERENCE
Portions of the registrant’s Proxy Statement for its 2018 Annual Meeting of Stockholders are incorporated by reference into Part III.
2
The following business description should be read in conjunction with our audited consolidated financial statements and accompanying notes thereto appearing elsewhere in this Annual Report on Form 10-K. Unless otherwise indicated or the context otherwise requires, all references in this Annual Report on Form 10-K to “we,” “us,” “our,” “AV Homes,” or the “Company” refer to AV Homes, Inc. and its consolidated subsidiaries.
Company Overview
AV Homes, Inc. is a homebuilder engaged in the business of homebuilding and community development in Florida, the Carolinas and Arizona. Beginning in January 2018, we now operate in Texas through the acquisition of Oakdale-Hampton Homes (see Note 16, Subsequent Events, to the consolidated financial statements included in Part II of this report). Our business focuses on the development and construction of (i) primary residential communities serving first-time and move-up buyers, including under our local Savvy Homes, Bonterra Builders, Royal Oak Homes and Oakdale-Hampton brands, and (ii) active adult communities, which are age-restricted to the age 55 and over active adult demographic. As of December 31, 2017, we owned 4,911 developed residential lots, 2,395 partially developed residential lots, 8,776 undeveloped residential lots, and 6,980 acres of mixed-use, commercial, and industrial land. We utilize our deep experience, strong operating platform, and land inventory to capitalize on the strengthening housing environment and favorable demographic trends within our core markets. We are publicly held and our common stock is traded on the NASDAQ Stock Market under the symbol “AVHI.”
During 2017, we expanded our market presence and increased the number of homes we sold. In 2017, we closed on 2,491 homes at an average sales price of approximately $330,000 per closed home, generating approximately $822 million of homebuilding revenue, as compared to 2016, in which we closed on 2,465 homes at an average sales price of approximately $310,000 per closed home, generating approximately $764 million of homebuilding revenue. The number of housing contracts (net of cancellations) signed in 2017 increased 3.1% to 2,443 as compared to 2016 and we had 724 homes in backlog with a sales value of approximately $237 million as of December 31, 2017 compared to 703 homes in backlog with a sales value of approximately $236 million as of December 31, 2016.
Available Information
AV Homes, Inc. was incorporated in the state of Delaware in 1970. Our principal executive offices are located at 8601 N. Scottsdale Rd., Suite 225, Scottsdale, Arizona 85253, and our telephone number is (480) 214-7400. Our website address is www.avhomesinc.com. Information on our website does not constitute part of this Annual Report on Form 10-K.
We are subject to the informational requirements of the Securities Exchange Act of 1934, as amended (the “Exchange Act”). Accordingly, we file annual, quarterly and current reports, proxy statements and other information with the Securities and Exchange Commission (the “SEC”). You may read and copy materials that we have filed with the SEC at the Public Reference Room of the SEC at 100 F Street, NE, Washington, D.C. 20549 or by calling the SEC at 1-800-SEC-0330. In addition, the SEC maintains an Internet site (http://www.sec.gov) that contains reports, proxy and information statements and other information regarding issuers that file electronically.
You can access financial and other information on our website, www.avhomesinc.com. The information on or accessible through our website is not incorporated by reference in this Annual Report on Form 10-K. We make available, free of charge, copies of our annual reports on Form 10-K, quarterly reports on Form 10-Q, current reports on Form 8-K and any amendments to those reports filed or furnished pursuant to Section 13(a) or 15(d) of the Exchange Act as soon as reasonably practicable after filing or furnishing such material electronically or otherwise with the SEC.
3
Our Strengths
We believe we are well-positioned to execute our core business strategies as a result of the following competitive strengths:
Transformed from a land company to an efficient, process-driven homebuilder. Beginning in 2011, we implemented a strategic planning initiative to restructure our overhead costs and reposition the Company as a cost-efficient and process-driven homebuilder. Pursuant to this initiative, we re-aligned our business to capitalize on the demographic trends and homebuilding recovery in our core markets. Specifically, our management re-evaluated all of our land holdings to identify core assets for development and homebuilding activities, as well as non-core land positions to be sold in favorable market conditions. We also recruited a new team of senior and operating management with longstanding experience in the homebuilding industry, strengthening us to take advantage of the ongoing housing recovery. In addition, we repositioned and diversified our consumer market segmentation mix and broadened our geographical diversification to maximize our opportunity to drive profitable growth.
Significant expertise in our core markets. We have significant geographic expertise in the Florida, the Carolinas, Arizona and Texas markets. In addition, as a result of our experience in developing communities for the active adult population for almost two decades, we have market expertise in serving the housing and lifestyle aspirations of the vast Baby Boomer population. Our management team has a deep understanding of the active adult and primary residential markets and the preferences of the buyers in these markets. We also supplement our expertise in our markets by utilizing a research-based approach to understanding the lifestyle preferences of these buyer markets.
Favorable demographics and real estate market recovery. In the active adult market, we believe the demographic trends and lifestyle aspirations of aging Baby Boomers provide us with a favorable environment for future business.
Reputation for unique high-quality homes in desirable locations. We believe that our reputation for delivering high-quality homes in desirable locations, coupled with our unique amenities and home designs emphasizing lifestyle and value, drive customers to our developments. We seek to provide the highest level of customer service to our homebuyers by involving them in multiple phases of the construction process. Homebuyer involvement allows our sales staff to enhance their knowledge and relationship with our buyers. Our selling process focuses on the homes’ features, benefits, quality, and design, as opposed to merely price and square footage. In order to ensure that our buyers are able to make informed decisions, we generally utilize customer-friendly design centers focused on meeting our customers’ range of needs as they move through the process of purchasing a home.
Business Strategy
Our primary business is homebuilding and community development, which includes the acquisition, development and building of active adult and primary residential home communities, in Florida, the Carolinas, Arizona and Texas. Our core business strategies, which we believe give us long-term competitive advantages relative to other builders, are intended to promote our growth, drive profitability and generate cash liquidity. Those strategies are summarized below.
Strategically expand our primary segments to capitalize on market recoveries. We focus on strategic development of land and communities to ensure sales of homes in high buyer-demand environments, which will allow us to obtain higher home prices and gross margins, as well as yield a strong pace of sales and higher returns. We employ a deliberate land acquisition strategy focused on making prudent investments in high-demand markets in addition to exploring opportunities to broaden our geographic footprint. We also intend to maximize near-term value through developing communities where appropriate on our existing buildable land positions.
Serve the lifestyle and housing needs of the 55+ active adults. Millions of Baby Boomers will continue to age toward and reach retirement. This demographic supports a growing interest in lifestyle-oriented, age-qualified communities, especially throughout the Sun Belt. We serve the lifestyle and housing needs of these active adults with innovative communities uniquely tailored to their lifestyle ambitions through our Solivita and Vitalia at Tradition
4
communities in Florida, our CantaMia and Encore at Eastmark communities in Arizona, and our Creekside at Bethpage community in Raleigh, North Carolina.
Maintain core focus on operational improvements to drive profitability while managing construction and labor costs. We utilize proven technologies and processes to drive profitability as well as strategies and procedures designed to streamline our homebuilding operations. With keen insight into our customers’ buying habits, we are simplifying processes and employing value-engineering practices to help us deliver high-quality, well-built homes with the value our customers expect and the margins that enhance our profitability. Additionally, as we gain scale in our markets, we work to unbundle the building materials to achieve further cost savings by bidding out individual cost components, with the goal of improving our profitability over time.
Exercise prudent balance sheet management to maintain ample liquidity for growth. We believe that it is critical for us to maintain a strong balance sheet with ample liquidity so that we can service our debt obligations, support on-going homebuilding operations, and take advantage of growth opportunities in our core markets. As of December 31, 2017, we had $241.0 million of cash and cash equivalents, $1.2 million of restricted cash, an undrawn $155 million senior unsecured credit facility, and $480.0 million of outstanding debt.
Profitably monetize non-core commercial and industrial land positions and scattered lots. We continue to opportunistically sell non-core commercial and industrial land positions, as well as scattered lot positions and land assets that are in excess of our needed supply in a given market. We sold $4.6 million under this plan in 2017 for a profit of $2.8 million, $3.6 million in 2016 for a profit of $2.3 million, and $6.5 million in 2015 for a profit of $5.6 million.
Our Operations
Our primary business is homebuilding, which includes the acquisition, development and building of active adult and primary residential home communities in Florida, the Carolinas, Arizona and Texas. For further information regarding our financial condition and results of operations, please see Item 7, Management’s Discussion and Analysis of Financial Condition and Results of Operations.
Key Operating Metrics
We track the following key operating metrics in connection with our homebuilding operations:
Contracts signed. Net contracts signed for a given period represents the number of contracts we have entered into with homebuyers for the purchase and sale of homes, less the number of contracts that were cancelled in the same period. We consider a home sales contract cancelled when the customer terminates the contract or when we provide notice of termination due to a failure on the part of the customer to close on the home or meet a contingency under the contract.
Home starts. Home starts is the number of new homes on which we have started construction in a given period. Home starts are monitored by management in order to minimize the time between contract signing and closing.
Closings. Closings represents the number of home sales closed in the period. We recognize revenue equal to the sales price of a home when the sales are closed and title passes to the purchasers.
Backlog. Backlog is the number of homes we are building that are under contract for sale that have not closed as of the end of the period being presented. The dollar value of backlog is the revenue anticipated to be realized at closing equal to the purchase price provided in the applicable contract. Backlog is an important indicator of home closings and homebuilding revenues in future periods.
Average sales price. Average sales price represents total homebuilding revenue for a given period divided by the number of closings for such period.
5
Construction
Construction time for our homes depends on the availability of labor and materials, the type and size of the home, location and weather conditions. Construction of a home in our active adult communities or primary residential communities is typically completed within six months following commencement of construction.
We act as the general contractor for the construction of our homes and communities. We typically engage subcontractors on a project-by-project basis to complete construction at a negotiated fixed price. Agreements with our subcontractors and material suppliers are generally entered into after competitive bidding. Our subcontract agreements typically require the subcontractor to meet certain insurance requirements and to indemnify us against claims related to their work. Our project managers and superintendents supervise the construction of each home, schedule and manage the activities of subcontractors and suppliers, subject their materials and work to quality control standards and assure compliance with zoning and building codes.
Purchase of Raw Materials
We engage several suppliers in each region in order to eliminate or minimize any shortages in materials or labor. We also have national supplier contracts for certain items such as flooring, faucets and air conditioning systems where economies of scale can be leveraged. We choose each of our suppliers based on price, quality, reputation, scalability and ability to meet our construction timelines. We do not maintain inventories of construction materials except for materials being utilized just-in-time for homes under construction.
Prices of materials may fluctuate due to various factors, including demand or supply shortages, which may be beyond the control of our suppliers. Although we have generally been able to offset increases in the costs of materials and labor with increases in the prices of our homes, we may not be able to do so in the future because sales of homes are frequently made in advance of construction. In the ordinary course of business, our construction budgets contain a contingency amount for price increases.
Purchase of Land
We buy improved lots and tracts of raw land or unimproved lots that require development. Generally, earnest money deposits on new land purchases have historically ranged from 5% to 20% of the final purchase price. Additionally, we will use option contracts to acquire lots on a metered basis. Our liability, in the event we do not perform as agreed in the terms of the option contract, is generally forfeiture of our earnest money deposit to the land seller. As of December 31, 2017, we had $9.6 million of earnest money deposits outstanding on new land purchases and land option contracts.
Marketing and Sales
We market our homes through a variety of means, including our website, social media and other Internet channels, as well as the use of model homes, newspaper, magazine and billboard advertising. We also seek to customize our marketing efforts based on location to address the needs and preferences of local homebuyers. We employ sales professionals who are compensated through a combination of salaries and sales commissions to encourage and reward increased sales performance. We use a customer relationship management system to track our traffic and automate follow-up with our contact lists. We also use outside sales brokers in certain markets.
We use model homes in our communities to provide homebuyers the opportunity to view fully furnished and landscaped homes. We typically use one or more model homes in each community. Additionally, in some of our active adult communities, we have homes that we use as Discovery Day units. These homes are used for prospective buyers to stay for short periods of time for exposure to the overall experience of the community.
In order to provide a more tailored product, our homebuyers have the option of customizing their homes through our design center services. Each floor plan has available options that may be added or modified in order to suit the requirements of individual homebuyers.
6
We report a home as sold pursuant to a written sales contract that requires the homebuyer to make a cash deposit. Such sales contracts often contain contingencies such as the ability to receive mortgage financing. We have preferred relationships with select vendors to provide customer financing and title services. In connection with our sales process, we generally require all of our buyers to pre-qualify with a preferred mortgage financing provider. In October 2017, we formed AVH Mortgage, LLC, a joint venture with an established mortgage broker, to better serve our homebuyer’s mortgage needs.
We conduct pre-closing home orientation and post-closing surveys for the homebuyer, which we believe is an integral part of our customer service program. We conduct home orientations with homebuyers immediately before closing. Prior to these orientations, we inspect the home and create a list of unfinished construction items and address outstanding issues promptly. We believe that delivering a high-quality finished home to our homeowners enhances our reputation for quality and service. Typically, we engage an outside firm to conduct comprehensive follow-up surveys with our homeowners to determine their level of satisfaction several months after closing. These surveys provide us with valuable feedback on the quality of the homes we deliver and the services we provide.
Primary Residential Community Development
With our acquisition of the Royal Oak Homes business in 2014, the Bonterra Builders business in 2015, Savvy Homes business in 2017, and the Oakdale-Hampton Homes business in January 2018, we have significantly expanded our focus on the primary residential market, which continues to improve since the most recent housing downturn. We believe that continued investment in this segment will provide us with a balanced portfolio. In addition to our recent acquisitions, we have continued to expand organically in our existing Central Florida, Charlotte and greater Phoenix markets, while also expanding into the Jacksonville, Florida, Raleigh, North Carolina, and Dallas-Fort Worth, Texas markets. During 2017, we had 1,714 home closings in the primary residential market compared to 1,770 home closings for the same period in 2016. With increased investment in new communities, we expect growth to resume in our primary residential homes in 2018.
Active Adult Community Development
A second component of our business is the development of active adult communities and the construction and sales of residences within those communities. We intend to grow this component of our business and continue to seek and evaluate opportunities to expand our active adult operations both in terms of assets and geography. Our current major active adult communities include:
Solivita
Solivita commenced active sales in 2000 and is comprised of 10,098 lots on 7,193 acres in Central Florida, south of the Orlando metropolitan area. As of December 31, 2017, 4,459 of the 5,598 planned residences in the actively developed area have been sold and closed, with approximately 4,500 lots to be developed in future phases. Solivita offers its residents numerous activities year-round through the community’s Lifestyles program, which includes approximately 148,000 square feet of recreation facilities. These facilities include two fitness centers, 14 heated swimming pools, restaurants, arts and crafts rooms, a billiard room, a café, and other meeting and ballroom facilities. We also developed and own two 18-hole championship golf courses. The community’s activity park houses a variety of sports and games facilities, including an official softball field, bocce ball courts, shuffleboard courts, pickleball courts, tennis courts, horseshoe pits, dog parks and an outdoor pavilion. Social activities at Solivita include over 300 clubs, including such diverse interests as dragon boats, photography, travel, pickleball, softball, theatre and motorcycle riding and Veterans affairs.
CantaMia
CantaMia is a 1,698 lot active adult community located on 541 acres in the Estrella Mountain Ranch master-planned community in Goodyear, Arizona, west of Phoenix. Residents have exclusive use of the 30,000 square foot recreation and lifestyle facility that has, as its focal point, an eighteen acre man-made lake system. Amenities include an
7
exercise facility, indoor/outdoor swimming pools, a demonstration kitchen, a library, a technology center, an arts/crafts studio, rooms for games and club activities, a movement studio for yoga and aerobics, and a café. CantaMia also has outdoor sporting venues, including swimming, pickleball, bocce ball, tennis and horseshoes. As of December 31, 2017, a total of 682 homes have closed since we started selling in 2010.
Vitalia at Tradition
Vitalia at Tradition (“Vitalia”) is a 1,153 lot, 452-acre active adult community located in Port St. Lucie, Florida, between Vero Beach and West Palm Beach on Florida’s east coast. We acquired this property in 2009 in its partially developed condition. We have completed new model homes and the recreational center amenity, and have commenced development of additional roadways. As of December 31, 2017, a total of 787 homes have closed since 2009.
Encore at Eastmark
Encore at Eastmark (“Encore”) is our latest active adult community in the Arizona market and is located in the Southeast Valley of metropolitan Phoenix, in the City of Mesa, Arizona. Encore is a 310-acre master-planned community, located within the much larger master-planned community of Eastmark. Encore offers four different product lines designed for the active adult demographic encompassing 973 lots. Residents have exclusive use of the 15,000 square foot recreation and lifestyle facility. Amenities include an exercise facility, outdoor swimming pool, a library, an arts/crafts studio, rooms for games and club activities, a movement studio for yoga and aerobics, and a café. Encore also has outdoor sporting venues, including pickleball, bocce ball, and tennis. As of December 31, 2017, a total of 389 homes have closed since we started selling in 2015.
Creekside at Bethpage
Creekside at Bethpage (“Creekside”) is our first entry into the Raleigh/Durham market. This community is part of the larger Bethpage mixed-use development, which consists of residential, retail, multi-family and commercial uses. Creekside is a 292-acre parcel with a preliminary total of 653 lots that is age-restricted and targets the active adult segment. Creekside has five different product lines ranging from 1,200 to 4,000 square feet.
The sales center and model complex opened in October 2015. The surrounding amenities consist of a 14,000 square foot clubhouse with tennis courts, pickleball courts, bocce ball, an urban garden and a swimming pool, which were completed and opened in the fall of 2016. As of December 31, 2017, a total of 222 homes have closed since we started selling in 2015.
Customer Financing
Most of our homebuyers require financing. Accordingly, we refer them to mortgage lenders that offer a variety of financing options. While our homebuyers may obtain financing from any mortgage provider of their choice, we recently entered a joint venture arrangement with an established mortgage broker that will allow it to act as a preferred mortgage broker to our buyers to help facilitate the sale and closing process as well as generate additional fee income for us through our interest in the joint venture.
Segment Information
Our reportable segment information regarding revenues, results of operations and assets is incorporated herein by reference to Note 13, Segment Information, to the consolidated financial statements included in Part II of this report.
Trademarks
We have federally registered trademarks and service marks or pending applications for federal registration for several of our entities, operations and communities, including AV Homes®, Stonegate®, Solivita®, Royal Oak Homes®, CantaMia®, Vitalia® and AVH Mortgage™.
8
Employees
As of December 31, 2017, we employed 367 individuals on a full-time or part-time basis. Relations with our employees are satisfactory and there have been no work stoppages.
Regulation
Our business is subject to extensive federal, state and local statutes, ordinances and regulations that affect every aspect of our business, such as environmental, hazardous waste and land-use requirements, and can result in substantial expense to AV Homes.
Homes and residential communities that we build must comply with federal, state and local laws, regulations, and ordinances relating to, among other things, zoning, construction permits or entitlements, construction material requirements, density requirements, and requirements relating to building design and property elevation, building codes and the handling of waste. These laws and regulations are subject to frequent change and often result in increased construction or other costs related to our business. In some instances, we must comply with laws that require commitments from us to provide roads and other offsite infrastructure to be in place prior to the commencement of new construction. These laws and regulations may result in fees and assessments, including, without limitation, fees and assessments for schools, parks, streets and highways and other public improvements, the costs of which can be substantial.
The residential homebuilding industry is also subject to a variety of federal, state and local statutes, ordinances, rules and regulations concerning the protection of human health and the environment. These environmental laws include such areas as storm water and surface water management, soil, groundwater, endangered or imperiled species, natural resources and wetlands protection, and air quality protection and enhancement. Complying with environmental laws for existing conditions may result in delays, may cause us to incur substantial compliance and other costs, and may prohibit or severely restrict homebuilding activity in environmentally sensitive regions or areas.
Competition
The homebuilding industry is highly competitive. Homebuilders compete not only for homebuyers, but also for desirable properties, financing, raw materials and skilled labor. We compete with other local, regional and national homebuilders, often within larger subdivisions, that are designed, planned and developed by such homebuilders. We also compete with the resale market, including within our own communities, as well as foreclosure sales and the rental market. In addition, the consolidation of some homebuilding companies may create additional competitors that have greater financial, marketing and sales resources than we do and thus are able to compete more effectively against us, and there may be new entrants in the markets in which we currently conduct business. These competitive conditions in the homebuilding industry can affect our business and financial results through lower sales, lower selling prices, increased selling incentives, lower profit margins, impairments in the value of inventory and other assets, difficulty in acquiring suitable land, raw materials, and skilled labor at acceptable prices or terms, and delays in construction of our homes.
Seasonality
Our business is affected to some extent by the seasonality of home sales, which generally produce increased closings in the latter half of the year. However, periods of economic downturn in the industry can alter seasonal patterns.
Our business, financial condition, results of operations, cash flows, future performance, and the prevailing market price and performance of our common stock, may be adversely affected by a number of factors, including the matters discussed below. Certain statements and information set forth in this Annual Report on Form 10-K, as well as other written or oral statements made from time to time by us or by our authorized officers on our behalf, constitute “forward-looking statements” within the meaning of the Federal Private Securities Litigation Reform Act of 1995. Forward-looking statements in this document speak only as of the date of this Annual Report on Form 10-K and we
9
undertake no duty or obligation to update or revise our forward-looking statements, whether as a result of new information, future events or otherwise, except as required by law. Although we believe that the expectations, plans, intentions and projections reflected in our forward-looking statements are reasonable, such statements are subject to risks, uncertainties and other factors that may cause our actual results, performance or achievements to be materially different from any future results, performance or achievements expressed or implied by the forward-looking statements.
The risks, uncertainties and other factors that our stockholders and prospective investors should consider include the following:
The homebuilding industry is cyclical and affected by a variety of factors. Deterioration in industry conditions or in broader economic conditions could have material adverse effects on our business and financial results.
The homebuilding industry is highly cyclical and may be significantly affected by changes in general economic and business conditions, such as:
|
· |
employment and income levels; |
|
· |
availability of financing for homebuyers; |
|
· |
interest rates; |
|
· |
affordability; |
|
· |
consumer confidence; |
|
· |
labor availability; |
|
· |
supply of new and existing homes for sale or rent; |
|
· |
shifting housing demand due to population and demographic changes; and |
|
· |
the supply of developable land in our markets and the United States generally. |
Changes in these conditions may occur on a national scale or may acutely affect some of the regions or markets in which we operate more than others. Adverse conditions affecting certain markets could have a proportionately greater impact on us than on other homebuilding companies with smaller or less concentrated presences in these locally affected markets.
Adverse changes in economic conditions can cause demand and prices for our homes to diminish, cause us to take longer to build our homes, and/or make it more costly for us to do so. We may not be able to recover increased costs by raising prices in the event market conditions are weak and because the price of each home we sell is usually set several months before the home is delivered, as many customers sign their home purchase contracts before construction begins. Adverse economic conditions could also impact our customers’ ability to obtain suitable financing and cause some homebuyers to cancel or refuse to honor their home purchase contracts altogether. Any such adverse change nationally or in any of our markets could have a material adverse effect on our business, liquidity and results of operations.
Our success depends on the availability of suitable land acquisition opportunities at acceptable prices and our having sufficient liquidity to acquire such properties.
Our success in developing land and in building and selling homes depends in part upon the continued availability of suitable undeveloped land, partially developed land and improved lots at prices that meet our investment criteria. Such availability depends on a number of factors outside of our control, including competition in local markets for land and lots and restrictive governmental regulations. Should suitable land opportunities become less available, the number of homes we may be able to build and sell would be reduced, which would have an adverse effect on our revenue and profits. In addition, our ability to make land purchases will depend upon us having sufficient liquidity to fund such purchases.
10
If we are unable to develop our communities successfully or within expected timeframes, our results of operations could be adversely affected.
Before a community generates any revenues, time and material expenditures are required to acquire land, obtain development approvals and, in many cases, construct significant portions of project infrastructure, amenities, model homes and sales facilities. A decline in our ability to develop and market our communities successfully and to generate positive cash flow from these operations in a timely manner would have a material adverse effect on our business and results of operations and on our ability to service our debt and to meet our working capital requirements.
Increases in interest rates and reductions in the availability of mortgage financing could lower demand for our products, negatively impact our backlog and impact our operating results.
A substantial majority of our customers finance their homes through lenders that provide mortgage loans, including through our mortgage joint venture. Interest rates have been near historical lows for several years, which has increased the purchasing power of potential homebuyers. Increases in interest rates could lower demand for new homes because monthly mortgage costs would increase for potential homebuyers. Even if potential new homebuyers do not need financing, changes in interest rates could make it harder for them to sell their existing homes to potential buyers who need financing. This could prevent or limit our ability to attract new customers as well as our ability to fully realize our backlog because our sales contracts often include financing or other contingencies.
Following the most recent downturn in the housing industry, which began with defaults on subprime loans, lenders, regulators and others questioned the adequacy of lending standards and other credit requirements for several loan products and programs. This resulted in a tightening of lending and qualification standards. Fewer loan products, tighter loan qualifications and a reduced willingness of lenders to make loans, in turn, have made it more difficult for many buyers to sell their homes or to finance the purchase of our homes. A further reduction in loan products or tightening of qualification standards would have a further adverse effect on our results.
Additionally, the federal government plays a significant role in supporting mortgage lending through its conservatorship of Fannie Mae and Freddie Mac, both of which purchase home mortgages and mortgage-backed securities originated by mortgage lenders, and its insurance of mortgages originated by lenders through the FHA and the VA. The availability and affordability of mortgage loans, including consumer interest rates for such loans, could be adversely affected by a curtailment or cessation of the federal government’s mortgage-related programs or policies. The FHA may continue to impose stricter loan qualification standards, raise minimum down payment requirements, impose higher mortgage insurance premiums and other costs, and/or limit the number of mortgages it insures. Because the availability of Fannie Mae, Freddie Mac, FHA- and VA-backed mortgage financing is an important factor in marketing and selling many of our homes, any limitations, restrictions or changes in the availability of such government-backed financing could reduce our home sales, which could have a material adverse effect on our business, prospects, liquidity, financial condition and results of operations.
There have been substantial changes to the Internal Revenue Code, some of which could have an adverse effect on our business or financial results
In December 2017, the Tax Cuts and Jobs Act (“TCJA”) went into effect, which contains substantial changes to the Internal Revenue Code, effective January 1, 2018, some of which could have an adverse effect on our business. Among the changes that could make purchasing homes less attractive are (i) limitations on the ability of our homebuyers to deduct property taxes and (ii) limitations on the ability of our homebuyers to deduct mortgage interest. Although, depending on the income levels of potential homebuyers, many potential homebuyers are likely to experience positive changes under the new tax law, the resulting loss or reduction of homeowner tax deductions could adversely impact demand for and sales prices of new homes.
11
Price increases, supply shortages and other risks related to demand for building materials could increase our costs and delay deliveries.
In recent years the cost of building materials, including the price of concrete, lumber, drywall, and other important materials, has increased. Additionally, the homebuilding industry has, from time to time, experienced raw material shortages and been adversely affected by volatility in global commodity prices. Shortages in concrete, lumber, drywall or other important materials could result in delays in the start or completion of, or increase the cost of completing our homes, which could adversely impact our results of operations.
Our business and results of operations are dependent on the availability and skill of subcontractors. If we experience shortages in labor skill or supply, there could be delays and increased costs in developing our communities.
Substantially all of our construction work is done by third-party subcontractors with us acting as the general contractor. Accordingly, the timing and quality of our construction depend on the availability and skill of our subcontractors. Access to qualified labor may be affected by circumstances beyond our control, including labor disputes, shortages in qualified trades people, changes in immigration laws that reduce the available labor force and trends in labor force migration. While we generally anticipate being able to obtain sufficient materials and reliable subcontractors, and believe that our relationships with subcontractors are good, the availability of qualified subcontractors in our markets has at times been constrained. We do not have long-term contractual commitments with any subcontractors, and there can be no assurance that skilled subcontractors will continue to be available at reasonable rates and in the areas in which we conduct our operations.
To the extent the demand for labor and materials increases, as it has in recent years, our average per home cost of labor and building materials will likely increase, and our operating margins and results of operations may be adversely affected. Further, the inability to contract with skilled subcontractors at reasonable costs on a timely basis could have a material adverse effect on our business, prospects and results of operations.
Our current efforts to grow and expand our operations could have a material adverse effect on our cash flows or profitability.
In 2017, we announced the acquisition of MMLC Texas Builders, LLC (doing business as Oakdale Homes and Hampton Homes), which closed in 2018 and expanded our operations into Texas. Also in 2017, we acquired Savvy Homes, LLC, and in 2015, we acquired Bonterra Builders, LLC, both of which significantly expanded our operations in the Carolinas. We continue to consider opportunities for growth, in both our existing markets and in new markets. Additional growth of our business, either through increased land purchases, the development of larger projects or the acquisition of existing homebuilders, may have a material adverse effect on our cash flows or profitability. Any expansion of our business into new markets or new businesses, or significant growth in existing markets, could divert the attention of senior management from our existing business and could fail due to our relative lack of experience in those markets or businesses. In addition, when we acquire other homebuilders, such acquisitions could be difficult to integrate with our operations and could require us to assume unanticipated liabilities and expenses. Acquisitions also involve numerous other risks, including (i) the risk of impairing inventory, goodwill and other assets related to the acquisition, (ii) risks associated with our ability to implement and maintain effective controls, procedures and policies for the acquired business, (iii) the diversion of management’s attention and resources from other business concerns, (iv) risks associated with entering markets in which we have limited or no direct experience, (v) risks associated with the combination of different corporate cultures, and (vi) the potential loss of key employees of the acquired company.
Homebuilding is very competitive, and competitive conditions could adversely affect our business or financial results.
The homebuilding industry is highly competitive. Homebuilders compete not only for homebuyers, but also for desirable properties, financing, raw materials and skilled labor. We compete with other local, regional and national homebuilders, often within larger subdivisions. We also compete with the home re-sale market, foreclosures and rental properties. In addition, many of our competitors have greater financial, marketing and sales resources than we do and thus may be able to compete more effectively against us. Finally, any damage to our reputation, which may spread
12
widely and quickly through digital and social media, could impair our ability to compete for homebuyers. These competitive conditions in the homebuilding industry can affect our business and result in lower sales, lower selling prices and lower profit margin, among other things.
Our business is capital intensive and requires access to sufficient capital.
Our business is capital intensive and requires significant up-front expenditures to acquire land and begin development. We must make significant capital expenditures to commence development of a community and bear the costs of the development until we sell the homes. Accordingly, our ability to access capital is a key factor in our ability to cover our operating expenses, service our indebtedness, and fund our other liquidity needs. We expect to seek and raise additional capital from time to time from a variety of sources, including bank financings and/or securities offerings, to cover our liquidity needs and grow our business. Deterioration in our creditworthiness or a constriction of the capital markets could reduce the sources of liquidity available to us and increase our cost of capital. Any difficulty in obtaining sufficient capital for planned development expenditures could cause project delays and any such delay could result in cost increases and may adversely affect our sales and future results of operations and cash flows.
We may not be able to generate sufficient cash to service all of our indebtedness, including our outstanding notes, and may be forced to take other actions to satisfy our obligations under our indebtedness, which may not be successful.
As of December 31, 2017, the total principal amount of our debt was $480.0 million. Our ability to make scheduled payments on or refinance our debt obligations, including the 6.00% Senior Convertible Notes due 2020 and the 6.625% Senior Notes due 2022 (collectively, the “Notes”) and our revolving credit facility, depends on our financial condition and operating performance, which are subject to prevailing economic and competitive conditions and to certain financial, business, legislative, regulatory and other factors beyond our control. If we are significantly and negatively impacted by any of the foregoing, we may be unable to maintain a level of cash flows from operating activities sufficient to permit us to pay the principal, premium, if any, and interest on our indebtedness, including the Notes, as the same shall become due and payable.
If our cash flows and capital resources are insufficient to fund our debt service obligations, we could face substantial liquidity problems and could be forced to reduce or delay investments and capital expenditures or to dispose of material assets or operations, seek additional debt or equity capital or restructure or refinance our indebtedness, including the Notes. Under such circumstances, we may not be able to affect any such alternative measures on commercially reasonable terms or at all and, even if successful, those alternative actions may not allow us to meet our scheduled debt service obligations. The credit agreement governing our revolving credit facility and the indentures that govern the Notes restrict our ability to dispose of assets and use the proceeds from those dispositions and may also restrict our ability to raise debt or equity capital to be used to repay other indebtedness when it becomes due. We may not be able to consummate those dispositions or to obtain proceeds in an amount sufficient to meet any debt service obligations when due.
If we cannot make scheduled payments on our debt, we will be in default and holders of the Notes could declare all outstanding principal and interest to be due and payable, the lenders under the revolving credit facility could terminate their commitments to loan money, and we could be forced into bankruptcy or liquidation.
The terms of the credit agreement governing our revolving credit facility and the indentures governing the Notes restrict our current and future operations, particularly our ability to respond to changes or to take certain actions.
The indentures governing the Notes contain, and the credit agreement governing our revolving credit facility contains, a number of restrictive covenants that impose significant operating and financial restrictions on us and may limit our ability to engage in acts that may be in our long-term best interest, including restrictions on our ability to:
|
· |
incur additional indebtedness and guarantee indebtedness; |
|
· |
pay dividends or make other distributions or repurchase or redeem our capital stock; |
|
· |
prepay, redeem or repurchase certain debt; |
|
· |
issue certain preferred stock or similar equity securities; |
13
|
· |
make loans and investments; |
|
· |
sell assets; |
|
· |
incur liens; |
|
· |
enter into transactions with affiliates; |
|
· |
alter the business we conduct; |
|
· |
enter into agreements restricting our subsidiaries’ ability to pay dividends; and |
|
· |
consolidate, merge or sell all or substantially all of our assets. |
In addition, the restrictive covenants in the credit agreement governing our revolving credit facility require us to maintain specified financial ratios and satisfy other financial condition tests. Our ability to meet those financial ratios and tests can be affected by events beyond our control.
A breach of the covenants or restrictions under the indentures governing the Notes or under the credit agreement governing our revolving credit facility could result in an event of default under the applicable indebtedness. Such a default may allow the creditors to accelerate the related debt and may result in the acceleration of any other debt to which a cross-acceleration or cross-default provision applies. In addition, an event of default under the credit agreement governing our revolving credit facility would permit the lenders under our revolving credit facility to terminate all commitments to extend further credit under that facility. In the event our lenders or noteholders accelerate the repayment of our borrowings, we and our subsidiaries may not have sufficient assets to repay that indebtedness. As a result of these restrictions, we may be:
|
· |
limited in how we conduct our business; |
|
· |
unable to raise additional debt or equity financing to operating during general economic or business downturns; or |
|
· |
unable to compete effectively or to take advantage of new business opportunities. |
These restrictions may affect our ability to grow in accordance with our strategy. In addition, our future financial results, our substantial indebtedness and our credit ratings could adversely affect the availability and terms of our financing.
Our variable rate indebtedness subjects us to interest rate risk, which could cause our debt service obligations to increase significantly.
Borrowings under our revolving credit facility, if any, are at variable rates of interest and expose us to interest rate risk. If interest rates were to increase, our debt service obligations on the variable rate indebtedness would increase even though the amount borrowed remained the same, and our net income and cash flows, including cash available for servicing our indebtedness, will correspondingly decrease.
Despite our current level of indebtedness, we and our subsidiaries may still be able to incur substantially more debt. This could further exacerbate the risks to our financial condition described above.
We and our subsidiaries may be able to incur significant additional indebtedness in the future. Although the indentures related to our Notes contain, and the credit agreement governing our revolving credit facility contains, restrictions on the incurrence of additional indebtedness, these restrictions are subject to a number of qualifications and exceptions, and the additional indebtedness incurred in compliance with these restrictions could be substantial. These restrictions also will not prevent us from incurring obligations that do not constitute indebtedness. If new debt is added to our current debt levels, the related risks that we face could intensify.
Additionally, agreements governing any future indebtedness may contain restrictions on our ability to incur indebtedness, grant certain liens to support indebtedness, enter into certain affiliate transactions and make certain distributions. These covenants could adversely affect our ability to finance our future operations or capital needs, engage in, expand or pursue our business activities and prevent us from engaging in certain transactions that might otherwise be considered beneficial to us.
14
We may be unable to purchase the Notes upon a fundamental change.
We may not have the funds necessary to fulfill our obligations under the 6.00% Senior Convertible Notes due 2020 following a “fundamental change,” as defined in the indenture governing such notes. Upon the occurrence of a defined fundamental change, which definition includes a change of control (whether it be voluntary or involuntary), we will be required to offer to repurchase all of the applicable outstanding notes at 100% of the principal amount thereof, plus accrued and unpaid interest to the date of repurchase. Similarly, our 6.625% Senior Notes due 2022 require us to repurchase all or a portion of the outstanding notes at 101% of their principal amount, plus accrued and unpaid interest upon certain change of control transactions. However, we may not have sufficient funds at the time of any such event to make the required repurchase of the Notes. Our failure to make or complete an offer to repurchase Notes in connection with any such event would place us in default under each indenture governing the applicable Notes.
An inability to obtain additional letters of credit and surety bonds could limit our future growth.
In addition, we use letters of credit and surety bonds to secure our performance under various construction and land development agreements, escrow agreements, financial guarantees and other arrangements. Should our future performance or economic conditions continue to make such letters of credit and surety bonds costly or difficult to obtain or lead to us being required to collateralize such instruments to a greater extent than previously, our business and financial results could be adversely affected.
Cancellations of home sales orders in backlog may increase as homebuyers choose to not honor their contracts.
Our backlog reflects sales contracts with our homebuyers for homes that have not yet been delivered. In cases of cancellation, we remarket the home and, subject to certain exceptions, usually retain any deposits. Nevertheless, the deposits may not cover the additional costs involved in remarketing the home, replacing installed options, reducing the sales price or increasing incentives on the completed home for greater marketability and carrying higher inventory. If prices for new homes decline, if competitors increase their use of sales incentives, if interest rates increase, if the availability of mortgage financing diminishes or if there is a downturn in local or regional economies or in the national economy, U.S. homebuyers may terminate their existing home purchase contracts with us in order to negotiate for a lower price or because they cannot, or will not, complete the purchase. Any significant increase in cancellations of home sales orders in backlog in the future could have a material adverse impact on our results of operations and financial condition.
The geographic concentration of our operations in Florida, the Carolinas, Arizona and Texas subjects us to an increased risk of loss of revenue or decreases in the market value of our land and homes in these regions from factors which may affect any of these regions.
Our operations are concentrated in Florida, the Carolinas, Arizona and Texas. Due to the concentrated nature of our operations, negative factors affecting one or more of these geographic regions at the same time could result in a relatively greater impact on our results of operations than they might have on other companies that have a more diversified portfolio of operations. In particular, our operations are heavily concentrated in Florida and negative events effecting this region, such as natural disasters, could have a disproportionate impact on our business and results of operations.
Inflation or deflation could adversely affect our business and financial results.
Inflation can adversely affect us by increasing costs of land, materials and labor. We may not be able to offset any such cost increases with higher sales prices. In addition, inflation is often accompanied by higher interest rates, which have a negative impact on housing demand. In such an environment, we may not be able to raise home prices sufficiently to keep up with the rate of inflation and we may not be able to pass on any such increases to customers who have already entered into sales contracts, which may be well in advance of the construction of the home, which could cause our margins to decrease. Moreover, with inflation, our costs of capital increase, and the purchasing power of our cash resources may decline.
15
Alternatively, a significant period of deflation could cause a decrease in overall spending and borrowing levels. This could lead to a further deterioration in economic conditions, including an increase in the rate of unemployment. Deflation could also cause the value of our inventories to decline or reduce the value of existing homes below the related mortgage loan balance, making it impractical for potential homebuyers to sell their existing homes in favor of a new home.
Homebuilding is subject to home warranty and construction defect claims and other litigation risks in the ordinary course of business that can be significant. Our operating expenses could increase if we are required to pay higher insurance premiums or incur substantial litigation costs with respect to such claims and risks.
As a homebuilder, we are subject to home warranty and construction defect claims arising in the ordinary course of business. Construction defects may occur on projects and developments and may arise during a significant period of time after completion. Defects arising on a development attributable to us may lead to significant contractual or other liabilities as well as reputational harm. As a consequence, we maintain products and completed operations excess liability insurance, obtain indemnities and certificates of insurance from subcontractors generally covering claims related to damages resulting from faulty workmanship and materials, and create warranty and customer service reserves for the homes we sell based on historical experience in our markets and our judgment of the risks associated with the types of homes built. Although we actively monitor our insurance reserves and coverage, because of the uncertainties inherent to these matters, we cannot provide assurance that our insurance coverage, our subcontractor arrangements and our reserves will be adequate to address all of our warranty and construction defect claims in the future.
In addition, decreases in home values as a result of general economic conditions may result in an increase in construction defect claims, as well as claims based on marketing and sales practices. Our reserves may not cover all of the claims arising from such issues, or we may experience litigation costs and losses that could impact our profitability. Even if we are successful in defending such claims, we may incur significant costs.
A major health and safety incident relating to our business could be costly in terms of potential liabilities and reputational damage.
Building sites and amenity facilities are inherently dangerous, and operating in the homebuilding industry poses certain inherent health and safety risks. Due to health and safety regulatory requirements and the number of projects we work on, health and safety performance is critical to the success of all areas of our business. Any failure in health and safety performance may result in penalties for non-compliance with relevant regulatory requirements, and a failure that results in a major or significant health and safety incident is likely to be costly in terms of potential liabilities incurred as a result. Such a failure could generate significant negative publicity and have a corresponding impact on our reputation, our relationships with relevant regulatory agencies or governmental authorities, and our ability to sell homes, which, in turn, could have a material adverse effect on our business, financial condition and operating results.
Our business is seasonal in nature, and our quarterly operating results can fluctuate.
Our quarterly operating results generally fluctuate by season. We typically experience the highest new home order activity in the winter and spring months, although new order activity is also highly dependent on the number of actively selling communities and the timing of new community openings as well as other market factors. We may experience higher liquidity demands during the first half of the calendar year as we incur the costs associated with new construction resulting from the increased sales volume. If, due to construction delays or other reasons, we are unable to deliver our expected number of homes in the second half of the calendar year, our full year results of operations may be adversely affected.
We may be adversely affected by weather conditions and natural disasters.
Weather conditions and natural disasters, such as hurricanes, tornadoes, earthquakes, wildfires, droughts and floods, can harm our homebuilding business. These can delay home closings, the development of raw land positions, adversely affect the cost or availability of materials or labor, or damage homes under construction. The climates of certain of the states in which we operate present increased risks of adverse weather or natural disasters. In particular, a
16
large portion of our homebuilding operations are concentrated in Florida and the Carolinas, which are subject to increased risk of hurricanes. Additionally, if our insurance does not fully cover losses resulting from these events or any related business interruption, our assets, financial condition and capital resources could be adversely affected. Furthermore, even if a natural disaster occurs in a region where were are not operating, our existing markets could be impacted in the event available labor shifts to the markets impacted by the natural disaster.
Resource shortages or rate fluctuations could have an adverse effect on our operations.
The areas in which we operate are subject to resource shortages, including significant changes to the availability of potable and non-potable water. Shortages of natural resources, particularly water, may make it more difficult for us to obtain regulatory approval for new developments or present challenges within existing developments. We may incur additional costs and may not be able to complete construction on a timely basis if such shortages continue. Furthermore, these shortages may adversely affect the regional economies in which we operate, which may reduce demand for our homes. In addition, the cost of petroleum products, which are used both to deliver our materials and to transport our employees to our job sites, fluctuates and may increase as a result of geopolitical events or accidents. This could also result in higher prices for any product utilizing petrochemicals. These cost increases may have an adverse effect on our operating margin and results of operations.
Values of, and costs associated with, our land and lot inventory could adversely affect our business or financial results.
The risks inherent in controlling or purchasing, holding and developing land for new home construction are substantial and increase as consumer demand for housing decreases. The value of undeveloped land, developed lots and housing inventories can fluctuate significantly as a result of changing market conditions. If the fair market value of the land, lots and inventories we hold decreases, we may be required to reduce the carrying value of these assets and take significant impairment charges. We may have acquired options on or bought and developed land at a cost we will not be able to recover fully or on which we cannot build and sell homes profitably. In addition, our deposits for developed lots controlled under option or similar contracts may be put at risk. Inventory carrying costs can be significant and can result in reduced margins or losses in poorly performing communities or markets. Because future market conditions are uncertain, we cannot provide assurance that we will be successful in managing our future inventory risks or avoiding future impairment charges. Any material write-downs of assets could have a material adverse effect on our business, prospects, liquidity, financial condition and results of operations.
In addition, some real estate investments are relatively difficult to sell quickly. As a result, our ability to promptly sell one or more properties in response to changing economic, financial and investment conditions may be limited, and we may be forced to hold non-income producing assets for an extended period of time. We cannot predict whether we will be able to sell any property for the price or on the terms that we set or whether any price or other terms offered by a prospective purchaser would be acceptable to us. We also cannot predict the length of time needed to find a willing purchaser and to close the sale of a property.
An oversupply of alternatives to new homes and reduction in homebuyer demand can adversely impact our ability to sell new homes.
An oversupply of alternatives to new homes, including foreclosed homes, homes held for sale by investors and speculators, other existing homes and rental properties, can adversely impact our ability to sell new homes, depress new home prices and reduce margins on the sales of new homes. High levels of foreclosures not only contribute to additional inventory available for sale, but can also reduce appraisal valuations for new homes, potentially resulting in lower sales prices.
Reduced home sales may impair our ability to recoup development costs or force us to absorb additional costs.
We incur many costs before we begin to build homes in a community. Depending on the stage of development a land parcel is in when acquired, such costs may include costs of preparing land; finishing and entitling lots; installing roads, sewers, water systems and other utilities; building amenities in our age-restricted and age-targeted communities;
17
paying taxes and other costs related to ownership of the land on which we plan to build homes; and incurring promotional marketing and overhead expenses to prepare for the opening of a new home community for sales. In addition, local municipalities may impose requirements resulting in additional costs. If the rate at which we sell and deliver homes slows or falls, or if we delay the opening of new home communities for sales due to development delays or other reasons, we may incur additional costs, and it will take a longer period of time for us to recover our costs.
TPG Aviator, L.P. is a significant stockholder and may have conflicts of interest with us in the future.
TPG Aviator, L.P. (“TPG Aviator”) beneficially owned approximately 43.7% of our common stock as of December 31, 2017, and is our largest single stockholder. In addition, so long as TPG Aviator owns at least 10% of our issued and outstanding common stock, TPG Aviator has a pre-emptive right to participate in our future equity issuances, subject to certain conditions. This concentration of ownership in one stockholder could potentially be disadvantageous to other stockholders’ interests. In addition, if TPG Aviator were to sell or otherwise transfer all or a large percentage of its holdings, our stock price could decline and we could find it difficult to raise capital, if needed, through the sale of additional equity securities.
The interests of TPG Aviator and its affiliates may differ from the interests of our other stockholders in material respects. For example, TPG Aviator and its affiliates may have an interest in directly or indirectly pursuing acquisitions, divestitures, financings or other transactions that, in their judgment, could enhance their other equity investments, even though such transactions might involve risks to us. TPG Aviator and its affiliates are in the business of making or advising on investments in companies, including businesses that directly or indirectly compete with our business. They may also pursue acquisition opportunities that may be complementary to our business, and, as a result, those acquisition opportunities may not be available to us.
Our stockholders agreement with TPG Aviator grants TPG Aviator certain rights that may restrain our ability to take various actions in the future.
In connection with TPG Aviator’s June 2013 investment in us, we entered into a stockholders agreement with TPG Aviator, pursuant to which we granted TPG Aviator certain rights that may restrict our ability to take certain actions in the future. Under the stockholders agreement, we agreed to increase the size of our board of directors to ten members and we appointed four directors designated by TPG Aviator.
TPG Aviator has the right to nominate a specified number of directors to the board and to appoint a specified number of such directors to each committee of the board of directors for so long as TPG Aviator’s ownership percentage of our common stock is equal to or greater than 5%. TPG Aviator is entitled to nominate to the board: (i) four directors if TPG Aviator’s ownership percentage of our common stock is at least 30%, (ii) three directors if TPG Aviator’s ownership percentage is at least 20% but less than 30%, (iii) two directors if TPG Aviator’s ownership percentage is at least 15% but less than 20%, and (iv) one director if TPG Aviator’s ownership percentage is at least 5% but less than 15%.
In addition, we agreed to constitute each of our compensation committee and finance committee as a five member committee and (i) for so long as the ownership of TPG Aviator and its affiliates of our common stock is at least 15%, TPG Aviator has the right to have two TPG Aviator designated board members appointed to each such committee (of which all such TPG Aviator designees have been appointed), and (ii) for so long as the ownership of TPG Aviator and its affiliates of our common stock is at least 5% but less than 15%, TPG Aviator has the right to have one TPG Aviator designated board member appointed to each such committee. For so long as the ownership of TPG Aviator and its affiliates of our common stock is at least 5%, each other committee of our board will be constituted as three member committees, and TPG Aviator has the right to have one TPG Aviator designated board member appointed to each such committee (of which all such TPG Aviator designees have been appointed).
18
In addition, for so long as TPG Aviator’s ownership percentage of our common stock is equal to or greater than 5%, the rights and responsibilities of the finance committee of the board will include approval of (1) except for certain permitted issuances relating to outstanding rights to purchase or acquire our capital stock, compensation arrangements and acquisition transactions, any sale or issuance of any capital stock or other security, (2) any redemption, purchase, repurchase or other acquisition of securities by AV Homes or any subsidiary, other than in connection with equity compensation arrangements, (3) any incurrence of indebtedness or certain debt-like obligations, with limited exceptions, (4) any hiring or firing of members of senior management, (5) any land or builder acquisitions or dispositions, any acquisitions or dispositions of subsidiaries or any other acquisitions or dispositions, in each case, that are greater than $5.0 million (including total expected capital requirements and development costs), (6) any capital expenditures or land commitments over an agreed upon budget, as approved by our board of directors, or otherwise greater than $10.0 million, and (7) any entry into new markets or lines of business. During such period, the rights and responsibilities of the compensation committee will include approval of (1) any adoption of any new, or expansion of any existing, equity incentive plan, and (2) any changes to, or the adoption of, any compensation arrangements for any members of our board of directors or senior management. During such period, our board may not approve such matters without the requisite committee approval, which in most cases will require the approval of at least one of the committee members appointed by TPG Aviator.
Pursuant to the terms of the stockholders agreement, TPG Aviator also has the right to consent to certain actions related to our corporate existence and governance, including any change in the rights and responsibilities of either the finance committee or the compensation committee, for so long as TPG Aviator’s ownership percentage of our common stock is equal to or greater than 10% and equal to or greater than 25% of the number of shares owned by them at closing of the TPG Aviator investment.
We are dependent on the services of our senior management team and certain of our key employees, and the loss of their services could hurt our business.
We believe that our management’s experience is a competitive strength, and that our future success depends upon our ability to retain these executives. In addition, we believe that our ability to attract, train, assimilate and retain new skilled personnel is important to the success of our business. If we are unable to retain our senior management team and certain of our key employees, or attract, train, assimilate or retain other skilled personnel in the future, it could hinder the execution of our business strategy.
Government regulations could increase the cost and limit the availability of our development and homebuilding projects and adversely affect our business or financial results.
We are subject to extensive and complex regulations that affect land development and home construction, including zoning, density restrictions, building design and building standards. These regulations often provide broad discretion to the administering governmental authorities as to the conditions we must meet prior to being approved, if approved at all. Land parcels we acquire are often undeveloped and sometimes do not have all (or sometimes any) of the governmental approvals necessary to develop and construct homes. If we are unable to obtain these approvals or obtain approvals that restrict our ability to use the land in ways we do not anticipate, the value of the parcel will be negatively impacted. We are subject to determinations by these authorities as to the adequacy of water and sewage facilities, roads and other local services. Laws and regulations are subject to frequent change and often result in increased construction or other costs related to our business. In some instances, we must comply with laws that require commitments from us to provide roads and other offsite infrastructure to be in place prior to the commencement of new construction. New housing developments may also be subject to various fees and assessments for schools, parks, streets and other public improvements. Any of these regulatory issues can limit or delay home construction and increase our operating costs.
We are also subject to a variety of local, state and federal laws and regulations concerning land use and the protection of health, safety and the environment. The particular impact and requirements of environmental laws that apply to any given community vary greatly according to the community site, the site’s environmental conditions and the present and former use of the site. We expect that increasingly stringent requirements will be imposed on homebuilders in the future. Environmental laws may result in delays, cause us to implement time consuming and expensive compliance programs and prohibit or severely restrict development in certain environmentally sensitive regions or areas.
19
Environmental regulations can also have an adverse impact on the availability and price of certain raw materials, such as lumber. Furthermore, we could incur substantial costs, including cleanup costs, fines, penalties and other sanctions and damages from third-party claims for property damage or personal injury, as a result of our failure to comply with, or liabilities under, applicable environmental laws and regulations.
Laws and regulations governing the residential mortgage industry could have material adverse effects on our business and financial results.
In 2017, we established a joint venture, AVH Mortgage, LLC, to provide mortgage related services to homebuyers. The residential mortgage lending industry remains under intense scrutiny and is heavily regulated at the federal, state and local levels. Although we do not originate mortgages, we are directly or indirectly subject to certain of these regulations. Changes to existing laws or regulations or adoption of new laws or regulations could require our joint venture to incur significant compliance costs. A material failure to comply with any of these laws or regulations could result in the loss or suspension of required licenses or other approvals, the imposition of monetary penalties, and restitution awards or other relief. Any of these outcomes could materially and adversely affect our results of operations.
Our mortgage joint venture could be materially and adversely affected by lack of sole decision making authority, reliance on our co-venturer’s financial condition and disputes between us and our co-venturer.
We have co-invested with an established mortgage broker in the AVH Mortgage, LLC joint venture. As a result, we will not be in a position to exercise sole decision-making authority regarding mortgage services offered by this joint venture, and our investment may be illiquid due to our lack of control. Investments in such a joint venture may, under certain circumstances, involve risks not present when a third-party is not involved, including the possibility that the co-venturer might become bankrupt, fail to fund its share of required capital contributions or otherwise meet its contractual obligations, make poor business decisions or block or delay necessary decisions. The co-venturer may have economic or other business interests or goals that are inconsistent with our business interests or goals, and may be in a position to take actions contrary to our policies or objectives. Such investments may also have the potential risk of impasses on decisions because neither us nor the co-venturer would have full control over the joint venture. Disputes between us and the co-venturer may result in litigation or arbitration that would increase our expenses and prevent our officers and/or directors from focusing their time and effort on our business. In addition, we may in certain circumstances be liable for the actions of our co-venturer.
We have a significant number of development liabilities related to our predecessor and its affiliates, over which we have little or no control as to the dates that payment may be required, and which could have an adverse effect on our results of operations.
We have a significant number of development liabilities related to our predecessor and its affiliates, most of which relate to class action settlement agreements entered into by us in 1974 and the bankruptcy of our predecessor and its affiliates in the mid-1970s (collectively, the “Orders”). Among other things, under the Orders, we are obligated to install certain utility infrastructure to lots sold by us in Rio Rico, Arizona and Poinciana, Florida prior to such Orders (“Affected Lots”). Historically, we have identified such contingent obligations with respect to the Orders as evaluated by the reports of various independent engineers. Our estimate of the liability has been accrued and is included in the estimated development liability line item in our consolidated balance sheet as of December 31, 2017. If a significant number of the owners of the Affected Lots require us to install infrastructure in Rio Rico or Poinciana, it is possible that it would have a material impact on our liquidity.
Our net operating loss carryforwards could be substantially limited if we experience an ownership change, as defined in the Internal Revenue Code.
From the end of our 2007 fiscal year through 2014, we generated net operating losses (“NOL”) due to significant impairments and other factors affecting financial performance. Under federal tax laws, we can use our NOL (and certain related tax credits) to reduce our future taxable income for up to 20 years, after which they expire for such purposes. Until they expire, we can carry forward the NOL (and certain related tax credits) that we do not use in any particular year to reduce our taxable income in future years.
20
The benefits of our NOL, built-in losses and tax credits would be reduced or eliminated if we experience an “ownership change,” as determined under Internal Revenue Code Section 382 (“Section 382”). A Section 382 ownership change occurs if a stockholder or a group of stockholders who are deemed to own at least 5% of our common stock increase their ownership by more than 50 percentage points over their lowest ownership percentage within a rolling three-year period. If an ownership change were to occur, Section 382 would impose an annual limit on the amount of NOL we could use to reduce our taxable income equal to the product of the total value of our outstanding equity immediately prior to the ownership change (reduced by certain items specified in Section 382) and the federal long-term tax-exempt interest rate in effect for the month of the ownership change. A number of complex rules apply in calculating this annual limit.
Changes in global or regional environmental conditions and governmental actions in response to such changes may adversely affect us by increasing the costs of or restricting our planned or future growth activities.
There is growing concern from members of the scientific community and the general public that an increase in global average temperatures due to emissions of greenhouse gases and other human activities have or will cause significant changes in weather patterns and increase the frequency and severity of natural disasters. An increased frequency or duration of extreme weather conditions and environmental events could limit, delay and/or increase the costs to develop land and build new homes and reduce the value of our land and housing inventory in locations that become less desirable to consumers or blocked to development. Projected climate change, if it occurs, may exacerbate the scarcity of water and other natural resources in affected regions, which could limit, prevent or increase the costs of residential development in certain areas. In addition, government mandates, standards or regulations intended to mitigate or reduce greenhouse gas emissions or projected climate change impacts could result in prohibitions or severe restrictions on land development in certain areas, increased energy, transportation and raw material costs that make building materials less available or more expensive, or cause us to incur compliance expenses and other financial obligations to meet permitting or land development or home construction-related requirements that we may be unable to fully recover (due to market conditions or other factors), and may reduce our housing gross profit margins and may adversely impact our consolidated financial statements, potentially to a material degree. As a result, climate change impacts, and laws and land development and home construction standards, and/or the manner in which they are interpreted or implemented, to address potential climate change impacts, could increase our costs and have a long-term adverse impact on our business and our consolidated financial statements.
As we continue to increase our dependence on digital technologies to conduct operations, our risks associated with cyber security have also increased, leaving us subject to possible frequent and severe cyber incidents.
For a number of years, we have been increasing our reliance on computers and digital technology. Many of our files have been digitized and more of our employees are working in almost paperless environments. We have also made changes, some significant, to our hardware and software environments and some of these transitions have not been successful, taken longer than anticipated and/or are still in progress. All of these activities may give rise to material cyber security risks and potential costs and consequences that cannot be estimated or predicted with any certainty. We have outsourced a number of our information technology (“IT”) functions, including IT support of our infrastructure and software. We continue to take steps to secure, or ensure the security of, our confidential information, including information stored by our vendors and data storage providers, from third parties who may be seeking to infiltrate our systems or those of third-parties with whom we do business. At this time we do not have any specific insurance for cyber security events. Management will continue to monitor our IT environment and determine whether our business operations merit further insurance coverage as we consider a future cyber-attack a material concern that could have severe financial and other business implications.
21
There may be future sales or other dilution of our equity, which may adversely affect the market price of our common stock.
Issuances of shares of common stock upon conversion of our 6.00% Senior Convertible Notes due 2020, as well as the issuance of a substantial number of shares of our common stock or other equity-related securities either for new consideration or in connection with restructuring existing indebtedness, could depress the market price of our common stock and impair our ability to raise capital through the sale of additional equity securities. Any such future issuances could also dilute the ownership interests of stockholders, and we cannot predict the effect that future issuances of our common stock or other equity-related securities would have on the market price of our common stock, nor can we predict our future needs to fund our operations or balance sheet with future equity issuances.
We have significant intangible assets. If these assets become impaired, then our profits and shareholders’ equity may be reduced.
We have significant intangible assets related to business combinations. We evaluate the recoverability of intangible assets whenever facts and circumstances indicate the carrying amount may not be recoverable. If the carrying value of intangible assets is deemed impaired, the carrying value is written down to fair value. This would result in a charge to our earnings. If management’s expectations of future results and cash flows decrease significantly, impairments of the remaining intangible assets may occur.
ITEM 1B. UNRESOLVED STAFF COMMENTS
None.
Our corporate headquarters are located in leased office facilities at 8601 N. Scottsdale Rd., Suite 225, Scottsdale, Arizona 85253. Our homebuilding divisions lease office space in the geographic locations in which they conduct their day-to-day operations.
Because of the nature of our homebuilding operations, significant amounts of property are held as inventory in the ordinary course. Such properties are not included in response to this Item.
We are involved in litigation from time to time in the ordinary course of our business, much of which is related to alleged construction defects or our amenity operations. We do not believe that any current pending legal or administrative proceedings or disputes will have a material adverse effect on our business, financial condition or results of operations. However, we cannot assure you that the ultimate resolution of any of these proceedings or disputes will not have a material adverse effect on our business, financial condition and results of operations. For additional information related to pending legal proceedings, see Note 12, Commitments and Contingencies, to the consolidated financial statements included in Part II of this report, which is incorporated herein by reference.
ITEM 4. MINE SAFETY DISCLOSURES
Not applicable.
22
ITEM 4A. EXECUTIVE OFFICERS OF THE REGISTRANT
The following table includes information with respect to all persons serving as executive officers of AV Homes as of the date of this Annual Report on Form 10-K. Officers serve until their successors are elected or until their earlier resignation or removal.
|
Name |
Age |
Office and Business Experience |
||
|
Roger A. Cregg |
61 |
Mr. Cregg has served as our President, Chief Executive Officer, and member of our Board of Directors since December 2012. Prior to this, Mr. Cregg served as Senior Vice President of Finance and Chief Financial Officer of The ServiceMaster Company, a residential and commercial service company, from August 2011 through November 2012. He served as Executive Vice President of PulteGroup, Inc. (formerly known as Pulte Homes, Inc.), a national homebuilding company, from May 2003 to May 2011 and Chief Financial Officer of PulteGroup, Inc. from January 1998 to May 2011. He served as Senior Vice President of PulteGroup, Inc. from January 1998 to May 2003. He has served as a director of Comerica Incorporated since 2006. He was a director of the Federal Reserve Bank of Chicago, Detroit Branch, from January 2004 to December 2009 and served as Chair from January to December 2006. |
||
|
Michael S. Burnett |
50 |
Mr. Burnett has served as our Executive Vice President and Chief Financial Officer since October 2013. Prior to this, Mr. Burnett served as Group Vice President, Finance, Treasury and Investor Relations for JDA Software Group, Inc., a leading global software provider offering supply chain management solutions, from November 2009 to October 2013. Previously, he served as Chief Financial Officer for American Traffic Solutions, Inc., a leading provider of technology and business solutions for traffic safety and electronic toll collection programs worldwide. He also served as Senior Vice President and Treasurer and held various financial roles for Allied Waste Industries, Inc. from 1998 to 2008. Mr. Burnett began his career as a certified public accountant with Arthur Andersen LLP, from 1990 to 1998, providing audit and business advisory services. |
||
|
S. Gary Shullaw |
39 |
Mr. Shullaw has served as our Executive Vice President, General Counsel and Corporate Secretary since November 2014. From November 2009 through November 2014, he worked for ON Semiconductor Corporation, a semiconductor manufacturing company, where he served as Senior Corporate Counsel. From 2008 to 2009, Mr. Shullaw was a corporate and securities associate at the law firm of DLA Piper and from 2005 to 2008 he was a corporate associate at Quarles & Brady, LLP. |
No executive officer of AV Homes has any family relationship with any other executive officer or director of AV Homes.
23
ITEM 5. MARKET FOR REGISTRANT’S COMMON EQUITY, RELATED STOCKHOLDER MATTERS AND ISSUER PURCHASES OF EQUITY SECURITIES
Our common stock is traded on the NASDAQ Global Select Market (“NASDAQ”) under the symbol “AVHI.” There were 2,381 record holders of common stock at February 15, 2018.
The high and low sales prices per share, as reported, for each fiscal quarter during the last two years were:
|
|
|
2017 |
|
2016 |
|
||||||||
|
Quarter Ended |
|
High |
|
Low |
|
High |
|
Low |
|
||||
|
March 31 |
|
$ |
19.13 |
|
$ |
14.90 |
|
$ |
13.30 |
|
$ |
8.50 |
|
|
June 30 |
|
$ |
20.30 |
|
$ |
15.50 |
|
$ |
13.79 |
|
$ |
10.72 |
|
|
September 30 |
|
$ |
20.50 |
|
$ |
14.65 |
|
$ |
16.97 |
|
$ |
11.76 |
|
|
December 31 |
|
$ |
19.00 |
|
$ |
15.90 |
|
$ |
17.45 |
|
$ |
15.05 |
|
We have not declared any cash dividends on our common stock since our incorporation and have no current plan to pay cash dividends. We did not repurchase any outstanding shares of common stock in 2017.
Performance Graph
The following line graph compares for the fiscal years ended December 31, 2013, 2014, 2015, 2016 and 2017 (a) the yearly cumulative total shareholder return (i.e., the change in share price plus the cumulative amount of dividends, assuming dividend reinvestment, divided by the initial share price, expressed as a percentage) on our common shares, with (b) the cumulative total return of the S&P 500 Index, and with (c) the Dow Jones Home Construction Index. The Dow Jones Home Construction Index is a widely-recognized index comprised primarily of large national homebuilders.
24
COMPARISON OF FIVE YEAR CUMULATIVE TOTAL RETURN*
AMONG AV HOMES, INC., S&P 500 INDEX, AND PEER INDEX
Fiscal Year Ended December 31, 2017
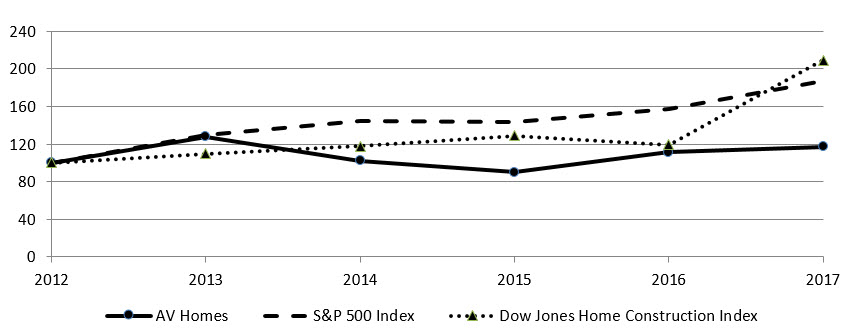
|
|
|
2012 |
|
2013 |
|
2014 |
|
2015 |
|
2016 |
|
2017 |
|
|
AV Homes |
|
100.00 |
|
127.78 |
|
102.46 |
|
90.08 |
|
111.11 |
|
117.09 |
|
|
S&P 500 Index |
|
100.00 |
|
129.60 |
|
144.36 |
|
143.31 |
|
156.98 |
|
187.47 |
|
|
Dow Jones Home Construction Index |
|
100.00 |
|
109.78 |
|
117.85 |
|
128.94 |
|
119.46 |
|
209.26 |
|
*Assumes $100 invested on December 31, 2012, and the reinvestment of dividends.
25
ITEM 6. SELECTED FINANCIAL DATA
Set forth below is selected consolidated financial data for each of the past five fiscal years. The selected financial data should be read in conjunction with Item 7, Management’s Discussion and Analysis of Financial Condition and Results of Operations, and our consolidated financial statements and notes thereto included elsewhere in this report.
FIVE YEAR COMPARISON OF SELECTED FINANCIAL DATA
(in thousands, except per share amounts)
|
|
|
For the Years Ended December 31, |
|
|||||||||||||
|
|
|
2017 |
|
2016 |
|
2015 |
|
2014 |
|
2013 |
|
|||||
|
Operations Data: |
|
|
|
|
|
|
|
|
|
|
|
|
|
|
|
|
|
Revenues |
|
$ |
843,253 |
|
$ |
779,305 |
|
$ |
517,766 |
|
$ |
285,913 |
|
$ |
141,482 |
|
|
|
|
|
|
|
|
|
|
|
|
|
|
|
|
|
|
|
|
Income (loss) before income taxes |
|
$ |
18,332 |
|
$ |
37,586 |
|
$ |
12,386 |
|
$ |
(1,603) |
|
$ |
(8,272) |
|
|
Income tax expense (benefit) |
|
|
40,268 |
|
|
(109,521) |
|
|
436 |
|
|
— |
|
|
— |
|
|
Net income (loss) |
|
|
(21,936) |
|
|
147,107 |
|
|
11,950 |
|
|
(1,603) |
|
|
(8,272) |
|
|
Net income attributable to non-controlling interests in consolidated entities |
|
|
— |
|
|
— |
|
|
— |
|
|
329 |
|
|
1,205 |
|
|
Net income (loss) attributable to AV Homes stockholders |
|
$ |
(21,936) |
|
$ |
147,107 |
|
$ |
11,950 |
|
$ |
(1,932) |
|
$ |
(9,477) |
|
|
|
|
|
|
|
|
|
|
|
|
|
|
|
|
|
|
|
|
Per Share Data: |
|
|
|
|
|
|
|
|
|
|
|
|
|
|
|
|
|
Basic earnings (loss) per share |
|
$ |
(0.98) |
|
$ |
6.58 |
|
$ |
0.54 |
|
$ |
(0.09) |
|
$ |
(1.34) |
|
|
Diluted earnings (loss) per share |
|
$ |
(0.98) |
|
$ |
5.66 |
|
$ |
0.54 |
|
$ |
(0.09) |
|
$ |
(1.34) |
|
|
|
|
|
|
|
|
|
|
|
|
|
|
|
|
|
|
|
|
Balance Sheet Data: |
|
|
|
|
|
|
|
|
|
|
|
|
|
|
|
|
|
Cash and cash equivalents |
|
$ |
240,990 |
|
$ |
67,792 |
|
$ |
46,898 |
|
$ |
180,334 |
|
$ |
144,727 |
|
|
Restricted cash |
|
|
1,165 |
|
|
1,231 |
|
|
26,948 |
|
|
16,447 |
|
|
3,956 |
|
|
Land and other inventories |
|
|
603,851 |
|
|
584,408 |
|
|
582,531 |
|
|
383,184 |
|
|
240,078 |
|
|
Total assets |
|
|
1,010,144 |
|
|
840,233 |
|
|
736,139 |
|
|
663,151 |
|
|
465,928 |
|
|
Senior debt, net |
|
|
472,108 |
|
|
275,660 |
|
|
320,846 |
|
|
294,221 |
|
|
104,602 |
|
|
Stockholders’ equity (1) |
|
|
431,970 |
|
|
450,807 |
|
|
301,681 |
|
|
286,740 |
|
|
286,101 |
|
|
Shares outstanding |
|
|
22,364 |
|
|
22,513 |
|
|
22,333 |
|
|
22,072 |
|
|
21,986 |
|
|
Stockholders’ equity per share |
|
$ |
19.32 |
|
$ |
20.02 |
|
$ |
13.51 |
|
$ |
12.99 |
|
$ |
13.01 |
|
|
|
|
|
|
|
|
|
|
|
|
|
|
|
|
|
|
|
|
Other Data: |
|
|
|
|
|
|
|
|
|
|
|
|
|
|
|
|
|
Contracts signed, net |
|
|
2,443 |
|
|
2,369 |
|
|
2,035 |
|
|
994 |
|
|
463 |
|
|
Closings |
|
|
2,491 |
|
|
2,465 |
|
|
1,750 |
|
|
953 |
|
|
481 |
|
|
Backlog units |
|
|
724 |
|
|
703 |
|
|
799 |
|
|
331 |
|
|
167 |
|
|
Backlog value |
|
$ |
236,759 |
|
$ |
236,240 |
|
$ |
243,947 |
|
$ |
85,753 |
|
$ |
39,862 |
|
|
(1) |
These figures exclude cumulative non-controlling interests for the year ended December 31, 2013, which is classified in consolidated stockholders’ equity in accordance with authoritative accounting guidance. These non-controlling interests represent our partners’ equity in limited liability companies that we consolidate for financial reporting purposes. |
26
ITEM 7. MANAGEMENT’S DISCUSSION AND ANALYSIS OF FINANCIAL CONDITION AND RESULTS OF OPERATIONS
The following discussion and analysis of our financial condition and results of operations should be read in conjunction with Item 6, Selected Financial Data, and the audited consolidated financial statements and accompanying notes included elsewhere in this Annual Report.
Overview
We are engaged in the business of homebuilding and community development in Florida, the Carolinas and Arizona. Beginning in January 2018, we now operate in Texas through the acquisition of Oakdale-Hampton Homes (see Note 16, Subsequent Events, to the consolidated financial statements included in Part II of this report). We also engage to a limited degree in other real estate activities, such as the operation of amenities and the sale of land for third-party development. We manage our business through three reportable segments: Florida, the Carolinas and Arizona.
In 2017, we derived 46% of our revenues from Florida, 36% of our revenues from the Carolinas, and 18% of our revenues from Arizona. The following is a summary of our revenues by segment for the years ended December 31, 2015, 2016 and 2017.
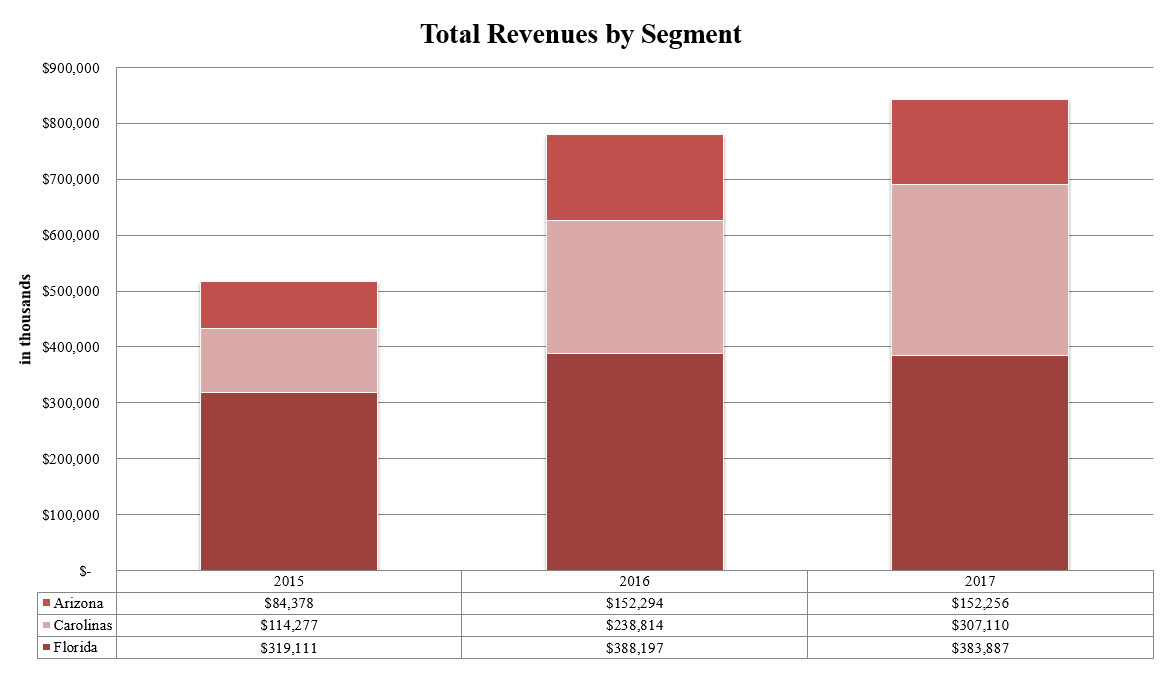
Our primary business is the development of land and the construction and sale of homes for people of all ages, including active adults (55 years and older). Our current homebuilding sales activities include locations in Florida, the Carolinas, Arizona and Texas, with additional communities in the pipeline for each region. Within each geographical segment, we build both active adult communities, which are restricted to homeowners that are age 55 and older, and primary residential communities, which are open to all ages. This geographic and product segment diversification helps mitigate our overall business risks. We also opportunistically sell existing non-core commercial and industrial land positions, as well as scattered lot positions and land assets, that are in excess of our needed supply in a given market.
27
As of December 31, 2017, our selling community count includes 61 locations: 17 in Florida, 37 in the Carolinas and seven in Arizona, with additional communities in the pipeline for each region. Our count of communities with closings includes 69 locations: 24 in Florida, 38 in the Carolinas and seven in Arizona.
Solivita and Vitalia in Florida; CantaMia and Encore in Arizona; and Creekside in North Carolina currently serve as our flagship communities in the active adult market. These communities broaden our geographic footprint and product offering, and should provide us with market participation in the long-term growth of demand from the wave of Baby Boomers entering their retirement years.
We continue to invest in the primary residential market to create a more diversified portfolio that mitigates cyclical impact over time. Through homebuilder acquisitions and purchases of new land and lot positions, we have expanded and continue to expand within our existing markets in Central Florida, Charlotte, Raleigh, Jacksonville, the greater Phoenix area and Dallas-Fort Worth with the acquisition of Oakdale-Hampton Homes in January 2018. Replacement lot positions require new acquisitions of developed lots or platted or unplatted undeveloped land, or we may decide to develop current land holdings, depending on market conditions within the submarket of these assets.
2017 Highlights
During 2017, we continued to execute our strategic and operational business plan by (i) increasing our liquidity, extending our debt maturities and lowering our cost of capital through the issuance of $400 million of 6.625% Senior Notes due 2022, (ii) increasing and improving our concentration in an existing market with the acquisition of Savvy Homes in Raleigh, North Carolina, (iii) continuing to reinvest in our existing markets through the deployment of existing capital into land and lot acquisitions, (iv) improving financial returns through the development of existing land and lot positions, in addition to the construction of homes for sale, (v) increasing the number of homes sold and closed, and (vi) opportunistically monetizing non-core land positions through asset sales.
28
The following table provides a comparison of certain financial data related to our operations in each of our geographic segments (in thousands):
|
|
|
For the Years Ended December 31, |
|
|||||||
|
|
|
2017 |
|
2016 |
|
2015 |
|
|||
|
Operating income: |
|
|
|
|
|
|
|
|
|
|
|
Florida |
|
|
|
|
|
|
|
|
|
|
|
Revenues: |
|
|
|
|
|
|
|
|
|
|
|
Homebuilding |
|
$ |
363,477 |
|
$ |
373,383 |
|
$ |
300,260 |
|
|
Amenity and other |
|
|
17,061 |
|
|
11,698 |
|
|
12,385 |
|
|
Land sales |
|
|
3,349 |
|
|
3,116 |
|
|
6,466 |
|
|
Total revenues |
|
|
383,887 |
|
|
388,197 |
|
|
319,111 |
|
|
Expenses: |
|
|
|
|
|
|
|
|
|
|
|
Homebuilding cost of revenue |
|
|
287,415 |
|
|
291,372 |
|
|
239,001 |
|
|
Homebuilding selling, general and administrative |
|
|
40,478 |
|
|
46,113 |
|
|
38,500 |
|
|
Amenity and other |
|
|
14,749 |
|
|
11,062 |
|
|
10,587 |
|
|
Land sales |
|
|
579 |
|
|
770 |
|
|
823 |
|
|
Segment operating income |
|
$ |
40,666 |
|
$ |
38,880 |
|
$ |
30,200 |
|
|
|
|
|
|
|
|
|
|
|
|
|
|
Carolinas |
|
|
|
|
|
|
|
|
|
|
|
Revenues: |
|
|
|
|
|
|
|
|
|
|
|
Homebuilding |
|
$ |
306,068 |
|
$ |
238,549 |
|
$ |
114,277 |
|
|
Land sales |
|
|
1,042 |
|
|
265 |
|
|
— |
|
|
Total revenues |
|
|
307,110 |
|
|
238,814 |
|
|
114,277 |
|
|
Expenses: |
|
|
|
|
|
|
|
|
|
|
|
Homebuilding cost of revenue |
|
|
266,642 |
|
|
205,348 |
|
|
95,232 |
|
|
Homebuilding selling, general and administrative |
|
|
32,444 |
|
|
22,807 |
|
|
12,205 |
|
|
Land sales |
|
|
1,026 |
|
|
289 |
|
|
— |
|
|
Segment operating income |
|
$ |
6,998 |
|
$ |
10,370 |
|
$ |
6,840 |
|
|
|
|
|
|
|
|
|
|
|
|
|
|
Arizona |
|
|
|
|
|
|
|
|
|
|
|
Revenues: |
|
|
|
|
|
|
|
|
|
|
|
Homebuilding |
|
$ |
152,071 |
|
$ |
152,109 |
|
$ |
84,378 |
|
|
Land sales |
|
|
185 |
|
|
185 |
|
|
— |
|
|
Total revenues |
|
|
152,256 |
|
|
152,294 |
|
|
84,378 |
|
|
Expenses: |
|
|
|
|
|
|
|
|
|
|
|
Homebuilding cost of revenue |
|
|
128,447 |
|
|
128,751 |
|
|
71,305 |
|
|
Homebuilding selling, general and administrative |
|
|
15,198 |
|
|
14,994 |
|
|
11,981 |
|
|
Amenity and other |
|
|
89 |
|
|
86 |
|
|
115 |
|
|
Land sales |
|
|
180 |
|
|
171 |
|
|
— |
|
|
Segment operating income |
|
$ |
8,342 |
|
$ |
8,292 |
|
$ |
977 |
|
|
|
|
|
|
|
|
|
|
|
|
|
|
Operating income |
|
$ |
56,006 |
|
$ |
57,542 |
|
$ |
38,017 |
|
|
|
|
|
|
|
|
|
|
|
|
|
|
Unallocated income (expenses): |
|
|
|
|
|
|
|
|
|
|
|
Interest income and other |
|
|
1,063 |
|
|
16 |
|
|
308 |
|
|
Corporate general and administrative expenses |
|
|
(18,271) |
|
|
(16,305) |
|
|
(16,900) |
|
|
Loss on extinguishment of debt |
|
|
(9,848) |
|
|
— |
|
|
— |
|
|
Interest expense |
|
|
(10,618) |
|
|
(3,667) |
|
|
(9,039) |
|
|
Income before income taxes |
|
|
18,332 |
|
|
37,586 |
|
|
12,386 |
|
|
Income tax expense (benefit) |
|
|
40,268 |
|
|
(109,521) |
|
|
436 |
|
|
Net income (loss) |
|
$ |
(21,936) |
|
$ |
147,107 |
|
$ |
11,950 |
|
29
Data from closings for the Florida, the Carolinas and Arizona segments for the years ended December 31, 2017, 2016 and 2015 is summarized as follows (dollars in thousands):
|
|
|
|
|
|
|
|
Average |
|
|
|
|
|
Number |
|
|
|
|
Price |
|
|
|
Years Ended December 31, |
|
of Units |
|
Revenues |
|
Per Unit |
|
||
|
2017 |
|
|
|
|
|
|
|
|
|
|
Florida |
|
1,232 |
|
$ |
363,477 |
|
$ |
295 |
|
|
Carolinas |
|
815 |
|
|
306,068 |
|
|
376 |
|
|
Arizona |
|
444 |
|
|
152,071 |
|
|
343 |
|
|
Total |
|
2,491 |
|
$ |
821,616 |
|
|
330 |
|
|
|
|
|
|
|
|
|
|
|
|
|
2016 |
|
|
|
|
|
|
|
|
|
|
Florida |
|
1,332 |
|
$ |
373,383 |
|
$ |
280 |
|
|
Carolinas |
|
646 |
|
|
238,549 |
|
|
369 |
|
|
Arizona |
|
487 |
|
|
152,109 |
|
|
312 |
|
|
Total |
|
2,465 |
|
$ |
764,041 |
|
|
310 |
|
|
|
|
|
|
|
|
|
|
|
|
|
2015 |
|
|
|
|
|
|
|
|
|
|
Florida |
|
1,124 |
|
$ |
300,260 |
|
$ |
267 |
|
|
Carolinas |
|
328 |
|
|
114,277 |
|
|
348 |
|
|
Arizona |
|
298 |
|
|
84,378 |
|
|
283 |
|
|
Total |
|
1,750 |
|
$ |
498,915 |
|
|
285 |
|
Fiscal Year 2017 Compared to Fiscal Year 2016
Total revenue increased by $63.9 million or 8.2% to $843.3 million for the year ended December 31, 2017 compared to the same period in 2016. Homebuilding revenue, which is revenue from home closings, increased $57.6 million or 7.5% to $821.6 million for the year ended December 31, 2017 compared to the same period in 2016, primarily due to a 6.5% increase in the average sales price for homes closed. The average selling prices increased 5.4%, 1.9% and 9.9% for the Florida, Carolinas and Arizona segments, respectively, due to a combination of selective price increases, improved market conditions, and the mix of communities with closings in each period. In the Florida segment, homebuilding revenue decreased $9.9 million or 2.7% for the year ended December 31, 2017 compared to the same period in 2016, primarily due to a decrease in the number of communities in which we had closings from 27 to 24. In the Carolinas segment, homebuilding revenue increased by $67.5 million or 28.3% for the year ended December 31, 2017 compared to the same period in 2016 due to an increase in the number of communities in which we had closings from 25 to 38, primarily as a result of the acquisition of Savvy Homes. In the Arizona segment, 2017 homebuilding revenue was comparable to 2016.
Gross margin, which is homebuilding revenue less homebuilding cost of revenue, from total home closings decreased to 16.9% for the year ended December 31, 2017 from 18.1% compared to the same period in 2016. Gross margin from the Florida segment decreased by 110 basis points to 20.9% from 22.0% for the year ended December 31, 2017 compared to the same period in 2016 mainly due to the change in mix of communities with home closings in each year and increased construction costs. Gross margin from the Carolinas segment decreased by 100 basis points to 12.9% from 13.9% for the year ended December 31, 2017 compared to the same period in 2016, primarily due to the change in the mix of communities with home closings and increased construction costs, primarily due to Savvy Homes operations, post-acquisition. Gross margin from the Arizona segment increased slightly to 15.5% for the year ended December 31, 2017 compared to 15.3% in the same period in 2016. Capitalized interest included in cost of sales for the Florida, Carolinas and Arizona segments was $8.5 million, $8.1 million and $5.7 million, respectively, for the year ended December 31, 2017 and was $8.8 million, $6.2 million and $5.8 million, respectively, for the same period in 2016.
Total selling, general and administrative expenses as a percentage of homebuilding revenue improved to 12.9% for the year ended December 31, 2017 from 13.1% for the same period in 2016. Homebuilding selling, general and administrative expenses as a percentage of homebuilding revenue (“Homebuilding SG&A to Revenue Ratio”) improved
30
to 10.7% for the year ended December 31, 2017 from 11.0% for the same period in 2016. The Homebuilding SG&A to Revenue Ratio for the Florida segment improved to 11.1% for the year ended December 31, 2017 from 12.4% for the same period in 2016, primarily due to a reduction in the co-brokerage participation rate and lower year over year compensation-related costs. The Homebuilding SG&A to Revenue Ratio for the Carolinas segment increased to 10.6% for the year ended December 31, 2017 compared to 9.6% for the same period in 2016, primarily due to transition costs as we integrate Savvy Homes, one-time severance costs and higher commission costs from external brokers in 2017. The Homebuilding SG&A to Revenue Ratio of 10.0% for the Arizona segment for the year ended December 31, 2017 was comparable to the 9.9% for the same period in 2016.
Corporate general and administrative expenses increased by $2.0 million to $18.3 million for the year ended December 31, 2017 compared to the same period in 2016. As a percentage of homebuilding revenue, corporate general and administrative expenses increased to 2.2% for the year ended December 31, 2017 compared to 2.1% for the same period in 2016. The increase as a percentage of revenue was primarily driven by $1.0 million of transaction and integration costs directly related to the Savvy Homes acquisition in 2017, offset in part by a $1.8 million reversal of the contingent earn-out obligation for Savvy Homes and non-recurring favorable adjustments related to the forfeiture of unvested share-based awards in 2016.
Interest expense increased by $7.0 million to $10.6 million for the year ended December 31, 2017 compared to $3.7 million in the same period in 2016. The increase in interest expense is a result of the $200.0 million increase in debt compared to the prior year, partially offset by an 80 basis point reduction in our weighted average interest rate.
Income before income taxes for the year ended December 31, 2017 was $18.3 million compared to $37.6 million for the year ended December 31, 2016. The decrease was primarily due to the $9.8 million loss on extinguishment associated with the repurchase of our 8.50% Notes and the replacement of our Senior Secured Credit Facility and the $10.6 million of interest expense for the year ended December 31, 2017 compared to $3.7 million for the same period in 2016 due to the issuance of the 6.625% Notes in May 2017.
Income tax expense (benefit) for the years ended December 31, 2017 and 2016 was $40.3 million and $(109.5) million, respectively. Due to the recent tax law changes under the TCJA, our federal corporate statutory tax rate was reduced from 35% to 21% effective January 1, 2018. As a result, we recorded a one-time revaluation adjustment to our net deferred tax assets during the year ended December 31, 2017 of $32.5 million. The income tax benefit in 2016 was due to the $124.5 million reversal of the deferred tax asset valuation allowance during the period.
Net loss for the year ended December 31, 2017 was $21.9 million or $0.98 per diluted share compared to net income of $147.1 million or $5.66 per diluted share for the year ended December 31, 2016. The decrease in net income for the year ended December 31, 2017 compared to the same period in 2016 was primarily due to the one-time revaluation adjustment to our net deferred tax assets of $32.5 million, the $7.0 million increase in interest expense in 2017, the $9.8 million loss on extinguishment associated with the repurchase of our 8.5% Notes and the replacement of our Senior Secured Credit Facility and the $124.5 million reversal of the deferred tax asset valuation allowance and the factors noted in the analysis above for income before income taxes.
31
Data from contracts signed for the Florida, Carolinas and Arizona segments for the years ended December 31, 2017, 2016 and 2015 is summarized as follows (dollars in thousands):
|
|
|
Gross |
|
|
|
|
|
|
|
|
|
|
|
|
|
|
Number |
|
|
|
Contracts |
|
|
|
|
Average |
|
|
|
|
|
of Contracts |
|
|
|
Signed, Net of |
|
Dollar |
|
Price Per |
|
||
|
Years Ended December 31, |
|
Signed |
|
Cancellations |
|
Cancellations |
|
Value |
|
Unit |
|
||
|
2017 |
|
|
|
|
|
|
|
|
|
|
|
|
|
|
Florida |
|
1,397 |
|
(135) |
|
1,262 |
|
$ |
372,912 |
|
$ |
295 |
|
|
Carolinas |
|
860 |
|
(104) |
|
756 |
|
|
279,250 |
|
|
369 |
|
|
Arizona |
|
517 |
|
(92) |
|
425 |
|
|
146,175 |
|
|
344 |
|
|
Total |
|
2,774 |
|
(331) |
|
2,443 |
|
$ |
798,337 |
|
|
327 |
|
|
|
|
|
|
|
|
|
|
|
|
|
|
|
|
|
2016 |
|
|
|
|
|
|
|
|
|
|
|
|
|
|
Florida |
|
1,511 |
|
(253) |
|
1,258 |
|
$ |
356,247 |
|
$ |
283 |
|
|
Carolinas |
|
762 |
|
(74) |
|
688 |
|
|
261,539 |
|
|
380 |
|
|
Arizona |
|
559 |
|
(136) |
|
423 |
|
|
136,157 |
|
|
322 |
|
|
Total |
|
2,832 |
|
(463) |
|
2,369 |
|
$ |
753,943 |
|
|
318 |
|
|
|
|
|
|
|
|
|
|
|
|
|
|
|
|
|
2015 |
|
|
|
|
|
|
|
|
|
|
|
|
|
|
Florida |
|
1,509 |
|
(242) |
|
1,267 |
|
$ |
344,171 |
|
$ |
272 |
|
|
Carolinas |
|
331 |
|
(42) |
|
289 |
|
|
102,851 |
|
|
356 |
|
|
Arizona |
|
590 |
|
(111) |
|
479 |
|
|
142,004 |
|
|
296 |
|
|
Total |
|
2,430 |
|
(395) |
|
2,035 |
|
$ |
589,026 |
|
|
289 |
|
The total number of net housing contracts signed during the year ended December 31, 2017 compared to the same period in 2016 increased by 74 or 3.1%. The dollar value of housing contracts signed increased by $44.4 million or 5.9% over the same period. The number of net housing contracts signed for the Florida segment during the year ended December 31, 2017 increased 0.3% from the same period in 2016, while the dollar value of housing contracts signed increased by $16.7 million or 4.7%, due to higher average selling prices. The number of net housing contracts signed for the Carolinas segment during the year ended December 31, 2017 increased by 68 or 9.9%, while the dollar value of housing contracts signed increased by $17.7 million or 6.8%, primarily as a result of the Savvy Homes acquisition. The number of net housing contracts signed for the Arizona segment during the year ended December 31, 2017 increased 0.5% from the same period in 2016, while the dollar value of housing contracts signed increased by $10.0 million or 7.4%, due to higher average selling prices.
The cancellation rate for the year ended December 31, 2017 improved to 11.9% from 16.3% compared to the same period in 2016. The cancellation rate in the Florida segment decreased to 9.7% from 16.7% over the same period due to certain closed out communities that had higher cancellation rates in the prior period. The cancellation rate in the Carolinas segment for the year ended December 31, 2017 increased to 12.1% from 9.7% compared to the same period in 2016, attributable to newer communities focused on first-time homebuyers who tend to have higher cancellation rates. The cancellation rate in the Arizona segment for the year ended December 31, 2017 decreased to 17.8% from 24.3% compared to the same period in 2016, primarily due to communities closing out in 2017, which had higher first-time homebuyer volume in 2016.
32
Backlog for the Florida, the Carolinas and Arizona segments as of December 31, 2017, 2016 and 2015 is summarized as follows (dollars in thousands):
|
|
|
|
|
|
|
|
Average |
|
|
|
|
|
Number |
|
Dollar |
|
Price |
|
||
|
As of December 31, |
|
of Units |
|
Volume |
|
Per Unit |
|
||
|
2017 |
|
|
|
|
|
|
|
|
|
|
Florida |
|
372 |
|
$ |
111,059 |
|
$ |
299 |
|
|
Carolinas |
|
202 |
|
|
74,139 |
|
|
367 |
|
|
Arizona |
|
150 |
|
|
51,561 |
|
|
344 |
|
|
Total |
|
724 |
|
$ |
236,759 |
|
|
327 |
|
|
|
|
|
|
|
|
|
|
|
|
|
2016 |
|
|
|
|
|
|
|
|
|
|
Florida |
|
342 |
|
$ |
100,184 |
|
$ |
293 |
|
|
Carolinas |
|
192 |
|
|
79,325 |
|
|
413 |
|
|
Arizona |
|
169 |
|
|
56,731 |
|
|
336 |
|
|
Total |
|
703 |
|
$ |
236,240 |
|
|
336 |
|
|
|
|
|
|
|
|
|
|
|
|
|
2015 |
|
|
|
|
|
|
|
|
|
|
Florida |
|
416 |
|
$ |
116,061 |
|
$ |
279 |
|
|
Carolinas |
|
150 |
|
|
56,427 |
|
|
376 |
|
|
Arizona |
|
233 |
|
|
71,459 |
|
|
307 |
|
|
Total |
|
799 |
|
$ |
243,947 |
|
|
305 |
|
The backlog of housing contracts as of December 31, 2017 increased by 21 or 3.0% and the dollar value of backlog increased $0.5 million or 0.2% as compared to the prior year. The backlog of housing contracts in the Florida segment as of December 31, 2017 compared to December 31, 2016 increased by 30 or 8.8% and the dollar value increased by $10.9 million or 10.9% over the same period due to improved fourth quarter sales in 2017 as compared to the same period in 2016. The backlog of housing contracts in the Carolinas segment as of December 31, 2017 compared to December 31, 2016 increased by 10 or 5.2% and the dollar value decreased by $5.2 million or 6.5% over the same period due to a decrease in average selling price from the prior year, primarily as a result of the Savvy Homes acquisition, which focuses more on entry-level buyers. The backlog of housing contracts in the Arizona segment as of December 31, 2017 compared to December 31, 2016 decreased by 19 or 11.2% and the dollar value decreased by $5.2 million or 9.1% over the same period, driven by lower sales in higher priced close-out communities in 2017.
As of December 31, 2017, our inventory of unsold (speculative) homes, both completed and under construction, was 470 units, as compared to 364 units as of December 31, 2016. As of December 31, 2017, approximately 35% of our unsold homes were completed compared to approximately 34% as of December 31, 2016. The increase in speculative homes is mainly due to the Savvy Homes acquisition.
33
The following is a breakdown of our land holdings including land under option contracts as of December 31, 2017 and 2016:
|
|
|
December 31, 2017 |
|
December 31, 2016 |
|
||||||||||||
|
|
|
|
|
Partially |
|
|
|
Total |
|
|
|
Partially |
|
|
|
Total |
|
|
|
|
Developed |
|
Developed |
|
|
|
Remaining |
|
Developed |
|
Developed |
|
|
|
Remaining |
|
|
|
|
Lots |
|
Lots |
|
Raw Lots |
|
Lots (1) |
|
Lots |
|
Lots |
|
Raw Lots |
|
Lots (1) |
|
|
Florida |
|
|
|
|
|
|
|
|
|
|
|
|
|
|
|
|
|
|
Active adult |
|
794 |
|
332 |
|
6,179 |
|
7,305 |
|
858 |
|
233 |
|
5,264 |
|
6,355 |
|
|
Primary residential |
|
1,269 |
|
912 |
|
1,336 |
|
3,517 |
|
1,480 |
|
677 |
|
1,193 |
|
3,350 |
|
|
|
|
2,063 |
|
1,244 |
|
7,515 |
|
10,822 |
|
2,338 |
|
910 |
|
6,457 |
|
9,705 |
|
|
Carolinas |
|
|
|
|
|
|
|
|
|
|
|
|
|
|
|
|
|
|
Active adult |
|
219 |
|
— |
|
234 |
|
453 |
|
148 |
|
187 |
|
221 |
|
556 |
|
|
Primary residential |
|
1,750 |
|
520 |
|
30 |
|
2,300 |
|
723 |
|
443 |
|
324 |
|
1,490 |
|
|
|
|
1,969 |
|
520 |
|
264 |
|
2,753 |
|
871 |
|
630 |
|
545 |
|
2,046 |
|
|
Arizona |
|
|
|
|
|
|
|
|
|
|
|
|
|
|
|
|
|
|
Active adult |
|
584 |
|
561 |
|
452 |
|
1,597 |
|
611 |
|
836 |
|
452 |
|
1,899 |
|
|
Primary residential |
|
295 |
|
70 |
|
545 |
|
910 |
|
352 |
|
— |
|
429 |
|
781 |
|
|
|
|
879 |
|
631 |
|
997 |
|
2,507 |
|
963 |
|
836 |
|
881 |
|
2,680 |
|
|
|
|
|
|
|
|
|
|
|
|
|
|
|
|
|
|
|
|
|
Total principal communities |
|
4,911 |
|
2,395 |
|
8,776 |
|
16,082 |
|
4,172 |
|
2,376 |
|
7,883 |
|
14,431 |
|
|
(1) |
Estimated planned lots are based on historical densities for our land. New projects may ultimately be developed into more or less than the number of lots stated. |
The Company also has approximately 1,700 acres of commercial and industrial land, approximately 5,200 acres of unplatted scattered mixed-use land, and 760 platted scattered lots not reflected in the above lot counts.
Fiscal Year 2016 Compared to Fiscal Year 2015
Total revenue increased by $261.5 million or 50.5% to $779.3 million during the year ended December 31, 2016 compared to the year ended December 31, 2015. Homebuilding revenue, which is revenue from home closings, increased $265.1 million or 53.1% to $764.0 million for the year ended December 31, 2016 compared to the same period in 2015 primarily due to a 40.9% increase in units closed and an 8.8% increase in the average sales price for homes closed. In the Florida segment, homebuilding revenue increased $73.1 million or 24.4% for the year ended December 31, 2016 compared to the same period in 2015 driven by an 18.5% increase in units closed due to an increase in the number of communities in which we had closings from 24 to 27. In the Carolinas segment, homebuilding revenue increased by $124.3 million or 108.7% for the year ended December 31, 2016 compared to the same period in 2015 primarily due to the Bonterra Builders acquisition in July 2015. In the Arizona segment, homebuilding revenue increased $67.7 million or 80.3% for the year ended December 31, 2016 compared to the same period in 2015 driven by a 63.4% increase in units closed due to an increase in the number of communities in which we had closings from eight to nine, and a full year of closings in newer communities that opened during 2015. Additionally, the average selling prices increased 4.9%, 6.0% and 10.2% for the Florida, Carolinas and Arizona segments, respectively, due to a combination of selective price increases and the mix of communities with closings in each respective period.
Gross margin, which is homebuilding revenue less homebuilding cost of revenues, decreased to 18.1% for the year ended December 31, 2016 from 18.7% compared to the same period in 2015, primarily due to the increase in the amortization of previously capitalized interest. Gross margin from the Florida segment increased by 160 basis points to 22.0% from 20.4% for the year ended December 31, 2016 compared to the same period in 2015 primarily due to cost reduction initiatives favorably impacting our construction costs and selective price increases. Gross margin from the Carolinas segment decreased by 280 basis points to 13.9% from 16.7% for the year ended December 31, 2016 compared to the same period in 2015 primarily due to increased construction and land development costs, a 110 basis point increase in previously capitalized interest and the mix of communities with closings. The Carolinas gross margin for the years ended December 31, 2016 and 2015 also includes $1.6 million and $1.7 million, respectively, of expense associated with the purchase accounting write-up of the Bonterra Builders in-process inventory. Gross margin from the
34
Arizona segment remained relatively flat at 15.3% for the year ended December 31, 2016 compared to 15.5% in the same period in 2015. Capitalized interest included in cost of sales for the Florida, Carolinas and Arizona segments was $8.8 million, $6.2 million and $5.8 million, respectively, for the year ended December 31, 2016 and was $6.7 million, $1.7 million and $2.7 million, respectively, for the same period in 2015.
Total selling, general and administrative expenses as a percentage of homebuilding revenue improved to 13.1% for the year ended December 31, 2016 from 16.0% for the same period in 2015. Homebuilding SG&A to Revenue Ratio improved to 11.0% for the year ended December 31, 2016 from 12.6% for the same period in 2015 as we were able to continue to leverage the cost base over our increased revenues. Homebuilding SG&A to Revenue Ratio for the Florida segment improved to 12.4% for the year ended December 31, 2016 from 12.8% for the same period in 2015. Homebuilding SG&A to Revenue Ratio for the Carolinas segment improved to 9.6% for the year ended December 31, 2016 compared to 10.7% for the same period in 2015 due to the significant increase in revenue primarily from the acquisition of Bonterra Builders. Homebuilding SG&A to Revenue Ratio for the Arizona segment improved to 9.9% for the year ended December 31, 2016 compared to 14.2% for the same period in 2015 primarily due to the cost leverage achieved from the 80.3% increase in homebuilding revenue from the same period in 2015.
Corporate general and administrative expenses decreased by $0.6 million to $16.3 million for the year ended December 31, 2016 compared to the same period in 2015. As a percentage of homebuilding revenue, corporate general and administrative expenses improved to 2.1% for the year ended December 31, 2016 compared to 3.4% for the same period in 2015. The decrease as a percentage of revenue was driven by the significant increase in revenue while containing our costs.
Interest expense decreased by $5.4 million to $3.7 million for the year ended December 31, 2016 compared to $9.0 million in the same period in 2015. The decrease in interest expense is primarily attributable to a reduction in debt and an increase in capitalized interest due to an expansion of inventory under development in 2016 as compared to 2015.
Income before income taxes for the year ended December 31, 2016 was $37.6 million compared to $12.4 million for the year ended December 31, 2015. The increase was primarily due to the higher volume of closings, increases in average selling price, leveraging our cost base and a decrease in interest expense, partially offset by a decrease of $3.3 million in land sale gains.
Income tax benefit for the year ended December 31, 2016 increased to $109.5 million from an income tax expense of $0.4 million for the same period in 2015 primarily due to the $124.5 million reversal of the deferred tax asset valuation allowance in 2016, partially offset by an increase in our income tax provision due to increased earnings. During 2016, we evaluated both positive and negative evidence and determined it was “more likely than not” that our federal deferred tax assets and our state deferred tax assets will be realized. We noted several factors that led to the reversal such as sustained growth, recent significant pre-tax income and evidence that conditions in the U.S. housing industry will continue to be favorable over the long-term.
Net income for the year ended December 31, 2016 was $147.1 million or $5.66 per diluted share compared to net income of $12.0 million or $0.54 per diluted share for the year ended December 31, 2015. The increase in net income for the year ended December 31, 2016 compared to the same period in 2015 was primarily due to the reversal of the deferred tax asset valuation allowance in 2016 and the factors noted in the analysis above for income before income taxes.
The backlog of housing contracts as of December 31, 2016 compared to December 31, 2015 decreased by 96 or 12.0% and the dollar value of backlog decreased by $7.7 million or 3.2% over the same period. The decrease in units of backlog was due to lower selling community counts in the Carolinas and Arizona segments and a decrease in net housing contracts signed in the Florida and Arizona segments in late 2016. The backlog of housing contracts in the Florida segment as of December 31, 2016 compared to December 31, 2015 decreased by 74 or 17.8% and the dollar value decreased by $15.9 million or 13.7% over the same period. The backlog of housing contracts in the Carolinas segment as of December 31, 2016 compared to December 31, 2015 increased by 42 or 28.0% and the dollar value increased by $22.9 million or 40.6% over the same period due to the increase in net housing contracts signed. The backlog of housing contracts in the Arizona segment as of December 31, 2016 compared to December 31, 2015 decreased by 64 or 27.5%
35
and the dollar value decreased by $14.7 million or 20.6% over the same period primarily due to a decrease in net housing contracts signed in late 2016.
As of December 31, 2016, our inventory of unsold (speculative) homes, both completed and under construction, was 364 units, as compared to 421 units as of December 31, 2015. As of December 31, 2016, approximately 34% of unsold homes were completed compared to approximately 40% as of December 31, 2015. The decrease in speculative homes is due to our efforts to optimize our inventory of unsold (speculative) homes, which typically have lower margins.
Income Taxes
Income taxes have been provided for using the asset and liability method under Accounting Standards Codification (“ASC”) 740, Income Taxes (“ASC 740”). The asset and liability method is used in accounting for income taxes where deferred tax assets and liabilities are recognized by identifying the temporary differences arising from the different treatment of items for tax and accounting purposes. In assessing the realizability of deferred tax assets, we consider whether it is “more likely than not” that some portion or all of the deferred tax assets will not be realized. The ultimate realization of deferred tax assets is primarily dependent upon the generation of future taxable income. In determining the future tax consequences of events that have been recognized in the financial statements or tax returns, judgment is required. Differences between the anticipated and actual outcomes of these future tax consequences could have a material impact on our consolidated results of operations or financial position.
We evaluate our deferred tax assets quarterly to determine if valuation allowances are required. ASC 740 requires that companies assess whether valuation allowances should be established based on the consideration of all available evidence using a “more likely than not” standard. The realization of the deferred tax assets ultimately depends upon the existence of sufficient taxable income in future periods. We established a full valuation allowance against our deferred tax assets in 2009 and regularly analyzed all available positive and negative evidence in determining the continuing need for a valuation allowance with respect to our deferred tax assets. This evaluation considered, among other factors, historical operating results, our three-year cumulative profit or loss position, forecasts of future profitability, and the duration of statutory carryforward periods. After careful evaluation of all positive and negative evidence, and giving more weight to objectively verifiable evidence over more subjective evidence, we concluded as of June 30, 2016 that it was “more likely than not” that all of our federal deferred tax assets and our state deferred tax assets will be realized. Even if industry conditions weaken from current levels, we believe we will be able to adjust our operations to sustain long-term profitability. Accordingly, by December 31, 2016 we reversed the entire valuation allowance. These reversals are reflected in our income tax benefit in the accompanying consolidated statements of operations.
Any interest or penalties assessed have been minimal and immaterial to our financial results. In the event we are assessed any interest or penalties in the future, we plan to include them in our consolidated statements of operations as income tax expense.
On December 22, 2017, the Tax Cuts and Jobs Act (“TCJA”) was signed into law, which, among other items, reduces the federal statutory corporate tax rate from 35% to 21%, effective January 1, 2018. As required under ASC 740, we evaluated and accounted for the impact of the changes from the TCJA in the period when the law was enacted. As a result, we recorded a $32.5 million one-time revaluation adjustment to decrease our net deferred tax assets in the quarter ended December 31, 2017. This adjustment was primarily due to the reduction in the federal corporate statutory tax rate. This amount has been recorded as a one-time increase to the provision for income taxes. Our assessment of the TCJA was based on information available at this time and results for the quarter ended December 31, 2017. Future periods may differ from the impact disclosed herein due to, among other things, changes in interpretations and assumptions made by us, guidance that may be issued and actions we may take as a result of the TCJA. The overall impact of the TCJA is also subject to the effect of other provisions of the TCJA.
36
Liquidity and Capital Resources
Our primary business activities are capital intensive in nature. Significant capital resources are required to finance planned residential communities, homebuilding construction in process, community infrastructure, selling expenses, new projects and working capital needs, including funding of debt service requirements, operating deficits and the carrying costs of land. We finance these activities using cash provided by operating activities, capital market financing and our senior unsecured credit facility.
Cash Flows
As of December 31, 2017, our cash and cash equivalents totaled $241.0 million compared to $67.8 million as of December 31, 2016. As of December 31, 2017, total consolidated indebtedness was $480.0 million compared to $280.0 million as of December 31, 2016. The increase in cash and cash equivalents as of December 31, 2017 is primarily due to the issuance of $400.0 million of our 6.625% Notes in May 2017, partially offset by the repurchase and redemption of $200.0 million in principal of the 8.50% Notes and the acquisition of Savvy Homes with available cash.
Our operating cash flows fluctuate relative to the status of development within existing communities, expenditures for land, new developments and other real estate activities, sales of various homebuilding product lines within those communities and other developments and to fund operating deficits.
For the year ended December 31, 2017, net cash provided by operating activities was $34.6 million. The operating cash inflow was primarily due to $18.3 million income before income taxes, $9.8 million in non-cash charges for the extinguishment of debt, and the $19.0 million decrease in land and other inventories, partially offset by the $12.9 million decrease in accounts payable and accrued liabilities. Net cash used in investing activities was $43.6 million mainly due to the acquisition of Savvy Homes. Net cash provided by financing activities was $182.2 million, primarily due to proceeds from the issuance of the 6.625% Notes, partially offset by the repurchase of the 8.50% Notes and $8.1 million in debt issuance costs.
For the year ended December 31, 2016, net cash provided by operating activities was $73.8 million. The operating cash inflow was primarily due to the net income of $147.1 million, partially offset by the $110.3 million increase in deferred tax assets, net due to the reversal of the deferred tax asset valuation allowance in 2016. The remaining change was due to a decrease in restricted cash of $25.7 million and a net decrease in operating assets and liabilities of $2.2 million. Net cash used in investing activities was $1.6 million primarily due to the purchase of property and equipment for Florida amenity improvements. Net cash used in financing activities was $51.3 million primarily due to the repayment of the remaining $46.8 million of 7.50% Notes at maturity.
For the year ended December 31, 2015, net cash used in operating activities was $59.0 million. The operating cash outflow was primarily due to the increase in land and other inventories of $83.8 million and an increase in restricted cash of $10.5 million related to a covenant requirement in our Senior Secured Credit Facility. Using the proceeds from our 8.50% Senior Notes issued in June 2014 and our 6.00% Notes issued in June 2015, we purchased land and lots for the expansion of all our homebuilding segments and increased the number of homes under construction commensurate with the increase in our new orders. These outflows were partially offset by cash inflow of $19.1 million from increased customer deposits and accrued liabilities. Net cash used in investing activities was $97.8 million, primarily due to the purchase of Bonterra Builders in the third quarter of 2015. Net cash provided by financing activities was $23.4 million, primarily due to the issuance of $80.0 million of the 6.00% Notes, partially offset by the aggregate redemption and repurchase of the 7.50% Exchange Notes and portions of the 7.50% Notes for $53.2 million.
Surety Bonds
Surety bonds, issued by third-party entities, are used primarily to guarantee our performance to construct improvements in our various communities. As of December 31, 2017 and 2016, we had outstanding surety bonds of approximately $36.1 million and $30.6 million, respectively. The amount of outstanding surety bonds could fluctuate depending on the level of development activity. We do not believe that it is likely any of these outstanding surety bonds will be drawn upon.
37
Other
Assuming that no additional significant adverse changes in our business occur, we anticipate the aggregate cash on hand, cash flow generated through homebuilding and related operations, our senior unsecured credit facility, and sales of commercial and industrial and other land will provide sufficient liquidity to fund our business for 2018.
Off-balance Sheet Arrangements
When we are either deemed to hold the controlling interest in a voting interest entity or deemed to be the primary beneficiary of a variable interest entity (“VIE”), we are required to consolidate the investment. The primary beneficiary of a VIE is the entity that has both of the following characteristics: (a) the power to direct the activities of a VIE that most significantly impact the VIE’s economic performance and (b) the obligation to absorb the majority of losses of the VIE or the right to receive the majority of benefits from the VIE. Investments where we do not hold the controlling interest and we are not the primary beneficiary are accounted for under the equity method.
Our variable interests may be in the form of (1) equity ownership, (2) contracts to purchase assets and/or (3) loans provided by us to the investor. We examine specific criteria and use judgment when determining if we are the primary beneficiary of a VIE. Factors considered in determining whether we are the primary beneficiary include risk and reward sharing, experience and financial condition of other partner(s), voting rights, involvement in day-to-day capital and operating decisions, level of economic disproportionality between us and the other partner(s) and contracts to purchase assets from VIEs.
We participate in entities with less than 100% equity interests. One entity in which we have a 58% equity interest, was formed for the purpose of acquiring and developing land in our Encore active adult community in Arizona while the other is a mortgage joint venture in which we have a 50% equity interest, was formed in the fourth quarter of 2017 to serve as a preferred lender for homebuyers in our markets along with other related services. These entities, along with other arrangements, may represent variable interests, depending on the contractual terms of the arrangement. We determine the method for accounting for our investments at inception or upon a reconsideration event.
We share in the profits and losses of the unconsolidated entities generally in accordance with our ownership interests. We and our equity partners make initial and ongoing capital contributions to these unconsolidated entities on a pro-rata basis. The obligation to make capital contributions is governed by each unconsolidated entity’s respective operating agreement.
As of December 31, 2017, these unconsolidated entities were financed by partner equity and do not have third-party debt. In addition, we have not provided any guarantees to these entities or our equity partners.
Effects of Inflation and Economic Conditions
We may be adversely affected during periods of inflation because of higher land and construction costs. Inflation may also increase our financing costs. In addition, higher mortgage interest rates affect the affordability of our products to prospective homebuyers. While we attempt to pass on to our customers increases in our costs through increased sales prices, market forces may limit our ability to do so. If we are unable to raise sales prices enough to compensate for higher costs, or if mortgage interest rates increase significantly, our revenues, gross margins, and net income could be adversely affected.
Various housing indices have shown improvement in recent periods. While we believe that higher interest rates are inevitable and may have a moderating effect on demand and pricing, we believe this impact will be outweighed by the other factors driving increased sales activity as overall new orders remain low compared with historical levels. We believe that any sustained rise in interest rates will be indicative of a stronger macroeconomic environment that will support a continued recovery in the homebuilding industry.
38
Tax Cuts and Jobs Act
The recently passed Tax Cuts and Jobs Act has added additional momentum to the economic landscape. While there have been concerns about the new tax law on housing, initial readings and reviews are suggesting that it is generally stimulative to the economy. In addition, concerns about the reduction of the mortgage interest deduction, deductibility of real estate taxes and state and local taxes seem to be offset by overall optimistic momentum around economic stability and growth. For our typical buyer profile, we have found that the effect of the new tax law is generally positive at their income levels. Additionally, the doubling of the standard deduction should help a new group of aspiring homeowners accumulate savings for a down payment to purchase a home and create personal financial stability.
Seasonality
Our business is affected to some extent by the seasonality of home sales, which generally produce increased closings in the latter half of the year. However, periods of economic downturn in the industry can alter seasonal patterns.
Contractual Obligations and Commercial Commitments
The following table reflects contractual obligations as of December 31, 2017 (in thousands):
|
|
|
Payments Due by Period |
|
|
|
|
||||||||||
|
|
|
|
|
|
|
|
|
|
|
|
More |
|
|
|
|
|
|
|
|
Less than |
|
1 – 3 |
|
3 – 5 |
|
Than |
|
|
|
|
||||
|
|
|
1 Year |
|
Years |
|
Years |
|
5 Years |
|
Total |
|
|||||
|
Long-term debt obligations (1) |
|
$ |
— |
|
$ |
80,000 |
|
$ |
400,000 |
|
$ |
— |
|
$ |
480,000 |
|
|
Interest obligations on long-term debt |
|
|
31,300 |
|
|
60,200 |
|
|
38,646 |
|
|
— |
|
|
130,146 |
|
|
Operating lease obligations |
|
|
1,612 |
|
|
2,678 |
|
|
1,578 |
|
|
1,459 |
|
|
7,327 |
|
|
Capital lease obligations |
|
|
151 |
|
|
44 |
|
|
— |
|
|
— |
|
|
195 |
|
|
Purchase obligations – residential development (2) |
|
|
127,155 |
|
|
— |
|
|
— |
|
|
— |
|
|
127,155 |
|
|
Other long-term liabilities (3) |
|
|
1,035 |
|
|
2,678 |
|
|
3,370 |
|
|
28,682 |
|
|
35,765 |
|
|
Total |
|
$ |
161,253 |
|
$ |
145,600 |
|
$ |
443,594 |
|
$ |
30,141 |
|
$ |
780,588 |
|
|
(1) |
Long-term debt obligations represent: |
|
(i) |
$400,000 outstanding under the 6.625% Senior Notes due May 15, 2022; and |
|
(ii) |
$80,000 outstanding under the 6.00% Senior Convertible Notes due July 1, 2020. |
|
(2) |
Purchase obligations-residential development represent purchase commitments for land development and construction expenditures, substantially for homebuilding operations that relate to contracts for services, materials and supplies, which obligations generally relate to corresponding contracts for sales of homes. |
|
(3) |
Other long-term liabilities represent the estimated cost-to-complete of certain utilities improvements in areas within Poinciana, Florida and Rio Rico, Arizona where home sites have been sold and certain development obligations associated with CantaMia. |
Critical Accounting Policies and Estimates
The accompanying consolidated financial statements were prepared in conformity with U.S. generally accepted accounting principles. When more than one accounting principle, or the method of its application, is generally accepted, we select the principle or method that is appropriate in our specific circumstances (see Note 1, Basis of Financial Statement Presentation and Summary of Significant Accounting Policies, to the consolidated financial statements included in Part II of this report). Application of these accounting principles requires us to make estimates about the future resolution of existing uncertainties; as a result, actual results could differ from these estimates. In preparing these consolidated financial statements, we have made our best estimates and judgments of the amounts and disclosures included in the consolidated financial statements, giving due regard to materiality.
39
The accounting policies that we deem most critical to us and involve the most difficult, subjective or complex judgments are as follows:
Revenue Recognition
Homebuilding revenue and related profit are generally recognized when title to and possession of the property are transferred to the buyer. Sales are closed when all of the following conditions are met: a sale is consummated, a sufficient down payment is received, the earnings process is complete and the collection of any remaining receivables is reasonably assured. Concurrent with the recognition of revenues in our consolidated statements of operations, sales incentives in the form of price concessions on the selling price of a home are recorded as a reduction of revenues, while the cost of sales incentives in the form of free products or services to homebuyers, including option upgrades and closing cost allowances used to cover a portion of the fees and costs charged to a homebuyer, is reflected as construction and land costs.
Land and Other Inventories and Homebuilding Cost of Revenue
Land and other inventories include expenditures for land acquisition, construction, land development, construction costs for homeowners’ association amenities, and direct and allocated indirect costs, including interest cost capitalized until development and construction are substantially completed. These costs are assigned to components of land and other inventories based on specific identification, relative sales value, or area allocation methods.
Land and other inventories are stated at cost unless the asset is determined to be impaired, in which case the asset is written to its fair value, in accordance with ASC 360, Property, Plant and Equipment (“ASC 360”).
Homebuilding cost of revenue is comprised of direct and allocated costs, including estimated future costs for the limited warranty we provide on our homes. Land acquisition, land development and other common costs are generally allocated on a relative sales value or area allocation basis to the homes or lots within the applicable community or land parcel. Land acquisition and land development costs include related interest and real estate taxes during the period of time under development.
We evaluate our land and other inventories for impairment on a quarterly basis in accordance with ASC 360 to reflect market conditions, including a consideration of supply of new and resale homes for sale in the respective market, level of foreclosure activity and competition. For assets held and used, if indicators are present, we perform an impairment test in which the asset is reviewed for impairment by comparing the estimated future undiscounted cash flows to be generated by the asset to its carrying value. If such cash flows are less than the asset’s carrying value, the carrying value is written down to its estimated fair value. Generally, fair value is determined by discounting the estimated cash flows at a rate commensurate with the inherent risks associated with the asset and related estimated cash flow streams. The discount rate used in the determination of fair value would vary, depending on the state of development. Assumptions and estimates used in the determination of the estimated future cash flows are based on expectations of future operations and economic conditions and certain factors described below. Changes to these assumptions could significantly affect the estimates of future cash flows, which could affect the potential for future impairments. Due to the uncertainties of the estimation process, actual results could differ significantly from such estimates.
During the years ended December 31, 2017 and 2016, our impairment assessments resulted in $0.9 million $0.8 million of impairment charges, respectively, and are included in homebuilding cost of revenue in the consolidated statements of operations. During the year ended December 31, 2015, our impairment assessment resulted in no significant impairment charges.
Goodwill
We evaluate goodwill for possible impairment in accordance with ASC 350, Intangibles-Goodwill and Other, on an annual basis, or more frequently if events or changes in circumstances indicate that the carrying amount of such assets may not be recoverable. First, we perform a qualitative assessment that analyzes current economic indicators associated with a particular reporting unit. For example, we analyze changes in economic, market and industry conditions, business
40
strategy, cost factors, and financial performance, among others, to determine if there would be a significant decline to the fair value of a particular reporting unit. If the qualitative assessment indicates a stable or improved fair value, no further testing is required.
If a qualitative assessment indicates that a significant decline to fair value of a reporting unit is more likely than not, or if a reporting unit’s fair value has historically been closer to its carrying value, we will then calculate the fair value of a reporting unit based on discounted future cash flows. If this calculation indicates that the carrying value of a reporting unit is in excess of its fair value, the goodwill impairment will be the amount by which a reporting unit’s carrying amount exceeds its fair value, not to exceed the carrying amount of goodwill.
Business Combinations
We account for business combinations in accordance with ASC 850, Business Combinations, if the assets acquired and liabilities assumed constitute a business. For acquired companies constituting a business, we recognize the identifiable assets acquired and liabilities assumed at their acquisition-date fair values and recognize any excess of total consideration paid over the fair value of the identifiable assets as goodwill.
The estimated fair value of the acquired assets and assumed liabilities requires significant judgments by management, which are outlined below:
Inventories. The fair value of acquired inventories largely depends on the stage of production of the acquired land and work in process inventory. For acquired land inventory, we typically utilize, with the assistance of a third-party appraiser, a forecasted cash flow approach for the development, marketing, and sale of each community acquired. Significant assumptions included in our estimates include future per-lot development costs, construction and overhead costs, mix of products sold in each community, as well as average sales price. For work in process inventories, we estimate the fair value based upon the stage of production of each unit and a gross margin that we believe a market participant would require to complete the remaining development and requisite selling efforts.
Intangible assets. The fair value of the acquired intangible assets largely depends on the nature of the intangible asset acquired. In our most recent acquisitions, we identified intangible assets acquired in our business combinations for non-compete agreements and trade names. With the assistance of a third-party valuation firm, we estimated the value of each intangible asset based on a combination of approaches. The fair value of acquired intangible assets is largely a factor of our forecasted future results of each acquisition and is dependent on similar assumptions as those outlined above for “Inventories.”
If forecasts and estimates utilized in our purchase price allocation differ significantly from actual results in future periods, impairments of inventory, amortizable intangible assets, and goodwill could arise.
Income Taxes
We account for income taxes in accordance with ASC 740, Income Taxes. The provision for, or benefit from, income taxes is calculated using the asset and liability method, under which deferred tax assets and liabilities are recognized by identifying the temporary differences arising from the different treatment of items for tax and accounting purposes. In assessing the ability to realize the value of deferred tax assets, we consider whether it is more likely than not that some portion or all of the deferred tax assets may not be realized. Deferred tax assets are evaluated on a quarterly basis to determine if adjustments to the valuation allowance are required. The ultimate realization of deferred tax assets is primarily dependent upon the generation of future taxable income during the periods in which those temporary differences become deductible. As of December 31, 2017 and 2016, our net deferred tax asset was $70.4 million and $110.3 million respectively. There was no remaining valuation allowance as of December 31, 2016.
In determining the future tax consequences of events that have been recognized in the financial statements or tax returns, judgment is required. We evaluate our uncertain tax positions quarterly based on various factors, including changes in facts or circumstances, tax laws or the status of audits by tax authorities. Differences between the anticipated
41
and actual outcomes of these future tax consequences could have a material impact on the consolidated results of operations or financial position.
Warranty Costs
Warranty reserves for homes are established to cover estimated costs for materials and labor with regard to warranty-type claims to be incurred subsequent to the closing of a home. We estimate the costs to be incurred under these warranties and record a liability in the amount of such costs at the time product revenue is recognized. Our primary assumption in estimating future warranty costs is that historical claims experience is a strong indicator of future claims experience. Factors that affect our warranty liability include the number of homes sold, historical and anticipated rates of warranty claims, and the cost per claim. We periodically assess the adequacy of our recorded warranty liability and adjust the amounts as necessary. Actual warranty costs in the future could differ from our estimates. Warranty reserves are included in accrued and other liabilities in the consolidated balance sheets.
ITEM 7A. QUANTITATIVE AND QUALITATIVE DISCLOSURES ABOUT MARKET RISK
We are subject to market risk associated with changes in interest rates and the cyclical nature of the real estate industry. A majority of the purchasers of our homes finance their purchases through third-party lenders providing mortgage financing or, to some extent, rely upon investment income. In general, housing demand is dependent on home equity, consumer savings, employment and income levels, and third-party financing and is adversely affected by increases in interest rates, unavailability of mortgage financing, increasing housing costs and unemployment levels. The amount or value of discretionary income and savings, including retirement assets, available to home purchasers can be affected by a decline in the capital markets. Fluctuations in interest rates could adversely affect our real estate results of operations and liquidity because of the negative impact on the housing industry. Real estate developers are subject to various risks, many of which are outside their control, including real estate market conditions (both where our communities and homebuilding operations are located and in areas where our potential customers reside), changing demographic conditions, adverse weather conditions and natural disasters, such as hurricanes, tornadoes and wildfires, delays in construction schedules, cost overruns, changes in government regulations or requirements, increases in real estate taxes and other local government fees, availability and cost of land, materials and labor, and access to financing. See Note 6, Senior Debt, and Note 14, Fair Value Disclosures, to the consolidated financial statements in included in Part II of this report. See Item 1A, Risk Factors, of this report for further discussion of risks.
Forward-Looking Statements
Certain statements discussed in Item 1, Business, Item 3, Legal Proceedings, Item 7, Management’s Discussion and Analysis of Financial Condition and Results of Operations, and elsewhere in this report constitute “forward-looking statements” within the meaning of the Private Securities Litigation Reform Act of 1995. Such forward-looking statements involve known and unknown risks, uncertainties and other important factors that could cause the actual results, performance or achievements of results to differ materially from any future results, performance or achievements expressed or implied by such forward-looking statements. Such risks, uncertainties and other important factors include, among others: the cyclical nature of the homebuilding industry and its dependence on broader economic conditions; availability and suitability of undeveloped land, partially developed land and improved lots; ability to develop communities within expected timeframes; fluctuations in interest rates; the availability of mortgage financing for homebuyers; changes in federal lending programs and other regulations; the potential impact of the Tax Cuts and Jobs Act on homebuyer demand; elimination or reduction of tax benefits associated with home ownership; the prices and supply of building materials and skilled labor; the availability and skill of subcontractors; effect of our expansion efforts on our cash flows and profitability; our ability to successfully integrate acquired businesses; competition for homebuyers, properties, financing, raw materials and skilled labor; our ability to access sufficient capital; our ability to generate sufficient cash to service our indebtedness and potential need for additional financing; terms of our financing documents that may restrict our operations and corporate actions; incurrence of additional debt; our ability to purchase outstanding notes upon certain fundamental changes; our ability to obtain additional letters of credit and surety bonds; cancellations of home sale orders; declines in home prices in our primary regions; inflation or deflation affecting homebuilding costs; warranty and construction defect claims; health and safety incidents in homebuilding activities; the seasonal nature of our business; impacts of weather conditions and natural disasters; resource shortages and rate
42
fluctuations; value and costs related to our land and lot inventory; overall market supply and demand for new homes; our ability to recover our costs in the event of reduced home sales; conflicts of interest involving our largest stockholder; contractual restrictions under a stockholders agreement with our largest stockholder; dependence on our senior management; effects of government regulation of development and homebuilding projects; costs of environmental compliance; increased regulation of the mortgage industry; the lack of sole decision-making authority and reliance on our co-venturer; development liabilities that may impose payment obligations on us; contingent liabilities that may affect our liquidity; our ability to utilize our deferred income tax asset; impact of environmental changes; dependence on digital technologies and potential interruptions; potential dilution related to future financing activities; and potential impairment of intangible assets, all as are described in Item 1A, Risk Factors, of this report. Readers are cautioned not to place undue reliance on any forward-looking statements contained herein, which reflect management’s opinions only as of the date hereof.
43
ITEM 8. FINANCIAL STATEMENTS AND SUPPLEMENTARY DATA
44
AV HOMES, INC. AND SUBSIDIARIES
(in thousands, except share and per share amounts)
|
|
|
December 31, |
|
||||
|
|
|
2017 |
|
2016 |
|
||
|
Assets |
|
|
|
|
|
|
|
|
Cash and cash equivalents |
|
$ |
240,990 |
|
$ |
67,792 |
|
|
Restricted cash |
|
|
1,165 |
|
|
1,231 |
|
|
Receivables |
|
|
13,702 |
|
|
10,827 |
|
|
Land and other inventories |
|
|
603,851 |
|
|
584,408 |
|
|
Property and equipment, net |
|
|
32,664 |
|
|
33,680 |
|
|
Prepaid expenses and other assets |
|
|
17,117 |
|
|
12,753 |
|
|
Deferred tax assets, net |
|
|
70,365 |
|
|
110,257 |
|
|
Goodwill |
|
|
30,290 |
|
|
19,285 |
|
|
Total assets |
|
$ |
1,010,144 |
|
$ |
840,233 |
|
|
|
|
|
|
|
|
|
|
|
Liabilities and Stockholders’ Equity |
|
|
|
|
|
|
|
|
|
|
|
|
|
|
|
|
|
Liabilities |
|
|
|
|
|
|
|
|
Accounts payable |
|
$ |
35,810 |
|
$ |
37,387 |
|
|
Accrued and other liabilities |
|
|
29,193 |
|
|
34,298 |
|
|
Customer deposits |
|
|
9,507 |
|
|
9,979 |
|
|
Estimated development liability |
|
|
31,556 |
|
|
32,102 |
|
|
Senior debt, net |
|
|
472,108 |
|
|
275,660 |
|
|
Total liabilities |
|
|
578,174 |
|
|
389,426 |
|
|
|
|
|
|
|
|
|
|
|
Stockholders’ equity |
|
|
|
|
|
|
|
|
Common stock, par value $1 per share |
|
|
22,475 |
|
|
22,624 |
|
|
Authorized: 50,000,000 shares |
|
|
|
|
|
|
|
|
Issued: 22,474,821 shares as of December 31, 2017 |
|
|
|
|
|
|
|
|
22,623,506 shares as of December 31, 2016 |
|
|
|
|
|
|
|
|
Additional paid-in capital |
|
|
404,859 |
|
|
401,558 |
|
|
Retained earnings |
|
|
7,655 |
|
|
29,644 |
|
|
|
|
|
434,989 |
|
|
453,826 |
|
|
Treasury stock, at cost, 110,874 shares as of December 31, 2017 and 2016, respectively |
|
|
(3,019) |
|
|
(3,019) |
|
|
Total stockholders’ equity |
|
|
431,970 |
|
|
450,807 |
|
|
Total liabilities and stockholders’ equity |
|
$ |
1,010,144 |
|
$ |
840,233 |
|
See notes to consolidated financial statements.
45
AV HOMES, INC. AND SUBSIDIARIES
Consolidated Statements of Operations
(in thousands, except per share amounts)
|
|
|
|
|
|
|
|
|
|
|
|
|
|
|
For the Years Ended December 31, |
|
|||||||
|
|
|
2017 |
|
2016 |
|
2015 |
|
|||
|
Revenues |
|
|
|
|
|
|
|
|
|
|
|
Homebuilding |
|
$ |
821,616 |
|
$ |
764,041 |
|
$ |
498,915 |
|
|
Amenity and other |
|
|
17,061 |
|
|
11,698 |
|
|
12,385 |
|
|
Land sales |
|
|
4,576 |
|
|
3,566 |
|
|
6,466 |
|
|
Total revenues |
|
|
843,253 |
|
|
779,305 |
|
|
517,766 |
|
|
|
|
|
|
|
|
|
|
|
|
|
|
Expenses |
|
|
|
|
|
|
|
|
|
|
|
Homebuilding cost of revenue |
|
|
682,504 |
|
|
625,471 |
|
|
405,538 |
|
|
Amenity and other |
|
|
14,838 |
|
|
11,148 |
|
|
10,702 |
|
|
Land sales |
|
|
1,785 |
|
|
1,230 |
|
|
823 |
|
|
Total real estate expenses |
|
|
699,127 |
|
|
637,849 |
|
|
417,063 |
|
|
Selling, general and administrative expenses |
|
|
106,391 |
|
|
100,219 |
|
|
79,586 |
|
|
Interest income and other |
|
|
(1,063) |
|
|
(16) |
|
|
(308) |
|
|
Interest expense |
|
|
10,618 |
|
|
3,667 |
|
|
9,039 |
|
|
Loss on extinguishment of debt |
|
|
9,848 |
|
|
— |
|
|
— |
|
|
Total expenses |
|
|
824,921 |
|
|
741,719 |
|
|
505,380 |
|
|
|
|
|
|
|
|
|
|
|
|
|
|
Income before income taxes |
|
|
18,332 |
|
|
37,586 |
|
|
12,386 |
|
|
Income tax expense (benefit) |
|
|
40,268 |
|
|
(109,521) |
|
|
436 |
|
|
Net income (loss) |
|
$ |
(21,936) |
|
$ |
147,107 |
|
$ |
11,950 |
|
|
|
|
|
|
|
|
|
|
|
|
|
|
Basic earnings (loss) per share |
|
$ |
(0.98) |
|
$ |
6.58 |
|
$ |
0.54 |
|
|
Basic weighted average shares outstanding |
|
|
22,493 |
|
|
22,346 |
|
|
22,010 |
|
|
|
|
|
|
|
|
|
|
|
|
|
|
Diluted earnings (loss) per share |
|
$ |
(0.98) |
|
$ |
5.66 |
|
$ |
0.54 |
|
|
Diluted weighted average shares outstanding |
|
|
22,493 |
|
|
26,509 |
|
|
22,130 |
|
See notes to consolidated financial statements.
46
AV HOMES, INC. AND SUBSIDIARIES
Consolidated Statements of Stockholders’ Equity
(in thousands, except share amounts)
|
|
|
|
|
|
|
|
|
|
|
|
|
|
|
|
|
|
|
|
|
|
|
|
|
|
|
|
|
|
Additional |
|
Retained |
|
|
|
|
|
|
Total |
|
|||
|
|
|
Common Stock |
|
Paid-in |
|
Earnings |
|
Treasury Stock |
|
Stockholders’ |
|
|||||||||
|
|
|
Shares |
|
Amount |
|
Capital |
|
(Deficit) |
|
Shares |
|
Amount |
|
Equity |
|
|||||
|
Balance as of December 31, 2014 |
|
22,182,972 |
|
$ |
22,183 |
|
$ |
396,989 |
|
$ |
(129,413) |
|
(110,874) |
|
$ |
(3,019) |
|
$ |
286,740 |
|
|
Issuances of common or restricted stock |
|
291,075 |
|
|
291 |
|
|
(291) |
|
|
— |
|
— |
|
|
— |
|
|
— |
|
|
Forfeiture or cancellation of restricted stock |
|
(20,973) |
|
|
(21) |
|
|
21 |
|
|
— |
|
— |
|
|
— |
|
|
— |
|
|
Shares repurchased to satisfy tax obligations |
|
(9,046) |
|
|
(9) |
|
|
(113) |
|
|
— |
|
— |
|
|
— |
|
|
(122) |
|
|
Share-based compensation |
|
— |
|
|
— |
|
|
3,113 |
|
|
— |
|
— |
|
|
— |
|
|
3,113 |
|
|
Net income |
|
— |
|
|
— |
|
|
— |
|
|
11,950 |
|
— |
|
|
— |
|
|
11,950 |
|
|
Balance as of December 31, 2015 |
|
22,444,028 |
|
$ |
22,444 |
|
$ |
399,719 |
|
$ |
(117,463) |
|
(110,874) |
|
$ |
(3,019) |
|
|
301,681 |
|
|
Issuances of common or restricted stock |
|
347,400 |
|
|
347 |
|
|
(347) |
|
|
— |
|
— |
|
|
— |
|
|
— |
|
|
Forfeiture or cancellation of restricted stock |
|
(155,027) |
|
|
(155) |
|
|
155 |
|
|
— |
|
— |
|
|
— |
|
|
— |
|
|
Shares repurchased to satisfy tax obligations |
|
(12,895) |
|
|
(12) |
|
|
(176) |
|
|
— |
|
— |
|
|
— |
|
|
(188) |
|
|
Share-based compensation |
|
— |
|
|
— |
|
|
2,207 |
|
|
— |
|
— |
|
|
— |
|
|
2,207 |
|
|
Net income |
|
— |
|
|
— |
|
|
— |
|
|
147,107 |
|
— |
|
|
— |
|
|
147,107 |
|
|
Balance as of December 31, 2016 |
|
22,623,506 |
|
$ |
22,624 |
|
$ |
401,558 |
|
$ |
29,644 |
|
(110,874) |
|
$ |
(3,019) |
|
|
450,807 |
|
|
Issuances of common or restricted stock |
|
40,051 |
|
|
40 |
|
|
(40) |
|
|
— |
|
— |
|
|
— |
|
|
— |
|
|
Forfeiture or cancellation of restricted stock and stock units |
|
(175,972) |
|
|
(176) |
|
|
176 |
|
|
— |
|
— |
|
|
— |
|
|
— |
|
|
Shares repurchased to satisfy tax obligations |
|
(12,764) |
|
|
(13) |
|
|
(200) |
|
|
— |
|
— |
|
|
— |
|
|
(213) |
|
|
Share-based compensation |
|
— |
|
|
— |
|
|
3,365 |
|
|
(53) |
|
— |
|
|
— |
|
|
3,312 |
|
|
Net loss |
|
— |
|
|
— |
|
|
— |
|
|
(21,936) |
|
— |
|
|
— |
|
|
(21,936) |
|
|
Balance as of December 31, 2017 |
|
22,474,821 |
|
$ |
22,475 |
|
$ |
404,859 |
|
$ |
7,655 |
|
(110,874) |
|
$ |
(3,019) |
|
$ |
431,970 |
|
See notes to consolidated financial statements.
47
AV HOMES, INC. AND SUBSIDIARIES
Consolidated Statements of Cash Flows
(in thousands)
|
|
|
For the Years Ended December 31, |
|
|||||||
|
|
|
2017 |
|
2016 |
|
2015 |
|
|||
|
Operating Activities |
|
|
|
|
|
|
|
|
|
|
|
Net income (loss) |
|
$ |
(21,936) |
|
$ |
147,107 |
|
$ |
11,950 |
|
|
Adjustments to reconcile net income to net cash provided by (used in) operating activities: |
|
|
|
|
|
|
|
|
|
|
|
Depreciation and amortization |
|
|
6,897 |
|
|
6,368 |
|
|
3,693 |
|
|
Amortization of share-based compensation |
|
|
3,312 |
|
|
2,207 |
|
|
3,113 |
|
|
Change in fair value of contingent consideration |
|
|
(1,818) |
|
|
(422) |
|
|
(116) |
|
|
Impairment charges |
|
|
943 |
|
|
769 |
|
|
— |
|
|
Loss on extinguishment of debt |
|
|
9,848 |
|
|
— |
|
|
— |
|
|
Deferred income taxes, net |
|
|
39,892 |
|
|
(110,257) |
|
|
— |
|
|
Other adjustments, net |
|
|
369 |
|
|
135 |
|
|
(185) |
|
|
Changes in operating assets and liabilities: |
|
|
|
|
|
|
|
|
|
|
|
Restricted cash |
|
|
66 |
|
|
25,717 |
|
|
(10,501) |
|
|
Receivables |
|
|
(2,716) |
|
|
(3,649) |
|
|
(3,698) |
|
|
Land and other inventories |
|
|
19,011 |
|
|
(2,646) |
|
|
(83,804) |
|
|
Prepaid expenses and other assets |
|
|
(5,889) |
|
|
3,646 |
|
|
1,510 |
|
|
Accounts payable, estimated development liability, and accrued and other liabilities |
|
|
(12,898) |
|
|
3,487 |
|
|
17,248 |
|
|
Customer deposits |
|
|
(472) |
|
|
1,350 |
|
|
1,813 |
|
|
Net cash provided by (used in) operating activities |
|
|
34,609 |
|
|
73,812 |
|
|
(58,977) |
|
|
|
|
|
|
|
|
|
|
|
|
|
|
Investing Activities |
|
|
|
|
|
|
|
|
|
|
|
Investment in property and equipment |
|
|
(2,161) |
|
|
(1,578) |
|
|
(1,209) |
|
|
Proceeds from sales of property and equipment |
|
|
5 |
|
|
11 |
|
|
31 |
|
|
Business acquisitions |
|
|
(41,150) |
|
|
10 |
|
|
(93,760) |
|
|
Investment in unconsolidated entities |
|
|
(267) |
|
|
(20) |
|
|
(2,887) |
|
|
Net cash used in investing activities |
|
|
(43,573) |
|
|
(1,577) |
|
|
(97,825) |
|
|
|
|
|
|
|
|
|
|
|
|
|
|
Financing Activities |
|
|
|
|
|
|
|
|
|
|
|
Proceeds from issuance of debt |
|
|
400,000 |
|
|
— |
|
|
79,930 |
|
|
Gross proceeds from Senior Secured Credit Facility |
|
|
30,000 |
|
|
35,000 |
|
|
40,000 |
|
|
Payments of Senior Secured Credit Facility |
|
|
(30,000) |
|
|
(35,000) |
|
|
(40,000) |
|
|
Debt issuance costs |
|
|
(8,148) |
|
|
— |
|
|
(2,072) |
|
|
Principal payments of senior debt |
|
|
(200,000) |
|
|
(46,793) |
|
|
(53,163) |
|
|
Premium paid on redemption of debt |
|
|
(6,718) |
|
|
— |
|
|
— |
|
|
Contingent consideration and other financing activities |
|
|
(2,972) |
|
|
(4,548) |
|
|
(1,329) |
|
|
Net cash provided by (used in) financing activities |
|
|
182,162 |
|
|
(51,341) |
|
|
23,366 |
|
|
|
|
|
|
|
|
|
|
|
|
|
|
Increase (decrease) in cash and cash equivalents |
|
|
173,198 |
|
|
20,894 |
|
|
(133,436) |
|
|
Cash and cash equivalents at beginning of year |
|
|
67,792 |
|
|
46,898 |
|
|
180,334 |
|
|
Cash and cash equivalents at end of year |
|
$ |
240,990 |
|
$ |
67,792 |
|
$ |
46,898 |
|
|
|
|
|
|
|
|
|
|
|
|
|
|
Non-cash transactions: |
|
|
|
|
|
|
|
|
|
|
|
Transfer from assets held for sale to land and other inventories and property and equipment |
|
$ |
— |
|
$ |
— |
|
$ |
4,051 |
|
|
Distribution of land from unconsolidated joint venture |
|
$ |
— |
|
$ |
— |
|
$ |
19,860 |
|
|
Supplemental cash flow information: |
|
|
|
|
|
|
|
|
|
|
|
Interest paid, net of capitalized interest |
|
$ |
12,656 |
|
$ |
2,098 |
|
$ |
4,846 |
|
|
Income taxes paid |
|
$ |
720 |
|
$ |
1,240 |
|
$ |
— |
|
|
Supplemental non-cash investing activity: |
|
|
|
|
|
|
|
|
|
|
|
Accrual of contingent consideration as of the acquisition date |
|
$ |
1,818 |
|
$ |
— |
|
$ |
6,000 |
|
See notes to consolidated financial statements.
48
AV HOMES, INC. AND SUBSIDIARIES
Notes to Consolidated Financial Statements
December 31, 2017
Note 1 - Summary of Significant Accounting Policies
Basis of Presentation
The accompanying consolidated financial statements include the accounts of AV Homes, Inc. and all subsidiaries, partnerships and other entities in which AV Homes, Inc. (“AV Homes,” “we,” “us,” “our,” or the “Company”) has a controlling interest. Our investments in unconsolidated entities in which we have less than a controlling interest are accounted for using the equity method. All intercompany accounts and transactions have been eliminated in consolidation. For comparative purposes, certain prior year amounts have been reclassified to conform to the current year presentation. We have no components of comprehensive income (loss), therefore, net income (loss) and comprehensive income (loss) are the same for the years ended December 31, 2017, 2016 and 2015.
Use of Estimates
The preparation of our consolidated financial statements in conformity with U.S. generally accepted accounting principles (“GAAP”) requires management to make estimates and assumptions that affect the amounts reported in the financial statements and accompanying notes. Actual results could differ from those estimates.
TPG Investment in Company
TPG Aviator, L.P. (“TPG Aviator”) beneficially owned approximately 43.7% of our common stock as of December 31, 2017, and is our largest single stockholder. In June 2013, concurrent with TPG Aviator’s initial investment, we entered into a Management Services Agreement with TPG VI Management, LLC (“TPG Management”), an affiliate of TPG Aviator, that sets forth certain financial advisory services to be provided by, and fees to be paid to, TPG Management in connection with ongoing services to us. Pursuant to the Management Services Agreement and in exchange for certain ongoing advisory and consulting services, we agreed to pay to TPG Management a monitoring fee up to $0.5 million per year for so long as TPG Aviator and its affiliates own at least 30% of the Common Stock outstanding and also to reimburse expenses incurred by TPG Management and its affiliates to provide services or enforce its rights under the management services agreement. The monitoring fee is reduced proportionately based on TPG Aviator’s board representation rights under a separate Stockholders Agreement we entered into with TPG Aviator. The monitoring fee is payable quarterly in advance and is reduced by director fees otherwise payable to the TPG-nominated directors who are not employed by TPG Aviator or its affiliates. We paid TPG Management a total of $0.4 million during each of the years ended December 31, 2017, 2016 and 2015, for the annual monitoring fee and reimbursement of expenses under the Management Services Agreement.
Cash and Cash Equivalents and Restricted Cash
We consider all highly liquid investments purchased with an initial maturity of three months or less to be cash equivalents. As of December 31, 2017, our cash and cash equivalents were invested primarily in money market accounts that invest primarily in U.S. government securities. Due to the short maturity period of the cash equivalents, the carrying amount of these instruments approximate their fair values.
Our cash items that are restricted as to withdrawal or usage include deposits of $1.2 million as of December 31, 2017 and 2016.
49
Land and Other Inventories and Homebuilding Cost of Revenue
Land and other inventories include expenditures for land acquisition, construction, land development, construction costs for homeowners’ association amenities, and direct and allocated indirect costs, including interest cost capitalized until development and construction are substantially completed. These costs are assigned to components of land and other inventories based on specific identification, relative sales value, or area allocation methods.
Land and other inventories are stated at cost unless the asset is determined to be impaired, in which case the asset is written to its fair value, in accordance with ASC 360, Property, Plant and Equipment (“ASC 360”).
Homebuilding cost of revenue is comprised of direct and allocated costs, including estimated future costs for the limited warranty we provide on our homes. Land acquisition, land development and other common costs are generally allocated on a relative sales value or area allocation basis to the homes or lots within the applicable community or land parcel. Land acquisition and land development costs include related interest and real estate taxes incurred during the period of time under development.
We evaluate our land and other inventories for impairment on a quarterly basis in accordance with ASC 360 to reflect market conditions, including a consideration of supply of new and resale homes for sale in the respective market, level of foreclosure activity and competition. For assets held and used, if indicators are present, we perform an impairment test in which the asset is reviewed for impairment by comparing the estimated future undiscounted cash flows to be generated by the asset to its carrying value. If such cash flows are less than the asset’s carrying value, the carrying value is written down to its estimated fair value. Generally, fair value is determined by discounting the estimated cash flows at a rate commensurate with the inherent risks associated with the asset and related estimated cash flow streams. The discount rate used in the determination of fair value would vary, depending on the state of development. Assumptions and estimates used in the determination of the estimated future cash flows are based on expectations of future operations and economic conditions. Changes to these assumptions could significantly affect the estimates of future cash flows, which could affect the potential for future impairments. Due to the uncertainties of the estimation process, actual results could differ significantly from such estimates.
During the years ended December 31, 2017 and 2016, our impairment assessments resulted in $0.9 million and $0.8 million of impairment charges, respectively, and are included in homebuilding cost of revenue in the consolidated statements of operations. During the year ended December 31, 2015, our impairment assessment resulted in no significant impairment charges.
Receivables
Receivables primarily consists of amounts in transit or due from title companies for home closings and rebates.
Property and Equipment, net
Property and equipment are stated at cost, net of accumulated depreciation, which is computed by the straight-line method over the following estimated useful lives of the assets: land improvements 5 to 15 years; buildings and improvements 3 to 40 years; and machinery, equipment and fixtures 3 to 10 years. Maintenance and operating expenses of equipment utilized in the development of land are capitalized to land inventory. Repairs and maintenance are expensed as incurred.
Property and equipment includes amenities assets such as club facilities on properties owned by us. The cost of amenities includes expenditures for land acquisition, construction, land development and direct and allocated costs. Property and equipment owned and constructed by us also includes interest cost incurred during development and construction.
Each reporting period, we review our property and equipment for indicators of impairment in accordance with ASC 360. For our amenities, which are located within certain of our communities, indicators of potential impairment are similar to those of our housing communities, as these factors may impact our ability to generate revenues at our
50
amenities or cause construction costs to increase. In addition, we factor in the collectability and potential delinquency of the fees due for our amenity memberships. There were no indicators of impairment during the years ended December 31, 2017 and 2016.
Investments in Partnerships and Limited Liability Companies
When we are either deemed to hold the controlling interest in a voting interest entity or deemed to be the primary beneficiary of a variable interest entity (“VIE”), we are required to consolidate the investment.
Factors considered when determining if we hold the controlling interest in a voting interest entity include who holds the general partnership or managing member interests, which partner or member makes the day-to-day decisions regarding the operations of the entity, and whether or not the other partners or members have substantive participating rights.
With respect to VIEs, our variable interests may be in the form of (1) equity ownership, (2) contracts to purchase assets and/or (3) loans provided by us to the investor. We examine specific criteria and use judgment when determining if we are the primary beneficiary of a VIE. The primary beneficiary of a VIE is the entity that has both of the following characteristics: (a) the power to direct the activities of a VIE that most significantly impact the VIE’s economic performance and (b) the obligation to absorb the majority of losses of the VIE or the right to receive the majority of benefits from the VIE.
Investments, including joint ventures with independent third parties, where we do not hold the controlling interest and we are not the primary beneficiary, but over which we have significant influence, are accounted for under the equity method. Under the equity method of accounting, we recognize our proportionate share of the earnings and losses of these entities.
The balance of our investments in unconsolidated entities was $0.3 million and $1.2 million as of December 31, 2017 and December 31, 2016, respectively, and is included in prepaid expenses and other assets in our consolidated balance sheets.
We evaluate our investments in unconsolidated entities for recoverability in accordance with ASC 323, Investments – Equity Method and Joint Ventures. If we determine that a loss in the value of the investment is other than temporary, we write down the investment to its estimated fair value. Any such losses are recorded to equity in (earnings) loss of unconsolidated entities in the consolidated statements of operations. Due to uncertainties in the estimation process and the significant volatility in demand for new housing, actual results could differ significantly from such estimates. There were no indicators of impairment during the years ended December 31, 2017 and 2016.
Business Acquisitions
When acquiring a business, we allocate the purchase price to the tangible and intangible assets and liabilities assumed based on their estimated fair values. In making estimates of fair values for this purpose, we use a number of sources, including independent appraisals and information obtained about each property as a result our pre-acquisition due diligence and its marketing and housing activities. See Note 2, Business Acquisitions.
Goodwill
Goodwill arises from business combinations and represents the excess of the cost of an acquired entity over the net fair value amounts that were assigned to the identifiable assets acquired and the liabilities assumed. Goodwill is tested for impairment at the reporting unit level on an annual basis and between annual tests if an event occurs or circumstances change that would more likely than not reduce the fair value of the reporting unit below its carrying value. There were no indicators of impairment during the years ended December 31, 2017 and 2016.
51
Revenue Recognition
In accordance with ASC 360, homebuilding revenue and related profit from the sales of housing units are recognized when title to and possession of the property are transferred to the buyer. In addition, revenue from land sales is recognized in full at closing, provided the buyer’s initial and continuing investment is adequate, any financing is considered collectible and there is no significant continuing involvement.
Sales Incentives
When sales incentives involve a discount on the selling price of the home, we record the discount as a reduction of revenue at the time of home closing. If the sales incentive requires us to provide a free product or service to the customer, the cost of the free product or service is recorded as cost of revenues at the time of home closing. This includes the cost related to optional upgrades and seller-paid financing costs, closing costs, homeowners’ association fees, or merchandise.
Advertising Costs
Advertising costs are expensed as incurred. During the years ended December 31, 2017, 2016 and 2015, advertising costs totaled $4.0 million, $3.6 million and $3.0 million, respectively. Advertising costs, sales commissions and closing costs are included in selling, general and administrative expenses in the accompanying consolidated statements of operations.
Warranty Costs
Warranty reserves for homes are established to cover estimated costs for materials and labor with regard to warranty-type claims to be incurred subsequent to the closing of a home. Reserves are determined based on historical data and other relevant factors. We have, and require our subcontractors to have, general liability, property, workers’ compensation, and other business insurance. These insurance policies protect us against a portion of our risk of loss from claims, subject to certain self-insured per occurrence and aggregate retentions, deductibles, and available policy limits. We may have recourse against subcontractors for certain claims relating to workmanship and materials. Warranty reserves are included in accrued and other liabilities in the consolidated balance sheets.
During the years ended December 31, 2017, 2016 and 2015, changes in the warranty reserve consisted of the following (in thousands):
|
|
|
|
|
|
|
|
|
|
|
|
|
|
|
For the Years Ended December 31, |
|
|||||||
|
|
|
2017 |
|
2016 |
|
2015 |
|
|||
|
Accrued warranty reserve, beginning of period |
|
$ |
4,033 |
|
$ |
3,333 |
|
$ |
1,528 |
|
|
Reserve provided |
|
|
5,089 |
|
|
3,864 |
|
|
3,974 |
|
|
Payments |
|
|
(4,206) |
|
|
(3,164) |
|
|
(2,169) |
|
|
Accrued warranty reserve, end of period |
|
$ |
4,916 |
|
$ |
4,033 |
|
$ |
3,333 |
|
Income Taxes
The provision for income taxes is calculated using the asset and liability method, under which deferred tax assets and liabilities are recognized by identifying the temporary differences arising from the different treatment of items for tax and accounting purposes. In assessing the realizability of deferred tax assets, we consider whether it is more likely than not that some portion or all of the deferred tax assets will not be realized. The ultimate realization of deferred tax assets is primarily dependent upon the generation of future taxable income. See Note 11, Income Taxes.
In determining the future tax consequences of events that have been recognized in the financial statements or tax returns, judgment is required. Differences between the anticipated and actual outcomes of these future tax consequences could have a material impact on our consolidated results of operations or financial position.
52
Share-Based Compensation
The Amended and Restated 1997 Incentive and Capital Accumulation Plan (2011 Restatement), as amended (“Incentive Plan”) and the 2015 Incentive Compensation Plan, as amended and restated (the “2015 Plan”) provide for the grant of stock options, stock appreciation rights, stock awards, performance awards, and stock units to officers, employees and directors of AV Homes. The exercise prices of stock options granted under the Incentive Plan and the 2015 Plan may not be less than the stock exchange closing price of our common stock on the date of grant. Stock option awards under the Incentive Plan and 2015 Plan generally expire 10 years after the date of grant.
As of December 31, 2017, there were an aggregate of 1.5 million shares available for grant under the 2015 Plan and 0.3 million shares reserved for future issuance relating to stock options and restricted stock units previously awarded and currently outstanding under the 2015 Plan. Additionally, as of December 31, 2017, an aggregate of 0.5 million shares of our common stock were reserved for future issuance in connection with stock options and restricted stock units previously awarded under the Incentive Plan. See Note 10, Share-Based Payments and Other Compensation.
Employee Benefit Plans
We have a defined contribution savings plan that covers substantially all employees. Under this savings plan, we may contribute to the plan based upon specified percentages of employees’ voluntary contributions. During the years ended December 31, 2017 and 2016, we contributed $0.3 million and $0.3 million to the plan, respectively. We made no contributions to the plan for the year ended December 31, 2015.
Earnings (Loss) Per Share
Basic earnings (loss) per share is computed by dividing net income (loss) by the weighted average number of common shares outstanding for the period. Diluted earnings per share reflects the potential dilution that could occur if securities or other contracts to issue common stock were exercised or converted into common stock or resulted in the issuance of common stock that then shared in the earnings of AV Homes.
The weighted average number of shares outstanding in calculating basic earnings (loss) per share includes the addition of 0.1 million shares in 2017, 2016 and 2015, each in connection with the vesting of restricted stock and restricted stock units each year. Excluded from the weighted average number of shares outstanding are 0.1 million shares for 2016 and 0.3 million shares for 2015 associated with annual restricted stock awards that remain subject to vesting and performance requirements. There were no shares excluded in 2017. See Note 10, Share-Based Payments and Other Compensation. In accordance with ASC 260, Earnings Per Share, nonvested shares are not included in basic earnings (loss) per share until the vesting and performance requirements are met.
53
The following table represents a reconciliation of the net income (loss) and weighted average shares outstanding for the calculation of basic and diluted earnings (loss) per share for the years ended December 31, 2017, 2016 and 2015 (in thousands, except per share amounts):
|
|
|
For the Years Ended December 31, |
|
|||||||
|
|
|
2017 |
|
2016 |
|
2015 |
|
|||
|
Numerator: |
|
|
|
|
|
|
|
|
|
|
|
Basic net income (loss) |
|
$ |
(21,936) |
|
$ |
147,107 |
|
$ |
11,950 |
|
|
Effect of dilutive securities |
|
|
— |
|
|
2,969 |
|
|
— |
|
|
Diluted net income (loss) |
|
$ |
(21,936) |
|
$ |
150,076 |
|
$ |
11,950 |
|
|
|
|
|
|
|
|
|
|
|
|
|
|
Denominator: |
|
|
|
|
|
|
|
|
|
|
|
Basic weighted average shares outstanding |
|
|
22,493 |
|
|
22,346 |
|
|
22,010 |
|
|
Effect of dilutive securities |
|
|
— |
|
|
4,163 |
|
|
120 |
|
|
Diluted weighted average shares outstanding |
|
|
22,493 |
|
|
26,509 |
|
|
22,130 |
|
|
|
|
|
|
|
|
|
|
|
|
|
|
Basic earnings (loss) per share |
|
$ |
(0.98) |
|
$ |
6.58 |
|
$ |
0.54 |
|
|
Diluted earnings (loss) per share |
|
$ |
(0.98) |
|
$ |
5.66 |
|
$ |
0.54 |
|
Recent Accounting Pronouncements
In January 2017, the Financial Accounting Standards Board (“FASB”) issued Accounting Standards Update (“ASU”) No. 2017-04, Intangibles – Goodwill and Other (Topic 350): Simplifying the Accounting for Goodwill Impairment (“ASU 2017-04”), which removes the requirement to perform a hypothetical purchase price allocation to measure goodwill impairment. A goodwill impairment will now be the amount by which a reporting unit’s carrying value exceeds its fair value, not to exceed the carrying amount of goodwill. ASU 2017-04 is effective for us for annual and interim periods beginning January 1, 2020, with early adoption permitted, and applied prospectively. We adopted this guidance in the first quarter of 2017 and there was no impact on our consolidated financial statements.
In January 2017, the FASB issued ASU No. 2017-01, Business Combinations (Topic 805), Clarifying the Definition of a Business (“ASU 2017-01”). ASU 2017-01 clarifies the definition of a business with the objective of addressing whether transactions involving in-substance nonfinancial assets, held directly or in a subsidiary, should be accounted for as acquisitions or disposals of nonfinancial assets or of businesses. ASU 2017-01 is effective for us for the fiscal year and interim periods beginning January 1, 2018, with early adoption permitted, and applied prospectively. We do not anticipate the adoption of ASU 2017-01 to have a material impact on our consolidated financial statements.
In August 2016, the FASB issued ASU No. 2016-15, Statement of Cash Flows (Topic 230): Classification of Certain Cash Receipts and Cash Payments (“ASU 2016-15”). ASU 2016-15 reduces the existing diversity in practice in financial reporting across all industries by clarifying certain existing principles in ASC 230, Statement of Cash Flows, including providing additional guidance on how and what an entity should consider in determining the classification of certain cash flows. ASU 2016-15 is effective for us for the fiscal year and interim periods beginning January 1, 2018. The adoption of ASU 2016-15 will modify our current disclosures within the consolidated statements of cash flows but is not expected to have a material effect on our consolidated financial statements.
In March 2016, the FASB issued ASU No. 2016-09, Compensation - Stock Compensation (Topic 718): Improvements to Employee Share-Based Payment Accounting (“ASU 2016-09”). ASU 2016-09 simplifies several aspects of the accounting for share-based payment transactions. ASU 2016-09 became effective for us for fiscal years and interim periods beginning January 1, 2017. Amendments related to the timing of when excess tax benefits are recognized, minimum statutory withholding requirements and forfeitures were applied on a modified retrospective transition method through a cumulative-effect adjustment to equity as of January 1, 2017. The adoption of the provisions of ASU 2016-09 in the first quarter of 2017 had no material effect on our consolidated financial statements.
In February 2016, the FASB issued ASU No. 2016-02, Leases (Topic 842) (“ASU 2016-02”). ASU 2016-02 will require organizations that lease assets–referred to as “lessees”–to recognize on the balance sheet the assets and liabilities
54
for the rights and obligations created by those leases. Under ASU 2016-02, a lessee will be required to recognize assets and liabilities for leases with lease terms of more than twelve months. Lessor accounting remains substantially similar to current GAAP. In addition, disclosures of leasing activities are to be expanded to include qualitative along with specific quantitative information. ASU 2016-02 is effective for us for fiscal years and interim periods beginning January 1, 2019. The standard mandates a modified retrospective transition method. We continue to evaluate the impact of adopting this guidance on our consolidated financial statements.
In May 2014, the FASB issued ASU No. 2014-09, Revenue from Contracts with Customers (“ASU 2014-09”). The standard is a comprehensive new revenue recognition model that requires revenue to be recognized in a manner to depict the transfer of goods or services to a customer at an amount that reflects the consideration expected to be received in exchange for those goods or services. ASU 2014-09 also affects certain industry-specific cost guidance. The FASB has also issued several updates to this standard. The standard is effective for us for annual and interim periods beginning January 1, 2018, and we plan to apply the modified retrospective method of adoption.
We have evaluated the impact of the adoption of ASU 2014-09 and concluded that there will not be a material change to the amount or timing of our homebuilding, amenity and other, and land sales revenues. Our homebuilding revenue currently includes forfeited customer deposits. This classification will not change under the new standard. However, the standard will impact the timing of recognition for certain selling costs related to model homes and sales offices. Prior to the adoption of ASU 2014-09, for selling communities, these costs were capitalized as land and other inventories and expensed as homes in the communities were closed in accordance with ASC 970-340. Upon adoption, the balance of these capitalized selling costs will be recorded as either land and other inventories or property and equipment, while the remaining costs that would have been expensed under the new guidance will be reflected as an adjustment to retained earnings on January 1, 2018. We expect that adjustment to be a decrease of approximately $1.4 million in our land and other inventories and retained earnings balances.
Note 2 - Business Acquisitions
Our acquisitions are accounted for in accordance with ASC 805, Business Combinations (“ASC 805”). We record the acquired assets and assumed liabilities at their estimated fair values. We determine the estimated fair values with the assistance of appraisals or valuations performed by independent third-party specialists, discounted cash flow analyses, quoted market prices where available, and estimates by management. To the extent the consideration transferred exceeds the fair value of the net assets acquired in a transaction, such excess is assigned to goodwill.
Receivables and other assets, property and equipment, accounts payable and accrued and other liabilities and customer deposits are generally stated at historical carrying values given the short-term nature of these assets and liabilities. Liabilities are recorded at historical carrying values in accordance with ASC 805, which we believe approximates fair value.
We determine the fair value of land and other inventories on a lot-by-lot basis primarily using market comparable land and home sales transactions combined with our estimates related to expected average home selling prices and sales incentives, expected sales paces and cancellation rates, expected land development and construction timelines, and anticipated land development, construction, and overhead costs. Such estimates must be made for each individual community and may vary significantly between communities. The fair values of identified intangible assets are determined using discounted cash flow models.
We engage a third-party valuation specialist to assist with the determination of the estimated fair value of intangible assets acquired. We estimate the preliminary fair value of acquired assets and liabilities as of the date of acquisition based on information available at that time. The valuation of these tangible and identifiable intangible assets and liabilities is subject to further management review and may change during the purchase price allocation period.
55
Savvy Homes Acquisition
On April 3, 2017, we acquired substantially all of the assets of Savvy Homes, LLC and certain of its affiliated entities (“Savvy Homes”) for approximately $43 million, which included an earn-out of $1.8 million, which was subject to customary post-closing adjustments. As of December 31, 2017, we revised our estimated earn-out payment to zero as we do not expect Savvy Homes to meet the required performance targets. The $1.8 million of income is included in selling, general and administrative expenses in the consolidated statements of operations. The assets acquired included substantially all of the real estate, land acquisition agreements and permits associated with the Savvy Homes business, and certain of its leases, contracts, commitments and purchase orders. We also assumed certain liabilities of Savvy Homes, including the liabilities and obligations relating to the acquired contracts, but excluding other liabilities including home warranty obligations relating to homes closed by Savvy Homes prior to the acquisition. Savvy Homes acquires raw and developed land, develops raw land and constructs single-family homes in the Raleigh, North Carolina area and enhances our position in a key growth market. The results of operations of Savvy Homes are included in our consolidated financial statements from the acquisition date of April 3, 2017. During the year ended December 31, 2017, Savvy Homes’ revenue and net loss included in our 2017 consolidated financial statements were $53.2 million and $4.0 million, respectively. The $4.0 million net loss does not include income of $1.8 million from the reversal of the earn-out liability, which is included in our corporate general and administrative expenses.
The following table summarizes the calculation of the fair value of the total consideration transferred to Savvy Homes and its allocation to the assets acquired and liabilities assumed as of the acquisition date (in thousands):
|
Fair value of consideration transferred: |
|
|
|
|
|
Cash paid for Savvy Homes net assets |
|
$ |
41,150 |
|
|
Contingent consideration (earn-out) |
|
|
1,818 |
|
|
Total consideration transferred |
|
$ |
42,968 |
|
|
|
|
|
|
|
|
Assets acquired and liabilities assumed: |
|
|
|
|
|
Assets |
|
|
|
|
|
Receivables and other assets |
|
$ |
159 |
|
|
Land and other inventories |
|
|
39,311 |
|
|
Property and equipment |
|
|
168 |
|
|
Trade name |
|
|
407 |
|
|
Goodwill |
|
|
11,005 |
|
|
Total assets acquired |
|
|
51,050 |
|
|
|
|
|
|
|
|
Liabilities |
|
|
|
|
|
Accounts payable |
|
|
7,692 |
|
|
Accrued and other liabilities |
|
|
390 |
|
|
Total liabilities assumed |
|
|
8,082 |
|
|
Total net assets acquired |
|
$ |
42,968 |
|
The $0.4 million of acquired intangible assets relates to trade names that are being amortized over 2.75 years. Amortization expense for these assets was $0.1 million for the year ended December 31, 2017 and is included in selling, general and administrative expenses in the consolidated statements of operations.
Transaction and integration costs directly related to the Savvy Homes acquisition, including legal and accounting fees, were $1.0 million year ended December 31, 2017 and are included in selling, general and administrative expenses in the consolidated statements of operations. Such costs were expensed as incurred in accordance with ASC 805.
56
The following represents the unaudited pro forma operating results as if Savvy Homes had been included in our consolidated statements of operations and as of the beginning of the fiscal year presented (in thousands, except per share data):
|
|
|
|
Year Ended December 31, |
||||
|
|
|
|
2017 |
|
2016 |
||
|
Revenue |
|
|
$ |
860,723 |
|
$ |
850,937 |
|
Net income (loss) |
|
|
|
(21,722) |
|
|
150,195 |
|
Basic earnings (loss) per share |
|
|
|
(0.97) |
|
|
6.72 |
|
Diluted earnings (loss) per share |
|
|
|
(0.97) |
|
|
5.78 |
The supplemental pro forma operating results have been determined after adjusting the operating results of Savvy Homes to reflect additional expense that would have been recorded assuming the fair value adjustments to inventory and intangible assets had been applied as of January 1, 2016. These results may not be indicative of future operating results.
Bonterra Builders Acquisition
On July 1, 2015, we acquired substantially all of the assets and certain liabilities of Bonterra Builders, LLC (“Bonterra Builders”) for approximately $99.8 million. The earn-out was $5.7 million, which has been paid as of December 31, 2017. A portion of the aggregate consideration equal to $0.8 million was held back by us at the closing as security for Bonterra Builder’s indemnification and other potential obligations under the purchase agreement, which has been fully paid as of December 31, 2017. Bonterra Builders acquires raw and developed land, develops raw land and constructs single-family homes in the Charlotte, North Carolina area. With approximately 1,700 lots owned or controlled at the time of acquisition, Bonterra Builders significantly enhanced our position in a key growth market. The results of Bonterra Builders’ operations are included in our consolidated financial statements from the acquisition date of July 1, 2015.
We acquired substantially all of the assets of Bonterra Builders, including all of its real estate, land acquisition agreements and permits, and certain of its leases, contracts, commitments and purchase orders. We also assumed certain liabilities of Bonterra Builders, including the liabilities and obligations relating to the acquired contracts, but excluding certain home warranty obligations relating to homes closed by Bonterra Builders prior to the acquisition.
57
The following table summarizes the calculation of the fair value of the total consideration transferred to Bonterra Builders and the amounts of assets acquired and liabilities assumed as of the acquisition date (in thousands):
|
Fair value of consideration transferred: |
|
|
|
|
|
Cash paid for Bonterra Builders net assets |
|
$ |
40,818 |
|
|
Contingent consideration (earn-out) |
|
|
6,000 |
|
|
Debt repaid at closing |
|
|
52,941 |
|
|
Total consideration transferred |
|
$ |
99,759 |
|
|
|
|
|
|
|
|
Assets acquired and liabilities assumed: |
|
|
|
|
|
Assets |
|
|
|
|
|
Receivables and other assets |
|
$ |
574 |
|
|
Land and other inventories |
|
|
91,632 |
|
|
Property and equipment |
|
|
14 |
|
|
Trade name |
|
|
1,400 |
|
|
Non-compete intangible asset |
|
|
600 |
|
|
Goodwill |
|
|
13,223 |
|
|
Total assets acquired |
|
|
107,443 |
|
|
|
|
|
|
|
|
Liabilities |
|
|
|
|
|
Accounts payable |
|
|
5,071 |
|
|
Accrued and other liabilities |
|
|
763 |
|
|
Customer deposits |
|
|
1,850 |
|
|
Total liabilities assumed |
|
|
7,684 |
|
|
Total net assets acquired |
|
$ |
99,759 |
|
The $2.0 million of acquired intangible assets relates to trade names and non-compete agreements that are being amortized over five years and three years, respectively. Amortization expense for these assets totaled $0.5 million, $0.4 million and $0.3 million for the years ended December 31, 2017, 2016 and 2015, respectively, which is included in the consolidated statements of operations within selling, general and administrative expenses.
During the year ended December 31, 2015, goodwill decreased by $1.7 million due to a post-closing purchase price adjustment and a revision of the valuation of the earn-out, as we finalized our acquisition accounting.
Transaction and integration costs directly related to the Bonterra Builders acquisition, including legal and accounting fees, totaled $0.9 million for the year ended December 31, 2015, the majority of which are included in the consolidated statements of operations within selling, general and administrative expenses. Such costs were expensed as incurred in accordance with ASC 805.
The following represents the unaudited pro forma operating results as if Bonterra Builders had been included in the Company’s consolidated statements of operations as of the beginning of the fiscal year presented (in thousands):
|
|
|
|
Year Ended December 31, |
|
|
|
|
|
2015 |
|
|
Revenue |
$ |
588,533 |
||
|
Net income |
|
|
|
17,158 |
The supplemental pro forma operating results have been determined after adjusting the operating results of Bonterra Builders to reflect additional expense that would have been recorded assuming the fair value adjustments to inventory and intangible assets had been applied as of January 1, 2015. These results may not be indicative of future operating results.
58
The amount of revenue and net income of Bonterra Builders included in the consolidated statements of operations for 2017 is $168.8 million and $7.2 million, respectively. The amount of revenue and net income of Bonterra Builders included in the consolidated statements of operations for 2016 is $177.6 million and $7.9 million, respectively.
Note 3 - Land and Other Inventories
As of December 31, 2017 and 2016, land and other inventories consisted of the following (in thousands):
|
|
|
December 31, |
|
||||
|
|
|
2017 |
|
2016 |
|
||
|
Land held for future development |
|
$ |
29,312 |
|
$ |
29,089 |
|
|
Land developed and in process of development |
|
|
351,798 |
|
|
349,891 |
|
|
Homes completed or under construction |
|
|
222,741 |
|
|
205,428 |
|
|
Total |
|
$ |
603,851 |
|
$ |
584,408 |
|
We capitalize interest to inventories during the period of development in accordance with ASC 835, Interest (“ASC 835”). Homebuilding interest capitalized as cost of inventories is included in cost of sales as related units or lots are sold. To the extent our homebuilding debt exceeds our qualified assets, as defined in ASC 835, we expense a portion of interest incurred. Qualified homebuilding assets consist of land, lots and homes, excluding finished unsold homes or finished models, that are under development or construction.
The following table represents interest incurred, interest capitalized, and interest expense for December 31, 2017, 2016 and 2015 (in thousands):
|
|
|
For the Years Ended December 31, |
|
|||||||
|
|
|
2017 |
|
2016 |
|
2015 |
|
|||
|
Interest incurred |
|
$ |
32,490 |
|
$ |
26,145 |
|
$ |
28,207 |
|
|
Interest capitalized |
|
|
(21,872) |
|
|
(22,478) |
|
|
(19,168) |
|
|
Interest expense |
|
$ |
10,618 |
|
$ |
3,667 |
|
$ |
9,039 |
|
Note 4 - Property and Equipment, net
As of December 31, 2017 and 2016, property and equipment, net consisted of the following (in thousands):
|
|
|
December 31, |
|
||||
|
|
|
2017 |
|
2016 |
|
||
|
Land improvements |
|
$ |
24,420 |
|
$ |
23,820 |
|
|
Building |
|
|
38,821 |
|
|
38,367 |
|
|
Equipment |
|
|
5,877 |
|
|
5,185 |
|
|
Motor vehicles |
|
|
521 |
|
|
521 |
|
|
Furniture and fixtures |
|
|
4,016 |
|
|
4,033 |
|
|
Capitalized software |
|
|
2,291 |
|
|
2,099 |
|
|
Gross property and equipment |
|
|
75,946 |
|
|
74,025 |
|
|
Less: accumulated depreciation |
|
|
(43,282) |
|
|
(40,345) |
|
|
Property and equipment, net |
|
$ |
32,664 |
|
$ |
33,680 |
|
As of December 31, 2017, we had $2.1 million of equipment with $1.7 million of accumulated depreciation that were financed with capital leases. The amortization of these assets is recorded as depreciation expense and is included within selling, general and administrative expenses on our consolidated statements of operations.
59
Note 5 - Investments in Unconsolidated Entities
We participate in entities with less than 100% equity interests. One entity in which we have a 58% equity interest, was formed for the purpose of acquiring and developing land in our Encore active adult community in Arizona while the other is a mortgage joint venture in which we have a 50% equity interest, was formed in the fourth quarter of 2017 to serve as a preferred lender for homebuyers in our markets along with other related services.
We determine the method for accounting for our investment at inception or upon a reconsideration event. We share in the profits and losses of unconsolidated entities generally in accordance with our ownership interests. Earnings from investments in unconsolidated entities is included within interest income and other in our consolidated statement of operations. We and our equity partners make initial and ongoing capital contributions to these unconsolidated entities on a pro-rata basis. The obligation to make capital contributions is governed by each unconsolidated entity’s respective operating agreement or other governing documents. We made contributions totaling less than $0.3 million, less than $0.1 million and $2.9 million to our unconsolidated entities during the years ended December 31, 2017, 2016 and 2015, respectively. The balance of our investments in unconsolidated entities was $0.3 million and $1.2 million as of December 31, 2017 and December 31, 2016, respectively, and is included in prepaid expenses and other assets in our consolidated balance sheets.
Note 6 - Senior Debt
As of December 31, 2017 and 2016, senior debt, net consisted of the following (in thousands):
|
|
|
December 31, |
|
||||
|
|
|
2017 |
|
2016 |
|
||
|
6.625% Senior Notes due 2022 |
|
$ |
400,000 |
|
$ |
— |
|
|
6.00% Senior Convertible Notes due 2020 |
|
|
80,000 |
|
|
80,000 |
|
|
8.50% Senior Notes due 2019 |
|
|
— |
|
|
200,000 |
|
|
Senior Unsecured Credit Facility |
|
|
— |
|
|
— |
|
|
Senior Secured Credit Facility |
|
|
— |
|
|
— |
|
|
Total senior debt |
|
|
480,000 |
|
|
280,000 |
|
|
Deferred debt issuance costs |
|
|
(7,853) |
|
|
(4,285) |
|
|
Debt discount |
|
|
(39) |
|
|
(55) |
|
|
Total senior debt, net |
|
$ |
472,108 |
|
$ |
275,660 |
|
6.625% Senior Notes due 2022
On May 18, 2017, we completed a private offering of $400.0 million of our 6.625% Senior Notes due 2022 (the “6.625% Notes”). The proceeds of the 6.625% Notes were used to (i) fund the repurchase and redemption of the $200.0 million in aggregate principal amount of our outstanding 8.50% Notes and (ii) pay amounts outstanding under our Senior Secured Credit Facility (as defined below), totaling $30.0 million. We intend to use the remaining proceeds for general corporate purposes, which may include the financing of acquisitions. The 6.625% Notes mature on May 15, 2022, unless earlier redeemed or repurchased. Interest on the 6.625% Notes is payable semi-annually in arrears in cash on May 15 and November 15 of each year, commencing November 15, 2017.
We have the option to redeem all or a portion of the 6.625% Notes at any time on or after May 15, 2019 at certain redemption prices, plus accrued and unpaid interest, if any, to but excluding the date of redemption. At any time prior to May 15, 2019, we have the option to redeem up to 35% of the original principal amount of the 6.625% Notes with the proceeds of certain equity offerings by us at a redemption price of 106.625% of the principal amount of the 6.625% Notes, plus accrued and unpaid interest, if any, to but excluding the date of redemption, provided that at least 65% of the original aggregate principal amount of the 6.625% Notes remains outstanding after such redemption. Prior to May 15, 2019, we may redeem some or all of the 6.625% Notes at a redemption price equal to 100% of the principal amount of the 6.625% Notes, plus accrued and unpaid interest, if any, to but excluding the applicable redemption date plus the applicable “make-whole” premium.
60
The indenture governing the 6.625% Notes contains covenants that limit our ability and the ability of certain of our subsidiaries to (i) pay dividends, or make other distributions or redeem or repurchase our capital stock; (ii) prepay, redeem or repurchase certain debt; (iii) incur additional and guarantee indebtedness; (iv) issue certain preferred stock or similar equity securities; (v) make loans and investments; (vi) incur liens; (vii) sell assets; (viii) enter into transactions with affiliates; (ix) enter into agreements restricting our subsidiaries’ ability to pay dividends; and (x) consolidate, merge or sell all or substantially all assets. These covenants are subject to important exceptions and qualifications.
The indenture further provides that upon certain specified change of control events, certain covenants will no longer apply to the 6.625% Notes and will be replaced with new covenants (a “Covenant Replacement Event”). Additionally, if we experience specific kinds of changes in control that do not result in a Covenant Replacement Event or, if following a Covenant Replacement Event we experience a subsequent change of control that result in a downgrade of the rating assigned to the 6.625% Notes, holders of the 6.625% Notes will be entitled to require us to purchase all or a portion of the 6.625% Notes at 101% of their principal amount, plus accrued and unpaid interest to but excluding the date of repurchase.
Certain of our subsidiaries are guarantors of the 6.625% Notes. All of the subsidiary guarantors are 100% owned by us, and all of the guarantees are full, unconditional, and joint and several. We have no independent assets or operations, and our subsidiaries, other than the subsidiary guarantors, are minor.
In August 2017, we satisfied our obligation to exchange the 6.625% Notes and related guarantees for registered notes and guarantees having substantially the same terms.
We have assessed the 6.625% Notes and concluded that the impact of any embedded derivative features are not material as of December 31, 2017.
6.00% Senior Convertible Notes due 2020
On June 23, 2015, we completed a private offering of $80.0 million aggregate principal amount of 6.00% Senior Convertible Notes due 2020 (the “6.00% Notes”). The 6.00% Notes were issued in exchange for $15.4 million aggregate principal amount of 7.50% Exchange Notes and $64.5 million in cash. We used $30.7 million of the net cash proceeds from the sale of the 6.00% Notes to (i) repurchase 7.50% Exchange Notes and 7.50% Notes and (ii) pay approximately $1.5 million of accrued interest (in respect of the notes being exchanged or repurchased) and premium (in respect of the notes being repurchased). The 6.00% Notes will mature on July 1, 2020, unless earlier repurchased or converted. The 6.00% Notes are governed by the Indenture dated February 4, 2011 and the Third Supplemental Indenture dated June 23, 2015 between us and the trustee named therein. The 6.00% Notes bear regular cash interest on the principal amount of each note, payable semiannually in arrears on January 1 and July 1 of each year, beginning on January 1, 2016.
The 6.00% Notes were issued pursuant a series of separate, privately negotiated note purchase agreements entered into on June 17, 2015 by us and certain qualified institutional buyers. TPG Aviator, L.P. (“TPG”) purchased $20.0 million aggregate principal amount of 6.00% Notes for $20.0 million in cash and waived its rights to purchase additional 6.00% Notes, resulting in a fully diluted beneficial ownership of approximately 43.5% of our common stock for TPG. Pursuant to the terms of the Company’s Related Person Transaction Policy, the audit committee of the Company’s board of directors reviewed and approved the terms of the 6.00% Notes and TPG’s purchase of 6.00% Notes.
8.50% Senior Notes due 2019
On June 30, 2014, we completed an underwritten offering for $200.0 million aggregate principal amount of our 8.50% Senior Notes due 2019 (the “8.50% Notes”). The 8.50% Notes were scheduled to mature on July 1, 2019, unless earlier converted, redeemed or repurchased. Interest on the 8.50% Notes was 8.50% per year, payable semi-annually in arrears in cash on January 1 and July 1 of each year, commencing January 1, 2015. The 8.50% Notes were redeemable at our option, in whole or in part, at any time on or after July 1, 2016, at certain redemption prices, together with accrued and unpaid interest, if any, to but excluding the date of redemption.
61
Certain of our subsidiaries were guarantors of the 8.50% Notes. All of the subsidiary guarantors are 100% owned by us, and all of the guarantees are full, unconditional, and joint and several. We have no independent assets or operations, and our subsidiaries, other than the subsidiary guarantors, are minor.
On May 18, 2017, in conjunction with the completion of our private offering of $400.0 million of the 6.625% Notes, we repurchased $45.5 million aggregate principal amount of the 8.50% Notes representing approximately 23% of the total principal amount outstanding. Holders of the tendered notes received the total consideration of $1,038.87 per $1,000 principal amount of 8.50% Notes tendered, which includes an early tender payment of $6.99 per $1,000 principal amount of 8.50% Notes tendered. In addition, holders of the tendered notes received accrued and unpaid interest up to, but not including, May 18, 2017. Effective July 1, 2017, we redeemed the remaining $154.5 million principal of our 8.50% Notes. During the year ended December 31, 2017, we recognized a loss on extinguishment of debt of $9.8 million, which includes a redemption premium of $4.9 million and the write-off of unamortized debt issuance costs.
Senior Unsecured Credit Facility
On May 18, 2017, we entered into an unsecured revolving credit agreement (the “Senior Unsecured Credit Facility”) with each of the financial institutions party thereto, JPMorgan Chase Bank, N.A., as administrative agent, and Citibank, N.A., as syndication agent. As of June 30, 2017, the Senior Unsecured Credit Facility had replaced the previously outstanding Senior Secured Credit Facility.
The Senior Unsecured Credit Facility has substantially similar terms and provisions to the Senior Secured Credit Facility, except that the facility is no longer secured by substantially all of our assets and the assets of certain of our subsidiaries.
The Senior Unsecured Credit Facility includes a revolving credit facility in an aggregate principal amount of up to $155.0 million, with an “accordion” feature that allows us, with the consent of the lenders, to increase the aggregate amount to $250.0 million. The facility includes a letter of credit sub-facility in an amount equal to 50% of total commitments then in effect. The maximum amount available under the Senior Unsecured Credit Facility is limited to the lesser of (i) $155.0 million (subject to increase pursuant to the “accordion”) and (ii) an amount equal to the borrowing base minus our consolidated senior debt. The borrowing base includes 100% of unrestricted cash, to the extent it exceeds the interest reserve, and escrowed deposits and funds payable to us following the sale of real property, plus the following, subject to certain limitations:
|
· |
85% of the book value of our real property that is under contract or under construction and is or is planned to be residential housing units or model homes; plus |
|
· |
65% of the book value of our finished lots and lots under development; plus |
|
· |
50% of the book value of our entitled lands that are not finished lots or lots under development. |
To be included in the borrowing base, the real property must be owned by us or one of our subsidiaries that guarantees the Company’s obligations under the Senior Unsecured Credit Facility and meet certain criteria. As of September 30, 2017, we had sufficient qualified assets in the borrowing base to cover borrowings of up to $155.0 million and had no borrowings outstanding.
Interest will be payable on revolving credit borrowings at variable rates determined by the applicable LIBOR plus 3.25% or the prime rate plus 2.25%, at our election. We pay quarterly fees of 0.50% per annum on the unused portion of the lenders’ commitments under the Senior Unsecured Credit Facility to the lenders.
The Senior Unsecured Credit Facility expires on July 28, 2020. Upon expiration, all borrowings become due and payable. We may prepay loans borrowed under the Senior Unsecured Credit Facility or reduce the commitments thereunder at our option, without any prepayment fee or penalty.
The Senior Unsecured Credit Facility is guaranteed by certain of our subsidiaries, and we have the option to add or remove guarantors from time to time, subject to certain limitations.
62
The Senior Unsecured Credit Facility contains certain restrictions and covenants, which, among other things, restrict our ability to acquire or merge with another entity, make investments, loans or guarantees, incur additional indebtedness, create liens or other encumbrances, or pay cash dividends or make other distributions. The Senior Unsecured Credit Facility also requires that we comply with the following financial covenants as of the end of each fiscal quarter:
|
· |
our leverage ratio may not exceed 60%; |
|
· |
if our interest coverage ratio is less than 1.50 to 1.00, we must deposit to an interest reserve account an amount equal to the interest we have incurred on all indebtedness during the prior twelve months; and |
|
· |
our consolidated tangible net worth, excluding the tangible net worth of our subsidiaries that do not guarantee the Senior Unsecured Credit Facility unless such subsidiaries are a subsidiary of a guarantor, must be at least $325.1 million plus 50% of our cumulative consolidated net income since December 31, 2016 plus 50% of the net proceeds of any equity offerings. |
We were in compliance with all financial covenants as of December 31, 2017.
Maturities of senior notes as of December 31, 2017 are as follows (in thousands):
|
|
|
|
|
|
|
|
|
Total |
|
|
|
2018 |
|
$ |
— |
|
|
2019 |
|
|
— |
|
|
2020 |
|
|
80,000 |
|
|
2021 |
|
|
— |
|
|
2022 |
|
|
400,000 |
|
|
Thereafter |
|
|
— |
|
|
Total |
|
$ |
480,000 |
|
Note 7 - Lease Commitments
We lease the majority of our administration and sales offices under operating leases that expire at varying times through 2025. Rental expense was $1.1 million, $1.2 million and $0.9 million in 2017, 2016 and 2015, respectively. The following table reflects lease commitments as of December 31, 2017 (in thousands):
|
|
|
Payments Due By Period |
|
|
|
|
||||||||||||||||
|
|
|
2018 |
|
2019 |
|
2020 |
|
2021 |
|
2022 |
|
Thereafter |
|
Total |
|
|||||||
|
Noncancelable operating leases |
|
$ |
1,456 |
|
$ |
1,483 |
|
$ |
1,195 |
|
$ |
889 |
|
$ |
689 |
|
$ |
1,459 |
|
$ |
7,171 |
|
|
Capital lease obligations |
|
|
151 |
|
|
44 |
|
|
— |
|
|
— |
|
|
— |
|
|
— |
|
|
195 |
|
|
Leased model homes |
|
|
156 |
|
|
— |
|
|
— |
|
|
— |
|
|
— |
|
|
— |
|
|
156 |
|
|
Total |
|
$ |
1,763 |
|
$ |
1,527 |
|
$ |
1,195 |
|
$ |
889 |
|
$ |
689 |
|
$ |
1,459 |
|
$ |
7,522 |
|
63
Note 8 - Accrued and Other Liabilities
As of December 31, 2017 and 2016, accrued and other liabilities consisted of the following (in thousands):
|
|
|
December 31, |
|
||||
|
|
|
2017 |
|
2016 |
|
||
|
Accrued interest |
|
$ |
5,786 |
|
$ |
10,900 |
|
|
Accrued compensation |
|
|
7,307 |
|
|
6,865 |
|
|
Warranty reserve |
|
|
4,916 |
|
|
4,033 |
|
|
Infrastructure obligations |
|
|
6,075 |
|
|
5,979 |
|
|
Contingent consideration |
|
|
— |
|
|
2,400 |
|
|
Other |
|
|
5,109 |
|
|
4,121 |
|
|
Total |
|
$ |
29,193 |
|
$ |
34,298 |
|
Note 9 - Estimated Development Liability
The estimated development liability consists primarily of utilities improvements in Poinciana, Florida and Rio Rico, Arizona for more than 8,000 home sites previously sold, in most cases prior to 1980. The estimated development liability is reduced by actual expenditures and is evaluated and adjusted, as appropriate, to reflect management’s estimate of potential completion costs. In addition, we obtain third-party engineer evaluations on an annual basis and adjust this liability as necessary to reflect changes in the estimated completion costs. During the years ended December 31, 2017, 2016 and 2015, cash expenditures associated with these obligations were each $0.5 million. Future increases or decreases of costs for construction, material and labor, as well as other land development and utilities infrastructure costs, may have a significant effect on the estimated development liability. The balance of the estimated development liability was $31.6 million and $32.1 million as of December 31, 2017 and 2016, respectively.
Note 10 - Share-Based Payments and Other Compensation
The Amended and Restated 1997 Incentive and Capital Accumulation Plan (2011 Restatement), as amended (“Incentive Plan”) and the 2015 Incentive Compensation Plan, as amended and restated (the “2015 Plan”) provide for the grant of stock options, stock appreciation rights, stock awards, performance awards, and stock units to officers, employees and directors of AV Homes. The exercise prices of stock options granted under the Incentive Plan or the 2015 Plan may not be less than the stock exchange closing price of our common stock on the date of grant. Stock option awards under the Incentive Plan and 2015 Plan generally expire 10 years after the date of grant.
As of December 31, 2017, there were an aggregate of 1.5 million shares available for grant under the 2015 Plan and 0.3 million shares reserved for future issuance relating to restricted stock units previously awarded and currently outstanding under the 2015 Plan. Additionally, as of December 31, 2017, an aggregate of 0.5 million shares of our common stock were reserved for future issuance in connection with options and restricted stock units previously awarded under the Incentive Plan.
During 2017, we granted 75,718 service-based restricted stock units, which vest ratably over four years, and 82,349 shares of performance-based restricted stock units, which will vest, if at all, upon the attainment of certain performance conditions in future periods. We also granted 95,674 stock options, which vest ratably over four years. Additionally, we granted 25,926 restricted stock units to non-employee directors for service on our Board for the term beginning at the 2017 Annual Meeting of Stockholders, which will vest and be converted into an equivalent number of shares of common stock upon the earlier of the first anniversary of the date of the award and the date immediately preceding the date of AV Homes’ 2018 Annual Meeting of Stockholders, provided that the director is a member of the board of directors on such vesting date.
Compensation expense related to the stock option, restricted stock, and restricted stock unit awards during the years ended December 31, 2017, 2016 and 2015 was $3.3 million, $2.4 million and $3.1 million, respectively.
64
As of December 31, 2017, there was $2.5 million of unrecognized compensation expense related to unvested restricted stock and restricted stock units. That expense is expected to be recognized over a weighted average period of 1.6 years.
As of December 31, 2017, there was $0.3 million of unrecognized compensation expense related to unvested stock options. That expense is expected to be recognized over a weighted average period of 2.0 years.
Under ASC 718, Stock Compensation (“ASC 718”), the fair value of awards of restricted stock and units that do not contain a specified hurdle price condition is based on the market price of our common stock on the date of grant. The fair value of restricted stock unit awards with a market condition is estimated on the grant date using a stock price simulation model using Geometric Brownian Motion to model future stock prices. The fair value of restricted stock awards that contain a specified hurdle price condition is estimated on the grant date using the Monte-Carlo option valuation model. The fair value of each stock option is estimated on the grant date using the Black-Scholes option-pricing model. The valuation models require assumptions and estimates to determine expected volatility, expected life, expected dividend yield and expected risk-free interest rates. The expected volatility was determined using historical volatility of our stock based on the contractual life of the award. The risk-free interest rate assumption was based on the yield on zero-coupon U.S. Treasury bonds at the award grant date.
The significant weighted average assumptions used for the years ended December 31, 2017, 2016 and 2015 were as follows:
|
|
|
2017 |
|
2016 |
|
2015 |
|
|||
|
Dividend yield |
|
|
— |
% |
|
— |
% |
|
— |
% |
|
Volatility rate |
|
|
33.7 |
% |
|
40.5 |
% |
|
38.0 |
% |
|
Risk-free interest rate |
|
|
1.46 |
% |
|
0.91 |
% |
|
1.10 |
% |
|
Expected life (years) |
|
|
2.92 |
|
|
2.91 |
|
|
2.95 |
|
|
Weighted average fair value of units granted |
|
$ |
19.19 |
|
$ |
3.37 |
|
$ |
5.95 |
|
The stock option activity for the years ended December 31, 2017, 2016 and 2015 is summarized as follows:
|
|
|
For the Years Ended December 31, |
|
|||||||||||||
|
|
|
2017 |
|
2016 |
|
2015 |
|
|||||||||
|
|
|
|
|
Weighted |
|
|
|
Weighted |
|
|
|
Weighted |
|
|||
|
|
|
|
|
Average |
|
|
|
Average |
|
|
|
Average |
|
|||
|
|
|
Stock |
|
Exercise Price |
|
Stock |
|
Exercise Price |
|
Stock |
|
Exercise Price |
|
|||
|
|
|
Options |
|
Per Share |
|
Options |
|
Per Share |
|
Options |
|
Per Share |
|
|||
|
Outstanding as of beginning of year |
|
445,036 |
|
$ |
17.05 |
|
545,036 |
|
$ |
17.01 |
|
555,036 |
|
$ |
17.00 |
|
|
Granted |
|
95,674 |
|
|
17.74 |
|
— |
|
|
— |
|
— |
|
|
— |
|
|
Exercised |
|
— |
|
|
— |
|
— |
|
|
— |
|
— |
|
|
— |
|
|
Forfeited |
|
— |
|
|
— |
|
(100,000) |
|
|
16.80 |
|
(10,000) |
|
|
16.80 |
|
|
Outstanding as of end of year |
|
540,710 |
|
$ |
17.17 |
|
445,036 |
|
$ |
17.05 |
|
545,036 |
|
$ |
17.01 |
|
|
Exercisable as of end of year |
|
468,958 |
|
$ |
17.09 |
|
333,777 |
|
$ |
17.05 |
|
272,518 |
|
$ |
17.01 |
|
The weighted average remaining contractual life of stock options outstanding as of December 31, 2017 was 9.1 years.
65
The restricted stock and restricted stock units activity for the years ended December 31, 2017 and 2016 is summarized as follows:
|
|
|
For the Years Ended December 31, |
|
||||||||||||||||||
|
|
|
2017 |
|
2016 |
|
||||||||||||||||
|
|
|
Performance-Based |
|
Service-Based |
|
Performance-Based |
|
Service-Based |
|
||||||||||||
|
|
|
|
|
Weighted |
|
|
|
Weighted |
|
|
|
Weighted |
|
|
|
Weighted |
|
||||
|
|
|
Number of |
|
Average |
|
Number of |
|
Average |
|
Number of |
|
Average |
|
Number of |
|
Average |
|
||||
|
|
|
Shares or |
|
Grant Date |
|
Shares or |
|
Grant Date |
|
Shares or |
|
Grant Date |
|
Shares or |
|
Grant Date |
|
||||
|
|
|
Units |
|
Fair Value |
|
Units |
(1) |
Fair Value |
|
Units |
|
Fair Value |
|
Units |
(1) |
Fair Value |
|
||||
|
Outstanding as of beginning of year |
|
305,543 |
|
$ |
4.78 |
|
157,264 |
|
$ |
11.75 |
|
235,746 |
|
$ |
8.55 |
|
116,592 |
|
$ |
15.57 |
|
|
Granted |
|
82,349 |
|
|
18.32 |
|
101,644 |
|
|
17.31 |
|
198,174 |
|
|
3.37 |
|
154,176 |
|
|
10.43 |
|
|
Vested |
|
(6,536) |
|
|
15.80 |
|
(88,412) |
|
|
13.56 |
|
(10,821) |
|
|
15.80 |
|
(74,571) |
|
|
13.26 |
|
|
Expired/forfeited/cancelled |
|
(153,801) |
|
|
5.64 |
|
(25,869) |
|
|
12.45 |
|
(117,556) |
|
|
7.38 |
|
(38,933) |
|
|
11.95 |
|
|
Outstanding as of end of year |
|
227,555 |
|
$ |
11.16 |
|
144,627 |
|
$ |
20.72 |
|
305,543 |
|
$ |
4.78 |
|
157,264 |
|
$ |
11.75 |
|
|
(1) |
Restricted stock shares are considered legally outstanding but are not considered outstanding for accounting purposes until the vesting conditions are satisfied in accordance with authoritative accounting guidance. Additionally, the balances do not include the restricted stock units deferred under our director deferral program discussed below. |
Under our director deferral program, non-management directors may elect to defer up to 100% of their annual retainer fees, committee fees and chairperson fees, for which the director is credited with a number of stock units based upon the closing price of our common stock on the due date of each payment. The number of stock units become distributable as shares of common stock upon the earlier of a date designated by the individual director or the date of the individual’s separation from service as a director. No stock units were distributed as shares to non-management directors during the years ended December 31, 2017, 2016 and 2015. The outstanding balance of restricted stock units under the deferral plan as of December 31, 2017, 2016 and 2015 was 76,611 and 60,955 and 50,376, respectively.
Note 11 - Income Taxes
Income taxes have been provided using the liability method under ASC 740. The liability method is used in accounting for income taxes where deferred income tax assets and liabilities are determined based on differences between financial reporting and tax basis of assets and liabilities and are measured using the enacted tax rates and laws that are expected to be in effect when the differences reverse.
The components of income tax expense (benefit) for the years ended December 31, 2017, 2016 and 2015 are as follows (in thousands):
|
|
|
For the Years Ended December 31, |
|
|||||||
|
|
|
2017 |
|
2016 |
|
2015 |
|
|||
|
Current: |
|
|
|
|
|
|
|
|
|
|
|
Federal |
|
$ |
80 |
|
$ |
542 |
|
$ |
253 |
|
|
State |
|
|
296 |
|
|
364 |
|
|
183 |
|
|
Total current |
|
|
376 |
|
|
906 |
|
|
436 |
|
|
|
|
|
|
|
|
|
|
|
|
|
|
Deferred: |
|
|
|
|
|
|
|
|
|
|
|
Federal |
|
|
38,303 |
|
|
(93,383) |
|
|
— |
|
|
State |
|
|
1,589 |
|
|
(17,044) |
|
|
— |
|
|
Total deferred |
|
|
39,892 |
|
|
(110,427) |
|
|
— |
|
|
Total income tax expense (benefit) |
|
$ |
40,268 |
|
$ |
(109,521) |
|
$ |
436 |
|
66
Deferred income taxes reflect the net tax effect of temporary differences between the carrying amounts of assets and liabilities for financial reporting purposes and the amounts used for income tax purposes. Significant components of deferred income tax assets and liabilities as of December 31, 2017 and 2016 are as follows (in thousands):
|
|
|
December 31, |
|
||||
|
|
|
2017 |
|
2016 |
|
||
|
Deferred tax assets: |
|
|
|
|
|
|
|
|
Net operating loss carryforward and credits |
|
$ |
32,829 |
|
$ |
47,529 |
|
|
Impairment charges |
|
|
28,926 |
|
|
48,311 |
|
|
Other inventory valuation adjustments |
|
|
7,929 |
|
|
13,819 |
|
|
Other reserves and accruals |
|
|
3,366 |
|
|
5,028 |
|
|
Land development reserves |
|
|
3,180 |
|
|
5,270 |
|
|
Executive incentive compensation |
|
|
1,875 |
|
|
2,352 |
|
|
Total deferred tax assets |
|
|
78,105 |
|
|
122,309 |
|
|
Valuation allowance for deferred tax assets |
|
|
— |
|
|
— |
|
|
Deferred tax assets, net of valuation allowance |
|
|
78,105 |
|
|
122,309 |
|
|
|
|
|
|
|
|
|
|
|
Deferred tax liabilities: |
|
|
|
|
|
|
|
|
Deferred gain |
|
|
(3,495) |
|
|
(6,246) |
|
|
Goodwill |
|
|
(1,524) |
|
|
(1,013) |
|
|
State taxes |
|
|
(1,426) |
|
|
(2,800) |
|
|
Depreciation |
|
|
(844) |
|
|
(1,222) |
|
|
Capitalized expenses |
|
|
(451) |
|
|
(771) |
|
|
Total deferred tax liabilities |
|
|
(7,740) |
|
|
(12,052) |
|
|
Deferred tax assets, net |
|
$ |
70,365 |
|
$ |
110,257 |
|
As of December 31, 2017, our gross federal and state NOL carryforwards were $98.7 million and $259.0 million, respectively. Federal NOL carryforwards may be used to offset future taxable income for 20 years and begin to expire in 2032. State NOL carryforwards may be used to offset future taxable income for 20 years and begin to expire in 2028.
We evaluate our deferred tax assets each period to determine if a valuation allowance is required based on whether it is “more likely than not” that some portion of the deferred tax assets would not be realized. The ultimate realization of these deferred tax assets is dependent upon the generation of sufficient taxable income during future periods. We conduct our evaluation by considering all available positive and negative evidence. This evaluation considers, among other factors, historical operating results, forecasts of future profitability, the duration of statutory carryforward periods, and the outlooks for the U.S. housing industry and broader economy. Based on our evaluation through June 30, 2016, we determined that the valuation allowance against all of our federal and state deferred tax assets was no longer required. Accordingly, by December 31, 2016 we reversed the entire valuation allowance.
Any interest or penalties assessed have been minimal and immaterial to our financial results. In the event we are assessed any interest or penalties in the future, we plan to include them in our consolidated statements of operations as income tax expense.
67
A reconciliation of income tax expense (benefit) to the expected income tax expense (benefit) at the federal statutory rate of 35% for each of the years ended December 31, 2017, 2016 and 2015 is as follows (in thousands):
|
|
|
For the Years Ended December 31, |
|
|||||||
|
|
|
2017 |
|
2016 |
|
2015 |
|
|||
|
Income tax expense computed at statutory rate |
|
$ |
6,416 |
|
$ |
13,155 |
|
$ |
4,320 |
|
|
State income tax expense, net of federal benefit |
|
|
506 |
|
|
1,201 |
|
|
1,452 |
|
|
Remeasurement of deferred tax assets (lower federal rate) |
|
|
32,484 |
|
|
— |
|
|
— |
|
|
Change in valuation allowance on deferred tax assets |
|
|
— |
|
|
(124,525) |
|
|
(5,336) |
|
|
Change in state rate |
|
|
395 |
|
|
688 |
|
|
— |
|
|
Share-based compensation costs |
|
|
470 |
|
|
— |
|
|
— |
|
|
Other |
|
|
(3) |
|
|
(40) |
|
|
— |
|
|
Income tax expense (benefit) |
|
$ |
40,268 |
|
$ |
(109,521) |
|
$ |
436 |
|
On December 22, 2017, the Tax Cuts and Jobs Act (“TCJA”) was signed into law, which, among other items, reduces the federal statutory corporate tax rate from 35% to 21%, effective January 1, 2018. As required under ASC 740, we evaluated and accounted for the impact of the changes from the TCJA in the period when the law was enacted. As a result, we recorded a $32.5 million one-time revaluation adjustment to decrease our net deferred tax assets in the quarter ended December 31, 2017. This adjustment was primarily due to the reduction in the federal corporate statutory tax rate. This amount has been recorded as a one-time increase to the provision for income taxes. Our assessment of the TCJA was based on information available at this time and results for the quarter ended December 31, 2017. Future periods may differ from the impact disclosed herein due to, among other things, changes in interpretations and assumptions made by us, guidance that may be issued and actions we may take as a result of the TCJA. The overall impact of the TCJA is also subject to the effect of other provisions of the TCJA.
We file income tax returns in the U.S. federal jurisdiction and various state jurisdictions. We are subject to U.S. federal income tax examination for calendar tax years ending 2014 through 2016. Additionally, we are subject to various state income tax examinations for the 2013 through 2016 calendar tax years.
Note 12 - Commitments and Contingencies
Legal
We are involved in litigation from time to time, primarily arising in the normal course of our business. These cases are in various procedural stages. In view of the inherent difficulty of predicting the outcome of these legal and regulatory matters, we generally cannot predict the ultimate resolution of the pending matters, the related timing, or the eventual loss. While the outcome of such contingencies cannot be predicted with certainty, we do not believe that the resolution of such matters will have a material adverse impact on our results of operations, financial position, or cash flows.
On April 26, 2017, we received notice of a Class Action Complaint filed in the Circuit Court for the 10th Judicial Circuit, Polk County, Florida, generally alleging that the collection of club membership fees in connection with the use and enjoyment of the club facilities located within the Solivita community is illegal in that it violates, among other laws, Florida’s Homeowners’ Association Act (“FLHOA”) and Florida’s Deceptive and Unfair Trade Practices Act (“FDUTPA”). It also generally alleges that certain other actions by us have violated FLHOA and FDUTPA. The complaint seeks relief in various forms including recovery for the prior payment of club membership fees and an injunction to prohibit the future collection of club membership fees. On June 9, 2017, we filed an amended motion to dismiss this matter, which was heard on June 13, 2017. On August 8, 2017, the judge issued an order denying in part and granting in part the motion to dismiss. Plaintiffs were provided leave to amend the FDUTPA claims and filed an amended complaint on September 15, 2017. We filed our amended answer on September 29, 2017 along with certain affirmative defenses. The amended answer also contains counterclaims against the plaintiffs for breach of contract and tortious interference with contractual relations, among other claims. On October 5, 2017, we also filed a motion for summary judgment, which was heard on December 8, 2017. On January 23, 2018, the court ruled, granting our motion for summary judgment in part and denying it in part. Importantly, the court ruled that our club operations in Solivita constitute commercial property under the FLHOA and that nothing in the FLHOA prevents a developer from owning club operations for profit, as is the case in this instance. As a result of the foregoing ruling, it is our continuing
68
contention that every count of the plaintiffs’ class action lawsuit must ultimately fail as each is without merit and rely, directly or indirectly, on an interpretation of the FLHOA explicitly rejected by the court.
Surety Bonds
Surety bonds, issued by third-party entities, are used primarily to guarantee our performance to construct improvements in our various communities. As of December 31, 2017 and 2016, we had outstanding surety bonds of approximately $36.1 million and $30.6 million, respectively. The amount of outstanding surety bonds could fluctuate depending on the level of development activity. We do not believe that it is likely any of these outstanding surety bonds will be drawn upon.
Community Development District and Other Special Obligations
A community development district or similar development authority (“CDD”) is a unit of local government created under various state statutes that utilizes the proceeds from the sale of bonds to finance the construction or acquisition of infrastructure assets of a development. A portion of the liability associated with the bonds, including principal and interest, is assigned to each parcel of land within the development. This debt is typically paid by subsequent special assessments levied by the CDD on the landowners. Generally, we are only responsible for paying the special assessments for the period during which we are the landowner of the applicable parcels. However, in certain limited instances we record a liability for future assessments.
69
Note 13 - Segment Information
Our operating segments are defined as a component of an enterprise for which discrete financial information is available and is reviewed regularly by the chief operating decision maker to evaluate performance and make operating decisions. We have identified our chief operating decision maker as our Chief Executive Officer.
The following table summarizes our information for reportable segments for the years ended December 31, 2017, 2016 and 2015 (in thousands):
|
|
|
For the Years Ended December 31, |
|
|||||||
|
|
|
2017 |
|
2016 |
|
2015 |
|
|||
|
Operating income: |
|
|
|
|
|
|
|
|
|
|
|
Florida |
|
|
|
|
|
|
|
|
|
|
|
Revenues: |
|
|
|
|
|
|
|
|
|
|
|
Homebuilding |
|
$ |
363,477 |
|
$ |
373,383 |
|
$ |
300,260 |
|
|
Amenity and other |
|
|
17,061 |
|
|
11,698 |
|
|
12,385 |
|
|
Land sales |
|
|
3,349 |
|
|
3,116 |
|
|
6,466 |
|
|
Total revenues |
|
|
383,887 |
|
|
388,197 |
|
|
319,111 |
|
|
Expenses: |
|
|
|
|
|
|
|
|
|
|
|
Homebuilding cost of revenue |
|
|
287,415 |
|
|
291,372 |
|
|
239,001 |
|
|
Homebuilding selling, general and administrative |
|
|
40,478 |
|
|
46,113 |
|
|
38,500 |
|
|
Amenity and other |
|
|
14,749 |
|
|
11,062 |
|
|
10,587 |
|
|
Land sales |
|
|
579 |
|
|
770 |
|
|
823 |
|
|
Segment operating income |
|
$ |
40,666 |
|
$ |
38,880 |
|
$ |
30,200 |
|
|
|
|
|
|
|
|
|
|
|
|
|
|
Carolinas |
|
|
|
|
|
|
|
|
|
|
|
Revenues: |
|
|
|
|
|
|
|
|
|
|
|
Homebuilding |
|
$ |
306,068 |
|
$ |
238,549 |
|
$ |
114,277 |
|
|
Land sales |
|
|
1,042 |
|
|
265 |
|
|
— |
|
|
Total revenues |
|
|
307,110 |
|
|
238,814 |
|
|
114,277 |
|
|
Expenses: |
|
|
|
|
|
|
|
|
|
|
|
Homebuilding cost of revenue |
|
|
266,642 |
|
|
205,348 |
|
|
95,232 |
|
|
Homebuilding selling, general and administrative |
|
|
32,444 |
|
|
22,807 |
|
|
12,205 |
|
|
Land sales |
|
|
1,026 |
|
|
289 |
|
|
— |
|
|
Segment operating income |
|
$ |
6,998 |
|
$ |
10,370 |
|
$ |
6,840 |
|
|
|
|
|
|
|
|
|
|
|
|
|
|
Arizona |
|
|
|
|
|
|
|
|
|
|
|
Revenues: |
|
|
|
|
|
|
|
|
|
|
|
Homebuilding |
|
$ |
152,071 |
|
$ |
152,109 |
|
$ |
84,378 |
|
|
Land sales |
|
|
185 |
|
|
185 |
|
|
— |
|
|
Total revenues |
|
|
152,256 |
|
|
152,294 |
|
|
84,378 |
|
|
Expenses: |
|
|
|
|
|
|
|
|
|
|
|
Homebuilding cost of revenue |
|
|
128,447 |
|
|
128,751 |
|
|
71,305 |
|
|
Homebuilding selling, general and administrative |
|
|
15,198 |
|
|
14,994 |
|
|
11,981 |
|
|
Amenity and other |
|
|
89 |
|
|
86 |
|
|
115 |
|
|
Land sales |
|
|
180 |
|
|
171 |
|
|
— |
|
|
Segment operating income |
|
$ |
8,342 |
|
$ |
8,292 |
|
$ |
977 |
|
|
|
|
|
|
|
|
|
|
|
|
|
|
Operating income |
|
$ |
56,006 |
|
$ |
57,542 |
|
$ |
38,017 |
|
|
|
|
|
|
|
|
|
|
|
|
|
|
Unallocated income (expenses): |
|
|
|
|
|
|
|
|
|
|
|
Interest income and other |
|
|
1,063 |
|
|
16 |
|
|
308 |
|
|
Corporate general and administrative expenses |
|
|
(18,271) |
|
|
(16,305) |
|
|
(16,900) |
|
|
Loss on extinguishment of debt |
|
|
(9,848) |
|
|
— |
|
|
— |
|
|
Interest expense |
|
|
(10,618) |
|
|
(3,667) |
|
|
(9,039) |
|
|
Income before income taxes |
|
|
18,332 |
|
|
37,586 |
|
|
12,386 |
|
|
Income tax expense (benefit) |
|
|
40,268 |
|
|
(109,521) |
|
|
436 |
|
|
Net income (loss) |
|
$ |
(21,936) |
|
$ |
147,107 |
|
$ |
11,950 |
|
70
|
|
|
2017 |
|
2016 |
|
||
|
Segment assets: |
|
|
|
|
|
|
|
|
Florida |
|
$ |
312,383 |
|
$ |
317,398 |
|
|
Carolinas |
|
|
238,941 |
|
|
178,333 |
|
|
Arizona |
|
|
141,566 |
|
|
158,783 |
|
|
Unallocated assets |
|
|
317,254 |
|
|
185,719 |
|
|
Total assets |
|
$ |
1,010,144 |
|
$ |
840,233 |
|
|
· |
Our businesses are conducted in the United States. |
|
· |
Identifiable assets by segment are those assets that are used in the operations of each segment. |
|
· |
No significant part of the business is dependent upon a single customer or group of customers. |
|
· |
The caption “Unallocated assets” under the table depicting the segment assets represents the following as of December 31, 2017 and 2016, respectively: net deferred tax assets of $70.4 million and $110.3 million; cash, cash equivalents and restricted cash of $241.0 million and $67.8 million; property and equipment of $0.8 million and $1.2 million; receivables of $0.2 million and $0.2 million; and prepaid expenses and other assets of $4.8 million and $5.1 million. None of the foregoing are directly attributable to a reportable segment in accordance with ASC 280, Segment Reporting. |
|
· |
There is no interest expense from the Florida, Carolinas and Arizona segments included in segment operating income during 2017, 2016 and 2015. |
|
· |
Included in segment operating income for 2017 is depreciation expense (including amortization of capital leases) of $2.2 million, $0.4 million, less than $0.1 million and $0.7 million from Florida, the Carolinas, Arizona and unallocated corporate general and administrative expenses, respectively. Included in segment operating income for 2016 is depreciation expense (including amortization of assets under capital leases) of $2.1 million, $0.1 million, $0.0 million and $0.7 million from Florida, the Carolinas, Arizona and unallocated corporate general and administrative expenses, respectively. Included in segment operating income for 2015 is depreciation expense of $2.4 million, $0.1 million, $0.0 million and $0.6 million from Florida, the Carolinas, Arizona and unallocated corporate general and administrative expenses, respectively. |
|
· |
During the years ended December 31, 2017 and 2016, there was $0.9 million and $0.8 million of impairment losses recognized, respectively. During 2015, there were no significant impairment losses recognized. |
|
· |
Goodwill of $6.1 million and $24.2 million has been assigned to the Florida and Carolinas segments, respectively. |
Note 14 - Fair Value Disclosures
ASC 820, Fair Value Measurements and Disclosures, provides guidance for using fair value to measure assets and liabilities, defines fair value, establishes a framework for measuring fair value under GAAP, expands disclosures about fair value measurements, and establishes a fair value hierarchy that requires an entity to maximize the use of observable inputs and minimize the use of unobservable inputs when measuring fair value.
The accounting standards require that assets and liabilities carried at fair value be classified and disclosed in one of the following three categories:
Level 1: Fair value determined based on quoted market prices in active markets for identical assets and liabilities.
Level 2: Fair value determined using significant observable inputs, such as quoted prices for similar assets or liabilities or quoted prices for identical or similar assets or liabilities in markets that are not active, inputs other than quoted prices that are observable for the asset or liability, or inputs that are derived principally from or corroborated by observable market data, by correlation or other means.
71
Level 3: Fair value determined using significant unobservable inputs, such as discounted cash flows, or similar techniques.
The carrying amounts of cash and cash equivalents, restricted cash, receivables, accounts payable, the Senior Secured Credit Facility, and the Senior Unsecured Credit Facility approximate the fair value due to their short-term nature.
Certain assets are required to be recorded at fair value on a non-recurring basis when events and circumstances indicate that the carrying value may not be recoverable.
The carrying amounts and fair values of our financial liabilities as of December 31, 2017 and 2016 are as follows (in thousands):
|
|
|
December 31, 2017 |
|
December 31, 2016 |
|
||||||||
|
|
|
Carrying |
|
Fair |
|
Carrying |
|
Fair |
|
||||
|
|
|
Amount |
|
Value |
|
Amount |
|
Value |
|
||||
|
Senior notes: |
|
|
|
|
|
|
|
|
|
|
|
|
|
|
6.625% Notes, net (1) |
|
$ |
392,909 |
|
$ |
420,480 |
|
$ |
— |
|
$ |
— |
|
|
6.00% Notes, net (1) |
|
|
79,199 |
|
|
90,240 |
|
|
78,878 |
|
|
84,984 |
|
|
8.50% Notes, net (1) |
|
|
— |
|
|
— |
|
|
196,782 |
|
|
206,500 |
|
|
Contingent consideration (earn-out) (2) |
|
|
— |
|
|
— |
|
|
2,400 |
|
|
2,400 |
|
|
(1) |
The carrying amounts are net of unamortized deferred financing costs and certain debt discounts. |
|
(2) |
During the year ended December 31, 2017, we paid $2.4 million of earn-out and reduced the carrying amount of earn-out accrued during 2017 by $1.8 million to its estimated fair value, which is included in selling, general and administrative expenses on our consolidated statement of operations. |
In estimating the fair value of financial liabilities, we used the following methods and assumptions:
Senior Notes
As of December 31, 2017 and 2016, the fair value of the 6.625% Notes, 6.00% Notes and 8.50% Notes are estimated, based on quoted or estimated market prices. These fall within Level 2 of the fair value hierarchy.
Contingent Consideration (“earn-out”)
This was recognized as part of the purchase price paid for the Bonterra Builders acquisition in 2015 and the Savvy Homes acquisition in 2017. At inception, the fair values were determined through the use of valuation models that simulated earnings, applying the terms of the earn-out in each simulated path, determining the average payment in each year across all the trials of the simulation, and calculating the present values of the future payments. The primary inputs and key assumptions include estimated future earnings, probabilities of achievement, earnings volatility, and the discount rate. These fall within Level 3 of the fair value hierarchy.
72
Note 15 - Unaudited Quarterly Information
Summarized quarterly financial data for 2017 and 2016 is as follows (dollars in thousands):
|
|
|
2017 Quarter |
|
||||||||||
|
|
|
First |
|
Second |
|
Third |
|
Fourth |
|
||||
|
Total revenues |
|
$ |
155,548 |
|
$ |
201,194 |
|
$ |
205,739 |
|
$ |
280,772 |
|
|
Total expenses |
|
|
151,380 |
|
|
199,725 |
|
|
208,088 |
|
|
265,728 |
|
|
Income (loss) before income taxes |
|
|
4,168 |
|
|
1,469 |
|
|
(2,349) |
|
|
15,044 |
|
|
Less: income tax expense (benefit) |
|
|
1,729 |
|
|
822 |
|
|
(872) |
|
|
38,589 |
|
|
Net income (loss) |
|
$ |
2,439 |
|
$ |
647 |
|
$ |
(1,477) |
|
$ |
(23,545) |
|
|
Earnings (loss) per share: (1) |
|
|
|
|
|
|
|
|
|
|
|
|
|
|
Basic |
|
$ |
0.11 |
|
$ |
0.03 |
|
$ |
(0.07) |
|
$ |
(1.05) |
|
|
Diluted |
|
$ |
0.11 |
|
$ |
0.03 |
|
$ |
(0.07) |
|
$ |
(1.05) |
|
|
|
|
2016 Quarter |
|
||||||||||
|
|
|
First |
|
Second |
|
Third |
|
Fourth |
|
||||
|
Total revenues |
|
$ |
124,090 |
|
$ |
188,096 |
|
$ |
205,427 |
|
$ |
261,692 |
|
|
Total expenses |
|
|
123,231 |
|
|
180,800 |
|
|
193,492 |
|
|
244,196 |
|
|
Income before income taxes |
|
|
859 |
|
|
7,296 |
|
|
11,935 |
|
|
17,496 |
|
|
Less: income tax expense (benefit) |
|
|
68 |
|
|
(110,065) |
|
|
38 |
|
|
438 |
|
|
Net income |
|
$ |
791 |
|
$ |
117,361 |
|
$ |
11,897 |
|
$ |
17,058 |
|
|
Earnings per share: (1) |
|
|
|
|
|
|
|
|
|
|
|
|
|
|
Basic |
|
$ |
0.04 |
|
$ |
5.24 |
|
$ |
0.53 |
|
$ |
0.77 |
|
|
Diluted |
|
$ |
0.04 |
|
$ |
4.45 |
|
$ |
0.49 |
|
$ |
0.68 |
|
|
(1) |
Quarterly and year-to-date computations of per share amounts are made independently. Therefore, the sum of per share amounts for the quarters may not be consistent with the per share amounts for the year. |
Note 16 - Subsequent Events
On January 8, 2018, we acquired substantially all of the assets and assumed certain liabilities of MMLC Texas Builders, LLC (“Oakdale-Hampton Homes”) for approximately $43.0 million, including a $3.0 million estimated earn-out, which remains subject to customary post-closing adjustments. The actual amount of the earn-out may be more or less than the $3.0 million target amount based on the performance of the Oakdale-Hampton Homes business through the end of 2019. A portion of the aggregate consideration equal to $0.6 million was placed in a third-party escrow account as security for Oakdale-Hampton Homes’ indemnification and other obligations under the purchase agreement. Oakdale-Hampton Homes acquires developed land and constructs single-family homes in the Dallas-Fort Worth, Texas area. Oakdale-Hampton Homes’ total revenues in 2017 were approximately $45.1 million. This acquisition marks our entry into a new key growth market.
As of the date of this report, the initial accounting for this business combination is incomplete because the valuation of assets and liabilities acquired is still in process; therefore, certain disclosures required by ASC 805 cannot be made at this time. These disclosures include the amount of acquisition-related costs, the fair value of acquired receivables, the amounts of major classes of assets and liabilities acquired, the amount of goodwill recognized, if any, including qualitative discussion of the factors that make up that goodwill, the total amount of goodwill deductible for tax purposes, the amount of goodwill reportable by segment, the fair value and description of contingent consideration, and the amount of revenue and earnings of Oakdale-Hampton Homes since the date of acquisition.
73
REPORT OF INDEPENDENT REGISTERED PUBLIC ACCOUNTING FIRM
To the stockholders and the Board of Directors of AV Homes, Inc.
Opinion on the Financial Statements
We have audited the accompanying consolidated balance sheets of AV Homes, Inc. and subsidiaries (the “Company”) as of December 31, 2017 and 2016, the related consolidated statements of operations, stockholders' equity, and cash flows, for the years then ended, and the related notes (collectively referred to as the “financial statements”). In our opinion, the financial statements present fairly, in all material respects, the financial position of the Company as of December 31, 2017 and 2016, and the results of its operations and its cash flows for the years then ended, in conformity with accounting principles generally accepted in the United States of America.
We have also audited, in accordance with the standards of the Public Company Accounting Oversight Board (United States) (PCAOB), the Company's internal control over financial reporting as of December 31, 2017, based on criteria established in Internal Control — Integrated Framework (2013) issued by the Committee of Sponsoring Organizations of the Treadway Commission and our report dated February 23, 2018, expressed an unqualified opinion on the Company's internal control over financial reporting.
Basis for Opinion
These financial statements are the responsibility of the Company's management. Our responsibility is to express an opinion on the Company's financial statements based on our audits. We are a public accounting firm registered with the PCAOB and are required to be independent with respect to the Company in accordance with the U.S. federal securities laws and the applicable rules and regulations of the Securities and Exchange Commission and the PCAOB.
We conducted our audits in accordance with the standards of the PCAOB. Those standards require that we plan and perform the audit to obtain reasonable assurance about whether the financial statements are free of material misstatement, whether due to error or fraud. Our audits included performing procedures to assess the risks of material misstatement of the financial statements, whether due to error or fraud, and performing procedures that respond to those risks. Such procedures included examining, on a test basis, evidence regarding the amounts and disclosures in the financial statements. Our audits also included evaluating the accounting principles used and significant estimates made by management, as well as evaluating the overall presentation of the financial statements. We believe that our audits provide a reasonable basis for our opinion.
/s/ DELOITTE & TOUCHE LLP
Phoenix, Arizona
February 23, 2018
We have served as the Company’s auditor since 2016.
74
REPORT OF INDEPENDENT REGISTERED PUBLIC ACCOUNTING FIRM
The Board of Directors and Stockholders of AV Homes, Inc.
We have audited the accompanying consolidated statements of operations, stockholders’ equity and cash flows of AV Homes, Inc. and subsidiaries for the year ended December 31, 2015. These financial statements are the responsibility of the Company’s management. Our responsibility is to express an opinion on these financial statements based on our audits.
We conducted our audit in accordance with the standards of the Public Company Accounting Oversight Board (United States). Those standards require that we plan and perform the audit to obtain reasonable assurance about whether the financial statements are free of material misstatement. An audit includes examining, on a test basis, evidence supporting the amounts and disclosures in the financial statements. An audit also includes assessing the accounting principles used and significant estimates made by management, as well as evaluating the overall financial statement presentation. We believe that our audit provides a reasonable basis for our opinion.
In our opinion, the financial statements referred to above present fairly, in all material respects, the consolidated results of AV Homes, Inc. and subsidiaries’ operations and its cash flows for the year ended December 31, 2015, in conformity with U.S. generally accepted accounting principles.
/s/ Ernst & Young LLP
Phoenix, Arizona
March 4, 2016
75
ITEM 9. CHANGES IN AND DISAGREEMENTS WITH ACCOUNTANTS ON ACCOUNTING AND FINANCIAL DISCLOSURES
None.
ITEM 9A. CONTROLS AND PROCEDURES
Disclosure Controls and Procedures
Our management, with the participation of the Chief Executive Officer and the Chief Financial Officer, has evaluated the effectiveness of the Company’s disclosure controls and procedures as of the end of the period covered by this report. Based on this evaluation, the Chief Executive Officer and the Chief Financial Officer have concluded that the Company’s disclosure controls and procedures were effective as of the end of the period covered by this report.
Internal Control Over Financial Reporting
(a) Management’s Annual Report on Internal Control Over Financial Reporting
Our management is responsible for establishing and maintaining adequate internal control over financial reporting (as defined in Rules 13a-15(f) and 15d-15(f) under the Securities Exchange Act of 1934, as amended). Under the supervision and with the participation of our management, including our Chief Executive Officer and Chief Financial Officer, we assessed the effectiveness of internal control over financial reporting of AV Homes, Inc. and its subsidiaries as of the end of the period covered by this Annual Report based on the framework in “Internal Control-Integrated Framework” issued by the Committee of Sponsoring Organizations of the Treadway Commission (2013 framework). Based on that assessment, our Chief Executive Officer and Chief Financial Officer concluded that our internal control over financial reporting was effective as of December 31, 2017.
Our management’s assessment of our internal control over financial reporting excluded the acquisition of Savvy Homes, LLC, which was acquired on April 3, 2017 and represents approximately 6% of consolidated total assets and consolidated total revenues as of and for the year ended December 31, 2017.
Deloitte & Touche LLP, an independent registered public accounting firm that audited the consolidated financial statements of AV Homes, Inc. and its subsidiaries included in this Annual Report, has issued an attestation report on the effectiveness of our internal control over financial reporting. The attestation report follows this report.
(b) Report of Independent Registered Public Accounting Firm
To the stockholders and the Board of Directors of AV Homes, Inc.
Opinion on Internal Control over Financial Reporting
We have audited the internal control over financial reporting of AV Homes, Inc. and subsidiaries (the “Company”) as of December 31, 2017, based on criteria established in Internal Control — Integrated Framework (2013) issued by the Committee of Sponsoring Organizations of the Treadway Commission (COSO). In our opinion, the Company maintained, in all material respects, effective internal control over financial reporting as of December 31, 2017, based on criteria established in Internal Control — Integrated Framework (2013) issued by COSO.
We have also audited, in accordance with the standards of the Public Company Accounting Oversight Board (United States) (PCAOB), the consolidated financial statements as of and for the year ended December 31, 2017, of the Company and our report dated February 23, 2018, expressed an unqualified opinion on those financial statements.
76
As described in Management’s Annual Report on Internal Control over Financial Reporting, management excluded from its assessment the internal control over financial reporting at Savvy Homes, LLC, which was acquired on April 3, 2017 and whose financial statements constitute 6% of consolidated total assets and consolidated revenues of the consolidated financial statement amounts as of and for the year ended December 31, 2017. Accordingly, our audit did not include the internal control over financial reporting at Savvy Homes, LLC.
Basis for Opinion
The Company’s management is responsible for maintaining effective internal control over financial reporting and for its assessment of the effectiveness of internal control over financial reporting, included in the accompanying Management's Annual Report on Internal Control over Financial Reporting. Our responsibility is to express an opinion on the Company’s internal control over financial reporting based on our audit. We are a public accounting firm registered with the PCAOB and are required to be independent with respect to the Company in accordance with the U.S. federal securities laws and the applicable rules and regulations of the Securities and Exchange Commission and the PCAOB.
We conducted our audit in accordance with the standards of the PCAOB. Those standards require that we plan and perform the audit to obtain reasonable assurance about whether effective internal control over financial reporting was maintained in all material respects. Our audit included obtaining an understanding of internal control over financial reporting, assessing the risk that a material weakness exists, testing and evaluating the design and operating effectiveness of internal control based on the assessed risk, and performing such other procedures as we considered necessary in the circumstances. We believe that our audit provides a reasonable basis for our opinion.
Definition and Limitations of Internal Control over Financial Reporting
A company’s internal control over financial reporting is a process designed to provide reasonable assurance regarding the reliability of financial reporting and the preparation of financial statements for external purposes in accordance with generally accepted accounting principles. A company’s internal control over financial reporting includes those policies and procedures that (1) pertain to the maintenance of records that, in reasonable detail, accurately and fairly reflect the transactions and dispositions of the assets of the company; (2) provide reasonable assurance that transactions are recorded as necessary to permit preparation of financial statements in accordance with generally accepted accounting principles, and that receipts and expenditures of the company are being made only in accordance with authorizations of management and directors of the company; and (3) provide reasonable assurance regarding prevention or timely detection of unauthorized acquisition, use, or disposition of the company’s assets that could have a material effect on the financial statements.
Because of its inherent limitations, internal control over financial reporting may not prevent or detect misstatements. Also, projections of any evaluation of effectiveness to future periods are subject to the risk that controls may become inadequate because of changes in conditions, or that the degree of compliance with the policies or procedures may deteriorate.
/s/ DELOITTE & TOUCHE LLP
Phoenix, Arizona
February 23, 2018
(c) Changes in Internal Control Over Financial Reporting
There have been no changes in our internal controls over financial reporting during the quarter ended December 31, 2017 that has materially affected, or is reasonably likely to materially affect, our internal control over financial reporting.
None.
77
ITEM 10. DIRECTORS, EXECUTIVE OFFICERS AND CORPORATE GOVERNANCE
The information required by this Item is incorporated by reference to our Proxy Statement for our 2018 Annual Meeting of Stockholders, which will be filed with the SEC no later than 120 days after the end of the fiscal year covered by this Annual Report on Form 10-K, or, alternatively, by amendment to this Form 10-K under cover of Form 10-K/A no later than the end of such 120 day period, except for the information regarding the executive officers of AV Homes, which information is included in Part I of this Annual Report under the heading “Executive Officers of the Registrant.”
ITEM 11. EXECUTIVE COMPENSATION
The information required by this Item is incorporated by reference to our Proxy Statement for our 2018 Annual Meeting of Stockholders, which will be filed with the SEC no later than 120 days after the end of the fiscal year covered by this Annual Report on Form 10-K, or, alternatively, by amendment to this Annual Report on Form 10-K under cover of Form 10-K/A no later than the end of such 120 day period.
ITEM 12. SECURITY OWNERSHIP OF CERTAIN BENEFICIAL OWNERS AND MANAGEMENT AND RELATED STOCKHOLDER MATTERS
The information required by this Item is incorporated by reference to our Proxy Statement for our 2018 Annual Meeting of Stockholders, which will be filed with the SEC no later than 120 days after the end of the fiscal year covered by this Annual Report on Form 10-K, or, alternatively, by amendment to this Annual Report on Form 10-K under cover of Form 10-K/A no later than the end of such 120 day period.
ITEM 13. CERTAIN RELATIONSHIPS AND RELATED TRANSACTIONS, AND DIRECTOR INDEPENDENCE
The information required by this Item is incorporated by reference to our Proxy Statement for our 2018 Annual Meeting of Stockholders, which will be filed with the SEC no later than 120 days after the end of the fiscal year covered by this Annual Report on Form 10-K, or, alternatively, by amendment to this Annual Report on Form 10-K under cover of Form 10-K/A no later than the end of such 120 day period.
ITEM 14. PRINCIPAL ACCOUNTANT FEES AND SERVICES
The information required by this Item is incorporated by reference to our Proxy Statement for our 2018 Annual Meeting of Stockholders, which will be filed with the SEC no later than 120 days after the end of the fiscal year covered by this Annual Report on Form 10-K, or, alternatively, by amendment to this Annual Report on Form 10-K under cover of Form 10-K/A no later than the end of such 120 day period.
78
ITEM 15. EXHIBITS AND FINANCIAL STATEMENT SCHEDULES
(a)(1) Financial Statements and Schedules:
See Item 8, Financial Statements and Supplementary Data, of this report.
(a)(2) Financial Statements Schedules:
All schedules are omitted because the required information is not present, is not present in amounts sufficient to require submission of the schedule, or because the required information is included in the financial statements or notes thereto.
(a)(3) Exhibits:
The following exhibits are filed with this Annual Report on Form 10-K or are incorporated herein by reference.
|
Exhibit |
|
Reference |
|
Description |
|
2.1 |
|
*2 |
|
|
|
3.1 |
|
* |
|
|
|
3.2 |
|
* |
|
|
|
3.3 |
|
* |
|
|
|
3.4 |
|
* |
|
|
|
4.1 |
|
* |
|
|
|
4.2 |
|
* |
|
|
|
4.3 |
|
* |
|
|
|
4.4 |
|
* |
|
|
|
4.5 |
|
* |
|
79
|
Exhibit |
|
Reference |
|
Description |
|
4.6 |
|
* |
|
|
|
10.1 |
|
*1 |
|
|
|
10.2 |
|
*1 |
|
|
|
10.3 |
|
*1 |
|
|
|
10.4 |
|
*1 |
|
|
|
10.5 |
|
*1 |
|
|
|
10.6 |
|
*1 |
|
|
|
10.7 |
|
*1 |
|
|
|
10.8 |
|
*1 |
|
|
|
10.9 |
|
*1 |
|
|
|
10.10 |
|
*1 |
|
|
|
10.11 |
|
*1 |
|
|
|
10.12 |
|
*1 |
|
|
|
10.13 |
|
1 |
|
Form of Amendment to Executive Employment Agreement (filed herewith). |
|
10.14 |
|
*1 |
|
|
|
10.15 |
|
*1 |
|
|
|
10.16 |
|
*1 |
|
|
|
10.17 |
|
*1 |
|
80
|
Exhibit |
|
Reference |
|
Description |
|
10.18 |
|
*1 |
|
|
|
10.19 |
|
*1 |
|
|
|
10.20 |
|
*1 |
|
|
|
10.21 |
|
* |
|
|
|
10.22 |
|
* |
|
|
|
10.23 |
|
* |
|
|
|
10.24 |
|
* |
|
|
|
10.25 |
|
* |
|
|
|
10.26 |
|
* |
|
|
|
10.27 |
|
* |
|
|
|
10.28 |
|
* |
|
|
|
10.29 |
|
* |
|
|
|
10.30 |
|
* |
|
|
|
10.31 |
|
* |
|
|
|
12.1 |
|
|
|
Ratio of Earnings to Fixed Charges at December 31, 2017 (filed herewith). |
|
21 |
|
|
|
|
|
23.1 |
|
|
|
|
|
23.2 |
|
|
|
|
|
31.1 |
|
|
|
81
|
Exhibit |
|
Reference |
|
Description |
|
31.2 |
|
|
|
|
|
32.1 |
|
|
|
|
|
32.2 |
|
|
|
|
|
101.INS |
|
|
|
XBRL Instance Document. |
|
101.SCH |
|
|
|
XBRL Taxonomy Extension Schema. |
|
101.CAL |
|
|
|
XBRL Taxonomy Extension Calculation Linkbase. |
|
101.DEF |
|
|
|
XBRL Taxonomy Extension Definition Linkbase. |
|
101.LAB |
|
|
|
XBRL Taxonomy Extension Label Linkbase. |
|
101.PRE |
|
|
|
XBRL Taxonomy Extension Presentation Linkbase. |
*These exhibits are incorporated by reference and are on file with the Securities and Exchange Commission.
|
1) |
Management contract or compensatory plan or arrangement. |
|
2) |
Excludes exhibits and schedules, which the registrant agrees to furnish supplementally to the Securities and Exchange Commission upon request. |
None.
82
Pursuant to the requirements of Section 13 or 15(d) of the Securities Exchange Act of 1934, the registrant has duly caused this report to be signed on its behalf by the undersigned, thereunto duly authorized.
|
|
|
|
AV HOMES, INC. |
|
|
|
|
|
|
|
|
Dated: |
February 23, 2018 |
|
By: |
/s/ Roger A. Cregg |
|
|
|
|
|
Roger A. Cregg, Director, President, and |
|
|
|
|
|
Chief Executive Officer (Principal Executive Officer) |
Pursuant to the requirements of the Securities Exchange Act of 1934, this report has been signed below by the following persons (including a majority of the Board of Directors) on behalf of the registrant and in the capacities and on the dates indicated.
|
Dated: |
|
February 23, 2018 |
|
By: |
/s/ Roger A. Cregg |
|
|
|
|
|
|
Roger A. Cregg, Director, President, and Chief Executive Officer (Principal Executive Officer) |
|
|
|
|
|
|
|
|
Dated: |
|
February 23, 2018 |
|
By: |
/s/ Michael S. Burnett |
|
|
|
|
|
|
Michael S. Burnett, Executive Vice President and Chief Financial Officer (Principal Financial Officer and Principal Accounting Officer) |
|
|
|
|
|
|
|
|
Dated: |
|
February 23, 2018 |
|
By: |
/s/ Joshua L. Nash |
|
|
|
|
|
|
Joshua L. Nash, Director and Chairman of the Board |
|
|
|
|
|
|
|
|
Dated: |
|
February 23, 2018 |
|
By: |
/s/ Paul D. Barnett |
|
|
|
|
|
|
Paul D. Barnett, Director |
|
|
|
|
|
|
|
|
Dated: |
|
February 23, 2018 |
|
By: |
/s/ Matthew Coleman |
|
|
|
|
|
|
Matthew Coleman, Director |
|
|
|
|
|
|
|
|
Dated: |
|
February 23, 2018 |
|
By: |
/s/ Roger W. Einiger |
|
|
|
|
|
|
Roger W. Einiger, Director |
|
|
|
|
|
|
|
|
Dated: |
|
February 23, 2018 |
|
By: |
/s/ Paul Hackwell |
|
|
|
|
|
|
Paul Hackwell, Director |
|
|
|
|
|
|
|
|
Dated: |
|
February 23, 2018 |
|
By: |
/s/ Jonathan M. Pertchik |
|
|
|
|
|
|
Jonathan M. Pertchik, Director |
|
|
|
|
|
|
|
|
Dated: |
|
February 23, 2018 |
|
By: |
/s/ Michael F. Profenius |
|
|
|
|
|
|
Michael F. Profenius, Director |
|
|
|
|
|
|
|
|
Dated: |
|
February 23, 2018 |
|
By: |
/s/ Aaron Ratner |
|
|
|
|
|
|
Aaron Ratner, Director |
|
|
|
|
|
|
|
|
Dated: |
|
February 23, 2018 |
|
By: |
/s/ Joel M. Simon |
|
|
|
|
|
|
Joel M. Simon, Director |
83