Attached files
| file | filename |
|---|---|
| EX-32 - EX-32 - WILLIAMS PARTNERS L.P. | wpz_20171231x10kxex32.htm |
| EX-31.2 - EX-31.2 - WILLIAMS PARTNERS L.P. | wpz_20171231x10kxex312.htm |
| EX-31.1 - EX-31.1 - WILLIAMS PARTNERS L.P. | wpz_20171231x10kxex311.htm |
| EX-23.3 - EX-23.3 - WILLIAMS PARTNERS L.P. | wpz_20171231x10kxex233.htm |
| EX-23.2 - EX-23.2 - WILLIAMS PARTNERS L.P. | wpz_20171231x10kxex232.htm |
| EX-23.1 - EX-23.1 - WILLIAMS PARTNERS L.P. | wpz_20171231x10kxex231.htm |
| EX-21 - EX-21 - WILLIAMS PARTNERS L.P. | wpz_20171231x10kxex21.htm |
| EX-12 - EX-12 - WILLIAMS PARTNERS L.P. | wpz_20171231x10kxex12.htm |
\
UNITED STATES SECURITIES AND EXCHANGE COMMISSION
Washington, D.C. 20549
FORM 10-K
(Mark One) | |
þ | ANNUAL REPORT PURSUANT TO SECTION 13 OR 15(d) OF THE SECURITIES EXCHANGE ACT OF 1934 |
For the fiscal year ended December 31, 2017 | |
OR | |
¨ | TRANSITION REPORT PURSUANT TO SECTION 13 OR 15(d) OF THE SECURITIES EXCHANGE ACT OF 1934 |
For the transition period from to | |
Commission file number 1-34831
WILLIAMS PARTNERS L.P.
(Exact Name of Registrant as Specified in Its Charter)
Delaware | 20-2485124 |
(State or Other Jurisdiction of Incorporation or Organization) | (I.R.S. Employer Identification No.) |
One Williams Center, Tulsa, Oklahoma | 74172-0172 |
(Address of Principal Executive Offices) | (Zip Code) |
918-573-2000
(Registrant’s Telephone Number, Including Area Code)
Securities registered pursuant to Section 12(b) of the Act:
Title of Each Class | Name of Each Exchange on Which Registered |
Common Units | New York Stock Exchange |
Securities registered pursuant to Section 12(g) of the Act:
None
(Title of Class)
Indicate by check mark if the registrant is a well-known seasoned issuer, as defined in Rule 405 of the Securities Act. Yes þ No ¨
Indicate by check mark if the registrant is not required to file reports pursuant to Section 13 or Section 15(d) of the Act. Yes ¨ No þ
Indicate by check mark whether the registrant (1) has filed all reports required to be filed by Section 13 or 15(d) of the Securities Exchange Act of 1934 during the preceding 12 months (or for such shorter period that the registrant was required to file such reports), and (2) has been subject to such filing requirements for the past 90 days. Yes þ No ¨
Indicate by check mark whether the registrant has submitted electronically and posted on its corporate Web site, if any, every Interactive Data File required to be submitted and posted pursuant to Rule 405 of Regulation S-T (§232.405 of this chapter) during the preceding 12 months (or for such shorter period that the registrant was required to submit and post such files). Yes þ No ¨
Indicate by check mark if disclosure of delinquent filers pursuant to Item 405 of Regulation S-K (§229.405 of this chapter) is not contained herein, and will not be contained, to the best of registrant’s knowledge, in definitive proxy or information statements incorporated by reference in Part III of this Form 10-K or any amendment to this Form 10-K. þ
Indicate by check mark whether the registrant is a large accelerated filer, an accelerated filer, a non-accelerated filer, a smaller reporting company, or an emerging growth company. See the definitions of “large accelerated filer,” “accelerated filer,” “smaller reporting company,” and “emerging growth company” in Rule 12b-2 of the Exchange Act.
Large accelerated filer þ | Accelerated filer ¨ | Non-accelerated filer ¨ | Smaller reporting company ¨ | Emerging growth company ¨ | ||||
(Do not check if a smaller reporting company) | ||||||||
If an emerging growth company, indicate by check mark if the registrant has elected not to use the extended transition period for complying with any new or revised financial accounting standards provided pursuant to Section 13(a) of the Exchange Act. ¨
Indicate by check mark whether the registrant is a shell company (as defined in Rule 12b-2 of the Act). Yes ¨ No þ
The aggregate market value of the registrant’s common units held by non-affiliates based on the closing sale price of such units as reported on the New York Stock Exchange, as of the last business day of the registrant’s most recently completed second quarter was approximately $38,332,867,488.
The registrant had 957,529,465 common units and 18,124,096 Class B units outstanding as of February 19, 2018.
DOCUMENTS INCORPORATED BY REFERENCE
None
WILLIAMS PARTNERS L.P.
FORM 10-K
TABLE OF CONTENTS
Page | ||
PART I | ||
Item 1. | ||
Item 1A. | ||
Item 1B. | ||
Item 2. | ||
Item 3. | ||
Item 4. | ||
PART II | ||
Item 5. | ||
Item 6. | ||
Item 7. | ||
Item 7A. | ||
Item 8. | ||
Item 9. | ||
Item 9A. | ||
Item 9B. | ||
PART III | ||
Item 10. | ||
Item 11. | ||
Item 12. | ||
Item 13. | ||
Item 14. | ||
PART IV | ||
Item 15. | ||
Item 16. | ||
1
DEFINITIONS
The following is a listing of certain abbreviations, acronyms and other industry terminology that may be used throughout this Annual Report.
Measurements:
Barrel: One barrel of petroleum products that equals 42 U.S. gallons
Bcf : One billion cubic feet of natural gas
Bcf/d: One billion cubic feet of natural gas per day
British Thermal Unit (Btu): A unit of energy needed to raise the temperature of one pound of water by one degree
Fahrenheit
Dekatherms (Dth): A unit of energy equal to one million British thermal units
Mbbls/d: One thousand barrels per day
Mdth/d: One thousand dekatherms per day
MMcf/d: One million cubic feet per day
MMdth: One million dekatherms or approximately one trillion British thermal units
MMdth/d: One million dekatherms per day
Tbtu: One trillion British thermal units
Consolidated Entities:
Cardinal: Cardinal Gas Services, L.L.C.
Constitution: Constitution Pipeline Company, LLC
Gulfstar One: Gulfstar One LLC
Jackalope: Jackalope Gas Gathering Services, L.L.C.
Northwest Pipeline: Northwest Pipeline LLC
Transco: Transcontinental Gas Pipe Line Company, LLC
Partially Owned Entities: Entities in which we do not own a 100 percent ownership interest and, as of December 31, 2017, which we account for as an equity-method investment, including principally the following:
Aux Sable: Aux Sable Liquid Products LP
Caiman II: Caiman Energy II, LLC
Discovery: Discovery Producer Services LLC
Gulfstream: Gulfstream Natural Gas System, L.L.C.
Laurel Mountain: Laurel Mountain Midstream, LLC
OPPL: Overland Pass Pipeline Company LLC
UEOM: Utica East Ohio Midstream LLC
Government and Regulatory:
EPA: Environmental Protection Agency
Exchange Act: The Securities and Exchange Act of 1934, as amended
FERC: Federal Energy Regulatory Commission
GAAP: Generally accepted accounting principles
IRS: Internal Revenue Service
SEC: Securities and Exchange Commission
2
Other:
Williams: The Williams Companies, Inc. and, unless the context otherwise indicates, its subsidiaries (other than Williams Partners L.P. and its subsidiaries)
ACMP: Access Midstream Partners, L.P. prior to its merger with Pre-merger WPZ
DRIP: Distribution reinvestment program
Energy Transfer: Energy Transfer Equity, L.P.
ETC Merger: Merger wherein Williams would have been merged into ETC
Fractionation: The process by which a mixed stream of natural gas liquids is separated into its constituent products,
such as ethane, propane, and butane
IDR: Incentive distribution right
LNG: Liquefied natural gas; natural gas which has been liquefied at cryogenic temperatures
MVC: Minimum volume commitment
NGLs: Natural gas liquids; natural gas liquids result from natural gas processing and crude oil refining and are
used as petrochemical feedstocks, heating fuels, and gasoline additives, among other applications
NGL margins: NGL revenues less Btu replacement cost, plant fuel, transportation, and fractionation
NYSE: New York Stock Exchange
Pre-merger WPZ: Williams Partners L.P. prior to its merger with ACMP
RGP Splitter: Refinery grade propylene splitter
Throughput: The volume of product transported or passing through a pipeline, plant, terminal, or other facility
The statements in this Annual Report that are not historical information, including statements concerning plans and objectives of management for future operations, economic performance or related assumptions, are forward-looking statements. Forward-looking statements may be identified by various forms of words such as “anticipates,” “believes,” “seeks,” “could,” “may,” “should,” “continues,” “estimates,” “expects,” “forecasts,” “intends,” “might,” “goals,” “objectives,” “targets,” “planned,” “potential,” “projects,” “scheduled,” “will,” “assumes,” “guidance,” “outlook,” “in-service date,” or other similar expressions and other words and terms of similar meaning. Although we believe that our expectations regarding future events are based on reasonable assumptions, we can give no assurance that such expectations or assumptions will be achieved. Additional information regarding forward-looking statements and important factors that could cause actual results to differ materially from those in the forward-looking statements are described under Part I, Item 1A in this Annual Report.
3
PART I
Item 1. Business
Unless the context clearly indicates otherwise, references in this report to “we,” “our,” “us” or like terms refer to Williams Partners L.P. and its subsidiaries. Unless the context clearly indicates otherwise, references to “we,” “our,” and “us” include the operations of our Partially Owned Entities in which we own interests accounted for as equity-method investments that are not consolidated in our financial statements. When we refer to our Partially Owned Entities by name, we are referring exclusively to their businesses and operations.
WEBSITE ACCESS TO REPORTS AND OTHER INFORMATION
We file our annual report on Form 10-K, quarterly reports on Form 10-Q, current reports on Form 8-K and other documents electronically with the SEC under the Exchange Act. These reports include, among other disclosures, information on any transactions we may engage in with our general partner and its affiliates and on fees and other amounts paid or accrued to our general partner and its affiliates. You may read and copy any materials that we file with the SEC at the SEC’s Public Reference Room at 100 F Street, N.E., Washington, DC 20549. You may obtain information on the operation of the Public Reference Room by calling the SEC at 1-800-SEC-0330. You may also obtain such reports from the SEC’s Internet website at www.sec.gov.
Our Internet website is http://investor.williams.com/. We make available, free of charge, through our Internet website our annual report on Form 10-K, quarterly reports on Form 10-Q, current reports on Form 8-K, and amendments to those reports filed or furnished pursuant to Section 13(a) or 15(d) of the Exchange Act as soon as reasonably practicable after we electronically file such material with, or furnish it to, the SEC. Our Corporate Governance Guidelines, Code of Business Conduct, Code of Ethics for Senior Officers, and the charter of the Audit Committee of our general partner’s Board of Directors are also available on our Internet website. We will also provide, free of charge, a copy of any of our governance documents listed above upon written request to our general partner’s Corporate Secretary at Williams Partners L.P., One Williams Center, Suite 4700, Tulsa, Oklahoma 74172.
GENERAL
We are an energy infrastructure master limited partnership focused on connecting North America’s significant hydrocarbon resource plays to growing markets for natural gas and NGLs through our gas pipeline and midstream businesses. Our operations are located principally in the United States. As of December 31, 2017, Williams owned our general partner interest and an approximate 74 percent limited partner interest in us.
Williams is an energy infrastructure company that trades on the NYSE under the symbol “WMB.”
Our principal executive offices are located at One Williams Center, Tulsa, Oklahoma 74172. Our telephone number is 918-573-2000.
FINANCIAL INFORMATION ABOUT SEGMENTS
See Part II, Item 8. — Financial Statements and Supplementary Data — Notes to Consolidated Financial Statements — Note 18 – Segment Disclosures.
BUSINESS SEGMENTS
Operations of our businesses are located in the United States. We manage our business and analyze our results of operations on a segment basis consistent with the manner in which our chief operating decision maker evaluates performance and allocates resources. Our operations are organized into the following reportable segments: Northeast G&P, Atlantic-Gulf, West, and NGL & Petchem Services. Certain other corporate activities are included in Other.
• | Northeast G&P — this segment is comprised of our midstream natural gas gathering and processing businesses in the Marcellus Shale region primarily in Pennsylvania, New York, and West Virginia and the Utica Shale region of eastern Ohio, as well as a 66 percent interest in Cardinal (a consolidated entity), a 62 percent equity- |
4
method investment in UEOM, a 69 percent equity-method investment in Laurel Mountain, a 58 percent equity-method investment in Caiman II, and Appalachia Midstream Services, LLC, which owns equity-method investments with an approximate average 66 percent interest in multiple gas gathering systems in the Marcellus Shale.
• | Atlantic-Gulf — this segment is comprised of our interstate natural gas pipeline, Transco, and significant natural gas gathering and processing and crude oil production handling and transportation assets in the Gulf Coast region, including a 51 percent interest in Gulfstar One (a consolidated entity), which is a proprietary floating production system, and various petrochemical and feedstock pipelines in the Gulf Coast region, as well as a 50 percent equity-method investment in Gulfstream, a 41 percent interest in Constitution (a consolidated entity), which is developing a pipeline project (see Note 3 – Variable Interest Entities of Notes to Consolidated Financial Statements), and a 60 percent equity-method investment in Discovery. |
• | West — this segment is comprised of our interstate natural gas pipeline, Northwest Pipeline, and our natural gas gathering, processing, and treating operations in New Mexico, Colorado, and Wyoming, as well as the Barnett Shale region of north-central Texas, the Eagle Ford Shale region of south Texas, the Haynesville Shale region of northwest Louisiana, and the Mid-Continent region which includes the Anadarko, Arkoma, Delaware, and Permian basins. This reporting segment also includes an NGL and natural gas marketing business, storage facilities, and an undivided 50 percent interest in an NGL fractionator near Conway, Kansas, and a 50 percent equity-method investment in OPPL, as well as our previously owned 50 percent equity-method investment in the Delaware basin gas gathering system in the Mid-Continent region (see Note 6 – Investing Activities of Notes to Consolidated Financial Statements). |
• | NGL & Petchem Services — this segment is comprised of previously owned operations, including our 88.5 percent undivided interest in an olefins production facility in Geismar, Louisiana, which was sold in July 2017, and our refinery grade propylene splitter in the Gulf region, which was sold in June 2017. This reporting segment also includes our previously owned Canadian assets, which included an oil sands offgas processing plant located near Fort McMurray, Alberta, and an NGL/olefin fractionation facility at Redwater, Alberta. In September 2016, these Canadian operations were sold. (See Note 2 – Acquisitions and Divestitures of Notes to Consolidated Financial Statements.) |
Detailed discussion of each of our reporting segments follows. For a discussion of our ongoing expansion projects, see Part II, Item 7. Management’s Discussion and Analysis of Financial Condition and Results of Operations.
Northeast G&P
This segment includes our natural gas gathering, compression, processing, and NGL fractionation business in the Marcellus and Utica Shale regions in Pennsylvania, West Virginia, New York, and Ohio.
The following tables summarize the significant consolidated assets of this segment:
Natural Gas Gathering Assets | ||||||||||||
Inlet | ||||||||||||
Pipeline | Capacity | Ownership | ||||||||||
Location | Miles | (Bcf/d) | Interest | Supply Basins | ||||||||
Ohio Valley Midstream | Ohio, West Virginia, & Pennsylvania | 216 | 0.8 | 100% | Appalachian | |||||||
Susquehanna Supply Hub | Pennsylvania & New York | 436 | 3.2 | 100% | Appalachian | |||||||
Cardinal (1) | Ohio | 353 | 1.0 | 66% | Appalachian | |||||||
Flint | Ohio | 75 | 0.4 | 100% | Appalachian | |||||||
Marcellus South (2) | Pennsylvania | 41 | 0.1 | 100% | Appalachian | |||||||
_____________
(1) | Statistics reflect 100 percent of the assets from our 66 percent ownership of Cardinal gathering system. |
(2) | Statistics reflect 100 percent of the Beaver Creek assets in the consolidated Marcellus South gathering system. |
5
Natural Gas Processing Facilities | ||||||||||||
NGL | ||||||||||||
Inlet | Production | |||||||||||
Capacity | Capacity | Ownership | ||||||||||
Location | (Bcf/d) | (Mbbls/d) | Interest | Supply Basins | ||||||||
Fort Beeler | Marshall County, WV | 0.5 | 62 | 100% | Appalachian | |||||||
Oak Grove | Marshall County, WV | 0.2 | 25 | 100% | Appalachian | |||||||
We also own and operate fractionation facilities at Moundsville, de-ethanization and condensate facilities at our Oak Grove processing plant, a condensate stabilization facility near our Oak Grove plant, and an ethane transportation pipeline. Our three condensate stabilizers are capable of handling 17 Mbbls/d of field condensate. NGLs are extracted from the natural gas stream in our cryogenic processing plants. Our Oak Grove de-ethanizer is capable of handling up to approximately 80 Mbbls/d of mixed NGLs to extract up to approximately 40 Mbbls/d of ethane. The remaining mixed NGL stream from the de-ethanizer is then transported and fractionated at our Moundsville facilities, which are capable of handling more than 43 Mbbls/d of mixed NGLs. Ethane produced at our de-ethanizer is transported to markets via our 50-mile ethane pipeline from Oak Grove to Houston, Pennsylvania.
Our gathering business also provides multiple takeaway options to its customers. Ohio Valley Midstream makes customer deliveries with interconnections to two pipelines. Susquehanna Supply Hub makes deliveries for its customers with interconnections to Transco, as well as five other pipelines, while our Cardinal system utilizes interconnections with Blue Racer Midstream, LLC (Blue Racer), and UEOM. In addition, our NGL processing business utilizes connections with multiple pipelines, as well as truck and rail transportation to local and regional markets.
Certain Equity-Method Investments
Laurel Mountain
We own a 69 percent interest in a joint venture, Laurel Mountain, that includes a 2,053-mile gathering system that we operate in western Pennsylvania with the capacity to gather 0.7 Bcf/d of natural gas. Laurel Mountain has a long-term, dedicated, volumetric-based fee agreement, with exposure to natural gas prices, to gather the anchor customer’s production in the western Pennsylvania area of the Marcellus Shale.
Caiman II
We own a 58 percent interest in Caiman II, which owns a 50 percent interest in Blue Racer, a joint project to own, operate, develop and acquire midstream assets in the Utica Shale and certain adjacent areas in the Marcellus Shale. Blue Racer’s assets include 721 miles of gathering pipelines, and the Natrium complex in Marshall County, West Virginia, with a cryogenic processing capacity of 400 MMcf/d and fractionation capacity of approximately 120,000 Bbls/d. Blue Racer also owns the Berne complex in Monroe County, Ohio, with a cryogenic processing capacity of 400 MMcf/d, and NGL and condensate pipelines connecting Natrium to Berne.
Utica East Ohio Midstream
We own a 62 percent interest in UEOM, which includes infrastructure for the gathering, processing, and fractionation of natural gas and NGLs in the Utica Shale play in eastern Ohio. We operate a natural gas gathering pipeline, while our partner operates inlet compression, two processing plants with a total capacity of 800 MMcf/d, 41 Mbbls/d of condensate stabilization capacity, a 135 Mbbls/d NGL fractionation facility, approximately 950,000 barrels of NGL storage capacity and other ancillary assets, including loading and terminal facilities. These assets earn a fixed fee that escalates annually within a specified range.
Appalachia Midstream Investments
Through our Appalachia Midstream Investments, we operate 100 percent of and own an approximate average 66 percent interest in the Bradford Supply Hub gathering system and own an approximate average 68 percent interest in the Marcellus South gathering system, together which consist of approximately 987 miles of gathering pipeline in the
6
Marcellus Shale region. The majority of our volumes in the region are gathered from northern Pennsylvania, southwestern Pennsylvania and the northwestern panhandle of West Virginia in core areas of the Marcellus Shale. Appalachia Midstream Investments operates the assets under long-term, 100 percent fixed-fee gathering agreements that include significant acreage dedications and cost of service mechanisms.
During the first quarter of 2017, we exchanged all of our 50 percent interest in the Delaware basin gas gathering system, previously reported within the West segment, for an increased interest in the Bradford Supply Hub natural gas gathering system that is part of the Appalachia Midstream Investments and $155 million in cash. Following this exchange, we have an approximate average 66 percent interest in the Appalachia Midstream Investments. We continue to account for this investment under the equity-method due to the significant participatory rights of our partners such that we do not exercise control. (See Note 6 – Investing Activities of Notes to Consolidated Financial Statements.)
Aux Sable
We also own a 15 percent interest in Aux Sable and its Channahon, Illinois, gas processing and NGL fractionation facility near Chicago. The facility is capable of processing up to 2.1 Bcf/d of natural gas from the Alliance Pipeline system and fractionating approximately 132 Mbbls/d of extracted liquids into NGL products. Additionally, Aux Sable owns an 80 MMcf/d gas conditioning plant and a 12-inch, 83-mile gas pipeline infrastructure in North Dakota that provides additional NGLs to Channahon from the Bakken Shale in the Williston basin.
Operating Statistics
2017 | 2016 | 2015 | ||||||
Volumes: (1) | ||||||||
Gathering (Bcf/d) | 3.31 | 3.21 | 3.10 | |||||
Plant inlet natural gas volumes (Bcf/d) | 0.43 | 0.33 | 0.34 | |||||
NGL production volumes (Mbbls/d) (2) | 38 | 32 | 23 | |||||
__________
(1) | Excludes volumes associated with equity-method investments. |
(2) | Annual average Mbbls/d. |
Atlantic-Gulf
This segment includes the Transco interstate natural gas pipeline that extends from the Gulf of Mexico to the eastern seaboard, as well as natural gas gathering, processing and treating, crude oil production handling, and NGL fractionation assets within the onshore, offshore shelf, and deepwater areas in and around the Gulf Coast states of Texas, Louisiana, Mississippi, and Alabama. This segment also includes various petrochemical and feedstock pipelines in the Gulf Coast region.
Transco
Transco is an interstate natural gas transmission company that owns and operates a 9,700-mile natural gas pipeline system, which is regulated by the FERC, extending from Texas, Louisiana, Mississippi and the Gulf of Mexico through Alabama, Georgia, South Carolina, North Carolina, Virginia, Maryland, Delaware, Pennsylvania and New Jersey to the New York City metropolitan area. The system serves customers in Texas and 12 southeast and Atlantic seaboard states, including major metropolitan areas in Georgia, North Carolina, Washington, D.C., Maryland, New York, New Jersey and Pennsylvania.
At December 31, 2017, Transco’s system, which extends from Texas to New York, had a system-wide delivery capacity totaling approximately 15.0 MMdth of natural gas per day. During 2017, Transco completed five fully-contracted expansions, which added more than 2.8 MMdth of firm transportation capacity per day to the existing pipeline system. Transco’s system includes 50 compressor stations, four underground storage fields, and an LNG storage facility. Compression facilities at sea level-rated capacity total approximately 2.1 million horsepower.
7
Transco has natural gas storage capacity in four underground storage fields located on or near its pipeline system or market areas and operates two of these storage fields. Transco also has storage capacity in an LNG storage facility that it owns and operates. The total usable gas storage capacity available to Transco and its customers in such underground storage fields and LNG storage facility and through storage service contracts is approximately 200 Bcf of natural gas. At December 31, 2017, Transco’s customers had stored in its facilities approximately 141 Bcf of natural gas. In addition, wholly owned subsidiaries of Transco operate and hold a 35 percent equity-method investment in Pine Needle LNG Company, LLC, an LNG storage facility with 4 Bcf of storage capacity. Storage capacity permits Transco’s customers to inject gas into storage during the summer and off-peak periods for delivery during peak winter demand periods.
Gas Gathering, Processing, and Treating Assets
The following tables summarize the significant consolidated assets of this segment:
Natural Gas Gathering Assets | ||||||||||
Inlet | ||||||||||
Pipeline | Capacity | Ownership | ||||||||
Location | Miles | (Bcf/d) | Interest | Supply Basins | ||||||
Canyon Chief, including Blind Faith and Gulfstar extensions | Deepwater Gulf of Mexico | 156 | 0.5 | 100% | Eastern Gulf of Mexico | |||||
Other Eastern Gulf | Offshore shelf and other | 46 | 0.2 | 100% | Eastern Gulf of Mexico | |||||
Seahawk | Deepwater Gulf of Mexico | 115 | 0.4 | 100% | Western Gulf of Mexico | |||||
Perdido Norte | Deepwater Gulf of Mexico | 105 | 0.3 | 100% | Western Gulf of Mexico | |||||
Other Western Gulf | Offshore shelf and other | 105 | 0.5 | 100% | Western Gulf of Mexico | |||||
Natural Gas Processing Facilities | ||||||||||
NGL | ||||||||||
Inlet | Production | |||||||||
Capacity | Capacity | Ownership | ||||||||
Location | (Bcf/d) | (Mbbls/d) | Interest | Supply Basins | ||||||
Markham | Markham, TX | 0.5 | 45 | 100% | Western Gulf of Mexico | |||||
Mobile Bay | Coden, AL | 0.7 | 30 | 100% | Eastern Gulf of Mexico | |||||
In addition, we own and operate several natural gas treating facilities in Texas and Louisiana which bring natural gas to specifications allowable by major interstate pipelines.
Crude Oil Transportation and Production Handling Assets
In addition to our natural gas assets, we own and operate four deepwater crude oil pipelines and own production platforms serving the deepwater in the Gulf of Mexico. Our offshore floating production platforms provide centralized services to deepwater producers such as compression, separation, production handling, water removal, and pipeline landings.
8
The following tables summarize the significant crude oil transportation pipelines and production handling platforms of this segment:
Crude Oil Pipelines | |||||||||||
Pipeline | Capacity | Ownership | |||||||||
Miles | (Mbbls/d) | Interest | Supply Basins | ||||||||
Mountaineer, including Blind Faith and Gulfstar extensions | 155 | 150 | 100% | Eastern Gulf of Mexico | |||||||
BANJO | 57 | 90 | 100% | Western Gulf of Mexico | |||||||
Alpine | 96 | 85 | 100% | Western Gulf of Mexico | |||||||
Perdido Norte | 74 | 150 | 100% | Western Gulf of Mexico | |||||||
Production Handling Platforms | |||||||||||
Crude/NGL | |||||||||||
Gas Inlet | Handling | ||||||||||
Capacity | Capacity | Ownership | |||||||||
(MMcf/d) | (Mbbls/d) | Interest | Supply Basins | ||||||||
Devils Tower | 210 | 60 | 100% | Eastern Gulf of Mexico | |||||||
Gulfstar I FPS (1) | 172 | 80 | 51% | Eastern Gulf of Mexico | |||||||
__________
(1) | Statistics reflect 100 percent of the assets from our 51 percent interest in Gulfstar One. |
Other NGL & Petchem Operations
We own 283 miles of pipeline systems in Louisiana and Texas that provide feedstock transportation from fractionation and storage facilities to various third-party crackers. These systems include the Bayou ethane pipeline, which provides ethane transportation from Mont Belvieu, Texas; certain ethane and propane systems in Louisiana; and a pipeline that has the capacity to transport 12 Mbbls/d of ethane from Discovery’s Paradis fractionator.
Additionally, we own 114 miles of pipelines in the Houston Ship Channel area which transport a variety of products including ethane, propane, ammonia, tertiary butyl alcohol, and other industrial products used in the petrochemical industry. We also own a tunnel crossing pipeline under the Houston Ship Channel. A portion of these pipelines are leased to third parties.
Certain Equity-Method Investments
Discovery
We own a 60 percent interest in and operate the facilities of Discovery. Discovery’s assets include a 600 MMcf/d cryogenic natural gas processing plant near Larose, Louisiana, a 32 Mbbls/d NGL fractionator plant near Paradis, Louisiana, and a 614-mile offshore natural gas gathering and transportation system in the Gulf of Mexico. Discovery’s mainline has a gathering inlet capacity of 600 MMcf/d, while the Keathley Canyon Connector, a deepwater lateral pipeline in the central deepwater Gulf of Mexico has a gathering inlet capacity of 400 MMcf/d. Discovery’s assets also include a crude oil production handling platform with a crude oil/NGL handling capacity of 10 Mbbls/d and natural gas processing capacity of 75 MMcf/d.
Gulfstream
Gulfstream is a 745-mile interstate natural gas pipeline system extending from the Mobile Bay area in Alabama to markets in Florida, which has a capacity to transport 1.3 Bcf/d. We own, through a subsidiary, a 50 percent equity-method investment in Gulfstream. We share operating responsibilities for Gulfstream with the other 50 percent owner.
9
Operating Statistics
2017 | 2016 | 2015 | ||||||
Volumes: (1) | ||||||||
Interstate natural gas pipeline throughput (Tbtu) | 3,783 | 3,503 | 3,373 | |||||
Gathering (Bcf/d) | 0.31 | 0.41 | 0.34 | |||||
Plant inlet natural gas (Bcf/d) | 0.55 | 0.72 | 0.66 | |||||
NGL production (Mbbls/d) (2) | 33 | 41 | 34 | |||||
NGL equity sales (Mbbls/d) (2) | 9 | 13 | 6 | |||||
Crude oil transportation (Mbbls/d) (2) | 134 | 113 | 126 | |||||
_____________
(1) | Excludes volumes associated with equity-method investments. |
(2) | Annual average Mbbls/d. |
West
This segment includes the Northwest Pipeline interstate natural gas pipeline, as well as natural gas gathering, processing, and treating assets in Colorado, New Mexico, Wyoming, Louisiana, Texas, Arkansas, and Oklahoma. This segment also includes an NGL and natural gas marketing business, storage facilities, and an undivided 50 percent interest in an NGL fractionator near Conway, Kansas.
Northwest Pipeline
Northwest Pipeline is an interstate natural gas transmission company that owns and operates a natural gas pipeline system, which is regulated by the FERC, extending from the San Juan basin in northwestern New Mexico and southwestern Colorado through Colorado, Utah, Wyoming, Idaho, Oregon, and Washington to a point on the Canadian border near Sumas, Washington. Northwest Pipeline provides services for markets in Washington, Oregon, Idaho, Wyoming, Nevada, Utah, Colorado, New Mexico, California, and Arizona, either directly or indirectly through interconnections with other pipelines.
At December 31, 2017, Northwest Pipeline’s system, having long-term firm transportation and storage redelivery agreements with aggregate capacity reservations of approximately 3.8 MMdth/d, was composed of approximately 3,900 miles of mainline and lateral transmission pipeline and 41 transmission compressor stations having a combined sea level-rated capacity of approximately 472,000 horsepower.
Northwest Pipeline owns a one-third interest in the Jackson Prairie underground storage facility in Washington and contracts with a third party for natural gas storage services in the Clay basin underground field in Utah. Northwest Pipeline also owns and operates an LNG storage facility in Washington. These storage facilities have an aggregate working natural gas storage capacity of 14.2 MMdth of natural gas, which is substantially utilized for third-party natural gas. These natural gas storage facilities enable Northwest Pipeline to balance daily receipts and deliveries and provide storage services to customers.
10
Gas Gathering, Processing, and Treating Assets
The following tables summarize the significant consolidated assets of this segment:
Natural Gas Gathering Assets | |||||||||||
Location | Pipeline Miles | Inlet Capacity (Bcf/d) | Ownership Interest | Supply Basins/Shale Formations | |||||||
Four Corners | Colorado & New Mexico | 3,742 | 1.8 | 100% | San Juan | ||||||
Wamsutter | Wyoming | 2,084 | 0.7 | 100% | Wamsutter | ||||||
Southwest Wyoming | Wyoming | 1,614 | 0.5 | 100% | Southwest Wyoming | ||||||
Piceance | Colorado | 352 | 1.8 | (1) | Piceance | ||||||
Niobrara | Wyoming | 224 | 0.2 | (2) | Powder River | ||||||
Barnett Shale | Texas | 858 | 0.8 | 100% | Barnett Shale | ||||||
Eagle Ford Shale | Texas | 1,225 | 0.6 | 100% | Eagle Ford Shale | ||||||
Haynesville Shale | Louisiana | 626 | 1.8 | 100% | Haynesville Shale | ||||||
Permian | Texas | 365 | 0.1 | 100% | Permian | ||||||
Mid-Continent | Oklahoma, Texas, & Kansas | 2,248 | 0.9 | 100% | Miss-Lime, Granite Wash, Colony Wash, Arkoma | ||||||
__________
(1) | Includes our 60 percent ownership of a gathering system in the Ryan Gulch area with 140 miles of pipeline and 0.2 Bcf/d of inlet capacity, and our 67 percent ownership of a gathering system at Allen Point with 8 miles of pipeline and 0.1 Bcf/d of inlet capacity. We operate both systems. We own and operate 100 percent of the balance of the Piceance gathering assets. |
(2) | Statistics reflect 100 percent of the assets from our 50 percent ownership of the Jackalope gathering system. |
Natural Gas Processing Facilities | |||||||||||
NGL | |||||||||||
Inlet | Production | ||||||||||
Capacity | Capacity | Ownership | |||||||||
Location | (Bcf/d) | (Mbbls/d) | Interest | Supply Basins | |||||||
Echo Springs | Echo Springs, WY | 0.7 | 58 | 100% | Wamsutter | ||||||
Opal | Opal, WY | 1.1 | 47 | 100% | Southwest Wyoming | ||||||
Bucking Horse (1) | Converse County, WY | 0.1 | 7 | 50% | Powder River | ||||||
Willow Creek | Rio Blanco County, CO | 0.5 | 30 | 100% | Piceance | ||||||
Parachute | Garfield County, CO | 1.1 | 6 | 100% | Piceance | ||||||
Ignacio | Ignacio, CO | 0.5 | 29 | 100% | San Juan | ||||||
Kutz | Bloomfield, NM | 0.2 | 12 | 100% | San Juan | ||||||
__________
(1) | Statistics reflect 100 percent of the assets from our 50 percent ownership of Bucking Horse gas processing facility. |
In addition, we own and operate natural gas treating facilities in New Mexico and Colorado, which bring natural gas to specifications allowable by major interstate pipelines.
Marketing Services
We market NGL products to a wide range of users in the energy and petrochemical industries. The NGL marketing business transports and markets our equity NGLs from the production at our processing plants, and also markets NGLs on behalf of third-party NGL producers, including some of our fee-based processing customers, and the NGL volumes owned by Discovery. The NGL marketing business bears the risk of price changes in these NGL volumes while they are being transported to final sales delivery points. In order to meet sales contract obligations, we may purchase products in the spot market for resale. Other than a long-term agreement to sell our equity NGLs transported on OPPL, the majority of sales are based on supply contracts of one year or less in duration.
11
In certain situations to facilitate our gas gathering and processing activities, we buy natural gas from our producer customers for resale.
Other NGL Operations
We own interests in and/or operate NGL fractionation and storage assets in central Kansas near Conway. These assets include a 50 percent interest in an NGL fractionation facility with capacity of slightly more than 100 Mbbls/d and we own approximately 20 million barrels of NGL storage capacity.
Certain Equity-Method Investments
Delaware basin gas gathering system
We previously owned a non-operated 50 percent interest in the Delaware basin gas gathering system in the Permian basin, which was sold in February 2017. The system was comprised of more than 450 miles of gathering pipeline, located in west Texas.
Overland Pass Pipeline
We also operate and own a 50 percent interest in OPPL. OPPL is capable of transporting 255 Mbbls/d and includes approximately 1,096 miles of NGL pipeline extending from Opal, Wyoming, to the Mid-Continent NGL market center near Conway, Kansas, along with extensions into the Piceance and Denver-Julesberg basins in Colorado and the Bakken Shale in the Williston basin in North Dakota. Our equity NGL volumes from two of our three Wyoming plants and our Willow Creek facility in Colorado are dedicated for transport on OPPL under a long-term transportation agreement.
Operating Statistics
2017 | 2016 | 2015 | |||||||
Volumes: | |||||||||
Interstate natural gas pipeline throughput (Tbtu) | 750 | 727 | 763 | ||||||
Gathering (Bcf/d) | 4.53 | 4.62 | 4.90 | ||||||
Plant inlet natural gas (Bcf/d) | 2.07 | 2.45 | 2.52 | ||||||
NGL production (Mbbls/d) (1) | 77 | 78 | 74 | ||||||
NGL equity sales (Mbbls/d) (1) | 29 | 28 | 21 | ||||||
__________
(1) | Annual average Mbbls/d. |
NGL & Petchem Services
NGL & Petchem Services is comprised of previously owned operations. Effective July 2017, we no longer have ongoing operations in this segment.
Gulf Olefins
In mid-2017, we completed the sale of an 88.5 percent undivided interest and operatorship of an olefins production facility in Geismar, Louisiana, along with a refinery grade propylene splitter in the Gulf region. The olefins business also operated an ethylene storage hub at Mont Belvieu using leased third-party underground storage caverns.
Our refinery grade propylene splitter had production capacity of approximately 500 million pounds per year of propylene. At the propylene splitter, we purchased refinery grade propylene and fractionated it into polymer grade propylene and propane; as a result, the asset was exposed to the price spread between those commodities.
Marketing Services
Prior to the sale of our olefin operations, we marketed olefin products to a wide range of users in the energy and petrochemical industries.
12
Canadian Operations
We completed the sale of our Canadian operations in September, 2016. This business included an oil sands offgas processing plant located near Fort McMurray, Alberta, and an NGL/olefin fractionation facility located at Redwater, Alberta, which is near Edmonton, Alberta, and the Boreal Pipeline which transported NGLs and associated olefins from the Fort McMurray plant to the Redwater fractionation facility. This business allowed us to extract, fractionate, treat, store, terminal and sell the ethane/ethylene, propane, propylene, normal butane (butane), iso-butane, alky feedstock, and condensate recovered from a third-party oil sands bitumen upgrader.
Operating Statistics
2017 | 2016 | 2015 | ||||||
Volumes: | ||||||||
Geismar ethylene sales (millions of pounds) | 566 | 1,638 | 1,066 | |||||
Canadian propylene sales (millions of pounds) | — | 87 | 161 | |||||
Canadian NGL sales (millions of gallons) | — | 141 | 284 | |||||
Service Assets, Customers, and Contracts
Interstate Natural Gas Pipeline Assets
Our interstate natural gas pipelines are subject to regulation by the FERC and as such, our rates and charges for the transportation of natural gas in interstate commerce are subject to regulation. The rates are established through the FERC’s ratemaking process.
Our interstate natural gas pipelines transport and store natural gas for a broad mix of customers, including local natural gas distribution companies, public utilities, municipalities, direct industrial users, electric power generators, and natural gas marketers and producers. We have firm transportation and storage contracts that are generally long-term contracts with various expiration dates and account for the major portion of our regulated businesses. Additionally, we offer storage services and interruptible transportation services under shorter-term agreements.
Gathering, Processing and Treating Assets
Our gathering systems receive natural gas from producers’ oil and natural gas wells and gather these volumes to gas processing, treating or redelivery facilities. Typically, natural gas, in its raw form, is not acceptable for transportation in major interstate natural gas pipelines or for commercial use as a fuel. Our treating facilities remove water vapor, carbon dioxide and other contaminants and collect condensate, but do not extract NGLs. We are generally paid a fee based on the volume of natural gas gathered and/or treated, generally measured in the Btu heating value.
In addition, natural gas contains various amounts of NGLs, which generally have a higher value when separated from the natural gas stream. Our processing plants extract the NGLs in addition to removing water vapor, carbon dioxide, and other contaminants. NGL products include:
• | Ethane, primarily used in the petrochemical industry as a feedstock for ethylene production, one of the basic building blocks for plastics; |
• | Propane, used for heating, fuel and as a petrochemical feedstock in the production of ethylene and propylene, another building block for petrochemical-based products such as carpets, packing materials, and molded plastic parts; |
• | Normal butane, isobutane and natural gasoline, primarily used by the refining industry as blending stocks for motor gasoline or as a petrochemical feedstock. |
13
Our gas processing services generate revenues primarily from the following types of contracts:
• | Fee-based: We are paid a fee based on the volume of natural gas processed, generally measured in the Btu heating value. Our customers are entitled to the NGLs produced in connection with this type of processing agreement. A portion of our fee-based processing revenue includes a share of the margins on the NGLs produced. For the year ended December 31, 2017, 70 percent of our NGL production volumes were under fee-based contracts. |
• | Noncash commodity-based: We also process gas under two types of commodity-based contracts, keep-whole and percent-of-liquids, where we receive consideration for our services in the form of NGLs. Under these contracts, we retain some or all of the extracted NGLs as compensation for our services. For a keep-whole arrangement we replace the Btu content of the retained NGLs that were extracted during processing with natural gas purchases, also known as shrink replacement gas. For a percent-of-liquids arrangement, we deliver to customers an agreed-upon percentage of the extracted NGLs and retain the remainder. NGLs we retain in connection with these types of processing agreements are referred to as our equity NGL production. Under keep-whole agreements, we have commodity price exposure on the difference between NGL and natural gas prices. For the year ended December 31, 2017, 30 percent of our NGL production volumes were under noncash commodity-based contracts. |
Our gathering and processing agreements have terms ranging from month-to-month to the life of the producing lease. Generally, our gathering and processing agreements are long-term agreements. Some contracts have price escalators which annually increase our gathering rates. In addition, certain contracts include fee redetermination or cost of service mechanisms that are designed to support a return on invested capital and allow our gathering rates to be adjusted, subject to specified caps in certain cases, to account for variability in volume, capital expenditures, commodity price fluctuations, compression and other expenses. Certain of our gas gathering agreements include MVCs. If the minimum annual or semi-annual volume commitment is not met, these customers are obligated to pay a fee equal to the applicable fee for each Mcf by which the applicable customer’s minimum annual or semi-annual volume commitment exceeds the actual volume gathered. The revenue associated with such shortfall fees is generally recognized in the fourth quarter of each year.
Demand for gas gathering and processing services is dependent on producers’ drilling activities, which is impacted by the strength of the economy, natural gas prices, and the resulting demand for natural gas by manufacturing and industrial companies and consumers. Our gas gathering and processing customers are generally natural gas producers who have proved and/or producing natural gas fields in the areas surrounding our infrastructure. During 2017, our facilities gathered and processed gas and crude oil for approximately 260 customers. Our top ten customers accounted for approximately 75 percent of our gathering and processing fee revenues and NGL margins from our noncash commodity-based agreements.
Demand for our equity NGLs is affected by economic conditions and the resulting demand from industries using these commodities to produce petrochemical-based products such as plastics, carpets, packing materials and blending stocks for motor gasoline and the demand from consumers using these commodities for heating and fuel. NGL products are currently the preferred feedstock for ethylene and propylene production, which has shifted away from the more expensive crude-based feedstocks.
Key variables for our business will continue to be:
• | Producer drilling activities impacting natural gas supplies supporting our gathering and processing volumes; |
• | Prices impacting our commodity-based activities; |
• | Retaining and attracting customers by continuing to provide reliable services; |
• | Revenue growth associated with additional infrastructure either completed or currently under construction; |
14
• | Disciplined growth in our service areas. |
Crude Oil Transportation and Production Handling Assets
Our crude oil transportation revenues are typically volumetric-based fee arrangements. However, a portion of our marketing revenues are recognized from purchase and sale arrangements whereby the oil that we transport is purchased and sold as a function of the same index-based price. Revenue sources have historically included a combination of fixed-fee, volumetric-based fee and cost reimbursement arrangements. Fixed fees associated with the resident production at our Devils Tower facility are recognized on a units-of-production basis. Fixed fees associated with the resident production at our Gulfstar One facility are recognized as the guaranteed capacity is made available.
Significant Service Revenues
Revenues by service that exceeded 10 percent of consolidated revenue include:
Northeast G&P | Atlantic- Gulf | West | Total | |||||||||||||
(Millions) | ||||||||||||||||
2017 | ||||||||||||||||
Service: | ||||||||||||||||
Regulated natural gas transportation and storage | $ | — | $ | 1,675 | $ | 473 | $ | 2,148 | ||||||||
Gathering, processing, and production handling | 689 | 382 | 1,644 | 2,715 | ||||||||||||
2016 | ||||||||||||||||
Service: | ||||||||||||||||
Regulated natural gas transportation and storage | $ | — | $ | 1,527 | $ | 474 | $ | 2,001 | ||||||||
Gathering, processing, and production handling | 693 | 317 | 1,719 | 2,729 | ||||||||||||
2015 | ||||||||||||||||
Service: | ||||||||||||||||
Regulated natural gas transportation and storage | $ | — | $ | 1,465 | $ | 473 | $ | 1,938 | ||||||||
Gathering, processing, and production handling | 698 | 319 | 1,787 | 2,804 | ||||||||||||
We have one customer, Chesapeake Energy Corporation, and its affiliates, that accounts for 10 percent of our total revenue in 2017. (See Note 16 – Fair Value Measurements, Guarantees, and Concentration of Credit Risk of Notes to Consolidated Financial Statements for additional information.)
REGULATORY MATTERS
FERC
Our gas pipeline interstate transmission and storage activities are subject to FERC regulation under the Natural Gas Act of 1938 (NGA) and under the Natural Gas Policy Act of 1978, and, as such, our rates and charges for the transportation of natural gas in interstate commerce, accounting, and the extension, enlargement, or abandonment of our jurisdictional facilities, among other things, are subject to regulation. Each gas pipeline company holds certificates of public convenience and necessity issued by the FERC authorizing ownership and operation of all pipelines, facilities, and properties for which certificates are required under the NGA. FERC Standards of Conduct govern how our interstate pipelines communicate and do business with gas marketing employees. Among other things, the Standards of Conduct require that interstate pipelines not operate their systems to preferentially benefit gas marketing functions.
FERC regulation requires all terms and conditions of service, including the rates charged, to be filed with and approved by the FERC before any changes can go into effect. Each of our interstate natural gas pipeline companies establishes its rates primarily through the FERC’s ratemaking process. Key determinants in the ratemaking process are:
• | Costs of providing service, including depreciation expense; |
15
• | Allowed rate of return, including the equity component of the capital structure and related income taxes; |
• | Contract and volume throughput assumptions. |
The allowed rate of return is determined in each rate case. Rate design and the allocation of costs between the reservation and commodity rates also impact profitability. As a result of these proceedings, certain revenues previously collected may be subject to refund.
We also own interests in and operate two offshore transmission pipelines that are regulated by the FERC because they are deemed to transport gas in interstate commerce. Black Marlin Pipeline Company provides transportation service for offshore Texas production in the High Island area and redelivers that gas to intrastate pipeline interconnects near Texas City. Discovery provides transportation service for offshore Louisiana production from the South Timbalier, Grand Isle, Ewing Bank, and Green Canyon (deepwater) areas to an onshore processing facility and downstream interconnect points with major interstate pipelines. In addition, we own a 50 percent equity-method investment in and are the operator of OPPL, which is an interstate natural gas liquids pipeline regulated by the FERC pursuant to the Interstate Commerce Act. OPPL provides transportation service pursuant to tariffs filed with the FERC. We also own an ethane pipeline in West Virginia and Pennsylvania (Williams Ohio Valley Pipeline LLC) and an ethane pipeline in Texas and Louisiana (Williams Bayou Ethane Pipeline) each of which provides interstate service subject to FERC jurisdiction under the Interstate Commerce Act.
Pipeline Safety
Our gas pipelines are subject to the Natural Gas Pipeline Safety Act of 1968, as amended, the Pipeline Safety Improvement Act of 2002, the Pipeline Safety, Regulatory Certainty, and Jobs Creation Act of 2011 (Pipeline Safety Act), and the Protecting Our Infrastructure of Pipelines and Enhancing Safety Act of 2016, which regulate safety requirements in the design, construction, operation, and maintenance of interstate natural gas transmission facilities. The United States Department of Transportation Pipeline and Hazardous Materials Safety Administration (PHMSA) administers federal pipeline safety laws.
Federal pipeline safety laws authorize PHMSA to establish minimum safety standards for pipeline facilities and persons engaged in the transportation of gas or hazardous liquids by pipeline. These safety standards apply to the design, construction, testing, operation, and maintenance of gas and hazardous liquids pipeline facilities affecting interstate or foreign commerce. PHMSA has also established reporting requirements for operators of gas and hazardous liquid pipeline facilities, as well as provisions for establishing the qualification of pipeline personnel and requirements for managing the integrity of gas transmission and distribution lines and certain hazardous liquid pipelines. To ensure compliance with these provisions, PHMSA performs pipeline safety inspections and has the authority to initiate enforcement actions.
Federal pipeline safety regulations contain an exemption that applies to gathering lines in certain rural locations. A substantial portion of our gathering lines qualify for that exemption and are currently not regulated under federal law.
States are largely preempted by federal law from regulating pipeline safety for interstate pipelines but most are certified by PHMSA to assume responsibility for enforcing intrastate pipeline safety regulations and inspecting intrastate pipelines. In practice, because states can adopt stricter standards for intrastate pipelines than those imposed by the federal government for interstate lines, they vary considerably in their authority and capacity to address pipeline safety.
On January 3, 2012, the Pipeline Safety Act was enacted. The Pipeline Safety Act requires PHMSA to complete a number of reports in preparation for potential rulemakings. The issues addressed in these rulemaking provisions include, but are not limited to, the use of automatic or remotely controlled shut-off valves on new or replaced transmission line facilities, modifying the requirements for pipeline leak detection systems, and expanding the scope of the pipeline integrity management requirements for both gas and liquid pipeline systems. On June 22, 2016, the Protecting Our Infrastructure of Pipelines and Enhancing Safety Act of 2016 was enacted, further strengthening PHMSA’s safety authority.
16
Pipeline Integrity Regulations
We have an enterprise-wide Gas Integrity Management Plan that we believe meets the PHMSA final rule that was issued pursuant to the requirements of the Pipeline Safety Improvement Act of 2002. The rule requires gas pipeline operators to develop an integrity management program for gas transmission pipelines that could affect high-consequence areas in the event of pipeline failure. The integrity management program includes a baseline assessment plan along with periodic reassessments to be completed within required time frames. In meeting the integrity regulations, we have identified high-consequence areas and developed baseline assessment plans. Ongoing periodic reassessments and initial assessments of any new high-consequence areas have been completed. We estimate that the cost to be incurred in 2018 associated with this program to be approximately $99 million. Management considers the costs associated with compliance with the rule to be prudent costs incurred in the ordinary course of business and, therefore, recoverable through Northwest Pipeline’s and Transco’s rates.
We have an enterprise-wide Liquid Integrity Management Plan that we believe meets the PHMSA final rule that was issued pursuant to the requirements of the Pipeline Safety Improvement Act of 2002. The rule requires liquid pipeline operators to develop an integrity management program for liquid transmission pipelines that could affect high-consequence areas in the event of pipeline failure. The integrity management program includes a baseline assessment plan along with periodic reassessments expected to be completed within required time frames. In meeting the integrity regulations we utilized government defined high-consequence areas and developed baseline assessment plans. We completed assessments within the required time frames. We estimate that the cost to be incurred in 2018 associated with this program will be approximately $4 million. Ongoing periodic reassessments and initial assessments of any new high-consequence areas are expected to be completed within the time frames required by the rule. Management considers the costs associated with compliance with the rule to be prudent costs incurred in the ordinary course of business.
State Gathering Regulation
Our onshore midstream gathering operations are subject to laws and regulations in the various states in which we operate. For example, the Texas Railroad Commission has the authority to regulate the terms of service for our intrastate natural gas gathering business in Texas. Although the applicable state regulations vary widely, they generally require that pipeline rates and practices be reasonable and nondiscriminatory, and may include provisions covering marketing, pricing, pollution, environment, and human health and safety. Some states, such as New York, have specific regulations pertaining to the design, construction, and operations of gathering lines within such state.
OCSLA
Our offshore midstream gathering is subject to the Outer Continental Shelf Lands Act (OCSLA). Although offshore gathering facilities are not subject to the NGA, offshore transmission pipelines are subject to the NGA, and in recent years the FERC has taken a broad view of offshore transmission, finding many shallow-water pipelines to be jurisdictional transmission. Most offshore gathering facilities are subject to the OCSLA, which provides in part that outer continental shelf pipelines “must provide open and nondiscriminatory access to both owner and nonowner shippers.”
Intrastate Liquids Pipelines in the Gulf Coast
Our intrastate liquids pipelines in the Gulf Coast are regulated by the Louisiana Department of Environmental Quality, the Texas Railroad Commission, and various other state and federal agencies. These pipelines are also subject to the liquid pipeline safety and integrity regulations discussed above since both Louisiana and Texas have adopted the integrity management regulations defined in PHMSA.
See Part II, Item 8. Financial Statements and Supplementary Data — Note 17 – Contingent Liabilities and Commitments of Notes to Consolidated Financial Statements for further details on our regulatory matters. For additional information regarding regulatory matters, please also refer to “Risk Factors — The operation of our businesses might also be adversely affected by regulatory proceedings, changes in government regulations or in their interpretation or implementation, or the introduction of new laws or regulations applicable to our businesses or our customers,” and
17
“The natural gas sales, transportation, and storage operations of our gas pipelines are subject to regulation by the FERC, which could have an adverse impact on their ability to establish transportation and storage rates that would allow them to recover the full cost of operating their respective pipelines, including a reasonable rate of return.”
ENVIRONMENTAL MATTERS
Our operations are subject to federal environmental laws and regulations as well as the state, local, and tribal laws and regulations adopted by the jurisdictions in which we operate. We could incur liability to governments or third parties for any unlawful discharge of pollutants into the air, soil, or water, as well as liability for cleanup costs. Materials could be released into the environment in several ways including, but not limited to:
• | Leakage from gathering systems, underground gas storage caverns, pipelines, processing or treating facilities, transportation facilities, and storage tanks; |
• | Damage to facilities resulting from accidents during normal operations; |
• | Damages to onshore and offshore equipment and facilities resulting from storm events or natural disasters; |
• | Blowouts, cratering, and explosions. |
In addition, we may be liable for environmental damage caused by former owners or operators of our properties.
We believe compliance with current environmental laws and regulations will not have a material adverse effect on our capital expenditures, earnings, or current competitive position. However, environmental laws and regulations could affect our business in various ways from time to time, including incurring capital and maintenance expenditures, fines and penalties, and creating the need to seek relief from the FERC for rate increases to recover the costs of certain capital expenditures and operation and maintenance expenses.
For additional information regarding the potential impact of federal, state, tribal, or local regulatory measures on our business and specific environmental issues, please refer to “Risk Factors – Our operations are subject to environmental laws and regulations, including laws and regulations relating to climate change and greenhouse gas emissions, which may expose us to significant costs, liabilities, and expenditures that could exceed our expectations” and Part II, Item 7. “Management’s Discussion and Analysis of Financial Condition and Results of Operations – Environmental” and “Environmental Matters” in Part II, Item 8. — Financial Statements and Supplementary Data —Note 17 – Contingent Liabilities and Commitments of Notes to Consolidated Financial Statements.
COMPETITION
Gas Pipeline Business
The market for supplying natural gas is highly competitive and new pipelines, storage facilities, and other related services are expanding to service the growing demand for natural gas. Additionally, pipeline capacity in many growing natural gas supply basins is constrained causing competition to increase among pipeline companies as they strive to connect those basins to major natural gas demand centers.
In our business, we compete with major intrastate and interstate natural gas pipelines. In the last few years, local distribution companies have also started entering into the long haul transportation business through joint venture pipelines. The principle elements of competition in the interstate natural gas pipeline business are based on rates, reliability, quality of customer service, diversity of supply, and proximity to customers and market hubs.
Significant entrance barriers to build new pipelines exist, including federal and growing state regulations and public opposition against new pipeline builds, and these factors will continue to impact potential competition for the foreseeable future. However, we believe the position of our existing infrastructure, established strategic long-term contracts, and the fact that our pipelines have numerous receipt and delivery points along our systems provide us a competitive advantage, especially along the eastern seaboard and northwestern United States.
18
Midstream Business
Competition for natural gas gathering, processing, treating, transporting, and storing natural gas continues to increase as production from shales and other resource areas continues to grow. Our midstream services compete with similar facilities that are in the same proximity as our assets.
We face competition from major and independent natural gas midstream providers, private equity firms, and major integrated oil and natural gas companies that gather, transport, process, fractionate, store, and market natural gas and NGLs, as well as some larger exploration and production companies that are choosing to develop midstream services to handle their own natural gas.
Our gathering and processing agreements are generally long-term agreements that may include acreage dedication. We primarily face competition to the extent these agreements approach renewal and new volume opportunities arise. Competition for natural gas volumes is primarily based on reputation, commercial terms (products retained or fees charged), array of services provided, efficiency and reliability of services, location of gathering facilities, available capacity, downstream interconnects, and latent capacity. We believe our significant presence in traditional prolific supply basins, our solid positions in growing shale plays, and our ability to offer integrated packages of services position us well against our competition.
For additional information regarding competition for our services or otherwise affecting our business, please refer to “Risk Factors - The financial condition of our natural gas transportation and midstream businesses is dependent on the continued availability of natural gas supplies in the supply basins that we access and demand for those supplies in the markets we serve,” “Our industry is highly competitive and increased competitive pressure could adversely affect our business and operating results,” and “We may not be able to replace, extend, or add additional customer contracts or contracted volumes on favorable terms, or at all, which could affect our financial condition, the amount of cash available to pay distributions, and our ability to grow.”
EMPLOYEES
We do not have any employees. We are managed and operated by the directors and officers of our general partner. At February 1, 2018, our general partner or its affiliates employed approximately 5,425 full-time employees, a substantial portion of which support our operations and provide services to us. Additionally, our general partner and its affiliates provide general and administrative services to us. For further information, please read Part III, Item 10. “Directors, Executive Officers and Corporate Governance” and Part III, Item 13. “Certain Relationships and Related Transactions, and Director Independence — Reimbursement of Expenses of our General Partner.”
FINANCIAL INFORMATION ABOUT GEOGRAPHIC AREAS
See Part II, Item 8. Financial Statements and Supplementary Data — Note 18 – Segment Disclosures of Notes to Consolidated Financial Statements for amounts of revenues during the last three fiscal years from external customers attributable to the United States and all foreign countries. Also see Part II, Item 8. Financial Statements and Supplementary Data — Note 18 – Segment Disclosures of Notes to Consolidated Financial Statements for information relating to long-lived assets during the last three fiscal years, located in the United States and all foreign countries.
19
Item 1A. Risk Factors
FORWARD-LOOKING STATEMENTS
The reports, filings, and other public announcements of WPZ may contain or incorporate by reference statements that do not directly or exclusively relate to historical facts. Such statements are “forward-looking statements” within the meaning of Section 27A of the Securities Act of 1933, as amended (Securities Act) and Section 21E of the Securities Exchange Act of 1934, as amended (Exchange Act). These forward-looking statements relate to anticipated financial performance, management’s plans and objectives for future operations, business prospects, outcome of regulatory proceedings, market conditions, and other matters.
All statements, other than statements of historical facts, included in this report that address activities, events or developments that we expect, believe or anticipate will exist or may occur in the future, are forward-looking statements. Forward-looking statements can be identified by various forms of words such as “anticipates,” “believes,” “seeks,” “could,” “may,” “should,” “continues,” “estimates,” “expects,” “forecasts,” “intends,” “might,” “goals,” “objectives,” “targets,” “planned,” “potential,” “projects,” “scheduled,” “will,” “assumes,” “guidance,” “outlook,” “in-service date,” or other similar expressions. These forward-looking statements are based on management’s beliefs and assumptions and on information currently available to management and include, among others, statements regarding:
• | Levels of cash distributions with respect to limited partner interests; |
• | Our and our affiliates’ future credit ratings; |
• | Amounts and nature of future capital expenditures; |
• | Expansion and growth of our business and operations; |
• | Expected in-service dates for capital projects; |
• | Financial condition and liquidity; |
• | Business strategy; |
• | Cash flow from operations or results of operations; |
• | Seasonality of certain business components; |
• | Natural gas and natural gas liquids prices, supply, and demand; |
• | Demand for our services. |
Forward-looking statements are based on numerous assumptions, uncertainties, and risks that could cause future events or results to be materially different from those stated or implied in this report. Many of the factors that will determine these results are beyond our ability to control or predict. Specific factors that could cause actual results to differ from results contemplated by the forward-looking statements include, among others, the following:
• | Whether we will produce sufficient cash flows to provide expected levels of cash distributions; |
• | Whether we elect to pay expected levels of cash distributions; |
• | Whether we will be able to effectively execute our financing plan; |
20
• | Availability of supplies, including lower than anticipated volumes from third parties served by our midstream business, and market demand; |
• | Volatility of pricing including the effect of lower than anticipated energy commodity prices and margins; |
• | Inflation, interest rates, and general economic conditions (including future disruptions and volatility in the global credit markets and the impact of these events on our customers and suppliers); |
• | The strength and financial resources of our competitors and the effects of competition; |
• | Whether we are able to successfully identify, evaluate, and timely execute our capital projects and other investment opportunities in accordance with our forecasted capital expenditures budget; |
• | Our ability to successfully expand our facilities and operations; |
• | Development and rate of adoption of alternative energy sources; |
• | The impact of operational and developmental hazards and unforeseen interruptions, and the availability of adequate insurance coverage; |
• | The impact of existing and future laws (including, but not limited to, the Tax Cuts and Jobs Act of 2017), regulations, the regulatory environment, environmental liabilities, and litigation, as well as our ability to obtain necessary permits and approvals and achieve favorable rate proceeding outcomes; |
• | Our costs for defined benefit pension plans and other postretirement benefit plans sponsored by our affiliates; |
• | Changes in maintenance and construction costs; |
• | Changes in the current geopolitical situation; |
• | Our exposure to the credit risk of our customers and counterparties; |
• | Risks related to financing, including restrictions stemming from debt agreements, future changes in credit ratings as determined by nationally recognized credit rating agencies, and the availability and cost of capital; |
• | The amount of cash distributions from and capital requirements of our investments and joint ventures in which we participate; |
• | Risks associated with weather and natural phenomena, including climate conditions and physical damage to our facilities; |
• | Acts of terrorism, including cybersecurity threats, and related disruptions; |
• | Additional risks described in our filings with the Securities and Exchange Commission (SEC). |
Given the uncertainties and risk factors that could cause our actual results to differ materially from those contained in any forward-looking statement, we caution investors not to unduly rely on our forward-looking statements. We disclaim any obligations to and do not intend to update the above list or announce publicly the result of any revisions to any of the forward-looking statements to reflect future events or developments.
21
In addition to causing our actual results to differ, the factors listed above and referred to below may cause our intentions to change from those statements of intention set forth in this report. Such changes in our intentions may also cause our results to differ. We may change our intentions, at any time and without notice, based upon changes in such factors, our assumptions, or otherwise.
Limited partner units are inherently different from the capital stock of a corporation, although many of the business risks to which we are subject are similar to those that would be faced by a corporation engaged in a similar business. You should carefully consider the risk factors discussed below in addition to the other information in this report. If any of the following risks were actually to occur, our business, results of operations, and financial condition could be materially adversely affected. In that case, we might not be able to pay distributions on our common units, the trading price of our common units could decline, and unitholders could lose all or part of their investment.
Because forward-looking statements involve risks and uncertainties, we caution that there are important factors, in addition to those listed above, that may cause actual results to differ materially from those contained in the forward-looking statements. These factors are described in the following section.
RISK FACTORS
You should carefully consider the following risk factors in addition to the other information in this report. Each of these factors could adversely affect our business, prospects, financial condition, results of operations, cash flows, and, in some cases our reputation. The occurrence of any of such risks could also adversely affect the value of an investment in our securities.
Risks Related to Our Business
The financial condition of our natural gas transportation and midstream businesses is dependent on the continued availability of natural gas supplies in the supply basins that we access and demand for those supplies in the markets we serve.
Our ability to maintain and expand our natural gas transportation and midstream businesses depends on the level of drilling and production by third parties in our supply basins. Production from existing wells and natural gas supply basins with access to our pipeline and gathering systems will naturally decline over time. The amount of natural gas reserves underlying these existing wells may also be less than anticipated, and the rate at which production from these reserves declines may be greater than anticipated. We do not obtain independent evaluations of natural gas reserves connected to our systems and processing facilities. Accordingly, we do not have independent estimates of total reserves dedicated to our systems or the anticipated life of such reserves. In addition, low prices for natural gas, regulatory limitations, or the lack of available capital could adversely affect the development and production of additional natural gas reserves, the installation of gathering, storage, and pipeline transportation facilities and the import and export of natural gas supplies. Localized low natural gas prices in one or more of our existing supply basins, whether caused by a lack of infrastructure or otherwise, could also result in depressed natural gas production in such basins and limit the supply of natural gas made available to us. The competition for natural gas supplies to serve other markets could also reduce the amount of natural gas supply for our customers. A failure to obtain access to sufficient natural gas supplies will adversely impact our ability to maximize the capacities of our gathering, transportation, and processing facilities.
Demand for our services is dependent on the demand for gas in the markets we serve. Alternative fuel sources such as electricity, coal, fuel oils, or nuclear energy, as well as technological advances and renewable sources of energy, could reduce demand for natural gas in our markets and have an adverse effect on our business.
A failure to obtain access to sufficient natural gas supplies or a reduction in demand for our services in the markets we serve could result in impairments of our assets and have a material adverse effect on our business, financial condition, results of operations, and cash flows.
Prices for natural gas, NGLs, oil, and other commodities, are volatile and this volatility has and could continue to adversely affect our financial results, cash flows, access to capital, and ability to maintain our existing businesses.
22
Our revenues, operating results, future rate of growth, and the value of certain components of our businesses depend primarily upon the prices of natural gas, NGLs, oil, or other commodities, and the differences between prices of these commodities and could be materially adversely affected by an extended period of current low commodity prices, or a further decline in commodity prices. Price volatility has and could continue to impact both the amount we receive for our products and services and the volume of products and services we sell. Prices affect the amount of cash flow available for capital expenditures and our ability to borrow money or raise additional capital. Price volatility has and could continue to have an adverse effect on our business, results of operations, financial condition, cash flows, and our ability to make cash distributions to unitholders.
The markets for natural gas, NGLs, oil, and other commodities are likely to continue to be volatile. Wide fluctuations in prices might result from one or more factors beyond our control, including:
• | Worldwide and domestic supplies of and demand for natural gas, NGLs, oil, and related commodities; |
• | Turmoil in the Middle East and other producing regions; |
• | The activities of the Organization of Petroleum Exporting Countries; |
• | The level of consumer demand; |
• | The price and availability of other types of fuels or feedstocks; |
• | The availability of pipeline capacity; |
• | Supply disruptions, including plant outages and transportation disruptions; |
• | The price and quantity of foreign imports of natural gas and oil; |
• | Domestic and foreign governmental regulations and taxes; |
• | The credit of participants in the markets where products are bought and sold. |
We are exposed to the credit risk of our customers and counterparties, including Chesapeake Energy Corporation and its affiliates, and our credit risk management will not be able to completely eliminate such risk.
We are subject to the risk of loss resulting from nonpayment and/or nonperformance by our customers and counterparties in the ordinary course of our business. Generally, our customers are rated investment grade, are otherwise considered creditworthy, or are required to make prepayments or provide security to satisfy credit concerns. However, our credit procedures and policies cannot completely eliminate customer and counterparty credit risk. Our customers and counterparties include industrial customers, local distribution companies, natural gas producers, and marketers whose creditworthiness may be suddenly and disparately impacted by, among other factors, commodity price volatility, deteriorating energy market conditions, and public and regulatory opposition to energy producing activities. In a low commodity price environment certain of our customers could be negatively impacted, causing them significant economic stress including, in some cases, to file for bankruptcy protection or to renegotiate contracts. To the extent one or more of our key customers commences bankruptcy proceedings, our contracts with the customers may be subject to rejection under applicable provisions of the United States Bankruptcy Code, or may be renegotiated. Further, during any such bankruptcy proceeding, prior to assumption, rejection or renegotiation of such contracts, the bankruptcy court may temporarily authorize the payment of value for our services less than contractually required, which could have a material adverse effect on our business, financial condition, results of operations, and cash flows. For example, Chesapeake Energy Corporation and its affiliates, which accounted for approximately 10 percent of our 2017 consolidated revenues, have experienced significant, negative financial results due to sustained low commodity prices. If we fail to adequately
23
assess the creditworthiness of existing or future customers and counterparties or otherwise do not take or are unable to take sufficient mitigating actions, including obtaining sufficient collateral, deterioration in their creditworthiness, and any resulting increase in nonpayment and/or nonperformance by them could cause us to write down or write off accounts receivable. Such write-downs or write-offs could negatively affect our operating results in the periods in which they occur, and, if significant, could have a material adverse effect on our business, results of operations, cash flows, and financial condition, and our ability to make cash distributions to unitholders.
We may not be able to grow or effectively manage our growth.
As part of our growth strategy, we consider acquisition opportunities and engage in significant capital projects. We have both a project lifecycle process and an investment evaluation process. These are processes we use to identify, evaluate, and execute on acquisition opportunities and capital projects. We may not always have sufficient and accurate information to identify and value potential opportunities and risks or our investment evaluation process may be incomplete or flawed. Regarding potential acquisitions, suitable acquisition candidates may not be available on terms and conditions we find acceptable or, where multiple parties are trying to acquire an acquisition candidate, we may not be chosen as the acquirer. If we are able to acquire a targeted business, we may not be able to successfully integrate the acquired businesses and realize anticipated benefits in a timely manner.
Our growth may also be dependent upon the construction of new natural gas gathering, transportation, compression, processing, or treating pipelines and facilities, NGL transportation, or fractionation or storage facilities, as well as the expansion of existing facilities. In the current environment, we may face political opposition by landowners, environmental activists, and others resulting in the delay and/or denial of required governmental permits. Additional risks associated with construction may include the inability to obtain rights-of-way, skilled labor, equipment, materials, and other required inputs in a timely manner such that projects are completed, on time or at all, and the risk that construction cost overruns could cause total project costs to exceed budgeted costs. Additional risks associated with growing our business include, among others, that:
• | Changing circumstances and deviations in variables could negatively impact our investment analysis, including our projections of revenues, earnings, and cash flow relating to potential investment targets, resulting in outcomes which are materially different than anticipated; |
• | We could be required to contribute additional capital to support acquired businesses or assets; |
• | We may assume liabilities that were not disclosed to us, that exceed our estimates and for which contractual protections are either unavailable or prove inadequate; |
• | Acquisitions could disrupt our ongoing business, distract management, divert financial and operational resources from existing operations and make it difficult to maintain our current business standards, controls, and procedures; |
• | Acquisitions and capital projects may require substantial new capital, including the issuance of debt or equity, and we may not be able to access capital markets or obtain acceptable terms. |
If realized, any of these risks could have an adverse impact on our financial condition, results of operations, including the possible impairment of our assets, or cash flows, and our ability to make cash distributions to unitholders.
We may face opposition to the construction and operation of our pipelines and facilities from various groups.
We may face opposition to the construction and operation of our pipelines and facilities from environmental groups, landowners, tribal groups, local groups and other advocates. Such opposition could take many forms, including organized protests, attempts to block or sabotage our operations, intervention in regulatory or administrative proceedings involving our assets, or lawsuits or other actions designed to prevent, disrupt or delay the operation of our assets and business. In addition, acts of sabotage or eco-terrorism could cause significant damage or injury to people, property or the
24
environment or lead to extended interruptions of our operations. Any such event that interrupts the revenues generated by our operations, or which causes us to make significant expenditures not covered by insurance, could adversely affect our financial condition, results of operations, cash flows, and our ability to make cash distributions to unitholders.
We may not have sufficient cash from operations to enable us to pay cash distributions or to maintain current or expected levels of cash distributions following establishment of cash reserves and payment of fees and expenses, including payments to our general partner.
We may not have sufficient cash each quarter to pay cash distributions or maintain current or expected levels of cash distributions. The actual amount of cash we can distribute on our common units principally depends upon the amount of cash we generate from our operations, which will fluctuate from quarter to quarter based on, among other things:
• | The amount of cash that our subsidiaries and the Partially Owned Entities distribute to us; |
• | The amount of cash we generate from our operations, our working capital needs, our level of capital expenditures, and our ability to borrow; |
• | The restrictions contained in our indentures and credit facility and our debt service requirements; |
• | The cost of acquisitions, if any. |
Unitholders should be aware that the amount of cash we have available for distribution depends primarily on our cash flow, including cash reserves and working capital or other borrowings, and not solely on profitability, which will be affected by noncash items. As a result, we may make cash distributions during periods when we record losses, and we may not make cash distributions during periods when we record net income. A failure to pay distributions or to pay distributions at expected levels could result in a loss of investor confidence, reputational damage, and a decrease in the value of our unit price.
Our industry is highly competitive and increased competitive pressure could adversely affect our business and operating results.
We have numerous competitors in all aspects of our businesses, and additional competitors may enter our markets. Any current or future competitor that delivers natural gas, NGLs, or other commodities into the areas that we operate could offer transportation services that are more desirable to shippers than those we provide because of price, location, facilities or other factors. In addition, current or potential competitors may make strategic acquisitions or have greater financial resources than we do, which could affect our ability to make strategic investments or acquisitions. Our competitors may be able to respond more quickly to new laws or regulations or emerging technologies or to devote greater resources to the construction, expansion, or refurbishment of their facilities than we can. Failure to successfully compete against current and future competitors could have a material adverse effect on our business, financial condition, results of operations, cash flows, and our ability to make cash distributions to unitholders.
We do not own all of the interests in the Partially Owned Entities, which could adversely affect our ability to operate and control these assets in a manner beneficial to us.
Because we do not control the Partially Owned Entities, we may have limited flexibility to control the operation of or cash distributions received from these entities. The Partially Owned Entities’ organizational documents generally require distribution of their available cash to their members on a quarterly basis; however, in each case, available cash is reduced, in part, by reserves appropriate for operating the businesses. As of December 31, 2017, our investments in the Partially Owned Entities accounted for approximately 8 percent of our total consolidated assets. Conflicts of interest may arise in the future between us, on the one hand, and our Partially Owned Entities, on the other hand, with regard to our Partially Owned Entities’ governance, business, or operations. If a conflict of interest arises between us and a Partially Owned Entity, other owners may control the Partially Owned Entity’s actions with respect to such matter (subject to certain limitations), which could be detrimental to our business. Any future disagreements with the other
25
co-owners of these assets could adversely affect our ability to respond to changing economic or industry conditions, which could have a material adverse effect on our business, financial condition, results of operations, cash flows, and our ability to make cash distributions to unitholders.
We will conduct certain operations through joint ventures that may limit our operational flexibility or require us to make additional capital contributions.
Some of our operations are conducted through joint venture arrangements, and we may enter additional joint ventures in the future. In a joint venture arrangement, we have less operational flexibility, as actions must be taken in accordance with the applicable governing provisions of the joint venture. In certain cases:
• | We cannot control the amount of capital expenditures that we are required to fund with respect to these operations; |
• | We are dependent on third parties to fund their required share of capital expenditures; |
• | We may be subject to restrictions or limitations on our ability to sell or transfer our interests in the jointly owned assets; |
• | We may be forced to offer rights of participation to other joint venture participants in the area of mutual interest; |
• | We have limited ability to influence or control certain day to day activities affecting the operations. |
In addition, joint venture participants may have obligations that are important to the success of the joint venture, such as the obligation to pay substantial carried costs pertaining to the joint venture and to pay their share of capital and other costs of the joint venture, the performance of which is outside our control. Similarly, if we fail to make a required capital contribution under the applicable governing provisions of a joint venture arrangement, we could be deemed to be in default under the joint venture agreement. Joint venture partners may be in a position to take actions contrary to instructions or requests or contrary to our policies or objectives, and disputes between us and our joint venture partners may result in delays, litigation or operational impasses.
The risks described above or the failure to continue joint ventures, or to resolve disagreements with joint venture partners could adversely affect our ability to conduct our operations that are the subject of any joint venture, which could in turn negatively affect our financial condition and results of operations.
We may not be able to replace, extend, or add additional customer contracts or contracted volumes on favorable terms, or at all, which could affect our financial condition, the amount of cash available to pay distributions, and our ability to grow.
We rely on a limited number of customers and producers for a significant portion of our revenues and supply of natural gas and NGLs. Although many of our customers and suppliers are subject to long-term contracts, if we are unable to replace or extend such contracts, add additional customers, or otherwise increase the contracted volumes of natural gas provided to us by current producers, in each case on favorable terms, if at all, our financial condition, growth plans, and the amount of cash available to pay distributions could be adversely affected. Our ability to replace, extend, or add additional customer or supplier contracts, or increase contracted volumes of natural gas from current producers, on favorable terms, or at all, is subject to a number of factors, some of which are beyond our control, including:
• | The level of existing and new competition in our businesses or from alternative sources, such as electricity, renewable resources, coal, fuel oils, or nuclear energy; |
• | Natural gas and NGL prices, demand, availability, and margins in our markets. Higher prices for energy commodities related to our businesses could result in a decline in the demand for those commodities and, |
26
therefore, in customer contracts or throughput on our pipeline systems. Also, lower energy commodity prices could negatively impact our ability to maintain or achieve favorable contractual terms, including pricing, and could also result in a decline in the production of energy commodities resulting in reduced customer contracts, supply contracts, and throughput on our pipeline systems;
• | General economic, financial markets, and industry conditions; |
• | The effects of regulation on us, our customers, and our contracting practices; |
• | Our ability to understand our customers’ expectations, efficiently and reliably deliver high quality services and effectively manage customer relationships. The results of these efforts will impact our reputation and positioning in the market. |
Certain of our gas pipeline services are subject to long-term, fixed-price contracts that are not subject to adjustment, even if our cost to perform such services exceeds the revenues received from such contracts.
Our gas pipelines provide some services pursuant to long-term, fixed-price contracts. It is possible that costs to perform services under such contracts will exceed the revenues our pipelines collect for their services. Although most of the services are priced at cost-based rates that are subject to adjustment in rate cases, under FERC policy, a regulated service provider and a customer may mutually agree to sign a contract for service at a “negotiated rate” that may be above or below the FERC regulated cost-based rate for that service. These “negotiated rate” contracts are not generally subject to adjustment for increased costs that could be produced by inflation or other factors relating to the specific facilities being used to perform the services.
Some of our businesses are exposed to supplier concentration risks arising from dependence on a single or a limited number of suppliers.
Some of our businesses may be dependent on a small number of suppliers for delivery of critical goods or services. If a supplier on which we depend were to fail to timely supply required goods and services we may not be able to replace such goods and services in a timely manner or otherwise on favorable terms or at all. If we are unable to adequately diversify or otherwise mitigate such supplier concentration risks and such risks were realized, we could be subject to reduced revenues and increased expenses, which could have a material adverse effect on our financial condition, results of operation, and cash flows and our ability to make cash distributions to unitholders.
Failure of our service providers or disruptions to our outsourcing relationships might negatively impact our ability to conduct our business.
We rely on Williams for certain services necessary for us to be able to conduct our business. Certain of the accounting and information technology services that we rely on are currently provided by third-party vendors, and sometimes from service centers outside of the United States. Services provided pursuant to these agreements could be disrupted. Similarly, the expiration of such agreements or the transition of services between providers could lead to loss of institutional knowledge or service disruptions. Our reliance on Williams and others as service providers, and on Williams’ outsourcing relationships, and our limited ability to control certain costs, could have a material adverse effect on our business, financial condition, results of operations, cash flows, and our ability to make cash distributions to unitholders.
An impairment of our assets, including goodwill, property, plant, and equipment, intangible assets, and/or equity-method investments, could reduce our earnings.
GAAP requires us to test certain assets for impairment on either an annual basis or when events or circumstances occur which indicate that the carrying value of such assets might be impaired. The outcome of such testing could result in impairments of our assets including our goodwill, property, plant, and equipment, intangible assets, and/or equity method investments. Additionally, any asset monetizations could result in impairments if any assets are sold or otherwise exchanged for amounts less than their carrying value. If we determine that an impairment has occurred, we would be required to take an immediate noncash charge to earnings.
27
Our operations are subject to operational hazards and unforeseen interruptions.
There are operational risks associated with the gathering, transporting, storage, processing, and treating of natural gas, the fractionation, transportation, and storage of NGLs, and crude oil transportation and production handling, including:
• | Aging infrastructure and mechanical problems; |
• | Damages to pipelines and pipeline blockages or other pipeline interruptions; |
• | Uncontrolled releases of natural gas (including sour gas), NGLs, crude oil, or other products; |
• | Collapse or failure of storage caverns; |
• | Operator error; |
• | Damage caused by third-party activity, such as operation of construction equipment; |
• | Pollution and other environmental risks; |
• | Fires, explosions, craterings, and blowouts; |
• | Security risks, including cybersecurity; |
• | Operating in a marine environment. |
Any of these risks could result in loss of human life, personal injuries, significant damage to property, environmental pollution, impairment of our operations, loss of services to our customers, reputational damage, and substantial losses to us. The location of certain segments of our facilities in or near populated areas, including residential areas, commercial business centers, and industrial sites, could increase the level of damages resulting from these risks. An event such as those described above could have a material adverse effect on our financial condition and results of operations, particularly if the event is not fully covered by insurance.
We do not insure against all potential risks and losses and could be seriously harmed by unexpected liabilities or by the inability of our insurers to satisfy our claims.
In accordance with customary industry practice, we maintain insurance against some, but not all, risks and losses, and only at levels we believe to be appropriate. The occurrence of any risks not fully covered by insurance could have a material adverse effect on our business, financial condition, results of operations, and cash flows, and our ability to repay our debt and make cash distributions to unitholders.
Our assets and operations, as well as our customers’ assets and operations, can be adversely affected by weather and other natural phenomena.
Our assets and operations, especially those located offshore, and our customers’ assets and operations, can be adversely affected by hurricanes, floods, earthquakes, landslides, tornadoes, fires, and other natural phenomena and weather conditions, including extreme or unseasonable temperatures, making it more difficult for us to realize the historic rates of return associated with our assets and operations. A significant disruption in our or our customers’ operations or a significant liability for which we are not fully insured could have a material adverse effect on our business, financial condition, results of operations, and cash flows.
28
Our business could be negatively impacted by acts of terrorism and security threats, including cybersecurity threats, and related disruptions.
Given the volatile nature of the commodities we transport, process, store, and sell, our assets and the assets of our customers and others in our industry may be targets of terrorist activities. A terrorist attack could create significant price volatility, disrupt our business, limit our access to capital markets, or cause significant harm to our operations, such as full or partial disruption to our ability to produce, process, transport, or distribute natural gas, NGLs, or other commodities. Acts of terrorism, as well as events occurring in response to or in connection with acts of terrorism could cause environmental repercussions that could result in a significant decrease in revenues or significant reconstruction or remediation costs, which could have a material adverse effect on our business, financial condition, results of operations, cash flows, and our ability to make cash distributions to unitholders.
We rely on our information technology infrastructure to process, transmit, and store electronic information, including information we use to safely operate our assets. While we believe that we maintain appropriate information security policies, practices, and protocols, we face cybersecurity and other security threats to our information technology infrastructure, which could include threats to our operational industrial control systems and safety systems that operate our pipelines, plants, and assets. We could face unlawful attempts to gain access to our information technology infrastructure, including coordinated attacks from hackers, whether state-sponsored groups, “hacktivists”, or private individuals. The age, operating systems, or condition of our current information technology infrastructure and software assets and our ability to maintain and upgrade such assets could affect our ability to resist cybersecurity threats. We could also face attempts to gain access to information related to our assets through attempts to obtain unauthorized access by targeting acts of deception against individuals with legitimate access to physical locations or information. Breaches in our information technology infrastructure or physical facilities, or other disruptions including those arising from theft, vandalism, fraud, or unethical conduct, could result in damage to our assets, unnecessary waste, safety incidents, damage to the environment, reputational damage, potential liability, or the loss of contracts, and have a material adverse effect on our operations, financial condition, results of operations, and cash flows.
If third-party pipelines and other facilities interconnected to our pipelines and facilities become unavailable to transport natural gas and NGLs or to treat natural gas, our revenues and cash available to pay distributions could be adversely affected.
We depend upon third-party pipelines and other facilities that provide delivery options to and from our pipelines and facilities for the benefit of our customers. Because we do not own these third-party pipelines or other facilities, their continuing operation is not within our control. If these pipelines or facilities were to become temporarily or permanently unavailable for any reason, or if throughput were reduced because of testing, line repair, damage to pipelines or facilities, reduced operating pressures, lack of capacity, increased credit requirements or rates charged by such pipelines or facilities or other causes, we and our customers would have reduced capacity to transport, store or deliver natural gas or NGL products to end use markets or to receive deliveries of mixed NGLs, thereby reducing our revenues. Any temporary or permanent interruption at any key pipeline interconnect or in operations on third-party pipelines or facilities that would cause a material reduction in volumes transported on our pipelines or our gathering systems or processed, fractionated, treated, or stored at our facilities could have a material adverse effect on our business, financial condition, results of operations, cash flows, and our ability to make cash distributions to unitholders.
Our operating results for certain components of our business might fluctuate on a seasonal basis.
Revenues from certain components of our business can have seasonal characteristics. In many parts of the country, demand for natural gas and other fuels peaks during the winter. As a result, our overall operating results in the future might fluctuate substantially on a seasonal basis. Demand for natural gas and other fuels could vary significantly from our expectations depending on the nature and location of our facilities and pipeline systems and the terms of our natural gas transportation arrangements relative to demand created by unusual weather patterns.
29
We do not own all of the land on which our pipelines and facilities are located, which could disrupt our operations.
We do not own all of the land on which our pipelines and facilities have been constructed. As such, we are subject to the possibility of increased costs to retain necessary land use. In those instances in which we do not own the land on which our facilities are located, we obtain the rights to construct and operate our pipelines and gathering systems on land owned by third parties and governmental agencies for a specific period of time. In addition, some of our facilities cross Native American lands pursuant to rights-of-way of limited terms. We may not have the right of eminent domain over land owned by Native American tribes. Our loss of these rights, through our inability to renew right-of-way contracts or otherwise, could have a material adverse effect on our business, financial condition, results of operations, cash flows, and our ability to make cash distributions to unitholders.
Our business could be negatively impacted as a result of stockholder activism directed toward Williams.
In recent years, stockholder activism, including threatened or actual proxy contests, has been directed against numerous public companies, including Williams. During the latter part of fiscal year 2016, Williams was the target of a proxy contest from a stockholder activist. If stockholder activists were to again take or threaten to take actions against Williams or seek to involve themselves in the governance, strategic direction or operations of Williams, our management could be distracted, which could have an adverse effect on our business or financial results. In addition, actions of activist stockholders towards Williams could cause significant fluctuations in our unit price based on temporary or speculative market perceptions or other factors that do not necessarily reflect the underlying fundamentals and prospects of our business.
Our allocation from Williams for costs for its defined benefit pension plans and other postretirement benefit plans are affected by factors beyond our and Williams’ control.
As we have no employees, employees of Williams and its affiliates provide services to us. As a result, we are allocated a portion of Williams’ costs in defined benefit pension plans covering substantially all of Williams’ or its affiliates’ employees providing services to us, as well as a portion of the costs of other postretirement benefit plans covering certain eligible participants providing services to us. The timing and amount of our allocations under the defined benefit pension plans depend upon a number of factors that Williams controls, including changes to pension plan benefits, as well as factors outside of Williams’ control, such as asset returns, interest rates and changes in pension laws. Changes to these and other factors that can significantly increase our allocations could have a significant adverse effect on our financial condition and results of operations.
Williams’ failure to attract and retain an appropriately qualified workforce could negatively impact our results of operations.
Events such as an aging workforce without appropriate replacements, mismatch of skill sets to future needs, or unavailability of contract labor may lead to operating challenges such as lack of resources, loss of knowledge, and a lengthy time period associated with skill development, including with the workforce needs associated with projects and ongoing operations. Williams’ failure to hire and adequately obtain replacement employees, including the ability to transfer significant internal historical knowledge and expertise to the new employees, or the future availability and cost of contract labor may adversely affect our ability to manage and operate the businesses. If Williams is unable to successfully attract and retain an appropriately qualified workforce, results of operations could be negatively impacted.
Risks Related to Financing Our Business
Downgrades of our credit ratings, which are determined outside of our control by independent third parties, impact our liquidity, access to capital, and our costs of doing business.
Downgrades of our credit ratings increase our cost of borrowing and could require us to provide collateral to our counterparties, negatively impacting our available liquidity. In addition, our ability to access capital markets could continue to be limited by the downgrading of our credit ratings.
30
Credit rating agencies perform independent analysis when assigning credit ratings. This analysis includes a number of criteria such as business composition, market and operational risks, as well as various financial tests. Credit rating agencies continue to review the criteria for industry sectors and various debt ratings and may make changes to those criteria from time to time. Credit ratings are subject to revision or withdrawal at any time by the ratings agencies. As of the date of the filing of this report, we have been assigned investment-grade credit ratings by each of the three credit ratings agencies.
Our ability to obtain credit in the future could be affected by Williams’ credit ratings.
Substantially all of Williams’ operations are conducted through its subsidiaries. Williams’ cash flows are substantially derived from loans, dividends, and distributions paid to it by its subsidiaries. Williams’ cash flows are typically utilized to service debt and pay dividends on the common stock of Williams, with the balance, if any, reinvested in its subsidiaries as loans or contributions to capital. Due to our relationship with Williams, our ability to obtain credit will be affected by Williams’ credit ratings. Williams has been assigned sub-investment-grade credit ratings at each of the three ratings agencies. If Williams were to experience a deterioration in its credit standing or financial condition, our access to capital and our ratings could be adversely affected. Any future downgrading of a Williams credit rating could also result in a downgrading of our credit rating. A downgrading of a Williams credit rating could limit our ability to obtain financing in the future upon favorable terms, if at all.
Difficult conditions in the global financial markets and the economy in general could negatively affect our business and results of operations.
Our businesses may be negatively impacted by adverse economic conditions or future disruptions in global financial markets. Included among these potential negative impacts are industrial or economic contraction leading to reduced energy demand and lower prices for our products and services and increased difficulty in collecting amounts owed to us by our customers. If financing is not available when needed, or is available only on unfavorable terms, we may be unable to implement our business plans or otherwise take advantage of business opportunities or respond to competitive pressures. In addition, financial markets have periodically been affected by concerns over U.S. fiscal and monetary policies. These concerns, as well as actions taken by the U.S. federal government in response to these concerns, could significantly and adversely impact the global and U.S. economies and financial markets, which could negatively impact us in the manner described above.
As a publicly traded partnership, these developments could significantly impair our ability to make acquisitions or finance growth projects. We distribute all of our available cash to our unitholders on a quarterly basis. We typically rely upon external financing sources, including the issuance of debt and equity securities and bank borrowings, to fund acquisitions or expansion capital expenditures. Any limitations on our access to external capital, including limitations caused by illiquidity or volatility in the capital markets, may impair our ability to complete future acquisitions and construction projects on favorable terms, if at all. As a result, we may be at a competitive disadvantage as compared to businesses that reinvest all of their available cash to expand ongoing operations, particularly under adverse economic conditions.
Restrictions in our debt agreements and the amount of our indebtedness may affect our future financial and operating flexibility.
Our total outstanding long-term debt (which does not include commercial paper notes) as of December 31, 2017, was $16.5 billion.
The agreements governing our indebtedness contain covenants that restrict our and our material subsidiaries’ ability to incur certain liens to support indebtedness and our ability to merge or consolidate or sell all or substantially all of our assets in certain circumstances. In addition, certain of our debt agreements contain various covenants that restrict or limit, among other things, our ability to make certain distributions during the continuation of an event of default and our, and our material subsidiaries’, ability to enter into certain affiliate transactions and certain restrictive agreements and change the nature of our business. Certain of our debt agreements also contain, and those we enter into in the future
31
may contain, financial covenants and other limitations with which we will need to comply. Williams’ debt agreements contain similar covenants with respect to Williams and its subsidiaries, including in some cases us.
Our debt service obligations and the covenants described above could have important consequences. For example, they could:
• | Make it more difficult for us to satisfy our obligations with respect to our indebtedness, which could in turn result in an event of default on such indebtedness; |
• | Impair our ability to obtain additional financing in the future for working capital, capital expenditures, acquisitions, general partnership purposes, or other purposes; |
• | Diminish our ability to withstand a continued or future downturn in our business or the economy generally; |
• | Require us to dedicate a substantial portion of our cash flow from operations to debt service payments, thereby reducing the availability of cash for working capital, capital expenditures, acquisitions, the payment of distributions, general partnership purposes, or other purposes; |
• | Limit our flexibility in planning for, or reacting to, changes in our business and the industry in which we operate, including limiting our ability to expand or pursue our business activities and preventing us from engaging in certain transactions that might otherwise be considered beneficial to us. |
Our ability to comply with our debt covenants, to repay, extend, or refinance our existing debt obligations and to obtain future credit will depend primarily on our operating performance. Our ability to refinance existing debt obligations or obtain future credit will also depend upon the current conditions in the credit markets and the availability of credit generally. If we are unable to comply with these covenants, meet our debt service obligations, or obtain future credit on favorable terms, or at all, we could be forced to restructure or refinance our indebtedness, seek additional equity capital, or sell assets. We may be unable to obtain financing or sell assets on satisfactory terms, or at all.
Our failure to comply with the covenants in the documents governing our indebtedness could result in events of default, which could render such indebtedness due and payable. We may not have sufficient liquidity to repay our indebtedness in such circumstances. In addition, cross-default or cross-acceleration provisions in our debt agreements could cause a default or acceleration to have a wider impact on our liquidity than might otherwise arise from a default or acceleration of a single debt instrument. For more information regarding our debt agreements, please read Note 13 – Debt, Banking Arrangements, and Leases of Notes to Consolidated Financial Statements.
Increases in interest rates could adversely impact our unit price, our ability to issue equity or incur debt for acquisitions or other purposes, and our ability to make cash distributions at our intended levels.
Interest rates may increase in the future. As a result, interest rates on future credit facilities and debt offerings could be higher than current levels, causing our financing costs to increase accordingly. As with other yield-oriented securities, our unit price will be impacted by the level of our cash distributions and implied distribution yield. The distribution yield is often used by investors to compare and rank yield-oriented securities for investment decision-making purposes. Therefore, changes in interest rates, either positive or negative, may affect the yield requirements of investors who invest in our units, and a rising interest rate environment could have an adverse impact on our unit price and our ability to issue equity or incur debt for acquisitions or other purposes and to make cash distributions at our intended levels.
Our hedging activities might not be effective and could increase the volatility of our results.
In an effort to manage our financial exposure related to commodity price and market fluctuations, we have entered, and may in the future enter into contracts to hedge certain risks associated with our assets and operations. In these hedging activities, we have used, and may in the future use, fixed-price, forward, physical purchase, and sales contracts, futures, financial swaps, and option contracts traded in the over-the-counter markets or on exchanges. Nevertheless,
32
no single hedging arrangement can adequately address all risks present in a given contract. For example, a forward contract that would be effective in hedging commodity price volatility risks would not hedge the contract’s counterparty credit or performance risk. Therefore, unhedged risks will always continue to exist. While we attempt to manage counterparty credit risk within guidelines established by our credit policy, we may not be able to successfully manage all credit risk and as such, future cash flows, and results of operations could be impacted by counterparty default.
Risks Related to Regulations
The natural gas sales, transportation, and storage operations of our gas pipelines are subject to regulation by the FERC, which could have an adverse impact on their ability to establish transportation and storage rates that would allow them to recover the full cost of operating their respective pipelines, including a reasonable rate of return.
In addition to regulation by other federal, state, and local regulatory authorities, under the Natural Gas Act of 1938, interstate pipeline transportation and storage service is subject to regulation by the FERC. Federal regulation extends to such matters as:
• | Transportation and sale for resale of natural gas in interstate commerce; |
• | Rates, operating terms, types of services, and conditions of service; |
• | Certification and construction of new interstate pipelines and storage facilities; |
• | Acquisition, extension, disposition, or abandonment of existing interstate pipelines and storage facilities; |
• | Accounts and records; |
• | Depreciation and amortization policies; |
• | Relationships with affiliated companies who are involved in marketing functions of the natural gas business; |
• | Market manipulation in connection with interstate sales, purchases, or transportation of natural gas. |
Regulatory or administrative actions in these areas, including successful complaints or protests against the rates of the gas pipelines, can affect our business in many ways, including decreasing tariff rates and revenues, decreasing volumes in our pipelines, increasing our costs, and otherwise altering the profitability of our pipeline business.
The operation of our businesses might also be adversely affected by regulatory proceedings, changes in government regulations or in their interpretation or implementation, or the introduction of new laws or regulations applicable to our businesses or our customers.
Public and regulatory scrutiny of the energy industry has resulted in the proposal and/or implementation of increased regulations. Such scrutiny has also resulted in various inquiries, investigations, and court proceedings, including litigation of energy industry matters. Both the shippers on our pipelines and regulators have rights to challenge the rates we charge under certain circumstances. Any successful challenge could materially affect our results of operations.
Certain inquiries, investigations, and court proceedings are ongoing. Adverse effects may continue as a result of the uncertainty of ongoing inquiries, investigations, and court proceedings, or additional inquiries and proceedings by federal or state regulatory agencies or private plaintiffs. In addition, we cannot predict the outcome of any of these inquiries or whether these inquiries will lead to additional legal proceedings against us, civil or criminal fines and/or penalties, or other regulatory action, including legislation, which might be materially adverse to the operation of our business and our results of operations or increase our operating costs in other ways. Current legal proceedings or other
33
matters, including environmental matters, suits, regulatory appeals, and similar matters might result in adverse decisions against us which, among other outcomes, could result in the imposition of substantial penalties and fines and could damage our reputation. The result of such adverse decisions, either individually or in the aggregate, could be material and may not be covered fully or at all by insurance.
In addition, existing regulations, including those pertaining to financial assurances to be provided by our businesses in respect of potential asset decommissioning and abandonment activities, might be revised, reinterpreted, or otherwise enforced in a manner which differs from prior regulatory action. New laws and regulations, including those pertaining to oil and gas hedging and cash collateral requirements, might also be adopted or become applicable to us, our customers, or our business activities. If new laws or regulations are imposed relating to oil and gas extraction, or if additional or revised levels of reporting, regulation, or permitting moratoria are required or imposed, including those related to hydraulic fracturing, the volumes of natural gas and other products that we transport, gather, process, and treat could decline, our compliance costs could increase, and our results of operations could be adversely affected.
Our operations are subject to environmental laws and regulations, including laws and regulations relating to climate change and greenhouse gas emissions, which may expose us to significant costs, liabilities, and expenditures that could exceed our expectations.
Our operations are subject to extensive federal, state, tribal, and local laws and regulations governing environmental protection, endangered and threatened species, the discharge of materials into the environment, and the security of industrial facilities. Substantial costs, liabilities, delays, and other significant issues related to environmental laws and regulations are inherent in the gathering, transportation, storage, processing, and treating of natural gas, fractionation, transportation, and storage of NGLs, and crude oil transportation and production handling as well as waste disposal practices and construction activities. Failure to comply with these laws, regulations, and permits may result in the assessment of administrative, civil and/or criminal penalties, the imposition of remedial obligations, the imposition of stricter conditions on or revocation of permits, the issuance of injunctions limiting or preventing some or all of our operations, and delays or denials in granting permits.
Joint and several, strict liability may be incurred without regard to fault under certain environmental laws and regulations, for the remediation of contaminated areas and in connection with spills or releases of materials associated with natural gas, oil, and wastes on, under or from our properties and facilities. Private parties, including the owners of properties through which our pipeline and gathering systems pass and facilities where our wastes are taken for reclamation or disposal, may have the right to pursue legal actions to enforce compliance as well as to seek damages for noncompliance with environmental laws and regulations or for personal injury or property damage arising from our operations. Some sites at which we operate are located near current or former third-party hydrocarbon storage and processing or oil and natural gas operations or facilities, and there is a risk that contamination has migrated from those sites to ours.
We are generally responsible for all liabilities associated with the environmental condition of our facilities and assets, whether acquired or developed, regardless of when the liabilities arose and whether they are known or unknown. In connection with certain acquisitions and divestitures, we could acquire, or be required to provide indemnification against, environmental liabilities that could expose us to material losses, which may not be covered by insurance. In addition, the steps we could be required to take to bring certain facilities into compliance could be prohibitively expensive, and we might be required to shut down, divest or alter the operation of those facilities, which might cause us to incur losses.
In addition, climate change regulations and the costs associated with the regulation of emissions of greenhouse gases (GHGs) have the potential to affect our business. Regulatory actions by the Environmental Protection Agency or the passage of new climate change laws or regulations could result in increased costs to operate and maintain our facilities, install new emission controls on our facilities, or administer and manage our GHG compliance program. If we are unable to recover or pass through a significant level of our costs related to complying with climate change regulatory requirements imposed on us, it could have a material adverse effect on our results of operations and financial condition. To the extent financial markets view climate change and GHG emissions as a financial risk, this could
34
negatively impact our cost of and access to capital. Climate change and GHG regulation could also reduce demand for our services.
We expect that certain aspects of Tax Cuts and Jobs Act signed into law on December 22, 2017 (Tax Reform), including regulatory liabilities relating to reduced corporate federal income tax rates, could adversely impact our financial condition and our future financial results.
Certain of the rates we charge to our customers are subject to the rate-making policies of the FERC. These policies permit us to include in our cost-of-service an income tax allowance that includes a deferred income tax component. The recently enacted Tax Reform makes significant changes to the U.S. federal income tax rules applicable to both individuals and entities, including among other things, a reduction in corporate federal income tax rates. Although we expect the decreased federal income tax rates will require us to return amounts to certain customers for this item through future rates and have recognized a regulatory liability, the details of any regulatory implementation guidance remain uncertain.
Risks Inherent in an Investment in Us
Williams owns and controls our general partner, which has sole responsibility for conducting our business and managing our operations. Our general partner has limited duties to us and it and its affiliates, including Williams, and may have conflicts of interest with us and may favor their own interests to the detriment of us and our common unitholders.
Williams owns and controls our general partner and appoints all of the officers and directors of our general partner, some of whom are also officers and directors of Williams. Although our general partner has a contractual duty when acting in its capacity as our general partner to act in a way that it believes is in our best interest, the directors and officers of our general partner have a fiduciary duty to manage our general partner in a manner that is beneficial to its sole member and Williams. Conflicts of interest may arise between Williams and our general partner, on the one hand, and us and our unitholders, on the other hand. In resolving these conflicts of interest, our general partner may favor its own interests and the interests of Williams over our interests and the interests of our common unitholders. These conflicts include the following situations, among others:
• | Neither our partnership agreement nor any other agreement requires Williams to pursue a business strategy that favors us. For example, Williams’ directors and officers have a fiduciary duty to make decisions in the best interests of the owners of Williams, which may be contrary to our best interests and the interests of our unitholders. Further, Williams is not a party to any agreement that prohibits it from competing against us in our gas gathering and processing operations and for gathering, processing, and acquisition opportunities. It is possible that Williams could preclude us from pursuing opportunities in which Williams has a competitive interest. |
• | Our general partner is allowed to take into account the interests of parties other than us, such as Williams, in resolving conflicts of interest. |
• | Our partnership agreement limits the liability of and reduces the duties owed by our general partner, and also restricts the remedies available to our unitholders for actions that, without the limitations, might constitute breaches of fiduciary duty. |
• | Except in limited circumstances, our general partner has the power and authority to conduct our business without unitholder approval. |
• | Williams owns units representing approximately 74 percent of the limited partner interest in us. If a vote of our limited partners is required in which Williams is entitled to vote, Williams will be able to vote its units in accordance with its own interests, which may be contrary to our interests or the interests of our unitholders. |
35
• | The executive officers and certain directors of our general partner devote significant time to our business and/or the business of Williams, and will be compensated by Williams for the services rendered to them. |
• | Our general partner determines the amount and timing of asset purchases and sales, capital expenditures, borrowings, issuance of additional partnership securities, and the creation, reduction or increase of reserves, each of which can affect the amount of cash that is distributed to our unitholders. |
• | Our general partner determines the amount and timing of any capital expenditures and, based on the applicable facts and circumstances and, in some instances, with the concurrence of the conflicts committee of its board of directors, whether a capital expenditure is classified as a maintenance capital expenditure, which reduces operating surplus, or an expansion capital expenditure, which does not reduce operating surplus. This determination can affect the amount of cash that is distributed to our unitholders. |
• | Our general partner determines which costs incurred by it and its affiliates are reimbursable by us. |
• | Our general partner may cause us to borrow funds in order to permit the payment of cash distributions. |
• | Our partnership agreement permits us to classify up to $120 million as operating surplus, even if it is generated from asset sales, non-working capital borrowings, or other sources that would otherwise constitute capital surplus. |
• | Our partnership agreement does not restrict our general partner from causing us to pay it or its affiliates for any services rendered to us or entering into additional contractual arrangements with any of these entities on our behalf. |
• | Our general partner, in certain circumstances, has limited liability regarding our contractual and other obligations and in some circumstances is required to be indemnified by us. |
• | Our general partner may exercise its right to call and purchase all of the common units not owned by it and its affiliates if they own more than 85 percent of the common units. |
• | Our general partner controls the enforcement of the obligations that it and its affiliates owe to us. |
• | Our general partner decides whether to retain separate counsel, accountants, or others to perform services for us. |
Our partnership agreement limits our general partner’s duties to unitholders and restricts the remedies available to such unitholders for actions taken by our general partner that might otherwise constitute breaches of fiduciary duty.
Our partnership agreement contains provisions that modify and reduce the standards to which our general partner would otherwise be held by state fiduciary duty law. The limitation and definition of these duties is permitted by the Delaware law governing limited partnerships. In addition, our partnership agreement restricts the remedies available to holders of our limited partner units for actions taken by our general partner that might otherwise constitute breaches of fiduciary duty. For example, our partnership agreement:
• | Permits our general partner to make a number of decisions in its individual capacity as opposed to in its capacity as our general partner. This entitles our general partner to consider only the interests and factors that it desires, and it has no duty or obligation to give any consideration to any interest of, or factors affecting, us, our affiliates or any limited partner. Examples include whether to exercise its limited call right, how to exercise its voting rights with respect to the units it owns, whether to exercise its registration rights, its determination whether or not to consent to any merger or consolidation of the partnership or amendment to the partnership agreement, |
36
whether to elect to reset target distribution levels, and how to allocate business opportunities among us and its affiliates;
• | Provides that our general partner will not have any liability to us or our unitholders for decisions made in its capacity as a general partner so long as it acted in good faith, meaning it believed the decision was in the best interests of our partnership; |
• | Generally provides that affiliate transactions and resolutions of conflicts of interest not approved by the conflicts committee of the board of directors of our general partner and not involving a vote of unitholders must be on terms no less favorable to us than those generally being provided to or available from unrelated third parties or be “fair and reasonable” to us, as determined by our general partner in good faith. In determining whether a transaction or resolution is “fair and reasonable,” our general partner may consider the totality of the relationships between the parties involved, including other transactions that may be particularly advantageous or beneficial to us; |
• | Provides that our general partner, its affiliates and their respective officers and directors will not be liable for monetary damages to us or our limited partners or assignees for any acts or omissions unless there has been a final and nonappealable judgment entered by a court of competent jurisdiction determining that our general partner or those other persons acted in bad faith or engaged in fraud or willful misconduct or, in the case of a criminal matter, acted with knowledge that such conduct was criminal; |
• | Provides that in resolving conflicts of interest, if Special Approval (as defined in our partnership agreement) is sought or if neither Special Approval nor unitholder approval is sought and the board of directors of our general partner determines that the resolution or course of action taken with respect to a conflict of interest satisfies certain standards set forth in our partnership agreement, it will be presumed that in making its decision our general partner or the conflicts committee of its board of directors acted in good faith, and in any proceeding brought by or on behalf of any limited partner or us, the person bringing or prosecuting such proceeding will have the burden of overcoming such presumption. |
Common unitholders are bound by the provisions in our partnership agreement, including the provisions discussed above.
Affiliates of our general partner, including Williams, are not limited in their ability to compete with us and may exclude us from opportunities with which they are involved. In addition, all of the executive officers and certain of the directors of our general partner are also officers and/or directors of Williams, and these persons will owe fiduciary duties to Williams.
While our relationship with Williams and its affiliates is a significant attribute, it is also a source of potential conflicts. For example, Williams and its affiliates are in the natural gas business and are not restricted from competing with us. Williams and its affiliates may acquire, construct or dispose of natural gas industry assets in the future, some or all of which may compete with our assets, without any obligation to offer us the opportunity to purchase or construct such assets. In addition, all of the executive officers and certain of the directors of our general partner are also officers and/or directors of Williams and certain of its affiliates and will owe fiduciary duties to those entities.
Holders of our common units have limited voting rights and are not entitled to elect our general partner or its directors, which could reduce the price at which the common units will trade.
Unlike the holders of common stock in a corporation, unitholders have only limited voting rights on matters affecting our business and, therefore, limited ability to influence management’s decisions regarding our business. Unitholders will have no right to elect our general partner or its board of directors on an annual or other continuing basis. The board of directors of our general partner, including the independent directors, will be chosen entirely by Williams and not by the unitholders. Unlike publicly traded corporations, we will not conduct annual meetings of our unitholders to elect directors or conduct other matters routinely conducted at annual meetings of stockholders. As a
37
result of these limitations, the price at which the common units will trade could be diminished because of the absence or reduction of a takeover premium in the trading price.
Cost reimbursements due to our general partner and its affiliates will reduce cash available to pay distributions to unitholders.
We will reimburse our general partner and its affiliates, including Williams, for various general and administrative services they provide for our benefit, including costs for rendering administrative staff and support services to us, and overhead allocated to us. Our general partner determines the amount of these reimbursements in its sole discretion. Payments for these services will be substantial and will reduce the amount of cash available for distributions to unitholders. In addition, under Delaware partnership law, our general partner has unlimited liability for our obligations, such as our debts and environmental liabilities, except for our contractual obligations that are expressly made without recourse to our general partner. To the extent our general partner incurs obligations on our behalf, we are obligated to reimburse or indemnify it. If we are unable or unwilling to reimburse or indemnify our general partner, our general partner may take actions to cause us to make payments of these obligations and liabilities. Any such payments could reduce the amount of cash otherwise available for distribution to our unitholders.
Even if public unitholders are dissatisfied, they have little ability to remove our general partner without the consent of Williams.
Unlike the holders of common stock in a corporation, unitholders have only limited voting rights on matters affecting our business and, therefore, limited ability to influence management’s decisions regarding our business. Unitholders have no right to elect our general partner or its board of directors on an annual or other continuing basis. The board of directors of our general partner is chosen by Williams. As a result of these limitations, the price at which our common units will trade could be diminished because of the absence or reduction of a takeover premium in the trading price.
Furthermore, if our public unitholders are dissatisfied with the performance of our general partner, they will have little ability to remove our general partner. The vote of the holders of at least 66 2/3 percent of all outstanding limited partner units is required to remove our general partner. Williams and its affiliates own approximately 74 percent of our outstanding limited partner units and, as a result, our public unitholders cannot remove our general partner without the consent of Williams.
The control of our general partner may be transferred to a third party without unitholder consent.
Our general partner may transfer its general partner interest to a third party in a merger or in a sale of all or substantially all of its assets without the consent of the unitholders. Furthermore, our partnership agreement effectively permits a change of control without unitholder consent. The new owner of our general partner would then be in a position to replace our general partner’s board of directors and officers with its own designees and thereby exert significant control over the decisions made by the board of directors and officers.
We may issue additional common units without unitholder approval, which would dilute unitholder ownership interests.
Our partnership agreement does not limit the number of additional limited partner interests that we may issue at any time without the approval of unitholders. The issuance by us of additional common units or other equity securities of equal or senior rank, or classes of securities which ultimately convert into common units, will have the following effects:
• | Our unitholders’ proportionate ownership interest in us will decrease; |
• | The amount of cash available to pay distributions on each unit may decrease; |
• | The ratio of taxable income to distributions may decrease; |
38
• | The relative voting strength of each previously outstanding unit may be diminished; |
• | The market price of the common units may decline. |
The existence and eventual sale of common units or securities convertible into common units, whether held by Williams or which may be issued in acquisitions and eligible for future sale, may adversely affect the price of our common units.
Williams holds common units and Class B units representing approximately 74 percent of our units outstanding. Williams may, from time to time, sell all or a portion of its common units. We may issue additional common units to unaffiliated third parties in connection with future acquisitions. Sales of substantial amounts of common units by Williams or third parties, or the anticipation of such sales, could lower the market price of our common units and may make it more difficult for us to sell our equity securities in the future at a time and at a price that we deem appropriate.
Our general partner has a limited call right that may require unitholders to sell their common units at an undesirable time or price.
Pursuant to our partnership agreement, if at any time our general partner and its affiliates own more than 85 percent of the common units, our general partner will have the right, but not the obligation, to acquire all, but not less than all, of the common units held by unaffiliated persons at a price not less than their then-current market price. Our general partner may assign this right to any of its affiliates or to us. As a result, nonaffiliated unitholders may be required to sell their common units at an undesirable time or price and may not receive any return on their investment. Such unitholders may also incur a tax liability upon a sale of their units. Our general partner is not obligated to obtain a fairness opinion regarding the value of the common units to be repurchased by it upon exercise of the limited call right. There is no restriction in our partnership agreement that prevents our general partner from exercising its call right. If our general partner exercised its limited call right, the effect would be to take us private and, if the units were subsequently deregistered under the Exchange Act, we would no longer be subject to the reporting requirements of such Act.
Our partnership agreement restricts the voting rights of unitholders owning 20 percent or more of our common units.
Our partnership agreement restricts unitholders’ voting rights by providing that any units held by a person that owns 20 percent or more of any class of units then outstanding, other than our general partner, its affiliates, their direct transferees and their indirect transferees approved by our general partner (which approval may be granted in its sole discretion) and persons who acquired such units with the prior approval of our general partner, cannot vote on any matter. The partnership agreement also contains provisions limiting the ability of unitholders to call meetings, to acquire information about our operations and to influence the manner or direction of management.
Your liability may not be limited if a court finds that unitholder action constitutes control of our business.
A general partner of a partnership generally has unlimited liability for the obligations of the partnership, except for those contractual obligations of the partnership that are expressly made without recourse to the general partner. Our partnership is organized under Delaware law and we conduct business in a number of other states. The limitations on the liability of holders of limited partner interests for the obligations of a limited partnership have not been clearly established in some of the other states in which we do business. You could be liable for any and all of our obligations as if you were a general partner if a court or government agency were to determine that:
• | We were conducting business in a state but had not complied with that particular state’s partnership statute; or |
39
• | Your rights to act with other unitholders to remove or replace the general partner, to approve some amendments to our partnership agreement or to take other actions under our partnership agreement constitute “control” of our business. |
Unitholders may have liability to repay distributions that were wrongfully distributed to them.
Under certain circumstances, unitholders may have to repay amounts wrongfully returned or distributed to them. Under Section 17-607 of the Delaware Revised Uniform Limited Partnership Act, we may not make a distribution to you if the distribution would cause our liabilities to exceed the fair value of our assets. Delaware law provides that for a period of three years from the date of the impermissible distribution, limited partners who received the distribution and who knew at the time of the distribution that it violated Delaware law will be liable to the limited partnership for the distribution amount. Substituted limited partners are liable for the obligations of the assignor to make contributions to the partnership that are known to the substituted limited partner at the time it became a limited partner and for unknown obligations if the liabilities could be determined from the partnership agreement. Liabilities to partners on account of their partnership interest and liabilities that are nonrecourse to the partnership are not counted for purposes of determining whether a distribution is permitted.
Tax Risks
Our tax treatment depends on our status as a partnership for U.S. federal income tax purposes, as well as our not being subject to a material amount of entity-level taxation by states and localities. If the Internal Revenue Service (IRS) were to treat us as a corporation for U.S. federal income tax purposes or if we were to become subject to a material amount of entity-level taxation for state or local tax purposes, then our cash available for distribution to unitholders would be substantially reduced.
The anticipated after-tax economic benefit of an investment in the common units depends largely on our being treated as a partnership for U.S. federal income tax purposes. Despite the fact that we are a limited partnership under Delaware law, we will be treated as a corporation for U.S. federal income tax purposes unless we satisfy a “qualifying income” requirement. Based upon our current operations, we believe we satisfy the qualifying income requirement. Failing to meet the qualifying income requirement or a change in current law could cause us to be treated as a corporation for U.S. federal income tax purposes or otherwise subject us to taxation as an entity.
If we were treated as a corporation for U.S. federal income tax purposes, we would pay U.S. federal income tax on our taxable income at the corporate tax rate, and we would also likely pay state and local income taxes at varying rates. Distributions to unitholders would generally be taxed again as corporate distributions, and no income, gains, losses, deductions, or credits would flow through to unitholders. Because a tax would be imposed upon us as a corporation, our cash available to pay distributions to unitholders would be substantially reduced. In addition, changes in current state law may subject us to additional entity-level taxation by individual states. Several states have been evaluating ways to subject partnerships to entity-level taxation through the imposition of state income, franchise or other forms of taxation. If any state were to impose a tax upon us as an entity, the cash available for distributions to unitholders would be reduced. Therefore, if we were treated as a corporation for U.S. federal income tax purposes or otherwise subjected to a material amount of entity-level taxation, there would be a material reduction in the anticipated cash flow and after-tax return to unitholders, likely causing a substantial reduction in the value of the common units.
The U.S. federal income tax treatment of publicly traded partnerships or an investment in our common units could be subject to potential legislative, judicial, or administrative changes and differing interpretations, possibly on a retroactive basis.
The present U.S. federal income tax treatment of publicly traded partnerships, including us, or an investment in our common units may be modified by administrative, legislative, or judicial interpretation at any time. For example, from time to time, the U.S. President and members of Congress have proposed and considered substantive changes to the existing U.S. federal income tax laws that would affect certain publicly traded partnerships. Further, Treasury Regulations under Section 7704(d)(1)(E) of the Internal Revenue Code that apply to taxable years beginning on or after January 19, 2017, interpret the scope of qualifying income requirements for publicly traded partnerships by providing
40
industry-specific guidance. We believe the income that we treat as qualifying satisfies the requirements under these regulations. However, there are no assurances that the regulations will not be revised to take a position that is contrary to our interpretation of current law.
Any modification to the U.S. federal income tax laws and interpretations thereof may or may not be applied retroactively and could make it more difficult or impossible to meet the exception for us to be treated as a partnership for U.S. federal income tax purposes. We are unable to predict whether any of these changes, or other proposals, will ultimately be enacted. Any such changes could negatively impact the value of an investment in our common units.
We prorate our items of income, gain, loss, and deduction between transferors and transferees of the common units each month based upon the ownership of the common units on the first day of each month, instead of the date a particular common unit is transferred. The IRS may challenge this treatment, which could change the allocation of items of income, gain, loss, and deduction among our unitholders.
We prorate our items of income, gain, loss, and deduction between transferors and transferees of the common units each month based upon the ownership of the common units on the first day of each month, instead of the date a particular common unit is transferred. Although Treasury Regulations allow publicly traded partnerships to use a similar monthly simplifying convention to allocate tax items among transferor and transferee unitholders, these regulations do not specifically authorize all aspects of the proration method we have adopted. If the IRS were to successfully challenge our proration method or new Treasury Regulations were issued, we may be required to change the allocation of items of income, gain, loss, and deduction among our unitholders.
An IRS contest of the U.S. federal income tax positions we take may adversely impact the market for the common units, and our cash available for distribution to our unitholders might be substantially reduced.
The IRS may adopt positions that differ from the U.S. federal income tax positions we take and the IRS’s positions may ultimately be sustained. It may be necessary to resort to administrative or court proceedings to sustain some or all of the positions we take. A court may not agree with some or all of the positions we take. Any contest with the IRS may materially and adversely impact the market for the common units and the price at which they trade. In addition, the costs of any contest with the IRS will result in a reduction in cash available to pay distributions to our unitholders and our general partner and thus will be borne indirectly by them.
Legislation applicable to partnership tax years beginning after 2017 alters the procedures for auditing large partnerships and for assessing and collecting taxes due (including penalties and interest) as a result of a partnership-level federal income tax audit. If the IRS makes audit adjustments to our partnership tax returns, to the extent possible under the new rules our general partner may elect to either pay the taxes (including any applicable penalties and interest) directly to the IRS in the year in which the audit is completed or, if we are eligible, issue a revised information statement to each unitholder and former unitholder with respect to an audited and adjusted partnership tax return. Although our general partner may elect to have our unitholders and former unitholders take such audit adjustment into account and pay any resulting taxes (including applicable penalties or interest) in accordance with their interests in us during the tax year under audit, there can be no assurance that such election will be practical, permissible or effective in all circumstances. If we make payments of taxes and any penalties and interest directly to the IRS in the year in which the audit is completed, our cash available for distribution to our unitholders might be substantially reduced, in which case our current unitholders may bear some or all of the tax liability resulting from such audit adjustment, even if the unitholders did not own units in us during the tax year under audit.
Unitholders will be required to pay taxes on their share of our income even if unitholders do not receive any cash distributions from us.
Because our unitholders will be treated as partners to whom we will allocate taxable income that could be different in amount than the cash we distribute, unitholders will be required to pay U.S. federal income taxes and, in some cases, state and local income taxes on their share of our taxable income, whether or not they receive cash distributions from us. Unitholders may not receive cash distributions from us equal to their share of our taxable income or even equal to the actual tax liability that results from their share of our taxable income.
41
The tax gain or loss on the disposition of the common units could be different than expected.
If a unitholder sells its common units, it will recognize gain or loss for U.S. federal income tax purposes equal to the difference between the amount realized and its tax basis in those common units. Prior distributions to a unitholder in excess of the total net taxable income that was allocated to a unitholder for a common unit, which decreased its tax basis in that common unit, will, in effect, become taxable income to the unitholder if the common unit is sold at a price greater than its tax basis in that common unit, even if the price the unitholder receives is less than the original cost. A substantial portion of the amount realized, regardless of whether such amount represents gain, may be taxed as ordinary income to the unitholder due to potential recapture items, including depreciation recapture. In addition, because the amount realized may include a unitholder’s share of our nonrecourse liabilities, if a unitholder sells its common units, the unitholder may incur a U.S. federal income tax liability in excess of the amount of cash it received from the sale.
Unitholders may be subject to limitations on their ability to deduct interest expense we incur.
Our ability to deduct business interest expense will be limited for federal income tax purposes to an amount equal to our business interest income and 30 percent of our “adjusted taxable income” during the taxable year computed without regard to any business interest income or expense, and in the case of taxable years beginning before 2022, any deduction allowable for depreciation, amortization, or depletion. Business interest expense that we are not entitled to fully deduct will be allocated to each unitholder as excess business interest and can be carried forward by the unitholder to successive taxable years and used to offset any excess taxable income allocated by us to the unitholder. Any excess business interest expense allocated to a unitholder will reduce the unitholder’s tax basis in its partnership interest in the year of the allocation even if the expense does not give rise to a deduction to the unitholder in that year.
Tax-exempt entities face unique tax issues from owning common units that may result in adverse tax consequences to them.
Investment in common units by tax-exempt entities, such as individual retirement accounts (IRAs), raise issues unique to them. For example, virtually all of our income allocated to the unitholders who are organizations that are exempt from U.S. federal income tax, including IRAs and other retirement plans, may be taxable to them as “unrelated business taxable income.” Tax-exempt entities with multiple unrelated trades or businesses cannot aggregate losses from one unrelated trade or business to offset income from another to reduce total unrelated business taxable income. As a result, it may not be possible for tax-exempt entities to utilize losses from an investment in us to offset unrelated business taxable income from another unrelated trade or business and vice versa.
Non-U.S. unitholders will be subject to federal income taxes and withholding with respect to income and gain from owning our common units.
Non-U.S. persons are generally taxed and subject to federal income tax filing requirements on income effectively connected with a U.S. trade or business. Income allocated to our unitholders and, under recently enacted legislation, any gain from the sale of our units will generally be considered to be “effectively connected” with a U.S. trade or business. As a result, distributions to a non-U.S. unitholder will be subject to withholding at the highest applicable effective tax rate and a non-U.S. unitholder who sells or otherwise disposes of a common unit will also be subject to federal income tax on the gain realized from the sale or disposition of that unit.
Recently enacted legislation also imposes a federal income tax withholding obligation of 10 percent of the amount realized upon a non-U.S. person’s sale or exchange of an interest in a partnership that is engaged in a U.S. trade or business. However, application of this withholding rule to dispositions of publicly traded partnership interests has been temporarily suspended by the IRS until regulations or other guidance have been issued. Non-U.S. persons should consult a tax advisor before investing in our common units.
42
We treat each purchaser of common units in the same calendar month as having the same tax benefits without regard to the actual common units purchased. The IRS may challenge this treatment, which could adversely affect the value of the common units.
Because we cannot match transferors and transferees of common units, we have adopted monthly purchase price allocation conventions and depreciation and amortization positions that may not conform to all aspects of applicable Treasury regulations. Our counsel is unable to opine as to the validity of such filing positions. A successful IRS challenge to those conventions could adversely affect the amount of U.S. federal income tax benefits available to unitholders. It also could affect the timing of these tax benefits or the amount of gain from the sale of common units and could have a negative impact on the value of the common units or result in audit adjustments to unitholder tax returns.
Unitholders will likely be subject to state and local taxes and return filing requirements as a result of investing in our common units.
In addition to U.S. federal income taxes, unitholders will likely be subject to other taxes, such as state and local income taxes, unincorporated business taxes and estate, inheritance, or intangible taxes that are imposed by the various jurisdictions in which we do business or own property, even if the unitholder does not live in any of those jurisdictions. Unitholders will likely be required to file state and local income tax returns and pay state and local income taxes in some or all of these various jurisdictions. Further, unitholders may be subject to penalties for failure to comply with those requirements. As we make acquisitions or expand our business, we may own assets or conduct business in additional states or foreign countries that impose a personal income tax or an entity level tax. It is the unitholder’s responsibility to file all U.S. federal, state, and local tax returns. Our counsel has not rendered an opinion on the state and local tax consequences of an investment in our common units.
We have adopted certain valuation methodologies in determining a unitholder’s allocations of income, gain, loss and deduction. The IRS may challenge these methodologies or the resulting allocations, and such a challenge could adversely affect the value of the common units.
In determining the items of income, gain, loss, and deduction allocable to our unitholders, we must routinely determine the fair market value of our respective assets. Although we may from time to time consult with professional appraisers regarding valuation matters, we make fair market value estimates using a methodology based on the market value of our common units as a means to measure the fair market value of our respective assets. The IRS may challenge these valuation methods and the resulting allocations of income, gain, loss and deduction.
A successful IRS challenge to these methods or allocations could adversely affect the amount, character, and timing of taxable income or loss being allocated to our unitholders. It also could affect the amount of gain from a unitholder’s sale of common units and could have a negative impact on the value of the common units or result in audit adjustments to the unitholder’s tax returns without the benefit of additional deductions.
A unitholder whose common units are loaned to a “short seller” to effect a short sale of common units may be considered as having disposed of those common units. If so, the unitholder would no longer be treated for U.S. federal income tax purposes as a partner with respect to those common units during the period of the loan and may recognize gain or loss from the disposition.
Because a unitholder whose common units are loaned to a “short seller” to effect a short sale of common units may be considered as having disposed of the loaned common units, the unitholder may no longer be treated for U.S. federal income tax purposes as a partner with respect to those common units during the period of the loan to the short seller and the unitholder may recognize gain or loss from such disposition. Moreover, during the period of the loan, items of our income, gain, loss, or deduction with respect to those common units may not be reportable by the unitholder and any cash distributions received by the unitholder as to those common units could be fully taxable as ordinary income. Our counsel has not rendered an opinion regarding the treatment of a unitholder whose common units are loaned to a short seller to effect a short sale of common units. Unitholders desiring to assure their status as partners and avoid the risk of gain recognition from a loan to a short seller are urged to consult a tax advisor to discuss whether
43
it is advisable to modify any applicable brokerage account agreements to prohibit their brokers from loaning their common units.
Item 1B. Unresolved Staff Comments
None.
Item 2. Properties
Please read “Business” for a description of the location and general character of our principal physical properties. We generally own our facilities, although a substantial portion of our pipeline and gathering facilities are constructed and maintained pursuant to rights-of-way, easements, permits, licenses, or consents on and across properties owned by others.
Item 3. Legal Proceedings
Environmental
Certain reportable legal proceedings involving governmental authorities under federal, state, and local laws regulating the discharge of materials into the environment are described below. While it is not possible for us to predict the final outcome of the proceedings which are still pending, we do not anticipate a material effect on our consolidated financial position if we receive an unfavorable outcome in any one or more of such proceedings.
On June 13, 2013, an explosion and fire occurred at our formerly owned Geismar olefins plant and rendered the facility temporarily inoperable (Geismar Incident). On October 21, 2013, the EPA issued an Inspection Report pursuant to the Clean Air Act’s Risk Management Program following its inspection of the facility on June 24 through June 28, 2013. The report notes the EPA’s preliminary determinations about the facility’s documentation regarding process safety, process hazard analysis, as well as operating procedures, employee training, and other matters. On June 16, 2014, we received a request for information related to the Geismar Incident from the EPA under Section 114 of the Clean Air Act to which we responded on August 13, 2014. The EPA could issue penalties pertaining to final determinations.
On February 21, 2017, we received notice from the Environmental Enforcement Section of the United States Department of Justice (DOJ) regarding certain alleged violations of the Clean Air Act at our Moundsville facility as set forth in a Notice of Noncompliance issued by the EPA on January 14, 2016. The notice includes an offer to avoid further legal action on the alleged violations by paying $2 million. In discussion with the DOJ and the EPA, the EPA has indicated its belief that additional similar violations have occurred at our Oak Grove facility and has expressed interest in pursuing a global settlement. On January 19, 2018, we received an offer from the DOJ to globally settle the government’s claim for civil penalties associated with the alleged violations at both the Moundsville and the Oak Grove facilities for $1.955 million. We are currently evaluating the penalty assessment and the proposed global settlement offer and will respond to the agencies.
On May 5, 2017, we entered into a Consent Order with the Georgia Department of Natural Resources, Environmental Protection Division (GADNR) pertaining to alleged violations of the Georgia Water Quality Control Act and associated rules arising from a permit issued by GADNR for construction of the Dalton Project. Pursuant to the Consent Order, we paid a fine of $168,750 and agreed to perform a Corrective Action Order to remedy the alleged violations.
On January 19, 2018, we received notice from the PHMSA regarding certain alleged violations of PHMSA regulations in connection with a fire and release of liquid ethane that occurred at our Houston Meter Station located near Houston, Washington County, PA on December 24, 2014. The Notice of Probable Violation and Proposed Civil Penalty issued by PHMSA alleges failure to timely notify the National Response Center of a release of a hazardous liquid resulting in a fire or explosion and failure to verify that the facility was constructed, inspected, tested, and calibrated in accordance with comprehensive written specifications or standards and proposes a total civil penalty of $174,100. We are currently evaluating the penalty assessment and will respond to the agency.
44
Other environmental matters called for by this Item are described under the caption “Environmental Matters” in Note 17 – Contingent Liabilities and Commitments of Notes to Consolidated Financial Statements included under Part II, Item 8 Financial Statements of this report, which information is incorporated by reference into this Item.
Other Litigation
The additional information called for by this Item is provided in Note 17 – Contingent Liabilities and Commitments of Notes to Consolidated Financial Statements included under Part II, Item 8 Financial Statements of this report, which information is incorporated by reference into this Item.
Item 4. Mine Safety Disclosures
Not applicable.
45
PART II
Item 5. Market for Registrant’s Common Equity, Related Stockholder Matters and Issuer Purchases of Equity Securities
Market Information, Holders, and Distributions
Our common units are listed on the New York Stock Exchange under the symbol “WPZ.” At the close of business on February 19, 2018, there were 957,529,465 common units outstanding, held by approximately 87 record holders, including common units held by an affiliate of Williams.
We also have issued 18,124,096 Class B units, for which there is no established public trading market. All of the Class B units are held by an affiliate of Williams. Class B units are entitled to paid-in-kind distributions.
For information regarding securities that may be issued under our Long-Term Incentive Plan (LTIP), please read the information under Item 12, which is incorporated by reference into this Item 5.
The following table sets forth, for the periods indicated, the high and low sales prices for our common units, as reported on the NYSE Composite Transactions Tape, and quarterly cash distributions paid to our unitholders.
High | Low | Cash Distribution per Unit (1) | |||
2017 | |||||
First Quarter | $42.32 | $37.98 | $0.60 | ||
Second Quarter | 42.25 | 36.25 | 0.60 | ||
Third Quarter | 41.59 | 37.02 | 0.60 | ||
Fourth Quarter | 40.06 | 34.74 | 0.60 | ||
2016 | |||||
First Quarter | $28.66 | $12.69 | $0.85 | ||
Second Quarter | 35.36 | 19.04 | 0.85 | ||
Third Quarter | 40.36 | 33.17 | 0.85 | ||
Fourth Quarter | 38.49 | 32.93 | 0.85 | ||
________
(1) | Represents cash distributions attributable to the quarter and declared and paid within 45 days after quarter end. |
Distributions of Available Cash
Within 45 days after the end of each quarter we distribute all of our available cash, as defined in our partnership agreement, to common unitholders of record on the applicable record date. Available cash generally means, for each fiscal quarter, all cash on hand at the end of the quarter:
• | Less the amount of cash reserves established by our general partner to: |
◦ | Provide for the proper conduct of our business (including reserves for future capital expenditures and for our anticipated credit needs); |
◦ | Comply with applicable law, any of our debt instruments or other agreements; or |
◦ | Provide funds for distribution to our unitholders for any one or more of the next four quarters; |
◦ | Plus all cash on hand on the date of determination of available cash for the quarter resulting from working capital borrowings made after the end of the quarter for which the determination is being made. Working capital borrowings are borrowings used solely for working capital purposes or to pay distributions made |
46
pursuant to a credit facility or other arrangement provided that, at the time incurred, the borrower’s intent is to repay such borrowings within 12 months from sources other than working capital borrowings.
In January 2017, we engaged in certain Financial Repositioning transactions (see Item 7. Management’s Discussion and Analysis of Financial Condition and Results of Operations) wherein Williams permanently waived the general partner’s incentive distribution rights and converted its 2 percent general partner interest in us to a non-economic interest.
The Class B units originated under ACMP and are not entitled to cash distributions. Instead, prior to conversion into common units, the Class B units receive quarterly distributions of additional paid-in-kind Class B units. Effective February 10, 2015, each Class B unit became convertible at the election of either us or the holders of such Class B unit into a common unit on a one-for-one basis.
The preceding discussion is based on the assumption that our general partner does not issue additional classes of equity securities.
47
Item 6. Selected Financial Data
The following financial data at December 31, 2017 and 2016, and for each of the three years in the period ended December 31, 2017, should be read in conjunction with Item 7, Management’s Discussion and Analysis of Financial Condition and Results of Operations and Item 8, Financial Statements and Supplementary Data of this Form 10-K. All other financial data has been prepared from our accounting records.
2017 | 2016 | 2015 | 2014 | 2013 | ||||||||||||||||
(Millions, except per-unit amounts) | ||||||||||||||||||||
Revenues (1) | $ | 8,010 | $ | 7,491 | $ | 7,331 | $ | 7,409 | $ | 6,835 | ||||||||||
Net income (loss) (1) (2) | 975 | 519 | (1,358 | ) | 1,284 | 1,119 | ||||||||||||||
Net income (loss) attributable to controlling interests (1) (2) | 871 | 431 | (1,449 | ) | 1,188 | 1,116 | ||||||||||||||
Net income (loss) per common unit (1) (2) | .90 | (.17 | ) | (3.27 | ) | .99 | 1.76 | |||||||||||||
Total assets at December 31 (1) | 45,903 | 46,265 | 47,870 | 49,248 | 23,513 | |||||||||||||||
Commercial paper and long-term debt due within one year at December 31 (3) | 501 | 878 | 675 | 802 | 225 | |||||||||||||||
Long-term debt at December 31 (1) | 15,996 | 17,685 | 19,001 | 16,252 | 8,999 | |||||||||||||||
Total equity at December 31 (1) | 23,689 | 23,203 | 24,606 | 28,685 | 11,567 | |||||||||||||||
Cash distributions declared per common unit | 2.650 | 3.400 | 3.400 | 3.642 | 3.415 | |||||||||||||||
____________
(1) | The increase in 2014 reflects the merger with ACMP. Because ACMP was under the common control of Williams, effective July 1, 2014, the merger was accounted for as a common control transaction, whereby ACMP’s assets and liabilities were combined with ours at Williams’ historical carrying values and the historical results of ACMP’s operations were combined with ours beginning with the date (July 1, 2014) Williams obtained control of ACMP. Net income (loss) per common unit was recast for years prior to 2014 to reflect the surviving entity’s equity structure. The 2014 increase in Long-term debt reflects $2.8 billion in issuances as well as $4.1 billion in debt assumed as the result of the merger with ACMP. |
(2) | Net income (loss): |
• | For 2017 includes $1.156 billion of impairments of certain assets, a $1.095 billion gain on the sale of our Geismar interest, and $713 million of regulatory charges resulting from Tax Reform; |
• | For 2016 includes a $457 million impairment of certain assets and a $430 million impairment of certain equity-method investments; |
• | For 2015 includes a $1.4 billion impairment of certain equity-method investments and a $1.1 billion impairment of goodwill. |
(3) | The increase in 2014 reflects borrowings under our commercial paper program, which was initiated in 2013. |
48
Item 7. Management’s Discussion and Analysis of Financial Condition and Results of Operations
General
We are an energy infrastructure master limited partnership focused on connecting North America’s significant hydrocarbon resource plays to growing markets for natural gas and NGLs through our gas pipeline and midstream businesses. WPZ GP LLC, a Delaware limited liability company wholly owned by Williams, is our general partner.
Our interstate natural gas pipeline strategy is to create value by maximizing the utilization of our pipeline capacity by providing high quality, low cost transportation of natural gas to large and growing markets. Our gas pipeline businesses’ interstate transmission and storage activities are subject to regulation by the FERC and as such, our rates and charges for the transportation of natural gas in interstate commerce, and the extension, expansion or abandonment of jurisdictional facilities and accounting, among other things, are subject to regulation. The rates are established through the FERC’s ratemaking process. Changes in commodity prices and volumes transported have limited near-term impact on these revenues because the majority of cost of service is recovered through firm capacity reservation charges in transportation rates.
The ongoing strategy of our midstream operations is to safely and reliably operate large-scale midstream infrastructure where our assets can be fully utilized and drive low per-unit costs. We focus on consistently attracting new business by providing highly reliable service to our customers. These services include natural gas gathering, processing, treating, and compression, NGL fractionation and transportation, crude oil production handling and transportation, marketing services for NGL, oil and natural gas, as well as storage facilities.
Consistent with the manner in which our chief operating decision maker evaluates performance and allocates resources, our reportable segments are Northeast G&P, Atlantic-Gulf, West, and NGL & Petchem Services, which are comprised of the following businesses:
• | Northeast G&P is comprised of our midstream gathering and processing businesses in the Marcellus Shale region primarily in Pennsylvania, New York, and West Virginia and the Utica Shale region of eastern Ohio, as well as a 66 percent interest in Cardinal (a consolidated entity), a 62 percent equity-method investment in UEOM, a 69 percent equity-method investment in Laurel Mountain, a 58 percent equity-method investment in Caiman II, and Appalachia Midstream Services, LLC, which owns equity-method investments with an approximate average 66 percent interest in multiple gas gathering systems in the Marcellus Shale (Appalachia Midstream Investments). |
• | Atlantic-Gulf is comprised of our interstate natural gas pipeline, Transco, and significant natural gas gathering and processing and crude oil production handling and transportation assets in the Gulf Coast region, including a 51 percent interest in Gulfstar One (a consolidated entity), which is a proprietary floating production system, and various petrochemical and feedstock pipelines in the Gulf Coast region, as well as a 50 percent equity-method investment in Gulfstream, a 60 percent equity-method investment in Discovery, and a 41 percent interest in Constitution (a consolidated entity), which is developing a pipeline project (see Note 3 – Variable Interest Entities of Notes to Consolidated Financial Statements). |
• | West is comprised of our interstate natural gas pipeline, Northwest Pipeline, and our gathering, processing and treating operations in New Mexico, Colorado, and Wyoming, as well as the Barnett Shale region of north-central Texas, the Eagle Ford Shale region of south Texas, the Haynesville Shale region of northwest Louisiana, and the Mid-Continent region which includes the Anadarko, Arkoma, Delaware, and Permian basins. This segment also includes our NGL and natural gas marketing business, storage facilities, an undivided 50 percent interest in an NGL fractionator near Conway, Kansas and a 50 percent equity-method investment in OPPL, as well as our previously owned 50 percent equity-method investment in the Delaware basin gas gathering system (DBJV) in the Mid-Continent region (see Note 6 – Investing Activities of Notes to Consolidated Financial Statements). |
• | NGL & Petchem Services is comprised of previously owned operations, including an 88.5 percent undivided interest in an olefins production facility in Geismar, Louisiana, which was sold in July 2017 (see Note 2 – |
49
Acquisitions and Divestitures of Notes to Consolidated Financial Statements), and a refinery grade propylene splitter in the Gulf region, which was sold in June 2017. This segment also includes our previously owned Canadian assets which included an oil sands offgas processing plant near Fort McMurray, Alberta, and a NGL/olefin fractionation facility at Redwater, Alberta. In September 2016, these Canadian operations were sold.
Financial Repositioning
In January 2017, we entered into agreements with Williams, wherein Williams permanently waived the general partner’s IDRs and converted its 2 percent general partner interest in us to a noneconomic interest in exchange for 289 million newly issued common units. Pursuant to this agreement, Williams also purchased approximately 277 thousand common units for $10 million. Additionally, Williams purchased approximately 59 million common units at a price of $36.08586 per unit in a private placement transaction. According to the terms of this agreement, concurrent with our quarterly distributions in February 2017 and May 2017, Williams paid additional consideration totaling $56 million to us for these units. Following these transactions and as of December 31, 2017, Williams owns a 74 percent limited partner interest in us.
Unless indicated otherwise, the following discussion and analysis of critical accounting estimates, results of operations, and financial condition and liquidity should be read in conjunction with the consolidated financial statements and notes thereto included in Part II, Item 8 of this report.
Distributions
On February 9, 2018, we paid a quarterly distribution of $0.60 per common unit to unitholders of record as of February 2, 2018.
Overview
Net income (loss) attributable to controlling interests for the year ended December 31, 2017, increased $440 million compared to the year ended December 31, 2016, reflecting the absence of $430 million of impairments of equity-method investments incurred in 2016, a $252 million increase in Other investing income (loss) – net primarily associated with the disposition of certain equity-method investments in 2017, and reduced interest expense, partially offset by a decrease of $264 million in operating income and an increase of $86 million in the provision for income taxes. The decrease in operating income is primarily due to a $699 million increase in Impairments of certain assets, $674 million of regulatory charges resulting from Tax Reform, and a $172 million decrease in product margins primarily due to the loss of olefins volumes as a result of the sales of our Gulf Olefins and Canadian operations, partially offset by a gain of $1.095 billion from the sale of our Geismar Interest and increased service revenue primarily associated with expansion projects.
Tax Reform
In December 2017, the Tax Cuts and Jobs Act was enacted, which, among other things, reduced the federal corporate income tax rate from 35 percent to 21 percent (Tax Reform) . Transco and Northwest Pipeline have recognized regulatory liabilities to reflect the probable return to customers through future rates of the future decrease in income taxes payable associated with Tax Reform. These liabilities represent an obligation to return amounts directly to our customers. The regulatory liabilities were recorded in December 2017 through regulatory charges to operating income totaling $674 million. (See Note 1 – General, Description of Business, Basis of Presentation, and Summary of Significant Accounting Policies of Notes to Consolidated Financial Statements.) The timing and actual amount of such return will be subject to future negotiations regarding this matter and many other elements of cost-of-service rate proceedings, including other costs of providing service.
Revenue Recognition
As a result of the adoption of Accounting Standards Update 2014-09, Revenues from Contracts with Customers (ASC 606), we expect that our 2018 revenues will increase in situations where we receive noncash consideration, which exists primarily in certain of our gas processing contracts where we receive commodities as full or partial consideration for services provided. This increase in revenues will be offset by a similar increase in costs and expenses when the
50
commodities received are subsequently sold. Based on commodities received during 2017 as consideration for services and market prices during 2017, we estimate the impact to revenues and costs would have been approximately $350 million.
Additionally, we expect future revenues will be impacted by application of the new accounting standard to certain contracts for which we received prepayments for services and have recorded deferred revenue (contract liabilities). For these contracts, which underwent modifications in periods prior to January 1, 2018, the modification is treated as a termination of the existing contract and the creation of a new contract. The new accounting guidance requires that the transaction price, including any remaining deferred revenue from the old contract, be allocated to the performance obligations over the term of the new contract. As a result, we will recognize the deferred revenue over longer periods than application of revenue recognition under accounting guidance prior to January 1, 2018. The application of ASC 606 to prior periods related to these contracts would have resulted in lower revenues in 2016 and 2017. Revenues will also be lower in 2018 and 2019 than what would have been recorded under the previous guidance, offset by increased revenues in later reporting periods given the longer period of recognition.
We are adopting ASC 606 utilizing the modified retrospective transition approach, effective January 1, 2018, by recognizing the cumulative effect of initially applying ASC 606 for periods prior to January 1, 2018, which we expect to result in a decrease of approximately $315 million to the opening balance of Total equity in the Consolidated Balance Sheet. This adjustment is primarily associated with the impact to the timing of deferred revenue (contract liabilities) for certain contracts as noted above.
Atlantic-Gulf
Virginia Southside II
In December 2017, the Virginia Southside II expansion project to the Transco system was placed into service. The project expanded Transco’s existing natural gas transmission system together with greenfield facilities to provide incremental firm transportation capacity from our Station 210 in New Jersey and our Station 165 in Virginia to a new lateral extending from our Brunswick Lateral in Virginia. The project increased capacity by 250 Mdth/d.
New York Bay Expansion
In October 2017, the New York Bay expansion to the Transco system was placed into service. The project expanded Transco’s existing natural gas transmission system to provide incremental firm transportation capacity from Station 195 in Pennsylvania to the Rockaway Delivery Lateral transfer point and the Narrows meter station in New York. The project increased capacity by 115 Mdth/d.
Dalton
In August 2017, the Dalton expansion to the Transco system was placed into service. This project expanded Transco’s existing natural gas transmission system together with greenfield facilities to provide incremental firm transportation capacity from our Station 210 in New Jersey to markets in northwest Georgia. On April 1, 2017, we began providing firm transportation service through the mainline portion of the project on an interim basis and we placed the full project into service in August 2017. The project increased capacity by 448 Mdth/d.
Hillabee
In July 2017, Phase I of the Hillabee Expansion Project was placed into service. The project involves an expansion of Transco’s existing natural gas transmission system from our Station 85 in west central Alabama to a new interconnection with the Sabal Trail pipeline in Alabama. The project will be constructed in phases, and all of the project expansion capacity is dedicated to Sabal Trail pursuant to a capacity lease agreement. We placed a portion of Phase I into service in June of 2017 and the remainder of Phase I into service in July of 2017. Phase I increased capacity by 818 Mdth/d. The in-service date of Phase II is planned for the second quarter of 2020 and together they are expected to increase capacity by 1,025 Mdth/d.
51
In March 2016, we entered into an agreement with the member-sponsors of Sabal Trail to resolve several matters. In accordance with the agreement, the member-sponsors paid us an aggregate amount of $240 million in three equal installments as certain milestones of the project were met. The first $80 million payment was received in March 2016, the second installment was received in September 2016 and the third installment was received in July 2017. We expect to recognize income associated with these receipts over the term of the capacity lease agreement.
In August 2017, the Court of Appeals for the District of Columbia Circuit granted an appeal of the FERC certificate order for the Southeast Market Pipelines projects (a group of related projects, including the Hillabee Expansion Project) filed by certain non-governmental organizations. In doing so, the court (i) remanded the matter to the FERC for preparation of an Environmental Impact Statement (EIS) that conforms with the court’s opinion regarding quantifying certain greenhouse gas emissions, and (ii) vacated the FERC’s certificate order for the projects, which would be effective following the court’s mandate (by court order, the mandate will not issue until after disposition of all petitions for rehearing). We, along with other intervenors, and the FERC filed petitions for rehearing with the court to overturn the remedy that would involve vacating the FERC certificate order, but on January 31, 2018 the court denied the petitions. In compliance with the court’s directive, on February 5, 2018, the FERC issued a Final Supplemental EIS for the projects, reaffirming that while the projects would result in temporary and permanent impacts on the environment, those impacts would not be significant. On February 6, 2018, we, along with other intervenors, and the FERC filed motions with the court to stay the issuance of the mandate in order to give the FERC time to re-issue the authorizations for the projects. The filing of the motions automatically stays the effectiveness of the court’s mandate. If the court’s mandate is issued prior to the FERC re-issuing the authorizations for the projects, we believe that the FERC will take the necessary steps (which may include issuing temporary certificate authority) to avoid any lapse in federal authorization for the projects.
West
Exchange of DBJV Interest
During the first quarter of 2017, we exchanged all of our 50 percent interest in DBJV for an increased interest in two natural gas gathering systems that are part of the Appalachia Midstream Investments and $155 million in cash. Appalachia Midstream Investments is part of our Northeast G&P segment. Following this exchange, we have an approximate average 66 percent interest in the Appalachia Midstream Investments. We also sold all of our interest in Ranch Westex JV LLC for $45 million. These transactions resulted in a total gain of $269 million reflected in Other investing income (loss) – net in the Consolidated Statement of Comprehensive Income (Loss) within the West segment. (See Note 6 – Investing Activities of Notes to Consolidated Financial Statements.)
NGL & Petchem Services
Geismar olefins facility monetization
In July 2017, we completed the sale of our Geismar Interest for $2.084 billion in cash. We received a final working capital adjustment of $12 million in October 2017. Additionally, we entered into a long-term supply and transportation agreement with the purchaser to provide feedstock to the plant via our Bayou Ethane pipeline system, which is expected to provide a long-term fee-based revenue stream. (See Note 2 – Acquisitions and Divestitures of Notes to Consolidated Financial Statements.)
Following this sale, the cash proceeds were used to repay our $850 million term loan. Proceeds have also been funding a portion of the capital and investment expenditures that are a part of our growth portfolio.
Commodity Prices
NGL per-unit margins were approximately 62 percent higher in 2017 compared to 2016 due to a 42 percent increase in per-unit non-ethane prices. The per-unit margin increase also reflects the absence of our former Canadian operations which had lower per-unit non-ethane margins in the prior year compared to our domestic operations. These favorable impacts were partially offset by an approximate 26 percent increase in per-unit natural gas feedstock prices.
52
NGL margins are defined as NGL revenues less any applicable Btu replacement cost, plant fuel, and third-party transportation and fractionation. Per-unit NGL margins are calculated based on sales of our own equity volumes at the processing plants. Our equity volumes include NGLs where we own the rights to the value from NGLs recovered at our plants under both “keep-whole” processing agreements, where we have the obligation to replace the lost heating value with natural gas, and “percent-of-liquids” agreements whereby we receive a portion of the extracted liquids with no obligation to replace the lost heating value.
The following graph illustrates the NGL production and sales volumes, as well as the margin differential between ethane and non-ethane products and the relative mix of those products.
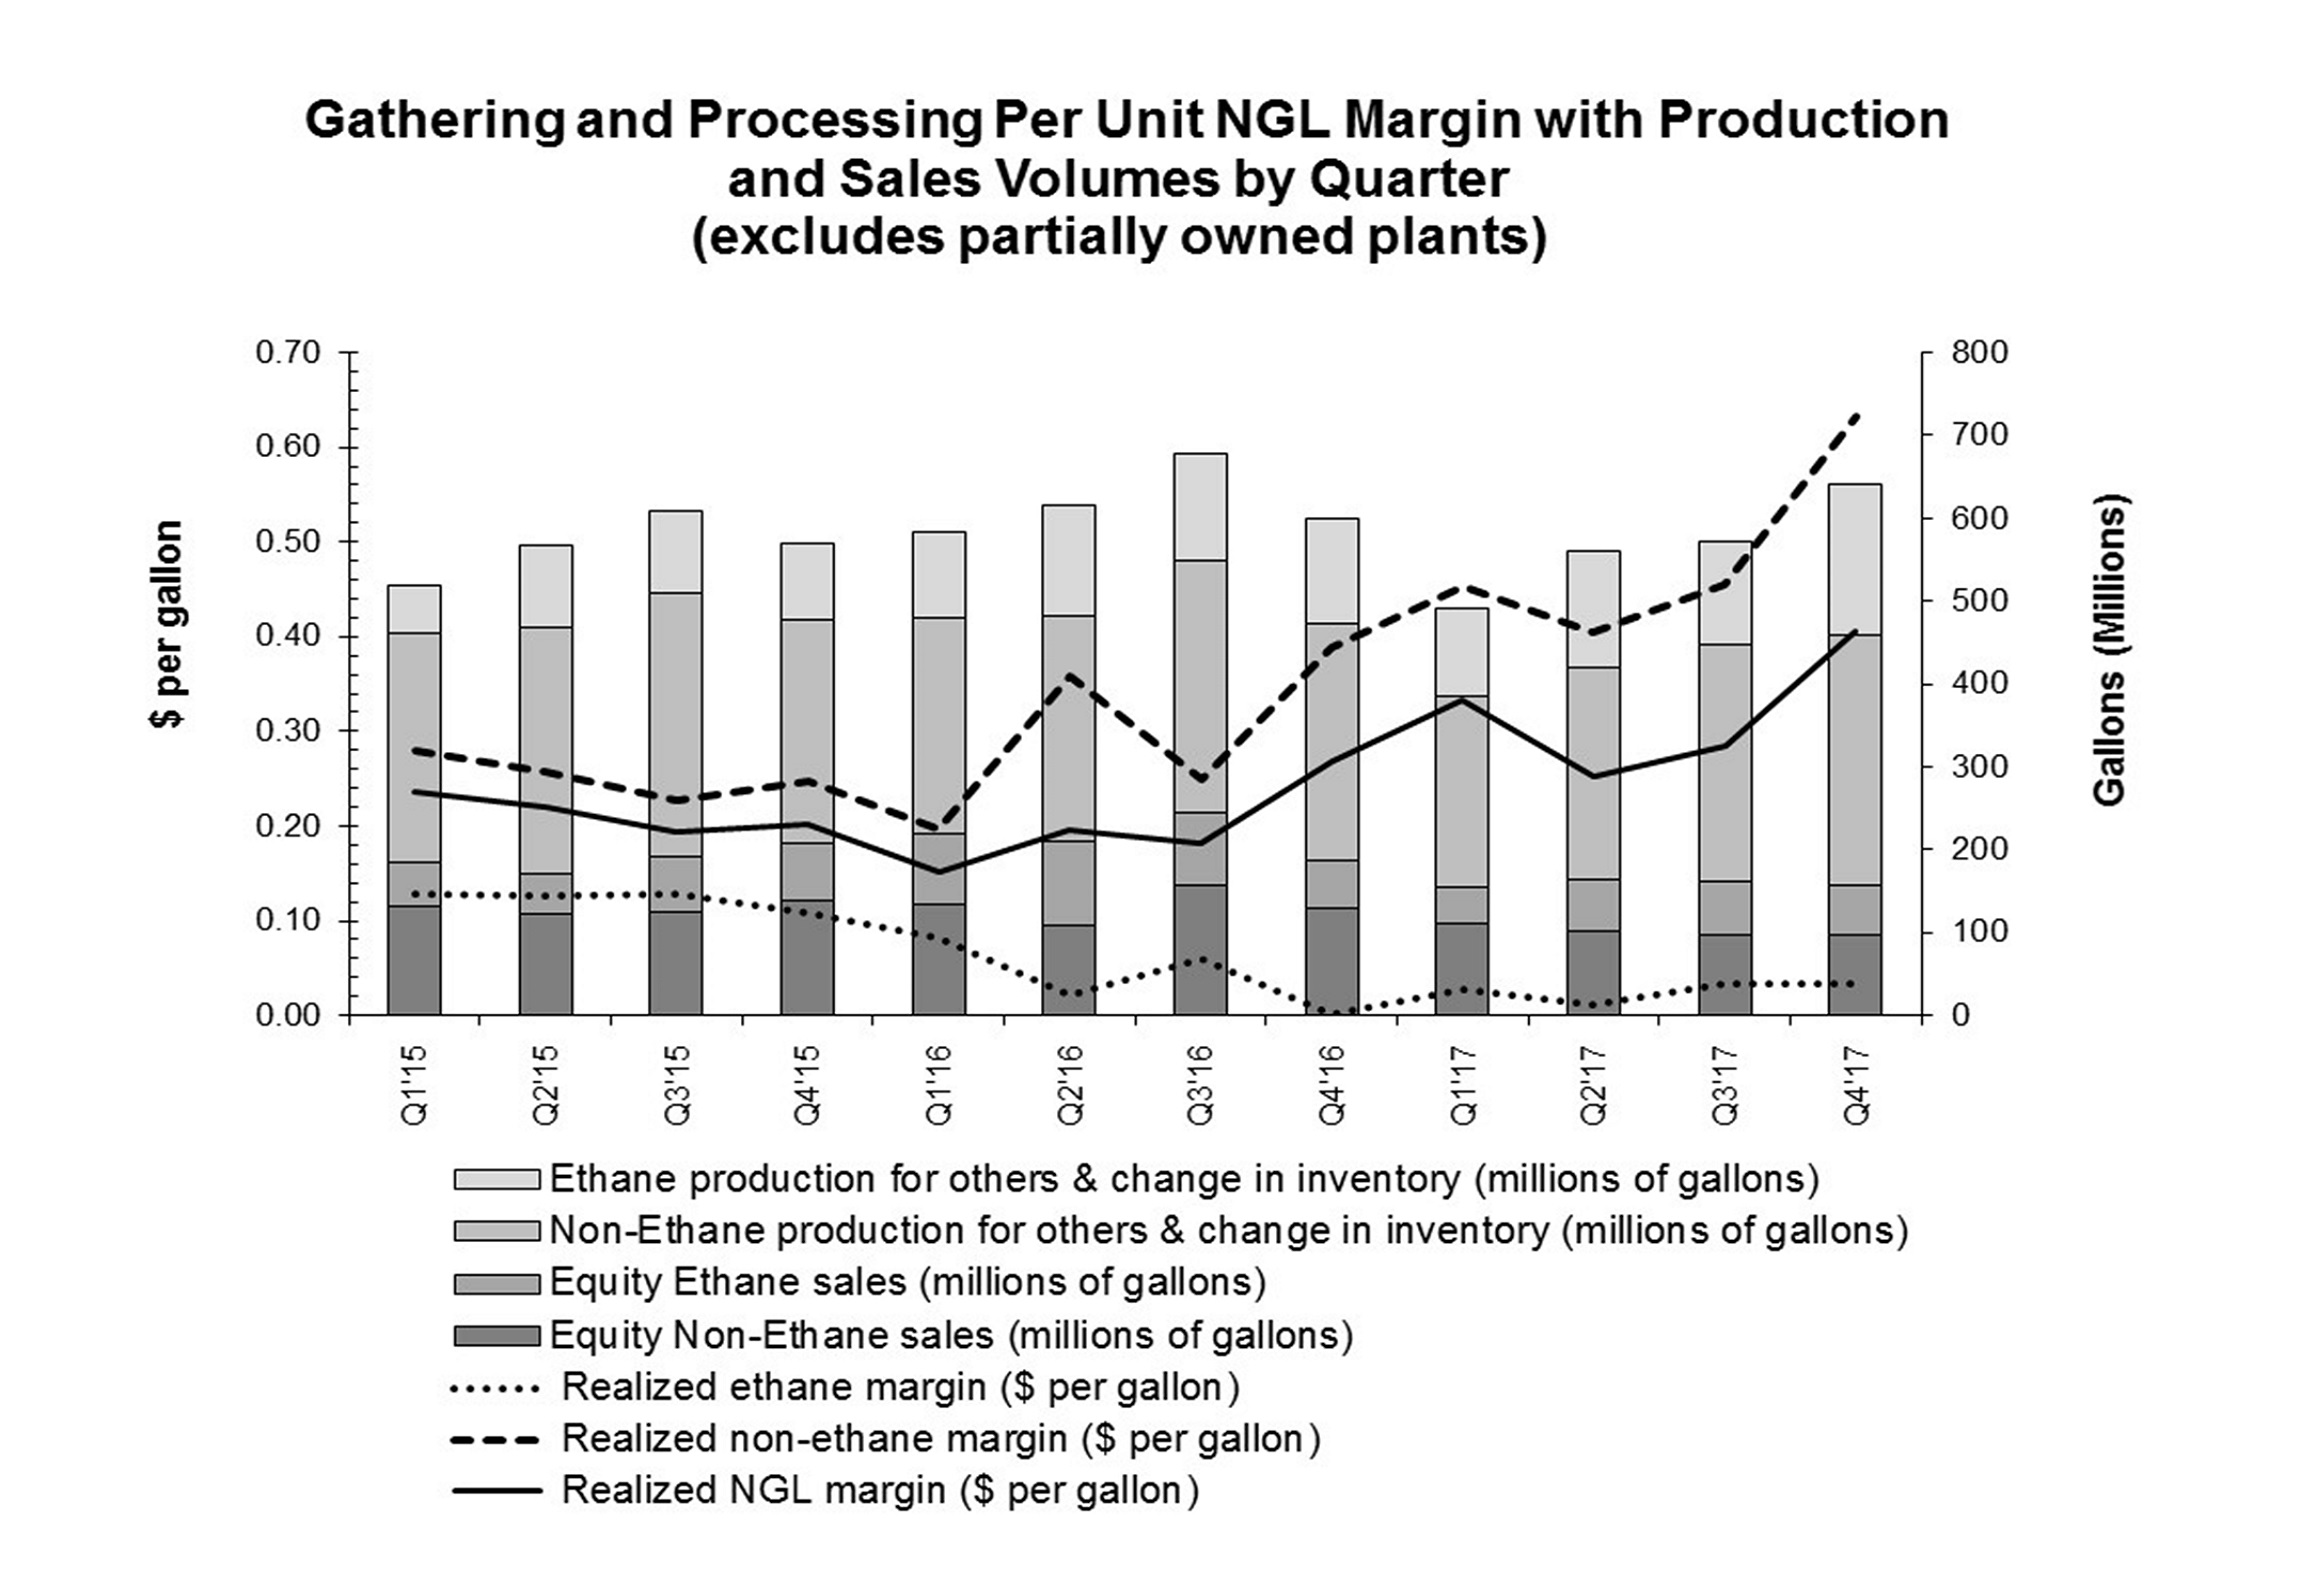 |
The potential impact of commodity prices on our business is further discussed in the following Company Outlook.
Company Outlook
Our strategy is to provide large-scale energy infrastructure designed to maximize the opportunities created by the vast supply of natural gas and natural gas products that exists in the United States. We accomplish this by connecting the growing demand for cleaner fuels and feedstocks with our major positions in the premier natural gas and natural gas products supply basins. We continue to maintain a strong commitment to safety, environmental stewardship, operational excellence, and customer satisfaction. We believe that accomplishing these goals will position us to deliver safe and reliable service to our customers and an attractive return to our unitholders.
Our business plan for 2018 includes a continued focus on growing our fee-based businesses, executing growth projects and accomplishing cost discipline initiatives to ensure operations support our strategy. We anticipate operating results will increase through organic business growth driven primarily by Transco expansion projects and continued growth in the Northeast region. We intend to fund planned growth capital with retained cash flow and debt, and based on currently forecasted projects, we do not expect to access public equity markets for the next several years.
53
Our growth capital and investment expenditures in 2018 are expected to be approximately $2.7 billion. Approximately $1.7 billion of our growth capital funding needs include Transco expansions and other interstate pipeline growth projects, most of which are fully contracted with firm transportation agreements. The remaining growth capital spending in 2018 primarily reflects investment in gathering and processing systems in the Northeast G&P segment limited primarily to known new producer volumes, including volumes that support Transco expansion projects including our Atlantic Sunrise project. In addition to growth capital and investment expenditures, we also remain committed to projects that maintain our assets for safe and reliable operations, as well as projects that meet legal, regulatory, and/or contractual commitments.
As a result of our significant continued capital and investment expenditures on Transco expansions and fee-based gathering and processing projects, fee-based businesses are a significant component of our portfolio and serve to reduce the influence of commodity price fluctuations on our operating results and cash flows. We expect to benefit as continued growth in demand for low-cost natural gas is driven by increases in LNG exports, industrial demand and power generation. For 2018, current forward market prices indicate oil prices are expected to be higher compared to 2017, while natural gas and NGL prices are expected to be lower or comparable with 2017. We continue to address certain pricing risks through the utilization of commodity hedging strategies. However, some of our customers may continue to curtail or delay drilling plans until there is a more sustained recovery in prices, which may negatively impact our gathering and processing volumes. The credit profiles of certain of our producer customers have been, and may continue to be, challenged as a result of lower energy commodity prices. Unfavorable changes in energy commodity prices or the credit profile of our producer customers may also result in noncash impairments of our assets.
In 2018, our operating results are expected to include increases from our regulated Transco fee-based business primarily related to projects recently placed in-service or expected to be placed in-service in 2018, including the Atlantic Sunrise project. For our non-regulated businesses, we anticipate increases in fee-based revenue in the Northeast G&P segment, partially offset by lower fee-based revenue in the West segment. As previously discussed, under the new accounting guidance for revenue recognition, deferred revenue under certain contracts will be recognized over longer periods than under the prior guidance, resulting in a decrease in revenue for the West segment. We expect overall gathering and processing volumes to grow in 2018 and increase thereafter to meet the growing demand for natural gas and natural gas products. We also anticipate lower general and administrative expenses due to the full year impact of prior year cost reduction initiatives.
Potential risks and obstacles that could impact the execution of our plan include:
• | Certain aspects of Tax Reform, including regulatory liabilities relating to reduced corporate federal income tax rates, could adversely impact the rates we can charge on our regulated pipelines; |
• | Opposition to infrastructure projects, including the risk of delay or denial in permits and approvals needed for our projects; |
•Unexpected significant increases in capital expenditures or delays in capital project execution;
•Counterparty credit and performance risk, including that of Chesapeake Energy Corporation and its affiliates;
• | Lower than anticipated demand for natural gas and natural gas products which could result in lower than expected volumes, energy commodity prices and margins; |
•General economic, financial markets, or further industry downturn, including increased interest rates;
•Physical damages to facilities, including damage to offshore facilities by named windstorms;
•Production issues impacting offshore gathering volumes;
• | Other risks set forth under Part I, Item 1A. Risk Factors in this report. |
54
We seek to maintain a strong financial position and liquidity, as well as manage a diversified portfolio of energy infrastructure assets which continue to serve key growth markets and supply basins in the United States.
Expansion Projects
Our ongoing major expansion projects include the following:
Northeast G&P
Ohio River Supply Hub Expansion
We agreed to expand our services to a customer to provide 660 MMcf/d of processing wet gas capacity in the Marcellus and Upper Devonian Shale in West Virginia. Associated with this agreement, we expect to further expand the processing capacity of our Oak Grove facility, which has the ability to increase capacity by an additional 1.8 Bcf/d. Additionally, with the same customer, we secured a gathering dedication agreement to gather dry gas in this same region. These expansions will be supported by long-term, fee-based agreements and volumetric commitments.
Susquehanna Supply Hub Expansion
The Susquehanna Supply Hub Expansion, which involves two new compression facilities with an additional 49,000 horsepower and 59 miles of 12 inch to 24 inch pipeline, is expected to increase gathering capacity, allowing a certain producer to fulfill its commitment to deliver 850 Mdth/d to our Atlantic Sunrise development. We placed a portion of this project into service in January 2018 and anticipate this expansion will be fully commissioned in the first quarter of 2018.
Atlantic-Gulf
Atlantic Sunrise
In February 2017, we received approval from the FERC to expand Transco’s existing natural gas transmission system along with greenfield facilities to provide incremental firm transportation capacity from the northeastern Marcellus producing area to markets along Transco’s mainline as far south as Station 85 in west central Alabama. We placed a portion of the mainline project facilities into service in September 2017 and it increased capacity by 400 Mdth/d. We plan to place the full project into service during mid-2018, assuming timely receipt of all remaining regulatory approvals. The full project is expected to increase capacity by 1,700 Mdth/d.
Constitution Pipeline
We currently own 41 percent of Constitution with three other parties holding 25 percent, 24 percent, and 10 percent, respectively. We are the operator of Constitution. The 126-mile Constitution pipeline is proposed to connect our gathering system in Susquehanna County, Pennsylvania, to the Iroquois Gas Transmission and Tennessee Gas Pipeline systems in New York, as well as to a local distribution company serving New York and Pennsylvania.
In December 2014, Constitution received approval from the FERC to construct and operate its proposed pipeline, which will have an expected capacity of 650 Mdth/d. However, in April 2016, the New York State Department of Environmental Conservation (NYSDEC) denied the necessary water quality certification under Section 401 of the Clean Water Act for the New York portion of the pipeline. In May 2016, Constitution appealed the NYSDEC’s denial of the Section 401 certification to the United States Court of Appeals for the Second Circuit and in August 2017, the court issued a decision denying in part and dismissing in part Constitution’s appeal. The court expressly declined to rule on Constitution’s argument that the delay in the NYSDEC’s decision on Constitution’s Section 401 application constitutes a waiver of the certification requirement. The court determined that it lacked jurisdiction to address that contention, and found that jurisdiction over the waiver issue lies exclusively with the United States Court of Appeals for the District of Columbia Circuit. As to the denial itself, the court determined that NYSDEC’s action was not arbitrary or capricious. Constitution filed a petition for rehearing with the Second Circuit Court of Appeals, but in October the court denied our petition.
55
In October 2017, we filed a petition for declaratory order requesting the FERC to find that, by operation of law, the Section 401 certification requirement for the New York State portion of Constitution’s pipeline project was waived due to the failure by the NYSDEC to act on Constitution’s Section 401 application within a reasonable period of time as required by the express terms of such statute. In January 2018, the FERC denied our petition, finding that Section 401 provides that a state waives certification only when it does not act on an application within one year from the date of the application.
The project’s sponsors remain committed to the project, and, in that regard, we are pursuing two separate and independent paths in order to overturn the NYSDEC’s denial of the Section 401 certification. In January 2018, we filed a petition with the United States Supreme Court to review the decision of the Second Circuit Court of Appeals that upheld the merits of the NYSDEC’s denial of the Section 401 certification. And, in February 2018, we filed a request with the FERC for rehearing of its finding that the NYSDEC did not waive the Section 401 certification requirement. If the FERC denies such request, we will file a petition for review with the D.C. Circuit Court of Appeals.
We estimate that the target in-service date for the project would be approximately 10 to 12 months following any court or FERC decision that the NYSDEC denial order was improper or that the NYSDEC waived the Section 401 certification requirement. (See Note 3 – Variable Interest Entities of Notes to Consolidated Financial Statements.)
Garden State
In April 2016, we received approval from the FERC to expand Transco’s existing natural gas transmission system to provide incremental firm transportation capacity from Station 210 in New Jersey to a new interconnection on our Trenton Woodbury Lateral in New Jersey. The project will be constructed in phases and is expected to increase capacity by 180 Mdth/d. We placed the initial phase of the project into service in September 2017 and plan to place the remaining portion of the project into service during the first quarter of 2018.
Gateway
In November 2017, we filed an application with the FERC to expand Transco’s existing natural gas transmission system to provide incremental firm transportation capacity from PennEast Pipeline Company's proposed interconnection with Transco’s mainline south of Station 205 in New Jersey to other existing Transco meter stations within New Jersey. We plan to place the project into service in the first quarter of 2021, assuming timely receipt of all necessary regulatory approvals. The project is expected to increase capacity by 65 Mdth/d.
Gulf Connector
In November 2017, we received approval from the FERC allowing Transco to expand its existing natural gas transmission system to provide incremental firm transportation capacity from Station 65 in Louisiana to delivery points in Wharton and San Patricio Counties, Texas. The project will be constructed in two phases and we plan to place both phases into service during the first half of 2019, assuming timely receipt of all necessary regulatory approvals. The project is expected to increase capacity by 475 Mdth/d.
Hillabee
In February 2016, the FERC issued a certificate order for the initial phases of Transco’s Hillabee Expansion Project. The project involves an expansion of Transco’s existing natural gas transmission system from Station 85 in west central Alabama to a new interconnection with the Sabal Trail pipeline in Alabama. The project will be constructed in phases, and all of the project expansion capacity will be leased to Sabal Trail. We placed a portion of Phase I into service in June of 2017 and the remainder of Phase I into service in July of 2017. Phase I increased capacity by 818 Mdth/d. The in-service date of Phase II is planned for the second quarter of 2020 and together they are expected to increase capacity by 1,025 Mdth/d. See Atlantic-Gulf within Overview.
56
Norphlet Project
In March 2016, we announced that we have reached an agreement to provide deepwater gas gathering services to the Appomattox development in the Gulf of Mexico. The project will provide offshore gas gathering services to our existing Transco lateral, which will provide transmission services onshore to our Mobile Bay processing facility. We also plan to make modifications to our Main Pass 261 Platform to install an alternate delivery route from the platform, as well as modifications to our Mobile Bay processing facility. The project is scheduled to go into service during the second half of 2019.
Northeast Supply Enhancement
In March 2017, we filed an application with the FERC to expand Transco’s existing natural gas transmission system to provide incremental firm transportation capacity from Station 195 in Pennsylvania to the Rockaway Delivery Lateral transfer point in New York. We plan to place the project into service in late 2019 or during the first half of 2020, assuming timely receipt of all necessary regulatory approvals. The project is expected to increase capacity by 400 Mdth/d.
Rivervale South to Market
In August 2017, we filed an application with the FERC to expand Transco’s existing natural gas transmission system to provide incremental firm transportation capacity from the existing Rivervale interconnection with Tennessee Gas Pipeline on Transco’s North New Jersey Extension to other existing Transco locations within New Jersey. We plan to place the project into service as early as the fourth quarter of 2019, assuming timely receipt of all necessary regulatory approvals. The project is expected to increase capacity by 190 Mdth/d.
West
North Seattle Lateral Upgrade
In May 2017, we filed an application with the FERC to expand delivery capabilities on Northwest Pipeline’s North Seattle Lateral. The project consists of the removal and replacement of approximately 5.9 miles of 8-inch diameter pipeline with new 20-inch diameter pipeline. We plan to place the project into service as early as the fourth quarter of 2019. The project is expected to increase capacity by up to 159 Mdth/d.
Critical Accounting Estimates
The preparation of financial statements in conformity with generally accepted accounting principles requires management to make estimates and assumptions. We believe that the nature of these estimates and assumptions is material due to the subjectivity and judgment necessary, or the susceptibility of such matters to change, and the impact of these on our financial condition or results of operations.
Property, Plant, and Equipment and Other Identifiable Intangible Assets
We evaluate our property, plant, and equipment and other identifiable intangible assets for impairment when events or changes in circumstances indicate, in our judgment, that the carrying value of such assets may not be recoverable. When an indicator of impairment has occurred, we compare our estimate of undiscounted future cash flows attributable to the assets to the carrying value of the assets to determine whether an impairment has occurred and we may apply a probability-weighted approach to consider the likelihood of different cash flow assumptions and possible outcomes including selling in the near term or holding for the remaining estimated useful life. If an impairment of the carrying value has occurred, we determine the amount of the impairment recognized by estimating the fair value of the assets and recording a loss for the amount that the carrying value exceeds the estimated fair value. This evaluation is performed at the lowest level for which separately identifiable cash flows exist.
During the third quarter of 2017, we received solicitations and engaged in negotiations for the sale of certain gas gathering assets within the Mid-Continent region. As a result of these events, we evaluated the Mid-Continent asset group, which includes property, plant, and equipment and intangible assets, for impairment. Our evaluation considered the likelihood of divesting certain assets within the Mid-Continent region as well as information developed from the
57
negotiation process that impacted our estimate of future cash flows associated with these assets. The estimated undiscounted future cash flows were determined to be below the carrying amount for these assets. We computed the estimated fair value using an income approach and incorporated market inputs based on ongoing negotiations for the potential sale of a portion of the underlying assets. For the income approach, we utilized a discount rate of 10.2 percent, reflecting an estimated cost of capital and risks associated with the underlying assets. As a result of this evaluation, we recorded an impairment charge of $1.019 billion for the difference between the estimated fair value and carrying amount of these assets.
Judgments and assumptions are inherent in estimating undiscounted future cash flows, fair values, and the probability-weighting of possible outcomes. The use of alternate judgments and assumptions could result in a different determination affecting the consolidated financial statements.
Equity-Method Investments
At December 31, 2017, our Consolidated Balance Sheet includes approximately $6.6 billion of investments that are accounted for under the equity-method of accounting. We evaluate these investments for impairment when events or changes in circumstances indicate, in our management’s judgment, that the carrying value of such investments may have experienced an other-than-temporary decline in value. We continue to monitor our equity-method investments for any indications that the carrying value may have experienced an other-than-temporary decline in value. When evidence of a loss in value has occurred, we compare our estimate of the fair value of the investment to the carrying value of the investment to determine whether an impairment has occurred. We generally estimate the fair value of our investments using an income approach where significant judgments and assumptions include expected future cash flows and the appropriate discount rate. In some cases, we may utilize a form of market approach to estimate the fair value of our investments.
If the estimated fair value is less than the carrying value and we consider the decline in value to be other-than-temporary, the excess of the carrying value over the fair value is recognized in the consolidated financial statements as an impairment charge. Events or changes in circumstances that may be indicative of an other-than-temporary decline in value will vary by investment, but may include:
• | A significant or sustained decline in the market value of an investee; |
• | Lower than expected cash distributions from investees; |
• | Significant asset impairments or operating losses recognized by investees; |
• | Significant delays in or lack of producer development or significant declines in producer volumes in markets served by investees; |
• | Significant delays in or failure to complete significant growth projects of investees. |
As of December 31, 2017, the carrying value of our equity-method investment in Discovery is $534 million. During the fourth quarter of 2017, certain customers of Discovery terminated a significant offshore gas gathering agreement following the shut-in of production after the associated wells ceased flowing. As a result, we evaluated this investment for impairment and determined that no impairment was necessary.
We estimated the fair value of our investment in Discovery using an income approach that primarily considered probability-weighted assumptions of additional commercial development, the continued operation of the business under existing contracts, and a discount rate of 11.3 percent. Higher probabilities were generally assigned to those commercial development opportunities that were more advanced in the discussion and contracting process, utilizing existing infrastructure due to producer capital constraints, and/or we believe Discovery has a competitive advantage due to geographical proximity to the prospect. The estimated fair value of our investment in Discovery exceeded its carrying value by approximately 6 percent and thus no impairment was necessary.
58
Judgments and assumptions are inherent in our estimates of future cash flows, discount rates, and additional development probabilities. It is reasonably possible that an impairment could be required in the future if commercial development activities are not as successful or as timely as assumed. The use of alternate judgments and assumptions could result in a different calculation of fair value, which could ultimately result in the recognition of an impairment charge in the consolidated financial statements.
Constitution Pipeline Capitalized Project Costs
As of December 31, 2017, Property, plant, and equipment – net in our Consolidated Balance Sheet includes approximately $381 million of capitalized project costs for Constitution, for which we are the construction manager and own a 41 percent consolidated interest. As a result of the events discussed in Company Outlook, we evaluated the capitalized project costs for impairment as recently as December 31, 2017, and determined that no impairment was necessary. Our evaluation considered probability-weighted scenarios of undiscounted future net cash flows, including scenarios assuming construction of the pipeline, as well as a scenario where the project does not proceed. These scenarios included our most recent estimate of total construction costs. The probability-weighted scenarios also considered our assessment of the likelihood of success of the two separate and independent paths to obtain necessary certification, as described in Company Outlook. It is reasonably possible that future unfavorable developments, such as a reduced likelihood of success, increased estimates of construction costs, or further significant delays, could result in a future impairment.
Regulatory Liabilities resulting from Tax Reform
In December 2017, Tax Reform was enacted, which, among other things, reduced the corporate income tax rate from 35 percent to 21 percent. Rates charged to customers of our regulated natural gas pipelines are subject to the rate-making policies of the FERC, which permit the recovery of an income tax allowance that includes a deferred income tax component. As a result of the reduced income tax rate from Tax Reform and the collection of historical rates that reflected historical federal income tax rates, we expect that our regulated natural gas pipelines will be required to return amounts to certain customers through future rates and have established regulatory liabilities accordingly. These liabilities were recorded in December 2017 through regulatory charges to operating income totaling $674 million. (See Note 1 – General, Description of Business, Basis of Presentation, and Summary of Significant Accounting Policies of Notes to Consolidated Financial Statements.) The timing and actual amount of such return will be subject to future negotiations regarding this matter and many other elements of cost–of–service rate proceedings, including other costs of providing service.
Our estimation of these regulatory liabilities incorporated the following significant judgments and assumptions involving income taxes collected from our customers.
• | We utilized current FERC guidance for the default income tax rate for non-corporate taxpayers, which is an element of our overall effective tax rate. It is possible that the FERC will provide updated implementation guidance in the future, including an updated default income tax rate for non-corporate taxpayers. We estimate that a decline of one percentage point in our assumed overall effective tax rate would increase our regulatory liabilities by approximately $42 million. |
• | We made assumptions regarding the allocation of our taxable income between corporate and non-corporate taxpayers. This allocation is subject to annual variation that could impact the weighted average federal tax component of the overall income tax allowance rate. |
• | We made assumptions regarding the allocation of our taxable income among the states in which we conduct business. This allocation is subject to annual variation that could impact the weighted average state tax component of the overall income tax allowance rate. It is possible that certain states may change their income tax laws and/or rates in the future in response to Tax Reform. |
• | In determining the estimated liability that we currently believe is probable of return to customers through future rates, we considered the mix of services provided by our regulated natural gas pipelines, taking into consideration that certain of these services are provided under contractually-based rates, in lieu of recourse- |
59
based rates. The contractually-based rates are designed to recover the cost of providing those services, with no expected future rate adjustment for the term of those contracts. We estimate that a one percent change in the relative mix of services would change the regulatory liability by approximately $8 million.
The use of alternative judgments and assumptions could result in the recognition of different regulatory liabilities and associated charges in the consolidated financial statements.
60
Results of Operations
Consolidated Overview
The following table and discussion is a summary of our consolidated results of operations for the three years ended December 31, 2017. The results of operations by segment are discussed in further detail following this consolidated overview discussion.
Years Ended December 31, | |||||||||||||||||||||||
2017 | $ Change from 2016* | % Change from 2016* | 2016 | $ Change from 2015* | % Change from 2015* | 2015 | |||||||||||||||||
(Millions) | |||||||||||||||||||||||
Revenues: | |||||||||||||||||||||||
Service revenues | $ | 5,292 | +119 | +2 | % | $ | 5,173 | +38 | +1 | % | $ | 5,135 | |||||||||||
Product sales | 2,718 | +400 | +17 | % | 2,318 | +122 | +6 | % | 2,196 | ||||||||||||||
Total revenues | 8,010 | 7,491 | 7,331 | ||||||||||||||||||||
Costs and expenses: | |||||||||||||||||||||||
Product costs | 2,300 | -572 | -33 | % | 1,728 | +51 | +3 | % | 1,779 | ||||||||||||||
Operating and maintenance expenses | 1,562 | -14 | -1 | % | 1,548 | +77 | +5 | % | 1,625 | ||||||||||||||
Depreciation and amortization expenses | 1,700 | +20 | +1 | % | 1,720 | -18 | -1 | % | 1,702 | ||||||||||||||
Selling, general, and administrative expenses | 610 | +20 | +3 | % | 630 | +54 | +8 | % | 684 | ||||||||||||||
Impairment of goodwill | — | — | — | % | — | +1,098 | +100 | % | 1,098 | ||||||||||||||
Impairment of certain assets | 1,156 | -699 | -153 | % | 457 | -312 | NM | 145 | |||||||||||||||
Gain on sale of Geismar Interest | (1,095 | ) | +1,095 | NM | — | — | — | % | — | ||||||||||||||
Regulatory charges resulting from Tax Reform | 674 | -674 | NM | — | — | — | % | — | |||||||||||||||
Insurance recoveries – Geismar Incident | (9 | ) | +2 | +29 | % | (7 | ) | -119 | -94 | % | (126 | ) | |||||||||||
Other (income) expense – net | 79 | +39 | +33 | % | 118 | -77 | -188 | % | 41 | ||||||||||||||
Total costs and expenses | 6,977 | 6,194 | 6,948 | ||||||||||||||||||||
Operating income (loss) | 1,033 | 1,297 | 383 | ||||||||||||||||||||
Equity earnings (losses) | 434 | +37 | +9 | % | 397 | +62 | +19 | % | 335 | ||||||||||||||
Impairment of equity-method investments | — | +430 | +100 | % | (430 | ) | +929 | +68 | % | (1,359 | ) | ||||||||||||
Other investing income (loss) – net | 281 | +252 | NM | 29 | +27 | NM | 2 | ||||||||||||||||
Interest expense | (822 | ) | +94 | +10 | % | (916 | ) | -105 | -13 | % | (811 | ) | |||||||||||
Other income (expense) – net | 55 | -7 | -11 | % | 62 | -31 | -33 | % | 93 | ||||||||||||||
Income (loss) before income taxes | 981 | 439 | (1,357 | ) | |||||||||||||||||||
Provision (benefit) for income taxes | 6 | -86 | NM | (80 | ) | +81 | NM | 1 | |||||||||||||||
Net income (loss) | 975 | 519 | (1,358 | ) | |||||||||||||||||||
Less: Net income attributable to noncontrolling interests | 104 | -16 | -18 | % | 88 | +3 | +3 | % | 91 | ||||||||||||||
Net income (loss) attributable to controlling interests | $ | 871 | $ | 431 | $ | (1,449 | ) | ||||||||||||||||
_________
* | + = Favorable change; - = Unfavorable change; NM = A percentage calculation is not meaningful due to a change in signs, a zero-value denominator, or a percentage change greater than 200. |
2017 vs. 2016
Service revenues increased due to higher transportation fee revenues at Transco and in the eastern Gulf reflecting expansion projects placed in-service in 2016 and 2017; partially offset by a decrease in gathering, processing, and fractionation revenue including lower rates, primarily in the Barnett Shale region associated with the restructuring of
61
contracts in the fourth quarter of 2016; lower volumes in the western regions, driven by natural declines and extreme weather conditions in the Rocky Mountains in 2017; and the sale of our former Canadian and Gulf Olefins operations.
Product sales increased primarily due to higher marketing revenues reflecting significantly higher prices and volumes. Revenues from the sale of our equity NGLs increased primarily due to higher non-ethane NGL prices, partially offset by lower volumes. These increases were partially offset by lower olefin production sales due to lower volumes resulting from the sales of our former Gulf Olefins and Canadian operations.
The increase in Product costs is primarily due to the same factors that increased marketing sales, partially offset by lower olefin feedstock purchases associated with the sales of our Gulf Olefins and Canadian operations.
Operating and maintenance expenses increased primarily due to higher pipeline integrity testing and general maintenance at Transco and a settlement charge from a pension early payout program (see Note 9 – Benefit Plans of Notes to Consolidated Financial Statements), partially offset by the absence of costs associated with our former Canadian and Gulf Olefins operations and lower labor-related costs resulting from our workforce reductions that occurred late in first-quarter 2016, and ongoing cost containment efforts.
Depreciation and amortization expenses decreased primarily due to the absence of our former Canadian and Gulf Olefins operations, partially offset by new assets placed in-service.
Selling, general, and administrative expenses (SG&A) decreased primarily due to the absence of costs associated with our former Canadian and Gulf Olefins operations, lower labor-related costs resulting from our workforce reductions that occurred late in first-quarter 2016, and ongoing cost containment efforts. These decreases are partially offset by higher costs in 2017 related to severance, primarily associated with our Other segment, and organizational realignment, as well as a settlement charge from a pension early payout program.
The unfavorable change in Impairment of certain assets primarily reflects the 2017 impairment of certain gathering operations in the Mid-Continent and Marcellus South regions, partially offset by the absence of 2016 impairments of our former Canadian operations and certain Mid-Continent assets (see Note 16 – Fair Value Measurements, Guarantees, and Concentration of Credit Risk of Notes to Consolidated Financial Statements).
The Gain on sale of Geismar Interest reflects the gain recognized on the sale of our Geismar Interest in July 2017. (See Note 2 – Acquisitions and Divestitures of Notes to Consolidated Financial Statements).
The Regulatory charges resulting from Tax Reform relates to the recognition of regulatory liabilities for the probable return to customers through future rates of the future decrease in income taxes payable associated with Tax Reform. (See Note 1 – General, Description of Business, Basis of Presentation, and Summary of Significant Accounting Policies of Notes to Consolidated Financial Statements).
The favorable change in Other (income) expense – net within Operating income (loss) is primarily due to the absence of the 2016 loss on the sale of our Canadian operations, gains from certain contract settlements and terminations in 2017, a gain on the sale of our RGP Splitter in 2017, and the absence of an unfavorable change in foreign currency exchange associated with our former Canadian operations. These favorable changes are partially offset by additional expense associated with an annual revision to the ARO liability and the accrual of additional expenses in 2017 related to the Geismar Incident.
Operating income (loss) changed unfavorably primarily due to a regulatory charge resulting from Tax Reform, 2017 impairments of certain gathering operations in the Mid-Continent and Marcellus South regions, the absence of operating income associated with our former Gulf Olefins operations, and a settlement charge from a pension early payout program. These unfavorable changes were partially offset by the Gain on sale of Geismar Interest, the absence of the 2016 impairments of our former Canadian operations and certain Mid-Continent assets, higher service revenues primarily from expansion projects placed in-service in 2016 and 2017, as well as ongoing cost containment efforts, including the workforce reductions in first-quarter 2016. Operating income (loss) also improved due to absence of the 2016 loss on the sale of our Canadian operations, the absence of an operating loss associated with our former Canadian operations, gains from certain contract settlements and the sale of our RGP Splitter.
62
The favorable change in Equity earnings (losses) is due to an increase in ownership of our Appalachia Midstream Investments and improved results at Aux Sable due to favorable pricing and higher volumes, partially offset by lower UEOM results driven by lower processing volumes from the Utica gathering system and lower Discovery results due to lower volumes.
The decrease in Impairment of equity-method investments reflects the absence of 2016 impairment charges associated with our Appalachia Midstream Investments, DBJV, Laurel Mountain, and Ranch Westex equity-method investments. (See Note 16 – Fair Value Measurements, Guarantees, and Concentration of Credit Risk of Notes to Consolidated Financial Statements.)
Other investing income (loss) – net reflects the gain on disposition of our investments in DBJV and Ranch Westex JV LLC in 2017, partially offset by the absence of a 2016 gain on the sale of an equity-method investment interest in a gathering system that was part of our Appalachia Midstream Investments gathering system. (See Note 6 – Investing Activities of Notes to Consolidated Financial Statements.)
Interest expense decreased due to lower Interest incurred primarily attributable to debt retirements and the absence of borrowings on our credit facility in 2017. (See Note 13 – Debt, Banking Arrangements, and Leases of Notes to Consolidated Financial Statements.)
Other income (expense) – net below Operating income (loss) changed unfavorably primarily due to $39 million of regulatory charges resulting from Tax Reform, offset by a net gain on early debt retirements in 2017, which is included in our Other segment. (See Note 7 – Other Income and Expenses of Notes to Consolidated Financial Statements.)
Provision (benefit) for income taxes changed unfavorably primarily due to the absence of a 2016 income tax benefit associated with the impairment of our former Canadian operations. See Note 8 – Provision (Benefit) for Income Taxes of Notes to Consolidated Financial Statements for a discussion of the effective tax rates compared to the federal statutory rate for both periods.
The unfavorable change in Net income (loss) attributable to noncontrolling interests is primarily due to improved results in our Gulfstar operations, partially offset by lower results for our Cardinal gathering system.
2016 vs. 2015
Service revenues increased primarily due to expansion projects placed in service in 2015 and 2016, including those associated with Transco’s natural gas transportation system and new transportation and fractionation revenue associated with Williams’ Horizon liquids extraction plant in Canada. The Canadian operations were sold in late September 2016. These increases were partially offset by a decrease in gathering, processing, and fractionation revenue primarily due to lower volumes primarily in the Barnett Shale and Anadarko basin.
Product sales increased primarily due to higher olefins sales reflecting increased volumes at our former Geismar plant as a result of the plant operating at higher production levels in 2016, partially offset by lower olefin sales from other olefin operations associated with lower volumes and per-unit sales prices. Product sales also reflect higher marketing revenues associated with higher NGL and propylene prices and natural gas and crude oil volumes, partially offset by lower NGL volumes and crude oil prices.
The decrease in Product costs includes lower olefin feedstock purchases and lower costs associated with other product sales, partially offset by higher marketing purchases primarily due to the same factors that increased marketing sales. The decline in olefin feedstock purchases is primarily associated with lower per-unit feedstock costs and volumes at our other olefin operations, partially offset by an increase in olefin feedstock purchases at our former Geismar plant reflecting increased volumes resulting from higher production levels in 2016.
Operating and maintenance expenses decreased primarily due to lower labor-related and outside service costs resulting from our first-quarter 2016 workforce reductions and cost containment efforts, lower costs associated with general maintenance activities in the Marcellus Shale, as well as the absence of ACMP transition-related costs recognized in 2015. These decreases are partially offset by $16 million of severance and related costs recognized in 2016 and higher pipeline testing and general maintenance costs at Transco.
63
Depreciation and amortization expenses increased primarily due to depreciation on new assets placed in service, including Transco pipeline projects, partially offset by lower depreciation related to Canadian operations sold in 2016.
SG&A decreased primarily due to the absence of ACMP merger and transition-related costs recognized in 2015 and lower labor-related costs resulting from our first-quarter 2016 workforce reductions and cost containment efforts, partially offset by $21 million of severance and related costs recognized in 2016.
Impairment of goodwill decreased due to the absence of a 2015 impairment charge associated with certain goodwill. (See Note 16 – Fair Value Measurements, Guarantees, and Concentration of Credit Risk of Notes to Consolidated Financial Statements.)
Impairment of certain assets reflects 2016 impairments of our former Canadian operations, certain Mid-Continent assets, and other assets. Impairments recognized in 2015 relate primarily to previously capitalized development costs and surplus equipment write-downs. (See Note 16 – Fair Value Measurements, Guarantees, and Concentration of Credit Risk of Notes to Consolidated Financial Statements.)
Insurance recoveries – Geismar Incident changed unfavorably reflecting the receipt of $126 million of insurance proceeds in the second quarter of 2015, as compared to the receipt of $7 million of proceeds in the fourth quarter of 2016.
The unfavorable change in Other (income) expense – net within Operating income (loss) includes a loss on the sale of our Canadian operations that were sold in September 2016, project development costs at Constitution as we discontinued capitalization of these costs in April 2016, and an unfavorable change in foreign currency exchange that primarily relates to losses incurred on foreign currency transactions and the remeasurement of the U.S. dollar-denominated current assets and liabilities within our former Canadian operations.
Operating income (loss) changed favorably primarily due to the absence of a goodwill impairment in 2015, higher olefin margins related to the Geismar plant operating at higher production levels in 2016, lower costs related to the merger and integration of ACMP, lower costs and expenses associated with cost containment efforts, and higher service revenues reflecting new projects placed in service in 2015 and 2016. These favorable changes are partially offset by higher impairments of assets and loss on sale of certain assets in 2016, a decrease in insurance proceeds received, and higher depreciation expenses related to new projects placed in service.
Equity earnings (losses) changed favorably primarily due to a $30 million increase at Discovery driven by the completion of the Keathley Canyon Connector in the first quarter of 2015. Additionally, equity earnings from OPPL, Laurel Mountain, and DBJV improved $16 million, $11 million, and $10 million, respectively.
Impairment of equity-method investments reflects 2016 impairment charges associated with Appalachia Midstream Investments, DBJV, Laurel Mountain and Ranch Westex equity-method investments, while the 2015 impairment charges relate to our equity-method investments in Appalachia Midstream Investments, DBJV, UEOM, and Laurel Mountain. (See Note 6 – Investing Activities of Notes to Consolidated Financial Statements.)
Other investing income (loss) – net reflects a 2016 gain on the sale of an equity-method investment interest in a gathering system that was part of our Appalachia Midstream Investments. (See Note 6 – Investing Activities of Notes to Consolidated Financial Statements.)
Interest expense increased due to higher Interest incurred of $85 million primarily attributable to new debt issuances in 2016 and 2015, as well as lower Interest capitalized of $20 million primarily related to construction projects that have been placed into service, partially offset by lower interest due to 2015 and 2016 debt retirements. (See Note 13 – Debt, Banking Arrangements, and Leases of Notes to Consolidated Financial Statements.)
Other income (expense) – net below Operating income (loss) changed unfavorably primarily due to a decrease in allowance for equity funds used during construction (AFUDC) due to decreased spending on Constitution and the absence of a $14 million gain on early debt retirement in 2015.
64
Provision (benefit) for income taxes changed favorably primarily due to lower foreign pre-tax income associated with our former Canadian operations. See Note 8 – Provision (Benefit) for Income Taxes of Notes to Consolidated Financial Statements for a discussion of the effective tax rates compared to the federal statutory rate for both years.
The favorable change in Net income attributable to noncontrolling interests is primarily due to project development costs for Constitution, partially offset by the absence of a 2015 goodwill impairment at Cardinal.
Year-Over-Year Operating Results – Segments
We evaluate segment operating performance based upon Modified EBITDA. Note 18 – Segment Disclosures of Notes to Consolidated Financial Statements includes a reconciliation of this non-GAAP measure to Net income (loss). Management uses Modified EBITDA because it is an accepted financial indicator used by investors to compare company performance. In addition, management believes that this measure provides investors an enhanced perspective of the operating performance of our assets. Modified EBITDA should not be considered in isolation or as a substitute for a measure of performance prepared in accordance with GAAP.
Northeast G&P
Years Ended December 31, | |||||||||||
2017 | 2016 | 2015 | |||||||||
(Millions) | |||||||||||
Service revenues | $ | 872 | $ | 870 | $ | 823 | |||||
Product sales | 291 | 162 | 128 | ||||||||
Segment revenues | 1,163 | 1,032 | 951 | ||||||||
Product costs | (286 | ) | (159 | ) | (121 | ) | |||||
Other segment costs and expenses | (386 | ) | (364 | ) | (387 | ) | |||||
Impairment of certain assets | (124 | ) | (13 | ) | (32 | ) | |||||
Proportional Modified EBITDA of equity-method investments | 452 | 357 | 359 | ||||||||
Northeast G&P Modified EBITDA | $ | 819 | $ | 853 | $ | 770 | |||||
2017 vs. 2016
Modified EBITDA decreased primarily due to higher Impairment of certain assets and Other segment costs and expenses, partially offset by higher Proportional Modified EBITDA of equity-method investments.
Service revenues increased slightly reflecting:
• | A $38 million increase in gathering fee revenue at Susquehanna Supply Hub driven by 11 percent higher gathered volumes reflecting increased customer production; |
• | A $23 million increase in fee revenue at Ohio Valley Midstream reflecting the absence of shut-in volumes from the first half of 2016, as well as new production coming online; |
• | A $56 million decrease in Utica gathering fee revenues primarily due to 14 percent lower gathered volumes driven by natural declines in the wet gas areas, partially offset by higher volumes from new development in the dry gas areas. |
Product sales increased primarily due to higher non-ethane and ethane prices and higher non-ethane volumes within our marketing activities. The changes in marketing revenues are offset by similar changes in marketing purchases, reflected above as Product costs.
Other segment costs and expenses increased due to a $31 million increase in operating and maintenance expenses primarily resulting from higher costs related to various maintenance expenses and ad valorem taxes, and $7 million
65
related to a settlement charge from a pension early payout program (see Note 9 – Benefit Plans of Notes to Consolidated Financial Statements). These increases are partially offset by $16 million lower general and administrative expenses primarily due to a reduced share of allocated support costs, ongoing cost containment efforts, and 2016 workforce reductions.
Impairment of certain assets increased primarily due to a $115 million impairment of certain gathering operations in the Marcellus South region.
Proportional Modified EBITDA of equity-method investments changed favorably primarily due to a $100 million increase at Appalachia Midstream Investments reflecting our increased ownership acquired late in the first quarter of 2017 and higher gathering volumes reflecting the absence of shut-in volumes from 2016 and increased customer production, a $20 million increase at Aux Sable due to increased customer production and the absence of the $9 million impairment in 2016, an $8 million increase at Laurel Mountain Midstream associated with higher gathering revenue due to higher rates reflecting higher natural gas prices, partially offset by a $34 million decrease at UEOM driven by lower processing volumes from the wet gas areas of the Utica gathering system as noted above.
2016 vs. 2015
Modified EBITDA increased primarily due to higher service revenues, lower operating and maintenance expenses, and lower impairment charges.
Service revenues include a $27 million increase in Susquehanna Supply Hub gathering revenues resulting from fewer producer shut-ins associated with improved regional natural gas prices. In addition, revenues associated with compression and reimbursements for management services from certain equity-method investees also contributed to increased service revenues. These increases were partially offset by a $19 million decrease from our Ohio Valley Midstream operations primarily associated with lower volumes and rates driven by producer shut-ins and temporarily reduced gathering and processing rates with certain producers.
Product sales increased primarily due to $33 million higher marketing sales associated with our Ohio Valley Midstream operations, due primarily to higher non-ethane marketing sales prices, partially offset by lower non-ethane volumes. The changes in marketing revenues are offset by similar changes in marketing purchases, reflected above as Product costs.
Product costs increased primarily due to $35 million higher marketing costs associated with our Ohio Valley Midstream operations, due primarily to higher non-ethane marketing sales prices, partially offset by lower non-ethane volumes. The changes in marketing purchases are offset by similar changes in marketing revenues, reflected above as Product sales.
Other segment costs and expenses decreased primarily due to a $34 million decrease in operating and maintenance expenses primarily resulting from lower costs related to supplies, outside services, and repairs, partially offset by slightly higher general and administrative expenses.
Impairment of certain assets changed favorably primarily due to lower impairment charges associated with certain surplus equipment within our Ohio Valley Midstream business (see Note 16 – Fair Value Measurements, Guarantees, and Concentration of Credit Risk of Notes to Consolidated Financial Statements).
Proportional Modified EBITDA of equity-method investments changed unfavorably due to a decrease from Appalachia Midstream Investments primarily due to lower fee revenues driven by lower rates, partially offset by lower impairments in 2016 and higher volumes. This decrease is substantially offset by a $20 million increase from Caiman II resulting from higher volumes due to assets placed into service in 2015, an $11 million increase from UEOM primarily associated with an increase in our ownership percentage, and a $10 million increase from Laurel Mountain primarily due to lower impairments incurred in 2016.
66
Atlantic-Gulf
Years Ended December 31, | |||||||||||
2017 | 2016 | 2015 | |||||||||
(Millions) | |||||||||||
Service revenues | $ | 2,239 | $ | 1,998 | $ | 1,923 | |||||
Product sales | 484 | 450 | 463 | ||||||||
Segment revenues | 2,723 | 2,448 | 2,386 | ||||||||
Product costs | (437 | ) | (405 | ) | (434 | ) | |||||
Other segment costs and expenses | (819 | ) | (707 | ) | (665 | ) | |||||
Impairment of certain assets | — | (2 | ) | (5 | ) | ||||||
Regulatory charges resulting from Tax Reform | (493 | ) | — | — | |||||||
Proportional Modified EBITDA of equity-method investments | 264 | 287 | 257 | ||||||||
Atlantic-Gulf Modified EBITDA | $ | 1,238 | $ | 1,621 | $ | 1,539 | |||||
NGL margin | $ | 41 | $ | 38 | $ | 27 | |||||
2017 vs. 2016
Modified EBITDA decreased primarily due to regulatory charges associated with the impact of Tax Reform at our regulated entities, higher Other segment costs and expenses, and lower Proportional Modified EBITDA from Discovery; partially offset by higher Service revenues.
Service revenues increased primarily due to:
• | A $135 million increase in Transco’s natural gas transportation fee revenues primarily due to a $150 million increase associated with expansion projects placed in-service in 2016 and 2017, partially offset by lower volume-based transportation services revenues; |
• | A $103 million increase in eastern Gulf Coast region fee revenues primarily related to the impact of new volumes at Gulfstar One related to the Gunflint expansion placed in-service in the third quarter of 2016, the absence of the temporary shut-down and subsequent ramp-up of Gulfstar One in the second and third quarters of 2016 to tie-in Gunflint, and the absence of producers’ operational issues in the Tubular Bells field during the first quarter of 2016, partially offset by lower volumes as a result of a temporary increase in 2016 due to disrupted operations of a competitor; |
• | A $15 million increase in Transco’s storage revenue primarily related to the absence of an accrual for potential refunds associated with a ruling received in certain rate case litigation in 2016; |
• | A $15 million decrease in western Gulf Coast region fee revenues due to lower volumes primarily associated with producer maintenance. |
Product sales increased primarily due to:
• | A $31 million increase in NGL and crude oil marketing revenues primarily due to a $72 million increase driven by higher prices, partially offset by a $41 million decrease driven by lower volumes. Average realized non-ethane prices were 47 percent higher and average realized crude prices were 18 percent higher. Non-ethane volumes were 16 percent lower and crude volumes were 13 percent lower driven by shut-ins of certain wells behind Devils Tower as a result of production issues and temporary hurricane-related shut-ins. (Increases in marketing revenues are substantially offset by higher Product costs); |
67
• | A $12 million increase in system management gas sales from Transco. System management gas sales are offset in Product costs and, therefore, have no impact on Modified EBITDA; |
• | A $5 million decrease in revenues associated with our equity NGLs due to a $19 million decrease driven by lower volumes, partially offset by a $14 million increase driven by higher prices. Realized non-ethane prices increased by 32 percent. Non-ethane volumes decreased by 31 percent primarily as a result of a temporary increase in 2016 due to disrupted operations of a competitor. |
Product costs increased primarily due to:
• | A $28 million increase in marketing purchases (more than offset in Product sales); |
• | A $12 million increase in system management gas costs (offset in Product sales); |
• | An $8 million decrease in natural gas purchases associated with the production of equity NGLs primarily due to lower volumes. |
Other segment costs and expenses increased primarily due to $89 million higher operating costs, primarily associated with Transco pipeline integrity testing and general maintenance, a $17 million increase in expense associated with an annual revision to the ARO liability, $9 million of higher general and administrative costs due to an increased share of allocated support costs, and a $15 million expense in 2017 related to a settlement charge from a pension early payout program (see Note 9 – Benefit Plans of Notes to Consolidated Financial Statements). These increases are partially offset by a $14 million favorable change in equity AFUDC associated with an increase in Transco’s capital spending, which is offset by an $8 million decrease in Constitution’s equity AFUDC. Other favorable changes include $12 million lower project development costs at Constitution and favorable impacts related to gains on asset retirements.
Regulatory charges resulting from Tax Reform reflects $493 million of regulatory charges associated with the impact of Tax Reform at Transco (See Note 1 – General, Description of Business, Basis of Presentation, and Summary of Significant Accounting Policies of Notes to Consolidated Financial Statements).
The decrease in Proportional Modified EBITDA of equity-method investments includes a $12 million decrease from Discovery, a $7 million decrease in Cardinal Pipeline Company, LLC and a $5 million decrease in Pine Needle LNG Company, LLC. The decrease in Discovery is primarily associated with lower fee revenue driven by significant production issues at certain wells, higher turbine maintenance expenses, temporary hurricane-related shut-ins, and maintenance on the Keathley Canyon connector pipeline. The decrease in Cardinal Pipeline Company, LLC and Pine Needle LNG Company, LLC is primarily due to $11 million of regulatory charges associated with the impact of Tax Reform.
2016 vs. 2015
Modified EBITDA increased primarily due to higher service revenues and higher earnings at Discovery due to the completion of the Keathley Canyon Connector in the first quarter of 2015, partially offset by higher segment costs and expenses.
Service revenues increased primarily due to:
• | A $79 million increase in Transco’s natural gas transportation fee revenues primarily associated with expansion projects placed in service in 2015 and 2016, partially offset by lower volume-based transportation services revenues; |
• | A $20 million increase in eastern Gulf Coast region fee revenues primarily related to the impact of new volumes at Gulfstar One related to the Gunflint expansion (which was placed in service in the third quarter of 2016), higher volumes at Devils Tower related to the Kodiak field (which began production in early 2016), and higher volumes from a temporary increase related to disrupted operations of a competitor. These increases were |
68
partially offset by lower volumes from the impact of 2016 producers’ operational issues and suspending operations in order to facilitate the tie-in of the Gunflint expansion at Gulfstar One;
• | A $15 million decrease in Transco’s storage revenue related to potential refunds associated with a ruling received in certain rate case litigation in 2016; |
• | A $12 million decrease in western Gulf Coast region fee revenues primarily related to lower volumes associated with producer maintenance in 2016 and natural declines in certain production areas. |
Product sales decreased primarily due to:
• | A $39 million decrease in system management gas sales from Transco. System management gas sales are offset in Product costs and, therefore, have no impact on Modified EBITDA; |
• | A $12 million decrease in crude oil and NGL marketing revenues. Crude oil marketing sales decreased $5 million primarily due to 13 percent lower crude oil per barrel sales prices, partially offset by 11 percent higher volumes. NGL marketing sales also decreased $7 million primarily due to 13 percent lower non-ethane volumes, partially offset by 35 percent higher ethane volumes and slightly higher ethane and non-ethane per-unit sales prices. These changes in marketing revenues are offset by similar changes in marketing purchases; |
• | A $36 million increase in revenues from our equity NGLs primarily due to a temporary increase in keep-whole volumes due to disrupted operations of a competitor. |
Product costs decreased primarily due to:
• | A $39 million decrease in system management gas costs (offset in Product sales); |
• | A $17 million decrease in marketing purchases (substantially offset in Product sales); |
• | A $25 million increase in natural gas purchases associated with the production of equity NGLs primarily due to higher volumes. |
The increase in Other segment costs and expenses includes $28 million higher operating expenses at Transco, primarily due to higher contract services for pipeline testing and general maintenance, as well as higher operating taxes, and $28 million higher Constitution project development costs as we discontinued capitalization of these costs beginning in April 2016. AFUDC also changed unfavorably by $11 million primarily associated with a decrease in spending on Constitution, and $8 million was incurred in first-quarter 2016 for severance and related costs associated with workforce reductions. These increases are partially offset by $22 million lower general and administrative expenses driven by first-quarter 2016 workforce reductions and ongoing cost containment efforts and an $11 million gain on an asset retirement in 2016.
The increase in Proportional Modified EBITDA of equity-method investments includes a $30 million increase from Discovery primarily due to higher fee revenues attributable to the completion of the Keathley Canyon Connector in the first quarter of 2015.
69
West
Years Ended December 31, | |||||||||||
2017 | 2016 | 2015 | |||||||||
(Millions) | |||||||||||
Service revenues | $ | 2,246 | $ | 2,328 | $ | 2,399 | |||||
Product sales | 2,013 | 1,380 | 1,220 | ||||||||
Segment revenues | 4,259 | 3,708 | 3,619 | ||||||||
Product costs | (1,842 | ) | (1,256 | ) | (1,105 | ) | |||||
Other segment costs and expenses | (832 | ) | (918 | ) | (1,008 | ) | |||||
Impairment of certain assets | (1,032 | ) | (100 | ) | (108 | ) | |||||
Regulatory charges resulting from Tax Reform | (220 | ) | — | — | |||||||
Proportional Modified EBITDA of equity-method investments | 79 | 110 | 83 | ||||||||
West Modified EBITDA | $ | 412 | $ | 1,544 | $ | 1,481 | |||||
NGL margin | $ | 154 | $ | 112 | $ | 105 | |||||
2017 vs. 2016
Modified EBITDA decreased primarily due to higher Impairment of certain assets, regulatory charges associated with the impact of Tax Reform at Northwest Pipeline, lower gathering rates, and lower volumes as a result of natural declines, partially offset by lower segment costs and expenses, higher per-unit NGL margins, and higher amortization of deferred revenue associated with the up-front cash payment received in conjunction with the fourth quarter 2016 Barnett Shale contract restructuring.
Service revenues decreased primarily due to:
• | A $79 million decrease related to net lower gathering rates, primarily in the Barnett Shale area primarily due to the fourth quarter 2016 contract restructuring, as well as lower rates recognized in the Niobrara, Eagle Ford Shale, and Haynesville Shale regions. These rate decreases are offset by higher commodity-based fee revenues in the Piceance area primarily due to higher per-unit NGL margins and higher rates in the Wamsutter area as a result of renegotiated rates in conjunction with infrastructure expansions. Rates recognized in the Niobrara region represent a portion of the total contractual rate that is received, with the difference reflected as deferred revenue; |
• | A $34 million decrease driven by lower volumes in most gathering and processing regions primarily as a result of natural declines and more extreme weather conditions in the Rocky Mountains in the first quarter of 2017, partially offset by higher volumes in the Haynesville Shale region as a result of increased drilling in certain areas; |
• | A $39 million increase related to the rate of amortization of deferred revenue associated with the up-front cash payment received in conjunction with the fourth quarter 2016 Barnett Shale contract restructuring. |
Product sales increased primarily due to:
• | A $532 million increase in marketing revenues primarily due to a $450 million increase driven by higher prices and an $82 million increase driven by higher volumes. The average non-ethane per-unit sales price increased by 43 percent, the average ethane per-unit sales prices increased by 30 percent, and the average natural gas per-unit sales price increased by 13 percent. Ethane and non-ethane sales volumes were 28 percent and six percent higher, respectively, partially offset by 17 percent lower natural gas sales volumes. (Higher marketing sales revenues are substantially offset by higher Product costs); |
70
• | A $72 million increase in revenues associated with our equity NGLs primarily due to an $80 million increase driven by higher prices, partially offset by an $8 million decrease driven by lower volumes. Realized non-ethane prices increased by 42 percent and realized ethane prices increased by 46 percent. Non-ethane volumes decreased by six percent primarily due to natural declines and to severe winter conditions in the first quarter of 2017; |
• | A $24 million increase in other product sales related to certain fabricated equipment sales to affiliates (more than offset by higher other Product costs). |
Product costs increased primarily due to:
• | A $529 million increase in marketing purchases (more than offset in Product sales); |
• | A $30 million increase in natural gas purchases associated with the production of equity NGLs primarily due to a 26 percent increase in per-unit natural gas prices; |
• | A $25 million increase in other product costs related to certain fabricated equipment sales to affiliates (offset by higher other Product sales). |
The decrease in Other segment costs and expenses reflects a $56 million decline in operating expenses, a $27 million reduction in general and administrative expenses, and $15 million of gains from contract settlements and terminations in Other (income) expense – net within Operating income (loss). The reductions in operating and general and administrative expenses are primarily due to the 2016 workforce reductions, ongoing cost containment efforts, lower compression expenses, favorable system gains and gas imbalance revaluations, and a reduced share of allocated support costs. These items are partially offset by a $13 million expense in 2017 related to a settlement charge from a pension early payout program (See Note 9 – Benefit Plans of Notes to Consolidated Financial Statements of Notes to Consolidated Financial Statements).
Impairment of certain assets increased primarily due to the $1.032 billion impairment of certain gathering operations primarily in the Mid-Continent region in 2017, partially offset by the absence of $100 million in impairments of certain Mid-Continent gathering assets and impairments or write-downs of other certain assets that may no longer be in use or are surplus in nature in 2016.
Regulatory charges resulting from Tax Reform reflects $220 million of regulatory charges associated with the impact of Tax Reform at Northwest Pipeline (See Note 1 – General, Description of Business, Basis of Presentation, and Summary of Significant Accounting Policies of Notes to Consolidated Financial Statements).
Proportional Modified EBITDA of equity-method investments decreased primarily due to the divestiture of our interests of DBJV and Ranch Westex LLC late in the first quarter of 2017.
2016 vs. 2015
Modified EBITDA increased primarily due to the absence of a $94 million impairment charge in 2015 (see Note 16 – Fair Value Measurements, Guarantees, and Concentration of Credit Risk of Notes to Consolidated Financial Statements) associated with previously capitalized project development costs for a gas processing plant and lower costs and expenses driven by ongoing cost containment efforts, partially offset by $91 million in impairments in 2016 of certain Mid-Continent gathering assets and impairments or write-downs of other certain assets that may no longer be in use or are surplus in nature and lower Service revenues.
Service revenues decreased primarily due to $69 million lower fee revenues in the Barnett Shale, Anadarko and Eagle Ford Shale areas driven by volume declines in the Barnett Shale and Anadarko areas as well as a net decrease in fee rates in the Barnett Shale, Anadarko, and Eagle Ford Shale areas, a $20 million reduction associated with lower gathering and processing fees in the Piceance region attributable to reduced producer volumes, and $12 million lower gathering and processing fees in the Four Corners region associated with system downtime and a natural decline in producer volumes. These reductions are partially offset by increased gathering and processing revenues of $14 million
71
associated with higher gathering and processing rates in our Niobrara operations, which is partially offset by 25 percent lower gathering volumes, and $15 million higher fee revenues in the Haynesville Shale area driven by higher rates and volumes primarily attributable to a contract executed in 2015 and additional volumes from new wells.
Product sales increased primarily due to:
• | A $149 million increase in marketing revenues primarily due to higher natural gas and NGL volumes and higher ethane prices, partially offset by lower natural gas and non-ethane prices (offset in Product costs); |
• | A $21 million increase in revenues from our equity NGLs associated with higher NGL volumes, partially offset by $5 million of lower NGL prices. |
Product costs increased primarily due to:
• | A $145 million increase in marketing purchases primarily due the same drivers as marketing sales (offset in Product sales); |
• | A $9 million increase in natural gas purchases associated with the production of equity NGLs due to higher volumes, partially offset by lower natural gas prices. |
Other segment costs and expenses decreased due to lower labor-related costs driven by first-quarter 2016 workforce reductions and ongoing cost containment efforts, as well as a $45 million decrease in ACMP Merger and transition expenses.
Impairment of certain assets changed favorably primarily due to the absence of a $94 million impairment charge associated with previously capitalized project development costs for a gas processing plant, partially offset by $91 million in impairments in 2016 of certain Mid-Continent gathering assets and impairments or write-downs of other certain assets that may no longer be in use or are surplus in nature.
The increase in Proportional Modified EBITDA of equity-method investments reflects a $16 million improvement at OPPL primarily due to higher transportation volumes, as well as lower expenses in 2016 due to cost reduction efforts, and a $9 million increase at DBJV related to increased gathering revenue from higher volumes.
NGL & Petchem Services
Years Ended December 31, | |||||||||||
2017 | 2016 | 2015 | |||||||||
(Millions) | |||||||||||
Service revenues | $ | 7 | $ | 50 | $ | 20 | |||||
Product sales | 365 | 778 | 712 | ||||||||
Segment revenues | 372 | 828 | 732 | ||||||||
Product costs | (238 | ) | (428 | ) | (474 | ) | |||||
Other segment costs and expenses | (77 | ) | (210 | ) | (166 | ) | |||||
Gain on sale of Geismar Interest | 1,095 | — | — | ||||||||
Insurance recoveries – Geismar Incident | 9 | 7 | 126 | ||||||||
Impairment of certain assets | — | (342 | ) | — | |||||||
NGL & Petchem Services Modified EBITDA | $ | 1,161 | $ | (145 | ) | $ | 218 | ||||
Olefins margin | $ | 125 | $ | 337 | $ | 226 | |||||
NGL margin | — | 12 | 21 | ||||||||
72
The NGL & Petchem Services segment is comprised of previously owned operations. On July 6, 2017, we completed the sale of Williams Olefins, L.L.C., a wholly owned subsidiary which owned our Geismar Interest. In June 2017, we sold our RGP Splitter operations, and in September 2016, we sold our Canadian operations.
2017 vs. 2016
Modified EBITDA increased primarily due to the $1.095 billion gain on the sale of our Geismar Interest, the absence of a $341 million impairment of our former Canadian operations in second-quarter 2016, and the absence of a $34 million loss on the sale of our former Canadian operations in 2016, partially offset by the absence of results from our former Gulf Olefins (Geismar Olefins and RGP Splitter plants) and Canadian operations.
Service revenues declined primarily due to the absence of revenues associated with our former Canadian operations.
Product sales decreased primarily due to:
• | A $377 million decrease in olefin sales primarily due to a $340 million decrease reflecting the absence of third- and fourth-quarter sales of our Gulf Olefins operations, a $29 million decrease due to the sale of the Canadian operations in 2016 and a $16 million decrease at our Geismar plant in the first half of 2017 primarily due to lower volumes associated with the electrical outage in second-quarter 2017, as well as planned maintenance downtime in first-quarter 2017. These items were partially offset by $8 million higher sales at the RGP Splitter in the first half 2017 primarily due to higher propylene prices; |
• | A $36 million decrease due to the absence of NGL production revenues associated with our former Canadian operations; |
• | A $3 million increase in marketing revenues primarily due to a $58 million increase in the first half of 2017 due to higher olefin volumes and prices, partially offset by a $55 million decrease in the second half of 2017 associated with the absence of marketing activity due to the sale of our Geismar Interest (offset by higher Product costs). |
Product costs decreased primarily due to:
• | A $166 million decrease in olefin feedstock purchases primarily due to the absence of $163 million in feedstock purchases in the second half of 2017 reflecting the sale of our Gulf Olefins operations, as well as the absence of $9 million in costs associated with our former Canadian operations, partially offset by $6 million higher feedstock costs associated with our Gulf Olefins operations in the first half of 2017; |
• | A $24 million decrease due to the absence of NGL product costs associated with our former Canadian operations; |
• | A $2 million increase in marketing product costs primarily due to a $54 million increase in the first half of 2017 primarily due to higher olefin feedstock prices and volumes, partially offset by a $52 million decrease in the second half of 2017 associated with the absence of marketing activity due to the sale of our Geismar plant (offset by higher Product sales). |
The favorable change in Other segment costs and expenses is primarily due to the absence of $61 million in operating and other expenses associated with our former Canadian operations, a reduction of $56 million in operating and general and administrative expenses in the second half of 2017 associated with the sale of our Gulf Olefins operations, the absence of a $34 million loss on the sale of our former Canadian operations in 2016, and a $12 million gain on the sale of the RGP Splitter. These favorable changes are partially offset by $16 million of additional expense in 2017 associated with the 2013 Geismar Incident and $12 million higher operating and other expenses in the first half of 2017 primarily due to selling expenses associated with our Geismar Interest and higher operating expenses associated with repairs of the electrical outage noted above.
73
Gain on sale of Geismar Interest reflects the gain recognized on the sale of our Geismar Interest in July 2017. (See Note 2 – Acquisitions and Divestitures of Notes to Consolidated Financial Statements.)
The decrease in Impairment of certain assets primarily reflects the absence of the 2016 impairment of our former Canadian operations (see Note 16 – Fair Value Measurements, Guarantees, and Concentration of Credit Risk of Notes to Consolidated Financial Statements).
2016 vs. 2015
Modified EBITDA decreased primarily due to the impairment and loss on sale of our Canadian operations and lower insurance proceeds related to the Geismar Incident, partially offset by higher olefin margins driven by higher production levels at the Geismar facility and higher ethylene prices in 2016 than in 2015, as well as higher service revenues associated with the expansion of the Redwater facilities in Canada.
Service revenues improved primarily due to the expansion of the Redwater facilities in March 2016 to provide transportation and fractionation services associated with the Williams Horizon liquids extraction plant. These operations were sold in September 2016.
Product sales increased primarily due to:
• | A $24 million increase in marketing revenues primarily due to higher non-ethane and propylene volumes and higher propylene prices, partially offset by lower ethane volumes (substantially offset by higher Product costs); |
• | A $94 million increase in olefin sales comprised of a $170 million increase from the Geismar plant that returned to service in late March 2015, partially offset by a $76 million decrease from our other former olefin operations. The increase at Geismar includes $153 million associated with increased volumes as a result of the plant operating at higher production levels in 2016 than when production resumed in March 2015 following the Geismar Incident and $17 million primarily associated with higher ethylene per-unit sales prices. The decrease in other olefin sales includes a $14 million reduction due to the absence of our former Canadian operations in the fourth quarter of 2016, as well as lower volumes and lower per-unit sales prices within the other olefin operations; |
• | A $49 million decrease in Canadian NGL production revenues comprised of a $41 million decrease associated with lower volumes and an $8 million decrease associated with lower prices across all products. The lower volumes include a $20 million reduction in the fourth quarter due to the sale of our former Canadian operations in September 2016. The volume declines also reflect the shut-down and evacuation of the liquids extraction plant because of wild fires in the Fort McMurray area during the second quarter of 2016, and a longer period of planned maintenance in 2016. |
Product costs decreased primarily due to:
• | A $40 million decrease in NGL product costs due to a $29 million decrease in primarily propane and ethane volumes and an $11 million decrease reflecting a decline in the price of natural gas associated with the production of equity NGLs. The $29 million decline associated with lower volumes includes $13 million attributable to the fourth quarter of 2016, subsequent to the sale of our former Canadian operations; |
• | A $17 million decrease in olefin feedstock purchases is primarily comprised of $78 million in lower purchases at our former other olefins operations, partially offset by $61 million of higher purchases due primarily to increased volumes at the Geismar plant resulting from higher productions levels. The lower costs at the other olefin operations are comprised of $54 million in lower per-unit feedstock costs and $24 million in primarily lower propylene volumes; |
• | A $6 million decrease in Canadian condensate product costs primarily due to lower volumes as a result of the sale of our former Canadian operations; |
74
• | A $17 million increase in marketing product costs primarily due to the same drivers as marketing sales (more than offset by higher Product sales). |
The increase in Other segment costs and expenses is primarily due to a $34 million loss on the sale of our Canadian operations in September 2016, as well as a $20 million unfavorable change in foreign currency exchange that primarily relates to losses on foreign currency transactions and the remeasurement of U.S. dollar denominated current assets and liabilities within our former Canadian operations, partially offset by slightly lower maintenance and general and administrative costs associated with our ongoing cost reduction efforts.
Insurance recoveries – Geismar Incident decreased due to a 2015 receipt of $126 million of insurance proceeds, partially offset by a $7 million receipt in 2016.
Impairment of certain assets primarily reflects the second-quarter 2016 impairment of our former Canadian operations (see Note 16 – Fair Value Measurements, Guarantees, and Concentration of Credit Risk of Notes to Consolidated Financial Statements).
75
Management’s Discussion and Analysis of Financial Condition and Liquidity
Overview
In 2017, we exceeded our target for asset sales, significantly improved our balance sheet to provide ample available liquidity, and continued to focus on growth in our businesses by identifying, contracting, permitting, and constructing attractive expansion projects. Examples of this activity included:
• | Sale of our Geismar Interest (See Note 2 – Acquisitions and Divestitures of Notes to Consolidated Financial Statements.); |
• | Repayment of our $850 million variable interest rate term loan that was due December 2018, and early retirement of our $750 million of 6.125 percent senior unsecured notes that were due in 2022; |
• | Repayment of our $1.4 billion of 4.875 percent senior unsecured notes that were due in 2023 with proceeds from the issuance of our $1.45 billion of 3.75 percent senior unsecured notes due in 2027; |
• | Extension to 2021 for the maturity date of our long-term credit facility; |
• | Expansion of Transco’s interstate natural gas pipeline system through completion of 2017 strategic projects (Gulf Trace, Hillabee Phase 1, Dalton, New York Bay, and Virginia Southside II) to meet the demand of growth markets. |
Outlook
Fee-based businesses are a significant component of our portfolio and serve to reduce the influence of commodity price fluctuations on our cash flows. We expect to benefit as continued growth in demand for low-cost natural gas is driven by increases in LNG exports, industrial demand, and power generation.
As previously discussed in Company Outlook, our growth capital and investment expenditures in 2018 are expected to be approximately $2.7 billion. Approximately $1.7 billion of our growth capital funding needs include Transco expansions and other interstate pipeline growth projects, most of which are fully contracted with firm transportation agreements. The remaining growth capital spending in 2018 primarily reflects investment in gathering and processing systems in the Northeast G&P segment limited primarily to known new producer volumes, including volumes that support Transco expansion projects including our Atlantic Sunrise project. In addition to growth capital and investment expenditures, we also remain committed to projects that maintain our assets for safe and reliable operations, as well as projects that meet legal, regulatory, and/or contractual commitments. We intend to fund the planned 2018 growth capital with retained cash flow and debt. We retain the flexibility to adjust planned levels of growth capital and investment expenditures in response to changes in economic conditions or business opportunities.
Liquidity
Based on our forecasted levels of cash flow from operations and other sources of liquidity, we expect to have sufficient liquidity to manage our businesses in 2018. Our potential material internal and external sources of liquidity for 2018 are as follows:
• | Cash and cash equivalents on hand; |
• | Cash generated from operations; |
• | Distributions from our equity-method investees; |
• | Cash proceeds from issuance of debt and/or equity securities; |
• | Utilization of our credit facility and/or commercial paper program; |
76
• | Proceeds from asset monetizations. |
We anticipate our material internal and external uses of liquidity to be:
• | Working capital requirements; |
• | Capital and investment expenditures; |
• | Debt service payments, including payments of long-term debt; |
• | Quarterly distributions to our unitholders. |
Potential risks associated with our planned levels of liquidity discussed above include those previously discussed in Company Outlook.
As of December 31, 2017, we had a working capital deficit of $307 million. Our available liquidity is as follows:
Available Liquidity | December 31, 2017 | ||
(Millions) | |||
Cash and cash equivalents | $ | 881 | |
Capacity available under our $3.5 billion credit facility, less amounts outstanding under our $3 billion commercial paper program (1) | 3,500 | ||
$ | 4,381 | ||
______________
(1) | In managing our available liquidity, we do not expect a maximum outstanding amount in excess of the capacity of our credit facility inclusive of any outstanding amounts under our commercial paper program. As of December 31, 2017, no Commercial paper was outstanding under our commercial paper program. The highest amount outstanding under our commercial paper program and credit facility during 2017 was $178 million. At December 31, 2017, we were in compliance with the financial covenants associated with this credit facility. See Note 13 – Debt, Banking Arrangements, and Leases of Notes to Consolidated Financial Statements for additional information on our credit facility and commercial paper program. Borrowing capacity available under our $3.5 billion credit facility as of February 20, 2018, was $3.5 billion. |
Registrations
In September 2016, we filed a registration statement for our distribution reinvestment program. (See Note 14 – Partners’ Capital of Notes to Consolidated Financial Statements.)
In February 2015, we filed a shelf registration statement, as a well-known seasoned issuer, registering common units representing limited partner interests and debt securities. Also in February 2015, we filed a shelf registration statement for the offer and sale from time to time of common units representing limited partner interests in us having an aggregate offering price of up to $1 billion. These sales are to be made over a period of time and from time to time in transactions at prices which are market prices prevailing at the time of sale, prices related to market price, or at negotiated prices. Such sales are to be made pursuant to an equity distribution agreement between us and certain banks who may act as sales agents or purchase for their own accounts as principals. During 2016 and 2015, we received net proceeds of approximately $115 million and approximately $59 million, respectively, from equity issued under this registration; there was no activity during 2017.
Distributions from Equity-Method Investees
The organizational documents of entities in which we have an equity-method investment generally require distribution of their available cash to their members on a quarterly basis. In each case, available cash is reduced, in part, by reserves appropriate for operating their respective businesses. (See Note 6 – Investing Activities of Notes to Consolidated Financial Statements for our more significant equity-method investees.)
77
Credit Ratings
Our ability to borrow money is impacted by our credit ratings. Our current ratings are as follows:
Rating Agency | Outlook | Senior Unsecured Debt Rating | Corporate Credit Rating | |||
S&P Global Ratings | Stable | BBB | BBB | |||
Moody’s Investors Service | Positive | Baa3 | N/A | |||
Fitch Ratings | Positive | BBB- | N/A | |||
During March 2017, S&P Global Ratings upgraded its rating for WPZ. These credit ratings are included for informational purposes and are not recommendations to buy, sell, or hold our securities, and each rating should be evaluated independently of any other rating. No assurance can be given that the credit rating agencies will continue to assign us investment-grade ratings even if we meet or exceed their current criteria for investment-grade ratios. A downgrade of our credit rating might increase our future cost of borrowing and would require us to provide additional collateral to third parties, negatively impacting our available liquidity.
Cash Distributions to Unitholders
We paid a cash distribution of $0.60 per common unit on February 9, 2018, to unitholders of record at the close of business on February 2, 2018.
78
Sources (Uses) of Cash
The following table summarizes the sources (uses) of cash and cash equivalents for each of the periods presented (see Notes to Consolidated Financial Statements for the Notes referenced in the table):
Cash Flow | Years Ended December 31, | ||||||||||||
Category | 2017 | 2016 | 2015 | ||||||||||
(Millions) | |||||||||||||
Sources of cash and cash equivalents: | |||||||||||||
Operating activities – net | Operating | $ | 2,840 | $ | 3,948 | $ | 2,663 | ||||||
Proceeds from sales of common units (see Note 1) | Financing | 2,184 | 614 | 59 | |||||||||
Proceeds from sale of businesses, net of cash divested (see Note 2) | Investing | 2,070 | 672 | — | |||||||||
Proceeds from long-term debt (see Note 13) | Financing | 1,698 | 998 | 3,842 | |||||||||
Distributions from unconsolidated affiliates in excess of cumulative earnings | Investing | 529 | 472 | 404 | |||||||||
Contributions in aid of construction | Investing | 426 | 218 | 87 | |||||||||
Proceeds from dispositions of equity-method investments (see Note 6) | Investing | 200 | 34 | — | |||||||||
Contributions from noncontrolling interests | Financing | 17 | 29 | 111 | |||||||||
Proceeds from credit-facility borrowings | Financing | — | 3,250 | 3,832 | |||||||||
Special distribution from Gulfstream (see Note 6) | Financing | — | — | 396 | |||||||||
Uses of cash and cash equivalents: | |||||||||||||
Payments of long-term debt (see Note 13) | Financing | (3,785 | ) | (375 | ) | (1,533 | ) | ||||||
Distributions paid (1) | Financing | (2,471 | ) | (2,531 | ) | (2,686 | ) | ||||||
Capital expenditures | Investing | (2,374 | ) | (1,944 | ) | (2,795 | ) | ||||||
Distributions to noncontrolling interests | Financing | (212 | ) | (92 | ) | (87 | ) | ||||||
Purchases of and contributions to equity-method investments | Investing | (132 | ) | (177 | ) | (594 | ) | ||||||
Payments of commercial paper – net | Financing | (93 | ) | (409 | ) | (306 | ) | ||||||
Payments on credit-facility borrowings | Financing | — | (4,560 | ) | (3,162 | ) | |||||||
Contribution to Gulfstream for repayment of debt (see Note 6) | Financing | — | (148 | ) | (248 | ) | |||||||
Purchases of businesses, net of cash acquired | Investing | — | — | (112 | ) | ||||||||
Other sources / (uses) – net | Financing and Investing | (161 | ) | 50 | 54 | ||||||||
Increase (decrease) in cash and cash equivalents | $ | 736 | $ | 49 | $ | (75 | ) | ||||||
____________
(1) | Includes $1.861 billion, $1.693 billion, and $1.846 billion to Williams in 2017, 2016, and 2015, respectively. |
Operating activities
The factors that determine operating activities are largely the same as those that affect Net income (loss), with the exception of noncash items such as Depreciation and amortization, Provision (benefit) for deferred income taxes, Net (gain) loss on disposition of equity-method investments, Impairment of goodwill, Impairment of equity-method investments, Impairment of and net (gain) loss on sale of assets and businesses, Gain on sale of Geismar Interest, and Regulatory charges resulting from Tax Reform.
Our Net cash provided (used) by operating activities in 2017 decreased from 2016 primarily due to the absence in 2017 of receipts from 2016 contract restructurings, partially offset by higher operating income in 2017.
79
Our Net cash provided (used) by operating activities in 2016 increased from 2015 primarily due to the impact of higher operating income, net favorable changes in operating working capital, and receipts from contract restructurings.
Off-Balance Sheet Arrangements and Guarantees of Debt or Other Commitments
We have various other guarantees and commitments which are disclosed in Note 3 – Variable Interest Entities, Note 10 – Property, Plant, and Equipment, Note 13 – Debt, Banking Arrangements, and Leases, Note 16 – Fair Value Measurements, Guarantees, and Concentration of Credit Risk, and Note 17 – Contingent Liabilities and Commitments of Notes to Consolidated Financial Statements. We do not believe these guarantees and commitments or the possible fulfillment of them will prevent us from meeting our liquidity needs.
Contractual Obligations
The table below summarizes the maturity dates of our contractual obligations at December 31, 2017:
2018 | 2019 - 2020 | 2021 - 2022 | Thereafter | Total | |||||||||||||||
(Millions) | |||||||||||||||||||
Long-term debt: (1) | |||||||||||||||||||
Principal | $ | 502 | $ | 2,104 | $ | 2,504 | $ | 11,489 | $ | 16,599 | |||||||||
Interest | 805 | 1,514 | 1,304 | 6,177 | 9,800 | ||||||||||||||
Operating leases | 35 | 59 | 50 | 126 | 270 | ||||||||||||||
Purchase obligations (2) | 1,109 | 835 | 595 | 276 | 2,815 | ||||||||||||||
Other obligations (3) | 1 | 1 | — | — | 2 | ||||||||||||||
Total | $ | 2,452 | $ | 4,513 | $ | 4,453 | $ | 18,068 | $ | 29,486 | |||||||||
____________
(1) | Includes any outstanding borrowings under our credit facility, but does not include any related variable-rate interest payments. |
(2) | Includes approximately $348 million in open property, plant, and equipment purchase orders. Includes an estimated $314 million long-term ethane purchase obligation with index-based pricing terms that is reflected in this table at December 31, 2017 prices. This obligation is part of an overall exchange agreement whereby volumes we transport on OPPL are sold at a third-party fractionator near Conway, Kansas, and we are subsequently obligated to purchase ethane volumes at Mont Belvieu. The purchased ethane volumes may be utilized or sold at comparable prices in the Mont Belvieu market. Includes an estimated $454 million long-term ethane purchase obligation with index-based pricing terms that primarily supplies third parties at their plants and is valued in this table at a price calculated using December 31, 2017 prices. Any excess purchased volumes may be sold at comparable market prices. Includes an estimated $765 million long-term mixed NGLs purchase obligation with index-based pricing terms that is reflected in this table at December 31, 2017 prices. Includes an estimated $278 million long-term ethane purchase obligation with index-based pricing terms that primarily supplies a third party for consumption at their plant and is reflected in this table at a price calculated using December 31, 2017 prices. Any excess purchased volumes may be sold at comparable market prices. In addition, we have not included certain natural gas life-of-lease contracts for which the future volumes are indeterminable. We have not included commitments, beyond purchase orders, for the acquisition or construction of property, plant, and equipment or expected contributions to our jointly owned investments. (See Company Outlook – Expansion Projects.) |
(3) | We have not included income tax liabilities in the table above. See Note 8 – Provision (Benefit) for Income Taxes of Notes to Consolidated Financial Statements for a discussion of income taxes. |
Effects of Inflation
Our operations have historically not been materially affected by inflation. Approximately 44 percent of our gross property, plant, and equipment is comprised of our interstate natural gas pipeline assets. They are subject to regulation, which limits recovery to historical cost. While amounts in excess of historical cost are not recoverable under current FERC practices, we anticipate being allowed to recover and earn a return based on increased actual cost incurred to
80
replace existing assets. Cost-based regulations, along with competition and other market factors, may limit our ability to recover such increased costs. For our gathering and processing assets, operating costs are influenced to a greater extent by both competition for specialized services and specific price changes in crude oil and natural gas and related commodities than by changes in general inflation. Crude oil, natural gas, and NGL prices are particularly sensitive to the market perceptions concerning the supply and demand balance in the near future, as well as general economic conditions. However, our exposure to certain of these price changes is reduced through the fee-based nature of certain of our services and the use of hedging instruments.
Environmental
We are a participant in certain environmental activities in various stages including assessment studies, cleanup operations, and/or remedial processes at certain sites, some of which we currently do not own (see Note 17 – Contingent Liabilities and Commitments of Notes to Consolidated Financial Statements). We are monitoring these sites in a coordinated effort with other potentially responsible parties, the EPA, or other governmental authorities. We are jointly and severally liable along with unrelated third parties in some of these activities and solely responsible in others. Current estimates of the most likely costs of such activities are approximately $15 million, all of which are included in Other accrued liabilities and Regulatory liabilities and other in the Consolidated Balance Sheet at December 31, 2017. We will seek recovery of the accrued costs related to remediation activities by our interstate gas pipelines totaling approximately $7 million through future natural gas transmission rates. The remainder of these costs will be funded from operations. During 2017, we paid approximately $4 million for cleanup and/or remediation and monitoring activities. We expect to pay approximately $6 million in 2018 for these activities. Estimates of the most likely costs of cleanup are generally based on completed assessment studies, preliminary results of studies, or our experience with other similar cleanup operations. At December 31, 2017, certain assessment studies were still in process for which the ultimate outcome may yield different estimates of most likely costs. Therefore, the actual costs incurred will depend on the final amount, type, and extent of contamination discovered at these sites, the final cleanup standards mandated by the EPA or other governmental authorities, and other factors.
The EPA and various state regulatory agencies routinely promulgate and propose new rules, and issue updated guidance to existing rules. More recent rules and rulemakings include, but are not limited to, rules for reciprocating internal combustion engine maximum achievable control technology, air quality standards for one hour nitrogen dioxide emissions, and volatile organic compound and methane new source performance standards impacting design and operation of storage vessels, pressure valves, and compressors. On October 1, 2015, the EPA issued its rule regarding National Ambient Air Quality Standards for ground-level ozone, setting a stricter standard of 70 parts per billion. We are monitoring the rule's implementation as the reduction will trigger additional federal and state regulatory actions that may impact our operations. Implementation of the regulations is expected to result in impacts to our operations and increase the cost of additions to Property, plant, and equipment – net in the Consolidated Balance Sheet for both new and existing facilities in affected areas. We are unable to reasonably estimate the cost of additions that may be required to meet the regulations at this time due to uncertainty created by various legal challenges to these regulations and the need for further specific regulatory guidance.
Our interstate natural gas pipelines consider prudently incurred environmental assessment and remediation costs and the costs associated with compliance with environmental standards to be recoverable through rates.
81
Item 7A. Quantitative and Qualitative Disclosures About Market Risk
Interest Rate Risk
Our current interest rate risk exposure is related primarily to our debt portfolio. Our debt portfolio is primarily comprised of fixed rate debt, which mitigates the impact of fluctuations in interest rates. Any borrowings under the credit facilities and any issuances under the commercial paper program could be at a variable interest rate and could expose us to the risk of increasing interest rates. The maturity of our long-term debt portfolio is partially influenced by the expected lives of our operating assets. (See Note 13 – Debt, Banking Arrangements, and Leases of Notes to Consolidated Financial Statements.)
The tables below provide information by maturity date about our interest rate risk-sensitive instruments as of December 31, 2017 and 2016. The fair value of our publicly traded long-term debt is valued using indicative year-end traded bond market prices. Private debt is valued based on market rates and the prices of similar securities with similar terms and credit ratings.
2018 | 2019 | 2020 | 2021 | 2022 | Thereafter (1) | Total | Fair Value December 31, 2017 | |||||||||||||||||||||||||
(Millions) | ||||||||||||||||||||||||||||||||
Long-term debt, including current portion: | ||||||||||||||||||||||||||||||||
Fixed rate | $ | 502 | $ | 2 | $ | 2,102 | $ | 502 | $ | 2,002 | $ | 11,387 | $ | 16,497 | $ | 18,112 | ||||||||||||||||
Weighted-average interest rate | 4.9 | % | 4.9 | % | 4.9 | % | 4.9 | % | 5.0 | % | 5.5 | % | ||||||||||||||||||||
2017 | 2018 | 2019 | 2020 | 2021 | Thereafter (1) | Total | Fair Value December 31, 2016 | |||||||||||||||||||||||||
(Millions) | ||||||||||||||||||||||||||||||||
Long-term debt, including current portion: | ||||||||||||||||||||||||||||||||
Fixed rate | $ | 785 | $ | 500 | $ | — | $ | 2,100 | $ | 500 | $ | 13,735 | $ | 17,620 | $ | 18,057 | ||||||||||||||||
Weighted-average interest rate | 5.1 | % | 5.0 | % | 5.0 | % | 5.0 | % | 5.0 | % | 5.4 | % | ||||||||||||||||||||
Variable rate (2) | $ | — | $ | 850 | $ | — | $ | — | $ | — | $ | — | $ | 850 | $ | 850 | ||||||||||||||||
Commercial paper: | ||||||||||||||||||||||||||||||||
Variable rate (3) | $ | 93 | $ | — | $ | — | $ | — | $ | — | $ | — | $ | 93 | $ | 93 | ||||||||||||||||
______________
(1) | Includes unamortized discount / premium and debt issuance costs. |
(2) | The weighted-average interest rate for our $850 million term loan was 2.50 percent at December 31, 2016. |
(3) | The weighted-average interest rate was 1.06 percent at December 31, 2016. |
Commodity Price Risk
We are exposed to the impact of fluctuations in the market price of NGLs and natural gas, as well as other market factors, such as market volatility and energy commodity price correlations. We are exposed to these risks in connection with our owned energy-related assets, our long-term energy-related contracts, and limited proprietary trading activities. Our management of the risks associated with these market fluctuations includes maintaining sufficient liquidity, as well as using various derivatives and nonderivative energy-related contracts. The fair value of derivative contracts is subject to many factors, including changes in energy commodity market prices, the liquidity and volatility of the markets in which the contracts are transacted, and changes in interest rates. At December 31, 2017 and 2016, our derivative activity was not material. (See Note 16 – Fair Value Measurements, Guarantees, and Concentration of Credit Risk of Notes to Consolidated Financial Statements.)
82
Item 8. Financial Statements and Supplementary Data
Report of Independent Registered Public Accounting Firm
The Limited Partners of Williams Partners L.P.
and the Board of Directors of WPZ GP LLC,
General Partner of Williams Partners L.P.
Opinion on the Financial Statements
We have audited the accompanying consolidated balance sheet of Williams Partners L.P. (the “Partnership”) as of December 31, 2017 and 2016, the related consolidated statements of comprehensive income (loss), changes in equity, and cash flows for each of the three years in the period ended December 31, 2017, and the related notes (collectively referred to as the “consolidated financial statements”). In our opinion, based on our audits and the reports of other auditors, the consolidated financial statements present fairly, in all material respects, the consolidated financial position of the Partnership at December 31, 2017 and 2016, and the consolidated results of its operations and its cash flows for each of the three years in the period ended December 31, 2017, in conformity with U.S. generally accepted accounting principles.
We did not audit the financial statements of Gulfstream Natural Gas System, L.L.C. (“Gulfstream”), a limited liability corporation in which the Partnership has a 50 percent interest. In the consolidated financial statements, the Partnership’s investment in Gulfstream was $244 million and $261 million as of December 31, 2017 and 2016, respectively, and the Partnership’s equity earnings in the net income of Gulfstream were $75 million in 2017, $69 million in 2016 and $65 million in 2015. Gulfstream’s financial statements were audited by other auditors whose reports have been furnished to us, and our opinion, insofar as it relates to the amounts included for Gulfstream, is based solely on the reports of the other auditors.
We also have audited, in accordance with the standards of the Public Company Accounting Oversight Board (United States) (“PCAOB”), the Partnership’s internal control over financial reporting as of December 31, 2017, based on criteria established in Internal Control - Integrated Framework issued by the Committee of Sponsoring Organizations of the Treadway Commission (2013 framework) and our report dated February 22, 2018 expressed an unqualified opinion thereon.
Basis for Opinion
These consolidated financial statements are the responsibility of the Partnership’s management. Our responsibility is to express an opinion on the Partnership’s consolidated financial statements based on our audits. We are a public accounting firm registered with the PCAOB and are required to be independent with respect to the Partnership in accordance with the U.S. federal securities laws and the applicable rules and regulations of the Securities and Exchange Commission and the PCAOB.
We conducted our audits in accordance with the standards of the PCAOB. Those standards require that we plan and perform the audit to obtain reasonable assurance about whether the consolidated financial statements are free of material misstatement, whether due to error or fraud. Our audits included performing procedures to assess the risks of material misstatement of the consolidated financial statements, whether due to error or fraud, and performing procedures that respond to those risks. Such procedures included examining, on a test basis, evidence regarding the amounts and disclosures in the consolidated financial statements. Our audits also included evaluating the accounting principles used and significant estimates made by management, as well as evaluating the overall presentation of the consolidated financial statements. We believe that our audits and the reports of other auditors provide a reasonable basis for our opinion.
/s/ Ernst & Young LLP
We have served as the Partnership’s auditor since 2004.
Tulsa, Oklahoma
February 22, 2018
83
Report of Independent Registered Public Accounting Firm
To the Management Committee and Members of Gulfstream Natural Gas System, L.L.C.:
Opinion on the Financial Statements
We have audited the balance sheet of Gulfstream Natural Gas System, L.L.C. (the “Company”) as of December 31, 2017, and the related statements of operations, comprehensive income, cash flows, and members’ equity for the year then ended, including the related notes (collectively referred to as the “financial statements;” not presented herein). In our opinion, the financial statements present fairly, in all material respects, the financial position of the Company as of December 31, 2017, and the results of its operations and its cash flows for the year then ended in conformity with accounting principles generally accepted in the United States of America.
Basis for Opinion
These financial statements are the responsibility of the Company’s management. Our responsibility is to express an opinion on the Company’s financial statements based on our audit. We are a public accounting firm registered with the Public Company Accounting Oversight Board (United States) (“PCAOB”) and are required to be independent with respect to the Company in accordance with the U.S. federal securities laws and the applicable rules and regulations of the Securities and Exchange Commission and the PCAOB.
We conducted our audit of these financial statements in accordance with the standards of the PCAOB and in accordance with auditing standards generally accepted in the United States of America. Those standards require that we plan and perform the audit to obtain reasonable assurance about whether the financial statements are free of material misstatement, whether due to error or fraud.
Our audit included performing procedures to assess the risks of material misstatement of the financial statements, whether due to error or fraud, and performing procedures that respond to those risks. Such procedures included examining, on a test basis, evidence regarding the amounts and disclosures in the financial statements. Our audit also included evaluating the accounting principles used and significant estimates made by management, as well as evaluating the overall presentation of the financial statements. We believe that our audit provides a reasonable basis for our opinion.
/s/ PricewaterhouseCoopers LLP
Houston, Texas
February 22, 2018
We have served as the Company’s auditor since 2018.
84
Report of Independent Registered Public Accounting Firm
To the Members of Gulfstream Natural Gas System, L.L.C.
We have audited the balance sheet of Gulfstream Natural Gas System, L.L.C. (the "Company") as of December 31, 2016, and the related statement of operations, comprehensive income, cash flows, and members’ equity for each of the two years in the period ended December 31, 2016. These financial statements are the responsibility of the Company's management. Our responsibility is to express an opinion on these financial statements based on our audits.
We conducted our audits in accordance with the standards of the Public Company Accounting Oversight Board (United States) and in accordance with auditing standards generally accepted in the United States of America. Those standards require that we plan and perform the audit to obtain reasonable assurance about whether the financial statements are free of material misstatement. The Company is not required to have, nor were we engaged to perform, an audit of its internal control over financial reporting. Our audits included consideration of internal control over financial reporting as a basis for designing audit procedures that are appropriate in the circumstances, but not for the purpose of expressing an opinion on the effectiveness of the Company's internal control over financial reporting. Accordingly, we express no such opinion. An audit also includes examining, on a test basis, evidence supporting the amounts and disclosures in the financial statements, assessing the accounting principles used and significant estimates made by management, as well as evaluating the overall financial statement presentation. We believe that our audits provide a reasonable basis for our opinion.
In our opinion, such financial statements present fairly, in all material respects, the financial position of Gulfstream Natural Gas System, L.L.C. as of December 31, 2016, and the results of its operations and its cash flows for each of the two years in the period ended December 31, 2016, in conformity with accounting principles generally accepted in the United States of America.
/s/ DELOITTE & TOUCHE LLP
Houston, Texas
February 22, 2017
85
Williams Partners L.P.
Consolidated Statement of Comprehensive Income (Loss)
Years Ended December 31, | ||||||||||||
2017 | 2016 | 2015 | ||||||||||
(Millions, except per-unit amounts) | ||||||||||||
Revenues: | ||||||||||||
Service revenues | $ | 5,292 | $ | 5,173 | $ | 5,135 | ||||||
Product sales | 2,718 | 2,318 | 2,196 | |||||||||
Total revenues | 8,010 | 7,491 | 7,331 | |||||||||
Costs and expenses: | ||||||||||||
Product costs | 2,300 | 1,728 | 1,779 | |||||||||
Operating and maintenance expenses | 1,562 | 1,548 | 1,625 | |||||||||
Depreciation and amortization expenses | 1,700 | 1,720 | 1,702 | |||||||||
Selling, general, and administrative expenses | 610 | 630 | 684 | |||||||||
Impairment of goodwill (Note 16) | — | — | 1,098 | |||||||||
Impairment of certain assets (Note 16) | 1,156 | 457 | 145 | |||||||||
Gain on sale of Geismar Interest (Note 2) | (1,095 | ) | — | — | ||||||||
Regulatory charges resulting from Tax Reform (Note 1) | 674 | — | — | |||||||||
Insurance recoveries – Geismar Incident | (9 | ) | (7 | ) | (126 | ) | ||||||
Other (income) expense – net | 79 | 118 | 41 | |||||||||
Total costs and expenses | 6,977 | 6,194 | 6,948 | |||||||||
Operating income (loss) | 1,033 | 1,297 | 383 | |||||||||
Equity earnings (losses) | 434 | 397 | 335 | |||||||||
Impairment of equity-method investments (Note 16) | — | (430 | ) | (1,359 | ) | |||||||
Other investing income (loss) – net | 281 | 29 | 2 | |||||||||
Interest incurred | (855 | ) | (949 | ) | (864 | ) | ||||||
Interest capitalized | 33 | 33 | 53 | |||||||||
Other income (expense) – net | 55 | 62 | 93 | |||||||||
Income (loss) before income taxes | 981 | 439 | (1,357 | ) | ||||||||
Provision (benefit) for income taxes | 6 | (80 | ) | 1 | ||||||||
Net income (loss) | 975 | 519 | (1,358 | ) | ||||||||
Less: Net income attributable to noncontrolling interests | 104 | 88 | 91 | |||||||||
Net income (loss) attributable to controlling interests | $ | 871 | $ | 431 | $ | (1,449 | ) | |||||
Allocation of net income (loss) for calculation of earnings per common unit: | ||||||||||||
Net income (loss) attributable to controlling interests | $ | 871 | $ | 431 | $ | (1,449 | ) | |||||
Allocation of net income (loss) to general partner | — | 517 | 384 | |||||||||
Allocation of net income (loss) to Class B units | 15 | 12 | (46 | ) | ||||||||
Allocation of net income (loss) to Class D units | — | — | 68 | |||||||||
Allocation of net income (loss) to common units | $ | 856 | $ | (98 | ) | $ | (1,855 | ) | ||||
Basic earnings (loss) per common unit: | ||||||||||||
Net income (loss) per common unit | $ | 0.90 | $ | (0.17 | ) | $ | (3.27 | ) | ||||
Weighted average number of common units outstanding (thousands) | 947,171 | 592,519 | 567,275 | |||||||||
Diluted earnings (loss) per common unit: | ||||||||||||
Net income (loss) per common unit | $ | 0.90 | $ | (0.17 | ) | $ | (3.27 | ) | ||||
Weighted average number of common units outstanding (thousands) | 947,485 | 592,519 | 567,275 | |||||||||
Cash distributions per common unit | $ | 2.40 | $ | 3.40 | $ | 3.40 | ||||||
Other comprehensive income (loss): | ||||||||||||
Cash flow hedging activities: | ||||||||||||
Net unrealized gain (loss) from derivative instruments | $ | (11 | ) | $ | 5 | $ | 6 | |||||
Reclassifications into earnings of net derivative instruments (gain) loss | 7 | (3 | ) | (7 | ) | |||||||
Foreign currency translation activities: | ||||||||||||
Foreign currency translation adjustments | — | 61 | (173 | ) | ||||||||
Reclassification into earnings upon sale of foreign entity | — | 108 | — | |||||||||
Other comprehensive income (loss) | (4 | ) | 171 | (174 | ) | |||||||
Comprehensive income (loss) | 971 | 690 | (1,532 | ) | ||||||||
Less: Comprehensive income attributable to noncontrolling interests | 104 | 88 | 91 | |||||||||
Comprehensive income (loss) attributable to controlling interests | $ | 867 | $ | 602 | $ | (1,623 | ) | |||||
See accompanying notes.
86
Williams Partners L.P.
Consolidated Balance Sheet
December 31, | |||||||
2017 | 2016 | ||||||
(Millions) | |||||||
ASSETS | |||||||
Current assets: | |||||||
Cash and cash equivalents | $ | 881 | $ | 145 | |||
Trade accounts and other receivables (net of allowance of $9 at December 31, 2017 and $6 at December 31, 2016) | 972 | 926 | |||||
Inventories | 113 | 138 | |||||
Other current assets and deferred charges | 176 | 205 | |||||
Total current assets | 2,142 | 1,414 | |||||
Investments | 6,552 | 6,701 | |||||
Property, plant, and equipment – net | 27,912 | 28,021 | |||||
Intangible assets – net of accumulated amortization | 8,790 | 9,662 | |||||
Regulatory assets, deferred charges, and other | 507 | 467 | |||||
Total assets | $ | 45,903 | $ | 46,265 | |||
LIABILITIES AND EQUITY | |||||||
Current liabilities: | |||||||
Accounts payable: | |||||||
Trade | $ | 957 | $ | 589 | |||
Affiliate | 134 | 109 | |||||
Accrued interest | 214 | 258 | |||||
Asset retirement obligations | 53 | 61 | |||||
Other accrued liabilities | 590 | 804 | |||||
Commercial paper | — | 93 | |||||
Long-term debt due within one year | 501 | 785 | |||||
Total current liabilities | 2,449 | 2,699 | |||||
Long-term debt | 15,996 | 17,685 | |||||
Asset retirement obligations | 944 | 798 | |||||
Deferred income tax liabilities | 16 | 20 | |||||
Long-term deferred income | 1,119 | 1,048 | |||||
Regulatory liabilities and other | 1,690 | 812 | |||||
Contingent liabilities and commitments (Note 17) | |||||||
Equity: | |||||||
Partners’ equity: | |||||||
Common units (956,952,542 and 607,064,550 units outstanding at December 31, 2017 and 2016, respectively) | 21,251 | 18,300 | |||||
Class B units (17,853,088 and 16,690,016 units outstanding as of December 31, 2017 and 2016, respectively) | 784 | 769 | |||||
General partner | — | 2,385 | |||||
Accumulated other comprehensive income (loss) | (5 | ) | (1 | ) | |||
Total partners’ equity | 22,030 | 21,453 | |||||
Noncontrolling interests in consolidated subsidiaries | 1,659 | 1,750 | |||||
Total equity | 23,689 | 23,203 | |||||
Total liabilities and equity | $ | 45,903 | $ | 46,265 | |||
See accompanying notes.
87
Williams Partners L.P.
Consolidated Statement of Changes in Equity
Williams Partners L.P. | |||||||||||||||||||||||||||||||
Limited Partners | |||||||||||||||||||||||||||||||
Common Units | Class B Units | Class D Units | General Partner | Accumulated Other Comprehensive Income (Loss) | Total Partners’ Equity | Noncontrolling Interests | Total Equity | ||||||||||||||||||||||||
(Millions) | |||||||||||||||||||||||||||||||
Balance – December 31, 2014 | $ | 10,367 | $ | — | $ | 1,011 | $ | 9,214 | $ | 2 | $ | 20,594 | $ | 8,091 | $ | 28,685 | |||||||||||||||
Net income (loss) | (1,988 | ) | (52 | ) | 1 | 590 | — | (1,449 | ) | 91 | (1,358 | ) | |||||||||||||||||||
Other comprehensive income (loss) | — | — | — | — | (174 | ) | (174 | ) | — | (174 | ) | ||||||||||||||||||||
Contributions from The Williams Companies, Inc.- net | 12,254 | 823 | — | (6,573 | ) | — | 6,504 | (6,484 | ) | 20 | |||||||||||||||||||||
Sales of common units (Note 14) | 59 | — | — | — | — | 59 | — | 59 | |||||||||||||||||||||||
Amortization of beneficial conversion feature of Class D units (Note 4) | (68 | ) | — | 68 | — | — | — | — | — | ||||||||||||||||||||||
Conversion of Class D units to common units (Note 4) | 1,080 | — | (1,080 | ) | — | — | — | — | — | ||||||||||||||||||||||
Distributions to partners | (1,995 | ) | — | — | (691 | ) | — | (2,686 | ) | — | (2,686 | ) | |||||||||||||||||||
Contributions from general partner | — | — | — | 14 | — | 14 | — | 14 | |||||||||||||||||||||||
Contributions from noncontrolling interests | — | — | — | — | — | — | 111 | 111 | |||||||||||||||||||||||
Distributions to noncontrolling interests | — | — | — | — | — | — | (87 | ) | (87 | ) | |||||||||||||||||||||
Other | 21 | — | — | (2 | ) | — | 19 | 3 | 22 | ||||||||||||||||||||||
Net increase (decrease) in equity | 9,363 | 771 | (1,011 | ) | (6,662 | ) | (174 | ) | 2,287 | (6,366 | ) | (4,079 | ) | ||||||||||||||||||
Balance – December 31, 2015 | 19,730 | 771 | — | 2,552 | (172 | ) | 22,881 | 1,725 | 24,606 | ||||||||||||||||||||||
Net income (loss) | (57 | ) | (2 | ) | — | 490 | — | 431 | 88 | 519 | |||||||||||||||||||||
Other comprehensive income (loss) | — | — | — | — | 171 | 171 | — | 171 | |||||||||||||||||||||||
Noncash consideration from The Williams Companies, Inc. (Note 2) | — | — | — | (150 | ) | — | (150 | ) | — | (150 | ) | ||||||||||||||||||||
Sales of common units (Note 14) | 624 | — | — | — | — | 624 | — | 624 | |||||||||||||||||||||||
Distributions to partners | (2,007 | ) | — | — | (533 | ) | — | (2,540 | ) | — | (2,540 | ) | |||||||||||||||||||
Contributions from general partner | — | — | — | 26 | — | 26 | — | 26 | |||||||||||||||||||||||
Contributions from noncontrolling interests | — | — | — | — | — | — | 29 | 29 | |||||||||||||||||||||||
Distributions to noncontrolling interests | — | — | — | — | — | — | (92 | ) | (92 | ) | |||||||||||||||||||||
Other | 10 | — | — | — | — | 10 | — | 10 | |||||||||||||||||||||||
Net increase (decrease) in equity | (1,430 | ) | (2 | ) | — | (167 | ) | 171 | (1,428 | ) | 25 | (1,403 | ) | ||||||||||||||||||
Balance – December 31, 2016 | 18,300 | 769 | — | 2,385 | (1 | ) | 21,453 | 1,750 | 23,203 | ||||||||||||||||||||||
Net income (loss) | 856 | 15 | — | — | — | 871 | 104 | 975 | |||||||||||||||||||||||
Other comprehensive income (loss) | — | — | — | — | (4 | ) | (4 | ) | — | (4 | ) | ||||||||||||||||||||
Conversion to noneconomic general partner interest (Note 1) | 2,385 | — | — | (2,385 | ) | — | — | — | — | ||||||||||||||||||||||
Distributions to The Williams Companies, Inc. - net | (3 | ) | — | — | — | — | (3 | ) | — | (3 | ) | ||||||||||||||||||||
Sales of common units (Note 1) | 2,245 | — | — | — | — | 2,245 | — | 2,245 | |||||||||||||||||||||||
Distributions to partners | (2,532 | ) | — | — | — | — | (2,532 | ) | — | (2,532 | ) | ||||||||||||||||||||
Contributions from noncontrolling interests | — | — | — | — | — | — | 17 | 17 | |||||||||||||||||||||||
Distributions to noncontrolling interests | — | — | — | — | — | — | (212 | ) | (212 | ) | |||||||||||||||||||||
Net increase (decrease) in equity | 2,951 | 15 | — | (2,385 | ) | (4 | ) | 577 | (91 | ) | 486 | ||||||||||||||||||||
Balance – December 31, 2017 | $ | 21,251 | $ | 784 | $ | — | $ | — | $ | (5 | ) | $ | 22,030 | $ | 1,659 | $ | 23,689 | ||||||||||||||
See accompanying notes.
88
Williams Partners L.P.
Consolidated Statement of Cash Flows
Years Ended December 31, | |||||||||||
2017 | 2016 | 2015 | |||||||||
(Millions) | |||||||||||
OPERATING ACTIVITIES: | |||||||||||
Net income (loss) | $ | 975 | $ | 519 | $ | (1,358 | ) | ||||
Adjustments to reconcile to net cash provided (used) by operating activities: | |||||||||||
Depreciation and amortization | 1,700 | 1,720 | 1,702 | ||||||||
Provision (benefit) for deferred income taxes | (4 | ) | (83 | ) | 4 | ||||||
Net (gain) loss on disposition of equity-method investments | (269 | ) | (27 | ) | — | ||||||
Impairment of goodwill | — | — | 1,098 | ||||||||
Impairment of equity-method investments | — | 430 | 1,359 | ||||||||
Impairment of and net (gain) loss on sale of assets and businesses | 1,156 | 481 | 150 | ||||||||
Gain on sale of Geismar Interest (Note 2) | (1,095 | ) | — | — | |||||||
Amortization of stock-based awards | 8 | 20 | 27 | ||||||||
Regulatory charges resulting from Tax Reform (Note 1) | 713 | — | — | ||||||||
Cash provided (used) by changes in current assets and liabilities: | |||||||||||
Accounts and notes receivable | (96 | ) | 80 | (67 | ) | ||||||
Inventories | 8 | (20 | ) | 105 | |||||||
Other current assets and deferred charges | (16 | ) | (2 | ) | 2 | ||||||
Accounts payable | 126 | 15 | (126 | ) | |||||||
Accrued liabilities | (72 | ) | 503 | (15 | ) | ||||||
Affiliate accounts receivable and payable – net | 24 | (37 | ) | — | |||||||
Other, including changes in noncurrent assets and liabilities | (318 | ) | 349 | (218 | ) | ||||||
Net cash provided (used) by operating activities | 2,840 | 3,948 | 2,663 | ||||||||
FINANCING ACTIVITIES: | |||||||||||
Proceeds from (payments of) commercial paper – net | (93 | ) | (409 | ) | (306 | ) | |||||
Proceeds from long-term debt | 1,698 | 4,248 | 7,675 | ||||||||
Payments of long-term debt | (3,785 | ) | (4,936 | ) | (4,699 | ) | |||||
Proceeds from sales of common units | 2,184 | 614 | 59 | ||||||||
Contributions from general partner | — | 26 | 14 | ||||||||
Distributions paid | (2,471 | ) | (2,531 | ) | (2,686 | ) | |||||
Distributions to noncontrolling interests | (212 | ) | (92 | ) | (87 | ) | |||||
Contributions from noncontrolling interests | 17 | 29 | 111 | ||||||||
Contributions from (distributions to) The Williams Companies, Inc. – net | (3 | ) | — | 20 | |||||||
Payments for debt issuance costs | (16 | ) | (9 | ) | (33 | ) | |||||
Special distribution from Gulfstream | — | — | 396 | ||||||||
Contribution to Gulfstream for repayment of debt | — | (148 | ) | (248 | ) | ||||||
Other – net | (83 | ) | (10 | ) | (3 | ) | |||||
Net cash provided (used) by financing activities | (2,764 | ) | (3,218 | ) | 213 | ||||||
INVESTING ACTIVITIES: | |||||||||||
Property, plant, and equipment: | |||||||||||
Capital expenditures (1) | (2,374 | ) | (1,944 | ) | (2,795 | ) | |||||
Dispositions – net | (41 | ) | 6 | 3 | |||||||
Contributions in aid of construction | 426 | 218 | 87 | ||||||||
Proceeds from sale of businesses, net of cash divested | 2,070 | 672 | — | ||||||||
Proceeds from dispositions of equity-method investments | 200 | 34 | — | ||||||||
Purchases of businesses, net of cash acquired | — | — | (112 | ) | |||||||
Purchases of and contributions to equity-method investments | (132 | ) | (177 | ) | (594 | ) | |||||
Distributions from unconsolidated affiliates in excess of cumulative earnings | 529 | 472 | 404 | ||||||||
Other – net | (18 | ) | 38 | 56 | |||||||
Net cash provided (used) by investing activities | 660 | (681 | ) | (2,951 | ) | ||||||
Increase (decrease) in cash and cash equivalents | 736 | 49 | (75 | ) | |||||||
Cash and cash equivalents at beginning of year | 145 | 96 | 171 | ||||||||
Cash and cash equivalents at end of year | $ | 881 | $ | 145 | $ | 96 | |||||
_________ | |||||||||||
(1) Increases to property, plant, and equipment | $ | (2,639 | ) | $ | (1,871 | ) | $ | (2,649 | ) | ||
Changes in related accounts payable and accrued liabilities | 265 | (73 | ) | (146 | ) | ||||||
Capital expenditures | $ | (2,374 | ) | $ | (1,944 | ) | $ | (2,795 | ) | ||
See accompanying notes.
89
Williams Partners L.P. | ||
Notes to Consolidated Financial Statements | ||
Note 1 – General, Description of Business, Basis of Presentation, and Summary of Significant Accounting Policies
General
Unless the context clearly indicates otherwise, references in this report to “we,” “our,” “us,” or like terms refer to Williams Partners L.P. (WPZ) and its subsidiaries. Unless the context clearly indicates otherwise, references to “we,” “our,” and “us” include the operations in which we own interests accounted for as equity-method investments that are not consolidated in our financial statements. When we refer to our equity investees by name, we are referring exclusively to their businesses and operations.
We are a Delaware limited partnership whose common units are listed and traded on the New York Stock Exchange. WPZ GP LLC, a Delaware limited liability company wholly owned by The Williams Companies, Inc. (Williams), serves as our general partner. Our operations are located in the United States.
Financial Repositioning
In January 2017, we entered into agreements with Williams, wherein Williams permanently waived the general partner’s incentive distribution rights (IDRs) and converted its 2 percent general partner interest in us to a noneconomic interest in exchange for 289 million newly issued common units. Pursuant to this agreement, Williams also purchased approximately 277 thousand common units for $10 million. Additionally, Williams purchased approximately 59 million common units at a price of $36.08586 per unit in a private placement transaction. According to the terms of this agreement, concurrent with our quarterly distributions in February 2017 and May 2017, Williams paid additional consideration totaling $56 million to us for these units. Following these transactions and as of December 31, 2017, Williams owns a 74 percent limited partner interest in us.
Public Unit Exchange
On May 12, 2015, we entered into an agreement for a unit-for-stock transaction whereby Williams would have acquired all of our publicly held outstanding common units in exchange for shares of Williams’ common stock (WPZ Public Unit Exchange).
On September 28, 2015, we entered into a Termination Agreement and Release (Termination Agreement), terminating the WPZ Public Unit Exchange. Under the terms of the Termination Agreement, Williams was required to pay us a $428 million termination fee, which settled through a reduction of quarterly incentive distributions payable to Williams (such reduction not to exceed $209 million per quarter). Our November 2015, February 2016, and May 2016 distributions to Williams were reduced by $209 million, $209 million, and $10 million, respectively, related to this termination fee.
ACMP Merger
On February 2, 2015, Williams Partners L.P. merged with and into Access Midstream Partners, L.P. (ACMP Merger). For the purpose of these financial statements and notes, Williams Partners L.P. (WPZ) refers to the renamed merged partnership, while Pre-merger Access Midstream Partners, L.P. (ACMP) and Pre-merger Williams Partners L.P. (Pre-merger WPZ) refer to the separate partnerships prior to the consummation of the ACMP Merger and subsequent name change. The net assets of Pre-merger WPZ and ACMP were combined at Williams’ historical basis.
Description of Business
Consistent with the manner in which our chief operating decision maker evaluates performance and allocates resources, our operations are organized into the following reportable segments: Northeast G&P, Atlantic-Gulf, West, and NGL & Petchem Services. Certain other corporate activities are included in Other.
90
Williams Partners L.P. | ||
Notes to Consolidated Financial Statements – (Continued) | ||
Northeast G&P is comprised of our midstream gathering and processing businesses in the Marcellus Shale region primarily in Pennsylvania, New York, and West Virginia and the Utica Shale region of eastern Ohio, as well as a 66 percent interest in Cardinal Gas Services, L.L.C. (Cardinal) (a consolidated entity), a 62 percent equity-method investment in Utica East Ohio Midstream, LLC (UEOM), a 69 percent equity-method investment in Laurel Mountain Midstream, LLC (Laurel Mountain), a 58 percent equity-method investment in Caiman Energy II, LLC (Caiman II), and Appalachia Midstream Services, LLC, which owns equity-method investments with an approximate average 66 percent interest in multiple gathering systems in the Marcellus Shale (Appalachia Midstream Investments).
Atlantic-Gulf is comprised of our interstate natural gas pipeline, Transcontinental Gas Pipe Line Company, LLC (Transco), and significant natural gas gathering and processing and crude oil production handling and transportation assets in the Gulf Coast region, including a 51 percent interest in Gulfstar One LLC (Gulfstar One) (a consolidated entity), which is a proprietary floating production system, and various petrochemical and feedstock pipelines in the Gulf Coast region, as well as a 50 percent equity-method investment in Gulfstream Natural Gas System, L.L.C. (Gulfstream), a 41 percent interest in Constitution Pipeline Company, LLC (Constitution) (a consolidated entity), which is developing a pipeline project (see Note 3 – Variable Interest Entities), and a 60 percent equity-method investment in Discovery Producer Services LLC (Discovery).
West is comprised of our interstate natural gas pipeline, Northwest Pipeline LLC (Northwest Pipeline), and our gathering, processing, and treating operations in New Mexico, Colorado, and Wyoming, as well as the Barnett Shale region of north-central Texas, the Eagle Ford Shale region of south Texas, the Haynesville Shale region of northwest Louisiana, and the Mid-Continent region which includes the Anadarko, Arkoma, Delaware, and Permian basins. This segment also includes our NGL and natural gas marketing business, storage facilities, an undivided 50 percent interest in an NGL fractionator near Conway, Kansas, and a 50 percent equity-method investment in Overland Pass Pipeline, LLC (OPPL), as well as our previously owned 50 percent equity-method investment in the Delaware basin gas gathering system (DBJV) in the Mid-Continent region (see Note 6 – Investing Activities).
NGL & Petchem Services is comprised of previously owned operations, including our 88.5 percent undivided interest in an olefins production facility in Geismar, Louisiana, which was sold in July 2017, and our refinery grade propylene splitter in the Gulf region, which was sold in June 2017. This segment also includes our previously owned Canadian assets, which included an oil sands offgas processing plant located near Fort McMurray, Alberta, and a natural gas liquid (NGL)/olefin fractionation facility at Redwater, Alberta. In September 2016, these Canadian operations were sold. (See Note 2 – Acquisitions and Divestitures.)
Basis of Presentation
Prior to the ACMP Merger, Williams owned certain limited partnership interests in both Pre-merger WPZ and ACMP, as well as 100 percent of the general partners of both partnerships. Due to the ownership of the general partners, Williams controlled both partnerships.
ACMP Merger
The ACMP Merger has been accounted for as a combination between entities under common control, with Pre-merger WPZ representing the predecessor entity. As such, the accompanying financial statements represent a continuation of Pre-merger WPZ, the accounting acquirer, except for certain adjustments to give effect to the exchange ratio applied to Pre-merger WPZ’s historically outstanding units. Because the ACMP Merger was between entities under common control, it was treated similar to a pooling of interests whereby the historical results of operations for ACMP were combined with those of Pre-merger WPZ for periods under common control.
Historical earnings of ACMP prior to the ACMP Merger have been presented herein as allocated to either the capital account of the general partner for interests owned by Williams or to noncontrolling interests for interests held by the public. Thus, there was no change in the total amount of historical earnings attributable to common unitholders. In conjunction with the ACMP Merger, the partners’ equity interests in ACMP have been reclassified out of the capital account of the general partner for interests owned by Williams and noncontrolling interests for interests held by the
91
Williams Partners L.P. | ||
Notes to Consolidated Financial Statements – (Continued) | ||
public and into the capital accounts of common and Class B interests as Contributions from The Williams Companies, Inc. - net within the Consolidated Statement of Changes in Equity.
Significant risks and uncertainties
We may monetize assets that are not core to our strategy which could result in impairments of certain equity-method investments, property, plant, and equipment, and intangible assets. Such impairments could potentially be caused by indications of fair value implied through the monetization process or, in the case of asset dispositions that are part of a broader asset group, the impact of the loss of future estimated cash flows.
Summary of Significant Accounting Policies
Principles of consolidation
The consolidated financial statements include the accounts of all entities that we control and our proportionate interest in the accounts of certain ventures in which we own an undivided interest. Our judgment is required to evaluate whether we control an entity. Key areas of that evaluation include:
• | Determining whether an entity is a variable interest entity (VIE); |
• | Determining whether we are the primary beneficiary of a VIE, including evaluating which activities of the VIE most significantly impact its economic performance and the degree of power that we and our related parties have over those activities through our variable interests; |
• | Identifying events that require reconsideration of whether an entity is a VIE and continuously evaluating whether we are a VIE’s primary beneficiary; |
• | Evaluating whether other owners in entities that are not VIEs are able to effectively participate in significant decisions that would be expected to be made in the ordinary course of business such that we do not have the power to control such entities. |
We apply the equity method of accounting to investments over which we exercise significant influence but do not control.
Common control transactions
Entities and assets acquired from Williams and its affiliates are accounted for as common control transactions whereby the net assets acquired are combined with ours at their historical amounts. If any cash consideration transferred to Williams in such a transaction exceeds the carrying value of the net assets acquired, the excess is treated as a capital transaction with our general partner, similar to a dividend. If the carrying value of the net assets acquired exceeds any cash consideration transferred and limited partner units are also issued as consideration, then the limited partner units are recorded at an amount equal to the excess of the carrying value of the net assets acquired over any cash consideration transferred. To the extent that such transactions require prior periods to be recast, historical net equity amounts prior to the transaction date are reflected in the account of the general partner or noncontrolling interests, if applicable. Cash consideration up to the carrying value of net assets acquired is presented as an investing activity in our Consolidated Statement of Cash Flows. Cash consideration in excess of the carrying value of net assets acquired is presented as a financing activity in our Consolidated Statement of Cash Flows.
Equity-method investment basis differences
Differences between the cost of our equity-method investments and our underlying equity in the net assets of investees are accounted for as if the investees were consolidated subsidiaries. Equity earnings (losses) in the
92
Williams Partners L.P. | ||
Notes to Consolidated Financial Statements – (Continued) | ||
Consolidated Statement of Comprehensive Income (Loss) includes our allocable share of net income (loss) of investees adjusted for any depreciation and amortization, as applicable, associated with basis differences.
Use of estimates
The preparation of financial statements in conformity with accounting principles generally accepted in the United States requires us to make estimates and assumptions that affect the amounts reported in the consolidated financial statements and accompanying notes. Actual results could differ from those estimates.
Significant estimates and assumptions include:
• | Impairment assessments of investments, property, plant, and equipment, goodwill, and other identifiable intangible assets; |
• | Litigation-related contingencies; |
• | Environmental remediation obligations; |
• | Depreciation and/or amortization of equity-method investment basis differences; |
• | Asset retirement obligations; |
• | Measurement of regulatory liabilities. |
These estimates are discussed further throughout these notes.
Regulatory accounting
Transco and Northwest Pipeline are regulated by the Federal Energy Regulatory Commission (FERC). Their rates, which are established by the FERC, are designed to recover the costs of providing the regulated services, and their competitive environment makes it probable that such rates can be charged and collected. Therefore, we have determined that it is appropriate under Accounting Standards Codification (ASC) Topic 980, “Regulated Operations,” to account for and report regulatory assets and liabilities related to these operations consistent with the economic effect of the way in which their rates are established. Accounting for these operations that are regulated can differ from the accounting requirements for nonregulated operations. For example, for regulated operations, allowance for funds used during construction (AFUDC) represents the estimated cost of debt and equity funds applicable to utility plant in the process of construction and is capitalized as a cost of property, plant, and equipment because it constitutes an actual cost of construction under established regulatory practices; nonregulated operations are only allowed to capitalize the cost of debt funds related to construction activities, while a component for equity is prohibited. The components of our regulatory assets and liabilities relate to the effects of deferred taxes on equity funds used during construction, asset retirement obligations, fuel cost differentials, levelized incremental depreciation, negative salvage, pension and other postretirement benefits, and rate allowances for deferred income taxes at a historically higher federal income tax rate.
In December 2017, the Tax Cuts and Jobs Act was enacted, which, among other things, reduced the federal corporate income tax rate from 35 percent to 21 percent (Tax Reform). In accordance with ASC 980-740-25-2, Transco and Northwest Pipeline have recognized regulatory liabilities to reflect the probable return to customers through future rates of the future decrease in income taxes payable associated with Tax Reform. These liabilities represent an obligation to return amounts directly to our customers. While a majority of our customers have entered into tariff rates based on our cost-of-service proceedings and related rate base therein, certain other contracts with customers reflect contractually-based rates that are designed to recover the cost of providing those services, including an allowance for income taxes, with no expected future rate adjustment for the term of those contracts. This relative mix of contracts for services was considered in determining the probable amount to be returned to customers through future rates. The regulatory liabilities were recorded in December 2017 through regulatory charges to operating income totaling $674 million. The timing
93
Williams Partners L.P. | ||
Notes to Consolidated Financial Statements – (Continued) | ||
and actual amount of such return will be subject to future negotiations regarding this matter and many other elements of cost-of-service rate proceedings, including other costs of providing service.
Certain of our equity-method investees recorded similar regulatory liabilities, for which our Equity earnings (losses) in the Consolidated Statement of Comprehensive Income (Loss) have been reduced by $11 million related to our proportionate share of the associated regulatory charges.
Our regulatory assets associated with the effects of deferred taxes on equity funds used during construction were also impacted by Tax Reform and were reduced by $39 million in December 2017 through a charge to Other income (expense) – net below Operating income (loss) in the Consolidated Statement of Comprehensive Income (Loss) (see Note 7 – Other Income and Expenses). This amount, along with the previously described charges for establishing the regulatory liabilities resulting from Tax Reform, is reported within Regulatory charges resulting from Tax Reform within the Consolidated Statement of Cash Flows.
Our current and noncurrent regulatory asset and liability balances for the years ended December 31, 2017 and 2016 are as follows:
December 31, | |||||||
2017 | 2016 | ||||||
(Millions) | |||||||
Current assets reported within Other current assets and deferred charges | $ | 102 | $ | 91 | |||
Noncurrent assets reported within Regulatory assets, deferred charges, and other | 299 | 299 | |||||
Total regulated assets | $ | 401 | $ | 390 | |||
Current liabilities reported within Other accrued liabilities | $ | 18 | $ | 11 | |||
Noncurrent liabilities reported within Regulatory liabilities and other | 1,234 | 480 | |||||
Total regulated liabilities | $ | 1,252 | $ | 491 | |||
Cash and cash equivalents
Cash and cash equivalents in the Consolidated Balance Sheet includes amounts primarily invested in funds with high-quality, short-term securities and instruments that are issued or guaranteed by the U.S. government. These have maturity dates of three months or less when acquired.
Accounts receivable
Accounts receivable are carried on a gross basis, with no discounting, less an allowance for doubtful accounts. We estimate the allowance for doubtful accounts based on existing economic conditions, the financial condition of our customers, and the amount and age of past due accounts. We consider receivables past due if full payment is not received by the contractual due date. Interest income related to past due accounts receivable is generally recognized at the time full payment is received or collectability is assured. Past due accounts are generally written off against the allowance for doubtful accounts only after all collection attempts have been exhausted.
Inventories
Inventories in the Consolidated Balance Sheet consist of natural gas liquids, olefins, natural gas in underground storage, and materials and supplies and are stated at the lower of cost or net realizable value. The cost of inventories is primarily determined using the average-cost method.
Property, plant, and equipment
Property, plant, and equipment is initially recorded at cost. We base the carrying value of these assets on estimates, assumptions, and judgments relative to capitalized costs, useful lives, and salvage values.
94
Williams Partners L.P. | ||
Notes to Consolidated Financial Statements – (Continued) | ||
As regulated entities, Northwest Pipeline and Transco provide for depreciation using the straight-line method at FERC-prescribed rates. Depreciation for nonregulated entities is provided primarily on the straight-line method over estimated useful lives, except for certain offshore facilities that apply an accelerated depreciation method.
Gains or losses from the ordinary sale or retirement of property, plant, and equipment for regulated pipelines are credited or charged to accumulated depreciation. Other gains or losses are recorded in Other (income) expense – net included in Operating income (loss) in the Consolidated Statement of Comprehensive Income (Loss).
Ordinary maintenance and repair costs are generally expensed as incurred. Costs of major renewals and replacements are capitalized as property, plant, and equipment.
We record a liability and increase the basis in the underlying asset for the present value of each expected future asset retirement obligation (ARO) at the time the liability is initially incurred, typically when the asset is acquired or constructed. As regulated entities, Northwest Pipeline and Transco offset the depreciation of the underlying asset that is attributable to capitalized ARO cost to a regulatory asset as we expect to recover these amounts in future rates. We measure changes in the liability due to passage of time by applying an interest rate to the liability balance. This amount is recognized as an increase in the carrying amount of the liability and as a corresponding accretion expense included in Operating and maintenance expenses in the Consolidated Statement of Comprehensive Income (Loss), except for regulated entities, for which the liability is offset by a regulatory asset. The regulatory asset is amortized commensurate with our collection of those costs in rates.
Measurements of AROs include, as a component of future expected costs, an estimate of the price that a third party would demand, and could expect to receive, for bearing the uncertainties inherent in the obligations, sometimes referred to as a market-risk premium.
Goodwill
Goodwill included within Intangible assets – net of accumulated amortization in the Consolidated Balance Sheet represents the excess of the consideration, plus the fair value of any noncontrolling interest or any previously held equity interest, over the fair value of the net assets acquired. It is not subject to amortization but is evaluated annually as of October 1 for impairment or more frequently if impairment indicators are present that would indicate it is more likely than not that the fair value of the reporting unit is less than its carrying amount. Generally, the evaluation of goodwill for impairment involves a two-step quantitative test, although under certain circumstances an initial qualitative evaluation may be sufficient to conclude goodwill is not impaired. If a quantitative assessment is performed, we compare our estimate of the fair value of the reporting unit with its carrying value, including goodwill. If the carrying value of the reporting unit exceeds its fair value, a computation of the implied fair value of the goodwill is compared with its related carrying value. If the carrying value of the reporting unit goodwill exceeds the implied fair value of that goodwill, an impairment loss is recognized in the amount of the excess. Judgments and assumptions are inherent in our estimate of fair value. Effective October 1, 2017, we early adopted Accounting Standards Update (ASU) 2017-04 “Intangibles - Goodwill and Other (Topic 350): Simplifying the Test for Goodwill Impairment” (ASU 2017-04), which removed the computation of the implied fair value of goodwill from the measurement process.
Other intangible assets
Our identifiable intangible assets included within Intangible assets – net of accumulated amortization in the Consolidated Balance Sheet are primarily related to gas gathering, processing, and fractionation contractual customer relationships. Our intangible assets are amortized on a straight-line basis over the period in which these assets contribute to our cash flows. We evaluate these assets for changes in the expected remaining useful lives and would reflect any changes prospectively through amortization over the revised remaining useful life.
Impairment of property, plant, and equipment, other identifiable intangible assets, and investments
We evaluate our property, plant, and equipment and other identifiable intangible assets for impairment when events or changes in circumstances indicate, in our judgment, that the carrying value of such assets may not be recoverable.
95
Williams Partners L.P. | ||
Notes to Consolidated Financial Statements – (Continued) | ||
When an indicator of impairment has occurred, we compare our estimate of undiscounted future cash flows attributable to the assets to the carrying value of the assets to determine whether an impairment has occurred and we may apply a probability-weighted approach to consider the likelihood of different cash flow assumptions and possible outcomes including selling in the near term or holding for the remaining estimated useful life. If an impairment of the carrying value has occurred, we determine the amount of the impairment recognized in the financial statements by estimating the fair value of the assets and recording a loss for the amount that the carrying value exceeds the estimated fair value. This evaluation is performed at the lowest level for which separately identifiable cash flows exist.
For assets identified to be disposed of in the future and considered held for sale, we compare the carrying value to the estimated fair value less the cost to sell to determine if recognition of an impairment is required. Until the assets are disposed of, the estimated fair value, which includes estimated cash flows from operations until the assumed date of sale, is recalculated when related events or circumstances change.
We evaluate our investments for impairment when events or changes in circumstances indicate, in our judgment, that the carrying value of such investments may have experienced an other-than-temporary decline in value. When evidence of loss in value has occurred, we compare our estimate of fair value of the investment to the carrying value of the investment to determine whether an impairment has occurred. If the estimated fair value is less than the carrying value and we consider the decline in value to be other-than-temporary, the excess of the carrying value over the fair value is recognized in the consolidated financial statements as an impairment charge.
Judgments and assumptions are inherent in our estimate of undiscounted future cash flows and an asset’s or investment’s fair value. Additionally, judgment is used to determine the probability of sale with respect to assets considered for disposal.
Deferred income
We record a liability for deferred income related to cash received from customers in advance of providing our services. Such amounts are generally recognized in revenue upon satisfying our performance obligations, primarily providing services based on units of production or over remaining contractual service periods ranging from 1 to 25 years. Deferred income is reflected within Other accrued liabilities and Long-term deferred income on the Consolidated Balance Sheet. (See Note 12 – Other Accrued Liabilities.)
We received an aggregate amount of $240 million in three equal installments as certain milestones of Transco’s Hillabee Expansion Project were met related to an agreement to resolve several matters in relation to the project. (See Note 12 – Other Accrued Liabilities.) During the third quarter of 2017, WPZ received the final installment and placed the project into service. As a result of placing the project into service, WPZ reclassified the refundable deposits to deferred income and expects to recognize income associated with these receipts over the term of an underlying contract.
During 2016, we received cash proceeds totaling $820 million associated with restructuring certain gas gathering contracts in the Barnett Shale and Mid-Continent regions. The proceeds were recorded as deferred income and are being amortized into income.
In October 2016, we received $104 million of newly constructed assets as part of a noncash investing transaction with a customer for which we provide production handling and other services. The transaction was recorded in Property, plant, and equipment – net and deferred income in the Consolidated Balance Sheet and is being amortized based on units of production through 2024. Due to the noncash nature of this transaction, it is not presented within the Consolidated Statement of Cash Flows.
Contingent liabilities
We record liabilities for estimated loss contingencies, including environmental matters, when we assess that a loss is probable and the amount of the loss can be reasonably estimated. These liabilities are calculated based upon our assumptions and estimates with respect to the likelihood or amount of loss and upon advice of legal counsel, engineers,
96
Williams Partners L.P. | ||
Notes to Consolidated Financial Statements – (Continued) | ||
or other third parties regarding the probable outcomes of the matters. These calculations are made without consideration of any potential recovery from third parties. We recognize insurance recoveries or reimbursements from others when realizable. Revisions to these liabilities are generally reflected in income when new or different facts or information become known or circumstances change that affect the previous assumptions or estimates.
Cash flows from revolving credit facility and commercial paper program
Proceeds and payments related to borrowings under our credit facility are reflected in the financing activities in the Consolidated Statement of Cash Flows on a gross basis. Proceeds and payments related to borrowings under our commercial paper program are reflected in the financing activities in the Consolidated Statement of Cash Flows on a net basis, as the outstanding notes generally have maturity dates less than three months from the date of issuance. (See Note 13 – Debt, Banking Arrangements, and Leases.)
Derivative instruments and hedging activities
We may utilize derivatives to manage a portion of our commodity price risk. These instruments consist primarily of swaps, futures, and forward contracts involving short- and long-term purchases and sales of energy commodities. We report the fair value of derivatives, except those for which the normal purchases and normal sales exception has been elected, in Other current assets and deferred charges; Regulatory assets, deferred charges, and other; Other accrued liabilities; or Regulatory liabilities and other in the Consolidated Balance Sheet. We determine the current and noncurrent classification based on the timing of expected future cash flows of individual trades. We report these amounts on a gross basis. Additionally, we report cash collateral receivables and payables with our counterparties on a gross basis. (See Note 16 – Fair Value Measurements, Guarantees, and Concentration of Credit Risk.)
The accounting for the changes in fair value of a commodity derivative can be summarized as follows:
Derivative Treatment | Accounting Method | |
Normal purchases and normal sales exception | Accrual accounting | |
Designated in a qualifying hedging relationship | Hedge accounting | |
All other derivatives | Mark-to-market accounting | |
We may elect the normal purchases and normal sales exception for certain short- and long-term purchases and sales of physical energy commodities. Under accrual accounting, any change in the fair value of these derivatives is not reflected on the balance sheet after the initial election of the exception.
We may also designate a hedging relationship for certain commodity derivatives. For a derivative to qualify for designation in a hedging relationship, it must meet specific criteria and we must maintain appropriate documentation. We establish hedging relationships pursuant to our risk management policies. We evaluate the hedging relationships at the inception of the hedge and on an ongoing basis to determine whether the hedging relationship is, and is expected to remain, highly effective in achieving offsetting changes in fair value or cash flows attributable to the underlying risk being hedged. We also regularly assess whether the hedged forecasted transaction is probable of occurring. If a derivative ceases to be or is no longer expected to be highly effective, or if we believe the likelihood of occurrence of the hedged forecasted transaction is no longer probable, hedge accounting is discontinued prospectively, and future changes in the fair value of the derivative are recognized currently in Product sales or Product costs in the Consolidated Statement of Comprehensive Income (Loss).
For commodity derivatives designated as a cash flow hedge, the effective portion of the change in fair value of the derivative is reported in Accumulated other comprehensive income (loss) (AOCI) in the Consolidated Balance Sheet and reclassified into earnings in the period in which the hedged item affects earnings. Any ineffective portion of the derivative’s change in fair value is recognized currently in Product sales or Product costs in the Consolidated Statement of Comprehensive Income (Loss). Gains or losses deferred in AOCI associated with terminated derivatives, derivatives that cease to be highly effective hedges, derivatives for which the forecasted transaction is reasonably possible but no
97
Williams Partners L.P. | ||
Notes to Consolidated Financial Statements – (Continued) | ||
longer probable of occurring, and cash flow hedges that have been otherwise discontinued remain in AOCI until the hedged item affects earnings. If it becomes probable that the forecasted transaction designated as the hedged item in a cash flow hedge will not occur, any gain or loss deferred in AOCI is recognized in Product sales or Product costs in the Consolidated Statement of Comprehensive Income (Loss) at that time. The change in likelihood of a forecasted transaction is a judgmental decision that includes qualitative assessments made by us.
For commodity derivatives that are not designated in a hedging relationship, and for which we have not elected the normal purchases and normal sales exception, we report changes in fair value currently in Product sales or Product costs in the Consolidated Statement of Comprehensive Income (Loss).
Certain gains and losses on derivative instruments included in the Consolidated Statement of Comprehensive Income (Loss) are netted together to a single net gain or loss, while other gains and losses are reported on a gross basis. Gains and losses recorded on a net basis include unrealized gains and losses on all derivatives that are not designated as hedges and for which we have not elected the normal purchases and normal sales exception.
Realized gains and losses on derivatives that require physical delivery, as well as natural gas derivatives for NGL processing activities and which are not held for trading purposes nor were entered into as a pre-contemplated buy/sell arrangement, are recorded on a gross basis.
Revenue recognition
Revenues
As a result of the ratemaking process, certain revenues collected by us may be subject to refunds upon the issuance of final orders by the FERC in pending rate proceedings. We record estimates of rate refund liabilities considering our and other third-party regulatory proceedings, advice of counsel, and other risks.
Service revenues
Revenues from our interstate natural gas pipeline businesses include services pursuant to long-term firm transportation and storage agreements. These agreements provide for a reservation charge based on the volume of contracted capacity and a commodity charge based on the volume of gas delivered, both at rates specified in our FERC tariffs. We recognize revenues for reservation charges ratably over the contract period regardless of the volume of natural gas that is transported or stored. Revenues for commodity charges, from both firm and interruptible transportation services and storage injection and withdrawal services, are recognized when natural gas is delivered at the agreed upon delivery point or when natural gas is injected or withdrawn from the storage facility.
Certain revenues from our midstream operations include those derived from natural gas gathering, processing, treating, and compression services and are performed under volumetric-based fee contracts. These revenues are recorded when services have been performed.
Certain of our gas gathering and processing agreements have minimum volume commitments. If a customer under such an agreement fails to meet its minimum volume commitment for a specified period, generally measured on an annual basis, it is obligated to pay a contractually determined fee based upon the shortfall between actual production volumes and the minimum volume commitment for that period. The revenue associated with minimum volume commitments is recognized in the period that the actual shortfall is determined and is no longer subject to future reduction or offset, which is generally at the end of the annual period or fourth quarter.
Crude oil gathering and transportation revenues and offshore production handling fees are recognized when the services have been performed. Certain offshore production handling contracts contain fixed payment terms that result in the deferral of revenues until such services have been performed or such capacity has been made available.
98
Williams Partners L.P. | ||
Notes to Consolidated Financial Statements – (Continued) | ||
Storage revenues from our midstream operations associated with prepaid contracted storage capacity contracts are recognized on a straight-line basis over the life of the contract as services are provided.
Product sales
In the course of providing transportation services to customers of our interstate natural gas pipeline businesses, we may receive different quantities of gas from shippers than the quantities delivered on behalf of those shippers. The resulting imbalances are primarily settled through the purchase and sale of gas with our customers under terms provided for in our FERC tariffs. Revenue is recognized from the sale of gas upon settlement of the transportation and exchange imbalances.
We market NGLs, crude oil, and natural gas that we purchase from our producer customers as part of the overall service provided to producers. Our revenues from marketing activities are recognized when the products have been sold and delivered.
Under our keep-whole and percent-of-liquids processing contracts, we retain the rights to all or a portion of the NGLs extracted from the producers’ natural gas stream and recognize revenues when the extracted NGLs are sold and delivered.
Our former domestic olefins business produced olefins from purchased or produced feedstock and we recognized revenues when the olefins were sold and delivered.
Our Canadian businesses that were sold in September 2016 had processing and fractionation operations where we retained certain NGLs and olefins from an upgrader’s offgas stream and we recognized revenues when the fractionated products were sold and delivered.
Interest capitalized
We capitalize interest during construction on major projects with construction periods of at least 3 months and a total project cost in excess of $1 million. Interest is capitalized on borrowed funds and, where regulation by the FERC exists, on internally generated funds (equity AFUDC). The latter is included in Other income (expense) – net below Operating income (loss) in the Consolidated Statement of Comprehensive Income (Loss). The rates used by regulated companies are calculated in accordance with FERC rules. Rates used by nonregulated companies are based on our average interest rate on debt.
Employee equity-based awards
We recognize compensation expense on employee equity-based awards on a straight-line basis; forfeitures are recognized when they occur. (See Note 15 – Equity-Based Compensation.)
Pension and other postretirement benefits
We do not have employees. Certain of the costs charged to us by Williams associated with employees who directly support us include costs related to Williams’ pension and other postretirement benefit plans. (See Note 9 – Benefit Plans.) Although the underlying benefit plans of Williams are single-employer plans, we follow multiemployer plan accounting whereby the amount charged to us, and thus paid by us, is based on our share of net periodic benefit cost.
Income taxes
We generally are not a taxable entity for income tax purposes, with the exception of Texas franchise tax and foreign income taxes associated with our Canadian operations, which were sold in September 2016. Other income taxes are generally borne by individual partners. Net income for financial statement purposes may differ significantly from taxable income of unitholders as a result of differences between the tax basis and financial reporting basis of assets and liabilities and the taxable income allocation requirements under our partnership agreement. The aggregated difference
99
Williams Partners L.P. | ||
Notes to Consolidated Financial Statements – (Continued) | ||
in the basis of our net assets for financial and tax reporting purposes cannot be readily determined because information regarding each partner’s tax attributes in us is not available to us.
Foreign deferred income taxes associated with our former Canadian operations have been computed using the liability method and have been provided on all temporary differences between the financial basis and the tax basis of the related assets and liabilities.
Earnings (loss) per common unit
We use the two-class method to calculate basic and diluted earnings (loss) per common unit whereby net income (loss), adjusted for items specifically allocated to our general partner, is allocated on a pro-rata basis between ownership interests. Basic and diluted earnings (loss) per common unit are based on the average number of common units outstanding. Diluted earnings (loss) per common unit includes any dilutive effect of nonvested restricted common units determined by the treasury-stock method, unless common unitholders are allocated a loss.
Foreign currency translation
Our former foreign subsidiaries used the Canadian dollar as their functional currency. Assets and liabilities of such foreign subsidiaries were translated at the spot rate in effect at the applicable reporting date, and the combined statements of comprehensive income (loss) were translated into the U.S. dollar at the average exchange rates in effect during the applicable period. The resulting cumulative translation adjustment was recorded as a separate component of AOCI in the Consolidated Balance Sheet.
Transactions denominated in currencies other than the functional currency were recorded based on exchange rates at the time such transactions arose. Subsequent changes in exchange rates when the transactions were settled resulted in transaction gains and losses which were reflected in Other (income) expense – net within Costs and expenses in the Consolidated Statement of Comprehensive Income (Loss). All of our Canadian operations were sold in September 2016.
Accounting standards issued and adopted
Effective October 1, 2017, we early adopted ASU 2017-04 “Intangibles - Goodwill and Other (Topic 350): Simplifying the Test for Goodwill Impairment.” ASU 2017-04 modified the concept of goodwill impairment to represent the amount by which a reporting unit’s carrying value exceeds its fair value, not to exceed the carrying amount of goodwill. Under ASU 2017-04, entities are no longer required to determine the implied fair value of goodwill by assigning the fair value of a reporting unit to its individual assets and liabilities as if that reporting unit had been acquired in a business combination. Our West reportable segment has $47 million of goodwill included in Intangible assets – net of accumulated amortization in the Consolidated Balance Sheet (see Note 11 – Goodwill and Other Intangible Assets).
Accounting standards issued but not yet adopted
In August 2017, the Financial Accounting Standards Board (FASB) issued ASU 2017-12 “Derivatives and Hedging (Topic 815): Targeted Improvements to Accounting for Hedging Activities” (ASU 2017-12). ASU 2017-12 applies to entities that elect hedge accounting in accordance with Accounting Standards Codification (ASC) 815. The ASU affects both the designation and measurement guidance for hedging relationships and the presentation of hedging results. ASU 2017-12 is effective for interim and annual periods beginning after December 15, 2018. Early adoption is permitted. ASU 2017-12 will be applied using a modified retrospective approach for cash flow and net investment hedges existing at the date of adoption and prospectively for the presentation and disclosure guidance. During the first quarter of 2018, we early adopted ASU 2017-12. The adoption did not have a significant impact on our consolidated financial statements.
In August 2016, the FASB issued ASU 2016-15 “Statement of Cash Flows (Topic 230): Classification of Certain Cash Receipts and Cash Payments” (ASU 2016-15). ASU 2016-15 provides specific guidance on eight cash flow classification issues, including debt prepayment or debt extinguishment costs and distributions received from equity method investees, to reduce diversity in practice. ASU 2016-15 is effective for interim and annual periods beginning
100
Williams Partners L.P. | ||
Notes to Consolidated Financial Statements – (Continued) | ||
after December 15, 2017. Early adoption is permitted. ASU 2016-15 requires a retrospective transition. We do not expect ASU 2016-15 to have a material impact on our consolidated financial statements.
In June 2016, the FASB issued ASU 2016-13 “Financial Instruments - Credit Losses (Topic 326): Measurement of Credit Losses on Financial Instruments” (ASU 2016-13). ASU 2016-13 changes the impairment model for most financial assets and certain other instruments. For trade and other receivables, held-to-maturity debt securities, loans, and other instruments, entities will be required to use a new forward-looking “expected loss” model that generally will result in the earlier recognition of allowances for losses. The guidance also requires increased disclosures. ASU 2016-13 is effective for interim and annual periods beginning after December 15, 2019. Early adoption is permitted. The standard requires varying transition methods for the different categories of amendments. Although we do not expect ASU 2016-13 to have a significant impact, it will impact our trade receivables as the related allowance for credit losses will be recognized earlier under the expected loss model.
In February 2016, the FASB issued ASU 2016-02 “Leases (Topic 842)” (ASU 2016-02). ASU 2016-02 establishes a comprehensive new lease accounting model. ASU 2016-02 modifies the definition of a lease, requires a dual approach to lease classification similar to current lease accounting, and causes lessees to recognize leases on the balance sheet as a lease liability measured as the present value of the future lease payments with a corresponding right-of-use asset, with an exception for leases with a term of one year or less. Additional disclosures will also be required regarding the amount, timing, and uncertainty of cash flows arising from leases. In January 2018, the FASB issued ASU 2018-01 “Leases (Topic 842): Land Easement Practical Expedient for Transition to Topic 842” (ASU 2018-01). Per ASU 2018-01, land easements and rights-of-way are required to be assessed under ASU 2016-02 to determine whether the arrangements are or contain a lease. ASU 2018-01 permits an entity to elect a transition practical expedient to not apply ASU 2016-02 to land easements that exist or expired before the effective date of ASU 2016-02 and that were not previously assessed under the previous lease guidance in ASC Topic 840 “Leases.” ASU 2016-02 is effective for interim and annual periods beginning after December 15, 2018. Early adoption is permitted. ASU 2016-02 currently requires a modified retrospective transition for financing or operating leases existing at or entered into after the beginning of the earliest comparative period presented in the financial statements.
In January 2018, the FASB proposed an accounting standard update titled “Leases (Topic 842): Targeted Improvements,” which is an update to ASU 2016-02 allowing entities an additional transition method to the existing requirements whereby an entity could adopt the provisions of ASU 2016-02 by recognizing a cumulative-effect adjustment to the opening balance of retained earnings in the period of adoption without adjustment to the financial statements for periods prior to adoption. We expect to adopt ASU 2016-02 effective January 1, 2019. We are in the process of reviewing contracts to identify leases based on the modified definition of a lease, implementing a financial lease accounting system, and evaluating internal control changes to support management in the accounting for and disclosure of leasing activities. While we are still in the process of completing our implementation evaluation of ASU 2016-02, we currently believe the most significant changes relate to the recognition of a lease liability and offsetting right-of-use asset in our consolidated balance sheet for operating leases. We are also evaluating ASU 2016-02’s currently available and proposed practical expedients on adoption.
In May 2014, the FASB issued ASU 2014-09 establishing ASC Topic 606, “Revenue from Contracts with Customers” (ASC 606). ASC 606 establishes a comprehensive new revenue recognition model designed to depict the transfer of goods or services to a customer in an amount that reflects the consideration the entity expects to be entitled to receive in exchange for those goods or services and requires significantly enhanced revenue disclosures. In August 2015, the FASB issued ASU 2015-14 “Revenue from Contracts with Customers (Topic 606): Deferral of the Effective Date” (ASU 2015-14). Per ASU 2015-14, the standard is effective for interim and annual reporting periods beginning after December 15, 2017. ASC 606 allows either full retrospective or modified retrospective transition and early adoption is permitted for annual periods beginning after December 15, 2016. We are adopting ASC 606 utilizing the modified retrospective transition approach, effective January 1, 2018, by recognizing the cumulative effect of initially applying ASC 606 for periods prior to January 1, 2018, which we expect to result in a decrease of approximately $315 million, to the opening balance of Total equity in the Consolidated Balance Sheet.
101
Williams Partners L.P. | ||
Notes to Consolidated Financial Statements – (Continued) | ||
We are in the final stages of evaluating the impact ASC 606 will have on our financial statements. For each revenue contract type, we have conducted a formal contract review process to evaluate the impact of ASC 606. We have substantially completed our evaluation. During the fourth quarter, we concluded on certain technical matters, including the evaluation of significant financing components, tiered pricing structures, and minimum volume commitments, and certain contracts for which we received prepayments for services. The adjustment to Total equity upon adoption of ASC 606 is primarily comprised of the impact to the timing of recognition of deferred revenue (contract liabilities) associated with certain contracts which underwent modifications in periods prior to January 1, 2018. Under the provisions of ASC 606, when a contract modification does not increase both the scope and price of the contract, and the remaining goods and services are distinct from the goods and services transferred prior to the modification, the modification is treated as a termination of the existing contract and the creation of a new contract. The new contract requires that the transaction price, including any remaining deferred revenue from the old contract, be allocated to the performance obligations over the term of the new contract. The contract modifications adjustments are partially offset by the impact of changes to the timing of recognizing revenue which is subject to the constraint on estimates of variable consideration of certain contracts. The constraint of variable consideration will result in the acceleration of revenue recognition and corresponding de-recognition of deferred revenue for certain contracts (as compared to the previous revenue recognition model) as a result of our assessment that it is probable such recognition would not result in a significant revenue reversal in the future. Additionally, under ASC 606, our revenues will increase in situations where we receive noncash consideration, which exists primarily in certain of our gas processing contracts where we receive commodities as full or partial consideration for services provided. This increase in revenues will be offset by a similar increase in costs and expenses when the commodities received are subsequently sold. Based on commodities received during 2017 as consideration for services and market prices during 2017, the increase in revenues and costs would have been approximately $350 million. Financial systems and internal controls necessary for adoption were implemented effective January 1, 2018.
Note 2 – Acquisitions and Divestitures
Eagle Ford Gathering System
In May 2015, we acquired a gathering system comprised of approximately 140 miles of pipeline and a sour gas compression facility in the Eagle Ford Shale, included in our West segment, for $112 million. The acquisition was accounted for as a business combination, and the allocation of the acquisition-date fair value of the major classes of assets acquired includes $80 million of Property, plant, and equipment – net and $32 million of Intangible assets – net of accumulated amortization in the Consolidated Balance Sheet. Changes to the preliminary allocation disclosed in the second quarter of 2015 reflect an increase of $20 million in Property, plant, and equipment – net, and a decrease of $20 million in Intangible assets – net of accumulated amortization.
Sale of Geismar Interest
In July 2017, we completed the sale of Williams Olefins, L.L.C., a wholly owned subsidiary which owned our interest in the Geismar, Louisiana, olefins plant (Geismar Interest) for total consideration of $2.084 billion in cash. We received a final working capital adjustment of $12 million in October 2017. The assets and liabilities of the Geismar olefins plant were designated as held for sale within the NGL & Petchem Services segment during the first quarter of 2017. Upon closing of the sale, we entered into a long-term supply and transportation agreement with the purchaser to provide feedstock to the plant via its Bayou Ethane pipeline system. As a result of this sale, we recorded a gain of $1.095 billion in the third quarter of 2017. Following this sale, the cash proceeds were used to repay our $850 million term loan. Proceeds have also been funding a portion of the capital and investment expenditures that are a part of our growth portfolio.
102
Williams Partners L.P. | ||
Notes to Consolidated Financial Statements – (Continued) | ||
The following table presents the results of operations for the Geismar Interest, excluding the gain noted above.
Years Ended December 31, | |||||||
2017 | 2016 | ||||||
(Millions) | |||||||
Income (loss) before income taxes of the Geismar Interest | $ | 26 | $ | 141 | |||
Sale of Canadian Operations
In September 2016, we completed the sale of subsidiaries conducting Canadian operations (such subsidiaries, the Canadian disposal group). Consideration received totaled $672 million, net of $13 million of cash divested and subject to customary working capital adjustments. Consideration also included $150 million in the form of a waiver of incentive distributions otherwise payable to Williams in the fourth quarter of 2016. The waiver recognizes certain affiliate contracts wherein our Canadian operations provided services to Williams. This noncash transaction is reflected as a decrease in General partner equity in the Consolidated Statement of Changes in Equity. The proceeds were primarily used to reduce borrowings on credit facilities.
During the second quarter of 2016, we designated these operations as held for sale. As a result, we measured the fair value of the disposal group as of June 30, 2016, resulting in an impairment charge of $341 million, reflected in Impairment of certain assets in the Consolidated Statement of Comprehensive Income (Loss). (See Note 16 – Fair Value Measurements, Guarantees, and Concentration of Credit Risk.) During the second half of 2016, we recorded an additional loss of $34 million at our NGL & Petchem Services segment upon completion of the sale, primarily reflecting revisions to the sales price and including an $11 million benefit related to transactions to hedge our foreign currency exchange risk on the Canadian proceeds, reflected in Other (income) expense – net within Costs and expenses in the Consolidated Statement of Comprehensive Income (Loss).
The following table presents the results of operations for the Canadian disposal group, excluding the impairment and loss noted above.
Years Ended December 31, | |||||||
2017 | 2016 | ||||||
(Millions) | |||||||
Income (loss) before income taxes of the Canadian disposal group | $ | — | $ | (9 | ) | ||
Note 3 – Variable Interest Entities
As of December 31, 2017, we consolidate the following VIEs:
Gulfstar One
We own a 51 percent interest in Gulfstar One LLC (Gulfstar One), a subsidiary that, due to certain risk-sharing provisions in its customer contracts, is a VIE. Gulfstar One includes a proprietary floating-production system, Gulfstar FPS, and associated pipelines which provide production handling and gathering services in the eastern deepwater Gulf of Mexico. We are the primary beneficiary because we have the power to direct the activities that most significantly impact Gulfstar One’s economic performance.
Constitution
We own a 41 percent interest in Constitution, a subsidiary that, due to shipper fixed-payment commitments under its long-term firm transportation contracts, is a VIE. We are the primary beneficiary because we have the power to direct the activities that most significantly impact Constitution’s economic performance. We, as operator of Constitution, are responsible for constructing the proposed pipeline connecting our gathering system in Susquehanna County, Pennsylvania, to the Iroquois Gas Transmission and the Tennessee Gas Pipeline systems. The total remaining cost of
103
Williams Partners L.P. | ||
Notes to Consolidated Financial Statements – (Continued) | ||
the project is estimated to be approximately $740 million, which would be funded with capital contributions from us and the other equity partners on a proportional basis.
In December 2014, Constitution received approval from the Federal Energy Regulatory Commission (FERC) to construct and operate its proposed pipeline. However, in April 2016, the New York State Department of Environmental Conservation (NYSDEC) denied the necessary water quality certification under Section 401 of the Clean Water Act for the New York portion of the pipeline. In May 2016, Constitution appealed the NYSDEC’s denial of the Section 401 certification to the United States Court of Appeals for the Second Circuit, and in August 2017 the court issued a decision denying in part and dismissing in part Constitution’s appeal. The court expressly declined to rule on Constitution’s argument that the delay in the NYSDEC’s decision on Constitution’s Section 401 application constitutes a waiver of the certification requirement. The court determined that it lacked jurisdiction to address that contention, and found that jurisdiction over the waiver issue lies exclusively with the United States Court of Appeals for the District of Columbia Circuit. As to the denial itself, the court determined that NYSDEC’s action was not arbitrary or capricious. Constitution filed a petition for rehearing with the Second Circuit Court of Appeals, but in October the court denied our petition.
In October 2017, we filed a petition for declaratory order requesting the FERC to find that, by operation of law, the Section 401 certification requirement for the New York State portion of Constitution’s pipeline project was waived due to the failure by the NYSDEC to act on Constitution’s Section 401 application within a reasonable period of time as required by the express terms of such statute. In January 2018, the FERC denied our petition, finding that Section 401 provides that a state waives certification only when it does not act on an application within one year from the date of the application.
The project’s sponsors remain committed to the project, and, in that regard, we are pursuing two separate and independent paths in order to overturn the NYSDEC’s denial of the Section 401 certification. In January 2018, we filed a petition with the United States Supreme Court to review the decision of the Second Circuit Court of Appeals that upheld the merits of the NYSDEC’s denial of the Section 401 certification. And, in February 2018, we filed a request with the FERC for rehearing of its finding that the NYSDEC did not waive the Section 401 certification requirement. If the FERC denies such request, we will file a petition for review with the D.C. Circuit Court of Appeals.
We estimate that the target in-service date for the project would be approximately 10 to 12 months following any court or FERC decision that the NYSDEC denial order was improper or that the NYSDEC waived the Section 401 certification requirement. An unfavorable resolution could result in the impairment of a significant portion of the capitalized project costs, which total $381 million on a consolidated basis at December 31, 2017, and are included within Property, plant, and equipment – net in the Consolidated Balance Sheet. Beginning in April 2016, we discontinued capitalization of development costs related to this project. It is also possible that we could incur certain supplier-related costs in the event of a prolonged delay or termination of the project.
Cardinal
We own a 66 percent interest in Cardinal, a subsidiary that provides gathering services for the Utica Shale region and is a VIE due to certain risks shared with customers. We are the primary beneficiary because we have the power to direct the activities that most significantly impact Cardinal’s economic performance. We expect to fund future expansion activity with capital contributions from us and the other equity partner on a proportional basis.
Jackalope
We own a 50 percent interest in Jackalope Gas Gathering Services, L.L.C. (Jackalope), a subsidiary that provides gathering and processing services for the Powder River basin and is a VIE due to certain risks shared with customers. We are the primary beneficiary because we have the power to direct the activities that most significantly impact Jackalope’s economic performance. We expect to fund future expansion activity with capital contributions from us and the other equity partner on a proportional basis.
104
Williams Partners L.P. | ||
Notes to Consolidated Financial Statements – (Continued) | ||
The following table presents amounts included in our Consolidated Balance Sheet that are for the use or obligation of our consolidated VIEs:
December 31, | |||||||||
2017 | 2016 | Classification | |||||||
(Millions) | |||||||||
Assets (liabilities): | |||||||||
Cash and cash equivalents | $ | 35 | $ | 82 | Cash and cash equivalents | ||||
Accounts receivable | 76 | 91 | Trade accounts and other receivables | ||||||
Prepaid assets | 2 | 3 | Other current assets and deferred charges | ||||||
Property, plant, and equipment – net | 2,887 | 3,024 | Property, plant, and equipment – net | ||||||
Intangible assets – net | 1,381 | 1,431 | Intangible assets – net of accumulated amortization | ||||||
Accounts payable | (28 | ) | (44 | ) | Accounts payable – trade | ||||
Accrued liabilities | (1 | ) | (3 | ) | Other accrued liabilities | ||||
Current deferred revenue | (57 | ) | (63 | ) | Other accrued liabilities | ||||
Noncurrent asset retirement obligations | (103 | ) | (99 | ) | Asset retirement obligations | ||||
Noncurrent deferred revenue associated with customer advance payments | (305 | ) | (324 | ) | Long-term deferred income | ||||
Note 4 – Allocation of Net Income (Loss) and Distributions
The components of Net income (loss) within Equity are as follows:
Years Ended December 31, | |||||||||||
2017 | 2016 | 2015 | |||||||||
(Millions) | |||||||||||
Net income (loss) allocated to common limited partners’ equity (1) | $ | 856 | $ | (57 | ) | $ | (2,056 | ) | |||
Net income (loss) allocated to Class B limited partners’ equity | 15 | (2 | ) | (52 | ) | ||||||
Net income allocated to general partner’s equity (1) (2) | — | 490 | 590 | ||||||||
Net income allocated to Class D limited partners’ equity (3) | — | — | 69 | ||||||||
Net income allocated to noncontrolling interests | 104 | 88 | 91 | ||||||||
Net income (loss) | $ | 975 | $ | 519 | $ | (1,358 | ) | ||||
____________
(1) | Net income (loss) allocated to equity accounts above considers distributions paid to partners during the current reporting period, while Net income (loss) allocated within the Consolidated Statement of Comprehensive Income (Loss) considers distributions declared for the current reporting period, but paid in the subsequent period. The difference between Net income (loss) allocated to equity accounts and Net income (loss) allocated within the Consolidated Statement of Comprehensive Income (Loss) for 2016 is primarily due to the effect of units issued and the conversion of the general partner interest in us to a non-economic interest in conjunction with our Financial Repositioning. The 2015 difference is primarily due to the timing of the waiver of IDRs associated with the Termination Agreement. (See Note 1 – General, Description of Business, Basis of Presentation, and Summary of Significant Accounting Policies.) |
(2) | As a result of the first quarter 2017 Financial Repositioning, our general partner no longer receives an allocation of net income. |
(3) | Includes amortization of the beneficial conversion feature associated with the Pre-merger WPZ Class D units of $68 million for the year ended December 31, 2015. See following discussion of Class D units. |
105
Williams Partners L.P. | ||
Notes to Consolidated Financial Statements – (Continued) | ||
Common Units
On February 9, 2018, we paid a cash distribution of $0.60 per common unit on our outstanding common units to unitholders of record at the close of business on February 2, 2018.
Class B Units
The Class B units are not entitled to cash distributions. Instead, prior to conversion into common units, the Class B units receive quarterly distributions of additional paid-in-kind Class B units. Effective February 10, 2015, each Class B unit became convertible at the election of either us or the holders of such Class B unit into a common unit on a one-for-one basis. During 2017, 2016, and 2015 we issued 1,163,072, 1,906,001, and 1,058,172, respectively, of additional paid-in-kind Class B units associated with quarterly distributions. On February 9, 2018, we issued 271,008 Class B units associated with the fourth-quarter 2017 distribution.
Class D Units
Pre-merger WPZ Class D units were issued at a discount to the market price of Pre-merger WPZ’s common units. The discount represented a beneficial conversion feature and was being amortized through the originally expected first quarter 2016 conversion date. The remaining unamortized balance was recognized in the first quarter of 2015 due to the ACMP Merger. All Pre-merger WPZ Class D units were converted into common units in conjunction with the ACMP Merger.
Note 5 – Related Party Transactions
Reimbursement of Expenses of Our General Partner
The employees of our operated assets are employees of Williams. Williams directly charges us for the payroll and benefit costs associated with operations employees and carries the obligations for many employee-related benefits in its financial statements, including the liabilities related to employee retirement, medical plans, and paid time off. Our share of the costs is charged to us through affiliate billings and reflected in Operating and maintenance expenses in the Consolidated Statement of Comprehensive Income (Loss) and Property, plant, and equipment – net in the Consolidated Balance Sheet.
In addition, employees of Williams provide general, administrative, and operations support services to us. We are also charged for certain administrative expenses incurred by Williams. These charges are either directly identifiable or allocated to our assets. Direct charges are for goods and services provided by Williams at our request. Allocated charges are based on either metrics correlating to the service provided or, if a service cannot be specifically correlated to a specific metric, a three-factor formula, which considers revenues; property, plant, and equipment; and payroll. Our share of direct and allocated administrative expenses is generally reflected in Selling, general, and administrative expenses in the Consolidated Statement of Comprehensive Income (Loss). Our share of direct and allocated operations support expenses is generally reflected in Operating and maintenance expenses in the Consolidated Statement of Comprehensive Income (Loss). Our share of such direct and allocated costs may also be capitalized within Property, plant, and equipment – net in the Consolidated Balance Sheet.
In management’s estimation, the allocation methodologies used are reasonable and result in a reasonable allocation to us of our costs of doing business incurred by Williams.
Transactions with Affiliates and Equity-Method Investees
Service revenues, in the Consolidated Statement of Comprehensive Income (Loss), includes transportation and fractionation revenues from our former NGL/olefins fractionation facility located in Redwater, Alberta. This facility supported Williams’ Horizon liquids extraction plant in Canada until both were sold in September 2016 (see Note 2 – Acquisitions and Divestitures).
106
Williams Partners L.P. | ||
Notes to Consolidated Financial Statements – (Continued) | ||
Product costs, in the Consolidated Statement of Comprehensive Income (Loss), includes charges for the following types of transactions:
• | Purchases of NGLs for resale from Discovery; |
• | Payments to OPPL for transportation of NGLs from certain natural gas processing plants; |
• | Purchases of NGLs for resale from Williams’ former Horizon liquids extraction plant in Canada. |
Summary of the related party transactions discussed in all sections above.
Years Ended December 31, | ||||||||||||
2017 | 2016 | 2015 | ||||||||||
(Millions) | ||||||||||||
Service revenues | $ | — | $ | 31 | $ | — | ||||||
Product costs | 208 | 181 | 169 | |||||||||
Operating and maintenance expenses - employee costs | 470 | 470 | 498 | |||||||||
Selling, general, and administrative expenses: | ||||||||||||
Employee direct costs | 343 | 344 | 368 | |||||||||
Employee allocated costs | 174 | 160 | 195 | |||||||||
HB Construction Company Ltd., a subsidiary of Williams, provided construction services to us until the sale of our Canadian operations in September 2016. Charges for these construction services were previously capitalized within Property, plant, and equipment – net in the Consolidated Balance Sheet and totaled $9 million during 2016. Charges for capitalized payroll and benefit costs charged by Williams described above totaled $92 million and $94 million during 2017 and 2016, respectively.
The Accounts payable — affiliate in the Consolidated Balance Sheet represents the payable positions that result from the transactions with affiliates discussed above. We also have $20 million and $19 million in Accounts payable — trade in the Consolidated Balance Sheet with our equity-method investees at December 31, 2017 and 2016, respectively.
Operating Agreements with Equity-Method Investees
We have operating agreements with certain equity-method investees. These operating agreements typically provide for reimbursement or payment to us for certain direct operational payroll and employee benefit costs, materials, supplies, and other charges and also for management services. Williams supplied a portion of these services, primarily those related to employees since we do not have any employees, to certain equity-method investees. The total charges to equity-method investees for these fees are $67 million, $66 million, and $64 million for the years ended December 31, 2017, 2016, and 2015, respectively.
Omnibus Agreements
Under these agreements, Williams is obligated to reimburse us for certain items including an amount based on the amortization over time of deferred revenue amounts that relate to cash payments received by Williams prior to the closing of the contribution transaction for services to be rendered by us in the future at the Devils Tower floating production platform. Net amounts received under these agreements for the years ended December 31, 2017, 2016, and 2015 were $11 million, $11 million, and $12 million, respectively.
We have a contribution receivable from our general partner of $2 million and $3 million at December 31, 2017 and 2016, respectively, for amounts reimbursable to us under omnibus agreements presented within Total partners’ equity in the Consolidated Balance Sheet.
107
Williams Partners L.P. | ||
Notes to Consolidated Financial Statements – (Continued) | ||
Acquisitions and Equity Issuances
Note 1 – General, Description of Business, Basis of Presentation, and Summary of Significant Accounting Policies includes related party transactions for Financial Repositioning and the ACMP Merger.
Note 14 – Partners’ Capital includes related party transactions for a distribution reinvestment program (DRIP) in November 2016 and a private placement transaction in August 2016.
Board of Directors
A former member of Williams’ Board of Directors, who was elected in 2013 and resigned during 2016, is also the current chairman, president, and chief executive officer of an energy services company that is a customer of ours. We recorded $144 million and $111 million in Service revenues in Consolidated Statement of Comprehensive Income (Loss) from this company for transportation and storage of natural gas for the years ended December 31, 2016 and 2015, respectively.
Note 6 – Investing Activities
Impairment of equity-method investments
The following table presents other-than-temporary impairment charges related to certain equity-method investments. (See Note 16 – Fair Value Measurements, Guarantees, and Concentration of Credit Risk.)
Years Ended December 31, | ||||||||
2016 | 2015 | |||||||
(Millions) | ||||||||
Northeast G&P | ||||||||
Appalachia Midstream Investments | $ | 294 | $ | 562 | ||||
Laurel Mountain | 50 | 45 | ||||||
UEOM | — | 241 | ||||||
West | ||||||||
DBJV | 59 | 503 | ||||||
Ranch Westex | 24 | — | ||||||
Other | 3 | 8 | ||||||
$ | 430 | $ | 1,359 | |||||
Acquisition of Additional Interests in Appalachia Midstream Investments
During the first quarter of 2017, we exchanged all of our 50 percent interest in DBJV for an increased interest in two natural gas gathering systems that are part of the Appalachia Midstream Investments and $155 million in cash. This transaction was recorded based on our estimate of the fair value of the interests received as we have more insight to this value as we operate the underlying assets. Following this exchange, we have an approximate average 66 percent interest in the Appalachia Midstream Investments. We continue to account for this investment under the equity-method due to the significant participatory rights of our partners such that we do not exercise control. We also sold all of our interest in Ranch Westex JV LLC (Ranch Westex) for $45 million. These transactions resulted in a total gain of $269 million reflected in Other investing income (loss) – net in the Consolidated Statement of Comprehensive Income (Loss).
The fair value of the increased interests in the Appalachia Midstream Investments received as consideration was estimated to be $1.1 billion using an income approach based on expected cash flows and an appropriate discount rate (a Level 3 measurement within the fair value hierarchy). The determination of estimated future cash flows involved significant assumptions regarding gathering volumes, rates, and related capital spending. A 9.5 percent discount rate was utilized and reflected our estimate of the cost of capital as impacted by market conditions and risks associated with the underlying business.
108
Williams Partners L.P. | ||
Notes to Consolidated Financial Statements – (Continued) | ||
Acquisition of Additional Interest in UEOM
In June 2015, we acquired an additional 13 percent interest in our equity-method investment, UEOM, for $357 million. Following the acquisition we own approximately 62 percent of UEOM. However, we continue to account for this as an equity-method investment because we do not control UEOM due to the significant participatory rights of our partner. In connection with the acquisition of the additional interest, our general partner agreed to waive approximately $2 million of its IDR payments each quarter through 2017. See Note 1 – General, Description of Business, Basis of Presentation, and Summary of Significant Accounting Policies for discussion of agreement with Williams wherein Williams permanently waived IDR payment obligations from us.
Equity earnings (losses)
In 2015, we recognized a loss of $19 million associated with our share of underlying property impairments at certain of the Appalachia Midstream Investments.
Other investing income (loss) – net
In 2016, we recognized a $27 million gain from the sale of an equity-method investment interest in a gathering system that was part of our Appalachia Midstream Investments.
Investments
Ownership Interest at December 31, 2017 | December 31, | ||||||||
2017 | 2016 | ||||||||
(Millions) | |||||||||
Appalachia Midstream Investments | (1) | $ | 3,104 | $ | 2,062 | ||||
UEOM | 62% | 1,383 | 1,448 | ||||||
Discovery | 60% | 534 | 572 | ||||||
Caiman II | 58% | 429 | 426 | ||||||
OPPL | 50% | 422 | 430 | ||||||
Laurel Mountain | 69% | 309 | 324 | ||||||
Gulfstream | 50% | 244 | 261 | ||||||
DBJV | — | — | 988 | ||||||
Other | Various | 127 | 190 | ||||||
$ | 6,552 | $ | 6,701 | ||||||
____________
(1) | Includes equity-method investments in multiple gathering systems in the Marcellus Shale with an approximate average 66 percent interest. |
We have differences between the carrying value of our equity-method investments and the underlying equity in the net assets of the investees of $1.8 billion at December 31, 2017 and $1.9 billion at December 31, 2016. For 2017 these differences primarily relate to our investments in Appalachia Midstream Investments and UEOM resulting from property, plant, and equipment, as well as customer-based intangible assets and goodwill. For 2016, the difference also includes DBJV.
109
Williams Partners L.P. | ||
Notes to Consolidated Financial Statements – (Continued) | ||
Purchases of and contributions to equity-method investments
We generally fund our portion of significant expansion or development projects of these investees through additional capital contributions. These transactions increased the carrying value of our investments and included:
Years Ended December 31, | |||||||||||
2017 | 2016 | 2015 | |||||||||
(Millions) | |||||||||||
Appalachia Midstream Investments | $ | 70 | $ | 28 | $ | 93 | |||||
DBJV | 32 | 105 | 57 | ||||||||
Caiman II | 24 | 22 | — | ||||||||
UEOM | — | — | 357 | ||||||||
Discovery | 1 | — | 35 | ||||||||
Other | 5 | 22 | 52 | ||||||||
$ | 132 | $ | 177 | $ | 594 | ||||||
Dividends and distributions
The organizational documents of entities in which we have an equity-method interest generally require distribution of available cash to members on at least a quarterly basis. These transactions reduced the carrying value of our investments and included:
Years Ended December 31, | |||||||||||
2017 | 2016 | 2015 | |||||||||
(Millions) | |||||||||||
Appalachia Midstream Investments | $ | 270 | $ | 211 | $ | 219 | |||||
Discovery | 127 | 141 | 116 | ||||||||
Gulfstream | 92 | 100 | 88 | ||||||||
UEOM | 80 | 92 | 42 | ||||||||
OPPL | 68 | 69 | 45 | ||||||||
Caiman II | 49 | 40 | 33 | ||||||||
DBJV | 39 | 39 | 33 | ||||||||
Laurel Mountain | 32 | 28 | 31 | ||||||||
Other | 27 | 22 | 26 | ||||||||
$ | 784 | $ | 742 | $ | 633 | ||||||
In addition, on September 24, 2015, we received a special distribution of $396 million from Gulfstream reflecting our proportional share of the proceeds from new debt issued by Gulfstream. The new debt was issued to refinance Gulfstream’s debt maturities. Subsequently, we contributed $248 million and $148 million to Gulfstream for our proportional share of amounts necessary to fund debt maturities of $500 million due on November 1, 2015 and $300 million due on June 1, 2016, respectively.
Summarized Financial Position and Results of Operations of All Equity-Method Investments
December 31, | |||||||
2017 | 2016 | ||||||
(Millions) | |||||||
Assets (liabilities): | |||||||
Current assets | $ | 447 | $ | 508 | |||
Noncurrent assets | 9,181 | 9,695 | |||||
Current liabilities | (295 | ) | (412 | ) | |||
Noncurrent liabilities | (1,538 | ) | (1,484 | ) | |||
110
Williams Partners L.P. | ||
Notes to Consolidated Financial Statements – (Continued) | ||
Years Ended December 31, | |||||||||||
2017 | 2016 | 2015 | |||||||||
(Millions) | |||||||||||
Gross revenue | $ | 1,961 | $ | 1,883 | $ | 1,707 | |||||
Operating income | 871 | 799 | 690 | ||||||||
Net income | 806 | 726 | 611 | ||||||||
Note 7 – Other Income and Expenses
The following table presents certain gains or losses reflected in Other (income) expense – net within Costs and expenses in the Consolidated Statement of Comprehensive Income (Loss):
Years Ended December 31, | ||||||||||||
2017 | 2016 | 2015 | ||||||||||
(Millions) | ||||||||||||
Atlantic-Gulf | ||||||||||||
Amortization of regulatory assets associated with asset retirement obligations | $ | 33 | $ | 33 | $ | 33 | ||||||
Accrual of regulatory liability related to overcollection of certain employee expenses | 22 | 25 | 20 | |||||||||
Project development costs related to Constitution (see Note 3) | 16 | 28 | — | |||||||||
Gain on asset retirement | — | (11 | ) | — | ||||||||
West | ||||||||||||
Gains on contract settlements and terminations | (15 | ) | — | — | ||||||||
NGL & Petchem Services | ||||||||||||
Gain on sale of Refinery Grade Propylene Splitter | (12 | ) | — | — | ||||||||
Loss on sale of Canadian operations (see Note 2) | 4 | 34 | — | |||||||||
Net foreign currency exchange (gains) losses (1) | — | 10 | (10 | ) | ||||||||
__________
(1) | Primarily relates to gains and losses incurred on foreign currency transactions and the remeasurement of U.S. dollar-denominated current assets and liabilities within our former Canadian operations (see Note 2 – Acquisitions and Divestitures). |
ACMP Acquisition, Merger, and Transition
Certain ACMP acquisition, merger, and transition costs included in the Consolidated Statement of Comprehensive Income (Loss) are as follows:
• | Selling, general, and administrative expenses includes $26 million in 2015 primarily related to professional advisory fees within the West segment. |
• | Operating and maintenance expenses includes $12 million in 2015 primarily related to employee transition costs within the West segment. |
Additional Items
Certain additional items included in the Consolidated Statement of Comprehensive Income (Loss) are as follows:
• | Service revenues includes $66 million, $58 million, and $239 million, recognized in the fourth quarter of 2017, 2016, and 2015, respectively, from minimum volume commitment fees in the Barnett Shale and Mid-Continent regions within the West segment. |
111
Williams Partners L.P. | ||
Notes to Consolidated Financial Statements – (Continued) | ||
• | Service revenues for the year ended December 31, 2016, includes $173 million associated with the amortization of deferred income related to the restructuring of certain gas gathering contracts in the Barnett Shale and Mid-Continent regions within the West segment. |
• | Service revenues were reduced by $15 million for the year ended December 31, 2016, related to potential refunds associated with a ruling received in certain rate case litigation within the Atlantic-Gulf segment. |
•Selling, general, and administrative expenses and Operating and maintenance expenses for the years ended December 31, 2017 and 2016 includes severance and other related costs. Amounts by segment are as follows:
Years Ended December 31, | |||||||
2017 | 2016 | ||||||
(Millions) | |||||||
Northeast G&P | $ | — | $ | 3 | |||
Atlantic-Gulf | — | 8 | |||||
West | — | 13 | |||||
NGL & Petchem Services | — | 4 | |||||
Other | 22 | 9 | |||||
• | Other income (expense) – net below Operating income (loss) includes $70 million, $65 million, and $76 million in 2017, 2016, and 2015, respectively, for equity AFUDC within the Atlantic-Gulf segment. |
• | Other income (expense) – net below Operating income (loss) also includes a $33 million and $6 million charge for the year ended December 31, 2017, within the Atlantic Gulf and West segments, respectively, for regulatory assets associated with the effects of deferred taxes on equity funds used during construction as a result of Tax Reform (see Note 1 – General, Description of Business, Basis of Presentation, and Summary of Significant Accounting Policies). |
• | Other income (expense) – net below Operating income (loss) for the year ended December 31, 2017, includes a net gain of $30 million associated with the February 23, 2017, early retirement of $750 million of 6.125 percent senior unsecured notes that were due in 2022 and a net loss of $3 million associated with the July 3, 2017, early retirement of of $1.4 billion of 4.875 percent senior unsecured notes that were due in 2023. The net gain for the February 23, 2017, early retirement within the Other segment reflects $53 million of unamortized premium, partially offset by $23 million in premiums paid. The net loss for the July 3, 2017, early retirement within the Other segment reflects $51 million of unamortized premium, offset by $54 million in premiums paid (see Note 13 – Debt, Banking Arrangements, and Leases). |
112
Williams Partners L.P. | ||
Notes to Consolidated Financial Statements – (Continued) | ||
Note 8 – Provision (Benefit) for Income Taxes
The Provision (benefit) for income taxes includes:
Years Ended December 31, | |||||||||||
2017 | 2016 | 2015 | |||||||||
(Millions) | |||||||||||
Current: | |||||||||||
State | $ | 10 | $ | 2 | $ | (3 | ) | ||||
Foreign | — | 1 | — | ||||||||
10 | 3 | (3 | ) | ||||||||
Deferred: | |||||||||||
State | (4 | ) | (1 | ) | (3 | ) | |||||
Foreign | — | (82 | ) | 7 | |||||||
(4 | ) | (83 | ) | 4 | |||||||
Provision (benefit) for income taxes | $ | 6 | $ | (80 | ) | $ | 1 | ||||
Reconciliations from the Provision (benefit) at statutory rate to recorded Provision (benefit) for income taxes are as follows:
Years Ended December 31, | |||||||||||
2017 | 2016 | 2015 | |||||||||
(Millions) | |||||||||||
Provision (benefit) at statutory rate | $ | 343 | $ | 154 | $ | (475 | ) | ||||
Increases (decreases) in taxes resulting from: | |||||||||||
Income not subject to U.S. federal tax | (343 | ) | (154 | ) | 475 | ||||||
State income taxes | 6 | 1 | (6 | ) | |||||||
Foreign operations — net | — | (81 | ) | 7 | |||||||
Provision (benefit) for income taxes | $ | 6 | $ | (80 | ) | $ | 1 | ||||
The 2016 foreign deferred benefit includes the tax effect of a $341 million impairment associated with the Canadian operations (see Note 16 – Fair Value Measurements, Guarantees, and Concentration of Credit Risk). The 2015 state deferred benefit includes $7 million related to the impact of a Texas franchise tax rate decrease. The 2015 foreign deferred provision includes $8 million related to the impact of an Alberta provincial tax rate increase.
Income (loss) before income taxes includes $4 million and $387 million of foreign loss in 2017 and 2016, respectively, and $1 million of foreign income in 2015.
Deferred income tax liabilities, primarily attributable to the taxable temporary differences from property, plant, and equipment, were $16 million and $20 million in 2017 and 2016, respectively.
Cash payments for income taxes (net of refunds) were $12 million and $3 million in 2017 and 2016, respectively. Cash refunds for income taxes (net of payments) were $4 million in 2015.
As of December 31, 2017, we have no unrecognized tax benefits.
Tax years after 2013 are subject to examination by the Texas Comptroller. Generally, tax returns for our previously owned Canadian entities are open to audit for tax years after 2012. Tax years 2013 and 2014 are currently under examination. Williams has indemnified us for any adjustments to foreign tax returns filed prior to Pre-Merger WPZ’s acquisition of certain Canadian operations from Williams in 2014. We have indemnified the purchaser for any adjustments to foreign tax returns for periods prior to the sale of our Canadian operations in September 2016 (see Note 2 – Acquisitions and Divestitures).
113
Williams Partners L.P. | ||
Notes to Consolidated Financial Statements – (Continued) | ||
Note 9 – Benefit Plans
Certain of the benefit costs charged to us by our general partner associated with employees who directly support us are described below. Additionally, allocated corporate expenses from Williams to us also include amounts related to these same employee benefits, which are not included in the amounts presented below, except as specifically described.
Defined Benefit Pension Plans
Williams has noncontributory defined benefit pension plans (Williams Pension Plan, Williams Inactive Employees Pension Plan, and The Williams Companies Retirement Restoration Plan) that provide pension benefits for its eligible employees. Pension costs charged to us by Williams for 2017, 2016, and 2015 totaled $47 million, $32 million, and $43 million, respectively. Included in our 2017 pension costs is a $19 million settlement charge. This amount reflects the portion of Williams’ settlement charge directly charged to us which was required as a result of lump-sum benefit payments made under Williams’ 2017 program to pay out certain deferred vested pension benefits, as well as lump-sum benefit payments made throughout 2017. In addition, we were charged $16 million of allocated corporate expenses also associated with the settlement charge. At the total Williams plan level, the pension plans had a projected benefit obligation of $1.3 billion and $1.5 billion at December 31, 2017 and 2016, respectively. The plans were underfunded by $92 million and $212 million at December 31, 2017 and 2016, respectively.
Postretirement Benefits Other than Pensions
Williams provides subsidized retiree health care and life insurance benefits for certain eligible participants. We recognized a net periodic postretirement benefit credited to us by Williams of $11 million, $12 million, and $12 million in 2017, 2016, and 2015, respectively. At the total Williams plan level, the postretirement benefit plans had an accumulated postretirement benefit obligation of $206 million and $197 million at December 31, 2017 and 2016, respectively. The plans were overfunded by $21 million and $11 million at December 31, 2017 and 2016, respectively.
Any differences between the annual expense and amounts currently being recovered in rates by Transco and Northwest Pipeline are recorded as an adjustment to expense and collected or refunded through future rate adjustments.
Defined Contribution Plans
Williams maintains defined contribution plans for the benefit of substantially all of its employees. We were charged compensation expense of $21 million, $24 million, and $27 million in 2017, 2016, and 2015, respectively, for contributions to these plans.
114
Williams Partners L.P. | ||
Notes to Consolidated Financial Statements – (Continued) | ||
Note 10 – Property, Plant, and Equipment
The following table presents nonregulated and regulated Property, plant, and equipment – net as presented on the Consolidated Balance Sheet for the years ended:
Estimated | Depreciation | ||||||||||
Useful Life (1) | Rates (1) | December 31, | |||||||||
(Years) | (%) | 2017 | 2016 | ||||||||
(Millions) | |||||||||||
Nonregulated: | |||||||||||
Natural gas gathering and processing facilities (2) | 5 - 40 | $ | 18,350 | $ | 19,377 | ||||||
Construction in progress | Not applicable | 548 | 355 | ||||||||
Other (2) | 3 - 45 | 2,302 | 2,630 | ||||||||
Regulated: | |||||||||||
Natural gas transmission facilities | 1.2 - 6.97 | 14,460 | 12,692 | ||||||||
Construction in progress | Not applicable | Not applicable | 1,637 | 1,603 | |||||||
Other | 5 - 45 | 1.35 - 33.33 | 1,634 | 1,590 | |||||||
Total property, plant, and equipment, at cost | 38,931 | 38,247 | |||||||||
Accumulated depreciation and amortization | (11,019 | ) | (10,226 | ) | |||||||
Property, plant, and equipment – net | $ | 27,912 | $ | 28,021 | |||||||
_________________
(1) | Estimated useful life and depreciation rates are presented as of December 31, 2017. Depreciation rates and estimated useful lives for regulated assets are prescribed by the FERC. |
(2) | The 2016 presentation has been changed to reflect $890 million of right-of-way assets previously presented in Natural gas gathering and processing facilities, now in Other. |
Depreciation and amortization expense for Property, plant, and equipment – net was $1.353 billion, $1.364 billion, and $1.348 billion in 2017, 2016, and 2015, respectively.
Regulated Property, plant, and equipment – net includes approximately $626 million and $665 million at December 31, 2017 and 2016, respectively, related to amounts in excess of the original cost of the regulated facilities within our gas pipeline businesses as a result of our prior acquisitions. This amount is being amortized over 40 years using the straight-line amortization method. Current FERC policy does not permit recovery through rates for amounts in excess of original cost of construction.
Asset Retirement Obligations
Our accrued obligations relate to underground storage caverns, offshore platforms and pipelines, fractionation and compression facilities, gas gathering well connections and pipelines, and gas transmission pipelines and facilities. At the end of the useful life of each respective asset, we are legally obligated to plug storage caverns and remove any related surface equipment, to restore land and remove surface equipment at gas processing, fractionation, and compression facilities, to dismantle offshore platforms and appropriately abandon offshore pipelines, to cap certain gathering pipelines at the wellhead connection and remove any related surface equipment, and to remove certain components of gas transmission facilities from the ground.
115
Williams Partners L.P. | ||
Notes to Consolidated Financial Statements – (Continued) | ||
The following table presents the significant changes to our ARO, of which $944 million and $798 million are included in Asset retirement obligations with the remaining portion in Asset retirement obligations under Current liabilities on the Consolidated Balance Sheet at December 31, 2017 and 2016, respectively.
December 31, | |||||||
2017 | 2016 | ||||||
(Millions) | |||||||
Beginning balance | $ | 859 | $ | 914 | |||
Liabilities incurred | 34 | 21 | |||||
Liabilities settled | (16 | ) | (8 | ) | |||
Accretion expense (1) | 141 | 69 | |||||
Revisions (2) | (21 | ) | (137 | ) | |||
Ending balance | $ | 997 | $ | 859 | |||
______________
(1) | The increase in accretion expense for 2017 includes an adjustment associated with obligations identified from certain Transco land agreements. |
(2) | Several factors are considered in the annual review process, including inflation rates, current estimates for removal cost, market risk premiums, discount rates, and the estimated remaining useful life of the assets. The 2017 revisions reflect changes in removal cost estimates and decreases in the estimated remaining useful life of certain assets and discount rates used in the annual review process. The 2016 revisions reflect changes in removal cost estimates, increases in the estimated remaining useful life of certain assets, and decreases in the inflation rate and discount rates used in the annual review process. |
The funds Transco collects through a portion of its rates to fund its ARO are deposited into an external trust account dedicated to funding its ARO (ARO Trust). (See Note 16 – Fair Value Measurements, Guarantees, and Concentration of Credit Risk.) Under its current rate settlement, Transco’s annual funding obligation is approximately $36 million, with installments to be deposited monthly.
Note 11 – Goodwill and Other Intangible Assets
Goodwill
At December 31, 2017, 2016, and 2015, our Consolidated Balance Sheet includes $47 million of goodwill in Intangible assets – net of accumulated amortization, reported in the West segment. Our goodwill is not subject to amortization, but is evaluated at least annually for impairment or more frequently if impairment indicators are present. We did not identify or recognize any impairments to goodwill in connection with our annual evaluation of goodwill for impairment (performed as of October 1) during the years ended December 31, 2017 and 2016. During 2015, we performed an interim assessment of goodwill within the Northeast G&P and West segments as of September 30, 2015, and the annual assessment of goodwill within the Northeast G&P and West segments as of October 1, 2015. The estimated fair value of the reporting units evaluated exceeded their carrying amounts, and thus no impairment was identified. We performed an additional goodwill impairment evaluation as of December 31, 2015, of the goodwill recorded within the Northeast G&P and West segments. As a result of this evaluation, we recorded goodwill impairment charges totaling $1.098 billion. (See Note 16 – Fair Value Measurements, Guarantees, and Concentration of Credit Risk.)
116
Williams Partners L.P. | ||
Notes to Consolidated Financial Statements – (Continued) | ||
Other Intangible Assets
The gross carrying amount and accumulated amortization of other intangible assets, included in Intangible assets – net of accumulated amortization, at December 31 are as follows:
2017 | 2016 | ||||||||||||||
Gross Carrying Amount | Accumulated Amortization | Gross Carrying Amount | Accumulated Amortization | ||||||||||||
(Millions) | |||||||||||||||
Contractual customer relationships | $ | 10,026 | $ | (1,283 | ) | $ | 10,634 | $ | (1,019 | ) | |||||
Other intangible assets primarily relate to gas gathering, processing, and fractionation contractual customer relationships recognized in acquisitions including ACMP and Eagle Ford (see Note 2 – Acquisitions and Divestitures). The decrease in the gross carrying amount of other intangible assets during 2017 is primarily related to the impairment of certain gathering operations in the Mid-Continent and Marcellus South regions (see Note 16 – Fair Value Measurements, Guarantees, and Concentration of Credit Risk). The write-off of accumulated amortization related to the impaired assets is the primary reason for the difference between the change in accumulated amortization during 2017 indicated above and the amortization expense for 2017 noted below. Other intangible assets are being amortized on a straight-line basis over an initial period of 30 years which represents a portion of the term over which the contractual customer relationships are expected to contribute to our cash flows.
We expense costs incurred to renew or extend the terms of our gas gathering, processing, and fractionation contracts with customers. Based on the estimated future revenues during the contract periods (as estimated at the time of the acquisition), the weighted-average period prior to the next renewal or extension of the contractual customer relationships associated with the Eagle Ford acquisition was approximately 10 years. Although a significant portion of the expected future cash flows associated with these contractual customer relationships are dependent on our ability to renew or extend the arrangements beyond the initial contract periods, these expected future cash flows are significantly influenced by the scope and pace of our producer customers’ drilling programs. Once producer customers’ wells are connected to our gathering infrastructure, their likelihood of switching to another provider before the wells are abandoned is reduced due to the significant capital investment required.
The amortization expense related to other intangible assets was $347 million, $356 million, and $353 million in 2017, 2016, and 2015, respectively. The estimated amortization expense for each of the next five succeeding fiscal years is approximately $337 million.
Note 12 – Other Accrued Liabilities
December 31, | |||||||
2017 | 2016 | ||||||
(Millions) | |||||||
Deferred income | $ | 361 | $ | 338 | |||
Refundable deposits | — | 160 | |||||
Other, including other loss contingencies | 229 | 306 | |||||
$ | 590 | $ | 804 | ||||
Deferred income includes cash proceeds associated with restructuring certain gas gathering contracts in the Barnett Shale and Mid-Continent regions. (See Note 1 – General, Description of Business, Basis of Presentation, and Summary of Significant Accounting Policies.)
Refundable deposits in 2016 includes receipts related to an agreement to resolve several matters in relation to Transco’s Hillabee Expansion Project. In accordance with the agreement, the member–sponsors of Sabal Trail paid us an aggregate amount of $240 million in three equal installments as certain milestones of the project were met. During the third quarter of 2017 we received the final installment and placed the project into service. As a result of placing the
117
Williams Partners L.P. | ||
Notes to Consolidated Financial Statements – (Continued) | ||
project into service, we reclassified the Refundable deposits to Other accrued liabilities and Long-term deferred income and expect to recognize income associated with these receipts over the term of an underlying contract.
Note 13 – Debt, Banking Arrangements, and Leases
Long-Term Debt
December 31, | ||||||||
2017 | 2016 | |||||||
(Millions) | ||||||||
Transco: | ||||||||
6.05% Notes due 2018 | $ | 250 | $ | 250 | ||||
7.08% Debentures due 2026 | 8 | 8 | ||||||
7.25% Debentures due 2026 | 200 | 200 | ||||||
7.85% Notes due 2026 | 1,000 | 1,000 | ||||||
5.4% Notes due 2041 | 375 | 375 | ||||||
4.45% Notes due 2042 | 400 | 400 | ||||||
Other financing obligation | 231 | — | ||||||
Northwest Pipeline: | ||||||||
5.95% Notes due 2017 | — | 185 | ||||||
6.05% Notes due 2018 | 250 | 250 | ||||||
7.125% Debentures due 2025 | 85 | 85 | ||||||
4% Notes due 2027 | 250 | — | ||||||
Williams Partners L.P.: | ||||||||
7.25% Notes due 2017 | — | 600 | ||||||
5.25% Notes due 2020 | 1,500 | 1,500 | ||||||
4.125% Notes due 2020 | 600 | 600 | ||||||
4% Notes due 2021 | 500 | 500 | ||||||
3.6% Notes due 2022 | 1,250 | 1,250 | ||||||
3.35% Notes due 2022 | 750 | 750 | ||||||
6.125% Notes due 2022 | — | 750 | ||||||
4.5% Notes due 2023 | 600 | 600 | ||||||
4.875% Notes due 2023 | — | 1,400 | ||||||
4.3% Notes due 2024 | 1,000 | 1,000 | ||||||
4.875% Notes due 2024 | 750 | 750 | ||||||
3.9% Notes due 2025 | 750 | 750 | ||||||
4% Notes due 2025 | 750 | 750 | ||||||
3.75% Notes due 2027 | 1,450 | — | ||||||
6.3% Notes due 2040 | 1,250 | 1,250 | ||||||
5.8% Notes due 2043 | 400 | 400 | ||||||
5.4% Notes due 2044 | 500 | 500 | ||||||
4.9% Notes due 2045 | 500 | 500 | ||||||
5.1% Notes due 2045 | 1,000 | 1,000 | ||||||
Term Loan, variable interest rate, due 2018 | — | 850 | ||||||
Debt issuance costs | (96 | ) | (90 | ) | ||||
Net unamortized debt premium (discount) | (6 | ) | 107 | |||||
Long-term debt, including current portion | 16,497 | 18,470 | ||||||
Long-term debt due within one year | (501 | ) | (785 | ) | ||||
Long-term debt | $ | 15,996 | $ | 17,685 | ||||
118
Williams Partners L.P. | ||
Notes to Consolidated Financial Statements – (Continued) | ||
The terms of our senior unsecured notes are governed by indentures that contain covenants that, among other things, limit: (1) our ability and the ability of our subsidiaries to create liens securing indebtedness and (2) mergers, consolidations, and sales of assets. The indentures also contain customary events of default, upon which the trustee or the holders of the senior unsecured notes may declare all outstanding senior unsecured notes to be due and payable immediately.
The following table presents aggregate minimum maturities of long-term debt, excluding net unamortized debt premium (discount) and debt issuance costs, for each of the next five years:
December 31, 2017 | |||
(Millions) | |||
2018 | $ | 502 | |
2019 | 2 | ||
2020 | 2,102 | ||
2021 | 502 | ||
2022 | 2,002 | ||
Issuances and retirements
On July 6, 2017, we repaid our $850 million variable interest rate term loan that was due December 2018 using proceeds from the sale of our Geismar Interest.
On June 5, 2017, we issued $1.45 billion of 3.75 percent senior unsecured notes due 2027. We used the proceeds for general partnership purposes, primarily the July 3, 2017 repayment of $1.4 billion of 4.875 percent senior unsecured notes that were due in 2023.
On April 3, 2017, Northwest Pipeline issued $250 million of 4.0 percent senior unsecured notes due 2027 to investors in a private debt placement. Northwest Pipeline used the net proceeds to retire $185 million of 5.95 percent senior unsecured notes that matured on April 15, 2017, and for general corporate purposes. As part of the issuance, Northwest Pipeline entered into a registration rights agreement with the initial purchasers of the unsecured notes. Under the terms of the agreement, Northwest Pipeline was obligated to file and consummate a registration statement for an offer to exchange the notes for a new issue of substantially identical notes registered under the Securities Act of 1933, as amended, within 365 days from closing and to use commercially reasonable efforts to complete the exchange offer. Northwest Pipeline has filed the registration statement, which became effective in January 2018. The exchange offer is expected to be completed in the first quarter of 2018.
On February 23, 2017, using proceeds received from the Financial Repositioning (see Note 1 – General, Description of Business, Basis of Presentation, and Summary of Significant Accounting Policies), we early retired $750 million of 6.125 percent senior unsecured notes that were due in 2022.
We retired $600 million of 7.25 percent senior unsecured notes that matured on February 1, 2017.
Northwest Pipeline retired $175 million of 7 percent senior unsecured notes that matured on June 15, 2016.
Transco retired $200 million of 6.4 percent senior unsecured notes that matured on April 15, 2016.
On January 22, 2016, Transco, issued $1 billion of 7.85 percent senior unsecured notes due 2026 to investors in a private debt placement. In January 2017, Transco completed an exchange of these notes for substantially identical new notes that are registered under the Securities Act of 1933, as amended. Transco used the net proceeds to repay debt and to fund capital expenditures.
119
Williams Partners L.P. | ||
Notes to Consolidated Financial Statements – (Continued) | ||
Other financing obligation
During the construction of Transco’s Dalton expansion project, we received funding from a partner for its proportionate share of construction costs related to its undivided ownership interest in the project. Amounts received were recorded within noncurrent liabilities and 100 percent of the costs associated with construction were capitalized on our Consolidated Balance Sheet. Upon placing the project in service during the third quarter of 2017, we began leasing this partner’s undivided interest in the lateral, including the associated pipeline capacity, and reclassified approximately $237 million of funding previously received from our partner from noncurrent liabilities to debt to reflect the financing obligation payable to our partner over an expected term of 35 years.
Credit Facilities
December 31, 2017 | |||||||
Available | Outstanding | ||||||
(Millions) | |||||||
Long-term credit facility (1) | $ | 3,500 | $ | — | |||
Letters of credit under certain bilateral bank agreements | 1 | ||||||
__________
(1) | In managing our available liquidity, we do not expect a maximum outstanding amount in excess of the capacity of our credit facility inclusive of any outstanding amounts under our commercial paper program. |
Long-term credit facilities
On February 2, 2015, we along with Transco, Northwest Pipeline, the lenders named therein, and an administrative agent entered into the Second Amended & Restated Credit Agreement with aggregate commitments available of $3.5 billion, with up to an additional $500 million increase in aggregate commitments available under certain circumstances. In November 2017, the maturity date of the facility was extended to February 2, 2021. However, the co-borrowers may request an additional extension of the maturity date for a one year period to allow a maturity date as late as February 2, 2022, under certain circumstances. The agreement allows for swing line loans up to an aggregate amount of $150 million, subject to available capacity under the credit facility, and letters of credit commitments of $1.125 billion. Transco and Northwest Pipeline are each able to borrow up to $500 million under this credit facility to the extent not otherwise utilized by the other co-borrowers.
The agreement governing our credit facility contains the following terms and conditions:
• | Various covenants may limit, among other things, a borrower’s and its material subsidiaries’ ability to grant certain liens supporting indebtedness, merge or consolidate, sell all or substantially all of its assets, enter into certain affiliate transactions, make certain distributions during an event of default, enter into certain restrictive agreements, and allow any material change in the nature of its business. |
• | If an event of default with respect to a borrower occurs under the credit facility, the lenders will be able to terminate the commitments for all borrowers and accelerate the maturity of any loans of the defaulting borrower under the credit facility agreement and exercise other rights and remedies. |
• | Other than swing line loans, each time funds are borrowed, the borrower must choose whether such borrowing will be an alternate base rate borrowing or a Eurodollar borrowing. If such borrowing is an alternate base rate borrowing, interest is calculated on the basis of the greater of (a) the Prime Rate, (b) the Federal Funds Effective Rate plus one half of 1 percent, and (c) a periodic fixed rate equal to the London Interbank Offered Rate (LIBOR) plus 1 percent, plus, in the case of each of (a), (b), and (c), an applicable margin. If the borrowing is a Eurodollar borrowing, interest is calculated on the basis of LIBOR for the relevant period plus an applicable margin. Interest on swing line loans is calculated as the sum of the alternate base rate plus an applicable margin. The borrower is required to pay a commitment fee based on the unused portion of the credit facility. |
120
Williams Partners L.P. | ||
Notes to Consolidated Financial Statements – (Continued) | ||
The applicable margin and the commitment fee are determined for each borrower by reference to a pricing schedule based on such borrower’s senior unsecured long-term debt ratings.
Significant financial covenants under the agreement require the ratio of debt to EBITDA, each as defined in the credit facility, be no greater than 5.00 to 1, except for the fiscal quarter and the two following fiscal quarters in which one or more acquisitions has been executed, in which case the ratio of debt to EBITDA is to be no greater than 5.5 to 1.
The ratio of debt to capitalization (defined as net worth plus debt) must be no greater than 65 percent for each of Transco and Northwest Pipeline. We are in compliance with these financial covenants as measured at December 31, 2017.
As of February 20, 2018, there are no amounts outstanding under our long-term credit facility.
Commercial Paper Program
On February 2, 2015, we amended and restated the commercial paper program for the ACMP Merger and to allow a maximum outstanding amount of unsecured commercial paper notes of $3 billion. The maturities of the commercial paper notes vary but may not exceed 397 days from the date of issuance. The commercial paper notes are sold under customary terms in the commercial paper market and are issued at a discount from par, or, alternatively, are sold at par and bear varying interest rates on a fixed or floating basis. Proceeds from these notes are used for general partnership purposes, including funding capital expenditures, working capital, and partnership distributions. At December 31, 2017, no Commercial paper was outstanding. At December 31, 2016, $93 million of Commercial paper was outstanding at a weighted-average interest rate of 1.06 percent, which was classified in Current liabilities in the Consolidated Balance Sheet, as the outstanding notes have maturity dates less than three months from the date of issuance.
Cash Payments for Interest (Net of Amounts Capitalized)
Cash payments for interest (net of amounts capitalized) were $855 million in 2017, $891 million in 2016, and $795 million in 2015.
Leases-Lessee
The future minimum annual rentals under noncancelable operating leases, are payable as follows:
December 31, 2017 | |||
(Millions) | |||
2018 | $ | 33 | |
2019 | 32 | ||
2020 | 27 | ||
2021 | 26 | ||
2022 | 24 | ||
Thereafter | 126 | ||
Total | $ | 268 | |
Total rent expense was $55 million in 2017, $59 million in 2016, and $62 million in 2015 and primarily included in Operating and maintenance expenses and Selling, general, and administrative expenses in the Consolidated Statement of Comprehensive Income (Loss).
121
Williams Partners L.P. | ||
Notes to Consolidated Financial Statements – (Continued) | ||
Note 14 – Partners’ Capital
Financial Repositioning
See Note 1 – General, Description of Business, Basis of Presentation, and Summary of Significant Accounting Policies for information regarding units that were issued during the first quarter of 2017 related to the Financial Repositioning.
Distribution Reinvestment Program and Other Private Placement Transactions
In September 2016, we filed a Form S-3D registration statement with the Securities and Exchange Commission for our distribution reinvestment program. The DRIP commenced with the quarterly distribution for the quarter ending September 30, 2016. Under the DRIP, registered unitholders may invest all or a portion of their quarterly cash distribution in our common units. The price for newly issued common units purchased under the DRIP is the average of the high and low trading prices of our common units for the five trading days immediately preceding the distribution, less a discount rate of 2.5 percent.
2017 Activity
Distribution Date | Common Units Issued to the Public | Discounted Average Price per Unit | Reinvested Distribution Amount (Millions) | ||||||
November | 521,143 | $ | 35.88 | $ | 19 | ||||
August | 378,631 | 38.24 | 14 | ||||||
May | 311,279 | 39.69 | 12 | ||||||
February | 395,395 | 39.76 | 16 | ||||||
2016 Activity
The November 2016 distribution resulted in 7,891,414 common units issued at a discounted average price of $32.92 per unit associated with reinvested distributions of $260 million, of which $250 million related to Williams.
In August 2016, we completed an equity issuance of 6,975,446 common units sold to Williams in a private placement. The units were sold for an aggregate purchase price of $250 million. The proceeds were used to repay amounts outstanding under our credit facility and for general partnership purposes.
Equity Distribution Agreement Transactions
In November 2016, we issued 3,254,958 common units pursuant to an equity distribution agreement between us and certain banks resulting in net proceeds of $115 million. The net proceeds were used for general partnership purposes. We incurred commission fees of approximately $1.2 million associated with these transactions.
In January 2016, we issued 18,643 common units pursuant to an equity distribution agreement between us and certain banks. The net proceeds of $414 thousand were used for general partnership purposes. We incurred commission fees of $4 thousand associated with these transactions.
In November 2015, we issued 1,790,840 common units pursuant to an equity distribution agreement between us and certain banks. The net proceeds of $59 million were used for general partnership purposes. We incurred commission fees of $592 thousand associated with these transactions.
122
Williams Partners L.P. | ||
Notes to Consolidated Financial Statements – (Continued) | ||
Limited Partners’ Rights
Significant rights of the limited partners include the following:
• | Right to receive distributions of available cash within 45 days after the end of each quarter. |
• | No limited partner shall have any management control over our business and affairs; the general partner shall conduct, direct and manage our activities. |
• | The general partner may be removed if such removal is approved by the unitholders holding at least 66 2/3 percent of the outstanding units voting as a single class, including units held by our general partner and its affiliates. |
Incentive Distribution Rights
Prior to the previously described Financial Repositioning in January 2017, our general partner was entitled to incentive distributions if the amount we distribute to unitholders with respect to any quarter exceeds specified target levels shown below:
Total Quarterly Distribution per Unit | Unitholders | General Partner | ||||
Minimum Quarterly Distribution | $0.3375 | 98% | 2% | |||
First Target Distribution | Up to $0.388125 | 98 | 2 | |||
Second Target Distribution | Above $0.388125 up to $0.421875 | 85 | 15 | |||
Third Target Distribution | Above $0.421875 up to $0.50625 | 75 | 25 | |||
Thereafter | Above $0.50625 | 50 | 50 | |||
In the event of liquidation, all property and cash in excess of that required to discharge all liabilities will be distributed to the unitholders and our general partner in proportion to their capital account balances, as adjusted to reflect any gain or loss upon the sale or other disposition of our assets in liquidation.
Issuances of Additional Partnership Securities
Our partnership agreement allows us to issue additional partnership securities for any partnership purpose at any time and from time to time for consideration and on terms and conditions as our general partner determines, all without the approval of any limited partners.
Note 15 – Equity-Based Compensation
Williams’ Plan Information
The Williams Companies, Inc. 2007 Incentive Plan (Plan) provides for Williams common-stock-based awards to both employees and nonmanagement directors. The Plan permits the granting of various types of awards including, but not limited to, stock options and restricted stock units. Awards may be granted for no consideration other than prior and future services or based on certain financial performance targets being achieved.
Williams charges us directly for compensation expense related to stock-based compensation awards based on the fair value of the awards.
Operating and maintenance expenses and Selling, general, and administrative expenses include equity-based compensation expense for the years ended December 31, 2017, 2016, and 2015 of $34 million, $20 million, and $19 million, respectively.
123
Williams Partners L.P. | ||
Notes to Consolidated Financial Statements – (Continued) | ||
Williams Partners’ Plan Information
During 2014, certain employees of ACMP’s general partner received equity-based compensation through ACMP’s equity-based compensation program. These awards were converted to WPZ equity-based awards in accordance with the terms of the ACMP Merger. No additional grants of restricted common units were awarded through Williams Partners’ equity-based compensation programs and no additional grants are expected in the future. Operating and maintenance expenses and Selling, general, and administrative expenses include equity-based compensation expense related to Williams Partners’ equity-based compensation program of $5 million, $16 million, and $26 million, for the years ended December 31, 2017, 2016, and 2015, respectively. The total fair value of the restricted common units vested during 2017, 2016, and 2015 was $24 million, $34 million, and $5 million, respectively. As of December 31, 2017, there were 76 thousand nonvested units outstanding and $1 million of unrecognized compensation expense attributable to the outstanding awards which will be recognized in 2018.
Note 16 – Fair Value Measurements, Guarantees, and Concentration of Credit Risk
The following table presents, by level within the fair value hierarchy, certain of our financial assets and liabilities. The carrying values of cash and cash equivalents, accounts receivable, commercial paper, and accounts payable approximate fair value because of the short-term nature of these instruments. Therefore, these assets and liabilities are not presented in the following table.
Fair Value Measurements Using | |||||||||||||||||||
Carrying Amount | Fair Value | Quoted Prices In Active Markets for Identical Assets (Level 1) | Significant Other Observable Inputs (Level 2) | Significant Unobservable Inputs (Level 3) | |||||||||||||||
(Millions) | |||||||||||||||||||
Assets (liabilities) at December 31, 2017: | |||||||||||||||||||
Measured on a recurring basis: | |||||||||||||||||||
ARO Trust investments | $ | 135 | $ | 135 | $ | 135 | $ | — | $ | — | |||||||||
Energy derivatives liabilities designated as hedging instruments | (3 | ) | (3 | ) | (2 | ) | (1 | ) | — | ||||||||||
Energy derivatives liabilities not designated as hedging instruments | (3 | ) | (3 | ) | — | — | (3 | ) | |||||||||||
Additional disclosures: | |||||||||||||||||||
Other receivables | 7 | 7 | 7 | — | — | ||||||||||||||
Long-term debt, including current portion | (16,497 | ) | (18,112 | ) | — | (18,112 | ) | — | |||||||||||
Assets (liabilities) at December 31, 2016: | |||||||||||||||||||
Measured on a recurring basis: | |||||||||||||||||||
ARO Trust investments | $ | 96 | $ | 96 | $ | 96 | $ | — | $ | — | |||||||||
Energy derivatives assets designated as hedging instruments | 2 | 2 | — | 2 | — | ||||||||||||||
Energy derivatives assets not designated as hedging instruments | 1 | 1 | — | — | 1 | ||||||||||||||
Energy derivatives liabilities not designated as hedging instruments | (6 | ) | (6 | ) | — | — | (6 | ) | |||||||||||
Additional disclosures: | |||||||||||||||||||
Other receivables | 15 | 15 | 15 | — | — | ||||||||||||||
Long-term debt, including current portion | (18,470 | ) | (18,907 | ) | — | (18,907 | ) | — | |||||||||||
124
Williams Partners L.P. | ||
Notes to Consolidated Financial Statements – (Continued) | ||
Fair Value Methods
We use the following methods and assumptions in estimating the fair value of our financial instruments:
Assets and liabilities measured at fair value on a recurring basis
ARO Trust investments: Transco deposits a portion of its collected rates, pursuant to its rate case settlement, into an external trust that is specifically designated to fund future asset retirement obligations. The ARO Trust invests in a portfolio of actively traded mutual funds that are measured at fair value on a recurring basis based on quoted prices in an active market, is classified as available-for-sale, and is reported in Regulatory assets, deferred charges, and other in the Consolidated Balance Sheet. Both realized and unrealized gains and losses are ultimately recorded as regulatory assets or liabilities.
Energy derivatives: Energy derivatives include commodity-based exchange-traded contracts and over-the-counter contracts, which consist of physical forwards, futures, and swaps that are measured at fair value on a recurring basis. The fair value amounts are presented on a gross basis and do not reflect the netting of asset and liability positions permitted under the terms of our master netting arrangements. Further, the amounts do not include cash held on deposit in margin accounts that we have received or remitted to collateralize certain derivative positions. Energy derivatives assets are reported in Other current assets and deferred charges and Regulatory assets, deferred charges, and other in the Consolidated Balance Sheet. Energy derivatives liabilities are reported in Other accrued liabilities and Regulatory liabilities and other in the Consolidated Balance Sheet.
Reclassifications of fair value between Level 1, Level 2, and Level 3 of the fair value hierarchy, if applicable, are made at the end of each quarter. No transfers between Level 1 and Level 2 occurred during the years ended December 31, 2017 or 2016.
Additional fair value disclosures
Other receivables: Other receivables consist of margin deposits, which are reported in Other current assets and deferred charges in the Consolidated Balance Sheet. The disclosed fair value of our margin deposits is considered to approximate the carrying value generally due to the short-term nature of these items.
Long-term debt, including current portion: The disclosed fair value of our long-term debt is determined primarily by a market approach using broker quoted indicative period-end bond prices. The quoted prices are based on observable transactions in less active markets for our debt or similar instruments. The fair value of the financing obligation associated with our Dalton lateral, which is included within long-term debt, was determined using an income approach (See Note 13 – Debt, Banking Arrangements, and Leases).
Nonrecurring fair value measurements
We performed an interim assessment of the goodwill associated with our Central Region and Northeast Region reporting units within the West and Northeast G&P segments, respectively, as of September 30, 2015. At the time of measurement, the Central Region was part of our former Central segment. We performed the annual assessment of goodwill associated with our Northeast G&P and West G&P reporting units as of October 1, 2015. No impairment charges were required following these evaluations.
During the fourth quarter of 2015, we observed a significant decline in the market values of WPZ and comparable midstream companies within the industry. This served to reduce our estimate of enterprise value and increased our estimates of discount rates. As a result, we performed an impairment assessment as of December 31, 2015, of the goodwill associated with these reporting units.
We estimated the fair value of each reporting unit based on an income approach utilizing discount rates specific to the underlying businesses of each reporting unit. These discount rates considered variables unique to each business area, including equity yields of comparable midstream businesses, expectations for future growth, and customer
125
Williams Partners L.P. | ||
Notes to Consolidated Financial Statements – (Continued) | ||
performance considerations. Weighted-average discount rates utilized ranged from approximately 11 percent to 13 percent across the four reporting units.
As a result of the increases in discount rates during the fourth quarter of 2015, coupled with certain reductions in estimated future cash flows determined during the same period, the fair values of the Central Region, Northeast Region and Northeast G&P reporting units were determined to be below their respective carrying values. We then calculated the implied fair value of goodwill by performing a hypothetical application of the acquisition method wherein the estimated fair value was allocated to the underlying assets and liabilities of each reporting unit. As a result of these Level 3 measurements, we determined that the previously recorded goodwill associated with each reporting unit was fully impaired, resulting in a fourth-quarter 2015 noncash charge of $1,098 million, reflected in Impairment of goodwill in the Consolidated Statement of Comprehensive Income (Loss). For the West G&P reporting unit, the estimated fair value exceeded the carrying value and no impairment was recorded.
126
Williams Partners L.P. | ||
Notes to Consolidated Financial Statements – (Continued) | ||
The following table presents impairments of assets and investments associated with certain nonrecurring fair value measurements within Level 3 of the fair value hierarchy.
Impairments | |||||||||||||||||||||
Years Ended December 31, | |||||||||||||||||||||
Classification | Segment | Date of Measurement | Fair Value | 2017 | 2016 | 2015 | |||||||||||||||
(Millions) | |||||||||||||||||||||
Certain gathering operations (1) | Property, plant, and equipment – net and Intangible assets - net of accumulated amortization | West | September 30, 2017 | $ | 439 | $ | 1,019 | ||||||||||||||
Certain gathering operations (2) | Property, plant, and equipment – net and Intangible assets - net of accumulated amortization | Northeast G&P | September 30, 2017 | 21 | 115 | ||||||||||||||||
Canadian operations (3) | Assets held for sale | NGL & Petchem Services | June 30, 2016 | 924 | $ | 341 | |||||||||||||||
Certain gathering operations (4) | Property, plant, and equipment – net | West | June 30, 2016 | 18 | 48 | ||||||||||||||||
Previously capitalized project development costs (5) | Property, plant, and equipment – net | West | December 31, 2015 | 13 | $ | 94 | |||||||||||||||
Surplus equipment (6) | Property, plant, and equipment – net | Northeast G&P | June 30, 2015 | 17 | 20 | ||||||||||||||||
Level 3 fair value measurements of certain assets | 1,134 | 389 | 114 | ||||||||||||||||||
Other impairments and write-downs (7) | 22 | 68 | 31 | ||||||||||||||||||
Impairment of certain assets | $ | 1,156 | $ | 457 | $ | 145 | |||||||||||||||
Equity-method investments (8) | Investments | West and Northeast G&P | December 31, 2016 | $ | 1,295 | $ | 318 | ||||||||||||||
Equity-method investments (9) | Investments | West and Northeast G&P | March 31, 2016 | 1,294 | 109 | ||||||||||||||||
Other equity-method investment | Investments | West | March 31, 2016 | — | 3 | ||||||||||||||||
Equity-method investments (10) | Investments | West and Northeast G&P | December 31, 2015 | 4,017 | $ | 890 | |||||||||||||||
Equity-method investments (11) | Investments | West and Northeast G&P | September 30, 2015 | 1,203 | 461 | ||||||||||||||||
Other equity-method investment | Investments | Northeast G&P | December 31, 2015 | 58 | 8 | ||||||||||||||||
Impairment of equity-method investments | $ | 430 | $ | 1,359 | |||||||||||||||||
__________________
(1) | Relates to certain gathering operations in the Mid-Continent region. During the third quarter of 2017, we received solicitations and engaged in negotiations for the sale of certain of these assets which led to our impairment |
127
Williams Partners L.P. | ||
Notes to Consolidated Financial Statements – (Continued) | ||
evaluation. The estimated fair value was determined using an income approach and incorporated market inputs based on ongoing negotiations for a potential sale of a portion of the underlying assets. For the income approach, we utilized a discount rate of 10.2 percent, reflecting an estimated cost of capital and risks associated with the underlying assets.
(2) | Relates to certain gathering operations in the Marcellus South region resulting from an anticipated decline in future volumes following a third-quarter 2017 shut-in by the primary producer. The estimated fair value was determined by the income approach utilizing a discount rate of 11.1 percent, reflecting an estimated cost of capital and risks associated with the underlying assets. |
(3) | Relates to our Canadian operations. We designated these operations as held for sale as of June 30, 2016. As a result, we measured the fair value of the disposal group, resulting in an impairment charge. The estimated fair value was determined by a market approach based primarily on inputs received in the marketing process and reflected our estimate of the potential assumed proceeds. We disposed of our Canadian operations through a sale during the third quarter of 2016. (See Note 2 – Acquisitions and Divestitures). |
(4) | Relates to certain gathering assets within the Mid-Continent region. The estimated fair value was determined by a market approach based on our analysis of observable inputs in the principal market. |
(5) | Relates to a gas processing plant, the completion of which is considered remote due to unfavorable impact of low natural gas prices on customer drilling activities. The assessed fair value primarily represents the estimated salvage value of certain equipment measured using a market approach based on our analysis of observable inputs in the principal market. |
(6) | Relates to certain surplus equipment. The estimated fair value was determined by a market approach based on our analysis of observable inputs in the principal market. |
(7) | Reflects multiple individually insignificant impairments and write-downs of other certain assets that may no longer be in use or are surplus in nature for which the fair value was determined to be lower than the carrying value. |
(8) | Relates to West’s previously held interest in Ranch Westex and multiple, currently held Appalachia Midstream Investments at Northeast G&P. The historical carrying value of these equity-method investments was initially recorded based on estimated fair value during the third quarter of 2014 in conjunction with the acquisition of ACMP. We estimated the fair value of these Appalachia Midstream Investments using an income approach based on expected future cash flows and appropriate discount rates. The determination of estimated future cash flows involved significant assumptions regarding gathering volumes, rates, and related capital spending. The discount rate utilized for the Appalachia Midstream Investments evaluation was 10.2 percent and reflected an estimated cost of capital as impacted by market conditions and risks associated with the underlying businesses. In addition to utilizing an income approach, we also considered a market approach for certain Appalachia Midstream Investments and Ranch Westex based on an agreement reached in February 2017 to exchange our interests in DBJV and Ranch Westex for additional interests in certain Appalachia Midstream Investments and cash. (See Note 6 – Investing Activities). |
(9) | Relates to West’s previously held interest in DBJV and Northeast G&P’s currently held equity-method investment in Laurel Mountain. Our carrying values in these equity-method investments had been written down to fair value at December 31, 2015. Our first-quarter 2016 analysis reflected higher discount rates for both of these equity-method investments, along with lower natural gas prices for Laurel Mountain. We estimated the fair value of these equity-method investments using an income approach based on expected future cash flows and appropriate discount rates. The determination of estimated future cash flows involved significant assumptions regarding gathering volumes and related capital spending. Discount rates utilized ranged from 13.0 percent to 13.3 percent |
128
Williams Partners L.P. | ||
Notes to Consolidated Financial Statements – (Continued) | ||
and reflected increases in the estimated cost of capital, revised estimates of expected future cash flows, and risks associated with the underlying businesses.
(10) | Relates to West’s previously held interest in DBJV as well as Northeast G&P’s currently held equity-method investments in UEOM, Laurel Mountain, and certain of the Appalachia Midstream Investments. We estimated the fair value of these equity-method investments using an income approach based on expected future cash flows and appropriate discount rates. The determination of estimated future cash flows involved significant assumptions regarding gathering volumes and related capital spending. Discount rates utilized ranged from 10.8 percent to 14.4 percent and reflected further fourth-quarter 2015 increases in the estimated cost of capital, revised estimates of expected future cash flows, and risks associated with the underlying businesses. |
(11) | Relates to West’s previously held interest in DBJV and certain of the Appalachia Midstream Investments at Northeast G&P currently held. The historical carrying value of these equity-method investments was initially recorded based on estimated fair value during the third quarter of 2014 in conjunction with the acquisition of ACMP. We estimated the fair value of these equity-method investments using an income approach based on expected future cash flows and appropriate discount rates. The determination of estimated future cash flows involved significant assumptions regarding gathering volumes and related capital spending. Discount rates utilized were 11.8 percent and 8.8 percent for DBJV and certain of the Appalachia Midstream Investments, respectively, and reflected an estimated cost of capital as impacted by market conditions, and risks associated with the underlying businesses. |
Guarantees
We are required by our revolving credit agreement to indemnify lenders for certain taxes required to be withheld from payments due to the lenders and for certain tax payments made by the lenders. The maximum potential amount of future payments under these indemnifications is based on the related borrowings and such future payments cannot currently be determined. These indemnifications generally continue indefinitely unless limited by the underlying tax regulations and have no carrying value. We have never been called upon to perform under these indemnifications and have no current expectation of a future claim.
Concentration of Credit Risk
Cash equivalents
Our cash equivalents are primarily invested in funds with high-quality, short-term securities and instruments that are issued or guaranteed by the U.S. government.
Trade accounts and other receivables
The following table summarizes concentration of receivables, net of allowances:
December 31, | |||||||
2017 | 2016 | ||||||
(Millions) | |||||||
NGLs, natural gas, and related products and services | $ | 760 | $ | 736 | |||
Transportation of natural gas and related products | 212 | 187 | |||||
Other | — | 3 | |||||
Total | $ | 972 | $ | 926 | |||
Customers include producers, distribution companies, industrial users, gas marketers, and pipelines primarily located in the continental United States. As a general policy, collateral is not required for receivables, but customers’ financial condition and credit worthiness are evaluated regularly. Based upon this evaluation, we may obtain collateral to support receivables. As of December 31, 2017 and 2016, Chesapeake Energy Corporation, and its affiliates
129
Williams Partners L.P. | ||
Notes to Consolidated Financial Statements – (Continued) | ||
(Chesapeake), a customer primarily within our Northeast G&P and West segments, accounted for $176 million and $133 million, respectively, of the consolidated Trade accounts and other receivables balances.
Revenues
In 2017, 2016, and 2015, Chesapeake accounted for 10 percent, 14 percent, and 18 percent, respectively, of our consolidated revenues.
Note 17 – Contingent Liabilities and Commitments
Environmental Matters
We are a participant in certain environmental activities in various stages including assessment studies, cleanup operations, and/or remedial processes at certain sites, some of which we currently do not own. We are monitoring these sites in a coordinated effort with other potentially responsible parties, the U.S. Environmental Protection Agency (EPA), or other governmental authorities. We are jointly and severally liable along with unrelated third parties in some of these activities and solely responsible in others. Certain of our subsidiaries have been identified as potentially responsible parties at various Superfund and state waste disposal sites. In addition, these subsidiaries have incurred, or are alleged to have incurred, various other hazardous materials removal or remediation obligations under environmental laws. As of December 31, 2017, we have accrued liabilities totaling $15 million for these matters, as discussed below. Estimates of the most likely costs of cleanup are generally based on completed assessment studies, preliminary results of studies, or our experience with other similar cleanup operations. At December 31, 2017, certain assessment studies were still in process for which the ultimate outcome may yield different estimates of most likely costs. Therefore, the actual costs incurred will depend on the final amount, type, and extent of contamination discovered at these sites, the final cleanup standards mandated by the EPA or other governmental authorities, and other factors.
The EPA and various state regulatory agencies routinely promulgate and propose new rules, and issue updated guidance to existing rules. More recent rules and rulemakings include, but are not limited to, rules for reciprocating internal combustion engine maximum achievable control technology, air quality standards for one hour nitrogen dioxide emissions, and volatile organic compound and methane new source performance standards impacting design and operation of storage vessels, pressure valves, and compressors. On October 1, 2015, the EPA issued its rule regarding National Ambient Air Quality Standards for ground-level ozone, setting a stricter standard of 70 parts per billion. We are monitoring the rule’s implementation as the reduction will trigger additional federal and state regulatory actions that may impact our operations. Implementation of the regulations is expected to result in impacts to our operations and increase the cost of additions to Property, plant, and equipment – net in the Consolidated Balance Sheet for both new and existing facilities in affected areas. We are unable to reasonably estimate the cost of additions that may be required to meet the regulations at this time due to uncertainty created by various legal challenges to these regulations and the need for further specific regulatory guidance.
Our interstate gas pipelines are involved in remediation activities related to certain facilities and locations for polychlorinated biphenyls, mercury, and other hazardous substances. These activities have involved the EPA and various state environmental authorities, resulting in our identification as a potentially responsible party at various Superfund waste sites. At December 31, 2017, we have accrued liabilities of $7 million for these costs. We expect that these costs will be recoverable through rates.
We also accrue environmental remediation costs for natural gas underground storage facilities, primarily related to soil and groundwater contamination. At December 31, 2017, we have accrued liabilities totaling $8 million for these costs.
Royalty Matters
Certain of our customers, including one major customer, have been named in various lawsuits alleging underpayment of royalties and claiming, among other things, violations of anti-trust laws and the Racketeer Influenced and Corrupt Organizations Act. We have also been named as a defendant in certain of these cases filed in Pennsylvania
130
Williams Partners L.P. | ||
Notes to Consolidated Financial Statements – (Continued) | ||
based on allegations that we improperly participated with that major customer in causing the alleged royalty underpayments. We believe that the claims asserted are subject to indemnity obligations owed to us by that major customer. Due to the preliminary status of the cases, we are unable to estimate a range of potential loss at this time.
Unitholder Litigation
On March 7, 2016, a purported unitholder of us filed a putative class action on behalf of certain purchasers of our units in U.S. District Court in Oklahoma. The action names as defendants us, Williams, Williams Partners GP LLC, Alan S. Armstrong, and former Chief Financial Officer Donald R. Chappel and alleges violations of certain federal securities laws for failure to disclose Energy Transfer Equity, L.P.’s intention to pursue a purchase of Williams conditioned on Williams not closing the WPZ Public Unit Exchange when announcing the WPZ Public Unit Exchange. The complaint seeks, among other things, damages and an award of costs and attorneys’ fees. The plaintiff filed an amended complaint on August 31, 2016. On October 17, 2016, we requested the court dismiss the action, and on March 8, 2017, the court dismissed the complaint with prejudice. On April 7, 2017, the plaintiff filed a notice of appeal. We cannot reasonably estimate a range of potential loss at this time.
Other
In addition to the foregoing, various other proceedings are pending against us which are incidental to our operations, none of which are expected to be material to our expected future annual results of operations, liquidity, and financial position.
Summary
We have disclosed all significant matters for which we are unable to reasonably estimate a range of possible loss. We estimate that for all other matters for which we are able to reasonably estimate a range of loss, our aggregate reasonably possible losses beyond amounts accrued are immaterial to our expected future annual results of operations, liquidity, and financial position. These calculations have been made without consideration of any potential recovery from third parties.
Commitments
Commitments for construction and acquisition of property, plant, and equipment are approximately $348 million at December 31, 2017.
Note 18 – Segment Disclosures
Our reportable segments are Northeast G&P, Atlantic-Gulf, West, and NGL & Petchem Services. (See Note 1 – General, Description of Business, Basis of Presentation, and Summary of Significant Accounting Policies.) Certain other corporate activities are included in Other.
Performance Measurement
We evaluate segment operating performance based upon Modified EBITDA (earnings before interest, taxes, depreciation, and amortization). This measure represents the basis of our internal financial reporting and is the primary performance measure used by our chief operating decision maker in measuring performance and allocating resources among our reportable segments. Intersegment revenues primarily represent the sale of NGLs from our natural gas processing plants to our marketing business.
We define Modified EBITDA as follows:
• | Net income (loss) before: |
◦ | Provision (benefit) for income taxes; |
◦ | Interest incurred, net of interest capitalized; |
131
Williams Partners L.P. | ||
Notes to Consolidated Financial Statements – (Continued) | ||
◦ | Equity earnings (losses); |
◦ | Impairment of equity-method investments; |
◦ | Other investing income (loss) – net; |
◦ | Impairment of goodwill; |
◦ | Depreciation and amortization expenses; |
◦ | Accretion expense associated with asset retirement obligations for nonregulated operations. |
• | This measure is further adjusted to include our proportionate share (based on ownership interest) of Modified EBITDA from our equity-method investments calculated consistently with the definition described above. |
The following geographic area data includes Revenues from external customers based on product shipment origin and Long-lived assets based upon physical location:
United States | Canada | Total | |||||||||||
(Millions) | |||||||||||||
Revenues from external customers: | |||||||||||||
2017 | $ | 8,010 | $ | — | $ | 8,010 | |||||||
2016 | 7,406 | 85 | 7,491 | ||||||||||
2015 | 7,228 | 103 | 7,331 | ||||||||||
Long-lived assets: | |||||||||||||
2017 | $ | 36,702 | $ | — | $ | 36,702 | |||||||
2016 | 37,683 | — | 37,683 | ||||||||||
2015 | 37,586 | 1,030 | 38,616 | ||||||||||
Long-lived assets are comprised of property, plant, and equipment, goodwill, and other intangible assets.
132
Williams Partners L.P. | ||
Notes to Consolidated Financial Statements – (Continued) | ||
The following table reflects the reconciliation of Segment revenues to Total revenues as reported in the Consolidated Statement of Comprehensive Income (Loss) and Other financial information:
Northeast G&P | Atlantic- Gulf | West | NGL & Petchem Services | Eliminations | Total | ||||||||||||||||||
(Millions) | |||||||||||||||||||||||
2017 | |||||||||||||||||||||||
Segment revenues: | |||||||||||||||||||||||
Service revenues | |||||||||||||||||||||||
External | $ | 837 | $ | 2,202 | $ | 2,246 | $ | 7 | $ | — | $ | 5,292 | |||||||||||
Internal | 35 | 37 | — | — | (72 | ) | — | ||||||||||||||||
Total service revenues | 872 | 2,239 | 2,246 | 7 | (72 | ) | 5,292 | ||||||||||||||||
Product sales | |||||||||||||||||||||||
External | 264 | 257 | 1,840 | 357 | — | 2,718 | |||||||||||||||||
Internal | 27 | 227 | 173 | 8 | (435 | ) | — | ||||||||||||||||
Total product sales | 291 | 484 | 2,013 | 365 | (435 | ) | 2,718 | ||||||||||||||||
Total revenues | $ | 1,163 | $ | 2,723 | $ | 4,259 | $ | 372 | $ | (507 | ) | $ | 8,010 | ||||||||||
Other financial information: | |||||||||||||||||||||||
Proportional Modified EBITDA of equity-method investments | $ | 452 | $ | 264 | $ | 79 | $ | — | $ | — | $ | 795 | |||||||||||
2016 | |||||||||||||||||||||||
Segment revenues: | |||||||||||||||||||||||
Service revenues | |||||||||||||||||||||||
External | $ | 836 | $ | 1,959 | $ | 2,328 | $ | 50 | $ | — | $ | 5,173 | |||||||||||
Internal | 34 | 39 | — | — | (73 | ) | — | ||||||||||||||||
Total service revenues | 870 | 1,998 | 2,328 | 50 | (73 | ) | 5,173 | ||||||||||||||||
Product sales | |||||||||||||||||||||||
External | 134 | 245 | 1,183 | 756 | — | 2,318 | |||||||||||||||||
Internal | 28 | 205 | 197 | 22 | (452 | ) | — | ||||||||||||||||
Total product sales | 162 | 450 | 1,380 | 778 | (452 | ) | 2,318 | ||||||||||||||||
Total revenues | $ | 1,032 | $ | 2,448 | $ | 3,708 | $ | 828 | $ | (525 | ) | $ | 7,491 | ||||||||||
Other financial information: | |||||||||||||||||||||||
Proportional Modified EBITDA of equity-method investments | $ | 357 | $ | 287 | $ | 110 | $ | — | $ | — | $ | 754 | |||||||||||
2015 | |||||||||||||||||||||||
Segment revenues: | |||||||||||||||||||||||
Service revenues | |||||||||||||||||||||||
External | $ | 816 | $ | 1,900 | $ | 2,399 | $ | 20 | $ | — | $ | 5,135 | |||||||||||
Internal | 7 | 23 | — | — | (30 | ) | — | ||||||||||||||||
Total service revenues | 823 | 1,923 | 2,399 | 20 | (30 | ) | 5,135 | ||||||||||||||||
Product sales | |||||||||||||||||||||||
External | 110 | 287 | 1,100 | 699 | — | 2,196 | |||||||||||||||||
Internal | 18 | 176 | 120 | 13 | (327 | ) | — | ||||||||||||||||
Total product sales | 128 | 463 | 1,220 | 712 | (327 | ) | 2,196 | ||||||||||||||||
Total revenues | $ | 951 | $ | 2,386 | $ | 3,619 | $ | 732 | $ | (357 | ) | $ | 7,331 | ||||||||||
Other financial information: | |||||||||||||||||||||||
Proportional Modified EBITDA of equity-method investments | $ | 359 | $ | 257 | $ | 83 | $ | — | $ | — | $ | 699 | |||||||||||
133
Williams Partners L.P. | ||
Notes to Consolidated Financial Statements – (Continued) | ||
The following table reflects the reconciliation of Modified EBITDA to Net income (loss) as reported in the Consolidated Statement of Comprehensive Income (Loss):
Years Ended December 31, | |||||||||||||||||
2017 | 2016 | 2015 | |||||||||||||||
(Millions) | |||||||||||||||||
Modified EBITDA by segment: | |||||||||||||||||
Northeast G&P | $ | 819 | $ | 853 | $ | 770 | |||||||||||
Atlantic-Gulf | 1,238 | 1,621 | 1,539 | ||||||||||||||
West | 412 | 1,544 | 1,481 | ||||||||||||||
NGL & Petchem Services | 1,161 | (145 | ) | 218 | |||||||||||||
Other | (14 | ) | (9 | ) | (5 | ) | |||||||||||
3,616 | 3,864 | 4,003 | |||||||||||||||
Accretion expense associated with asset retirement obligations for nonregulated operations | (33 | ) | (31 | ) | (28 | ) | |||||||||||
Depreciation and amortization expenses | (1,700 | ) | (1,720 | ) | (1,702 | ) | |||||||||||
Impairment of goodwill | — | — | (1,098 | ) | |||||||||||||
Equity earnings (losses) | 434 | 397 | 335 | ||||||||||||||
Impairment of equity-method investments | — | (430 | ) | (1,359 | ) | ||||||||||||
Other investing income (loss) – net | 281 | 29 | 2 | ||||||||||||||
Proportional Modified EBITDA of equity-method investments | (795 | ) | (754 | ) | (699 | ) | |||||||||||
Interest expense | (822 | ) | (916 | ) | (811 | ) | |||||||||||
(Provision) benefit for income taxes | (6 | ) | 80 | (1 | ) | ||||||||||||
Net income (loss) | $ | 975 | $ | 519 | $ | (1,358 | ) | ||||||||||
The following table reflects Total assets, Investments, and Additions to long-lived assets by reportable segments:
Total Assets at December 31, | Investments at December 31, | Additions to Long-Lived Assets at December 31, | |||||||||||||||||||||||||
2017 | 2016 | 2017 | 2016 | 2017 | 2016 | 2015 | |||||||||||||||||||||
(Millions) | |||||||||||||||||||||||||||
Northeast G&P | $ | 14,397 | $ | 13,436 | $ | 5,307 | $ | 4,345 | $ | 460 | $ | 223 | $ | 584 | |||||||||||||
Atlantic-Gulf | 15,230 | 14,176 | 823 | 893 | 2,001 | 1,608 | 1,607 | ||||||||||||||||||||
West | 16,144 | 18,479 | 422 | 1,463 | 321 | 223 | 591 | ||||||||||||||||||||
NGL & Petchem Services | 3 | 1,112 | — | — | 5 | 48 | 175 | ||||||||||||||||||||
Other (1) | 936 | 161 | — | — | 5 | — | 3 | ||||||||||||||||||||
Eliminations (2) | (807 | ) | (1,099 | ) | — | — | — | — | — | ||||||||||||||||||
Total | $ | 45,903 | $ | 46,265 | $ | 6,552 | $ | 6,701 | $ | 2,792 | $ | 2,102 | $ | 2,960 | |||||||||||||
(1) | Increase in Other due primarily to increased cash balance. |
(2) | Eliminations primarily relate to the intercompany accounts receivable generated by our cash management program. |
134
Williams Partners L.P. | ||
Quarterly Financial Data | ||
(Unaudited) | ||
Summarized quarterly financial data are as follows:
First Quarter | Second Quarter | Third Quarter | Fourth Quarter | |||||||||||||
(Millions, except per-unit amounts) | ||||||||||||||||
2017 | ||||||||||||||||
Revenues | $ | 1,983 | $ | 1,919 | $ | 1,885 | $ | 2,223 | ||||||||
Product costs | 579 | 537 | 504 | 680 | ||||||||||||
Net income (loss) | 660 | 348 | 284 | (317 | ) | |||||||||||
Net income (loss) attributable to controlling interests | 634 | 320 | 259 | (342 | ) | |||||||||||
Net income (loss) allocated to common units for calculation of earnings per common unit (1) | 623 | 314 | 255 | (336 | ) | |||||||||||
Basic and diluted net income (loss) per common unit (2) | .68 | .33 | .27 | (.35 | ) | |||||||||||
2016 | ||||||||||||||||
Revenues | $ | 1,654 | $ | 1,740 | $ | 1,907 | $ | 2,190 | ||||||||
Product costs | 317 | 403 | 463 | 545 | ||||||||||||
Net income (loss) | 79 | (77 | ) | 351 | 166 | |||||||||||
Net income (loss) attributable to controlling interests | 50 | (90 | ) | 326 | 145 | |||||||||||
Net income (loss) allocated to common units for calculation of earnings per common unit (1) | (148 | ) | (289 | ) | 247 | 143 | ||||||||||
Basic and diluted net income (loss) per common unit (2) | (.25 | ) | (.49 | ) | .42 | .24 | ||||||||||
___________________
(1) | The sum of Net income (loss) allocated to common units for calculation of earnings per common unit for the four quarters may not equal the total for the year due to timing of unit issuances. |
(2) | The sum of Net income (loss) per common unit for the four quarters may not equal the total for the year due to changes in the average number of common units outstanding and rounding. |
2017
Net income (loss) for fourth-quarter 2017 includes $713 million of regulatory charges resulting from Tax Reform.
Net income (loss) for third-quarter 2017 includes:
• | $1.095 billion gain on the sale of Williams Olefins, L.L.C., a wholly owned subsidiary which owned our interest in the Geismar, Louisiana, olefins plant (Geismar Interest) (see Note 2 – Acquisitions and Divestitures of Notes to Consolidated Financial Statements); |
• | $1.019 billion impairment in the West reportable segment, primarily related to impairment of certain gathering operations in the Mid-Continent region (see Note 16 – Fair Value Measurements, Guarantees, and Concentration of Credit Risk); |
• | $121 million impairment in the Northeast G&P reportable segment, primarily related to impairment of certain gathering operations in the Marcellus South region (see Note 16 – Fair Value Measurements, Guarantees, and Concentration of Credit Risk). |
Net income (loss) for first-quarter 2017 includes a gain of $269 million associated with the disposition of certain equity-method investments (see Note 6 – Investing Activities).
135
Williams Partners L.P. | ||
Quarterly Financial Data – (Continued) | ||
(Unaudited) | ||
2016
Net income (loss) for fourth-quarter 2016 includes:
• | $173 million of income associated with the amortization of deferred income related to the restructuring of certain gas gathering contracts in the Barnett Shale and Mid-Continent regions and $58 million of related minimum volume commitment fees (see Note 7 – Other Income and Expenses); |
• | $318 million impairment loss on certain equity-method investments (see Note 16 – Fair Value Measurements, Guarantees, and Concentration of Credit Risk). |
Net income (loss) for second-quarter 2016 includes a $341 million impairment loss on Canadian assets (see Note 16 – Fair Value Measurements, Guarantees, and Concentration of Credit Risk).
Net income (loss) for first-quarter 2016 includes a $112 million impairment loss on equity-method investments (see Note 16 – Fair Value Measurements, Guarantees, and Concentration of Credit Risk).
136
Item 9. Changes In and Disagreements With Accountants on Accounting and Financial Disclosure
None.
Item 9A. Controls and Procedures
Disclosure Controls and Procedures
Our management, including our general partner’s Chief Executive Officer and Chief Financial Officer, does not expect that our disclosure controls and procedures (as defined in Rules 13a - 15(e) and 15d - 15(e) of the Securities Exchange Act) (Disclosure Controls) will prevent all errors and all fraud. A control system, no matter how well conceived and operated, can provide only reasonable, not absolute, assurance that the objectives of the control system are met. Further, the design of a control system must reflect the fact that there are resource constraints, and the benefits of controls must be considered relative to their costs. Because of the inherent limitations in all control systems, no evaluation of controls can provide absolute assurance that all control issues and instances of fraud, if any, within Williams Partners L.P. have been detected. These inherent limitations include the realities that judgments in decision-making can be faulty, and that breakdowns can occur because of simple error or mistake. Additionally, controls can be circumvented by the individual acts of some persons, by collusion of two or more people, or by management override of the control. The design of any system of controls also is based in part upon certain assumptions about the likelihood of future events, and there can be no assurance that any design will succeed in achieving its stated goals under all potential future conditions. Because of the inherent limitations in a cost-effective control system, misstatements due to error or fraud may occur and not be detected. We monitor our Disclosure Controls and make modifications as necessary; our intent in this regard is that the Disclosure Controls will be modified as systems change and conditions warrant.
Evaluation of Disclosure Controls and Procedures
An evaluation of the effectiveness of the design and operation of our Disclosure Controls was performed as of the end of the period covered by this report. This evaluation was performed under the supervision and with the participation of our management, including our general partner’s Chief Executive Officer and Chief Financial Officer. Based upon that evaluation, our general partner’s Chief Executive Officer and Chief Financial Officer concluded that these Disclosure Controls are effective at a reasonable assurance level.
Changes in Internal Control Over Financial Reporting
There have been no changes during the fourth quarter of 2017 that have materially affected, or are reasonably likely to materially affect, our Internal Control over Financial Reporting.
Management’s Annual Report on Internal Control over Financial Reporting
Management is responsible for establishing and maintaining adequate internal control over financial reporting (as defined in Rules 13a - 15(f) and 15d - 15(f) under the Securities Exchange Act of 1934). Our internal control over financial reporting is designed to provide reasonable assurance to our management and board of directors regarding the preparation and fair presentation of financial statements in accordance with accounting principles generally accepted in the United States. Our internal control over financial reporting includes those policies and procedures that (i) pertain to the maintenance of records that, in reasonable detail, accurately and fairly reflect the transactions and dispositions of our assets; (ii) provide reasonable assurance that transactions are recorded as to permit preparation of financial statements in accordance with generally accepted accounting principles, and that our receipts and expenditures are being made only in accordance with authorization of our management and board of directors; and (iii) provide reasonable assurance regarding prevention or timely detection of unauthorized acquisition, use or disposition of our assets that could have a material effect on our financial statements.
All internal control systems, no matter how well designed, have inherent limitations including the possibility of human error and the circumvention or overriding of controls. Therefore, even those systems determined to be effective can provide only reasonable assurance with respect to financial statement preparation and presentation.
137
Under the supervision and with the participation of our management, including our general partner’s Chief Executive Officer and Chief Financial Officer, we assessed the effectiveness of our internal control over financial reporting as of December 31, 2017, based on the criteria set forth by the Committee of Sponsoring Organizations of the Treadway Commission (COSO) in Internal Control — Integrated Framework (2013). Based on our assessment we concluded that, as of December 31, 2017, our internal control over financial reporting was effective.
Ernst & Young LLP, our independent registered public accounting firm, has audited our internal control over financial reporting, as stated in their report which is included in this Annual Report on Form 10-K.
138
Report of Independent Registered Public Accounting Firm
on Internal Control Over Financial Reporting
The Limited Partners of Williams Partners L.P.
and the Board of Directors of WPZ GP LLC,
General Partner of Williams Partners L.P.
Opinion on Internal Control Over Financial Reporting
We have audited Williams Partners L.P.’s internal control over financial reporting as of December 31, 2017, based on criteria established in Internal Control - Integrated Framework issued by the Committee of Sponsoring Organizations of the Treadway Commission (2013 framework) (the “COSO criteria”). In our opinion, Williams Partners L.P. (the “Partnership”) maintained, in all material respects, effective internal control over financial reporting as of December 31, 2017, based on the COSO criteria.
We also have audited, in accordance with the standards of the Public Company Accounting Oversight Board (United States) (“PCAOB”), the consolidated balance sheet of the Partnership as of December 31, 2017 and 2016, and the related consolidated statements of comprehensive income (loss), changes in equity, and cash flows for each of the three years in the period ended December 31, 2017, and the related notes and our report dated February 22, 2018 expressed an unqualified opinion thereon.
Basis for Opinion
The Partnership’s management is responsible for maintaining effective internal control over financial reporting and for its assessment of the effectiveness of internal control over financial reporting included in the accompanying Management’s Annual Report on Internal Control over Financial Reporting. Our responsibility is to express an opinion on the Partnership’s internal control over financial reporting based on our audit. We are a public accounting firm registered with the PCAOB and are required to be independent with respect to the Partnership in accordance with the U.S. federal securities laws and the applicable rules and regulations of the Securities and Exchange Commission and the PCAOB.
We conducted our audit in accordance with the standards of the PCAOB. Those standards require that we plan and perform the audit to obtain reasonable assurance about whether effective internal control over financial reporting was maintained in all material respects.
Our audit included obtaining an understanding of internal control over financial reporting, assessing the risk that a material weakness exists, testing and evaluating the design and operating effectiveness of internal control based on the assessed risk, and performing such other procedures as we considered necessary in the circumstances. We believe that our audit provides a reasonable basis for our opinion.
Definition and Limitations of Internal Control Over Financial Reporting
A company’s internal control over financial reporting is a process designed to provide reasonable assurance regarding the reliability of financial reporting and the preparation of financial statements for external purposes in accordance with generally accepted accounting principles. A company’s internal control over financial reporting includes those policies and procedures that (1) pertain to the maintenance of records that, in reasonable detail, accurately and fairly reflect the transactions and dispositions of the assets of the company; (2) provide reasonable assurance that transactions are recorded as necessary to permit preparation of financial statements in accordance with generally accepted accounting principles, and that receipts and expenditures of the company are being made only in accordance with authorizations of management and directors of the company; and (3) provide reasonable assurance regarding prevention or timely detection of unauthorized acquisition, use, or disposition of the company’s assets that could have a material effect on the financial statements.
Because of its inherent limitations, internal control over financial reporting may not prevent or detect misstatements. Also, projections of any evaluation of effectiveness to future periods are subject to the risk that controls may become inadequate because of changes in conditions, or that the degree of compliance with the policies or procedures may deteriorate.
/s/ Ernst & Young LLP
Tulsa, Oklahoma
February 22, 2018
139
Item 9B. Other Information
None.
PART III
Item 10. Directors, Executive Officers and Corporate Governance
As a limited partnership, we have no directors or officers. Instead, our general partner, WPZ GP LLC, manages our operations and activities. Our general partner is not elected by our unitholders and is not subject to re-election on a regular basis in the future. Unitholders are not entitled to elect the directors of our general partner or directly or indirectly participate in our management or operation. Our general partner’s directors are appointed by Williams, the corporate parent of our general partner. Accordingly, we do not have a procedure by which our unitholders may recommend nominees to our general partner’s Board of Directors.
All of the senior officers of our general partner are also senior officers of Williams.
The following table shows information for the directors and executive officers of our general partner.
Name | Age | Position with WPZ GP LLC | ||
Alan S. Armstrong | 55 | Chairman of the Board and Chief Executive Officer and Director | ||
H. Brent Austin | 63 | Director and Member of Audit and Conflicts Committees | ||
John D. Chandler | 48 | Senior Vice President and Chief Financial Officer and Director | ||
Micheal G. Dunn | 52 | Executive Vice President and Chief Operating Officer and Director | ||
Philip L. Frederickson | 61 | Director and Member of Audit and Conflicts Committees | ||
Alice M. Peterson | 65 | Director and Member of Audit and Conflicts Committees | ||
Chad J. Zamarin | 41 | Senior Vice President - Corporate Strategic Development and Director | ||
Walter J. Bennett | 48 | Senior Vice President - West | ||
Frank J. Ferazzi | 61 | Senior Vice President - Atlantic-Gulf | ||
John E. Poarch | 52 | Senior Vice President - Engineering Services | ||
James E. Scheel | 53 | Senior Vice President - Northeast G&P | ||
Ted T. Timmermans | 61 | Vice President, Controller, and Chief Accounting Officer | ||
T. Lane Wilson | 51 | Senior Vice President and General Counsel | ||
Officers serve at the discretion of the Board of Directors of our general partner. There are no family relationships among any of the directors or executive officers of our general partner. The directors of our general partner are appointed for one-year terms. In addition to independence and financial literacy for members of our general partner’s Board of Directors who serve on the Audit Committee and Conflicts Committee, our general partner considers the following qualifications relevant to service on its Board of Directors in the context of our business and structure:
• | Industry experience in oil and natural gas. |
• | Engineering and construction experience. |
• | Financial and accounting experience. |
• | Corporate governance experience. |
• | Securities and capital markets experience. |
• | Executive leadership experience. |
• | Public policy and government experience. |
140
• | Strategy development and risk management experience. |
• | Operating experience. |
• | Knowledge of the marketplace and political and regulatory environments relevant to the energy sector in the locations where we operate currently or plan to in the future (marketplace knowledge). |
Certain information about each of our general partner’s directors and executive officers is set forth below, including qualifications relevant to service on our general partner’s Board of Directors.
Alan S. Armstrong has served as a director of our general partner since 2012, as Chief Executive Officer of our general partner since December 31, 2014, and as Chairman of the Board of Directors of our general partner since February 2, 2015. Mr. Armstrong has served as the Chief Executive Officer, President, and a director of Williams since 2011. Mr. Armstrong served as a director of the general partner of Pre-merger WPZ (the Pre-merger WPZ Board) from 2005 until the ACMP Merger on February 2, 2015, as the Chairman of the Pre-merger WPZ Board and the Chief Executive Officer of the general partner of Pre-merger WPZ (the Pre-merger WPZ General Partner) from 2011 until the ACMP Merger. From 2010 to 2011, Mr. Armstrong served as Senior Vice President - Midstream of the Pre-merger WPZ General Partner. From 2005 until 2010, Mr. Armstrong served as the Chief Operating Officer of the Pre-merger WPZ General Partner. From 2002 to 2011, Mr. Armstrong served as Senior Vice President - Midstream of Williams and acted as President of Williams’ midstream business. From 1999 to 2002, Mr. Armstrong was Vice President, Gathering and Processing in Williams’ midstream business and from 1998 to 1999 was Vice President, Commercial Development, in Williams’ midstream business. Mr. Armstrong has also served as a director of BOK Financial Corporation (a financial services company) since 2013.
Mr. Armstrong’s qualifications include industry, engineering and construction, financial and accounting, corporate governance, securities and capital markets, executive leadership, strategy development and risk management, operating experience, and marketplace knowledge.
H. Brent Austin has served as a director of our general partner since the ACMP Merger. Mr. Austin served as a director of the Pre-merger WPZ General Partner from 2010 until the ACMP Merger. Mr. Austin has been Managing Director and Chief Investment Officer of Alsamora L.P., a private limited partnership with real estate and diversified equity investments, since 2003. Mr. Austin served as a director of the general partner of Williams Pipeline Partners L.P. (WMZ) (a limited partnership formed by Williams to own and operate natural gas and storage assets) from 2008 until WMZ merged with Pre-merger WPZ in 2010. From 2002 to 2003, Mr. Austin was President and Chief Operating Officer of El Paso Corporation, an owner and operator of natural gas transportation pipelines, storage, and other midstream assets, where he managed all nonregulated operations as well as all financial functions.
Mr. Austin’s qualifications include marketplace knowledge and industry, financial and accounting, corporate governance, securities and capital markets, executive leadership, public policy and government, strategy development and risk management, and operating experience.
John D. Chandler has served as a director of our general partner since November 2017 and as Senior Vice President and Chief Financial Officer of our general partner and Williams since September 2017. Mr. Chandler most recently served as Senior Vice President and Chief Financial Officer of Magellan GP, LLC, the general partner of Magellan Midstream Partners, LP from 2009 until his retirement in March 2014. From 2003 until 2009, he served as Senior Vice President and Chief Financial Officer for the general partner of Magellan Midstream Holdings, L.P. From 1992 until 2002, Mr. Chandler held various accounting and finance roles within Williams and MAPCO Inc., prior to its acquisition by Williams. Since 2017, he has served on the Board of Directors of Matrix Service Company, and at times between 2013 and 2017, he served on the Boards of Directors of USA Compression Partners, Cone Midstream Partners, and Green Plains Partners.
Mr. Chandler’s qualifications include industry, financial and accounting, securities and capital markets, executive leadership, strategy development and risk management, and marketplace knowledge.
141
Micheal G. Dunn has served as a director of our general partner and as Executive Vice President and Chief Operating Officer of our general partner and Williams since February 2017. Previously, Mr. Dunn served as President of Questar Pipeline and as Executive Vice President of Questar Corporation from 2015 through 2017. Prior to joining Questar in 2015, Mr. Dunn served as President and Chief Executive Officer of PacifiCorp Energy from 2010 through 2015, a subsidiary of Berkshire Hathaway Energy. Before that, Mr. Dunn was president of Kern River Gas Transmission Company, a Berkshire Hathaway Energy interstate natural gas pipeline subsidiary. Mr. Dunn began his career with Williams as an operations engineer and spent 14 years with the company in a variety of technical and leadership roles.
Mr. Dunn’s qualifications include industry, engineering and construction, corporate governance, executive leadership, strategy development and risk management, operating experience, and marketplace knowledge.
Philip L. Frederickson has served as a director of our general partner since 2010. Mr. Frederickson retired from ConocoPhillips (then an international, integrated oil company) after 29 years of service. At the time of his retirement, he was Executive Vice President Planning, Strategy and Corporate Affairs. He also served as a board member for Chevron Phillips Chemical (a chemical producer) and DCP Midstream (a natural gas processor and marketer). Mr. Frederickson joined Conoco in 1978 and held several senior positions in the United States and Europe, including General Manager, Strategy and Business Development; General Manager, Refining and Marketing Europe; Managing Director, Conoco Ireland; General Manager, Refining and Marketing; General Manager, Strategy and Portfolio Management, Upstream; and Vice President, Business Development. Mr. Frederickson was Senior Vice President of Corporate Strategy and Business Development for Conoco Inc. from 2001 to 2002. Following the announcement of the merger of Conoco and Phillips in 2001, Mr. Frederickson was named integration lead to coordinate the merger transition and in 2002 was made Executive Vice President, Commercial, of ConocoPhillips. Mr. Frederickson serves as a board member for Entergy Corporation, and as a director emeritus for the Yellowstone Park Foundation. Mr. Frederickson previously served as a director of Sunoco Logistics Partners L.P. and Rosetta Resources Inc.
Mr. Frederickson’s qualifications include industry, engineering and construction, financial and accounting, corporate governance, securities and capital markets, public policy and government, strategy and risk management, mergers and acquisitions, operating experience, and marketplace knowledge.
Alice M. Peterson has served as a director of our general partner since the ACMP Merger. Ms. Peterson served as a director of the Pre-merger WPZ General Partner from 2005 until the ACMP Merger. Ms. Peterson is currently President of Loretto Group, a consultancy focused on sustainably profitable business growth. From 2012 through 2015, she served as Chief Operating Officer of PPL Group and Big Shoulders Capital, both private equity firms with common ownership. Ms. Peterson served as a director of RIM Finance, LLC, a wholly owned subsidiary of Research in Motion, Ltd., the maker of the Blackberry™ handheld device, from 2000 to 2013. From 2009 to 2010, Ms. Peterson served as the Chief Ethics Officer of SAI Global, a provider of compliance and ethics services, and was a special advisor to SAI Global until 2012. Ms. Peterson served as a director of Patina Solutions, which provides professionals on a flexible basis to help companies achieve their business objectives from 2012 to 2013. Ms. Peterson founded and served as the president of Syrus Global, a provider of ethics, compliance, and reputation management solutions from 2002 to 2009, when it was acquired by SAI Global. From 2000 to 2001, Ms. Peterson served as President and General Manager of RIM Finance, LLC. From 1998 to 2000, Ms. Peterson served as Vice President of Sears Online and from 1993 to 1998, as Vice President and Treasurer of Sears, Roebuck and Co. Ms. Peterson previously served as a director of Navistar Financial Corporation, a wholly owned subsidiary of Navistar International (a manufacturer of commercial and military trucks, diesel engines and parts), Hanesbrands Inc. (an apparel company), TBC Corporation (a marketer of private branded replacement tires), and Fleming Companies (a supplier of consumer package goods). Ms. Peterson has served as a director of SP Plus Corporation since February 2018.
Ms. Peterson’s qualifications include industry, financial and accounting, corporate governance, securities and capital markets, executive leadership, strategy development and risk management, and operating experience.
Chad J. Zamarin has served as a director of our general partner since November 2017 and as Senior Vice President - Corporate Strategic Development of our general partner and Williams since June 2017. He most recently served as President, Pipeline and Midstream at Cheniere Energy from 2014 through 2017. Prior to joining Cheniere, Mr. Zamarin
142
served as the Chief Operating Officer at NiSource Midstream, LLC and NiSource Energy Ventures, LLC, as well as the President of Pennant Midstream, LLC, a joint venture with Hilcorp Energy.
Mr. Zamarin’s qualifications include industry, engineering and construction, executive leadership, strategy development and risk management, mergers and acquisitions, operating experience, and marketplace knowledge.
Walter J. Bennett has served as Senior Vice President - West of our general partner since December 2013, and previously served as a director of our general partner from February 2017 through November 2017. Mr. Bennett has served as Senior Vice President - West of Williams since January 2015, and in the same role for the Pre-merger WPZ General Partner until the ACMP Merger. Previously, Mr. Bennett served as Vice President - Western Operations for our general partner from December 2013 to April 2015. Prior to that, he served as Chief Operating Officer of Chesapeake Midstream Development.
Frank J. Ferazzi has served as Senior Vice President - Atlantic-Gulf of our general partner and Williams since June 2017. Previously, Mr. Ferazzi served as VP & GM Eastern Interstates of Williams from November 2014 through June 2017, and previously as VP & GM Transco from January 2013 - January 2015. Before that, Mr. Ferazzi served as VP Commercial Operations - Gas Pipeline from May 2010 - December 2012.
John E. Poarch has served as Senior Vice President - Engineering Services of our general partner and Williams since November 2017. Previously, he served as VP Commercial West OA from March 2017 through November 2017, and before that, as VP Commercial & Business Development from January 2015 through March 2017. Before that, Mr. Poarch was the general manager for Access Midstream's Eagle Ford operations.
James E. Scheel has served as Senior Vice President - Northeast G&P of our general partner since the ACMP Merger, and served in that role for the Pre-merger WPZ General Partner from January 2014 until the ACMP Merger. Mr. Scheel served as a director of our general partner from the ACMP Merger until November 2017. Mr. Scheel has served as Senior Vice President - Northeast G&P since January 2014. Mr. Scheel served as a director of the Pre-merger WPZ General Partner from 2012 until the ACMP Merger. Mr. Scheel served as a director of the Pre-merger ACMP General Partner from 2012 to February 2014. Previously, Mr. Scheel served as Senior Vice President - Corporate Strategic Development of Williams and the Pre-merger WPZ General Partner from February 2012 to January 2014. Mr. Scheel served as Vice President of Business Development of Williams’ midstream business from January 2011 until February 2012.
Ted T. Timmermans has served as Vice President, Controller, and Chief Accounting Officer of our general partner since the ACMP Merger. Mr. Timmermans has served as Vice President, Controller, and Chief Accounting Officer of Williams since 2005 and served in those roles for the Pre-merger WPZ General Partner from 2005 until the ACMP Merger. Mr. Timmermans served as an Assistant Controller of Williams from 1998 to 2005. Mr. Timmermans served as Chief Accounting Officer of the general partner of WMZ from 2008 until WMZ merged with Pre-merger WPZ in 2010.
T. Lane Wilson has served as Senior Vice President, General Counsel of our general partner and Williams since April 2017. Prior to joining Williams, Mr. Wilson served as a United States Magistrate Judge for the Northern District of Oklahoma from 2009 until he joined Williams in April 2017. Mr. Wilson previously served as a shareholder and member of the board of directors of the Hall Estill law firm from 1994 to 2008.
Governance
Our general partner adopted governance guidelines that address, among other areas, director independence, policies on meeting attendance and preparation, executive sessions of nonmanagement directors and communications with nonmanagement directors.
143
Director Independence
Because we are a limited partnership, the NYSE does not require our general partner’s Board of Directors to be composed of a majority of directors who meet the criteria for independence required by the NYSE or to maintain nominating/corporate governance and compensation committees composed entirely of independent directors.
Our general partner’s Board of Directors has adopted governance guidelines which require at least three members of our general partner’s Board of Directors to be independent directors as defined by the rules of the NYSE and have no material relationship with us or our general partner. Our general partner’s Board of Directors at least annually reviews the independence of its members expected to be independent and affirmatively makes a determination that each director meets these independence standards.
Our general partner’s Board of Directors affirmatively determined that each of Ms. Peterson, and Messrs. Austin and Frederickson is an “independent director” under the current listing standards of the NYSE and our director independence standards. In addition, there were no transactions or relationships between each director and any member of his or her immediate family on one hand, and us or any affiliate of us on the other, that were identified and considered by the Board of Directors. Accordingly, the Board of Directors of our general partner affirmatively determined that all of the directors mentioned above are independent. Because Messrs. Armstrong, Chandler, Dunn, and Zamarin, are employees, officers and/or directors of Williams, they are not independent under these standards.
Ms. Peterson and Messrs. Austin and Frederickson do not serve as an executive officer of any nonprofit organization to which we or our affiliates made contributions within any single year of the preceding three years that exceeded the greater of $1.0 million or 2 percent of such organization’s consolidated gross revenues. Further, there were no discretionary contributions made by us or our affiliates to a nonprofit organization with which such director, or such director’s spouse, has a relationship that impacts the director’s independence.
Meeting Attendance and Preparation
Members of the Board of Directors of our general partner are expected to attend at least 75 percent of regular Board meetings and meetings of the committees on which they serve, either in person or telephonically. In addition, directors are expected to be prepared for each meeting of the Board by reviewing written materials distributed in advance.
Executive Sessions of Nonmanagement Directors
Our general partner’s nonmanagement Board members periodically meet outside the presence of our general partner’s executive officers. The Chair of the Audit Committee serves as the presiding director for executive sessions of nonmanagement Board members. The current Chair of the Audit Committee and the presiding director is Ms. Peterson.
Communications with Directors
Interested parties wishing to communicate with our general partner’s nonmanagement directors, individually or as a group, may do so by contacting our general partner’s Corporate Secretary or the presiding director. The contact information is maintained at the corporate governance/corporate governance guidelines tab of our website at http://investor.williams.com/williams-partners-lp.
The current contact information is as follows:
Williams Partners L.P.
c/o WPZ GP LLC
One Williams Center, Suite 4700
Tulsa, Oklahoma 74172
Attn: Presiding Director
144
Williams Partners L.P.
c/o WPZ GP LLC
One Williams Center, Suite 4700
Tulsa, Oklahoma 74172
Attn: Corporate Secretary
Board Committees
The Board of Directors of our general partner has a separately designated standing Audit Committee established in accordance with Section 3(a)(58)(A) of the Securities Exchange Act of 1934 and a Conflicts Committee. The following is a description of each of the committees and current committee membership.
Board Committee Membership
Audit | Conflicts | ||
Committee | Committee | ||
H. Brent Austin | ü | Ÿ | |
Philip L. Frederickson | ü | ü | |
Alice M. Peterson | Ÿ | ü | |
_______________
ü= committee member
Ÿ = chairperson
Audit Committee
Our general partner’s Board of Directors has determined that all members of the Audit Committee meet the heightened independence requirements of the NYSE for audit committee members and that all members are financially literate as defined by the rules of the NYSE. The Board of Directors has further determined that all members of the Audit Committee qualify as “audit committee financial experts” as defined by the rules of the SEC. Biographical information for each of these persons is set forth above. The Audit Committee is governed by a written charter adopted by the Board of Directors. For further information about the Audit Committee, please read the “Report of the Audit Committee” below and “Principal Accountant Fees and Services.”
Conflicts Committee
The Conflicts Committee of our general partner’s Board of Directors reviews specific matters that the Board believes may involve conflicts of interest. The Conflicts Committee determines if resolution of the conflict is fair and reasonable to us. The members of the Conflicts Committee may not be officers or employees of our general partner or directors, officers or employees of its affiliates and must meet the independence and experience requirements established by the NYSE and other federal securities laws. Any matters approved by the Conflicts Committee will be conclusively deemed fair and reasonable to us, approved by all of our partners and not a breach by our general partner of any duties it may owe to us or our unitholders.
Code of Business Conduct and Ethics
Our general partner has adopted a Code of Business Conduct and Ethics for directors, officers and employees. We intend to disclose any amendments to or waivers of the Code of Business Conduct and Ethics on behalf of our general partner’s Chief Executive Officer, Chief Financial Officer, Controller and persons performing similar functions on our website at http://investor.williams.com/williams-partners-lp under the Corporate Governance tab, promptly following the date of any such amendment or waiver.
Section 16(a) Beneficial Ownership Reporting Compliance
Section 16(a) of the Securities Exchange Act of 1934 requires our general partner’s executive officers and directors and persons who own more than 10 percent of a registered class of our equity securities to file with the SEC and the
145
NYSE reports of ownership of our securities and changes in reported ownership. Executive officers and directors of our general partner and greater than 10 percent unitholders are required by SEC rules to furnish to us copies of all Section 16(a) reports that they file. Based solely on a review of reports furnished to our general partner, or written representations from reporting persons that all reportable transactions were reported, we believe that with respect to all of our general partner’s officers and directors and our greater than 10 percent common unitholders, all required reports were timely filed under Section 16(a).
Transfer Agent and Registrar
Computershare Trust Company, N.A. serves as registrar and transfer agent for our common units. Contact information for Computershare is as follows:
Computershare Trust Company, N.A.
P.O. Box 505000
Louisville, KY 40233
Phone: (781) 575-2879 or toll-free, (800) 884-4225
Hearing impaired: (800) 952-9245
Internet: www.computershare.com/investor
Send overnight mail to:
Computershare Trust Company, N.A.
462 South 4th Street, Suite 1600
Louisville, KY 40202
146
REPORT OF THE AUDIT COMMITTEE
The Audit Committee oversees our financial reporting process on behalf of the Board of Directors. Management has the primary responsibility for the financial statements and the reporting process including the systems of internal controls. The Audit Committee operates under a written charter approved by the Board. The charter, among other things, provides that the Audit Committee has authority to appoint, retain, oversee and terminate when appropriate the independent auditor. In this context, the Audit Committee:
• | Reviewed and discussed the audited financial statements in this annual report on Form 10-K with management, including a discussion of the quality, not just the acceptability, of the accounting principles, the reasonableness of significant judgments and the clarity of disclosures in the financial statements; |
• | Reviewed with Ernst & Young LLP, the independent auditors, who are responsible for expressing an opinion on the conformity of those audited financial statements with generally accepted accounting principles, their judgments as to the quality and acceptability of Williams Partners L.P.’s accounting principles and such other matters as are required to be discussed with the Audit Committee under generally accepted auditing standards; |
• | Received the written disclosures and the letter from Ernst & Young LLP required by applicable requirements of the Public Company Accounting Oversight Board regarding Ernst & Young LLP’s communications with the audit committee concerning independence, and discussed with Ernst & Young LLP its independence; |
• | Discussed with Ernst & Young LLP the matters required to be discussed by Auditing Standard No. 16, “Communications with Audit Committees” issued by the Public Company Accounting Oversight Board; |
• | Discussed with Williams Partners L.P.’s internal auditors and Ernst & Young LLP the overall scope and plans for their respective audits. The Audit Committee meets with the internal auditors and Ernst & Young LLP, with and without management present, to discuss the results of their examinations, their evaluations of Williams Partners L.P.’s internal controls and the overall quality of Williams Partners L.P.’s financial reporting; and |
• | Based on the foregoing reviews and discussions, recommended to the Board of Directors that the audited financial statements be included in the annual report on Form 10-K for the year ended December 31, 2017, for filing with the SEC. |
This report has been furnished by the members of the Audit Committee of the Board of Directors:
— Alice M. Peterson - Chair
— H. Brent Austin
— Philip L. Frederickson
The report of the Audit Committee in this report shall not be deemed incorporated by reference into any other filing by Williams Partners L.P. under the Securities Act of 1933, as amended, or the Securities Exchange Act of 1934, except to the extent that we specifically incorporate this information by reference, and shall not otherwise be deemed filed under such acts.
Item 11. Executive Compensation
Compensation Discussion and Analysis
We are managed by the executive officers of our general partner who are also executive officers of Williams. Neither we nor our general partner have a compensation committee. The executive officers of our general partner are compensated directly by Williams. All decisions as to the compensation of the executive officers of our general partner who are involved in our management are made by the Compensation and Management Development Committee of Williams (Compensation Committee). Therefore, we do not have any policies or programs relating to compensation of the executive officers of our general partner and we make no decisions relating to such compensation. None of the executive officers of our general partner have employment agreements with us or are otherwise specifically compensated for their service as an executive officer of our general partner. A full discussion of the policies and programs of the
147
Compensation Committee of Williams will be set forth in the Williams’ Proxy Statement which will be available upon its filing on the SEC’s website at www.sec.gov and on Williams’ website at www.williams.com at the “Investors - SEC Filings” tab Williams’ Proxy Statement. We reimburse our general partner for direct and indirect general and administrative expenses attributable to our management (which expenses include the share of the compensation paid to the executive officers of our general partner attributable to the time they spend managing our business). Please read “Certain Relationships and Related Transactions, and Director Independence - Reimbursement of Expenses of Our General Partner” for more information regarding this arrangement.
Executive Compensation
The following table summarizes the compensation attributable to services performed for us in 2017 for our general partner’s named executive officers (NEOs), consisting of our principal executive officer, principal financial officer, and three other most highly compensated executive officers.
Further information regarding compensation of our principal executive officer, Mr. Armstrong, who also serves as the President and Chief Executive Officer of Williams, our principal financial officer, Mr. Chandler, who also serves as the Senior Vice President and Chief Financial Officer of Williams, Mr. Dunn who serves as Executive Vice President and Chief Operating Officer, Mr. Zamarin, who serves as Senior Vice President - Corporate Strategic Development, and Mr. Scheel, who serves as Senior Vice President - Northeast G&P will be set forth in Williams’ Proxy Statement. Compensation amounts set forth in Williams’ Proxy Statement will include all compensation paid by Williams, including the amounts in the table below attributable to services performed for us. Williams’ Proxy Statement will also provide compensation information for three former executive officers, including Mr. Donald R. Chappel, who was our principal financial officer prior to his retirement and served as Senior Vice President and Chief Financial Officer of Williams, Mr. Robert S. Purgason, who previously served as Senior Vice President - Access and Mr. Rory L. Miller, who previously served as Senior Vice President - Atlantic Gulf.
148
2017 Summary Compensation Table
The following table sets forth certain information with respect to Williams’ compensation of our general partner’s NEOs attributable to us during fiscal years 2017, 2016, and 2015:
Name and Principal Position | Year | Salary | Bonus (1) | Stock Awards (2) | Option Awards (3) | Non-Equity Incentive Plan Compensation (4) | Change in Pension Value and Nonqualified Deferred Compensation Earnings (5) | All Other Compensation (6) | Total | ||||||||||||||||
Alan S. Armstrong | 2017 | $ | 1,141,925 | $ | — | $ | 5,488,545 | $ | 1,240,200 | $ | 1,841,196 | $ | 811,434 | $ | 24,075 | $ | 10,547,375 | ||||||||
President and Chief | 2016 | 1,104,619 | — | 5,198,012 | 1,134,671 | 1,863,824 | 665,884 | 23,706 | 9,990,716 | ||||||||||||||||
Executive Officer | 2015 | 1,100,925 | — | 4,024,297 | 1,152,621 | 1,128,905 | (568,869 | ) | 40,772 | 6,878,652 | |||||||||||||||
John D. Chandler | 2017 | 158,604 | — | 497,120 | — | 164,047 | 41,970 | 10,059 | 871,800 | ||||||||||||||||
SVP, Chief Financial | 2016 | — | — | — | — | — | — | — | — | ||||||||||||||||
Officer | 2015 | — | — | — | — | — | — | — | — | ||||||||||||||||
James E. Scheel | 2017 | 457,846 | — | 2,658,770 | 291,402 | 435,000 | 250,660 | 47,864 | 4,141,542 | ||||||||||||||||
SVP, Northeast G&P | 2016 | 446,000 | — | 1,342,640 | 300,003 | 450,000 | 185,458 | 18,497 | 2,742,598 | ||||||||||||||||
2015 | 429,956 | — | 1,014,378 | 283,815 | 250,000 | (126,535 | ) | 22,796 | 1,874,410 | ||||||||||||||||
Micheal G. Dunn | 2017 | 493,032 | — | 1,986,751 | 496,443 | 596,022 | 97,146 | 58,739 | 3,728,133 | ||||||||||||||||
EVP, Chief Operating | 2016 | — | — | — | — | — | — | — | — | ||||||||||||||||
Officer | 2015 | — | — | — | — | — | — | — | — | ||||||||||||||||
Chad J. Zamarin | 2017 | 260,748 | 596,310 | 2,236,175 | — | 252,438 | — | 132,641 | 3,478,312 | ||||||||||||||||
SVP, Corp. Strategic | 2016 | — | — | — | — | — | — | — | — | ||||||||||||||||
Development | 2015 | — | — | — | — | — | — | — | — | ||||||||||||||||
Donald R. Chappel | 2017 | 652,203 | — | 3,317,575 | 414,950 | 631,000 | 189,965 | 2,383,255 | 7,588,948 | ||||||||||||||||
Former SVP, Chief | 2016 | 658,150 | — | 1,764,641 | 394,301 | 687,347 | 314,266 | 20,681 | 3,839,386 | ||||||||||||||||
Financial Officer | 2015 | 658,534 | — | 1,433,184 | 400,993 | 598,224 | (253,539 | ) | 20,159 | 2,857,555 | |||||||||||||||
Rory L. Miller | 2017 | 314,473 | — | 1,700,010 | — | 283,548 | 226,986 | 1,683,111 | 4,208,128 | ||||||||||||||||
Former SVP, Atlantic | 2016 | 490,000 | — | 1,342,640 | 300,003 | 486,000 | 224,134 | 17,288 | 2,860,065 | ||||||||||||||||
- Gulf | 2015 | 487,692 | — | 1,086,877 | 304,088 | 310,000 | (201,730 | ) | 16,848 | 2,003,775 | |||||||||||||||
Robert Purgason | 2017 | 131,154 | — | — | — | — | 22,891 | 3,671,645 | 3,825,690 | ||||||||||||||||
Former SVP, Access | 2016 | 550,000 | — | 1,074,086 | 240,002 | — | 158,431 | 16,449 | 2,038,968 | ||||||||||||||||
2015 | 531,558 | — | 1,449,125 | 405,453 | 310,000 | 88,676 | 29,930 | 2,814,742 | |||||||||||||||||
___________
(1) | Bonus. A sign-on bonus was paid to Mr. Zamarin as part of a pay package intended to address the retention awards that were in place at his prior employer. |
(2) | Stock Awards. Awards were granted under the terms of Williams’ 2007 Incentive Plan and include time-based and performance-based restricted stock units (RSUs). Amounts shown are the grant date fair value of awards attributable to us computed in accordance with FASB ASC Topic 718 Compensation - Stock Compensation (FASB ASC Topic 718). The assumptions used by Williams to determine the grant date fair value of the stock awards can be found in the Williams Annual Report on Form 10‑K for the year-ended December 31, 2017. The NEOs do not have any outstanding stock awards from us. |
149
The potential maximum values attributable to us of the performance-based RSUs, subject to changes in performance outcomes of Williams, are as follows:
2017 Performance-Based RSU Maximum Potential | ||||
Alan S. Armstrong | $ | 7,997,895 | ||
John D. Chandler | — | |||
James E. Scheel | 1,537,532 | |||
Micheal G. Dunn | 2,235,131 | |||
Chad J. Zamarin | — | |||
Donald R. Chappel | 2,162,532 | |||
Rory L. Miller | — | |||
Robert Purgason | — | |||
(3) | Option Awards. Awards are granted under the terms of Williams’ 2007 Incentive Plan and include nonqualified stock options. Amounts shown are the grant date fair value of awards attributable to us computed in accordance with FASB ASC Topic 718. The assumptions used by Williams to determine the grant date fair value of the option awards can be found in the Williams Annual Report on Form 10-K for the year-ended December 31, 2017. The options may be exercised to acquire Williams’ common stock. The NEOs do not receive any option awards from us. |
(4) | Non-Equity Incentive Plan. Williams provides an annual incentive program to the NEOs and payments are based on the financial performance of Williams. The maximum annual incentive pool funding for NEOs is 200 percent of target and the amounts shown are costs attributable to us. We do not sponsor any non-equity incentive plans. |
(5) | Change in Pension Value and Nonqualified Deferred Compensation Earnings. The amount shown is the aggregate change attributable to us from December 31, 2016 to December 31, 2017 in the actuarial present value of the accrued benefit under the qualified pension and non-qualified plan. A portion of the increase in the change in present value is due to a lower discount rate used to measure these benefits at the end of 2017. The underlying design of these programs did not change from 2016 to 2017. Please refer to the “Pension Benefits” table in Williams’ Proxy Statement for further details of the present value of the accrued benefit. |
(6) | All Other Compensation. Amounts shown represent payments made on behalf of the NEOs and include life insurance premiums, a 401(k) matching contribution, tax gross-ups on the imputed income related to spousal travel for business purposes, payment of legal fees in connection with a benefit plan, relocation benefits, separation or severance payments, and perquisites (if applicable). Perquisites may include financial planning services, mandated annual physical exams and personal use of the Company aircraft. If the NEO used the Company aircraft, the incremental cost method is used to calculate the value of the personal use of the Company aircraft. The incremental cost calculation includes such items as fuel, maintenance, weather and airport services, pilot meals, pilot overnight expenses, aircraft telephone, and catering. Amounts do not include arrangements that are generally available to our employees and do not discriminate in scope, terms or operations in favor of our NEOs, such as medical, dental, and disability programs. |
• | Mr. Armstrong received 401(k) matching contributions in the amount of $14,554; imputed income on use of the Company aircraft; tax gross-up of $1,587 related to spousal travel for business purposes; and life insurance premiums. |
• | Mr. Chandler received 401(k) matching contributions; imputed income on use of the Company aircraft; tax gross-up of $53 related to spousal travel for business purposes; and life insurance premiums. |
• | Mr. Scheel received 401(k) matching contributions in the amount of $16,200; reimbursement of financial planning services; $27,400 in legal fees in connection with the interpretation of a benefit plan; and life insurance premiums. |
150
• | Mr. Dunn received 401(k) matching contributions in the amount of $15,277; relocation benefits totaling $37,540; reimbursement related to a mandated annual physical exam; and life insurance premiums. |
• | Mr. Zamarin received relocation benefits in the amount of $131,671 to move his principle residence to Tulsa; imputed income on use of the Company aircraft; tax gross-up of $133 related to spousal travel for business purposes; and life insurance premiums. |
• | Mr. Chappel received 401(k) matching contributions in the amount of $16,200; reimbursement related to a mandated annual physical exam; $2,362,500 in separation benefits consistent with benefits available under the Executive Severance Pay Plan; and life insurance premiums. |
• | Mr. Miller received 401(k) matching contributions in the amount of $16,200; $1,666,000 in separation benefits consistent with benefits available under the Executive Severance Pay Plan; and life insurance premiums. |
• | Mr. Purgason received 401(k) matching contributions; $110,516 in legal fees in connection with the interpretation of a benefit plan; $3,553,000 in separation benefits provided in a document titled “Separation Agreement and General Release” and filed as Exhibit 10.1 to an 8-K filed on March 25, 2017; and life insurance premiums. |
Notable Items
The Compensation Committee considers the compensation of CEOs from similarly-sized comparator companies when setting Mr. Armstrong’s pay. It is the competitive norm for CEOs to be paid more than other NEOs. In addition, the Compensation Committee believes the difference in pay between the CEO and other NEOs is consistent with our compensation philosophy (summarized in Williams’ Compensation Discussion and Analysis), which considers the external market and internal value of each job to the Company along with the incumbent’s experience and performance of the job in setting pay. The CEO’s job is different from the other NEOs because the CEO has ultimate responsibility for performance results and is accountable to the Board and stockholders. Consequently, the Compensation Committee believes it is appropriate for the CEO’s pay to be higher.
The CEO Pay Ratio was calculated in compliance with the requirements set forth in Item 402(u) of Regulation S-K. The median employee was identified using Williams’ employee population on October 2, 2017. Williams used a consistently applied compensation measure across our employee population to determine the median employee. For the consistently applied compensation measure, Williams used targeted total cash compensation which includes an employee’s base salary plus their annual incentive bonus opportunity at target. Due to the consistent use of base salaries and the annual incentive program across the population, targeted total cash compensation provides an accurate depiction of total earnings for the purpose of identifying the median employee. Williams then calculated the median employee’s compensation in the same manner as the named executive officers in the Williams Summary Compensation Table.
The median employee’s compensation was $124,648. The CEO’s disclosed compensation amount was $10,620,236. Accordingly, the CEO Pay Ratio is 85:1.
We have not included tables with information about grants of plan-based awards as there were not any WPZ equity awards to NEOs in 2017.
151
Options Exercised and Stock Vested Table
The following table sets forth certain information with respect to options exercised by the NEO and stock that vested during fiscal year 2017.
Option Awards | Stock Awards | ||||||||||||||||
Name | Number of Units Acquired on Exercise | Value Realized on Exercise | Number of Units Acquired on Vesting | Value Realized on Vesting | |||||||||||||
Alan S. Armstrong | — | $ | — | — | $ | — | |||||||||||
John D. Chandler | — | — | — | — | |||||||||||||
Micheal G. Dunn | — | — | — | — | |||||||||||||
Chad J. Zamarin | — | — | — | — | |||||||||||||
James E. Scheel | — | — | — | — | |||||||||||||
Donald R. Chappel | — | — | — | — | |||||||||||||
Rory L. Miller | — | — | — | — | |||||||||||||
Robert S. Purgason (1) | — | — | 62,306 | 2,581,338 | |||||||||||||
__________
(1) Robert Purgason’s 2017 stock award value realized came from the vesting of his outstanding July 2014 WPZ award.
Additionally, pension benefits, and nonqualified deferred compensation tables are not included because we do not currently sponsor such plans. In addition, our NEOs are not entitled to any compensation as a result of a WPZ change-in-control or the termination of their service as an NEO of our general partner. Information related to Williams’ sponsorship of any such plans is set forth in Williams’ Form 10‑K.
Compensation Committee Interlocks and Insider Participation
As previously discussed, our general partner’s Board of Directors is not required to maintain, and does not maintain, a compensation committee. During 2017, all compensation decisions with respect to our NEOs were made by the Compensation Committee of the Board of Directors of Williams, which is comprised entirely of independent members of Williams’ Board. In addition, none of these individuals receive any compensation directly from us or our general partner. Please read “Certain Relationships and Related Transactions, and Director Independence” below for information about relationships among us, our general partner and Williams.
Compensation Policies and Practices as They Relate to Risk Management
We do not have any employees. We are managed and operated by the directors and officers of our general partner and employees of Williams perform services on our behalf. We do not have any compensation policies or practices that need to be assessed or evaluated for the effect on our operations. Please read “Compensation Discussion and Analysis,” “Employees,” and “Certain Relationships and Related Transactions, and Director Independence” for more information about this arrangement. For an analysis of any risks arising from Williams’ compensation policies and practices, please read Williams’ Form 10-K.
Board Report on Compensation
Neither we nor our general partner has a compensation committee. The Board of Directors of our general partner has reviewed and discussed with management the Compensation Discussion and Analysis set forth above and based on this review and discussion has approved it for inclusion in this Form 10-K.
The Board of Directors of WPZ GP LLC:
Alan S. Armstrong,
H. Brent Austin,
John D. Chandler,
Micheal G. Dunn,
Philip L. Frederickson,
Alice M. Peterson,
Chad J. Zamarin
152
The Board Report on Compensation in this report shall not be deemed incorporated by reference into any other filing by Williams Partners L.P. under the Securities Act of 1933, as amended, or the Securities Exchange Act of 1934, except to the extent that we specifically incorporate this information by reference, and shall not otherwise be deemed filed under such acts.
Compensation of Directors
We are managed by the Board of Directors of our general partner. Members of the Board of Directors who are also officers or employees of Williams or an affiliate of us or Williams do not receive additional compensation for serving on the Board of Directors. Please read “Compensation Discussion and Analysis,” “Executive Compensation,” and “Certain Relationships and Related Transactions, and Director Independence - Reimbursement of Expenses of Our General Partner” for information about how we reimburse our general partner for direct and indirect general and administrative expenses attributable to our management. Non-employee directors receive a bi-annual compensation package consisting of the following, which amounts are paid on January 1 and July 1: (a) $75,000 cash retainer; and (b) $5,000 cash retainer each for service on the Conflicts Committee or Audit Committee of the Board of Directors. If a non-employee director’s service on the Board of Directors commenced after January 1 and prior to the final day of June, or after July 1 and prior to December 31, the non-employee director receives a prorated bi-annual compensation at the time of the next scheduled bi-annual payment. Also, each non-employee director serving as a member of the Conflicts Committee receives $1,250 cash for each Conflicts Committee meeting attended by such director. Fees for attendance at meetings of the Conflicts Committee are paid on January 1 and July 1 for meetings held during the preceding months. Mr. Austin, Mr. Frederickson and Ms. Peterson received cash payments of $13,750, for attending 11 meetings of the Conflicts Committee of WPZ during 2017.
Each non-employee director is also reimbursed for out-of-pocket expenses in connection with attending meetings of the Board of Directors or its committees. Each director will be fully indemnified by us for actions associated with being a director to the extent permitted under Delaware law. We also reimburse non-employee directors for the costs of education programs relevant to their duties as Board members. For their service, nonmanagement directors earned the following compensation in 2017:
Director Compensation Fiscal Year 2017
Name | Fees Earned or Paid in Cash (1) | Unit Awards | Option Awards | Nonequity Incentive Plan Compensation | Change in Pension Value and Nonqualified Deferred Compensation Earnings | All Other Compensation | Total | |||||||||||||||||||||
H. Brent Austin | $ | 173,750 | $ | — | $ | — | $ | — | $ | — | $ | — | $ | 173,750 | ||||||||||||||
Phil Frederickson | 163,750 | — | — | — | — | — | 163,750 | |||||||||||||||||||||
Alice M. Peterson | 173,750 | — | — | — | — | — | 173,750 | |||||||||||||||||||||
__________
(1) | Bi-annual compensation retainer fees and Conflicts Committee meeting fees paid in 2017 are reflected in this column. |
Item 12. Security Ownership of Certain Beneficial Owners and Management and Related Stockholder Matters
The following tables set forth the beneficial ownership by holders of (i) our common units and other classes of equity and (ii) shares of Williams that, unless otherwise noted, as of February 19, 2018, are held by:
• | Each member of our general partner’s Board of Directors; |
• | Each named executive officer of our general partner; |
• | All directors and executive officers of our general partner as a group; |
153
• | Each person or group of persons known by us to be a beneficial owner of 5 percent or more of the then outstanding common units and Class B units. |
The amounts and percentage of units or shares beneficially owned are reported on the basis of regulations of the SEC governing the determination of beneficial ownership of securities. Under the rules of the SEC, a person is deemed to be a “beneficial owner” of a security if that person has or shares “voting power,” which includes the power to vote or to direct the voting of such security, or “investment power,” which includes the power to dispose of or to direct the disposition of such security. A person is also deemed to be a beneficial owner of any securities of which that person has a right to acquire beneficial ownership within 60 days. Under these rules, more than one person may be deemed a beneficial owner of the same securities and a person may be deemed a beneficial owner of securities as to which he or she has no economic interest. Except as indicated by footnote, the persons named in the tables below have sole voting and investment power with respect to all units or shares shown as beneficially owned by them, subject to community property laws where applicable.
Williams Partners Beneficial Ownership | ||||||||||
Name of Beneficial Owner | Common Units | Percentage of Common Units (1) | Class B Units | Percentage of Class B Units | ||||||
The Williams Companies, Inc.(2) | 702,218,502 | 73.34% | 18,124,096 | 100.00% | ||||||
Alan S. Armstrong (3) | 37,334 | * | — | — | ||||||
H. Brent Austin | 9,958 | * | — | — | ||||||
Walter J. Bennett | 20,009 | * | — | — | ||||||
John D. Chandler | — | * | — | — | ||||||
Micheal G. Dunn | 500 | * | — | — | ||||||
Frank J. Ferazzi | — | * | — | — | ||||||
Philip L. Frederickson | 23,577 | * | — | — | ||||||
Alice M. Peterson | 3,921 | * | — | — | ||||||
John E. Poarch | 11,438 | * | — | — | ||||||
James E. Scheel | — | * | — | — | ||||||
Ted T. Timmermans | 588 | * | — | — | ||||||
T. Lane Wilson | — | * | — | — | ||||||
Chad J. Zamarin | — | * | — | — | ||||||
All executive officers and directors of general partner as a group (13 persons) | 107,325 | * | — | — | ||||||
____________
* Less than 1 percent.
(1) | The percentage of beneficial ownership is based on 957,529,465 common units outstanding as of February 19, 2018. |
(2) | This row includes ownership information of Williams Gas Pipeline Company, LLC, which is controlled by Williams and directly held 702,218,502 Common Units and 18,124,096 Class B Units as of February 19, 2018. |
(3) | Includes 8,667 common units indirectly held by the Shelly Stone Armstrong Trust, dated June 16, 2010 and 28,667 common units indirectly held by the Alan Stuart Armstrong Trust, dated June 16, 2010. |
154
Williams Beneficial Ownership | ||||||||||||||
Name of Beneficial Owner | Shares of Common Stock Owned Directly or Indirectly | Shares Underlying Stock Options (1) | Shares Underlying Restricted Stock Units (2) | Total | Percent of Class (3) | |||||||||
Alan S. Armstrong (4) | 385,791 | 1,032,646 | 29,247 | 1,447,684 | * | |||||||||
H. Brent Austin | — | — | — | — | * | |||||||||
Walter J. Bennett | — | 71,978 | 8,545 | 80,523 | * | |||||||||
John D. Chandler | 112 | — | — | 112 | * | |||||||||
Micheal G. Dunn | 2,000 | 26,912 | — | 28,912 | * | |||||||||
Frank J. Ferazzi (5) | 4,356 | 36,581 | 3,014 | 43,951 | * | |||||||||
Philip L. Frederickson | — | — | — | — | * | |||||||||
Alice M. Peterson | — | — | — | — | * | |||||||||
John E. Poarch | 350 | 10,368 | 1,781 | 12,499 | * | |||||||||
James E. Scheel | — | 211,091 | 9,969 | 221,060 | * | |||||||||
Ted T. Timmermans | 10,371 | 104,170 | 3,607 | 118,148 | * | |||||||||
T. Lane Wilson | — | — | — | — | * | |||||||||
Chad J. Zamarin | — | — | — | — | * | |||||||||
All current directors and executive officers as a group (13 persons) | 402,980 | 1,493,746 | 56,163 | 1,952,889 | * | |||||||||
_____________
* | Less than 1 percent. |
(1) | Amounts reflect Williams shares that may be acquired upon the exercise of stock options granted under Williams’ current or previous equity plans that are currently exercisable, will become exercisable, or would be exercisable upon the voluntary retirement of such person, within 60 days of February 19, 2018. |
(2) | Amounts reflect Williams shares that would be acquired upon the vesting of restricted stock units granted under Williams’ current or previous equity plans that will vest or that would vest upon the voluntary retirement of such person, within 60 days of February 19, 2018. Restricted stock units have no voting or investment power. |
(3) | Ownership percentage is reported based on 827,327,336 shares of Williams common stock outstanding on February 19, 2018, plus, as to the holder thereof only and no other person, the number of shares (if any) that the person has the right to acquire as of February 19, 2018 or within 60 days from that date, through the exercise of all options and other rights. |
(4) | Shares of Common Stock amount reflect 40,264 shares in the Alan and Shelly Armstrong Foundation dated December 16, 2015, Alan Armstrong and Shelly Armstrong, Trustees. |
(5) | Shares of Common Stock amount reflect 3,088 shares in employee 401(k) plan. |
Securities Authorized for Issuance Under Equity Compensation Plans
The following table sets forth information with respect to the securities that may be issued under our long-term incentive plans as of December 31, 2017.
155
Plan Category | Number of Securities to be Issued upon Exercise of Outstanding Options, Warrants and Rights | Weighted-Average Exercise Price of Outstanding Options, Warrants and Rights | Number of Securities Remaining Available for Future Issuance Under Equity Compensation Plans (Excluding Securities Reflected in Column) | |||||
Equity compensation plans approved by security holders | — | — | — | |||||
Equity compensation plans not approved by security holders (1) (2) | 76,206 | N/A | 1,773,249 | |||||
_____________
(1) | Amounts presented reflect the Williams Partners L.P. Long-Term Incentive Plan, as adopted by the Board of Directors of our general partner in 2010. |
(2) | The table does not include securities available for future issuance under Pre-merger WPZ’s long-term incentive plan, which was adopted by the Board of Directors of its general partner in 2005. We assumed this plan as a result of the ACMP Merger. As of December 31, 2017, 686,597 of these securities were available for issuance under this plan. The number of awards that may be issued under this plan in the future is subject to conversion to our securities by our general partner to reflect the effect of the ACMP Merger. No awards were outstanding under this plan as of December 31, 2017. |
Item 13. Certain Relationships and Related Transactions, and Director Independence
Transactions with Related Persons
In January 2017, we announced an agreement with Williams, wherein Williams permanently waived the general partner’s incentive distribution rights and converted its 2 percent general partner interest in us to a non-economic interest in exchange for 289 million newly issued common units. Pursuant to this agreement, Williams also purchased approximately 277 thousand common units for $10 million. Additionally, Williams purchased approximately 59 million common units at a price of $36.08586 per unit in a private placement transaction. Immediately following such transactions, Williams contributed the common units to Williams Gas Pipeline Company, LLC, its wholly-owned subsidiary and our affiliate. Following these transactions, Williams owns a 74 percent limited partner interest in us. Williams also owns 100 percent of our general partner, which allows it to control us.
In addition to the related transactions and relationships discussed below, information about such transactions and relationships is included in Note 5 – Related Party Transactions of our Notes to Consolidated Financial Statements and is incorporated into this Item 13 by reference.
Distributions and Payments to Our General Partner and Its Affiliates
The following table summarizes the distributions and payments made or to be made by us to our general partner and its affiliate in connection with our ongoing operation and upon our liquidation, if any. These distributions and payments were determined by and among affiliated entities.
156
Operational Stage | ||
Distributions of available cash to our general partner and its affiliate | As a result of the 2017 transactions discussed above, our general partner no longer receives cash distributions in respect of its general partner interest or incentive distributions. We only make cash distributions to our unit holders pro rata including Williams as the holder of an aggregate 73 percent of our common units. However, with respect to the approximately 59 million common units issued to Williams in the 2017 private placement, Williams was not entitled to receive distributions on such common units for the quarter ended December 31, 2016 and the prorated portion of the first quarter of 2017 up to closing of the private placement. For further information about distributions, please read “Market for Registrant’s Common Equity, Related Stockholder Matters and Issuer Purchases of Equity Securities-” and “Management’s Discussion and Analysis of Financial Condition and Results of Operations—Management’s Discussion and Analysis of Financial Condition and Liquidity.” | |
Payments to our general partner and its affiliates | Please read “—Reimbursement of Expenses of Our General Partner” below. | |
Withdrawal or removal of our general partner | If our general partner withdraws or is removed, its general partner interest will either be sold to the new general partner for cash or converted into common units, for an amount equal to fair market value. | |
Liquidation Stage | ||
Liquidation | Upon our liquidation, the limited partners will be entitled to receive liquidating distributions according to their particular capital account balances. | |
Reimbursement of Expenses of Our General Partner
Our general partner does not receive any management fee or other compensation for its management of our business. We reimburse our general partner for expenses incurred on our behalf, including expenses incurred in compensating employees of an affiliate of Williams who perform services on our behalf. These expenses include all allocable expenses necessary or appropriate to the conduct of our business. Our partnership agreement provides that our general partner will determine in good faith the expenses that are allocable to us. There is no minimum or maximum amount that may be paid or reimbursed to our general partner for expenses incurred on our behalf. These expenses will include our allocable share of salaries, non-equity incentive plan compensation, and other employment-related expenses, including Williams restricted stock unit and stock option awards, retirement plans, health and welfare plans, employer-related payroll taxes, matching contributions made under a Williams defined contribution plan and premiums for life insurance.
Our general partner allocates expenses to us for the services performed on our behalf by our executive officers, who are also employees of Williams, and those of our directors, who are also employees of Williams. This allocated expense of $64 million, included our allocable share of salaries, non-equity incentive plan compensation, and other employment-related expenses, including Williams restricted stock unit and stock option awards, retirement plans, health and welfare plans, employer-related payroll taxes, matching contributions made under a Williams defined contribution plan and premiums for life insurance.
Williams affiliates charge us for the costs associated with the employees that operate our assets. In addition, general and administrative services are provided to us by employees of Williams, and we are charged for certain administrative expenses incurred by Williams. These charges are either directly identifiable or allocated to our operations. Direct charges are for goods and services provided by Williams at our request. Allocated charges are based on a three-factor formula, which considers revenues; property, plant and equipment; and payroll. In management’s estimation, the allocation methodologies used are reasonable and result in a reasonable allocation to us of the costs of doing business incurred by Williams. These services are provided to Transco and Northwest Pipeline pursuant to separate administrative service agreements with an affiliate of Williams.
Summary of Other Transactions Involving Williams and its Affiliates
157
Financial Repositioning
See Note 1 – General, Description of Business, Basis of Presentation, and Summary of Significant Accounting Policies of Notes to Consolidated Financial Statements for additional transactions associated with the Financial Repositioning.
Operating Agreements with Equity Method Investees
We are party to operating agreements with unconsolidated companies where our investment is accounted for using the equity method. These operating agreements typically provide for reimbursement or payment to us for certain direct operational payroll and employee benefit costs, materials, supplies and other charges and also for management services. Williams supplied a portion of these services, primarily those related to employees since we do not have any employees, to the equity-method investees. Amounts are billed to the equity-method investments the partnership operates.
Quarterly Cash Distributions
For the year ended December 31, 2017, we distributed approximately $1.9 billion to an affiliate of Williams as quarterly distributions on our common units.
2005 Omnibus Agreement
This omnibus agreement continues to govern our relationship with Williams regarding the following matters:
• | Indemnification for certain environmental liabilities and tax liabilities; |
• | Reimbursement for certain expenditures; |
• | A license for the use of certain software and intellectual property. |
Total amounts received under this agreement for the year ended December 31, 2017, were less than $1 million.
2010 Omnibus and Contribution Agreements
Pursuant to the omnibus agreement, Williams remains obligated to indemnify us for an amount based on the amortization over time of deferred revenue amounts that relate to cash payments received prior to the closing of a contribution transaction for services to be rendered by us in the future at the Devils Tower floating production platform located in Mississippi Canyon Block 773. Amounts received under this agreement for the year ended December 31, 2017, were $10 million. The contribution agreement continues to govern our relationship with Williams with respect to indemnification for certain tax liabilities.
Intellectual Property License
Williams and its affiliates granted a license to us for the use of certain marks, including our logo, for as long as Williams controls our general partner, at no charge.
Review, Approval or Ratification of Transactions with Related Persons
Our partnership agreement contains specific provisions that address potential conflicts of interest between our general partner and its affiliates, including Williams, on one hand, and us and our subsidiaries, on the other hand. Whenever such a conflict of interest arises, our general partner will resolve the conflict. Our general partner may, but is not required to, seek the approval of such resolution from the Conflicts Committee of the Board of Directors of our general partner, which is comprised of independent directors. The partnership agreement provides that our general partner will not be in breach of its obligations under the partnership agreement or its duties to us or to our unitholders if the resolution of the conflict is:
• | Approved by the Conflicts Committee; |
158
• | Approved by the vote of a majority of the outstanding common units, excluding any common units owned by our general partner or any of its affiliates; |
• | On terms no less favorable to us than those generally being provided to or available from unrelated third parties; or |
• | Fair and reasonable to us, taking into account the totality of the relationships between the parties involved, including other transactions that may be particularly favorable or advantageous to us. |
If our general partner does not seek approval from the Conflicts Committee and the Board of Directors of our general partner determines that the resolution or course of action taken with respect to the conflict of interest satisfies either of the standards set forth in the third and fourth bullet points above, then it will be presumed that, in making its decision, the Board of Directors acted in good faith, and in any proceeding brought by or on behalf of any limited partner or the partnership, the person bringing or prosecuting such proceeding will have the burden of overcoming such presumption. Unless the resolution of a conflict is specifically provided for in our partnership agreement, our general partner or the Conflicts Committee may consider any factors it determines in good faith to consider when resolving a conflict. When our partnership agreement requires someone to act in good faith, it requires that person to reasonably believe that he is acting in the best interests of the partnership, unless the context otherwise requires. See “Directors, Executive Officers and Corporate Governance — Governance — Board Committees — Conflicts Committee.”
In addition, our Code of Business Conduct and Ethics requires that all employees, including employees of affiliates of Williams who perform services for us and our general partner, avoid or disclose any activity that may interfere, or have the appearance of interfering, with their responsibilities to us and our unitholders. Conflicts of interest that cannot be avoided must be disclosed to a supervisor who is then responsible for establishing and monitoring procedures to ensure that we are not disadvantaged.
Director Independence
Please read “Directors, Executive Officers and Corporate Governance — Governance — Director Independence” and “ — Board Committees” in Item 10 above for information about the independence of our general partner’s Board of Directors and its committees, which information is incorporated into this Item 13 by reference.
Item 14. Principal Accountant Fees and Services
We have engaged Ernst & Young LLP as our independent registered public accounting firm. The following table summarizes the fees we have paid to the firm to audit the Partnership’s annual consolidated financial statements and for other services for each of the last two fiscal years:
2017 | 2016 | ||||||
(Millions) | |||||||
Audit Fees | $ | 5.7 | $ | 5.7 | |||
Audit-Related Fees | 0.9 | 0.4 | |||||
Tax Fees | — | 0.1 | |||||
All Other Fees | — | — | |||||
$ | 6.6 | $ | 6.2 | ||||
Fees for audit services in 2017 and 2016 include fees associated with the annual audit, the reviews of our quarterly reports on Form 10-Q, the audit of our assessment of internal controls as required by Section 404 of the Sarbanes-Oxley Act of 2002 and services provided in connection with other filings with the SEC. The fees for audit services do not include audit costs for stand-alone audits for equity investees. Audit-Related fees include services under certain agreed-upon procedures for other compliance purposes. Ernst & Young LLP does not provide tax services to our general partner’s executive officers.
The Audit Committee of our general partner’s Board of Directors is responsible for appointing, setting compensation for and overseeing the work of Ernst & Young LLP, our independent auditor. The Audit Committee has established a
159
policy regarding pre-approval of all audit and non-audit services provided by Ernst & Young LLP. On an ongoing basis, our general partner’s management presents specific projects and categories of service to the Audit Committee to request advance approval. The Audit Committee reviews those requests and advises management if the Audit Committee approves the engagement of Ernst & Young LLP. On a quarterly basis, the management of our general partner reports to the Audit Committee regarding the services rendered by, including the fees of, the independent accountant in the previous quarter and on a cumulative basis for the fiscal year. The Audit Committee may also delegate the ability to pre-approve audit and permitted non-audit services, excluding services related to our internal control over financial reporting, to any two committee members, provided that any such pre-approvals are reported at a subsequent Audit Committee meeting. In 2017 and 2016, 100 percent of Ernst & Young LLP’s fees were pre-approved by the Audit Committee.
160
PART IV
Item 15. Exhibits and Financial Statement Schedules
(a) 1 and 2. Williams Partners L.P. financials
Page | |
Covered by reports of independent auditors: | |
Not covered by reports of independent auditors: | |
All other schedules have been omitted since the required information is not present or is not present in amounts sufficient to require submission of the schedule, or because the information required is included in the financial statements and notes thereto.
(a) | 3 and (b). The following documents are included as exhibits to this report: |
INDEX TO EXHIBITS
Exhibit Number | Description | |||
2.1§ | — | |||
2.2§ | — | |||
2.3§ | — | |||
2.4§ | __ | |||
3.1 | — | |||
3.2 | — | |||
Exhibit Number | Description | |||
3.3 | — | |||
3.4 | — | |||
3.5 | — | |||
3.6 | — | |||
3.7 | — | |||
3.8 | — | |||
3.9 | — | |||
3.10 | — | |||
4.1 | — | |||
4.2 | — | |||
4.3 | — | |||
4.4 | — | |||
4.5 | — | |||
4.6 | — | |||
Exhibit Number | Description | |||
4.7 | — | |||
4.8 | — | |||
4.9 | — | |||
4.10 | — | |||
4.11 | __ | |||
4.12 | __ | |||
4.13 | — | |||
4.14 | — | |||
4.15 | — | |||
4.16 | — | |||
4.17 | __ | |||
4.18 | — | |||
4.19 | — | |||
Exhibit Number | Description | |||
4.20 | — | |||
4.21 | — | |||
4.22 | — | |||
10.1# | — | |||
10.2# | — | |||
10.3# | — | |||
10.4# | — | |||
10.5# | — | |||
10.6# | — | |||
10.7 | — | |||
10.8† | — | |||
10.9# | — | |||
10.10# | — | |||
10.11 | — | |||
Exhibit Number | Description | |||
10.12 | — | |||
10.13 | — | |||
10.14 | __ | |||
10.15 | — | |||
10.16 | — | |||
10.17 | — | |||
10.18 | — | |||
10.19 | — | |||
10.20 | — | |||
10.21 | — | |||
Exhibit Number | Description | |||
10.22 | __ | |||
12* | — | |||
21* | — | |||
23.1* | — | |||
23.2* | ||||
23.3* | — | |||
31.1* | — | |||
31.2* | — | |||
32** | — | |||
101.INS* | — | XBRL Instance Document. | ||
101.SCH* | — | XBRL Taxonomy Extension Schema. | ||
101.CAL* | — | XBRL Taxonomy Extension Calculation Linkbase. | ||
101.DEF* | — | XBRL Taxonomy Extension Definition Linkbase. | ||
101.LAB* | — | XBRL Taxonomy Extension Label Linkbase. | ||
101.PRE* | — | XBRL Taxonomy Extension Presentation Linkbase. | ||
____________________ | |
* | Filed herewith. |
** | Furnished herewith. |
§ | Pursuant to item 601(b) (2) of Regulation S-K, the registrant agrees to furnish supplementally a copy of any omitted exhibit or schedule to the SEC upon request. |
# | Management contract or compensatory plan or arrangement. |
† | Portions of this exhibit have been omitted pursuant to a request for confidential treatment. Such portions have been filed separately with the Securities and Exchange Commission. |
Item 16. Form 10-K Summary
Not applicable.
SIGNATURES
Pursuant to the requirements of Section 13 or 15(d) of the Securities Exchange Act of 1934, the registrant has duly caused this report to be signed on its behalf by the undersigned, thereunto duly authorized.
WILLIAMS PARTNERS L.P. (Registrant) | ||
By: WPZ GP LLC, its general partner | ||
/s/ TED T. TIMMERMANS | ||
Ted T. Timmermans | ||
Vice President, Controller, and Chief Accounting Officer (Duly Authorized Officer and Principal Accounting Officer) | ||
Date: February 22, 2018
Pursuant to the requirements of the Securities Exchange Act of 1934, this report has been signed below by the following persons on behalf of the registrant and in the capacities and on the dates indicated.
Signature | Title | Date | ||
/s/ ALAN S. ARMSTRONG | Chief Executive Officer and | February 22, 2018 | ||
Alan S. Armstrong | Chairman of the Board (Principal Executive Officer) | |||
/s/ JOHN D. CHANDLER | Chief Financial Officer and Director | February 22, 2018 | ||
John D. Chandler | (Principal Financial Officer) | |||
/s/ TED T. TIMMERMANS | Vice President, Controller, and Chief | February 22, 2018 | ||
Ted T. Timmermans | Accounting Officer (Principal Accounting Officer) | |||
/s/ H. BRENT AUSTIN | Director | February 22, 2018 | ||
H. Brent Austin | ||||
/s/ MICHEAL G. DUNN | Director | February 22, 2018 | ||
Micheal G. Dunn | ||||
/s/ PHILIP L. FREDERICKSON | Director | February 22, 2018 | ||
Philip L. Frederickson | ||||
/s/ ALICE M. PETERSON | Director | February 22, 2018 | ||
Alice M. Peterson | ||||
/s/ CHAD J. ZAMARIN | Director | February 22, 2018 | ||
Chad J. Zamarin | ||||