Attached files
| file | filename |
|---|---|
| EX-31.1 - EXHIBIT 31.1 - WILLIAM LYON HOMES | wlh-ex311x12312017.htm |
| EX-32.2 - EXHIBIT 32.2 - WILLIAM LYON HOMES | wlh-ex322x12312017.htm |
| EX-32.1 - EXHIBIT 32.1 - WILLIAM LYON HOMES | wlh-ex321x12312017.htm |
| EX-31.2 - EXHIBIT 31.2 - WILLIAM LYON HOMES | wlh-ex312x12312017.htm |
| EX-23.1 - EXHIBIT 23.1 - WILLIAM LYON HOMES | wlh-ex231x123117.htm |
| EX-21.1 - EXHIBIT 21.1 - WILLIAM LYON HOMES | wlh-ex211x12312017.htm |
| EX-12.1 - EXHIBIT 12.1 - WILLIAM LYON HOMES | wlh-ex121x12312017.htm |
| EX-10.49 - EXHIBIT 10.49 - WILLIAM LYON HOMES | wlh-ex1049x12312017.htm |
SECURITIES AND EXCHANGE COMMISSION
Washington, D.C. 20549
FORM 10-K
(Mark One)
ý | ANNUAL REPORT PURSUANT TO SECTION 13 OR 15(d) OF THE SECURITIES EXCHANGE ACT OF 1934 |
For the fiscal year ended December 31, 2017
OR
¨ | TRANSITION REPORT PURSUANT TO SECTION 13 OR 15(d) OF THE SECURITIES EXCHANGE ACT OF 1934 |
For the transition period from to
Commission File Number 001-31625
WILLIAM LYON HOMES
(Exact name of registrant as specified in its charter)
Delaware | 33-0864902 | |
(State or other jurisdiction of incorporation or organization) | (I.R.S. Employer Identification Number) | |
4695 MacArthur Court, 8th Floor Newport Beach, California | 92660 | |
(Address of principal executive offices) | (Zip Code) | |
Registrant’s telephone number, including area code: (949) 833-3600
Securities registered pursuant to Section 12(b) of the Act:
Title of each class of stock | Name of each exchange on which registered | |
Class A Common Stock, $0.01 par value | New York Stock Exchange | |
Securities registered pursuant to Section 12(g) of the Act:
None
Indicate by check mark if the registrant is a well-known seasoned issuer, as defined in Rule 405 of the Securities Act. Yes ¨ No ý
Indicate by check mark if the registrant is not required to file reports pursuant to Section 13 or Section 15(d) of the Exchange Act. Yes ¨ No ý
Indicate by check mark whether registrant (1) has filed all reports required to be filed by Section 13 or 15(d) of the Securities Exchange Act of 1934 during the preceding 12 months (or for such shorter period that the registrant was required to file such reports), and (2) has been subject to such filing requirements for the past 90 days. YES ý NO ¨.
Indicate by check mark whether the registrant has submitted electronically and posted on its corporate Web site, if any, every Interactive Data File required to be submitted and posted pursuant to Rule 405 of Regulation S-T (§232.405 of this chapter) during the preceding 12 months (or for such shorter period that the registrant was required to submit and post such files). Yes ý No ¨
Indicate by check mark if disclosure of delinquent filers pursuant to Item 405 of Regulation S-K is not contained herein, and will not be contained, to the best of registrant’s knowledge, in definitive proxy or information statements incorporated by reference in Part III of this Form 10-K or any amendments to this
Form 10-K. ý
Indicate by check mark whether the registrant is a large accelerated filer, an accelerated filer, a non-accelerated filer or a smaller reporting company. See definition of “large accelerated filer,” “accelerated filer,” and “smaller reporting company” in Rule 12b-2 of the Exchange Act.
Large Accelerated Filer | ¨ | Accelerated filer | x | |||
Non-accelerated filer | ¨ | Smaller reporting company | ¨ | |||
Emerging Growth Company | ¨ | |||||
Indicate by check mark whether the registrant is a shell company (as defined in Rule 12b-2 of the Exchange Act). Yes ¨ No ý
As of June 30, 2017, the aggregate market value of the registrant’s common stock held by non-affiliates of the registrant was approximately $593.0 million based on the closing sale price as reported on the New York Stock Exchange on such date. The determination of affiliate status for purposes of this calculation is not necessarily a conclusive determination for other purposes.
Indicate the number of shares outstanding of each of the issuer’s classes of common stock, as of the latest practicable date.
Class of Common Stock | Outstanding at February 14, 2018 | ||||
Common stock, Class A, par value $0.01 | 34,267,510 | ||||
Common stock, Class B, par value $0.01 | 4,817,394 | ||||
DOCUMENTS INCORPORATED BY REFERENCE
Portions from the registrant's Definitive Proxy Statement to be filed with the Securities and Exchange Commission in connection with the registrant's 2018 Annual Meeting of Stockholders are incorporated by reference into Part III, Items 10, 11, 12, 13 and 14 hereof.
WILLIAM LYON HOMES
INDEX
Page No. | ||
PART I | ||
Item 1. | Business | |
Item 1A. | Risk Factors | |
Item 1B. | Unresolved Staff Comments | |
Item 2. | Properties | |
Item 3. | Legal Proceedings | |
Item 4. | Mine Safety Disclosure | |
PART II | ||
Item 5. | Market for Registrant’s Common Equity, Related Stockholder Matters and Issuer Purchases of Equity Securities | |
Item 6. | Selected Historical Consolidated Financial Data | |
Item 7. | Management’s Discussion and Analysis of Financial Condition and Results of Operations | |
Item 7A. | Quantitative and Qualitative Disclosures About Market Risk | |
Item 8. | Financial Statements and Supplementary Data | |
Item 9. | Changes in and Disagreements with Accountants on Accounting and Financial Disclosure | |
Item 9A. | Controls and Procedures | |
Item 9B. | Other Information | |
PART III | ||
Item 10. | Directors, Executive Officers and Corporate Governance | |
Item 11. | Executive Compensation | |
Item 12. | Security Ownership of Certain Beneficial Owners and Management and Related Stockholder Matters | |
Item 13. | Certain Relationships and Related Transactions, and Director Independence | |
Item 14. | Principal Accountant Fees and Services | |
PART IV | ||
Item 15. | Exhibits and Financial Statement Schedules | |
Index to Financial Statements | ||
1
CAUTIONARY NOTE ABOUT FORWARD-LOOKING STATEMENTS
Investors are cautioned that certain statements contained in this Annual Report on Form 10-K, as well as some statements by the Company in periodic press releases and information included in oral statements or other written statements by the Company are “forward-looking statements” within the meaning of Section 27A of the Securities Act of 1933, as amended, and Section 21 of the Securities Exchange Act of 1934, as amended. Statements which are predictive in nature, which depend upon or refer to future events or conditions, or which include words such as “expects”, “anticipates”, “intends”, “plans”, “believes”, “estimates”, “hopes”, and similar expressions constitute forward-looking statements. Such statements may include, but are not limited to, information related to: our proposed acquisition of RSI Communities LLC and three related real estate assets ("the RSI Acquisition"); anticipated operating results; home deliveries and backlog conversion; financial resources and condition; cash needs and liquidity; timing of project openings; leverage ratios and compliance with debt covenants; revenues and average selling prices of deliveries; sales price ranges for active and future communities; backlog conversion; global and domestic economic conditions; market and industry trends; cycle times; profitability and gross margins; cost of revenues; selling, general and administrative expenses and leverage; interest expense; inventory write-downs; unrecognized tax benefits; land acquisition spending and timing; debt maturities; business and operational strategies and the anticipated effects thereof; the Company's ability to achieve tax benefits and utilize its tax attributes; sales pace; effects of home buyer cancellations; community count; joint ventures; the Company's ability to acquire land and pursue real estate opportunities; the Company's ability to gain approvals and open new communities; the Company's ability to sell homes and properties; the Company's ability to secure materials and subcontractors; the Company's ability to produce the liquidity and capital necessary to expand and take advantage of opportunities; and legal proceedings, insurance and claims. Forward-looking statements are based upon expectations and projections about future events and are subject to assumptions, risks and uncertainties about, among other things, the Company, economic and market factors and the homebuilding industry. There is no guarantee that any of the events anticipated by the forward-looking statements in this annual report on Form 10-K will occur, or if any of the events occur, there is no guarantee what effect it will have on the Company's operations, financial condition or share price. The Company's past performance, and past or present economic conditions in its housing markets, are not indicative of future performance or conditions. Investors are urged not to place undue reliance on forward-looking statements. The Company will not, and undertakes no obligation to, update or revise forward-looking statements to reflect changed assumptions, the occurrence of anticipated or unanticipated events or changes to projections over time unless required by federal securities laws.
Actual events and results may differ materially from those expressed or forecasted in the forward-looking statements due to a number of factors. While it is impossible to identify all such factors, the major risks and uncertainties, and assumptions that are made, that affect the Company's business and may cause actual results to differ materially from those estimated by the Company include, but are not limited to: our ability to consummate the RSI Acquisition as described herein on time or at all, and to realize the anticipated benefits therefrom; our ability to integrate successfully the RSI operations with our existing operations; the availability of skilled subcontractors, labor and homebuilding materials and increased construction cycle times; the availability and timing of mortgage financing; adverse weather conditions; the Company’s financial leverage and level of indebtedness and any inability to comply with financial and other covenants under its debt instruments; continued volatility and worsening in general economic conditions either internationally, nationally or in regions in which the Company operates; changes in governmental laws and regulations and increased costs, fees and delays associated therewith; government actions, policies, programs and regulations directed at or affecting the housing market (including the Tax Cuts and Jobs Act (the “Tax Cuts and Job Act”), the Dodd-Frank Act, tax benefits associated with purchasing and owning a home, and the standards, fees and size limits applicable to the purchase or insuring of mortgage loans by government-sponsored enterprises and government agencies), the homebuilding industry, or construction activities; defects in manufactured products or other homebuilding materials; changes in existing tax laws or enacted corporate income tax rates, including pursuant to the Tax Cuts and Job Act; worsening in markets for residential housing; the impact of construction defect, product liability and home warranty claims, including the adequacy of self-insurance accruals, and the applicability and sufficiency of the Company’s insurance coverage; decline in real estate values resulting in impairment of the Company’s real estate assets; volatility in the banking industry, credit and capital markets; the timing of receipt of regulatory approvals and the opening of projects; the availability and cost of land for future development; terrorism or other hostilities involving the United States; building moratorium or “slow-growth” or “no-growth” initiatives that could be implemented in states in which the Company operates; changes in mortgage and other interest rates; conditions in the capital, credit and financial markets, including mortgage lending standards and the availability of mortgage financing; changes in generally accepted accounting principles or interpretations of those principles; changes in prices of homebuilding materials; competition for home sales from other sellers of new and resale homes; cancellations and the Company’s ability to convert its backlog into deliveries; the occurrence of events such as landslides, soil subsidence and earthquakes that are uninsurable, not economically insurable or not subject to effective indemnification agreements; increased outside broker costs; changes in governmental laws and regulations; limitations on the Company’s ability to utilize its tax attributes; whether an ownership change occurred that could, under certain circumstances, have resulted in the limitation of the Company’s ability to offset prior years’ taxable income with net operating losses; and other factors, risks and uncertainties described in Item 1A. "Risk Factors" in this report.
2
EXPLANATORY NOTE
In this annual report on Form 10-K, unless otherwise stated or the context otherwise requires, the “Company,” “we,” “our,” and “us” refer to William Lyon Homes, a Delaware corporation, and its subsidiaries. In addition, unless otherwise stated or the context otherwise requires, “Parent” refers to William Lyon Homes, and “California Lyon” refers to William Lyon Homes, Inc., a California corporation and wholly-owned subsidiary of Parent.
3
PART I
Item 1. | Business |
Overview
William Lyon Homes, a Delaware corporation, together with its subsidiaries, is one of the largest Western U.S. regional homebuilders. Headquartered in Newport Beach, California, the Company is primarily engaged in the design, construction, marketing and sale of single-family detached and attached homes in California, Arizona, Nevada, Colorado, Washington and Oregon. The Company's core markets currently include Orange County, Los Angeles, the Inland Empire, the San Francisco Bay Area, Phoenix, Las Vegas, Denver, Seattle and Portland. The Company has a distinguished legacy of more than 60 years of homebuilding operations, over which time it has sold in excess of 102,000 homes. The Company believes that its markets are characterized by attractive long-term housing fundamentals and that it has a significant land supply, with 17,436 lots owned or controlled.
The Company has significant expertise in understanding the needs of its homebuyers and designing its product offerings to meet those needs. This allows the Company to maximize the return on its land investments by tailoring its home offerings to meet the buyer demands in each of its markets. The Company builds and sells across a diverse range of product lines at a variety of price points with sales to entry-level, first-time move-up, second-time move-up homebuyers, as well as a signature luxury brand and an active adult target segment. The Company is committed to achieving the highest standards in design, quality and customer satisfaction and has received numerous industry awards and commendations throughout its operating history in recognition of its achievements.
In 2017, the Company delivered 3,239 homes, with an average selling price of approximately $554,200, and recognized home sales revenues of $1.8 billion. As of December 31, 2017, the Company had a consolidated backlog of 822 sold but unclosed homes, with an associated sales value of $433.0 million, representing a 5% increase in value as compared to its backlog as of December 31, 2016. The average selling price of homes in backlog as of December 31, 2017 was approximately $526,800.
The Company’s Markets
The Company is currently operating in six reportable operating segments: California, Arizona, Nevada, Colorado, Washington and Oregon. Each of the segments has responsibility for the management of the Company’s homebuilding and development operations within its geographic footprint. See Note 4 to the financial statements for further information.
The following table sets forth homebuilding revenue from each of the Company’s homebuilding segments for the years ended December 31, 2017, 2016, and 2015 (in thousands):
Year Ended December 31, | |||||||||||
2017 | 2016 | 2015 | |||||||||
California (1) | $ | 682,806 | $ | 490,352 | $ | 379,310 | |||||
Arizona (2) | 158,534 | 125,951 | 67,010 | ||||||||
Nevada (3) | 176,355 | 191,711 | 130,845 | ||||||||
Colorado (4) | 124,456 | 128,530 | 107,014 | ||||||||
Washington (5) | 332,302 | 154,600 | 181,258 | ||||||||
Oregon (6) | 320,621 | 311,059 | 213,491 | ||||||||
$ | 1,795,074 | $ | 1,402,203 | $ | 1,078,928 | ||||||
(1) | The California Segment during the time periods reflected above consists of operations in Orange, Los Angeles, San Diego, Riverside, San Bernardino, Alameda, Contra Costa, and San Joaquin counties. The offices are located in leased office space at 4695 MacArthur Court, 8th Floor, Newport Beach, California 92660 and 2603 Camino Ramon, Suite 450, San Ramon, CA 94583. |
(2) | The Arizona Segment consists of operations in the Phoenix metropolitan area. The offices are located in a leased office building at 8840 E. Chaparral Road, Suite 200, Scottsdale, AZ 85250. |
(3) | The Nevada Segment consists of operations in Clark and Nye counties. The offices are located in a leased office building at 1980 Festival Plaza Drive, Suite 500, Las Vegas, NV 89135. |
4
(4) | The Colorado Segment consists of operations in Douglas, Grand, Jefferson, and Larimer counties. The offices are located in a leased office building at 8480 East Orchard Road, Suite 1000, Greenwood Village, CO 80111. |
(5) | The Washington Segment consists of operations in King, Snohomish, and Pierce counties. The offices are located in a leased office building at 11624 SE 5th Street, Bellevue, WA 98005. |
(6) | The Oregon Segment consists of operations in Clackamas and Washington counties. The offices are located in a leased office building at 703 Broadway Street, Suite 510, Vancouver, WA 98660. |
Strategy and Lot Position
The Company owned approximately 13,256 lots and had options to purchase an additional 4,180 lots as of December 31, 2017. As used in this Annual Report on Form 10-K, “entitled” land typically has a development agreement and/or vesting tentative map, or a final recorded plat or map from the appropriate county or city government. Development agreements and vesting tentative maps generally provide for the right to develop the land in accordance with the provisions of the development agreement or vesting tentative map unless an issue arises concerning health, safety or general welfare. The Company’s sources of developed lots for its homebuilding operations are (1) purchase of smaller projects with shorter life cycles (merchant homebuilding) and (2) development of larger scale projects and/or master-planned communities.
The Company intends to continue to utilize its current inventory of lots and future land acquisitions to conduct its operating strategy, which consists of:
1. | converting our lot supply into active projects; |
2. | maximizing revenue at communities with strong demand; |
3. | maintaining a low cost structure; |
4. | acquiring land positions through disciplined acquisition strategies near employment centers or transportation corridors; |
5. | leveraging an experienced management team; |
6. | deleveraging the balance sheet; and |
7. | generating positive cash flows and strong returns for shareholders. |
Land Acquisition and Development
To manage the risks associated with land ownership and development, the Company has a Corporate Land Committee, which is comprised of certain members of its senior executive management team and key operational and financial executives. As potential land acquisitions are being analyzed, the Corporate Land Committee must approve all land acquisitions. Further, the Company's board of directors must also approve land purchases over certain dollar thresholds. The Company’s long-term strategy consists of the following elements:
• | completing due diligence prior to committing to acquire land; |
• | reviewing the status of entitlements and other governmental processing to mitigate zoning and other entitlement or development risk; |
• | maximizing density to achieve more units per acre; |
• | analyzing project pricing compared to the market's median home price; |
• | focusing on land as a component of a home’s cost structure, rather than on the land’s speculative value; |
• | limiting land acquisition size to reduce investment levels in any one project where possible; |
• | utilizing option, joint venture and other non-capital intensive structures to control land and reduce risk where feasible; |
• | funding land acquisitions whenever possible with non-recourse seller financing; |
• | employing centralized control of approval over all land transactions; and |
• | diversifying with respect to market segments and product types. |
5
Prior to committing to the acquisition of land, the Company conducts feasibility studies covering pertinent aspects of the proposed commitment. These studies may include a variety of elements from technical aspects such as title, zoning, soil and seismic characteristics, to marketing studies that review population and employment trends, schools, transportation access, buyer profiles, sales forecasts, projected profitability, cash requirements, and assessment of geo-political risk and other factors. Prior to acquiring land, the Company considers assumptions concerning the needs of the targeted customer and determines whether the underlying land price enables the Company to meet those needs at an affordable price. Before purchasing land, the Company attempts to project the commencement of construction and sales over a reasonable time period. The Company utilizes architects and outside consultants, under close supervision, to help review acquisitions and design products.
Homebuilding and Market Strategy
The Company currently has a wide variety of product lines which enables it to meet the specific needs of each of its markets. The Company creates product for the entry-level, first time move-up, second time move-up, luxury home and active adult markets, and believes that a diversified product strategy enables it to best serve a wide range of buyers and adapt quickly to a variety of market conditions. The Company’s markets are geographically diverse in order to mitigate market risk.
Because the decision as to which product to develop is based on the Company’s assessment of market conditions and the restrictions imposed by government regulations, home styles and sizes vary from project to project. The Company generally standardizes and limits the number of home designs within any given product line. This standardization allows on-site mass production techniques and bulk purchasing of materials and components, thus enabling the Company to better control and sometimes reduce construction costs and home construction cycles.
The Company contracts with a number of architects and other consultants who are involved in the design process of the Company’s homes. Designs are constrained by zoning requirements, building codes, energy efficiency laws and local architectural guidelines, among other factors. Engineering, landscaping, master-planning and environmental impact analysis work are subcontracted to independent firms which are familiar with local requirements.
Substantially all construction work is done by subcontractors with the Company acting as the general contractor. The Company manages subcontractor activities with on-site supervisory employees and management control systems. The Company does not have long-term contractual commitments with its subcontractors or suppliers, and instead it contracts development work by project and where possible by phase size of 10 to 25 home sites or by building/structure for attached product. The Company generally has been able to obtain sufficient materials and subcontractors during times of material shortages, though it has experienced skilled labor shortages in certain markets during times of peak demand. The Company believes its relationships with its suppliers and subcontractors are in good standing.
Description of Projects and Communities Under Development
The Company’s homebuilding projects usually take two to five years to develop. The following table presents project information relating to each of the Company’s homebuilding operating segments as of December 31, 2017. The section for "Active Projects" includes only projects with lots owned as of December 31, 2017, lots consolidated in accordance with certain accounting principles as of December 31, 2017, in each case, with an estimated year of first delivery of 2018 or earlier, or homes either closed or in backlog as of or for the year ended December 31, 2017. The section for "Future Owned and Controlled" includes projects with lots owned as of December 31, 2017 but with an estimated year of first delivery of 2018 or later, parcels of undeveloped land held for future sale, and lots controlled as of December 31, 2017, in each case aggregated by county. The following table includes certain information that is forward-looking or predictive in nature and is based on expectations and projections about future events. Such information is subject to a number of risks and uncertainties, and actual results may differ materially from those expressed or forecast in the table below. In addition, we undertake no obligation to update or revise the information in the table below to reflect changed assumptions, the occurrence of anticipated or unanticipated events or changes to projections over time. See "CAUTIONARY NOTE ABOUT FORWARD-LOOKING STATEMENTS" included in this Annual Report on Form 10-K.
6
Active Projects (by County or City) | Estimated Year of First Delivery | Estimated Number of Homes at Completion (1) | Cumulative Homes Closed as of December 31, 2017 (2) | Backlog at December 31, 2017 (3) (4) | Lots Owned as of December 31, 2017 (5) | Homes Closed for the Year Ended December 31, 2017 | Estimated Sales Price Range (6) | |||||||||||
CALIFORNIA | ||||||||||||||||||
Orange County: | ||||||||||||||||||
Anaheim | ||||||||||||||||||
Avelina | 2017 | 38 | 38 | — | — | 38 | (8) | |||||||||||
Buena Park | ||||||||||||||||||
The Covey (7) | 2016 | 67 | 67 | — | — | 43 | (8) | |||||||||||
Cypress | ||||||||||||||||||
Mackay Place (7) | 2016 | 47 | 47 | — | — | 13 | (8) | |||||||||||
Ovation at Flora Park (7) | 2018 | 244 | — | — | 244 | — | $ 720,000 - 846,000 | |||||||||||
Dana Point | ||||||||||||||||||
Grand Monarch | 2015 | 37 | 15 | — | 22 | 2 | $ 2,561,000 - 2,904,000 | |||||||||||
Ladera Ranch | ||||||||||||||||||
Artisan | 2015 | 14 | 9 | — | 5 | 3 | $ 2,550,000 - 3,025,000 | |||||||||||
Artisan II | 2018 | 15 | — | — | 7 | — | $ 1,986,000 - 2,991,000 | |||||||||||
Irvine | ||||||||||||||||||
The Vine | 2016 | 106 | 94 | 10 | 12 | 63 | $ 546,000 - 645,000 | |||||||||||
Calistoga | 2016 | 60 | 56 | — | 4 | 41 | $1,230,000 - $1,475,000 | |||||||||||
Celadon (7) | 2017 | 79 | 26 | 32 | 53 | 26 | $ 720,000 - 815,000 | |||||||||||
Rancho Mission Viejo | ||||||||||||||||||
Aurora (7) | 2016 | 94 | 94 | — | — | 37 | (8) | |||||||||||
Vireo (7) | 2015 | 90 | 84 | — | 6 | 24 | $ 599,000 - 655,000 | |||||||||||
Briosa (7) | 2016 | 50 | 17 | 1 | 33 | 16 | $ 945,000 - 1,050,000 | |||||||||||
Reverie | 2018 | 118 | — | — | 54 | — | $ 690,000 - 815,000 | |||||||||||
Rancho Santa Margarita | ||||||||||||||||||
Dahlia Court | 2016 | 36 | 36 | — | — | 36 | (8) | |||||||||||
Los Angeles County: | ||||||||||||||||||
Glendora | ||||||||||||||||||
La Colina Estates | 2015 | 121 | 24 | 8 | 97 | 5 | $ 1,274,000 - 1,654,000 | |||||||||||
Lakewood | ||||||||||||||||||
Canvas | 2015 | 72 | 72 | — | — | 1 | (8) | |||||||||||
Claremont | ||||||||||||||||||
Meadow Park | 2017 | 95 | 6 | 9 | 89 | 6 | $ 460,000 - 585,000 | |||||||||||
Riverside County: | ||||||||||||||||||
Riverside | ||||||||||||||||||
SkyRidge | 2014 | 90 | 61 | 9 | 29 | 39 | $ 510,000 - 560,000 | |||||||||||
TurnLeaf | ||||||||||||||||||
Crossings | 2014 | 42 | 39 | — | 3 | 20 | $ 498,000 - 528,000 | |||||||||||
Coventry | 2015 | 42 | 36 | 3 | 6 | 23 | $ 538,000 - 558,000 | |||||||||||
Cameos | 2018 | 216 | — | 30 | 216 | — | $ 510,000 - 605,000 | |||||||||||
Eastvale | ||||||||||||||||||
Nexus | 2015 | 220 | 168 | 33 | 52 | 73 | $ 356,000 - 415,000 | |||||||||||
San Bernardino County: | ||||||||||||||||||
Upland | ||||||||||||||||||
The Orchards (7) | ||||||||||||||||||
Citrus Court | 2015 | 77 | 77 | — | — | 32 | (8) | |||||||||||
Citrus Pointe | 2015 | 132 | 94 | 11 | 38 | 50 | $ 369,000 - 394,000 | |||||||||||
Yucaipa | ||||||||||||||||||
Cedar Glen | 2015 | 143 | 143 | — | — | 10 | (8) | |||||||||||
7
Chino | ||||||||||||||||||
Laurel Lane | 2017 | 70 | 12 | 24 | 58 | 12 | $ 534,000 - 600,000 | |||||||||||
San Diego County: | ||||||||||||||||||
Escondido | ||||||||||||||||||
Citron | 2018 | 63 | — | — | 63 | — | $ 377,000 - 418,000 | |||||||||||
Alameda County: | ||||||||||||||||||
Livermore | ||||||||||||||||||
Wayland | 2018 | 54 | — | 17 | 54 | — | $ 895,000 - 1,090,000 | |||||||||||
Newark | ||||||||||||||||||
The Cove | 2016 | 108 | 72 | 27 | 36 | 64 | $ 716,000 - 821,000 | |||||||||||
The Strand | 2016 | 157 | 66 | 6 | 91 | 58 | $ 802,000 - 912,000 | |||||||||||
The Banks | 2016 | 120 | 96 | — | 24 | 92 | $ 865,000 - 950,000 | |||||||||||
The Tides | 2016 | 75 | 52 | 9 | 23 | 48 | $ 944,000 - 974,000 | |||||||||||
The Isles | 2016 | 82 | 43 | 11 | 39 | 40 | $ 1,038,000 - 1,118,000 | |||||||||||
Contra Costa County: | ||||||||||||||||||
Pittsburg | ||||||||||||||||||
Vista Del Mar | ||||||||||||||||||
Victory II | 2014 | 104 | 104 | — | — | 4 | (8) | |||||||||||
CALIFORNIA TOTAL | 3,178 | 1,748 | 240 | 1,358 | 919 | |||||||||||||
ARIZONA | ||||||||||||||||||
Maricopa County: | ||||||||||||||||||
Queen Creek | ||||||||||||||||||
Meridian | ||||||||||||||||||
Harvest | 2015 | 448 | 255 | 24 | 193 | 121 | $ 217,990 - 260,990 | |||||||||||
Homestead | 2015 | 313 | 120 | 27 | 193 | 64 | $ 257,990 - 346,990 | |||||||||||
Harmony | 2015 | 282 | 65 | 28 | 217 | 36 | $ 288,990 - 311,990 | |||||||||||
Horizons | 2016 | 161 | 38 | 20 | 123 | 29 | $ 324,990 - 411,990 | |||||||||||
Mesa | ||||||||||||||||||
Lehi Crossing | ||||||||||||||||||
Settlers Landing | 2012 | 235 | 235 | — | — | 34 | (8) | |||||||||||
Wagon Trail | 2013 | 244 | 242 | — | 2 | 90 | $ 259,990 - 341,990 | |||||||||||
Monument Ridge | 2013 | 248 | 169 | 29 | 79 | 82 | $ 301,990 - 440,990 | |||||||||||
Albany Village | 2016 | 228 | 69 | 33 | 159 | 61 | $ 203,990 - 268,990 | |||||||||||
Peoria | ||||||||||||||||||
Rio Vista | 2015 | 197 | 197 | — | — | 22 | (8) | |||||||||||
ARIZONA TOTAL | 2,356 | 1,390 | 161 | 966 | 539 | |||||||||||||
NEVADA | ||||||||||||||||||
Clark County: | ||||||||||||||||||
Las Vegas | ||||||||||||||||||
Lyon Estates | 2014 | 81 | 81 | — | — | 8 | (8) | |||||||||||
Tuscan Cliffs | 2015 | 76 | 33 | — | 43 | 6 | $ 645,000 - 826,000 | |||||||||||
Brookshire | ||||||||||||||||||
Estates | 2015 | 35 | 34 | 1 | 1 | 7 | (8) | |||||||||||
Heights | 2015 | 98 | 92 | 4 | 6 | 54 | $ 373,000 - 425,000 | |||||||||||
Las Vegas - Summerlin | ||||||||||||||||||
Sterling Ridge | ||||||||||||||||||
Grand | 2014 | 137 | 111 | 10 | 26 | 29 | $ 920,000 - 1,003,000 | |||||||||||
Premier | 2014 | 62 | 62 | — | — | 2 | $ 1,244,000 - 1,357,000 | |||||||||||
Allegra | 2016 | 88 | 53 | 9 | 35 | 23 | $ 519,000 - 556,000 | |||||||||||
Silver Ridge | 2016 | 83 | 32 | 12 | 34 | 20 | $ 1,292,500 - 1,500,500 | |||||||||||
8
Affinity | ||||||||||||||||||
Moda (7) | 2017 | 192 | 12 | 12 | 180 | 12 | $ 247,000 - 316,000 | |||||||||||
Evoke | 2017 | 117 | 15 | 6 | 102 | 15 | $ 336,000 - 423,000 | |||||||||||
Savu (7) | 2017 | 96 | 5 | 4 | 91 | 5 | $ 410,000 - 489,000 | |||||||||||
Revo (7) | 2017 | 80 | 1 | 4 | 79 | 1 | $ 445,000 - 485,000 | |||||||||||
Henderson | ||||||||||||||||||
Lago Vista | 2016 | 52 | 16 | 4 | 36 | 13 | $ 790,000 - 878,000 | |||||||||||
The Peaks | 2016 | 88 | 10 | 9 | 78 | 10 | $ 490,000 - 514,000 | |||||||||||
Nye County: | ||||||||||||||||||
Pahrump | ||||||||||||||||||
Mountain Falls | ||||||||||||||||||
Series I | 2011 | 242 | 239 | 3 | 3 | 50 | (8) | |||||||||||
Series II | 2014 | 96 | 58 | 7 | 38 | 23 | $ 237,500 - 326,500 | |||||||||||
Ventano | 2018 | 166 | — | 1 | 166 | — | $ 195,500 - 223,500 | |||||||||||
Ovation at Mountain Falls | ||||||||||||||||||
Onyx | 2018 | 256 | — | — | 256 | — | $ 209,500 - 234,500 | |||||||||||
Jade | 2018 | 179 | — | — | 179 | — | $ 274,300 - 284,300 | |||||||||||
Topaz | 2018 | 166 | — | — | 166 | — | $ 299,600 - 316,600 | |||||||||||
NEVADA TOTAL | 2,390 | 854 | 86 | 1,519 | 278 | |||||||||||||
COLORADO | ||||||||||||||||||
Arapahoe County: | ||||||||||||||||||
Aurora | ||||||||||||||||||
Southshore | ||||||||||||||||||
Generations | 2014 | 15 | 15 | — | — | 1 | (8) | |||||||||||
Signature | 2015 | 7 | 7 | — | — | 1 | (8) | |||||||||||
Reverie Collection | 2016 | 30 | 12 | 2 | 18 | 10 | $ 423,000 - 497,000 | |||||||||||
Artistry | 2016 | 61 | 46 | 2 | 15 | 29 | $ 437,000 - 495,000 | |||||||||||
Signature II | 2017 | 30 | 8 | 2 | 22 | 8 | $ 482,000 - 533,000 | |||||||||||
Marque Collection | 2017 | 79 | 1 | 15 | 78 | 1 | $ 358,000 - 398,000 | |||||||||||
Reverie Collection 40's Lg | 2018 | 71 | — | — | 71 | — | $ 396,000 - 462,000 | |||||||||||
Touchstone Collection | 2018 | 68 | — | 2 | 68 | — | $ 434,000 - 495,000 | |||||||||||
Centennial | ||||||||||||||||||
Greenfield: Artistry | 2016 | 35 | 34 | — | 1 | 25 | $ 454,000 - 523,000 | |||||||||||
Douglas County: | ||||||||||||||||||
Castle Rock | ||||||||||||||||||
Cliffside: Portrait | 2014 | 49 | 49 | — | — | 5 | (8) | |||||||||||
Jefferson County: | ||||||||||||||||||
Arvada | ||||||||||||||||||
Candelas | ||||||||||||||||||
Generations | 2015 | 50 | 48 | — | 2 | 14 | $ 425,000 - 497,000 | |||||||||||
Tapestry | 2015 | 26 | 18 | — | 8 | 10 | $ 460,000 - 530,000 | |||||||||||
The 40's Collection | 2017 | 40 | 3 | 4 | 37 | 3 | $ 413,000 - 466,000 | |||||||||||
The 50's Collection | 2017 | 85 | 1 | 3 | 84 | 1 | $ 450,000 - 510,000 | |||||||||||
Leydon Rock | ||||||||||||||||||
Garden | 2014 | 60 | 57 | — | 3 | 22 | $ 422,000 - 462,000 | |||||||||||
Park | 2015 | 74 | 72 | — | 2 | 10 | $ 410,000 - 458,000 | |||||||||||
Larimer County: | ||||||||||||||||||
Fort Collins | ||||||||||||||||||
West Village at Timnath Ranch North | ||||||||||||||||||
Park | 2014 | 92 | 91 | 1 | 1 | 27 | (8) | |||||||||||
Sonnet | 2014 | 55 | 53 | — | 2 | 6 | $ 398,000 - 470,000 | |||||||||||
9
The 50's Collection | 2017 | 55 | 3 | 3 | 52 | 3 | $ 410,000 - 490,000 | |||||||||||
The 40's Collection | 2017 | 69 | — | 2 | 69 | — | $ 381,000 - 447,000 | |||||||||||
Loveland | ||||||||||||||||||
Lakes at Centerra: Park | 2015 | 88 | 60 | 12 | 28 | 25 | $ 397,000 - 440,000 | |||||||||||
Denver County: | ||||||||||||||||||
Denver | ||||||||||||||||||
Avion at Denver Connection | ||||||||||||||||||
Summit | 2017 | 93 | 5 | 16 | 88 | 5 | $ 354,000 - 394,000 | |||||||||||
Horizon | 2017 | 191 | 9 | 31 | 182 | 9 | $ 292,000 - 346,000 | |||||||||||
Alpine | 2017 | 101 | 5 | 18 | 96 | 5 | $ 283,000 - 313,000 | |||||||||||
Westerly | 2017 | 309 | 12 | 46 | 297 | 12 | $ 255,000 - 283,000 | |||||||||||
Boulder County: | ||||||||||||||||||
Erie | ||||||||||||||||||
Flatiron Meadows | 2017 | 98 | 8 | 13 | 28 | 8 | $ 462,000 - 564,000 | |||||||||||
COLORADO TOTAL | 1,931 | 617 | 172 | 1,252 | 240 | |||||||||||||
WASHINGTON | ||||||||||||||||||
King County: | ||||||||||||||||||
Bryant Heights SF | 2015 | 14 | 14 | — | — | 2 | (8) | |||||||||||
Bryant Heights NC | 2017 | 36 | 24 | 1 | 12 | 24 | $ 514,060 - 904,990 | |||||||||||
Bryant Heights MF | 2016 | 39 | 39 | — | — | 38 | (8) | |||||||||||
Highcroft at Sammamish | 2016 | 121 | 117 | 3 | 4 | 80 | $ 849,990 - 1,329,990 | |||||||||||
Peasley Canyon | 2016 | 153 | 123 | 18 | 30 | 88 | $ 389,990 - 497,990 | |||||||||||
Ridgeview Townhomes | 2016 | 40 | 40 | — | — | 34 | (8) | |||||||||||
High Point Block 9 | 2018 | 52 | — | — | 52 | — | $ 405,990 - 524,990 | |||||||||||
High Point Block 34 | 2017 | 54 | 53 | 1 | 1 | 53 | (8) | |||||||||||
Westridge SF South | 2017 | 72 | 3 | 6 | 39 | 3 | $ 969,990 - 1,284,290 | |||||||||||
Westridge MF South | 2018 | 109 | — | — | 34 | — | $ 659,990 - 824,990 | |||||||||||
Upton at Crossroads Village (7) | 2017 | 176 | 21 | 23 | 155 | 21 | $ 574,990 - 884,990 | |||||||||||
The Cottages at North Bend | 2017 | 37 | 29 | 5 | 8 | 29 | $ 489,990 - 739,990 | |||||||||||
Snohomish County: | ||||||||||||||||||
Silverlake Center | 2015 | 100 | 100 | — | — | 1 | (8) | |||||||||||
Riverfront | 2016 | 425 | 139 | 25 | 286 | 133 | $ 284,990 - 552,990 | |||||||||||
Pierce County: | ||||||||||||||||||
Ovation at Oak Tree (7) | 2017 | 814 | 10 | 9 | 245 | 10 | $ 324,990 - 459,990 | |||||||||||
WASHINGTON TOTAL | 2,242 | 712 | 91 | 866 | 516 | |||||||||||||
OREGON | ||||||||||||||||||
Clackamas County: | ||||||||||||||||||
Villebois Zion IIII - Townhomes | 2014 | 40 | 36 | — | 4 | — | $ 269,990 - 309,990 | |||||||||||
Villebois Zion III - Cottage | 2014 | 46 | 37 | 2 | 9 | — | $ 299,990 - 429,990 | |||||||||||
Villebois Zion III - Alley | 2015 | 51 | 32 | — | 19 | — | $ 339,990 - 414,990 | |||||||||||
Villebois V Fasano | 2016 | 93 | 92 | 1 | 1 | 55 | (8) | |||||||||||
Grande Pointe at Villebois Alley | 2016 | 40 | 39 | — | 1 | 28 | $ 459,990 - 483,990 | |||||||||||
Grande Pointe at Villebois FL | 2016 | 60 | 41 | 6 | 19 | 29 | $ 529,990 - 599,990 | |||||||||||
Villebois Lund Cottages | 2015 | 67 | 67 | — | — | 31 | (8) | |||||||||||
Villebois Lund Townhomes | 2015 | 42 | 42 | — | — | 14 | (8) | |||||||||||
Villebois Lund Alley | 2016 | 96 | 52 | 13 | 44 | 41 | $ 349,990 - 464,990 | |||||||||||
Villebois Village Parcel 80 | 2016 | 50 | 50 | — | — | 50 | (8) | |||||||||||
Villebois Village Parcel 83 | 2016 | 31 | 31 | — | — | 13 | (8) | |||||||||||
10
Villebois Village Parcel 77 | 2018 | 92 | — | — | 92 | — | $ 209,990 - 309,990 | |||||||||||
Villebois Village Parcel 78 | 2018 | 43 | — | 11 | 43 | — | $ 269,990 - 299,990 | |||||||||||
Villebois Village Parcel 82 | 2018 | 39 | — | — | 39 | — | $ 279,990 - 309,990 | |||||||||||
Washington County: | ||||||||||||||||||
Sequoia Village - Cornelius Pass | 2016 | 157 | 154 | 3 | 3 | 91 | (8) | |||||||||||
Twin Creeks | 2014 | 94 | 94 | — | — | 2 | (8) | |||||||||||
Bethany West - Alley | 2015 | 94 | 87 | — | 7 | 1 | $ 429,990 - 489,990 | |||||||||||
Bethany West - Cottage | 2015 | 61 | 60 | — | 1 | — | $ 389,990 - 429,990 | |||||||||||
Bethany West - Traditional | 2015 | 82 | 82 | — | — | 5 | (8) | |||||||||||
Bethany West - Townhomes | 2017 | 40 | 29 | 4 | 11 | 29 | $ 569,990 - 664,990 | |||||||||||
Bethany West - Weisenfluh | 2016 | 36 | 36 | — | — | 5 | (8) | |||||||||||
Bethany Round 2 - Alley | 2016 | 25 | 25 | — | — | 25 | (8) | |||||||||||
Bethany Round 2 - Cottage | 2016 | 13 | 13 | — | — | 13 | (8) | |||||||||||
Bethany Round 2 - Traditional | 2016 | 24 | 20 | — | 4 | 20 | $ 569,990 - 609,990 | |||||||||||
Bethany Phase 5 - Alley | 2018 | 48 | — | 7 | 48 | — | $ 474,990 - 589,990 | |||||||||||
Bethany Phase 5 - Townhomes | 2018 | 62 | — | — | 62 | — | $ 309,990 - 499,990 | |||||||||||
Bull Mountain 1 NW River Terrace - Alley | 2017 | 35 | 34 | — | 1 | 34 | $ 399,990 - 429,990 | |||||||||||
Bull Mountain 1 NW River Terrace - Med/Std/Lrg | 2016 | 116 | 86 | — | 30 | 86 | $ 464,990 - 594,990 | |||||||||||
Bull Mountain 1 NW River Terrace - Townhomes | 2017 | 64 | 46 | — | 18 | 46 | $ 269,990 - 294,990 | |||||||||||
Bull Mountain 2 W River Terrace - Alley | 2016 | 60 | 60 | — | — | 26 | (8) | |||||||||||
Bull Mountain 2 W River Terrace - Med/Std | 2016 | 31 | 31 | — | — | 19 | (8) | |||||||||||
Bull Mountain 2 W River Terrace - Townhomes | 2016 | 46 | 46 | — | — | 46 | (8) | |||||||||||
Bull Mountain 3 NE River Terrace - Townhouse | 2018 | 43 | — | 9 | 34 | — | $ 279,990 - 309,990 | |||||||||||
Bull Mountain 3 NE River Terrace - Alley | 2018 | 54 | — | 1 | 27 | — | $ 429,990 - 529,990 | |||||||||||
Bull Mountain 3 NE River Terrace - Med/Std | 2018 | 103 | — | 12 | 30 | — | $ 509,990 - 639,990 | |||||||||||
Bull Mountain 3 NE River Terrace - Large | 2018 | 15 | — | — | 15 | — | $ 684,990 - 699,990 | |||||||||||
Bull Mountain 3 NE River Terrace - Estate | 2018 | 8 | — | — | 8 | — | $ 669,990 - 715,990 | |||||||||||
Bull Mountain 7 Dickson | 2016 | 82 | 50 | 3 | 32 | 35 | $ 549,990 - 779,990 | |||||||||||
Bull Mountain River Terrace Condos | 2018 | 141 | — | — | 141 | — | $ 194,990 - 279,990 | |||||||||||
Sunset Ridge | 2015 | 104 | 104 | — | — | 3 | (8) | |||||||||||
OREGON TOTAL | 2,428 | 1,576 | 72 | 743 | 747 | |||||||||||||
Future Owned and Controlled (by County) | Lots Owned or Controlled as of December 31, 2017 (9) | |||||||||||||||||
CALIFORNIA | ||||||||||||||||||
Orange County | 176 | |||||||||||||||||
San Diego County | 122 | |||||||||||||||||
Alameda County | 457 | |||||||||||||||||
Contra Costa County | 489 | |||||||||||||||||
ARIZONA | ||||||||||||||||||
Maricopa County (10) | 3,255 | |||||||||||||||||
NEVADA | ||||||||||||||||||
Nye County (10) | 1,249 | |||||||||||||||||
11
Clark County | 230 | |||||||||||||||||
COLORADO | ||||||||||||||||||
Douglas County | 477 | |||||||||||||||||
Grand County | 24 | |||||||||||||||||
Larimer County | 106 | |||||||||||||||||
Boulder County | 186 | |||||||||||||||||
WASHINGTON | ||||||||||||||||||
King County | 684 | |||||||||||||||||
Pierce County | 559 | |||||||||||||||||
Snohomish County | 74 | |||||||||||||||||
OREGON | ||||||||||||||||||
Clackamas County | 131 | |||||||||||||||||
Washington County | 2,513 | |||||||||||||||||
TOTAL FUTURE | 10,732 | |||||||||||||||||
GRAND TOTALS | 14,525 | 6,897 | 822 | 17,436 | 3,239 | |||||||||||||
(1) | The estimated number of homes to be built at completion is approximate and includes home sites in our backlog. Such estimated amounts are subject to change based on, among other things, future site planning, as well as zoning and permit changes, and there can be no assurance that the Company will build these homes. Further, certain projects may include lots that the Company controls, and that are also reflected in "Future Owned and Controlled." |
(2) | “Cumulative Homes Closed” represents homes closed since the project opened, and may include prior years, in addition to the homes closed during the current year presented. |
(3) | Backlog consists of homes sold under sales contracts that have not yet closed, and there can be no assurance that closings of sold homes will occur. |
(4) | Of the total homes subject to pending sales contracts as of December 31, 2017, 703 represent homes that are completed or under construction. |
(5) | Lots owned as of December 31, 2017 include lots in backlog at December 31, 2017. |
(6) | Estimated sales price range reflects the most recent pricing updates of the base price only and excludes any lot premium, buyer incentive and buyer selected options, which vary from project to project. Sales prices reflect current pricing estimates (excluding homes sold under any affordable or other government-sponsored program) and might not be indicative of past or future pricing. Further, any potential benefit to be gained from an increase in sales price ranges as compared to previously estimated amounts may be offset by increases in costs, profit participation, and other factors. |
(7) | Project is a joint venture and is consolidated as a VIE in accordance with ASC 810, Consolidation. |
(8) | Project is completely sold out, therefore the sales price range is not applicable as of December 31, 2017. |
(9) | Includes projects with lots owned as of December 31, 2017 that are expected to open for sale and have an estimated year of first delivery of 2018 or later, as well as lots controlled as of December 31, 2017, and parcels of undeveloped land held for future sale. Certain lots controlled are under land banking arrangements which may become owned and produce deliveries during 2018. Actual homes at completion may change prior to the marketing and sales of homes in these projects and the sales price ranges for these projects are to be determined and will be based on current market conditions and other factors upon the commencement of active selling. There can be no assurance that the Company will acquire any of the controlled lots reflected in these amounts. |
(10) | Includes parcels of undeveloped land held for future sale. It is unknown when the Company plans to develop homes on this land. |
Sales and Marketing
Each division's management team develops a sales and marketing strategy for each project, which includes:
12
•market studies of existing home sales, both re-sale and new homes, as well as competition to establish
pricing;
•developing the advertising program based on the product segmentation; and
•understanding the buyer profile to target marketing efforts.
The Company makes use of marketing tactics that include promotional events as well as on-line and off-line advertising channels. Advertising channels include primarily off-site signage programs that serve as way-finding to individual neighborhood model complexes, online digital advertising specifically targeting potential homebuyers and on-site promotional events to support new neighborhood grand openings, new phase releases and/or homeowner referrals.
The Company normally builds, decorates, furnishes and landscapes three to seven model homes for each product line and maintains on-site sales offices, which typically are open seven days a week, however, in some cases the Company will operate out of an on-site sales trailer prior to model home construction. Management believes that model homes and sales trailers play a particularly important role in the Company’s marketing efforts. Consequently, the Company expends a significant amount of effort in creating an attractive atmosphere at its model homes. Interior decorations vary among the Company’s models and are carefully selected based upon the lifestyles of targeted buyers. Structural changes in design from the model homes are not generally permitted, but home buyers may select various other optional construction and design amenities.
The Company employs in-house commissioned sales personnel to sell its homes, and outside brokers are also involved in the selling of the Company’s homes. The Company typically engages its sales personnel on a long-term, rather than a project-by-project basis, which it believes results in a more motivated sales force with an extensive knowledge of the Company’s operating policies and products. Sales personnel are trained by the Company and attend regular meetings to be updated on the availability of financing, construction schedules and marketing and advertising plans.
The Company strives to provide a high level of customer help service throughout the entire sales process and after a home has closed escrow. The participation of the sales representatives, on-site construction supervisors and the post-closing customer service personnel, working in a team effort, is intended to foster the Company’s reputation for quality and service, and ultimately lead to an overall better customer home-buying experience that will benefit not only the customer directly, but also benefit the company in improving buyer retention and future homeowner referrals.
The Company’s homes are typically sold before or during construction through sales contracts which are usually accompanied by a small cash deposit. Such sales contracts are usually subject to certain contingencies such as the buyer’s ability to qualify for financing. The cancellation rate of buyers who contracted to buy a home but did not close escrow at the Company and its joint ventures’ projects was approximately 15% during 2017 and 16% during 2016. Cancellations are caused by a variety of factors beyond the Company’s control such as buyer’s change in ability to secure financing over time, individual life changing events, or overall economic market conditions.
Warranty
The Company provides its homebuyers with a one to three year limited warranty, depending upon the timing of close of escrow and location of the project, covering workmanship and materials. The Company also provides its homebuyers with a limited warranty that covers “construction defects,” as defined in the limited warranty agreement provided to each home buyer, for the length of its legal liability for such defects (which may be up to ten years in some circumstances), as determined by the law of the state in which the Company builds. The limited warranty covering construction defects is transferable to subsequent buyers not under direct contract with the Company and requires that homebuyers agree to the definitions and procedures set forth in the warranty, including the submission of unresolved construction-related disputes to binding arbitration. In connection with the limited warranty covering construction defects, the Company maintains general liability insurance coverage. The Company believes that its insurance policy will respond to construction defect claims on homes that close during each policy period for the duration of the Company’s legal liability, upon satisfaction of the applicable self-insured retention. The insurance policy provides a single policy of insurance to the Company and its subcontractors. As a result, the Company is not required to obtain proof of insurance from its subcontractors nor be named as an additional insured under their individual insurance policies regarding the subcontractors' general liability policies for work on the Company's projects. The subcontractors still must provide proof of insurance regarding general liability coverage for off-site work, worker's compensation and auto coverage. Furthermore, the Company generally requires that each subcontractor and design professional agreement provide the Company with an indemnity, subject to various limitations.
There can be no assurance, however, that the terms and limitations of the limited warranty will be enforceable against the homebuyers, that the Company will be able to renew its insurance coverage or renew it at reasonable rates, that the Company will not be liable for damages, the cost of repairs, and/or the expense of litigation surrounding possible construction defects, soil subsidence or building-related claims or that claims will not arise out of uninsurable events not covered by insurance and
13
not subject to effective indemnification agreements with the Company’s subcontractors and design professionals or that such subcontractors and design professionals will be viable entities at the time of the claim.
Raw Materials
Typically, all of the raw materials and most of the components used in our business are readily available in the United States. Most are standard items carried by major suppliers. However, a rapid increase in the number of homes started or other market conditions could cause delays in the delivery of, shortages in, or higher prices for necessary materials. Delivery delays or the inability to obtain necessary materials could result in delays in the delivery of homes under construction. We have established national purchase programs for certain materials and we continue to monitor the supply markets to achieve the best prices available.
Sale of Lots and Land
In the ordinary course of business, the Company continually evaluates land sales and has sold, and expects that it will continue to sell, land as market and business conditions warrant. The Company may also sell both multiple lots to other builders (bulk sales) and improved individual lots for the construction of custom homes where the presence of such homes adds to the quality of the community. In addition, the Company may acquire sites with commercial, industrial and multi-family parcels which will generally be sold to third-party developers.
Customer Financing
The Company seeks to assist its home buyers in obtaining mortgage financing for qualified buyers. Substantially all home buyers utilize long-term mortgage financing to purchase a home and mortgage lenders will usually make loans only to qualified borrowers. In connection with the Polygon Acquisition in 2014, the Company acquired a membership interest in an unconsolidated joint venture which provides certain mortgage brokerage services, in part, to its customers in Washington and Oregon. In addition, in 2015 the Company announced the formation of a separate unconsolidated joint venture, of which it holds a membership interest, which provides a variety of mortgage banking services, in part, to its customers in California, Nevada, Arizona and Colorado. While the Company's mortgage joint ventures may offer or provide certain mortgage services to the Company's homebuyers, the Company's homebuyers may obtain mortgage financing to purchase its homes from any lender or other provider of their choice.
Information Systems and Controls
The Company assigns a high priority to the development and maintenance of its budget and cost control systems and procedures. The Company’s segment offices are connected to corporate headquarters through a fully integrated accounting, financial and operational management information system. Through this system, management regularly evaluates the status of its projects in relation to budgets to determine the cause of any variances and, where appropriate, adjusts the Company’s operations to capitalize on favorable variances or to limit adverse financial impacts.
Regulation
The Company and its competitors are subject to various local, state and federal statutes, ordinances, rules and regulations concerning zoning, building design, construction and similar matters, including local regulation which imposes restrictive zoning and density requirements in order to limit the number of homes that can ultimately be built within the boundaries of a particular project. The Company and its competitors may also be subject to periodic delays or may be precluded entirely from developing in certain communities due to building moratoriums or “slow-growth” or “no-growth” initiatives that could be implemented in the future in the states in which it operates. Because the Company usually purchases land with entitlements, the Company believes that the moratoriums would adversely affect the Company only if they arose from unforeseen health, safety and welfare issues such as insufficient water or sewage facilities. Local and state governments also have broad discretion regarding the imposition of development fees for projects in their jurisdiction. However, these are normally locked-in when the Company receives entitlements.
The Company and its competitors are also subject to a variety of local, state and federal statutes, ordinances, rules and regulations concerning protection of health and the environment. The particular environmental laws which apply to any given community vary greatly according to the community site, the site’s environmental conditions and the present and former uses of the site. These environmental laws may result in delays, may cause the Company and its competitors to incur substantial compliance and other costs, and may prohibit or severely restrict development in certain environmentally sensitive regions or areas. Environmental laws and regulations can also have an adverse impact on the availability and price of certain raw materials such as lumber. The Company’s projects in California are especially susceptible to restrictive government regulations and environmental laws. In addition, home deliveries in California may be delayed or prevented due to governmental responses
14
to drought conditions, even when we have obtained water rights for those projects. However, environmental laws have not, to date, had a material adverse impact on the Company’s operations. The Company’s wholly-owned subsidiary, California Lyon, is licensed as a general building contractor in California, Arizona and Nevada, in various municipalities within Colorado as required, and in Oregon. In addition, California Lyon's wholly-owned subsidiary, Polygon WLH LLC, is licensed as a general building contractor in Washington and Oregon, and the additional special purpose entities acquired through the Polygon Acquisition hold such a license in Washington or Oregon, as applicable to their location of business operations. California Lyon holds a corporate real estate license under the California Real Estate Law.
Competition
The homebuilding industry is highly competitive and fragmented. Homebuilders compete for, among other things, homebuyers, desirable land parcels, financing, raw materials and skilled labor. The Company competes for homebuyers primarily on the basis of a number of interrelated factors including home design and location, construction quality, customer service and satisfaction, and reputation. The Company believes that it competes effectively in its existing markets as a result of its product and geographic diversity, substantial development expertise and its reputation as a low-cost producer of quality homes. Further, the Company believes that it sometimes gains a competitive advantage in locations where changing regulations make it difficult for competitors to obtain entitlements and/or government approvals which the Company has already obtained.
Seasonality
The Company’s operations are historically seasonal, with the highest new order activity typically occurring in the spring and summer, which is impacted by the timing of project openings and competition in surrounding projects, among other factors. In addition, a majority of the Company’s home deliveries typically occur in the third and fourth quarter of each fiscal year, based on the construction cycle times of our homes between five and eight months. As a result, the Company’s revenues, cash flow and profitability are higher in that same period.
Financing
The Company provides for its ongoing cash requirements principally from internally generated funds from the sales of real estate, outside borrowings and by forming new joint ventures with venture partners that provide a substantial portion of the capital required for certain projects. In addition, the Company makes use of the funds received from certain recent corporate transactions including the Company's initial public offering of equity securities, senior notes offerings and other capital markets transactions.
As of December 31, 2017, California Lyon has outstanding its 5.75% Senior Notes due 2019, 7% Senior Notes due 2022, 5.875% Senior Notes due 2025, certain construction and land seller notes payable, and a letter of credit from its revolving credit facility. In addition to these borrowings, the Company had availability of $162.2 million under its revolving credit facility. Parent, California Lyon and their subsidiaries and joint ventures have financed, and may in the future finance, certain project and land acquisitions with construction loans secured by real estate inventories, seller-provided financing, lot option agreements and land banking transactions.
Corporate Organization and Personnel
The Company combines decentralized management in those aspects of its business where detailed knowledge of local market conditions is important (such as governmental processing, construction, land development and sales and marketing), with centralized management in those functions where the Company believes central control is required (such as approval of land acquisitions, finance, treasury, human resources and legal matters - corporate governance).
As of December 31, 2017, the Company employed 643 full-time employees, including corporate staff, supervisory personnel of construction projects, warranty service personnel for completed projects, as well as persons engaged in administrative, finance and accounting, engineering, sales and marketing activities.
The Company believes that its relations with its employees are good. Some employees of the subcontractors the Company utilizes are unionized, but none of the Company’s employees are union members.
Available Information
The Company’s Internet address is http://www.lyonhomes.com. The information contained on the Company's website is not incorporated by reference into this report and should not be considered part of this report. The Company makes available free of charge on or through its Internet website its annual report on Form 10-K, quarterly reports on Form 10-Q, current reports on Form 8-K, and any amendments to those reports filed or furnished pursuant to Section 13(a) or 15(d) of the
15
Securities Exchange Act of 1934 as soon as reasonably practicable after such material was electronically filed with, or furnished to, the Securities and Exchange Commission. The Company’s principal executive offices are located at 4695 MacArthur Court, 8th Floor, Newport Beach, California 92660 and its telephone number is (949) 833-3600. The Company was incorporated in the State of Delaware on July 15, 1999.
Item 1A. | Risk Factors |
An investment in the Company entails the following risks and uncertainties. These risk factors should be carefully considered when evaluating any investment in the Company. Any of these risks and uncertainties could cause the actual results
to differ materially from the results contemplated by the forward-looking statements set forth herein, and could otherwise have a significant adverse impact on the Company’s business, prospects, financial condition or results of operations. In addition, please read “Cautionary Note About Forward-Looking Statements” in this Annual Report on Form 10-K, where we describe additional uncertainties associated with our business and the forward-looking statements included in this Annual Report on Form 10-K.
Risks Related to Our Business
The homebuilding industry is cyclical and affected by changes in general economic, real estate and other business conditions that could reduce the demand for new homes and, as a result, negatively impact the Company's results of operations, financial condition and cash flows.
Certain economic, real estate and other business conditions that have significant effects on the homebuilding industry include:
• | employment levels and job and personal income growth; |
• | availability and pricing of financing for homebuyers; |
• | short and long-term interest rates; |
• | overall consumer confidence and the confidence of potential homebuyers in particular; |
• | demographic trends; |
• | changes in energy prices; |
• | housing demand from population growth, household formation and other demographic changes, among other factors; |
• | U.S. and global financial system, market volatility and credit market stability; |
• | private party and governmental residential consumer mortgage loan programs, and federal and state regulation of lending and appraisal practices; |
• | federal and state personal income tax rates and provisions, and government actions, policies, programs and regulations directed at or affecting the housing market (including the Tax Cuts and Jobs Act (“Tax Cuts and Job Act”), the Dodd-Frank Act, tax benefits associated with purchasing and owning a home, and the standards, fees and size limits applicable to the purchase or insuring of mortgage loans by government-sponsored enterprises and government agencies), the homebuilding industry, or construction activities; |
• | the supply of and prices for available new or existing homes, including lender-owned homes acquired through foreclosures and short sales and homes held for sale by investors and speculators, and other housing alternatives, such as apartments and other residential rental property; |
• | homebuyer interest in our current or new product designs and community locations, and general consumer interest in purchasing a home compared to choosing other housing alternatives; and |
• | real estate taxes. |
These above conditions, among others, are complex and interrelated. Adverse changes in such conditions may have a significant negative impact on our business, as they did during the recent downturn. The negative impact may be national in scope but may also negatively and acutely affect some of the regions or markets in which we operate more than others. In addition, adverse economic conditions in markets outside the U.S., such as Asia, India and Canada, as well as any restrictive economic policies in such overseas regions, may have an adverse impact on our financial results to the extent such factors decrease the amount of potential homebuyers from such regions in our markets. For example, the capital markets in China experienced a high level of volatility in recent years and such volatility and economic uncertainty, as well as capital constraints and restrictions imposed by the government, may adversely affect our sales to the extent any potential homebuyers become more hesitant, or unable, to purchase a home. When such adverse conditions affect any of our markets, those conditions could
16
have a proportionately greater impact on us than on some other homebuilding companies. We cannot predict their occurrence or severity, nor can we provide assurance that our strategic responses to their impacts would be successful.
Further, the prior recession and downturn in the homebuilding industry had a significant adverse effect on us. While we believe that the housing market began to recover in fiscal year 2012 from the significant slowdown and appears to continue to be recovering in most of the regions in which we operate, we cannot predict the pace or scope of the recovery, and we have experienced a more tempered home price appreciation and moderate sales pace during recent years, with a good deal of variation between our markets, following the steep rebound of home prices in 2012 and 2013. We cannot predict the duration or ultimate magnitude of any economic downturn or the continuation of the current recovery, nor can we provide assurance that should the recovery not continue, our response would be successful. The recent improvement in housing market conditions following a prolonged and severe housing downturn may not continue, and any slowing or reversal of the present housing recovery may materially and adversely affect our business and results of operations.
Shortages in the availability of subcontract labor may delay construction schedules and increase our costs.
The Company's business and results of operations are dependent on the availability and skill of subcontractors, as substantially all construction work is done by subcontractors with the Company acting as the general contractor. Accordingly, the timing and quality of construction depend on the availability and skill of the Company’s unaffiliated, third party subcontractors. As the homebuilding market returns to full capacity, we have previously experienced and may again experience skilled labor shortages. Throughout the homebuilding cycle, we have experienced shortages of skilled labor in a number of our markets which has led to increased labor costs and increased the cycle times of completion of home construction and our ability to convert home sales into closings. The cost of labor may also be adversely affected by shortages of qualified trades people, changes in laws and regulations relating to union activity and changes in immigration laws and trends in labor migration. We cannot be assured that there will be a sufficient supply of, or satisfactory performance by, these unaffiliated third-party consultants and subcontractors, which could have a material adverse effect on our business.
The residential construction industry also experiences labor shortages and disruptions from time to time, including: work stoppages, labor disputes, shortages in qualified trades people, lack of availability of adequate utility infrastructure and services, our need to rely on local subcontractors who may not be adequately capitalized or insured, and delays in availability of building materials. Additionally, the Company could experience labor shortages as a result of subcontractors going out of business or leaving the residential construction market due to low levels of housing production and volumes. Any of these circumstances could give rise to delays in the start or completion of the Company’s communities, increase the cost of developing one or more of the Company’s communities and increase the construction cost of the Company’s homes. To the extent that market conditions prevent the recovery of increased costs, including, among other things, subcontracted labor, finished lots, building materials, and other resources, through higher sales prices, the Company’s gross margins from home sales and results of operations could be adversely affected.
In addition, some of the subcontractors engaged by us are represented by labor unions or are subject to collective bargaining arrangements that require the payment of prevailing wages that are typically higher than normally expected on a residential construction site. A strike or other work stoppage involving any of our subcontractors could also make it difficult for us to retain subcontractors for their construction work. In addition, union activity could result in higher costs for us to retain our subcontractors. Access to qualified labor at reasonable rates may also be affected by other circumstances beyond our control, including: (i) shortages of qualified tradespeople, such as carpenters, roofers, electricians and plumbers; (ii) high inflation; (iii) changes in laws relating to employment and union organizing activity; (iv) changes in trends in labor force migration; and (v) increases in contractor, subcontractor and professional services costs. The inability to contract with skilled contractors and subcontractors at reasonable rates on a timely basis could materially and adversely affect our financial condition and operating results.
Further, the enactment and implementation of federal, state or local statutes, ordinances, rules or regulations requiring the payment of prevailing wages on private residential developments would materially increase our costs of development and construction, which could materially and adversely affect our results of operations and financial conditions.
Limitations on the availability and increases in the cost of mortgage financing can adversely affect demand for housing, which could materially and adversely affect us.
In general, housing demand is negatively impacted by the unavailability of mortgage financing, as a result of declining customer credit quality, tightening of mortgage loan underwriting standards and factors that increase the upfront or monthly cost of financing a home such as increases in interest rates, insurance premiums or limitations on mortgage interest deductibility. Most of our buyers finance their home purchases through one of our mortgage joint ventures or third-party lenders providing mortgage financing. If mortgage rates increase and, consequently, the ability of prospective buyers to finance
17
home purchases is adversely affected, home sales, gross margins and cash flow may also be adversely affected and the impact may be material. The U.S. Federal Open Market Committee has raised the target range for the federal funds rate several times in the last few years. We are unable to predict if, or when, the Federal Open Market Committee will announce further increases or the impact of any such increases on home mortgage interest rates, and mortgage interest rates during 2018 and beyond may prove to be more volatile than in recent years. Rising interest rates, decreased availability of mortgage financing or of certain mortgage programs, higher down payment requirements or increased monthly mortgage costs may lead to reduced demand for our homes. Increased interest rates can also hinder our ability to realize our backlog because our home purchase contracts provide homebuyers with a financing contingency. Financing contingencies may allow homebuyers to cancel their home purchase contracts in the event that they cannot arrange for adequate financing. Further, even if potential customers do not need financing, changes in the availability of mortgage products or increases in mortgage costs may make it harder for them to sell their current homes to potential buyers who need financing, which has in some cases led to lower demand for new homes. As a result, rising interest rates can decrease our home sales. Any of these factors could have a material adverse effect on the Company's business and results of operations.
In addition, as a result of the turbulence in the credit markets and mortgage finance industry, the federal government has taken on a significant role in supporting mortgage lending through its conservatorship of Fannie Mae and Freddie Mac, both of which purchase home mortgages and mortgage-backed securities originated by mortgage lenders, and its insurance of mortgages originated by lenders through the FHA and the VA. The availability and affordability of mortgage loans, including consumer interest rates for such loans, could be adversely affected by a curtailment or cessation of the federal government's mortgage-related programs or policies. The FHA may continue to impose stricter loan qualification standards, raise minimum down payment requirements, impose higher mortgage insurance premiums and other costs, and/or limit the number of mortgages it insures. Due to federal budget deficits, the U.S. Treasury may not be able to continue supporting the mortgage-related activities of Fannie Mae, Freddie Mac, the FHA and the VA at present levels, or it may revise significantly the federal government's participation in and support of the residential mortgage market. For example, the FHA significantly reduced the limits on loans eligible for insurance by the FHA in 2014, which has impacted the availability and cost of financing in our markets. Because the availability of Fannie Mae, Freddie Mac, FHA- and VA-backed mortgage financing is an important factor in marketing and selling many of our homes, any limitations, restrictions or changes in the availability of such government-backed financing could reduce our home sales, which could have a material adverse effect on the Company's business and results of operations.
Furthermore, in July 2010, the Dodd-Frank Wall Street Reform and Consumer Protection Act was signed into law. This legislation provides for a number of new requirements relating to residential mortgages and mortgage lending practices, many of which are to be developed further by implementing rules. These include, among others, minimum standards for mortgages and lender practices in making mortgages, limitations on certain fees and incentive arrangements, retention of credit risk and remedies for borrowers in foreclosure proceedings. The effect of such provisions on lending institutions will depend on the rules that are ultimately adopted. However, these requirements, as and when implemented, are expected to reduce the availability of loans to borrowers and/or increase the costs to borrowers to obtain such loans. Any such reduction could result in a decline of our home sales, which could have a material adverse effect on the Company's business and results of operations.
In February 2017, President Donald Trump issued an executive order requiring the Secretary of the Treasury to report on the extent to which existing laws, treaties, regulations, guidance, reporting and recordkeeping requirements, and other government policies promote six core principals established by the President. This executive order could result in significant changes to laws, regulations and policies affecting the availability and cost of mortgage financing, including the Dodd-Frank Wall Street Reform and Consumer Protection Act. We are unable to predict the impact, if any, of these potential changes on our home sales or financial performance.
Ultimately, if these trends continue and mortgage loans continue to be difficult or costly to obtain, the ability and willingness of prospective buyers to finance home purchases or to sell their existing homes would be adversely affected, which would adversely affect the Company’s results of operations through reduced home sales revenue, gross margin and cash flow.
Third-party lenders may not complete mortgage loan originations for the Company's homebuyers in a timely manner or at all, which can lead to cancellations and a lower backlog of orders, or to significant delays in the Company's delivering homes and recognizing revenues from those homes.
The Company's buyers may obtain mortgage financing for their home purchases from any lender or other provider of their choice, including one of the Company's mortgage joint ventures or an unaffiliated lender. If, due to credit or consumer lending market conditions, regulatory requirements, or other factors or business decisions, these lenders refuse or are unable to provide mortgage loans to the Company's buyers, the number of homes that the Company delivers, the Company's business and its consolidated financial statements may be materially and adversely affected.
18
Although the Company currently has a non-controlling ownership interest in two mortgage joint ventures, many of the Company's homebuyers will continue to seek mortgage loans from other lenders and be subject to those lenders’ ability to perform. The Company can provide no assurance as to other lenders’ ability or willingness to complete, in a timely fashion or at all, the mortgage loan originations they start for the Company's homebuyers. Such inability or unwillingness may result in mortgage loan funding issues that slow deliveries of the Company's homes and/or cause cancellations, which in each case may have a material adverse effect on the Company's business and its consolidated financial statements. In addition, recent changes to mortgage loan disclosure requirements to consumers may potentially delay lenders’, including the Company's mortgage joint ventures', completion of the mortgage loan funding process for borrowers. Specifically, the Consumer Financial Protection Bureau (CFPB) has adopted a rule governing the content and timing of mortgage loan disclosures to borrowers, commonly known as TILA-RESPA Integrated Disclosures or TRID, which became effective on October 3, 2015. Lender compliance with TRID could result in delays in loan closings and the delivery of homes that materially and adversely affect the Company's financial results and operations.
The Company may not have access to other capital resources to fund its liquidity needs, and difficulty in obtaining sufficient capital could result in increased costs and delays in completion of projects.
The homebuilding industry is capital-intensive and requires significant up-front expenditures to acquire land and begin development. There is no assurance that cash generated from the Company's operations, borrowings incurred under its credit agreements or project-level financing arrangements, or proceeds raised in capital markets transactions, will be sufficient to finance the Company's capital projects or otherwise fund its liquidity needs. If the Company's future cash flows from operations and other capital resources are insufficient to finance its capital projects or otherwise fund its liquidity needs, the Company may be forced to:
• | reduce or delay its business activities, land acquisitions and capital expenditures; |
• | sell assets; |
• | obtain additional debt or equity capital; or |
• | restructure or refinance all or a portion of its debt, including the notes, on or before maturity. |
These alternative measures may not be successful and the Company may not be able to accomplish any of these alternatives on a timely basis or on satisfactory terms, if at all. In addition, the terms of the Company's existing debt, including the notes and its credit agreements, will limit its ability to pursue these alternatives. Further, the Company may seek additional capital in the form of project-level financing from time to time. The availability of borrowed funds, especially for land acquisition and construction financing, may be greatly reduced nationally, and the lending community may require increased amounts of equity to be invested in a project by borrowers in connection with both new loans and the extension of existing loans. Land acquisition, development and construction activities may be adversely affected by any shortage or increased cost of financing or the unwillingness of third parties to engage in joint ventures. Any difficulty in obtaining sufficient capital for planned development expenditures could cause project delays and any such delay could result in cost increases and may adversely affect the Company’s sales and future results of operations and cash flows.
The Company’s business is geographically concentrated, and therefore, the Company’s sales, results of operations, financial condition and business would be negatively impacted by a decline in the general economy or the homebuilding industry in such regions.
The Company presently conducts all of its business in the following geographic areas within the Western U.S. region: Southern California, Northern California, Arizona, Nevada, Colorado, Washington and Oregon. The Company’s geographic concentration in the Western U.S. could adversely impact the Company if the homebuilding business in its current markets should decline, since there may not be a balancing opportunity in a stronger market in other geographic regions.
In addition, a prolonged economic downturn in one or more of these areas, or in any sector of employment on which the residents in such areas are substantially dependent, could have a material adverse effect on our business, prospects, liquidity, financial condition and results of operations, and a disproportionately greater impact on us than other homebuilders with more diversified operations. For example, much of the employment base in the Pacific Northwest and Northern California markets are dependent upon the technology sector, and Nevada the hospitality and gaming sector, and the local economy in certain Colorado markets is to a large extent driven by the oil and gas industry. Further, during the downturn from 2008 to 2010, land values, the demand for new homes and home prices declined substantially in California, negatively impacting the Company’s profitability and financial position. In addition, in the past the state of California has experienced severe budget shortfalls and taken measures such as raising taxes and increasing fees to offset the deficit. Accordingly, the Company's sales, results of
19
operations, financial condition and business would be negatively impacted by a decline in the economy, the job sector or the homebuilding industry in the Western U.S. regions in which our operations are concentrated.
Negative environmental impacts from, and legal and regulatory requirements in response to, severe and prolonged drought conditions in California, Arizona and Nevada could adversely affect our business and results of operations in those regions and our consolidated financial statements.
Certain areas in which we operate, particularly California and parts of Arizona and Nevada, have experienced extreme or exceptional drought conditions from time to time. In response to these conditions and concerns that they may continue for an extended period of time or worsen, government officials have taken, or have proposed taking, a number of steps to preserve potable water supplies. For instance, in 2014, the Governor of California proclaimed a Drought State of Emergency warning that drought conditions may place drinking water supplies at risk in many California communities. In April 2015, the Governor issued an executive order that, among other things, directs the State Water Resources Control Board to implement mandatory water reductions in cities and towns across California to reduce water usage by 25 percent and to prohibit irrigation with potable water outside newly constructed homes that is not delivered by drip or micro-spray systems. The Governor's order also calls on local water agencies to adjust their rate structures to implement conservation pricing, directs the Department of Water Resources to update the Model Water Efficient Landscape Ordinance, and directs the California Energy Commission to adopt emergency regulations establishing standards to improve the efficiency of water appliances such as toilets and faucets. In May 2015, the Water Board adopted emergency regulations mandating reductions in potable water use by urban water suppliers to achieve the 25% statewide reduction mandated by the Governor’s Executive Order. Based on continued drought conditions, in February 2016, the Water Board extended the emergency regulations through November 2016 but revised the regulations to provide for decreases in certain urban water suppliers’ reduction targets under specified conditions. In May 2016, the Water Board again extended the emergency regulations restricting urban water use through February 28, 2017 but adopted a “stress test” approach that mandates urban water suppliers to take actions to ensure at least a three year supply of water to their customers under drought conditions. In 2017, the California Governor lifted the drought proclamation for most of California and the Water Board rescinded its emergency restrictions. However, the Water Board maintained the urban water use reporting requirements and the prohibitions on wasteful water practices, and announced a plan to make water conservation a long-term way of life in California. These and other measures that are instituted to respond to drought conditions could cause us to incur additional costs, and there can be no assurance that the drought proclamation with not be reinstated. In addition, new home deliveries in some areas may be delayed or prevented due to the unavailability of water, even when we have obtained water rights for those projects.
To address the state’s mandate and their own available potable water supplies, local water agencies/suppliers could potentially restrict, delay the issuance of, or proscribe new water connection permits for homes or businesses, increase the costs for securing such permits, either directly or by requiring participation in impact mitigation programs, adopt higher efficiency requirements for water-using appliances or fixtures, limit or ban the use of water for construction activities, impose requirements as to the types of allowed plant material or irrigation for outdoor landscaping that are more strict than state standards and less desired by consumers, and/or impose fines and penalties for noncompliance with any such measures, all of which may adversely impact our new home deliveries. These local water agencies/suppliers could also increase rates and charges to residential users for the water they use, potentially increasing the cost of homeownership. We can offer no assurance whether, where and the extent to which these or additional conservation measures might be imposed by local water agencies or suppliers in California or by other federal, state or local lawmakers or regulators in Arizona, California and Nevada. However, if potable water supplies become further constrained due to persistent drought conditions, tighter conservation requirements may be imposed that could limit, impair or delay our ability to acquire and develop land, or build and deliver homes, increase our production costs, or cause the fair value of affected land or land interests in our inventory to decline, which could result in inventory impairment or land option contract abandonment charges, or both, or negatively affect the economies of, or diminish consumer interest in living in, water-constrained areas. These impacts, individually or collectively, could adversely affect our business and consolidated financial statements, and the effect could be material. Although California experienced significant snow and rainfall in the water year that ended September 2017, precipitation cannot be counted on to continue, and snowpack levels are subject to rapid reductions as seen in 2016 and in earlier periods. In addition, some parts of California are still experiencing water supply shortfalls and five years of drought have resulted in a significant water supply deficit, especially when it comes to California’s groundwater basins.
There have been substantial changes to the Internal Revenue Code, some of which could have an adverse effect on our business.
On December 22, 2017, the President signed into law the Tax Cuts and Jobs Act (the “Tax Cuts and Job Act”), which contains substantial changes to the Internal Revenue Code, effective January 1, 2018, some of which could have an adverse effect on our business. Prior to the Tax Cuts and Job Act’s enactment, significant expenses of owning a home, including mortgage loan interest costs and real estate taxes, generally were deductible expenses for the purpose of calculating an individual’s or household’s federal, and in some cases state, taxable income, subject to various limitations. The Tax Cuts and Job Act establishes new limits on the
20
federal tax deductions individual taxpayers may take on mortgage loan interest payments and on state and local taxes, including real estate taxes. The Tax Cuts and Job Act also raises the standard deduction. These changes could reduce the perceived affordability of homeownership, and therefore the demand for homes, and/or have a moderating impact on home sales prices, in areas with relatively high housing prices and/or high state and local income taxes and real estate taxes, including in certain of our served markets in California. As a result, some communities in our California operations could experience lower net orders and/or a tempering of average sales prices in future periods depending on how homebuyers react to the tax law changes under the Tax Cuts and Job Act. In addition, if the federal government further changes, or a state government changes, its income tax laws by eliminating or substantially reducing the income tax benefits associated with homeownership, the after-tax cost of owning a home could measurably increase. Any increases in personal income tax rates and/or tax deduction limits or restrictions enacted at the federal or state levels, including those enacted under the Tax Cuts and Job Act, could adversely impact demand for and/or selling prices of new homes, including our homes, and the effect on our consolidated financial statements could be adverse and material.
Increases in the Company’s cancellation rate could have a negative impact on the Company’s home sales revenue and home building gross margins.
During the years ended December 31, 2017, 2016, and 2015, the Company experienced cancellation rates of 15%, 16%, and 20%, respectively. Cancellations negatively impact the number of closed homes, net new home orders, home sales revenue and the Company’s results of operations, as well as the number of homes in backlog. Home order cancellations can result from a number of factors, including but not limited to declines or slow appreciation in the market value of homes, increases in the supply of homes available to be purchased, increased competition, higher mortgage interest rates, buyer's remorse, homebuyers’ inability to sell their existing homes, homebuyers’ inability to obtain suitable financing, including providing sufficient down payments, and adverse changes in economic conditions. Many of these factors are beyond the Company’s control. Increased levels of home order cancellations would have a negative impact on the Company’s home sales revenue and financial and operating results.
If we are not able to develop our communities successfully and in a timely manner, our revenues, financial condition and results of operations may be adversely impacted.
Before a community can open for sale, significant expenditures are required to acquire land, to obtain or renew permits, development approvals and entitlements and to construct significant portions of project infrastructure, amenities, model homes and sales facilities. There may be a lag between the time we acquire land or options for land for development or developed home sites and the time we can bring the communities to market and sell homes. We can also experience significant delays in obtaining permits, development approvals and entitlements, delays resulting from local, state or federal government approvals and utility company constraints or delays, or delays in a land seller's lot deliveries or from rights or claims asserted by third parties, which may be outside of our control. Additionally, we may also have to renew existing permits and there can be no assurances that these permits will be renewed. Lag time varies on a project-by-project basis depending on the complexity of the project, its stage of development when acquired, and the regulatory and community issues involved. As a result of these possible delays, we face the risk that demand for housing may decline during this period and we will not be able to open communities and sell homes at expected prices or within anticipated time frames or at all. The market value of home inventories, undeveloped land, options for land and developed home sites can fluctuate significantly because of changing market conditions. Each of these factors may have a significant negative impact on our financial and operational results.
Our long-term growth depends upon our ability to acquire land at reasonable prices.
The Company’s business depends on its ability to obtain land for the development of its residential communities at reasonable prices and with terms that meet its underwriting criteria. The Company’s ability to obtain land for new residential communities may be adversely affected by changes in the general availability of land, the willingness of land sellers to sell land at reasonable prices, competition for available land, availability of financing to acquire land, zoning, regulations that limit housing density, and other market conditions. If the supply of land appropriate for development of residential communities is limited because of these factors, or for any other reason, the number of homes that the Company builds and sells may decline. Additionally, the ability of the Company to open new projects could be impacted if the Company elects not to purchase lots under option contracts. To the extent that the Company is unable to purchase land timely or enter into new contracts for the purchase of land at reasonable prices, due to the lag time between the time the Company acquires land and the time the Company begins selling homes, the Company’s home sales revenue and results of operations could be negatively impacted and/or the Company could be required to scale back the Company’s operations in a given market.
Financial condition and results of operations may be adversely affected by any decrease in the value of land inventory, as well as by the associated carrying costs.
21
The Company continuously acquires land for replacement and expansion of land inventory within the markets in which it builds. The risks inherent in purchasing and developing land increase as consumer demand for housing decreases, and thus, the Company may have bought and developed land on which homes cannot be profitably built and sold. The Company employs measures to manage inventory risks which may not be successful.
We incur many costs even before we begin to build homes in a community, including costs of preparing land and installing roads, sewage and other utilities, as well as taxes and other costs related to ownership of the land on which we plan to build homes. In addition, inventory carrying costs can be significant and can result in losses in a poorly performing project or market, and the Company may have to sell homes at significantly lower margins or at a loss, which conditions may persist for extended periods of time. If the rate at which we sell and deliver homes slows or falls, or if we delay the opening of new home communities for sales due to adjustments in our marketing strategy or other reasons, each of which occurred throughout the previous housing downturn, we may incur additional costs and it will take a longer period of time for us to recover our costs, including the costs we incurred in acquiring and developing land.
Construction defect, home warranty, soil subsidence and building-related and other claims may be asserted against the Company in the ordinary course of business, and the Company may be subject to liability for such claims.
As a homebuilder, we have been, and continue to be, subject to construction defect, product liability and home warranty claims, including moisture intrusion and related claims, arising in the ordinary course of business, in addition to other potentially significant lawsuits, arbitration proceedings and other claims, including breach of contract claims, contractual disputes, personal injury claims and disputes related to defective title or property misdescription. These claims are common to the homebuilding industry and can be costly.
There can be no assurance that any current or future developments undertaken by us will be free from defects once completed. Construction defects may occur on projects and developments and may arise during a significant period of time after completion. Defects arising on a development attributable to us may lead to significant contractual or other liabilities. We also currently conduct a significant portion of our business in California, one of the most highly regulated and litigious jurisdictions in the United States, which imposes a ten year, strict liability tail on many construction liability claims and therefore, our potential losses and expenses due to litigation, new laws and regulations may be greater than those of our competitors who have smaller or no California operations. For these and other reasons, we establish warranty, claim and litigation reserves that we believe are adequate based on historical experience in the markets in which we operate and judgment of the risks associated with the types of homes, lots and land we sell. We also obtain certain indemnities from contractors and subcontractors generally covering claims related to damages resulting from faulty workmanship and materials and enroll a majority of these contractors and subcontractors in our Owner Controlled Insurance Program providing general liability coverage for these types of claims, subject to self-insured retentions.
With respect to certain general liability exposures, including construction defect claims, product liability claims and related claims, assessment of claims and the related liability and reserve estimation process is highly judgmental due to the complex nature of these exposures, with each exposure exhibiting unique circumstances. Furthermore, once claims are asserted for construction defects, it can be difficult to determine the extent to which the assertion of these claims will expand. Plaintiffs may seek to consolidate multiple parties in one lawsuit, bring suit on behalf of a homeowners association, or HOA, or seek class action status in some of these legal proceedings with potential class sizes that vary from case to case. Consolidated, HOA and class action lawsuits can be costly to defend and, if we were to lose any consolidated, HOA or certified class action suit, it could result in substantial liability.
In addition to difficulties with respect to claim assessment and liability and reserve estimation, some types of claims may not be covered by insurance or may exceed applicable coverage limits. Furthermore, contractual indemnities with contractors and subcontractors can be difficult to enforce, and we may also be responsible for applicable self-insured retentions with respect to our insurance policies, and we include our subcontractors on our general liability insurance and our ability to seek indemnity for insured claims is significantly limited. Furthermore, any product liability or warranty claims made against us, whether or not they are viable, may lead to negative publicity, which could impact our reputation and future home sales. In addition, manufactured product defects may result in delays, additional costs and remediation efforts which could have a negative impact on our new home deliveries and financial and operating results.
Although we have obtained insurance for construction defect claims subject to applicable self-insurance retentions, such policies may not be available or adequate to cover liability for damages, the cost of repairs, and/or the expense of litigation surrounding current claims, and future claims may arise out of events or circumstances not covered by insurance and not subject to effective indemnification agreements with our subcontractors.
22
For these reasons, although we actively manage our claims and litigation and actively monitor our reserves and insurance coverage, because of the uncertainties inherent in these matters, we cannot provide assurance that our insurance coverage, indemnity arrangements and reserves will be adequate to cover liability for any damages, the cost of repairs and litigation, or any other related expenses surrounding the current claims to which we are subject or any future claims that may arise. Such damages and expenses, to the extent that they are not covered by insurance or redress against contractors and subcontractors, could materially and adversely affect our consolidated financial statements and results.
Adverse weather and geological conditions may increase costs, cause project delays and reduce consumer demand for housing, all of which could materially and adversely affect the Company’s business, prospects, liquidity, financial condition or results of operations.
As a homebuilder, the Company is subject to numerous risks, many of which are beyond management’s control, such as droughts, floods, wildfires, landslides, soil subsidence, earthquakes and other weather-related and geologic events which could damage projects, cause delays in completion of projects, or reduce consumer demand for housing, and shortages in labor or materials, which could delay project completion and cause increases in the prices for labor or materials, thereby affecting the Company’s sales and profitability. Many of the Company’s projects are located in California, which has experienced significant earthquake activity and seasonal wildfires. Areas in Colorado have also been subjected to seasonal wildfires and soil subsidence, as well as periods of extremely cold weather and snow. Further, the Company operates in markets in the Pacific Northwest that experience high levels of rain, and there may be significant rainfall from a strong El Nino weather pattern in California and other Western U.S. regions. In addition to directly damaging the Company’s projects, earthquakes or other geologic events could damage roads and highways providing access to those projects, thereby adversely affecting the Company’s ability to market homes in those areas and possibly increasing the costs of completion.
There are some risks of loss for which the Company may be unable to purchase insurance coverage. For example, losses associated with landslides, earthquakes and other geologic events may not be insurable and other losses, such as those arising from terrorism, may not be economically insurable. A sizable uninsured loss could adversely affect the Company’s business, prospects, liquidity, results of operations or financial condition.
The Company may not be able to compete effectively against competitors in the homebuilding industry.
The homebuilding industry is highly competitive and there are relatively low barriers to entry. Homebuilders compete for, among other things, homebuying customers, desirable properties, financing, raw materials and skilled labor. The Company competes both with large homebuilding companies, some of which have greater financial, marketing and sales resources than the Company, and with smaller local builders. Our competitors may independently develop land and construct housing units that are substantially similar to our products and may employ increased sales incentives for such products. Many of these competitors also have long-standing relationships with subcontractors and suppliers in the markets in which we operate. We currently build in several of the top markets in the nation and, therefore, we expect to continue to face additional competition from new entrants into our markets. The Company also competes for sales with individual resales of existing homes and available rental housing. These competitive conditions can result in:
• | our delivering fewer homes; |
• | our selling homes at lower prices; |
• | our offering or increasing sales incentives, discounts or price concessions for our homes; |
• | our experiencing lower housing gross profit margins, particularly if we cannot raise our selling prices to cover increased land development, home construction or overhead costs; |
• | our selling fewer homes or experiencing a higher number of cancellations by homebuyers; |
• | impairments in the value of our inventory and other assets; |
• | difficulty in acquiring desirable land that meets our investment return or marketing standards, and in selling our interests in land that no longer meet such standards on favorable terms; |
• | difficulty in our acquiring raw materials and skilled management and trade labor at acceptable prices; |
• | delays in the development of land and/or the construction of our homes; and/or |
• | difficulty in securing external financing, performance bonds or letter of credit facilities on favorable terms. |
These competitive conditions may have a material adverse effect on our business and consolidated financial statements by decreasing our revenues, impairing our ability to successfully implement our current strategies, increasing our costs and/or diminishing growth in our local or regional homebuilding businesses.
23
In addition, existing and increased competition could prevent the Company from acquiring attractive land parcels on which to build homes or make such acquisitions more expensive, hinder its growth efforts, and lead to pricing pressures on the Company's homes that may adversely impact its margins and revenues. Furthermore, a number of the Company’s competitors have larger staffs, larger marketing organizations and substantially greater financial resources than those of the Company, and accordingly, they may be able to compete more effectively in one or more of the markets in which the Company operates. Many of these competitors also have longstanding relationships with subcontractors and suppliers in the markets in which the Company operates. The Company also competes for sales with individual resales of existing homes and with available rental housing.
Labor and raw materials and building supply shortages and price fluctuations could delay or increase the cost of home construction and reduce our sales and earnings.
The residential construction industry experiences serious material shortages from time to time, including shortages in labor, insulation, drywall, cement, steel and lumber. These labor and material shortages can be more severe during periods of strong demand for housing and during periods where the regions in which we operate experience natural disasters that have a significant impact on existing residential and commercial structures. From time to time, we have experienced volatile price swings in the cost of labor and materials, including in particular, the cost of labor, lumber, cement, steel and drywall. In addition, environmental and other regulations and import tariffs have had, and in the future could continue to have, an adverse impact on the cost of certain raw materials such as lumber. The Company generally is unable to pass on increases in construction costs to customers who have already entered into sales contracts, as those sales contracts generally fix the price of the homes at the time the contracts are signed, which may be in advance of the construction of the home. During the most recent economic downturn, a large number of qualified tradespeople went out of business or otherwise exited the market, which may limit capacity for new construction until the labor base grows. Additionally, the cost of petroleum products, which are used to deliver our materials, fluctuates and may be subject to increased volatility as a result of geopolitical events or accidents, which could affect the price of our important raw materials. Shortages could cause delays in and increase our costs of home construction, and increases in construction costs may, over time, erode the Company’s gross margins from home sales, particularly if pricing competition restricts the ability to pass on any additional costs of materials or labor, thereby decreasing gross margins from home sales, which in turn could have a material adverse effect on our business, financial condition and results of operations.
We may not be successful in integrating acquisitions or implementing our growth strategies.
In December 2012, we acquired Village Homes marking our entry into the Colorado market, and in August 2014, we closed the Polygon Acquisition, marking our entry into the Washington and Oregon markets, and we may in the future consider growth or expansion of our operations in our current markets or in new markets, whether through strategic acquisitions of homebuilding companies or otherwise. The magnitude, timing and nature of any future expansion will depend on a number of factors, including our ability to identify suitable additional markets and/or acquisition candidates, the negotiation of acceptable terms, our financial capabilities and general economic and business conditions. Our expansion into new or existing markets, whether through acquisition or otherwise, could have a material adverse effect on our business, prospects, liquidity, financial condition or results of operations, and any future acquisitions could result in the dilution of existing shareholders if we issue our common shares as consideration. Acquisitions also involve numerous risks, including difficulties in the assimilation of the acquired company’s operations, the incurence of unanticipated liabilities or expenses, the risk of impairing inventory and other assets related to the acquisition, the diversion of management’s attention and resources from other business concerns, risks associated with entering markets in which we have limited or no direct experience and the potential loss of key employees of the acquired company.
We may write-off intangible assets, such as goodwill.
We have recorded intangible assets, including goodwill in connection with the Polygon Acquisition. On an ongoing basis, we will evaluate whether facts and circumstances indicate any impairment of the value of intangible assets. As circumstances change, we cannot assure that the value of these intangible assets will be realized by us. If we determine that a significant impairment has occurred, we will be required to write-off the impaired portion of intangible assets, which could have a material adverse effect on our results of operations in the period in which the write-off occurs.
The Company’s success depends on key executive officers and personnel.
The Company’s success is dependent upon the efforts and abilities of its executive officers and other key employees, many of whom have significant experience in the homebuilding industry and in the Company’s divisional markets. In particular, the Company is dependent upon the services of William H. Lyon, Executive Chairman of the Board, and Matthew R. Zaist, Chief Executive Officer and President, as well as the services of the corporate senior management, division presidents
24
and division management teams and other personnel in the corporate office. The loss of the services or limitation in the availability of any of these executives or key personnel, for any reason, could hinder the execution of our business strategy and have a material adverse effect upon the Company’s business, prospects, liquidity, financial condition or results of operation. Further, such a loss could be negatively perceived in the capital markets.
Moreover, our employment agreements with certain members of senior management provide that if their employment terminates under certain circumstances, we may be required to pay them significant amounts of severance compensation. In addition, we have not obtained key man life insurance that would provide us with proceeds in the event of death or disability of any of our key personnel.
Power and natural resource shortages or price increases could have an adverse impact on operations.
Certain of the markets in which we operate, including California, have experienced power and resource shortages, including mandatory periods without electrical power, changes to water availability and significant increases in utility and resource costs. These conditions may cause us to incur additional costs and we may not be able to complete construction on a timely basis if they were to continue for an extended period of time. Shortages of natural resources, particularly water and power, may make it more difficult to obtain regulatory approval of new developments. The Company may incur additional costs and may not be able to complete construction on a timely basis if such power shortages and utility rate increases continue. Furthermore, power shortages and rate increases may adversely affect the regional economies in which the Company operates, which may reduce demand for housing. The Company’s operations may be adversely impacted if further rate increases and/or power shortages occur.
Increased insurance costs and reduced insurance coverages may affect the Company’s results of operations and increase the potential exposure to liability.
Recently, lawsuits have been filed against builders asserting claims of personal injury and property damage, including arising from the presence of mold or other materials in residential dwellings. Some of these lawsuits have resulted in substantial monetary judgments or settlements against these builders. The Company’s insurance may not cover all of the potential claims, including personal injury claims, or such coverage may become prohibitively expensive. If the Company is unable to obtain adequate insurance coverage, a material adverse effect on the Company’s business, prospects, liquidity, results of operations or financial condition could result.
The costs of insuring against construction defect, product liability and director and officer claims are substantial and the cost of insurance for the Company’s operations has risen, deductibles and retentions have increased and the availability of insurance has diminished. Significant increases in the cost of insurance coverage or significant limitations on coverage could have a material adverse effect on the Company’s business, prospects, liquidity, results of operations or financial condition from such increased costs or from liability for significant uninsurable or underinsured claims.
We are party to two joint venture arrangements to provide certain mortgage related services to our customers and other homebuyers, which ventures are subject to extensive government regulations.
In connection with the Polygon Acquisition we acquired a non-controlling interest in a mortgage services joint venture to provide services, in part, to our home buyers in our Washington and Oregon divisions, and we also formed a second mortgage services joint venture, in which we also hold a non-controlling interest, to provide services, in part, to our home buyers in our operating divisions in California, Nevada, Arizona and Colorado. The business operations of these mortgage joint ventures are heavily regulated and subject to the rules and regulations promulgated by a number of governmental and quasi-governmental agencies. The mortgage industry remains under intense scrutiny and continues to face increasing regulation at the federal, state and local level. If either of the ventures are determined to have violated federal or state regulations, they may face the loss of licenses or other required approvals or could be subject to fines, penalties, civil actions or could be required to suspend their activities, and we may face the same consequences for any violations of regulations applicable to us, each of which could have an adverse effect on the ventures’, and our, reputation, results and operations. In addition, to the extent that either of the ventures were faced with any claims for losses or liabilities arising from the services performed that were in excess of any reserve levels, then there may be an adverse impact on the ventures’ financial condition or ability to operate, or cause us to recognize losses with respect to our equity interest in the ventures, or cause our customers to seek mortgage loans from other lenders and/or experience mortgage loan funding issues that could delay our delivering homes to them and/or cause them to cancel their home purchase contracts with us.
We could be responsible for employment-related liabilities with respect to our contractors’ employees.
Several other homebuilders have received inquiries from regulatory agencies concerning whether homebuilders using contractors are deemed to be employers of the employees of such contractors under certain circumstances. Although contractors
25
are independent of the homebuilders that contract with them under normal management practices and the terms of trade contracts and subcontracts within the homebuilding industry, if regulatory agencies reclassify the employees of contractors as employees of homebuilders, homebuilders using contractors could be responsible for wage and hour labor laws, workers’ compensation and other employment-related liabilities of their contractors. Even if we are not deemed to be joint employers with our contractors, we may be subject to legislation that requires us to share liability with our contractors for the payment of wages and the failure to secure valid workers’ compensation coverage. In addition, California’s Governor recently signed legislation, AB 1701, that will require direct construction contractors to assume and be liable for unpaid wages, fringe or other benefit payments or contributions, including interest, incurred by a subcontractor at any tier for contracts entered into on or after January 1, 2018. While we are still analyzing the ultimate impact this legislation could have on our business, we believe it may result in increased costs.
Inflation could adversely affect the Company’s business, prospects, liquidity, financial condition or results of operations, particularly in a period of oversupply of homes or declining home sale prices.
Inflation can adversely affect the Company by increasing costs of land, materials and labor. However, the Company may be unable to offset these increases with higher sales prices. In addition, inflation is often accompanied by higher interest rates, which have a negative impact on housing demand. In such an environment, the Company may be unable to raise home prices sufficiently to keep up with the rate of cost inflation, and, accordingly, its margins could decrease. Furthermore, if we need to lower the price of our homes to meet demand, the value of our land inventory may decrease. Moreover, with inflation, the costs of capital can increase and purchasing power of the Company’s cash resources can decline.
The Company’s business is seasonal in nature and quarterly operating results can fluctuate.
The Company’s quarterly operating results generally fluctuate by season. The Company typically achieves its highest new home sales orders in the spring and summer, although new homes sales order activity is also highly dependent on the number of active selling communities and the timing of new community openings. Because it typically takes the Company four to eight months to construct a new home, the Company delivers a greater number of homes in the second half of the calendar year as sales orders convert to home deliveries. As a result, the Company’s revenues from homebuilding operations are typically higher in the second half of the year, particularly in the fourth quarter, and the Company generally experiences higher capital demands in the first half of the year when it incurs construction costs. If, due to construction delays or other causes, the Company cannot close its expected number of homes in the second half of the year, the Company’s financial condition and full year results of operations may be adversely affected.
The Company may be unable to obtain suitable bonding for the development of its communities.
The Company provides bonds in the ordinary course of business to governmental authorities and others to ensure the completion of its projects and/or in support of obligations to build community improvements such as roads, sewers, water systems and other utilities, and to support similar development activities by certain of our joint ventures. As a result of the deterioration in market conditions during the recent downturn, surety providers became increasingly reluctant to issue new bonds and some providers were requesting credit enhancements (such as cash deposits or letters of credit) in order to maintain existing bonds or to issue new bonds, which trends may continue. The Company may also be required to provide performance bonds and/or letters of credit to secure our performance under various escrow agreements, financial guarantees and other arrangements. If the Company is unable to obtain performance bonds and/or letters of credit when required or the cost or operational restrictions or conditions imposed by issuers to obtain them increases significantly, the Company may not be able to develop or may be significantly delayed in developing a community or communities and/or may incur significant additional expenses, and, as a result, the Company’s business, prospects, liquidity, financial condition or results of operation could be materially and adversely affected.
The Company is the managing member in certain joint venture limited liability companies and may become a managing member or general partner in future joint ventures, and therefore may be liable for joint venture obligations.
Certain of the Company’s active joint ventures, or JVs, are organized as limited liability companies. The Company is the managing member in some of these and may serve as the managing member or general partner, in the case of a limited partnership JV, in future JVs. As a managing member or general partner, the Company may be liable for a JV’s liabilities and obligations should the JV fail or be unable to pay these liabilities or obligations. These risks include, among others, that a partner in the JV may fail to fund its share of required capital contributions, that a partner may make poor business decisions or delay necessary actions, or that a partner may have economic or other business interests or goals that are inconsistent with our own.
26
Fluctuations in real estate values may require us to write–down the book value of our real estate assets.
The homebuilding industry is subject to significant variability and fluctuations in real estate values. As a result, the Company may be required to write-down the book value of certain real estate assets in accordance with U.S. generally accepted accounting principles, or U.S. GAAP, and some of those write downs could be material. Any material write–downs of assets could have a material adverse effect on our business, prospects, liquidity, financial condition or results of operations.
The Company assesses its projects on a quarterly basis, when indicators of impairment exist. Indicators of impairment include a decrease in demand for housing due to soft market conditions, competitive pricing pressures which reduce the average sales price of homes, which includes sales incentives for home buyers, sales absorption rates below management expectations, a decrease in the value of the underlying land and a decrease in projected cash flows for a particular project.
Because real estate investments are relatively illiquid, our ability to promptly sell one or more properties for reasonable prices in response to changing economic, financial and investment conditions may be limited and we may be forced to hold non-income producing properties for extended periods of time.
Real estate investments are relatively difficult to sell quickly. As a result, our ability to promptly sell one or more properties in response to changing economic, financial and investment conditions is limited and we may be forced to hold non-income producing assets for an extended period of time. We cannot predict whether we will be able to sell any property for the price or on the terms that we set or whether any price or other terms offered by a prospective purchaser would be acceptable to us. We also cannot predict the length of time needed to find a willing purchaser and to close the sale of a property.
Governmental laws and regulations may increase the Company’s expenses, limit the number of homes that the Company can build or delay completion of projects.
The Company is subject to numerous local, state, federal and other statutes, ordinances, rules and regulations concerning zoning, development, building design, construction and similar matters which impose restrictive zoning and density requirements in order to limit the number of homes that can eventually be built within the boundaries of a particular area, as well as governmental taxes, fees and levies on the acquisition and development of land parcels. These regulations often provide broad discretion to the administering governmental authorities as to the conditions we must meet prior to being approved, if approved at all. We are subject to determinations by these authorities as to the adequacy of water and sewage facilities, roads and other local services. New housing developments may also be subject to various assessments for schools, parks, streets, other public improvements, other development or impact fees, and fees imposed on developers to provide low- and moderate-income housing. Although we do not typically purchase land that is not entitled, to the extent that projects are not entitled, purchased lands may be subjected to periodic delays, changes in use, less intensive development or elimination of development in certain specific areas due to government regulations. The Company may also be subject to periodic delays, may be precluded entirely from developing in certain communities or may otherwise be restricted in our business activities due to building moratoriums or “slow-growth” or “no-growth” initiatives that could be implemented in the future in the states in which the Company operates. Such moratoriums can occur prior or subsequent to commencement of our operations, without notice or recourse. Local and state governments also have broad discretion regarding the imposition of development fees for projects in their jurisdiction. Projects for which the Company has received land use and development entitlements or approvals may still require a variety of other governmental approvals and permits during the development process and can also be impacted adversely by unforeseen health, safety, and welfare issues, which can further delay these projects or prevent their development. As a result of any of these factors, home sales could decline, costs increase, and projects could be materially delayed, any of which could negatively affect the Company’s business, prospects, liquidity, financial condition and results of operations.
The Company is subject to environmental laws and regulations, which may increase costs, limit the areas in which the Company can build homes and delay completion of projects.
The Company is also subject to a variety of local, state, federal and other statutes, ordinances, rules and regulations concerning the environment. The particular environmental laws which apply to any given homebuilding site vary according to the site’s location, its environmental conditions and the present and former uses of the site, as well as adjoining properties. Environmental laws and conditions may result in delays, may cause the Company to incur substantial compliance and other costs, including significant fines and penalties for any violation, and can prohibit or severely restrict homebuilding activity in environmentally sensitive regions or areas, which could negatively affect the Company’s results of operations.
Under various environmental laws, current or former owners of real estate, as well as certain other categories of parties, may be required to investigate and clean up hazardous or toxic substances or petroleum product releases, and may be held liable to a governmental entity or to third parties for property damage and for investigation and clean-up costs incurred by such
27
parties in connection with the contamination. In addition, in those cases where an endangered species is involved, environmental rules and regulations can result in the elimination of development in identified environmentally sensitive areas.
We may become subject to litigation, which could materially and adversely affect us.
In the future, we may become subject to litigation, including claims relating to our operations, breach of contract, securities offerings or otherwise in the ordinary course of business. Some of these claims may result in significant defense costs and potentially significant judgments against us, some of which are not, or cannot be, insured against. We cannot be certain of the ultimate outcomes of any claims that may arise in the future. Resolution of these types of matters against us may result in significant fines, judgments or settlements, which, if uninsured, or if the fines, judgments and settlements exceed insured levels, could adversely impact our earnings and cash flows, thereby materially and adversely affecting us. Litigation or the resolution of litigation may affect the availability or cost of our insurance coverage, which could materially and adversely impact us, expose us to increased risks that would be uninsured, and materially and adversely impact our ability to attract directors and officers.
Changes in global or regional climate conditions and governmental response to such changes may limit, prevent or increase the costs of our planned or future growth activities.
Projected climate change, if it occurs, may exacerbate the scarcity or presence of water and other natural resources in affected regions, which could limit, prevent or increase the costs of residential development in certain areas. In addition, a variety of new legislation is being enacted, or considered for enactment, at the federal, state and local level relating to energy and climate change, and as climate change concerns continue to grow, legislation and regulations of this nature are expected to continue. This legislation relates to items such as carbon dioxide emissions control and building codes that impose energy efficiency standards. Government mandates, standards or regulations intended to mitigate or reduce greenhouse gas emissions or projected climate change impacts could result in prohibitions or severe restrictions on land development in certain areas, increased energy and transportation costs, and increased compliance expenses and other financial obligations to meet permitting or land development or home construction-related requirements that we may be unable to fully recover (due to market conditions or other factors), any of which could cause a reduction in our homebuilding gross margins and materially and adversely affect our financial performance. Energy-related initiatives could similarly affect a wide variety of companies throughout the United States and the world, and because our results of operations are heavily dependent on significant amounts of raw materials, these initiatives could have an indirect adverse impact on our financial performance to the extent the manufacturers and suppliers of our materials are burdened with expensive cap and trade or other climate related regulations.
As a result, climate change impacts, and laws and land development and home construction standards, and/or the manner in which they are interpreted or implemented, to address potential climate change concerns could increase our costs and have a long-term adverse impact on our operating results and financial condition. This is a particular concern in the western United States, where some of the most extensive and stringent environmental laws and residential building construction standards in the country have been enacted, and where our business operations are geographically concentrated.
Information technology failures, data security breaches and other similar adverse events could harm our business.
We rely on information technology and other computer resources to perform important operational and marketing activities as well as to maintain our business and employee records and financial data. Our computer systems are subject to damage or interruption from power outages, computer attacks by hackers, viruses, catastrophes, hardware and software failures and breach of data security protocols by our personnel. Although we have implemented administrative and technical controls and taken other actions to minimize the risk of cyber incidents and otherwise protect our information technology, computer intrusion efforts are becoming increasingly sophisticated and even the controls that we have installed might be breached. Further, many of these computer resources are provided to us or are maintained on our behalf by third-party service providers pursuant to agreements that specify certain security and service level standards, but which are ultimately outside of our control. If we were to experience a significant period of disruption in our information technology systems that involve interactions with customers or suppliers, it could result in the loss of sales and customers and significant incremental costs, which could adversely affect our business. Additionally, security breaches of our information technology systems could result in the misappropriation or unauthorized disclosure of proprietary, personal and confidential information, which could result in significant financial or reputational damage to us.
A major health and safety incident relating to our business could be costly in terms of potential liabilities and reputational damage.
28
Building sites are inherently dangerous, and operating in the homebuilding and land development industry poses certain inherent health and safety risks to those working at such sites. Due to health and safety regulatory requirements and the number of our projects, health and safety performance is critical to the success of all areas of our business. Any failure in health and safety performance may result in penalties for non-compliance with relevant regulatory requirements or litigation, and a failure that results in a major or significant health and safety incident is likely to be costly in terms of potential liabilities incurred as a result. Such a failure could generate significant negative publicity and have a corresponding impact on our reputation, our relationships with relevant regulatory agencies, governmental authorities and local communities, and our ability to win new business, which in turn could materially and adversely affect our operating results and financial condition.
Risks Related to the Pending RSI Acquisition
The Company cannot assure you that the proposed RSI Acquisition will be completed.
There are a number of risks and uncertainties relating to the RSI Acquisition. For example, the RSI Acquisition may not be completed, or may not be completed in the time frame, on the terms or in the manner currently anticipated, as a result of a number of factors, including, among other things, the failure of one or more of the conditions to closing in the acquisition agreements. There can be no assurance that the conditions to closing of the RSI Acquisition will be satisfied or waived or that other events will not intervene to delay or result in the failure to close the RSI Acquisition. The acquisition agreements may be terminated by the parties thereto under certain circumstances, including, without limitation, if the RSI Acquisition has not been completed by April 1, 2018, assuming all conditions to closing have been satisfied or waived. Any delay in closing, or a failure to close, could have a negative impact on our business and the trading prices of our securities.
The Company will incur significant transaction and acquisition-related integration costs in connection with the RSI Acquisition.
Although we anticipate achieving synergies in connection with the RSI Acquisition, we also expect to incur costs implementing such cost-saving measures. We cannot currently identify the timing, nature and amount of all such costs. Although we believe that the elimination of duplicative costs, as well as the realization of other efficiencies related to the integration of the businesses, will offset certain incremental transaction- and acquisition-related costs over time, this net benefit may not be achieved in the near term, or at all. We have identified some, but not all, of the actions necessary to achieve our anticipated cost and operational savings. Accordingly, the cost and operational savings may not be achievable in our anticipated amount or timeframe or at all.
The Company and RSI will be subject to business uncertainties before and after the consummation of the RSI Acquisition that could adversely affect our and its business.
Uncertainty about the effect of the RSI Acquisition on employees and customers may have an adverse effect on us and RSI. Although we and RSI intend to take actions to reduce any adverse effects, these uncertainties may impair our and their ability to attract, retain and motivate key personnel until the RSI Acquisition is completed and for a period of time thereafter. These uncertainties could cause customers, suppliers and others that deal with us and RSI to seek to change existing business relationships with us and RSI.
Additionally, employee retention could be reduced before or after the consummation of the RSI Acquisition, as employees may experience uncertainty about their future roles or encounter difficulties in the integration process. The successful integration of RSI after completion of the RSI Acquisition will depend, in part, upon our ability to retain its key employees following the RSI Acquisition. If, despite our and RSI’s retention efforts, key employees depart before or after consummation of the RSI Acquisition, our business could be harmed and we may not realize all of the expected benefits of the RSI Acquisition.
Prior to the RSI Acquisition, RSI was a privately-held company and its new obligations of being a part of a public company may require significant resources and management attention.
Upon consummation of the RSI Acquisition, RSI and the other entities being acquired from RSI will become subsidiaries of our consolidated Company, and will need to comply with the Sarbanes-Oxley Act of 2002 and the rules and regulations subsequently implemented by the SEC and other regulatory bodies. We will need to ensure that RSI establishes and maintains effective disclosure controls as well as internal controls and procedures for financial reporting, and such compliance efforts may be costly and may divert the attention of management.
29
The Company's assumptions relating to the RSI Acquisition may prove to be materially inaccurate.
We have made, or will make, certain assumptions relating to the RSI Acquisition, including, for example:
• | projections of RSI’s future revenues and other metrics of financial performance; |
• | the amount of goodwill and intangibles that will result from the acquisition; |
• | purchase accounting adjustments that we expect will be recorded in our financial statements in connection with the RSI Acquisition in future periods; |
• | acquisition costs, including transaction and integration costs; and |
• | other financial and strategic rationales and risks of the acquisition. |
These assumptions, when made, may turn out to be materially inaccurate, including for reasons beyond our control. If these assumptions are incorrect or our valuation consultants do not concur with our judgments and require that we change or modify our assumptions, such change or modification could have a material adverse effect on our financial condition or results of operations or our financial results.
Risks Related to Our Capital Structure
We have substantial outstanding indebtedness and may incur additional debt in the future.
We are highly leveraged. At December 31, 2017, the total outstanding principal amount of our debt was approximately $1,030.2 million. In addition, we have the ability to incur additional indebtedness under our Revolving Credit Facility, subject to a borrowing base formula, and under our project-level financing facilities. As of December 31, 2017, we would have had up to approximately $278.4 million of additional borrowing capacity under our Revolving Credit Facility and our project-level financing facilities. Moreover, the terms of the indentures governing our outstanding Senior Notes and the Revolving Credit Facility permit us to incur additional debt, in each case, subject to certain restrictions. In addition, we intend to fund a portion of the purchase price of the RSI Acquisition with debt financing, which would increase our level of indebtedness. Our high level of indebtedness could have detrimental consequences, including the following:
• | our ability to obtain additional financing as needed for working capital, land acquisition costs, building costs, other capital expenditures, or general corporate purposes, or to refinance existing indebtedness before its scheduled maturity, may be limited; |
• | we will need to use a substantial portion of cash flow from operations to pay interest and principal on our indebtedness, which will reduce the funds available for other purposes; |
• | if we are unable to comply with the terms of the agreements governing our indebtedness, the holders of that indebtedness could accelerate that indebtedness and exercise other rights and remedies against us; |
• | if we have a higher level of indebtedness than some of our competitors, it may put us at a competitive disadvantage and reduce our flexibility in planning for, or responding to, changing conditions in the industry, including increased competition; |
• | the terms of any refinancing may not be as favorable as the debt being refinanced; and |
• | some of our current debt has, and any additional debt we incur may have, a floating rate of interest. The FOMC recently raised the target range for the federal funds rate. We are unable to predict if, or when, the FOMC will announce further increases and the impact of any such increases on our floating rate interest rates. |
We cannot be certain that cash flow from operations will be sufficient to allow us to pay principal and interest on our debt, support operations and meet other obligations. If we do not have the resources to meet these and other obligations, we may be required to refinance all or part of our outstanding debt, sell assets or borrow more money. We may not be able to do so on acceptable terms, in a timely manner, or at all. If we are unable to refinance our debt on acceptable terms, we may be forced to dispose of our assets on disadvantageous terms, potentially resulting in losses. Defaults under our debt agreements could have a material adverse effect on our business, prospects, liquidity, financial condition or results of operations.
The agreements governing our debt impose significant operating and financial restrictions, which may prevent us from capitalizing on business opportunities and taking some corporate actions.
30
The agreements governing our debt impose significant operating and financial restrictions. These restrictions limit our ability, among other things, to:
• | incur or guarantee additional indebtedness or issue certain equity interests; |
• | pay dividends or distributions, repurchase equity or prepay subordinated debt; |
• | make certain investments; |
• | sell assets; |
• | incur liens; |
• | create certain restrictions on the ability of restricted subsidiaries to transfer assets; |
• | enter into transactions with affiliates; |
• | create unrestricted subsidiaries; and |
• | consolidate, merge or sell all or substantially all of our assets. |
As a result of these restrictions, our ability to obtain additional financing as needed for working capital, land acquisition costs, building costs, other capital expenditures, or general corporate purposes, or to refinance existing indebtedness before its scheduled maturity, may be limited. In addition, our Revolving Credit Facility contains a maximum leverage ratio that remained at 62.5% from December 31, 2016 through and including December 30, 2017, and decreased to 60% on the last day of the 2017 fiscal year and will remain at 60% thereafter. Our leverage ratio as of December 31, 2017, as calculated under the Revolving Credit Facility, was approximately 51.7%. Failure to have sufficient borrowing base availability in the future or to be in compliance with our maximum leverage ratio under the Revolving Credit Facility could have a material adverse effect on our operations and financial condition.
In addition, we may in the future enter into other agreements refinancing or otherwise governing indebtedness which impose yet additional restrictions and covenants, including covenants limiting our ability to incur additional debt, make certain investments, reduce liquidity below certain levels, make distributions to our stockholders and otherwise affect our operating policies. These restrictions may adversely affect our ability to finance future operations or capital needs or to pursue available business opportunities. A breach of any of these covenants could result in a default in respect of the related indebtedness. If a default occurs, the relevant lenders could elect to declare the indebtedness, together with accrued interest and other fees, to be immediately due and payable and proceed against any collateral securing that indebtedness.
A breach of the covenants under the indentures governing our notes or any of the other agreements governing our indebtedness could result in an event of default under the indentures governing our notes or other such agreements.
A default under the indentures governing our outstanding Senior Notes, Revolving Credit Facility or other agreements governing our indebtedness may allow our creditors to accelerate the related debt and may result in the acceleration of any other debt to which a cross-acceleration or cross-default provision applies. In addition, an event of default under the credit agreement governing the Revolving Credit Facility would permit the lenders thereunder to terminate all commitments to extend further credit under the Revolving Credit Facility. Furthermore, if we were unable to repay the amounts due and payable under our Revolving Credit Facility or other future secured credit facilities, those lenders could proceed against the collateral granted to them to secure that indebtedness. In the event our lenders or the holders of our notes accelerate the repayment of our borrowings, we cannot assure that we and our subsidiaries would have sufficient assets to repay such indebtedness. As a result of these restrictions, we may be:
• | limited in how we conduct our business; |
• | unable to raise additional debt or equity financing to operate during general economic or business downturns; or |
• | unable to compete effectively or to take advantage of new business opportunities. |
31
These restrictions may affect our ability to grow in accordance with our plans.
Potential future downgrades of our credit ratings could adversely affect our access to capital and could otherwise have a material adverse effect on us.
In the past, rating agencies have downgraded our corporate credit rating due to the deterioration in our homebuilding operations, credit metrics and other earnings-based metrics, as well as our high leverage and a significant decrease in our tangible net worth. These ratings and our current credit condition affect, among other things, our ability to access new capital, especially debt, and negative changes in these ratings may result in more stringent covenants and higher interest rates under the terms of any new debt. Our credit ratings could be downgraded or rating agencies could issue adverse commentaries in the future, which could have a material adverse effect on our business, results of operations, financial condition and liquidity. In particular, a weakening of our financial condition, including a significant increase in our leverage or decrease in our profitability or cash flows, could adversely affect our ability to obtain necessary funds, result in a credit rating downgrade or change in outlook, or otherwise increase our cost of borrowing.
We may not have access to other capital resources to fund our liquidity needs.
There is no assurance that cash generated from our operations, proceeds raised in our capital markets transactions, or borrowings incurred under our credit agreements will be sufficient to finance our capital projects or otherwise fund our liquidity needs. If our future cash flows from operations and other capital resources are insufficient to finance our capital projects or otherwise fund our liquidity needs, we may be forced to:
• | reduce or delay our business activities and capital expenditures; |
• | sell assets; |
• | obtain additional debt or equity capital; or |
• | restructure or refinance all or a portion of our debt, including the notes, on or before maturity. |
These alternative measures may not be successful and we may not be able to accomplish any of these alternatives on a timely basis or on satisfactory terms, if at all. In addition, the terms of our debt, including the notes and our credit agreements, will limit our ability to pursue these alternatives.
Risks Related to Ownership of Our Class A Common Stock
Concentration of ownership of the voting power of our capital stock may prevent other stockholders from influencing corporate decisions and create perceived conflicts of interest.
Our common stock consists of two classes: Class A and Class B. Holders of Class A Common Stock are entitled to one vote per share, and holders of Class B Common Stock are entitled to five votes per share, on all matters entitled to be voted on by our common stockholders. Based on the number of shares outstanding as of February 14, 2018, William H. Lyon, individually or through affiliated entities, holds approximately 50% of the voting power of the Company's common stock, assuming exercise in full of the warrant to purchase additional shares of Class B Common Stock, through ownership of 100% of the outstanding Class B Common Stock, a warrant to purchase 1,907,550 additional shares of Class B Common Stock and ownership of shares of Class A Common Stock. In addition, our Amended and Restated Certificates of Incorporation provides for certain preemptive rights to the holders of our Class B Common Stock, which would permit such holders to purchase additional shares of Class B Common Stock up to a certain amount in order to preserve their then-current voting power in the event of certain issuances of our Class A Common Stock, subject to certain exceptions.
William H. Lyon may have interests that differ from yours and may vote in a way with which you disagree and which may be adverse to your interests. This ownership concentration may adversely impact the trading of our capital stock because of a perceived conflict of interest that may exist, thereby depressing the value of our capital stock.
Future sales of our common stock by existing stockholders could cause the price of our Class A Common Stock to decline.
32
Any sales of a substantial number of shares of our common stock in the public market, or the perception that such sales might occur, may cause the market price for our Class A Common Stock to decline. We had 34,267,510 shares of Class A Common Stock and 4,817,394 shares of Class B Common Stock outstanding as of February 14, 2018, excluding 1,907,550 shares of Class B Common Stock issuable upon the exercise of a warrant held by the holder of our Class B Common Stock and shares of unvested restricted stock and Class A Common Stock issuable upon exercise of outstanding stock options. All of these shares, other than the shares of Class B Common Stock beneficially owned by William H. Lyon through Lyon Shareholder 2012, LLC, and certain shares of Class A Common Stock held by our directors and officers and other “affiliates”, as defined in Rule 144 of the Securities Act, or Rule 144, are freely tradeable without restriction under the Securities Act. Based on current ownership trends, the Company believes that Stockholders holding up to approximately 4,817,394 shares of our common stock as of February 14, 2018, which includes the Class A Common Stock that may be issued upon conversion of the outstanding Class B Common Stock on a one-to-one basis, have exercised their registration rights to include their shares of common stock in registration statements related to our securities, including our Registration Statement on Form S-3 (File No. 333-194517) that was declared effective by the Securities and Exchange Commission on March 20, 2014. Shares of common stock sold under this shelf registration statement can be freely sold in the public market, and even if not sold pursuant to an effective registration statement, shares held by affiliates may be sold under Rule 144 subject to the volume and manner of sale, and other, requirements thereunder. Any sale of a large number of shares of common stock by our existing stockholders could reduce the trading price of our common stock. In addition, investors would incur dilution upon the exercise of stock options or other equity-based awards under our equity incentive plan, and upon any exercise of preemptive rights granted pursuant to our Certificate of Incorporation to holders of our Class B Common Stock upon the issuance of Class A Common Stock in potential future offerings. We may issue equity securities in the future for a number of reasons, including to finance our operations and business strategy, to adjust our ratio of debt to equity, to satisfy our obligations upon exercise of outstanding options or for other reasons. Any such future issuances of our common stock or convertible or other equity-linked securities will dilute the ownership interest of the holders of our Class A Common Stock. We cannot predict the size of future issuances of our common stock or other equity-related securities or the effect, if any, that they may have on the market price of our Class A Common Stock.
We do not currently intend to pay dividends on our common stock.
We have not declared or paid any cash dividends on our common stock and we do not plan to do so in the foreseeable future. Any determination to pay dividends to the holders of our common stock will be at the discretion of our board of directors. Further, the payment of cash dividends is restricted under the terms of the agreements governing our debt instruments and may be restricted under the terms of our future debt agreements. Therefore, you are not likely to receive any dividends on your common stock for the foreseeable future.
The price of our Class A Common Stock is subject to volatility related or unrelated to our operations.
The market price of the Class A Common Stock may fluctuate substantially due to a variety of factors, including:
• | actual or anticipated variations in our quarterly operating results; |
• | changes in market valuations of similar companies; |
• | adverse market reaction to the level of our indebtedness; |
• | market reaction to our capital markets transactions; |
• | additions or departures of key personnel; |
• | actions by stockholders; |
• | increased volatility as a result of the relative size of our public float; |
• | speculation in the press or investment community; |
• | general market, economic and political conditions, including an economic slowdown or dislocation in the global credit markets; |
• | our operating performance and the performance of other similar companies; |
• | changes in accounting principles; and |
• | passage of legislation or other regulatory developments that adversely affect us or the homebuilding industry. |
33
In addition, the stock market itself is subject to extreme price and volume fluctuations. This volatility has had a significant effect on the market price of securities issued by many companies for reasons related and unrelated to their operating performance and could have the same effect on our common stock.
Further, securities class action litigation has often been initiated against companies following periods of volatility in their stock price. This type of litigation could result in substantial costs and divert our management’s attention and resources, and could also require us to make substantial payments to satisfy judgments or to settle litigation. The threat or filing of class action litigation lawsuits could cause the price of our Class A Common Stock to decline.
Any of these factors could have a material adverse effect on your investment in our Class A Common Stock and, as a result, you could lose some or all of your investment.
We incur substantial costs and demands upon management as a result of complying with the laws and regulations affecting public companies, which could harm our operating results.
As a public company, we are required to incur significant legal, accounting and other expenses, including costs associated with public company reporting requirements. We also incur costs associated with current corporate governance requirements, including requirements under Section 404 and other provisions of the Sarbanes-Oxley Act of 2002, as amended, or the Sarbanes-Oxley Act, as well as rules implemented by the SEC and the New York Stock Exchange. The expenses incurred by public companies for reporting and corporate governance purposes have increased dramatically in recent years. We expect these rules and regulations to substantially increase our legal and financial compliance costs and to make some activities more time-consuming and costly. Our efforts to comply with evolving laws, regulations and standards result in increased administrative expenses and a diversion of management’s time and attention from revenue-generating activities. In addition, if we fail to implement or maintain the requirements with respect to our internal accounting and audit functions, our ability to continue to report our operating results on a timely and accurate basis could be impaired and we could be subject to sanctions or investigation by regulatory authorities, such as the SEC or NYSE. Any such action could harm our reputation and the confidence of investors and customers in our company and could materially adversely affect our business and cause the price of our Class A Common Stock to decline.
If we fail to maintain proper and effective internal controls, our ability to produce accurate and timely financial statements could be impaired, which could harm our operating results, our ability to operate our business and investors’ views of us.
Ensuring that we have adequate internal financial and accounting controls and procedures in place to enable the Company to produce accurate financial statements on a timely basis is a costly and time-consuming effort that needs to be re-evaluated frequently. Section 404 of the Sarbanes-Oxley Act requires annual management assessments of the effectiveness of our internal controls over financial reporting, and, commencing with the year ended December 31, 2014, our auditors have begun attesting to and reporting on our internal controls and could, as part of that documentation and testing, identify areas for further attention or improvement. Implementing any appropriate changes to our internal controls may require additional personnel, specific compliance training of our directors, officers and employees, entail substantial costs in order to modify our existing accounting systems and require a significant period of time to complete.
Effective internal controls are necessary for us to provide reliable financial reports and effectively prevent fraud. We may in the future discover areas of our internal controls that need improvement. We cannot be certain that we will be successful in implementing or maintaining adequate internal control over our financial reporting and financial processes. Furthermore, as we grow our business, our internal controls will become more complex, and we will require significantly more resources to ensure our internal controls remain effective. Additionally, the existence of any material weakness or significant deficiency would require management to devote significant time and incur significant expense to remediate any such material weaknesses or significant deficiencies and management may not be able to remediate any such material weaknesses or significant deficiencies in a timely manner. The existence of any material weakness in our internal control over financial reporting could also result in errors in our financial statements that could require us to restate our financial statements, cause us to fail to meet our reporting obligations and cause stockholders to lose confidence in our reported financial information, all of which could materially and adversely affect us.
Anti-takeover provisions in our corporate organizational documents, under Delaware law and in our debt covenants could make an acquisition of our company more difficult, limit attempts by our stockholders to replace or remove our current management and limit the market price of our capital stock.
34
Provisions in our corporate organizational documents may have the effect of delaying or preventing a change of control or changes in our management. Such provisions include, but are not limited to:
• | authorizing the issuance of undesignated preferred stock, the terms of which may be established and shares of which may be issued without stockholder approval; |
• | any action to be taken by holders of our common stock must be effected at a duly called annual or special meeting and not by written consent; |
• | special meetings of our stockholders can be called only by our board of directors, the Chairman of our board of directors, our Chief Executive Officer or our lead independent director; |
• | our dual-class voting structure that provides for five-to-one voting rights for holders of our Class B Common Stock; |
• | holders of our Class B Common Stock possess certain preemptive rights allowing them to purchase additional shares of Class B Common Stock in the event of certain issuances of Class A Common Stock, subject to certain exceptions; |
• | vacancies and newly created directorships resulting from any increase in the authorized number of directors may be filled by a majority of the directors then in office, although less than a quorum, or by a sole remaining director, but not by stockholders; |
• | our bylaws require advance notice of stockholder proposals and director nominations; |
• | an amendment to our bylaws requires a supermajority vote of stockholders; and |
• | after the conversion of all Class B Common Stock, our board of directors will be staggered into three separate classes, with classes fixed by the board, and, once staggered, the removal of directors requires a supermajority vote of stockholders. |
These provisions may frustrate or prevent attempts by our stockholders to replace or remove our current management by making it more difficult for stockholders to replace members of our board of directors, which is responsible for appointing the members of our management. In addition, we are subject to the provisions of Section 203 of the Delaware General Corporation Law, or the DGCL, which generally prohibits a Delaware corporation from engaging in any of a broad range of business combinations with any “interested” stockholder for a period of three years following the date on which the stockholder became an “interested” stockholder. In addition, some of our debt covenants contained in the agreements governing our debt may delay or prevent a change in control.
Future offerings of debt securities, which would rank senior to our common stock upon our liquidation, and future offerings of equity securities, which may be senior to our common stock for purposes of liquidating and dividend distributions, may adversely affect the market price of our common stock.
In the future, we may attempt to increase our capital resources by making offerings of debt securities or additional offerings of equity securities. Upon bankruptcy or liquidation, holders of our debt securities and shares of preferred stock, if any, and lenders with respect to other borrowings will receive a distribution of our available assets prior to the holders of our common stock. Additional equity offerings may dilute the holdings of our existing stockholders or reduce the market price of our common stock, or both. Our preferred stock, if issued, could have a preference on liquidating distributions or a preference on dividend payments or both that could limit our ability to make a dividend distribution to the holders of our common stock. Our decision to issue securities in any future offering will depend on market conditions and other factors beyond our control. As a result, we cannot predict or estimate the amount, timing or nature of our future offerings, and purchasers of our common stock bear the risk of our future offerings reducing the market price of our common stock and diluting their ownership interest in our company.
If securities or industry analysts do not publish, or cease publishing, research or reports about us, our business or our market, or if they change their recommendations regarding our stock adversely, our stock price and trading volume could decline.
The trading market for our Class A Common Stock depends in part on the research and reports that securities or industry analysts publish about us or our business. If one or more of the analysts who covers us downgrades our Class A Common Stock or publishes inaccurate or unfavorable research about our business, the price of our Class A Common Stock would likely decline. If one or more of these analysts ceases coverage of us or fails to publish reports on us regularly, demand for our Class A Common Stock could decrease, which could cause the price of our Class A Common Stock and trading volume to decline.
35
Non-U.S. holders may be subject to United States federal income tax on gain realized on the sale or disposition of shares of our Class A Common Stock.
The Company believes that it is a “United States real property holding corporation,” or USRPHC, for United States federal income tax purposes. If the Company is a USRPHC, non-U.S. holders may be subject to United States federal income tax (including withholding tax) upon a sale or disposition of our Class A Common Stock, if (i) our Class A Common Stock is not regularly traded on an established securities market, or (ii) our Class A Common Stock is regularly traded on an established securities market, and the non-U.S. holder owned, actually or constructively, Class A Common Stock with a fair market value of more than 5% of the total fair market value of such common stock throughout the shorter of the five-year period ending on the date of the sale or other disposition or the non-U.S. holder’s holding period for such common stock.
There is no assurance that our stock repurchase program will result in further repurchases of our common stock or enhance long term stockholder value, and repurchases, if any, could affect our stock price and increase its volatility and will diminish our cash reserves.
As announced on February 22, 2017, our board of directors approved a $50 million stock repurchase program. Repurchases pursuant to a stock repurchase program could affect our stock price and increase its volatility and will reduce the market liquidity for our stock. The existence of a stock repurchase program could also cause our stock price to be higher than it would be in the absence of such a program. Additionally, these repurchases will diminish our cash reserves, which could impact our ability to pursue possible future strategic opportunities and acquisitions and would result in lower overall returns on our cash balances. The Company has conducted certain repurchases under the stock repurchase program, and additional capacity remains for future repurchases. There can be no assurance that any further stock repurchases will, in fact, occur, or, if they occur, that they will enhance stockholder value. Although stock repurchase programs is intended to enhance long term stockholder value, short-term stock price fluctuations could reduce the effectiveness of these repurchases.
Other Risks
The Company may not be able to benefit from its tax attributes.
In connection with our emergence from Chapter 11 bankruptcy proceedings, we were able to retain the tax basis in our assets as well as a portion of our U.S. net operating loss and tax credit carryforwards, or the Tax Attributes. Sections 382 and 383 of the Internal Revenue Code of 1986, as amended, or the Code, provide an annual limitation with respect to the ability of a corporation to utilize its Tax Attributes against future U.S. taxable income in the event of a change in ownership. Implementation of the Plan upon our emergence from Chapter 11 bankruptcy proceedings triggered a change in ownership for purposes of Section 382 and our annual Section 382 limitation is $3.6 million. As a result, our future U.S. taxable income may not be fully offset by the Tax Attributes if such income exceeds our annual limitation, and we may incur a tax liability with respect to such income. In addition, subsequent changes in ownership for purposes of the Code could further diminish our ability to utilize Tax Attributes.
Geopolitical risks and market disruption could adversely affect our business, liquidity, financial condition and results of operations.
Geopolitical events, acts of war or terrorism or any outbreak or escalation of hostilities throughout the world or health pandemics, may have a substantial impact on the economy, consumer confidence, the housing market, our employees and our customers. Historically, perceived threats to national security and other actual or potential conflicts or wars and related geopolitical risks have also created significant economic and political uncertainties. If any such events were to occur, or there was a perception that they were about to occur, they could have a material adverse impact on our business, liquidity, financial condition and results of operations.
36
Item 1B. | Unresolved Staff Comments |
None.
Item 2. | Properties |
Headquarters
The Company leases its corporate headquarters, which are located at 4695 MacArthur Court, 8th floor, Newport Beach, California. The Company leases properties for its segment offices located in the markets where the Company conducts its business. The Company believes that such properties, including the equipment located therein, are suitable and adequate to meet the needs of its business. For information about properties owned by the Company for use in its homebuilding activities, see Item 1 of Part I of this Annual Report, “Business.”
Item 3. | Legal Proceedings |
The Company is involved in various legal proceedings, most of which relate to routine litigation and some of which are covered by insurance. These matters are subject to many uncertainties and the outcomes of these matters are not within our control and may not be known for prolonged periods of time. Nevertheless, in the opinion of the Company’s management, none of the uninsured claims involves claims which are material and unreserved or will have a material adverse effect on the financial condition of the Company.
Item 4. | Mine Safety Disclosure |
Not Applicable.
37
PART II
Item 5. | Market for Registrant’s Common Equity, Related Stockholder Matters and Issuer Purchases of Equity Securities |
Shares of the Company's Class A Common Stock have been listed on the New York Stock Exchange under the symbol "WLH" since May 16, 2013, the day after our initial public offering. The following table sets forth, for the fiscal quarters indicated, the high and low sales prices per share of the Company's Class A Common Stock, as reported on the NYSE.
2017 | 2016 | ||||||||||||||||
Calendar Quarter Ended | High | Low | High | Low | |||||||||||||
March 31 | $ | 21.20 | $ | 16.37 | $ | 16.42 | $ | 7.61 | |||||||||
June 30 | 24.51 | 19.76 | 17.44 | 12.80 | |||||||||||||
September 30 | 25.18 | 18.85 | 19.02 | 15.18 | |||||||||||||
December 31 | 30.79 | 22.77 | 21.92 | 15.60 | |||||||||||||
As of February 14, 2018, the Company had approximately 50 stockholders of record, 49 of which were holders of the Company's Class A Common Stock, including shares of unvested restricted stock awards, and one of which was a holder of the Company's Class B Common Stock. The number of stockholders of record is based upon the actual number of stockholders registered at such date and does not include holders of shares in "street name" or persons, partnerships, associates, corporations or other entities identified in security position listings maintained by depositories.
Stock Performance Graph
The following graph compares the five-year cumulative total return of the Company's Class A Common Stock, the S&P 500 Index and the S&P Composite 1500 Homebuilding Index for the periods ended December 31.
The performance graph and related information shall not be deemed to be “soliciting material” or to be “filed” with the Securities and Exchange Commission, nor shall such information be incorporated by reference into any filing under the Securities Act or the Exchange Act, except to the extent that we specifically incorporate it by reference into such filing.
38
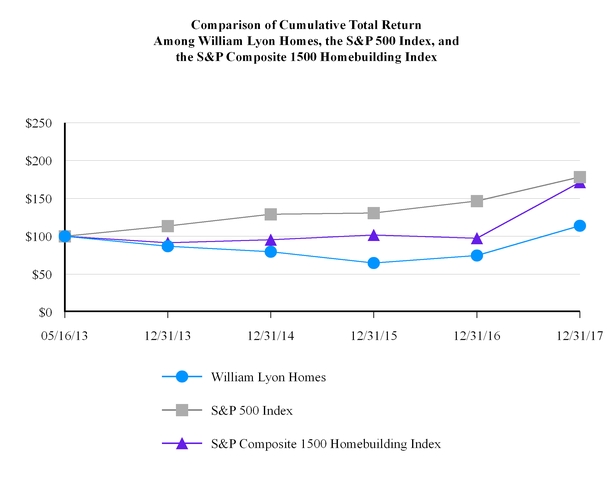
5/16/2013 | 12/31/2013 | 12/31/2014 | 12/31/2015 | 12/31/2016 | 12/31/2017 | ||||||||||||||||||
William Lyon Homes | $ | 100 | $ | 86.82 | $ | 79.49 | $ | 64.71 | $ | 74.63 | $ | 114.04 | |||||||||||
S&P 500 Index | 100 | 113.45 | 128.98 | 130.77 | 146.41 | 178.37 | |||||||||||||||||
S&P Composite 1500 Homebuilding Index | 100 | 91.56 | 95.47 | 101.68 | 97.51 | 171.47 | |||||||||||||||||
The above graph is based on the Company's Class A common stock and index prices calculated as of the dates indicated. The closing price of the Company's Class A common stock on the New York Stock Exchange was $29.08 per share on December 31, 2017 and $19.03 per share on December 31, 2016. Total return assumes $100 invested at market close on May 16, 2013 in the Company's Class A common stock, the S&P 500 Index and the S&P Composite 1500 Homebuilding Index, and the re-investment of all dividends. The performance of our common stock as presented above reflects past performance only and is not indicative of future performance.
Dividends
Our Class A Common Stock began trading on May 16, 2013, following our initial public offering. Since that time, the Company has not declared any cash dividends. The Company does not intend to declare cash dividends in the near future. Future cash dividends, if any, will depend upon the financial condition, results of operations, and capital requirements of the Company, as well as compliance with Delaware law, certain restrictive debt covenants, as well as other factors considered relevant by the Company's board of directors.
Recent Sales of Unregistered Securities
Other than the sales of unregistered securities that we reported in Quarterly Reports on Form 10-Q or Current Reports on Form 8-K during fiscal year 2017, we did not make any sales of unregistered securities during 2017.
39
Issuer Purchases of Equity Securities
The table below summarizes the number of shares of our Class A Common Stock that were repurchased during the three month period ended December 31, 2017.
Month Ended | Total Number of Shares Purchased (1) (2) | Average Price Paid Per Share | Total Number of Shares Purchased from Certain Employees (1) | Total Number of Shares Purchased under the Stock Repurchase Program (2) | Approximate Dollar Value of Shares that may yet be Repurchased under the Stock Repurchase Program | ||||||||||||
October 31, 2017 | 36,197 | $ | 23.88 | — | 36,197 | $ | 46,890,294 | ||||||||||
November 30, 2017 | 2,816 | $ | 28.84 | 2,816 | — | 46,890,294 | |||||||||||
December 31, 2017 | — | N/A | — | — | 46,890,294 | ||||||||||||
Total | 39,013 | 2,816 | 36,197 | ||||||||||||||
(1) The Company repurchased 2,816 shares from certain employees to facilitate income tax withholding payments pertaining to stock-based compensation awards that vested during the three month period ended December 31, 2017. Such shares were not repurchased pursuant to a publicly announced plan or program.
(2) As announced on February 22, 2017, the Board of Directors of the Company has approved a stock repurchase program, authorizing the repurchase of up to an aggregate of $50 million of the Company's Class A common stock. The program allows the Company to repurchase shares of Class A common stock from time to time for cash in the open market or privately negotiated transactions or other transactions, as market and business conditions warrant and subject to applicable legal requirements. The stock repurchase program does not obligate the Company to repurchase any particular amount of common stock, and it could be modified, suspended or discontinued at any time.
40
Item 6. | Selected Historical Consolidated Financial Data |
The following table sets forth certain of the Company’s historical financial data. The selected historical consolidated financial data as of December 31, 2017 and December 31, 2016 and for the years ended December 31, 2017, 2016, and 2015 has been derived from the Company’s audited consolidated financial statements and the related notes included elsewhere herein. The selected historical consolidated financial data as of December 31, 2015, and as of and for the years ended December 31, 2014, and 2013 have been derived from the Company’s audited financial statements for such years, which are not included herein.
You should read this summary in conjunction with the discussion under the heading “Management’s Discussion and Analysis of Financial Condition and Results of Operations,” and the historical consolidated financial statements and accompanying notes included elsewhere herein.
41
Year Ended December 31, | |||||||||||||||||||
2017 | 2016 | 2015 | 2014 | 2013 | |||||||||||||||
(in thousands except number of shares, per share data and number of homes) | |||||||||||||||||||
Statement of Operations Data: | |||||||||||||||||||
Revenues | |||||||||||||||||||
Home sales | $ | 1,795,074 | $ | 1,402,203 | $ | 1,078,928 | $ | 857,025 | $ | 521,310 | |||||||||
Construction services | 1,454 | 3,837 | 25,124 | 37,728 | 32,533 | ||||||||||||||
Total revenues | 1,796,528 | 1,406,040 | 1,104,052 | 894,753 | 553,843 | ||||||||||||||
Operating income | 137,956 | 93,968 | 80,247 | 75,473 | 51,857 | ||||||||||||||
Income before reorganization items, extinguishment of debt and (provision for) benefit from income taxes | 142,512 | 102,817 | 87,067 | 78,323 | 53,765 | ||||||||||||||
(Provision for) benefit from income taxes | (62,933 | ) | (34,850 | ) | (26,806 | ) | (23,797 | ) | 82,302 | ||||||||||
Net income | 57,751 | 67,967 | 60,261 | 54,526 | 135,603 | ||||||||||||||
Net income available to common stockholders | 48,135 | 59,696 | 57,336 | 44,625 | 127,604 | ||||||||||||||
Income per common share: | |||||||||||||||||||
Basic | $ | 1.30 | $ | 1.62 | $ | 1.57 | $ | 1.41 | $ | 5.16 | |||||||||
Diluted | $ | 1.24 | $ | 1.55 | $ | 1.48 | $ | 1.34 | $ | 4.95 | |||||||||
Weighted average common shares outstanding: | |||||||||||||||||||
Basic | 37,040,137 | 36,764,799 | 36,546,227 | 31,753,110 | 24,736,841 | ||||||||||||||
Diluted | 38,663,667 | 38,474,900 | 38,767,556 | 33,263,343 | 25,796,197 | ||||||||||||||
Operating Data (including consolidated joint ventures) (unaudited): | |||||||||||||||||||
Number of net new home orders | 3,328 | 2,775 | 2,575 | 1,677 | 1,322 | ||||||||||||||
Number of homes closed | 3,239 | 2,781 | 2,314 | 1,753 | 1,360 | ||||||||||||||
Average sales price of homes closed | $ | 554 | $ | 504 | $ | 466 | $ | 489 | $ | 383 | |||||||||
Cancellation rates | 15 | % | 16 | % | 20 | % | 18 | % | 17 | % | |||||||||
Backlog at end of period, number of homes | 822 | 733 | 739 | 478 | 368 | ||||||||||||||
Backlog at end of period, aggregate sales value | $ | 433,012 | $ | 410,675 | $ | 391,770 | $ | 260,127 | $ | 199,523 | |||||||||
42
December 31, | |||||||||||||||||||
2017 | 2016 | 2015 | 2014 | 2013 | |||||||||||||||
(in thousands) | |||||||||||||||||||
Balance Sheet Data: | |||||||||||||||||||
Cash and cash equivalents | $ | 182,710 | $ | 42,612 | $ | 50,203 | $ | 52,771 | $ | 171,672 | |||||||||
Real estate inventories—Owned | 1,699,850 | 1,771,998 | 1,675,106 | 1,404,639 | 671,790 | ||||||||||||||
Real estate inventories—Not owned | — | — | — | — | 12,960 | ||||||||||||||
Total assets | 2,061,104 | 2,011,280 | 1,923,450 | 1,659,724 | 1,010,411 | ||||||||||||||
Total debt | 1,030,184 | 1,080,650 | 1,105,776 | 925,398 | 469,355 | ||||||||||||||
Total William Lyon Homes stockholders’ equity | 780,472 | 697,086 | 632,095 | 569,915 | 428,179 | ||||||||||||||
Noncontrolling interests | 80,158 | 66,343 | 39,374 | 27,231 | 22,615 | ||||||||||||||
Item 7. | Management’s Discussion and Analysis of Financial Condition and Results of Operations |
The following discussion of results of operations and financial condition should be read in conjunction with Item 6 of Part II of this Annual Report, “Selected Historical Consolidated Financial Data,” Item 8 of Part II of this Annual Report, “Financial Statements and Supplementary Data,” and other financial information appearing elsewhere in this Annual Report on Form 10-K. This discussion contains forward-looking statements reflecting current expectations that involve risks and uncertainties. See the section titled, "Cautionary Note Concerning Forward-Looking Statements" included elsewhere in this Annual Report on Form 10-K. Actual results and the timing of events may differ materially from those contained in these forward-looking statements due to a number of factors, including those discussed in the section entitled “Risk Factors” and elsewhere in this annual report on Form 10-K. As used herein, “on a consolidated basis” means the total of operations in wholly-owned projects and in consolidated joint venture projects.
Overview
The Company is one of the largest Western U.S. regional homebuilders. Headquartered in Newport Beach, California, the Company is primarily engaged in the design, construction, marketing and sale of single-family detached and attached homes in California, Arizona, Nevada, Colorado, Washington and Oregon. The Company's core markets currently include Orange County, Los Angeles, the Inland Empire, the San Francisco Bay Area, Phoenix, Las Vegas, Denver, Seattle and Portland. The Company has a distinguished legacy of more than 60 years of homebuilding operations, over which time we have sold in excess of 102,000 homes. The Company believes that its markets are characterized by attractive long-term housing fundamentals. The Company believes that it holds leading market share positions in most of its markets and has a significant land supply.
The U.S. housing market has continued to improve in 2017, building upon the improvement from previous years. The Company attributes this strong housing market to a healthy domestic economy, strong demand dynamics in market with limited lot supply, coupled with positive demographic trends, including employment and population growth. In addition, the Company operates in some of the strongest markets in the Western Region of the United States, with consistent price appreciation, strong economic growth and consistent homebuyer demand.
The Company experienced a record homebuilding revenue year in 2017, with homebuilding revenue of $1.8 billion, demonstrating strong growth over 2016, against a backdrop of tight labor markets, weather challenges in the early part of 2017, and geo-political change. The Company's absorption rates for the year ended December 31, 2017 increased when compared to the 2016 period and also strategically maximized revenue at it projects as market conditions allowed. In 2017, the Company opened 35 new home communities. As of December 31, 2017, our average community count for the period then ended was 84 locations, which is a 14% increase from the previous period.
Results of Operations
In the year ended December 31, 2017, the Company delivered 3,239 homes, with an average selling price of approximately $554,200, and recognized home sales revenues and total revenues of $1.8 billion. The Company generated net income available to common shareholders of $48.1 million for the year ended December 31, 2017, and income per share of $1.30. The Company's net income was significantly reduced by a loss from extinguishment of debt of $21.8 million from the refinance of the 8.5% Senior Notes during the period and a one-time $23.1 million charge included within our tax provision to
43
reduce the value of our net deferred tax asset resulting from the new tax reform legislation signed into effect in December 2017. The Company continues to see positive trends in closings, price appreciation in certain projects, and our average sales price of homes closed increased by 10% compared to the 2016 period.
As of December 31, 2017, the Company had a consolidated backlog of 822 sold but unclosed homes, with an associated sales value of $433.0 million, representing a 12% increase in units, and a 5% increase in dollars, as compared to the backlog at December 31, 2016. The Company believes that the attractive fundamentals in its markets, its leading market share positions, its long-standing relationships with land developers, its significant land supply and its focus on providing the best possible customer experience, positions the Company to capitalize on meaningful growth.
Homebuilding gross margin percentage and adjusted homebuilding gross margin percentage was 17.6% and 23.2%, respectively, for the year ended December 31, 2017, as compared to 17.1% and 22.9%, respectively, for the year ended December 31, 2016.
Comparisons of the Year Ended December 31, 2017 to December 31, 2016
Year Ended December 31, | Increase (Decrease) | ||||||||||
2017 | 2016 | Amount | % | ||||||||
Number of Net New Home Orders | |||||||||||
California | 935 | 752 | 183 | 24 | % | ||||||
Arizona | 496 | 468 | 28 | 6 | % | ||||||
Nevada | 305 | 275 | 30 | 11 | % | ||||||
Colorado | 337 | 248 | 89 | 36 | % | ||||||
Washington | 555 | 297 | 258 | 87 | % | ||||||
Oregon | 700 | 735 | (35 | ) | (5 | )% | |||||
Total | 3,328 | 2,775 | 553 | 20 | % | ||||||
The 20% increase in the number of net new home orders was driven by a 14% increase in the average number of sales locations to 84 average locations in 2017, compared to 74 average locations in the 2016 period. In addition, the monthly absorption rate during the 2017 period increased to 3.3 compared to 3.1 in the prior year.
Year Ended December 31, | Increase (Decrease) | |||||||
2017 | 2016 | Amount | ||||||
Cancellation Rates | ||||||||
California | 18 | % | 18 | % | — | % | ||
Arizona | 9 | % | 12 | % | (3 | )% | ||
Nevada | 18 | % | 18 | % | — | % | ||
Colorado | 15 | % | 13 | % | 2 | % | ||
Washington | 14 | % | 16 | % | (2 | )% | ||
Oregon | 16 | % | 17 | % | (1 | )% | ||
Overall | 15 | % | 16 | % | (1 | )% | ||
Cancellation rates during the 2017 period decreased to 15% from 16% during the 2016 period. Cancellation rates typically are driven by personal factors affecting buyers and may not be indicative of any overarching trends affecting regions. The 2% increase in cancellation rates in Colorado was partially due to a manufactured product issue relating to fire rated I-joists, which was announced by the manufacturer at the beginning of the 2017 third quarter and impacted certain homes in backlog and/or under construction in our Colorado division, and for which we have implemented a remediation program. In addition, the cancellation rate in Arizona has decreased from the prior period, in part, due to the Company having more spec homes available to sell and close within a given period.
44
Year Ended December 31, | Increase (Decrease) | ||||||||||
2017 | 2016 | Amount | % | ||||||||
Average Number of Sales Locations | |||||||||||
California | 23 | 20 | 3 | 15 | % | ||||||
Arizona | 7 | 8 | (1 | ) | (13 | )% | |||||
Nevada | 13 | 12 | 1 | 8 | % | ||||||
Colorado | 15 | 10 | 5 | 50 | % | ||||||
Washington | 10 | 6 | 4 | 67 | % | ||||||
Oregon | 16 | 18 | (2 | ) | (11 | )% | |||||
Total | 84 | 74 | 10 | 14 | % | ||||||
The average number of sales locations for the Company increased to 84 locations for the year ended December 31, 2017 compared to 74 for the year ended December 31, 2016. As of December 31, 2017, the Company was selling out of 77 locations, down from 81 at December 31, 2016. During the 2017 period, on a consolidated basis, the Company opened 35 new sales locations and closed 39.
Year Ended December 31, | Increase (Decrease) | |||||
2017 | 2016 | Amount | ||||
Monthly Absorption Rates | ||||||
California | 3.4 | 3.1 | 0.3 | |||
Arizona | 5.9 | 4.9 | 1.0 | |||
Nevada | 2.0 | 1.9 | 0.1 | |||
Colorado | 1.9 | 2.1 | (0.2) | |||
Washington | 4.6 | 4.1 | 0.5 | |||
Oregon | 3.6 | 3.4 | 0.2 | |||
Overall | 3.3 | 3.1 | 0.2 | |||
The Company's consolidated monthly absorption rate, representing number of net new home orders divided by average sales locations for the period, increased to 3.3 sales per project for the 2017 period from 3.1 for the 2016 period. With all of our markets, except Colorado, there was strong improvement over prior year. As mentioned previously, the Colorado I-joists issue increased our cancellation rates, therefore reducing net sales. The increase in absorption rates in Arizona was due to strong demand from the needs based entry level buyer compared to the prior period.
December 31, | Increase (Decrease) | |||||||||||
2017 | 2016 | Amount | % | |||||||||
Backlog (units) | ||||||||||||
California | 240 | 224 | 16 | 7 | % | |||||||
Arizona | 161 | 204 | (43 | ) | (21 | )% | ||||||
Nevada | 86 | 59 | 27 | 46 | % | |||||||
Colorado | 172 | 75 | 97 | 129 | % | |||||||
Washington | 91 | 52 | 39 | 75 | % | |||||||
Oregon | 72 | 119 | (47 | ) | (39 | )% | ||||||
Total | 822 | 733 | 89 | 12 | % | |||||||
The Company’s backlog at December 31, 2017 increased 12% to 822 units from 733 units at December 31, 2016. The increase in backlog is primarily driven by the 20% increase in new home orders over prior period, in addition to an increase in fourth quarter backlog conversion rate, from 84% during the fourth quarter of 2016 to 88% for the fourth quarter of 2017.
45
December 31, | Increase (Decrease) | ||||||||||||||
2017 | 2016 | Amount | % | ||||||||||||
(dollars in thousands) | |||||||||||||||
Backlog (dollars) | |||||||||||||||
California | $ | 167,938 | $ | 182,300 | $ | (14,362 | ) | (8 | )% | ||||||
Arizona | 49,656 | 59,563 | (9,907 | ) | (17 | )% | |||||||||
Nevada | 62,105 | 45,034 | 17,071 | 38 | % | ||||||||||
Colorado | 65,716 | 39,569 | 26,147 | 66 | % | ||||||||||
Washington | 55,583 | 34,789 | 20,794 | 60 | % | ||||||||||
Oregon | 32,014 | 49,420 | (17,406 | ) | (35 | )% | |||||||||
Total | $ | 433,012 | $ | 410,675 | $ | 22,337 | 5 | % | |||||||
The dollar amount of backlog of homes sold but not closed as of December 31, 2017 was $433.0 million, up 5% from $410.7 million as of December 31, 2016. The increase is primarily the result of the increase in net orders described above, partially offset by the decrease in average selling price in some reporting segments. The increase in the dollar amount of backlog of homes sold but not closed as described above generally results in an increase in operating revenues in the subsequent period as compared to the previous period.
In California, the dollar amount of backlog decreased 8% to $167.9 million as of December 31, 2017 from $182.3 million as of December 31, 2016, which is attributable to the decrease in average selling price of homes in backlog to $699,700 as of December 31, 2017 compared to $813,800 as of December 31, 2016, which is related to product mix. The decrease was partially offset by a 7% increase in the number of homes in backlog in California to 240 homes as of December 31, 2017 compared to 224 homes as of December 31, 2016.
In Arizona, the dollar amount of backlog decreased 17% to $49.7 million as of December 31, 2017 from $59.6 million as of December 31, 2016, which is attributable to a 21% decrease in the number of units in backlog at December 31, 2017, to 161 from 204 as of December 31, 2016. The decrease was partially offset by a 6% increase in the average selling price of homes in backlog as of December 31, 2017 to $308,400 from $292,000 at December 31, 2016.
In Nevada, the dollar amount of backlog increased 38% to $62.1 million as of December 31, 2017 from $45.0 million as of December 31, 2016, which is attributable to a 46% increase in the number of units in backlog as December 31, 2017, to 86 from 59 as of December 31, 2016. The increase is partially offset by a decrease in the average selling price of homes in backlog to $722,200 as of December 31, 2017, down 5% from $763,300 as of December 31, 2016.
In Colorado, the dollar amount of backlog increased 66% to $65.7 million as of December 31, 2017, from $39.6 million as of December 31, 2016. The increase is attributable to a 129% increase in the number of units in backlog at December 31, 2017, to 172 from 75 at December 31, 2016, partially offset by a decrease in average selling price of homes in backlog of 28% to $382,100 as of December 31, 2017 from $527,600 as of December 31, 2016.
In Washington, the dollar amount of backlog increased 60% to $55.6 million as of December 31, 2017, from $34.8 million as of December 31, 2016. The increase is attributable to a 75% increase in the number of units in backlog as of December 31, 2017, to 91 from 52 at December 31, 2016, partially offset by a 9% decrease in the average selling price of homes in backlog as of December 31, 2017 to $610,800 from $669,000 at December 31, 2016.
In Oregon, the dollar amount of backlog decreased 35% to $32.0 million as of December 31, 2017, from $49.4 million as of December 31, 2016. The decrease is attributable to a 39% decrease in the number of units in backlog at December 31, 2017, to 72 from 119 at December 31, 2016, partially offset by a 7% increase in the average selling price of homes in backlog as of December 31, 2017 to $444,600 from $415,300 at December 31, 2016.
46
December 31, | Increase (Decrease) | ||||||||||
2017 | 2016 | Amount | % | ||||||||
Number of Homes Closed | |||||||||||
California | 919 | 722 | 197 | 27 | % | ||||||
Arizona | 539 | 473 | 66 | 14 | % | ||||||
Nevada | 278 | 331 | (53 | ) | (16 | )% | |||||
Colorado | 240 | 251 | (11 | ) | (4 | )% | |||||
Washington | 516 | 289 | 227 | 79 | % | ||||||
Oregon | 747 | 715 | 32 | 4 | % | ||||||
Total | 3,239 | 2,781 | 458 | 16 | % | ||||||
During the year ended December 31, 2017, the number of homes closed increased 16% to 3,239 in the 2017 period from 2,781 in the 2016 period, the highest since 2007. The increase is attributable to an increase in net new orders by 20% to 3,328 orders in the 2017 period compared to 2,775 orders in the 2016 period, in addition to an increase of 14% in the average number of sales locations to 84 locations during the 2017 period compared to 74 locations during the 2016 period.
Year Ended December 31, | Increase (Decrease) | |||||||||||||
2017 | 2016 | Amount | % | |||||||||||
(dollars in thousands) | ||||||||||||||
Home Sales Revenue | ||||||||||||||
California | $ | 682,806 | $ | 490,352 | $ | 192,454 | 39 | % | ||||||
Arizona | 158,534 | 125,951 | 32,583 | 26 | % | |||||||||
Nevada | 176,355 | 191,711 | (15,356 | ) | (8 | )% | ||||||||
Colorado | 124,456 | 128,530 | (4,074 | ) | (3 | )% | ||||||||
Washington | 332,302 | 154,600 | 177,702 | 115 | % | |||||||||
Oregon | 320,621 | 311,059 | 9,562 | 3 | % | |||||||||
Total | $ | 1,795,074 | $ | 1,402,203 | $ | 392,871 | 28 | % | ||||||
The increase in homebuilding revenue of 28% to $1,795.1 million for the year ended December 31, 2017 from $1,402.2 million for the year ended December 31, 2016 is primarily attributable to a 16% increase in the number of homes closed to 3,239 during the 2017 period from 2,781 in the 2016 period, in addition to a 10% increase in the average sales price of homes closed to $554,200 during the 2017 period from $504,200 during the 2016 period.
Year Ended December 31, | Increase (Decrease) | |||||||||||||
2017 | 2016 | Amount | % | |||||||||||
Average Sales Price of Homes Closed | ||||||||||||||
California | $ | 743,000 | $ | 679,200 | $ | 63,800 | 9 | % | ||||||
Arizona | 294,100 | 266,300 | 27,800 | 10 | % | |||||||||
Nevada | 634,400 | 579,200 | 55,200 | 10 | % | |||||||||
Colorado | 518,600 | 512,100 | 6,500 | 1 | % | |||||||||
Washington | 644,000 | 534,900 | 109,100 | 20 | % | |||||||||
Oregon | 429,200 | 435,000 | (5,800 | ) | (1 | )% | ||||||||
Total average | $ | 554,200 | $ | 504,200 | $ | 50,000 | 10 | % | ||||||
The average sales price of homes closed for the 2017 period increased 10% compared to the 2016 period primarily due to a greater number of overall deliveries in the current period in California and Washington, which have higher price points, in addition to benefits from product mix and overall increases in sales prices. On a same store basis (projects that were open in both periods presented), the average sales price increased 5% for the 2017 period compared to the 2016 period.
47
Gross Margin
Homebuilding gross margins increased to 17.6% for the year ended December 31, 2017 from 17.1% in the 2016 period, primarily driven by price appreciation above costs appreciation, as well as new project openings with deliveries in 2017 with margins above previous company averages.
For the comparison of the year ended December 31, 2017 and the year ended December 31, 2016, adjusted homebuilding gross margin percentage, which excludes previously capitalized interest included in cost of sales as well as the effect of adjustments recorded in relation to purchase accounting, was 23.2% for the 2017 period compared to 22.9% for the 2016 period. The increase was primarily a result of the increase in homebuilding gross margins described above, coupled with the increase in the impact of interest in cost of sales.
Adjusted homebuilding gross margin is a non-GAAP financial measure. The Company believes this information is meaningful as it isolates the impact that interest and purchase accounting have on homebuilding gross margin and permits investors to make better comparisons with our competitors, who also break out and adjust gross margins in a similar fashion. For comparative purposes purchase accounting is the net adjustment in basis related to the acquisition of our Colorado, Washington and Oregon operating segments. See table set forth below reconciling this non-GAAP measure to homebuilding gross margin.
Year Ended December 31, | |||||||
2017 | 2016 | ||||||
(dollars in thousands) | |||||||
Home sales revenue | $ | 1,795,074 | $ | 1,402,203 | |||
Cost of home sales | 1,478,549 | 1,162,337 | |||||
Homebuilding gross margin | 316,525 | 239,866 | |||||
Homebuilding gross margin percentage | 17.6 | % | 17.1 | % | |||
Add: Interest in cost of sales | 83,455 | 57,297 | |||||
Add: Purchase accounting adjustments | 15,771 | 23,414 | |||||
Adjusted homebuilding gross margin | $ | 415,751 | $ | 320,577 | |||
Adjusted homebuilding gross margin percentage | 23.2 | % | 22.9 | % | |||
Construction Services Revenue
Construction services revenue was $1.5 million during the year ended December 31, 2017, compared to $3.8 million for the year ended December 31, 2016. The decrease is primarily due to a decrease in revenue attributable to one project in Northern California, which has closed out, which was partially offset by a new project started in Washington towards the end of 2017.
Sales and Marketing & General and Administrative Expense
Year Ended December 31, | As a Percentage of Home Sales Revenue | ||||||||||||
2017 | 2016 | 2017 | 2016 | ||||||||||
(dollars in thousands) | |||||||||||||
Sales and Marketing | $ | 86,226 | $ | 72,509 | 4.8 | % | 5.2 | % | |||||
General and Administrative | 90,206 | 73,398 | 5.0 | % | 5.2 | % | |||||||
Total Sales and Marketing & General and Administrative | $ | 176,432 | $ | 145,907 | 9.8 | % | 10.4 | % | |||||
Sales and marketing expense as a percentage of home sales revenue decreased to 4.8% in the 2017 period compared to 5.2% in the 2016 period as a result of higher homebuilding revenue. In addition, the Company has been lowering advertising as a percentage of homebuilding revenue to 0.7% in the 2017 period from 0.8% in the 2016 period, by a more efficient advertising spending strategy through utilization of social media and mobile applications, in an effort to offset higher outside broker costs. General and administrative expense as a percentage of home sales revenues decreased to 5.0% in the 2017 period compared to 5.2% in the 2016 period. The decrease is driven by a lower relative cost structure due to the higher revenue and positive operating leverage.
48
Equity in Income of Unconsolidated Joint Ventures
Equity in income of unconsolidated joint ventures decreased to $3.7 million during the 2017 period from $5.6 million during the 2016 period as a result of declining performance at one of our mortgage joint ventures.
Other Items
Combined, other operating costs increased to $2.3 million for the year ended December 31, 2017, compared to $0.3 million for the year ended December 31, 2016.
Interest activity for the years ended December 31, 2017 and 2016 are as follows (in thousands):
Year Ended December 31, | |||||||
2017 | 2016 | ||||||
Interest incurred | $ | 73,729 | $ | 83,218 | |||
Less: Interest capitalized | (73,729 | ) | (83,218 | ) | |||
Interest expense, net of amounts capitalized | $ | — | $ | — | |||
Cash paid for interest | $ | 62,679 | $ | 79,734 | |||
The decrease in interest incurred for the year ended December 31, 2017 compared to the interest incurred for the year ended December 31, 2016 reflects the impact of the effective refinancing transaction on January 31, 2017, in which the Company completed the sale to certain purchasers of $450.0 million in aggregate principal amount of 5.875% Senior Notes due 2025 and concurrent retirement of the remaining outstanding 8.5% Notes, such that the entire aggregate $425.0 million of previously outstanding 8.5% Notes are now retired and extinguished. The Company capitalized all of the interest it incurred during both periods presented due to its qualifying assets exceeding its outstanding debt.
Provision for Income Taxes
During the year ended December 31, 2017 the Company recorded a provision for income taxes of $62.9 million, reflecting an effective tax rate of 52.1%. During the year ended December 31, 2016, the Company recorded a provision for income taxes of $34.9 million for an effective tax rate of 33.9%. The increase in the current year tax rate is driven by the new tax reform legislation signed into effect in December 2017, which resulted in remeasurement of our net deferred tax asset of $23.1 million. This increase was partially offset by the tax benefit of $7.8 million related to the loss on debt extinguishment.
Net Income Attributable to Noncontrolling Interest
Net income attributable to noncontrolling interest increased to $9.6 million during the year ended December 31, 2017, compared to $8.3 million for the year ended December 31, 2016, reflecting the stage in the project development cycle of a number of our recently entered into joint venture projects and an increase in deliveries.
Net Income Available to Common Stockholders
As a result of the preceding factors, net income available to common stockholders for the years ended December 31, 2017 and 2016 was $48.1 million and $59.7 million, respectively.
Lots Owned and Controlled
The table below summarizes the Company’s lots owned and controlled as of the periods presented:
49
December 31, | ||||||||||||
2017 | 2016 | Amount | % | |||||||||
Lots Owned | ||||||||||||
California | 1,551 | 1,484 | 67 | 5 | % | |||||||
Arizona | 4,221 | 4,932 | (711 | ) | (14 | )% | ||||||
Nevada | 2,981 | 3,028 | (47 | ) | (2 | )% | ||||||
Colorado | 1,276 | 1,475 | (199 | ) | (13 | )% | ||||||
Washington | 1,334 | 1,367 | (33 | ) | (2 | )% | ||||||
Oregon | 1,893 | 1,340 | 553 | 41 | % | |||||||
Total | 13,256 | 13,626 | (370 | ) | (3 | )% | ||||||
Lots Controlled (1) | ||||||||||||
California | 1,051 | 971 | 80 | 8 | % | |||||||
Arizona | — | — | — | — | % | |||||||
Nevada | 17 | 43 | (26 | ) | (60 | )% | ||||||
Colorado | 769 | 86 | 683 | 794 | % | |||||||
Washington | 849 | 1,036 | (187 | ) | (18 | )% | ||||||
Oregon | 1,494 | 2,096 | (602 | ) | (29 | )% | ||||||
Total | 4,180 | 4,232 | (52 | ) | (1 | )% | ||||||
Total Lots Owned and Controlled | 17,436 | 17,858 | (422 | ) | (2 | )% | ||||||
(1) | Lots controlled may be purchased by the Company as consolidated projects or may be purchased by newly formed joint ventures. |
Total lots owned and controlled has decreased 2% to 17,436 lots owned and controlled at December 31, 2017 from 17,858 lots at December 31, 2016.
Comparisons of the Year Ended December 31, 2016 to December 31, 2015
Year Ended December 31, | Increase (Decrease) | ||||||||||
2016 | 2015 | Amount | % | ||||||||
Number of Net New Home Orders | |||||||||||
California | 752 | 669 | 83 | 12 | % | ||||||
Arizona | 468 | 414 | 54 | 13 | % | ||||||
Nevada | 275 | 272 | 3 | 1 | % | ||||||
Colorado | 248 | 224 | 24 | 11 | % | ||||||
Washington | 297 | 416 | (119 | ) | (29 | )% | |||||
Oregon | 735 | 580 | 155 | 27 | % | ||||||
Total | 2,775 | 2,575 | 200 | 8 | % | ||||||
The 8% increase in the number of net new home orders was driven by a 9% increase in the average number of sales locations to 74 average locations in 2016, compared to 68 in the 2015 period, driven by an increase in the average number of communities in all reporting segments with the exception of Colorado and Washington. The monthly absorption rate during the 2016 period was 3.1 compared to the 2015 period of 3.2, remaining relatively consistent between periods.
50
Year Ended December 31, | Increase (Decrease) | |||||||
2016 | 2015 | Amount | ||||||
Cancellation Rates | ||||||||
California | 18 | % | 22 | % | (4 | )% | ||
Arizona | 12 | % | 14 | % | (2 | )% | ||
Nevada | 18 | % | 20 | % | (2 | )% | ||
Colorado | 13 | % | 19 | % | (6 | )% | ||
Washington | 16 | % | 20 | % | (4 | )% | ||
Oregon | 17 | % | 21 | % | (4 | )% | ||
Overall | 16 | % | 20 | % | (4 | )% | ||
Cancellation rates during the 2016 period decreased to 16% from 20% during the 2015 period. Cancellation rates typically are driven by personal factors affecting buyers and may not be indicative of any overarching trends affecting regions.
Year Ended December 31, | Increase (Decrease) | ||||||||||
2016 | 2015 | Amount | % | ||||||||
Average Number of Sales Locations | |||||||||||
California | 20 | 18 | 2 | 11 | % | ||||||
Arizona | 8 | 7 | 1 | 14 | % | ||||||
Nevada | 12 | 11 | 1 | 9 | % | ||||||
Colorado | 10 | 13 | (3 | ) | (23 | )% | |||||
Washington | 6 | 6 | — | — | % | ||||||
Oregon | 18 | 13 | 5 | 38 | % | ||||||
Total | 74 | 68 | 6 | 9 | % | ||||||
The average number of sales locations for the Company increased to 74 locations for the year ended December 31, 2016 compared to 68 for the year ended December 31, 2015. As of December 31, 2016, the Company had 81 locations, up from 72 at December 31, 2015. During the 2016 period, on a consolidated basis, the Company opened 36 new sales locations and closed 27.
Year Ended December 31, | Increase (Decrease) | |||||
2016 | 2015 | Amount | ||||
Monthly Absorption Rates | ||||||
California | 3.1 | 3.1 | — | |||
Arizona | 4.9 | 4.9 | — | |||
Nevada | 1.9 | 2.1 | (0.2 | ) | ||
Colorado | 2.1 | 1.4 | 0.7 | |||
Washington | 4.1 | 5.8 | (1.7) | |||
Oregon | 3.4 | 3.7 | (0.3) | |||
Overall | 3.1 | 3.2 | (0.1 | ) | ||
The Company's consolidated monthly absorption rate, representing number of net new home orders divided by average sales locations for the period, remained consistent at 3.1 sales per project for both the 2016 and 2015 periods. Absorption rates declined in Washington to 4.1 for the 2016 period compared to 5.8 for the 2015 period; however, Washington represents the second highest absorption rate across all reporting segments during the 2016 period.
51
December 31, | Increase (Decrease) | |||||||||||
2016 | 2015 | Amount | % | |||||||||
Backlog (units) | ||||||||||||
California | 224 | 194 | 30 | 15 | % | |||||||
Arizona | 204 | 209 | (5 | ) | (2 | )% | ||||||
Nevada | 59 | 115 | (56 | ) | (49 | )% | ||||||
Colorado | 75 | 78 | (3 | ) | (4 | )% | ||||||
Washington | 52 | 44 | 8 | 18 | % | |||||||
Oregon | 119 | 99 | 20 | 20 | % | |||||||
Total | 733 | 739 | (6 | ) | (1 | )% | ||||||
The Company’s backlog at December 31, 2016 decreased 1% to 733 units from 739 units at December 31, 2015. The decrease in backlog is primarily driven by an increase in fourth quarter backlog conversion rate, from 78% during the fourth quarter of 2015 to 84% for the fourth quarter of 2016, in addition to an increase in net orders.
December 31, | Increase (Decrease) | ||||||||||||||
2016 | 2015 | Amount | % | ||||||||||||
(dollars in thousands) | |||||||||||||||
Backlog (dollars) | |||||||||||||||
California | $ | 182,300 | $ | 152,673 | $ | 29,627 | 19 | % | |||||||
Arizona | 59,563 | 53,527 | 6,036 | 11 | % | ||||||||||
Nevada | 45,034 | 77,151 | (32,117 | ) | (42 | )% | |||||||||
Colorado | 39,569 | 40,952 | (1,383 | ) | (3 | )% | |||||||||
Washington | 34,789 | 24,414 | 10,375 | 42 | % | ||||||||||
Oregon | 49,420 | 43,053 | 6,367 | 15 | % | ||||||||||
Total | $ | 410,675 | $ | 391,770 | $ | 18,905 | 5 | % | |||||||
The dollar amount of backlog of homes sold but not closed as of December 31, 2016 was $410.7 million, up 5% from $391.8 million as of December 31, 2015. The increase is primarily the result of the increase in net orders described above, coupled with an increase in average selling price in several reporting segments. The increase in the dollar amount of backlog of homes sold but not closed as described above generally results in an increase in operating revenues in the subsequent period as compared to the previous period.
In California, the dollar amount of backlog increased 19% to $182.3 million as of December 31, 2016 from $152.7 million as of December 31, 2015, which is attributable to a 15% increase in the number of homes in backlog in California to 224 homes as of December 31, 2016 compared to 194 homes as of December 31, 2015. The increase is also the result of an increase in the average sales price of homes in backlog to $813,800 as of December 31, 2016 compared to $787,000 as of December 31, 2015.
In Arizona, the dollar amount of backlog increased 11% to $59.6 million as of December 31, 2016 from $53.5 million as of December 31, 2015, which is attributable to a 14% increase in the average selling price of homes in backlog as of December 31, 2016 to $292,000 from $256,100 at December 31, 2015
In Nevada, the dollar amount of backlog decreased 42% to $45.0 million as of December 31, 2016 from $77.2 million as of December 31, 2015, which is attributable to a 49% decrease in the number of units in backlog as December 31, 2016 when compared with the 2015 period. This decrease is partially offset by an increase in the average selling price of homes in backlog to $763,300 as of December 31, 2016, up 14% from $670,900 as of December 31, 2015.
In Colorado, the dollar amount of backlog decreased 3% to $39.6 million as of December 31, 2016, from $41.0 million as of December 31, 2015. The decrease is attributable to a 4% decrease in the number of units in backlog at December 31, 2016, to 75 from 78 at December 31, 2015, driven by an increase in homes closed of 9% to 251 closings as of December 31, 2016 from 230 as of December 31, 2015.
In Washington, the dollar amount of backlog increased 42% to $34.8 million as of December 31, 2016, from $24.4 million as of December 31, 2015. The increase is attributable to an 18% increase in the number of units in backlog as of December 31, 2016, to 52 from 44 at December 31, 2015, in addition to a 21% increase in the average selling price of homes in backlog as of December 31, 2016 to $669,000 from $554,900 at December 31, 2015.
52
In Oregon, the dollar amount of backlog increased 15% to $49.4 million as of December 31, 2016, from $43.1 million as of December 31, 2015. The increase is attributable to a 20% increase in the number of units in backlog at December 31, 2016, to 119 from 99 at December 31, 2015, partially offset by a 5% decrease in the average selling price of homes in backlog as of December 31, 2016 to $415,300 from $434,900 at December 31, 2015.
December 31, | Increase (Decrease) | ||||||||||
2016 | 2015 | Amount | % | ||||||||
Number of Homes Closed | |||||||||||
California | 722 | 633 | 89 | 14 | % | ||||||
Arizona | 473 | 252 | 221 | 88 | % | ||||||
Nevada | 331 | 230 | 101 | 44 | % | ||||||
Colorado | 251 | 230 | 21 | 9 | % | ||||||
Washington | 289 | 434 | (145 | ) | (33 | )% | |||||
Oregon | 715 | 535 | 180 | 34 | % | ||||||
Total | 2,781 | 2,314 | 467 | 20 | % | ||||||
During the year ended December 31, 2016, the number of homes closed increased 20% to 2,781 in the 2016 period from 2,314 in the 2015 period, the highest since 2007. The increase is attributable to an increase in average number of sales locations by 9% to 74 average sales locations in the 2016 period compared to 68 average sales locations in the 2015 period. Absorption rates remained relatively consistent in all reporting segments.
Year Ended December 31, | Increase (Decrease) | |||||||||||||
2016 | 2015 | Amount | % | |||||||||||
(dollars in thousands) | ||||||||||||||
Home Sales Revenue | ||||||||||||||
California | $ | 490,352 | $ | 379,310 | $ | 111,042 | 29 | % | ||||||
Arizona | 125,951 | 67,010 | 58,941 | 88 | % | |||||||||
Nevada | 191,711 | 130,845 | 60,866 | 47 | % | |||||||||
Colorado | 128,530 | 107,014 | 21,516 | 20 | % | |||||||||
Washington | 154,600 | 181,258 | (26,658 | ) | (15 | )% | ||||||||
Oregon | 311,059 | 213,491 | 97,568 | 46 | % | |||||||||
Total | $ | 1,402,203 | $ | 1,078,928 | $ | 323,275 | 30 | % | ||||||
The increase in homebuilding revenue of 30% to $1,402.2 million for the year ended December 31, 2016 from $1,078.9 million for the year ended December 31, 2015 is primarily attributable to a 20% increase in the number of homes closed to 2,781 during the 2016 period from 2,314 in the 2015 period, in addition to an 8% increase in the average sales price of homes closed to $504,200 during the 2016 period from $466,300 during the 2015 period.
Year Ended December 31, | Increase (Decrease) | |||||||||||||
2016 | 2015 | Amount | % | |||||||||||
Average Sales Price of Homes Closed | ||||||||||||||
California | $ | 679,200 | $ | 599,200 | $ | 80,000 | 13 | % | ||||||
Arizona | 266,300 | 265,900 | 400 | — | % | |||||||||
Nevada | 579,200 | 568,900 | 10,300 | 2 | % | |||||||||
Colorado | 512,100 | 465,300 | 46,800 | 10 | % | |||||||||
Washington | 534,900 | 417,600 | 117,300 | 28 | % | |||||||||
Oregon | 435,000 | 399,000 | 36,000 | 9 | % | |||||||||
Total average | $ | 504,200 | $ | 466,300 | $ | 37,900 | 8 | % | ||||||
53
The average sales price of homes closed for the 2016 period increased 8% compared to the 2015 period primarily due to a greater number of overall deliveries in the current period in the California, Nevada and Colorado reporting segments, which have higher price points, in addition to benefits from product mix and overall increases in sales prices. On a same store basis, the average sales price increased 10% for the 2016 period compared to the 2015 period, most notably in Washington, where the increase in ASP was due to price appreciation in certain communities that were open in both the 2016 and 2015 periods.
Gross Margin
Homebuilding gross margins decreased to 17.1% for the year ended December 31, 2016 from 18.5% in the 2015 period, primarily driven by rising labor and land costs, as well as an increase in capitalized interest being amortized through cost of sales, which increased to 410 basis points compared to 360 basis points in the 2015 period. Additionally, homebuilding gross margins were negatively impacted by rising labor and land costs during the 2015 and 2016 periods.
For the comparison of the year ended December 31, 2016 and the year ended December 31, 2015, adjusted homebuilding gross margin percentage, which excludes previously capitalized interest included in cost of sales as well as the effect of adjustments recorded in relation to purchase accounting, was 22.9% for the 2016 period compared to 24.8% for the 2015 period. The decrease was primarily a result of the changes for homebuilding gross margins described previously.
Adjusted homebuilding gross margin is a non-GAAP financial measure. The Company believes this information is meaningful as it isolates the impact that interest and purchase accounting have on homebuilding gross margin and permits investors to make better comparisons with our competitors, who also break out and adjust gross margins in a similar fashion. For comparative purposes purchase accounting is the net adjustment in basis related to the acquisition of our Colorado, Washington and Oregon operating segments. See table set forth below reconciling this non-GAAP measure to homebuilding gross margin.
Year Ended December 31, | |||||||
2016 | 2015 | ||||||
(dollars in thousands) | |||||||
Home sales revenue | $ | 1,402,203 | $ | 1,078,928 | |||
Cost of home sales | 1,162,337 | 878,995 | |||||
Homebuilding gross margin | 239,866 | 199,933 | |||||
Homebuilding gross margin percentage | 17.1 | % | 18.5 | % | |||
Add: Interest in cost of sales | 57,297 | 38,416 | |||||
Add: Purchase accounting adjustments | 23,414 | 28,919 | |||||
Adjusted homebuilding gross margin | $ | 320,577 | $ | 267,268 | |||
Adjusted homebuilding gross margin percentage | 22.9 | % | 24.8 | % | |||
Construction Services Revenue
Construction services revenue, which is only in the California reporting segment, was $3.8 million during the year ended December 31, 2016, compared to $25.1 million for the year ended December 31, 2015. The decrease is primarily due to a decrease in revenue attributable to one project in Northern California, which has closed out. During the fourth quarter of 2015 and continuing into 2016, the Company finalized significant construction services projects.
Sales and Marketing & General and Administrative Expense
Year Ended December 31, | As a Percentage of Home Sales Revenue | ||||||||||||
2016 | 2015 | 2016 | 2015 | ||||||||||
(dollars in thousands) | |||||||||||||
Sales and Marketing | $ | 72,509 | $ | 61,539 | 5.2 | % | 5.7 | % | |||||
General and Administrative | 73,398 | 59,161 | 5.2 | % | 5.5 | % | |||||||
Total Sales and Marketing & General and Administrative | $ | 145,907 | $ | 120,700 | 10.4 | % | 11.2 | % | |||||
54
Sales and marketing expense as a percentage of home sales revenue decreased to 5.2% in the 2016 period compared to 5.7% in the 2015 period as a result of lower advertising and upfront marketing costs, partially offset by a higher percentage of homes with outside broker commissions. General and administrative expense as a percentage of home sales revenues decreased to 5.2% in the 2016 period compared to 5.5% in the 2015 period. The decrease is driven by increased revenues and improved operating leverage over our increased headcount.
Equity in Income of Unconsolidated Joint Ventures
Equity in income of unconsolidated joint ventures increased to $5.6 million during the 2016 period from $3.2 million during the 2015 period. The increase reflects the expanding operations of the mortgage joint ventures in which the Company holds a non-consolidated equity interest and increased volume.
Other Items
Combined, other operating costs decreased to $0.3 million for the year ended December 31, 2016, compared to $2.0 million for the year ended December 31, 2015.
Interest activity for the years ended December 31, 2016 and 2015 are as follows (in thousands):
Year Ended December 31, | |||||||
2016 | 2015 | ||||||
Interest incurred | $ | 83,218 | $ | 76,221 | |||
Less: Interest capitalized | (83,218 | ) | (76,221 | ) | |||
Interest expense, net of amounts capitalized | $ | — | $ | — | |||
Cash paid for interest | $ | 79,734 | $ | 72,254 | |||
The Company capitalized all of the interest it incurred during both periods presented due to its qualifying assets exceeding its outstanding debt.
Provision for Income Taxes
During the year ended December 31, 2016 the Company recorded a provision for income taxes of $34.9 million, reflecting an effective tax rate of 33.9%. The significant drivers of the effective rate are the allocation of income to noncontrolling interests and domestic production activities deduction. During the year ended December 31, 2015, the Company recorded a provision for income taxes of $26.8 million for an effective tax rate of 30.8%.
Net Income Attributable to Noncontrolling Interest
Net income attributable to noncontrolling interest increased to $8.3 million during the year ended December 31, 2016, compared to $2.9 million for the year ended December 31, 2015, reflecting the stage in the project development cycle of a number of our recently entered into joint venture projects and an increase in deliveries.
Net Income Available to Common Stockholders
As a result of the preceding factors, net income available to common stockholders for the years ended December 31, 2016 and 2015 was $59.7 million and $57.3 million, respectively.
Lots Owned and Controlled
The table below summarizes the Company’s lots owned and controlled as of the periods presented:
55
December 31, | ||||||||||||
2016 | 2015 | Amount | % | |||||||||
Lots Owned | ||||||||||||
California | 1,484 | 2,200 | (716 | ) | (33 | )% | ||||||
Arizona | 4,932 | 5,204 | (272 | ) | (5 | )% | ||||||
Nevada | 3,028 | 2,888 | 140 | 5 | % | |||||||
Colorado | 1,475 | 798 | 677 | 85 | % | |||||||
Washington | 1,367 | 1,144 | 223 | 19 | % | |||||||
Oregon | 1,340 | 1,245 | 95 | 8 | % | |||||||
Total | 13,626 | 13,479 | 147 | 1 | % | |||||||
Lots Controlled (1) | ||||||||||||
California | 971 | 601 | 370 | 62 | % | |||||||
Arizona | — | — | — | — | % | |||||||
Nevada | 43 | 554 | (511 | ) | (92 | )% | ||||||
Colorado | 86 | 134 | (48 | ) | (36 | )% | ||||||
Washington | 1,036 | 871 | 165 | 19 | % | |||||||
Oregon | 2,096 | 1,775 | 321 | 18 | % | |||||||
Total | 4,232 | 3,935 | 297 | 8 | % | |||||||
Total Lots Owned and Controlled | 17,858 | 17,414 | 444 | 3 | % | |||||||
(1) | Lots controlled may be purchased by the Company as consolidated projects or may be purchased by newly formed joint ventures. |
Total lots owned and controlled has increased 3% to 17,858 lots owned and controlled at December 31, 2016 from 17,414 lots at December 31, 2015.
Financial Condition and Liquidity
In the year ended December 31, 2017, the Company delivered 3,239 homes, with an average selling price of approximately $554,200, and recognized home sales revenues and total revenues of $1.8 billion. In the year ended December 31, 2017, net new home orders increased 20% to 3,328 in the 2017 period from 2,775 in the 2016 period and home closings increased 16% to 3,239 in the 2017 period from 2,781 in the 2016 period. On a consolidated basis, the cancellation rate decreased to 15% in the 2017 period compared to 16% in the 2016 period. Homebuilding gross margin percentage and adjusted homebuilding gross margin percentage increased to 17.6% and 23.2%, respectively, for the year ended December 31, 2017, as compared to 17.1% and 22.9%, respectively, for the year ended December 31, 2016.
As of December 31, 2017, the Company was selling homes in 77 communities and had a consolidated backlog of 822 sold but unclosed homes, with an associated sales value of $433.0 million, representing a 12% increase in units and 5% increase in dollars, as compared to the backlog at December 31, 2016. The Company benefits from a sizable and well-located lot supply, and as of December 31, 2017, the Company owned 13,256 lots, all of which are entitled, and had options to purchase an additional 4,180 lots. The Company’s lot supply reflects its balanced approach to land investment. The Company has a diverse mix of finished lots available for near-term homebuilding operations and longer-term strategic land positions to support future growth. The Company believes that its current inventory of owned and controlled lots is sufficient to supply the vast majority of its projected future home closings for the next several years.
Since our initial public offering, which raised approximately $163.7 million of net proceeds, the Company has access to the public equity and debt markets, which is a significant source of financing for investing in land in our existing markets or financing expansion into new markets, such as the Company’s acquisition of the residential homebuilding business of Polygon Northwest, or the Polygon Acquisition. Most recently, the Company completed the sale of $450.0 million in aggregate principal amount of 5.875% Senior Notes due 2025 in a private placement with registration rights, issued pursuant to an indenture, dated as of January 31, 2017, the net proceeds from which were used, together with cash on hand, to pay off in full the outstanding aggregate principal amount of the Company’s previously outstanding 8.5% senior notes due 2020.
The Company ended the year with total liquidity of $344.9 million, including cash on hand of $182.7 million and availability under the Company's revolving credit facility of $162.2 million. The Company provides for its ongoing cash requirements with the proceeds identified above, as well as from internally generated funds from the sales of homes and/or land
56
sales. During the year ended December 31, 2017, the Company generated cash from operations of $167.5 million, which included investment in land acquisitions of $451.0 million, for net cash generated by operations of $618.5 million, net of investment in land acquisitions. In addition, the Company has the option to use additional outside borrowing, form new joint ventures with partners that provide a substantial portion of the capital required for certain projects, and buy land via lot options or land banking arrangements. The Company has financed, and may in the future finance, certain projects and land acquisitions with construction loans secured by real estate inventories, seller-provided financing and land banking transactions. The Company may also draw on its revolving line of credit to fund land acquisitions, as discussed below. We believe we are well-positioned with a strong balance sheet and sufficient liquidity for supporting our ongoing operations. In addition, consistent with our favorable outlook of the market and long-term business strategy, the Company expects to use its capital to support growth initiatives.
Tangible Equity Units
On November 21, 2014, in order to pay down approximately $111.2 million borrowed under the one-year senior unsecured facility entered into in conjunction with the acquisition of Polygon, the Company completed its public offering and sale of 1,000,000 6.50% tangible equity units (“TEUs”, or "Units"), sold for a stated amount of $100 per Unit, featuring a 17.5% conversion premium. On December 3, 2014, the Company sold an additional 150,000 TEUs pursuant to an over-allotment option granted to the underwriters. Each TEU is a unit composed of two parts:
• | a prepaid stock purchase contract (a “purchase contract”); and |
• | a senior subordinated amortizing note (an “amortizing note”). |
Each amortizing note had an initial principal amount of $18.01, bore interest at the annual rate of 5.50% and had a final installment payment date of December 1, 2017. On each March 1, June 1, September 1 and December 1, commencing on March 1, 2015, William Lyon Homes paid equal quarterly installments of $1.6250 on each amortizing note (except for the March 1, 2015 installment payment, which was $1.8056 per amortizing note). Each installment constituted a payment of interest and a partial repayment of principal.
On November 27, 2017, the Company issued 670,811 shares of Class A Common Stock to certain holders who elected for early settlement of their purchase contracts. On December 1, 2017 (the "mandatory settlement date"), the Company issued the balance to the remaining holders, for an aggregate issuance of 5,113,473 shares of Class A Common Stock, which reflected the minimum number of shares of Class A Common Stock, or 4.4465 shares per each of the previously outstanding 1,150,000 tangible equity units that were issuable by the Company under the purchase contracts (as adjusted for fractional shares). As of December 31, 2017, the Company paid off the outstanding balance of the amortizing notes.
5 3/4% Senior Notes Due 2019
On March 31, 2014, California Lyon completed its offering of 5.75% Senior Notes due 2019, or the 5.75% Notes, in an aggregate principal amount of $150 million. The 5.75% Notes were issued at 100% of their aggregate principal amount.
As of December 31, 2017, the outstanding principal amount of the 5.75% Notes was $150.0 million, excluding deferred loan costs of $0.6 million. The 5.75% Notes bear interest at a rate of 5.75% per annum, payable semiannually in arrears on April 15 and October 15, and mature on April 15, 2019. The 5.75% Notes are unconditionally guaranteed on a joint and several unsecured basis by Parent and certain of its existing and future restricted subsidiaries. The 5.75% Notes and the related guarantees are California Lyon’s and the guarantors’ unsecured senior obligations and rank equally in right of payment with all of California Lyon’s and the guarantors’ existing and future unsecured senior debt, including California Lyon’s $350 million in aggregate principal amount of 7.00% Notes and $450 million in aggregate principal amount of 5.875% Notes, each as described below. The 5.75% Notes rank senior in right of payment to all of California Lyon’s and the guarantors’ future subordinated debt. The 5.75% Notes and the guarantees are and will be effectively junior to California Lyon’s and the guarantors’ existing and future secured debt to the extent of the value of the collateral securing such debt.
8 1/2% Senior Notes Due 2020
On November 8, 2012, California Lyon completed its offering of 8.5% Senior Notes due 2020, or the initial 8.5% Notes, in an aggregate principal amount of $325 million. The initial 8.5% Notes were issued at 100% of their aggregate principal amount. The Company used the net proceeds from the sale of the initial 8.5% Notes, together with cash on hand, to refinance the Company’s (i) $235 million 10.25% Senior Secured Term Loan due 2015, (ii) approximately $76 million in aggregate principal amount of 12% Senior Subordinated Secured Notes due 2017, (iii) approximately $11 million in principal amount of
57
project related debt, and (iv) to pay accrued and unpaid interest thereon. In July 2013, the Company exchanged 100% of the initial 8.5% Notes for notes that are freely transferable under the Securities Act.
On October 24, 2013, California Lyon completed the sale to certain purchasers of an additional $100.0 million in aggregate principal amount of its 8.5% Senior Notes due 2020, or the additional 8.5% Notes and, together with the initial 8.5% Notes, the 8.5% Notes, at an issue price of 106.5% of their aggregate principal amount, plus accrued interest from and including May 15, 2013, in a private placement, resulting in net proceeds of approximately $104.7 million including the premium on issuance. In February 2014, we exchanged 100% of the additional 8.5% Notes for notes that are freely transferable and registered under the Securities Act.
On January 31, 2017, California Lyon completed the sale to certain purchasers of $450.0 million in aggregate principal amount of 5.875% Senior Notes due 2025 in a private placement with registration rights. Parent, through California Lyon, used the net proceeds from the 5.875% Notes, as further described below, to purchase $395.6 million of the outstanding aggregate principal amount of the 8.5% Notes, pursuant to a cash tender offer and consent solicitation. Subsequently, the Company used the remaining proceeds, together with cash on hand, for the retirement of the remaining outstanding 8.5% Notes, such that the entire aggregate $425 million of previously outstanding 8.5% Notes are retired and extinguished as of December 31, 2017. The Company incurred certain costs related to the early extinguishment of debt of the 8.5% Notes during the period ended December 31, 2017 in an amount of $21.8 million, which is included in the Consolidated Statement of Operations as Loss on extinguishment of debt.
7% Senior Notes due 2022
On August 11, 2014, WLH PNW Finance Corp., or the Escrow Issuer, completed its private placement with registration rights of 7.00% Senior Notes due 2022, or the initial 7.00% Notes, in an aggregate principal amount of $300 million. The initial 7.00% Notes were issued at 100% of their aggregate principal amount. On August 12, 2014, in connection with the consummation of the Polygon Acquisition, Escrow Issuer merged with and into California Lyon, and California Lyon assumed the obligations of the Escrow Issuer under the 7.00% Notes and the related indenture by operation of law, or the Escrow Merger. Following the Escrow Merger, California Lyon is the obligor under the initial 7.00% Notes. In January 2015, we exchanged 100% of the initial 7.00% Notes for notes that are freely transferable and registered under the Securities Act.
On September 15, 2015, California Lyon completed its private placement with registration rights of an additional $50.0 million in aggregate principal amount of its 7.00% Senior Notes due 2022, or the additional 7.00% Notes, and together with the initial 7.00% Notes, the 7.00% Notes, at an issue price of 102.0% of their principal amount, plus accrued interest from August 15, 2015, resulting in net proceeds of approximately $50.5 million. In January 2016, we exchanged 100% of the additional 7.00% Notes for notes that are freely transferable and registered under the Securities Act.
As of December 31, 2017, the outstanding principal amount of the 7.00% Notes was $350 million, excluding unamortized premium of $0.7 million and deferred loan costs of $4.0 million. The 7.00% Notes bear interest at a rate of 7.00% per annum, payable semiannually in arrears on February 15 and August 15, and mature on August 15, 2022. The 7.00% Notes are unconditionally guaranteed on a joint and several unsecured basis by Parent and certain of its existing and future restricted subsidiaries. The 7.00% Notes and the related guarantees are California Lyon’s and the guarantors’ unsecured senior obligations and rank equally in right of payment with all of California Lyon’s and the guarantors’ existing and future unsecured senior debt, including California Lyon’s $150 million in aggregate principal amount of 5.75% Senior Notes, as described above and $450 million in aggregate principal amount of 5.875% Senior Notes, as described below. The 7.00% Notes rank senior in right of payment to all of California Lyon’s and the guarantors’ future subordinated debt. The 7.00% Notes and the guarantees are and will be effectively junior to California Lyon’s and the guarantors’ existing and future secured debt to the extent of the value of the collateral securing such debt.
5 7/8% Senior Notes Due 2025
On January 31, 2017, California Lyon completed its private placement with registration rights of 5.875% Senior Notes due 2025 (the "5.875% Notes"), in an aggregate principal amount of $450 million. The 5.875% Notes were issued at 99.215% of their aggregate principal amount. Parent, through California Lyon, used the net proceeds from the 5.875% Notes offering to purchase the outstanding aggregate principal amount of the 8.5% Notes such that the entire aggregate $425 million of previously outstanding 8.5% Notes are retired and extinguished as of December 31, 2017. In May 2017, the Company exchanged 100% of the 5.875% Notes for notes that are freely transferable and registered under the Securities Act.
As of December 31, 2017, the outstanding principal amount of the 5.875% Notes was $450 million, excluding unamortized discount of $3.2 million and deferred loan costs of $7.2 million. The 5.875% Notes bear interest at a rate of 5.875% per annum, payable semiannually in arrears on January 31 and July 31, and mature on January 31, 2025. The 5.875% Notes are unconditionally guaranteed on a joint and several unsecured basis by Parent and certain of its existing and future restricted subsidiaries. The 5.875% Notes and the related guarantees are California Lyon’s and the guarantors’
58
unsecured senior obligations and rank equally in right of payment with all of California Lyon’s and the guarantors’ existing and future unsecured senior debt, including California Lyon’s $150 million in aggregate principal amount of 5.75% Senior Notes due 2019 and $350 million in aggregate principal amount of 7.00% Senior Notes due 2022, each as described above. The 5.875% Notes rank senior in right of payment to all of California Lyon’s and the guarantors’ future subordinated debt. The 5.875% Notes and the guarantees are and will be effectively junior to California Lyon’s and the guarantors’ existing and future secured debt to the extent of the value of the collateral securing such debt.
Senior Notes Covenant Compliance
The indentures governing the 5.75% Notes, 7.00% Notes, and 5.875% Notes contain covenants that limit the ability of Parent, California Lyon, and their restricted subsidiaries to, among other things: (i) incur or guarantee certain additional indebtedness; (ii) pay dividends, distributions, or repurchase equity or make payments in respect of subordinated indebtedness; (iii) make certain investments; (iv) sell assets; (v) incur liens; (vi) enter into agreements restricting the ability of the Company’s restricted subsidiaries to pay dividends or transfer assets; (vii) enter into transactions with affiliates; (viii) create unrestricted subsidiaries; and (viii) consolidate, merge or sell all or substantially all of its assets. These covenants are subject to a number of important exceptions and qualifications as described in the indentures. The Company was in compliance with all such covenants as of December 31, 2017.
Revolving Credit Facility
On July 1, 2016, California Lyon and Parent entered into an amendment and restatement agreement pursuant to which its existing credit agreement providing for a revolving credit facility, as previously amended and restated on March 27, 2015 as described below, was further amended and restated in its entirety (as so further amended and restated, the "Second Amended Facility"). The Second Amended Facility amends and restates the Company’s previous $130.0 million revolving credit facility and provides for total lending commitments of $145.0 million. In addition, the Second Amended Facility has an uncommitted accordion feature under which the Company may increase the total principal amount up to a maximum aggregate of $200.0 million under certain circumstances, as well as a sublimit of $50.0 million for letters of credit. Effective as of November 28, 2017, California Lyon increased the size of the commitment under its revolving credit facility by $25.0 million to an aggregate total of $170.0 million, through exercise of the facility’s accordion feature and entry into a new lender supplement as of such date.
The Second Amended Facility, among other things, also amended the maturity date of the previous facility to July 1, 2019, provided that the Second Amended Facility will terminate on January 14, 2019 (the “Springing Termination Date”) if, on the Springing Termination Date, the aggregate outstanding principal amount of California Lyon’s 5.75% senior notes due 2019 is equal to or greater than the sum of (a) 50% of the Consolidated EBITDA (as defined in the Second Amended Facility) of California Lyon, Parent, certain of the Parent’s direct and indirect wholly owned subsidiaries (together with California Lyon and Parent, the “Loan Parties”) and their Restricted Subsidiaries (as defined in the Second Amended Facility) for the four-quarter period ending September 30, 2018, plus (b) the Liquidity (as defined in the Second Amended Facility) of the Loan Parties and their consolidated subsidiaries on the Springing Termination Date. Further, the Second Amended Facility amended the maximum leverage ratio covenant to extend the timing of the gradual step-downs. Specifically, pursuant to the Second Amended Facility, the maximum leverage ratio remained at 65% from June 30, 2016 through and including December 30, 2016, decreased to 62.5% on the last day of the 2016 fiscal year, remained at 62.5% from December 31, 2016 through and including June 29, 2017, and was scheduled to further decrease to 60% on the last day of the second quarter of 2017 and to remain at 60% thereafter. The Second Amended Facility did not revise any of our other financial covenants thereunder.
On June 16, 2017, California Lyon, Parent and the lenders party thereto entered into an amendment to the Second Amended Facility, which amended the maximum leverage ratio to further extend the timing of the gradual step-downs, such that the leverage ratio remained at 62.5% through and including December 30, 2017, and decreased to 60% on the last day of the 2017 fiscal year and will remain at 60% thereafter. The amendment did not revise any of our other financial covenants thereunder.
Borrowings under the Second Amended Facility, the availability of which is subject to a borrowing base formula, are required to be guaranteed by the Parent and certain of the Parent's wholly-owned subsidiaries, are secured by a pledge of all equity interests held by such guarantors, and may be used for general corporate purposes. Interest rates on borrowings generally will be based on either LIBOR or a base rate, plus the applicable spread. As of December 31, 2017, the commitment fee on the unused portion of the Second Amended Facility accrues at an annual rate of 0.01%. As of December 31, 2017, the Company had a letter of credit for $7.8 million but no outstanding balance against the Second Amended Facility. As of December 31, 2016, the Company had $29.0 million outstanding against the Second Amended Facility at an effective rate of 4.75% and a letter of credit for $8.0 million.
59
The Second Amended Facility contains certain financial maintenance covenants, including (a) a minimum tangible net worth requirement of $451.0 million (which is subject to increase over time based on subsequent earnings and proceeds from equity offerings, as well as deferred tax assets to the extent included on the Company's financial statements), (b) a maximum leverage covenant that prohibits the leverage ratio (as defined therein) from exceeding 65%, which maximum leverage ratio decreased to 62.5% effective as of December 31, 2016, and further decreased to 60% effective as of December 31, 2017, and (c) a covenant requiring us to maintain either (i) an interest coverage ratio (EBITDA to interest incurred, as defined therein) of at least 1.50 to 1.00 or (ii) liquidity (as defined therein) of an amount not less than the greater of our consolidated interest incurred during the trailing 12 months and $50.0 million. Our compliance with these financial covenants is measured by calculations and metrics that are specifically defined or described by the terms of the Second Amended Facility and can differ in certain respects from comparable GAAP or other commonly used terms. The Second Amended Facility contains customary events of default, subject to cure periods in certain circumstances, including: nonpayment of principal, interest and fees or other amounts; violation of covenants; inaccuracy of representations and warranties; cross default to certain other indebtedness; unpaid judgments; and certain bankruptcy and other insolvency events. The occurrence of any event of default could result in the termination of the commitments under the Second Amended Facility and permit the lenders to accelerate payment on outstanding borrowings under the Second Amended Facility and require cash collateralization of outstanding letters of credit. If a change in control (as defined in the Second Amended Facility) occurs, the lenders may terminate the commitments under the Second Amended Facility and require that the Company repay outstanding borrowings under the Second Amended Facility and cash collateralize outstanding letters of credit. Interest rates on borrowings generally will be based on either LIBOR or a base rate, plus the applicable spread. The Company was in compliance with all covenants under the Second Amended Facility as of December 31, 2017. The following table summarizes these covenants pursuant to the Second Amended Facility, and our compliance with such covenants as of December 31, 2017:
Covenant Requirements at | Actual at | |||||||
Financial Covenant | December 31, 2017 | December 31, 2017 | ||||||
Minimum Tangible Net Worth | $ | 536.5 | million | $ | 800.7 | million | ||
Maximum Leverage Ratio | 60.0 | % | 51.7 | % | ||||
Interest Coverage Ratio; or (1) | 1.50x | 3.31x | ||||||
Minimum Liquidity (1) | $ | 73.7 | million | $ | 344.9 | million | ||
(1) We are required to meet either the Interest Coverage Ratio or Minimum Liquidity, but not both.
In connection with the issuance of the Company’s new 5.875% Notes to pay off in full the previously outstanding 8.5% Notes in January 2017, the Company entered into an amendment to the Second Amended Facility effective as of January 27, 2017. The amendment modifies the definition of Tangible Net Worth (as defined therein) for purposes of calculating the Leverage Ratio covenant under the Second Amended Facility, so as to exclude any reduction in Tangible Net Worth that occurs as a result of the costs related to payment of any call premium or any other costs associated with the refinancing transaction and the redemption of outstanding 8.5% Notes.
Although the Company does not believe it is likely to breach any of the covenants listed above, including the maximum leverage ratio covenant, based on its current expectations and assumptions, there are certain steps that the Company could take to decrease the likelihood of any breach in the event it was determined that a breach was reasonably likely. The Company remains focused on continuing to drive top line revenue growth which it believes will improve cash flow and generate earnings. In addition, there are certain discretionary levers that the Company has the ability to utilize to the extent it is determined that near-term steps are needed to manage to covenant requirements. For example, land acquisition and development is a strategic investment by the Company to support our future growth plans. While the Company intends to continue to acquire land that it believes is accretive to the Company, the Company's currently owned and controlled land position enables it to be selective and nimble in its future acquisition strategy. The Company also has the option to form new joint ventures with partners that could provide a substantial portion of the capital required for certain projects, purchase land through lot options or land banking arrangements, as well as utilizing such financing structures as a means to generate incremental cash flow, or adjust the timing of housing starts. In addition, during the year ended December 31, 2017, the Company paid approximately $451.0 million for land and land developments. Such spending related to land owned is a discretionary component that the Company can temper as needed to reduce cash outflow, and it believes it can do so without a significant impact on near-term operating results.
The Second Amended Facility contains customary events of default, subject to cure periods in certain circumstances, including: nonpayment of principal, interest and fees or other amounts; violation of covenants, including those financial
60
covenants identified above; inaccuracy of representations and warranties; cross default to certain other indebtedness; unpaid judgments; and certain bankruptcy and other insolvency events.
The occurrence of any event of default could result in the termination of the commitments under the Second Amended Facility and permit the lenders to accelerate payment on outstanding borrowings under the Second Amended Facility and require cash collateralization of outstanding letters of credit, if we are unable to amend the Second Amended Facility, secure a waiver of the default from the lenders or otherwise cure the default. Further, acceleration of the Second Amended Facility borrowings may result in the acceleration of other debt to which a cross-acceleration or cross-default provision applies, including but not limited to our senior notes as described above to the extent the acceleration is above certain threshold amounts, and the triggering default is not cured or waived or any acceleration rescinded, as well as certain notes payable.
In addition, if a change in control (as defined in the Second Amended Facility) occurs, the lenders may terminate the commitments under the Second Amended Facility and require that the Company repay outstanding borrowings under the Second Amended Facility and cash collateralize outstanding letters of credit.
The Company believes it has access to alternate sources of funding to pay off resulting obligations or replace funding under the Second Amended Facility should there be a likelihood of, or anticipated, breach of any covenants, including cash generated from operations and opportunistic land sales. In addition, the Company has capacity under the restrictive covenants of its senior notes indentures to incur additional indebtedness which it can do through access to the debt capital markets, and the Company believes it can also raise equity in the capital markets.
Seller Financing
At December 31, 2017, the Company had $0.6 million of notes payable outstanding related to one land acquisition for which seller financing was provided. The note bears interest at a rate of 7% per annum, is secured by the underlying land, and matures in June 2018. During the year ended December 31, 2017, the Company paid in full a note payable outstanding related to a land acquisition for which seller financing was provided. The note bore interest at a rate of 7% per annum, was secured by the underlying land, and was paid upon maturity in August 2017. This note was entered into with a related party, which is described in more detail in the financial statements.
Joint Venture Notes Payable
The Company and certain of its consolidated joint ventures have entered into construction notes payable agreements. The issuance date, facility size, maturity date and interest rate are listed in the table below as of December 31, 2017 (in millions):
Issuance Date | Facility Size | Outstanding | Maturity | Current Rate | ||||||||||
March, 2016 | $ | 33.4 | $ | 13.8 | (4) | September, 2018 | 4.47 | % | (1) | |||||
January, 2016 | 35.0 | 28.9 | February, 2019 | 4.82 | % | (2) | ||||||||
November, 2015 | 42.5 | 15.7 | (4) | May, 2018 | 5.50 | % | (1) | |||||||
November, 2014 | 7.0 | 2.1 | (4) | February, 2018 | 5.00 | % | (3) | |||||||
March, 2014 | 26.0 | — | (6) | April, 2018 | 4.53 | % | (1) | |||||||
July, 2017 | 66.2 | 33.4 | February, 2021 | 4.51 | % | (5) | ||||||||
$ | 210.1 | $ | 93.9 | |||||||||||
(1) Loan bears interest at the Company's option of either LIBOR +3.0% or the prime rate +1.0%.
(2) Loan bears interest at LIBOR +3.25%.
(3) Loan bears interest at the prime rate +0.5%.
(4) The Company anticipates paying the borrowings in full upon the maturity date from proceeds from homes closed in the respective project.
(5) Loan bears interest at the greatest of the prime rate, federal funds effective rate +1.0%, or LIBOR +1.0%.
(6) The balance on this borrowing was paid in full prior to the maturity date, along with all accrued interest to date.
Net Debt to Total Capital
The Company’s ratio of net debt to total capital was 49.6% and 57.6% as of December 31, 2017 and 2016, respectively. The ratio of net debt to total capital is a non-GAAP financial measure, which is calculated by dividing notes payable and Senior Notes, net of cash and cash equivalents, by total capital (notes payable and Senior Notes, net of cash and cash equivalents, plus
61
total equity). The Company believes this calculation is a relevant and useful financial measure to investors in understanding the leverage employed in its operations, and may be helpful in comparing the Company with other companies in the homebuilding industry to the extent they provide similar information. See table set forth below reconciling this non-GAAP measure to the ratio of debt to total capital.
December 31, | ||||||||
2017 | 2016 | |||||||
(dollars in thousands) | ||||||||
Notes payable and Senior Notes | $ | 1,030,184 | $ | 1,080,650 | ||||
Total equity | 860,630 | 763,429 | ||||||
Total capital | $ | 1,890,814 | $ | 1,844,079 | ||||
Ratio of debt to total capital | 54.5 | % | 58.6 | % | ||||
Notes payable and Senior Notes | $ | 1,030,184 | $ | 1,080,650 | ||||
Less: Cash and cash equivalents | (182,710 | ) | (42,612 | ) | ||||
Net debt | 847,474 | 1,038,038 | ||||||
Total equity | 860,630 | 763,429 | ||||||
Total capital (net of cash) | $ | 1,708,104 | $ | 1,801,467 | ||||
Ratio of net debt to total capital (net of cash) | 49.6 | % | 57.6 | % | ||||
Joint Venture Financing
The Company and certain of its subsidiaries are general partners or members in joint ventures involved in the development and sale of residential projects. As described more fully in Critical Accounting Policies—Variable Interest Entities, certain joint ventures have been determined to be variable interest entities in which the Company is considered the primary beneficiary. Accordingly, the assets, liabilities and operations of these joint ventures have been consolidated with the Company’s financial statements for the periods presented. The financial statements of joint ventures in which the Company is not considered the primary beneficiary are not consolidated with the Company’s financial statements. The Company’s investments in unconsolidated joint ventures are accounted for using the equity method because the Company has a 50% or less voting or economic interest (and thus such joint ventures are not controlled by the Company). Based upon current estimates, substantially all future development and construction costs incurred by the joint ventures will be funded by the venture partners or from the proceeds of construction financing obtained by the joint ventures.
During the year ended December 31, 2014, the Company acquired a non-controlling interest in an unconsolidated mortgage joint venture as a result of the Polygon Acquisition, and had made an initial investment in a second non-controlling interest in an unconsolidated mortgage joint venture. During the year ended December 31, 2015, the Company made an additional investment in this second unconsolidated mortgage joint venture.
Assessment District Bonds
In some jurisdictions in which the Company develops and constructs property, assessment district bonds are issued by municipalities to finance major infrastructure improvements and fees. Such financing has been an important part of financing master-planned communities due to the long-term nature of the financing, favorable interest rates when compared to the Company’s other sources of funds and the fact that the bonds are sold, administered and collected by the relevant government entity. As a landowner benefited by the improvements, the Company is responsible for the assessments on its land. When the Company’s homes or other properties are sold, the assessments are either prepaid or the buyers assume the responsibility for the related assessments.
Cash Flows — Comparison of Year Ended December 31, 2017 to Year Ended December 31, 2016
For the comparison of the year ended December 31, 2017 and the year ended December 31, 2016, the comparison of cash flows is as follows:
• | Net cash provided by operating activities was $167.5 million in the 2017 period compared to net cash provided by operating activities of $21.7 million in the 2016 period. The change was primarily a result of (i) a decrease in real estate inventories-owned of $52.9 million in the 2017 period compared to spending of $69.6 million in the 2016 period, (ii) a decrease in deferred tax assets of $27.8 million in the 2017 period compared to $4.0 million in the 2016 period, driven by the new tax reform legislation signed into effect in December 2017, which resulted in a one-time charge to our deferred tax asset, and (iii) an increase in accrued expenses of $17.2 million in the 2017 period |
62
compared to an increase of $9.5 million in the 2016 period, partially offset by (iv) a decrease in accounts payable of $15.5 million in the 2017 period compared to a decrease of $1.6 million in the 2016 period due to timing of payments, and (v) an increase in escrow receivables of $3.2 million in the 2017 period compared to a decrease of $3.0 million in the 2016 period due to the timing of payments received.
• | Net cash used in investing activities was $4.3 million in the 2017 period compared to net cash provided by investing activities of $5.2 million in the 2016 period, primarily driven by (i) proceeds from repayment of notes receivable of $6.2 million in the 2016 period for which there was no corresponding amount in the 2017 period, and (ii) purchases of property and equipment of $4.3 million in the 2017 period compared to $1.0 million in the 2016 period. |
• | Net cash used in financing activities was $23.1 million in the 2017 period compared to net cash used in financing activities of $34.5 million in the 2016 period. The change was primarily the result of (i) proceeds from the issuance of the 5.875% Senior Notes for $446.5 million million in the 2017 period for which there is no comparable amount in the 2016 period, (ii) proceeds from issuance of Class B shares of $29.9 million in the 2017 period for which there is no comparable amount in the 2016 period, and (iii) net payments of $29.0 million against the revolving line of credit in the 2017 period, versus net payments of $36.0 million in the 2016 period, partially offset by (iv) principal payments for the 8.5% Senior Notes for $425.0 million in the 2017 period, in addition to its redemption premium for $19.6 million, for which there is no comparable amount in the 2016 period, (v) net noncontrolling interest contributions of $4.2 million in the 2017 period versus net contributions of $18.7 million in the 2016 period, and (vi) payment of deferred loan costs of $9.9 million in the 2017 period compared to $1.1 million in the 2016 period. |
Cash Flows — Comparison of Year Ended December 31, 2016 to Year Ended December 31, 2015
For the comparison of the year ended December 31, 2016 and the year ended December 31, 2015, the comparison of cash flows is as follows:
• | Net cash provided by operating activities was $21.7 million in the 2016 period compared to net cash used in operating activities of $172.9 million in the 2015 period. The change was primarily a result of (i) a net decrease in spending on real estate inventories-owned of $69.6 million in the 2016 period compared to spending of $264.9 million in the 2015 period, and (ii) an increase in accrued expenses of $9.5 million in the 2016 period compared to a decrease of $15.0 million in the 2015 period, partially offset by (iii) a decrease in accounts payable of $1.6 million in the 2016 period compared to an increase of $24.1 million in the 2015 period due to timing of payments, and (iv) a decrease in receivables of $0.9 million in the 2016 period compared to an increase of $6.7 million in the 2015 period due to the timing of payments received. |
• | Net cash provided by investing activities was $5.2 million in the 2016 period compared to net cash used in investing activities of $5.8 million in the 2015 period, primarily driven by (i) an increase in proceeds from repayment of notes receivable of $6.2 million in the 2016 period for which there was no corresponding amount in the 2015 period, (ii) investment in unconsolidated joint ventures of $1.0 million in the 2015 period for which there was no corresponding amount in the 2016 period, and (iii) decreases in purchases of property and equipment of $1.0 million in the 2016 period, compared to $4.8 million in the 2015 period. |
• | Net cash used in financing activities was $34.5 million in the 2016 period compared to net cash provided by financing activities of $176.1 million in the 2015 period. The change was primarily the result of (i) proceeds from issuance of 7% Senior notes of $51.0 million in the 2015 period for which there is no corresponding amount in the 2016 period, (ii) net payments of $36.0 million against the revolving line of credit in the 2016 period compared to net borrowings of $65.0 million in the 2015 period, and (iii) net payments of notes payable of $8.1 million in the 2016 period compared to net borrowings of $61.4 million in the 2015 period, partially offset by (iv) net noncontrolling interest contributions of $18.7 million in the 2016 period compared to $9.2 million in the 2015 period. |
63
Contractual Obligations and Off-Balance Sheet Arrangements
The Company enters into certain off-balance sheet arrangements including joint venture financing, option agreements, land banking arrangements and variable interests in consolidated and unconsolidated entities. These arrangements are more fully described above and in Notes 3 and 15 of “Notes to Consolidated Financial Statements.” In addition, the Company is party to certain contractual obligations, including land purchases and project commitments, which are detailed in Note 15 of “Notes to Consolidated Financial Statements.”
The Company’s contractual obligations consisted of the following at December 31, 2017 (in thousands):
Payments due by period | ||||||||||||||||||||
Total(1) | Less than 1 year (2018) | 1-3 years (2019-2020) | 3-5 years (2021-2022) | More than 5 years | ||||||||||||||||
Notes Payable | $ | 94,515 | $ | 32,213 | $ | 28,866 | $ | 33,436 | $ | — | ||||||||||
Notes Payable interest | 7,025 | 3,767 | 3,132 | 126 | — | |||||||||||||||
Senior Notes | 950,000 | — | 150,000 | 350,000 | 450,000 | |||||||||||||||
Senior Notes interest | 313,761 | 59,563 | 104,391 | 94,729 | 55,078 | |||||||||||||||
Operating leases | 17,802 | 6,998 | 6,624 | 3,740 | 440 | |||||||||||||||
Surety bonds | 234,012 | 216,759 | 17,248 | 5 | — | |||||||||||||||
Purchase obligations: | ||||||||||||||||||||
Land purchases and option commitments (2) | 539,254 | 249,660 | 248,326 | 41,268 | — | |||||||||||||||
Project commitments (3) | 355,524 | 248,867 | 106,657 | — | — | |||||||||||||||
Total | $ | 2,511,893 | $ | 817,827 | $ | 665,244 | $ | 523,304 | $ | 505,518 | ||||||||||
(1) | The summary of contractual obligations above includes interest on all interest-bearing obligations. Interest on all fixed rate interest-bearing obligations is based on the stated rate and is calculated to the stated maturity date. Interest on all variable rate interest bearing obligations is based on the rates effective as of December 31, 2017 and is calculated to the stated maturity date. |
(2) | Represents the Company’s obligations in land purchases, lot option agreements and land banking arrangements. If the Company does not purchase the land under contract, it will forfeit its non-refundable deposit related to the land. Further, reflects the full contractual amount and there may be existing deposits that net against such amount, and the actual amount may change if the Company decides to acquire the land through a joint venture or land bank arrangement, if at all. |
(3) | Represents the Company’s homebuilding project purchase commitments for developing and building homes in the ordinary course of business. |
Inflation
The Company’s revenues and profitability may be affected by increased inflation rates and other general economic conditions. In periods of high inflation, demand for the Company’s homes may be reduced by increases in mortgage interest rates. Further, the Company’s profits will be affected by its ability to recover through higher sales prices, increases in the costs of land, construction, labor and administrative expenses. The Company’s ability to raise prices at such times will depend upon demand and other competitive factors.
Critical Accounting Policies
The Company’s financial statements have been prepared in accordance with U.S. generally accepted accounting principles. The preparation of these financial statements requires management to make estimates and judgments that affect the reported amounts of assets and liabilities at the date of the financial statements and the reported amounts of revenues and costs and expenses during the reporting period. On an on-going basis, management evaluates its estimates and judgments, including those which impact its most critical accounting policies. Management bases its estimates and judgments on historical experience and on various other factors that are believed to be reasonable under the circumstances. Actual results may differ from these estimates under different assumptions or conditions. Management believes that the following accounting policies are among the most important to a portrayal of the Company’s financial condition and results of operations and require among the most difficult, subjective or complex judgments:
64
Real Estate Inventories and Cost of Sales
Real estate inventories are carried at cost net of impairment losses, if any. Real estate inventories consist primarily of deposits to purchase land, raw land, lots under development, homes under construction, completed homes and model homes of real estate projects. All direct and indirect land costs, offsite and onsite improvements and applicable interest and other carrying charges are capitalized to real estate projects during periods when the project is under development. Land, offsite costs and all other common costs are allocated to land parcels benefited based upon relative fair values before construction. Onsite construction costs and related carrying charges (principally interest and property taxes) are allocated to the individual homes within a phase based upon the relative sales value of the homes. The estimation process involved in determining relative fair values and sales values is inherently uncertain because it involves estimates of current market values for land parcels before construction as well as future sales values of individual homes within a phase. The Company’s estimate of future sales values is supported by the Company’s budgeting process. The estimate of future sales values is inherently uncertain because it requires estimates of current market conditions as well as future market events and conditions. Additionally, in determining the allocation of costs to a particular land parcel or individual home, the Company relies on project budgets that are based on a variety of assumptions, including assumptions about construction schedules and future costs to be incurred. It is possible that actual results could differ from budgeted amounts for various reasons, including construction delays, increases in costs which have not yet been committed, or unforeseen issues encountered during construction that fall outside the scope of contracts obtained. While the actual results for a particular construction project are accurately reported over time, a variance between the budget and actual costs could result in the understatement or overstatement of costs and a related impact on gross margins in a specific reporting period. To reduce the potential for such distortion, the Company has set forth procedures which have been applied by the Company on a consistent basis, including assessing and revising project budgets on a monthly basis, obtaining commitments from subcontractors and vendors for future costs to be incurred, reviewing the adequacy of warranty accruals and historical warranty claims experience, and utilizing the most recent information available to estimate costs. The variances between budget and actual amounts identified by the Company have historically not had a material impact on its consolidated results of operations. Management believes that the Company’s policies provide for reasonably dependable estimates to be used in the calculation and reporting of costs. The Company relieves its accumulated real estate inventories through cost of sales by the budgeted amount of cost of homes sold, as described more fully below in the section entitled “Sales and Profit Recognition.”
Impairment of Real Estate Inventories
The Company accounts for its real estate inventories in accordance with FASB ASC Topic 360, Property, Plant & Equipment. ASC Topic 360 requires impairment losses to be recorded on real estate inventories when indicators of impairment are present and the undiscounted cash flows estimated to be generated by real estate inventories are less than the carrying amount of such assets. Indicators of impairment include a decrease in demand for housing due to softening market conditions, competitive pricing pressures which reduce the average sales price of homes, which includes sales incentives for homebuyers, slowing sales absorption rates (calculated as net new homes orders divided by average sales locations for a given period), a decrease in home values in the markets in which the Company operates, significant decreases in gross margins and a decrease in project cash flows for a particular project.
For land and land under development, homes completed and under construction and model homes, the Company estimates expected cash flows at the project level by maintaining current budgets using recent historical information and current market assumptions. The Company updates project budgets and cash flows of each real estate project on a quarterly basis to determine whether the estimated remaining undiscounted future cash flows of the project are more or less than the carrying amount (net book value) of the asset. If the undiscounted cash flows are more than the net book value of the project, then there is no impairment. If the undiscounted cash flows are less than the net book value of the asset, then the asset is deemed to be impaired and is written-down to its fair value. Fair value represents the amount at which an asset could be bought or sold in a current transaction between willing parties (i.e., other than a forced or liquidation sale). Management determines the estimated fair value of each project by determining the present value of estimated future cash flows at discount rates that are commensurate with the risk of each project. The estimation process involved in determining if assets have been impaired and in the determination of fair value is inherently uncertain because it requires estimates of future revenues and costs, current market yields as well as future events and conditions. As described more fully above in the section entitled “Real Estate Inventories and Cost of Sales,” estimates of revenues and costs are supported by the Company’s budgeting process.
Under FASB ASC Topic 360, when indicators of impairment are present the Company is required to make certain assumptions to estimate undiscounted future cash flows of a project, which include: (i) estimated sales prices, including sales incentives, (ii) anticipated sales absorption rates and sales volume, (iii) project costs incurred to date and the estimated future costs of the project based on the project budget, (iv) the carrying costs related to the time a project is actively selling until it closes the final unit in the project, and (v) alternative strategies including selling the land to a third-party or temporarily
65
suspending development on the project. During the year ended December 31, 2017, no indicators of impairment were noted by the Company.
The assumptions and judgments used by the Company in the estimation process to determine the future undiscounted cash flows of a project and its fair value are inherently uncertain and require a substantial degree of judgment. The realization of the Company’s real estate inventories is dependent upon future uncertain events and market conditions. Due to the subjective nature of the estimates and assumptions used in determining the future cash flows of a project, the continued decline in the current housing market, the uncertainty in the banking and credit markets, actual results could differ materially from current estimates.
These estimates are dependent on specific market or sub-market conditions for each subdivision. While the Company considers available information to determine what it believes to be its best estimates as of the end of a reporting period, these estimates are subject to change in future reporting periods as facts and circumstances change. Local market-specific conditions that may impact these estimates for a subdivision include:
• | historical subdivision results, and actual operating profit, base selling prices and home sales incentives; |
• | forecasted operating profit for homes in backlog; |
• | the intensity of competition within a market or sub-market, including publicly available home sales prices and home sales incentives offered by our competitors; |
• | increased levels of home foreclosures; |
• | the current sales pace for active subdivisions; |
• | subdivision specific attributes, such as location, availability of lots in the sub-market, desirability and uniqueness of subdivision location and the size and style of homes currently being offered; |
• | changes by management in the sales strategy of a given subdivision; and |
• | current local market economic and demographic conditions and related trends and forecasts. |
These and other local market-specific conditions that may be present are considered by personnel in the Company’s homebuilding divisions as they prepare or update the forecasted assumptions for each subdivision. Quantitative and qualitative factors other than home sales prices could significantly impact the potential for future impairments. The sales objectives can differ among subdivisions, even within a given sub-market. For example, facts and circumstances in a given subdivision may lead the Company to price its homes with the objective of yielding a higher sales absorption pace, while facts and circumstances in another subdivision may lead the Company to price its homes to minimize deterioration in home gross margins, even though this could result in a slower sales absorption pace. Furthermore, the key assumptions included in estimated future undiscounted cash flows may be interrelated. For example, a decrease in estimated base sales price or an increase in home sales incentives may result in a corresponding increase in sales absorption pace. Additionally, a decrease in the average sales price of homes to be sold and closed in future reporting periods for one subdivision that has not been generating what management believes to be an adequate sales absorption pace may impact the estimated cash flow assumptions of a nearby subdivision. Changes in key assumptions, including estimated construction and land development costs, absorption pace, selling strategies or discount rates could materially impact future cash flow and fair value estimates. Due to the number of possible scenarios that would result from various changes in these factors, the Company does not believe it is possible to develop a sensitivity analysis with a level of precision that would be meaningful to an investor.
Management assesses land deposits for impairment when estimated land values are deemed to be less than the agreed upon contract price. The Company considers changes in market conditions, the timing of land purchases, the ability to renegotiate with land sellers the terms of the land option contract in question, the availability and best use of capital, and other factors. If land values are determined to be less than the contract price, the future project will not be purchased. The Company records abandoned land deposits and related pre-acquisition costs to cost of sales-land in the consolidated statement of operations in the period that it is abandoned.
The Company evaluates homebuilding assets for impairment when indicators of impairments are present. Indicators of potential impairment include, but are not limited to, a decrease in housing market values, sales absorption rates, and sales prices. For the years ended December 31, 2017, 2016 and 2015, there were no impairment charges recorded. During the year ended December 31, 2017, no indicators of impairment were noted by the Company.
66
Variable Interest Entities
The Company accounts for variable interest entities in accordance with ASC 810, Consolidation (“ASC 810”). Under ASC 810, a variable interest entity (“VIE”) is created when: (a) the equity investment at risk in the entity is not sufficient to permit the entity to finance its activities without additional subordinated financial support provided by other parties, including the equity holders; (b) the entity’s equity holders as a group either (i) lack the direct or indirect ability to make decisions about the entity, (ii) are not obligated to absorb expected losses of the entity or (iii) do not have the right to receive expected residual returns of the entity; or (c) the entity’s equity holders have voting rights that are not proportionate to their economic interests, and the activities of the entity involve or are conducted on behalf of the equity holder with disproportionately few voting rights. If an entity is deemed to be a VIE pursuant to ASC 810, the enterprise that has both (i) the power to direct the activities of a VIE that most significantly impact the entity’s economic performance and (ii) the obligation to absorb the expected losses of the entity or right to receive benefits from the entity that could be potentially significant to the VIE is considered the primary beneficiary and must consolidate the VIE. In accordance with ASC 810, we perform ongoing reassessments of whether an enterprise is the primary beneficiary of a VIE.
As of December 31, 2017 and 2016, the Company had 13 and 11 joint ventures, respectively, which were deemed to be VIEs under ASC 810 for which the Company is considered the primary beneficiary. The Company manages the joint ventures, by using its sales, development and operations teams and has significant control over these projects and therefore the power to direct the activities that most significantly impact the joint venture’s performance, in addition to being obligated to absorb expected losses or receive benefits from the joint venture, and therefore the Company is deemed to be the primary beneficiary of these VIEs.
Under ASC 810, a non-refundable deposit paid to an entity is deemed to be a variable interest that will absorb some or all of the entity’s expected losses if they occur. Our land purchase and lot option deposits generally represent our maximum exposure to the land seller if we elect not to purchase the optioned property. In some instances, we may also expend funds for due diligence, development and construction activities with respect to optioned land prior to takedown. Such costs are classified as inventories owned, which we would have to write-off should we not exercise the option. Therefore, whenever we enter into a land option or purchase contract with an entity and make a non-refundable deposit, a VIE may have been created. As of December 31, 2017 and 2016, the Company was not required to consolidate any VIEs nor did the Company write-off any costs that had been capitalized under lot option contracts. In accordance with ASC 810, we perform ongoing reassessments of whether we are the primary beneficiary of a VIE.
Business Combinations
The Company accounts for business combinations in accordance with FASB ASC Topic 805, Business Combinations. ASC Topic 805 requires that business combinations be accounted for under the acquisition method. The acquisition method requires: i) identifying the acquirer; ii) determining the acquisition date; iii) recognizing and measuring the identifiable assets acquired, the liabilities assumed, and any noncontrolling interest in the acquiree; and iv) recognizing and measuring goodwill or a gain from a bargain purchase. Under this method, all acquisition costs are expensed as incurred, and the assets and liabilities of the acquired entity are recorded at their acquisition date fair value, with any excess recorded as goodwill. Goodwill is allocated to the appropriate segments which benefited from the business combination when the goodwill arose. The allocation of the purchase price to the fair value of acquired assets and liabilities assumed requires the use of significant estimates and assumptions. Significant assumptions can include i) expected selling prices of acquired projects, ii) anticipated sales pace of acquired projects , iii) cost to complete estimates of acquired projects, iv) highest and best use of acquired projects prior to acquisition, and v) comparable land values. Where appropriate, we consult with external advisors to assist with the determination of fair value.
Related Party Transactions
See Note 10 of “Notes to Consolidated Financial Statements” for the year ended December 31, 2017 for a description of the Company’s transactions with related parties.
Recently Issued Accounting Standards
See Note 1 of “Notes to Consolidated Financial Statements” for a description of the recently issued accounting standards.
Item 7A. | Quantitative and Qualitative Disclosures About Market Risk |
The Company’s exposure to market risk for changes in interest rates relates to the Company’s floating rate debt with a total outstanding balance at December 31, 2017 of $93.9 million where the interest rate is variable based upon certain bank reference or prime rates. The average prime rate during the year ended December 31, 2017 ranged between 3.75% and 4.50%.
67
Based upon the amount of variable rate debt held by the Company, and holding the variable rate debt balance constant, each 1% increase in interest rates would increase the amount of interest expense incurred by the Company by approximately $0.9 million.
The following table presents principal cash flows by scheduled maturity, interest rates and the estimated fair value of our long-term fixed rate debt obligations as of December 31, 2017 (dollars in thousands):
Year ended December 31, | Fair Value at December 31, 2017 | ||||||||||||||||||||||||||||||
2018 | 2019 | 2020 | 2021 | 2022 | Thereafter | Total | |||||||||||||||||||||||||
Fixed rate debt | $ | 589 | $ | 150,000 | $ | — | $ | — | $ | 350,000 | $ | 450,000 | $ | 950,589 | $ | 973,339 | |||||||||||||||
Interest rate | 7.00 | % | 5.75 | % | — | — | 7.00 | % | 5.875 | % | |||||||||||||||||||||
The Company does not utilize swaps, forward or option contracts on interest rates, foreign currencies or commodities, or other types of derivative financial instruments as of or during the year ended December 31, 2017. The Company does not enter into or hold derivatives for trading or speculative purposes.
68
Item 8. | Financial Statements and Supplementary Data |
The information required by this Item is incorporated by reference to the financial statements set forth in Section 15 of Part IV of this Annual Report, “Exhibits and Financial Statement Schedules”.
Item 9. | Changes in and Disagreements with Accountants on Accounting and Financial Disclosure |
None.
69
Item 9A. | Controls and Procedures |
Conclusion Regarding the Effectiveness of Disclosure Controls and Procedures
As of the end of the period covered by this annual report on Form 10-K, we carried out an evaluation, under the supervision and with the participation of our management, including our Chief Executive Officer (principal executive officer) and Chief Financial Officer (principal financial officer), of the effectiveness of the design and operation of our disclosure controls and procedures as such term is defined in Exchange Act Rules 13a-15(e) and 15d-15(e), including controls and procedures to timely alert management to material information relating to William Lyon Homes and subsidiaries required to be included in our periodic SEC filings. Based on that evaluation, our Chief Executive Officer and Chief Financial Officer have concluded that our disclosure controls and procedures were effective as of the end of the period covered by this report.
Our management, including our Chief Executive Officer and Chief Financial Officer, does not expect that our disclosure controls and procedures will prevent all errors and all fraud. A control system, no matter how well conceived and operated, can provide only reasonable, not absolute, assurance that the objectives of the control system are met. Further, the design of a control system must reflect the fact that there are resource constraints, and the benefits of controls must be considered relative to their costs. Because of the inherent limitations in all control systems, no evaluation of controls can provide absolute assurance that all control issues and instances of fraud, if any, have been detected. These inherent limitations include the realities that judgments in decision-making can be faulty and that breakdowns can occur because of simple error and mistake. Additionally, controls can be circumvented by the individual acts of some persons, by collusion of two or more people or by management override of controls.
The design of any system of controls also is based in part upon certain assumptions about the likelihood of future events, and there can be no assurance that any design will succeed in achieving its stated goals under all potential future conditions. Over time, a control may become inadequate because of changes in conditions or because the degree of compliance with the policies or procedures may deteriorate. Because of the inherent limitations in a cost-effective control system, misstatements due to error or fraud may occur and may not be detected.
Management’s Annual Report on Internal Control Over Financial Reporting
Our management is responsible for establishing and maintaining adequate internal control over financial reporting, as such term is defined in Exchange Act Rules 13a-15(f) and 15d-15(f). Our internal control over financial reporting is a process designed to provide reasonable assurance regarding the reliability of financial reporting and the preparation of our financial statements for external purposes in accordance with U.S. generally accepted accounting principles. Because of its inherent limitations, internal control over financial reporting may not prevent or detect misstatements. Also, projections of any evaluation of effectiveness to future periods are subject to the risk that controls may become inadequate because of changes in conditions, or that the degree of compliance with the policies or procedures may deteriorate.
Under the supervision and with the participation of our management, including our Chief Executive Officer and Chief Financial Officer, we conducted an evaluation of the effectiveness of our internal control over financial reporting based on the criteria in Internal Control-Integrated Framework (2013 framework) issued by the Committee of Sponsoring Organizations of the Treadway Commission. Based on our evaluation under the framework in Internal Control-Integrated Framework, our management concluded that our internal control over financial reporting was effective as of December 31, 2017.
Management's assessment of internal control over financial reporting as of December 31, 2017 has been audited by KPMG LLP, our independent registered public accounting firm, as stated in its attestation report which is included herein.
Changes in Internal Control over Financial Reporting
There were no changes in our internal control over financial reporting (as defined in Rule 13a-15(f) under the Exchange Act) that occurred during the quarter ended December 31, 2017 that have materially affected, or are reasonably likely to materially affect, our internal control over financial reporting.
70
REPORT OF INDEPENDENT REGISTERED PUBLIC ACCOUNTING FIRM
To the Board of Directors and Stockholders
William Lyon Homes, Inc.:
Opinion on Internal Control Over Financial Reporting
We have audited William Lyon Homes, Inc. and subsidiaries’ (the “Company”) internal control over financial reporting as of December 31, 2017, based on criteria established in Internal Control - Integrated Framework (2013) issued by the Committee of Sponsoring Organizations of the Treadway Commission (“COSO”). In our opinion, the Company maintained, in all material respects, effective internal control over financial reporting as of December 31, 2017, based on criteria established in Internal Control - Integrated Framework (2013) issued by COSO.
We also have audited, in accordance with the standards of the Public Company Accounting Oversight Board (United States) (“PCAOB”), the consolidated balance sheets of the Company as of December 31, 2017 and 2016, the related consolidated statements of operations, equity, and cash flows for each of the years in the three-year period ended December 31, 2017, and the related notes (collectively, the “consolidated financial statements”), and our report dated February 22, 2018, expressed an unqualified opinion on those consolidated financial statements.
Basis for Opinion
The Company’s management is responsible for maintaining effective internal control over financial reporting and for its assessment of the effectiveness of internal control over financial reporting, included in the accompanying Management’s Report on Internal Control over Financial Reporting appearing under Item 9A. Our responsibility is to express an opinion on the Company’s internal control over financial reporting based on our audit. We are a public accounting firm registered with the PCAOB and are required to be independent with respect to the Company in accordance with the U.S. federal securities laws and the applicable rules and regulations of the Securities and Exchange Commission and the PCAOB.
We conducted our audit in accordance with the standards of the PCAOB. Those standards require that we plan and perform the audit to obtain reasonable assurance about whether effective internal control over financial reporting was maintained in all material respects. Our audit of internal control over financial reporting included obtaining an understanding of internal control over financial reporting, assessing the risk that a material weakness exists, and testing and evaluating the design and operating effectiveness of internal control based on the assessed risk. Our audit also included performing such other procedures as we considered necessary in the circumstances. We believe that our audit provides a reasonable basis for our opinion.
Definition and Limitations of Internal Control Over Financial Reporting
A company’s internal control over financial reporting is a process designed to provide reasonable assurance regarding the reliability of financial reporting and the preparation of financial statements for external purposes in accordance with generally accepted accounting principles. A company’s internal control over financial reporting includes those policies and procedures that (1) pertain to the maintenance of records that, in reasonable detail, accurately and fairly reflect the transactions and dispositions of the assets of the company; (2) provide reasonable assurance that transactions are recorded as necessary to permit preparation of financial statements in accordance with generally accepted accounting principles, and that receipts and expenditures of the company are being made only in accordance with authorizations of management and directors of the company; and (3) provide reasonable assurance regarding prevention or timely detection of unauthorized acquisition, use, or disposition of the company’s assets that could have a material effect on the financial statements.
Because of its inherent limitations, internal control over financial reporting may not prevent or detect misstatements. Also, projections of any evaluation of effectiveness to future periods are subject to the risk that controls may become inadequate because of changes in conditions, or that the degree of compliance with the policies or procedures may deteriorate.
/s/ KPMG LLP
Irvine, California
February 22, 2018
71
Item 9B. | Other Information |
None.
72
PART III
Item 10. | Directors, Executive Officers and Corporate Governance |
The information required by this item will be set forth in the Proxy Statement for our 2018 Annual Meeting of Stockholders, to be filed by the Company with the U.S. Securities and Exchange Commission no later than 120 days after the close of our fiscal year ended December 31, 2017 (the "Proxy Statement"). For the limited purpose of providing the information necessary to comply with this Item 10, the Proxy Statement is incorporated herein by reference.
Item 11. | Executive Compensation |
The information required by this item will be set forth in the Proxy Statement. For the limited purpose of providing the information necessary to comply with this Item 11, the Proxy Statement is incorporated herein by reference.
Item 12. | Security Ownership of Certain Beneficial Owners and Management and Related Stockholder Matters |
The information required by this item will be set forth in the Proxy Statement. For the limited purpose of providing the information necessary to comply with this Item 12, the Proxy Statement is incorporated herein by reference.
Item 13. | Certain Relationships and Related Transactions, and Director Independence |
The information required by this item will be set forth in the Proxy Statement. For the limited purpose of providing the information necessary to comply with this Item 13, the Proxy Statement is incorporated herein by reference.
Item 14. | Principal Accountant Fees and Services |
The information required by this item will be set forth in the Proxy Statement. For the limited purpose of providing the information necessary to comply with this Item 14, the Proxy Statement is incorporated herein by reference.
73
PART IV
Item 15. | Exhibits and Financial Statement Schedules |
(a)(1) Financial Statements
The following financial statements of the Company are included in a separate section of this Annual Report on Form 10-K commencing on the page numbers specified below:
Page | |
Financial Statements as of December 31, 2017 and 2016, and for the years ended December 31, 2017, 2016 and 2015. | |
Report of Independent Registered Public Accounting Firm | |
Consolidated Balance Sheets | |
Consolidated Statements of Operations | |
Consolidated Statements of Equity | |
Consolidated Statements of Cash Flows | |
Notes to Consolidated Financial Statements | |
(2) Financial Statement Schedules:
Financial Statement Schedules have been omitted because they are either not required or not applicable, or because the information required to be presented is included in the financial statements or the notes thereto included in this Annual Report.
(3) Listing of Exhibits:
EXHIBIT INDEX
Exhibit Number | Description | ||
Purchase and Sale Agreement, dated as of June 22, 2014, by and among PNW Home Builders, L.L.C., PNW Home Builders North, L.L.C., PNW Home Builders South, L.L.C., Crescent Ventures, L.L.C. and William Lyon Homes, Inc. (incorporated by reference to Exhibit 2.1 to the Company's Current Report on Form 8-K filed on June 23, 2014). | |||
Third Amended and Restated Certificate of Incorporation of William Lyon Homes (incorporated by reference to William Lyon Homes’s Current Report on Form 8-K filed with the Commission on May 28, 2013). | |||
Amended and Restated Bylaws of William Lyon Homes (incorporated by reference to William Lyon Homes’s Current Report on Form 8-K filed with the Commission on May 28, 2013). | |||
Amended and Restated Bylaws of William Lyon Homes (Incorporated by reference to Exhibit 3.1 of the Company's Form 8-K filed July 22, 2015) | |||
Indenture (including form of 8.5% Senior Note due 2020), dated as of November 8, 2012, by and between William Lyon Homes, Inc., William Lyon Homes, certain of William Lyon Homes’s subsidiaries (as guarantors) and U.S. Bank National Association, as trustee (incorporated by reference to William Lyon Homes’s Current Report on Form 8-K filed with the Commission on November 8, 2012). | |||
Officers' certificate, dated October 24, 2013, delivered pursuant to the Indenture, and setting forth the terms of the notes (incorporated by reference to Exhibit 4.1 of the Company's Current Report on Form 8-K filed on October 25, 2013). | |||
74
Exhibit Number | Description | ||
Indenture (including form of 5.75% Senior Notes due 2019), dated March 31, 2014, among William Lyon Homes, Inc., William Lyon Homes, certain of William Lyon Homes' subsidiaries (as guarantors) and U.S. Bank National Association, as trustee (incorporated by reference to Exhibit 4.1 to the Company's Current Report on Form 8-K filed on April 1, 2014). | |||
Indenture (including form of 7.00% Senior Notes due 2022), dated August 11, 2014, among WLH PNW Finance Corp., the guarantors from time to time party thereto and U.S. Bank National Association, as trustee (incorporated by reference to Exhibit 4.1 of the Company's Form 8-K filed August 13, 2014). | |||
Second Supplemental Indenture, dated as of August 12, 2014, among William Lyon Homes, Inc., the subsidiary guarantors named therein and U.S. Bank National Association, relating to the 8.5% Senior Notes due 2020 (incorporated by reference to Exhibit 4.3 of the Company's Form 8-K filed August 13, 2014). | |||
First Supplemental Indenture, dated as of August 12, 2014, among William Lyon Homes, Inc., the subsidiary guarantors named therein and U.S. Bank National Association, relating to the 5.75% Senior Notes due 2019 (incorporated by reference to Exhibit 4.4 of the Company's Form 8-K filed August 13, 2014). | |||
First Supplemental Indenture, dated as of August 12, 2014, among William Lyon Homes, Inc., William Lyon Homes, the subsidiary guarantors named therein and U.S. Bank National Association, relating to the 7.00% Senior Notes due 2022 (incorporated by reference to Exhibit 4.5 of the Company's Form 8-K filed August 13, 2014). | |||
Second Supplemental Indenture, dated as of August 12, 2014, among William Lyon Homes, Inc., the subsidiary guarantors named therein and U.S. Bank National Association, relating to the 7.00% Senior Notes due 2022 (incorporated by reference to Exhibit 4.6 of the Company's Form 8-K filed August 13, 2014). | |||
Indenture, dated November 21, 2014, between William Lyon Homes and U.S. Bank National Association, as trustee (incorporated by reference to Exhibit 4.1 to William Lyon Homes’ Current Report on Form 8-K filed with the SEC on November 21, 2014). | |||
First Supplemental Indenture (including form of 5.50% Senior Subordinated Amortizing Notes due December 1, 2017), dated November 21, 2014, between William Lyon Homes and U.S. Bank National Association, as trustee (incorporated by reference to Exhibit 4.2 to William Lyon Homes’ Current Report on Form 8-K filed with the SEC on November 21, 2014). | |||
Purchase Contract Agreement (including form of unit and form of prepaid stock purchase contract), dated November 21, 2014, among William Lyon Homes, U.S. Bank National Association, as trustee, and U.S. Bank National Association, as purchase contract agent and as attorney-in-fact for the holders from time to time as provided therein (incorporated by reference to Exhibit 4.3 to William Lyon Homes’ Current Report on Form 8-K filed with the SEC on November 21, 2014). | |||
Officers’ Certificate, dated September 15, 2015, delivered pursuant to the Indenture dated August 11, 2014 relating to the 7.00% Senior Notes due 2022, and setting forth the terms of the Additional Notes (incorporated by reference to Exhibit 4.1 of the Company’s Form 8-K filed September 15, 2015) | |||
Indenture dated January 31, 2017, among California Lyon, the Guarantors and U.S. Bank National Association, as trustee (incorporated by reference to Exhibit 4.1 of the Company’s Form 8-K filed January 31, 2017) | |||
Form of 5.875% Senior Notes due 2025 (incorporated by reference to Exhibit 4.2 of the Company’s Form 8-K filed January 31, 2017) | |||
Third Supplemental Indenture, dated January 31, 2017, among California Lyon, Parent, the guarantors party thereto and U.S. Bank National Association, as trustee (incorporated by reference to Exhibit 4.3 of the Company’s Form 8-K filed January 31, 2017) | |||
75
Exhibit Number | Description | ||
10.1 | Form of Indemnity Agreement, between William Lyon Homes, a Delaware corporation, and the directors and officers of William Lyon Homes (incorporated by reference to William Lyon Homes’s Annual Report on Form 10-K for the year-ended December 31, 1999 (File No. 333-88569)). | ||
The Presley Companies Non-Qualified Retirement Plan for Outside Directors (incorporated by reference to William Lyon Homes’s Annual Report on Form 10-K for the year-ended December 31, 2002). | |||
Aircraft Purchase and Sale Agreement dated as of September 3, 2009, by and between Presley CMR, Inc., and Martin Aviation, Inc., or its designee (incorporated by reference to William Lyon Homes’s Current Report on Form 8-K filed with the Commission on September 10, 2009). | |||
Secured Promissory Note dated September 9, 2009 from Martin Aviation, Inc., a California corporation payable to William Lyon Homes, Inc., a California corporation (incorporated by reference to William Lyon Homes’s Current Report on Form 8-K filed with the Commission on September 10, 2009). | |||
Aircraft Mortgage and Security Agreement between Martin Aviation, Inc., a California corporation and William Lyon Homes, Inc., dated as of September 9, 2009 (incorporated by reference to William Lyon Homes’s Current Report on Form 8-K filed with the Commission on September 10, 2009). | |||
Form of Class A Common Stock Registration Rights Agreement, dated as of February 25, 2012, by and among William Lyon Homes and the Holders (as defined therein) (incorporated by reference to the Company’s Current Report on Form 8-K filed with the Commission on March 6, 2012). | |||
Class B Common Stock and Warrant Purchase Agreement, dated as of February 25, 2012, by and between William Lyon Homes and the Purchaser (as defined therein) (incorporated by reference to the Company’s Current Report on Form 8-K filed with the Commission on March 6, 2012). | |||
Warrant to Purchase Shares of Class B Common Stock of William Lyon Homes, dated as of February 25, 2012 (incorporated by reference to the Company’s Current Report on Form 8-K filed with the Commission on March 6, 2012). | |||
Class B Common Stock Registration Rights Agreement, dated as of February 25, 2012, by and among William Lyon Homes and the Holders (as defined therein) (incorporated by reference to the Company’s Current Report on Form 8-K filed with the Commission on March 6, 2012). | |||
Form of Convertible Preferred Stock and Class C Common Stock Registration Rights Agreement, dated as of February 25, 2012, by and among William Lyon Homes and the Holders party thereto (incorporated by reference to the Company’s Current Report on Form 8-K filed with the Commission on March 6, 2012). | |||
Employment Agreement, dated as of February 25, 2012, by and among William Lyon Homes, William Lyon Homes, Inc. and General William Lyon (incorporated by reference to the Company’s Current Report on Form 8-K filed with the Commission on March 6, 2012). | |||
Employment Agreement, dated as of February 25, 2012, by and among William Lyon Homes, William Lyon Homes, Inc. and William H. Lyon (incorporated by reference to the Company’s Current Report on Form 8-K filed with the Commission on March 6, 2012). | |||
William Lyon Homes 2012 Equity Incentive Plan (incorporated by reference to the Company’s Registration Statement on Form S-1/A filed with the Commission on December 6, 2012). | |||
William Lyon Homes 2012 Equity Incentive Plan form of Stock Option Agreement (incorporated by reference to the Company’s Registration Statement on Form S-1/A filed with the Commission on December 6, 2012). | |||
76
Exhibit Number | Description | ||
William Lyon Homes 2012 Equity Incentive Plan form of Restricted Stock Award Agreement (incorporated by reference to the Company’s Registration Statement on Form S-1/A filed with the Commission on December 6, 2012). | |||
Form of Employment Agreement, dated September 1, 2012 (incorporated by reference to the Company’s Registration Statement on Form S-1/A filed with the Commission on December 6, 2012). | |||
Class A Common Stock and Convertible Preferred Stock Subscription Agreement, dated October 12, 2012, by and between William Lyon Homes and WLH Recovery Acquisition LLC (incorporated by reference to the Company’s Registration Statement on Form S-1/A filed with the Commission on December 6, 2012). | |||
Amendment of and Joinder to Class A Common Stock Registration Rights Agreement, dated October 12, 2012, by and between WLH Recovery Acquisition LLC and William Lyon Homes (incorporated by reference to the Company’s Registration Statement on Form S-1/A filed with the Commission on December 6, 2012). | |||
Amendment of and Joinder to Convertible Preferred Stock and Class C Common Stock Registration Rights Agreement, dated October 12, 2012, by and between WLH Recovery Acquisition LLC and William Lyon Homes (incorporated by reference to the Company’s Registration Statement on Form S-1/A filed with the Commission on December 6, 2012). | |||
William Lyon Homes 2012 Equity Incentive Plan Form of Restricted Stock Award Agreement (performance-based) (incorporated by reference to William Lyon Homes’s Form S-1 Registration Statement filed April 9, 2013 (File No. 333-187819)). | |||
Revised Form of Employment Agreement, dated April 1, 2013 (incorporated by reference to William Lyon Homes’s Form S-1 Registration Statement filed April 9, 2013 (File No. 333-187819)). | |||
Amendment to Employment Agreement, dated March 6, 2013, by and between William Lyon Homes, Inc., and Matthew R. Zaist (incorporated by reference to William Lyon Homes’s Form S-1 Registration Statement filed April 9, 2013 (File No. 333-187819)). | |||
Amendment No. 1 to Warrant to Purchase Shares of Class B Common Stock (incorporated by reference to William Lyon Homes’s Current Report on Form 8-K filed with the Commission on May 28, 2013). | |||
Form of indemnification agreement (incorporated by reference to William Lyon Homes’s Current Report on Form 8-K filed with the Commission on May 28, 2013). | |||
Amendment No. 1 to the William Lyon Homes 2012 Equity Incentive Plan (incorporated by reference to Exhibit 10.23(a) to the Company’s Form S-1 Registration Statement filed May 6, 2013 (File No. 333-187819)). | |||
Credit Agreement among William Lyon Homes, Inc., as Borrower, William Lyon Homes, as Parent, The Lenders from time to time party thereto, and Credit Suisse AG, as Administrative Agent, dated as of August 7, 2013 (incorporated by reference to Exhibit 10.1 to the Company’s Quarterly Report on Form 10-Q for the period ended September 30, 2013). | |||
Amendment No. 2 to the William Lyon Homes 2012 Equity Incentive Plan (incorporated by reference to Exhibit 99.3 of the Company’s Form S-8 Registration Statement filed August 12, 2013 (File No. 333-190571)). | |||
77
Exhibit Number | Description | ||
William Lyon Homes 2012 Equity Incentive Plan Form of Restricted Stock Award Agreement (performance-based) (incorporated by reference to Exhibit 10.42 of the Company's Form S-4 Registration Statement filed December 27, 2013 (file no. 333-193112)). | |||
William Lyon Homes 2012 Equity Incentive Plan Form of Restricted Stock Award Agreement. (incorporated by reference to Exhibit 10.43 of the Company's Form S-4 Registration Statement filed December 27, 2013 (file no. 333-193112)). | |||
William Lyon Homes 2012 Equity Incentive Plan Form of Stock Option Agreement. (incorporated by reference to Exhibit 10.44 of the Company's Form S-4 Registration Statement filed December 27, 2013 (file no. 333-193112)). | |||
William Lyon Homes 2012 Equity Incentive Plan Form of Amendment No. 1 to Stock Option Agreement (Five-Year Options) (incorporated by reference to Exhibit 10.45 of the Company's Form S-4 Registration Statement filed December 27, 2013 (file no. 333-193112)). | |||
Bridge Loan Agreement, dated as of August 12, 2014, among William Lyon Homes, Inc., as Borrower, William Lyon Homes, as Parent, the Lenders from time to time party thereto, and J.P. Morgan Chase Bank, N.A., as Administrative Agent (incorporated by reference to Exhibit 10.1 of the Company's Form 8-K filed August 13, 2014). | |||
Amendment No. 1 to Credit Agreement among William Lyon Homes, Inc., as Borrower, William Lyon Homes, as Parent, The Lenders from time to time party thereto, and Credit Suisse AG, as Administrative Agent, dated as of August 7, 2013 (incorporated by reference to Exhibit 10.2 of the Company's Form 10-Q filed on November 12, 2014). | |||
Amendment No. 1 to Employment Agreement, dated as of February 25, 2012, by and among William Lyon Homes, William Lyon Homes, Inc. and General William Lyon (incorporated by reference to Exhibit 10.1 of the Company's Form 8-K filed December 31, 2014). | |||
Amendment No. 1 to Employment Agreement, dated as of February 25, 2012, by and among William Lyon Homes, William Lyon Homes, Inc. and William H. Lyon (incorporated by reference to Exhibit 10.2 of the Company's Form 8-K filed December 31, 2014). | |||
Amendment and Restatement Agreement dated as of March 27, 2015 among William Lyon Homes, Inc., a California corporation, as Borrower, William Lyon Homes, a Delaware corporation, as Parent, each subsidiary of the Borrower party thereto, the lenders listed on Schedule 1 thereto, and Credit Suisse AG, as administrative agent (incorporated by reference to Exhibit 10.1 of the Company's Quarterly Report on Form 10-Q filed May 8, 2015) | |||
Employment Agreement by and among William Lyon Homes, William Lyon Homes, Inc. and William H. Lyon, dated as of March 31, 2015 (incorporated by reference to Exhibit 10.1 of the Company's Form 8-K filed April 2, 2015) | |||
Employment Agreement by and among William Lyon Homes, William Lyon Homes, Inc. and Matthew R. Zaist, dated as of March 31, 2015 (incorporated by reference to Exhibit 10.2 of the Company's Form 8-K filed April 2, 2015) | |||
Offer Letter by and between William Lyon Homes, Inc. and William Lyon, dated as of March 31, 2015 (incorporated by reference to Exhibit 10.3 of the Company's Form 8-K filed April 2, 2015) | |||
78
Exhibit Number | Description | ||
Amendment No. 1 dated as of December 21, 2015 to the Amended and Restated Credit Agreement dated as of March 27, 2015 among William Lyon Homes, Inc., a California corporation, as Borrower, William Lyon Homes, a Delaware corporation, as Parent, the lenders from time to time party thereto, and Credit Suisse AG, as administrative agent (incorporated by reference to Exhibit 10.40 of the Company's Form 10-K filed March 11, 2016) | |||
William Lyon Homes 2012 Equity Incentive Plan Form of Restricted Stock Award Agreement (Performance Based) (incorporated by reference to Exhibit 10.1 of the Company's Form 10-Q filed May 9, 2016) | |||
William Lyon Homes 2012 Equity Incentive Plan Form of Restricted Stock Award Agreement (incorporated by reference to Exhibit 10.2 of the Company's Form 10-Q filed May 9, 2016) | |||
Offer letter by and between William Lyon Homes, Inc. and General William Lyon, dated as of March 22, 2016 (incorporated by reference to Exhibit 10.1 of the Company's Form 8-K filed March 24, 2016) | |||
Amendment and Restatement Agreement dated as of July 1, 2016 among William Lyon Homes, Inc., a California corporation, as Borrower, William Lyon Homes, a Delaware corporation, as Parent, each subsidiary of the Borrower party thereto, the lenders listed on Schedule 1 thereto, and Credit Suisse AG, as administrative agent (incorporated by reference to Exhibit 10.1 of the Company's Form 8-K filed July 7, 2016) | |||
Amendment No. 1 dated as of January 27, 2017 to the Second Amended and Restated Credit Agreement dated as of July 1, 2016, among William Lyon Homes, Inc., a California corporation, as Borrower, William Lyon Homes, a Delaware corporation, as Parent, the lenders from time to time party thereto, and Credit Suisse AG, as administrative agent (incorporated by reference to Exhibit 10.45 of the Company's Form 10-K filed March 9, 2017) | |||
William Lyon Homes Amended and Restated 2012 Equity Incentive Plan (incorporated by reference to Appendix A of the Registrant’s Definitive Proxy Statement filed with the Commission on April 12, 2017) | |||
Amendment No. 2 dated as of June 16, 2017 to the Second Amended and Restated Credit Agreement dated as of July 1, 2016, among William Lyon Homes, Inc., a California corporation, as Borrower, William Lyon Homes, a Delaware corporation, as Parent, the lenders from time to time party thereto, and Credit Suisse AG, as administrative agent (incorporated by reference to Exhibit 10.1 of the Company's Form 10-Q filed August 8, 2017) | |||
Stock Purchase Agreement, dated as of December 14, 2017, by and between the Company and Lyon Shareholder 2012, LLC (incorporated by reference to Exhibit 10.1 of the Company's Form 8-K filed December 14, 2017) | |||
New Lender Supplement dated as of November 28, 2017 to the Second Amended and Restated Credit Agreement dated as of July 1, 2016, among William Lyon Homes, Inc., a California corporation, as Borrower, William Lyon Homes, a Delaware corporation, as Parent, the lenders from time to time party thereto, and Credit Suisse AG, as administrative agent. | |||
12.1+ | Statement Regarding the Computation of Ratio of Earnings to Fixed Charges for the Years Ended December 31, 2017, 2016, 2015, 2014 and 2013. | ||
21.1+ | List of Subsidiaries of the Company. | ||
23.1+ | Consent of KPMG LLP, Independent Registered Public Accounting Firm. | ||
31.1+ | Certification of Principal Executive Officer Required Under Rule 13a-14(a) of the Securities Exchange Act of 1934, as amended | ||
79
Exhibit Number | Description | ||
31.2+ | Certification of Principal Financial Officer Required Under Rule 13a-14(a) of the Securities Exchange Act of 1934, as amended | ||
32.1* | Certification of Principal Executive Officer Required Under Rule 13a-14(b) of the Securities Exchange Act of 1934, as amended, and 18 U.S.C. Section 1350 | ||
32.2* | Certification of Principal Financial Officer Required Under Rule 13a-14(b) of the Securities Exchange Act of 1934, as amended, and 18 U.S.C. Section 1350 | ||
101.INS* ** | XBRL Instance Document | ||
101.SCH* ** | XBRL Taxonomy Extension Schema Document | ||
101.CAL* ** | XBRL Taxonomy Extension Calculation Linkbase Document | ||
101.DEF* ** | XBRL Taxonomy Extension Definition Linkbase Document | ||
101.LAB* ** | XBRL Taxonomy Extension Label Linkbase Document | ||
101.PRE* ** | XBRL Taxonomy Extension Presentation Linkbase Document | ||
+ | Filed herewith |
† | Management contract or compensatory agreement |
* | The information in Exhibits 32.1 and 32.2 shall not be deemed “filed” for purposes of Section 18 of the Securities Exchange Act of 1934, as amended (the “Exchange Act”), or otherwise subject to the liabilities of that section, nor shall they be deemed incorporated by reference in any filing under the Securities Act of 1933, as amended, or the Exchange Act (including this Report), unless the Registrant specifically incorporates the foregoing information into those documents by reference. |
** | Pursuant to Rule 406T of Regulation S-T, the XBRL information will not be deemed filed for purposes of Section 18 of the Securities Exchange Act of 1934 and will not be deemed filed or part of a registration statement or prospectus for purposes of Sections 11 and 12 of the Securities Act of 1933, or otherwise subject to liability under those Sections. |
80
SIGNATURES
Pursuant to the requirements of Section 13 or 15(d) of the Securities Exchange Act of 1934, the Registrant has duly caused this Annual Report on Form 10-K to be signed on its behalf by the undersigned, thereunto duly authorized, in the City of Newport Beach, State of California, on the 22nd day of February, 2018.
WILLIAM LYON HOMES, | ||
a Delaware corporation | ||
By: | /s/ Matthew R. Zaist | |
Matthew R. Zaist | ||
President & Chief Executive Officer | ||
Pursuant to the requirements of the Securities Exchange Act of 1934, this Report has been signed by the following persons in the capacities and on the dates indicated:
Signature | Title | Date | ||
/s/ Matthew R. Zaist Matthew R. Zaist | President & Chief Executive Officer, Director (Principal Executive Officer) | February 22, 2018 | ||
/s/ Colin T. Severn Colin T. Severn | Senior Vice President, Chief Financial Officer (Principal Financial and Accounting Officer) | February 22, 2018 | ||
/s/ William H. Lyon William H. Lyon | Executive Chairman, Chairman of the Board | February 22, 2018 | ||
/s/ Douglas K. Ammerman Douglas K. Ammerman | Director | February 22, 2018 | ||
/s/ Michael Barr Michael Barr | Director | February 22, 2018 | ||
/s/ Gary H. Hunt Gary H. Hunt | Director | February 22, 2018 | ||
/s/ Matthew R. Niemann Matthew R. Niemann | Director | February 22, 2018 | ||
/s/ Thomas Harrison Thomas Harrison | Director | February 22, 2018 | ||
/s/ Lynn Carlson Schell Lynn Carlson Schell | Director | February 22, 2018 | ||
81
INDEX TO FINANCIAL STATEMENTS
Page | |
Financial Statements as of December 31, 2017 and 2016, and for the years ended December 31, 2017, 2016 and 2015. | |
Report of Independent Registered Public Accounting Firm | |
Consolidated Balance Sheets | |
Consolidated Statements of Operations | |
Consolidated Statements of Equity | |
Consolidated Statements of Cash Flows | |
Notes to Consolidated Financial Statements | |
F-1
REPORT OF INDEPENDENT REGISTERED PUBLIC ACCOUNTING FIRM
To the Board of Directors and Stockholders
William Lyon Homes, Inc.:
Opinion on the Consolidated Financial Statements
We have audited the accompanying consolidated balance sheets of William Lyon Homes, Inc. and subsidiaries (the “Company”) as of December 31, 2017 and 2016, the related consolidated statements of operations, equity, and cash flows for each of the years in the three‑year period ended December 31, 2017, and the related notes (collectively, the “consolidated financial statements”). In our opinion, the consolidated financial statements present fairly, in all material respects, the financial position of the Company as of December 31, 2017 and 2016, and the results of their operations and their cash flows for each of the years in the three‑year period ended December 31, 2017, in conformity with U.S. generally accepted accounting principles.
We also have audited, in accordance with the standards of the Public Company Accounting Oversight Board (United States) (“PCAOB”), the Company’s internal control over financial reporting as of December 31, 2017, based on criteria established in Internal Control - Integrated Framework (2013) issued by the Committee of Sponsoring Organizations of the Treadway Commission (“COSO”), and our report dated February 22, 2018 expressed an unqualified opinion on the effectiveness of the Company’s internal control over financial reporting.
Basis for Opinion
These consolidated financial statements are the responsibility of the Company’s management. Our responsibility is to express an opinion on these consolidated financial statements based on our audits. We are a public accounting firm registered with the PCAOB and are required to be independent with respect to the Company in accordance with the U.S. federal securities laws and the applicable rules and regulations of the Securities and Exchange Commission and the PCAOB.
We conducted our audits in accordance with the standards of the PCAOB. Those standards require that we plan and perform the audit to obtain reasonable assurance about whether the consolidated financial statements are free of material misstatement, whether due to error or fraud. Our audits included performing procedures to assess the risks of material misstatement of the consolidated financial statements, whether due to error or fraud, and performing procedures that respond to those risks. Such procedures included examining, on a test basis, evidence regarding the amounts and disclosures in the consolidated financial statements. Our audits also included evaluating the accounting principles used and significant estimates made by management, as well as evaluating the overall presentation of the consolidated financial statements. We believe that our audits provide a reasonable basis for our opinion.
/s/ KPMG LLP
We have served as the Company’s auditor since 2012.
Irvine, California
February 22, 2018
F-2
WILLIAM LYON HOMES
CONSOLIDATED BALANCE SHEETS
(in thousands except number of shares and par value per share)
December 31, | |||||||
2017 | 2016 | ||||||
ASSETS | (as adjusted, refer to Note 1) | ||||||
Cash and cash equivalents — Note 1 | $ | 182,710 | $ | 42,612 | |||
Receivables | 10,223 | 9,538 | |||||
Escrow proceeds receivable | 3,319 | 85 | |||||
Real estate inventories - Note 5 | 1,699,850 | 1,771,998 | |||||
Investment in unconsolidated joint ventures - Note 3 | 7,867 | 7,282 | |||||
Goodwill — Note 6 | 66,902 | 66,902 | |||||
Intangibles, net of accumulated amortization of $4,640 as of December 31, 2017 and 2016 — Note 7 | 6,700 | 6,700 | |||||
Deferred income taxes — Note 11 | 47,915 | 75,751 | |||||
Lease right-of-use assets | 14,454 | 13,129 | |||||
Other assets, net | 21,164 | 17,283 | |||||
Total assets | $ | 2,061,104 | $ | 2,011,280 | |||
LIABILITIES AND EQUITY | |||||||
Accounts payable | $ | 58,799 | $ | 74,282 | |||
Accrued expenses | 111,491 | 92,919 | |||||
Notes payable — Note 8: | |||||||
Revolving credit facility | — | 29,000 | |||||
Seller financing | 589 | 24,692 | |||||
Joint venture notes payable | 93,926 | 102,076 | |||||
Subordinated amortizing notes due December 1, 2017 — Note 8 | — | 7,225 | |||||
5 3/4% Senior Notes due April 15, 2019 — Note 8 | 149,362 | 148,826 | |||||
8 1/2% Senior Notes due November 15, 2020 — Note 8 | — | 422,817 | |||||
7% Senior Notes due August 15, 2022 — Note 8 | 346,740 | 346,014 | |||||
5 7/8% Senior Notes due January 31, 2025 — Note 8 | 439,567 | — | |||||
1,200,474 | 1,247,851 | ||||||
Commitments and contingencies — Note 15 | |||||||
Equity: | |||||||
William Lyon Homes stockholders’ equity — Note 13 | |||||||
Preferred stock, par value $0.01 per share; 10,000,000 shares authorized and no shares issued and outstanding at December 31, 2017 and 2016 | — | — | |||||
Common stock, Class A, par value $0.01 per share; 150,000,000 shares authorized; 34,267,510 and 28,909,781 shares issued, 33,135,650 and 27,907,724 shares outstanding at December 31, 2017 and 2016, respectively | 344 | 290 | |||||
Common stock, Class B, par value $0.01 per share; 30,000,000 shares authorized; 4,817,394 and 3,813,884 shares issued and outstanding at December 31, 2017 and 2016, respectively | 48 | 38 | |||||
Additional paid-in capital | 454,286 | 419,099 | |||||
Retained earnings | 325,794 | 277,659 | |||||
Total William Lyon Homes stockholders’ equity | 780,472 | 697,086 | |||||
Noncontrolling interests — Note 2 | 80,158 | 66,343 | |||||
Total equity | 860,630 | 763,429 | |||||
Total liabilities and equity | $ | 2,061,104 | $ | 2,011,280 | |||
See accompanying notes to consolidated financial statements
F-3
WILLIAM LYON HOMES
CONSOLIDATED STATEMENTS OF OPERATIONS
(in thousands except number of shares and per share data)
Year Ended December 31, | |||||||||||
2017 | 2016 | 2015 | |||||||||
Operating revenue | |||||||||||
Home sales | $ | 1,795,074 | $ | 1,402,203 | $ | 1,078,928 | |||||
Construction services — Note 1 | 1,454 | 3,837 | 25,124 | ||||||||
1,796,528 | 1,406,040 | 1,104,052 | |||||||||
Operating costs | |||||||||||
Cost of sales — homes | (1,478,549 | ) | (1,162,337 | ) | (878,995 | ) | |||||
Construction services — Note 1 | (1,317 | ) | (3,485 | ) | (21,181 | ) | |||||
Sales and marketing | (86,226 | ) | (72,509 | ) | (61,539 | ) | |||||
General and administrative | (90,206 | ) | (73,398 | ) | (59,161 | ) | |||||
Amortization of intangible assets — Note 7 | — | — | (957 | ) | |||||||
Other | (2,274 | ) | (343 | ) | (1,972 | ) | |||||
(1,658,572 | ) | (1,312,072 | ) | (1,023,805 | ) | ||||||
Operating income | 137,956 | 93,968 | 80,247 | ||||||||
Equity in income of unconsolidated joint ventures | 3,661 | 5,606 | 3,239 | ||||||||
Other income, net | 895 | 3,243 | 3,581 | ||||||||
Income before extinguishment of debt | 142,512 | 102,817 | 87,067 | ||||||||
Loss on extinguishment of debt | (21,828 | ) | — | — | |||||||
Income before provision for income taxes | 120,684 | 102,817 | 87,067 | ||||||||
Provision for income taxes — Note 11 | (62,933 | ) | (34,850 | ) | (26,806 | ) | |||||
Net income | 57,751 | 67,967 | 60,261 | ||||||||
Less: Net income attributable to noncontrolling interests | (9,616 | ) | (8,271 | ) | (2,925 | ) | |||||
Net income available to common stockholders | 48,135 | 59,696 | 57,336 | ||||||||
Income per common share: | |||||||||||
Basic | $ | 1.30 | $ | 1.62 | $ | 1.57 | |||||
Diluted | $ | 1.24 | $ | 1.55 | $ | 1.48 | |||||
Weighted average common shares outstanding: | |||||||||||
Basic | 37,040,137 | 36,764,799 | 36,546,227 | ||||||||
Diluted | 38,663,667 | 38,474,900 | 38,767,556 | ||||||||
See accompanying notes to consolidated financial statements
F-4
WILLIAM LYON HOMES
CONSOLIDATED STATEMENTS OF EQUITY
(in thousands)
William Lyon Homes Stockholders | Non- Controlling Interest | Total | ||||||||||||||||||||
Common Stock | Additional Paid-In Capital | Retained Earnings | ||||||||||||||||||||
Shares | Amount | |||||||||||||||||||||
Balance — January 1, 2015 | 31,887 | $ | 319 | $ | 408,969 | $ | 160,627 | $ | 27,231 | $ | 597,146 | |||||||||||
Net income | — | — | — | 57,336 | 2,925 | 60,261 | ||||||||||||||||
Cash contributions from members of consolidated entities | — | — | — | — | 19,850 | 19,850 | ||||||||||||||||
Cash distributions to members of consolidated entities | — | — | — | — | (10,632 | ) | (10,632 | ) | ||||||||||||||
Exercise of stock options | 48 | — | 106 | — | — | 106 | ||||||||||||||||
Shares remitted to Company to satisfy employee personal income tax liabilities resulting from share based compensation plans | (88 | ) | (1 | ) | (1,831 | ) | — | — | (1,832 | ) | ||||||||||||
Stock based compensation | 331 | 4 | 6,566 | — | — | 6,570 | ||||||||||||||||
Balance — December 31, 2015 | 32,178 | $ | 322 | $ | 413,810 | $ | 217,963 | $ | 39,374 | $ | 671,469 | |||||||||||
Net income | — | — | — | 59,696 | 8,271 | 67,967 | ||||||||||||||||
Cash contributions from members of consolidated entities | — | — | — | — | 38,334 | 38,334 | ||||||||||||||||
Cash distributions to members of consolidated entities | — | — | — | — | (19,636 | ) | (19,636 | ) | ||||||||||||||
Shares remitted to Company to satisfy employee personal income tax liabilities resulting from share based compensation plans | (82 | ) | (1 | ) | (941 | ) | — | — | (942 | ) | ||||||||||||
Stock based compensation | 628 | 7 | 6,412 | — | — | 6,419 | ||||||||||||||||
Reversal of excess income tax benefit from stock based awards | — | — | (182 | ) | — | — | (182 | ) | ||||||||||||||
Balance - December 31, 2016 | 32,724 | $ | 328 | $ | 419,099 | $ | 277,659 | $ | 66,343 | $ | 763,429 | |||||||||||
Net income | — | — | — | 48,135 | 9,616 | 57,751 | ||||||||||||||||
Cash contributions from members of consolidated entities | — | — | — | — | 66,712 | 66,712 | ||||||||||||||||
Cash distributions to members of consolidated entities | — | — | — | — | (62,513 | ) | (62,513 | ) | ||||||||||||||
Repurchases of common stock | (138 | ) | (1 | ) | (3,111 | ) | — | — | (3,112 | ) | ||||||||||||
Shares remitted to Company to satisfy employee personal income tax liabilities resulting from share based compensation plans | (79 | ) | (1 | ) | (1,543 | ) | — | — | (1,544 | ) | ||||||||||||
Stock based compensation | 461 | 5 | 10,057 | — | — | 10,062 | ||||||||||||||||
Settlement of Tangible Equity Units - Note 8 | 5,113 | 51 | (114 | ) | — | — | (63 | ) | ||||||||||||||
Issuance of Class B common stock | 1,004 | 10 | 29,898 | — | — | 29,908 | ||||||||||||||||
Balance - December 31, 2017 | 39,085 | $ | 392 | $ | 454,286 | $ | 325,794 | $ | 80,158 | 860,630 | ||||||||||||
See accompanying notes to consolidated financial statements
F-5
Year Ended December 31, | |||||||||||
2017 | 2016 | 2015 | |||||||||
Operating activities: | |||||||||||
Net income | $ | 57,751 | $ | 67,967 | $ | 60,261 | |||||
Adjustments to reconcile net income to net cash provided by (used in) operating activities: | |||||||||||
Depreciation and amortization | 1,962 | 2,006 | 2,663 | ||||||||
Stock based compensation expense | 10,062 | 6,419 | 6,570 | ||||||||
Equity in income of unconsolidated joint ventures | (3,661 | ) | (5,606 | ) | (3,239 | ) | |||||
Distributions from unconsolidated joint ventures | 3,085 | 3,725 | 1,075 | ||||||||
Net change in deferred income taxes | 27,836 | 3,975 | 8,313 | ||||||||
Loss on extinguishment of debt | 21,828 | — | — | ||||||||
Net changes in operating assets and liabilities: | |||||||||||
Restricted cash | — | 504 | — | ||||||||
Receivables | (694 | ) | (876 | ) | 6,663 | ||||||
Escrow proceeds receivable | (3,234 | ) | 2,956 | (126 | ) | ||||||
Real estate inventories — owned | 52,913 | (69,598 | ) | (264,868 | ) | ||||||
Other assets, net | (2,158 | ) | 2,367 | 758 | |||||||
Accounts payable | (15,483 | ) | (1,599 | ) | 24,067 | ||||||
Accrued expenses | 17,247 | 9,466 | (15,045 | ) | |||||||
Net cash provided by (used in) operating activities | 167,454 | 21,706 | (172,908 | ) | |||||||
Investing activities: | |||||||||||
Investment in and advances to unconsolidated joint ventures | — | — | (1,000 | ) | |||||||
Proceeds from repayment of notes receivable | — | 6,188 | — | ||||||||
Purchases of property and equipment | (4,300 | ) | (1,029 | ) | (4,800 | ) | |||||
Net cash (used in) provided by investing activities | (4,300 | ) | 5,159 | (5,800 | ) | ||||||
F-6
Year Ended December 31, | |||||||||||
2017 | 2016 | 2015 | |||||||||
Financing activities: | |||||||||||
Proceeds from borrowings on notes payable | 134,061 | 139,783 | 119,663 | ||||||||
Principal payments on notes payable | (142,211 | ) | (147,887 | ) | (58,217 | ) | |||||
Proceeds from issuance of 7% Senior Notes | — | — | 51,000 | ||||||||
Redemption premium of 8.5% Senior Notes | (19,645 | ) | — | — | |||||||
Principal payments of 8.5% Senior Notes | (425,000 | ) | — | — | |||||||
Proceeds from issuance of 5.875% Senior Notes | 446,468 | — | — | ||||||||
Proceeds from borrowings on revolver | 346,121 | 258,000 | 229,000 | ||||||||
Payments on revolver | (375,121 | ) | (294,000 | ) | (164,000 | ) | |||||
Principal payments on subordinated amortizing notes | (7,225 | ) | (6,841 | ) | (6,651 | ) | |||||
Proceeds from stock options exercised | — | — | 106 | ||||||||
Proceeds from issuance of Class B Shares | 29,908 | — | — | ||||||||
Costs related to settlement of TEUs | (63 | ) | — | — | |||||||
Shares remitted to, or withheld by the Company for employee tax withholding | (1,544 | ) | (942 | ) | (1,832 | ) | |||||
Payments to repurchase common stock | (3,112 | ) | — | — | |||||||
Excess income tax benefit from stock based awards | — | (182 | ) | — | |||||||
Payment of deferred loan costs | (9,892 | ) | (1,085 | ) | (2,147 | ) | |||||
Cash contributions from members of consolidated entities | 66,712 | 38,334 | 19,850 | ||||||||
Cash distributions to members of consolidated entities | (62,513 | ) | (19,636 | ) | (10,632 | ) | |||||
Net cash (used in) provided by financing activities | (23,056 | ) | (34,456 | ) | 176,140 | ||||||
Net increase (decrease) in cash and cash equivalents | 140,098 | (7,591 | ) | (2,568 | ) | ||||||
Cash and cash equivalents — beginning of period | 42,612 | 50,203 | 52,771 | ||||||||
Cash and cash equivalents — end of period | $ | 182,710 | $ | 42,612 | $ | 50,203 | |||||
Supplemental disclosures: | |||||||||||
Cash paid for taxes | $ | 35,761 | $ | 16,540 | $ | 24,955 | |||||
Supplemental disclosures of non-cash investing and financing activities: | |||||||||||
Right-of-use assets obtained in exchange for new operating lease liabilities | $ | 5,925 | $ | 1,353 | $ | 3,600 | |||||
Notes payable issued in conjunction with land acquisitions | $ | — | $ | 24,692 | $ | — | |||||
See accompanying notes to consolidated financial statements
F-7
WILLIAM LYON HOMES
NOTES TO CONSOLIDATED FINANCIAL STATEMENTS
Note 1—Basis of Presentation and Significant Accounting Policies
Operations
William Lyon Homes, a Delaware corporation (“Parent” and together with its subsidiaries, the “Company”), are primarily engaged in designing, constructing and selling single family detached and attached homes in California, Arizona, Nevada, Colorado (currently, under the Village Homes brand), Washington and Oregon (together, currently under the Polygon Northwest Homes brand).
Basis of Presentation
The preparation of the Company’s financial statements in conformity with U.S. generally accepted accounting principles requires management to make estimates and assumptions that affect the reported amounts of the assets and liabilities as of December 31, 2017 and 2016 and revenues and expenses for the years ended December 31, 2017, 2016, and 2015. Accordingly, actual results could differ from those estimates. The significant accounting policies using estimates include real estate inventories and cost of sales, impairment of real estate inventories, warranty reserves, loss contingencies, accounting for variable interest entities, valuation of deferred tax assets, and the fair value of assets acquired and liabilities assumed in connection with acquisition accounting.
The consolidated financial statements include the accounts of the Company and all majority-owned and controlled subsidiaries and joint ventures, and certain joint ventures and other entities which have been determined to be variable interest entities in which the Company is considered the primary beneficiary (see Note 2). The accounting policies of the joint ventures are substantially the same as those of the Company. All significant intercompany accounts and transactions have been eliminated in consolidation.
Real Estate Inventories
Real estate inventories are carried at cost net of impairment losses, if any. Real estate inventories consist primarily of land deposits, land and land under development, homes completed and under construction, and model homes. All direct and indirect land costs, offsite and onsite improvements and applicable interest and other carrying charges are capitalized to real estate projects during periods when the project is under development. Land, offsite costs and all other common costs are allocated to land parcels benefited based upon relative fair values before construction. Onsite construction costs and related carrying charges (principally interest and property taxes) are allocated to the individual homes within a phase based upon the relative sales value of the homes. The Company relieves its accumulated real estate inventories through cost of sales for the estimated cost of homes sold. Selling expenses and other marketing costs are expensed in the period incurred. From time to time the Company sells land to third parties. The Company does not consider these sales to be core to its homebuilding business, and any gain or loss recognized on these transactions is recorded in other non-operating income. For the years ended December 31, 2017, 2016 and 2015, the Company had four, five, and one land parcel sales, respectively, that resulted in a $0.8 million gain, $3.6 million gain and $0.8 million gain, respectively.
The Company accounts for its real estate inventories under FASB ASC 360 Property, Plant, & Equipment (“ASC 360”). ASC 360 requires impairment losses to be recorded on real estate inventories when indicators of impairment are present and the undiscounted cash flows estimated to be generated by real estate inventories are less than the carrying amount of such assets. Indicators of impairment include a decrease in demand for housing due to softening market conditions, competitive pricing pressures, which reduce the average sales price of homes including an increase in sales incentives offered to buyers, slowing sales absorption rates (calculated as net new home orders divided by average sales locations for a given period), decreases in home values in the markets in which the Company operates, significant decreases in gross margins and a decrease in project cash flows for a particular project.
For land, construction in progress and completed inventory, including model homes, the Company estimates expected cash flows at the project level by maintaining current budgets using recent historical information and current market assumptions. The Company updates project budgets and cash flows of each real estate project on an as needed basis to determine whether the estimated remaining undiscounted future cash flows of the project are more or less than the carrying amount (net book value) of the asset. If the undiscounted cash flows are more than the net book value of the project, then there is no impairment. If the undiscounted cash flows are less than the net book value of the asset, then the asset is deemed to be impaired and is written-down to its fair value.
F-8
Fair value represents the amount at which an asset could be bought or sold in a current transaction between willing parties (i.e., other than a forced or liquidation sale). Management determines the estimated fair value of each project by determining the present value of estimated future cash flows at discount rates that are commensurate with the risk of each project and each domain, market or sub-market or may use recent appraisals if they more accurately reflect fair value. The estimation process involved in determining if assets have been impaired and in the determination of fair value is inherently uncertain because it requires estimates of future revenues and costs, as well as future events and conditions. Estimates of revenues and costs are supported by the Company’s budgeting process, and are based on recent sales in backlog, pricing required to get the desired pace of sales, pricing of competitive projects, incentives offered by competitors and current estimates of costs of development and construction or current appraisals.
The assumptions and judgments used by the Company in the estimation process to determine the future undiscounted cash flows of a project and its fair value are inherently uncertain and require a substantial degree of judgment. The realization of the Company’s real estate inventories is dependent upon future uncertain events and market conditions. Due to the subjective nature of the estimates and assumptions used in determining the future cash flows of a project, actual results could differ materially from current estimates.
Management assesses land deposits for impairment when estimated land values are deemed to be less than the agreed upon contract price. The Company considers changes in market conditions, the timing of land purchases, the ability to renegotiate with land sellers, the terms of the land option contracts in question, the availability and best use of capital, and other factors. The Company records abandoned land deposits and related pre-acquisition costs in cost of sales-lots, land and other in the consolidated statements of operations in the period that it is abandoned.
A provision for warranty costs relating to the Company’s limited warranty plans is included in cost of sales and accrued expenses at the time the sale of a home is recorded. The Company generally reserves a percent of the sales price of its homes, or a set amount per home closed depending on operating segment, against the possibility of future charges relating to its warranty programs and similar potential claims. Factors that affect the Company’s warranty liability include the number of homes under warranty, historical and anticipated rates of warranty claims, and cost per claim. The Company periodically assesses the adequacy of its recorded warranty liability and adjusts the amounts as necessary. Changes in the Company’s warranty liability for the years ended December 31, 2017, 2016, and 2015 are as follows (in thousands):
Year Ended December 31, 2017 | Year Ended December 31, 2016 | Year Ended December 31, 2015 | ||||||||||
Warranty liability, beginning of period | $ | 14,173 | $ | 18,117 | $ | 18,155 | ||||||
Warranty provision during period | 9,822 | 8,237 | 7,423 | |||||||||
Warranty payments, net of insurance recoveries during period | (10,497 | ) | (12,334 | ) | (8,555 | ) | ||||||
Warranty charges related to construction services projects | 145 | 153 | 1,094 | |||||||||
Warranty liability, end of period | $ | 13,643 | $ | 14,173 | $ | 18,117 | ||||||
Interest incurred under the Company’s debt obligations, as more fully discussed in Note 8, is capitalized to qualifying real estate projects under development. Any additional interest charges related to real estate projects not under development are expensed in the period incurred. Interest activity for the years ended December 31, 2017, 2016, and 2015 are as follows (in thousands):
Year Ended December 31, 2017 | Year Ended December 31, 2016 | Year Ended December 31, 2015 | |||||||||
Interest incurred | $ | 73,729 | $ | 83,218 | $ | 76,221 | |||||
Less: Interest capitalized | (73,729 | ) | (83,218 | ) | (76,221 | ) | |||||
Interest expense, net of amounts capitalized | $ | — | $ | — | $ | — | |||||
Cash paid for interest | $ | 62,679 | $ | 79,734 | $ | 72,254 | |||||
F-9
Construction Services
The Company accounts for construction management agreements using the Percentage of Completion Method in accordance with FASB ASC Topic 605 Revenue Recognition (“ASC 605”). Under ASC 605, the Company records revenues and expenses as a contracted project progresses, and based on the percentage of costs incurred to date compared to the total estimated costs of the contract.
The Company entered into construction management agreements to build, sell and market homes in certain communities. For such services, the Company will receive fees (generally 3 to 5 percent of the sales price, as defined) and may, under certain circumstances, receive additional compensation if certain financial thresholds are achieved. For the year ended December 31, 2017, the Company recorded nominal compensation from such agreements. For the years ended December 31, 2016 and 2015, the Company recorded additional compensation of $0.2 million and $1.9 million, respectively.
Financial Instruments
Financial instruments that potentially subject the Company to concentrations of credit risk are primarily cash investments, receivables, escrow proceeds receivable, our indebtedness, and deposits. The Company typically places its cash investments in investment grade short-term instruments. Deposits, included in other assets, are due from municipalities or utility companies and are generally collected from such entities through fees assessed to other developers. The Company is an issuer of, or subject to, financial instruments with off-balance sheet risk in the normal course of business which exposes it to credit risks. These financial instruments include letters of credit and obligations in connection with assessment district bonds. These off-balance sheet financial instruments are described in more detail in Note 15.
Cash and Cash Equivalents
Short-term investments with a maturity of three months or less when purchased are considered cash equivalents. The Company’s cash and cash equivalents balance exceeds federally insurable limits as of December 31, 2017 and 2016. The Company monitors the cash balances in its operating accounts; however, these cash balances could be negatively impacted if the underlying financial institutions fail or are subject to other adverse conditions in the financial markets. To date, the Company has experienced no loss or lack of access to cash in its operating accounts.
Goodwill
In accordance with the provisions of ASC 350, Intangibles, Goodwill and Other, goodwill is tested for impairment on an annual basis, or more frequently if events or circumstances indicate that goodwill may be impaired. The impairment test is performed at the reporting unit level, and an impairment loss is recognized to the extent that the carrying amount of goodwill exceeds the fair value. The Company has determined that we have six reporting segments, as discussed in Note 4, and will perform an annual goodwill impairment analysis during the fourth quarter of each fiscal year.
Intangible Assets
Recorded intangible assets primarily relate to brand names of acquired entities, construction management contracts, homes in backlog, and joint venture management fee contracts recorded in conjunction with FASB ASC Topic 805, Business Combinations ("ASC 805"). All intangible assets with the exception of those relating to brand names were valued based on expected cash flows related to home closings, and the asset is amortized on a per unit basis, as homes under the contracts close. Our brand name intangible assets are deemed to have an indefinite useful life.
Income per common share
The Company computes income per common share in accordance with FASB ASC Topic 260, Earnings per Share, which requires income per common share for each class of stock to be calculated using the two-class method. The two-class method is an allocation of income between the holders of common stock and a company’s participating security holders.
Basic income per common share is computed by dividing income or loss available to common stockholders by the weighted average number of shares of common stock outstanding. For purposes of determining diluted income per common share, basic income per common share is further adjusted to include the effect of potential dilutive common shares outstanding.
F-10
Income Taxes
Income taxes are accounted for under the provisions of Financial Accounting Standards Board ASC 740, Income Taxes, using an asset and liability approach. Deferred income taxes reflect the net effects of temporary differences between the carrying amount of assets and liabilities for financial reporting purposes and the amounts used for income tax purposes, and operating loss and tax credit carryforwards measured by applying currently enacted tax laws. A valuation allowance would be provided to reduce net deferred tax assets if it were determined that it is more likely than not to be realized. ASC 740 prescribes a recognition threshold and a measurement criterion for the financial statement recognition and measurement of tax positions taken or expected to be taken in a tax return. For those benefits to be recognized, a tax position must be considered “more-likely-than-not” to be sustained upon examination by taxing authorities. In addition, the Company has elected to recognize interest and penalties related to uncertain tax positions in the income tax provision.
Comprehensive Income or Loss
The Company had no other transactions or activity, other than net income or loss, that would be considered as part of comprehensive income or loss.
Impact of Recent Accounting Pronouncements
Effective January 1, 2017, the Company adopted Accounting Standards Update ("ASU") No. 2016-09, “Compensation - Stock Compensation (Topic 718): Improvements to Employee Share-Based Payment Accounting” (“ASU 2016-09”), which simplified several aspects for the accounting for share-based payment transactions, including the income tax consequences and classification on the statement of cash flows. The Company did not have any previously unrecognized excess tax benefits. The adoption of this guidance did not have a material impact on the Company's consolidated financial statements or notes to its consolidated financial statements.
In May 2014, the FASB issued ASU No. 2014-09, "Revenue from Contracts with Customers (“ASU 2014-09”), which clarifies existing accounting literature relating to how and when revenue is recognized by an entity. ASU 2014-09 affects any entity that either enters into contracts with customers to transfer goods or services or enters into contracts for the transfer of nonfinancial assets and supersedes the revenue recognition requirements in Topic 605, Revenue Recognition, and most industry-specific guidance. ASU 2014-09 requires an entity to recognize revenue when it transfers promised goods or services to customers in an amount that reflects the consideration to which an entity expects to be entitled in exchange for those goods or services. ASU 2014-09 also supersedes some cost guidance included in Subtopic 605-35, Revenue Recognition-Construction-Type and Production-Type Contracts.
The Company has evaluated the impact of adopting the new standard and determined that there will not be a significant impact to its current revenue recognition patterns. The adoption of ASU 2014-09 will primarily have an impact on our accounting policies related to the Company's accounting for certain capitalized marketing costs currently recorded in Real estate inventories. With the adoption of ASU 2014-09, the Company will no longer record certain costs related to model homes and sales offices within Real estate inventories, and will instead record them as property plant and equipment. The amortization of these costs will be the same under ASU 2014-09 as under current generally accepted accounting principles, resulting in no adjustment to the the Company's retained earnings upon adoption.
ASU 2014-09 is effective for public companies for interim and annual reporting periods beginning after December 15, 2017. The Company has adopted the guidance effective January 1, 2018 using a cumulative effect transition method. As a result of the Company's analysis, it will not record an adjustment to retained earnings on January 1, 2018.
In August 2016, the FASB issued ASU No. 2016-15, “Statement of Cash Flows (Topic 230): Classification of Certain Cash Receipts and Cash Payments” (“ASU 2016-15”). ASU 2016-15 provides guidance on how certain cash receipts and cash payments are to be presented and classified in the statement of cash flows. ASU 2016-15 is effective for annual and interim periods in fiscal years beginning after December 15, 2017. Early adoption is permitted. The Company does not anticipate that the adoption of ASU 2016-15 will have a material impact on its consolidated financial statements.
In November 2016, the FASB issued ASU No. 2016-18, "Statement of Cash Flows (Topic 230): Restricted Cash (a consensus of the FASB Emerging Issues Task Force)" (“ASU 2016-18”). ASU 2016-18 requires restricted cash to be included with cash and cash equivalents when reconciling the beginning and ending amounts on the statement of cash flows. ASU 2016-18 is effective for annual and interim periods in fiscal years beginning after December 15, 2017. Early adoption is permitted. The Company does not anticipate that the adoption of ASU 2016-18 will have a material impact on its consolidated financial statements.
F-11
Change in Accounting Principle
During the second quarter ended June 30, 2017, the Company adopted the provisions of Accounting Standards Update ("ASU") No. 2016-02, "Leases (Topic 842)" ("ASU 2016-02"), which amends the existing standards for lease accounting, requiring lessees to recognize most leases on their balance sheets and disclose key information about leasing arrangements. The new standard establishes a right-of-use ("ROU") model that requires a lessee to recognize a ROU asset and lease liability on the balance sheet for all leases with a term longer than 12 months. Leases will be classified as finance or operating, with classification affecting the pattern and classification of expense recognition in the income statement.
Effective April 1, 2017, the Company adopted the new standard with a modified retrospective transition approach for leases existing at, or entered into after, the beginning of the earliest comparative period presented in the financial statements. The adoption is accounted for as a change in accounting principle in conformity with Financial Accounting Standards Board ("FASB") Accounting Standards Codification ("ASC") 250, “Accounting Changes and Error Corrections”.
As a result of the adoption, the most significant changes related to (1) the recognition of new ROU assets and lease liabilities on the balance sheet for office, real estate and equipment operating leases; and (2) the derecognition of previous assets and liabilities for a sale-leaseback transaction that did not qualify for sale accounting under the previous standards.
The Company elected all of the standard's available practical expedients on adoption, including the package of practical expedients and use of hindsight expedient. Consequently, the Company:
–Recognized lease related liabilities within Accrued expenses of $15.6 million as of June 30, 2017, with corresponding ROU assets of the same amount based on the present value of the remaining minimum rental payments under current leasing standards for existing operating leases.
The balance sheet as of December 31, 2016 was adjusted using the modified retrospective transition approach which resulted in the following adjusted balances (in thousands):
December 31, 2016 | Lease adoption adjustments | December 31, 2016 | ||||||||
(as adjusted) | ||||||||||
Lease right-of-use assets | — | $ | 13,129 | $ | 13,129 | |||||
Total assets | 1,998,151 | 13,129 | 2,011,280 | |||||||
Accrued expenses | 79,790 | 13,129 | 92,919 | |||||||
Total liabilities and equity | 1,998,151 | 13,129 | 2,011,280 | |||||||
The Company's existing material leases were all considered operating leases under the new leasing standard and as a result, no adjustment to previously reported lease expense was incurred for prior periods presented.
–Derecognized obligations of $19.8 million relating to cash received from a sale-leaseback transaction that was previously classified within Accrued expenses, which occurred in the first quarter of 2017.
Refer to Note 15 for more details regarding leases as of December 31, 2017 and its comparative period.
Reclassifications
Certain balances on the financial statements and certain amounts presented in the notes have been reclassified in order to conform to current year presentation.
Note 2—Variable Interest Entities and Noncontrolling Interests
The Company accounts for variable interest entities in accordance with ASC 810, Consolidation (“ASC 810”). Under ASC 810, a variable interest entity (“VIE”) is created when: (a) the equity investment at risk in the entity is not sufficient to permit the entity to finance its activities without additional subordinated financial support provided by other parties, including the equity holders; (b) the entity’s equity holders as a group either (i) lack the direct or indirect ability to make decisions about the entity, (ii) are not obligated to absorb expected losses of the entity or (iii) do not have the right to receive expected residual returns of the entity; or (c) the entity’s equity holders have voting rights that are not proportionate to their economic interests, and the activities of the entity involve or are conducted on behalf of the equity holder with disproportionately few voting rights. If an entity is deemed to be a VIE pursuant to ASC 810, the enterprise that has both (i) the power to direct the activities of a VIE that most significantly impact the entity’s economic performance and (ii) the obligation to absorb the expected losses of the entity or right to receive benefits from the entity that could be potentially significant to the VIE is considered the primary
F-12
beneficiary and must consolidate the VIE. In accordance with ASC 810, we perform ongoing reassessments of whether an enterprise is the primary beneficiary of a VIE.
Joint Ventures
As of December 31, 2017 and 2016, the Company had thirteen and eleven joint ventures, respectively, which were deemed to be VIEs under ASC 810 for which the Company is considered the primary beneficiary. The Company manages the joint ventures, by using its sales, development and operations teams and has significant control over these projects and therefore the power to direct the activities that most significantly impact the joint venture’s performance, in addition to being obligated to absorb expected losses or receive benefits from the joint venture, and therefore the Company is deemed to be the primary beneficiary of these VIEs.
These joint ventures are each engaged in homebuilding and land development activities. Certain of these joint ventures have not obtained construction financing from outside lenders, but are financing their activities through equity contributions from each of the joint venture partners. The Company has no rights and limited obligations with respect to the liabilities of the VIEs, and none of the Company’s assets serve as collateral for the creditors of these VIEs. The assets of the joint ventures are the sole collateral for the liabilities of the joint ventures and as such, the creditors and equity investors of these joint ventures have no recourse to assets of the Company held outside of these joint ventures. The liabilities of each VIE are restricted to the assets of each VIE. Additionally, the creditors of the Company have no access to the assets of the VIEs. Income allocations and cash distributions to the Company are based on predetermined formulas between the Company and their joint venture partners as specified in the applicable partnership or operating agreements. The Company generally receives, after partners’ priority returns and return of partners’ capital, approximately 50% of the profits and cash flows from the joint ventures.
As of December 31, 2017, the assets of the consolidated VIEs totaled $219.6 million, of which $10.7 million was cash and $230.8 million was real estate inventories. The liabilities of the consolidated VIEs totaled $99.4 million, primarily comprised of notes payable, accounts payable and accrued liabilities.
As of December 31, 2016, the assets of the consolidated VIEs totaled $204.8 million, of which $5.8 million was cash and $200.7 million was real estate inventories. The liabilities of the consolidated VIEs totaled $107.3 million, primarily comprised of notes payable, accounts payable and accrued liabilities.
Note 3—Investments in Unconsolidated Joint Ventures
The table set forth below has been derived from the summarized financial information of our unconsolidated mortgage joint ventures and summarizes their combined statements of operations that we accounted for under the equity method (in thousands):
Year Ended December 31, 2017 | Year Ended December 31, 2016 | Year Ended December 31, 2015 | |||||||||
Revenues | $ | 20,003 | $ | 21,156 | $ | 12,314 | |||||
Cost of sales | (11,913 | ) | (10,407 | ) | (5,842 | ) | |||||
Income of unconsolidated joint ventures | $ | 8,090 | $ | 10,749 | $ | 6,472 | |||||
Income from unconsolidated joint ventures reflected in the accompanying consolidated statements of operations represents our share of the income of our unconsolidated mortgage joint ventures, which is allocated based on the provisions of the underlying joint venture operating agreements less any additional impairments recorded against our investments in joint ventures which we do not deem recoverable. For the years ended December 31, 2017, 2016 and 2015, the Company recorded income of $3.7 million, $5.6 million and $3.2 million, respectively, from its unconsolidated joint ventures. This income was primarily attributable to our share of income related to mortgages that were generated and issued to qualifying home buyers during the periods.
During the years ended December 31, 2017, 2016, and 2015, all of our unconsolidated joint ventures were reviewed for impairment. Based on the impairment review, no investments in joint ventures were determined to be impaired.
The table set forth below has been derived from the summarized financial information of our unconsolidated mortgage joint ventures and summarizes their combined balance sheets that we accounted for under the equity method (in thousands):
F-13
December 31, | ||||||||||
2017 | 2016 | |||||||||
Assets | ||||||||||
Cash | $ | 12,802 | $ | 10,208 | ||||||
Loans held for sale | 17,106 | 18,791 | ||||||||
Accounts receivable | 2,791 | 764 | ||||||||
Other assets | 128 | 56 | ||||||||
Total Assets | $ | 32,827 | $ | 29,819 | ||||||
Liabilities and Equity | ||||||||||
Accounts payable | $ | 779 | $ | 694 | ||||||
Accrued expenses | 1,532 | 1,026 | ||||||||
Credit lines payable | 18,312 | 17,748 | ||||||||
Other liabilities | 31 | 17 | ||||||||
Members equity | 12,173 | 10,334 | ||||||||
Total Liabilities and Equity | $ | 32,827 | $ | 29,819 | ||||||
Note 4—Segment Information
The Company operates one principal homebuilding business. Operating segments are defined as components of an enterprise about which separate financial information is available that is evaluated regularly by the chief operating decision-maker in deciding how to allocate resources and in assessing performance. The Company’s President and Chief Executive Officer has been identified as the chief operating decision maker. The Company’s chief operating decision maker directs the allocation of resources to operating segments based on the profitability and cash flows of each respective segment.
The Company’s homebuilding operations design, construct and sell a wide range of homes designed to meet the specific needs in each of its markets. As such, in accordance with the aggregation criteria defined by FASB ASC Topic 280, Segment Reporting (“ASC 280”), the Company’s homebuilding operating segments have been grouped into six reportable segments:
California, consisting of operating divisions in i) Southern California, consisting of operations in Orange, Los Angeles, Riverside and San Bernardino counties; ii) Northern California, consisting of operations in Alameda, Contra Costa, San Joaquin, and Santa Clara counties.
Arizona, consisting of operations in the Phoenix, Arizona metropolitan area.
Nevada, consisting of operations in the Las Vegas, Nevada metropolitan area.
Colorado, consisting of operations in the Denver, Colorado metropolitan area.
Washington, consisting of operations in the Seattle, Washington metropolitan area.
Oregon, consisting of operations in the Portland, Oregon metropolitan area.
Corporate develops and implements strategic initiatives and supports the Company’s operating segments by centralizing key administrative functions such as finance and treasury, information technology, risk management and litigation and human resources.
Segment financial information relating to the Company’s operations was as follows (in thousands):
F-14
Year Ended December 31, 2017 | Year Ended December 31, 2016 | Year Ended December 31, 2015 | |||||||||
Operating revenue: | |||||||||||
California (1) | $ | 682,896 | $ | 494,189 | $ | 401,934 | |||||
Arizona | 158,534 | 125,951 | 69,510 | ||||||||
Nevada | 176,354 | 191,711 | 130,845 | ||||||||
Colorado | 124,456 | 128,530 | 107,014 | ||||||||
Washington | 333,667 | 154,600 | 181,258 | ||||||||
Oregon | 320,621 | 311,059 | 213,491 | ||||||||
Total operating revenue | $ | 1,796,528 | $ | 1,406,040 | $ | 1,104,052 | |||||
(1) Operating revenue in the California segment includes construction services revenue.
Year Ended December 31, 2017 | Year Ended December 31, 2016 | Year Ended December 31, 2015 | |||||||||
Income before provision from income taxes: | |||||||||||
California | $ | 88,422 | $ | 47,692 | $ | 46,752 | |||||
Arizona | 14,832 | 12,004 | 5,743 | ||||||||
Nevada | 15,672 | 19,182 | 13,022 | ||||||||
Colorado | 7,156 | 6,978 | 3,291 | ||||||||
Washington | 30,008 | 9,528 | 18,652 | ||||||||
Oregon | 35,862 | 41,617 | 24,787 | ||||||||
Corporate | (49,440 | ) | (34,184 | ) | (25,180 | ) | |||||
Income before extinguishment of debt | $ | 142,512 | $ | 102,817 | $ | 87,067 | |||||
Corporate - Loss on extinguishment of debt | (21,828 | ) | — | — | |||||||
Income before provision for income taxes | $ | 120,684 | $ | 102,817 | $ | 87,067 | |||||
December 31, | December 31, | ||||||
2017 | 2016 | ||||||
Total assets: | |||||||
California | $ | 631,649 | $ | 716,955 | |||
Arizona | 170,634 | 191,581 | |||||
Nevada | 211,202 | 189,248 | |||||
Colorado | 149,183 | 124,580 | |||||
Washington | 286,442 | 343,973 | |||||
Oregon | 288,981 | 238,766 | |||||
Corporate (1) | 323,013 | 206,177 | |||||
Total assets | $ | 2,061,104 | $ | 2,011,280 | |||
(1) | Comprised primarily of cash and cash equivalents, receivables, deferred income taxes, and other assets. |
Note 5—Real Estate Inventories
Real estate inventories consist of the following (in thousands):
F-15
December 31, | |||||||
2017 | 2016 | ||||||
Real estate inventories: | |||||||
Land deposits | $ | 51,833 | $ | 50,429 | |||
Land and land under development | 904,410 | 1,069,001 | |||||
Homes completed and under construction | 646,198 | 545,310 | |||||
Model homes | 97,409 | 107,258 | |||||
Total | $ | 1,699,850 | $ | 1,771,998 | |||
The Company accounts for its real estate inventories under ASC 360, which requires impairment losses to be recorded on real estate inventories when indicators of impairment are present and the undiscounted cash flows estimated to be generated by real estate inventories are less than the carrying amount of such assets.
During the years ended December 31, 2017, 2016, and 2015, the Company did not record any impairments to the value of its real estate inventories.
Note 6—Goodwill
As of December 31, 2017 and 2016, the Company had Goodwill of $66.9 million.
Goodwill by operating segment as of December 31, 2017 and 2016 is as follows (in thousands):
December 31, | |||||||
2017 | 2016 | ||||||
California | $ | 6,801 | $ | 6,801 | |||
Arizona | 5,951 | 5,951 | |||||
Nevada | 1,457 | 1,457 | |||||
Colorado | — | — | |||||
Washington | 31,200 | 31,200 | |||||
Oregon | 21,493 | 21,493 | |||||
Total | $ | 66,902 | $ | 66,902 | |||
Note 7—Intangibles
The carrying value and accumulated amortization of intangible assets at December 31, 2017 and December 31, 2016, by major intangible asset category, is as follows (in thousands):
December 31, 2017 | December 31, 2016 | ||||||||||||||||||||||
Carrying Value | Accumulated Amortization | Net Carrying Amount | Carrying Value | Accumulated Amortization | Net Carrying Amount | ||||||||||||||||||
Brand Name - Polygon Northwest Homes | $ | 6,700 | $ | — | $ | 6,700 | $ | 6,700 | $ | — | $ | 6,700 | |||||||||||
The Company evaluates indefinite lived intangible assets at least annually, or more frequently if events or circumstances exist that may indicate that the asset is impaired or that its life is finite.
As of December 31, 2017 and December 31, 2016, the Company has fully amortized the value of all of the intangible assets it held with finite lives.
Note 8—Senior Notes, Secured, and Subordinated Indebtedness
The Company's senior notes, secured, and subordinated indebtedness consists of the following (in thousands):
F-16
December 31, | |||||||
2017 | 2016 | ||||||
Notes payable: | |||||||
Revolving credit facility | $ | — | $ | 29,000 | |||
Seller financing | 589 | 24,692 | |||||
Joint venture notes payable | 93,926 | 102,076 | |||||
Total notes payable | $ | 94,515 | $ | 155,768 | |||
Subordinated amortizing notes | — | 7,225 | |||||
Senior notes | |||||||
5 3/4% Senior Notes due April 15, 2019 | $ | 149,362 | $ | 148,826 | |||
8 1/2% Senior Notes due November 15, 2020 | — | 422,817 | |||||
7% Senior Notes due August 15, 2022 | 346,740 | 346,014 | |||||
5 7/8% Senior Notes due January 31, 2025 | 439,567 | — | |||||
Total Debt | $ | 1,030,184 | $ | 1,080,650 | |||
The maturities of the Company's Notes payable, 5 3/4% Senior Notes, 7% Senior Notes, and 5 7/8% Senior Notes are as follows as of December 31, 2017 (in thousands):
Year Ended December 31, | |||
2018 | $ | 32,213 | |
2019 | 178,866 | ||
2020 | — | ||
2021 | 33,436 | ||
2022 | 350,000 | ||
Thereafter | 450,000 | ||
$ | 1,044,515 | ||
Maturities above exclude premium on the 7% Senior Notes of $0.7 million, discount on the 5 7/8% Senior Notes of $3.2 million, and deferred loan costs on the 5 3/4%, 7%, and 5 7/8% Senior Notes in aggregate of $11.8 million as of December 31, 2017.
Notes Payable
Revolving Credit Facility
On July 1, 2016, California Lyon and Parent entered into an amendment and restatement agreement pursuant to which its existing credit agreement providing for a revolving credit facility, as previously amended and restated on March 27, 2015 as described below, was further amended and restated in its entirety (the "Second Amended Facility"). The Second Amended Facility amends and restates the Company’s previous $130.0 million revolving credit facility and provides for total lending commitments of $145.0 million. In addition, the Second Amended Facility has an uncommitted accordion feature under which the Company may increase the total principal amount up to a maximum aggregate of $200.0 million under certain circumstances, as well as a sublimit of $50.0 million for letters of credit. Effective as of November 28, 2017, California Lyon increased the size of the commitment under its revolving credit facility by $25.0 million to an aggregate total of $170.0 million, through exercise of the facility’s accordion feature and entry into a new lender supplement as of such date.
The Second Amended Facility, among other things, also amended the maturity date of the previous facility to July 1, 2019, provided that the Second Amended Facility will terminate on January 14, 2019 (the “Springing Termination Date”) if, on the Springing Termination Date, the aggregate outstanding principal amount of California Lyon’s 5.75% senior notes due 2019
F-17
is equal to or greater than the sum of (a) 50% of the Consolidated EBITDA (as defined in the Second Amended Facility) of California Lyon, Parent, certain of the Parent’s direct and indirect wholly owned subsidiaries (together with California Lyon and Parent, the “Loan Parties”) and their Restricted Subsidiaries (as defined in the Second Amended Facility) for the four-quarter period ending September 30, 2018, plus (b) the Liquidity (as defined in the Second Amended Facility) of the Loan Parties and their consolidated subsidiaries on the Springing Termination Date. Further, the Second Amended Facility amended the maximum leverage ratio covenant to extend the timing of the gradual step-downs. Specifically, pursuant to the Second Amended Facility, the maximum leverage ratio remained at 65% from June 30, 2016 through and including December 30, 2016, decreased to 62.5% on the last day of the 2016 fiscal year, remained at 62.5% from December 31, 2016 through and including June 29, 2017, and was scheduled to further decrease to 60% on the last day of the second quarter of 2017 and to remain at 60% thereafter. The Second Amended Facility did not revise any of our other financial covenants thereunder.
On June 16, 2017, California Lyon, Parent and the lenders party thereto entered into an amendment to the Second Amended Facility, which amended the maximum leverage ratio to further extend the timing of the gradual step-downs, such that the leverage ratio remained at 62.5% through and including December 30, 2017, and decreased to 60% on the last day of the 2017 fiscal year and will remain at 60% thereafter. The amendment did not revise any of our other financial covenants thereunder.
The Second Amended Facility contains certain financial maintenance covenants, including (a) a minimum tangible net worth requirement of $451.0 million (which is subject to increase over time based on subsequent earnings and proceeds from equity offerings, as well as deferred tax assets to the extent included on the Company's financial statements), (b) a maximum leverage covenant that prohibits the leverage ratio (as defined therein) from exceeding 65%, which maximum leverage ratio decreased to 62.5% effective as of December 31, 2016, and further decreased to 60% effective as of December 31, 2017, and (c) a covenant requiring us to maintain either (i) an interest coverage ratio (EBITDA to interest incurred, as defined therein) of at least 1.50 to 1.00 or (ii) liquidity (as defined therein) of an amount not less than the greater of our consolidated interest incurred during the trailing 12 months and $50.0 million. Our compliance with these financial covenants is measured by calculations and metrics that are specifically defined or described by the terms of the Second Amended Facility and can differ in certain respects from comparable GAAP or other commonly used terms. The Second Amended Facility contains customary events of default, subject to cure periods in certain circumstances, including: nonpayment of principal, interest and fees or other amounts; violation of covenants; inaccuracy of representations and warranties; cross default to certain other indebtedness; unpaid judgments; and certain bankruptcy and other insolvency events. The occurrence of any event of default could result in the termination of the commitments under the Second Amended Facility and permit the lenders to accelerate payment on outstanding borrowings under the Second Amended Facility and require cash collateralization of outstanding letters of credit. If a change in control (as defined in the Second Amended Facility) occurs, the lenders may terminate the commitments under the Second Amended Facility and require that the Company repay outstanding borrowings under the Second Amended Facility and cash collateralize outstanding letters of credit. Interest rates on borrowings generally will be based on either LIBOR or a base rate, plus the applicable spread.
In January 2017, the Company entered into an amendment which modifies the definition of Tangible Net Worth for purposes of calculating the Leverage Ratio covenant under the Second Amended Facility, so as to exclude any reduction in Tangible Net Worth (as defined therein) that occurs as a result of the costs related to payment of any call premium or any other costs associated with the refinancing transaction and the redemption of outstanding 8.5% Notes. The Company was in compliance with all covenants under the Second Amended Facility as of December 31, 2017.
Borrowings under the Second Amended Facility, the availability of which is subject to a borrowing base formula, are required to be guaranteed by the Parent and certain of the Parent's wholly-owned subsidiaries, are secured by a pledge of all equity interests held by such guarantors, and may be used for general corporate purposes. Interest rates on borrowings generally will be based on either LIBOR or a base rate, plus the applicable spread. As of December 31, 2017, the commitment fee on the unused portion of the Second Facility accrues at an annual rate of 0.50%. As of December 31, 2017, the Company had a letter of credit for $7.8 million but no outstanding balance against the Second Amended Facility. As of December 31, 2016, the Company had $29.0 million outstanding against the Second Amended Facility at an effective rate of 4.75% and a letter of credit for $8.0 million.
Seller Financing
At December 31, 2017, the Company had $0.6 million of notes payable outstanding related to one land acquisition for which seller financing was provided. The note bears interest at a rate of 7% per annum, is secured by the underlying land, and matures in June 2018. During the year ended December 31, 2017, the Company paid in full a note payable outstanding related to a land acquisition for which seller financing was provided. The note bore interest at a rate of 7% per annum, was secured by
F-18
the underlying land, and was paid upon maturity in August 2017. This note was entered into with a related party, which is described in more detail in Note 10.
Joint Venture Notes Payable
The Company and certain of its consolidated joint ventures have entered into construction notes payable agreements. These loans will be repaid with proceeds from closings and are secured by the underlying projects. The issuance date, facility size, maturity date and interest rate are listed in the table below as of December 31, 2017 (in millions):
Issuance Date | Facility Size | Outstanding | Maturity | Current Rate | ||||||||||
March, 2016 | $ | 33.4 | $ | 13.8 | (4) | September, 2018 | 4.47 | % | (1) | |||||
January, 2016 | 35.0 | 28.9 | February, 2019 | 4.82 | % | (2) | ||||||||
November, 2015 | 42.5 | 15.7 | (4) | May, 2018 | 5.50 | % | (1) | |||||||
November, 2014 | 7.0 | 2.1 | (4) | February, 2018 | 5.00 | % | (3) | |||||||
March, 2014 | 26.0 | — | (6) | April, 2018 | 4.53 | % | (1) | |||||||
July, 2017 | 66.2 | 33.4 | February, 2021 | 4.51 | % | (5) | ||||||||
$ | 210.1 | $ | 93.9 | |||||||||||
(1) Loan bears interest at the Company's option of either LIBOR +3.0% or the prime rate +1.0%.
(2) Loan bears interest at LIBOR +3.25%.
(3) Loan bears interest at the prime rate +0.5%.
(4) The Company anticipates paying the borrowings in full upon the maturity date from proceeds from homes closed in the respective project.
(5) Loan bears interest at the greatest of the prime rate, federal funds effective rate +1.0%, or LIBOR +1.0%.
(6) The balance on this borrowing was paid in full prior to the maturity date, along with all accrued interest to date.
The joint venture notes payable contain certain financial maintenance covenants. The Company was in compliance with all such covenants as of December 31, 2017.
Subordinated Amortizing Notes
On November 21, 2014, in order to pay down approximately $111.2 million borrowed under the one-year senior unsecured facility entered into in conjunction with the acquisition of Polygon, the Company completed its public offering and sale of 1,000,000 6.50% tangible equity units (“TEUs”, or "Units"), sold for a stated amount of $100 per Unit, featuring a 17.5% conversion premium. On December 3, 2014, the Company sold an additional 150,000 TEUs pursuant to an over-allotment option granted to the underwriters. Each TEU is a unit composed of two parts:
• | a prepaid stock purchase contract (a “purchase contract”); and |
• | a senior subordinated amortizing note (an “amortizing note”). |
Each amortizing note had an initial principal amount of $18.01, bore interest at the annual rate of 5.50% and had a final installment payment date of December 1, 2017. On each March 1, June 1, September 1 and December 1, commencing on March 1, 2015, William Lyon Homes paid equal quarterly installments of $1.6250 on each amortizing note (except for the March 1, 2015 installment payment, which was $1.8056 per amortizing note). Each installment constituted a payment of interest and a partial repayment of principal.
On November 27, 2017, the Company issued 670,811 shares of Class A Common Stock to certain holders who elected for early settlement of their purchase contracts. On December 1, 2017 (the "mandatory settlement date"), the Company issued the balance to the remaining holders, for an aggregate issuance of 5,113,473 shares of Class A Common Stock, which reflected the minimum number of shares of Class A Common Stock, or 4.4465 shares per each of the previously outstanding 1,150,000 tangible equity units that were issuable by the Company under the purchase contracts (as adjusted for fractional shares). As of December 31, 2017, the Company paid off the outstanding balance of the amortizing notes.
5 3/4% Senior Notes Due 2019
On March 31, 2014, California Lyon completed its private placement with registration rights of 5.75% Senior Notes due 2019 (the "5.75% Notes"), in an aggregate principal amount of $150 million. The 5.75% Notes were issued at 100% of their
F-19
aggregate principal amount. In August 2014, the Company exchanged 100% of the 5.75% Notes for notes that are freely transferable and registered under the Securities Act of 1933, as amended (the "Securities Act").
As of December 31, 2017, the outstanding principal amount of the 5.75% Notes was $150 million, excluding deferred loan costs of $0.6 million. The 5.75% Notes bear interest at a rate of 5.75% per annum, payable semiannually in arrears on April 15 and October 15, and mature on April 15, 2019. The 5.75% Notes are unconditionally guaranteed on a joint and several unsecured basis by Parent and by certain of Parent’s existing and future restricted subsidiaries. The 5.75% Notes and the related guarantees are California Lyon’s and the guarantors’ unsecured senior obligations and rank equally in right of payment with all of California Lyon’s and the guarantors’ existing and future unsecured senior debt, including California Lyon’s $350 million in aggregate principal amount of 7.00% Notes and $450 million in aggregate principal amount of 5.875% Notes, each as described below. The 5.75% Notes rank senior in right of payment to all of California Lyon’s and the guarantors’ future subordinated debt. The 5.75% Notes and the guarantees are and will be effectively junior to California Lyon’s and the guarantors’ existing and future secured debt to the extent of the value of the collateral securing such debt.
On or after April 15, 2016, California Lyon may redeem all or a portion of the 5.75% Notes upon not less than 30 nor more than 60 days’ notice, at the redemption prices (expressed as percentages of the principal amount) set forth below plus accrued and unpaid interest to the applicable redemption date, if redeemed during the period beginning on each of the dates indicated below:
Year | Percentage | |
April 15, 2016 | 104.313 | % |
October 15, 2016 | 102.875 | % |
April 15, 2017 | 101.438 | % |
April 15, 2018 and thereafter | 100.000 | % |
8 1/2% Senior Notes Due 2020
On November 8, 2012, William Lyon Homes, Inc., a California corporation and wholly-owned subsidiary of the Company (“California Lyon”) completed its private placement with registration rights of 8.5% Senior Notes due 2020 (the "initial 8.5% Notes"), in an aggregate principal amount of $325 million. The initial 8.5% Notes were issued at 100% of their aggregate principal amount. In July 2013, the Company exchanged 100% of the initial8.5% Notes for notes that are freely transferable and registered under the Securities Act.
On October 24, 2013, California Lyon completed its private placement with registration rights of an additional $100.0 million in aggregate principal amount of its 8.5% Senior Notes due 2020 (the “additional 8.5% Notes”, and together with the initial 8.5% Notes, the "8.5% Notes") at an issue price of 106.5% of their aggregate principal amount, plus accrued interest from and including May 15, 2013, in a private placement, resulting in net proceeds of approximately $104.7 million. In February 2014, the Company exchanged 100% of the additional 8.5% Notes for notes that are freely transferable and registered under the Securities Act.
On January 31, 2017, California Lyon completed the sale to certain purchasers of $450.0 million in aggregate principal amount of 5.875% Senior Notes due 2025 in a private placement with registration rights. Parent, through California Lyon, used the net proceeds from the 5.875% Notes, as further described below, to purchase $395.6 million of the outstanding aggregate principal amount of the 8.5% Notes, pursuant to a cash tender offer and consent solicitation. Subsequently, the Company used the remaining proceeds, together with cash on hand, for the retirement of the remaining outstanding 8.5% Notes, such that the entire aggregate $425 million of previously outstanding 8.5% Notes are retired and extinguished as of December 31, 2017. The Company incurred certain costs related to the early extinguishment of debt of the 8.5% Notes during the period ended December 31, 2017 in an amount of $21.8 million, which is included in the Consolidated Statement of Operations as Loss on extinguishment of debt.
7% Senior Notes Due 2022
On August 11, 2014, WLH PNW Finance Corp. (“Escrow Issuer”), completed its private placement with registration rights of 7.00% Senior Notes due 2022 (the “initial 7.00% Notes”), in an aggregate principal amount of $300 million. The initial 7.00% Notes were issued at 100% of their aggregate principal amount. On August 12, 2014, in connection with the consummation of the Acquisition, Escrow Issuer merged with and into California Lyon, and California Lyon assumed the
F-20
obligations of the Escrow Issuer under initial 7.00% Notes and the related indenture by operation of law (the “Escrow Merger”). Following the Escrow Merger, California Lyon is the obligor under the initial 7.00% Notes. In January 2015, the Company exchanged 100% of the initial 7.00% Notes for notes that are freely transferable and registered under the Securities Act.
On September 15, 2015, California Lyon completed its private placement with registration rights of an additional $50.0 million in aggregate principal amount of its 7.00% Senior Notes due 2022 (the "additional 7.00% Notes", and together with the initial 7.00% Notes, the "7.00 Notes"), at an issue price of 102.0% of their principal amount, plus accrued interest from August 15, 2015, resulting in net proceeds of approximately $50.5 million. In January 2016, the Company exchanged 100% of the additional 7.00% Notes for notes that are freely transferable and registered under the Securities Act.
As of December 31, 2017, the outstanding amount of the notes was $350 million, excluding unamortized premium of $0.7 million and deferred loan costs of $4.0 million. The notes bear interest at a rate of 7.00% per annum, payable semiannually in arrears on February 15 and August 15, and mature on August 15, 2022. The 7.00% Notes are unconditionally guaranteed on a joint and several unsecured basis by Parent and certain of its existing and future restricted subsidiaries. The 7.00% Notes and the related guarantees are California Lyon’s and the guarantors’ unsecured senior obligations and rank equally in right of payment with all of California Lyon’s and the guarantors’ existing and future unsecured senior debt, including California Lyon’s $150 million in aggregate principal amount of 5.75% Notes and $450 million in aggregate principal amount of 5.875% Notes, each as described above. The 7.00% Notes rank senior in right of payment to all of California Lyon’s and the guarantors’ future subordinated debt. The 7.00% Notes and the guarantees are and will be effectively junior to California Lyon’s and the guarantors’ existing and future secured debt to the extent of the value of the collateral securing such debt.
On or after August 15, 2017, California Lyon may redeem all or a portion of the 7.00% Notes upon not less than 30 nor more than 60 days’ notice, at the redemption prices (expressed as percentages of the principal amount) set forth below plus accrued and unpaid interest to the applicable redemption date, if redeemed during the period beginning on each of the dates indicated below:
Year | Percentage | |
August 15, 2017 | 103.500 | % |
August 15, 2018 | 101.750 | % |
August 15, 2019 and thereafter | 100.000 | % |
Prior to August 15, 2017, the 7.00% Notes may be redeemed in whole or in part at a redemption price equal to 100% of the principal amount plus a “make-whole” premium, and accrued and unpaid interest to, the redemption date.
5 7/8% Senior Notes Due 2025
On January 31, 2017, California Lyon completed its private placement with registration rights of 5.875% Senior Notes due 2025 (the "5.875% Notes"), in an aggregate principal amount of $450 million. The 5.875% Notes were issued at 99.215% of their aggregate principal amount. Parent, through California Lyon, used the net proceeds from the 5.875% Notes offering to purchase the outstanding aggregate principal amount of the 8.5% Notes such that the entire aggregate $425 million of previously outstanding 8.5% Notes are retired and extinguished as of December 31, 2017. In May 2017, the Company exchanged 100% of the 5.875% Notes for notes that are freely transferable and registered under the Securities Act.
As of December 31, 2017, the outstanding principal amount of the 5.875% Notes was $450 million, excluding unamortized discount of $3.2 million and deferred loan costs of $7.2 million. The 5.875% Notes bear interest at a rate of 5.875% per annum, payable semiannually in arrears on January 31 and July 31, and mature on January 31, 2025. The 5.875% Notes are unconditionally guaranteed on a joint and several unsecured basis by Parent and certain of its existing and future restricted subsidiaries. The 5.875% Notes and the related guarantees are California Lyon’s and the guarantors’ unsecured senior obligations and rank equally in right of payment with all of California Lyon’s and the guarantors’ existing and future unsecured senior debt, including California Lyon’s $150 million in aggregate principal amount of 5.75% Senior Notes due 2019 and $350 million in aggregate principal amount of 7.00% Senior Notes due 2022, each as described above. The 5.875% Notes rank senior in right of payment to all of California Lyon’s and the guarantors’ future subordinated debt. The 5.875% Notes and the guarantees are and will be effectively junior to California Lyon’s and the guarantors’ existing and future secured debt to the extent of the value of the collateral securing such debt.
F-21
On or after January 31, 2020, California Lyon may redeem all or a portion of the 5.875% Notes upon not less than 30 nor more than 60 days’ notice, at the redemption prices (expressed as percentages of principal amount), set forth below plus accrued and unpaid interest to the redemption date, if redeemed during the 12-month period commencing on each of the dates indicated below:
Year | Percentage | |
January 31, 2020 | 102.938 | % |
January 31, 2021 | 101.469 | % |
January 31, 2022 | 100.734 | % |
January 31, 2023 and thereafter | 100.000 | % |
Prior to January 31, 2020, the 5.875% Notes may be redeemed in whole or in part at a redemption price equal to 100% of the principal amount plus a "make-whole" premium, and accrued and unpaid interest to, the redemption date.
In addition, any time prior to January 31, 2020, California Lyon may, at its option on one or more occasions, redeem the 5.875% Notes in an aggregate principal amount not to exceed 35% of the aggregate principal amount of the 5.875% Notes issued prior to such date at a redemption price (expressed as a percentage of principal amount) of 105.875%, plus accrued and unpaid interest to the redemption date, with an amount equal to the net cash proceeds from one or more equity offerings.
Senior Note Covenant Compliance
The indentures governing the 5.75% Notes, the 7.00% Notes, and the 5.875% Notes, contain covenants that limit the ability of Parent, California Lyon, and their restricted subsidiaries to, among other things: (i) incur or guarantee certain additional indebtedness; (ii) pay dividends, distributions, or repurchase equity or make payments in respect of subordinated indebtedness; (iii) make certain investments; (iv) sell assets; (v) incur liens; (vi) enter into agreements restricting the ability of the Company’s restricted subsidiaries to pay dividends or transfer assets; (vii) enter into transactions with affiliates; (viii) create unrestricted subsidiaries; and (viii) consolidate, merge or sell all or substantially all of its assets. These covenants are subject to a number of important exceptions and qualifications as described in the indentures. The Company was in compliance with all such covenants as of December 31, 2017.
F-22
GUARANTOR AND NON-GUARANTOR FINANCIAL STATEMENTS
The following consolidating financial information includes:
(1) Consolidating balance sheets as of December 31, 2017 and 2016; consolidating statements of operations and cash flows for the years ended December 31, 2017, 2016 and 2015, of (a) William Lyon Homes, as the parent, or “Delaware Lyon”, (b) William Lyon Homes, Inc., as the subsidiary issuer, or “California Lyon”, (c) the guarantor subsidiaries, (d) the non-guarantor subsidiaries and (e) William Lyon Homes, Inc. on a consolidated basis; and
(2) Elimination entries necessary to consolidate Delaware Lyon, with William Lyon Homes, Inc. and its guarantor and non-guarantor subsidiaries.
Delaware Lyons owns 100% of all of its guarantor subsidiaries and all guarantees are full and unconditional, joint and several. As a result, in accordance with Rule 3-10 (d) of Regulation S-X promulgated by the SEC, no separate financial statements are required for these subsidiaries as of December 31, 2017 and 2016, and for the years ended December 31, 2017 2016, and 2015.
The consolidating balance sheet as of December 31, 2016 was adjusted to reflect the adoption of ASU 2016-02 (see Note 1).
F-23
CONSOLIDATING BALANCE SHEET
December 31, 2017
(in thousands)
Unconsolidated | |||||||||||||||||||||||
Delaware Lyon | California Lyon | Guarantor Subsidiaries | Non-Guarantor Subsidiaries | Eliminating Entries | Consolidated Company | ||||||||||||||||||
ASSETS | |||||||||||||||||||||||
Cash and cash equivalents | $ | — | $ | 171,434 | $ | 156 | $ | 11,120 | $ | — | $ | 182,710 | |||||||||||
Receivables | — | 4,647 | 2,252 | 3,324 | — | 10,223 | |||||||||||||||||
Escrow proceeds receivable | — | 1,594 | 1,725 | — | — | 3,319 | |||||||||||||||||
Real estate inventories | — | 831,007 | 630,384 | 238,459 | — | 1,699,850 | |||||||||||||||||
Investment in unconsolidated joint ventures | — | 7,717 | 150 | — | — | 7,867 | |||||||||||||||||
Goodwill | — | 14,209 | 52,693 | — | — | 66,902 | |||||||||||||||||
Intangibles, net | — | — | 6,700 | — | — | 6,700 | |||||||||||||||||
Deferred income taxes, net | — | 47,915 | — | — | — | 47,915 | |||||||||||||||||
Lease right-of-use assets | — | 14,454 | — | — | — | 14,454 | |||||||||||||||||
Other assets, net | — | 18,167 | 2,504 | 493 | — | 21,164 | |||||||||||||||||
Investments in subsidiaries | 780,472 | (16,544 | ) | (494,201 | ) | — | (269,727 | ) | — | ||||||||||||||
Intercompany receivables | — | — | 269,831 | — | (269,831 | ) | — | ||||||||||||||||
Total assets | $ | 780,472 | $ | 1,094,600 | $ | 472,194 | $ | 253,396 | $ | (539,558 | ) | $ | 2,061,104 | ||||||||||
LIABILITIES AND EQUITY | |||||||||||||||||||||||
Accounts payable | $ | — | $ | 40,075 | $ | 13,007 | $ | 5,717 | $ | — | $ | 58,799 | |||||||||||
Accrued expenses | — | 108,407 | 2,988 | 96 | — | 111,491 | |||||||||||||||||
Notes payable | — | 589 | — | 93,926 | — | 94,515 | |||||||||||||||||
5 3/4% Senior Notes | — | 149,362 | — | — | — | 149,362 | |||||||||||||||||
7% Senior Notes | — | 346,740 | — | — | — | 346,740 | |||||||||||||||||
5 7/8% Senior Notes | — | 439,567 | — | — | — | 439,567 | |||||||||||||||||
Intercompany payables | — | 179,788 | — | 90,043 | (269,831 | ) | — | ||||||||||||||||
Total liabilities | — | 1,264,528 | 15,995 | 189,782 | (269,831 | ) | 1,200,474 | ||||||||||||||||
Equity | |||||||||||||||||||||||
William Lyon Homes stockholders’ equity | 780,472 | (169,928 | ) | 456,199 | (16,544 | ) | (269,727 | ) | 780,472 | ||||||||||||||
Noncontrolling interests | — | — | — | 80,158 | — | 80,158 | |||||||||||||||||
Total liabilities and equity | $ | 780,472 | $ | 1,094,600 | $ | 472,194 | $ | 253,396 | $ | (539,558 | ) | $ | 2,061,104 | ||||||||||
F-24
CONSOLIDATING BALANCE SHEET
December 31, 2016
(as adjusted)
(in thousands)
Unconsolidated | |||||||||||||||||||||||
Delaware Lyon | California Lyon | Guarantor Subsidiaries | Non-Guarantor Subsidiaries | Eliminating Entries | Consolidated Company | ||||||||||||||||||
ASSETS | |||||||||||||||||||||||
Cash and cash equivalents | $ | — | $ | 36,204 | $ | 272 | $ | 6,136 | $ | — | $ | 42,612 | |||||||||||
Receivables | — | 2,989 | 3,303 | 3,246 | — | 9,538 | |||||||||||||||||
Escrow proceeds receivable | — | 85 | — | — | — | 85 | |||||||||||||||||
Real estate inventories | — | 910,594 | 645,341 | 216,063 | — | 1,771,998 | |||||||||||||||||
Investment in unconsolidated joint ventures | — | 7,132 | 150 | — | — | 7,282 | |||||||||||||||||
Goodwill | — | 14,209 | 52,693 | — | — | 66,902 | |||||||||||||||||
Intangibles, net | — | — | 6,700 | — | — | 6,700 | |||||||||||||||||
Deferred income taxes, net | — | 75,751 | — | — | — | 75,751 | |||||||||||||||||
Lease right-of-use assets | — | 13,129 | — | — | — | 13,129 | |||||||||||||||||
Other assets, net | — | 15,779 | 1,089 | 415 | — | 17,283 | |||||||||||||||||
Investments in subsidiaries | 697,086 | (23,736 | ) | (573,650 | ) | — | (99,700 | ) | — | ||||||||||||||
Intercompany receivables | — | — | 252,860 | — | (252,860 | ) | — | ||||||||||||||||
Total assets | $ | 697,086 | $ | 1,052,136 | $ | 388,758 | $ | 225,860 | $ | (352,560 | ) | $ | 2,011,280 | ||||||||||
LIABILITIES AND EQUITY | |||||||||||||||||||||||
Accounts payable | $ | — | $ | 52,380 | $ | 16,416 | $ | 5,486 | $ | — | $ | 74,282 | |||||||||||
Accrued expenses | — | 88,187 | 4,634 | 98 | — | 92,919 | |||||||||||||||||
Notes payable | — | 50,713 | 2,979 | 102,076 | — | 155,768 | |||||||||||||||||
Subordinated Amortizing Notes | — | 7,225 | — | — | — | 7,225 | |||||||||||||||||
5 3/4% Senior Notes | — | 148,826 | — | — | — | 148,826 | |||||||||||||||||
8 1/2% Senior Notes | — | 422,817 | — | — | — | 422,817 | |||||||||||||||||
7% Senior Notes | — | 346,014 | — | — | — | 346,014 | |||||||||||||||||
Intercompany payables | — | 177,267 | — | 75,593 | (252,860 | ) | — | ||||||||||||||||
Total liabilities | — | 1,293,429 | 24,029 | 183,253 | (252,860 | ) | 1,247,851 | ||||||||||||||||
Equity | |||||||||||||||||||||||
William Lyon Homes stockholders’ equity | 697,086 | (241,291 | ) | 364,727 | (23,736 | ) | (99,700 | ) | 697,086 | ||||||||||||||
Noncontrolling interests | — | — | — | 66,343 | — | 66,343 | |||||||||||||||||
Total liabilities and equity | $ | 697,086 | $ | 1,052,138 | $ | 388,756 | $ | 225,860 | $ | (352,560 | ) | $ | 2,011,280 | ||||||||||
F-25
CONSOLIDATING STATEMENT OF OPERATIONS
Year Ended December 31, 2017
(in thousands)
Unconsolidated | |||||||||||||||||||||||
Delaware Lyon | California Lyon | Guarantor Subsidiaries | Non-Guarantor Subsidiaries | Eliminating Entries | Consolidated Company | ||||||||||||||||||
Operating revenue | |||||||||||||||||||||||
Sales | $ | — | $ | 748,396 | $ | 844,611 | $ | 202,067 | $ | — | $ | 1,795,074 | |||||||||||
Construction services | — | 1,454 | — | — | — | 1,454 | |||||||||||||||||
Management fees | — | (5,741 | ) | — | — | 5,741 | — | ||||||||||||||||
— | 744,109 | 844,611 | 202,067 | 5,741 | 1,796,528 | ||||||||||||||||||
Operating costs | |||||||||||||||||||||||
Cost of sales | — | (596,970 | ) | (700,878 | ) | (174,960 | ) | (5,741 | ) | (1,478,549 | ) | ||||||||||||
Construction services | — | (1,317 | ) | — | — | — | (1,317 | ) | |||||||||||||||
Sales and marketing | — | (30,637 | ) | (44,849 | ) | (10,740 | ) | — | (86,226 | ) | |||||||||||||
General and administrative | — | (73,748 | ) | (16,457 | ) | (1 | ) | — | (90,206 | ) | |||||||||||||
Other | — | (2,560 | ) | 308 | (22 | ) | — | (2,274 | ) | ||||||||||||||
— | (705,232 | ) | (761,876 | ) | (185,723 | ) | (5,741 | ) | (1,658,572 | ) | |||||||||||||
Income (loss) from subsidiaries | 48,135 | 20,382 | — | — | (68,517 | ) | — | ||||||||||||||||
Operating income | 48,135 | 59,259 | 82,735 | 16,344 | (68,517 | ) | 137,956 | ||||||||||||||||
Equity in income of unconsolidated joint ventures | — | 2,135 | 1,526 | — | — | 3,661 | |||||||||||||||||
Other income (expense), net | — | 2,029 | 264 | (1,398 | ) | — | 895 | ||||||||||||||||
Income (loss) before loss on extinguishment of debt | 48,135 | 63,423 | 84,525 | 14,946 | (68,517 | ) | 142,512 | ||||||||||||||||
Loss on extinguishment of debt | — | (21,828 | ) | — | — | — | (21,828 | ) | |||||||||||||||
Income (loss) before provision for income taxes | 48,135 | 41,595 | 84,525 | 14,946 | (68,517 | ) | 120,684 | ||||||||||||||||
Provision for income taxes | (62,933 | ) | — | — | — | (62,933 | ) | ||||||||||||||||
Net income (loss) | 48,135 | (21,338 | ) | 84,525 | 14,946 | (68,517 | ) | 57,751 | |||||||||||||||
Less: Net income attributable to noncontrolling interests | — | — | — | (9,616 | ) | — | (9,616 | ) | |||||||||||||||
Net income (loss) available to common stockholders | $ | 48,135 | $ | (21,338 | ) | $ | 84,525 | $ | 5,330 | $ | (68,517 | ) | $ | 48,135 | |||||||||
F-26
CONSOLIDATING STATEMENT OF OPERATIONS
Year Ended December 31, 2016
(in thousands)
Unconsolidated | |||||||||||||||||||||||
Delaware Lyon | California Lyon | Guarantor Subsidiaries | Non-Guarantor Subsidiaries | Eliminating Entries | Consolidated Company | ||||||||||||||||||
Operating revenue | |||||||||||||||||||||||
Sales | $ | — | $ | 573,191 | $ | 680,138 | $ | 148,874 | $ | — | $ | 1,402,203 | |||||||||||
Construction services | — | 3,837 | — | — | — | 3,837 | |||||||||||||||||
Management fees | — | (4,362 | ) | — | — | 4,362 | — | ||||||||||||||||
— | 572,666 | 680,138 | 148,874 | 4,362 | 1,406,040 | ||||||||||||||||||
Operating costs | |||||||||||||||||||||||
Cost of sales | — | (462,153 | ) | (564,596 | ) | (131,226 | ) | (4,362 | ) | (1,162,337 | ) | ||||||||||||
Construction services | — | (3,485 | ) | — | — | — | (3,485 | ) | |||||||||||||||
Sales and marketing | — | (27,329 | ) | (36,170 | ) | (9,010 | ) | — | (72,509 | ) | |||||||||||||
General and administrative | — | (60,141 | ) | (13,256 | ) | (1 | ) | — | (73,398 | ) | |||||||||||||
Other | — | (442 | ) | 100 | (1 | ) | — | (343 | ) | ||||||||||||||
— | (553,550 | ) | (613,922 | ) | (140,238 | ) | (4,362 | ) | (1,312,072 | ) | |||||||||||||
Income (loss) from subsidiaries | 59,696 | 8,331 | — | — | (68,027 | ) | — | ||||||||||||||||
Operating income | 59,696 | 27,447 | 66,216 | 8,636 | (68,027 | ) | 93,968 | ||||||||||||||||
Equity in income of unconsolidated joint ventures | — | 4,369 | 1,237 | — | — | 5,606 | |||||||||||||||||
Other income (expense), net | — | 4,640 | (34 | ) | (1,363 | ) | — | 3,243 | |||||||||||||||
Income (loss) before provision for income taxes | 59,696 | 36,456 | 67,419 | 7,273 | (68,027 | ) | 102,817 | ||||||||||||||||
Provision for income taxes | — | (34,850 | ) | — | — | — | (34,850 | ) | |||||||||||||||
Net income (loss) | 59,696 | 1,606 | 67,419 | 7,273 | (68,027 | ) | 67,967 | ||||||||||||||||
Less: Net income attributable to noncontrolling interests | — | — | — | (8,271 | ) | — | (8,271 | ) | |||||||||||||||
Net income (loss) available to common stockholders | $ | 59,696 | $ | 1,606 | $ | 67,419 | $ | (998 | ) | $ | (68,027 | ) | $ | 59,696 | |||||||||
F-27
CONSOLIDATING STATEMENT OF OPERATIONS
Year Ended December 31, 2015
(in thousands)
Unconsolidated | |||||||||||||||||||||||
Delaware Lyon | California Lyon | Guarantor Subsidiaries | Non-Guarantor Subsidiaries | Eliminating Entries | Consolidated Company | ||||||||||||||||||
Operating revenue | |||||||||||||||||||||||
Sales | $ | — | $ | 459,990 | $ | 568,774 | $ | 50,164 | $ | — | $ | 1,078,928 | |||||||||||
Construction services | — | 25,124 | — | — | — | 25,124 | |||||||||||||||||
Management fees | — | (1,506 | ) | — | — | 1,506 | — | ||||||||||||||||
— | 483,608 | 568,774 | 50,164 | 1,506 | 1,104,052 | ||||||||||||||||||
Operating costs | |||||||||||||||||||||||
Cost of sales | — | (358,793 | ) | (475,043 | ) | (43,653 | ) | (1,506 | ) | (878,995 | ) | ||||||||||||
Construction services | — | (21,181 | ) | — | — | — | (21,181 | ) | |||||||||||||||
Sales and marketing | — | (26,626 | ) | (31,231 | ) | (3,682 | ) | — | (61,539 | ) | |||||||||||||
General and administrative | — | (47,385 | ) | (11,776 | ) | — | — | (59,161 | ) | ||||||||||||||
Amortization of intangible assets | — | (957 | ) | — | — | — | (957 | ) | |||||||||||||||
Other | — | (3,477 | ) | 1,505 | — | — | (1,972 | ) | |||||||||||||||
— | (458,419 | ) | (516,545 | ) | (47,335 | ) | (1,506 | ) | (1,023,805 | ) | |||||||||||||
Income (loss) from subsidiaries | 57,336 | (2,395 | ) | — | — | (54,941 | ) | — | |||||||||||||||
Operating income | 57,336 | 22,794 | 52,229 | 2,829 | (54,941 | ) | 80,247 | ||||||||||||||||
Income from unconsolidated joint ventures | — | 1,912 | 1,327 | — | — | 3,239 | |||||||||||||||||
Other income (expense), net | — | 7,911 | 4,793 | (9,123 | ) | — | 3,581 | ||||||||||||||||
Income before provision for income taxes | 57,336 | 32,617 | 58,349 | (6,294 | ) | (54,941 | ) | 87,067 | |||||||||||||||
Provision for income taxes | — | (26,806 | ) | — | — | — | (26,806 | ) | |||||||||||||||
Net income | 57,336 | 5,811 | 58,349 | (6,294 | ) | (54,941 | ) | 60,261 | |||||||||||||||
Less: Net income attributable to noncontrolling interests | — | — | — | (2,925 | ) | — | (2,925 | ) | |||||||||||||||
Net income available to common stockholders | $ | 57,336 | $ | 5,811 | $ | 58,349 | $ | (9,219 | ) | $ | (54,941 | ) | $ | 57,336 | |||||||||
F-28
CONSOLIDATING STATEMENT OF CASH FLOWS
Year Ended December 31, 2017
(in thousands)
Unconsolidated | |||||||||||||||||||||||
Delaware Lyon | California Lyon | Guarantor Subsidiaries | Non-Guarantor Subsidiaries | Eliminating Entries | Consolidated Company | ||||||||||||||||||
Operating activities | |||||||||||||||||||||||
Net cash (used in) provided by operating activities | $ | (35,251 | ) | $ | 84,840 | $ | 89,914 | $ | (7,300 | ) | $ | 35,251 | $ | 167,454 | |||||||||
Investing activities | |||||||||||||||||||||||
Purchases of property and equipment | — | (3,668 | ) | (555 | ) | (77 | ) | — | (4,300 | ) | |||||||||||||
Investments in subsidiaries | — | 13,190 | (79,449 | ) | — | 66,259 | — | ||||||||||||||||
Net cash provided by (used in) investing activities | — | 9,522 | (80,004 | ) | (77 | ) | 66,259 | (4,300 | ) | ||||||||||||||
Financing activities | |||||||||||||||||||||||
Proceeds from borrowings on notes payable | — | — | — | 134,061 | — | 134,061 | |||||||||||||||||
Principal payments on notes payable | — | — | — | (142,211 | ) | — | (142,211 | ) | |||||||||||||||
Redemption premium of 8.5% Senior Notes | — | (19,645 | ) | — | — | — | (19,645 | ) | |||||||||||||||
Principal payments of 8.5% Senior Notes | — | (425,000 | ) | — | — | — | (425,000 | ) | |||||||||||||||
Proceeds from issuance of 5.875% Senior Notes | — | 446,468 | — | — | — | 446,468 | |||||||||||||||||
Proceeds from borrowings on revolver | — | 346,121 | — | — | — | 346,121 | |||||||||||||||||
Payments on revolver | — | (375,121 | ) | — | — | — | (375,121 | ) | |||||||||||||||
Principal payments on subordinated amortizing notes | — | (7,225 | ) | — | — | — | (7,225 | ) | |||||||||||||||
Proceeds from issuance of Class B Shares | — | 29,908 | — | — | — | 29,908 | |||||||||||||||||
Costs related to settlement of TEUs | — | (63 | ) | — | — | — | (63 | ) | |||||||||||||||
Shares remitted to, or withheld by the Company for employee tax withholding | — | (1,544 | ) | — | — | — | (1,544 | ) | |||||||||||||||
Payments to repurchase common stock | — | (3,112 | ) | — | — | — | (3,112 | ) | |||||||||||||||
Payment of deferred loan costs | — | (9,892 | ) | — | — | — | (9,892 | ) | |||||||||||||||
Cash contributions from members of consolidated entities | — | — | — | 66,712 | — | 66,712 | |||||||||||||||||
Cash distributions to members of consolidated entities | — | — | — | (62,513 | ) | — | (62,513 | ) | |||||||||||||||
Advances to affiliates | — | — | 6,947 | 1,862 | (8,809 | ) | — | ||||||||||||||||
Intercompany receivables/payables | 35,251 | 59,973 | (16,973 | ) | 14,450 | (92,701 | ) | — | |||||||||||||||
Net cash provided by (used in) financing activities | 35,251 | 40,868 | (10,026 | ) | 12,361 | (101,510 | ) | (23,056 | ) | ||||||||||||||
Net increase (decrease) in cash and cash equivalents | — | 135,230 | (116 | ) | 4,984 | — | 140,098 | ||||||||||||||||
Cash and cash equivalents at beginning of period | — | 36,204 | 272 | 6,136 | — | 42,612 | |||||||||||||||||
Cash and cash equivalents at end of period | $ | — | $ | 171,434 | $ | 156 | $ | 11,120 | $ | — | $ | 182,710 | |||||||||||
F-29
CONSOLIDATING STATEMENT OF CASH FLOWS
Year Ended December 31, 2016
(in thousands)
Unconsolidated | |||||||||||||||||||||||
Delaware Lyon | California Lyon | Guarantor Subsidiaries | Non-Guarantor Subsidiaries | Eliminating Entries | Consolidated Company | ||||||||||||||||||
Operating activities | |||||||||||||||||||||||
Net cash (used in) provided by operating activities | $ | (5,295 | ) | $ | 64,780 | $ | (778 | ) | $ | (42,296 | ) | $ | 5,295 | $ | 21,706 | ||||||||
Investing activities | |||||||||||||||||||||||
Proceeds from repayment of notes receivable | — | 6,188 | — | — | — | 6,188 | |||||||||||||||||
Purchases of property and equipment | — | (1,004 | ) | 85 | (110 | ) | — | (1,029 | ) | ||||||||||||||
Investments in subsidiaries | — | (2,455 | ) | 12,104 | — | (9,649 | ) | — | |||||||||||||||
Net cash provided by (used in) investing activities | — | 2,729 | 12,189 | (110 | ) | (9,649 | ) | 5,159 | |||||||||||||||
Financing activities | |||||||||||||||||||||||
Proceeds from borrowings on notes payable | — | 2,211 | — | 137,572 | — | 139,783 | |||||||||||||||||
Principal payments on notes payable | — | (18,125 | ) | — | (129,762 | ) | — | (147,887 | ) | ||||||||||||||
Proceeds from borrowings on revolver | — | 258,000 | — | — | — | 258,000 | |||||||||||||||||
Payments on revolver | — | (294,000 | ) | — | — | — | (294,000 | ) | |||||||||||||||
Principal payments on Subordinated amortizing notes | — | (6,841 | ) | — | — | — | (6,841 | ) | |||||||||||||||
Purchase of common stock | — | (942 | ) | — | — | — | (942 | ) | |||||||||||||||
Excess income tax benefit from stock based awards | — | (182 | ) | — | — | — | (182 | ) | |||||||||||||||
Payments of deferred loan costs | — | (1,085 | ) | — | — | — | (1,085 | ) | |||||||||||||||
Noncontrolling interest contributions | — | — | — | 38,334 | — | 38,334 | |||||||||||||||||
Noncontrolling interest distributions | — | — | — | (19,636 | ) | — | (19,636 | ) | |||||||||||||||
Advances to affiliates | — | — | (252 | ) | 11,784 | (11,532 | ) | — | |||||||||||||||
Intercompany receivables/payables | 5,295 | (14,672 | ) | (13,611 | ) | 7,102 | 15,886 | — | |||||||||||||||
Net cash provided by (used in) financing activities | 5,295 | (75,636 | ) | (13,863 | ) | 45,394 | 4,354 | (34,456 | ) | ||||||||||||||
Net (decrease) increase in cash and cash equivalents | — | (8,127 | ) | (2,452 | ) | 2,988 | — | (7,591 | ) | ||||||||||||||
Cash and cash equivalents at beginning of period | — | 44,331 | 2,724 | 3,148 | — | 50,203 | |||||||||||||||||
Cash and cash equivalents at end of period | $ | — | $ | 36,204 | $ | 272 | $ | 6,136 | $ | — | $ | 42,612 | |||||||||||
F-30
CONSOLIDATING STATEMENT OF CASH FLOWS
Year Ended December 31, 2015
(in thousands)
Unconsolidated | |||||||||||||||||||||||
Delaware Lyon | California Lyon | Guarantor Subsidiaries | Non-Guarantor Subsidiaries | Eliminating Entries | Consolidated Company | ||||||||||||||||||
Operating activities | |||||||||||||||||||||||
Net cash (used in) provided by operating activities | $ | (4,844 | ) | $ | (123,099 | ) | $ | 26,398 | $ | (76,207 | ) | $ | 4,844 | $ | (172,908 | ) | |||||||
Investing activities | |||||||||||||||||||||||
Investment in and advances to joint ventures | — | (1,000 | ) | — | — | — | (1,000 | ) | |||||||||||||||
Purchases of property and equipment | — | (4,918 | ) | 89 | 29 | — | (4,800 | ) | |||||||||||||||
Investments in subsidiaries | — | (3,833 | ) | (12,584 | ) | — | 16,417 | — | |||||||||||||||
Net cash (used in) provided by investing activities | — | (9,751 | ) | (12,495 | ) | 29 | 16,417 | (5,800 | ) | ||||||||||||||
Financing activities | |||||||||||||||||||||||
Proceeds from borrowings on notes payable | — | 34,955 | — | 84,708 | — | 119,663 | |||||||||||||||||
Principal payments on notes payable | — | (28,924 | ) | (162 | ) | (29,131 | ) | — | (58,217 | ) | |||||||||||||
Proceeds from issuance of 7 % Senior Notes | — | 51,000 | — | — | — | 51,000 | |||||||||||||||||
Proceeds from borrowings on revolver | — | 229,000 | — | — | — | 229,000 | |||||||||||||||||
Payments on revolver | — | (164,000 | ) | — | — | — | (164,000 | ) | |||||||||||||||
Principal payments on Subordinated amortizing notes | — | (6,651 | ) | — | — | — | (6,651 | ) | |||||||||||||||
Proceeds from stock options exercised | — | 106 | — | — | — | 106 | |||||||||||||||||
Purchase of common stock | — | (1,832 | ) | — | — | — | (1,832 | ) | |||||||||||||||
Payments of deferred loan costs | — | (2,147 | ) | — | — | — | (2,147 | ) | |||||||||||||||
Noncontrolling interest contributions | — | — | — | 19,850 | — | 19,850 | |||||||||||||||||
Noncontrolling interest distributions | — | — | — | (10,632 | ) | — | (10,632 | ) | |||||||||||||||
Advances to affiliates | — | — | (5,237 | ) | 10,658 | (5,421 | ) | — | |||||||||||||||
Intercompany receivables/payables | 4,844 | 17,212 | (6,353 | ) | 137 | (15,840 | ) | — | |||||||||||||||
Net cash provided by (used in) financing activities | 4,844 | 128,719 | (11,752 | ) | 75,590 | (21,261 | ) | 176,140 | |||||||||||||||
Net (decrease) increase in cash and cash equivalents | — | (4,131 | ) | 2,151 | (588 | ) | — | (2,568 | ) | ||||||||||||||
Cash and cash equivalents at beginning of period | — | 48,462 | 573 | 3,736 | — | 52,771 | |||||||||||||||||
Cash and cash equivalents at end of period | $ | — | $ | 44,331 | $ | 2,724 | $ | 3,148 | $ | — | $ | 50,203 | |||||||||||
F-31
Note 9—Fair Value of Financial Instruments
In accordance with FASB ASC Topic 820 Fair Value Measurements and Disclosure, (“ASC 820”) the Company is required to disclose the estimated fair value of financial instruments. As of December 31, 2017 and 2016, the Company used the following assumptions to estimate the fair value of each type of financial instrument for which it is practicable to estimate:
• | Notes Payable—The carrying amount is a reasonable estimate of fair value of the notes payable because of floating interest rate terms and/or the outstanding balance is expected to be repaid within one year. |
• | Subordinated Amortizing Notes—The Subordinated amortizing notes are traded over the counter and their fair values were based upon quotes from industry sources. |
• | 5 3/4% Senior Notes—The 5 3/4% Senior Notes are traded over the counter and their fair value was based upon published quotes; |
• | 8 1/2% Senior Notes—The 8 1/2% Senior Notes are traded over the counter and their fair value was based upon published quotes; |
• | 7% Senior Notes—The 7% Senior Notes are traded over the counter and their fair value was based upon published quotes; |
• | 5 7/8% Senior Notes—The 5 7/8% Senior Notes are traded over the counter and their fair value was based upon published quotes; |
The following table excludes cash and cash equivalents, receivables and accounts payable, which had fair values approximating their carrying amounts due to the short maturities and liquidity of these instruments. The estimated fair values of financial instruments are as follows (in thousands):
December 31, 2017 | December 31, 2016 | ||||||||||||||
Carrying Amount | Fair Value | Carrying Amount | Fair Value | ||||||||||||
Financial liabilities: | |||||||||||||||
Notes payable | $ | 94,515 | $ | 94,515 | $ | 155,768 | $ | 155,768 | |||||||
Subordinated amortizing notes | — | — | 7,225 | 7,478 | |||||||||||
5 3/4% Senior Notes due 2019 | 149,362 | 151,500 | 148,826 | 151,125 | |||||||||||
8 1/2% Senior Notes due 2020 | — | — | 422,817 | 444,125 | |||||||||||
7% Senior Notes due 2022 | 346,740 | 362,250 | 346,014 | 363,125 | |||||||||||
5 7/8% Senior Notes due 2025 | 439,567 | 459,000 | — | — | |||||||||||
ASC 820 establishes a framework for measuring fair value, expands disclosures regarding fair value measurements and defines fair value as the price that would be received to sell an asset or paid to transfer a liability in an orderly transaction between market participants at the measurement date. ASC 820 requires the Company to maximize the use of observable market inputs, minimize the use of unobservable market inputs and disclose in the form of an outlined hierarchy the details of such fair value measurements. The Company utilized Level 3 inputs to determine the fair value of its Notes Payable, and Level 2 inputs to measure the fair value of its Senior Notes and Subordinated amortizing notes. ASC 820 specifies a hierarchy of valuation techniques based on whether the inputs to a fair value measurement are considered to be observable or unobservable in a marketplace. The three levels of the hierarchy are as follows:
• | Level 1—quoted prices for identical assets or liabilities in active markets; |
• | Level 2—quoted prices for similar assets or liabilities in active markets; quoted prices for identical or similar assets or liabilities in markets that are not active; and model-derived valuations in which significant inputs and significant value drivers are observable in active markets; and |
• | Level 3—valuations derived from valuation techniques in which one or more significant inputs or significant value drivers are unobservable. |
F-32
Note 10—Related Party Transactions
Pursuant to the preemptive rights granted under the Company’s Third Amended and Restated Certificate of Incorporation, upon the issuances of the shares of Class A Common Stock underlying the TEUs (see Note 8), Lyon Shareholder 2012, LLC, a Delaware limited liability company, and the sole holder (the “Class B Holder”) of the Company’s Class B Common Stock, had the right to purchase up to the number of additional shares of Class B Common Stock needed to maintain its voting power at the time of such issuances of Class A Common Stock. On December 14, 2017, in connection with the exercise of such preemptive rights by the Class B Holder, the Company entered into a stock purchase agreement (the “Purchase Agreement”) with the Class B Holder. The Purchase Agreement provided for the purchase by the Class B Holder from the Company of 1,003,510 newly issued shares of Class B Common Stock, subject to the terms and conditions specified therein, which shares were issued and sold to the Class B Holder, and are beneficially owned by William H. Lyon, the Company’s Executive Chairman and Chairman of the Board of Directors. The aggregate consideration received by the Company for the Class B Common Stock was $29.9 million. Refer to Note 13 for further details regarding the transaction.
The Company has entered into a Purchase and Sale Agreement (the “PSA”) with an entity (“Seller”) managed by an affiliate of Paulson & Co., Inc. (“Paulson”), which provides for the consummation of a transaction, subject to closing conditions specified therein, pursuant to which the Company may purchase certain real property from the Seller located in Oceanside, California, for a proposed residential homebuilding development. The PSA provides for an aggregate deposit amount of $1.2 million (the “Deposit”), which Deposit was paid and became non-refundable in December 2017. WLH Recovery Acquisition LLC, which is affiliated with, and managed by affiliates of, Paulson, previously held over 5% of Parent’s outstanding Class A common stock, which stock was sold in its entirety in September 2017. One of the members of Parent’s board of directors currently serves as Portfolio Manager for the Paulson Real Estate Funds, which are affiliates of Paulson, and is a Partner in Paulson. The Company believes that the transaction is on terms no less favorable than it would have agreed to with unrelated third parties.
In December 2016, the Company sold an unentitled remnant parcel of land located in Portland, Oregon for an overall purchase price of approximately $550,000 in cash to the Division President of our Oregon division. The purchase price was supported by an unaffiliated third party appraisal received by the Company, and the Company believes that the transaction was on terms no less favorable than it would have agreed to with unrelated parties.
In August 2016, the Company acquired certain lots within a master planned community located in Aurora, Colorado, for an overall purchase price of approximately $9.3 million, from an entity managed by an affiliate of Paulson. At the time of the transaction, WLH Recovery Acquisition LLC, which is affiliated with, and managed by affiliates of, Paulson, held over 5% of Parent’s outstanding Class A common stock. A portion of the acquisition price for the lots was paid in the form of a seller note with a principal amount of approximately $3.0 million (see Note 8). The Company believes that the transaction, including the terms of the seller note, was on terms no less favorable than it would have agreed to with unrelated parties.
On September 3, 2009, Presley CMR, Inc., a California corporation (“Presley CMR”) and wholly owned subsidiary of California Lyon, entered into an Aircraft Purchase and Sale Agreement (“PSA”) with an affiliate of General William Lyon to sell an aircraft. The PSA provided for an aggregate purchase price for the Aircraft of $8.3 million, (which value was the appraised fair market value of the Aircraft), which consisted of: (i) cash in the amount of $2.1 million to be paid at closing and (ii) a promissory note from the affiliate in the amount of $6.2 million. The note was secured by the Aircraft and required semiannual interest payments to California Lyon of approximately $132,000. The note provided for a maturity date in September 2016. During the year ended December 31, 2016, the promissory note was paid in full by the borrower prior to the September 2016 maturity date, along with all accrued interest to date.
In October 2015, the Company acquired certain lots within the master planned community of Lake Las Vegas in Nevada for a cash purchase price of approximately $7.3 million, from an entity managed by an affiliate of Paulson. The Company believes that the transaction was on terms no less favorable than it would have agreed to with unrelated parties.
Note 11—Income Taxes
Since inception, the Company has operated solely within the United States.
The following summarizes the provision from income taxes (in thousands):
F-33
Year Ended December 31, | Year Ended December 31, | Year Ended December 31, | |||||||||
2017 | 2016 | 2015 | |||||||||
Current | |||||||||||
Federal | $ | (25,974 | ) | $ | (26,978 | ) | $ | (15,296 | ) | ||
State | (9,122 | ) | (4,077 | ) | (3,350 | ) | |||||
Deferred | |||||||||||
Federal | (26,663 | ) | (1,395 | ) | (5,259 | ) | |||||
State | (1,174 | ) | (2,400 | ) | (2,901 | ) | |||||
$ | (62,933 | ) | $ | (34,850 | ) | $ | (26,806 | ) | |||
Income taxes differ from the amounts computed by applying the applicable federal statutory rates due to the following (in thousands):
Year Ended December 31, | Year Ended December 31, | Year Ended December 31, | |||||||||
2017 | 2016 | 2015 | |||||||||
Provision for federal income taxes at the statutory rate | $ | (42,240 | ) | $ | (35,986 | ) | $ | (30,473 | ) | ||
(Increases)/decreases in tax resulting from: | |||||||||||
Provision for state income taxes, net of federal income tax benefits | (6,692 | ) | (4,210 | ) | (4,063 | ) | |||||
Rate adjustment - new tax reform legislation | (23,126 | ) | — | — | |||||||
Change in valuation allowance | — | — | 1,626 | ||||||||
Domestic production activities deduction | 2,868 | 2,481 | 2,087 | ||||||||
Nondeductible items-other | (94 | ) | (58 | ) | (52 | ) | |||||
Non-controlling interests | 3,366 | 2,895 | 1,024 | ||||||||
Change in RBIL estimate | — | — | 1,771 | ||||||||
Tax credits | (160 | ) | 166 | 1,272 | |||||||
Stock based compensation | 281 | 27 | — | ||||||||
Other, net | 2,864 | (165 | ) | 2 | |||||||
$ | (62,933 | ) | $ | (34,850 | ) | $ | (26,806 | ) | |||
On December 22, 2017, President Donald Trump signed into law “H.R.1” (the “Tax Cuts and Jobs Act”), which among other items reduces the federal corporate tax rate from 35% to 21% effective January 1, 2018. Also on December 22, 2017, the Securities & Exchange Commission Staff issued Staff Accounting Bulletin No. 118 (“SAB 118”), which provides guidance for accounting for effects of the Tax Cuts and Jobs Act for which the accounting under ASC 740, “Income Taxes” (“ASC 740”) is incomplete. Under SAB 118, to the extent that accounting for certain income tax effects of the Tax Cuts and Jobs Act is incomplete but that the Company is able to determine a reasonable estimate, it must record a provisional estimate in its consolidated financial statements. If a reasonable estimate cannot be determined, ASC 740 should continue to be applied on the basis of the tax laws that were in effect prior to the passage of the Tax Cuts and Jobs Act.
The Company recognized the income tax effects of the Tax Cuts and Jobs Act in accordance with SAB 118. As such, the Company’s financial results for the year ended December 31, 2017 reflect the income tax effects for which the accounting under ASC Topic 740 is complete and provisional amounts for those specific income tax effects of the 2017 Tax Act for which the accounting under ASC Topic 740 is incomplete but a reasonable estimate could be determined. The Company has recognized the tax impact related to the revaluation of deferred tax assets and liabilities, resulting in $23.1 million of additional income tax expense for the year ended December 31, 2017. The Company has also recorded a provisional amount in relation to the treatment of AMT credits in its consolidated financial statements for the year ended December 31, 2017.
The Company did not identify any items for which the income tax effects of the Tax Cuts and Jobs Act have not been completed and a reasonable estimate could not be determined as of December 31, 2017. The ultimate impact of AMT credits
F-34
may differ from the provisional amount, possibly materially, due to, among other things, additional analysis, additional regulatory guidance that may be issued, and actions the Company may take as a result of the Tax Cuts and Jobs Act.
The Company’s effective income tax rate was 52.1%, and 33.9% for the year ended December 31, 2017 and 2016, respectively. The significant drivers of the effective tax rate are revaluation of deferred tax assets and liabilities discussed above, allocation of income to noncontrolling interests and the domestic production activities deduction.
Temporary differences giving rise to deferred income taxes consist of the following (in thousands):
December 31, | |||||||
2017 | 2016 | ||||||
Deferred tax assets | |||||||
Impairment and other reserves | $ | 33,883 | $ | 53,806 | |||
Compensation deductible for tax purposes when paid | 5,093 | 9,161 | |||||
AMT credit carryover | 1,384 | 1,384 | |||||
Unused recognized built-in loss | 10,706 | 18,651 | |||||
Net operating loss | 3,488 | 3,172 | |||||
Effect of book/tax differences for general and administrative | 4,508 | 6,427 | |||||
Other | 806 | 694 | |||||
59,868 | 93,295 | ||||||
Deferred tax liabilities | |||||||
Effect of book/tax differences for joint ventures | (1,343 | ) | (2,706 | ) | |||
Effect of book/tax differences for capitalized interest | (6,478 | ) | (11,103 | ) | |||
Fixed assets and intangibles | (1,850 | ) | (1,716 | ) | |||
Goodwill and other intangibles | (1,998 | ) | (1,541 | ) | |||
Other | (284 | ) | (478 | ) | |||
(11,953 | ) | (17,544 | ) | ||||
Total deferred tax assets, net | $ | 47,915 | $ | 75,751 | |||
Management assesses its deferred tax assets to determine whether all or any portion of the asset is more likely than not unrealizable under ASC 740. The Company is required to establish a valuation allowance for any portion of the asset that management concludes is more likely than not to be unrealizable. The ultimate realization of deferred tax assets is dependent upon the generation of future taxable income during the periods in which those temporary differences become deductible. The Company's assessment considers all evidence, both positive and negative, including the nature, frequency and severity of any current and cumulative losses, taxable income in carry back years, the scheduled reversal of deferred tax liabilities, tax planning strategies, and projected future taxable income in making this assessment. At December 31, 2017 the Company had no valuation allowance recorded.
As of December 31, 2012, the Company had generated significant deferred tax assets through its operations, but as a result of the Company's ongoing assessments had determined that it was not more likely than not that the Company would be able to utilize these assets. As a result, the Company had recorded a full valuation allowance against the $200.0 million deferred tax asset balance. During the quarter ended December 31, 2013, the Company determined that it would be able to utilize $95.6 million of its deferred tax assets, and recognized an income tax benefit in its results of operations in this amount. This conclusion was based upon the operating results of the Company, most notably three consecutive quarters of net income, reduced interest expense as a result of the 2012 restructure, and eight consecutive quarters of period over period growth in net new home orders, home closings, and dollar value of backlog, in addition to continued improving conditions in the single family home market. Since 2013, the Company's operating results have demonstrated consistent improvement with significant growth in revenues and net income, which has allowed it to realize approximately $20.0 million in deferred tax assets through December 31, 2017.
The Company's analysis demonstrated that even under the stress tested forecasts of future results which considered the potential impact of the negative evidence noted above, the Company would continue to generate sufficient taxable income in
F-35
future periods to realize the majority of its deferred tax assets. This fact, coupled with other positive evidence described above, significantly outweighed the negative evidence and based on this analysis management concluded, in accordance with ASC 740, that it was more likely than not that the majority of its deferred tax assets as of December 31, 2013 would be realized. At December 31, 2017, the Company had no remaining federal net operating loss carryforwards and $49.9 million remaining state net operating loss carryforwards. State net operating loss carryforwards begin to expire in 2031. In addition, as of December 31, 2017, the Company had unused federal and state built-in losses of $48.5 million and $7.5 million, respectively. The 5 year testing period for built-in losses expires in 2017 and the unused built-in loss carryforwards begin to expire at the end of 2032. The Company had AMT credit carryovers of $1.4 million at December 31, 2017, which if not previously utilized are allowable as refundable credits under the Jobs and Tax Act through 2022. However, the refundability of the credit will be determined through additional guidance to properly interpret the interaction between Internal Revenue Code Section 383 with the Jobs and Tax Act.
ASC 740 prescribes a recognition threshold and a measurement criterion for the financial statement recognition and measurement of tax positions taken or expected to be taken in a tax return. For those benefits to be recognized, a tax position must be considered more likely than not to be sustained upon examination by taxing authorities. The Company records interest and penalties related to uncertain tax positions as a component of the provision for income taxes. As of December 31, 2017 and 2016, the Company had no significant uncertain tax positions.
The Company and its subsidiaries file income tax returns in the U.S. federal jurisdiction and various state jurisdictions. Due to the Company’s net operating losses incurred, the Company is subject to U.S. federal income tax examinations for calendar tax years ended 2012 and forward and subject to various state income tax examinations for calendar tax years ended 2008 and forward. The Company is currently under examination by the Internal Revenue Service for the 2013 and 2014 tax years and a California examination is pending for the 2014 tax year.
Note 12—Income Per Common Share
Basic and diluted income per common share for the years ended December 31, 2017, 2016, and 2015 were calculated as follows (in thousands, except number of shares and per share amounts):
Year Ended December 31, 2017 | Year Ended December 31, 2016 | Year Ended December 31, 2015 | |||||||||
Basic weighted average number of shares outstanding (1) | 37,040,137 | 36,764,799 | 36,546,227 | ||||||||
Effect of dilutive securities: | |||||||||||
Preferred shares, stock options, and warrants | 1,623,530 | 815,171 | 1,326,399 | ||||||||
Tangible Equity Units | — | 894,930 | 894,930 | ||||||||
Diluted average shares outstanding | 38,663,667 | 38,474,900 | 38,767,556 | ||||||||
Net income available to common stockholders | $ | 48,135 | $ | 59,696 | $ | 57,336 | |||||
Basic income per common share | $ | 1.30 | $ | 1.62 | $ | 1.57 | |||||
Dilutive income per common share | $ | 1.24 | $ | 1.55 | $ | 1.48 | |||||
Potentially antidilutive securities not included in the calculation of diluted income per common share (weighted average): | |||||||||||
Unvested stock options | 240,000 | 240,000 | 180,000 | ||||||||
(1) For the year ended December 31, 2017, basic weighted average number of shares outstanding includes 5,113,475 shares of the Company’s Tangible Equity Units, of which 670,811 and 4,442,664 were settled and issued on November 27, 2017 and December 1, 2017, respectively. For the years ended December 31, 2016 and December 31, 2015, basic weighted average number of shares outstanding included the minimum number of shares that were issuable under the Company’s Tangible Equity Units. As these periods were prior to the settlement of the TEUs, these calculations assumed 5,113,475 shares included from the respective issue dates of the Company’s Tangible Equity Units. See Note 8.
F-36
Note 13—Equity
Common Stock
Pursuant to the preemptive rights granted under the Company’s Third Amended and Restated Certificate of Incorporation, upon the issuances of the shares of Class A Common Stock underlying the TEUs (see Note 8), Lyon Shareholder 2012, LLC, a Delaware limited liability company and the sole holder of the Company’s Class B Common Stock, par value $0.01 per share, had the right to purchase up to the number of additional shares of Class B Common Stock needed to maintain its voting power at the time of such issuances of Class A Common Stock. On December 14, 2017, in connection with the exercise of such preemptive rights by the Class B Holder, the Company entered into a stock purchase agreement with the Class B Holder. The purchase agreement provided for the purchase by the Class B Holder from the Company of 1,003,510 newly issued shares of Class B Common Stock, subject to the terms and conditions specified therein, which reflects the maximum number of shares that could be purchased pursuant to such preemptive rights in connection with the settlement of the TEUs. Accordingly, the Company issued and sold to the Class B Holder 1,003,510 shares of Class B Common Stock. The aggregate consideration received by the Company for the Class B Common Stock was $29,908,028, for an average purchase price of approximately $29.80 per share.
Pursuant to the terms of the Certificate of Incorporation, each share of Class B Common Stock is convertible into a share of Class A Common Stock. Each share of Class B Common Stock will automatically convert into one share of Class A Common Stock if holders of a majority of the shares of Class B Common Stock then-outstanding vote in favor of such conversion. Further, if, at any time, any share of Class B Common Stock is not owned, beneficially or of record, by either General William Lyon or William H. Lyon, their siblings, spouses and lineal descendants (including by step-, adoptive and similar relationships), any entities wholly owned by one or more of the foregoing persons, or any trusts or other estate planning vehicles for the benefit of any of the foregoing, then such share of Class B Common Stock will automatically convert into one share of Class A Common Stock. A holder of Class B Common Stock may also elect at any time to convert any or all of their shares into Class A Common Stock at the rate of one share of Class A Common Stock for each share of Class B Common Stock.
All of our outstanding shares of common stock have been validly issued and fully paid and are non-assessable. The rights of the holders of common stock will be subject to, and may be adversely affected by, the rights of the holders of preferred stock, of which there are no shares issued or outstanding as of December 31, 2017 or 2016. Holders of our common stock have no preference, exchange, sinking fund, redemption or appraisal rights and have no preemptive rights to subscribe for any of our securities, with the exception of holders of our Class B Common Stock, which do have certain preemptive rights.
The Company does not intend to declare or pay cash dividends in the foreseeable future. Any determination to pay dividends to holders of our common stock will be at the discretion of our board of directors. The payment of cash dividends is restricted under the terms of certain of the agreements governing our outstanding indebtedness, including the indentures governing our senior notes.
Share Repurchase Program
As announced on February 22, 2017, the Board of Directors of the Company has approved a stock repurchase program, authorizing the repurchase of up to an aggregate of $50 million of the Company's Class A common stock. The program allows the Company to repurchase shares of Class A common stock from time to time for cash in the open market or privately negotiated transactions or other transactions, as market and business conditions warrant and subject to applicable legal requirements. The stock repurchase program does not obligate the Company to repurchase any particular amount of common stock, and it could be modified, suspended or discontinued at any time. As of December 31, 2017, the Company repurchased 138,227 shares, for an average purchase price of approximately $22.50 per share, and had $46.9 million remaining available for repurchase.
Warrants
The holders of Class B common stock hold warrants to purchase 1,907,551 shares of Class B common stock at an exercise price of $17.08 per share. The expiration date of the Class B Warrants is February 24, 2022. The Warrants were assigned a value of $1.0 million in conjunction with the adoption of fresh start accounting and are recorded in additional paid-in capital.
F-37
Tangible Equity Units
On November 27, 2017, the Company issued 670,811 shares of Class A Common Stock to certain holders who elected for early settlement of their purchase contracts. On December 1, 2017 (the "mandatory settlement date"), the Company issued the balance to the remaining holders, for an aggregate issuance of 5,113,473 shares of Class A Common Stock, which reflected the minimum number of shares of Class A Common Stock, or 4.4465 shares per each of the previously outstanding 1,150,000 tangible equity units that were issuable by the Company under the purchase contracts (as adjusted for fractional shares). As of December 31, 2017, the amortizing notes were settled in full. The net proceeds from the issuance of the TEUs were allocated between the purchase contract and amortizing note based on their relative fair values. As a result, $90.7 million was allocated to additional paid-in capital in connection with the issuance of the TEUs during 2014.
Note 14—Stock Based Compensation
In 2012, the Company adopted the William Lyon Homes 2012 Equity Incentive Plan (the “Plan”). The Plan was approved by the Board of Directors and the Company’s stockholders, and is administered by the Compensation Committee of the Board. The provisions of the Plan allow for a variety of stock-based compensation awards, including stock options, stock appreciation rights, or SARs, restricted stock awards, restricted stock unit awards, deferred stock awards, deferred stock unit awards, dividend equivalent awards, stock payment awards and performance awards and other stock-based awards, to certain executives, directors, and non-executives of California Lyon. The Company believes that such awards provide a means of compensation to attract and retain qualified employees and better align the interests of our employees with those of our stockholders. Option awards are granted with an exercise price equal to the market price at the date of grant.
During 2017, the Company amended the Plan to reflect a broad range of compensation and governance practices necessary to attract and retain the services key individuals essential to the Company’s long -term growth and success. Among other things, the amendment served to increase the aggregate number of shares of common stock available for issuance under the prior plan by 900,000 shares.
Under the Plan, 4,535,363 shares of the Company’s Class A common stock have been reserved for issuance. In 2017, the Company granted an aggregate of 813,586 restricted shares of Class A common stock, which consisted of 259,677 shares of time-based restricted stock and 553,909 shares of performance based restricted stock. In 2016, and 2015, the Company granted an aggregate of 857,460 restricted shares and 493,524 restricted shares, respectively, of Class A common stock. With respect to time-based restricted stock granted to employees during 2017, 172,857 of such shares are subject to a vesting schedule pursuant to which one-third of the shares will vest on March 1st of each of 2018, 2019 and 2020, 45,111 of such shares are subject to a vesting schedule pursuant to which one-half of the shares will vest on March 1st of each of 2018 and 2019, and 6,434 of such shares have a vesting schedule pursuant to which one-half of the shares will vest on July 27th of each of 2018 and 2019, in each case subject to each grantee’s continued service through each vesting date, and 35,275 of such shares vest in equal quarterly installments on each of June 1, 2017, September 1, 2017, December 1, 2017 and March 1, 2018, subject to each grantee’s continued service on the board through each vesting date.
The Company granted performance-based restricted stock awards to certain executive employees during each of 2017, 2016 and 2015. With respect to the performance based restricted stock awards granted during 2017, 2016 and 2015, the performance based restricted stock awards vests as follows: one-third of the shares of performance based restricted stock will vest on March 1 of each of the first, second, and third years following the grant date, and all but one of such grants were subject to the Company’s achievement of pre-established performance targets as of the end of the given fiscal year, and subject to each grantee's continued service through each vesting date. The remaining grant did not contain a pre-established performance target, but the earned shares for such award were determined by the exercise of the discretion of the Compensation Committee of Parent’s Board of Directors following the end of the 2014 fiscal year, which were determined to be at the target level. During 2017, the Company achieved and recorded stock based compensation expense at 111% of its performance target. During 2016, the Company achieved 96% of its performance target related to certain metrics, resulting in earned shares based on the term of the award agreements, but did not achieve its target level for another metric applicable to certain individuals. During 2015, the Company achieved 92% of its performance targets.
The Company uses the fair value method of accounting for stock options granted to employees which requires us to measure the cost of employee services received in exchange for the stock options, based on the grant date fair value of the award. The fair value of the awards is estimated using the Black-Scholes option-pricing model. The resulting cost is recognized on a straight line basis over the period during which an employee is required to provide service in exchange for the award, usually the vesting period.
F-38
The fair value of each employee option awarded was estimated on the grant date using the Black-Scholes option-pricing model with the following weighted-average assumptions.
Year Ended December 31, 2017 | Year Ended December 31, 2016 | Year Ended December 31, 2015 | |||
Expected dividend yield | N/A | N/A | — | ||
Risk-free interest rate | N/A | N/A | 1.71% | ||
Expected volatility | N/A | N/A | 44% | ||
Expected life (in years) | N/A | N/A | 6.75 | ||
The Black-Scholes option-pricing model requires inputs such as the expected dividend yield, risk-free interest rate, expected term and expected volatility. Further, the forfeiture rate also affects the amount of aggregate compensation. These inputs are subjective and generally require significant judgment.
The risk-free interest rate that we use is based on the United States Treasury yield in effect at the time of grant for zero coupon United States Treasury notes with maturities approximating each grant’s expected life. Given our limited history with employee exercise patterns, we use the “simplified” method in estimating the expected term for our employee grants. The “simplified” method is calculated as the average of the time-to-vesting and the contractual life of the options. Our expected volatility was derived from the historical volatilities of our common stock and several unrelated public companies within the homebuilding industry, because we had insufficient trading history on our common stock at the time the grants were valued. When making the selections of our peer companies within the homebuilding industry to be used in the volatility calculation, we also considered the stage of development, size and financial leverage of potential comparable companies. We estimate our forfeiture rate based on an analysis of our actual forfeitures and will continue to evaluate the appropriateness of the forfeiture rate based on actual forfeiture experience, analysis of employee turnover behavior and other factors.
As of December 31, 2017, the Company has 1,604,258 shares available for grant under the Plan.
Summary of Stock Option Activity
Stock option activity under the Plan for the years ended December 31, 2017, 2016, and 2015 was as follows:
Year Ended December 31, 2017 | Year Ended December 31, 2016 | Year Ended December 31, 2015 | |||||||||||||||||||||
Options | Weighted Average Exercise Price | Options | Weighted Average Exercise Price | Options | Weighted Average Exercise Price | ||||||||||||||||||
Options outstanding at beginning of year | 596,313 | $ | 15.57 | 611,313 | $ | 15.40 | 419,238 | $ | 8.66 | ||||||||||||||
Granted (1) | — | N/A | — | N/A | 240,000 | $ | 25.82 | ||||||||||||||||
Exercised | (3,535 | ) | $ | 8.66 | (15,000 | ) | $ | 8.66 | (47,925 | ) | $ | 8.66 | |||||||||||
Canceled | — | N/A | — | N/A | — | N/A | |||||||||||||||||
Options outstanding at end of year | 592,778 | $ | 15.61 | 596,313 | $ | 15.57 | 611,313 | $ | 15.40 | ||||||||||||||
Options vested and expected to vest | 592,778 | $ | 15.61 | 596,313 | $ | 15.57 | 611,313 | $ | 15.40 | ||||||||||||||
Options exercisable at end of year (2) | 352,778 | $ | 8.66 | 356,313 | $ | 8.66 | 371,313 | $ | 8.66 | ||||||||||||||
Price range of options exercised | $ | 8.66 | $ | 8.66 | $ | 8.66 | |||||||||||||||||
Price range of options outstanding | $8.66-$25.82 | $8.66-$25.82 | $8.66-$25.82 | ||||||||||||||||||||
(1) | The weighted average grant date fair value of the stock options during December 31, 2015 was $12.01. |
(2) | No options vested during the years ended December 31, 2017, 2016 or 2015. |
The following table summarizes information about stock options granted to executives, directors, and non-executives that are outstanding and exercisable at December 31, 2017:
F-39
Outstanding | Exercisable | |||||||||||||
Exercise Price | Number of Shares | Weighted Average Remaining Contractual Term (in years) | Aggregate Intrinsic Value | Number of Shares | ||||||||||
$ | 8.66 | 352,778 | 4.75 | $ | 7,203,727 | 352,778 | ||||||||
Summary of Restricted Shares Activity
During the years ended December 31, 2017, 2016, and 2015, the Company had the following activity relating to grants of time-based restricted common stock:
Year Ended December 31, 2017 | Year Ended December 31, 2016 | Year Ended December 31, 2015 | ||||||||||||||||||
Number of Shares | Weighted Avg Grant Date Fair Value | Number of Shares | Weighted Avg Grant Date Fair Value | Number of Shares | Weighted Avg Grant Date Fair Value | |||||||||||||||
Non-vested shares at beginning of year | 346,924 | $ | 16.91 | 225,687 | $ | 23.65 | 79,335 | $ | 24.84 | |||||||||||
Granted | 259,677 | 18.14 | 291,368 | 14.14 | 208,715 | 23.11 | ||||||||||||||
Vested | (181,812 | ) | 17.62 | (126,073 | ) | 21.81 | (55,571 | ) | 23.24 | |||||||||||
Canceled (1) | (5,494 | ) | 16.23 | (44,058 | ) | 19.06 | (6,792 | ) | 24.28 | |||||||||||
Non-vested shares at end of year | 419,295 | $ | 17.38 | 346,924 | $ | 16.91 | 225,687 | $ | 23.65 | |||||||||||
(1) Represents shares that were canceled as result of terminations of employment.
During the years ended December 31, 2017, 2016, and 2015 the Company had the following activity relating to grants of performance based restricted common stock:
Year Ended December 31, 2017 | Year Ended December 31, 2016 | Year Ended December 31, 2015 | ||||||||||||||||||
Number of Shares | Weighted Avg Grant Date Fair Value | Number of Shares | Weighted Avg Grant Date Fair Value | Number of Shares | Weighted Avg Grant Date Fair Value | |||||||||||||||
Non-vested shares at beginning of year | 655,133 | $ | 17.81 | 480,757 | $ | 24.18 | 506,846 | $ | 23.84 | |||||||||||
Granted | 553,909 | 18.00 | 566,092 | 13.88 | 284,809 | 23.50 | ||||||||||||||
Vested | (147,477 | ) | 21.49 | (190,977 | ) | 20.58 | (154,467 | ) | 19.58 | |||||||||||
Canceled (1) | (349,000 | ) | 19.55 | (200,739 | ) | 23.38 | (156,431 | ) | 28.86 | |||||||||||
Non-vested shares at end of year | 712,565 | $ | 17.01 | 655,133 | $ | 17.81 | 480,757 | $ | 24.18 | |||||||||||
(1) Represents shares that were canceled as a result of achievement of performance targets as outlined in the respective grant agreement at below the maximum levels, as well as a result of terminations of employment.
In conjunction with the issuance of the equity grants in the years ended December 31, 2017, 2016 and 2015, the Company recorded stock based compensation expense of $10.1 million, $6.4 million, and $6.6 million, respectively, which is included in general and administrative expense in the consolidated statement of operations. As of December 31, 2017, $8.8 million of total unrecognized stock based compensation expense is expected to be recognized as an expense by the Company in the future over a weighted average period of 1.0 years. The total value of restricted stock awards which fully vested during the years ended December 31, 2017, 2016 and 2015 was $8.0 million, $5.1 million, and $6.0 million, respectively. For the years ended December 31, 2017, 2016 and 2015, the Company recognized an income tax benefit of $3.8 million, $4.1 million and $3.5 million related to stock based compensation, respectively.
F-40
Note 15—Commitments and Contingencies
The Company’s commitments and contingent liabilities include the usual obligations incurred by real estate developers in the normal course of business. In the opinion of management, these matters will not have a material effect on the Company’s consolidated financial position, results of operations or cash flows.
The Company is a defendant in various lawsuits related to its normal business activities. We believe that the accruals we have recorded for probable and reasonably estimable losses with respect to these proceedings are adequate and that, as of December 31, 2017, it was not reasonably possible that an additional material loss had been incurred in an amount in excess of the estimated amounts already recognized on our consolidated financial statements. We evaluate our accruals for litigation and regulatory proceedings, and as appropriate, adjust them to reflect (i) the facts and circumstances known to us at the time, including information regarding negotiations, settlements, rulings and other relevant events and developments; (ii) the advice and analyses of counsel; and (iii) the assumptions and judgment of management. Similar factors and considerations are used in establishing new accruals for proceedings as to which losses have become probable and reasonably estimable at the time an evaluation is made. The outcome of any of these proceedings, including the defense and other litigation-related costs and expenses we may incur, however, is inherently uncertain and could differ significantly from the estimate reflected in a related accrual, if made. Therefore, it is possible that the ultimate outcome of any proceeding, if in excess of a related accrual or if no accrual had been made, could be material to our consolidated financial statements.
In some jurisdictions in which the Company develops and constructs property, assessment district bonds are issued by municipalities to finance major infrastructure improvements. As a land owner benefited by these improvements, the Company is responsible for the assessments on its land. When properties are sold, the assessments are either prepaid or the buyers assume the responsibility for the related assessments. Assessment district bonds are recorded as liabilities in the Company’s consolidated balance sheet, if the amounts are fixed and determinable. As of December 31, 2017 and 2016, the Company is not obligated under any assessment district bonds.
The Company also had outstanding performance and surety bonds of $234.0 million at December 31, 2017 related principally to its obligations for site improvements at various projects. The Company does not believe that draws upon these bonds, if any, will have a material effect on the Company’s financial position, results of operations or cash flows. As of December 31, 2017, the Company had $355.5 million of project commitments relating to the construction of projects.
The Company has provided unsecured environmental indemnities to certain lenders, joint venture partners and land sellers. In each case, the Company has performed due diligence on the potential environmental risks including obtaining an independent environmental review from outside environmental consultants. These indemnities obligate the Company to reimburse the guaranteed parties for damages related to environmental matters. There is no term or damage limitation on these indemnities; however, if an environmental matter arises, the Company could have recourse against other previous owners.
See Note 8 for additional information relating to the Company’s guarantee arrangements.
The Company has entered into various purchase option agreements with third parties to acquire land. As of December 31, 2017, the Company has made non-refundable deposits of $51.8 million. The Company is under no obligation to purchase the land, but would forfeit remaining deposits if the land were not purchased. The total purchase price under the purchase option agreements is $539.3 million as of December 31, 2017.
Lease Obligations
As described more fully in Note 1, as of April 1, 2017, the Company adopted the provisions of ASU 2016-02 and recognized lease obligations and associated ROU assets for its existing non-cancelable leases. Lease obligations, as included in Accrued expenses on the consolidated balance sheets, were $14.5 million as of December 31, 2017 and $13.1 million as of December 31, 2016. The Company has non-cancelable operating leases primarily associated with office facilities, real estate and office equipment, in addition to one related sublease for an office facility. The determination of which discount rate to use when measuring the lease obligation was deemed a significant judgment. Lease cost, as included in general and administrative expense in our consolidated statements of operations for the respective periods, and additional information regarding lease terms are as follows (dollars in thousands):
F-41
Year Ended December 31, 2017 | Year Ended December 31, 2016 | |||||||
Lease cost | ||||||||
Operating lease cost | $ | 6,835 | $ | 3,890 | ||||
Sublease income | (117 | ) | (117 | ) | ||||
Total lease cost | $ | 6,718 | $ | 3,773 | ||||
Other information | ||||||||
Cash paid for amounts included in the measurement of lease liabilities for operating leases: | ||||||||
Operating cash flows | $ | 5,551 | $ | 3,270 | ||||
Right-of-use assets obtained in exchange for new operating lease liabilities | $ | 5,925 | $ | 1,353 | ||||
Weighted-average discount rate | 6.6 | % | 6.6 | % | ||||
December 31, 2017 | December 31, 2016 | |||
Weighted-average remaining lease term (in years) | 3.58 | 5.16 | ||
The table below shows the future minimum payments under non-cancelable operating leases at December 31, 2017 (in thousands).
Year Ending December 31, | |||
2018 | $ | 6,998 | |
2019 | 3,989 | ||
2020 | 2,635 | ||
2021 | 2,398 | ||
2022 | 1,342 | ||
Thereafter | 440 | ||
Total | $ | 17,802 | |
Note 16—Subsequent Events
Agreement to Acquire RSI Communities LLC
On February 20, 2018, the Company announced it entered into a definitive agreement with RSI Communities LLC (“RSI Communities”), RS Equity Management LLC, the Class B Sellers of RSI Communities, and RS Equity Management LLC, as the sellers’ representative, to acquire RSI Communities, a Southern California and Texas based homebuilder, and three additional related real estate assets for an aggregate cash purchase price of approximately $460 million, subject to net asset value adjustments. The Company intends to fund the transaction with cash on hand, debt, and land banking proceeds.
The transaction contains customary representations, warranties and covenants of the parties, and closing of the transaction is subject to customary closing conditions. The transaction is expected to close in the first quarter of fiscal year 2018. There can be no assurance that the proposed transaction will be completed, or if it is completed, that the expected benefits of the transaction will be realized.
No other events have occurred subsequent to December 31, 2017, that would require recognition or disclosure in the Company’s financial statements.
F-42
Note 17— Unaudited Summarized Quarterly Financial Information
Summarized unaudited quarterly financial information for the years ended December 31, 2017 and 2016 is as follows (in thousands except per share data):
Three Months Ended | |||||||||||||||
March 31, 2017 | June 30, 2017 | September 30, 2017 | December 31, 2017 | ||||||||||||
Home sales | $ | 258,854 | $ | 422,633 | $ | 490,304 | $ | 623,283 | |||||||
Cost of sales | (218,455 | ) | (353,057 | ) | (401,700 | ) | (505,337 | ) | |||||||
Gross profit | 40,399 | 69,576 | 88,604 | 117,946 | |||||||||||
Other income, costs and expenses, net | (49,695 | ) | (49,325 | ) | (58,544 | ) | (101,210 | ) | |||||||
Net (loss) income | (9,296 | ) | 20,251 | 30,060 | 16,736 | ||||||||||
Net (loss) income available to common stockholders | $ | (10,000 | ) | $ | 18,954 | $ | 27,418 | $ | 11,763 | ||||||
(Loss) Income per common share: | |||||||||||||||
Basic | $ | (0.27 | ) | $ | 0.51 | $ | 0.74 | $ | 0.32 | ||||||
Diluted | $ | (0.27 | ) | $ | 0.49 | $ | 0.71 | $ | 0.30 | ||||||
Three Months Ended | |||||||||||||||
March 31, 2016 | June 30, 2016 | September 30, 2016 | December 31, 2016 | ||||||||||||
Home sales | $ | 261,295 | $ | 325,059 | $ | 342,628 | $ | 473,221 | |||||||
Cost of sales | (215,171 | ) | (268,638 | ) | (285,896 | ) | (392,632 | ) | |||||||
Gross profit | 46,124 | 56,421 | 56,732 | 80,589 | |||||||||||
Other income, costs and expenses, net | (36,183 | ) | (41,335 | ) | (40,218 | ) | (54,163 | ) | |||||||
Net income | 9,941 | 15,086 | 16,514 | 26,426 | |||||||||||
Net income available to common stockholders | $ | 9,014 | $ | 14,561 | $ | 13,069 | $ | 23,052 | |||||||
Income per common share: | |||||||||||||||
Basic | $ | 0.25 | $ | 0.40 | $ | 0.36 | $ | 0.63 | |||||||
Diluted | $ | 0.24 | $ | 0.38 | $ | 0.34 | $ | 0.60 | |||||||
F-43
EXHIBIT INDEX
The following is a list of exhibits filed as part of this Annual Report on Form 10-K.
Exhibit Number | Description | ||
Purchase and Sale Agreement, dated as of June 22, 2014, by and among PNW Home Builders, L.L.C., PNW Home Builders North, L.L.C., PNW Home Builders South, L.L.C., Crescent Ventures, L.L.C. and William Lyon Homes, Inc. (incorporated by reference to Exhibit 2.1 to the Company's Current Report on Form 8-K filed on June 23, 2014). | |||
Third Amended and Restated Certificate of Incorporation of William Lyon Homes (incorporated by reference to William Lyon Homes’s Current Report on Form 8-K filed with the Commission on May 28, 2013). | |||
Amended and Restated Bylaws of William Lyon Homes (incorporated by reference to William Lyon Homes’s Current Report on Form 8-K filed with the Commission on May 28, 2013). | |||
Amended and Restated Bylaws of William Lyon Homes (Incorporated by reference to Exhibit 3.1 of the Company's Form 8-K filed July 22, 2015) | |||
Indenture (including form of 8.5% Senior Note due 2020), dated as of November 8, 2012, by and between William Lyon Homes, Inc., William Lyon Homes, certain of William Lyon Homes’s subsidiaries (as guarantors) and U.S. Bank National Association, as trustee (incorporated by reference to William Lyon Homes’s Current Report on Form 8-K filed with the Commission on November 8, 2012). | |||
Officers' certificate, dated October 24, 2013, delivered pursuant to the Indenture, and setting forth the terms of the notes (incorporated by reference to Exhibit 4.1 of the Company's Current Report on Form 8-K filed on October 25, 2013). | |||
Indenture (including form of 5.75% Senior Notes due 2019), dated March 31, 2014, among William Lyon Homes, Inc., William Lyon Homes, certain of William Lyon Homes' subsidiaries (as guarantors) and U.S. Bank National Association, as trustee (incorporated by reference to Exhibit 4.1 to the Company's Current Report on Form 8-K filed on April 1, 2014). | |||
Indenture (including form of 7.00% Senior Notes due 2022), dated August 11, 2014, among WLH PNW Finance Corp., the guarantors from time to time party thereto and U.S. Bank National Association, as trustee (incorporated by reference to Exhibit 4.1 of the Company's Form 8-K filed August 13, 2014). | |||
Second Supplemental Indenture, dated as of August 12, 2014, among William Lyon Homes, Inc., the subsidiary guarantors named therein and U.S. Bank National Association, relating to the 8.5% Senior Notes due 2020 (incorporated by reference to Exhibit 4.3 of the Company's Form 8-K filed August 13, 2014). | |||
First Supplemental Indenture, dated as of August 12, 2014, among William Lyon Homes, Inc., the subsidiary guarantors named therein and U.S. Bank National Association, relating to the 5.75% Senior Notes due 2019 (incorporated by reference to Exhibit 4.4 of the Company's Form 8-K filed August 13, 2014). | |||
First Supplemental Indenture, dated as of August 12, 2014, among William Lyon Homes, Inc., William Lyon Homes, the subsidiary guarantors named therein and U.S. Bank National Association, relating to the 7.00% Senior Notes due 2022 (incorporated by reference to Exhibit 4.5 of the Company's Form 8-K filed August 13, 2014). | |||
Second Supplemental Indenture, dated as of August 12, 2014, among William Lyon Homes, Inc., the subsidiary guarantors named therein and U.S. Bank National Association, relating to the 7.00% Senior Notes due 2022 (incorporated by reference to Exhibit 4.6 of the Company's Form 8-K filed August 13, 2014). | |||
Exhibit Number | Description | ||
Indenture, dated November 21, 2014, between William Lyon Homes and U.S. Bank National Association, as trustee (incorporated by reference to Exhibit 4.1 to William Lyon Homes’ Current Report on Form 8-K filed with the SEC on November 21, 2014). | |||
First Supplemental Indenture (including form of 5.50% Senior Subordinated Amortizing Notes due December 1, 2017), dated November 21, 2014, between William Lyon Homes and U.S. Bank National Association, as trustee (incorporated by reference to Exhibit 4.2 to William Lyon Homes’ Current Report on Form 8-K filed with the SEC on November 21, 2014). | |||
Purchase Contract Agreement (including form of unit and form of prepaid stock purchase contract), dated November 21, 2014, among William Lyon Homes, U.S. Bank National Association, as trustee, and U.S. Bank National Association, as purchase contract agent and as attorney-in-fact for the holders from time to time as provided therein (incorporated by reference to Exhibit 4.3 to William Lyon Homes’ Current Report on Form 8-K filed with the SEC on November 21, 2014). | |||
Officers’ Certificate, dated September 15, 2015, delivered pursuant to the Indenture dated August 11, 2014 relating to the 7.00% Senior Notes due 2022, and setting forth the terms of the Additional Notes (incorporated by reference to Exhibit 4.1 of the Company’s Form 8-K filed September 15, 2015) | |||
Indenture dated January 31, 2017, among California Lyon, the Guarantors and U.S. Bank National Association, as trustee (incorporated by reference to Exhibit 4.1 of the Company’s Form 8-K filed January 31, 2017) | |||
Form of 5.875% Senior Notes due 2025 (incorporated by reference to Exhibit 4.2 of the Company’s Form 8-K filed January 31, 2017) | |||
Third Supplemental Indenture, dated January 31, 2017, among California Lyon, Parent, the guarantors party thereto and U.S. Bank National Association, as trustee (incorporated by reference to Exhibit 4.3 of the Company’s Form 8-K filed January 31, 2017) | |||
10.1 | Form of Indemnity Agreement, between William Lyon Homes, a Delaware corporation, and the directors and officers of William Lyon Homes (incorporated by reference to William Lyon Homes’s Annual Report on Form 10-K for the year-ended December 31, 1999 (File No. 333-88569)). | ||
The Presley Companies Non-Qualified Retirement Plan for Outside Directors (incorporated by reference to William Lyon Homes’s Annual Report on Form 10-K for the year-ended December 31, 2002). | |||
Aircraft Purchase and Sale Agreement dated as of September 3, 2009, by and between Presley CMR, Inc., and Martin Aviation, Inc., or its designee (incorporated by reference to William Lyon Homes’s Current Report on Form 8-K filed with the Commission on September 10, 2009). | |||
Secured Promissory Note dated September 9, 2009 from Martin Aviation, Inc., a California corporation payable to William Lyon Homes, Inc., a California corporation (incorporated by reference to William Lyon Homes’s Current Report on Form 8-K filed with the Commission on September 10, 2009). | |||
Aircraft Mortgage and Security Agreement between Martin Aviation, Inc., a California corporation and William Lyon Homes, Inc., dated as of September 9, 2009 (incorporated by reference to William Lyon Homes’s Current Report on Form 8-K filed with the Commission on September 10, 2009). | |||
Form of Class A Common Stock Registration Rights Agreement, dated as of February 25, 2012, by and among William Lyon Homes and the Holders (as defined therein) (incorporated by reference to the Company’s Current Report on Form 8-K filed with the Commission on March 6, 2012). | |||
Exhibit Number | Description | ||
Class B Common Stock and Warrant Purchase Agreement, dated as of February 25, 2012, by and between William Lyon Homes and the Purchaser (as defined therein) (incorporated by reference to the Company’s Current Report on Form 8-K filed with the Commission on March 6, 2012). | |||
Warrant to Purchase Shares of Class B Common Stock of William Lyon Homes, dated as of February 25, 2012 (incorporated by reference to the Company’s Current Report on Form 8-K filed with the Commission on March 6, 2012). | |||
Class B Common Stock Registration Rights Agreement, dated as of February 25, 2012, by and among William Lyon Homes and the Holders (as defined therein) (incorporated by reference to the Company’s Current Report on Form 8-K filed with the Commission on March 6, 2012). | |||
Form of Convertible Preferred Stock and Class C Common Stock Registration Rights Agreement, dated as of February 25, 2012, by and among William Lyon Homes and the Holders party thereto (incorporated by reference to the Company’s Current Report on Form 8-K filed with the Commission on March 6, 2012). | |||
Employment Agreement, dated as of February 25, 2012, by and among William Lyon Homes, William Lyon Homes, Inc. and General William Lyon (incorporated by reference to the Company’s Current Report on Form 8-K filed with the Commission on March 6, 2012). | |||
Employment Agreement, dated as of February 25, 2012, by and among William Lyon Homes, William Lyon Homes, Inc. and William H. Lyon (incorporated by reference to the Company’s Current Report on Form 8-K filed with the Commission on March 6, 2012). | |||
William Lyon Homes 2012 Equity Incentive Plan (incorporated by reference to the Company’s Registration Statement on Form S-1/A filed with the Commission on December 6, 2012). | |||
William Lyon Homes 2012 Equity Incentive Plan form of Stock Option Agreement (incorporated by reference to the Company’s Registration Statement on Form S-1/A filed with the Commission on December 6, 2012). | |||
William Lyon Homes 2012 Equity Incentive Plan form of Restricted Stock Award Agreement (incorporated by reference to the Company’s Registration Statement on Form S-1/A filed with the Commission on December 6, 2012). | |||
Form of Employment Agreement, dated September 1, 2012 (incorporated by reference to the Company’s Registration Statement on Form S-1/A filed with the Commission on December 6, 2012). | |||
Class A Common Stock and Convertible Preferred Stock Subscription Agreement, dated October 12, 2012, by and between William Lyon Homes and WLH Recovery Acquisition LLC (incorporated by reference to the Company’s Registration Statement on Form S-1/A filed with the Commission on December 6, 2012). | |||
Amendment of and Joinder to Class A Common Stock Registration Rights Agreement, dated October 12, 2012, by and between WLH Recovery Acquisition LLC and William Lyon Homes (incorporated by reference to the Company’s Registration Statement on Form S-1/A filed with the Commission on December 6, 2012). | |||
Amendment of and Joinder to Convertible Preferred Stock and Class C Common Stock Registration Rights Agreement, dated October 12, 2012, by and between WLH Recovery Acquisition LLC and William Lyon Homes (incorporated by reference to the Company’s Registration Statement on Form S-1/A filed with the Commission on December 6, 2012). | |||
Exhibit Number | Description | ||
William Lyon Homes 2012 Equity Incentive Plan Form of Restricted Stock Award Agreement (performance-based) (incorporated by reference to William Lyon Homes’s Form S-1 Registration Statement filed April 9, 2013 (File No. 333-187819)). | |||
Revised Form of Employment Agreement, dated April 1, 2013 (incorporated by reference to William Lyon Homes’s Form S-1 Registration Statement filed April 9, 2013 (File No. 333-187819)). | |||
Amendment to Employment Agreement, dated March 6, 2013, by and between William Lyon Homes, Inc., and Matthew R. Zaist (incorporated by reference to William Lyon Homes’s Form S-1 Registration Statement filed April 9, 2013 (File No. 333-187819)). | |||
Amendment No. 1 to Warrant to Purchase Shares of Class B Common Stock (incorporated by reference to William Lyon Homes’s Current Report on Form 8-K filed with the Commission on May 28, 2013). | |||
Form of indemnification agreement (incorporated by reference to William Lyon Homes’s Current Report on Form 8-K filed with the Commission on May 28, 2013). | |||
Amendment No. 1 to the William Lyon Homes 2012 Equity Incentive Plan (incorporated by reference to Exhibit 10.23(a) to the Company’s Form S-1 Registration Statement filed May 6, 2013 (File No. 333-187819)). | |||
Credit Agreement among William Lyon Homes, Inc., as Borrower, William Lyon Homes, as Parent, The Lenders from time to time party thereto, and Credit Suisse AG, as Administrative Agent, dated as of August 7, 2013 (incorporated by reference to Exhibit 10.1 to the Company’s Quarterly Report on Form 10-Q for the period ended September 30, 2013). | |||
Amendment No. 2 to the William Lyon Homes 2012 Equity Incentive Plan (incorporated by reference to Exhibit 99.3 of the Company’s Form S-8 Registration Statement filed August 12, 2013 (File No. 333-190571)) | |||
William Lyon Homes 2012 Equity Incentive Plan Form of Restricted Stock Award Agreement (performance-based) (incorporated by reference to Exhibit 10.42 of the Company's Form S-4 Registration Statement filed December 27, 2013 (file no. 333-193112)). | |||
William Lyon Homes 2012 Equity Incentive Plan Form of Restricted Stock Award Agreement (incorporated by reference to Exhibit 10.43 of the Company's Form S-4 Registration Statement filed December 27, 2013 (file no. 333-193112)). | |||
William Lyon Homes 2012 Equity Incentive Plan Form of Stock Option Agreement (incorporated by reference to Exhibit 10.44 of the Company's Form S-4 Registration Statement filed December 27, 2013 (file no. 333-193112)). | |||
William Lyon Homes 2012 Equity Incentive Plan Form of Amendment No. 1 to Stock Option Agreement (Five-Year Options) (incorporated by reference to Exhibit 10.45 of the Company's Form S-4 Registration Statement filed December 27, 2013 (file no. 333-193112)). | |||
Bridge Loan Agreement, dated as of August 12, 2014, among William Lyon Homes, Inc., as Borrower, William Lyon Homes, as Parent, the Lenders from time to time party thereto, and J.P. Morgan Chase Bank, N.A., as Administrative Agent (incorporated by reference to Exhibit 10.1 of the Company's Form 8-K filed August 13, 2014). | |||
Exhibit Number | Description | ||
Amendment No. 1 to Credit Agreement among William Lyon Homes, Inc., as Borrower, William Lyon Homes, as Parent, The Lenders from time to time party thereto, and Credit Suisse AG, as Administrative Agent, dated as of August 7, 2013 (incorporated by reference to Exhibit 10.2 of the Company's Form 10-Q filed on November 12, 2014). | |||
Amendment No. 1 to Employment Agreement, dated as of February 25, 2012, by and among William Lyon Homes, William Lyon Homes, Inc. and General William Lyon (incorporated by reference to Exhibit 10.1 of the Company's Form 8-K filed December 31, 2014). | |||
Amendment No. 1 to Employment Agreement, dated as of February 25, 2012, by and among William Lyon Homes, William Lyon Homes, Inc. and William H. Lyon (incorporated by reference to Exhibit 10.2 of the Company's Form 8-K filed December 31, 2014). | |||
Amendment and Restatement Agreement dated as of March 27, 2015 among William Lyon Homes, Inc., a California corporation, as Borrower, William Lyon Homes, a Delaware corporation, as Parent, each subsidiary of the Borrower party thereto, the lenders listed on Schedule 1 thereto, and Credit Suisse AG, as administrative agent (incorporated by reference to Exhibit 10.1 of the Company's Quarterly Report on Form 10-Q filed May 8, 2015) | |||
Employment Agreement by and among William Lyon Homes, William Lyon Homes, Inc. and William H. Lyon, dated as of March 31, 2015 (incorporated by reference to Exhibit 10.1 of the Company's Form 8-K filed April 2, 2015) | |||
Employment Agreement by and among William Lyon Homes, William Lyon Homes, Inc. and Matthew R. Zaist, dated as of March 31, 2015 (incorporated by reference to Exhibit 10.2 of the Company's Form 8-K filed April 2, 2015) | |||
Offer Letter by and between William Lyon Homes, Inc. and William Lyon, dated as of March 31, 2015 (incorporated by reference to Exhibit 10.3 of the Company's Form 8-K filed April 2, 2015) | |||
Amendment No. 1 dated as of December 21, 2015 to the Amended and Restated Credit Agreement dated as of March 27, 2015 among William Lyon Homes, Inc., a California corporation, as Borrower, William Lyon Homes, a Delaware corporation, as Parent, the lenders from time to time party thereto, and Credit Suisse AG, as administrative agent (incorporated by reference to Exhibit 10.40 of the Company's Form 10-K filed March 11, 2016) | |||
William Lyon Homes 2012 Equity Incentive Plan Form of Restricted Stock Award Agreement (Performance Based) (incorporated by reference to Exhibit 10.1 of the Company's Form 10-Q filed May 9, 2016) | |||
William Lyon Homes 2012 Equity Incentive Plan Form of Restricted Stock Award Agreement (incorporated by reference to Exhibit 10.2 of the Company's Form 10-Q filed May 9, 2016) | |||
Offer letter by and between William Lyon Homes, Inc. and General William Lyon, dated as of March 22, 2016 (incorporated by reference to Exhibit 10.1 of the Company's Form 8-K filed March 24, 2016) | |||
Amendment and Restatement Agreement dated as of July 1, 2016 among William Lyon Homes, Inc., a California corporation, as Borrower, William Lyon Homes, a Delaware corporation, as Parent, each subsidiary of the Borrower party thereto, the lenders listed on Schedule 1 thereto, and Credit Suisse AG, as administrative agent (incorporated by reference to Exhibit 10.1 of the Company's Form 8-K filed July 7, 2016) | |||
Exhibit Number | Description | ||
Amendment No. 1 dated as of January 27, 2017 to the Second Amended and Restated Credit Agreement dated as of July 1, 2016, among William Lyon Homes, Inc., a California corporation, as Borrower, William Lyon Homes, a Delaware corporation, as Parent, the lenders from time to time party thereto, and Credit Suisse AG, as administrative agent (incorporated by reference to Exhibit 10.45 of the Company's Form 10-K filed March 9, 2017) | |||
William Lyon Homes Amended and Restated 2012 Equity Incentive Plan (incorporated by reference to Appendix A of the Registrant’s Definitive Proxy Statement filed with the Commission on April 12, 2017) | |||
Amendment No. 2 dated as of June 16, 2017 to the Second Amended and Restated Credit Agreement dated as of July 1, 2016, among William Lyon Homes, Inc., a California corporation, as Borrower, William Lyon Homes, a Delaware corporation, as Parent, the lenders from time to time party thereto, and Credit Suisse AG, as administrative agent (incorporated by reference to Exhibit 10.1 of the Company's Form 10-Q filed August 8, 2017) | |||
Stock Purchase Agreement, dated as of December 14, 2017, by and between the Company and Lyon Shareholder 2012, LLC (incorporated by reference to Exhibit 10.1 of the Company's Form 8-K filed December 14, 2017) | |||
New Lender Supplement dated as of November 28, 2017 to the Second Amended and Restated Credit Agreement dated as of July 1, 2016, among William Lyon Homes, Inc., a California corporation, as Borrower, William Lyon Homes, a Delaware corporation, as Parent, the lenders from time to time party thereto, and Credit Suisse AG, as administrative agent. | |||
12.1+ | Statement Regarding the Computation of Ratio of Earnings to Fixed Charges for the Years Ended December 31, 2017, 2016, 2015, 2014 and 2013. | ||
21.1+ | List of Subsidiaries of the Company. | ||
23.1+ | Consent of KPMG LLP, Independent Registered Public Accounting Firm. | ||
31.1+ | Certification of Principal Executive Officer Required Under Rule 13a-14(a) of the Securities Exchange Act of 1934, as amended | ||
31.2+ | Certification of Principal Financial Officer Required Under Rule 13a-14(a) of the Securities Exchange Act of 1934, as amended | ||
32.1* | Certification of Principal Executive Officer Required Under Rule 13a-14(b) of the Securities Exchange Act of 1934, as amended, and 18 U.S.C. Section 1350 | ||
32.2* | Certification of Principal Financial Officer Required Under Rule 13a-14(b) of the Securities Exchange Act of 1934, as amended, and 18 U.S.C. Section 1350 | ||
101.INS* ** | XBRL Instance Document | ||
101.SCH* ** | XBRL Taxonomy Extension Schema Document | ||
101.CAL* ** | XBRL Taxonomy Extension Calculation Linkbase Document | ||
101.DEF* ** | XBRL Taxonomy Extension Definition Linkbase Document | ||
101.LAB* ** | XBRL Taxonomy Extension Label Linkbase Document | ||
Exhibit Number | Description | ||
101.PRE* ** | XBRL Taxonomy Extension Presentation Linkbase Document | ||
+ | Filed herewith |
† | Management contract or compensatory agreement |
* | The information in Exhibits 32.1 and 32.2 shall not be deemed “filed” for purposes of Section 18 of the Securities Exchange Act of 1934, as amended (the “Exchange Act”), or otherwise subject to the liabilities of that section, nor shall they be deemed incorporated by reference in any filing under the Securities Act of 1933, as amended, or the Exchange Act (including this Report), unless the Registrant specifically incorporates the foregoing information into those documents by reference. |
** | Pursuant to Rule 406T of Regulation S-T, the XBRL information will not be deemed filed for purposes of Section 18 of the Securities Exchange Act of 1934 and will not be deemed filed or part of a registration statement or prospectus for purposes of Sections 11 and 12 of the Securities Act of 1933, or otherwise subject to liability under those Sections. |