Attached files
| file | filename |
|---|---|
| EX-32.1 - EXHIBIT 32.1 - RETAIL OPPORTUNITY INVESTMENTS CORP | roic-123117xex321.htm |
| EX-31.2 - EXHIBIT 31.2 - RETAIL OPPORTUNITY INVESTMENTS CORP | roic-123117xex312.htm |
| EX-31.1 - EXHIBIT 31.1 - RETAIL OPPORTUNITY INVESTMENTS CORP | roic-123117xex311.htm |
| EX-23.2 - EXHIBIT 23.2 - RETAIL OPPORTUNITY INVESTMENTS CORP | roic-123117xex232.htm |
| EX-23.1 - EXHIBIT 23.1 - RETAIL OPPORTUNITY INVESTMENTS CORP | roic-123117xex231.htm |
| EX-21.1 - EXHIBIT 21.1 - RETAIL OPPORTUNITY INVESTMENTS CORP | roic-123117xex211.htm |
UNITED STATES
SECURITIES AND EXCHANGE COMMISSION
Washington, DC 20549
FORM 10-K
[X] ANNUAL REPORT PURSUANT TO SECTION 13 OR 15(d) OF THE SECURITIES EXCHANGE ACT OF 1934
For the fiscal year ended December 31, 2017
or
[ ] TRANSITION REPORT PURSUANT TO SECTION 13 OR 15(d) OF THE SECURITIES EXCHANGE ACT OF 1934
For the transition period from to .
RETAIL OPPORTUNITY INVESTMENTS CORP.
(Exact name of registrant as specified in its charter)
Commission file number: 001-33749
RETAIL OPPORTUNITY INVESTMENTS PARTNERSHIP, LP
(Exact name of registrant as specified in its charter)
Commission file number: 333-189057-01
Maryland (Retail Opportunity Investments Corp.) Delaware (Retail Opportunity Investments Partnership, LP) (State or other jurisdiction of incorporation or organization) | 26-0500600 (Retail Opportunity Investments Corp.) 94-2969738 (Retail Opportunity Investments Partnership, LP) (I.R.S. Employer Identification No.) |
8905 Towne Centre Drive, Suite 108 San Diego, California (Address of principal executive offices) | 92122 (Zip code) |
Registrant’s telephone number, including area code:
(858) 677-0900
Securities Registered Pursuant to Section 12(b) of the Act:
Title of Each Class | Name of Exchange on Which Registered | |
Common Stock, $0.0001 par value per share | The NASDAQ Stock Market LLC | |
Securities Registered Pursuant to Section 12(g) of the Act:
Retail Opportunity Investments Corp. None
Retail Opportunity Investments Partnership, LP None
Indicate by check mark if the registrant is a well-known seasoned issuer, as defined in Rule 405 of the Securities Act.
Retail Opportunity Investments Corp. | Yes ☒ No ☐ | |
Retail Opportunity Investments Partnership, LP | Yes ☐ No ☒ | |
Indicate by check mark if the registrant is not required to file reports pursuant to Section 13 or Section 15(d) of the Act.
Retail Opportunity Investments Corp. | Yes ☐ No ☒ | |
Retail Opportunity Investments Partnership, LP | Yes ☐ No ☒ | |
Indicate by check mark whether the registrant (1) has filed all reports required to be filed by Section 13 or 15(d) of the Securities Exchange Act of 1934 during the preceding 12 months (or for such shorter period that the registrant was required to file such reports), and (2) has been subject to such filing requirements for the past 90 days.
Retail Opportunity Investments Corp. | Yes ☒ No ☐ | |
Retail Opportunity Investments Partnership, LP | Yes ☒ No ☐ | |
Indicate by check mark whether the registrant has submitted electronically and posted on its corporate Web site, if any, every Interactive Data File required to be submitted and posted pursuant to Rule 405 of Regulation S-T during the preceding 12 months (or for such shorter period that the registrant was required to submit and post such files).
Retail Opportunity Investments Corp. | Yes ☒ No ☐ | |
Retail Opportunity Investments Partnership, LP | Yes ☒ No ☐ | |
Indicate by check mark if disclosure of delinquent filers pursuant to Item 405 of Regulation S-K is not contained herein, and will not be contained, to the best of registrant’s knowledge, in definitive proxy or information statements incorporated by reference in Part III of this Form 10-K or any amendment to this Form 10-K. ☐
Indicate by check mark whether the registrant is a large accelerated filer, an accelerated filer, a non-accelerated filer, a smaller reporting company, or emerging growth company. See the definitions of “large accelerated filer,” “accelerated filer,” “smaller reporting company” and “emerging growth company” in Rule 12b-2 of the Exchange Act. (Check one):
Retail Opportunity Investments Corp.
Large accelerated filer ☒ | Accelerated filer ☐ | Non-accelerated filer ☐ (Do not check if a smaller reporting company) | Smaller reporting company ☐ |
Emerging growth company ☐ | If an emerging growth company, indicate by check mark if the registrant has elected not to use the extended transition period for complying with any new or revised financial accounting standards provided pursuant to Section 13(a) of the Exchange Act. ☐ | ||
Retail Opportunity Investments Partnership, LP
Large accelerated filer ☐ | Accelerated filer ☐ | Non-accelerated filer ☒ (Do not check if a smaller reporting company) | Smaller reporting company ☐ |
Emerging growth company ☐ | If an emerging growth company, indicate by check mark if the registrant has elected not to use the extended transition period for complying with any new or revised financial accounting standards provided pursuant to Section 13(a) of the Exchange Act. ☐ | ||
Indicate by check mark whether the registrant is a Shell Company (as defined in rule 12b-2 of the Exchange Act).
Retail Opportunity Investments Corp. | Yes ☐ No ☒ | |
Retail Opportunity Investments Partnership, LP | Yes ☐ No ☒ | |
The aggregate market value of the common equity held by non-affiliates of Retail Opportunity Investments Corp. as of June 30, 2017, the last business day of its most recently completed second fiscal quarter, was $2.1 billion (based on the closing sale price of $19.19 per share of Retail Opportunity Investments Corp. common stock on that date as reported on the NASDAQ Global Select Market).
There is no public trading market for the operating partnership units of Retail Opportunity Investments Partnership, LP. As a result the aggregate market value of common equity securities held by non-affiliates of this registrant cannot be determined.
Indicate the number of shares outstanding of each of the issuer’s classes of common stock as of the latest practicable date: 112,420,425 shares of common stock, par value $0.0001 per share, of Retail Opportunity Investments Corp. outstanding as of February 16, 2018.
DOCUMENTS INCORPORATED BY REFERENCE
Portions of Retail Opportunity Investments Corp.’s definitive proxy statement for its 2017 Annual Meeting, to be filed within 120 days after its fiscal year, are incorporated by reference into Part III of this Annual Report on Form 10-K.
1
EXPLANATORY PARAGRAPH
This report combines the annual reports on Form 10-K for the year ended December 31, 2017 of Retail Opportunity Investments Corp., a Maryland corporation (“ROIC”), and Retail Opportunity Investments Partnership, LP, a Delaware limited partnership (the “Operating Partnership”) of which Retail Opportunity Investments Corp. is the parent company and through its wholly owned subsidiary, acts as general partner. Unless otherwise indicated or unless the context requires otherwise, all references in this report to “the Company,” “we,” “us,” “our,” or “our company” refer to ROIC together with its consolidated subsidiaries, including Retail Opportunity Investments Partnership, LP. Unless otherwise indicated or unless the context requires otherwise, all references in this report to the Operating Partnership refer to Retail Opportunity Investments Partnership, LP together with its consolidated subsidiaries.
ROIC operates as a real estate investment trust and as of December 31, 2017, ROIC owned an approximate 90.5% partnership interest in the Operating Partnership. Retail Opportunity Investments GP, LLC, ROIC’s wholly-owned subsidiary, is the sole general partner of the Operating Partnership. Through this subsidiary, ROIC has full and complete authority and control over the Operating Partnership’s business.
The Company believes that combining the annual reports on Form 10-K of ROIC and the Operating Partnership into a single report will result in the following benefits:
•facilitate a better understanding by the investors of ROIC and the Operating Partnership by enabling them to view the business as a whole in the same manner as management views and operates the business;
•remove duplicative disclosures and provide a more straightforward presentation in light of the fact that a substantial portion of the disclosure applies to both ROIC and the Operating Partnership; and
•create time and cost efficiencies through the preparation of one combined report instead of two separate reports.
Management operates ROIC and the Operating Partnership as one enterprise. The management of ROIC and the Operating Partnership are the same.
There are few differences between ROIC and the Operating Partnership, which are reflected in the disclosures in this report. The Company believes it is important to understand the differences between ROIC and the Operating Partnership in the context of how these entities operate as an interrelated consolidated company. ROIC is a real estate investment trust, whose only material assets are its direct or indirect partnership interests in the Operating Partnership and membership interest in Retail Opportunity Investments GP, LLC, which is the sole general partner of the Operating Partnership. As a result, ROIC does not conduct business itself, other than acting as the parent company and through Retail Opportunity Investments Partnership GP, LLC as the sole general partner of the Operating Partnership. The Operating Partnership holds substantially all the assets of the Company and directly or indirectly holds the ownership interests in the Company’s real estate ventures. The Company conducts its business through the Operating Partnership, which is structured as a partnership with no publicly traded equity. Except for net proceeds from equity issuances by ROIC, which are contributed to the Operating Partnership, the Operating Partnership generates the capital required by the Company’s business through the Operating Partnership’s operations, by the Operating Partnership’s incurrence of indebtedness (directly and through subsidiaries) or through the issuance of operating partnership units (“OP Units”) of the Operating Partnership.
Non-controlling interests is the primary difference between the Consolidated Financial Statements for ROIC and the Operating Partnership. The OP Units in the Operating Partnership that are not owned by ROIC are accounted for as partners’ capital in the Operating Partnership’s financial statements and as non-controlling interests in ROIC’s financial statements. Accordingly, this report presents the Consolidated Financial Statements for ROIC and the Operating Partnership separately, as required, as well as Earnings Per Share / Earnings Per Unit and Capital of the Partnership.
This report also includes separate Management’s Discussion and Analysis of Financial Condition and Results of Operations – Liquidity and Capital Resources, Item 9A. Controls and Procedures sections and separate Chief Executive Officer and Chief Financial Officer certifications for each of ROIC and the Operating Partnership as reflected in Exhibits 31 and 32.
2
RETAIL OPPORTUNITY INVESTMENTS CORP. | ||
TABLE OF CONTENTS | ||
Page | ||
3
Statements Regarding Forward-Looking Information
When used in this discussion and elsewhere in this Annual Report on Form 10-K, the words “believes,” “anticipates,” “projects,” “should,” “estimates,” “expects,” and similar expressions are intended to identify forward-looking statements with the meaning of that term in Section 27A of the Securities Act of 1933, as amended (the “Securities Act”), and in Section 21F of the Securities and Exchange Act of 1934, as amended (the “Exchange Act”). Actual results may differ materially due to uncertainties including:
•the Company’s ability to identify and acquire retail real estate that meet its investment standards in its markets;
•the level of rental revenue the Company achieves from its assets;
•the market value of the Company’s assets and the supply of, and demand for, the retail real estate in which it invests;
•the state of the U.S. economy generally, or in specific geographic regions;
•the impact of economic conditions on the Company’s business;
• | the conditions in the local markets in which the Company operates and its concentration in those markets, as well as changes in national economic and market conditions; |
•consumer spending and confidence trends;
• | the Company’s ability to enter into new leases or to renew leases with existing tenants at the properties it owns or acquires at favorable rates; |
•the Company’s ability to anticipate changes in consumer buying practices and the space needs of tenants;
•the competitive landscape impacting the properties the Company owns or acquires and their tenants;
•the Company’s relationships with its tenants and their financial condition and liquidity;
•ROIC’s ability to continue to qualify as a real estate investment trust for U.S. federal income tax (a “REIT”);
• | the Company’s use of debt as part of its financing strategy and its ability to make payments or to comply with any covenants under its senior unsecured notes, its unsecured credit facilities or other debt facilities it currently has or subsequently obtains; |
•the Company’s level of operating expenses, including amounts it is required to pay to its management team;
• | changes in interest rates that could impact the market price of ROIC’s common stock and the cost of the Company’s borrowings; and |
•legislative and regulatory changes (including changes to laws governing the taxation of REITs).
Forward-looking statements are based on estimates as of the date of this Annual Report on Form 10-K. The Company disclaims any obligation to publicly release the results of any revisions to these forward-looking statements reflecting new estimates, events or circumstances after the date of this Annual Report on Form 10-K.
The risks included here are not exhaustive. Other sections of this Annual Report on Form 10-K may include additional factors that could adversely affect the Company’s business and financial performance. Moreover, the Company operates in a very competitive and rapidly changing environment. New risk factors emerge from time to time and it is not possible for management to predict all such risk factors, nor can it assess the impact of all such risk factors on the Company’s business or the extent to which any factor, or combination of factors, may cause actual results to differ materially from those contained in any forward-looking statements. Given these risks and uncertainties, investors should not place undue reliance on forward-looking statements as a prediction of actual results.
4
PART I
In this Annual Report on Form 10-K, unless otherwise indicated or the context requires otherwise, all references to “the Company,” “we,” “us,” “our,” or “our company” refer to ROIC together with its consolidated subsidiaries, including the Operating Partnership.
Item 1. Business
Overview
Retail Opportunity Investments Corp., a Maryland corporation (“ROIC”) commenced operations in October 2009 as a fully integrated, self-managed REIT, and as of December 31, 2017, ROIC owned an approximate 90.5% partnership interest and other limited partners owned the remaining 9.5% partnership interest in the Operating Partnership. The Company specializes in the acquisition, ownership and management of necessity-based community and neighborhood shopping centers on the west coast of the United States, anchored by supermarkets and drugstores. The Company is organized in a traditional umbrella partnership real estate investment trust (“UpREIT”) format pursuant to which Retail Opportunity Investments GP, LLC, its wholly-owned subsidiary, serves as the sole general partner of, and ROIC conducts substantially all of its business through, its operating partnership, Retail Opportunity Investments Partnership, LP, a Delaware limited partnership (the “Operating Partnership”), together with its subsidiaries. As of December 31, 2017, the Company’s portfolio consisted of 92 properties (91 retail and one office) totaling approximately 10.5 million square feet of gross leasable area (“GLA”).
ROIC’s only material assets are its direct or indirect partnership interests in the Operating Partnership and membership interest in Retail Opportunity Investments GP, LLC, which is the sole general partner of the Operating Partnership. As a result, ROIC does not conduct business itself, other than acting as the parent company and through this subsidiary, acts as the sole general partner of the Operating Partnership. The Operating Partnership holds substantially all the assets of the Company and directly or indirectly holds the ownership interests in the Company’s real estate ventures. The Operating Partnership conducts the operations of the Company’s business and is structured as a partnership with no publicly traded equity. Except for net proceeds from equity issuances by ROIC, which are contributed to the Operating Partnership, the Operating Partnership generates the capital required by the Company’s business through the Operating Partnership’s operations, by the Operating Partnership’s incurrence of indebtedness (directly and through subsidiaries) or through the issuance of operating partnership units (“OP Units”) of the Operating Partnership.
Investment Strategy
The Company seeks to acquire shopping centers located in densely populated, supply-constrained metropolitan markets on the west coast of the United States, which exhibit income and population growth and high barriers to entry. The Company’s senior management team has operated in the Company’s markets for over 25 years and has established an extensive network of relationships in these markets with key institutional and private property owners, brokers and financial institutions and other real estate operators. The Company’s in-depth local and regional market knowledge and expertise provides a distinct competitive advantage in identifying and accessing attractive acquisition opportunities, including properties that are not widely marketed.
The Company seeks to acquire high quality necessity-based community and neighborhood shopping centers anchored by national and regional supermarkets and drugstores that are well-leased, with stable cash flows. Additionally, the Company acquires shopping centers which it believes are candidates for attractive near-term re-tenanting or present other value-enhancement opportunities.
Upon acquiring a shopping center, the Company normally commences leasing initiatives aimed at enhancing long-term value through re-leasing below market space and improving the tenant mix. The Company focuses on leasing to retailers that provide necessity-based, non-discretionary goods and services, catering to the basic and daily needs of the surrounding community. The Company believes necessity-based retailers draw consistent, regular traffic to its shopping centers, which results in stronger sales for its tenants and a more consistent revenue base. Additionally, the Company seeks to maintain a strong and diverse tenant base with a balance of large, long-term leases to major national and regional retailers, including supermarkets, drugstores and discount stores, with small, shorter-term leases to a broad mix of national, regional and local retailers. The Company believes the long-term anchor tenants provide a reliable, stable base of rental revenue, while the shorter-term leases afford the Company the opportunity to drive rental growth, as well as the ongoing flexibility to adapt to evolving consumer trends.
The Company believes that the current market environment continues to present opportunities for it to further build its portfolio and add additional necessity-based community and neighborhood shopping centers that meet its investment profile. The Company’s long-term objective is to prudently build and maintain a diverse portfolio of necessity-based community and
5
neighborhood shopping centers aimed at providing stockholders with sustainable, long-term growth and value through all economic cycles.
In implementing its investment strategy and selecting an asset for acquisition, the Company analyzes the fundamental qualities of the asset, the inherent strengths and weaknesses of its market, sub-market drivers and trends, and potential risks and risk mitigants facing the property. The Company believes that its acquisition process and operational expertise provide it with the capability to identify and properly underwrite investment opportunities.
The Company’s aim is to seek to provide diversification of assets, tenant exposures, lease terms and locations as its portfolio expands. In order to capitalize on the changing sets of investment opportunities that may be present in the various points of an economic cycle, the Company may expand or refocus its investment strategy. The Company’s investment strategy may be amended from time to time, if approved by its board of directors. The Company is not required to seek stockholder approval when amending its investment strategy.
Transactions During 2017
Investing Activity
Property Asset Acquisitions
On January 25, 2017, the Company acquired the property known as PCC Community Markets Plaza located in Edmonds, Washington, within the Seattle metropolitan area, for an adjusted purchase price of approximately $8.7 million. PCC Community Markets Plaza is approximately 34,000 square feet and is anchored by PCC Community Markets. The property was acquired with available cash from operations.
On March 17, 2017, the Company acquired the property known as The Terraces located in Rancho Palos Verdes, California, within the Los Angeles metropolitan area, for an adjusted purchase price of approximately $54.2 million. The Terraces is approximately 173,000 square feet and is anchored by Trader Joe’s, Marshall’s and LA Fitness. The property was acquired with borrowings under the Company’s unsecured revolving credit facility (the “credit facility”).
On March 24, 2017, the Company acquired the property known as Santa Rosa Southside Shopping Center located in Santa Rosa, California, within the San Francisco metropolitan area, for an adjusted purchase price of approximately $28.9 million. Santa Rosa Southside Shopping Center is approximately 86,000 square feet and is anchored by REI and Cost Plus World Market. The property was acquired with borrowings under the credit facility and the issuance of 168,497 OP Units with a fair value of approximately $3.6 million.
On April 5, 2017, the Company acquired the property known as Division Center, located in Portland, Oregon, for an adjusted purchase price of approximately $33.1 million. Division Center is approximately 122,000 square feet and is anchored by Grocery Outlet Supermarket, Rite Aid Pharmacy and Petco. The property was acquired with borrowings under the credit facility.
On May 9, 2017, the Company acquired the property known as Highland Hill, located in Tacoma, Washington, within the Seattle metropolitan area, for an adjusted purchase price of approximately $47.4 million. Highland Hill is approximately 164,000 square feet and is anchored by Safeway Supermarket, LA Fitness, Dollar Tree and Petco. The property was acquired with borrowings under the credit facility.
On September 19, 2017, the Company acquired the property known as Monta Loma Plaza, located in Mountain View, California, within the San Francisco metropolitan area, for an adjusted purchase price of approximately $30.0 million. Monta Loma Plaza is approximately 48,000 square feet and is anchored by Safeway Supermarket. The property was acquired with borrowings under the credit facility.
On October 11, 2017, the Company acquired the properties known as Fullerton Crossroads and Riverstone Marketplace. Fullerton Crossroads, located in Fullerton, California, within Orange County, was acquired for an adjusted purchase price of approximately $61.6 million, is approximately 220,000 square feet and is anchored by Kroger (Ralph’s) Supermarket. Riverstone Marketplace, located in Vancouver, Washington, within the Portland metropolitan area, was acquired for an adjusted purchase price of approximately $31.7 million, is approximately 96,000 square feet and is anchored by Kroger (QFC) Supermarket. The properties were acquired through the issuance of 2,405,430 OP Units with a fair value of approximately $46.0 million and the assumption of existing debt on the properties with a fair value of approximately $46.0 million.
6
On October 19, 2017, the Company acquired the property known as North Lynnwood Shopping Center, located in Lynnwood, Washington, within the Seattle metropolitan area, for an adjusted purchase price of approximately $13.3 million. North Lynnwood Shopping Center is approximately 64,000 square feet and is anchored by Kroger (QFC) Supermarket. The property was acquired with borrowings under the credit facility.
On November 30, 2017, the Company acquired the property known as The Village at Nellie Gail Ranch, located in Laguna Hills, California, within Orange County, for an adjusted purchase price of approximately $46.1 million. The Village at Nellie Gail Ranch is approximately 88,000 square feet and is anchored by Smart & Final Extra Supermarket. The property was acquired with borrowings under the credit facility.
Financing Activities
The Company employs prudent amounts of leverage and uses debt as a means of providing funds for the acquisition of its properties and the diversification of its portfolio. The Company seeks to primarily utilize unsecured debt in order to maintain liquidity and flexibility in its capital structure.
Term Loan and Credit Facility
On September 29, 2015, the Company entered into a term loan agreement under which the lenders agreed to provide a $300.0 million unsecured term loan facility. Effective September 8, 2017, the Company entered into a First Amended and Restated Term Loan Agreement (the “Term Loan Agreement”) pursuant to which the maturity date of the term loan was extended from January 31, 2019 to September 8, 2022, without further options for extension. The Term Loan Agreement also provides that the Company may from time to time request increased aggregate commitments of $200.0 million under certain conditions set forth in the Term Loan Agreement, including the consent of the lenders for the additional commitments. Borrowings under the Term Loan Agreement accrue interest on the outstanding principal amount at a rate equal to an applicable rate based on the credit rating level of the Company, plus, as applicable, (i) a LIBOR rate determined by reference to the cost of funds for U.S. dollar deposits for the relevant period (the “Eurodollar Rate”), or (ii) a base rate determined by reference to the highest of (a) the federal funds rate plus 0.50%, (b) the rate of interest announced by the Administrative Agent as its “prime rate,” and (c) the Eurodollar Rate plus 1.10%.
The Operating Partnership has an unsecured revolving credit facility with several banks. Effective September 8, 2017, the Company entered into a Second Amended and Restated Credit Agreement (the “Credit Facility Agreement”) pursuant to which the borrowing capacity was increased from $500.0 million to $600.0 million. The maturity date of the credit facility was extended from January 31, 2019 to September 8, 2021, with two six-month extension options, which may be exercised by the Operating Partnership upon satisfaction of certain conditions including the payment of extension fees. Additionally, the credit facility contains an accordion feature, which allows the Operating Partnership to increase the borrowing capacity up to an aggregate of $1.2 billion, subject to lender consents and other conditions. Borrowings under the credit facility accrue interest on the outstanding principal amount at a rate equal to an applicable rate based on the credit rating level of the Company, plus, as applicable, (i) the Eurodollar Rate, or (ii) a base rate determined by reference to the highest of (a) the federal funds rate plus 0.50%, (b) the rate of interest announced by KeyBank, National Association as its “prime rate,” and (c) the Eurodollar Rate plus 1.00%. Additionally, the Operating Partnership is obligated to pay a facility fee at a rate based on the credit rating level of the Company, currently 0.20%, and a fronting fee at a rate of 0.125% per year with respect to each letter of credit issued under the credit facility. The Company has investment grade credit ratings from Moody’s Investors Service (Baa2) and Standard & Poor’s Ratings Services (BBB-).
Both the term loan and credit facility contain customary representations, financial and other covenants. The Operating Partnership’s ability to borrow under the term loan and credit facility are subject to its compliance with financial covenants and other restrictions on an ongoing basis. The Operating Partnership was in compliance with such covenants at December 31, 2017.
As of December 31, 2017, $300.0 million and $143.5 million were outstanding under the term loan and credit facility, respectively. The average interest rates on the term loan and the credit facility during the year ended December 31, 2017 were 2.2% and 2.1%, respectively. The Company had no available borrowings under the term loan at December 31, 2017. The Company had $456.5 million available to borrow under the credit facility at December 31, 2017.
Senior Notes
On November 10, 2017, the Operating Partnership entered into a Note Purchase Agreement which provided for the issuance of $250.0 million principal amount of 4.19% Senior Notes Due 2027 (the “Senior Notes Due 2027”) in a private placement effective December 15, 2017. The Senior Notes Due 2027 pay interest on June 15 and December 15 of each year, commencing on June 15, 2018, and mature on December 15, 2027, unless prepaid earlier by the Operating Partnership. The Operating Partnership’s
7
performance of the obligations under the Note Purchase Agreement, including the payment of any outstanding indebtedness thereunder, are guaranteed, jointly and severally, by ROIC.
Mortgage Notes Payable
On October 11, 2017, in connection with the acquisitions of Fullerton Crossroads and Riverstone Marketplace, the Company assumed two existing mortgage loans with outstanding principal balances of approximately $26.0 million and $18.5 million, respectively.
On May 11, 2017, the Company repaid in full the Bernardo Heights mortgage note related to Bernardo Heights Plaza for a total of approximately $8.1 million, without penalty, in accordance with the prepayment provisions of the note.
Equity Issuance
In connection with the acquisitions of Fullerton Crossroads and Riverstone Marketplace, a portion of the consideration for the properties was funded through the issuance of 2,405,430 OP Units. On December 12, 2017, the Company issued 2,584,254 shares of common stock, at a price per share of $21.25, in exchange for the 2,405,430 OP Units previously issued and the rights to approximately $3.8 million of cash to be used to acquire a third property to be identified by the Company. The proceeds of approximately $3.8 million are classified in Restricted Cash in the consolidated balance sheet as of December 31, 2017, as the proceeds are being held with an exchange accommodator under Section 1031 of the Internal Revenue Code of 1986, as amended (the “Code”), and are expected to be used to purchase a replacement asset during the first half of 2018. The shares of common stock of the Company were issued in a private placement in reliance on Section 4(a)(2) of the Securities Act of 1933, as amended, and the rules and regulations promulgated thereunder.
ATM Equity Offering
On September 19, 2014, ROIC entered into three separate Sales Agreements (the “Original Sales Agreements”) with each of Jefferies LLC, KeyBanc Capital Markets Inc., and Raymond James & Associates, Inc. (each individually, an “Original Agent” and collectively, the “Original Agents”) pursuant to which ROIC may sell, from time to time, shares of ROIC’s common stock, par value $0.0001 per share, having an aggregate offering price of up to $100.0 million through the Original Agents either as agents or principals. On May 23, 2016, ROIC entered into two additional sales agreements (the “Additional Sales Agreements”, and together with the Original Sales Agreements, the “Sales Agreements”) with each of Canaccord Genuity Inc. and Robert W. Baird & Co. Incorporated (the “Additional Agents”, and together with the Original Agents, the “Agents”) pursuant to which ROIC may sell shares of ROIC’s common stock through the Additional Agents either as agents or principals.
During the year ended December 31, 2017, ROIC sold a total of 34,001 shares of common stock under the Sales Agreements, which resulted in gross proceeds of approximately $681,000 and commissions of approximately $9,000 paid to the Agents.
The Company plans to finance future acquisitions through a combination of operating cashflow, borrowings under the credit facility, the assumption of existing mortgage debt, the issuance of equity securities including OP Units, equity and debt offerings, and the potential sale of existing assets.
Business Segments
The Company’s primary business is the ownership, management, and redevelopment of retail real estate properties. The Company reviews operating and financial information for each property on an individual basis and therefore, each property represents an individual operating segment. The Company evaluates financial performance using property operating income, defined as operating revenues (base rent and recoveries from tenants), less property and related expenses (property operating expenses and property taxes). The Company has aggregated the properties into one reportable segment as the properties share similar long-term economic characteristics and have other similarities including the fact that they are operated using consistent business strategies, are typically located in major metropolitan areas, and have similar tenant mixes.
Regulation
The following discussion describes certain material U.S. federal laws and regulations that may affect the Company’s operations and those of its tenants. However, the discussion does not address state laws and regulations, except as otherwise indicated. These state laws and regulations, like the U.S. federal laws and regulations, could affect the Company’s operations and those of its tenants.
8
Generally, real estate properties are subject to various laws, ordinances and regulations. Changes in any of these laws or regulations, such as the Comprehensive Environmental Response and Compensation, and Liability Act of 1980, as amended, increase the potential liability for environmental conditions or circumstances existing or created by tenants or others on the properties. In addition, laws affecting development, construction, operation, upkeep, safety and taxation requirements may result in significant unanticipated expenditures, loss of real estate property sites or other impairments, which would adversely affect its cash flows from operating activities.
Under the Americans with Disabilities Act of 1990 (the “Americans with Disabilities Act”) all places of public accommodation are required to meet certain U.S. federal requirements related to access and use by disabled persons. A number of additional U.S. federal, state and local laws also exist that may require modifications to properties, or restrict certain further renovations thereof, with respect to access thereto by disabled persons. Noncompliance with the Americans with Disabilities Act could result in the imposition of fines or an award of damages to private litigants and also could result in an order to correct any non-complying feature and in substantial capital expenditures. To the extent the Company’s properties are not in compliance, the Company may incur additional costs to comply with the Americans with Disabilities Act.
Property management activities are often subject to state real estate brokerage laws and regulations as determined by the particular real estate commission for each state.
Environmental Matters
Pursuant to U.S. federal, state and local environmental laws and regulations, a current or previous owner or operator of real property may be required to investigate, remove and/or remediate a release of hazardous substances or other regulated materials at or emanating from such property. Further, under certain circumstances, such owners or operators of real property may be held liable for property damage, personal injury and/or natural resource damage resulting from or arising in connection with such releases. Certain of these laws have been interpreted to be joint and several unless the harm is divisible and there is a reasonable basis for allocation of responsibility. The failure to properly remediate the property may also adversely affect the owner’s ability to lease, sell or rent the property or to borrow funds using the property as collateral.
In connection with the ownership, operation and management of the Company’s current properties and any properties that it may acquire and/or manage in the future, the Company could be legally responsible for environmental liabilities or costs relating to a release of hazardous substances or other regulated materials at or emanating from such property. In order to assess the potential for such liability, the Company conducts an environmental assessment of each property prior to acquisition and manages its properties in accordance with environmental laws while it owns or operates them. All of its leases contain a comprehensive environmental provision that requires tenants to conduct all activities in compliance with environmental laws and to indemnify the owner for any harm caused by the failure to do so. In addition, the Company has engaged qualified, reputable and adequately insured environmental consulting firms to perform environmental site assessments of its properties and is not aware of any environmental issues that are expected to materially impact the financial condition of the Company.
Competition
The Company believes that competition for the acquisition, operation and development of retail properties is highly fragmented. The Company competes with numerous owners, operators and developers for acquisitions and development of retail properties, including institutional investors, other REITs and other owner-operators of necessity-based community and neighborhood shopping centers, primarily anchored by supermarkets and drugstores, some of which own or may in the future own properties similar to the Company’s in the same markets in which its properties are located. The Company also faces competition in leasing available space to prospective tenants at its properties. The actual competition for tenants varies depending upon the characteristics of each local market (including current economic conditions) in which the Company owns and manages property. The Company believes that the principal competitive factors in attracting tenants in its market areas are location, demographics, price, the presence of anchor stores and the appearance of properties.
Many of the Company’s competitors are substantially larger and have considerably greater financial, marketing and other resources than the Company. Other entities may raise significant amounts of capital, and may have investment objectives that overlap with those of the Company, which may create additional competition for opportunities to acquire assets. In the future, competition from these entities may reduce the number of suitable investment opportunities offered to the Company or increase the bargaining power of property owners seeking to sell. Further, as a result of their greater resources, such entities may have more flexibility than the Company does in their ability to offer rental concessions to attract tenants. If the Company’s competitors offer space at rental rates below current market rates, or below the rental rates the Company currently charges its tenants, the Company may lose potential tenants and it may be pressured to reduce its rental rates below those it currently charges in order to retain tenants when its tenants’ leases expire.
9
Employees
As of December 31, 2017, the Company had 73 employees, including three executive officers, one of whom is also a member of its board of directors and 19 maintenance employees at the shopping centers.
Available Information
The Company files its annual report on Form 10-K, quarterly reports on Form 10-Q, current reports on Form 8-K, and all amendments to those reports with the Securities and Exchange Commission (the “SEC”). You may obtain copies of these documents by visiting the SEC’s Public Reference Room at 100 F Street N.E., Washington, D.C. 20549, or by calling the SEC at 1-800-SEC-0330. The SEC also maintains a website (www.sec.gov) that contains reports, proxy and information statements, and other information regarding issuers that file electronically with the SEC. The Company’s website is www.roireit.net. The Company’s reports on Forms 10-K, 10-Q and 8-K, and all amendments to those reports are available free of charge on its Website as soon as reasonably practicable after the reports and amendments are electronically filed with or furnished to the SEC. The contents of the Company’s website are not incorporated by reference herein.
Item 1A. Risk Factors
Risks Related to the Company’s Business and Operations
There are risks relating to investments in real estate.
Real property investments are subject to varying degrees of risk. Real estate values are affected by a number of factors, including: changes in the general economic climate, local conditions (such as an oversupply of space or a reduction in demand for real estate in an area), the quality and philosophy of management, competition from other available space, the ability of the owner to provide adequate maintenance and insurance and to control variable operating costs, adverse weather conditions, natural disasters, terrorist activities and other factors in the areas in which the properties are located. Shopping centers, in particular, may be affected by changing perceptions of retailers or shoppers regarding the safety, convenience and attractiveness of the shopping center, increasing consumer purchases through online retail websites and catalogs, the ongoing consolidation in the retail sector and by the overall climate for the retail industry generally. Real estate values are also affected by such factors as government regulations, interest rate levels, the availability of financing and potential liability under, and changes in, environmental, zoning, tax and other laws. A significant portion of the Company’s income is derived from rental income from real property. The Company’s income, cash flow, results of operations, financial condition, liquidity and ability to service its debt obligations could be materially and adversely affected if a significant number of its tenants were unable to meet their obligations, or if it were unable to lease on economically favorable terms a significant amount of space in its properties. In the event of default by a tenant, the Company may experience delays in enforcing, and incur substantial costs to enforce, its rights as a landlord. In addition, certain significant expenditures associated with each equity investment (such as mortgage payments, real estate taxes and maintenance costs) are generally not reduced when circumstances cause a reduction in income from the investment.
The Company operates in a highly competitive market and competition may limit its ability to acquire desirable assets and to attract and retain tenants.
The Company operates in a highly competitive market. The Company’s profitability depends, in large part, on its ability to acquire its assets at favorable prices and on trends impacting the retail industry in general, national, regional and local economic conditions, financial condition and operating results of current and prospective tenants and customers, availability and cost of capital, construction and renovation costs, taxes, governmental regulations, legislation and population trends. Many of the Company’s competitors are substantially larger and have considerably greater financial, marketing and other resources than it does. Other entities may raise significant amounts of capital, and may have investment objectives that overlap with the Company’s. In addition, the properties that the Company acquires may face competition from similar properties in the same market, as well as from e-commerce websites. At the time of the commencement of the Company’s operations, conditions in the capital markets and the credit markets reduced competitors’ ability to finance acquisitions. As access to capital and credit have improved and the number of competitors operating in the Company’s markets have increased, the Company has faced increased competition for opportunities to acquire assets and to attract and retain tenants. The presence of competitive alternatives affects the Company’s ability to lease space and the level of rents it can obtain. New construction, renovations and expansions at competing sites could also negatively affect the Company’s properties.
10
The Company may change any of its strategies, policies or procedures without stockholder consent, which could materially and adversely affect its business.
The Company may change any of its strategies, policies or procedures with respect to acquisitions, asset allocation, growth, operations, indebtedness, financing strategy and distributions, including those related to maintaining its REIT qualification, at any time without the consent of its stockholders, which could result in making acquisitions that are different from, and possibly riskier than, the types of acquisitions described in this Annual Report on Form 10-K. A change in the Company’s strategy may increase its exposure to real estate market fluctuations, financing risk, default risk and interest rate risk. Furthermore, a change in the Company’s asset allocation could result in the Company making acquisitions in asset categories different from those described in this Annual Report on Form 10-K. These changes could materially and adversely affect the Company’s income, cash flow, results of operations, financial condition, liquidity, the ability to service its debt obligations, the market price of its common stock and its ability to pay dividends and other distributions to its stockholders.
The Company’s directors are subject to potential conflicts of interest.
The Company’s executive officers and directors face conflicts of interest. Except for Messrs. Tanz, Haines and Schoebel, none of the Company’s executive officers or directors are required to commit their full time to its affairs and, accordingly, they may have conflicts of interest in allocating management time among various business activities. In addition, except for Mr. Tanz, each of the Company’s directors (including the Company’s non-Executive Chairman) is engaged in several other business endeavors. In the course of their other business activities, the Company’s directors may become aware of investment and business opportunities that may be appropriate for presentation to the Company as well as the other entities with which they are affiliated. They may have conflicts of interest in determining to which entity a particular business opportunity should be presented.
As a result of multiple business affiliations, the Company’s non-management directors may have legal obligations relating to presenting opportunities to acquire one or more properties, portfolios or real estate-related debt investments to other entities. The Company’s non-management directors (including the Company’s non-executive Chairman) may present such opportunities to the other entities to which they owe pre-existing fiduciary duties before presenting such opportunities to the Company. In addition, conflicts of interest may arise when the Company’s board of directors evaluates a particular opportunity.
Capital markets and economic conditions can materially affect the Company’s financial condition, its results of operations and the value of its assets.
There are many factors that can affect the value of the Company’s assets, including the state of the capital markets and economy. The great recession negatively affected consumer spending and retail sales, which adversely impacted the performance and value of retail properties in most regions in the United States. In addition, loans backed by real estate were difficult to obtain and that difficulty, together with a tightening of lending policies, resulted in a significant contraction in the amount of debt available to fund retail properties. Although there has been improvement in the credit and real estate markets, any reduction in available financing may materially and adversely affect the Company’s ability to achieve its financial objectives. Concern about the stability of the markets generally may limit the Company’s ability and the ability of its tenants to timely refinance maturing liabilities and access the capital markets to meet liquidity needs. Although the Company will factor in these conditions in acquiring its assets, its long term success depends in part on general economic conditions and the stability and dependability of the financing market for retail real estate. If the national economy or the local economies in which the Company operates were to experience uncertainty, or if general economic conditions were to worsen, the Company’s income, cash flow, results of operations, financial condition, liquidity, the ability to service its debt obligations, the market price of its common stock and its ability to pay dividends and other distributions to its stockholders could be materially and adversely affected.
Bankruptcy or insolvency of tenants may decrease the Company’s revenues and available cash.
In the case of many retail properties, the bankruptcy or insolvency of a major tenant could cause the Company to suffer lower revenues and operational difficulties, and could allow other tenants to exercise so-called “kick-out” clauses in their leases and terminate their lease or reduce their rents prior to the normal expiration of their lease terms. As a result, the bankruptcy or insolvency of major tenants could materially and adversely affect the Company’s income, cash flow, results of operations, financial condition, liquidity, the ability to service its debt obligations, the market price of its common stock and its ability to pay dividends and other distributions to its stockholders.
11
Inflation or deflation may materially and adversely affect the Company’s income, cash flow, results of operations, financial condition, liquidity, the ability to service its debt obligations, the market price of its common stock and its ability to pay dividends and distributions to its stockholders.
Increased inflation could have a pronounced negative impact on the Company’s property operating expenses and general and administrative expenses, as these costs could increase at a rate higher than the Company’s rents. Inflation could also have an adverse effect on consumer spending which could impact the Company’s tenants’ sales and, in turn, the Company’s percentage rents, where applicable, and the willingness and ability of tenants to enter into or renew leases and/or honor their obligations under existing leases. Conversely, deflation could lead to downward pressure on rents and other sources of income.
Compliance or failure to comply with safety regulations and requirements could result in substantial costs.
The Company’s properties are subject to various federal, state and local regulatory requirements, such as state and local fire and life safety requirements. If the Company fails to comply with these requirements, it could incur fines or private damage awards. The Company does not know whether compliance with the requirements will require significant unanticipated expenditures that could affect its income, cash flow, results of operations, financial condition, liquidity, prospects and ability to service its debt obligations, the market price of its common stock and its ability to pay dividends and other distributions to its stockholders.
The Company expects to acquire additional properties and this may create risks.
The Company expects to acquire additional properties consistent with its investment strategies. The Company may not, however, succeed in consummating desired acquisitions on time, within budget or at all. In addition, the Company may face competition in pursuing acquisition opportunities, which could result in increased acquisition costs. When the Company does pursue a project or acquisition, it may not succeed in leasing newly acquired properties at rents sufficient to cover its costs of acquisition. Difficulties in integrating acquisitions may prove costly or time-consuming and could result in poorer than anticipated performance. The Company may also abandon acquisition opportunities that it has begun pursuing and consequently fail to recover expenses already incurred. Furthermore, acquisitions of new properties will expose the Company to the liabilities of those properties, including, for example, liabilities for clean-up of disclosed or undisclosed environmental contamination, claims by persons in respect of events transpiring or conditions existing before the Company’s acquisition and claims for indemnification by general partners, directors, officers and others indemnified by the former owners of properties.
Factors affecting the general retail environment could adversely affect the financial condition of the Company’s retail tenants and the willingness of retailers to lease space in its shopping centers, and in turn, materially and adversely affect the Company.
The Company’s properties are focused on the retail real estate market. This means that the performance of the Company’s properties will be impacted by general retail market conditions, including the level of consumer spending and consumer confidence, the threat of terrorism and increasing competition from online retail websites and catalog companies. These conditions could adversely affect the financial condition of the Company’s retail tenants and the willingness and ability of retailers to lease space, or renew existing leases, in the Company’s shopping centers and to honor their obligations under existing leases, and in turn, materially and adversely affect the Company.
The Company’s growth depends on external sources of capital, which may not be available in the future.
In order to maintain its qualification as a REIT, the Company is required under the Code to annually distribute at least 90% of its REIT taxable income, determined without regard to the dividends paid deduction and excluding any net capital gain. After the Company invests its cash on hand, it expects to depend primarily on the credit facility and other external financing (including debt and equity financings) to fund the growth of its business. The Company’s access to debt or equity financing depends on the willingness of third parties to lend or make equity investments and on conditions in the capital markets generally. As a result of changing economic conditions, the Company may be limited in its ability to obtain additional financing or to refinance existing debt maturities on favorable terms or at all and there can be no assurances as to when financing conditions will improve.
The Company does not have a formal policy limiting the amount of debt it may incur and its board of directors may change its leverage policy without stockholder consent, which could result in a different risk profile.
Although the Company’s charter and bylaws do not limit the amount of indebtedness the Company can incur, the Company’s policy is to employ prudent amounts of leverage and use debt as a means of providing additional funds for the acquisition of its assets and the diversification of its portfolio. The amount of leverage the Company will deploy for particular investments will depend upon its management team’s assessment of a variety of factors, which may include the anticipated liquidity and price volatility of the assets in its portfolio, the potential for losses, the availability and cost of financing the assets, the Company’s
12
opinion of the creditworthiness of its financing counterparties, the health of the U.S. economy and commercial mortgage markets, the Company’s outlook for the level, slope and volatility of interest rates, the credit quality of the tenants occupying space at the Company’s properties, and the need for the Company to comply with financial covenants contained in the Company’s credit agreements. The Company’s board of directors may change its leverage policies at any time without the consent of its stockholders, which could result in an investment portfolio with a different risk profile.
The Company could be adversely affected if it or any of its subsidiaries are required to register as an investment company under the Investment Company Act of 1940 as amended (the “1940 Act”).
The Company conducts its operations so that neither it, nor the Operating Partnership nor any of the Company’s other subsidiaries, is required to register as investment companies under the 1940 Act. If the Company, the Operating Partnership or the Company’s other subsidiaries are required to register as an investment company but fail to do so, the unregistered entity would be prohibited from engaging in certain business, and criminal and civil actions could be brought against such entity. In addition, the contracts of such entity would be unenforceable unless a court required enforcement, and a court could appoint a receiver to take control of the entity and liquidate its business.
Real estate investments’ value and income fluctuate due to conditions in the general economy and the real estate business, which may materially and adversely affect the Company’s ability to service its debt and expenses.
The value of real estate fluctuates depending on conditions in the general and local economy and the real estate business. These conditions may also limit the Company’s revenues and available cash. The rents the Company receives and the occupancy levels at its properties may decline as a result of adverse changes in conditions in the general economy and the real estate business. If rental revenues and/or occupancy levels decline, the Company generally would expect to have less cash available to pay indebtedness and for distribution to its stockholders. In addition, some of the Company’s major expenses, including mortgage payments, real estate taxes and maintenance costs, generally do not decline when the related rents decline.
The lack of liquidity of the Company’s assets could materially and adversely affect the Company’s income, cash flow, results of operations, financial condition, liquidity, the ability to service its debt obligations, the market price of its common stock and its ability to pay dividends and other distributions to its stockholders, and could materially and adversely affect the Company’s ability to value and sell its assets.
Real estate investments are relatively difficult to buy and sell quickly. As a result, the Company expects many of its investments will be illiquid and if it is required to liquidate all or a portion of its portfolio quickly, it may realize significantly less than the value at which it had previously recorded its investments.
The Company depends on leasing space to tenants on economically favorable terms and collecting rent from tenants, some of whom may not be able to pay.
The Company’s financial results depend significantly on leasing space in its properties to tenants on economically favorable terms. In addition, as a substantial majority of the Company’s revenue comes from renting real property, the Company’s income, cash flow, results of operations, financial condition, liquidity, the ability to service its debt obligations, the market price of its common stock and its ability to pay dividends and other distributions to its stockholders could be materially and adversely affected if a significant number of its tenants cannot pay their rent or if the Company is not able to maintain occupancy levels on favorable terms. If a tenant does not pay its rent, the Company may not be able to enforce its rights as landlord without delays and may incur substantial legal costs.
Some of the Company’s properties depend on anchor stores or major tenants to attract shoppers and could be materially and adversely affected by the loss of or a store closure by one or more of these tenants.
The Company’s shopping centers are primarily anchored by national and regional supermarkets and drug stores. The value of the retail properties the Company acquires could be materially and adversely affected if these tenants fail to comply with their contractual obligations, seek concessions in order to continue operations or cease their operations. Adverse economic conditions may result in the closure of existing stores by tenants which may result in increased vacancies at the Company’s properties. Any periods of significant vacancies for the Company’s properties could materially and adversely impact the Company’s income, cash flow, results of operations, financial condition, liquidity, the ability to service its debt obligations, the market price of its common stock and its ability to pay dividends and other distributions to its stockholders.
13
Loss of revenues from major tenants could reduce the Company’s income, cash flow, results of operations, financial condition, liquidity, the ability to service its debt obligations, the market price of its common stock and its ability to pay dividends and other distributions to its stockholders.
The Company derives significant revenues from anchor tenants such as Albertson’s/Safeway Supermarkets, Kroger Supermarkets and Rite Aid Pharmacy. As of December 31, 2017, these tenants are the Company’s three largest tenants and accounted for 6.0%, 3.4% and 1.6%, respectively, of its annualized base rent on a pro-rata basis. The Company’s income, cash flow, results of operations, financial condition, liquidity, the ability to service its debt obligations, the market price of its common stock and its ability to pay dividends and other distributions to its stockholders could be materially and adversely affected by the loss of revenues in the event a major tenant becomes bankrupt or insolvent, experiences a downturn in its business, materially defaults on its leases, does not renew its leases as they expire, or renews at lower rental rates.
The Company’s inability to receive reimbursements of Common Area Maintenance (“CAM”) costs from tenants could adversely affect the Company’s cash flow.
CAM costs typically include allocable energy costs, repairs, maintenance and capital improvements to common areas, janitorial services, administrative, property and liability insurance costs and security costs. The Company may acquire properties with leases with variable CAM provisions that adjust to reflect inflationary increases or leases with a fixed CAM payment methodology which fixes its tenants’ CAM contributions. With respect to both variable and fixed payment methodologies, the amount of reimbursements for CAM costs that the Company is entitled to receive from its tenants pursuant to the terms of the respective lease agreements may be less than the actual CAM costs at the Company’s properties. The Company’s inability to recover or pass on CAM costs to its tenants, whether due to the terms of the Company’s leases or vacancies at the Company’s properties could adversely affect the Company’s cash flow.
The Company may incur costs to comply with environmental laws.
The Company’s operations and properties are subject to various federal, state and local laws and regulations concerning the protection of the environment, including air and water quality, hazardous or toxic substances and health and safety. Under some environmental laws, a current or previous owner or operator of real estate may be required to investigate and clean up hazardous or toxic substances released at a property. The owner or operator may also be held liable to a governmental entity or to third parties for property damage or personal injuries and for investigation and clean-up costs incurred by those parties because of the contamination. These laws often impose liability without regard to whether the owner or operator knew of the release of the substances or caused the release. The presence of contamination or the failure to remediate contamination may impair the Company’s ability to sell or lease real estate or to borrow using the real estate as collateral. Other laws and regulations govern indoor and outdoor air quality including those that can require the abatement or removal of asbestos-containing materials in the event of damage, demolition, renovation or remodeling and also govern emissions of and exposure to asbestos fibers in the air. The maintenance and removal of lead paint and certain electrical equipment containing polychlorinated biphenyls (“PCBs”) and underground storage tanks are also regulated by federal and state laws. The Company is also subject to risks associated with human exposure to chemical or biological contaminants such as molds, pollens, viruses and bacteria which, above certain levels, can be alleged to be connected to allergic or other health effects and symptoms in susceptible individuals. The Company could incur fines for environmental compliance and be held liable for the costs of remedial action with respect to the foregoing regulated substances or tanks or related claims arising out of environmental contamination or human exposure to contamination at or from its properties. Identification of compliance concerns or undiscovered areas of contamination, changes in the extent or known scope of contamination, discovery of additional sites, human exposure to the contamination or changes in cleanup or compliance requirements could result in significant costs to the Company. Moreover, compliance with new laws or regulations such as those related to climate change, including compliance with “green” building codes, or more stringent laws or regulations or stricter interpretations of existing laws may require material expenditures by the Company.
The Company faces risks associated with security breaches through cyber attacks, cyber intrusions or otherwise, as well as other significant disruptions of its information technology (“IT”) networks and related systems.
The Company faces risks associated with security breaches, whether through cyber attacks or cyber intrusions over the Internet, malware, computer viruses, attachments to e-mails, persons inside the Company or persons with access to systems inside the Company, and other significant disruptions of the Company’s IT networks and related systems. The risk of a security breach or disruption, particularly through cyber attack or cyber intrusion, including by computer hackers, foreign governments and cyber terrorists, has generally increased as the number, intensity and sophistication of attempted attacks and intrusions from around the world have increased. The Company’s IT networks and related systems are essential to the operation of its business and its ability to perform day-to-day operations (including managing its building systems). There can be no assurance that the Company’s efforts to maintain the security and integrity of these types of IT networks and related systems will be effective or that attempted security
14
breaches or disruptions would not be successful or damaging. A security breach or other significant disruption involving the Company’s IT networks and related systems could materially and adversely impact the Company’s income, cash flow, results of operations, financial condition, liquidity, the ability to service its debt obligations, the market price of its common stock and its ability to pay dividends and other distributions to its stockholders.
Our business and operations would suffer in the event of system failures.
Despite system redundancy, the implementation of security measures and the existence of a disaster recovery plan for our internal information technology systems, our systems are vulnerable to damage from any number of sources, including computer viruses, unauthorized access, energy blackouts, natural disasters, terrorism, war and telecommunication failures. Any system failure or accident that causes interruptions in our operations could result in a material disruption to our business. We may also incur additional costs to remedy damages caused by such disruptions.
A prolonged economic slowdown, a lengthy or severe recession or declining real estate values could impair the Company’s assets and have a material and adverse effect on its income, cash flow, results of operations, financial condition, liquidity, the ability to service its debt obligations, the market price of its common stock and its ability to pay dividends and other distributions to its stockholders.
The Company believes the risks associated with its business will be more severe during periods of economic slowdown or recession if these periods are accompanied by declining real estate values. Declines in real estate values, among other factors, could result in a determination that the Company’s assets have been impaired. If the Company determines that an impairment has occurred, the Company would be required to make an adjustment to the net carrying value of the asset which could have an adverse effect on its results of operations in the period in which the impairment charge is recorded. Although the Company will take current economic conditions into account in acquiring its assets, the Company’s long term success, and the value of its assets, depends in part on general economic conditions and other factors beyond the Company’s control. If the national economy or the local economies in which the Company operates experience uncertainty, or if general economic conditions were to worsen, the value of the Company’s properties could decline, and the Company’s income, cash flow, results of operations, financial condition, liquidity, the ability to service its debt obligations, the market price of its common stock and its ability to pay dividends and other distributions to its stockholders, could be materially and adversely affected.
Loss of key personnel could harm the Company’s operations.
The Company is dependent on the efforts of certain key personnel of its senior management team. While the Company has employment contracts with each of Messrs. Tanz, Haines and Schoebel, the loss of the services of any of these individuals could harm the Company’s operations and have a material and adverse effect on its income, cash flow, results of operations, financial condition, liquidity, the ability to service its debt obligations, the market price of its common stock and its ability to pay dividends and other distributions to its stockholders.
Under their employment agreements, certain members of the Company’s senior management team will have certain rights to terminate their employment and receive severance in connection with a change in control of the Company.
The Company’s employment agreements with each of Messrs. Tanz, Haines and Schoebel, which provide that, upon termination of his employment (i) by the applicable officer within 12 months following the occurrence of a change in control (as defined in the employment agreement), (ii) by the Company without cause (as defined in the employment agreement), (iii) by the applicable officer for good reason (as defined in the employment agreement), (iv) by non-renewal of the applicable officer’s employment agreement or (v) by reason of the applicable officer’s death or disability (as defined in the employment agreement), such executive officers would be entitled to certain termination or severance payments made by the Company (which may include a lump sum payment equal to defined percentages of annual salary and prior years’ average bonuses, paid in accordance with the terms and conditions of the respective agreement). In addition, the vesting of all his outstanding unvested equity-based incentives and awards would accelerate. These provisions make it costly to terminate their employment and could delay or prevent a transaction or a change in control of the Company that might involve a premium paid for shares of its common stock or otherwise be in the best interests of its stockholders.
Joint venture investments could be materially and adversely affected by the Company’s lack of sole decision-making authority or reliance on a joint venture partner’s financial condition.
The Company may enter into joint venture arrangements in the future. Investments in joint ventures involve risks that are not otherwise present with properties which the Company owns entirely. In a joint venture investment, the Company may not have exclusive control or sole decision-making authority over the development, financing, leasing, management and other aspects of
15
these investments. As a result, the joint venture partner might have economic or business interests or goals that are inconsistent with the Company’s goals or interests, take action contrary to the Company’s interests or otherwise impede the Company’s objectives. Joint venture investments involve risks and uncertainties, including the risk of the joint venture partner failing to provide capital and fulfill its obligations, which may result in certain liabilities to the Company for guarantees and other commitments, the risk of conflicts arising between the Company and its partners and the difficulty of managing and resolving such conflicts, and the difficulty of managing or otherwise monitoring such business arrangements. The joint venture partner also might become insolvent or bankrupt, which may result in significant losses to the Company. Further, although the Company may own a controlling interest in a joint venture and may have authority over major decisions such as the sale or refinancing of investment properties, the Company may have fiduciary duties to the joint venture partners or the joint venture itself that may cause, or require, it to take or refrain from taking actions that it would otherwise take if it owned the investment properties outright.
Uninsured losses or a loss in excess of insured limits could materially and adversely affect the Company.
The Company carries comprehensive general liability, fire, extended coverage, loss of rent insurance, and environmental liability where applicable on its properties, with policy specifications and insured limits customarily carried for similar properties. There are certain types of losses, such as losses resulting from wars or acts of God that generally are not insured because they are either uninsurable or not economically insurable. Should an uninsured loss or a loss in excess of insured limits occur, the Company could lose capital invested in a property, as well as the anticipated future revenues from a property, while remaining obligated for any mortgage indebtedness, or other financial obligations or liabilities related to the property. Any loss of these types could materially and adversely affect the Company’s income, cash flow, results of operations, financial condition, liquidity, prospects and ability to service its debt obligations, the market price of its common stock and its ability to pay dividends and other distributions to its stockholders.
The Company could be materially and adversely affected by poor market conditions where its properties are geographically concentrated.
The Company’s performance depends on the economic conditions in markets in which its properties are concentrated. During the year ended December 31, 2017, the Company’s properties in California, Washington and Oregon accounted for 66%, 19% and 15%, respectively, of its consolidated property operating income. The Company’s income, cash flow, results of operations, financial condition, liquidity, the ability to service its debt obligations, the market price of its common stock and its ability to pay dividends and other distributions to its stockholders could be materially and adversely affected by this geographic concentration if market conditions, such as an oversupply of space or a reduction in demand for real estate in an area, deteriorate in California, Washington and Oregon. Moreover, due to the geographic concentration of its properties, the Company may be disproportionately affected by general risks such as natural disasters, including major fires, floods and earthquakes, severe or inclement weather, and acts of terrorism should such developments occur in or near the markets in California, Washington and Oregon in which the Company’s properties are located.
Should the Company decide at some point in the future to expand into new markets, it may not be successful, which could materially and adversely affect its business, financial condition, liquidity and results of operations.
The Company’s properties are concentrated in California, Washington and Oregon. If the opportunity arises, the Company may explore acquisitions of properties in new markets inside or outside of these states. Each of the risks applicable to the Company’s ability to successfully acquire, integrate and operate properties in its current markets may also apply to its ability to successfully acquire, integrate and operate properties in new markets. In addition to these risks, the Company’s management team may not possess the same level of knowledge with respect to market dynamics and conditions of any new market in which the Company may attempt to expand, which could materially and adversely affect its ability to operate in any such markets. The Company may be unable to obtain the desired returns on its investments in these new markets, which could materially and adversely affect the Company’s income, cash flow, results of operations, financial condition, liquidity, prospects and ability to service its debt obligations, the market price of its common stock and its ability to pay dividends and other distributions to its stockholders.
Risks Related to Financing
The Company’s term loan, credit facility and unsecured senior notes contain restrictive covenants relating to its operations, which could limit the Company’s ability to respond to changing market conditions and its ability to pay dividends and other distributions to its stockholders.
The Company’s term loan, credit facility and unsecured senior notes contain restrictive covenants. These or other limitations, including those that may apply to future Company borrowings, may materially and adversely affect the Company’s flexibility and
16
its ability to achieve its operating plans and could result in the Company being limited in the amount of dividends and distributions it would be permitted to pay to its stockholders.
In addition, failure to comply with these covenants could cause a default under the applicable debt instrument, and the Company may then be required to repay such debt with capital from other sources. Under those circumstances, other sources of capital may not be available to the Company, or may be available only on unattractive terms.
Certain of the Company’s mortgage financing arrangements and other indebtedness contain provisions that could limit the Company’s operating flexibility.
The Company’s existing mortgage financing contains, and future mortgage financing may in the future contain, customary covenants and provisions that limit the Company’s ability to pre-pay such mortgages before their scheduled maturity date or to transfer the underlying asset. Additionally, the Company’s ability to satisfy prospective mortgage lenders’ insurance requirements may be materially and adversely affected if lenders generally insist upon greater insurance coverage against certain risks than is available to the Company in the marketplace or on commercially reasonable terms. In addition, because a mortgage is secured by a lien on the underlying real property, mortgage defaults subject the Company to the risk of losing the property through foreclosure.
The Company’s access to financing may be limited and thus its ability to potentially enhance its returns may be materially and adversely affected.
The Company intends, when appropriate, to employ prudent amounts of leverage and use debt as a means of providing additional funds for the acquisition of its assets and the diversification of its portfolio. As of December 31, 2017, the Company’s outstanding principal mortgage indebtedness was approximately $106.3 million, and the Company may incur significant additional debt to finance future acquisition and development activities. The credit facility consists of a $600.0 million unsecured revolving credit facility and the Company has a $300.0 million term loan, of which $143.5 million and $300.0 million, respectively, were outstanding as of December 31, 2017.
In addition, the Operating Partnership issued $250.0 million aggregate principal amount of unsecured senior notes in December 2017 (the “Senior Notes Due 2027”), $200.0 million aggregate principal amount of unsecured senior notes in September 2016 (the “Senior Notes Due 2026”), $250.0 million aggregate principal amount of unsecured senior notes in December 2014 (the “Senior Notes Due 2024”) and $250.0 million aggregate principal amount of unsecured senior notes in December 2013 (the “Senior Notes Due 2023” and collectively with the Senior Notes Due 2024, the Senior Notes Due 2026 and the Senior Notes Due 2027, the “unsecured senior notes”), each of which were fully and unconditionally guaranteed by ROIC.
The Company’s access to financing will depend upon a number of factors, over which it has little or no control, including:
• | general market conditions; |
• | the market’s view of the quality of the Company’s assets; |
• | the market’s perception of the Company’s growth potential; |
• | the Company’s eligibility to participate in and access capital from programs established by the U.S. government; |
• | the Company’s current and potential future earnings and cash distributions; and |
• | the market price of the shares of the Company’s common stock. |
Although the credit markets and real estate have recovered from the great recession, any reduction in available financing may materially and adversely affect the Company’s ability to achieve its financial objectives. Concern about the stability of the markets generally could adversely affect one or more private lenders and could cause one or more private lenders to be unwilling or unable to provide the Company with financing or to increase the costs of that financing. In addition, if regulatory capital requirements imposed on the Company’s private lenders change, they may be required to limit, or increase the cost of, financing they provide to the Company. In general, this could potentially increase the Company’s financing costs and reduce its liquidity or require it to sell assets at an inopportune time or price.
During times when interest rates on mortgage loans are high or financing is otherwise unavailable on a timely basis, the Company may purchase certain properties for cash or equity securities, including OP Units, or a combination thereof. Consequently,
17
depending on market conditions at the relevant time, the Company may have to rely more heavily on additional equity issuances, which may be dilutive to its stockholders, or on less efficient forms of debt financing that require a larger portion of its cash flow from operations, thereby reducing funds available for its operations, future business opportunities, cash distributions to its stockholders and other purposes. The Company cannot assure you that it will have access to such equity or debt capital on favorable terms (including, without limitation, cost and term) at the desired times, or at all, which may cause it to curtail its asset acquisition activities and/or dispose of assets, which could materially and adversely affect its income, cash flow, results of operations, financial condition, liquidity, the ability to service its debt obligations, the market price of its common stock and its ability to pay dividends and other distributions to its stockholders.
Increases in interest rates could increase the amount of the Company’s debt payments and materially and adversely affect its business, financial condition, liquidity and results of operations.
Interest the Company pays could reduce cash available for distributions. As of December 31, 2017, the Company had approximately $143.5 million and $300.0 million outstanding under the Company’s $600.0 million unsecured revolving credit facility and $300.0 million term loan, respectively, that bear interest at a variable rate. In addition, the Company may incur variable rate debt in the future, including mortgage debt, borrowings under the credit facility or new credit facilities. An increase in interest rates would increase the Company’s interest costs, which could adversely affect the Company’s cash flow, results of operations, ability to pay principal and interest on debt and pay dividends and other distributions to its stockholders, and reduce the Company’s access to capital markets. In addition, if the Company needs to repay existing debt during periods of rising interest rates, it may be required to incur additional indebtedness at higher rates. From time to time, the Company may enter into interest rate swap agreements and other interest rate hedging contracts with the intention of lessening the impact of rising interest rates. However, increased interest rates may increase the risk that the counterparties to such agreements may not be able to fulfill their obligations under these agreements, and there can be no assurance that these arrangements will be effective in reducing the Company’s exposure to interest rate changes. These risks could materially and adversely affect the Company’s cash flow, results of operations, financial condition, liquidity, the ability to service its debt obligations, the market price of its common stock and its ability to pay dividends and other distributions to its stockholders.
Financing arrangements that the Company may use to finance its assets may require it to provide additional collateral or pay down debt.
The Company, when appropriate, uses traditional forms of financing including secured debt. In the event the Company utilizes such financing arrangements, they would involve the risk that the market value of its assets which are secured may decline in value, in which case the lender may, in connection with a refinancing, require it to provide additional collateral, provide additional equity, or to repay all or a portion of the funds advanced. The Company may not have the funds available to repay its debt or provide additional equity at that time, which would likely result in defaults unless it is able to raise the funds from alternative sources, which it may not be able to achieve on favorable terms or at all. Providing additional collateral or equity would reduce the Company’s liquidity and limit its ability to leverage its assets. If the Company cannot meet these requirements, the lender could accelerate the Company’s indebtedness, increase the interest rate on advanced funds and terminate its ability to borrow funds from them, which could materially and adversely affect the Company’s income, cash flow, results of operations, financial condition, liquidity, the ability to service its debt obligations, the market price of its common stock and its ability to pay dividends and other distributions to its stockholders. The providers of secured debt may also require the Company to maintain a certain amount of cash or set aside assets sufficient to maintain a specified liquidity position. As a result, the Company may not be able to leverage its assets as fully as it would choose which could reduce its return on assets. There can be no assurance that the Company will be able to utilize such arrangements on favorable terms, or at all.
A downgrade in the Company’s or the Operating Partnership’s credit ratings could materially adversely affect the Company’s business and financial condition.
The credit ratings assigned to the Company’s obligations or to the debt securities of the Operating Partnership could change based upon, among other things, the Company’s and the Operating Partnership’s results of operations and financial condition. These ratings are subject to ongoing evaluation by credit rating agencies, and there can be no assurance that any rating will not be changed or withdrawn by a rating agency in the future if, in its judgment, circumstances warrant. Moreover, these credit ratings do not apply to the Company’s common stock and are not recommendations to buy, sell or hold any other securities. If any of the credit rating agencies that have rated the obligations of the Company or the debt securities of the Operating Partnership downgrades or lowers its credit ratings, or if any credit rating agency indicates that it has placed any such rating on a so-called “watch list” for a possible downgrading or lowering or otherwise indicates that its outlook for that rating is negative, it could have a material adverse effect on the Company’s costs and availability of capital, which could in turn materially and adversely impact the Company’s income, cash flow, results of operations, financial condition, liquidity, the ability to service its debt obligations, the market price of its common stock and its ability to pay dividends and other distributions to its stockholders.
18
Risks Related to the Company’s Organization and Structure
The Company depends on dividends and distributions from its direct and indirect subsidiaries. The creditors and any preferred equity holders of these subsidiaries are entitled to amounts payable to them by the subsidiaries before the subsidiaries may pay any dividends or distributions to the Company.
Substantially all of the Company’s assets are held through the Operating Partnership, which holds substantially all of the Company’s properties and assets through subsidiaries. The Operating Partnership’s cash flow is dependent on cash distributions to it by its subsidiaries, and in turn, substantially all of the Company’s cash flow is dependent on cash distributions to it by the Operating Partnership. The creditors and any preferred equity holders of the Company’s direct and indirect subsidiaries are entitled to payment of that subsidiary’s obligations to them, when due and payable, before distributions may be made by that subsidiary to its common equity holders. Thus, the Operating Partnership’s ability to make distributions to the Company and therefore the Company’s ability to make distributions to its stockholders will depend on its subsidiaries’ ability first to satisfy their obligations to creditors and any preferred equity holders and then to make distributions to the Operating Partnership.
In addition, the Company’s participation in any distribution of the assets of any of its direct or indirect subsidiaries upon the liquidation, reorganization or insolvency, is only after the claims of the creditors, including the holders of the unsecured senior notes and trade creditors, and preferred equity holders are satisfied.
Certain provisions of Maryland law may limit the ability of a third party to acquire control of the Company.
Certain provisions of the Maryland General Corporation Law (the “MGCL”) may have the effect of delaying, deferring or preventing a transaction or a change in control of the Company that might involve a premium price for holders of the Company’s common stock or otherwise be in their best interests, including:
• | “business combination” provisions that, subject to certain limitations, prohibit certain business combinations between the Company and an “interested stockholder” (defined generally as any person who beneficially owns 10% or more of the voting power of the Company’s shares or an affiliate thereof) for five years after the most recent date on which the stockholder becomes an interested stockholder, and thereafter impose special minimum price provisions and special stockholder voting requirements on these combinations; and |
• | “control share” provisions that provide that “control shares” of the Company (defined as shares which, when aggregated with other shares controlled by the stockholder, entitle the stockholder to exercise one of three increasing ranges of voting power in electing directors) acquired in a “control share acquisition” (defined as the direct or indirect acquisition of ownership or control of “control shares”) have no voting rights except to the extent approved by the Company’s stockholders by the affirmative vote of at least two-thirds of all the votes entitled to be cast on the matter, excluding all interested shares. |
However, the provisions of the MGCL relating to business combinations do not apply to business combinations that are approved or exempted by the Company’s board of directors prior to the time that the interested stockholder becomes an interested stockholder. In addition, the Company’s bylaws contain a provision exempting from the control share acquisition statute any and all acquisitions by any person of shares of the Company’s common stock. There can be no assurance that such exemption will not be amended or eliminated at any time in the future.
Additionally, Title 3, Subtitle 8 of the MGCL permits the Company’s board of directors, without stockholder approval and regardless of what is currently provided in the Company’s charter or bylaws, to take certain actions that may have the effect of delaying, deferring or preventing a transaction or a change in control of the Company that might involve a premium to the market price of its common stock or otherwise be in the stockholders’ best interests. These provisions of the MGCL permit the Company, by provision in its charter or bylaws or a resolution of its board of directors and notwithstanding any contrary provision in the charter or bylaws, to adopt:
• | a classified board; |
• | a two-thirds vote requirement for removing a director; |
• | a requirement that the number of directors be fixed only by vote of the board of directors; |
• | a requirement that a vacancy on the board be filled only by the remaining directors in office and (if the board is classified) for the remainder of the full term of the class of directors in which the vacancy occurred; and |
19
• | a majority requirement for the calling of a stockholder-requested special meeting of stockholders. |
The authorized but unissued shares of preferred stock and the ownership limitations contained in the Company’s Charter may prevent a change in control.
The Company’s charter authorizes the Company to issue authorized but unissued shares of preferred stock. In addition, the Company’s charter provides that the Company’s board of directors has the power, without stockholder approval, to authorize the Company to issue any authorized but unissued shares of stock, to classify any unissued shares of preferred stock and to reclassify any unissued shares of common stock or previously-classified shares of preferred stock into other classes or series of stock. As a result, the Company’s board of directors may establish a series of shares of preferred stock or use such preferred stock to create a stockholder’s rights plan or so-called “poison pill” that could delay or prevent a transaction or a change in control that might involve a premium price for shares of the Company’s common stock or otherwise be in the best interests of the Company’s stockholders.
In addition, the Company’s charter contains restrictions limiting the ownership and transfer of shares of the Company’s common stock and other outstanding shares of capital stock. The relevant sections of the Company’s charter provide that, subject to certain exceptions, ownership of shares of the Company’s common stock by any person is limited to 9.8% by value or by number of shares, whichever is more restrictive, of the outstanding shares of common stock (the common share ownership limit), and no more than 9.8% by value or number of shares, whichever is more restrictive, of the outstanding capital stock (the aggregate share ownership limit). The common share ownership limit and the aggregate share ownership limit are collectively referred to herein as the “ownership limits.” These provisions will restrict the ability of persons to purchase shares in excess of the relevant ownership limits. The Company’s board of directors has established exemptions from this ownership limit which permit certain institutional investors to hold additional shares of the Company’s common stock. The Company’s board of directors may in the future, in its sole discretion, establish additional exemptions from this ownership limit.
The Company’s failure to qualify as a REIT would subject it to U.S. federal income tax and potentially increased state and local taxes, which would reduce the amount of cash available for distribution to its stockholders.
The Company intends to operate in a manner that will enable it to continue to qualify as a REIT for U.S. federal income tax purposes. The Company has not requested and does not intend to request a ruling from the U.S. Internal Revenue Service that it will continue to qualify as a REIT. The U.S. federal income tax laws governing REITs are complex. The complexity of these provisions and of the applicable U.S. Treasury Department regulations that have been promulgated under the Code (“Treasury Regulations”) is greater in the case of a REIT that holds assets through a partnership, such as the Company, and judicial and administrative interpretations of the U.S. federal income tax laws governing REIT qualification are limited. To qualify as a REIT, the Company must meet, on an ongoing basis, various tests regarding the nature of its assets and its income, the ownership of its outstanding shares, and the amount of its distributions. Moreover, new legislation, court decisions or administrative guidance, in each case possibly with retroactive effect, may make it more difficult or impossible for the Company to qualify as a REIT. Thus, while the Company believes that it has operated and intends to continue to operate so that it will qualify as a REIT, given the highly complex nature of the rules governing REITs, the ongoing importance of factual determinations, and the possibility of future changes in the Company’s circumstances, no assurance can be given that it has qualified or will continue to so qualify for any particular year.
If the Company fails to qualify as a REIT in any taxable year, and does not qualify for certain statutory relief provisions, it would be required to pay U.S. federal income tax on its taxable income, and distributions to its stockholders would not be deductible by it in determining its taxable income. In such a case, the Company might need to borrow money or sell assets in order to pay its taxes. The Company’s payment of income tax would decrease the amount of its income available for distribution to its stockholders. Furthermore, if the Company fails to maintain its qualification as a REIT, it would no longer be required to distribute substantially all of its net taxable income to its stockholders. In addition, unless the Company were eligible for certain statutory relief provisions, it would not be eligible to re-elect to qualify as a REIT for four taxable years following the year in which it failed to qualify as a REIT.
Failure to make required distributions would subject the Company to tax, which would reduce the cash available for distribution to its stockholders.
In order to qualify as a REIT, the Company must distribute to its stockholders each calendar year at least 90% of its REIT taxable income, determined without regard to the deduction for dividends paid and excluding net capital gain. To the extent that the Company satisfies the 90% distribution requirement, but distributes less than 100% of its taxable income, it is subject to U.S. federal corporate income tax on its undistributed income. In addition, the Company will incur a 4% non-deductible excise tax on
20
the amount, if any, by which its distributions in any calendar year are less than a minimum amount specified under U.S. federal income tax laws. The Company intends to distribute its net income to its stockholders in a manner intended to satisfy the REIT 90% distribution requirement and to avoid the 4% non-deductible excise tax.
The Company’s taxable income may exceed its net income as determined by the U.S. generally accepted accounting principles (“GAAP”) because, for example, realized capital losses will be deducted in determining its GAAP net income, but may not be deductible in computing its taxable income. In addition, the Company may invest in assets that generate taxable income in excess of economic income or in advance of the corresponding cash flow from the assets. For example, the Company may be required to accrue interest income on mortgage loans or other types of debt securities or interests in debt securities before it receives any payments of interest or principal on such assets. Similarly, some of the debt securities that the Company acquires may have been issued with original issue discount. The Company will generally be required to include such original issue discount in income based on a constant yield to maturity method. As a result of the foregoing, the Company may generate less cash flow than taxable income in a particular year. To the extent that the Company generates such non-cash taxable income in a taxable year, it may incur corporate income tax and the 4% non-deductible excise tax on that income if it does not distribute such income to stockholders in that year. In that event, the Company may be required to use cash reserves, incur debt or liquidate assets at rates or times that it regards as unfavorable or make a taxable distribution of its shares in order to satisfy the REIT 90% distribution requirement and to avoid U.S. federal corporate income tax and the 4% non-deductible excise tax in that year.
In order to qualify as a REIT, prior to the end of each taxable year, the Company is required to distribute any earnings and profits of any corporation acquired by the Company in certain tax-deferred transactions to the extent that such earnings accrued at a time when such corporation did not qualify as a REIT. The Company has entered into certain transactions involving the tax-deferred acquisition of target corporations. The Company believes that it did not inherit any earnings and profits of such target corporations attributable to any period that such corporations did not qualify as a REIT. However, no assurance can be provided in this regard, and if the Company were determined to have inherited and retained any such earnings and profits, the Company’s qualification as a REIT could be adversely impacted.
To maintain its REIT qualification, the Company may be forced to borrow funds during unfavorable market conditions.
In order to qualify as a REIT and avoid the payment of income and excise taxes, the Company may need to borrow funds on a short-term basis, or possibly on a long-term basis, to meet the REIT distribution requirements even if the then prevailing market conditions are not favorable for these borrowings. These borrowing needs could result from, among other things, a difference in timing between the actual receipt of cash and inclusion of income for U.S. federal income tax purposes, the effect of non-deductible capital expenditures, the creation of reserves or required debt amortization payments.
Even if the Company qualifies as a REIT, it may be required to pay certain taxes.
Even if the Company qualifies for taxation as a REIT, it may be subject to certain U.S. federal, state and local taxes on its income and assets, including taxes on any undistributed income, taxes on income from some activities conducted as a result of a foreclosure and state or local income, franchise, property and transfer taxes, including mortgage recording taxes. In addition, the Company may hold some of its assets through taxable REIT subsidiary (“TRS”) corporations. Any TRSs or other taxable corporations in which the Company owns an interest will be subject to U.S. federal, state and local corporate taxes. Furthermore, the Company has entered into certain transactions in which the Company has acquired target entities in tax-deferred transactions. To the extent that such entities had outstanding U.S. federal income tax or other tax liabilities, the Company would succeed to such liabilities.
Payment of these taxes generally would decrease the cash available for distribution to the Company’s stockholders.
Dividends payable by REITs generally do not qualify for the reduced tax rates on dividend income from regular corporations, which could materially and adversely affect the value of the Company’s shares.
The maximum U.S. federal income tax rate for certain qualified dividends payable to U.S. stockholders that are individuals, trusts and estates is 20%. Dividends payable by REITs, however, are generally not eligible for these reduced qualified dividend rates. However, for taxable years beginning after December 31, 2017 and before January 1, 2026, under the newly enacted Tax Cust and Jobs Act (H.R. 1, the “TCJA”), noncorporate taxpayers may deduct up to 20% of certain qualified business income, including “qualified REIT dividends” (generally, dividends received by a REIT shareholder that are not designated as capital gain dividends or qualified dividend income), subject to certain limitations, resulting in an effective maximum U.S. federal income tax rate of 29.6% on such income. Although the reduced U.S. federal income tax rate applicable to qualified dividends from C corporations does not adversely affect the taxation of REITs or dividends paid by REITs, the more favorable rates applicable to regular corporate dividends, together with the recently reduced corporate tax rate (currently, 21%), could cause investors who are individuals, trusts and estates to perceive investments in REITs to be less attractive than investments in the stocks of non-REIT corporations that pay dividends, which could adversely affect the value of the shares of REITs, including the Company’s common stock.
21
Legislative, regulatory or administrative changes could adversely affect the Company.
The U.S. federal income tax laws and regulations governing REITs and their stockholders, as well as the administrative interpretations of those laws and regulations, are constantly under review and may be changed at any time, possibly with retroactive effect. No assurance can be given as to whether, when, or in what form, the U.S. federal income tax laws applicable to the Company and its stockholders may be enacted. Changes to the U.S. federal income tax laws and interpretations of U.S. federal tax laws could adversely affect an investment in the Company’s common stock.
The newly enacted TCJA, which was signed into law on December 22, 2017, significantly changes U.S. federal income tax laws applicable to businesses and their owners, including REITs and their stockholders, and may lessen the relative competitive advantage of operating as a REIT rather than as a C corporation. For additional discussion, see “Recent U.S. Federal Income Tax Legislation”.
In certain circumstances, the Company may be liable for certain tax obligations of certain limited partners.
In certain circumstances, the Company may be liable for certain tax obligations of certain limited partners. The Company has entered into tax protection agreements under which it has agreed to minimize the tax consequences to certain limited partners resulting from the sale or other disposition of certain of the Company’s assets. The obligation to indemnify such limited partners against adverse tax consequences is expected to continue until 2027. The Company may enter into additional tax protection agreements in the future, which could extend the period of time during which the Company may be liable for tax obligations of certain limited partners. During the period of these obligations, the Company’s flexibility to dispose of the related assets will be limited. In addition, the amount of any indemnification obligations may be significant.
The Company cannot assure you of its ability to pay distributions in the future.
The Company intends to pay quarterly distributions and to make distributions to its stockholders in an amount such that it distributes all or substantially all of its REIT taxable income in each year, subject to certain adjustments. The Company’s ability to pay distributions may be materially and adversely affected by a number of factors, including the risk factors described in this Annual Report on Form 10-K. All distributions will be made, subject to Maryland law (or Delaware law, in the case of distributions by the Operating Partnership), at the discretion of the Company’s board of directors and will depend on the Company’s earnings, its financial condition, any debt covenants, maintenance of its REIT qualification and other factors as its board of directors may deem relevant from time to time. The Company believes that a change in any one of the following factors could materially and adversely affect its income, cash flow, results of operations, financial condition, liquidity, the ability to service its debt obligations, the market price of its common stock and its ability to pay distributions to its stockholders:
• | the profitability of the assets acquired; |
• | the Company’s ability to make profitable acquisitions; |
• | unforeseen expenses that reduce the Company’s cash flow; |
• | defaults in the Company’s asset portfolio or decreases in the value of its portfolio; and |
• | the fact that anticipated operating expense levels may not prove accurate, as actual results may vary from estimates. |
The Company cannot assure you that it will achieve results that will allow it to make a specified level of cash distributions or year-to-year increases in cash distributions in the future. In addition, some of the Company’s distributions may include a return of capital.
Item 1B. Unresolved Staff Comments
None.
Item 2. Properties
The Company maintains its executive office at 8905 Towne Centre Drive, Suite 108, San Diego, CA 92122.
As of December 31, 2017, the Company’s portfolio consisted of 92 properties (91 retail and one office) totaling approximately 10.5 million square feet of gross leasable area which were approximately 97.1% leased. During the year ended December 31,
22
2017, the Company leased or renewed a total of approximately 1.4 million square feet in its portfolio. The Company has committed approximately $15.3 million, or $38.39 per square foot, in tenant improvements, including building and site improvements, for new leases that occurred during the year ended December 31, 2017. The Company has committed approximately $1.0 million, or $2.53 per square foot, in leasing commissions, for the new leases that occurred during the year ended December 31, 2017. Additionally, the Company has committed approximately $950,000, or $0.99 per square foot, in tenant improvements for renewed leases that occurred during the year ended December 31, 2017. Leasing commission commitments for renewed leases were not material for the year ended December 31, 2017.
The following table provides information regarding the Company’s properties as of December 31, 2017.
Property | Year Completed/ Renovated | Year Acquired | Gross Leasable Sq. Feet | Number of Tenants | % Leased | Principal Tenants | |||||||||
Southern California | |||||||||||||||
Los Angeles metro area | |||||||||||||||
Paramount Plaza | 1966/2010 | 2009 | 95,062 | 14 | 98.0 | % | Grocery Outlet Supermarket, 99¢ Only Stores, Rite Aid Pharmacy | ||||||||
Claremont Promenade | 1982/2011 | 2010 | 92,297 | 25 | 97.2 | % | Super King Supermarket | ||||||||
Gateway Village | 2003/2005 | 2010 | 96,959 | 28 | 96.2 | % | Sprouts Market | ||||||||
Seabridge Marketplace | 2006 | 2012 | 95,830 | 21 | 99.5 | % | Safeway (Vons) Supermarket | ||||||||
Glendora Shopping Center | 1992/2012 | 2012 | 106,535 | 20 | 95.8 | % | Albertson’s Supermarket | ||||||||
Redondo Beach Plaza | 1993/2004 | 2012 | 110,509 | 16 | 100.0 | % | Safeway (Vons) Supermarket, Petco | ||||||||
Diamond Bar Town Center | 1981 | 2013 | 100,342 | 23 | 100.0 | % | Walmart Neighborhood Market, Crunch Fitness | ||||||||
Diamond Hills Plaza | 1973/2008 | 2013 | 139,505 | 36 | 97.1 | % | H-Mart Supermarket, Rite Aid Pharmacy | ||||||||
Plaza de la Canada | 1968/2010 | 2013 | 100,408 | 11 | 95.9 | % | Gelson’s Supermarket, TJ Maxx, Rite Aid Pharmacy | ||||||||
Fallbrook Shopping Center | 1966/1986/ 2003/2015 | 2014 | 755,299 | 48 | 99.6 | % | Sprouts Market, Trader Joe’s, Kroger (Ralph’s) Supermarket (2), TJ Maxx | ||||||||
Moorpark Town Center | 1984/2014 | 2014 | 133,547 | 26 | 98.3 | % | Kroger (Ralph’s) Supermarket, CVS Pharmacy | ||||||||
Ontario Plaza | 1997-1999 | 2015 | 150,149 | 26 | 99.1 | % | El Super Supermarket, Rite Aid Pharmacy | ||||||||
Park Oaks Shopping Center | 1959/2005 | 2015 | 110,092 | 29 | 96.2 | % | Safeway (Vons) Supermarket, Dollar Tree | ||||||||
Warner Plaza | 1973-1974/ 2016-2017 | 2015 | 110,918 | 66 | 96.1 | % | Sprouts Market, Kroger (Ralph’s) Supermarket (2), Rite Aid Pharmacy (2) | ||||||||
Magnolia Shopping Center | 1962/1972/ 1987/2016 | 2016 | 116,360 | 24 | 91.5 | % | Kroger (Ralph’s) Supermarket | ||||||||
Casitas Plaza Shopping Center | 1972/1982 | 2016 | 97,407 | 24 | 98.6 | % | Albertson’s Supermarket, CVS Pharmacy | ||||||||
Bouquet Center | 1985 | 2016 | 148,903 | 27 | 97.8 | % | Safeway (Vons) Supermarket, CVS Pharmacy, Ross Dress For Less | ||||||||
North Ranch Shopping Center | 1977-1990 | 2016 | 146,625 | 30 | 90.0 | % | Kroger (Ralph’s) Supermarket, Trader Joe’s, Rite Aid Pharmacy, Petco | ||||||||
The Knolls | 2000/2016 | 2016 | 52,021 | 7 | 100.0 | % | Trader Joe’s, Pet Food Express | ||||||||
The Terraces | 1958/1970/ 1989 | 2017 | 172,922 | 25 | 90.8 | % | Trader Joe’s, Marshall’s, LA Fitness | ||||||||
Orange County metro area | |||||||||||||||
Santa Ana Downtown Plaza | 1987/2010 | 2010 | 105,536 | 27 | 94.1 | % | Kroger (Food 4 Less) Supermarket, Marshall’s | ||||||||
Sycamore Creek | 2008 | 2010 | 74,198 | 18 | 100.0 | % | Safeway (Vons) Supermarket, CVS Pharmacy (2) | ||||||||
Desert Springs Marketplace | 1993-94 / 2013 | 2011 | 113,718 | 19 | 96.3 | % | Kroger (Ralph’s) Supermarket, Rite Aid Pharmacy | ||||||||
Cypress Center West | 1970/1978 / 2014 | 2012 | 107,246 | 30 | 96.5 | % | Kroger (Ralph’s) Supermarket, Rite Aid Pharmacy | ||||||||
Harbor Place Center | 1994 | 2012 | 119,821 | 10 | 100.0 | % | AA Supermarket, Ross Dress For Less | ||||||||
Five Points Plaza | 1961-62 / 2012 / 2015 | 2013 | 160,536 | 38 | 99.7 | % | Trader Joe’s, Pier 1 | ||||||||
Peninsula Marketplace | 2000 | 2013 | 95,416 | 15 | 100.0 | % | Kroger (Ralph’s) Supermarket, Planet Fitness | ||||||||
Mission Foothill Marketplace | 1996 | 2014 | 110,678 | 13 | 64.0 | % | Safeway (Vons) Supermarket (1), CVS Pharmacy | ||||||||
23
Fullerton Crossroads | 1977/1997/ 2010-2011 | 2017 | 219,785 | 25 | 99.4 | % | Kroger (Ralph’s) Supermarket, Kohl’s, Jo-Ann Fabrics and Crafts | ||||||||
The Village at Nellie Gail Ranch | 1897 / 2014-2015 | 2017 | 88,486 | 25 | 98.5 | % | Smart & Final Extra Supermarket | ||||||||
San Diego metro area | |||||||||||||||
Marketplace Del Rio | 1990/ 2004 | 2011 | 177,195 | 43 | 88.4 | % | Stater Brothers Supermarket, Walgreens | ||||||||
Renaissance Towne Centre | 1991/2011 | 2011 | 53,074 | 29 | 100.0 | % | CVS Pharmacy | ||||||||
Euclid Plaza | 1982/2012 | 2012 | 77,044 | 9 | 96.8 | % | Vallarta Supermarket, Walgreens | ||||||||
Bay Plaza | 1986/2013 | 2012 | 73,324 | 28 | 97.9 | % | Seafood City Supermarket | ||||||||
Bernardo Heights Plaza | 1983/2006 | 2013 | 37,729 | 4 | 96.3 | % | Sprouts Market | ||||||||
Hawthorne Crossings | 1993/1999 | 2013 | 141,288 | 18 | 100.0 | % | Mitsuwa Supermarket, Ross Dress For Less, Staples | ||||||||
Creekside Plaza | 1993/2005 | 2014 | 128,852 | 26 | 98.9 | % | Stater Brothers Supermarket, AMC Theatres | ||||||||
Torrey Hills Corporate Center | 1998 | 2016 | 23,595 | 4 | 100.0 | % | Retail Opportunity Investments Corp. | ||||||||
Northern California | |||||||||||||||
San Francisco metro area | |||||||||||||||
Pleasant Hill Marketplace | 1980 | 2010 | 69,715 | 3 | 100.0 | % | Total Wine and More, Buy Buy Baby, Basset Furniture | ||||||||
Pinole Vista Shopping Center | 1981/2012 | 2011 | 223,369 | 28 | 96.9 | % | SaveMart (Lucky) Supermarket, Planet Fitness, Kmart | ||||||||
Country Club Gate Center | 1974/2012 | 2011 | 109,331 | 28 | 94.9 | % | SaveMart (Lucky) Supermarket, Rite Aid Pharmacy | ||||||||
Marlin Cove Shopping Center | 1972/2001 | 2012 | 73,943 | 24 | 95.5 | % | 99 Ranch Market | ||||||||
The Village at Novato | 2006 | 2012 | 20,081 | 4 | 100.0 | % | Trader Joe’s, Pharmaca Pharmacy | ||||||||
Santa Teresa Village | 1974-79 / 2013 | 2012 | 124,306 | 36 | 93.2 | % | Raleys (Nob Hill) Supermarket, Dollar Tree | ||||||||
Granada Shopping Center | 1962/1994 | 2013 | 69,325 | 15 | 100.0 | % | SaveMart (Lucky) Supermarket | ||||||||
Country Club Village | 1995 | 2013 | 111,093 | 23 | 99.0 | % | Walmart Neighborhood Market, CVS Pharmacy | ||||||||
North Park Plaza | 1997 | 2014 | 76,697 | 15 | 100.0 | % | H-Mart Supermarket | ||||||||
Winston Manor | 1977/1988/ 2011/2015 | 2015 | 49,852 | 14 | 100.0 | % | Grocery Outlet Supermarket | ||||||||
Jackson Square | 1972/1997 | 2015 | 114,220 | 16 | 100.0 | % | Safeway Supermarket, CVS Pharmacy, 24 Hour Fitness | ||||||||
Gateway Centre | 1996 | 2015 | 112,553 | 25 | 98.6 | % | SaveMart (Lucky) Supermarket, Walgreens | ||||||||
Iron Horse Plaza | 1998-1999 | 2015 | 61,860 | 10 | 96.3 | % | Lunardi’s Market | ||||||||
Monterey Center | 2007 | 2016 | 25,798 | 9 | 100.0 | % | Trader Joe’s, Pharmaca Pharmacy | ||||||||
Santa Rosa Southside Shopping Center | 1983-1984 | 2017 | 88,535 | 11 | 100.0 | % | REI, Cost Plus World Market | ||||||||
Monta Loma Plaza | 1973/ 2009-2010 | 2017 | 48,078 | 11 | 100.0 | % | Safeway Supermarket | ||||||||
Sacramento metro area | |||||||||||||||
Norwood Shopping Center | 1993/1999 | 2010 | 85,693 | 18 | 100.0 | % | Viva Supermarket, Rite Aid Pharmacy, Citi Trends | ||||||||
Mills Shopping Center | 1959/1996 | 2011 | 235,314 | 29 | 86.4 | % | Viva Supermarket, Ross Dress For Less (dd’s Discounts), Dollar Tree | ||||||||
Morada Ranch | 2006 | 2011 | 101,842 | 18 | 95.1 | % | Raleys Supermarket | ||||||||
Round Hill Square Shopping Center | 1998 | 2011 | 115,984 | 22 | 94.1 | % | Safeway Supermarket, Dollar Tree, US Postal Service | ||||||||
Green Valley Station | 2006/2007 | 2012 | 52,245 | 14 | 74.4 | % | CVS Pharmacy | ||||||||
Pacific Northwest | |||||||||||||||
Seattle Metropolitan | |||||||||||||||
Meridian Valley Plaza | 1978/2011 | 2010 | 51,597 | 15 | 96.9 | % | Kroger (QFC) Supermarket | ||||||||
The Market at Lake Stevens | 2000 | 2010 | 74,130 | 9 | 100.0 | % | Albertson’s (Haggen) Supermarket | ||||||||
Canyon Park Shopping Center | 1980/2012 | 2011 | 123,592 | 23 | 98.4 | % | PCC Community Markets, Rite Aid Pharmacy, Petco | ||||||||
Hawks Prairie Shopping Center | 1988/2012 | 2011 | 157,529 | 24 | 100.0 | % | Safeway Supermarket, Dollar Tree, Big Lots | ||||||||
The Kress Building | 1924/2005 | 2011 | 74,616 | 8 | 100.0 | % | IGA Supermarket, TJMaxx | ||||||||
Gateway Shopping Center | 2007 | 2012 | 104,298 | 18 | 90.4 | % | WinCo Foods (2), Rite Aid Pharmacy, Ross Dress For Less | ||||||||
24
Aurora Square | 1980 | 2012 | 38,030 | 4 | 100.0 | % | Central Supermarket | ||||||||
Canyon Crossing | 2008-2009 | 2013 | 120,508 | 26 | 96.3 | % | Safeway Supermarket | ||||||||
Crossroads Shopping Center | 1962/2004/ 2015 | 2010/2013 | 463,541 | 95 | 100.0 | % | Kroger (QFC) Supermarket, Bed Bath & Beyond, Dick’s Sporting Goods | ||||||||
Aurora Square II | 1987 | 2014 | 70,720 | 11 | 97.5 | % | Marshall’s, Pier 1 Imports | ||||||||
Bellevue Marketplace | 1971/1982/ 2017 | 2015 | 113,758 | 20 | 100.0 | % | Asian Family Market | ||||||||
Four Corner Square | 1983/2015 | 2015 | 119,560 | 30 | 100.0 | % | Grocery Outlet Supermarket, Walgreens, Johnsons Home & Garden | ||||||||
Bridle Trails Shopping Center | 1980/1984/ 1987 | 2016 | 105,486 | 29 | 100.0 | % | Grocery Outlet Supermarket, Bartell Drugs, Dollar Tree | ||||||||
PCC Community Markets Plaza | 1981/2007 | 2017 | 34,459 | 1 | 100.0 | % | PCC Community Markets | ||||||||
Highland Hill Shopping Center | 1956/1989/ 2006 | 2017 | 163,926 | 19 | 95.9 | % | Safeway Supermarket, LA Fitness, Dollar Tree, Petco | ||||||||
North Lynnwood Shopping Center | 1963/1965/ 2003 | 2017 | 63,606 | 8 | 91.3 | % | Kroger (QFC) Supermarket | ||||||||
Portland metro area | |||||||||||||||
Vancouver Market Center | 1996/2012 | 2010 | 118,385 | 18 | 97.0 | % | Skyzone | ||||||||
Happy Valley Town Center | 2007 | 2010 | 138,662 | 37 | 100.0 | % | New Seasons Supermarket | ||||||||
Wilsonville Old Town Square | 2011 | 2010/2012 | 49,937 | 19 | 100.0 | % | Kroger (Fred Meyer) Supermarket (2) | ||||||||
Cascade Summit Town Square | 2000 | 2010 | 94,934 | 29 | 97.3 | % | Safeway Supermarket | ||||||||
Heritage Market Center | 2000 | 2010 | 107,468 | 17 | 98.3 | % | Safeway Supermarket, Dollar Tree | ||||||||
Division Crossing | 1992 | 2010 | 103,561 | 19 | 98.8 | % | Rite Aid Pharmacy, Ross Dress For Less, Ace Hardware | ||||||||
Halsey Crossing | 1992 | 2010 | 99,428 | 18 | 96.3 | % | 24 Hour Fitness, Dollar Tree | ||||||||
Hillsboro Market Center | 2001-2002 | 2011 | 156,021 | 22 | 100.0 | % | Albertson’s Supermarket, Dollar Tree, Ace Hardware | ||||||||
Robinwood Shopping Center | 1980 / 2012 | 2013 | 70,831 | 16 | 100.0 | % | Walmart Neighborhood Market | ||||||||
Tigard Marketplace | 1988/2005 | 2014 | 136,889 | 18 | 99.3 | % | H-Mart Supermarket, Bi-Mart Pharmacy | ||||||||
Wilsonville Town Center | 1991/1996 | 2014 | 167,829 | 39 | 97.9 | % | Safeway Supermarket, Rite Aid Pharmacy, Dollar Tree | ||||||||
Tigard Promenade | 1996 | 2015 | 88,043 | 16 | 100.0 | % | Safeway Supermarket | ||||||||
Sunnyside Village Square | 1996-1997 | 2015 | 92,278 | 15 | 100.0 | % | Grocery Outlet Supermarket, 24 Hour Fitness, Ace Hardware | ||||||||
Johnson Creek Center | 2003/2009 | 2015 | 108,588 | 15 | 100.0 | % | Trader Joe’s, Walgreens, Sportsman’s Warehouse | ||||||||
Rose City Center | 1993/2012 | 2016 | 60,680 | 3 | 100.0 | % | Safeway Supermarket | ||||||||
Division Center | 1986-1987/ 2013-2014 | 2017 | 121,904 | 24 | 100.0 | % | Grocery Outlet Supermarket, Rite Aid Pharmacy, Petco | ||||||||
Riverstone Marketplace | 2002-2004 | 2017 | 95,774 | 23 | 98.5 | % | Kroger (QFC) Supermarket | ||||||||
Total Properties | 10,499,613 | 1,968 | 97.1 | % | |||||||||||
_______________
(1) | This tenant is not in possession of the space, but has an ongoing financial obligation to the Company. |
(2) | Retailer is not a tenant of the Company. |
As illustrated by the following tables, the Company’s shopping centers are substantially diversified by both tenant mix and by the staggering of its major tenant lease expirations. For the year ended December 31, 2017, no single tenant comprised more than 6.0% of the total annual base rent of the Company’s portfolio.
25
The following table sets forth a summary schedule of the Company’s ten largest tenants by percent of total annual base rent, as of December 31, 2017.
Tenant | Number of Leases | % of Total Annual Base Rent (1) | |||
Albertson’s / Safeway Supermarkets | 21 | 6.0 | % | ||
Kroger Supermarkets | 12 | 3.4 | % | ||
Rite Aid Pharmacy | 14 | 1.6 | % | ||
JP Morgan Chase | 22 | 1.5 | % | ||
SaveMart Supermarkets | 4 | 1.4 | % | ||
Marshall’s / TJMaxx | 6 | 1.3 | % | ||
Sprouts Markets | 4 | 1.2 | % | ||
Ross Dress For Less / dd’s Discounts | 7 | 1.2 | % | ||
Trader Joe’s | 8 | 1.2 | % | ||
H-Mart Supermarkets | 3 | 1.2 | % | ||
101 | 20.0 | % | |||
___________________
(1) | Annual base rent is equal to the annualized cash rent for all leases in place as of December 31, 2017 (including initial cash rent for new leases). |
The following table sets forth a summary schedule of the annual lease expirations for leases in place across the Company’s total portfolio at December 31, 2017 (Annual Base Rent in thousands).
Year of Expiration | Number of Leases Expiring (1) | Leased Square Footage | Annual Base Rent (2) | Annual Base Rent % | |||||||||
2018 | 265 | 705,867 | $ | 17,877 | 8.7 | % | |||||||
2019 | 281 | 1,038,569 | 22,904 | 11.1 | % | ||||||||
2020 | 292 | 1,192,524 | 23,922 | 11.6 | % | ||||||||
2021 | 285 | 1,125,504 | 23,400 | 11.3 | % | ||||||||
2022 | 288 | 1,199,667 | 25,997 | 12.6 | % | ||||||||
2023 | 165 | 1,206,825 | 22,353 | 10.9 | % | ||||||||
2024 | 76 | 502,815 | 9,554 | 4.6 | % | ||||||||
2025 | 67 | 553,038 | 10,506 | 5.1 | % | ||||||||
2026 | 72 | 579,343 | 10,862 | 5.2 | % | ||||||||
2027 | 67 | 408,179 | 8,995 | 4.4 | % | ||||||||
Thereafter | 106 | 1,658,256 | 29,738 | 14.5 | % | ||||||||
Total | 1,964 | 10,170,587 | $ | 206,108 | 100 | % | |||||||
___________________
(1) | Assumes no tenants exercise renewal options or cancellation options. |
(2) | Annual base rent is equal to the annualized cash rent for all leases in place as of December 31, 2017 (including initial cash rent for new leases). |
26
The following table sets forth a summary schedule of the annual lease expirations for leases in place with the Company’s anchor tenants at December 31, 2017 (Annual Base Rent in thousands). Anchor tenants are tenants with leases occupying at least 15,000 square feet or more.
Year of Expiration | Number of Leases Expiring (1) | Leased Square Footage | Annual Base Rent (2) | Annual Base Rent % | |||||||||
2018 | 7 | 240,284 | $ | 3,644 | 1.8 | % | |||||||
2019 | 15 | 474,450 | 7,485 | 3.6 | % | ||||||||
2020 | 17 | 553,496 | 6,451 | 3.1 | % | ||||||||
2021 | 14 | 494,281 | 5,246 | 2.5 | % | ||||||||
2022 | 18 | 551,606 | 6,930 | 3.4 | % | ||||||||
2023 | 25 | 803,885 | 11,576 | 5.6 | % | ||||||||
2024 | 6 | 270,824 | 3,487 | 1.7 | % | ||||||||
2025 | 10 | 341,785 | 4,919 | 2.4 | % | ||||||||
2026 | 11 | 389,933 | 5,235 | 2.5 | % | ||||||||
2027 | 9 | 231,234 | 3,694 | 1.8 | % | ||||||||
Thereafter | 33 | 1,326,833 | 20,609 | 10.0 | % | ||||||||
Total | 165 | 5,678,611 | $ | 79,276 | 38.4 | % | |||||||
____________________
(1) | Assumes no tenants exercise renewal or cancellation options. |
(2) | Annual base rent is equal to the annualized cash rent for all leases in place as of December 31, 2017 (including initial cash rent for new leases). |
Item 3. Legal Proceedings
In the normal course of business, from time to time, the Company is involved in routine legal actions incidental to its business of the ownership and operations of its properties. In management’s opinion, the liabilities, if any, that ultimately may result from such legal actions are not expected to have a material adverse effect on the consolidated financial position, results of operations or liquidity of the Company.
Item 4. Mine Safety Disclosures
Not applicable.
27
PART II
Item 5. Market for Registrant’s Common Equity, Related Stockholder Matters and Issuer Purchases of Equity Securities
ROIC Market Information
ROIC’s common stock trades on the NASDAQ Global Select Market (“NASDAQ”) under the symbol “ROIC”. The following table sets forth, for the period indicated, the high and low sales price for ROIC’s common stock as reported by the NASDAQ and the per share dividends declared:
Period | High | Low | Dividends Declared | |||||||||
2017 | ||||||||||||
First Quarter | $ | 22.37 | $ | 20.13 | $ | 0.1875 | ||||||
Second Quarter | $ | 22.06 | $ | 18.57 | $ | 0.1875 | ||||||
Third Quarter | $ | 20.78 | $ | 18.66 | $ | 0.1875 | ||||||
Fourth Quarter | $ | 20.09 | $ | 17.87 | $ | 0.1875 | ||||||
2016 | ||||||||||||
First Quarter | $ | 20.23 | $ | 16.90 | $ | 0.1800 | ||||||
Second Quarter | $ | 21.91 | $ | 18.80 | $ | 0.1800 | ||||||
Third Quarter | $ | 23.05 | $ | 21.03 | $ | 0.1800 | ||||||
Fourth Quarter | $ | 21.92 | $ | 18.45 | $ | 0.1800 | ||||||
On February 16, 2018, the closing price of ROIC’s common stock as reported by the NASDAQ was $17.62.
Dividends Declared on Common Stock and Tax Status
ROIC intends to make regular quarterly distributions to holders of its common stock. U.S. federal income tax law generally requires that a REIT distribute annually at least 90% of its REIT taxable income, without regard to the deduction for dividends paid and excluding net capital gains, and that it pay U.S. federal income tax at regular corporate rates to the extent that it annually distributes less than 100% of its net taxable income. ROIC intends to pay regular quarterly dividends to stockholders in an amount not less than its net taxable income, including capital gains, if any, if and to the extent authorized by its board of directors. Before ROIC pays any dividend, whether for U.S. federal income tax purposes or otherwise, it must first meet both its operating requirements and its debt service on debt. If ROIC’s cash available for distribution is less than its net taxable income, it could be required to sell assets or borrow funds to make cash distributions or it may make a portion of the required distribution in the form of a taxable stock distribution or distribution of debt securities.
The following table sets forth the dividends declared per share of ROIC’s common stock and the tax status for U.S. federal income tax purposes of such dividends declared during the years ended December 31, 2017 and 2016:
Year Ended December 31, 2017
Record Date | Payable Date | Total Dividend per Share | Ordinary Income per Share (1) | Return of Capital per Share | ||||
3/16/2017 | 3/30/2017 | $0.1875 | $0.15296 | $0.03454 | ||||
6/15/2017 | 6/29/2017 | $0.1875 | $0.15296 | $0.03454 | ||||
9/14/2017 | 9/28/2017 | $0.1875 | $0.15296 | $0.03454 | ||||
12/14/2017 | 12/28/2017 | $0.1875 | $0.15296 | $0.03454 | ||||
_________________
(1) | Ordinary Income per Share is non-qualified dividend income. |
28
Year Ended December 31, 2016
Record Date | Payable Date | Total Dividend per Share | Ordinary Income per Share (1) | Return of Capital per Share | ||||
3/16/2016 | 3/30/2016 | $0.1800 | $0.13945 | $0.04055 | ||||
6/15/2016 | 6/29/2016 | $0.1800 | $0.13945 | $0.04055 | ||||
9/15/2016 | 9/29/2016 | $0.1800 | $0.13945 | $0.04055 | ||||
12/15/2016 | 12/29/2016 | $0.1800 | $0.13945 | $0.04055 | ||||
_________________
(1) | Ordinary Income per Share is non-qualified dividend income. |
As of December 31, 2017, 90.5% of the outstanding interests in the Operating Partnership were owned by the Company.
Holders
As of February 16, 2018, ROIC had 64 registered holders. Such information was obtained through the registrar and transfer agent.
Operating Partnership
There is no established trading market for the Operating Partnership’s OP Units. The following table sets forth the distributions per OP Unit with respect to the periods indicated:
Period | Distributions | |||
2017 | ||||
First Quarter | $ | 0.1875 | ||
Second Quarter | $ | 0.1875 | ||
Third Quarter | $ | 0.1875 | ||
Fourth Quarter | $ | 0.1875 | ||
2016 | ||||
First Quarter | $ | 0.1800 | ||
Second Quarter | $ | 0.1800 | ||
Third Quarter | $ | 0.1800 | ||
Fourth Quarter | $ | 0.1800 | ||
The Operating Partnership intends to make regular quarterly distributions to holders of OP Units, to the extent authorized by ROIC’s board of directors. As of December 31, 2017, the Operating Partnership had 50 registered holders, including Retail Opportunity Investments GP, LLC.
29
Stockholder Return Performance
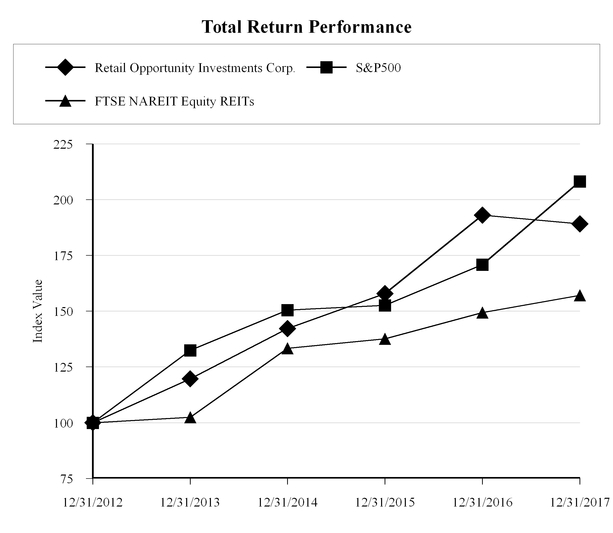
The above graph compares the cumulative total return on the Company’s common stock with that of the Standard and Poor’s 500 Stock Index (“S&P 500”) and the National Association of Real Estate Investment Trusts Equity Index (“FTSE NAREIT Equity REITs”) from December 31, 2012 through December 31, 2017. The stock price performance graph assumes that an investor invested $100 in each of ROIC and the indices, and the reinvestment of any dividends. The comparisons in the graph are provided in accordance with the SEC disclosure requirements and are not intended to forecast or be indicative of the future performance of ROIC’s shares of common stock.
Period Ending | ||||||||||||||||||
Index | 12/31/2012 | 12/31/2013 | 12/31/2014 | 12/31/2015 | 12/31/2016 | 12/31/2017 | ||||||||||||
Retail Opportunity Investments Corp. | 100.00 | 119.67 | 142.21 | 157.89 | 193.04 | 189.16 | ||||||||||||
S&P500 | 100.00 | 132.39 | 150.51 | 152.59 | 170.84 | 208.14 | ||||||||||||
FTSE NAREIT Equity REITs | 100.00 | 102.47 | 133.35 | 137.61 | 149.33 | 157.14 | ||||||||||||
Except to the extent that the Company specifically incorporates this information by reference, the foregoing Stockholder Return Performance information shall not be deemed incorporated by reference by any general statement incorporating by reference this Annual Report on Form 10-K into any filing under the Securities Act or under the Exchange Act. This information shall not otherwise be deemed filed under such Acts.
30
Securities Authorized For Issuance Under Equity Compensation Plans
During 2009, ROIC adopted the 2009 Equity Incentive Plan (the “2009 Plan”). For a description of the 2009 Plan, see Note 8 to the consolidated financial statements in this Annual Report on Form 10-K.
The following table presents certain information about the Company’s equity compensation plans as of December 31, 2017:
Plan Category | Number of securities to be issued upon exercise of outstanding options, warrants and rights | Weighted-average exercise price of outstanding options, warrants and rights | Number of securities remaining available for future issuance under equity compensation plans (excluding securities reflected in the first column of this table) | |||||||
Equity compensation plans approved by stockholders | 278,500 | $ | 10.79 | 1,103,418 | ||||||
Equity compensation plans not approved by stockholders | — | — | — | |||||||
Total | 278,500 | $ | 10.79 | 1,103,418 | ||||||
31
Item 6. Selected Financial Data
The following tables set forth selected financial and operating information on a historical basis for ROIC and the Operating Partnership, and should be read in conjunction with Item 7, “Management’s Discussion and Analysis of Financial Conditions and Results of Operations” and the Company’s financial statements, including the notes, included elsewhere herein.
RETAIL OPPORTUNITY INVESTMENTS CORP.
CONSOLIDATED HISTORICAL FINANCIAL INFORMATION
(in thousands, except share data)
Year Ended December 31, | |||||||||||||||||||
Retail Opportunity Investments Corp. | 2017 | 2016 | 2015 | 2014 | 2013 | ||||||||||||||
Statement of Operations Data: | |||||||||||||||||||
Total revenues | $ | 273,260 | $ | 237,189 | $ | 192,699 | $ | 155,864 | $ | 111,232 | |||||||||
Operating expenses | 179,595 | 160,018 | 133,364 | 112,090 | 83,457 | ||||||||||||||
Operating income | 93,665 | 77,171 | 59,335 | 43,774 | 27,775 | ||||||||||||||
Gain on consolidation of joint venture | — | — | — | — | 20,382 | ||||||||||||||
Gain on sale of real estate | — | — | — | 4,869 | — | ||||||||||||||
Interest expense and other finance expenses | 50,977 | 40,741 | 34,243 | 27,593 | 15,855 | ||||||||||||||
Income from continuing operations | 42,688 | 36,430 | 25,092 | 21,050 | 34,692 | ||||||||||||||
Loss from discontinued operations | — | — | — | — | (714 | ) | |||||||||||||
Net income | 42,688 | 36,430 | 25,092 | 21,050 | 33,978 | ||||||||||||||
Net Income Attributable to Retail Opportunity Investments Corp. | 38,477 | 32,754 | 23,864 | 20,301 | 33,813 | ||||||||||||||
Weighted average shares outstanding – Basic: | 109,400,123 | 104,072,222 | 95,651,780 | 83,411,230 | 67,419,497 | ||||||||||||||
Weighted average shares outstanding – Diluted: | 121,743,831 | 116,039,940 | 100,017,781 | 87,453,409 | 71,004,380 | ||||||||||||||
Income per share – Basic: | |||||||||||||||||||
Income from continuing operations | $ | 0.35 | $ | 0.31 | $ | 0.25 | $ | 0.24 | $ | 0.51 | |||||||||
Net Income Attributable to Retail Opportunity Investments Corp. | $ | 0.35 | $ | 0.31 | $ | 0.25 | $ | 0.24 | $ | 0.50 | |||||||||
Income per share – Diluted: | |||||||||||||||||||
Income from continuing operations | $ | 0.35 | $ | 0.31 | $ | 0.25 | $ | 0.24 | $ | 0.49 | |||||||||
Net Income Attributable to Retail Opportunity Investments Corp. | $ | 0.35 | $ | 0.31 | $ | 0.25 | $ | 0.24 | $ | 0.48 | |||||||||
Dividends per common share | $ | 0.75 | $ | 0.72 | $ | 0.68 | $ | 0.64 | $ | 0.60 | |||||||||
Balance Sheet Data: | |||||||||||||||||||
Real Estate Investments, net | $ | 2,849,282 | $ | 2,493,997 | $ | 2,162,306 | $ | 1,697,725 | $ | 1,314,934 | |||||||||
Cash and cash equivalents | 11,553 | 13,125 | 8,844 | 10,773 | 7,920 | ||||||||||||||
Total assets | 3,039,198 | 2,662,969 | 2,301,448 | 1,861,028 | 1,446,995 | ||||||||||||||
Total liabilities | 1,709,557 | 1,347,404 | 1,136,432 | 898,246 | 741,585 | ||||||||||||||
Non-controlling interests – redeemable OP Units | — | — | 33,674 | — | — | ||||||||||||||
Total equity | 1,329,641 | 1,315,565 | 1,131,342 | 962,782 | 705,410 | ||||||||||||||
32
RETAIL OPPORTUNITY INVESTMENTS PARTNERSHIP, LP
CONSOLIDATED HISTORICAL FINANCIAL INFORMATION
(in thousands, except share data)
Year Ended December 31, | |||||||||||||||||||
Retail Opportunity Investments Partnership, LP | 2017 | 2016 | 2015 | 2014 | 2013 | ||||||||||||||
Statement of Operations Data: | |||||||||||||||||||
Total revenues | $ | 273,260 | $ | 237,189 | $ | 192,699 | $ | 155,864 | $ | 111,232 | |||||||||
Operating expenses | 179,595 | 160,018 | 133,364 | 112,090 | 83,457 | ||||||||||||||
Operating income | 93,665 | 77,171 | 59,335 | 43,774 | 27,775 | ||||||||||||||
Gain on consolidation of joint venture | — | — | — | — | 20,382 | ||||||||||||||
Gain on sale of real estate | — | — | — | 4,869 | — | ||||||||||||||
Interest expense and other finance expenses | 50,977 | 40,741 | 34,243 | 27,593 | 15,855 | ||||||||||||||
Income from continuing operations | 42,688 | 36,430 | 25,092 | 21,050 | 34,692 | ||||||||||||||
Loss from discontinued operations | — | — | — | — | (714 | ) | |||||||||||||
Net income | 42,688 | 36,430 | 25,092 | 21,050 | 33,978 | ||||||||||||||
Net Income Attributable to Retail Opportunity Investments Partnership, LP | 42,688 | 36,430 | 25,092 | 21,050 | 33,978 | ||||||||||||||
Weighted average units outstanding – Basic: | 121,460,958 | 115,819,731 | 99,738,504 | 86,573,888 | 68,258,005 | ||||||||||||||
Weighted average units outstanding – Diluted: | 121,743,831 | 116,039,940 | 100,017,781 | 87,453,409 | 71,004,380 | ||||||||||||||
Income per unit – Basic: | |||||||||||||||||||
Income from continuing operations | $ | 0.35 | $ | 0.31 | $ | 0.25 | $ | 0.24 | $ | 0.51 | |||||||||
Net Income Attributable to Retail Opportunity Investments Partnership, LP | $ | 0.35 | $ | 0.31 | $ | 0.25 | $ | 0.24 | $ | 0.50 | |||||||||
Income per unit – Diluted: | |||||||||||||||||||
Income from continuing operations | $ | 0.35 | $ | 0.31 | $ | 0.25 | $ | 0.24 | $ | 0.49 | |||||||||
Net Income Attributable to Retail Opportunity Investments Partnership, LP | $ | 0.35 | $ | 0.31 | $ | 0.25 | $ | 0.24 | $ | 0.48 | |||||||||
Distributions per unit | $ | 0.75 | $ | 0.72 | $ | 0.68 | $ | 0.64 | $ | 0.60 | |||||||||
Balance Sheet Data: | |||||||||||||||||||
Real Estate Investments, net | $ | 2,849,282 | $ | 2,493,997 | $ | 2,162,306 | $ | 1,697,725 | $ | 1,314,934 | |||||||||
Cash and cash equivalents | 11,553 | 13,125 | 8,844 | 10,773 | 7,920 | ||||||||||||||
Total assets | 3,039,198 | 2,662,969 | 2,301,448 | 1,861,028 | 1,446,995 | ||||||||||||||
Total liabilities | 1,709,557 | 1,347,404 | 1,136,432 | 898,246 | 741,585 | ||||||||||||||
Redeemable limited partners | — | — | 33,674 | — | — | ||||||||||||||
Total capital | 1,329,641 | 1,315,565 | 1,131,342 | 962,782 | 705,410 | ||||||||||||||
33
Item 7. Management’s Discussion and Analysis of Financial Condition and Results of Operations
The following discussion should be read in conjunction with the Retail Opportunity Investments Corp. Consolidated Financial Statements and Notes thereto appearing elsewhere in this Annual Report on Form 10-K. The Company makes statements in this section that are forward-looking statements within the meaning of the federal securities laws. For a complete discussion of forward-looking statements, see the section in this Annual Report on Form 10-K entitled “Statements Regarding Forward-Looking Information.” Certain risk factors may cause actual results, performance or achievements to differ materially from those expressed or implied by the following discussion. For a discussion of such risk factors, see the section in this Annual Report on Form 10-K entitled “Risk Factors.”
Overview
The Company is organized in an UpREIT format pursuant to which Retail Opportunity Investments GP, LLC, its wholly-owned subsidiary, serves as the general partner of, and ROIC conducts substantially all of its business through, its Operating Partnership, Retail Opportunity Investments Partnership, LP, a Delaware limited partnership, together with its subsidiaries.
ROIC commenced operations in October 2009 as a fully integrated and self-managed REIT, and as of December 31, 2017, ROIC owned an approximate 90.5% partnership interest and other limited partners owned the remaining 9.5% partnership interest in the Operating Partnership. ROIC specializes in the acquisition, ownership and management of necessity-based community and neighborhood shopping centers on the west coast of the United States, anchored by supermarkets and drugstores.
As of December 31, 2017, the Company’s portfolio consisted of 92 properties (91 retail and one office) totaling approximately 10.5 million square feet of GLA. As of December 31, 2017, the Company’s portfolio was approximately 97.1% leased. During the year ended December 31, 2017, the Company leased and renewed approximately 399,000 and 958,000 square feet, respectively, in its portfolio.
The table below provides a reconciliation of beginning of year vacant space to end of year vacant space as of December 31, 2017.
Vacant Space Square Footage | ||
Vacant space at December 31, 2016 | 237,752 | |
Square footage vacated | 231,795 | |
Vacant space in acquired properties | 53,138 | |
Square footage leased | (219,587 | ) |
Vacant space at December 31, 2017 | 303,098 | |
The Company has committed approximately $15.3 million, or $38.39 per square foot, in tenant improvements, including building and site improvements, for new leases that occurred during the year ended December 31, 2017. The Company has committed approximately $1.0 million, or $2.53 per square foot, in leasing commissions for the new leases that occurred during the year ended December 31, 2017. Additionally, the Company has committed approximately $950,000, or $0.99 per square foot, in tenant improvements for renewed leases that occurred during the year ended December 31, 2017. Leasing commission commitments for renewed leases were not material for the year ended December 31, 2017.
Results of Operations
At December 31, 2017, the Company had 92 properties (91 retail and one office), all of which are consolidated in the accompanying financial statements. The Company believes, because of the location of the properties in densely populated areas, the nature of its investments provides for relatively stable revenue flows even during difficult economic times. The Company has a strong capital structure with manageable debt as of December 31, 2017. The Company expects to continue to actively explore acquisition opportunities consistent with its business strategy.
Property operating income is a non-GAAP financial measure of performance. The Company defines property operating income as operating revenues (base rent, recoveries from tenants and other income), less property and related expenses (property operating expenses and property taxes). Property operating income excludes general and administrative expenses, mortgage interest income, depreciation and amortization, acquisition transaction costs, other expense, interest expense, gains and losses from property acquisitions and dispositions, equity in earnings from unconsolidated joint ventures, extraordinary items, and amortization of
34
tenant improvements and leasing commissions. Other REITs may use different methodologies for calculating property operating income, and accordingly, the Company’s property operating income may not be comparable to other REITs.
Property operating income is used by management to evaluate and compare the operating performance of the Company’s properties, to determine trends in earnings and to compute the fair value of the Company’s properties as this measure is not affected by the cost of our funding, the impact of depreciation and amortization expenses, gains or losses from the acquisition and sale of operating real estate assets, general and administrative expenses or other gains and losses that relate to our ownership of our properties. The Company believes the exclusion of these items from net income is useful because the resulting measure captures the actual revenue generated and actual expenses incurred in operating the Company’s properties as well as trends in occupancy rates, rental rates and operating costs.
Property operating income is a measure of the operating performance of the Company’s properties but does not measure the Company’s performance as a whole. Property operating income is therefore not a substitute for net income or operating income as computed in accordance with GAAP.
Results of Operations for the year ended December 31, 2017 compared to the year ended December 31, 2016.
Property Operating Income
The table below provides a reconciliation of consolidated operating income in accordance with GAAP to consolidated property operating income for the years ended December 31, 2017 and 2016 (in thousands).
Year Ended December 31, | ||||||||
2017 | 2016 | |||||||
Operating income per GAAP | $ | 93,665 | $ | 77,171 | ||||
Plus: | Depreciation and amortization | 96,256 | 88,359 | |||||
General and administrative expenses | 14,103 | 13,120 | ||||||
Acquisition transaction costs | 4 | 824 | ||||||
Other expenses | 418 | 456 | ||||||
Property operating income | $ | 204,446 | $ | 179,930 | ||||
The following comparison for the year ended December 31, 2017 compared to the year ended December 31, 2016, makes reference to the effect of the same-center properties. Same-center properties, which totaled 72 of the Company’s 92 properties as of December 31, 2017, represent all operating properties owned by the Company during the entirety of both periods presented and consolidated into the Company’s financial statements during such periods, except for one shopping center that is currently under contract to be sold and is slated for new multi-family development and is no longer being managed as a retail asset.
The table below provides a reconciliation of consolidated operating income in accordance with GAAP to property operating income for the year ended December 31, 2017 related to the 72 same-center properties owned by the Company during the entirety of both the years ended December 31, 2017 and 2016 and consolidated into the Company’s financial statements during such periods (in thousands).
35
Year Ended December 31, 2017 | ||||||||||||
Same-Center | Non Same-Center | Total | ||||||||||
Operating income per GAAP | $ | 92,114 | $ | 1,551 | $ | 93,665 | ||||||
Plus: | Depreciation and amortization | 76,147 | 20,109 | 96,256 | ||||||||
General and administrative expenses (1) | — | 14,103 | 14,103 | |||||||||
Acquisition transaction costs | — | 4 | 4 | |||||||||
Other expenses (1) | — | 418 | 418 | |||||||||
Property operating income | $ | 168,261 | $ | 36,185 | $ | 204,446 | ||||||
______________________
(1) | For illustration purposes, general and administrative expenses and other expenses are included in non same-center because the Company does not allocate these types of expenses between same-center and non same-center properties. |
The table below provides a reconciliation of consolidated operating income in accordance with GAAP to property operating income for the year ended December 31, 2016 related to the 72 same-center properties owned by the Company during the entirety of both the years ended December 31, 2017 and 2016 and consolidated into the Company’s financial statements during such periods (in thousands).
Year Ended December 31, 2016 | ||||||||||||
Same-Center | Non Same-Center | Total | ||||||||||
Operating income (loss) per GAAP | $ | 85,378 | $ | (8,207 | ) | $ | 77,171 | |||||
Plus: | Depreciation and amortization | 79,909 | 8,450 | 88,359 | ||||||||
General and administrative expenses (1) | — | 13,120 | 13,120 | |||||||||
Acquisition transaction costs | 201 | 623 | 824 | |||||||||
Other expenses (1) | — | 456 | 456 | |||||||||
Property operating income | $ | 165,488 | $ | 14,442 | $ | 179,930 | ||||||
______________________
(1) | For illustration purposes, general and administrative expenses and other expenses are included in non same-center because the Company does not allocate these types of expenses between same-center and non same-center properties. |
During the year ended December 31, 2017, the Company generated property operating income of approximately $204.4 million compared to property operating income of $179.9 million generated during the year ended December 31, 2016. Property operating income increased by $24.5 million during the year ended December 31, 2017 primarily as a result of an increase in the number of properties owned by the Company in 2017 compared to 2016 and an increase in same-center properties’ operating income. As of December 31, 2017, the Company owned 92 properties as compared to 82 properties at December 31, 2016. The properties acquired during 2017 and 2016 increased property operating income in 2017 by approximately $21.7 million. The 72 same-center properties increased property operating income by approximately $2.8 million. This increase is primarily due to an increase in base rents.
Depreciation and amortization
The Company incurred depreciation and amortization expenses during the year ended December 31, 2017 of approximately $96.3 million compared to $88.4 million incurred during the year ended December 31, 2016. Depreciation and amortization expenses were higher in 2017 as a result of an increase in the number of properties owned by the Company in 2017 compared to 2016.
General and administrative expenses
The Company incurred general and administrative expenses during the year ended December 31, 2017 of approximately $14.1 million compared to $13.1 million incurred during the year ended December 31, 2016. General and administrative expenses increased approximately $983,000 primarily as a result of an increase in compensation-related expenses.
36
Acquisition transaction costs
The Company incurred property acquisition costs during the year ended December 31, 2017 of approximately $4,000 compared to $824,000 incurred during the year ended December 31, 2016. Acquisition costs decreased approximately $820,000 as a result of the Company’s prospective adoption of Accounting Standards Update No. 2017-1, “Business Combinations: Clarifying the Definition of a Business” on October 1, 2016. The standard issued by the FASB redefined the definition of a business, whereby an acquisition in which substantially all of the fair value of the assets acquired are concentrated in a single identifiable asset is accounted for as an asset acquisition. As a result, transaction costs related to such an acquisition are capitalized. During the year ended December 31, 2017 and the three months ended December 31, 2016, the Company concluded that its acquisitions did not meet the definition of a business and accounted for such acquisitions as asset acquisitions and capitalized all transactions costs related to completed and in-process acquisitions.
Interest expense and other finance expenses
During the year ended December 31, 2017, the Company incurred approximately $51.0 million of interest expense compared to approximately $40.7 million during the year ended December 31, 2016. Interest expense increased approximately $10.2 million primarily due to a higher debt level as a result of acquisitions and interest incurred related to the Senior Notes Due 2026 issued in September 2016 and the Senior Notes Due 2027 issued in December 2017.
Results of Operations for the year ended December 31, 2016 compared to the year ended December 31, 2015.
Property Operating Income
The table below provides a reconciliation of consolidated operating income in accordance with GAAP to consolidated property operating income for the years ended December 31, 2016 and 2015 (in thousands).
Year Ended December 31, | ||||||||
2016 | 2015 | |||||||
Operating income per GAAP | $ | 77,171 | $ | 59,335 | ||||
Plus: | Depreciation and amortization | 88,359 | 70,957 | |||||
General and administrative expenses | 13,120 | 12,650 | ||||||
Acquisition transaction costs | 824 | 965 | ||||||
Other expenses | 456 | 627 | ||||||
Property operating income | $ | 179,930 | $ | 144,534 | ||||
The following comparison for the year ended December 31, 2016 compared to the year ended December 31, 2015, makes reference to the effect of the same-center properties. Same-center properties, which totaled 61 of the Company’s 82 properties as of December 31, 2016, represent all operating properties owned by the Company during the entirety of both periods presented and consolidated into the Company’s financial statements during such periods.
The table below provides a reconciliation of consolidated operating income in accordance with GAAP to property operating income for the year ended December 31, 2016 related to the 61 same-center properties owned by the Company during the entirety of both the years ended December 31, 2016 and 2015 and consolidated into the Company’s financial statements during such periods (in thousands).
37
Year Ended December 31, 2016 | ||||||||||||
Same-Center | Non Same-Center | Total | ||||||||||
Operating income per GAAP | $ | 75,521 | $ | 1,650 | $ | 77,171 | ||||||
Plus: | Depreciation and amortization | 63,443 | 24,916 | 88,359 | ||||||||
General and administrative expenses (1) | — | 13,120 | 13,120 | |||||||||
Acquisition transaction costs | 51 | 773 | 824 | |||||||||
Other expenses (1) | — | 456 | 456 | |||||||||
Property operating income | $ | 139,015 | $ | 40,915 | $ | 179,930 | ||||||
______________________
(1) | For illustration purposes, general and administrative expenses and other expenses are included in non same-center because the Company does not allocate these types of expenses between same-center and non same-center properties. |
The table below provides a reconciliation of consolidated operating income in accordance with GAAP to property operating income for the year ended December 31, 2015 related to the 61 same-center properties owned by the Company during the entirety of both the years ended December 31, 2016 and 2015 and consolidated into the Company’s financial statements during such periods (in thousands).
Year Ended December 31, 2015 | ||||||||||||
Same-Center | Non Same-Center | Total | ||||||||||
Operating income per GAAP | $ | 69,507 | $ | (10,172 | ) | $ | 59,335 | |||||
Plus: | Depreciation and amortization | 64,722 | 6,235 | 70,957 | ||||||||
General and administrative expenses (1) | — | 12,650 | 12,650 | |||||||||
Acquisition transaction costs | 95 | 870 | 965 | |||||||||
Other expenses (1) | — | 627 | 627 | |||||||||
Property operating income | $ | 134,324 | $ | 10,210 | $ | 144,534 | ||||||
______________________
(1) | For illustration purposes, general and administrative expenses and other expenses are included in non same-center because the Company does not allocate these types of expenses between same-center and non same-center properties. |
During the year ended December 31, 2016, the Company generated property operating income of approximately $179.9 million compared to property operating income of $144.5 million generated during the year ended December 31, 2015. Property operating income increased by $35.4 million during the year ended December 31, 2016 primarily as a result of an increase in the number of properties owned by the Company in 2016 compared to 2015 and an increase in same-center properties’ operating income. As of December 31, 2016, the Company owned 82 properties as compared to 73 properties at December 31, 2015. The properties acquired during 2016 and 2015 increased property operating income in 2016 by approximately $30.7 million. The 61 same-center properties increased property operating income by approximately $4.7 million. This increase is primarily due to an increase in base rents.
Depreciation and amortization
The Company incurred depreciation and amortization expenses during the year ended December 31, 2016 of approximately $88.4 million compared to $71.0 million incurred during the year ended December 31, 2015. Depreciation and amortization expenses were higher in 2016 as a result of an increase in the number of properties owned by the Company in 2016 compared to 2015.
General and administrative expenses
The Company incurred general and administrative expenses during the year ended December 31, 2016 of approximately $13.1 million compared to $12.7 million incurred during the year ended December 31, 2015. General and administrative expenses increased approximately $470,000 primarily as a result of an increase in compensation-related expenses.
38
Acquisition transaction costs
The Company incurred property acquisition costs during the year ended December 31, 2016 of approximately $824,000, which is consistent with the $965,000 incurred during the year ended December 31, 2015.
Interest expense and other finance expenses
During the year ended December 31, 2016, the Company incurred approximately $40.7 million of interest expense compared to approximately $34.2 million during the year ended December 31, 2015. Interest expense increased approximately $6.5 million primarily due to a higher debt level as a result of acquisitions, and interest incurred related to the Senior Notes Due 2026 issued in September 2016.
Funds From Operations
Funds from operations (“FFO”), is a widely-recognized non-GAAP financial measure for REITs that the Company believes when considered with financial statements presented in accordance with GAAP, provides additional and useful means to assess its financial performance. FFO is frequently used by securities analysts, investors and other interested parties to evaluate the performance of REITs, most of which present FFO along with net income as calculated in accordance with GAAP.
The Company computes FFO in accordance with the “White Paper” on FFO published by the National Association of Real Estate Investment Trusts (“NAREIT”), which defines FFO as net income attributable to common stockholders (determined in accordance with GAAP) excluding gains or losses from debt restructuring, sales of depreciable property, and impairments, plus real estate related depreciation and amortization, and after adjustments for partnerships and unconsolidated joint ventures.
However, FFO:
•does not represent cash flows from operating activities in accordance with GAAP (which, unlike FFO, generally reflects all cash effects of transactions and other events in the determination of net income); and
•should not be considered an alternative to net income as an indication of our performance.
FFO as defined by the Company may not be comparable to similarly titled items reported by other REITs due to possible differences in the application of the NAREIT definition used by such REITs.
As previously discussed, effective October 1, 2016, the Company prospectively adopted ASU No. 2017-1. Accordingly, during the year ended December 31, 2017 and the three months ended December 31, 2016, the Company concluded that its acquisitions did not meet the definition of a business and accounted for such acquisitions as asset acquisitions and capitalized all transaction costs related to completed and in-process acquisitions. Acquisition costs that are expensed will reduce our FFO. For the years ended December 31, 2017, 2016 and 2015, the Company expensed $4,000, $824,000 and $965,000, respectively, relating to real estate acquisitions.
The table below provides a reconciliation of net income applicable to stockholders in accordance with GAAP to FFO for the years ended December 31, 2017, 2016 and 2015 (in thousands).
Year Ended December 31, | |||||||||||
2017 | 2016 | 2015 | |||||||||
Net income attributable to ROIC | $ | 38,477 | $ | 32,754 | $ | 23,864 | |||||
Plus: Depreciation and amortization | 96,256 | 88,359 | 70,957 | ||||||||
Funds from operations – basic | 134,733 | 121,113 | 94,821 | ||||||||
Net income attributable to non-controlling interests | 4,211 | 3,676 | 1,228 | ||||||||
Funds from operations – diluted | $ | 138,944 | $ | 124,789 | $ | 96,049 | |||||
Cash Net Operating Income (“NOI”)
Cash NOI is a non-GAAP financial measure of the Company’s performance. The most directly comparable GAAP financial measure is operating income. The Company defines cash NOI as operating revenues (base rent and recoveries from tenants), less
39
property and related expenses (property operating expenses and property taxes), adjusted for non-cash revenue and operating expense items such as straight-line rent and amortization of lease intangibles, debt-related expenses, and other adjustments. Cash NOI also excludes general and administrative expenses, depreciation and amortization, acquisition transaction costs, other expense, interest expense, gains and losses from property acquisitions and dispositions, extraordinary items, tenant improvements and leasing commissions. Other REITs may use different methodologies for calculating cash NOI, and accordingly, the Company’s cash NOI may not be comparable to other REITs.
Cash NOI is used by management internally to evaluate and compare the operating performance of the Company’s properties. The Company believes cash NOI provides useful information to investors regarding the Company’s financial condition and results of operations because it reflects only those cash income and expense items that are incurred at the property level, and when compared across periods, can be used to determine trends in earnings of the Company’s properties as this measure is not affected by non-cash revenue and expense recognition items, the cost of the Company’s funding, the impact of depreciation and amortization expenses, gains or losses from the acquisition and sale of operating real estate assets, general and administrative expenses or other gains and losses that relate to the Company’s ownership of properties. The Company believes the exclusion of these items from operating income is useful because the resulting measure captures the actual revenue generated and actual expenses incurred in operating the Company’s properties as well as trends in occupancy rates, rental rates and operating costs.
Cash NOI is a measure of the operating performance of the Company’s properties but does not measure the Company’s performance as a whole and is therefore not a substitute for net income or operating income as computed in accordance with GAAP.
Same-Center Cash NOI
The table below provides a reconciliation of same-center cash NOI to consolidated operating income in accordance with GAAP for the years ended December 31, 2017 and 2016. The table makes reference to the effect of the same-center properties. Same-center properties, which totaled 72 of the Company’s 92 properties as of December 31, 2017, represent all operating properties owned by the Company during the entirety of both periods presented and consolidated into the Company’s financial statements during such periods, except for one shopping center that is currently under contract to be sold and is slated for new multi-family development and is no longer being managed as a retail asset (in thousands).
Year Ended December 31, | |||||||
2017 | 2016 | ||||||
GAAP operating income | $ | 93,665 | $ | 77,171 | |||
Depreciation and amortization | 96,256 | 88,359 | |||||
General and administrative expenses | 14,103 | 13,120 | |||||
Acquisition transaction costs | 4 | 824 | |||||
Other expense | 418 | 456 | |||||
Property revenues and other expenses (1) | (22,404 | ) | (17,636 | ) | |||
Total Company cash NOI | 182,042 | 162,294 | |||||
Non same-center cash NOI | (27,337 | ) | (12,171 | ) | |||
Same-center cash NOI | $ | 154,705 | $ | 150,123 | |||
______________________
(1) | Includes straight-line rents, amortization of above-market and below-market lease intangibles, anchor lease termination fees, net of contractual amounts, and expense and recovery adjustments related to prior periods. |
During the year ended December 31, 2017, the Company generated same-center cash NOI of approximately $154.7 million compared to same-center cash NOI of approximately $150.1 million generated during the year ended December 31, 2016, representing a 3.1% increase. This increase is primarily due to an increase in base rents, recoveries and other income.
The table below provides a reconciliation of same-center cash NOI to consolidated operating income in accordance with GAAP for the years ended December 31, 2016 and 2015. The table makes reference to the effect of the same-center properties. Same-center properties, which totaled 61 of the Company’s 82 properties as of December 31, 2016, represent all operating properties owned by the Company during the entirety of both periods presented and consolidated into the Company’s financial statements during such periods (in thousands).
40
Year Ended December 31, | |||||||
2016 | 2015 | ||||||
GAAP operating income | $ | 77,171 | $ | 59,335 | |||
Depreciation and amortization | 88,359 | 70,957 | |||||
General and administrative expenses | 13,120 | 12,650 | |||||
Acquisition transaction costs | 824 | 965 | |||||
Other expense | 456 | 627 | |||||
Property revenues and other expenses (1) | (18,775 | ) | (16,223 | ) | |||
Total Company cash NOI | 161,155 | 128,311 | |||||
Non same-center cash NOI | (35,497 | ) | (9,001 | ) | |||
Same-center cash NOI | $ | 125,658 | $ | 119,310 | |||
______________________
(1) | Includes straight-line rents, amortization of above-market and below-market lease intangibles, anchor lease termination fees, net of contractual amounts, and expense and recovery adjustments related to prior periods. |
During the year ended December 31, 2016, the Company generated same-center cash NOI of approximately $125.7 million compared to same-center cash NOI of approximately $119.3 million generated during the year ended December 31, 2015, representing a 5.3% increase. This increase is primarily due to an increase in base rents and recoveries, slightly offset by a decrease in other property income.
Critical Accounting Estimates
Critical accounting estimates are those that are both important to the presentation of the Company’s financial condition and results of operations and require management’s most difficult, complex or subjective judgments. Set forth below is a summary of the accounting estimates that management believes are critical to the preparation of the consolidated financial statements. This summary should be read in conjunction with the more complete discussion of the Company’s accounting policies included in Note 1 to the Company’s consolidated financial statements.
Revenue Recognition
The Company records base rents on a straight-line basis over the term of each lease. The excess of rents recognized over amounts contractually due pursuant to the underlying leases is included in tenant and other receivables on the accompanying consolidated balance sheets. Most leases contain provisions that require tenants to reimburse a pro-rata share of real estate taxes and certain common area expenses. Adjustments are also made throughout the year to tenant and other receivables and the related cost recovery income based upon the Company’s best estimate of the final amounts to be billed and collected. In addition, the Company also provides an allowance for future credit losses in connection with the deferred straight-line rent receivable.
Allowance for Doubtful Accounts
The allowance for doubtful accounts is established based on a quarterly analysis of the risk of loss on specific accounts. The analysis places particular emphasis on past-due accounts and considers information such as the nature and age of the receivables, the payment history of the tenants or other debtors, the financial condition of the tenants and any guarantors and management’s assessment of their ability to meet their lease obligations, the basis for any disputes and the status of related negotiations, among other things. Management’s estimates of the required allowance is subject to revision as these factors change and is sensitive to the effects of economic and market conditions on tenants, particularly those at retail properties. Estimates are used to establish reimbursements from tenants for common area maintenance, real estate tax and insurance costs. The Company analyzes the balance of its estimated accounts receivable for real estate taxes, common area maintenance and insurance for each of its properties by comparing actual recoveries versus actual expenses and any actual write-offs. Based on its analysis, the Company may record an additional amount in its allowance for doubtful accounts related to these items. In addition, the Company also provides an allowance for future credit losses in connection with the deferred straight-line rent receivable.
41
Real Estate Investments
Land, buildings, property improvements, furniture/fixtures and tenant improvements are recorded at cost. Expenditures for maintenance and repairs are charged to operations as incurred. Renovations and/or replacements, which improve or extend the life of the asset, are capitalized and depreciated over their estimated useful lives.
The Company recognizes the acquisition of real estate properties, including acquired tangible (consisting of land, buildings and improvements), and acquired intangible assets and liabilities (consisting of above-market and below-market leases and acquired in-place leases) at their fair value (for acquisitions meeting the definition of a business) and relative fair value (for acquisitions not meeting the definition of a business). Acquired lease intangible assets include above-market leases and acquired in-place leases, and acquired lease intangible liabilities represent below-market leases, in the accompanying consolidated balance sheets. The fair value of the tangible assets of an acquired property is determined by valuing the property as if it were vacant, which value is then allocated to land, buildings and improvements based on management’s determination of the relative fair values of these assets. In valuing an acquired property’s intangibles, factors considered by management include an estimate of carrying costs during the expected lease-up periods, and estimates of lost rental revenue during the expected lease-up periods based on its evaluation of current market demand. Management also estimates costs to execute similar leases, including leasing commissions, tenant improvements, legal and other related costs.
The value of in-place leases is measured by the excess of (i) the purchase price paid for a property after adjusting existing in-place leases to market rental rates, over (ii) the estimated fair value of the property as if vacant. Above-market and below-market lease values are recorded based on the present value (using a discount rate which reflects the risks associated with the leases acquired) of the difference between the contractual amounts to be received and management’s estimate of market lease rates, measured over the terms of the respective leases that management deemed appropriate at the time of acquisition. Such valuations include a consideration of the non-cancellable terms of the respective leases as well as any applicable renewal periods. The fair values associated with below-market rental renewal options are determined based on the Company’s experience and the relevant facts and circumstances that existed at the time of the acquisitions. The value of the above-market and below-market leases associated with the original lease term is amortized to rental income, over the terms of the respective leases. The value of in-place leases are amortized to expense over the remaining non-cancellable terms of the respective leases. If a lease were to be terminated prior to its stated expiration, all unamortized amounts relating to that lease would be recognized in operations at that time.
The Company is required to make subjective assessments as to the useful life of its properties for purposes of determining the amount of depreciation. These assessments have a direct impact on its net income.
Properties are depreciated using the straight-line method over the estimated useful lives of the assets. The estimated useful lives are as follows:
Buildings | 39-40 years |
Property Improvements | 10-20 years |
Furniture/Fixtures | 3-10 years |
Tenant Improvements | Shorter of lease term or their useful life |
Asset Impairment
The Company reviews long-lived assets for impairment whenever events or changes in circumstances indicate that the carrying amount of an asset may not be recoverable. Recoverability of assets to be held and used is measured by a comparison of the carrying amount of the asset to aggregate future net cash flows (undiscounted and without interest) expected to be generated by the asset. If such assets are considered impaired, the impairment to be recognized is measured by the amount by which the carrying amount of the assets exceed the fair value.
REIT Qualification Requirements
The Company elected to be taxed as a REIT under the Code, and believes that it has been organized and has operated in a manner that will allow it to continue to qualify for taxation as a REIT under the Code.
The Company is subject to a number of operational and organizational requirements to qualify and then maintain qualification as a REIT. If the Company does not qualify as a REIT, its income would become subject to U.S. federal, state and local income taxes at regular corporate rates that would be substantial and the Company may not be permitted to re-elect to qualify as a REIT for
42
four taxable years following the year that it failed to qualify as a REIT. The Company’s results of operations, liquidity and amounts distributable to stockholders would be significantly reduced.
Recent U.S. Federal Income Tax Legislation
On December 22, 2017, the Tax Cuts and Jobs Act (H.R. 1, the “TCJA”) was signed into law. The TCJA makes significant changes to U.S. federal income tax laws applicable to businesses and their owners, including REITs and their stockholders. Certain key provisions of the TCJA that could impact the Company and its stockholders, beginning in 2018, include the following:
• | Reduced Tax Rates. The highest individual U.S. federal income tax rate on ordinary income is reduced from 39.6% to 37% (through taxable years ending in 2025), and the maximum corporate income tax rate is reduced from 35% to 21%. In addition, individuals, trust, and estates that own the Company’s stock are permitted to deduct up to 20% of dividends received from the Company (other than dividends that are designated as capital gain dividends or qualified dividend income), generally resulting in an effective maximum U.S. federal income tax rate of 29.6% on such dividends (through taxable years ending in 2025). Furthermore, the amount that the Company is required to withhold on distributions to non-U.S. stockholders that are treated as attributable to gains from the Company’s sale or exchange of U.S. real property interests is reduced from 35% to 21%. |
• | Net Operating Losses. The Company may not use net operating losses generated beginning in 2018 to offset more than 80% of the Company’s taxable income (prior to the application of the dividends paid deduction). Net operating losses generated beginning in 2018 can be carried forward indefinitely but can no longer be carried back. |
• | Limitation on Interest Deductions. The amount of interest expense that certain taxpayers, including the Company and its taxable REIT subsidiary, may deduct for a taxable year is limited to the sum of (i) the taxpayer’s business interest income for the taxable year, and (ii) 30% of the taxpayer’s “adjusted taxable income” for the taxable year. For taxable years beginning before January 1, 2022, adjusted taxable income means earnings before interest, taxes, depreciation, and amortization (“EBITDA”); for taxable years beginning on or after January 1, 2022, adjusted taxable income is limited to earnings before interest and taxes (“EBIT”). Taxpayers engaged in certain real estate businesses, including real estate rental, operation, and management, can generally elect to be treated as an “electing real property trade or business,” in which case the limitation described above generally will not apply. It is expected that the Company or the Operating Partnership would be entitled to make this election. An electing real property trade or business is required to use the alternative depreciation system, which generally results in longer depreciation periods and therefore lower depreciation deductions for certain categories of tangible property. |
• | Alternative Minimum Tax. The corporate alternative minimum tax is eliminated. |
• | Income Accrual. The Company is required to recognize certain items of income for U.S. federal income tax purposes no later than the Company would report such items on its financial statements. This provision may override many of the U.S. federal income tax rules relating to the timing of income inclusions. The provision generally applies to taxable years beginning after December 31, 2017, but will apply with respect to income from a debt instrument having “original issue discount” for U.S. federal income tax purposes only for taxable years beginning after December 31, 2018. |
Liquidity and Capital Resources of the Company
In this “Liquidity and Capital Resources of the Company” section and in the “Liquidity and Capital Resources of the Operating Partnership” section, the term “the Company” refers to Retail Opportunity Investments Corp. on an unconsolidated basis, excluding the Operating Partnership.
The Company’s business is operated primarily through the Operating Partnership, of which the Company is the parent company, and which it consolidates for financial reporting purposes. Because the Company operates on a consolidated basis with the Operating Partnership, the section entitled “Liquidity and Capital Resources of the Operating Partnership” should be read in conjunction with this section to understand the liquidity and capital resources of the Company on a consolidated basis and how the Company is operated as a whole.
The Company issues public equity from time to time, but does not otherwise generate any capital itself or conduct any business itself, other than incurring certain expenses in operating as a public company. The Company itself does not hold any indebtedness other than guarantees of indebtedness of the Operating Partnership, and its only material assets are its ownership of direct or indirect partnership interests in the Operating Partnership and membership interest in Retail Opportunity Investments GP, LLC, the sole general partner of the Operating Partnership. Therefore, the consolidated assets and liabilities and the consolidated revenues
43
and expenses of the Company and the Operating Partnership are the same on their respective financial statements. However, all debt is held directly or indirectly by the Operating Partnership. The Company’s principal funding requirement is the payment of dividends on its common stock. The Company’s principal source of funding for its dividend payments is distributions it receives from the Operating Partnership.
As the parent company of the Operating Partnership, the Company, indirectly, has the full, exclusive and complete responsibility for the Operating Partnership’s day-to-day management and control. The Company causes the Operating Partnership to distribute such portion of its available cash as the Company may in its discretion determine, in the manner provided in the Operating Partnership’s partnership agreement.
The Company is a well-known seasoned issuer with an effective shelf registration statement filed in May 2016 that allows the Company to register unspecified various classes of debt and equity securities. As circumstances warrant, the Company may issue equity from time to time on an opportunistic basis, dependent upon market conditions and available pricing. Any proceeds from such equity issuances would be contributed to the Operating Partnership. The Operating Partnership may use the proceeds to acquire additional properties, pay down debt, and for general working capital purposes.
Liquidity is a measure of the Company’s ability to meet potential cash requirements, including ongoing commitments to repay borrowings, fund and maintain its assets and operations, make distributions to its stockholders and meet other general business needs. The liquidity of the Company is dependent on the Operating Partnership’s ability to make sufficient distributions to the Company. The primary cash requirement of the Company is its payment of dividends to its stockholders.
During the year ended December 31, 2017, the Company’s primary source of cash was distributions from the Operating Partnership. As of December 31, 2017, the Company has determined that it has adequate working capital to meet its dividend funding obligations for the next twelve months.
During the year ended December 31, 2014, ROIC entered into three separate Sales Agreements (the “Original Sales Agreements”) with each of Jefferies LLC, KeyBanc Capital Markets Inc. and Raymond James & Associates, Inc. (each individually, an “Original Agent” and collectively, the “Original Agents”) pursuant to which ROIC may sell, from time to time, shares of ROIC’s common stock, par value $0.0001 per share, having an aggregate offering price of up to $100.0 million through the Original Agents either as agents or principals. On May 23, 2016, ROIC entered into two additional sales agreements (the “Additional Sales Agreements”, and together with the Original Sales Agreements, the “Sales Agreements”) with each of Canaccord Genuity Inc. and Robert W. Baird & Co. Incorporated (the “Additional Agents”, and together with the Original Agents, the “Agents”) pursuant to which the Company may sell shares of ROIC’s common stock through the Additional Agents either as agents or principals. During the year ended December 31, 2017, ROIC sold a total of 34,001 shares of common stock under the Sales Agreements, which resulted in gross proceeds of approximately $681,000 and commissions of approximately $9,000 paid to the Agents.
For the year ended December 31, 2017, dividends paid to stockholders totaled approximately $82.9 million. Additionally, for the year ended December 31, 2017, the Operating Partnership made distributions of approximately $8.7 million to the non-controlling interest OP Unitholders. On a consolidated basis, cash flows from operations for the same period totaled approximately $128.3 million. For the year ended December 31, 2016, dividends paid to stockholders totaled approximately $75.7 million. Additionally, for the year ended December 31, 2016, the Operating Partnership made distributions of approximately $8.4 million to the non-controlling interest OP Unitholders. On a consolidated basis, cash flows from operations for the same period totaled approximately $114.7 million.
Potential future sources of capital include equity issuances and distributions from the Operating Partnership.
Liquidity and Capital Resources of the Operating Partnership
In this “Liquidity and Capital Resources of the Operating Partnership” section, the terms the “Operating Partnership,” “we”, “our” and “us” refer to the Operating Partnership together with its consolidated subsidiaries or the Operating Partnership and the Company together with their respective consolidated subsidiaries, as the context requires.
During the year ended December 31, 2017, the Operating Partnership’s primary sources of cash were (i) proceeds from the issuance of senior unsecured debt, (ii) cash flow from operations, (iii) proceeds from bank borrowings under the credit facility, and (iv) cash contributed by ROIC from the issuance of common stock. As of December 31, 2017, the Operating Partnership has determined that it has adequate working capital to meet its debt obligations and operating expenses for the next twelve months.
On September 29, 2015, the Company entered into a term loan agreement under which the lenders agreed to provide a $300.0 million unsecured term loan facility. Effective September 8, 2017, the Company entered into a First Amended and Restated Term
44
Loan Agreement (the “Term Loan Agreement”) pursuant to which the maturity date of the term loan was extended from January 31, 2019 to September 8, 2022, without further options for extension. The Term Loan Agreement also provides that the Company may from time to time request increased aggregate commitments of $200.0 million under certain conditions set forth in the Term Loan Agreement, including the consent of the lenders for the additional commitments. Borrowings under the Term Loan Agreement accrue interest on the outstanding principal amount at a rate equal to an applicable rate based on the credit rating level of the Company, plus, as applicable, (i) a LIBOR rate determined by reference to the cost of funds for U.S. dollar deposits for the relevant period (the “Eurodollar Rate”), or (ii) a base rate determined by reference to the highest of (a) the federal funds rate plus 0.50%, (b) the rate of interest announced by the Administrative Agent as its “prime rate,” and (c) the Eurodollar Rate plus 1.10%.
The Operating Partnership has an unsecured revolving credit facility with several banks. Effective September 8, 2017, the Company entered into a Second Amended and Restated Credit Agreement (the “Credit Facility Agreement”) pursuant to which the borrowing capacity was increased from $500.0 million to $600.0 million. The maturity date of the credit facility was extended from January 31, 2019 to September 8, 2021, with two six-month extension options, which may be exercised by the Operating Partnership upon satisfaction of certain conditions including the payment of extension fees. Additionally, the credit facility contains an accordion feature, which allows the Operating Partnership to increase the borrowing capacity up to an aggregate of $1.2 billion, subject to lender consents and other conditions. Borrowings under the credit facility accrue interest on the outstanding principal amount at a rate equal to an applicable rate based on the credit rating level of the Company, plus, as applicable, (i) the Eurodollar Rate, or (ii) a base rate determined by reference to the highest of (a) the federal funds rate plus 0.50%, (b) the rate of interest announced by KeyBank, National Association as its “prime rate,” and (c) the Eurodollar Rate plus 1.00%. Additionally, the Operating Partnership is obligated to pay a facility fee at a rate based on the credit rating level of the Company, currently 0.20%, and a fronting fee at a rate of 0.125% per year with respect to each letter of credit issued under the credit facility.
Both the term loan and credit facility contain customary representations, financial and other covenants. The Operating Partnership’s ability to borrow under the credit facility and term loan is subject to its compliance with financial covenants and other restrictions on an ongoing basis. The Operating Partnership was in compliance with such covenants at December 31, 2017.
As of December 31, 2017, $300.0 million and $143.5 million were outstanding under the term loan and credit facility, respectively. The average interest rates on the term loan and the credit facility during the year ended December 31, 2017 were 2.2% and 2.1%, respectively. The Company had no available borrowings under the term loan at December 31, 2017. The Company had $456.5 million available to borrow under the credit facility at December 31, 2017.
On November 10, 2017, the Operating Partnership entered into a Note Purchase Agreement which provided for the issuance of $250.0 million principal amount of 4.19% Senior Notes Due 2027 (the “Senior Notes Due 2027”) in a private placement effective December 15, 2017. The Senior Notes Due 2027 pay interest on June 15 and December 15 of each year, commencing on June 15, 2018, and mature on December 15, 2027, unless prepaid earlier by the Operating Partnership. The Operating Partnership’s performance of the obligations under the Note Purchase Agreement, including the payment of any outstanding indebtedness thereunder, are guaranteed, jointly and severally, by ROIC.
Further, the Operating Partnership issued $200.0 million aggregate principal amount of unsecured senior notes in September 2016, $250.0 million aggregate principal amount of unsecured senior notes in December 2014 and $250.0 million aggregate principal amount of unsecured senior notes in December 2013, each of which were fully and unconditionally guaranteed by ROIC.
While the Operating Partnership generally intends to hold its assets as long term investments, certain of its investments may be sold in order to manage the Operating Partnership’s interest rate risk and liquidity needs, meet other operating objectives and adapt to market conditions. The timing and impact of future sales of its investments, if any, cannot be predicted with any certainty.
Cash Flows
The following table summarizes, for the periods indicated, selected items in our consolidated statements of cash flows (in thousands):
Year Ended December 31, | |||||||||||
2017 | 2016 | 2015 | |||||||||
Net Cash Provided by (Used in): | |||||||||||
Operating activities | $ | 128,295 | $ | 114,682 | $ | 86,917 | |||||
Investing activities | $ | (322,607 | ) | $ | (325,090 | ) | $ | (337,115 | ) | ||
Financing activities | $ | 192,740 | $ | 214,689 | $ | 248,269 | |||||
45
Net Cash Flows from:
Operating Activities
Increase in cash flows provided by operating activities from 2016 to 2017:
Net cash flows provided by operating activities amounted to $128.3 million during the year ended December 31, 2017, compared to $114.7 million during the year ended December 31, 2016. During the year ended December 31, 2017, cash flows provided by operating activities increased by approximately $13.6 million primarily due to an increase in property operating income of approximately $24.5 million, offset by an increase in interest expense of approximately $10.2 million due to higher borrowing amounts in 2017 as compared to 2016.
Increase in cash flows provided by operating activities from 2015 to 2016:
Net cash flows provided by operating activities amounted to $114.7 million during the year ended December 31, 2016, compared to $86.9 million during the year ended December 31, 2015. During the year ended December 31, 2016, cash flows provided by operating activities increased by approximately $27.8 million primarily due to an increase in property operating income of approximately $35.4 million, offset by an increase in interest expense of approximately $6.5 million due to higher borrowing amounts in 2016 as compared to 2015.
Investing Activities
Decrease in cash flows used in investing activities from 2016 to 2017:
Net cash flows used by investing activities amounted to $322.6 million during the year ended December 31, 2017, compared to $325.1 million during the year ended December 31, 2016. During the year ended December 31, 2017, cash flows used in investing activities decreased approximately $2.5 million, primarily due to the decrease in investments in real estate of approximately $21.5 million, offset by an increase in improvements to properties of approximately $13.3 million and an increase in restricted cash of approximately $3.8 million of funds being held with an exchange accomodator under Section 1031 of the Code.
Decrease in cash flows used in investing activities from 2015 to 2016:
Net cash flows used by investing activities amounted to $325.1 million during the year ended December 31, 2016, compared to $337.1 million during the year ended December 31, 2015. During the year ended December 31, 2016, cash flows used in investing activities decreased approximately $12.0 million, primarily due to the decrease in investments in real estate of approximately $28.8 million, offset by an increase in improvements to properties of approximately $13.2 million.
Financing Activities
Decrease in cash flows provided by financing activities from 2016 to 2017:
Net cash flows provided by financing activities amounted to $192.7 million during the year ended December 31, 2017, compared to $214.7 million during the year ended December 31, 2016. During the year ended December 31, 2017, cash flows provided by financing activities decreased approximately $21.9 million, primarily due to a decrease of $180.4 million in proceeds from the sale of common stock, and an increase in dividends paid to common shareholders of approximately $7.2 million, offset by an increase of $50.0 million in proceeds received from the issuance of senior notes, a decrease of approximately $83.0 million in net payments on the credit facility, and a $38.7 million decrease in cash redemption of OP Units.
Decrease in cash flows provided by financing activities from 2015 to 2016:
Net cash flows provided by financing activities amounted to $214.7 million during the year ended December 31, 2016, compared to $248.3 million during the year ended December 31, 2015. During the year ended December 31, 2016, cash flows provided by financing activities decreased approximately $33.6 million, primarily due to a decrease of $300 million in proceeds from the term loan received during the year ended December 31, 2015, a net decrease of approximately $16.5 million in proceeds received from draws on the credit facility, a decrease of approximately $35.5 million in mortgage proceeds received during the year ended December 31, 2015, and an increase in cash redemption of OP units of approximately $38.8 million. These decreases were offset by proceeds received of $200.0 million related to the issuance of the Senior Notes Due 2026 during the year ended December 31,
46
2016, a decrease of approximately $76.5 million in principal repayments on mortgages and an increase of approximately $83.6 million in proceeds from the sale of common stock.
Contractual Obligations
The following table presents the Company’s operating lease obligations and the principal and interest amounts of the Company’s long-term debt maturing each year, including amortization of principal based on debt outstanding, at December 31, 2017 (in thousands):
2018 | 2019 | 2020 | 2021 | 2022 | Thereafter | Total | |||||||||||||||||||||
Contractual obligations: | |||||||||||||||||||||||||||
Mortgage Notes Payable Principal (1) | $ | 19,612 | $ | 550 | $ | 577 | $ | 717 | $ | 24,133 | $ | 60,731 | $ | 106,320 | |||||||||||||
Mortgage Notes Payable Interest | 4,335 | 3,796 | 3,774 | 3,737 | 3,170 | 5,100 | 23,912 | ||||||||||||||||||||
Term loan (2) | — | — | — | — | 300,000 | — | 300,000 | ||||||||||||||||||||
Credit facility (3) | — | — | — | 143,500 | — | — | 143,500 | ||||||||||||||||||||
Senior Notes Due 2027 (4) | 10,504 | 10,475 | 10,475 | 10,475 | 10,475 | 302,346 | 354,750 | ||||||||||||||||||||
Senior Notes Due 2026 (4) | 7,900 | 7,900 | 7,900 | 7,900 | 7,900 | 231,600 | 271,100 | ||||||||||||||||||||
Senior Notes Due 2024 (4) | 10,000 | 10,000 | 10,000 | 10,000 | 10,000 | 270,000 | 320,000 | ||||||||||||||||||||
Senior Notes Due 2023 (4) | 12,500 | 12,500 | 12,500 | 12,500 | 12,500 | 262,500 | 325,000 | ||||||||||||||||||||
Operating lease obligations | 1,273 | 1,278 | 1,286 | 1,282 | 1,304 | 35,347 | 41,770 | ||||||||||||||||||||
Total | $ | 66,124 | $ | 46,499 | $ | 46,512 | $ | 190,111 | $ | 369,482 | $ | 1,167,624 | $ | 1,886,352 | |||||||||||||
__________________
(1) | Does not include unamortized mortgage premium of approximately $1.9 million as of December 31, 2017. |
(2) | For the purpose of the above table, the Company has assumed that borrowings under the term loan accrue interest at the interest rate on the term loan as of December 31, 2017 which was 2.7%. Borrowings under the term loan accrue interest at a rate equal to an applicable rate based on the credit rating level of the Company, plus, as applicable (i) the Eurodollar Rate, or (ii) a base rate determined by reference to the highest of (a) the federal funds rate plus 0.50%, (b) the rate of interest announced by the Administrative Agent as its “prime rate,” and (c) the Eurodollar Rate plus 1.10%. |
(3) | For the purpose of the above table, the Company has assumed that borrowings under the credit facility accrue interest at the interest rate on the credit facility as of December 31, 2017 which was 2.6%. Borrowings under the credit facility accrue interest at a rate equal to an applicable rate based on the credit rating level of the Company, plus, as applicable (i) the Eurodollar Rate, or (ii) a base rate determined by reference to the highest of (a) the federal funds rate plus 0.50%, (b) the rate of interest announced by KeyBank, National Association as its “prime rate,” and (c) the Eurodollar Rate plus 1.00%. |
(4) | Represents payments of interest only in years 2018 through 2022 and payments of both principal and interest thereafter. |
The Company has committed approximately $16.3 million and $1.0 million in tenant improvements (including building and site improvements) and leasing commissions, respectively, for the new leases and renewals that occurred during the year ended December 31, 2017. As of December 31, 2017, the Company did not have any capital lease obligations.
The Company has entered into several lease agreements with an officer of the Company. Pursuant to the lease agreements, the Company is provided the use of storage space.
Off-Balance Sheet Arrangements
As of December 31, 2017, the Company does not have any off-balance sheet arrangements.
Real Estate Taxes
The Company’s leases generally require the tenants to be responsible for a pro rata portion of the real estate taxes.
47
Inflation
The Company’s long-term leases contain provisions to mitigate the adverse impact of inflation on its operating results. Such provisions include clauses entitling the Company to receive (a) scheduled base rent increases and (b) percentage rents based upon tenants’ gross sales which generally increase as prices rise. In addition, many of the Company’s non-anchor leases are for terms of less than ten years, which permits the Company to seek increases in rents upon renewal at then-current market rates if rents provided in the expiring leases are below then-existing market rates. Most of the Company’s leases require tenants to pay a share of operating expenses, including common area maintenance, real estate taxes, insurance and utilities, thereby reducing the Company’s exposure to increases in costs and operating expenses resulting from inflation.
Leverage Policies
The Company employs prudent amounts of leverage and uses debt as a means of providing additional funds for the acquisition of its properties and the diversification of its portfolio. The Company seeks to primarily utilize unsecured debt in order to maintain liquidity and flexibility in its capital structure.
On September 29, 2015, the Company entered into a term loan agreement under which the lenders agreed to provide a $300.0 million unsecured term loan facility. Effective September 8, 2017, the Company entered into a First Amended and Restated Term Loan Agreement (the “Term Loan Agreement”) pursuant to which the maturity date of the term loan was extended from January 31, 2019 to September 8, 2022, without further options for extension. The Term Loan Agreement also provides that the Company may from time to time request increased aggregate commitments of $200.0 million under certain conditions set forth in the Term Loan Agreement, including the consent of the lenders for the additional commitments. The Operating Partnership has an unsecured revolving credit facility with several banks. Effective September 8, 2017, the Company entered into a Second Amended and Restated Credit Agreement (the “Credit Facility Agreement”) pursuant to which the borrowing capacity was increased from $500.0 million to $600.0 million. The maturity date of the credit facility was extended from January 31, 2019 to September 8, 2021, with two six-month extension options, which may be exercised by the Operating Partnership upon satisfaction of certain conditions including the payment of extension fees. Additionally, the credit facility contains an accordion feature, which allows the Operating Partnership to increase the borrowing capacity up to an aggregate of $1.2 billion, subject to lender consents and other conditions.
On November 10, 2017, the Operating Partnership entered into a Note Purchase Agreement which provided for the issuance of $250.0 million principal amount of 4.19% Senior Notes Due 2027 (the “Senior Notes Due 2027”) in a private placement effective December 15, 2017. The Senior Notes Due 2027 pay interest on June 15 and December 15 of each year, commencing on June 15, 2018, and mature on December 15, 2027, unless prepaid earlier by the Operating Partnership. The Operating Partnership’s performance of the obligations under the Note Purchase Agreement, including the payment of any outstanding indebtedness thereunder, are guaranteed, jointly and severally, by ROIC.
Further, the Operating Partnership issued $200.0 million aggregate principal amount of unsecured senior notes in September 2016, $250.0 million aggregate principal amount of unsecured senior notes in December 2014 and $250.0 million aggregate principal amount of unsecured senior notes in December 2013, each of which were fully and unconditionally guaranteed by ROIC.
The Company may borrow on a non-recourse basis at the corporate level or Operating Partnership level. Non-recourse indebtedness means the indebtedness of the borrower or its subsidiaries is secured only by specific assets without recourse to other assets of the borrower or any of its subsidiaries. Even with non-recourse indebtedness, however, a borrower or its subsidiaries will likely be required to guarantee against certain breaches of representations and warranties such as those relating to the absence of fraud, misappropriation, misapplication of funds, environmental conditions and material misrepresentations. Because non-recourse financing generally restricts the lender’s claim on the assets of the borrower, the lender generally may only proceed against the asset securing the debt. This may protect the Company’s other assets.
The Company plans to evaluate each investment opportunity and determine the appropriate leverage on a case-by-case basis and also on a Company-wide basis. The Company may seek to refinance indebtedness, such as when a decline in interest rates makes it beneficial to prepay an existing mortgage, when an existing mortgage matures or if an attractive investment becomes available and the proceeds from the refinancing can be used to purchase the investment.
The Company plans to finance future acquisitions through a combination of operating cashflow, borrowings under the credit facility, the assumption of existing mortgage debt, the issuance of OP Units, equity and debt offerings, and the potential sale of existing assets. In addition, the Company may acquire retail properties indirectly through joint ventures with third parties as a means of increasing the funds available for the acquisition of properties.
48
Distributions
The Operating Partnership and ROIC intend to make regular quarterly distributions to holders of their OP Units and common stock, respectively. The Operating Partnership pays distributions to ROIC directly as a holder of units of the Operating Partnership, and indirectly to ROIC through distributions to Retail Opportunity Investments GP, LLC, a wholly owned subsidiary of ROIC. U.S. federal income tax law generally requires that a REIT distribute annually at least 90% of its REIT taxable income, without regard to the deduction for dividends paid and excluding net capital gains, and that it pay U.S. federal income tax at regular corporate rates to the extent that it annually distributes less than 100% of its net taxable income. ROIC intends to pay regular quarterly dividends to its stockholders in an amount not less than its net taxable income, if and to the extent authorized by its board of directors. If ROIC’s cash available for distribution is less than its net taxable income, ROIC could be required to sell assets or borrow funds to make cash distributions or the Company may make a portion of the required distribution in the form of a taxable stock distribution or distribution of debt securities.
Item 7A. Quantitative and Qualitative Disclosures About Market Risk
The Company’s primary market risk exposure is to changes in interest rates related to its debt. There is inherent rollover risk for borrowings as they mature and are renewed at current market rates. The extent of this risk is not quantifiable or predictable because of the variability of future interest rates and the Company’s future financing requirements.
As of December 31, 2017, the Company had $443.5 million of variable rate debt outstanding. The Company has primarily used fixed-rate debt and forward starting interest rate swaps to manage its interest rate risk. See the discussion under Note 11, “Derivative and Hedging Activities,” to the accompanying consolidated financial statements for certain quantitative details related to the interest rate swaps.
The Company entered into four interest rate swaps in order to economically hedge against the risk of rising interest rates that would affect the Company’s interest expense related to its future anticipated debt issuances as part of its overall borrowing program. The sensitivity analysis table presented below shows the estimated instantaneous parallel shift in the yield curve up and down by 50 and 100 basis points, respectively, on the clean market value of its interest rate derivatives as of December 31, 2017, exclusive of non-performance risk (in thousands).
Swap Notional | Less 100 basis points | Less 50 basis points | December 31, 2017 Value | Increase 50 basis points | Increase 100 basis points | |||||||||||||||
$50,000 | $ | (21 | ) | $ | 231 | $ | 480 | $ | 728 | $ | 974 | |||||||||
$50,000 | $ | 29 | $ | 281 | $ | 529 | $ | 777 | $ | 1,023 | ||||||||||
$100,000 | $ | (2,744 | ) | $ | (513 | ) | $ | 1,665 | $ | 3,784 | $ | 5,851 | ||||||||
$100,000 | $ | (2,744 | ) | $ | (513 | ) | $ | 1,665 | $ | 3,784 | $ | 5,851 | ||||||||
See Note 11 of the accompanying consolidated financial statements for a discussion on how the Company values derivative financial instruments. The Company calculates the value of its interest rate swaps based upon the present value of the future cash flows expected to be paid and received on each leg of the swap. The cash flows on the fixed leg of the swap are agreed to at inception and the cash flows on the floating leg of a swap change over time as interest rates change. To estimate the floating cash flows at each valuation date, the Company utilizes a forward curve which is constructed using LIBOR fixings, Eurodollar futures, and swap rates, which are observable in the market. Both the fixed and floating legs’ cash flows are discounted at market discount factors. For purposes of adjusting its derivative valuations, the Company incorporates the nonperformance risk for both itself and its counterparties to these contracts based upon management’s estimates of credit spreads, credit default swap spreads (if available) or IHS Markit ratings in order to derive a curve that considers the term structure of credit.
As a corporation that has elected to qualify as a REIT for U.S. federal income tax purposes, commencing with its taxable year ended December 31, 2010, ROIC’s future income, cash flows and fair values relevant to financial instruments are dependent upon prevailing market interest rates. Market risk refers to the risk of loss from adverse changes in market prices and interest rates. The Company will be exposed to interest rate changes primarily as a result of long-term debt used to acquire properties. The Company’s interest rate risk management objectives will be to limit the impact of interest rate changes on earnings and cash flows and to lower overall borrowing costs. To achieve these objectives, the Company expects to borrow primarily at fixed rates or variable rates with the lowest margins available and, in some cases, with the ability to convert variable rates to fixed rates. In addition, the Company can use derivative financial instruments to manage interest rate risk. The Company will not use derivatives for trading or speculative purposes and will only enter into contracts with major financial institutions based on their credit rating and
49
other factors. Currently, the Company uses four interest rate swaps to manage its interest rate risk. See Note 11 of the accompanying consolidated financial statements.
Item 8. Financial Statements and Supplementary Data
Index to Consolidated Financial Statements and Financial Statement Schedules
Page | |
Consolidated Financial Statements of Retail Opportunity Investments Corp.: | |
Consolidated Financial Statements of Retail Opportunity Investments Partnership, LP: | |
Schedules | |
All other schedules for which provision is made in the applicable accounting regulation of the Securities and Exchange Commission are not required under the related instructions or are inapplicable and therefore have been omitted.
50
REPORT OF INDEPENDENT REGISTERED PUBLIC ACCOUNTING FIRM
The Board of Directors and Stockholders of
Retail Opportunity Investments Corp.
Opinion on the Financial Statements
We have audited the accompanying consolidated balance sheets of Retail Opportunity Investments Corp. (the “Company”) as of December 31, 2017 and 2016, the related consolidated statements of operations and comprehensive income, equity, and cash flows for each of the three years in the period ended December 31, 2017 and the related notes and financial statement schedules listed in the Index at Item 8 (collectively referred to as the “consolidated financial statements”). In our opinion, the consolidated financial statements referred to above present fairly, in all material respects, the financial position of the Company at December 31, 2017 and 2016, and the results of its operations and its cash flows for each of the three years in the period ended December 31, 2017, in conformity with U.S. generally accepted accounting principles.
We also have audited, in accordance with the standards of the Public Company Accounting Oversight Board (United States) (PCAOB), the Company’s internal control over financial reporting as of December 31, 2017, based on criteria established in Internal Control – Integrated Framework issued by the Committee of Sponsoring Organizations of the Treadway Commission (2013 Framework) and our report dated February 22, 2018 expressed an unqualified opinion thereon.
Basis for Opinion
These financial statements are the responsibility of the Company’s management. Our responsibility is to express an opinion on the Company’s financial statements based on our audits. We are a public accounting firm registered with the PCAOB and are required to be independent with respect to the Company in accordance with the U.S. federal securities laws and the applicable rules and regulations of the Securities and Exchange Commission and the PCAOB.
We conducted our audits in accordance with the standards of the PCAOB. Those standards require that we plan and perform the audit to obtain reasonable assurance about whether the financial statements are free of material misstatement, whether due to error or fraud. Our audits included performing procedures to assess the risks of material misstatement of the financial statements, whether due to error or fraud, and performing procedures that respond to those risks. Such procedures included examining, on a test basis, evidence regarding the amounts and disclosures in the financial statements. Our audits also included evaluating the accounting principles used and significant estimates made by management, as well as evaluating the overall presentation of the financial statements. We believe that our audits provide a reasonable basis for our opinion.
/s/ Ernst & Young LLP
We have served as the Company’s auditor since 2010
San Diego, California
February 22, 2018
51
REPORT OF INDEPENDENT REGISTERED PUBLIC ACCOUNTING FIRM
The Board of Directors and Stockholders of
Retail Opportunity Investments Corp.
Opinion on Internal Control over Financial Reporting
We have audited Retail Opportunity Investments Corp.’s (the “Company”) internal control over financial reporting as of December 31, 2017, based on criteria established in Internal Control—Integrated Framework issued by the Committee of Sponsoring Organizations of the Treadway Commission (2013 Framework) (the COSO criteria). In our opinion, Retail Opportunity Investments Corp. maintained, in all material respects, effective internal control over financial reporting as of December 31, 2017, based on the COSO criteria.
We also have audited, in accordance with the standards of the Public Company Accounting Oversight Board (United States) (PCAOB), the consolidated balance sheets of Retail Opportunity Investments Corp. as of December 31, 2017 and 2016, and the related consolidated statements of operations and comprehensive income, equity, and cash flows for each of the three years in the period ended December 31, 2017 and the related notes and financial statement schedules listed in the index at Item 8 and our report dated February 22, 2018 expressed an unqualified opinion thereon.
Basis for Opinion
The Company’s management is responsible for maintaining effective internal control over financial reporting, and for its assessment of the effectiveness of internal control over financial reporting included in the accompanying Management’s Report on Internal Control over Financial Reporting. Our responsibility is to express an opinion on the Company’s internal control over financial reporting based on our audit. We are a public accounting firm registered with the PCAOB and are required to be independent with respect to the Company in accordance with the U.S. federal securities laws and the applicable rules and regulations of the Securities and Exchange Commission and the PCAOB.
We conducted our audit in accordance with the standards of the PCAOB. Those standards require that we plan and perform the audit to obtain reasonable assurance about whether effective internal control over financial reporting was maintained in all material respects.
Our audit included obtaining an understanding of internal control over financial reporting, assessing the risk that a material weakness exists, testing and evaluating the design and operating effectiveness of internal control based on the assessed risk, and performing such other procedures as we considered necessary in the circumstances. We believe that our audit provides a reasonable basis for our opinion.
Definition and Limitations of Internal Control Over Financial Reporting
A company’s internal control over financial reporting is a process designed to provide reasonable assurance regarding the reliability of financial reporting and the preparation of financial statements for external purposes in accordance with generally accepted accounting principles. A company’s internal control over financial reporting includes those policies and procedures that (1) pertain to the maintenance of records that, in reasonable detail, accurately and fairly reflect the transactions and dispositions of the assets of the company; (2) provide reasonable assurance that transactions are recorded as necessary to permit preparation of financial statements in accordance with generally accepted accounting principles, and that receipts and expenditures of the company are being made only in accordance with authorizations of management and directors of the company; and (3) provide reasonable assurance regarding prevention or timely detection of unauthorized acquisition, use, or disposition of the company’s assets that could have a material effect on the financial statements.
Because of its inherent limitations, internal control over financial reporting may not prevent or detect misstatements. Also, projections of any evaluation of effectiveness to future periods are subject to the risk that controls may become inadequate because of changes in conditions, or that the degree of compliance with the policies or procedures may deteriorate.
/s/ Ernst & Young LLP
San Diego, California
February 22, 2018
52
REPORT OF INDEPENDENT REGISTERED PUBLIC ACCOUNTING FIRM
The Partners of Retail Opportunity Investments Partnership, LP
Opinion on the Financial Statements
We have audited the accompanying consolidated balance sheets of Retail Opportunity Investments Partnership, LP (the “Operating Partnership”) as of December 31, 2017 and 2016, the related consolidated statements of operations and comprehensive income, Partners’ capital, and cash flows for each of the three years in the period ended December 31, 2017 and the related notes and financial statement schedules listed in the Index at Item 8 (collectively referred to as the “consolidated financial statements”). In our opinion, the consolidated financial statements referred to above present fairly, in all material respects, the financial position of the Operating Partnership at December 31, 2017 and 2016, and the results of its operations and its cash flows for each of the three years in the period ended December 31, 2017, in conformity with U.S. generally accepted accounting principles.
Basis for Opinion
These financial statements are the responsibility of the Operating Partnership’s management. Our responsibility is to express an opinion on the Operating Partnership’s financial statements based on our audits. We are a public accounting firm registered with the PCAOB and are required to be independent with respect to the Company in accordance with the U.S. federal securities laws and the applicable rules and regulations of the Securities and Exchange Commission and the PCAOB.
We conducted our audits in accordance with the standards of the PCAOB. Those standards require that we plan and perform the audit to obtain reasonable assurance about whether the financial statements are free of material misstatement, whether due to error or fraud. Our audits included performing procedures to assess the risks of material misstatement of the financial statements, whether due to error or fraud, and performing procedures that respond to those risks. Such procedures included examining, on a test basis, evidence regarding the amounts and disclosures in the financial statements. Our audits also included evaluating the accounting principles used and significant estimates made by management, as well as evaluating the overall presentation of the financial statements. We believe that our audits provide a reasonable basis for our opinion.
/s/ Ernst & Young LLP
We have served as the the Operating Partnership’s auditor since 2013
San Diego, California
February 22, 2018
53
RETAIL OPPORTUNITY INVESTMENTS CORP.
Consolidated Balance Sheets
(In thousands, except share data)
December 31, | |||||||
2017 | 2016 | ||||||
ASSETS | |||||||
Real Estate Investments: | |||||||
Land | $ | 878,797 | $ | 766,199 | |||
Building and improvements | 2,230,600 | 1,920,819 | |||||
3,109,397 | 2,687,018 | ||||||
Less: accumulated depreciation | 260,115 | 193,021 | |||||
Real Estate Investments, net | 2,849,282 | 2,493,997 | |||||
Cash and cash equivalents | 11,553 | 13,125 | |||||
Restricted cash | 5,412 | 125 | |||||
Tenant and other receivables, net | 43,257 | 35,820 | |||||
Deposits | 500 | — | |||||
Acquired lease intangible assets, net | 82,778 | 79,205 | |||||
Prepaid expenses | 2,853 | 3,317 | |||||
Deferred charges, net | 37,167 | 34,753 | |||||
Other | 6,396 | 2,627 | |||||
Total assets | $ | 3,039,198 | $ | 2,662,969 | |||
LIABILITIES AND EQUITY | |||||||
Liabilities: | |||||||
Term loan | $ | 298,816 | $ | 299,191 | |||
Credit facility | 140,329 | 95,654 | |||||
Senior Notes Due 2027 | 248,751 | — | |||||
Senior Notes Due 2026 | 199,752 | 199,727 | |||||
Senior Notes Due 2024 | 245,887 | 245,354 | |||||
Senior Notes Due 2023 | 245,696 | 245,051 | |||||
Mortgage notes payable | 107,915 | 71,303 | |||||
Acquired lease intangible liabilities, net | 178,984 | 154,958 | |||||
Accounts payable and accrued expenses | 18,638 | 18,294 | |||||
Tenants’ security deposits | 6,771 | 5,950 | |||||
Other liabilities | 18,018 | 11,922 | |||||
Total liabilities | 1,709,557 | 1,347,404 | |||||
Commitments and contingencies | |||||||
Equity: | |||||||
Preferred stock, $.0001 par value 50,000,000 shares authorized; none issued and outstanding | — | — | |||||
Common stock, $0.0001 par value, 500,000,000 shares authorized; 112,347,451 and 109,301,762 shares issued and outstanding at December 31, 2017 and December 31, 2016, respectively | 11 | 11 | |||||
Additional paid-in capital | 1,412,590 | 1,357,910 | |||||
Dividends in excess of earnings | (210,490 | ) | (165,951 | ) | |||
Accumulated other comprehensive loss | 1,856 | (3,729 | ) | ||||
Total Retail Opportunity Investments Corp. stockholders’ equity | 1,203,967 | 1,188,241 | |||||
Non-controlling interests | 125,674 | 127,324 | |||||
Total equity | 1,329,641 | 1,315,565 | |||||
Total liabilities and equity | $ | 3,039,198 | $ | 2,662,969 | |||
See accompanying notes to consolidated financial statements.
54
RETAIL OPPORTUNITY INVESTMENTS CORP.
Consolidated Statements of Operations and Comprehensive Income
(In thousands, except per share data)
Year Ended December 31, | |||||||||||
2017 | 2016 | 2015 | |||||||||
Revenues | |||||||||||
Base rents | $ | 210,564 | $ | 183,330 | $ | 148,622 | |||||
Recoveries from tenants | 58,818 | 51,454 | 40,562 | ||||||||
Other income | 3,878 | 2,405 | 3,515 | ||||||||
Total revenues | 273,260 | 237,189 | 192,699 | ||||||||
Operating expenses | |||||||||||
Property operating | 39,151 | 32,201 | 28,475 | ||||||||
Property taxes | 29,663 | 25,058 | 19,690 | ||||||||
Depreciation and amortization | 96,256 | 88,359 | 70,957 | ||||||||
General and administrative expenses | 14,103 | 13,120 | 12,650 | ||||||||
Acquisition transaction costs | 4 | 824 | 965 | ||||||||
Other expense | 418 | 456 | 627 | ||||||||
Total operating expenses | 179,595 | 160,018 | 133,364 | ||||||||
Operating income | 93,665 | 77,171 | 59,335 | ||||||||
Non-operating expenses | |||||||||||
Interest expense and other finance expenses | (50,977 | ) | (40,741 | ) | (34,243 | ) | |||||
Net income | 42,688 | 36,430 | 25,092 | ||||||||
Net income attributable to non-controlling interests | (4,211 | ) | (3,676 | ) | (1,228 | ) | |||||
Net Income Attributable to Retail Opportunity Investments Corp. | $ | 38,477 | $ | 32,754 | $ | 23,864 | |||||
Earnings per share – basic and diluted | $ | 0.35 | $ | 0.31 | $ | 0.25 | |||||
Dividends per common share | $ | 0.75 | $ | 0.72 | $ | 0.68 | |||||
Comprehensive income: | |||||||||||
Net income | $ | 42,688 | $ | 36,430 | $ | 25,092 | |||||
Other comprehensive income: | |||||||||||
Unrealized swap derivative gain arising during the period | 3,665 | 541 | — | ||||||||
Reclassification adjustment for amortization of interest expense included in net income | 1,920 | 2,473 | 2,139 | ||||||||
Other comprehensive income | 5,585 | 3,014 | 2,139 | ||||||||
Comprehensive income | 48,273 | 39,444 | 27,231 | ||||||||
Comprehensive income attributable to non-controlling interests | (4,211 | ) | (3,676 | ) | (1,228 | ) | |||||
Comprehensive income attributable to Retail Opportunity Investments Corp | $ | 44,062 | $ | 35,768 | $ | 26,003 | |||||
See accompanying notes to consolidated financial statements.
55
RETAIL OPPORTUNITY INVESTMENTS CORP.
Consolidated Statements of Equity
(In thousands, except share data)
Common Stock | Additional paid-in capital | Retained earnings (Accumulated deficit) | Accumulated other comprehensive loss | Non- controlling interests | Equity | |||||||||||||||||||||
Shares | Amount | |||||||||||||||||||||||||
Balance at December 31, 2014 | 92,991,333 | $ | 9 | $ | 1,013,561 | $ | (80,976 | ) | $ | (8,882 | ) | $ | 39,070 | $ | 962,782 | |||||||||||
Shares issued under the 2009 Plan | 381,577 | — | — | — | — | — | — | |||||||||||||||||||
Shares withheld for employee taxes | (78,570 | ) | — | (1,317 | ) | — | — | — | (1,317 | ) | ||||||||||||||||
Cancellation of restricted stock | (2,832 | ) | — | — | — | — | — | — | ||||||||||||||||||
Stock based compensation expense | — | — | 4,684 | — | — | — | 4,684 | |||||||||||||||||||
Issuance of OP Units to non-controlling interests | — | — | — | — | — | 116,640 | 116,640 | |||||||||||||||||||
Redemption of OP Units | 174,959 | — | 3,184 | — | — | (3,184 | ) | — | ||||||||||||||||||
Adjustment to non-controlling interests ownership in Operating Partnership | — | — | 49,609 | — | — | (49,609 | ) | — | ||||||||||||||||||
Proceeds from the issuance of common stock | 6,064,567 | 1 | 101,292 | — | — | — | 101,293 | |||||||||||||||||||
Registration expenditures | — | — | (4,618 | ) | — | — | — | (4,618 | ) | |||||||||||||||||
Cash dividends ($0.68 per share) | — | — | — | (65,718 | ) | — | (2,764 | ) | (68,482 | ) | ||||||||||||||||
Dividends payable to officers | — | — | — | (161 | ) | — | — | (161 | ) | |||||||||||||||||
Net income attributable to Retail Opportunity Investments Corp. | — | — | — | 23,864 | — | — | 23,864 | |||||||||||||||||||
Net income attributable to non-controlling interests | — | — | — | — | — | 1,228 | 1,228 | |||||||||||||||||||
Other comprehensive income | — | — | — | — | 2,139 | — | 2,139 | |||||||||||||||||||
Total | 99,531,034 | 10 | 1,166,395 | (122,991 | ) | (6,743 | ) | 101,381 | 1,138,052 | |||||||||||||||||
Less: Promissory note secured by equity | — | — | — | — | — | (6,710 | ) | (6,710 | ) | |||||||||||||||||
Balance at December 31, 2015 | 99,531,034 | 10 | 1,166,395 | (122,991 | ) | (6,743 | ) | 94,671 | 1,131,342 | |||||||||||||||||
Shares issued under the 2009 Plan | 341,306 | — | — | — | — | — | — | |||||||||||||||||||
Shares withheld for employee taxes | (76,262 | ) | — | (1,368 | ) | — | — | — | (1,368 | ) | ||||||||||||||||
Cancellation of restricted stock | (7,332 | ) | — | — | — | — | — | — | ||||||||||||||||||
Stock based compensation expense | — | — | 4,916 | — | — | — | 4,916 | |||||||||||||||||||
Issuance of OP Units to non-controlling interests | — | — | — | — | — | 48,175 | 48,175 | |||||||||||||||||||
Redemption of OP Units | 755,762 | — | 15,990 | — | — | (15,990 | ) | — | ||||||||||||||||||
Cash redemption for non-controlling interests | — | — | — | — | — | (7,182 | ) | (7,182 | ) | |||||||||||||||||
Adjustment to non-controlling interests ownership in Operating Partnership | — | — | (5,627 | ) | — | — | 5,627 | — | ||||||||||||||||||
Proceeds from the issuance of common stock | 8,757,254 | 1 | 184,880 | — | — | — | 184,881 | |||||||||||||||||||
Registration expenditures | — | — | (7,276 | ) | — | — | — | (7,276 | ) | |||||||||||||||||
Cash dividends ($0.72 per share) | — | — | — | (75,537 | ) | — | (8,363 | ) | (83,900 | ) | ||||||||||||||||
Dividends payable to officers | — | — | — | (177 | ) | — | — | (177 | ) | |||||||||||||||||
Net income attributable to Retail Opportunity Investments Corp. | — | — | — | 32,754 | — | — | 32,754 | |||||||||||||||||||
Net income attributable to non-controlling interests | — | — | — | — | — | 3,676 | 3,676 | |||||||||||||||||||
Other comprehensive income | — | — | — | — | 3,014 | — | 3,014 | |||||||||||||||||||
Total | 109,301,762 | 11 | 1,357,910 | (165,951 | ) | (3,729 | ) | 120,614 | 1,308,855 | |||||||||||||||||
Proceeds from repayment of promissory note receivable secured by equity | — | — | — | — | — | 6,710 | 6,710 | |||||||||||||||||||
Balance at December 31, 2016 | 109,301,762 | 11 | 1,357,910 | (165,951 | ) | (3,729 | ) | 127,324 | 1,315,565 | |||||||||||||||||
Shares issued under the 2009 Plan | 353,261 | — | 44 | — | — | — | 44 | |||||||||||||||||||
Shares withheld for employee taxes | (74,331 | ) | — | (1,571 | ) | — | — | — | (1,571 | ) | ||||||||||||||||
Cancellation of restricted stock | (1,999 | ) | — | — | — | — | — | — | ||||||||||||||||||
Stock based compensation expense | — | — | 6,190 | — | — | — | 6,190 | |||||||||||||||||||
Issuance of OP Units to non-controlling interests | — | — | — | — | — | 49,599 | 49,599 | |||||||||||||||||||
Redemption / Exchange of OP Units | 2,555,933 | — | 50,155 | — | — | (50,155 | ) | — | ||||||||||||||||||
Cash redemption for non-controlling interests | — | — | — | — | — | (150 | ) | (150 | ) | |||||||||||||||||
Adjustment to non-controlling interests ownership in Operating Partnership | — | — | (3,574 | ) | — | — | 3,574 | — | ||||||||||||||||||
Proceeds from the issuance of common stock | 212,825 | — | 4,481 | — | — | — | 4,481 | |||||||||||||||||||
Registration expenditures | — | — | (1,045 | ) | — | — | — | (1,045 | ) | |||||||||||||||||
Cash dividends ($0.75 per share) | — | — | — | (82,781 | ) | — | (8,729 | ) | (91,510 | ) | ||||||||||||||||
Dividends payable to officers | — | — | — | (235 | ) | — | — | (235 | ) | |||||||||||||||||
Net income attributable to Retail Opportunity Investments Corp. | — | — | — | 38,477 | — | — | 38,477 | |||||||||||||||||||
Net income attributable to non-controlling interests | — | — | — | — | — | 4,211 | 4,211 | |||||||||||||||||||
Other comprehensive income | — | — | — | — | 5,585 | — | 5,585 | |||||||||||||||||||
Balance at December 31, 2017 | 112,347,451 | $ | 11 | $ | 1,412,590 | $ | (210,490 | ) | $ | 1,856 | $ | 125,674 | $ | 1,329,641 | ||||||||||||
See accompanying notes to consolidated financial statements.
56
RETAIL OPPORTUNITY INVESTMENTS CORP.
Consolidated Statements of Cash Flows
(In thousands)
Year Ended December 31, | |||||||||||
2017 | 2016 | 2015 | |||||||||
CASH FLOWS FROM OPERATING ACTIVITIES | |||||||||||
Net income | $ | 42,688 | $ | 36,430 | $ | 25,092 | |||||
Adjustments to reconcile net income to cash provided by operating activities: | |||||||||||
Depreciation and amortization | 96,256 | 88,359 | 70,957 | ||||||||
Amortization of deferred financing costs and mortgage premiums, net | 2,026 | 2,088 | 662 | ||||||||
Straight-line rent adjustment | (6,176 | ) | (4,560 | ) | (5,013 | ) | |||||
Amortization of above and below market rent | (17,078 | ) | (13,847 | ) | (9,890 | ) | |||||
Amortization relating to stock based compensation | 6,190 | 4,916 | 4,684 | ||||||||
Provisions for tenant credit losses | 1,191 | 1,805 | 1,984 | ||||||||
Other noncash interest expense | 2,139 | 2,139 | 2,139 | ||||||||
Change in operating assets and liabilities: | |||||||||||
Restricted cash | (643 | ) | 66 | 264 | |||||||
Tenant and other receivables | (2,452 | ) | (4,412 | ) | (2,599 | ) | |||||
Prepaid expenses | 464 | (1,363 | ) | 501 | |||||||
Accounts payable and accrued expenses | 456 | 4,417 | 512 | ||||||||
Other assets and liabilities, net | 3,234 | (1,356 | ) | (2,376 | ) | ||||||
Net cash provided by operating activities | 128,295 | 114,682 | 86,917 | ||||||||
CASH FLOWS FROM INVESTING ACTIVITIES | |||||||||||
Investments in real estate | (263,366 | ) | (284,867 | ) | (313,623 | ) | |||||
Increase in restricted cash | (3,800 | ) | — | — | |||||||
Improvements to properties | (54,097 | ) | (40,758 | ) | (27,515 | ) | |||||
Deposits on real estate acquisitions, net | (500 | ) | 500 | 4,000 | |||||||
Construction escrows and other | (844 | ) | 35 | 23 | |||||||
Net cash used in investing activities | (322,607 | ) | (325,090 | ) | (337,115 | ) | |||||
CASH FLOWS FROM FINANCING ACTIVITIES | |||||||||||
Principal repayments on mortgages | (8,848 | ) | (7,816 | ) | (84,308 | ) | |||||
Proceeds from new mortgage loan | — | — | 35,500 | ||||||||
Proceeds from term loan | — | — | 300,000 | ||||||||
Proceeds from draws on credit facility | 327,500 | 332,500 | 430,000 | ||||||||
Payments on credit facility | (282,000 | ) | (370,000 | ) | (451,000 | ) | |||||
Proceeds from issuance of Senior Notes Due 2027 | 250,000 | — | — | ||||||||
Proceeds from issuance of Senior Notes Due 2026 | — | 200,000 | — | ||||||||
Issuance of promissory note receivable | — | — | (6,710 | ) | |||||||
Proceeds on repayment of promissory note receivable | — | 6,710 | — | ||||||||
Redemption of OP Units | (150 | ) | (38,820 | ) | — | ||||||
Distributions to OP Unitholders | (8,729 | ) | (8,363 | ) | (2,764 | ) | |||||
Deferred financing and other costs | (3,845 | ) | (266 | ) | (1,849 | ) | |||||
Proceeds from the sale of common stock | 4,481 | 184,881 | 101,293 | ||||||||
Registration expenditures | (1,225 | ) | (7,097 | ) | (4,739 | ) | |||||
Dividends paid to common shareholders | (82,917 | ) | (75,672 | ) | (65,837 | ) | |||||
Common shares issued under the 2009 Plan | 44 | — | — | ||||||||
Shares withheld for employee taxes | (1,571 | ) | (1,368 | ) | (1,317 | ) | |||||
Net cash provided by financing activities | 192,740 | 214,689 | 248,269 | ||||||||
Net (decrease) increase in cash and cash equivalents | (1,572 | ) | 4,281 | (1,929 | ) | ||||||
Cash and cash equivalents at beginning of period | 13,125 | 8,844 | 10,773 | ||||||||
Cash and cash equivalents at end of period | $ | 11,553 | $ | 13,125 | $ | 8,844 | |||||
Supplemental disclosure of cash activities: | |||||||||||
Cash paid on gross receipts and income for federal and state purposes | $ | 253 | $ | 206 | $ | 241 | |||||
Interest paid | $ | 46,271 | $ | 34,275 | $ | 31,996 | |||||
Other non-cash investing and financing activities: | |||||||||||
Issuance of OP Units in connection with acquisitions | $ | 49,599 | $ | 46,140 | $ | 150,315 | |||||
Fair value of assumed mortgages upon acquisition | $ | 46,034 | $ | 17,618 | $ | 19,024 | |||||
Intangible lease liabilities | $ | 45,456 | $ | 32,615 | $ | 37,480 | |||||
Interest rate swap asset | $ | 3,446 | $ | 875 | $ | — | |||||
Accrued real estate improvement costs | $ | 383 | $ | 601 | $ | 590 | |||||
Redemption / Exchange of OP Units | $ | 50,155 | $ | 15,990 | $ | 3,184 | |||||
See accompanying notes to consolidated financial statements.
57
RETAIL OPPORTUNITY INVESTMENTS PARTNERSHIP, LP
Consolidated Balance Sheets
(In thousands)
December 31, 2017 | December 31, 2016 | ||||||
ASSETS | |||||||
Real Estate Investments: | |||||||
Land | $ | 878,797 | $ | 766,199 | |||
Building and improvements | 2,230,600 | 1,920,819 | |||||
3,109,397 | 2,687,018 | ||||||
Less: accumulated depreciation | 260,115 | 193,021 | |||||
Real Estate Investments, net | 2,849,282 | 2,493,997 | |||||
Cash and cash equivalents | 11,553 | 13,125 | |||||
Restricted cash | 5,412 | 125 | |||||
Tenant and other receivables, net | 43,257 | 35,820 | |||||
Deposits | 500 | — | |||||
Acquired lease intangible assets, net | 82,778 | 79,205 | |||||
Prepaid expenses | 2,853 | 3,317 | |||||
Deferred charges, net | 37,167 | 34,753 | |||||
Other | 6,396 | 2,627 | |||||
Total assets | $ | 3,039,198 | $ | 2,662,969 | |||
LIABILITIES AND CAPITAL | |||||||
Liabilities: | |||||||
Term loan | $ | 298,816 | $ | 299,191 | |||
Credit facility | 140,329 | 95,654 | |||||
Senior Notes Due 2027 | 248,751 | — | |||||
Senior Notes Due 2026 | 199,752 | 199,727 | |||||
Senior Notes Due 2024 | 245,887 | 245,354 | |||||
Senior Notes Due 2023 | 245,696 | 245,051 | |||||
Mortgage notes payable | 107,915 | 71,303 | |||||
Acquired lease intangible liabilities, net | 178,984 | 154,958 | |||||
Accounts payable and accrued expenses | 18,638 | 18,294 | |||||
Tenants’ security deposits | 6,771 | 5,950 | |||||
Other liabilities | 18,018 | 11,922 | |||||
Total liabilities | 1,709,557 | 1,347,404 | |||||
Commitments and contingencies | |||||||
Capital: | |||||||
Partners’ capital, unlimited partnership units authorized: | |||||||
ROIC capital | 1,202,111 | 1,191,970 | |||||
Limited partners’ capital | 125,674 | 127,324 | |||||
Accumulated other comprehensive loss | 1,856 | (3,729 | ) | ||||
Total capital | 1,329,641 | 1,315,565 | |||||
Total liabilities and capital | $ | 3,039,198 | $ | 2,662,969 | |||
See accompanying notes to consolidated financial statements.
58
RETAIL OPPORTUNITY INVESTMENTS PARTNERSHIP, LP
Consolidated Statements of Operations and Comprehensive Income
(In thousands)
Year Ended December 31, | |||||||||||
2017 | 2016 | 2015 | |||||||||
Revenues | |||||||||||
Base rents | $ | 210,564 | $ | 183,330 | $ | 148,622 | |||||
Recoveries from tenants | 58,818 | 51,454 | 40,562 | ||||||||
Other income | 3,878 | 2,405 | 3,515 | ||||||||
Total revenues | 273,260 | 237,189 | 192,699 | ||||||||
Operating expenses | |||||||||||
Property operating | 39,151 | 32,201 | 28,475 | ||||||||
Property taxes | 29,663 | 25,058 | 19,690 | ||||||||
Depreciation and amortization | 96,256 | 88,359 | 70,957 | ||||||||
General and administrative expenses | 14,103 | 13,120 | 12,650 | ||||||||
Acquisition transaction costs | 4 | 824 | 965 | ||||||||
Other expense | 418 | 456 | 627 | ||||||||
Total operating expenses | 179,595 | 160,018 | 133,364 | ||||||||
Operating income | 93,665 | 77,171 | 59,335 | ||||||||
Non-operating expenses | |||||||||||
Interest expense and other finance expenses | (50,977 | ) | (40,741 | ) | (34,243 | ) | |||||
Net Income Attributable to Retail Opportunity Investments Partnership, LP | $ | 42,688 | $ | 36,430 | $ | 25,092 | |||||
Earnings per unit - basic and diluted | $ | 0.35 | $ | 0.31 | $ | 0.25 | |||||
Distributions per unit | $ | 0.75 | $ | 0.72 | $ | 0.68 | |||||
Comprehensive income: | |||||||||||
Net income attributable to Retail Opportunity Investments Partnership, LP | $ | 42,688 | $ | 36,430 | $ | 25,092 | |||||
Other comprehensive income: | |||||||||||
Unrealized swap derivative gain arising during the period | 3,665 | 541 | — | ||||||||
Reclassification adjustment for amortization of interest expense included in net income | 1,920 | 2,473 | 2,139 | ||||||||
Other comprehensive income | 5,585 | 3,014 | 2,139 | ||||||||
Comprehensive income attributable to Retail Opportunity Investments Partnership, LP | $ | 48,273 | $ | 39,444 | $ | 27,231 | |||||
See accompanying notes to consolidated financial statements.
59
RETAIL OPPORTUNITY INVESTMENTS PARTNERSHIP, LP
Consolidated Statements of Partners’ Capital
(In thousands, except unit data)
Limited Partner’s Capital (1) | ROIC Capital (2) | ||||||||||||||||||||
Units | Amount | Units | Amount | Accumulated other comprehensive loss | Capital | ||||||||||||||||
Balance at December 31, 2014 | 3,921,314 | $ | 39,070 | 92,991,333 | $ | 932,594 | $ | (8,882 | ) | $ | 962,782 | ||||||||||
OP Units issued under the 2009 Plan | — | — | 381,577 | — | — | — | |||||||||||||||
OP Units withheld for employee taxes | — | — | (78,570 | ) | (1,317 | ) | — | (1,317 | ) | ||||||||||||
Cancellation of OP Units | — | — | (2,832 | ) | — | — | — | ||||||||||||||
Stock based compensation expense | — | — | — | 4,684 | — | 4,684 | |||||||||||||||
Issuance of OP Units in connection with acquisition | 8,449,248 | 116,640 | — | — | — | 116,640 | |||||||||||||||
Equity redemption of OP Units | (174,959 | ) | (3,184 | ) | 174,959 | 3,184 | — | — | |||||||||||||
Adjustment to non-controlling interests ownership in Operating Partnership | — | (49,609 | ) | — | 49,609 | — | — | ||||||||||||||
Issuance of OP Units in connection with sale of common stock | — | — | 6,064,567 | 101,293 | — | 101,293 | |||||||||||||||
Registration expenditures | — | — | — | (4,618 | ) | — | (4,618 | ) | |||||||||||||
Cash distributions ($0.68 per unit) | — | (2,764 | ) | — | (65,718 | ) | — | (68,482 | ) | ||||||||||||
Distributions payable to officers | — | — | — | (161 | ) | — | (161 | ) | |||||||||||||
Net income attributable to Retail Opportunity Investments Partnership, LP | — | 1,228 | — | 23,864 | — | 25,092 | |||||||||||||||
Other comprehensive income | — | — | — | — | 2,139 | 2,139 | |||||||||||||||
Total | 12,195,603 | 101,381 | 99,531,034 | 1,043,414 | (6,743 | ) | 1,138,052 | ||||||||||||||
Less: Promissory note secured by capital | — | (6,710 | ) | — | — | — | (6,710 | ) | |||||||||||||
Balance at December 31, 2015 | 12,195,603 | 94,671 | 99,531,034 | 1,043,414 | (6,743 | ) | 1,131,342 | ||||||||||||||
OP Units issued under the 2009 Plan | — | — | 341,306 | — | — | — | |||||||||||||||
OP Units withheld for employee taxes | — | — | (76,262 | ) | (1,368 | ) | — | (1,368 | ) | ||||||||||||
Cancellation of OP Units | — | — | (7,332 | ) | — | — | — | ||||||||||||||
Stock based compensation expense | — | — | — | 4,916 | — | 4,916 | |||||||||||||||
Issuance of OP Units in connection with acquisitions | 2,434,833 | 48,175 | — | — | 48,175 | ||||||||||||||||
Equity redemption of OP Units | (755,762 | ) | (15,990 | ) | 755,762 | 15,990 | — | — | |||||||||||||
Cash redemption of OP Units | (2,206,613 | ) | (7,182 | ) | — | — | (7,182 | ) | |||||||||||||
Adjustment to non-controlling interests ownership in Operating Partnership | — | 5,627 | — | (5,627 | ) | — | — | ||||||||||||||
Issuance of OP Units in connection with sale of common stock | — | — | 8,757,254 | 184,881 | — | 184,881 | |||||||||||||||
Registration expenditures | — | — | — | (7,276 | ) | — | (7,276 | ) | |||||||||||||
Cash distributions ($0.72 per unit) | — | (8,363 | ) | — | (75,537 | ) | — | (83,900 | ) | ||||||||||||
Distributions payable to officers | — | — | — | (177 | ) | — | (177 | ) | |||||||||||||
Net income attributable to Retail Opportunity Investments Partnership, LP | — | 3,676 | — | 32,754 | — | 36,430 | |||||||||||||||
Other comprehensive income | — | — | — | — | 3,014 | 3,014 | |||||||||||||||
Total | 11,668,061 | 120,614 | 109,301,762 | 1,191,970 | (3,729 | ) | 1,308,855 | ||||||||||||||
Proceeds from repayment of promissory note receivable secured by capital | — | 6,710 | — | — | — | 6,710 | |||||||||||||||
Balance at December 31, 2016 | 11,668,061 | 127,324 | 109,301,762 | 1,191,970 | (3,729 | ) | 1,315,565 | ||||||||||||||
OP units issued under the 2009 Plan | — | — | 353,261 | 44 | — | 44 | |||||||||||||||
OP Units withheld for employee taxes | — | — | (74,331 | ) | (1,571 | ) | — | (1,571 | ) | ||||||||||||
Cancellation of OP Units | — | — | (1,999 | ) | — | — | — | ||||||||||||||
Stock based compensation expense | — | — | — | 6,190 | — | 6,190 | |||||||||||||||
Issuance of OP Units in connection with acquisitions | 2,573,927 | 49,599 | — | — | — | 49,599 | |||||||||||||||
Equity redemption of OP Units | (2,555,933 | ) | (50,155 | ) | 2,555,933 | 50,155 | — | — | |||||||||||||
Cash redemption of OP Units | (7,064 | ) | (150 | ) | — | — | — | (150 | ) | ||||||||||||
Adjustment to non-controlling interests ownership in Operating Partnership | — | 3,574 | — | (3,574 | ) | — | — | ||||||||||||||
Issuance of OP Units in connection with sale of common stock | — | — | 212,825 | 4,481 | — | 4,481 | |||||||||||||||
Registration expenditures | — | — | — | (1,045 | ) | — | (1,045 | ) | |||||||||||||
Cash distributions ($0.75 per unit) | — | (8,729 | ) | — | (82,781 | ) | — | (91,510 | ) | ||||||||||||
Distributions payable to officers | — | — | — | (235 | ) | — | (235 | ) | |||||||||||||
Net income attributable to Retail Opportunity Investments Partnership, LP | — | 4,211 | — | 38,477 | — | 42,688 | |||||||||||||||
Other comprehensive income | — | — | — | — | 5,585 | 5,585 | |||||||||||||||
Balance at December 31, 2017 | 11,678,991 | $ | 125,674 | 112,347,451 | $ | 1,202,111 | $ | 1,856 | $ | 1,329,641 | |||||||||||
(1) | Consists of limited partnership interests held by third parties. |
(2) | Consists of general and limited partnership interests held by ROIC. |
See accompanying notes to consolidated financial statements.
60
RETAIL OPPORTUNITY INVESTMENTS PARTNERSHIP, LP
Consolidated Statements of Cash Flows
(In thousands)
Year Ended December 31, | |||||||||||
2017 | 2016 | 2015 | |||||||||
CASH FLOWS FROM OPERATING ACTIVITIES | |||||||||||
Net income | $ | 42,688 | $ | 36,430 | $ | 25,092 | |||||
Adjustments to reconcile net income to cash provided by operating activities: | |||||||||||
Depreciation and amortization | 96,256 | 88,359 | 70,957 | ||||||||
Amortization of deferred financing costs and mortgage premiums, net | 2,026 | 2,088 | 662 | ||||||||
Straight-line rent adjustment | (6,176 | ) | (4,560 | ) | (5,013 | ) | |||||
Amortization of above and below market rent | (17,078 | ) | (13,847 | ) | (9,890 | ) | |||||
Amortization relating to stock based compensation | 6,190 | 4,916 | 4,684 | ||||||||
Provisions for tenant credit losses | 1,191 | 1,805 | 1,984 | ||||||||
Other noncash interest expense | 2,139 | 2,139 | 2,139 | ||||||||
Change in operating assets and liabilities: | |||||||||||
Restricted cash | (643 | ) | 66 | 264 | |||||||
Tenant and other receivables | (2,452 | ) | (4,412 | ) | (2,599 | ) | |||||
Prepaid expenses | 464 | (1,363 | ) | 501 | |||||||
Accounts payable and accrued expenses | 456 | 4,417 | 512 | ||||||||
Other assets and liabilities, net | 3,234 | (1,356 | ) | (2,376 | ) | ||||||
Net cash provided by operating activities | 128,295 | 114,682 | 86,917 | ||||||||
CASH FLOWS FROM INVESTING ACTIVITIES | |||||||||||
Investments in real estate | (263,366 | ) | (284,867 | ) | (313,623 | ) | |||||
Increase in restricted cash | (3,800 | ) | — | — | |||||||
Improvements to properties | (54,097 | ) | (40,758 | ) | (27,515 | ) | |||||
Deposits on real estate acquisitions, net | (500 | ) | 500 | 4,000 | |||||||
Construction escrows and other | (844 | ) | 35 | 23 | |||||||
Net cash used in investing activities | (322,607 | ) | (325,090 | ) | (337,115 | ) | |||||
CASH FLOWS FROM FINANCING ACTIVITIES | |||||||||||
Principal repayments on mortgages | (8,848 | ) | (7,816 | ) | (84,308 | ) | |||||
Proceeds from new mortgage loan | — | — | 35,500 | ||||||||
Proceeds from term loan | — | — | 300,000 | ||||||||
Proceeds from draws on credit facility | 327,500 | 332,500 | 430,000 | ||||||||
Payments on credit facility | (282,000 | ) | (370,000 | ) | (451,000 | ) | |||||
Proceeds from issuance of Senior Notes Due 2027 | 250,000 | — | — | ||||||||
Proceeds from issuance of Senior Notes Due 2026 | — | 200,000 | — | ||||||||
Issuance of promissory note receivable | — | — | (6,710 | ) | |||||||
Proceeds on repayment of promissory note receivable | — | 6,710 | — | ||||||||
Redemption of OP Units | (150 | ) | (38,820 | ) | — | ||||||
Deferred financing and other costs | (3,845 | ) | (266 | ) | (1,849 | ) | |||||
Proceeds from the issuance of OP Units in connection with issuance of common stock | 4,481 | 184,881 | 101,293 | ||||||||
Registration expenditures | (1,225 | ) | (7,097 | ) | (4,739 | ) | |||||
Distributions to OP Unitholders | (91,646 | ) | (84,035 | ) | (68,601 | ) | |||||
Issuance of OP Units under the 2009 Plan | 44 | — | — | ||||||||
OP Units withheld for employee taxes | (1,571 | ) | (1,368 | ) | (1,317 | ) | |||||
Net cash provided by financing activities | 192,740 | 214,689 | 248,269 | ||||||||
Net (decrease) increase in cash and cash equivalents | (1,572 | ) | 4,281 | (1,929 | ) | ||||||
Cash and cash equivalents at beginning of period | 13,125 | 8,844 | 10,773 | ||||||||
Cash and cash equivalents at end of period | $ | 11,553 | $ | 13,125 | $ | 8,844 | |||||
Supplemental disclosure of cash activities: | |||||||||||
Cash paid on gross receipts and income for federal and state purposes | $ | 253 | $ | 206 | $ | 241 | |||||
Interest paid | $ | 46,271 | $ | 34,275 | $ | 31,996 | |||||
Other non-cash investing and financing activities: | |||||||||||
Issuance of OP Units in connection with acquisitions | $ | 49,599 | $ | 46,140 | $ | 150,315 | |||||
Fair value of assumed mortgages upon acquisition | $ | 46,034 | $ | 17,618 | $ | 19,024 | |||||
Intangible lease liabilities | $ | 45,456 | $ | 32,615 | $ | 37,480 | |||||
Interest rate swap asset | $ | 3,446 | $ | 875 | $ | — | |||||
Accrued real estate improvement costs | $ | 383 | $ | 601 | $ | 590 | |||||
Redemption / Exchange of OP Units | $ | 50,155 | $ | 15,990 | $ | 3,184 | |||||
See accompanying notes to consolidated financial statements.
61
NOTES TO CONSOLIDATED FINANCIAL STATEMENTS
1. Organization, Basis of Presentation and Summary of Significant Accounting Policies
Business
Retail Opportunity Investments Corp., a Maryland corporation (“ROIC”), is a fully integrated and self-managed real estate investment trust (“REIT”). ROIC specializes in the acquisition, ownership and management of necessity-based community and neighborhood shopping centers on the west coast of the United States anchored by supermarkets and drugstores.
ROIC is organized in a traditional umbrella partnership real estate investment trust (“UpREIT”) format pursuant to which Retail Opportunity Investments GP, LLC, its wholly-owned subsidiary, serves as the general partner of, and ROIC conducts substantially all of its business through, its operating partnership subsidiary, Retail Opportunity Investments Partnership, LP, a Delaware limited partnership (the “Operating Partnership”), together with its subsidiaries. Unless otherwise indicated or unless the context requires otherwise, all references to the “Company”, “we,” “us,” “our,” or “our company” refer to ROIC together with its consolidated subsidiaries, including the Operating Partnership.
With the approval of its stockholders, ROIC reincorporated as a Maryland corporation on June 2, 2011. ROIC began operations as a Delaware corporation, known as NRDC Acquisition Corp., which was incorporated on July 10, 2007, for the purpose of acquiring assets or operating businesses through a merger, capital stock exchange, stock purchase, asset acquisition or other similar business combination with one or more assets or control of one or more operating businesses. On October 20, 2009, ROIC’s stockholders and warrantholders approved each of the proposals presented at the special meetings of stockholders and warrantholders, respectively, in connection with the transactions contemplated by the Framework Agreement (the “Framework Agreement”) ROIC entered into on August 7, 2009 with NRDC Capital Management, LLC, which, among other things, set forth the steps to be taken by ROIC to continue its business as a corporation that has elected to qualify as a REIT for U.S. federal income tax purposes.
ROIC’s only material asset is its ownership of direct or indirect partnership interests in the Operating Partnership and membership interest in Retail Opportunity Investments GP, LLC, which is the sole general partner of the Operating Partnership. As a result, ROIC does not conduct business itself, other than acting as the parent company and issuing equity from time to time. The Operating Partnership holds substantially all the assets of the Company and directly or indirectly holds the ownership interests in the Company’s real estate ventures. The Operating Partnership conducts the operations of the Company’s business and is structured as a partnership with no publicly traded equity. Except for net proceeds from equity issuances by ROIC, which are contributed to the Operating Partnership, the Operating Partnership generates the capital required by the Company’s business through the Operating Partnership’s operations, by the Operating Partnership’s incurrence of indebtedness (directly and through subsidiaries) or through the issuance of operating partnership units (“OP Units”) of the Operating Partnership.
Recent Accounting Pronouncements
In August 2017, the Financial Accounting Standards Board issued Accounting Standards Update (“ASU”) 2017-12, “Derivatives and Hedging: Targeted Improvements to Accounting for Hedging Activities.” The pronouncement was issued to simplify the on-going assessment of hedge effectiveness and increase transparency related to hedge accounting. The pronouncement is effective for fiscal years, and for interim periods within those fiscal years, beginning after December 15, 2018, with early adoption permitted. The Company adopted the provisions of ASU No. 2017-12 effective July 1, 2017 using the modified retrospective approach. The Company determined there is no impact to the Company’s historical results as a result of adoption of the new standard and therefore no adjustment to retained earnings from application of the ASU.
In January 2017, the FASB issued ASU No. 2017-1, “Business Combinations: Clarifying the Definition of a Business.” The pronouncement changes the definition of a business to assist entities with evaluating when a set of transferred assets and activities is a business. The pronouncement requires an entity to evaluate if substantially all of the fair value of the gross assets acquired is concentrated in a single identifiable asset or a group of similar identifiable assets; if so, the set of transferred assets and activities is not a business. The pronouncement is effective for fiscal years, and for interim periods within those fiscal years, beginning after December 15, 2018, with early adoption permitted. The Company adopted the provisions of ASU 2017-1 effective October 1, 2016. For the period from October 1, 2016 through December 31, 2017, for the Company’s acquisitions it was concluded substantially all of the fair value of the assets acquired with each property acquisition was concentrated in a single identifiable asset and did not meet the definition of a business under ASU No. 2017-1. Acquisition transaction costs associated with these property acquisitions were capitalized to real estate investments.
62
In February 2016, the FASB issued ASU No. 2016-2, “Leases.” ASU No. 2016-2 is expected to result in the recognition of a right-to-use asset and related liability to account for future obligations under ground lease agreements for which the Company is the lessee. As of December 31, 2017, the remaining contractual payments under ground lease agreements aggregated approximately $41.8 million. In addition, this ASU will require that lessees and lessors capitalize, as initial direct costs, only those costs that are incurred due to the execution of a lease. Allocated payroll costs and other costs that are incurred regardless of whether the lease is obtained will no longer be capitalized as initial direct costs and instead will be expensed as incurred.
As a lessor, under current accounting standards, the Company recognizes rental revenue from its operating leases on a straight-line basis over the respective lease terms. The Company commences recognition of rental revenue at the date the property is ready for its intended use and the tenant takes possession of or controls the physical use of the property. Under current accounting standards, tenant recoveries related to payments of real estate taxes, insurance, utilities, repairs and maintenance, common area expenses, and other operating expenses are considered lease components. The Company recognizes these tenant recoveries as revenue when services are rendered in an amount equal to the related operating expenses incurred that are recoverable under the terms of the applicable lease.
Under ASU 2016-2, each lease agreement will be evaluated to identify the lease components and nonlease components at lease inception. The total consideration in the lease agreement will be allocated to the lease and nonlease components based on their relative standalone selling prices. Lessors will continue to recognize the lease revenue component using an approach that is substantially equivalent to existing guidance for operating leases (straight-line basis). In January 2018, the FASB issued a proposed amendment to ASU No. 2016-2 that would allow lessors to elect, as a practical expedient, not to allocate the total consideration to lease and nonlease components based on their relative standalone selling prices. If adopted, this practical expedient will allow lessors to elect a combined single lease component presentation if (i) the timing and pattern of the revenue recognition of the combined single lease component is the same, and (ii) the related lease component and, the combined single lease component would be classified as an operating lease.
The pronouncement is effective for fiscal years, and for interim periods within those fiscal years, beginning after December 15, 2018, with early adoption permitted. The Company plans to adopt the provisions of ASU No. 2016-2 effective January 1, 2019 using the modified retrospective approach. The Company continues to evaluate the impact this pronouncement will have on the Company’s consolidated financial statements.
In May 2014, the FASB issued ASU No. 2014-9, “Revenue from Contracts with Customers.” The pronouncement was issued to clarify the principles for recognizing revenue and to develop a common revenue standard and disclosure requirements for U.S. GAAP and International Financial Reporting Standards. The pronouncement is effective for reporting periods beginning after December 15, 2017. The Company will adopt the provisions of ASU No. 2014-9 effective January 1, 2018 using the modified retrospective approach. As discussed above, leases are specifically excluded from ASU No. 2014-9 and will be governed by the applicable lease codification; however, this update may have implications on certain variable payment terms included in lease agreements. Upon adoption of ASU No. 2016-2 in 2019, the Company may be required to classify its tenant recoveries into lease and nonlease components, whereby the nonlease components would be subject to the revenue recognition ASU, pending the resolution of the proposed amendment issued by the FASB in January 2018. Property services categorized as nonlease components that are reimbursed by the Company’s tenants may need to be presented on a net basis if it is determined that the Company holds an agent arrangement.
The Company evaluated the revenue recognition for all contracts within this scope under existing accounting standards and under ASU No. 2014-9 and confirmed that there were no differences in the amounts recognized or the pattern of recognition. Therefore, the adoption of this ASU did not result in an adjustment to the Company’s retained earnings on January 1, 2018.
Principles of Consolidation
The accompanying consolidated financial statements are prepared on the accrual basis in accordance with GAAP. In the opinion of management, the consolidated financial statements include all adjustments necessary, which are of a normal and recurring nature, for the fair presentation of the Company’s financial position and the results of operations and cash flows for the periods presented.
The consolidated financial statements include the accounts of the Company and those of its subsidiaries, which are wholly-owned or controlled by the Company. Entities which the Company does not control through its voting interest and entities which are variable interest entities (“VIEs”), but where it is not the primary beneficiary, are accounted for under the equity method. All significant intercompany balances and transactions have been eliminated.
63
The Company follows the FASB guidance for determining whether an entity is a VIE and requires the performance of a qualitative rather than a quantitative analysis to determine the primary beneficiary of a VIE. Under this guidance, an entity would be required to consolidate a VIE if it has (i) the power to direct the activities that most significantly impact the entity’s economic performance and (ii) the obligation to absorb losses of the VIE or the right to receive benefits from the VIE that could be significant to the VIE. Effective January 1, 2016, the Company adopted the provisions of ASU No 2015-2, and as a result, concluded that the Operating Partnership is a VIE. The Company has concluded that because they have both the power and the rights to control the Operating Partnership, they are the primary beneficiary and are required to continue to consolidate the Operating Partnership.
A non-controlling interest in a consolidated subsidiary is defined as the portion of the equity (net assets) in a subsidiary not attributable, directly or indirectly, to a parent. Non-controlling interests are required to be presented as a separate component of equity in the consolidated balance sheet and modifies the presentation of net income by requiring earnings and other comprehensive income to be attributed to controlling and non-controlling interests.
Use of Estimates
The preparation of financial statements in conformity with GAAP requires management to make estimates and assumptions that affect the disclosure of contingent assets and liabilities, the reported amounts of assets and liabilities at the date of the financial statements, and the reported amounts of revenue and expenses during the periods covered by the financial statements. The most significant assumptions and estimates relate to the purchase price allocations, depreciable lives, revenue recognition and the collectability of tenant receivables, other receivables, notes receivables, the valuation of performance-based restricted stock, and derivatives. Actual results could differ from these estimates.
Federal Income Taxes
The Company has elected to qualify as a REIT under Sections 856-860 of the Internal Revenue Code (the “Code”). Under those sections, a REIT that, among other things, distributes at least 90% of its REIT taxable income (determined without regard to the dividends paid deduction and excluding net capital gains) and meets certain other qualifications prescribed by the Code, will not be taxed on that portion of its taxable income that is distributed.
Although it may qualify as a REIT for U.S. federal income tax purposes, the Company is subject to state income or franchise taxes in certain states in which some of its properties are located. In addition, taxable income from non-REIT activities managed through the Company’s taxable REIT subsidiary (“TRS”), if any, is fully subject to U.S. federal, state and local income taxes. For all periods from inception through September 26, 2013 the Operating Partnership had been an entity disregarded from its sole owner, ROIC, for U.S. federal income tax purposes and as such had not been subject to U.S. federal income taxes. Effective September 27, 2013, the Operating Partnership issued OP Units in connection with the acquisitions of two shopping centers. Accordingly, the Operating Partnership ceased being a disregarded entity and instead is being treated as a partnership for U.S. federal income tax purposes.
The Company follows the FASB guidance that defines a recognition threshold and measurement attribute for the financial statement recognition and measurement of a tax position taken or expected to be taken in a tax return. The FASB also provides guidance on de-recognition, classification, interest and penalties, accounting in interim periods, disclosure, and transition. The Company records interest and penalties relating to unrecognized tax benefits, if any, as interest expense. As of December 31, 2017, the statute of limitations for tax years 2014 through and including 2016 remain open for examination by the Internal Revenue Service (“IRS”) and state taxing authorities.
ROIC intends to make regular quarterly distributions to holders of its common stock. U.S. federal income tax law generally requires that a REIT distribute annually at least 90% of its REIT taxable income, without regard to the deduction for dividends paid and excluding net capital gains, and that it pay U.S. federal income tax at regular corporate rates to the extent that it annually distributes less than 100% of its net taxable income. ROIC intends to pay regular quarterly dividends to stockholders in an amount not less than its net taxable income, if and to the extent authorized by its board of directors. Before ROIC pays any dividend, whether for U.S. federal income tax purposes or otherwise, it must first meet both its operating requirements and its debt service on debt. If ROIC’s cash available for distribution is less than its net taxable income, it could be required to sell assets or borrow funds to make cash distributions or it may make a portion of the required distribution in the form of a taxable stock distribution or distribution of debt securities.
On December 22, 2017, the Tax Cuts and Jobs Act (H.R. 1, the “TCJA”) was signed into law, which makes significant changes to U.S. federal income tax laws applicable to businesses and their owners, including REITs and their stockholders. The Company continues to evaluate the impact the TCJA will have on its consolidated financial statements.
64
Real Estate Investments
All costs related to the improvement or replacement of real estate properties are capitalized. Additions, renovations and improvements that enhance and/or extend the useful life of a property are also capitalized. Expenditures for ordinary maintenance, repairs and improvements that do not materially prolong the normal useful life of an asset are charged to operations as incurred. During the years ended December 31, 2017 and 2016, capitalized costs related to the improvements or replacement of real estate properties were approximately $54.5 million and $41.4 million, respectively.
The Company expenses transaction costs associated with business combinations and unsuccessful property asset acquisitions in the period incurred and capitalizes transaction costs associated with successful property asset acquisitions. In conjunction with the Company’s pursuit and acquisition of real estate investments, the Company expensed acquisition transaction costs during the years ended December 31, 2017, 2016 and 2015 of approximately $4,000, $824,000 and $965,000, respectively.
The Company evaluates each acquisition of real estate to determine if the acquired property meets the definition of a business and needs to be accounted for as a business combination. Under ASU 2017-1, the Company first determines whether substantially all of the fair value of the gross assets acquired is concentrated in a single identifiable asset or group of similar identifiable assets. If this threshold is met, the acquired property does not meet the definition of a business and is accounted for as an asset acquisition. The Company expects that acquisitions of real estate properties will not meet the revised definition of a business because substantially all of the fair value is concentrated in a single identifiable asset or group of similar identifiable assets (i.e. land, buildings, and related intangible assets).
The Company recognizes the acquisition of real estate properties, including acquired tangible (consisting of land, buildings and improvements), and acquired intangible assets and liabilities (consisting of above-market and below-market leases and acquired in-place leases) at their fair value (for acquisitions meeting the definition of a business) and relative fair value (acquisitions not meeting the definition of a business). The relative fair values used to allocate the cost of an asset acquisition are determined using the same methodologies and assumptions the Company utilizes to determine fair value in a business combination.
Acquired lease intangible assets include above-market leases and acquired in-place leases, and acquired lease intangible liabilities represent below-market leases, in the accompanying consolidated balance sheets. The fair value of the tangible assets of an acquired property is determined by valuing the property as if it were vacant, which value is then allocated to land, buildings and improvements based on management’s determination of the relative fair values of these assets. In valuing an acquired property’s intangibles, factors considered by management include an estimate of carrying costs during the expected lease-up periods, and estimates of lost rental revenue during the expected lease-up periods based on management’s evaluation of current market demand. Management also estimates costs to execute similar leases, including leasing commissions, tenant improvements, legal and other related costs. Leasing commissions, legal and other related costs (“lease origination costs”) are classified as deferred charges in the accompanying consolidated balance sheets.
The value of in-place leases is measured by the excess of (i) the purchase price paid for a property after adjusting existing in-place leases to market rental rates, over (ii) the estimated fair value of the property as if vacant. Above-market and below-market lease values are recorded based on the present value (using a discount rate which reflects the risks associated with the leases acquired) of the difference between the contractual amounts to be received and management’s estimate of market lease rates, measured over the terms of the respective leases that management deemed appropriate at the time of acquisition. Such valuations include a consideration of the non-cancellable terms of the respective leases as well as any applicable renewal periods. The fair values associated with below-market rental renewal options are determined based on the Company’s experience and the relevant facts and circumstances that existed at the time of the acquisitions. The value of the above-market and below-market leases is amortized to rental income, over the terms of the respective leases including option periods, if applicable. The value of in-place leases are amortized to expense over the remaining non-cancellable terms of the respective leases. If a lease were to be terminated prior to its stated expiration, all unamortized amounts relating to that lease would be recognized in operations at that time.
Asset Impairment
The Company reviews long-lived assets for impairment whenever events or changes in circumstances indicate that the carrying amount of an asset may not be recoverable. Recoverability of assets to be held and used is measured by a comparison of the carrying amount of the asset to aggregate future net cash flows (undiscounted and without interest) expected to be generated by the asset. If such assets are considered impaired, the impairment to be recognized is measured by the amount by which the carrying amount of the assets exceed the fair value. Management does not believe that the value of any of the Company’s real estate investments was impaired at December 31, 2017.
65
Cash and Cash Equivalents
The Company considers all highly liquid investments with an original maturity of three months or less when purchased to be cash equivalents. Cash and cash equivalents are maintained at financial institutions and, at times, balances may exceed the federally insured limit by the Federal Deposit Insurance Corporation. The Company has not experienced any losses related to these balances.
Restricted Cash
Restricted cash primarily represents cash that is being held by a qualified intermediary in anticipation of the acquisition of a replacement property in a tax-free exchange under Section 1031 of the Code. Additionally, the terms of several of the Company’s mortgage loans payable require the Company to deposit certain replacement and other reserves with its lenders. Such “restricted cash” is generally available only for property level requirements for which the reserves have been established and is not available to fund other property level or Company level obligations.
Revenue Recognition
Management has determined that all of the Company’s leases with its various tenants are operating leases. Rental income is generally recognized based on the terms of leases entered into with tenants. In those instances in which the Company funds tenant improvements and the improvements are deemed to be owned by the Company, revenue recognition will commence when the improvements are substantially completed and possession or control of the space is turned over to the tenant. When the Company determines that the tenant allowances are lease incentives, the Company commences revenue recognition and lease incentive amortization when possession or control of the space is turned over to the tenant for tenant work to begin. Minimum rental income from leases with scheduled rent increases is recognized on a straight-line basis over the lease term. Percentage rent is recognized when a specific tenant’s sales breakpoint is achieved. Property operating expense recoveries from tenants of common area maintenance, real estate taxes and other recoverable costs are recognized in the period the related expenses are incurred. Lease incentives are amortized as a reduction of rental revenue over the respective tenant lease terms.
Termination fees (included in other income) are fees that the Company has agreed to accept in consideration for permitting certain tenants to terminate their lease prior to the contractual expiration date. The Company recognizes termination fees in accordance with Securities and Exchange Commission Staff Accounting Bulletin 104, “Revenue Recognition,” when the following conditions are met: (a) the termination agreement is executed; (b) the termination fee is determinable; (c) all landlord services pursuant to the terminated lease have been rendered; and (d) collectability of the termination fee is assured. Interest income is recognized as it is earned. Gains or losses on disposition of properties are recorded when the criteria for recognizing such gains or losses under GAAP have been met.
The Company must make estimates as to the collectability of its accounts receivable related to base rent, straight-line rent, expense reimbursements and other revenues. Management analyzes accounts receivable by considering tenant creditworthiness, current economic trends, and changes in tenants’ payment patterns when evaluating the adequacy of the allowance for doubtful accounts receivable. The Company also provides an allowance for future credit losses of the deferred straight-line rents receivable. The provision for doubtful accounts at December 31, 2017 and December 31, 2016 was approximately $6.4 million and $5.2 million, respectively.
Depreciation and Amortization
The Company uses the straight-line method for depreciation and amortization. Buildings are depreciated over the estimated useful lives which the Company estimates to be 39-40 years. Property improvements are depreciated over the estimated useful lives that range from 10 to 20 years. Furniture and fixtures are depreciated over the estimated useful lives that range from 3 to 10 years. Tenant improvements are amortized over the shorter of the life of the related leases or their useful life.
Deferred Leasing and Financing Costs
Costs incurred in obtaining tenant leases (principally leasing commissions and acquired lease origination costs) are amortized ratably over the life of the tenant leases. Costs incurred in obtaining long-term financing are amortized ratably over the related debt agreement. The amortization of deferred leasing and financing costs is included in Depreciation and amortization and Interest expense and other finance expenses, respectively, in the Consolidated Statements of Operations.
66
The unamortized balances of deferred leasing costs included in deferred charges in the Consolidated Balance Sheet as of December 31, 2017 that will be charged to future operations are as follows (in thousands):
Lease Origination Costs | |||
2018 | $ | 7,937 | |
2019 | 6,537 | ||
2020 | 5,267 | ||
2021 | 4,353 | ||
2022 | 3,425 | ||
Thereafter | 9,648 | ||
$ | 37,167 | ||
The unamortized balances of deferred financing costs associated with the Company’s term loan, unsecured revolving credit facility, Senior Notes Due 2027, Senior Notes Due 2026, Senior Notes Due 2024, Senior Notes Due 2023, and mortgage notes payable included as a direct reduction from the carrying amount of the related debt instrument in the Consolidated Balance Sheet as of December 31, 2017 that will be charged to future operations are as follows (in thousands):
Financing Costs | |||
2018 | $ | 1,805 | |
2019 | 1,793 | ||
2020 | 1,793 | ||
2021 | 1,525 | ||
2022 | 849 | ||
Thereafter | 1,515 | ||
$ | 9,280 | ||
Internal Capitalized Leasing Costs
The Company capitalizes a portion of payroll-related costs related to its leasing personnel associated with new leases and lease renewals. These costs are amortized over the life of the respective leases. During the years ended December 31, 2017, 2016 and 2015, the Company capitalized approximately $1.2 million, $1.2 million and $1.1 million, respectively, of such payroll-related costs.
Concentration of Credit Risk
Financial instruments that potentially subject the Company to concentrations of credit risk consist primarily of cash and cash equivalents and tenant receivables. The Company places its cash and cash equivalents in excess of insured amounts with high quality financial institutions. The Company performs ongoing credit evaluations of its tenants and requires tenants to provide security deposits.
Earnings Per Share
Basic earnings per share (“EPS”) excludes the impact of dilutive shares and is computed by dividing net income by the weighted average number of shares of common stock outstanding for the period. Diluted EPS reflects the potential dilution that could occur if securities or other contracts to issue shares of common stock were exercised or converted into shares of common stock and then shared in the earnings of the Company.
For the years ended December 31, 2017, 2016 and 2015, basic EPS was determined by dividing net income allocable to common stockholders for the applicable period by the weighted average number of shares of common stock outstanding during such period. Net income during the applicable period is also allocated to the time-based unvested restricted stock as these grants are entitled to receive dividends and are therefore considered a participating security. Time-based unvested restricted stock is not allocated net losses and/or any excess of dividends declared over net income; such amounts are allocated entirely to the common stockholders other than the holders of time-based unvested restricted stock. The performance-based restricted stock grants awarded under the
67
2009 Plan described in Note 8 are excluded from the basic EPS calculation, as these units are not participating securities until they vest.
The following table sets forth the reconciliation between basic and diluted EPS for ROIC (in thousands, except share data):
Year Ended December 31, | |||||||||||
2017 | 2016 | 2015 | |||||||||
Numerator: | |||||||||||
Net income | $ | 42,688 | $ | 36,430 | $ | 25,092 | |||||
Less income attributable to non-controlling interests | (4,211 | ) | (3,676 | ) | (1,228 | ) | |||||
Less earnings allocated to unvested shares | (319 | ) | (270 | ) | (229 | ) | |||||
Net income available for common stockholders, basic | $ | 38,158 | $ | 32,484 | $ | 23,635 | |||||
Numerator: | |||||||||||
Net income | $ | 42,688 | $ | 36,430 | $ | 25,092 | |||||
Less earnings allocated to unvested shares | (319 | ) | (270 | ) | (229 | ) | |||||
Net income available for common stockholders, diluted | $ | 42,369 | $ | 36,160 | $ | 24,863 | |||||
Denominator: | |||||||||||
Denominator for basic EPS – weighted average common equivalent shares | 109,400,123 | 104,072,222 | 95,651,780 | ||||||||
OP units | 12,060,835 | 11,747,509 | 4,086,724 | ||||||||
Restricted stock awards – performance-based | 153,807 | 86,996 | 174,198 | ||||||||
Stock options | 129,066 | 133,213 | 105,079 | ||||||||
Denominator for diluted EPS – weighted average common equivalent shares | 121,743,831 | 116,039,940 | 100,017,781 | ||||||||
Earnings Per Unit
The following table sets forth the reconciliation between basic and diluted earnings per unit for the Operating Partnership (in thousands, except unit data):
Year Ended December 31, | |||||||||||
2017 | 2016 | 2015 | |||||||||
Numerator: | |||||||||||
Net income | $ | 42,688 | $ | 36,430 | $ | 25,092 | |||||
Less earnings allocated to unvested shares | (319 | ) | (270 | ) | (229 | ) | |||||
Net income available to unitholders, basic and diluted | $ | 42,369 | $ | 36,160 | $ | 24,863 | |||||
Denominator: | |||||||||||
Denominator for basic earnings per unit – weighted average common equivalent units | 121,460,958 | 115,819,731 | 99,738,504 | ||||||||
Restricted stock awards – performance-based | 153,807 | 86,996 | 174,198 | ||||||||
Stock options | 129,066 | 133,213 | 105,079 | ||||||||
Denominator for diluted earnings per unit – weighted average common equivalent units | 121,743,831 | 116,039,940 | 100,017,781 | ||||||||
Stock-Based Compensation
The Company has a stock-based employee compensation plan, which is more fully described in Note 8.
The Company accounts for its stock-based compensation plans based on the FASB guidance which requires that compensation expense be recognized based on the fair value of the stock awards less estimated forfeitures. Restricted stock grants vest based upon the completion of a service period (“time based grants”) and/or the Company meeting certain established market specific financial performance criteria (“performance based grants”). Time based grants are valued according to the market price for the
68
Company’s common stock at the date of grant. For performance based grants, a Monte Carlo valuation model is used, taking into account the underlying contingency risks associated with the performance criteria. It is the Company’s policy to grant options with an exercise price equal to the quoted closing market price of stock on the grant date. Awards of stock options and time based grants of stock are expensed as compensation on a straight-line basis over the vesting period. Depending on the terms of the agreement, certain awards of performance based grants are expensed as compensation under an accelerated attribution method while certain are expensed as compensation on a straight-line basis over the vesting period. All awards of performance based grants are recognized in income regardless of the results of the performance criteria.
Derivatives
The Company records all derivatives on the balance sheet at fair value. The accounting for changes in the fair value of derivatives depends on the intended use of the derivative, whether the Company has elected to designate a derivative in a hedging relationship and apply hedge accounting and whether the hedging relationship has satisfied the criteria necessary to apply hedge accounting. Derivatives designated and qualifying as a hedge of the exposure to changes in the fair value of an asset, liability, or firm commitment attributable to a particular risk, such as interest rate risk, are considered fair value hedges. Derivatives designated and qualifying as a hedge of the exposure to variability in expected future cash flows, or other types of forecasted transactions, are considered cash flow hedges. Hedge accounting generally provides for the matching of the timing of gain or loss recognition on the hedging instrument with the recognition of the changes in the fair value of the hedged asset or liability that are attributable to the hedged risk in a fair value hedge or the earnings effect of the hedged forecasted transactions in a cash flow hedge. When the Company terminates a derivative for which cash flow hedging was being applied, the balance which was recorded in Other Comprehensive Income is amortized to interest expense over the remaining contractual term of the derivative. The Company includes cash payments made to terminate interest rate derivative as an operating activity on the statement of cash flows, given the nature of the underlying cash flows that the derivative was hedging.
Segment Reporting
The Company’s primary business is the ownership, management, and redevelopment of retail real estate properties. The Company reviews operating and financing information for each property on an individual basis and therefore, each property represents an individual operating segment. The Company evaluates financial performance using property operating income, defined as operating revenues (base rent and recoveries from tenants), less property and related expenses (property operating expenses and property taxes). The Company has aggregated the properties into one reportable segment as the properties share similar long-term economic characteristics and have other similarities including the fact that they are operated using consistent business strategies, are typically located in major metropolitan areas, and have similar tenant mixes.
2. Real Estate Investments
The following real estate investment transactions occurred during the years ended December 31, 2017 and 2016.
Property Acquisitions in 2017
Asset Acquisitions
Subsequent to the adoption of ASU 2017-1, the Company evaluated its real estate property acquisitions under the new framework for determining whether a real estate property acquisition meets the definition of a business. The Company evaluated each of the following acquisitions and determined that substantially all of the fair value related to each acquisition was concentrated in a single identifiable asset. In each of these acquisitions, the Company allocated the total consideration for each acquisition to the individual assets and liabilities acquired on a relative fair value basis. All transaction costs incurred in these acquisitions were capitalized.
On January 25, 2017, the Company acquired the property known as PCC Community Markets Plaza located in Edmonds, Washington, within the Seattle metropolitan area, for an adjusted purchase price of approximately $8.7 million. PCC Community Markets Plaza is approximately 34,000 square feet and is anchored by PCC Community Markets. The property was acquired with available cash from operations.
On March 17, 2017, the Company acquired the property known as The Terraces located in Rancho Palos Verdes, California, within the Los Angeles metropolitan area, for an adjusted purchase price of approximately $54.2 million. The Terraces is approximately 173,000 square feet and is anchored by Trader Joe’s, Marshall’s and LA Fitness. The property was acquired with borrowings under the Company’s unsecured revolving credit facility (the “credit facility”).
69
On March 24, 2017, the Company acquired the property known as Santa Rosa Southside Shopping Center located in Santa Rosa, California, within the San Francisco metropolitan area, for an adjusted purchase price of approximately $28.9 million. Santa Rosa Southside Shopping Center is approximately 86,000 square feet and is anchored by REI and Cost Plus World Market. The property was acquired with borrowings under the credit facility and the issuance of 168,497 OP Units with a fair value of approximately $3.6 million.
On April 5, 2017, the Company acquired the property known as Division Center, located in Portland, Oregon, for an adjusted purchase price of approximately $33.1 million. Division Center is approximately 122,000 square feet and is anchored by Grocery Outlet Supermarket, Rite Aid Pharmacy and Petco. The property was acquired with borrowings under the credit facility.
On May 9, 2017, the Company acquired the property known as Highland Hill, located in Tacoma, Washington, within the Seattle metropolitan area, for an adjusted purchase price of approximately $47.4 million. Highland Hill is approximately 164,000 square feet and is anchored by Safeway Supermarket, LA Fitness, Dollar Tree and Petco. The property was acquired with borrowings under the credit facility.
On September 19, 2017, the Company acquired the property known as Monta Loma Plaza, located in Mountain View, California, within the San Francisco metropolitan area, for an adjusted purchase price of approximately $30.0 million. Monta Loma Plaza is approximately 48,000 square feet and is anchored by Safeway Supermarket. The property was acquired with borrowings under the credit facility.
On October 11, 2017, the Company acquired the properties known as Fullerton Crossroads and Riverstone Marketplace. Fullerton Crossroads, located in Fullerton, California, within Orange County, was acquired for an adjusted purchase price of approximately $61.6 million, is approximately 220,000 square feet and is anchored by Kroger (Ralph’s) Supermarket. Riverstone Marketplace, located in Vancouver, Washington, within the Portland metropolitan area, was acquired for an adjusted purchase price of approximately $31.7 million, is approximately 96,000 square feet and is anchored by Kroger (QFC) Supermarket. The properties were acquired through the issuance of 2,405,430 OP Units with a fair value of approximately $46.0 million and the assumption of existing debt on the properties with a fair value of approximately $46.0 million.
On October 19, 2017, the Company acquired the property known as North Lynnwood Shopping Center, located in Lynnwood, Washington, within the Seattle metropolitan area, for an adjusted purchase price of approximately $13.3 million. North Lynnwood Shopping Center is approximately 64,000 square feet and is anchored by Kroger (QFC) Supermarket. The property was acquired with borrowings under the credit facility.
On November 30, 2017, the Company acquired the property known as The Village at Nellie Gail Ranch, located in Laguna Hills, California, within Orange County, for an adjusted purchase price of approximately $46.1 million. The Village at Nellie Gail Ranch is approximately 88,000 square feet and is anchored by Smart & Final Extra Supermarket. The property was acquired with borrowings under the credit facility.
Property Acquisitions in 2016
Business Combinations
Prior to the adoption of ASU 2017-1 on October 1, 2016, the Company accounted for its real estate property acquisitions as business combinations. During the year ended December 31, 2016, the Company acquired 6 properties throughout the west coast with a total of approximately 596,000 square feet for a net adjusted purchase price of approximately $270.9 million. In each of these acquisitions, the Company allocated the total consideration for each acquisition to the individual assets and liabilities acquired based on their fair values. These acquisitions were consummated prior to October 1, 2016, and accordingly, all transaction costs incurred in these acquisitions were expensed.
Asset Acquisitions
During the year ended December 31, 2016, the Company acquired assets throughout the west coast with a total of approximately 239,000 square feet for a net adjusted purchase price of approximately $76.9 million. The Company evaluated each of the following acquisitions and determined that substantially all of the fair value related to each acquisition was concentrated in a single identifiable asset. In each of these acquisitions, the Company allocated the total consideration for each acquisition to the individual assets and liabilities acquired on a relative fair value basis. These acquisitions were consummated subsequent to October 1, 2016, and accordingly, all transaction costs incurred in these acquisitions were capitalized.
70
Any reference to square footage or occupancy is unaudited and outside the scope of our independent registered public accounting firm’s audit of the Company’s financial statements in accordance with the standards of the United States Public Company Accounting Oversight Board.
The financial information set forth below summarizes the Company’s purchase price allocation for the properties acquired during the years ended December 31, 2017 and 2016 (in thousands).
December 31, 2017 | December 31, 2016 | ||||||
Assets | |||||||
Land | $ | 109,356 | $ | 96,113 | |||
Building and improvements | 265,040 | 258,584 | |||||
Acquired lease intangible asset | 22,024 | 19,667 | |||||
Deferred charges | 8,034 | 6,876 | |||||
Assets acquired | $ | 404,454 | $ | 381,240 | |||
Liabilities | |||||||
Mortgage notes assumed | $ | 46,034 | $ | 17,618 | |||
Acquired lease intangible liability | 45,456 | 32,615 | |||||
Liabilities assumed | $ | 91,490 | $ | 50,233 | |||
Pro Forma Financial Information
The pro forma financial information is based upon the Company’s historical consolidated statements of operations for the year ended December 31, 2016, adjusted to give effect to the above completed business combination transactions as if they occurred on January 1, 2015. The pro forma financial information set forth below is presented for informational purposes only and may not be indicative of what actual results of operations would have been had the transactions occurred as if they occurred on January 1 2015, nor does it purport to represent the results of future operations. The below pro forma financial information does not include asset acquisitions that occurred during the year ended December 31, 2017 or the three months ended December 31, 2016 (in thousands).
Year Ended December 31, 2016 | |||
Statement of operations: | |||
Revenues | $ | 245,116 | |
Net income attributable to Retail Opportunity Investments Corp. | $ | 33,169 | |
The following table summarizes the operating results included in the Company’s historical consolidated statement of operations for the year ended December 31, 2017 for the properties acquired during the year ended December 31, 2017 (in thousands).
Year Ended December 31, 2017 | |||
Statement of operations: | |||
Revenues | $ | 13,500 | |
Net income attributable to Retail Opportunity Investments Corp. | $ | 2,948 | |
The following table summarizes the operating results included in the Company’s historical consolidated statement of operations for the year ended December 31, 2016 for the properties acquired during the year ended December 31, 2016 (in thousands).
Year Ended December 31, 2016 | |||
Statement of operations: | |||
Revenues | $ | 15,230 | |
Net income attributable to Retail Opportunity Investments Corp. | $ | 2,513 | |
71
3. Acquired Lease Intangibles
Intangible assets and liabilities as of December 31, 2017 and 2016 consisted of the following (in thousands):
December 31, 2017 | December 31, 2016 | ||||||
Assets: | |||||||
In-place leases | $ | 99,924 | $ | 93,952 | |||
Accumulated amortization | (36,971 | ) | (33,034 | ) | |||
Above-market leases | 33,176 | 30,251 | |||||
Accumulated amortization | (13,351 | ) | (11,964 | ) | |||
Acquired lease intangible assets, net | $ | 82,778 | $ | 79,205 | |||
Liabilities: | |||||||
Below-market leases | $ | 222,929 | $ | 190,321 | |||
Accumulated amortization | (43,945 | ) | (35,363 | ) | |||
Acquired lease intangible liabilities, net | $ | 178,984 | $ | 154,958 | |||
For the years ended December 31, 2017, 2016 and 2015, the net amortization of acquired lease intangible assets and acquired lease intangible liabilities for above and below market leases was $17.1 million, $13.8 million and $9.9 million, respectively, which amounts are included in base rents in the accompanying consolidated statements of operations and comprehensive income. For the years ended December 31, 2017, 2016 and 2015, the net amortization of in-place leases was $14.4 million, $15.6 million and $13.2 million, respectively, which amounts are included in depreciation and amortization in the accompanying consolidated statements of operations and comprehensive income.
The scheduled future amortization of acquired lease intangible assets as of December 31, 2017 is as follows (in thousands):
Year Ending December 31: | |||
2018 | $ | 14,085 | |
2019 | 10,270 | ||
2020 | 8,312 | ||
2021 | 6,554 | ||
2022 | 5,523 | ||
Thereafter | 38,034 | ||
Total future amortization of acquired lease intangible assets | $ | 82,778 | |
The scheduled future amortization of acquired lease intangible liabilities as of December 31, 2017 is as follows (in thousands):
Year Ending December 31: | |||
2018 | $ | 15,297 | |
2019 | 14,334 | ||
2020 | 13,275 | ||
2021 | 12,064 | ||
2022 | 11,045 | ||
Thereafter | 112,969 | ||
Total future amortization of acquired lease intangible liabilities | $ | 178,984 | |
4. Tenant Leases
Space in the Company’s shopping centers is leased to various tenants under operating leases that usually grant tenants renewal options and generally provide for additional rents based on certain operating expenses as well as tenants’ sales volume.
72
Future minimum rents to be received under non-cancellable leases as of December 31, 2017 are summarized as follows (in thousands):
Year Ending December 31: | |||
2018 | $ | 193,314 | |
2019 | 175,008 | ||
2020 | 153,451 | ||
2021 | 131,249 | ||
2022 | 105,293 | ||
Thereafter | 448,171 | ||
Total minimum lease payments | $ | 1,206,486 | |
5. Mortgage Notes Payable, Credit Facilities and Senior Notes
ROIC does not hold any indebtedness. All debt is held directly or indirectly by the Operating Partnership; however, ROIC has guaranteed the Operating Partnership’s term loan, unsecured revolving credit facility, carve-out guarantees on property-level debt, the Senior Notes Due 2027, the Senior Notes Due 2026, the Senior Notes Due 2024 and the Senior Notes Due 2023.
Mortgage Notes Payable
On October 11, 2017, in connection with the acquisitions of Fullerton Crossroads and Riverstone Marketplace, the Company assumed two existing mortgage loans with outstanding principal balances of approximately $26.0 million and $18.5 million, respectively. On May 11, 2017, the Company repaid in full the Bernardo Heights mortgage note related to Bernardo Heights Plaza for a total of approximately $8.1 million, without penalty, in accordance with the prepayment provisions of the note.
The mortgage notes payable collateralized by respective properties and assignment of leases at December 31, 2017 and December 31, 2016, respectively, were as follows (in thousands, except interest rates):
Property | Maturity Date | Interest Rate | December 31, 2017 | December 31, 2016 | |||||||||
Bernardo Heights Plaza | July 2017 | 5.700 | % | $ | — | $ | 8,216 | ||||||
Santa Teresa Village | February 2018 | 6.200 | % | 10,138 | 10,383 | ||||||||
Magnolia Shopping Center | October 2018 | 5.500 | % | 8,951 | 9,135 | ||||||||
Casitas Plaza Shopping Center | June 2022 | 5.320 | % | 7,307 | 7,449 | ||||||||
Riverstone Marketplace | July 2022 | 4.960 | % | 18,424 | — | ||||||||
Fullerton Crossroads | April 2024 | 4.728 | % | 26,000 | — | ||||||||
Diamond Hills Plaza | October 2025 | 3.550 | % | 35,500 | 35,500 | ||||||||
$ | 106,320 | $ | 70,683 | ||||||||||
Mortgage premiums | 1,921 | 1,037 | |||||||||||
Net unamortized deferred financing costs | (326 | ) | (417 | ) | |||||||||
Total mortgage notes payable | $ | 107,915 | $ | 71,303 | |||||||||
The combined aggregate principal maturities of mortgage notes payable during the next five years and thereafter are as follows (in thousands):
Principal Repayments | Scheduled Amortization | Mortgage Premium | Total | ||||||||||||
2018 | $ | 18,900 | $ | 712 | $ | 493 | $ | 20,105 | |||||||
2019 | — | 550 | 360 | 910 | |||||||||||
2020 | — | 577 | 360 | 937 | |||||||||||
2021 | — | 717 | 360 | 1,077 | |||||||||||
2022 | 23,130 | 1,003 | 223 | 24,356 | |||||||||||
Thereafter | 58,787 | 1,944 | 125 | 60,856 | |||||||||||
Total | $ | 100,817 | $ | 5,503 | $ | 1,921 | $ | 108,241 | |||||||
73
Term Loan and Credit Facility
The carrying values of the Company’s unsecured term loan (the “term loan”) were as follows (in thousands):
December 31, 2017 | December 31, 2016 | ||||||
Term loan | $ | 300,000 | $ | 300,000 | |||
Net unamortized deferred financing costs | (1,184 | ) | (809 | ) | |||
Term loan | $ | 298,816 | $ | 299,191 | |||
On September 29, 2015, the Company entered into an unsecured term loan agreement under which the lenders agreed to provide a $300.0 million unsecured term loan facility. Effective September 8, 2017, the Company entered into a First Amended and Restated Term Loan Agreement (the “Term Loan Agreement”) pursuant to which the maturity date of the term loan was extended from January 31, 2019 to September 8, 2022, without further options for extension. The Term Loan Agreement also provides that the Company may from time to time request increased aggregate commitments of $200.0 million under certain conditions set forth in the Term Loan Agreement, including the consent of the lenders for the additional commitments. Borrowings under the Term Loan Agreement accrue interest on the outstanding principal amount at a rate equal to an applicable rate based on the credit rating level of the Company, plus, as applicable, (i) a LIBOR rate determined by reference to the cost of funds for U.S. dollar deposits for the relevant period (the “Eurodollar Rate”), or (ii) a base rate determined by reference to the highest of (a) the federal funds rate plus 0.50%, (b) the rate of interest announced by the Administrative Agent as its “prime rate,” and (c) the Eurodollar Rate plus 1.10%.
The carrying values of the Company’s unsecured revolving credit facility were as follows (in thousands):
December 31, 2017 | December 31, 2016 | ||||||
Credit facility | $ | 143,500 | $ | 98,000 | |||
Net unamortized deferred financing costs | (3,171 | ) | (2,346 | ) | |||
Credit facility | $ | 140,329 | $ | 95,654 | |||
The Operating Partnership has an unsecured revolving credit facility with several banks. Effective September 8, 2017, the Company entered into a Second Amended and Restated Credit Agreement (the “Credit Facility Agreement”) pursuant to which the borrowing capacity was increased from $500.0 million to $600.0 million. The maturity date of the credit facility was extended from January 31, 2019 to September 8, 2021, with two six-month extension options, which may be exercised by the Operating Partnership upon satisfaction of certain conditions including the payment of extension fees. Additionally, the credit facility contains an accordion feature, which allows the Operating Partnership to increase the borrowing capacity up to an aggregate of $1.2 billion, subject to lender consents and other conditions. Borrowings under the credit facility accrue interest on the outstanding principal amount at a rate equal to an applicable rate based on the credit rating level of the Company, plus, as applicable, (i) the Eurodollar Rate, or (ii) a base rate determined by reference to the highest of (a) the federal funds rate plus 0.50%, (b) the rate of interest announced by KeyBank, National Association as its “prime rate,” and (c) the Eurodollar Rate plus 1.00%. Additionally, the Operating Partnership is obligated to pay a facility fee at a rate based on the credit rating level of the Company, currently 0.20%, and a fronting fee at a rate of 0.125% per year with respect to each letter of credit issued under the credit facility. The Company has investment grade credit ratings from Moody’s Investors Service (Baa2) and Standard & Poor’s Ratings Services (BBB-).
Both the term loan and credit facility contain customary representations, financial and other covenants. The Operating Partnership’s ability to borrow under the term loan and credit facility are subject to its compliance with financial covenants and other restrictions on an ongoing basis. The Operating Partnership was in compliance with such covenants at December 31, 2017.
As of December 31, 2017, $300.0 million and $143.5 million were outstanding under the term loan and credit facility, respectively. The average interest rates on the term loan and the credit facility during the year ended December 31, 2017 were 2.2% and 2.1%, respectively. The Company had no available borrowings under the term loan at December 31, 2017. The Company had $456.5 million available to borrow under the credit facility at December 31, 2017.
74
Senior Notes Due 2027
The carrying value of the Company’s unsecured Senior Notes Due 2027 is as follows (in thousands):
December 31, 2017 | December 31, 2016 | ||||||
Principal amount | $ | 250,000 | $ | — | |||
Net unamortized deferred financing costs | (1,249 | ) | — | ||||
Senior Notes Due 2027 | $ | 248,751 | $ | — | |||
On November 10, 2017, the Operating Partnership entered into a Note Purchase Agreement which provided for the issuance of $250.0 million principal amount of 4.19% Senior Notes Due 2027 (the “Senior Notes Due 2027”) in a private placement effective December 15, 2017. The Senior Notes Due 2027 pay interest on June 15 and December 15 of each year, commencing on June 15, 2018, and mature on December 15, 2027, unless prepaid earlier by the Operating Partnership. The Operating Partnership’s performance of the obligations under the Note Purchase Agreement, including the payment of any outstanding indebtedness thereunder, are guaranteed, jointly and severally, by ROIC. The net proceeds were used to reduce borrowings under the credit facility. The interest expense recognized on the Senior Notes Due 2027 during the year ended December 31, 2017 included approximately $466,000 for the contractual coupon interest.
In connection with the issuance of the Senior Notes Due 2027, the Company incurred approximately $1.3 million of deferred financing costs which are being amortized over the term of the Senior Notes Due 2027.
Senior Notes Due 2026
The carrying value of the Company’s unsecured Senior Notes Due 2026 is as follows (in thousands):
December 31, 2017 | December 31, 2016 | ||||||
Principal amount | $ | 200,000 | $ | 200,000 | |||
Net unamortized deferred financing costs | (248 | ) | (273 | ) | |||
Senior Notes Due 2026 | $ | 199,752 | $ | 199,727 | |||
On July 26, 2016, the Operating Partnership entered into a Note Purchase Agreement, as amended, which provided for the issuance of $200.0 million principal amount of 3.95% Senior Notes Due 2026 (the “Senior Notes Due 2026”) in a private placement effective September 22, 2016. The Senior Notes Due 2026 pay interest on March 22 and September 22 of each year, commencing on March 22, 2017, and mature on September 22, 2026, unless prepaid earlier by the Operating Partnership. The Operating Partnership’s performance of the obligations under the Note Purchase Agreement, including the payment of any outstanding indebtedness thereunder, are guaranteed, jointly and severally, by ROIC. The net proceeds were used to reduce borrowings under the credit facility. The interest expense recognized on the Senior Notes Due 2026 during the year ended December 31, 2017 included approximately $7.9 million for the contractual coupon interest. The interest expense recognized on the Senior Notes Due 2026 during the year ended December 31, 2016 included approximately $2.2 million for the contractual coupon interest.
In connection with the issuance of the Senior Notes Due 2026, the Company incurred approximately $283,000 of deferred financing costs which are being amortized over the term of the Senior Notes Due 2026.
Senior Notes Due 2024
The carrying value of the Company’s unsecured Senior Notes Due 2024 is as follows (in thousands):
December 31, 2017 | December 31, 2016 | ||||||
Principal amount | $ | 250,000 | $ | 250,000 | |||
Unamortized debt discount | (2,578 | ) | (2,891 | ) | |||
Net unamortized deferred financing costs | (1,535 | ) | (1,755 | ) | |||
Senior Notes Due 2024 | $ | 245,887 | $ | 245,354 | |||
75
On December 3, 2014, the Operating Partnership completed a registered underwritten public offering of $250.0 million aggregate principal amount of 4.000% Senior Notes due 2024 (the “Senior Notes Due 2024”), fully and unconditionally guaranteed by ROIC. The Senior Notes Due 2024 pay interest semi-annually on June 15 and December 15, commencing on June 15, 2015, and mature on December 15, 2024, unless redeemed earlier by the Operating Partnership. The Senior Notes Due 2024 are the Operating Partnership’s senior unsecured obligations that rank equally in right of payment with the Operating Partnership’s other unsecured indebtedness, and effectively junior to (i) all of the indebtedness and other liabilities, whether secured or unsecured, and any preferred equity of the Operating Partnership’s subsidiaries, and (ii) all of the Operating Partnership’s indebtedness that is secured by its assets, to the extent of the value of the collateral securing such indebtedness outstanding. ROIC fully and unconditionally guaranteed the Operating Partnership’s obligations under the Senior Notes Due 2024 on a senior unsecured basis, including the due and punctual payment of principal of, and premium, if any, and interest on, the notes, whether at stated maturity, upon acceleration, notice of redemption or otherwise. The guarantee is a senior unsecured obligation of ROIC and ranks equally in right of payment with all other senior unsecured indebtedness of ROIC. ROIC’s guarantee of the Senior Notes Due 2024 is effectively subordinated in right of payment to all liabilities, whether secured or unsecured, and any preferred equity of its subsidiaries (including the Operating Partnership and any entity ROIC accounts for under the equity method of accounting). The interest expense recognized on the Senior Notes Due 2024 during the year ended December 31, 2017 includes $10.0 million and approximately $313,000 for the contractual coupon interest and the accretion of the debt discount, respectively. The interest expense recognized on the Senior Notes Due 2024 during the year ended December 31, 2016 includes $10.0 million and approximately $300,000 for the contractual coupon interest and the accretion of the debt discount, respectively.
In connection with the Senior Notes Due 2024 offering, the Company incurred approximately $2.2 million of deferred financing costs which are being amortized over the term of the Senior Notes Due 2024.
Senior Notes Due 2023
The carrying value of the Company’s unsecured Senior Notes Due 2023 is as follows (in thousands):
December 31, 2017 | December 31, 2016 | ||||||
Principal amount | $ | 250,000 | $ | 250,000 | |||
Unamortized debt discount | (2,737 | ) | (3,119 | ) | |||
Net unamortized deferred financing costs | (1,567 | ) | (1,830 | ) | |||
Senior Notes Due 2023 | $ | 245,696 | $ | 245,051 | |||
On December 9, 2013, the Operating Partnership completed a registered underwritten public offering of $250.0 million aggregate principal amount of 5.000% Senior Notes due 2023 (the “Senior Notes Due 2023”), fully and unconditionally guaranteed by ROIC. The Senior Notes Due 2023 pay interest semi-annually on June 15 and December 15, commencing on June 15, 2014, and mature on December 15, 2023, unless redeemed earlier by the Operating Partnership. The Senior Notes Due 2023 are the Operating Partnership’s senior unsecured obligations that rank equally in right of payment with the Operating Partnership’s other unsecured indebtedness, and effectively junior to (i) all of the indebtedness and other liabilities, whether secured or unsecured, and any preferred equity of the Operating Partnership’s subsidiaries, and (ii) all of the Operating Partnership’s indebtedness that is secured by its assets, to the extent of the value of the collateral securing such indebtedness outstanding. ROIC fully and unconditionally guaranteed the Operating Partnership’s obligations under the Senior Notes Due 2023 on a senior unsecured basis, including the due and punctual payment of principal of, and premium, if any, and interest on, the notes, whether at stated maturity, upon acceleration, notice of redemption or otherwise. The guarantee is a senior unsecured obligation of ROIC and will rank equally in right of payment with all other senior unsecured indebtedness of ROIC. ROIC’s guarantee of the Senior Notes Due 2023 is effectively subordinated in right of payment to all liabilities, whether secured or unsecured, and any preferred equity of its subsidiaries (including the Operating Partnership and any entity ROIC accounts for under the equity method of accounting). The interest expense recognized on the Senior Notes Due 2023 during the year ended December 31, 2017 includes approximately $12.5 million and approximately $382,000 for the contractual coupon interest and the accretion of the debt discount, respectively. The interest expense recognized on the Senior Notes Due 2023 during the year ended December 31, 2016 includes approximately $12.5 million and approximately $363,000 for the contractual coupon interest and the accretion of the debt discount, respectively.
In connection with the Senior Notes Due 2023 offering, the Company incurred approximately $2.6 million of deferred financing costs which are being amortized over the term of the Senior Notes Due 2023.
76
6. Preferred Stock of ROIC
The Company is authorized to issue 50,000,000 shares of preferred stock with such designations, voting and other rights and preferences as may be determined from time to time by the board of directors. As of December 31, 2017 and 2016, there were no shares of preferred stock outstanding.
7. Common Stock of ROIC
Equity Issuance
In connection with the acquisitions of Fullerton Crossroads and Riverstone Marketplace, a portion of the consideration for the properties was funded through the issuance of 2,405,430 OP Units. On December 12, 2017, the Company issued 2,584,254 shares of common stock, at a price per share of $21.25, in exchange for the 2,405,430 OP Units previously issued and the rights to approximately $3.8 million of cash to be used to acquire a third property to be identified by the Company. The proceeds of approximately $3.8 million are classified in Restricted Cash in the consolidated balance sheet as of December 31, 2017, as the proceeds are being held with an exchange accommodator under Section 1031 of the Code, and are expected to be used to purchase a replacement asset during the first half of 2018. The shares of common stock of the Company were issued in a private placement in reliance on Section 4(a)(2) of the Securities Act of 1933, as amended, and the rules and regulations promulgated thereunder.
On July 12, 2016, ROIC issued 6,555,000 shares of common stock in a registered public offering, including shares issued upon the exercise in full of the underwriters’ option to purchase additional shares, resulting in net proceeds of approximately $133.0 million, after deducting the underwriters’ discounts and commissions and offering expenses. The net proceeds were used to reduce borrowings under the Operating Partnership’s revolving credit facility.
ATM
On September 19, 2014, ROIC entered into three separate Sales Agreements (the “Original Sales Agreements”) with each of Jefferies LLC, KeyBanc Capital Markets Inc. and Raymond James & Associates, Inc. (each individually, an “Original Agent” and collectively, the “Original Agents”) pursuant to which ROIC may sell, from time to time, shares of ROIC’s common stock, par value $0.0001 per share, having an aggregate offering price of up to $100.0 million through the Original Agents either as agents or principals. On May 23, 2016, ROIC entered into two additional sales agreements (the “Additional Sales Agreements”, and together with the Original Sales Agreements, the “Sales Agreements”) with each of Canaccord Genuity Inc. and Robert W. Baird & Co. Incorporated (the “Additional Agents”, and together with the Original Agents, the “Agents”) pursuant to which the Company may sell shares of ROIC’s common stock through the Additional Agents either as agents or principals.
During the year ended December 31, 2017, ROIC sold a total of 34,001 shares of common stock under the Sales Agreements, which resulted in gross proceeds of approximately $681,000 and commissions of approximately $9,000 paid to the Agents. During the year ended December 31, 2016, ROIC sold a total of 2,202,254 shares under the Sales Agreements, which resulted in gross proceeds of approximately $45.6 million and commissions of approximately $584,000 paid to the Agents.
Stock Repurchase Program
On July 31, 2013, ROIC’s board of directors authorized a stock repurchase program to repurchase up to a maximum of $50.0 million of the Company’s common stock. Through the year ended December 31, 2017, the Company has not repurchased any shares of common stock under this program.
8. Stock Compensation and Other Benefit Plans for ROIC
The Company follows the FASB guidance related to stock compensation which establishes financial accounting and reporting standards for stock-based employee compensation plans, including all arrangements by which employees receive shares of stock or other equity instruments of the employer, or the employer incurs liabilities to employees in amounts based on the price of the employer’s stock. The guidance also defines a fair value-based method of accounting for an employee stock option or similar equity instrument.
During 2009, the Company adopted the 2009 Plan. The 2009 Plan provides for grants of restricted common stock and stock option awards up to an aggregate of 7.5% of the issued and outstanding shares of the Company’s common stock at the time of the award, subject to a ceiling of 4,000,000 shares.
77
Restricted Stock
During the year ended December 31, 2017, ROIC awarded 419,394 shares of restricted common stock under the 2009 Plan, of which 149,475 shares are performance-based grants and the remainder of the shares are time based grants. The performance-based grants vest based on pre-defined market-specific performance criteria with a vesting date on January 1, 2020.
A summary of the status of the Company’s non-vested restricted stock awards as of December 31, 2017, and changes during the year ended December 31, 2017 are presented below:
Shares | Weighted Average Grant Date Fair Value | |||||
Non-vested at December 31, 2016 | 660,458 | $ | 16.10 | |||
Granted | 419,394 | $ | 19.58 | |||
Vested | (296,386 | ) | $ | 15.61 | ||
Forfeited | (1,999 | ) | $ | 19.66 | ||
Non-vested at December 31, 2017 | 781,467 | $ | 18.14 | |||
As of December 31, 2017, there remained a total of approximately $7.0 million of unrecognized restricted stock compensation related to outstanding non-vested restricted stock grants awarded under the 2009 Plan. Restricted stock compensation is expected to be expensed over a remaining weighted average period of 1.7 years (irrespective of achievement of the performance conditions). The total fair value of restricted stock that vested during the years ended December 31, 2017, 2016 and 2015 was $6.3 million, $5.6 million and $4.6 million, respectively.
Stock Based Compensation Expense
For the years ended December 31, 2017, 2016 and 2015, the amounts charged to expense for all stock based compensation totaled approximately $6.2 million, $4.9 million and $4.7 million, respectively.
Profit Sharing and Savings Plan
During 2011, the Company established a profit sharing and savings plan (the “401K Plan”), which permits eligible employees to defer a portion of their compensation in accordance with the Code. Under the 401K Plan, the Company made matching contributions on behalf of eligible employees. The Company made contributions to the 401K Plan of approximately $70,000, $76,000 and $31,000 for the years ended December 31, 2017, 2016 and 2015, respectively.
9. Capital of the Operating Partnership
As of December 31, 2017, the Operating Partnership had 124,026,442 OP Units outstanding. ROIC owned an approximate 90.5% interest in the Operating Partnership at December 31, 2017, or 112,347,451 OP Units. The remaining 11,678,991 OP Units are owned by other limited partners. A share of ROIC’s common stock and the OP Units have essentially the same economic characteristics as they share equally in the total net income or loss and distributions of the Operating Partnership.
As of December 31, 2017, subject to certain exceptions, holders are able to redeem their OP Units, at the option of ROIC, for cash or for unregistered shares of ROIC common stock on a one-for-one basis. If cash is paid in the redemption, the redemption price is equal to the average closing price on the NASDAQ Stock Market for shares of ROIC’s common stock over the ten consecutive trading days immediately preceding the date a redemption notice is received by ROIC.
In connection with the acquisitions of Fullerton Crossroads and Riverstone Marketplace, a portion of the consideration for the properties was funded through the issuance of 2,405,430 OP Units. On December 12, 2017, the Company issued 2,584,254 shares of common stock in exchange for the 2,405,430 OP Units previously issued and the rights to approximately $3.8 million of cash to be used to acquire a third property to be identified by the Company.
During the year ended December 31, 2017, ROIC received notices of redemption for a total of 157,567 OP Units (excluding the OP Units exchanged, as described above). ROIC elected to redeem 150,503 OP Units for shares of ROIC common stock on a one-for-one basis, and accordingly, 150,503 shares of ROIC common stock were issued. ROIC elected to redeem the remaining 7,064 OP Units in cash.
78
The redemption value of the OP Units owned by the limited partners as of December 31, 2017, not including ROIC, had such units been redeemed at December 31, 2017, was approximately $229.5 million, calculated based on the average closing price on the NASDAQ Stock Market of ROIC common stock for the ten consecutive trading days immediately preceding December 31, 2017, which amounted to $19.65 per share.
Retail Opportunity Investments GP, LLC, ROIC’s wholly-owned subsidiary, is the sole general partner of the Operating Partnership, and as the parent company, ROIC has the full and complete authority over the Operating Partnership’s day-to-day management and control. As the sole general partner of the Operating Partnership, ROIC effectively controls the ability to issue common stock of ROIC upon redemption of any OP Units. The redemption provisions that permit ROIC to settle the redemption of OP Units in either cash or common stock, in the sole discretion of ROIC, are further evaluated in accordance with applicable accounting guidance to determine whether temporary or permanent equity classification on the balance sheet is appropriate. The Company evaluated this guidance, including the ability, in its sole discretion, to settle in unregistered shares of common stock, and determined that the OP Units meet the requirements to qualify for presentation as permanent equity.
10. Fair Value of Financial Instruments
The Company follows the FASB guidance that defines fair value, establishes a framework for measuring fair value, and expands disclosures about fair value measurements. The guidance applies to reported balances that are required or permitted to be measured at fair value under existing accounting pronouncements; accordingly, the standard does not require any new fair value measurements of reported balances.
The guidance emphasizes that fair value is a market-based measurement, not an entity-specific measurement. Therefore, a fair value measurement should be determined based on the assumptions that market participants would use in pricing the asset or liability. As a basis for considering market participant assumptions in fair value measurements, the guidance establishes a fair value hierarchy that distinguishes between market participant assumptions based on market data obtained from sources independent of the reporting entity (observable inputs that are classified within Levels 1 and 2 of the hierarchy) and the reporting entity’s own assumptions about market participant assumptions (unobservable inputs classified within Level 3 of the hierarchy).
Level 1 inputs utilize quoted prices (unadjusted) in active markets for identical assets or liabilities that the Company has the ability to access. Level 2 inputs are inputs other than quoted prices included in Level 1 that are observable for the asset or liability, either directly or indirectly. Level 2 inputs may include quoted prices for similar assets and liabilities in active markets, as well as inputs that are observable for the asset or liability (other than quoted prices), such as interest rates, foreign exchange rates, and yield curves that are observable at commonly quoted intervals. Level 3 inputs are unobservable inputs for the asset or liability, which are typically based on an entity’s own assumptions, as there is little, if any, related market activity. In instances where the determination of the fair value measurement is based on inputs from different levels of the fair value hierarchy, the level in the fair value hierarchy within which the entire fair value measurement falls is based on the lowest level input that is significant to the fair value measurement in its entirety. The Company’s assessment of the significance of a particular input to the fair value measurement in its entirety requires judgment, and considers factors specific to the asset or liability.
The following disclosures of estimated fair value were determined by management, using available market information and appropriate valuation methodologies as discussed in Note 1. Considerable judgment is necessary to interpret market data and develop estimated fair value. Accordingly, the estimates presented herein are not necessarily indicative of the amounts realizable upon disposition of the financial instruments. The use of different market assumptions or estimation methodologies may have a material effect on the estimated fair value amounts.
The carrying values of cash and cash equivalents, restricted cash, tenant and other receivables, deposits, prepaid expenses, other assets, accounts payable and accrued expenses are reasonable estimates of their fair values because of the short-term nature of these instruments. The carrying values of the term loan and revolving credit facility are deemed to be at fair value since the outstanding debt is directly tied to monthly LIBOR contracts. The fair value of the outstanding Senior Notes Due 2027 at December 31, 2017 is approximately $249.5 million, calculated using significant inputs which are not observable in the market. The fair value of the outstanding Senior Notes Due 2026 at December 31, 2017 is approximately $196.2 million, calculated using significant inputs which are not observable in the market. The fair value, based on inputs not quoted on active markets, but corroborated by market data, or Level 2, of the outstanding Senior Notes Due 2024 at December 31, 2017 is approximately $248.3 million. The fair value, based on inputs not quoted on active markets, but corroborated by market data, or Level 2, of the outstanding Senior Notes Due 2023 at December 31, 2017 is approximately $259.6 million. Assumed mortgage notes payable were recorded at their fair value at the time they were assumed and are estimated to have a fair value of approximately $72.7 million with an interest rate range of 4.0% to 5.0% and a weighted average interest rate of 4.2% as of December 31, 2017. Mortgage notes payable originated by the Company are estimated to have a fair value of approximately $33.2 million with an interest rate of 4.6% as of December 31, 2017. These fair value measurements fall within level 3 of the fair value hierarchy.
79
11. Derivative and Hedging Activities
The Company’s objectives in using interest rate derivatives is to add stability to interest expense and to manage its exposure to interest rate movements. To accomplish this objective, the Company uses interest rate swaps as part of its interest rate risk management strategy. Interest rate swaps designated as cash flow hedges involve the receipt of variable-rate amounts from a counterparty in exchange for the Company making fixed-rate payments over the life of the agreements without exchange of the underlying notional amount.
The following is a summary of the terms of the Company’s current interest rate swaps as of December 31, 2017 (in thousands):
Swap Counterparty | Notional Amount | Effective Date | Maturity Date | ||||
Bank of Montreal | $ | 50,000 | 1/29/2016 | 1/31/2019 | |||
Regions Bank | $ | 50,000 | 2/29/2016 | 1/31/2019 | |||
Bank of Montreal | $ | 100,000 | 12/29/2017 | 8/31/2022 | |||
U.S. Bank | $ | 100,000 | 12/29/2017 | 8/31/2022 | |||
The changes in the fair value of derivatives that are designated as cash flow hedges are recorded in accumulated other comprehensive income (“AOCI”) and will be subsequently reclassified into earnings during the period in which the hedged forecasted transaction affects earnings.
The valuation of these instruments is determined using widely accepted valuation techniques including discounted cash flow analysis on the expected cash flows of the derivative. This analysis reflects the contractual terms of the derivative, including the period to maturity, and uses observable market-based inputs, including interest rate curves, and implied volatilities. The fair value of interest rate swaps is determined using the market standard methodology of netting the discounted future fixed cash receipts (or payments) and the discounted expected variable cash payments (or receipts). The variable cash payments (or receipts) are based on an expectation of future interest rates (forward curves) derived from observable market interest rate curves.
The Company incorporated credit valuation adjustments to appropriately reflect both its own non-performance risk and the respective counterparties non-performance risk in the fair value measurements. In adjusting the fair value of its derivative contract for the effect of non-performance risk, the Company considered the impact of netting and any applicable credit enhancements, such as collateral postings, thresholds, mutual puts, and guarantees.
Although the Company has determined that the majority of the inputs used to value its derivatives fall within Level 2 of the fair value hierarchy, the credit valuation adjustments associated with its derivatives utilize Level 3 inputs, such as estimates of current credit spreads to evaluate the likelihood of default by the Company and its counterparties. However, as of December 31, 2017, the Company has assessed the significance of the impact of the credit valuation adjustments on the overall valuation of its derivative position and has determined that the credit valuation adjustments are not significant to the overall valuation of its derivatives. As a result, the Company has determined that its derivative valuation in its entirety is classified in Level 2 of the fair value hierarchy.
80
The table below presents the Company’s assets and liabilities measured at fair value on a recurring basis, aggregated by the level in the fair value hierarchy within which those measurements fall (in thousands).
Quoted Prices in Active Markets for Identical Assets and Liabilities (Level 1) | Significant Other Observable Inputs (Level 2) | Significant Unobservable Inputs (Level 3) | Total | ||||||||||||
December 31, 2017: | |||||||||||||||
Assets | |||||||||||||||
Derivative financial instruments | $ | — | $ | 4,321 | $ | — | $ | 4,321 | |||||||
December 31, 2016 | |||||||||||||||
Assets | |||||||||||||||
Derivative financial instruments | $ | — | $ | 875 | $ | — | $ | 875 | |||||||
Amounts paid, or received, to cash settle interest rate derivatives prior to their maturity date are recorded in AOCI at the cash settlement amount, and will be reclassified to interest expense as interest expense is recognized on the hedged debt. During the next twelve months, the Company estimates that $712,000 will be reclassified as an increase to interest expense related to the Company’s four outstanding swap arrangements and it’s previously cash-settled swap arrangements.
The table below presents the fair value of the Company’s derivative financial instruments as well as their classification on the balance sheet as of December 31, 2017 and 2016, respectively (in thousands):
Derivatives designed as hedging instruments | Balance sheet location | December 31, 2017 Fair Value | December 31, 2016 Fair Value | ||||||
Interest rate products | Other assets | $ | 4,321 | $ | 875 | ||||
Derivatives in Cash Flow Hedging Relationships
The table below details the location in the financial statements of the gain or loss recognized on interest rate derivatives designated as cash flow hedges for the years ended December 31, 2017, 2016, and 2015, respectively (in thousands). Amounts reclassified from other comprehensive income (“OCI”) due to ineffectiveness are recognized as interest expense.
Year Ended December 31, | |||||||||||
2017 | 2016 | 2015 | |||||||||
Amount of gain recognized in OCI on derivatives | $ | 3,665 | $ | 541 | $ | — | |||||
Amount of loss reclassified from accumulated OCI into interest | $ | 1,920 | $ | 2,473 | $ | 2,139 | |||||
12. Commitments and Contingencies
In the normal course of business, from time to time, the Company is involved in legal actions relating to the ownership and operations of its properties. In management’s opinion, the liabilities, if any, that ultimately may result from such legal actions are not expected to have a material adverse effect on the consolidated financial position, results of operations or liquidity of the Company.
The Company has signed several ground leases for certain properties. For financial reporting purposes, rent expense is recognized on a straight-line basis over the term of the lease. Accordingly, rent expense recognized in excess of rent paid is reflected as a liability in the accompanying consolidated balance sheets. Rent expense, for both ground leases and corporate office storage space, was approximately $1.5 million, $831,000, and $1.2 million for the years ended December 31, 2017, 2016, and 2015, respectively.
81
The following table represents the Company’s future minimum annual lease payments under operating leases as of December 31, 2017 (in thousands):
Operating Leases | |||
2018 | $ | 1,273 | |
2019 | 1,278 | ||
2020 | 1,286 | ||
2021 | 1,282 | ||
2022 | 1,304 | ||
Thereafter | 35,347 | ||
Total minimum lease payments | $ | 41,770 | |
Tax Protection Agreements
In connection with the acquisition of the remaining 51% of the partnership interests in the Terranomics Crossroads Associates, LP and the acquisition of 100% of the equity interest in SARM Five Points Plaza LLC in September 2013, the Company entered into Tax Protection Agreements with certain limited partners of the Operating Partnership. The Tax Protection Agreements require the Company, subject to certain exceptions, for a period of 12 years, to indemnify the respective sellers receiving OP Units against certain tax liabilities incurred by them, as calculated pursuant to the respective Tax Protection Agreements. In connection with the acquisition of Wilsonville Town Center in December 2014, Iron Horse Plaza, Bellevue Marketplace and Warner Plaza in December 2015, Magnolia Shopping Center and Casitas Plaza Shopping Center in March 2016, and Santa Rosa Southside Shopping Center in March 2017 (more fully discussed in Footnote 2), the Company entered into Tax Protection Agreements with certain limited partners of the Operating Partnership. The Tax Protection Agreements require the Company, subject to certain exceptions, for a period of 10 years, to indemnify the respective sellers receiving OP Units against certain tax liabilities incurred by them, as calculated pursuant to the respective Tax Protection Agreements. If the Company were to trigger the tax protection provisions under these agreements, the Company would be required to pay damages in the amount of the taxes owed by these limited partners (plus additional damages in the amount of the taxes incurred as a result of such payment).
13. Related Party Transactions
The Company has entered into several lease agreements with an officer of the Company, whereby pursuant to the lease agreements, the Company is provided the use of storage space. For the years ended December 31, 2017, 2016, and 2015, the Company incurred approximately $52,000, $46,000 and $42,000, respectively, of expenses relating to the agreements which were included in general and administrative expenses in the accompanying consolidated statements of operations and other comprehensive income.
14. Quarterly Results of Operations (Unaudited)
The unaudited quarterly results of operations for the years ended December 31, 2017 and 2016 for ROIC are as follows (in thousands, except share data):
Year Ended December 31, 2017 | |||||||||||||||
March 31 | June 30 | September 30 | December 31 | ||||||||||||
Total revenues | $ | 65,900 | $ | 66,640 | $ | 67,966 | $ | 72,754 | |||||||
Net income | $ | 11,251 | $ | 9,197 | $ | 10,127 | $ | 12,113 | |||||||
Net income attributable to ROIC | $ | 10,170 | $ | 8,309 | $ | 9,149 | $ | 10,849 | |||||||
Basic and diluted income per share | $ | 0.09 | $ | 0.08 | $ | 0.08 | $ | 0.10 | |||||||
Year Ended December 31, 2016 | |||||||||||||||
March 31 | June 30 | September 30 | December 31 | ||||||||||||
Total revenues | $ | 56,094 | $ | 58,671 | $ | 59,354 | $ | 63,070 | |||||||
Net income | $ | 8,925 | $ | 8,638 | $ | 8,215 | $ | 10,652 | |||||||
Net income attributable to ROIC | $ | 8,027 | $ | 7,704 | $ | 7,402 | $ | 9,621 | |||||||
Basic and diluted income per share | $ | 0.08 | $ | 0.08 | $ | 0.07 | $ | 0.09 | |||||||
82
The unaudited quarterly results of operations for the years ended December 31, 2017 and 2016 for the Operating Partnership are as follows (in thousands, except unit data):
Year Ended December 31, 2017 | |||||||||||||||
March 31 | June 30 | September 30 | December 31 | ||||||||||||
Total revenues | $ | 65,900 | $ | 66,640 | $ | 67,966 | $ | 72,754 | |||||||
Net income attributable to the Operating Partnership | $ | 11,251 | $ | 9,197 | $ | 10,127 | $ | 12,113 | |||||||
Basic and diluted income per unit | $ | 0.09 | $ | 0.08 | $ | 0.08 | $ | 0.10 | |||||||
Year Ended December 31, 2016 | |||||||||||||||
March 31 | June 30 | September 30 | December 31 | ||||||||||||
Total revenues | $ | 56,094 | $ | 58,671 | $ | 59,354 | $ | 63,070 | |||||||
Net income attributable to the Operating Partnership | $ | 8,925 | $ | 8,638 | $ | 8,215 | $ | 10,652 | |||||||
Basic and diluted income per unit | $ | 0.08 | $ | 0.08 | $ | 0.07 | $ | 0.09 | |||||||
15. Subsequent Events
On February 20, 2018, the Company’s board of directors declared a cash dividend on its common stock of $0.1950 per share, payable on March 29, 2017 to holders of record on March 15, 2017.
83
SCHEDULE III – REAL ESTATE AND ACCUMULATED DEPRECIATION
December 31, 2017
(in thousands)
Initial Cost to Company | Cost Capitalized Subsequent to Acquisition | Amount at Which Carried at Close of Period | |||||||||||||||||||||||||||||||||||
Description and Location | Encumbrances | Land | Building & Improvements | Land | Building & Improvements | Land | Building & Improvements | Total (a) | Accumulated Depreciation (b) (1) | Date of Acquisition | |||||||||||||||||||||||||||
Paramount Plaza, CA | $ | — | $ | 6,347 | $ | 10,274 | $ | 317 | $ | 2,157 | $ | 6,664 | $ | 12,431 | $ | 19,095 | $ | 3,004 | 12/22/2009 | ||||||||||||||||||
Santa Ana Downtown Plaza, CA | — | 7,895 | 9,890 | — | 3,746 | 7,895 | 13,636 | 21,531 | 2,747 | 1/26/2010 | |||||||||||||||||||||||||||
Meridian Valley Plaza, WA | — | 1,881 | 4,795 | — | 1,510 | 1,881 | 6,305 | 8,186 | 1,361 | 2/1/2010 | |||||||||||||||||||||||||||
The Market at Lake Stevens, WA | — | 3,087 | 12,397 | — | 420 | 3,087 | 12,817 | 15,904 | 3,000 | 3/16/2010 | |||||||||||||||||||||||||||
Norwood Shopping Center, CA | — | 3,031 | 11,534 | 122 | 1,782 | 3,153 | 13,316 | 16,469 | 3,065 | 4/5/2010 | |||||||||||||||||||||||||||
Pleasant Hill Marketplace, CA | — | 6,359 | 6,927 | — | 1,590 | 6,359 | 8,517 | 14,876 | 2,028 | 4/8/2010 | |||||||||||||||||||||||||||
Vancouver Market Center, WA | — | 4,080 | 6,912 | — | 3,097 | 4,080 | 10,009 | 14,089 | 1,889 | 6/17/2010 | |||||||||||||||||||||||||||
Happy Valley Town Center, OR | — | 11,678 | 27,011 | — | 2,046 | 11,678 | 29,057 | 40,735 | 6,753 | 7/14/2010 | |||||||||||||||||||||||||||
Cascade Summit, OR | — | 8,853 | 7,732 | — | 388 | 8,853 | 8,120 | 16,973 | 2,245 | 8/20/2010 | |||||||||||||||||||||||||||
Heritage Market Center, WA | — | 6,595 | 17,399 | — | 648 | 6,595 | 18,047 | 24,642 | 3,905 | 9/23/2010 | |||||||||||||||||||||||||||
Claremont Center, CA | — | 5,975 | 1,019 | 183 | 4,526 | 6,158 | 5,545 | 11,703 | 2,245 | 9/23/2010 | |||||||||||||||||||||||||||
Shops At Sycamore Creek, CA | — | 3,747 | 11,584 | — | 574 | 3,747 | 12,158 | 15,905 | 3,139 | 9/30/2010 | |||||||||||||||||||||||||||
Gateway Village, CA | — | 5,917 | 27,298 | — | 727 | 5,917 | 28,025 | 33,942 | 5,806 | 12/16/2010 | |||||||||||||||||||||||||||
Division Crossing, OR | — | 3,706 | 8,327 | — | 5,726 | 3,706 | 14,053 | 17,759 | 3,318 | 12/22/2010 | |||||||||||||||||||||||||||
Halsey Crossing, OR (2) | — | — | 7,773 | — | 7,459 | — | 15,232 | 15,232 | 2,184 | 12/22/2010 | |||||||||||||||||||||||||||
Marketplace Del Rio,CA | — | 13,420 | 22,251 | 9 | 1,991 | 13,429 | 24,242 | 37,671 | 5,429 | 1/3/2011 | |||||||||||||||||||||||||||
Pinole Vista, CA | — | 12,894 | 30,670 | — | 2,659 | 12,894 | 33,329 | 46,223 | 5,274 | 1/6/2011 | |||||||||||||||||||||||||||
Desert Spring Marketplace, CA | — | 8,517 | 18,761 | 443 | 5,953 | 8,960 | 24,714 | 33,674 | 4,820 | 2/17/2011 | |||||||||||||||||||||||||||
Mills Shopping Center, CA | — | 4,084 | 16,833 | — | 10,646 | 4,084 | 27,479 | 31,563 | 6,435 | 2/17/2011 | |||||||||||||||||||||||||||
Morada Ranch, CA | — | 2,504 | 19,547 | — | 506 | 2,504 | 20,053 | 22,557 | 4,204 | 5/20/2011 | |||||||||||||||||||||||||||
Renaissance, CA | — | 8,640 | 13,848 | — | 639 | 8,640 | 14,487 | 23,127 | 2,710 | 8/3/2011 | |||||||||||||||||||||||||||
Country Club Gate, CA | — | 6,487 | 17,341 | — | 1,194 | 6,487 | 18,535 | 25,022 | 3,828 | 7/8/2011 | |||||||||||||||||||||||||||
Canyon Park, WA | — | 9,352 | 15,916 | — | 8,947 | 9,352 | 24,863 | 34,215 | 4,395 | 7/29/2011 | |||||||||||||||||||||||||||
Hawks Prairie, WA | — | 5,334 | 20,694 | — | 2,142 | 5,334 | 22,836 | 28,170 | 3,970 | 9/8/2011 | |||||||||||||||||||||||||||
Kress Building, WA | — | 5,693 | 20,866 | — | 4,680 | 5,693 | 25,546 | 31,239 | 5,271 | 9/30/2011 | |||||||||||||||||||||||||||
Round Hill Square, CA | — | 6,358 | 17,734 | — | 796 | 6,358 | 18,530 | 24,888 | 3,799 | 8/23/2011 | |||||||||||||||||||||||||||
Hillsboro, OR (2) | — | — | 17,553 | — | 780 | — | 18,333 | 18,333 | 3,780 | 11/23/2011 | |||||||||||||||||||||||||||
Gateway Shopping Center, WA (2) | — | 6,242 | 23,462 | — | (4 | ) | 6,242 | 23,458 | 29,700 | 4,033 | 2/16/2012 | ||||||||||||||||||||||||||
Euclid Plaza, CA | — | 7,407 | 7,753 | — | 2,947 | 7,407 | 10,700 | 18,107 | 2,553 | 3/28/2012 | |||||||||||||||||||||||||||
Green Valley, CA | — | 1,685 | 8,999 | — | 631 | 1,685 | 9,630 | 11,315 | 1,963 | 4/2/2012 | |||||||||||||||||||||||||||
Aurora Square, WA | — | 3,002 | 1,693 | — | (22 | ) | 3,002 | 1,671 | 4,673 | 458 | 5/3/2012 | ||||||||||||||||||||||||||
84
Marlin Cove, CA | — | 8,815 | 6,797 | — | 1,955 | 8,815 | 8,752 | 17,567 | 1,892 | 5/4/2012 | |||||||||||||||||||||||||||
Seabridge, CA | — | 5,098 | 17,164 | — | 2,831 | 5,098 | 19,995 | 25,093 | 3,373 | 5/31/2012 | |||||||||||||||||||||||||||
Novato, CA | — | 5,329 | 4,412 | — | 1,335 | 5,329 | 5,747 | 11,076 | 829 | 7/24/2012 | |||||||||||||||||||||||||||
Glendora, CA | — | 5,847 | 8,758 | — | 166 | 5,847 | 8,924 | 14,771 | 1,766 | 8/1/2012 | |||||||||||||||||||||||||||
Wilsonville, WA | — | 4,181 | 15,394 | — | 559 | 4,181 | 15,953 | 20,134 | 2,639 | 8/1/2012 | |||||||||||||||||||||||||||
Bay Plaza, CA | — | 5,454 | 14,857 | — | 1,326 | 5,454 | 16,183 | 21,637 | 2,840 | 10/5/2012 | |||||||||||||||||||||||||||
Santa Theresa, CA | 10,138 | 14,965 | 17,162 | — | 4,855 | 14,965 | 22,017 | 36,982 | 3,889 | 11/8/2012 | |||||||||||||||||||||||||||
Cypress West, CA | — | 15,480 | 11,819 | 80 | 2,023 | 15,560 | 13,842 | 29,402 | 2,615 | 12/7/2012 | |||||||||||||||||||||||||||
Redondo Beach, CA | — | 16,242 | 13,625 | 36 | 166 | 16,278 | 13,791 | 30,069 | 2,196 | 12/28/2012 | |||||||||||||||||||||||||||
Harbor Place, CA | — | 16,506 | 10,527 | — | 342 | 16,506 | 10,869 | 27,375 | 1,653 | 12/28/2012 | |||||||||||||||||||||||||||
Diamond Bar Town Center, CA | — | 9,540 | 16,795 | — | 3,501 | 9,540 | 20,296 | 29,836 | 3,736 | 2/1/2013 | |||||||||||||||||||||||||||
Bernardo Heights, CA | — | 3,192 | 8,940 | — | 701 | 3,192 | 9,641 | 12,833 | 1,521 | 2/6/2013 | |||||||||||||||||||||||||||
Canyon Crossing, WA | — | 7,941 | 24,659 | — | 2,874 | 7,941 | 27,533 | 35,474 | 4,670 | 4/15/2013 | |||||||||||||||||||||||||||
Diamond Hills, CA | 35,500 | 15,458 | 29,353 | — | 223 | 15,458 | 29,576 | 45,034 | 4,443 | 4/22/2013 | |||||||||||||||||||||||||||
Granada Shopping Center, CA | — | 3,673 | 13,459 | — | 389 | 3,673 | 13,848 | 17,521 | 2,067 | 6/27/2013 | |||||||||||||||||||||||||||
Hawthorne Crossings, CA | — | 10,383 | 29,277 | — | 413 | 10,383 | 29,690 | 40,073 | 4,183 | 6/27/2013 | |||||||||||||||||||||||||||
Robinwood, CA | — | 3,997 | 11,317 | 12 | 887 | 4,009 | 12,204 | 16,213 | 1,810 | 8/23/2013 | |||||||||||||||||||||||||||
Five Points Plaza, CA | — | 17,920 | 36,965 | — | 3,593 | 17,920 | 40,558 | 58,478 | 5,027 | 9/27/2013 | |||||||||||||||||||||||||||
Crossroads Shopping Center, CA | — | 68,366 | 67,756 | — | 17,965 | 68,366 | 85,721 | 154,087 | 11,165 | 9/27/2013 | |||||||||||||||||||||||||||
Peninsula Marketplace, CA | — | 14,730 | 19,214 | — | 1,900 | 14,730 | 21,114 | 35,844 | 2,795 | 11/1/2013 | |||||||||||||||||||||||||||
Country Club Village, CA | — | 9,986 | 26,579 | — | 1,778 | 9,986 | 28,357 | 38,343 | 4,140 | 11/26/2013 | |||||||||||||||||||||||||||
Plaza de la Canada, CA (2) | — | 10,351 | 24,819 | — | 400 | 10,351 | 25,219 | 35,570 | 3,028 | 12/13/2013 | |||||||||||||||||||||||||||
Tigard Marketplace, CA | — | 13,587 | 9,603 | — | 513 | 13,587 | 10,116 | 23,703 | 1,670 | 2/18/2014 | |||||||||||||||||||||||||||
Creekside Plaza, CA | — | 14,807 | 29,476 | — | 185 | 14,807 | 29,661 | 44,468 | 3,968 | 2/28/2014 | |||||||||||||||||||||||||||
North Park Plaza, CA | — | 13,593 | 17,733 | — | 543 | 13,593 | 18,276 | 31,869 | 1,927 | 4/30/2014 | |||||||||||||||||||||||||||
Aurora Square II, WA | — | 7,323 | 11,644 | — | 353 | 7,323 | 11,997 | 19,320 | 1,271 | 5/22/2014 | |||||||||||||||||||||||||||
Fallbrook Shopping Center (2) | — | 21,232 | 186,197 | 83 | 7,215 | 21,315 | 193,412 | 214,727 | 20,913 | 6/13/2014 | |||||||||||||||||||||||||||
Moorpark Town Center, CA | — | 7,063 | 19,694 | — | 1,568 | 7,063 | 21,262 | 28,325 | 2,670 | 12/4/2014 | |||||||||||||||||||||||||||
Mission Foothill Marketplace, CA | — | 11,415 | 17,783 | — | 118 | 11,415 | 17,901 | 29,316 | 1,343 | 12/4/2014 | |||||||||||||||||||||||||||
Wilsonville Town Center, OR | — | 10,334 | 27,101 | — | 456 | 10,334 | 27,557 | 37,891 | 2,749 | 12/11/2014 | |||||||||||||||||||||||||||
Park Oaks Shopping Center, CA | — | 8,527 | 38,064 | — | 624 | 8,527 | 38,688 | 47,215 | 3,598 | 1/6/2016 | |||||||||||||||||||||||||||
Ontario Plaza, CA | — | 9,825 | 26,635 | — | 1,415 | 9,825 | 28,050 | 37,875 | 2,759 | 1/6/2015 | |||||||||||||||||||||||||||
Winston Manor, CA | — | 10,018 | 9,762 | — | 1,729 | 10,018 | 11,491 | 21,509 | 1,182 | 1/7/2015 | |||||||||||||||||||||||||||
Jackson Square, CA | — | 6,886 | 24,558 | — | 933 | 6,886 | 25,491 | 32,377 | 1,933 | 7/1/2015 | |||||||||||||||||||||||||||
Tigard Promenade, OR | — | 9,844 | 10,843 | — | 108 | 9,844 | 10,951 | 20,795 | 826 | 7/28/2015 | |||||||||||||||||||||||||||
Sunnyside Village Square, OR | — | 4,428 | 13,324 | — | 3,313 | 4,428 | 16,637 | 21,065 | 1,143 | 7/28/2015 | |||||||||||||||||||||||||||
Gateway Centre, CA | — | 16,275 | 28,308 | — | 2,858 | 16,275 | 31,166 | 47,441 | 2,130 | 9/1/2015 | |||||||||||||||||||||||||||
Johnson Creek, OR | — | 9,009 | 22,534 | — | 1,345 | 9,009 | 23,879 | 32,888 | 1,761 | 11/9/2015 | |||||||||||||||||||||||||||
Iron Horse Plaza, CA | — | 8,187 | 39,654 | — | 459 | 8,187 | 40,113 | 48,300 | 2,289 | 12/4/2015 | |||||||||||||||||||||||||||
Bellevue Marketplace, WA | — | 10,488 | 39,119 | — | 6,812 | 10,488 | 45,931 | 56,419 | 2,464 | 12/10/2015 | |||||||||||||||||||||||||||
85
Four Corner Square, WA | — | 9,926 | 31,415 | — | 459 | 9,926 | 31,874 | 41,800 | 2,136 | 12/21/2015 | |||||||||||||||||||||||||||
Warner Plaza Shopping Center, CA | — | 16,104 | 60,188 | — | 7,429 | 16,104 | 67,617 | 83,721 | 3,770 | 12/31/2015 | |||||||||||||||||||||||||||
Magnolia Shopping Center, CA | 8,951 | 12,501 | 27,040 | — | 1,084 | 12,501 | 28,124 | 40,625 | 1,596 | 3/10/2016 | |||||||||||||||||||||||||||
Casitas Plaza Shopping Center, CA | 7,307 | 9,905 | 18,731 | — | 297 | 9,905 | 19,028 | 28,933 | 1,096 | 3/10/2016 | |||||||||||||||||||||||||||
Bouquet Center, CA | — | 10,040 | 48,362 | — | 529 | 10,040 | 48,891 | 58,931 | 2,408 | 4/28/2016 | |||||||||||||||||||||||||||
North Ranch Shopping Center, CA | — | 31,522 | 95,916 | — | (6 | ) | 31,522 | 95,910 | 127,432 | 4,235 | 6/1/2016 | ||||||||||||||||||||||||||
Monterey Center, CA (2) | — | 1,073 | 10,609 | — | 2 | 1,073 | 10,611 | 11,684 | 486 | 7/14/2016 | |||||||||||||||||||||||||||
Rose City Center, OR (2) | — | 3,637 | 10,301 | — | — | 3,637 | 10,301 | 13,938 | 467 | 9/15/2016 | |||||||||||||||||||||||||||
Trader Joe’s at the Knolls, CA | — | 9,726 | 18,299 | — | 20 | 9,726 | 18,319 | 28,045 | 702 | 10/3/2016 | |||||||||||||||||||||||||||
Bridle Trails Shopping Center, WA | — | 11,534 | 20,700 | — | 357 | 11,534 | 21,057 | 32,591 | 840 | 10/17/2016 | |||||||||||||||||||||||||||
Torrey Hills Corporate Center, CA | — | 5,579 | 3,915 | — | 1,393 | 5,579 | 5,308 | 10,887 | 138 | 12/6/2016 | |||||||||||||||||||||||||||
PCC Community Markets Plaza | — | 1,856 | 6,914 | — | 7 | 1,856 | 6,921 | $ | 8,777 | 207 | 1/25/2017 | ||||||||||||||||||||||||||
The Terraces | — | 18,378 | 37,103 | — | 355 | 18,378 | 37,458 | $ | 55,836 | 888 | 3/17/2017 | ||||||||||||||||||||||||||
Santa Rosa Southside Shopping Center | — | 5,593 | 24,453 | — | 1,279 | 5,593 | 25,732 | $ | 31,325 | 552 | 3/24/2017 | ||||||||||||||||||||||||||
Division Center | — | 6,917 | 26,098 | — | 242 | 6,917 | 26,340 | $ | 33,257 | 610 | 4/5/2017 | ||||||||||||||||||||||||||
Highland Hill Shopping Center | — | 10,511 | 37,825 | — | 293 | 10,511 | 38,118 | $ | 48,629 | 796 | 5/9/2017 | ||||||||||||||||||||||||||
Monta Loma Plaza | — | 18,223 | 11,113 | — | 3 | 18,223 | 11,116 | $ | 29,339 | 86 | 9/19/2017 | ||||||||||||||||||||||||||
Fullerton Crossroads | 26,000 | 28,164 | 44,870 | — | — | 28,164 | 44,870 | $ | 73,034 | 351 | 10/11/2017 | ||||||||||||||||||||||||||
Riverstone Marketplace | 18,424 | 5,113 | 27,594 | — | 5 | 5,113 | 27,599 | $ | 32,712 | 210 | 10/11/2017 | ||||||||||||||||||||||||||
North Lynnwood Shopping Center | — | 4,923 | 10,335 | — | 2 | 4,923 | 10,337 | $ | 15,260 | 57 | 10/19/2017 | ||||||||||||||||||||||||||
The Village at Nellie Gail Ranch | — | 9,222 | 36,889 | — | 97 | 9,222 | 36,986 | $ | 46,208 | — | 11/30/2017 | ||||||||||||||||||||||||||
$ | 106,320 | $ | 877,512 | $ | 2,055,143 | $ | 1,285 | $ | 175,457 | $ | 878,797 | $ | 2,230,600 | $ | 3,109,397 | $ | 260,115 | ||||||||||||||||||||
(a) | RECONCILIATION OF REAL ESTATE – OWNED SUBJECT TO OPERATING LEASES (in thousands) |
Year Ended December 31, | |||||||||||
2017 | 2016 | 2015 | |||||||||
Balance at beginning of period: | $ | 2,687,018 | $ | 2,296,617 | $ | 1,785,898 | |||||
Property improvements during the year | 54,481 | 41,359 | 28,104 | ||||||||
Properties acquired during the year | 374,004 | 354,035 | 485,853 | ||||||||
Assets written off during the year | (6,106 | ) | (4,993 | ) | (3,238 | ) | |||||
Balance at end of period: | $ | 3,109,397 | $ | 2,687,018 | $ | 2,296,617 | |||||
86
(b) | RECONCILIATION OF ACCUMULATED DEPRECIATION (in thousands) |
Year Ended December 31, | |||||||||||
2017 | 2016 | 2015 | |||||||||
Balance at beginning of period: | $ | 193,021 | $ | 134,311 | $ | 88,173 | |||||
Depreciation expenses | 72,725 | 63,872 | 49,619 | ||||||||
Property assets fully depreciated and written off | (5,631 | ) | (5,162 | ) | (3,481 | ) | |||||
Balance at end of period: | $ | 260,115 | $ | 193,021 | $ | 134,311 | |||||
(1) | Depreciation and investments in building and improvements reflected in the consolidated statement of operations is calculated over the estimated useful life of the assets as follows: |
Building: 39-40 years
Property Improvements: 10-20 years
(2) | Property, or a portion thereof, is subject to a ground lease. |
(3) | The aggregate cost for Federal Income Tax Purposes for real estate was approximately $2.8 billion at December 31, 2017. |
87
Item 9. Changes in and Disagreements with Accountants on Accounting and Financial Disclosure
None
Item 9A. Controls and Procedures
Evaluation of Disclosure Controls and Procedures (Retail Opportunity Investments Corp.)
ROIC maintains disclosure controls and procedures that are designed to ensure that information required to be disclosed in its reports filed under the Securities Exchange Act of 1934, as amended, is recorded, processed, summarized and reported within the time periods specified in the U.S. Securities and Exchange Commission’s rules and forms, and that such information is accumulated and communicated to its management, including its Chief Executive Officer and Chief Financial Officer, as appropriate, to allow timely decisions regarding required disclosure. In designing and evaluating the disclosure controls and procedures, ROIC’s management recognizes that any controls and procedures, no matter how well designed and operated, can provide only reasonable assurance of achieving the desired control objectives, and its management is required to apply its judgment in evaluating the cost-benefit relationship of possible controls and procedures.
ROIC’s Chief Executive Officer and Chief Financial Officer, based on their evaluation of ROIC’s disclosure controls and procedures (as defined in Rules 13a-15(e) and 15d-15(e) under the Exchange Act) required by paragraph (b) of Rule 13a-15 or Rule 15d-15, have concluded that as of the end of the period covered by this report, ROIC’s disclosure controls and procedures were effective to give reasonable assurances to the timely collection, evaluation and disclosure of information relating to ROIC that would potentially be subject to disclosure under the Exchange Act and the rules and regulations promulgated thereunder.
During the year ended December 31, 2017, there was no change in ROIC’s internal control over financial reporting that has materially affected, or is reasonably likely to materially affect, ROIC’s internal control over financial reporting.
Evaluation of Disclosure Controls and Procedures (Retail Opportunity Investments Partnership, LP)
The Operating Partnership maintains disclosure controls and procedures that are designed to ensure that information required to be disclosed in its reports filed under the Securities Exchange Act of 1934, as amended, is recorded, processed, summarized and reported within the time periods specified in the U.S. Securities and Exchange Commission’s rules and forms, and that such information is accumulated and communicated to its management, including its Chief Executive Officer and Chief Financial Officer, as appropriate, to allow timely decisions regarding required disclosure. In designing and evaluating the disclosure controls and procedures, the Operating Partnership’s management recognizes that any controls and procedures, no matter how well designed and operated, can provide only reasonable assurance of achieving the desired control objectives, and its management is required to apply its judgment in evaluating the cost-benefit relationship of possible controls and procedures.
The Company’s Chief Executive Officer and Chief Financial Officer, based on their evaluation of the Operating Partnership’s disclosure controls and procedures (as defined in Rules 13a-15(e) and 15d-15(e) under the Exchange Act) required by paragraph (b) of Rule 13a-15 or Rule 15d-15, have concluded that as of the end of the period covered by this report, the Operating Partnership’s disclosure controls and procedures were effective to give reasonable assurances to the timely collection, evaluation and disclosure of information relating to the Operating Partnership that would potentially be subject to disclosure under the Exchange Act and the rules and regulations promulgated thereunder.
During the year ended December 31, 2017, there was no change in the Operating Partnership’s internal control over financial reporting that has materially affected, or is reasonably likely to materially affect, the Operating Partnership’s internal control over financial reporting.
Management’s Report on Internal Control over Financial Reporting (Retail Opportunity Investments Corp.)
Management is responsible for establishing and maintaining adequate internal control over financial reporting, as such term is defined in Exchange Act Rules 13a-15(f) and 15d-15(f). Under the supervision and with the participation of ROIC’s management, including the Chief Executive Officer and Chief Financial Officer, ROIC conducted an evaluation of the effectiveness of its internal control over financial reporting as of December 31, 2017 based on the framework in Internal Control-Integrated Framework issued by the Committee of Sponsoring Organizations of the Treadway Commission (2013 Framework). Based on that evaluation, Management concluded that its internal control over financial reporting was effective as of December 31, 2017.
88
Because of its inherent limitations, internal control over financial reporting may not prevent or detect misstatements. Projections of any evaluation of effectiveness to future periods are subject to the risk that controls may become inadequate because of changes in conditions, or that the degree of compliance with the policies or procedures may deteriorate.
The effectiveness of internal control over financial reporting as of December 31, 2017, has been audited by Ernst & Young LLP, an independent registered public accounting firm, as stated in its report which appears on page 52 of this Annual Report on Form 10-K.
Management’s Report on Internal Control over Financial Reporting (Retail Opportunity Investments Partnership, LP)
Management is responsible for establishing and maintaining adequate internal control over financial reporting, as such term is defined in Exchange Act Rules 13a-15(f) and 15d-15(f). Under the supervision and with the participation of the Operating Partnership’s management, including the Chief Executive Officer and Chief Financial Officer of ROIC, the Operating Partnership conducted an evaluation of the effectiveness of its internal control over financial reporting as of December 31, 2017 based on the framework in Internal Control-Integrated Framework issued by the Committee of Sponsoring Organizations of the Treadway Commission (2013 Framework). Based on that evaluation, Management concluded that its internal control over financial reporting was effective as of December 31, 2017.
Because of its inherent limitations, internal control over financial reporting may not prevent or detect misstatements. Projections of any evaluation of effectiveness to future periods are subject to the risk that controls may become inadequate because of changes in conditions, or that the degree of compliance with the policies or procedures may deteriorate.
Changes in Internal Control over Financial Reporting
There was no change in ROIC’s or the Operating Partnership’s internal control over financial reporting (as such term is defined in Exchange Act Rule 13a-15(f)) that occurred during its most recent quarter that has materially affected, or is reasonably likely to materially affect, its internal control over financial reporting.
Item 9B. Other Information
None.
PART III
Item 10. Directors, Executive Officers and Corporate Governance
Information required by this Item is hereby incorporated by reference to the material appearing in the Proxy Statement for the Company’s 2018 Annual Meeting of Stockholders to be filed within 120 days after December 31, 2017.
Item 11. Executive Compensation
Information required by this Item is hereby incorporated by reference to the material appearing in the Proxy Statement for the Company’s 2018 Annual Meeting of Stockholders to be filed within 120 days after December 31, 2017.
Item 12. Security Ownership of Certain Beneficial Owners and Management and Related Stockholder Matters
Information required by this Item is hereby incorporated by reference to the material appearing in the Proxy Statement for the Company’s 2018 Annual Meeting of Stockholders to be filed within 120 days after December 31, 2017.
Item 13. Certain Relationships and Related Transactions, and Director Independence
Information required by this Item is hereby incorporated by reference to the material appearing in the Proxy Statement for the Company’s 2018 Annual Meeting of Stockholders to be filed within 120 days after December 31, 2017.
Item 14. Principal Accounting Fees and Services
Information required by this Item is hereby incorporated by reference to the material appearing in the Proxy Statement for the Company’s 2018 Annual Meeting of Stockholders to be filed within 120 days after December 31, 2017.
89
PART IV
Item 15. Exhibits and Financial Statement Schedules
(a)(1) and (2) Financial Statements and Schedules
Please refer to the Index to Consolidated Financial Statements included under Part II, Item 8. Financial Statements and Supplementary Data.
(a)(3) Exhibits
Bylaws (2) | ||
90
91
________________________
(1) | Incorporated by reference to the Company’s current report on Form 8-K filed on October 26, 2009 |
(2) | Incorporated by reference to the Company’s current report on Form 8-K filed on June 3, 2011 |
(3) | Incorporated by reference to the Company’s current report on Form 8-K filed on April 5, 2012 |
(4) | Incorporated by reference to the Company’s current report on Form 8-K filed on January 3, 2013 |
(5) | Incorporated by reference to the Company’s current report on Form 8-K filed on October 2, 2013 |
(6) | Incorporated by reference to the Company’s current report on Form 8-K filed on December 9, 2013 |
(7) | Incorporated by reference to the Company’s annual report on Form 10-K for the fiscal year ended December 31, 2013, filed on February 25, 2014 |
(8) | Incorporated by reference to the Company’s current report on Form 8-K filed on September 24, 2014 |
(9) | Incorporated by reference to the Company’s current report on Form 8-K filed on December 3, 2014 |
(10) | Incorporated by reference to the Company’s annual report on Form 10-K for the fiscal year ended December 31, 2014, filed on February 25, 2015 |
(11) | Incorporated by reference to the Company’s annual report on Form 10-K for the fiscal year ended December 31, 2015, filed on February 24, 2016 |
(12) | Incorporated by reference to the Company’s current report on Form 8-K filed on March 16, 2016 |
(13) | Incorporated by reference to the Company’s current report on Form 8-K filed on May 23, 2016 |
(14) | Incorporated by reference to the Company’s annual report on Form 10-Q for the fiscal quarter ended September 30, 2016 filed on October 26, 2016 |
(15) | Incorporated by reference to the Company’s current report on Form 8-K filed on March 24, 2017 |
(16) | Incorporated by reference to the Company’s annual report on Form 10-Q for the fiscal quarter ended March 31, 2017 filed on April 27, 2017 |
(17) | Incorporated by reference to the Company’s current report on Form 8-K filed on September 13, 2017 |
(18) | Incorporated by reference to the Company’s current report on Form 8-K filed on October 17, 2017 |
92
(19) | Incorporated by reference to the Company’s annual report on Form 10-Q for the fiscal quarter ended September 30, 2017 filed on October 25, 2017 |
(20) | Incorporated by reference to the Company’s current report on Form 8-K filed on November 13, 2017 |
* | Filed herewith |
+ | Unless otherwise noted, all exhibits have File No. 001-33479 |
Item 16. Form 10-K Summary
None.
93
SIGNATURES
Pursuant to the requirements of Section 13 or 15(d) of the Securities Exchange Act of 1934, as amended, the Registrant has duly caused this report to be signed on its behalf by the undersigned, thereunto duly authorized.
RETAIL OPPORTUNITY INVESTMENTS CORP. Registrant | |
Date: February 22, 2018 | By: /s/ Stuart A. Tanz |
Stuart A. Tanz | |
President and Chief Executive Officer | |
(Principal Executive Officer) | |
94
POWER OF ATTORNEY
KNOW ALL PERSONS BY THESE PRESENTS, that each person whose signature appears below constitutes and appoints Stuart A. Tanz and Michael B. Haines, and each of them, with full power to act without the other, such person’s true and lawful attorneys-in-fact and agents, with full power of substitution and resubstitution, for him or her and in his or her name, place and stead, in any and all capacities, to sign this Form 10-K and any and all amendments thereto, and to file the same, with exhibits and schedules thereto, and other documents in connection therewith, with the Securities and Exchange Commission, granting unto said attorneys-in-fact and agents, and each of them, full power and authority to do and perform each and every act and thing necessary or desirable to be done in and about the premises, as fully to all intents and purposes as he or she might or could do in person, hereby ratifying and confirming all that said attorneys-in-fact and agents, or any of them, or their or his or her substitute or substitutes, may lawfully do or cause to be done by virtue hereof.
Pursuant to the requirements of the Securities Exchange Act of 1934, as amended, this report has been signed below by the following persons on behalf of the Registrant and in the capacities and on the dates indicated.
Date: February 22, 2018 | /s/ Richard A. Baker |
Richard A. Baker | |
Non-Executive Chairman of the Board | |
Date: February 22, 2018 | /s/ Stuart A. Tanz |
Stuart A. Tanz | |
President, Chief Executive Officer and Director | |
(Principal Executive Officer) | |
Date: February 22, 2018 | /s/ Michael B. Haines |
Michael B. Haines | |
Chief Financial Officer | |
(Principal Financial Officer and Principal Accounting Officer) | |
Date: February 22, 2018 | /s/ Laurie A. Sneve |
Laurie A. Sneve | |
Chief Accounting Officer | |
Date: February 22, 2018 | /s/ Michael J. Indiveri |
Michael J. Indiveri | |
Director | |
Date: February 22, 2018 | /s/ Edward H. Meyer |
Edward H. Meyer | |
Director | |
Date: February 22, 2018 | /s/ Lee S. Neibart |
Lee S. Neibart | |
Director | |
95
Date: February 22, 2018 | /s/ Charles J. Persico |
Charles J. Persico | |
Director | |
Date: February 22, 2018 | /s/ Laura H. Pomerantz |
Laura H. Pomerantz | |
Director | |
Date: February 22, 2018 | /s/ Eric S. Zorn |
Eric S. Zorn | |
Director | |
96
SIGNATURES
Pursuant to the requirements of Section 13 or 15(d) of the Securities Exchange Act of 1934, as amended, the Registrant has duly caused this report to be signed on its behalf by the undersigned, thereunto duly authorized.
RETAIL OPPORTUNITY INVESTMENTS PARTNERSHIP, LP, by Retail Opportunity Investments GP, LLC, its sole general partner Registrant | |
Date: February 22, 2018 | By: /s/ Stuart A. Tanz |
Stuart A. Tanz | |
President and Chief Executive Officer | |
(Principal Executive Officer) | |
97
POWER OF ATTORNEY
KNOW ALL PERSONS BY THESE PRESENTS, that each person whose signature appears below constitutes and appoints Stuart A. Tanz and Michael B. Haines, and each of them, with full power to act without the other, such person’s true and lawful attorneys-in-fact and agents, with full power of substitution and resubstitution, for him or her and in his or her name, place and stead, in any and all capacities, to sign this Form 10-K and any and all amendments thereto, and to file the same, with exhibits and schedules thereto, and other documents in connection therewith, with the Securities and Exchange Commission, granting unto said attorneys-in-fact and agents, and each of them, full power and authority to do and perform each and every act and thing necessary or desirable to be done in and about the premises, as fully to all intents and purposes as he or she might or could do in person, hereby ratifying and confirming all that said attorneys-in-fact and agents, or any of them, or their or his or her substitute or substitutes, may lawfully do or cause to be done by virtue hereof.
Pursuant to the requirements of the Securities Exchange Act of 1934, as amended, this report has been signed below by the following persons on behalf of the Registrant and in the capacities and on the dates indicated.
Date: February 22, 2018 | /s/ Richard A. Baker |
Richard A. Baker | |
Non-Executive Chairman of the Board | |
Date: February 22, 2018 | /s/ Stuart A. Tanz |
Stuart A. Tanz | |
President, Chief Executive Officer and Director | |
(Principal Executive Officer) | |
Date: February 22, 2018 | /s/ Michael B. Haines |
Michael B. Haines | |
Chief Financial Officer | |
(Principal Financial Officer and Principal Accounting Officer) | |
Date: February 22, 2018 | /s/ Laurie A. Sneve |
Laurie A. Sneve | |
Chief Accounting Officer | |
Date: February 22, 2018 | /s/ Michael J. Indiveri |
Michael J. Indiveri | |
Director | |
Date: February 22, 2018 | /s/ Edward H. Meyer |
Edward H. Meyer | |
Director | |
Date: February 22, 2018 | /s/ Lee S. Neibart |
Lee S. Neibart | |
Director | |
98
Date: February 22, 2018 | /s/ Charles J. Persico |
Charles J. Persico | |
Director | |
Date: February 22, 2018 | /s/ Laura H. Pomerantz |
Laura H. Pomerantz | |
Director | |
Date: February 22, 2018 | /s/ Eric S. Zorn |
Eric S. Zorn | |
Director | |
99