Attached files
| file | filename |
|---|---|
| EX-23.3 - EX-23.3 - PENSKE AUTOMOTIVE GROUP, INC. | pag-20171231ex233bfd32e.htm |
| EX-32 - EX-32 - PENSKE AUTOMOTIVE GROUP, INC. | pag-20171231xex32.htm |
| EX-31.2 - EX-31.2 - PENSKE AUTOMOTIVE GROUP, INC. | pag-20171231ex312b05362.htm |
| EX-31.1 - EX-31.1 - PENSKE AUTOMOTIVE GROUP, INC. | pag-20171231ex311a4dfe9.htm |
| EX-23.2 - EX-23.2 - PENSKE AUTOMOTIVE GROUP, INC. | pag-20171231ex232b2e3a9.htm |
| EX-23.1 - EX-23.1 - PENSKE AUTOMOTIVE GROUP, INC. | pag-20171231ex23157dbf2.htm |
| EX-21 - EX-21 - PENSKE AUTOMOTIVE GROUP, INC. | pag-20171231ex219d508b9.htm |
| EX-12 - EX-12 - PENSKE AUTOMOTIVE GROUP, INC. | pag-20171231ex12b89aaec.htm |
| EX-10.18 - EX-10.18 - PENSKE AUTOMOTIVE GROUP, INC. | pag-20171231ex1018d5f4f.htm |
UNITED STATES
SECURITIES AND EXCHANGE COMMISSION
Washington, D.C. 20549
Form 10‑K
|
☒ |
ANNUAL REPORT PURSUANT TO SECTION 13 OR 15(d) OF THE SECURITIES EXCHANGE ACT OF 1934 |
|
For the fiscal year ended December 31, 2017 |
|
|
☐ |
TRANSITION REPORT PURSUANT TO SECTION 13 OR 15(d) OF THE SECURITIES EXCHANGE ACT OF 1934 |
|
For the transition period from to |
|
Commission file number 1‑12297
Penske Automotive Group, Inc.
(Exact name of registrant as specified in its charter)
|
Delaware |
22‑3086739 |
|
2555 Telegraph Road |
48302‑0954 |
(248) 648‑2500
(Registrant’s telephone number, including area code)
Securities registered pursuant to Section 12(b) of the Act:
|
Title of Each Class |
Name of Each Exchange on Which Registered |
|
Voting Common Stock, par value $0.0001 per share |
New York Stock Exchange |
Securities registered pursuant to Section 12(g) of the Act: None.
Indicate by check mark if the registrant is a well‑known seasoned issuer, as defined in Rule 405 of the Securities Act. Yes ☒ No ☐
Indicate by check mark if the registrant is not required to file reports pursuant to Section 13 or Section 15(d) of the Exchange Act. Yes ☐ No ☒
Indicate by check mark whether the registrant (1) has filed all reports required to be filed by Section 13 or 15(d) of the Securities Exchange Act of 1934 during the preceding 12 months (or for such shorter period that the registrant was required to file such reports), and (2) has been subject to such filing requirements for the past 90 days. Yes ☒ No ☐
Indicate by check mark whether the registrant has submitted electronically and posted on its corporate Web site, if any, every Interactive Data File required to be submitted and posted pursuant to Rule 405 of Regulation S‑T during the preceding 12 months (or for such shorter period that the registrant was required to submit and post such files). Yes ☒ No ☐
Indicate by check mark if disclosure of delinquent filers pursuant to Item 405 of Regulation S‑K is not contained herein, and will not be contained, to the best of the registrant’s knowledge, in definitive proxy or information statements incorporated by reference in Part III of this Form 10‑K or any amendment to this Form 10‑K. ☒
Indicate by check mark whether the registrant is a large accelerated filer, an accelerated filer, a non-accelerated filer, a smaller reporting company, or an emerging growth company. See the definitions of “large accelerated filer,” “accelerated filer,” “smaller reporting company,” and “emerging growth company” in Rule 12b-2 of the Exchange Act.
|
Large accelerated filer ☒ |
Accelerated filer ☐ |
Non‑accelerated filer ☐ |
Smaller reporting company ☐ |
|
|
|
|
Emerging growth company ☐ |
If an emerging growth company, indicate by check mark if the registrant has elected not to use the extended transition period for complying with any new or revised financial accounting standards provided pursuant to Section 13(a) of the Exchange Act. ☐
Indicate by check mark whether the registrant is a shell company (as defined in Rule 12b‑2 of the Exchange Act). Yes ☐ No ☒
The aggregate market value of the voting common stock held by non‑affiliates as of June 30, 2017 was $1,573,072,588. As of February 16, 2018, there were 85,787,007 shares of voting common stock outstanding.
Documents Incorporated by Reference
Certain portions, as expressly described in this report, of the registrant’s proxy statement for the 2018 Annual Meeting of the Stockholders to be held May 10, 2018 are incorporated by reference into Part III, Items 10‑14.
We are a diversified international transportation services company that operates automotive and commercial truck dealerships principally in the United States, Canada and Western Europe, and distributes commercial vehicles, diesel engines, gas engines, power systems and related parts and services principally in Australia and New Zealand. We employ more than 26,000 people worldwide.
In 2017, our business generated $21.4 billion in total revenue, which is comprised of approximately $19.8 billion from retail automotive dealerships, $1.0 billion from retail commercial truck dealerships and $0.5 billion from commercial vehicle distribution and other operations. We generated $3.2 billion in gross profit, which is comprised of $2.9 billion from retail automotive dealerships, $165.8 million from retail commercial truck dealerships and $131.9 million from commercial vehicle distribution and other operations.
Retail Automotive Dealership. We believe we are the second largest automotive retailer headquartered in the U.S. as measured by the $19.8 billion in total retail automotive dealership revenue we generated in 2017. As of December 31, 2017, we operated 343 retail automotive franchises, of which 155 franchises are located in the U.S. and 188 franchises are located outside of the U.S. The franchises outside the U.S. are located primarily in the U.K. In 2017, we retailed and wholesaled more than 618,900 vehicles. We are diversified geographically, with 59% of our total retail automotive dealership revenues in 2017 generated in the U.S. and Puerto Rico and 41% generated outside the U.S. We offer over 40 vehicle brands, with 70% of our retail automotive dealership revenue in 2017 generated from premium brands, such as Audi, BMW, Mercedes-Benz and Porsche. Each of our dealerships offers a wide selection of new and used vehicles for sale. In addition to selling new and used vehicles, we generate higher-margin revenue at each of our dealerships through maintenance and repair services and the sale and placement of third-party finance and insurance products, third-party extended service and maintenance contracts, and replacement and aftermarket automotive products.
In the first quarter of 2017, we acquired CarSense in the U.S. and CarShop in the U.K., both businesses representing stand-alone used vehicle dealerships, which we believe complement our existing franchised retail automotive dealership operations and provide scalable opportunities across our market areas. Our CarSense operations consist of five locations operating in the Philadelphia and Pittsburgh, Pennsylvania market areas, including southern New Jersey. Our CarShop operations consist of five retail locations and a vehicle preparation center operating principally throughout Southern England. In January 2018, we expanded our U.K. stand-alone used vehicle dealerships by acquiring The Car People, one of the U.K.’s leading retailers of used vehicles. The Car People has four retail locations operating across Northern England, which complements CarShop’s locations principally in Southern England.
Retail automotive dealerships represented 92.7% of our total revenues and 90.8% of our total gross profit in 2017.
1
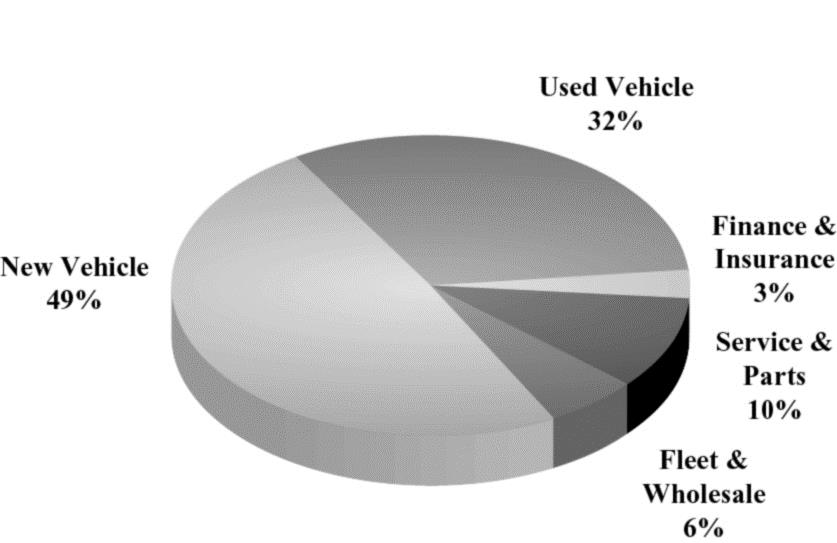
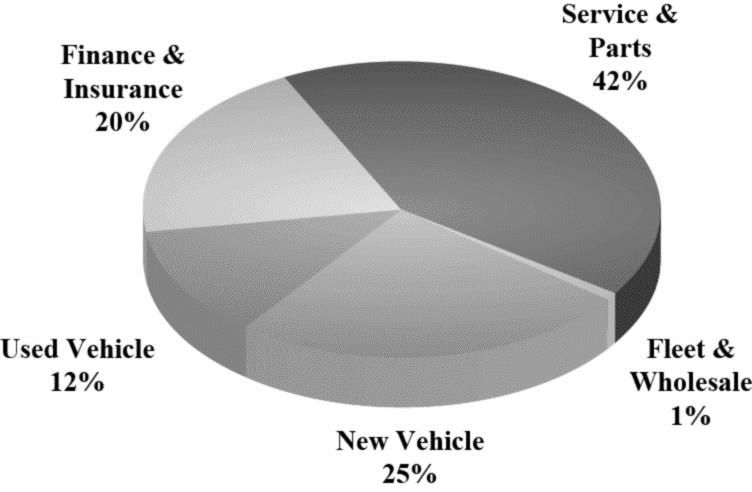
We believe our diversified retail automotive income streams help to mitigate the historical cyclicality found in some elements of the automotive sector. Revenues from higher margin service and parts sales include warranty work, customer paid work, collision repair services, and wholesale parts sales. Service and parts sales are typically less cyclical than retail vehicle sales and generate the largest part of our retail automotive gross profit. The following graphics show the percentage of our total retail automotive dealership revenues by product area and their respective contribution to our retail automotive gross profit:
|
Revenue Mix |
Gross Profit Mix |
|
|
|
Retail Commercial Truck Dealership. We operate a heavy and medium-duty truck dealership group known as Premier Truck Group (“PTG”) with locations in Texas, Oklahoma, Tennessee, Georgia, and Canada. As of December 31, 2017, PTG operated twenty locations, including fourteen full-service dealerships and six collision centers, offering primarily Freightliner and Western Star branded trucks. Four of these locations were acquired in April 2016 in the greater Toronto, Canada market area, and two of these locations were acquired in December 2016 in the Niagara Falls, Canada market area. PTG also offers a full range of used trucks available for sale as well as service and parts departments, providing a full range of maintenance and repair services.
This business represented 4.9% of our total revenues and 5.1% of our total gross profit in 2017.
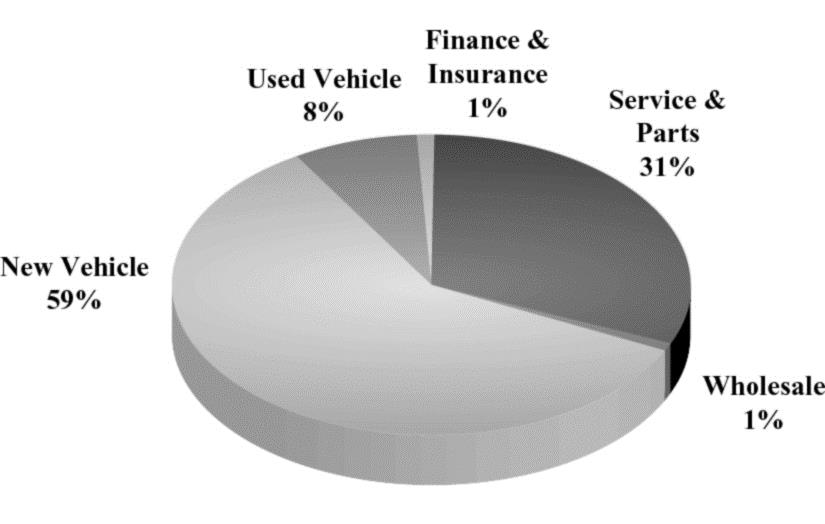
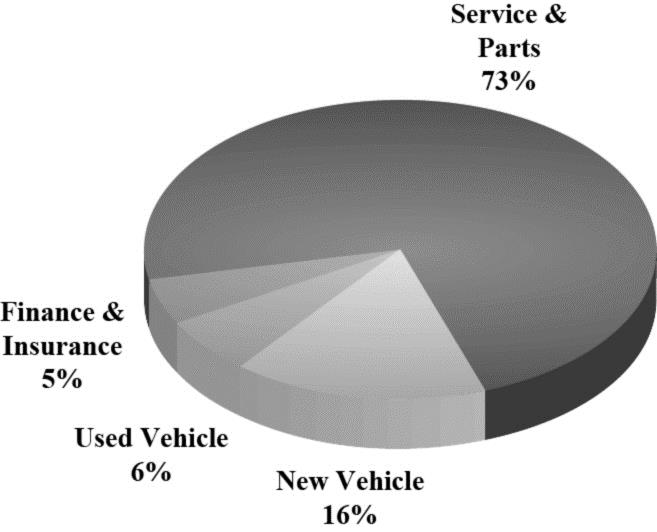
Our retail commercial truck business also benefits from diversified income streams similar to those of the retail automotive sector. The following graphics show the percentage of our total retail commercial truck dealership revenues by product area and their respective contribution to our retail commercial truck gross profit:
|
Revenue Mix |
Gross Profit Mix |
|
|
|
2
Commercial Vehicle Distribution. We are the exclusive importer and distributor of Western Star heavy-duty trucks (a Daimler brand), MAN heavy and medium-duty trucks and buses (a VW Group brand), and Dennis Eagle refuse collection vehicles, together with associated parts, across Australia, New Zealand and portions of the Pacific. This business, known as Penske Commercial Vehicles Australia (“PCV Australia”), distributes commercial vehicles and parts to a network of more than 70 dealership locations, including eight company-owned retail commercial vehicle dealerships.
We are also a leading distributor of diesel and gas engines and power systems, principally representing MTU, Detroit Diesel, Mercedes-Benz Industrial, Allison Transmission and MTU Onsite Energy. This business, known as Penske Power Systems (“PPS”), offers products across the on- and off-highway markets in Australia, New Zealand and portions of the Pacific and supports full parts and aftersales service through a network of branches, field locations and dealers across the region. The on-highway portion of this business complements our PCV Australia distribution business, including integrated operations at retail locations selling PCV brands.
These businesses represented 2.4% of our total revenues and 4.1% of our total gross profit in 2017.
Penske Truck Leasing. We currently hold a 28.9% ownership interest in Penske Truck Leasing Co., L.P. (“PTL”), a leading provider of transportation services and supply chain management. PTL is capable of meeting customers’ needs across the supply chain with a broad product offering that includes full-service truck leasing, truck rental and contract maintenance, along with logistic services such as dedicated contract carriage, distribution center management, transportation management and lead logistics provider. On July 27, 2016, we acquired an additional 14.4% ownership interest in PTL from subsidiaries of GE Capital Global Holdings, LLC (collectively, “GE Capital”) for approximately $498.5 million in cash to bring our ownership interest to 23.4%. Prior to this acquisition, we held a 9.0% ownership interest in PTL. On September 7, 2017, we acquired an additional 5.5% ownership interest from GE Capital for approximately $239.1 million in cash. At the same time, affiliates of Mitsui & Co., Ltd. (“Mitsui”), our second largest shareholder, acquired an additional 10.0% ownership interest in PTL at the same valuation. PTL is currently owned 41.1% by Penske Corporation, 28.9% by us, and 30.0% by Mitsui. GE Capital no longer owns any ownership interests in PTL. We account for our investment in PTL under the equity method, and we therefore record our share of PTL’s earnings on our statements of income under the caption “Equity in earnings of affiliates,” which also includes the results of our other equity method investments.
2017 & 2018 Key Developments
Retail Automotive Franchised Dealership Acquisitions and Dispositions. In 2017, we acquired or were granted open points (new franchises awarded from the automotive manufacturer) representing thirteen automotive franchises, which represented approximately $500.0 million in annualized revenue. Of the retail automotive franchises acquired, two are located in New Jersey and represent the Jaguar and Land Rover brands, two are located in Arizona and represent the Mercedes-Benz and Sprinter brands, two are located in the U.K. and represent the BMW and MINI brands, and two are located in Germany and represent the Audi and Volkswagen brands. In 2017, we disposed of twenty-five retail automotive franchises, which represented approximately $270.0 million in annualized revenue. Of the franchises disposed of, nine represented franchises in Puerto Rico, five represented smart franchises in the U.S. and five represented BMW, MINI, and Lexus franchises in the U.K.
Acquisition of Stand-Alone Used Vehicle Dealerships. In the first quarter of 2017, we acquired CarSense in the U.S. and CarShop in the U.K., both businesses representing stand-alone used vehicle dealerships, which we believe complement our existing franchised retail automotive dealership operations and provide scalable opportunities across our market areas. Our CarSense operations consist of five locations operating in the Philadelphia and Pittsburgh, Pennsylvania market areas, including southern New Jersey. Our CarShop operations consist of five retail locations and a vehicle preparation center operating principally throughout Southern England. These businesses generated approximately $710.0 million in revenue in 2017.
In January 2018, we acquired The Car People, which has four large-scale retail locations operating across Northern England. Prior to our acquisition, The Car People sold approximately 18,000 vehicles per year and is expected to represent approximately $300.0 million in annualized revenue, which would bring our total projected annualized revenues from our fourteen stand-alone used vehicle locations to approximately $1.0 billion.
3
Investment in PTL. In September 2017, we acquired an additional 5.5% ownership interest in PTL, a leading provider of transportation services and supply chain management, from GE Capital for approximately $239.1 million in cash. Prior to this acquisition, we held a 23.4% ownership interest in PTL. PTL is currently owned 41.1% by Penske Corporation, 28.9% by us, and 30.0% by Mitsui. GE Capital no longer owns any ownership interests in PTL. We account for our investment in PTL under the equity method.
Issuance of 3.75% Senior Subordinated Notes. In August 2017, we issued $300.0 million of 3.75% senior subordinated notes due 2020. We used the proceeds of the 3.75% notes to repay amounts outstanding under our U.S. credit agreement and floor plan credit agreements, leaving us with additional flexibility to continue our acquisition strategy.
Shareholder Dividends and Stock Repurchases. We increased our quarterly stock dividend each quarter in 2017. Our latest declared dividend is $0.34 per share payable March 1, 2018, which represents a dividend yield of 2.6% using our January 31, 2018 closing stock price. We repurchased 302,000 shares of our common stock in 2017 for $12.7 million, which, together with quarterly dividends, represents a return to shareholders of approximately $121.1 million.
Company and Dealership Awards. Twenty of our dealerships in the U.S. were named by Automotive News as among the 100 “Best Dealerships to Work For” in 2017. In addition, our U.K. dealerships, collectively known as the Sytner Group, were ranked in the U.K. by the London Sunday Times as the “Best Big Company to Work For” in 2017. We believe these awards reflect our ongoing commitment to our valuable dealership employees, which enhances customer satisfaction and may result in improved sales over time. Additionally, in January 2018, PAG was named one of the “World’s Most Admired Companies” by Fortune Magazine.
Outlook
Retail Automotive Dealership. In 2017, U.S. light vehicle sales declined 1.8%, as compared to last year, to 17.2 million units, with passenger car sales declining 11.2%, while sales of trucks, crossovers and sport utility vehicles increased 4.4%. We believe the sales of trucks, crossovers and sport utility vehicles will continue to outperform passenger car sales, largely due to consumer preference. We believe the U.S. market for new light vehicle sales has plateaued and will be impacted by the level of OEM incentives, increasing lease returns, generally low interest rates, strong credit availability, low levels of unemployment, the age of vehicles on the road, vehicle innovation, and tax reform, although actual sales may differ materially. We also expect to see strength across the used vehicle market into 2018, as the number of lease returns increases providing customers with an additional supply of affordable late model, low mileage vehicles from which to choose.
In 2017, U.K. new vehicle registrations declined 5.7%, as compared to last year, to 2.5 million registrations. The U.K. market is represented 44% by the private market and 56% by business/fleet. Private market registrations decreased 6.8%, while business/fleet registrations decreased 4.7%. Although new vehicle sales declined in 2017, sales of the premium brands we represent outperformed these figures. U.K. sales are being negatively affected by the uncertainty of residual values and future tax rates on diesel powered vehicles, as the U.K. and Western European countries consider the ramifications of diesel engines on the environment. Sales of diesel powered vehicles experienced a 17% decline in sales in 2017. The March 2019 planned exit from the European Union (“Brexit”) may be causing and may continue to cause economic and political uncertainty, potentially impacting the economic environment, which may lead to further declines in new vehicle registrations in future periods. Since no country has previously left the European Union, the outcome of any future negotiations between the U.K. and the European Union is uncertain and may affect the timing, terms of trade, and the level of new vehicle registrations in those markets.
Retail Commercial Truck Dealership. In 2017, North American sales of Class 5-8 heavy and medium-duty trucks, the principal vehicles for our PTG business, were 499,932 units, an increase of 3.3% from 2016. The Class 5-7 medium-duty truck market increased 6.0% to 248,138 units from 234,163 units in 2016. The largest North American market, Class 8 heavy-duty trucks, increased 0.7% to 251,794 units from 249,952 units in 2016. According to ACT Research (“ACT”), retail sales of Class 8 heavy-duty trucks were generally expected to decline in 2017; however, generally strong economic conditions, the stabilization in the values of used trucks, improved freight metrics, and increased utilization pushed the
4
market to a stronger than expected performance in 2017. These conditions are expected to continue in 2018 with the market expected to increase with stronger Class 8 retail unit sales in North America.
Commercial Vehicle Distribution. Our PCV Australia distribution business and the on-highway portion of our PPS business each operate principally in the Australian and New Zealand heavy and medium-duty truck markets. In 2017, the Australian heavy-duty truck market reported sales of 12,002 units, representing an increase of 21.5% from 2016. The New Zealand market reported sales of 3,294 units in 2017, representing an increase of 23.0% from 2016. The brands we represent in Australia hold an 8.3% market share in the Australian heavy-duty truck market, and a 5.3% market share in New Zealand. The Australian heavy-duty commercial vehicle market had lagged behind historical sales levels in recent years partly due to difficult macroeconomic conditions and the relative weak price of commodities in these markets. However, recent improvements in the heavy-duty truck market and overall market conditions, as well as a moderate strengthening of the Australian Dollar, have led to increasing industry sales which we expect to continue into 2018. We also expect continued new order growth from the off-highway engine distribution business as a result of improving market conditions.
Penske Truck Leasing. We expect PTL to benefit from continued strong demand for its full-service truck leasing, truck rental and contract maintenance, and logistics services resulting from continued positive economic conditions in the United States and customers’ desire to increase efficiency and lower costs by outsourcing non-core responsibilities such as fleet ownership. As a global logistics services provider, we also expect PTL to experience increased demand for its logistics supply chain solutions based primarily on optimizing the use of drivers, trucks, warehouses, and other services within the supply chain. As a result of recent improvements in the truck market, in 2017 we saw modest freight growth and improved conditions within PTL’s commercial truck rental business, an increase in the utilization rate of its fleet, and stabilization of used truck prices. We anticipate that these improvements will continue into 2018.
As discussed in “Item 1A. Risk Factors,” there are a number of factors that could cause actual results to differ materially from our expectations. For a detailed discussion of our financial and operating results, see “Item 7. Management’s Discussion and Analysis of Financial Condition and Results of Operations.”
Long-Term Business Strategy
Our long-term business strategy focuses on several key areas in an effort to foster long-term relationships with our customers and our associates. The key areas of our long-term strategy follow:
|
· Attract, develop, and empower associates to grow our business; |
|
· Diversification; |
|
· Offer outstanding brands in premium facilities and superior customer service; |
|
· Expand revenues at existing locations and increase higher-margin businesses; |
|
· Grow through strategic acquisitions; |
|
· Enhance customer satisfaction; |
|
· Leverage scale and implement “best practices”; and |
|
· Embrace digital marketing. |
Attract, Develop, and Empower Associates to Grow our Business
We view our local managers and associates as one of our most important assets. We operate in a decentralized manner that fosters an entrepreneurial spirit where each dealership or business unit has independent operational and financial management responsible for day-to-day operations. We believe experienced local managers are better qualified to make day-to-day decisions concerning the successful operation of a business unit and can be more responsive to our customers’ needs. We seek local management that not only has relevant industry experience, but is also familiar with the local market. We also have regional management that oversees operations and supports the local unit operationally and administratively. We invest for future growth and offer outstanding brands and facilities which we believe attract outstanding talent. We believe attracting the best talent and allowing our associates to make business decisions at the local level helps to foster long-term growth through increased repeat and referral business.
5
Diversification
Our business benefits from our diversified revenue mix, including the multiple revenue streams in a traditional dealership (new vehicles, used vehicles, finance and insurance, and service and parts operations), revenues from our retail commercial truck dealership operations, our commercial vehicle distribution operations, and returns relating to our joint venture investments, which we believe helps to mitigate the cyclicality that has historically impacted some elements of the automotive sector. We are further diversified within our retail automotive operations due to revenues generated from franchised dealerships and stand-alone used vehicle dealerships, due to our brand mix where we represent more than 40 brands, and geographically where we operate across more than 15 states and internationally. One of the unique attributes of our operations versus our peers is our diversification outside the U.S., with operations across nine countries.
The following table shows our consolidated revenues by country, and by state in the U.S., as a percentage of our total revenue:
|
Country |
|
% of Total 2017 Revenue |
|||
|
United States |
|
|
|
58 |
% |
|
United States Revenue by State |
|
|
|
|
|
|
Arizona |
|
6 |
% |
|
|
|
Arkansas |
|
2 |
% |
|
|
|
California |
|
11 |
% |
|
|
|
Connecticut |
|
3 |
% |
|
|
|
Florida |
|
3 |
% |
|
|
|
Georgia |
|
4 |
% |
|
|
|
Indiana |
|
1 |
% |
|
|
|
Maryland |
|
1 |
% |
|
|
|
Minnesota |
|
1 |
% |
|
|
|
New Jersey |
|
8 |
% |
|
|
|
New York |
|
1 |
% |
|
|
|
Ohio |
|
2 |
% |
|
|
|
Oklahoma |
|
1 |
% |
|
|
|
Pennsylvania |
|
1 |
% |
|
|
|
Puerto Rico |
|
1 |
% |
|
|
|
Rhode Island |
|
2 |
% |
|
|
|
Tennessee |
|
1 |
% |
|
|
|
Texas |
|
6 |
% |
|
|
|
Virginia |
|
2 |
% |
|
|
|
Wisconsin |
|
1 |
% |
|
|
|
United Kingdom |
|
|
|
33 |
% |
|
Germany/Italy |
|
|
|
6 |
% |
|
Canada |
|
|
|
1 |
% |
|
Australia/New Zealand/Pacific |
|
|
|
2 |
% |
The U.K. is the second largest automotive retail market in Western Europe as measured by new units sold. We generated 88% of our revenue in the U.K. through the sale and service of premium brands in 2017. We believe we are among the largest Audi, Bentley, BMW, Ferrari, Jaguar, Land Rover, Maserati, Mercedes-Benz, MINI, and Porsche dealers in the U.K. based on new unit sales. Additionally, we operate a number of dealerships in Germany, Western Europe’s largest automotive retail market, including through joint ventures with experienced local partners, which sell and service Audi, Lexus, Porsche, Toyota, Volkswagen and other brands. We also operate BMW, MINI, Maserati, Porsche, Audi, Land Rover and Volvo dealerships in Northern Italy, as well as BMW and MINI dealerships in Spain, through joint ventures with local partners. Our non-consolidated joint venture in Japan operates BMW, MINI, Rolls-Royce, Ferrari, and ALPINA dealerships.
Diversification Through Stand-Alone Used Vehicle Dealerships. Our acquisitions of CarSense in the U.S. and CarShop and The Car People in the U.K., each representing stand-alone used vehicle dealerships, complement and
6
provide more diversification to our retail automotive operations and provide scalable opportunities across our market areas.
Diversification Through Retail Commercial Truck Dealership. Our PTG business provides more diversification to our overall business model and allows us to bring our automotive dealership expertise to the retail commercial truck market. Recently acquired operations in Canada, in addition to our U.S. locations, further diversifies our revenue stream.
Diversification Through Penske Truck Leasing. We currently hold a 28.9% ownership interest in PTL, a leading provider of transportation services and supply chain management, which further diversifies our total results of operations. In September 2017, we increased our ownership interest in PTL from 23.4% to 28.9% as a result of our acquisition of an additional 5.5% ownership interest, as discussed previously, which further diversifies our earnings potential. We also expect to realize significant cash tax savings as a result of our investment in PTL in addition to the diversification offered by earnings from PTL.
Offer Outstanding Brands in Premium Facilities and Superior Customer Service
We offer outstanding brands in premium facilities and believe offering our customers a superior customer service experience will generate repeat and referral business and will help to foster a loyal and dedicated customer base. Customer satisfaction is measured at each of our automotive dealerships on a monthly, quarterly, and/or yearly basis by the manufacturers we represent, and we compensate our employees, in part, based on their performance in such rankings.
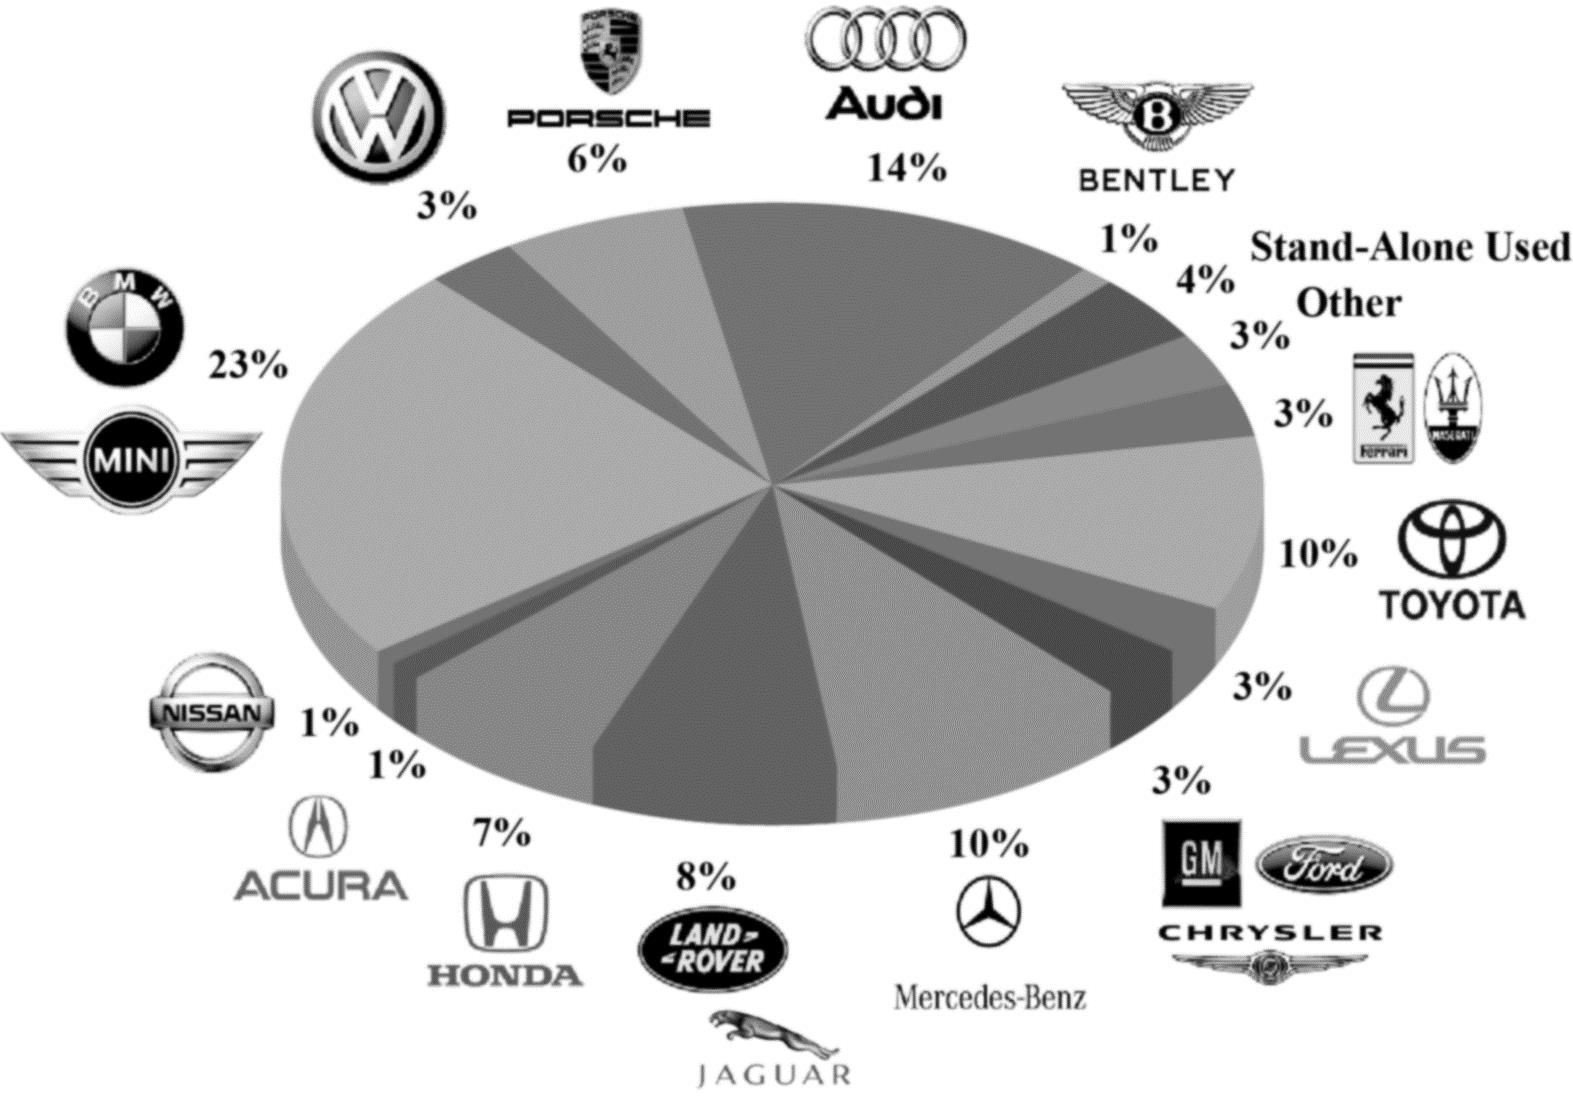
We sell over 40 brands in our markets and our automotive dealership revenue mix consists of 70% related to premium brands, 23% related to volume non-U.S. brands, 3% related to brands of U.S. based manufacturers, and 4% related to our stand-alone used vehicle dealerships. We believe our largely premium and non-U.S. brand mix will continue to offer us the opportunity to generate same-store growth, including higher margin service and parts sales. The following chart reflects our percentage of total retail automotive dealership revenue by brand:
We sell and service outstanding automotive brands in our premium facilities, in attractive geographic markets. Where advantageous, we aggregate our automotive dealerships in a campus setting in order to build a destination location for our customers, which we believe helps to drive increased customer traffic to each of the brands at the location. This strategy also creates an opportunity to reduce personnel expenses, consolidate advertising and administrative expenses and leverage operating expenses over a larger base of dealerships.
7
Our PTG dealerships provide a similar suite of services as our automotive dealerships, and similar to our retail automotive business, our retail commercial truck business is committed to providing outstanding brands and superior customer service in premium facilities. The necessity of repairing trucks for our customers is a key area of differentiation for our commercial truck dealerships, and we provide around-the-clock service in certain locations to get our customers’ commercial trucks back on the road so they can complete their routes.
Expand Revenues at Existing Locations and Increase Higher-Margin Businesses
Increase Same-Store Sales. We believe our emphasis on superior customer service and premium facilities will contribute to increases in same-store sales over time. We have added a significant number of incremental service bays in recent years in order to better accommodate our customers and further enhance our higher-margin service and parts revenues.
Grow Finance, Insurance, and Other Aftermarket Revenues. Each sale of a vehicle provides us the opportunity to assist in arranging financing for the sale of a vehicle, to sell the customer an extended service contract or other insurance product, and to sell aftermarket products, such as security systems and protective coatings. Where possible, we attempt to vertically integrate with the captive finance companies of the manufacturers we represent and to supplement these offerings with preferred lenders as necessary. In order to improve our finance and insurance business, we focus on enhancing training programs and implementing process improvements which we believe will improve our overall revenues.
Expand Service and Parts and Collision Repair Revenues. Today’s vehicles are increasingly complex and require sophisticated equipment and specially trained technicians to perform certain services. Additionally, many manufacturers today are offering maintenance programs packaged with the vehicle sale. These programs require customers to have the service work performed at a factory-authorized dealership. Unlike independent service shops, our dealerships are authorized to perform this work under warranties provided by manufacturers. Additionally, we offer maintenance programs for sale through our dealerships. We believe that our brand mix and the complexity of today’s vehicles, combined with our investment in expanded service facilities, including the addition of a significant number of incremental service bays in recent years, and our focus on customer service, will contribute to increases in our service and parts revenue. We also operate 38 automotive collision repair centers and six commercial truck collision centers which are integrated with local dealership operations. We offer rapid repair services such as paint-less dent repair, headlight reconditioning, wheel repairs, tire sales, seat sales for our retail commercial truck operations, and windshield replacement at most of our facilities in order to offer our customers the convenience of one-stop shopping for all of their vehicle requirements.
Grow Through Strategic Acquisitions
We believe that attractive retail automotive acquisition opportunities exist for well-capitalized dealership groups with experience in identifying, acquiring and integrating dealerships. The fragmented automotive retail market provides us with significant growth opportunities in our markets. We generally seek to acquire dealerships with high-growth automotive brands in highly concentrated or growing demographic areas that will benefit from our management expertise, manufacturer relations and scale of operations, as well as smaller, single location dealerships that can be effectively integrated into our existing operations. Over time, we have also been awarded new franchises from various manufacturers. In 2017, we acquired or were granted open points representing thirteen franchises, which generated approximately $500.0 million in annualized revenue.
In 2017, we acquired CarSense in the U.S. and CarShop in the U.K., both businesses representing stand-alone used vehicle dealerships, which we believe complement our retail automotive dealership operations and provide scalable opportunities across our market areas. These businesses generated approximately $710.0 million in revenue in 2017. We believe there are attractive acquisition opportunities to grow these operations in both the U.S. and the U.K., and in January 2018, we acquired The Car People in the U.K., as discussed previously, which is expected to represent approximately $300.0 million in annualized revenue.
8
We believe there are attractive retail commercial truck acquisition opportunities. We see continued growth in the brands we represent at our existing retail commercial truck dealerships and believe there are opportunities for us to continue to make strategic acquisitions over time.
Enhance Customer Satisfaction
We strive for superior customer satisfaction. By offering outstanding brands in premium facilities, “one-stop” shopping convenience in our aggregated facilities, and a well-trained and knowledgeable sales staff, we aim to forge lasting relationships with our customers, enhance our reputation in the community, and create the opportunity for significant repeat and referral business. We monitor customer satisfaction data to track the performance of operations, and incent our personnel to provide exceptional customer service, thereby driving increased customer loyalty and enhancing our reputation.
Reputation management is an extremely important and powerful business tool. Our reputation management strategy, which includes encouraging, monitoring, and responding to customer reviews, is crucial for generating and maintaining trust and customer loyalty in a competitive market. We proactively monitor online reputation management sites, including Google and Yelp, among others, to enhance our online presence, build loyalty, assess customer comments, ensure we are offering a superior customer service experience, and ultimately drive sales and profitability. We encourage customer reviews and have automated tools in place that make it easy for customers to review our business. Analysis of online reviews provides us valuable operational insights that we leverage to foster customer loyalty, stay ahead of the competition, and drive new sales.
Leverage Scale and Implement “Best Practices”
We seek to build scale in many of the markets where we have operations. Our desire is to reduce or eliminate redundant administrative costs such as accounting, payroll, information technology systems and other general administrative costs. In addition, we seek to leverage our industry knowledge and experience to foster communication and cooperation between like brand dealerships throughout our organization. Corporate management and local management meet regularly to review operating performance, examine industry trends, and implement operating improvements. Key financial information is discussed and compared across all markets. This frequent interaction facilitates implementation of successful strategies throughout the organization.
Embrace Digital Marketing
With consumers becoming increasingly immersed in the digital space, we have adopted a comprehensive digital marketing strategy that encompasses all avenues of customer engagement including websites, social media, video, mobile, email marketing, online advertising, search engine optimization, branding, and content. We strive to build and optimize our presence across all digital platforms to deliver a seamless and transparent experience for our customers.
To attract customers and enhance our customer service, each of our dealerships uses a custom content management system (CMS) to maintain its own website. All of our dealership websites have consistent functionality and responsive formats, except where otherwise required by original equipment manufacturers, which helps to minimize costs and provide a consistent image across dealerships.
To drive high quality traffic to our web properties, we primarily focus on search engine optimization and search engine marketing, and employ some third-party lead providers in key markets to augment our traffic. Most importantly, we have invested heavily in our own websites so we can retain traffic and deliver a quality experience. We operate with a “mobile first” mentality and have ensured that the content we serve our customers is tailored to their method of engagement with us, the device they are using, and their specific requests, where applicable. We believe the majority of our web traffic comes from mobile devices, making this approach important as a key driver of our success.
We promote our U.S. and U.K. automotive retail new and pre-owned vehicle inventory online through PenskeCars.com and Sytner.co.uk, respectively. The websites are designed to streamline the car-buying process and allow consumers to view and compare on average over 50,000 new, certified and pre-owned vehicles. These sites, together with our dealership websites, provide consumers a simple way to schedule service appointments online 24/7 and
9
view extensive vehicle information, including photos, prices, promotions, videos, and third-party vehicle history reports for pre-owned vehicles. Additionally, customers may download a PenskeCars.com app to access vehicle inventory, locate or contact a dealership, explore payments, and get instant trade offers at their convenience.
To help us continue to develop the online experience, we research consumer behavior and survey our customers to validate our approach and help guide our site design. Customers, now more than ever, are interested in a transparent and quick process, and use the web as a way to educate themselves about their potential purchase and save time during the purchase process. To further our digital strategy, and respond to changing consumer preferences, we created a digital retailing experience, called Preferred Purchase, for our U.S. dealerships that incorporates new online functionality to streamline the sales process in our traditional business model. Preferred Purchase allows customers to value trade-in vehicles, review pricing, leasing and financing options, manufacturer incentive programs, and pre-qualify for credit, all online without visiting the dealership. This functionality is integrated and automated on a single platform that resides on both our individual dealership sites as well as our corporate sites. Preferred Purchase promotes transparency and is intended to speed up customer transaction times and give our customers the flexibility to choose the path or sales process most comfortable to them. We continue to assess consumers’ purchasing habits, opinions, and preferences to ensure we are meeting consumer needs and making the right investments in new technology.
Social media is an optimal platform to proactively communicate with our customers and receive input on our service, branding, and online engagement. Our dealerships maintain social media pages, including Facebook, Instagram and Twitter, among others, to attract new customers, build stronger relationships with current customers, and help grow the business. Using a social media mobile app, our dealerships can easily capture customer photos, send review invitations, record videos, and submit content for their social media sites. Social media is an ever-increasing and critical part of our digital strategy, and one of the most powerful and cost-effective ways to engage with our customers, enhance brand visibility, and generate customer leads. By choosing a specific audience using a range of demographic tools, our dealerships are able to reach targeted potential customers effectively and efficiently.
10
Retail Automotive Dealership Operations
Retail Automotive Franchises. We routinely acquire and dispose of retail automotive franchises. Our financial statements include the results of operations of acquired dealerships from the date of acquisition. We expect to continue to pursue acquisitions and selected dispositions in the future. The following table exhibits our retail automotive franchises by location and manufacturer as of December 31, 2017:
|
Location |
|
Franchises |
|
Franchises |
|
U.S. |
|
Non-U.S. |
|
Total |
|
Arizona |
|
26 |
|
BMW/MINI |
|
22 |
|
44 |
|
66 |
|
Arkansas |
|
11 |
|
Toyota/Lexus |
|
24 |
|
1 |
|
25 |
|
California |
|
29 |
|
Mercedes-Benz/Sprinter/smart |
|
17 |
|
25 |
|
42 |
|
Connecticut |
|
9 |
|
Audi/Volkswagen/Bentley |
|
18 |
|
51 |
|
69 |
|
Florida |
|
6 |
|
Chrysler/Jeep/Dodge/Fiat/Alfa Romeo |
|
8 |
|
— |
|
8 |
|
Georgia |
|
4 |
|
Honda/Acura |
|
21 |
|
— |
|
21 |
|
Indiana |
|
2 |
|
Ferrari/Maserati |
|
4 |
|
12 |
|
16 |
|
Maryland |
|
2 |
|
Porsche |
|
8 |
|
11 |
|
19 |
|
Minnesota |
|
2 |
|
Jaguar/Land Rover |
|
12 |
|
20 |
|
32 |
|
New Jersey |
|
26 |
|
Lamborghini |
|
1 |
|
4 |
|
5 |
|
Ohio |
|
7 |
|
Nissan/Infiniti |
|
4 |
|
— |
|
4 |
|
Puerto Rico |
|
4 |
|
Cadillac/Chevrolet |
|
5 |
|
— |
|
5 |
|
Rhode Island |
|
9 |
|
Others |
|
11 |
|
20 |
|
31 |
|
Tennessee |
|
1 |
|
Total |
|
155 |
|
188 |
|
343 |
|
Texas |
|
9 |
|
|
|
|
|
|
|
|
|
Virginia |
|
6 |
|
|
|
|
|
|
|
|
|
Wisconsin |
|
2 |
|
|
|
|
|
|
|
|
|
Total U.S. |
|
155 |
|
|
|
|
|
|
|
|
|
U.K. |
|
143 |
|
|
|
|
|
|
|
|
|
Germany |
|
29 |
|
|
|
|
|
|
|
|
|
Italy |
|
16 |
|
|
|
|
|
|
|
|
|
Total Non-U.S. |
|
188 |
|
|
|
|
|
|
|
|
|
Total Worldwide |
|
343 |
|
|
|
|
|
|
|
|
|
|
|
|
|
|
|
|
|
|
|
|
Retail Automotive Stand-Alone Used Vehicle Dealerships. The following table exhibits the stand-alone used vehicle dealerships we currently operate by geographic location:
|
Location |
|
Number of Dealerships |
|
U.S. |
|
|
|
Pennsylvania |
|
4 |
|
New Jersey |
|
1 |
|
Total U.S. |
|
5 |
|
U.K. |
|
|
|
CarShop |
|
5 |
|
The Car People (1) |
|
4 |
|
Total U.K. |
|
9 |
|
Total |
|
14 |
|
|
|
|
|
(1) Acquired in January 2018 |
||
New Vehicle Retail Sales. In 2017, we retailed 248,774 new vehicles which generated 48.8% of our retail automotive dealership revenue and 25.5% of our retail automotive dealership gross profit. New vehicles are typically acquired by dealerships directly from the manufacturer. We strive to maintain outstanding relationships with the automotive manufacturers, based in part on our long-term presence in the retail automotive market, our commitment to providing premium facilities, our commitment to drive customer satisfaction, the reputation of our management team and the
11
consistent sales volume at our dealerships. Our dealerships finance the purchase of most new vehicles from the manufacturers through floor plan financing provided primarily by various manufacturers’ captive finance companies.
Used Vehicle Retail Sales. In 2017, we retailed 252,922 used vehicles, which generated 32.2% of our retail automotive dealership revenue and 12.2% of our retail automotive dealership gross profit. We acquire used vehicles from various sources including auctions open only to authorized new vehicle dealers, public auctions, trade-ins from consumers in connection with their purchase of a new vehicle from us, and lease expirations or terminations. To improve customer confidence in our used vehicle inventory, we provide vehicle history reports for all used vehicles and virtually all of our franchised new vehicle dealerships participate in manufacturer certification processes for used vehicles. If certification is obtained, the used vehicle owner is typically provided benefits and warranties similar to those offered to new vehicle owners by the applicable manufacturer. Most of our dealerships have implemented software tools which assist in procuring and selling used vehicles. In the U.K., we offer used vehicles to wholesalers and other dealers via online auction.
We currently operate fourteen stand-alone used vehicle dealerships in the U.S. and U.K. While we operate these dealerships under separate names (CarSense, CarShop and The Car People), each of these dealerships are committed to offering high quality “like-new” used vehicles at “no-haggle” prices. These businesses typically sell low mileage, high quality vehicles in a friendly and transparent buying experience. We acquired these businesses in 2017 and 2018, but each has a long history of serving their local communities. We include the results of our stand-alone used vehicle dealerships within used vehicle retail sales.
Vehicle Finance, Extended Service and Insurance Sales. Finance, extended service and insurance sales represented 2.9% of our retail automotive dealership revenue and 19.9% of our retail automotive dealership gross profit in 2017. At our customers’ option, our dealerships can arrange third-party financing or leasing in connection with vehicle purchases. We typically receive a portion of the cost of the financing or leasing paid by the customer for each transaction as a fee. While these services are generally non-recourse to us, we are subject to chargebacks in certain circumstances, such as default under a financing arrangement or prepayment. These chargebacks vary by finance product, but typically are limited to the fee we receive.
We also offer our customers various vehicle warranty and extended protection products, including extended service contracts, maintenance programs, guaranteed auto protection (known as “GAP,” this protection covers the shortfall between a customer’s loan balance and insurance payoff in the event of a total loss), lease “wear and tear” insurance and theft protection products. The extended service contracts and other products that our dealerships currently offer to customers are underwritten by independent third parties, including the vehicle manufacturers’ captive finance companies. Similar to finance transactions, we are subject to chargebacks relating to fees earned in connection with the sale of certain extended protection products. We also offer for sale other aftermarket products, including security systems and protective coatings.
We offer finance and insurance products using a “menu” process, which is designed to ensure that we offer our customers a complete range of finance, insurance, protection, and other aftermarket products in a transparent manner. We provide training to our finance and insurance personnel to help ensure compliance with internal policies and procedures, as well as applicable state regulations.
Service and Parts Sales. Service and parts sales represented 10.4% of our retail automotive dealership revenue and 41.7% of our retail automotive dealership gross profit in 2017. We generate service and parts sales in connection with warranty and non-warranty work performed at each of our dealerships. We believe our service and parts revenues benefit from the increasingly complex technology used in vehicles that makes it difficult for independent repair facilities to maintain and repair today’s automobiles.
A goal of each of our dealerships is to make each vehicle purchaser a customer of our service and parts department. Our dealerships keep detailed records of our customers’ maintenance and service histories, and many dealerships send reminders to customers when vehicles are due for periodic maintenance or service. Many of our dealerships have extended evening and weekend service hours for the convenience of our customers. We also offer rapid repair services such as paint-less dent repair, headlight reconditioning, wheel repairs, tire sales and windshield replacement at most of our facilities in order to offer our customers the convenience of one-stop shopping for all of their automotive
12
requirements. We also operate 38 automotive collision repair centers, each of which is operated as an integral part of our dealership operations.
Fleet and Wholesale Sales. Fleet and wholesale sales represented 5.7% of our retail automotive dealership revenue and 0.7% of our retail automotive dealership gross profit in 2017. Fleet activities represent the sale of new units to customers that are deemed to not be retail customers such as cities, municipalities or rental car companies, and are generally sold at contracted amounts. Wholesale activities relate to the sale of used vehicles generally to other dealers and occur at auction. Vehicles sold through this channel generally include units acquired by trade-in that do not meet certain standards or aged units.
Retail Commercial Truck Dealership Operations
We operate a heavy and medium-duty truck dealership group known as Premier Truck Group (“PTG”) with locations in Texas, Oklahoma, Tennessee, Georgia, and Canada. As of December 31, 2017, PTG operated twenty locations, including fourteen full-service dealerships and six collision centers, offering primarily Freightliner and Western Star branded trucks. PTG also offers a full range of used trucks available for sale as well as service and parts departments, providing a full range of maintenance and repair services. This business generated $1,048.0 million of revenue in 2017.
PTG dealerships provide a similar suite of services as our automotive dealerships, offering new trucks and a large selection of used trucks for sale, a full range of parts, maintenance and repair services, and finance and insurance options for its customers by facilitating truck and trailer financing and leasing, extended maintenance plans, physical damage insurance, GAP insurance, roadside relief and other programs.
The necessity of repairing trucks for our customers is a key area of differentiation for our commercial truck dealerships, and we provide around-the-clock service in certain locations to get our customers’ commercial trucks back on the road so they can complete their routes. PTG also carries an extensive inventory of parts for the new and used trucks they sell and service, including Thomas Built Buses, and other makes of medium and heavy-duty trucks. The service and parts business of our PTG commercial truck dealerships represents approximately 73% of our retail commercial truck dealership gross profit.
Similar to our retail automotive business, PTG is committed to providing outstanding brands and superior customer service in premium facilities. For example, our Dallas Freightliner location offers a state-of-the-art facility of climate controlled office space, service shops, customer amenities, parts inventory storage, and a parts showroom. This facility is equipped with 80 full-service truck bays with a full suite of on-hand parts inventory. Guests of Dallas Freightliner enjoy a television lounge with HDTV theater seating, a large comfortable customer lounge with lockers, laundry and shower facilities, on-site trailer parking, and free recreational vehicle electrical hook-up.
Commercial Vehicle Distribution Operations
Penske Commercial Vehicles Australia. We are the exclusive importer and distributor of Western Star heavy-duty trucks (a Daimler brand), MAN heavy and medium-duty trucks and buses (a VW Group brand), and Dennis Eagle refuse collection vehicles, together with associated parts, across Australia, New Zealand and portions of the Pacific. This business, known as Penske Commercial Vehicles Australia (“PCV Australia”), distributes commercial vehicles and parts to a network of more than 70 dealership locations, including eight company-owned retail commercial vehicle dealerships. This business generated $250.3 million of revenue in 2017.
Our local headquarters is located in Brisbane, Australia, which is the country’s third largest city. Our headquarters includes administrative facilities as well as a parts distribution center and a production center. We also have a parts distribution center in Auckland, New Zealand.
Western Star trucks are manufactured by Daimler Trucks North America in Portland, Oregon. These technologically advanced, custom-built vehicles are ordered by customers to meet their particular needs for line haul, long distance road train, mining, logging and other heavy-duty applications. We are also the exclusive importer of MAN trucks and buses. MAN Truck and Bus, a VW Group company, is a leading producer of medium and heavy-duty trucks as well as city and coach buses. These cab-forward, fuel efficient vehicles are principally produced in several sites in Germany and are
13
ordered by customers for line haul, local distribution, mining and other off-road applications. Dennis Eagle refuse collection vehicles are manufactured by Ros Roca in Warwick, England. Together these brands represented 8.3% of heavy-duty truck units sold in Australia and 5.3% in New Zealand during 2017.
Our commercial vehicle distribution operations include six company-owned retail commercial vehicle dealerships in Australia and two company-owned retail commercial vehicle dealerships in New Zealand. Our dealership in Brisbane, Australia is the largest retailer of Western Star Trucks in Australia by volume. We finance our purchases of these vehicles under floor plan agreements with a local Daimler affiliate and a local Volkswagen affiliate with terms similar to our other floor plan agreements.
Penske Power Systems. We are also a leading distributor of diesel and gas engines and power systems, principally representing MTU, Detroit Diesel, Mercedes-Benz Industrial, Allison Transmission and MTU Onsite Energy. This business, known as Penske Power Systems (“PPS”), offers products across the on- and off-highway markets in Australia, New Zealand and portions of the Pacific, including trucking, mining, power generation, construction, industrial, rail, marine, agriculture, oil & gas, and defense, and supports full parts and aftersales service through a network of branches, remote field service locations, and dealers across the region. This business generated $260.7 million of revenue in 2017.
Penske Power Systems’ principal headquarters is located at its Melbourne workshop/office facility. In addition to sales, distribution and full product repair capability, this facility includes the offices for national sales, engineering and marketing, a regional training facility, and a regional engineering center. In addition, PPS operates a corporate office based at its Sydney (Chipping Norton) branch which is dedicated to corporate activities, distribution and product repair capability, and retail truck sales. PPS operates 14 branch facilities across Australia and in Auckland, New Zealand, and utilizes mobile remote field service units travelling directly to customer premises.
Penske Power Systems’ 79 dealers are strategically located throughout Australia, New Zealand and the Pacific. Most of the dealers (67) represent the Detroit Diesel brand, with the majority aligned to Western Star and/or Freightliner truck manufacturers. The remaining dealers represent the MTU (1) and Allison Transmission (11) brands. The “off-highway” business of PPS principally includes the sale of power systems by PPS directly to customers in the commercial, defense and maritime sectors, and to several dealers.
Penske Truck Leasing
We currently hold a 28.9% ownership interest in PTL, a leading provider of transportation services and supply chain management. PTL is capable of meeting customers’ needs across the supply chain with a broad product offering that includes full-service truck leasing, truck rental and contract maintenance, along with logistics services such as dedicated contract carriage, distribution center management, transportation management and lead logistics provider. PTL has a highly diversified customer base that includes multi-national corporations across industries such as food and beverage, transportation, manufacturing, automotive, retail and healthcare, with whom they have long-term contracts, as well as individual consumers renting a single truck on a daily basis.
PTL operates one of the leading full-service truck leasing, truck rental and contract maintenance businesses in North America, and an international logistics business in North America, South America, Europe and Asia. PTL also operates its truck leasing and truck rental business in Australia through a joint venture with us.
Full-service truck leasing, truck rental and contract maintenance. Full-service truck leasing, truck rental and contract maintenance of commercial trucks, tractors and trailers is PTL’s largest business. PTL manages a fleet of approximately 269,000 trucks, tractors and trailers, consisting of approximately 185,500 vehicles owned by PTL and leased to customers under full-service lease or rental agreements and approximately 83,500 customer-owned and -operated vehicles for which they provided contract maintenance services. Terms under its full-service leases generally range from four to seven years for tractors and trucks and six to ten years for trailers. Its commercial and consumer rental fleet as of December 31, 2017 consisted of approximately 66,400 vehicles for use by its full-service truck leasing, small business and consumer customers for periods generally ranging from less than a day to 12 months. Most of its leased vehicles are configured according to customer specifications, including custom painting and lettering, while its rental trucks bear Penske branding.
14
Commercial customers often outsource to PTL in order to reduce the complexity, cost and total capital associated with vehicle ownership. Under a full-service lease, PTL provides and fully maintains the vehicle, which is generally specifically configured for the customer. The services provided under full-service lease and contract maintenance agreements generally include preventive and regular maintenance, advanced diagnostics, emergency road service, fleet services, safety programs, and nationwide fuel services through its network of company-operated facilities and a nationwide network of independent truck stops. In addition, PTL makes available to its full-service leasing and contract maintenance customers additional vehicles on a rental basis. This short-term availability of tractors, trucks and trailers typically accommodates seasonal, emergency and other temporary needs. A significant portion of these rentals are to existing full-service leasing and contract maintenance customers who are seeking flexibility in their fleet management. PTL has established a network of approximately 700 locations to provide full-service truck leasing, truck rental and contract maintenance services to customers. This network enables PTL to meet multi-location customer requirements. PTL’s commercial rental business generated 20% of its operating revenue for 2017 and its full-service lease and contract maintenance business generated 50% of its operating revenue in 2017.
For consumer customers, PTL provides short-term rental of light and medium-duty vehicles on a one-way and local basis, typically to transport household goods. Customers typically include local small businesses and individuals seeking a do-it-yourself solution to their moving needs. PTL’s fleet consists of late model vehicles ranging in size from small vans to 26-foot trucks, and its consumer rentals are conducted through approximately 1,860 independent rental agents and approximately 360 of its company-operated leasing and rental facilities. PTL’s consumer business generated 7% of its operating revenue for 2017.
Logistics. PTL’s logistics business offers a broad variety of services, such as dedicated contract carriage, distribution center management, transportation management, freight brokerage and lead logistics provider. PTL coordinates and provides services for its customers across the supply chain, including: inbound material flow, handling and packaging, inventory management, distribution and technologies, and sourcing of third-party carriers. These offerings are available individually or on a combined basis and often involve its associates performing services at the customer’s location. By offering a scalable series of services to its customers, PTL can manage the customer’s entire supply chain or any stand-alone service. PTL also utilizes specialized software that enables real-time fleet visibility and provides reporting metrics, giving customers detailed information on fuel economy and other critical supply chain costs. PTL’s international logistics business has approximately 380 locations in North America, South America, Europe and Asia. PTL’s logistics business generated 23% of its operating revenue for 2017.
Industry Information
Retail Automotive Dealership. Approximately 59% of our retail automotive dealership revenues are generated in the U.S., which in 2017 was the world’s second largest automotive retail market as measured by units sold. In 2017, sales of new cars and light trucks were approximately 17.2 million units, a decrease of 1.8% from 2016, and were generated at approximately 18,200 franchised new-car dealerships. According to the latest available data from the National Automobile Dealers Association, dealership revenue is derived as follows: 58% from new vehicle sales, 30% from used vehicle sales, and 12% from service and parts sales. Dealerships also offer a wide range of higher-margin products and services, including extended service contracts, financing arrangements and credit insurance. The National Automobile Dealers Association figures noted above include finance and insurance revenues within either new or used vehicle sales, as sales of these products are usually incremental to the sale of a vehicle.
In the U.S., the franchised automotive dealer industry is the largest retail business by revenue, with virtually all new cars and light trucks bought in the U.S. through franchised dealers in a market in excess of $1.0 trillion. Publicly held automotive retail groups account for less than 10% of total industry revenue. Although significant consolidation has already taken place, the industry remains highly fragmented, with more than 90% of the U.S. industry’s market share remaining in the hands of smaller regional and independent players. Our other markets are similarly fragmented. We believe that further consolidation in these markets is probable due to the significant capital requirements of maintaining manufacturer facility standards and the limited number of viable alternative exit strategies for dealership owners.
Our European markets consist of Germany, the U.K., Italy, and Spain, which represented the first, second, fourth, and fifth largest automotive retail markets, respectively, in Western Europe in 2017, and accounted for approximately 64% of the total vehicle sales in Western Europe. Unit sales of automobiles in Western Europe were approximately 14.3
15
million in 2017, a 2.5% increase compared to 2016. In Germany, the U.K., Italy, and Spain, new car sales were approximately 3.4 million, 2.5 million, 2.0 million and 1.2 million units, respectively, in 2017.
We also own a 49% interest in a Japanese joint venture. Unit sales in Japan were 5.2 million in 2017, an increase of 5.6% from 2016.
We also operate fourteen stand-alone used vehicle dealerships in the U.S. and the U.K. Used vehicle sales are even more fragmented than new vehicle sales and are generated by new car dealerships, used vehicle “superstores,” individual small lot sellers, as well as individual to individual sales. Used vehicle sales were approximately 40 million units in the U.S. and approximately 8 million units in the U.K. in 2017.
Retail Commercial Truck Dealership. In 2017, North America sales of Class 5-8 medium and heavy-duty trucks, the principal vehicles for our PTG business, were approximately 499,932 units, an increase of 3.3% from 2016. The Class 5-7 medium-duty truck market increased 6.0% to 248,138 units from 234,163 units in the same period in 2016. The largest market, Class 8 heavy-duty trucks, increased 0.7% to approximately 251,794 units from approximately 249,952 units in 2016. In this market, our principal brands, Freightliner and Western Star, represent approximately 39.7% of that market.
Commercial Vehicle Distribution. Our commercial vehicle distribution business operates principally in Australia and New Zealand. In 2017, heavy-duty truck sales in Australia and New Zealand combined were 15,296 units, representing an increase of 21.8% from 2016. The brands we represent in Australia hold an 8.3% market share in the Australian heavy-duty truck market, and a 5.3% market share in New Zealand.
Penske Truck Leasing. PTL participates broadly in the global supply chain, estimated at $8.2 trillion annually, and particularly in the U.S. supply chain, estimated at $1.5 trillion annually. Only 11% of the total U.S. supply chain function is outsourced to third parties, such as PTL. We estimate, based on R. L. Polk registration data, that there are approximately 8.1 million commercial trucks operating in the United States, of which up to 4.0 million could be potential opportunities for PTL’s full-service leasing and contract maintenance offerings.
Dealership. Generally, new vehicle unit sales are cyclical and, historically, fluctuations have been influenced by factors such as manufacturer incentives, interest rates, fuel prices, unemployment, inflation, weather, the level of personal discretionary spending, credit availability, consumer confidence and other general economic factors. However, from a profitability perspective, automotive and truck retailers have historically been less vulnerable than manufacturers and parts suppliers to declines in new vehicle sales. We believe this is due to the retailers’ more flexible expense structure (a significant portion of the retail industry’s costs are variable) and their diversified revenue streams such as used vehicle sales and service and parts sales. In addition, manufacturers may offer various dealer incentives when sales are slow, which further increases the volatility in profitability for manufacturers and may help to decrease volatility for franchised automotive retailers.
Business Description
Information Technology and Customer Privacy
We consolidate financial, accounting and operational data received from our local operations through private data communications networks. Local operating data is gathered and processed through individual systems utilizing common centralized management systems predominately licensed from, and in many cases operated by, third parties. Our local systems follow our standardized accounting procedures and are compliant with any guidelines established by our vehicle manufacturers. Our database technology allows us to extract and aggregate data from the systems in a consistent format to generate consolidated financial and operational analysis. These systems also allow us to access detailed information for each individual location, as a group, or on a consolidated basis. Information we can access includes, among other things, inventory, cash, unit sales, the mix of new and used vehicle sales and sales of aftermarket products and services. Our ability to access this data allows us to continually analyze our local results of operations and financial position so as to identify areas for improvement.
We utilize common customer relationship management systems that assist us in identifying customer opportunities and responding to customer inquiries. We utilize compliance systems that assist us with our regulatory obligations and
16
assist us in maintaining the privacy of the information we receive from customers that we collect, process, and retain in the normal course of our business. We have adopted rigorous customer information safeguard programs and “red flag” policies to assist us in maintaining customer privacy.
As part of our business model, we receive personal information regarding customers, associates and vendors, from various online and offline channels. Our internal and third-party systems are under a moderate level of risk from hackers or other individuals with malicious intent to gain unauthorized access to our systems. Cyber-attacks are growing in number and sophistication thus presenting an ongoing threat to systems, whether internal or external, used to operate the business on a day to day basis. We perform periodic control testing and audits on our systems. Despite these measures, our facilities and systems, and those of our third-party service providers, could be vulnerable to security breaches, computer viruses, or other events. Any security breach or event resulting in the unauthorized disclosure of confidential information, or degradation of services provided by critical business systems, whether by us directly or our third-party service providers, could adversely affect our business operations, sales, reputation with current and potential customers, associates or vendors, as well as other operational and financial impacts derived from investigations, litigation, imposition of penalties, or other means.
Marketing
Retail Automotive Dealership. Our marketing strategy focuses on our individual businesses to capitalize on local branding, as well as corporate programs and web presence, which allows us to leverage scale and our parent brand recognition. We align ourselves with the marketing implemented by our OEM partners for their respective brands and integrate those initiatives and resources across the brands we represent.
The central core of our marketing strategy revolves around a data-driven approach that combines key metrics and trends from industry and consumer studies, our customer relationship management systems, and performance data from our businesses. This approach emphasizes objectivity and transparency in our marketing efforts and allows us to measure and gauge our success.
Our dealerships have strong local brand and name recognition and are respected in their communities. As such, we focus our efforts on our individual businesses to capitalize on their strong local reputation. To supplement local marketing, we implement corporate initiatives that link our local businesses to leverage scale and our parent brand recognition.
We leverage scale by using consistent performance metrics across the group to identify best practices and opportunities to negotiate enterprise arrangements for key marketing partners. A single, unified, customer relationship management tool is used by our new vehicle dealerships in the U.S. to enhance and streamline customer communication, provide visibility into our sales pipeline, and measure return on investment across the organization.
To attract customers and enhance customer service, each of our dealerships maintains its own website platform. All dealership websites have consistent functionality and responsive formats, except where otherwise required by vehicle manufacturers, which helps to minimize costs and provides a consistent image across dealerships. In addition to the dealership websites, we advertise most of our U.S. and U.K. automotive retail new and pre-owned vehicle inventory online through PenskeCars.com and Sytner.co.uk, as discussed previously under “Embrace Digital Marketing” above.
Consistent with our data-driven approach, as consumer activity continues to move toward digital, our marketing strategy places a strong emphasis on all forms of digital marketing. We strive to build and optimize our online presence across multiple platforms in order to drive high quality traffic to our business and maintain consistent and professional messaging. By focusing on social media, video, mobile, email marketing, online advertising, search engine optimization, branding, and content, we proactively optimize all avenues of digital customer engagement.
We monitor customer satisfaction data to track the performance of operations, and incent our personnel to provide exceptional customer service, thereby driving increased customer loyalty. Social media is a highly-valued element of our marketing strategy that allows us to engage with customers, build dealership awareness and enhance repeat and referral business. Additionally, we leverage corporate social media efforts and partners to benefit our dealerships and create a
17
strong sense of community. Online reputation management sites, such as Google and Yelp, are proactively monitored to ensure we are offering a superior customer experience.
Through our marketing strategy, we aim to forge lasting relationships with our customers, enhance our reputation, and create the opportunity for significant repeat and referral business.
Retail Commercial Truck Dealership and Commercial Vehicle Distribution. We market commercial trucks in the U.S. and Canada and commercial vehicles and other products in Australia and New Zealand principally through a network of dealership and service locations, supported by corporate level marketing efforts. Our digital marketing leverages manufacturer websites supplemented by brand specific websites to promote our brands. We also employ local sponsorships to generate brand awareness in our markets and market to customers at various trade shows and other industry events. While we rely on our dealerships and service locations to market to local customers, we typically assign a regional sales manager to oversee local dealer marketing efforts.
Agreements with Vehicle Manufacturers
We operate our franchised new vehicle dealerships under separate agreements with the manufacturers or distributors of each brand of vehicle sold at that dealership. These agreements are typical throughout the industry and may contain provisions and standards governing almost every aspect of the dealership, including ownership, management, personnel, training, maintenance of a minimum of working capital, net worth requirements, maintenance of minimum lines of credit, advertising and marketing activities, facilities, signs, products and services, maintenance of minimum amounts of insurance, achievement of minimum customer service standards and monthly financial reporting. In addition, the General Manager and/or the owner of a dealership typically cannot be changed without the manufacturer’s consent. In exchange for complying with these provisions and standards, we are granted the non-exclusive right to sell the manufacturer’s or distributor’s brand of vehicles and related parts and warranty services at our dealerships. The agreements also grant us a non-exclusive license to use each manufacturer’s trademarks, service marks and designs in connection with our sales and service of its brand at our dealership.
Some of our agreements, including those with BMW, Honda, Mercedes-Benz and Toyota, expire after a specified period of time, ranging from one to six years. Manufacturers have generally not terminated our franchise agreements, and our franchise agreements with fixed terms have typically been renewed without substantial cost. We currently expect the manufacturers to renew all of our franchise agreements as they expire. In addition, certain agreements with the manufacturers limit the total number of dealerships of that brand that we may own in a particular geographic area and, in some cases, limit the total number of their vehicles that we may sell as a percentage of a particular manufacturer’s overall sales. Manufacturers may also limit the ownership of stores in contiguous markets. We have reached certain geographical limitations with certain manufacturers in the U.S. and U.K. Where these limits are reached, we cannot acquire additional franchises of those brands in the relevant market unless we can negotiate modifications to the agreements. We may not be able to negotiate any such modifications.
Many of these agreements also grant the manufacturer or distributor a security interest in the vehicles and/or parts sold by them to the dealership, as well as other dealership assets, and permit them to terminate or not renew the agreement for a variety of causes, including failure to adequately operate the dealership, insolvency or bankruptcy, impairment of the dealer’s reputation or financial standing, changes in the dealership’s management, owners or location without consent, sales of the dealership’s assets without consent, failure to maintain adequate working capital or floor plan financing, changes in the dealership’s financial or other condition, failure to submit required information to them on a timely basis, failure to have any permit or license necessary to operate the dealership, and material breaches of other provisions of the agreement. In the U.S., these termination rights are subject to state franchise laws that limit a manufacturer’s right to terminate a franchise. In the U.K., we operate without such local franchise law protection (see “Regulation” below).
Our agreements with manufacturers or distributors usually give them the right, in some circumstances (including upon a merger, sale, or change of control of the Company, or in some cases a material change in our business or capital structure), to acquire the dealerships from us at fair market value. For example, our agreement with General Motors provides that, upon a proposed purchase of 20% or more of our voting stock by any new person or entity or another manufacturer (subject to certain exceptions), an extraordinary corporate transaction (such as a merger, reorganization or
18
sale of a material amount of assets) or a change of control of our board of directors, General Motors has the right to acquire all assets, properties and business of any General Motors dealership owned by us for fair value. Some of our agreements with other major manufacturers, including Honda and Toyota, contain provisions similar to the General Motors provisions.
With respect to our commercial vehicle distribution operations in Australia and New Zealand, we are party to distributor agreements with each manufacturer of products we distribute pursuant to which we are the distributor of these products in those countries and nearby markets. The agreements govern all aspects of our distribution rights, including sales and service activities, service and warranty terms, use of intellectual property, promotion and advertising provisions, pricing and payment terms, and indemnification requirements. The agreement with Western Star expires in 2025, the agreement with MTU expires in 2024 and the agreement with Detroit Diesel expires in 2025. We also are party to shipping agreements with respect to importing those products. For each of our non-company owned dealers, we have signed a franchise agreement with terms that set forth the dealer’s obligations with respect to the sales and servicing of these vehicles.
Competition
Dealership. We believe that the principal factors consumers consider when determining where to purchase a vehicle are the marketing campaigns conducted by manufacturers, the ability of dealerships to offer a wide selection of the most popular vehicles, the location of dealerships and the quality of the customer experience. Other factors include customer preference for particular brands of vehicles, pricing (including manufacturer rebates and other special offers) and warranties. We believe that our dealerships are competitive in all of these areas.
The automotive and truck retail industry is currently served by franchised dealerships, independent used vehicle dealerships and individual consumers who sell used vehicles in private transactions. For new vehicle sales, we compete primarily with other franchised dealers in each of our marketing areas, relying on our premium facilities, superior customer service, advertising and merchandising, management experience, sales expertise, reputation, and the location of our dealerships to attract and retain customers. Each of our markets may include a number of well-capitalized competitors, including in certain instances dealerships owned by manufacturers and national and regional retail chains. In our retail commercial truck dealership operations, we compete with other manufacturers and retailers of medium and heavy-duty trucks such as Ford, International Kenworth, Mack, Peterbilt and Volvo. We also compete with dealers that sell the same brands of new vehicles that we sell and with dealers that sell other brands of new vehicles that we do not represent in a particular market. Our new vehicle dealership competitors have franchise agreements which give them access to new vehicles on the same terms as us. Automotive dealers also face competition in the sale of new vehicles from purchasing services and warehouse clubs. With respect to arranging financing for our customers’ vehicle purchases, we compete with a broad range of financial institutions such as banks and local credit unions.
For used vehicle sales, we compete in a highly fragmented market which sells approximately 40 million units in the U.S. and 8 million units in the U.K. annually through other franchised dealers, independent used vehicle dealers, automobile rental agencies, purchasing services, private parties, and used vehicle “superstores” for the procurement and resale of used vehicles.
We compete with other franchised dealers to perform warranty repairs, and with other dealers, franchised and non-franchised service center chains, and independent garages for non-warranty repair and routine maintenance business. We compete with other dealers, franchised and independent aftermarket repair shops, and parts retailers in our parts operations. We believe that the principal factors consumers consider when determining where to purchase vehicle parts and service are price, the use of factory-approved replacement parts, facility location, the familiarity with a manufacturer’s brands and the quality of customer service. A number of regional or national chains offer selected parts and services at prices that may be lower than our prices.
We believe the majority of consumers are utilizing the Internet and other digital media in connection with the purchase of new and used vehicles. Accordingly, we face increased competition from online vehicle websites, including those developed by manufacturers and other dealership groups.
19
Commercial Vehicle Distribution. With respect to our commercial vehicle distribution operations in Australia and New Zealand, we compete with manufacturers, distributors, and retailers of other vehicles and products in our markets. The brands we represent in Australia hold an 8.3% market share in the Australian heavy-duty truck market, and a 5.3% market share in New Zealand.
PTL. As an alternative to using PTL’s full-service truck leasing or contract maintenance services, we believe that most potential customers perform some or all of these services themselves. They may also purchase similar or alternative services from other third-party vendors. Its full-service truck leasing operations compete with companies providing similar services on a national, regional and local level. Many regional and local competitors provide services on a national level through their participation in various cooperative programs. Competitive factors include price, maintenance, service and geographic coverage. PTL competes with finance lessors, truck and trailer manufacturers, and independent dealers, each of which provides full-service lease products, finance leases, extended warranty maintenance, rental, and other transportation services. Its contract maintenance offering competes primarily with truck and trailer manufacturers and independent dealers who provide maintenance services.
Its commercial and consumer rental operations compete with several other nationwide vehicle rental systems, a large number of vehicle leasing and rental companies with multiple branches operating on a regional basis, and many similar companies operating primarily on a local basis. Because a significant portion of its rentals are used for moving and relocation, PTL competes with local and national moving and storage companies, as well as alternatives such as portable container-based transportation and storage. In its rental operations, it competes primarily on the basis of equipment availability, geographic location and customer service.
PTL’s logistics business competes with other dedicated logistics providers, transportation management businesses, freight brokers, warehouse providers and truckload carriers on a national, regional and local level, as well as with the internal supply chain functions of prospective customers who rely on their own resources for logistics management. Competitive factors include price, efficient logistical design offerings, equipment, maintenance, service, technology and geographic coverage, and driver and operations expertise. PTL seeks to combine its logistics services with its existing full-service truck leasing and truck rental business to create an integrated transportation solution for its customers.
As of December 31, 2017, we employed more than 26,000 people, approximately 750 of whom were covered by collective bargaining agreements with labor unions. We consider our relations with our employees to be satisfactory. Our policy is to motivate our key managers through, among other things, variable compensation programs tied principally to local profitability. Due to our reliance on vehicle manufacturers, we may be adversely affected by labor strikes or work stoppages at the manufacturers’ facilities.
Regulation
We operate in a highly regulated industry and a number of regulations affect the marketing, selling, financing, servicing, and distribution of vehicles. Under the laws of the jurisdictions in which we currently operate, we typically must obtain a license in order to establish, operate or relocate a dealership, or operate a repair facility. These laws also regulate our conduct of business, including our advertising, operating, financing, employment, distribution and sales practices. Other laws and regulations include franchise laws and regulations, environmental laws and regulations (see “Environmental Matters” below), laws and regulations applicable to new and used motor vehicle dealers, as well as privacy, identity theft prevention, wage-hour, anti-discrimination and other employment practices laws.
Our financing activities with customers are subject to truth-in-lending, consumer leasing, equal credit opportunity and similar regulations, as well as motor vehicle finance laws, installment finance laws, insurance laws, usury laws and other installment sales laws. Some jurisdictions regulate finance fees that may be paid as a result of vehicle sales. In recent years, private plaintiffs, state attorneys general and federal agencies in the U.S. have increased their scrutiny of advertising, sales, and finance and insurance activities in the sale and leasing of motor vehicles.
In the U.S., we benefit from the protection of numerous state franchise laws that generally provide that a manufacturer or distributor may not terminate or refuse to renew a franchise agreement unless it has first provided the dealer with
20
written notice setting forth good cause and stating the grounds for termination or non-renewal. Some state franchise laws allow dealers to file protests or petitions or to attempt to comply with the manufacturer’s criteria within the notice period to avoid the termination or non-renewal. Our international locations generally do not have these laws and, as a result, our international operations operate without these types of protections.
Environmental Matters
We are subject to a wide range of environmental laws and regulations, including those governing discharges into the air and water, the operation and removal of aboveground and underground storage tanks, the use, handling, storage and disposal of hazardous substances and other materials and the investigation and remediation of environmental contamination. Our business involves the generation, use, handling and contracting for recycling or disposal of hazardous or toxic substances or wastes, including environmentally sensitive materials such as motor oil, filters, transmission fluid, antifreeze, refrigerant, batteries, solvents, lubricants, tires, and fuel. We have incurred, and will continue to incur, capital and operating expenditures and other costs in complying with such laws and regulations.
Our operations involving the management of hazardous and other environmentally sensitive materials are subject to numerous requirements. Our business also involves the operation of storage tanks containing such materials. Storage tanks are subject to periodic testing, containment, upgrading and removal under applicable law. Furthermore, investigation or remediation may be necessary in the event of leaks or other discharges from current or former underground or aboveground storage tanks. In addition, water quality protection programs govern certain discharges from some of our operations. Similarly, certain air emissions from our operations, such as auto body painting, may be subject to relevant laws. Various health and safety standards also apply to our operations.
We may have liability in connection with materials that are sent to third-party recycling, treatment, and/or disposal facilities under the U.S. Comprehensive Environmental Response, Compensation and Liability Act and comparable statutes. These statutes impose liability for investigation and remediation of contamination without regard to fault or the legality of the conduct that contributed to the contamination. Responsible parties under these statutes may include the owner or operator of the site where the contamination occurred and companies that disposed or arranged for the disposal of the hazardous substances released at these sites.
An expanding trend in environmental regulation is to place more restrictions and limitations on activities that may affect the environment. Vehicle manufacturers are subject to federally mandated corporate average fuel economy standards, which will increase substantially through 2025. Furthermore, in response to concerns that emissions of carbon dioxide and certain other gases, referred to as “greenhouse gases,” may be contributing to warming of the Earth’s atmosphere, climate change-related legislation and policy changes to restrict greenhouse gas emissions are being considered, or have been implemented, at state and federal levels. Furthermore, numerous states, including California, have adopted or are considering requiring the sale of specified numbers of zero-emission vehicles. Significant increases in fuel economy requirements or new federal and state restrictions on emissions of carbon dioxide on vehicles and automobile fuels in the U.S. could adversely affect prices of and demand for the vehicles that we sell.
We have a proactive strategy related to environmental, health and safety compliance, which includes contracting with third parties to inspect our facilities periodically. We believe that we do not have any material environmental liabilities and that compliance with environmental laws and regulations will not, individually or in the aggregate, have a material effect on us. However, soil and groundwater contamination is known to exist at certain of our current or former properties. Further, environmental laws and regulations are complex and subject to change. In addition, in connection with our acquisitions, it is possible that we will assume or become subject to new or unforeseen environmental costs or liabilities, some of which may be material. Compliance with current, amended, new or more stringent laws or regulations, stricter interpretations of existing laws or the future discovery of environmental conditions could require additional expenditures by us, and such expenditures could be material.
Insurance
Our business is subject to substantial risk of loss due to significant concentrations of property value, including vehicles and parts at our locations. In addition, we are exposed to liabilities arising out of our operations such as employee claims, customer claims and claims for personal injury or property damage, and potential fines and penalties in
21
connection with alleged violations of regulatory requirements. We attempt to manage such risks through loss control and risk transfer utilizing insurance programs which are subject to specified deductibles and significant retentions. Certain insurers have limited available property coverage in response to the natural catastrophes experienced in recent years. As a result, we are exposed to uninsured and underinsured losses that could have a material adverse effect on us.
Available Information
For selected financial information concerning our various operating and geographic segments, see Note 17 to our consolidated financial statements included in Item 8 of this report. Our Annual Report on Form 10-K, Quarterly Reports on Form 10-Q, current reports on Form 8-K, and amendments to those reports filed or furnished pursuant to section 13(a) or 15(d) of the Exchange Act are available free of charge through our website, www.penskeautomotive.com, under the tab “Investor Relations” as soon as reasonably practicable after they are electronically filed with, or furnished to, the Securities and Exchange Commission (“SEC”). You may read or copy any materials we filed with the SEC at the SEC’s Public Reference Room at 100F Street, NE, Washington, DC 20549. You may obtain information on the operation of the Public Reference Room by calling the SEC at 800-732-0330. Additionally, the SEC maintains an Internet site that contains reports, proxy and information statements, and other information. The address of the SEC’s website is www.sec.gov. We also make available on our website copies of materials regarding our corporate governance policies and practices, including our Corporate Governance Guidelines; our Code of Business Ethics; and the charters relating to the committees of our Board of Directors. You may obtain a printed copy of any of the foregoing materials by sending a written request to: Investor Relations, Penske Automotive Group, Inc., 2555 Telegraph Road, Bloomfield Hills, MI 48302 or by calling toll-free 866-715-5289. The information on or linked to our website is not part of this document. We plan to disclose changes to our Code of Business Ethics, or waivers, if any, for our executive officers or directors, on our website. We are incorporated in the state of Delaware and began dealership operations in October 1992.
Seasonality
Dealership. Our business is modestly seasonal overall. Our U.S. operations generally experience higher volumes of vehicle sales in the second and third quarters of each year due in part to consumer buying trends and the introduction of new vehicle models. Also, vehicle demand, and to a lesser extent demand for service and parts, is generally lower during the winter months than in other seasons, particularly in regions of the U.S. where dealerships may be subject to severe winters. Our U.K. operations generally experience higher volumes of vehicle sales in the first and third quarters of each year, due primarily to vehicle registration practices in the U.K.
Commercial Vehicle Distribution. Our commercial vehicle distribution business generally experiences higher sales volumes during the second quarter of the year, which is primarily attributable to commercial vehicle customers completing annual capital expenditures before their fiscal year-end, which is typically June 30 in Australia.
Our business, financial condition, results of operations, cash flows, prospects, and the prevailing market price and performance of our common stock may be affected by a number of factors, including the matters discussed below. Certain statements and information set forth herein, as well as other written or oral statements made from time to time by us or by our authorized officers on our behalf, constitute “forward-looking statements” within the meaning of the Federal Private Securities Litigation Reform Act of 1995. Words such as “anticipate,” “believe,” “estimate,” “expect,” “intend,” “may,” “goal,” “plan,” “seek,” “project,” “continue,” “will,” “would,” and variations of such words and similar expressions are intended to identify such forward-looking statements. We intend for our forward-looking statements to be covered by the safe harbor provisions for forward-looking statements contained in the Private Securities Litigation Reform Act of 1995, and we set forth this statement in order to comply with such safe harbor provisions. You should note that our forward-looking statements speak only as of the date of this Annual Report on Form 10-K or when made and we undertake no duty or obligation to update or revise our forward-looking statements, whether as a result of new information, future events, or otherwise.
Although we believe that the expectations, plans, intentions, and projections reflected in our forward-looking statements are reasonable, such statements are subject to known and unknown risks, uncertainties, and other factors that
22
may cause our actual results, performance, or achievements to be materially different from any future results, performance, or achievements expressed or implied by the forward-looking statements.
The risks, uncertainties, and other factors that our stockholders and prospective investors should consider include the following:
Macro-economic conditions. Our performance is impacted by general economic conditions overall, and in particular by economic conditions in the markets in which we operate. These economic conditions include: levels of new and used vehicle sales; availability of consumer credit; changes in consumer demand; consumer confidence levels; fuel prices; personal discretionary spending levels; interest rates; and unemployment rates. When the worldwide economy faltered and the worldwide automotive industry experienced significant operational and financial difficulties in 2008 and 2009, we were adversely affected, and we expect a similar relationship between general economic and industry conditions and our performance in the future. The intended departure of the United Kingdom from the European Union (“Brexit”) noted below has generated significant macroeconomic challenges for the global economy. We cannot predict the future effect of Brexit on macroeconomic conditions or the automotive industry in particular, although any sustained drop in vehicle sales would adversely affect our operating results.
Vehicle manufacturers exercise significant control over us. Each of our new vehicle dealerships and distributor operations operate under franchise and other agreements with automotive manufacturers, commercial vehicle manufacturers, or related distributors. These agreements govern almost every aspect of the operation of our dealerships, and give manufacturers the discretion to terminate or not renew our franchise agreements for a variety of reasons, including certain events outside our control such as accumulation of our stock by third parties. Without franchise or distributor agreements, we would be unable to sell or distribute new vehicles or perform manufacturer authorized warranty service. If a significant number of our franchise agreements are terminated or are not renewed, or, with respect to our distributor operations, a competing distributor were introduced, we would be materially affected.
Brand reputation. Our businesses, and our commercial vehicle operations in particular as those are more concentrated with a particular manufacturer, are impacted by consumer demand and brand preference, including consumers’ perception of the quality of those brands. A decline in the quality and brand reputation of the vehicles or other products we sell or distribute, as a result of events such as manufacturer recalls or legal proceedings, may adversely affect our business. If such events were to occur, the profitability of our business related to those manufacturers could be adversely affected. Beginning in 2015, Volkswagen AG received notice informing them that governmental agencies determined that certain Volkswagen and Audi diesel vehicles do not comply with applicable emissions regulations. There have been conflicting reports whether similar issues are present in other manufacturers’ vehicles. While the Volkswagen and Audi diesel vehicles at issue represent a small portion of our total vehicle sales, should such non-compliance by the automotive manufacturers prove widespread or be present in a substantial number of vehicles we sell, our business could be adversely affected.
Restructuring, bankruptcy or other adverse conditions affecting a significant automotive manufacturer or supplier. Our success depends on the overall success of the automotive industry generally, and in particular on the success of the brands of vehicles that each of our dealerships sell. In 2017, revenue generated at our Audi/Volkswagen/Porsche/Bentley, BMW/MINI, Toyota/Lexus, and Mercedes-Benz/Sprinter/smart dealerships represented 24%, 23%, 13%, and 10%, respectively, of our total automotive dealership revenues. Significant adverse events, such as the earthquake and tsunami that struck Japan in March 2011 and resulted in reduced new vehicle production by Japanese automotive manufacturers in 2011, or other future events that interrupt vehicle or parts supply to our dealerships, would likely have a significant and adverse impact on the industry as a whole, including us, particularly if the events impact any of the manufacturers whose franchises generate a significant percentage of our revenue.
Manufacturer incentive programs. Vehicle manufacturers offer incentive programs intended to promote and support vehicle sales. These incentive programs include but are not limited to customer rebates, dealer incentives on new vehicles, manufacturer floor plan interest and advertising assistance, and warranties on new and used vehicles. A discontinuation of or change to the manufacturers’ incentive programs may adversely impact vehicle demand, the value of new and used vehicles, and may materially affect our results of operations.
23
Our business is very competitive. We generally compete with: other franchised dealerships in our markets; used vehicle superstores, private market buyers and sellers of used vehicles; Internet-based vehicle sellers; national and local service and repair shops and parts retailers; with respect to commercial vehicles, distributors of similar products; and manufacturers in certain markets. Purchase decisions by consumers when shopping for a vehicle are extremely price sensitive. The level of competition in the market generally, coupled with increasing price transparency resulting from the use of the Internet by consumers, and pricing discounts to customers, can lead to lower selling prices and related profits. If there is a prolonged drop in retail prices, new vehicle sales are allowed to be made over the Internet without the involvement of franchised dealers, or if dealerships are able to effectively use the Internet to sell outside of their markets, our business could be materially adversely affected.
Evolving automotive and trucking industries. The automotive and trucking industries are predicted to experience rapid change. Shared vehicle services such as Uber and Lyft provide consumers with increased choice in their personal mobility options. The effect of these and similar mobility options on the retail automotive industry is uncertain, and may include lower levels of new vehicles sales, but with increasing miles driven, which could require additional demand for vehicle maintenance. In part due to regulatory requirements to limit vehicle emissions, many automotive manufacturers have announced plans to further electrify their vehicle offerings. We expect to continue to sell electric and hybrid gas/electric vehicles through our franchised dealerships, though if pure electric vehicles were widely accepted by customers, our service revenues may decline, as these vehicles may require less physical maintenance than gas and hybrid vehicles. In addition, technological advances are facilitating the development of driverless vehicles. The eventual timing of availability of driverless vehicles is uncertain due to regulatory requirements, additional technological requirements, and uncertain consumer acceptance of these vehicles. The effect of driverless vehicles on the automotive retail and trucking industries is uncertain and could include changes in the level of new and used vehicles sales, the price of new vehicles, and the role of franchised dealers, any of which could materially and adversely affect our business.
Property loss, business interruption or other liabilities. Our business is subject to substantial risk of loss due to: the significant concentration of property values, including vehicle and parts inventories, at our operating locations; claims by employees, customers and third parties for personal injury or property damage; and fines and penalties in connection with alleged violations of regulatory requirements. While we have insurance for many of these risks, we retain risk relating to certain of these perils and certain perils are not covered by our insurance, including due to the hurricanes noted below. Certain insurers have limited available property coverage in response to the natural catastrophes experienced in recent years. If we experience significant losses that are not covered by our insurance, whether due to adverse weather conditions or otherwise, or we are required to retain a significant portion of a loss, it could have a significant and adverse effect on us.
Recent hurricanes impacted our operations. Hurricane Maria significantly impacted the island of Puerto Rico during the third quarter of 2017, as the power grid and communication systems on the island were severely damaged. As a result, certain of the Company’s operations were suspended and operations were adversely impacted into the fourth quarter of 2017 and remain impacted in the first quarter of 2018. Hurricanes Irma and Harvey disrupted our operations in Florida, Georgia (Atlanta market), and Texas (Houston market) during the third quarter of 2017. Operations in Florida and Texas were impacted for nearly one week, while Georgia experienced a disruption in operations for 1-2 days. We estimate that storm-related losses, expenses, and business interruption, net of expected insurance proceeds, were approximately $3.0 million in 2017.
Leverage. Our significant debt and other commitments expose us to a number of risks, including:
Cash requirements for debt and lease obligations. A significant portion of the cash flow we generate must be used to service the interest and principal payments relating to our various financial commitments, including $3.8 billion of floor plan notes payable, $2.2 billion of non-vehicle long-term debt and $5.1 billion of future lease commitments (including extension periods that are reasonably assured of being exercised and assuming constant consumer price indices). A sustained or significant decrease in our operating cash flows could lead to an inability to meet our debt service or lease requirements or to a failure to meet specified financial and operating covenants included in certain of our agreements. If this were to occur, it may lead to a default under one or more of our commitments and potentially the acceleration of amounts due, which could have a significant and adverse effect on us.
24
Availability. Because we finance the majority of our operating and strategic initiatives using a variety of commitments, including floor plan notes payable and revolving credit facilities, we are dependent on continued availability of these sources of funds. If these agreements are terminated or we are unable to access them because of a breach of financial or operating covenants or otherwise, we will likely be materially affected.
Interest rate variability. The interest rates we are charged on a substantial portion of our debt, including the floor plan notes payable we issue to purchase the majority of our inventory, are variable, increasing or decreasing based on changes in certain published interest rates. Increases to such interest rates would likely result in significantly higher interest expense for us, which would negatively affect our operating results. Because many of our customers finance their vehicle purchases, increased interest rates may also decrease vehicle sales, which would negatively affect our operating results.
Impairment of our goodwill or other indefinite-lived intangible assets has in the past had, and in the future could have, a material adverse impact on our earnings. We evaluate goodwill and other indefinite-lived intangible assets for impairment annually and upon the occurrence of an indicator of impairment. Our process for impairment testing of these assets is described further under “Impairment Testing” in Part II, Item 7, Management’s Discussion and Analysis of Financial Condition and Results of Operations — Critical Accounting Policies and Estimates. If we determine that the amount of our goodwill or other indefinite-lived intangible assets are impaired at any point in time, we would be required to reduce the value of these assets on our balance sheet, which would also result in a material non-cash impairment charge that could also have a material adverse effect on our results of operations for the period in which the impairment occurs.
Performance of sublessees. In connection with the sale, relocation and closure of certain of our franchises, we have entered into a number of third-party sublease agreements. The rent paid by our sub-tenants on such properties in 2017 totaled approximately $20.6 million. In the aggregate, we remain ultimately liable for approximately $200.1 million of such lease payments including payments relating to all available renewal periods. We rely on our sub-tenants to pay the rent and maintain the properties covered by these leases. In the event a subtenant does not perform under the terms of their lease with us, we could be required to fulfill such obligations, which could have a significant and adverse effect on us.
Information technology. Our information systems are fully integrated into our operations and we rely on them to operate effectively, including with respect to: electronic communications and data transfer protocols with manufacturers and other vendors; customer relationship management; sales and service scheduling; data storage; and financial and operational reporting. The majority of our systems are licensed from third parties, the most significant of which are provided by a limited number of suppliers in the U.S., U.K. and Australia. The failure of our information systems to perform as designed, the failure to protect the integrity of these systems, or the interruption of these systems due to natural disasters, power loss or other reasons, could disrupt our business operations, impact sales and results of operations, expose us to customer or third-party claims, or result in adverse publicity.
Cyber-security. As part of our business model, we receive personal information regarding customers, associates and vendors, from various online and offline channels. We collect, process, and retain this information in the normal course of our business. Our internal and third-party systems are under a moderate level of risk from hackers or other individuals with malicious intent to gain unauthorized access to our systems. Cyber-attacks are growing in number and sophistication thus presenting an ongoing threat to systems, whether internal or external, used to operate the business on a day to day basis. Despite the security measures we have in place, our facilities and systems, and those of our third-party service providers, could be vulnerable to security breaches, computer viruses, lost or misplaced data, programming errors, human errors, acts of vandalism, or other events. Any security breach or event resulting in the misappropriation, loss, or other unauthorized disclosure of confidential information, or degradation of services provided by critical business systems, whether by us directly or our third-party service providers, could adversely affect our business operations, sales, reputation with current and potential customers, associates or vendors, as well as other operational and financial impacts derived from investigations, litigation, imposition of penalties or other means.
The United Kingdom’s potential departure from the European Union could adversely affect us. The United Kingdom is expected to exit the European Union in May 2019. Negotiations regarding the future terms of the United Kingdom’s relationship with the European Union are ongoing. The effects of Brexit will depend on any agreements the
25
United Kingdom makes to retain access to European Union markets either during a transitional period or more permanently. Brexit itself and the length of time the United Kingdom and the European Union engage in discussions, which could be over a protracted period of time, could adversely affect European and worldwide economic and market conditions and could contribute to instability in global financial and foreign exchange markets, including volatility in the value of the British Pound and the Euro. More specifically, it could lead to increased retail prices in the United Kingdom since the majority of vehicles sold in the U.K. are imported from other countries in Europe.
In addition, commentators have suggested the June 2016 Brexit vote could lead to further referenda as to whether certain of the four countries that comprise the United Kingdom (England, Scotland, Wales and Northern Ireland) will remain a part of the European Union. While the majority of our U.K. operations are in England, we also have operations in Scotland, Wales and Northern Ireland. The same factors noted above apply to any potential exit of these countries from the United Kingdom.
As exchange rates fluctuate, our revenue and results of operations as reported in U.S. Dollars fluctuate. The British Pound has weakened since the June 2016 Brexit vote, with an average exchange rate of British Pounds to U.S. Dollars of 1.29 for 2017 compared to 1.36 in 2016, a decrease of 5.1%. A weakening British Pound as compared to the U.S. Dollar negatively impacts our U.S. Dollar reported results of operations. Our U.K. business generated 33% of our total revenue for the year ended December 31, 2017. Any of these effects of Brexit, and others we cannot anticipate, could adversely affect our business, consolidated financial position, results of operations, and cash flows.
The success of our commercial vehicle distribution businesses are directly impacted by availability and demand for the vehicles and other products we distribute. We are the exclusive distributor of Western Star commercial trucks, MAN commercial trucks and buses, and Dennis Eagle refuse collection vehicles, together with associated parts, across Australia, New Zealand and portions of the Pacific. We are also the distributor of diesel and gas engines and power systems in these same markets. The profitability of these businesses depends upon the number of vehicles, engines, power systems and parts we distribute, which in turn is impacted by demand for these products. We believe demand is subject to general economic conditions, exchange rate fluctuations, regulatory changes, competitiveness of the products and other factors over which we have limited control. In the event sales of these products are less than we expect, our related results of operations and cash flows for this aspect of our business may be materially adversely affected. The products we distribute are principally manufactured at a limited number of locations. In the event of a supply disruption or if sufficient quantities of the vehicles, engines, power systems and parts are not made available to us, or if we accept these products and are unable to economically distribute them, our cash flows or results of operations may be materially adversely affected.
Australian economic conditions. Our commercial vehicle distribution operations in Australia and New Zealand may be impacted by local economic conditions and in particular, the price of commodities such as copper and iron ore which may impact the desire of our customers to operate their mining operations and replace their vehicle fleets. Adverse pricing concerns of those, and other commodities, may have a material adverse effect on our ability to distribute, and/or retail, commercial vehicles and other products profitably. These same conditions may also negatively impact the value of the Australian Dollar versus the U.S. Dollar, which negatively impacts our U.S. Dollar reported financial results and the pricing of products sold by Penske Commercial Vehicles, which are manufactured in the U.S., U.K., and Germany.
International and foreign currency risk. We have significant operations outside the U.S. that expose us to changes in foreign exchange rates and to the impact of economic and political conditions in the markets where we operate. As exchange rates fluctuate, our results of operations as reported in U.S. Dollars fluctuate. For example, if the U.S. Dollar were to continue to strengthen against the British Pound, our U.K. results of operations would translate into less U.S. Dollar reported results. The British Pound has weakened since the June 2016 Brexit vote, with an average exchange rate of British Pounds to U.S. Dollars of 1.29 for 2017 compared to 1.36 in 2016, a decrease of 5.1%. Sustained levels or an increase in the value of the U.S. Dollar, particularly as compared to the British Pound, could result in a significant and adverse effect on our reported results.
Joint ventures. We have significant investments in a variety of joint ventures, including retail automotive operations in Germany, Japan, Italy and Spain. We previously had a 23.4% interest in PTL, and as of September 2017, increased our ownership to 28.9%. We expect to receive annual operating distributions from PTL and the other ventures, and in the case of PTL, realize significant cash tax savings. These benefits may not be realized if the joint ventures do not perform
26
as expected, or if changes in tax, financial, or regulatory requirements negatively impact the results of the joint venture operations. Our ability to dispose of these investments may be limited. In addition, the relevant joint venture agreement and other contractual restrictions may limit our access to the cash flows of these joint ventures. For example, PTL’s principal debt agreements allow partner distributions only as long as PTL is not in default under that agreement and the amount PTL distributes does not exceed 50% of its consolidated net income.
Additional risks relating to PTL. PTL’s business has additional risks to those in the retail business.
Customers. PTL has a more concentrated customer base than we do and is subject to changes in the financial health of its customers, changes in their asset utilization rates and increased competition for those customers.
Workforce. PTL requires a significant number of qualified drivers and technicians which may be difficult to hire, and is subject to increased compliance costs or work stoppages relating to those employees, particularly in regards to changes in labor laws and time of work rules regarding those employees.
Fleet risk. As one of the largest purchasers of commercial trucks in North America, PTL requires continued availability from truck manufacturers and suppliers of vehicles and parts for its fleet, which may be uncertain, in particular if a significant recall were to occur. In addition, because PTL sells a large number of trucks each year and is subject to residual risk for the vehicles it leases to customers, changes in values of used trucks affects PTL’s profitability.
Capital markets risk. PTL relies on banks and the capital markets to fund its operations and capital commitments. PTL had a significant amount of total indebtedness at December 31, 2017, which it uses in part to purchase its vehicle fleet, and therefore is subject to changes in, and continued access to, the capital markets.
Key personnel. We believe that our success depends to a significant extent upon the efforts and abilities of our senior management, and in particular upon Roger Penske who is our Chair and Chief Executive Officer. To the extent Mr. Penske, or other key personnel, were to depart from our Company unexpectedly, our business could be significantly disrupted.
Regulatory issues. We are subject to a wide variety of regulatory activities, including:
Governmental regulations, claims and legal proceedings. Governmental regulations affect almost every aspect of our business, including the fair treatment of our employees, wage and hour issues, and our financing activities with customers. In California, judicial decisions call into question whether long-standing methods for compensating dealership employees comply with the local wage and hour rules. We could be susceptible to claims or related actions if we fail to operate our business in accordance with applicable laws or it is determined that long-standing compensation methods did not comply with local laws. Claims arising out of actual or alleged violations of law which may be asserted against us or any of our dealers by individuals, through class actions, or by governmental entities in civil or criminal investigations and proceedings, may expose us to substantial monetary damages which may adversely affect us.
European Union General Data Protection Regulation. We are subject to numerous laws and regulations in the U.S. and internationally designed to protect the information of clients, customers, employees, and other third parties that we collect and maintain, including the European Union General Data Protection Regulation (the “GDPR”), which will take effect in May 2018. The GDPR, among other things, mandates new requirements regarding the handling of personal data of employees and customers, including its use, protection and the ability of persons whose data is stored to correct or delete such data about themselves. If we fail to comply with these laws or regulations, we could be subject to significant litigation, monetary damages, regulatory enforcement actions or fines in one or more jurisdictions. For example, a failure to comply with the GDPR could result in fines up to the greater of €20 million or 4% of annual global revenues.
Recalls. Legislative and regulatory bodies from time to time have considered laws or regulations that would prohibit companies from renting or selling any vehicle that is subject to a recall until the recall service is performed. Whether any such prohibition may be enacted, and its ultimate scope, cannot be determined at this time. If a law or
27
regulation is enacted that prevents the sale of vehicles until recall service has been performed, we could be required to reserve a significant portion of our vehicles from being available for sale for even a minor recall unrelated to vehicle safety. In addition, various manufacturers have issued stop sale notices in relation to certain recalls that require that we retain vehicles until the recall can be performed. For certain airbag recalls, these required parts are currently unavailable. While servicing recall vehicles yields parts and service revenue to us, the inability to sell a significant portion of our vehicles could increase our costs and have an adverse effect on our results of operations if a large number of our vehicles are the subject of simultaneous recalls, or if needed replacement parts are not in adequate supply.
Vehicle requirements. Federal and state governments in our markets have increasingly placed restrictions and limitations on the vehicles sold in the market in an effort to combat perceived negative environmental effects. For example, in the U.S., automotive manufacturers are subject to federally mandated corporate average fuel economy standards which will increase substantially through 2025. Furthermore, numerous states and other jurisdictions, including California, have adopted or are considering regulations requiring the sale of specified numbers of zero-emission vehicles. Moreover, several countries, including the U.K. and Germany, have announced or are considering plans to ban or restrict the sale of diesel or combustible fuel vehicles. Significant increases in fuel economy requirements and new federal or state restrictions on emissions on vehicles and fuels could adversely affect prices of and demand for the new vehicles that we sell, which could materially adversely affect us.
Franchise laws in the U.S. In the U.S., state law generally provides protections to franchised vehicle dealers from discriminatory practices by manufacturers and from unreasonable termination or non-renewal of their franchise agreements. If these franchise laws are repealed or amended, manufacturers may have greater flexibility to terminate or not renew our franchises. Franchised automotive dealers in the European Union operate without such protections.
Changes in law. New laws and regulations at the state and federal level may be enacted which could materially adversely impact our business. For example, in 2013, a ballot initiative in California titled the California Car Buyers Protection Act was proposed that would have eliminated our ability to be compensated for assisting in financing customer vehicle purchases, among other matters. If these initiatives or other adverse changes in law were to be enacted, it could have a significant and adverse effect on us.
New U.S. tax laws. On December 22, 2017, the U.S. Tax Cuts and Jobs Act was signed into law. This law imposes significant changes on the way we are taxed, including, among other things, changes to U.S. federal tax rates, imposing significant additional limitations on the deductibility of interest, and the migration to a new international system of taxation. There is substantial uncertainty regarding both the timing and the details of how these changes will affect our company, our customers, and the customers of Penske Truck Leasing, any of which changes may be adverse to us. See Part II, Item 8, Note 16 of the Notes to our Consolidated Financial Statements for additional information on our initial assessment of these changes to our company.
Environmental regulations. We are subject to a wide range of environmental laws and regulations, including those governing: discharges into the air and water; the operation and removal of storage tanks; and the use, storage and disposal of hazardous substances. In the normal course of our operations we use, generate and dispose of materials covered by these laws and regulations. We face potentially significant costs relating to claims, penalties and remediation efforts in the event of non-compliance with existing and future laws and regulations.
Accounting rules and regulations. The Financial Accounting Standards Board is currently evaluating several significant changes to GAAP in the U.S., including new guidance recently issued for revenue recognition and lease accounting. Changes to U.S. GAAP could significantly affect our reported financial position, earnings and cash flows upon adoption and effectiveness. For example, adoption of the new lease accounting standard is expected to result in a significant increase in lease liabilities and right-of-use assets on our consolidated balance sheets. In addition, changes to lease accounting could affect PTL customers’ decisions to purchase or lease trucks, which could adversely affect their business if leasing becomes a less favorable option. See the disclosure provided under “Recent Accounting Pronouncements” in Part II, Item 8, Note 1 of the Notes to our Consolidated Financial Statements for additional detail on accounting standard updates expected to have an impact on us.
28
Related parties. Our two largest stockholders, Penske Corporation and its affiliates (“Penske Corporation”) and Mitsui & Co. and its affiliates (“Mitsui”), together beneficially own approximately 58% of our outstanding common stock. The presence of such significant shareholders results in several risks, including:
Our principal stockholders have substantial influence. Penske Corporation and Mitsui have entered into a stockholders agreement pursuant to which they have agreed to vote together as to the election of our directors. As a result, Penske Corporation has the ability to control the composition of our Board of Directors, which may allow it to control our affairs and business. This concentration of ownership, coupled with certain provisions contained in our agreements with manufacturers, our certificate of incorporation, and our bylaws, could discourage, delay or prevent a change in control of us.
Some of our directors and officers may have conflicts of interest with respect to certain related party transactions and other business interests. Roger Penske, our Chair and Chief Executive Officer and a director, holds the same offices at Penske Corporation. Robert Kurnick, Jr., our President and a director, is also the Vice Chair and a director of Penske Corporation. Bud Denker, our Executive Vice President, Human Resources, is also the President of Penske Corporation. Each of these officers is paid much of their compensation by Penske Corporation. The compensation they receive from us is based on their efforts on our behalf, however, they are not required to spend any specific amount of time on our matters. One of our directors, Roger S. Penske, Jr., is the son of our Chair and also serves as a director of Penske Corporation. Kanji Sasaki, one of our directors and officers, is also an employee of Mitsui & Co. Roger Penske also serves as Chairman of Penske Truck Leasing, for which he is compensated by PTL.
Penske Corporation has pledged its shares of common stock to secure a loan facility. Penske Corporation has pledged all of its shares of our common stock as collateral to secure a loan facility. A default by Penske Corporation could result in the foreclosure on those shares by the lenders, after which the lenders could attempt to sell those shares on the open market or to a third party. Any such change in ownership and/or sale could materially impact the market price of our common stock. See below “Penske Corporation ownership levels.”
Penske Corporation ownership levels. Certain of our agreements have clauses that are triggered in the event of a material change in the level of ownership of our common stock by Penske Corporation, such as our trademark agreement between us and Penske Corporation that governs our use of the “Penske” name which can be terminated 24 months after the date that Penske Corporation no longer owns at least 20% of our voting stock. We may not be able to renegotiate such agreements on terms that are acceptable to us, if at all, in the event of a significant change in Penske Corporation’s ownership.
We have a significant number of shares of common stock eligible for future sale. Penske Corporation and Mitsui own approximately 58% of our common stock and each has two demand registration rights that could result in a substantial number of shares being introduced for sale in the market. We also have a significant amount of authorized but unissued shares. The introduction of any of these shares into the market could have a material adverse effect on our stock price.
Item 1B. Unresolved Staff Comments
Not applicable.
We lease or sublease substantially all of our dealership properties and other facilities. These leases are generally for a period of between 5 and 20 years, and are typically structured to include renewal options at our election. We lease office space in Bloomfield Hills, Michigan, Leicester, England and Brisbane, Australia for our principal administrative headquarters and other corporate related activities. We believe that our facilities are sufficient for our needs and are in good repair.
29
We are involved in litigation which may relate to claims brought by governmental authorities, customers, vendors, or employees, including class action claims and purported class action claims. We are not a party to any legal proceedings, including class action lawsuits, that individually or in the aggregate, are reasonably expected to have a material effect on us. However, the results of these matters cannot be predicted with certainty, and an unfavorable resolution of one or more of these matters could have a material adverse effect.
Item 4. Mine Safety Disclosures
Not applicable.
30
Item 5. Market for Registrant’s Common Equity, Related Stockholder Matters and Issuer Purchases of Equity Securities
Our common stock is traded on the New York Stock Exchange under the symbol “PAG.” As of February 16, 2018, there were 166 holders of record of our common stock. The following table sets forth the high and low sales prices and quarterly dividends per share for our common stock as reported on the New York Stock Exchange Composite Tape during each quarter of 2017 and 2016.
|
|
|
High |
|
Low |
|
Dividend |
|
|||
|
2016: |
|
|
|
|
|
|
|
|
|
|
|
First Quarter |
|
$ |
41.72 |
|
$ |
29.41 |
|
$ |
0.26 |
|
|
Second Quarter |
|
|
40.89 |
|
|
31.02 |
|
|
0.27 |
|
|
Third Quarter |
|
|
50.07 |
|
|
29.29 |
|
|
0.28 |
|
|
Fourth Quarter |
|
|
56.05 |
|
|
41.90 |
|
|
0.29 |
|
|
2017: |
|
|
|
|
|
|
|
|
|
|
|
First Quarter |
|
$ |
55.26 |
|
$ |
45.05 |
|
$ |
0.30 |
|
|
Second Quarter |
|
|
49.41 |
|
|
40.37 |
|
|
0.31 |
|
|
Third Quarter |
|
|
47.63 |
|
|
38.33 |
|
|
0.32 |
|
|
Fourth Quarter |
|
|
50.36 |
|
|
44.39 |
|
|
0.33 |
|
Dividends
In addition to the dividends noted above, we have announced the payment of a dividend of $0.34 per share to be paid on March 1, 2018 to shareholders of record as of February 12, 2018. Future cash dividends will depend upon our earnings, capital requirements, financial condition, restrictions imposed by any then-existing indebtedness and other factors considered relevant by our Board of Directors. In particular, our U.S. credit agreement and the indentures governing our 5.75%, 5.375%, 5.50%, and 3.75% senior subordinated notes contain, and any future indenture that governs any notes which may be issued by us may contain, certain limitations on our ability to pay dividends. Refer to the disclosures provided in Part II, Item 8, Note 9 of the Notes to our Consolidated Financial Statements set forth below for a detailed description of our long-term debt obligations. We are a holding company whose assets consist primarily of the direct or indirect ownership of the capital stock of our operating subsidiaries. Consequently, our ability to pay dividends is dependent upon the earnings of our subsidiaries and their ability to distribute earnings and other advances and payments to us.
Securities Repurchases
In October 2017, our Board of Directors increased the authority delegated to management to repurchase our outstanding securities to $200.0 million. Prior to the increase, we had $19.4 million in remaining authorization. As of December 31, 2017, we had $200.0 million in repurchase authorization remaining under the securities repurchase program. For further information with respect to repurchases of our shares by us, see “Item 7. Management’s Discussion and Analysis of Financial Condition and Results of Operations — Liquidity and Capital Resources — Securities Repurchases.”
31
SHARE INVESTMENT PERFORMANCE
The following graph compares the cumulative total stockholder returns on our common stock based on an investment of $100 on December 31, 2012 and the close of the market on December 31 of each year thereafter against (i) the Standard & Poor’s 500 Index and (ii) an industry/peer group consisting of Asbury Automotive Group, Inc., AutoNation, Inc., Group 1 Automotive, Inc., Lithia Motors, Inc., and Sonic Automotive, Inc. The graph assumes the reinvestment of all dividends.
COMPARISON OF 5 YEAR CUMULATIVE TOTAL RETURN*
Among Penske Automotive Group, Inc., the S&P 500 Index and a Peer Group
*$100 invested on 12/31/12 in stock or index, including reinvestment of dividends. Fiscal year ending December 31.
|
|
|
Cumulative Total Return |
|
||||||||||
|
|
|
12/12 |
|
12/13 |
|
12/14 |
|
12/15 |
|
12/16 |
|
12/17 |
|
|
Penske Automotive Group, Inc. |
|
100.00 |
|
159.49 |
|
168.83 |
|
148.37 |
|
187.18 |
|
177.63 |
|
|
S&P 500 |
|
100.00 |
|
132.39 |
|
150.51 |
|
152.59 |
|
170.84 |
|
208.14 |
|
|
Peer Group |
|
100.00 |
|
133.17 |
|
166.22 |
|
162.41 |
|
144.69 |
|
150.95 |
|
32
Item 6. Selected Financial Data
The following table sets forth our selected historical consolidated financial and other data as of and for each of the five years in the period ended December 31, 2017, which has been derived from our audited consolidated financial statements. During the periods presented, we made a number of acquisitions and have included the results of operations of the acquired dealerships from the date of acquisition. As a result, our period to period results of operations vary depending on the dates of the acquisitions. Accordingly, this selected financial data is not necessarily comparable or indicative of our future results. During the periods presented, we also sold or made available for sale certain entities which have been treated as discontinued operations in accordance with generally accepted accounting principles. You should read this selected consolidated financial data in conjunction with our audited consolidated financial statements and related footnotes included elsewhere in this report.
|
|
|
As of and for the Years Ended December 31, |
|
|||||||||||||
|
|
|
2017 (1) |
|
2016 (2) |
|
2015 |
|
2014 (3) |
|
2013 |
|
|||||
|
|
|
(In millions, except share and per share data) |
|
|||||||||||||
|
Consolidated Statement of Operations Data: |
|
|
|
|
|
|
|
|
|
|
|
|
|
|
|
|
|
Total revenues |
|
$ |
21,386.9 |
|
$ |
20,118.5 |
|
$ |
19,284.9 |
|
$ |
17,232.0 |
|
$ |
14,482.5 |
|
|
Gross profit |
|
$ |
3,222.5 |
|
$ |
2,966.6 |
|
$ |
2,867.5 |
|
$ |
2,579.2 |
|
$ |
2,201.0 |
|
|
Income from continuing operations attributable to Penske Automotive Group common stockholders (4) |
|
$ |
613.5 |
|
$ |
343.9 |
|
$ |
329.6 |
|
$ |
301.4 |
|
$ |
247.0 |
|
|
Net income attributable to Penske Automotive Group common stockholders |
|
$ |
613.3 |
|
$ |
342.9 |
|
$ |
326.1 |
|
$ |
286.7 |
|
$ |
244.2 |
|
|
Diluted earnings per share from continuing operations attributable to Penske Automotive Group common stockholders |
|
$ |
7.14 |
|
$ |
4.00 |
|
$ |
3.67 |
|
$ |
3.34 |
|
$ |
2.73 |
|
|
Diluted earnings per share attributable to Penske Automotive Group common stockholders |
|
$ |
7.14 |
|
$ |
3.99 |
|
$ |
3.63 |
|
$ |
3.17 |
|
$ |
2.70 |
|
|
Shares used in computing diluted share data |
|
|
85,877,227 |
|
|
86,000,754 |
|
|
89,759,626 |
|
|
90,354,839 |
|
|
90,330,621 |
|
|
Balance Sheet Data: |
|
|
|
|
|
|
|
|
|
|
|
|
|
|
|
|
|
Total assets (5) |
|
$ |
10,540.6 |
|
$ |
8,833.0 |
|
$ |
7,982.9 |
|
$ |
7,186.3 |
|
$ |
6,378.9 |
|
|
Total floor plan notes payable |
|
$ |
3,761.8 |
|
$ |
3,317.8 |
|
$ |
3,379.6 |
|
$ |
2,746.4 |
|
$ |
2,579.7 |
|
|
Total debt (excluding floor plan notes payable) |
|
$ |
2,163.2 |
|
$ |
1,877.1 |
|
$ |
1,275.0 |
|
$ |
1,342.6 |
|
$ |
989.3 |
|
|
Total equity attributable to Penske Automotive Group common stockholders |
|
$ |
2,395.2 |
|
$ |
1,750.9 |
|
$ |
1,790.2 |
|
$ |
1,652.8 |
|
$ |
1,504.4 |
|
|
Cash dividends per share |
|
$ |
1.26 |
|
$ |
1.10 |
|
$ |
0.94 |
|
$ |
0.78 |
|
$ |
0.62 |
|
|
(1) |
Includes a $243.4 million income tax benefit, or $2.83 per share, from the enactment of the U.S. Tax Cuts and Jobs Act in December 2017, as further discussed in Part II, Item 8, Note 16 of the Notes to our Consolidated Financial Statements set forth below. |
|
(2) |
Includes a $5.1 million income tax benefit, or $0.06 per share, from the revaluation of a deferred tax liability as a result of our acquisition of the remaining ownership interests of PTG in April 2016. |
|
(3) |
Includes a gain of $16.0 million ($9.7 million after tax), or $0.10 per share, from the revaluation at fair value of a previously held non-controlling interest in PTG, of which we acquired a controlling interest in November 2014. |
|
(4) |
Excludes income (loss) from continuing operations attributable to non-controlling interests of $(0.5) million, $3.5 million, $4.3 million, $3.4 million, and $1.5 million in 2017, 2016, 2015, 2014, and 2013, respectively. |
|
(5) |
Includes reclassifications due to the retrospective application of Accounting Standards Update No. 2015-17, “Income Taxes (Topic 740) — Balance Sheet Classification of Deferred Taxes” of $28.1 million, $30.5 million, $31.4 million, and $29.1 million in 2016, 2015, 2014, and 2013, respectively. |
33
Item 7. Management’s Discussion and Analysis of Financial Condition and Results of Operations
This Management’s Discussion and Analysis of Financial Condition and Results of Operations contains forward-looking statements that involve risks and uncertainties. Our actual results may differ materially from those discussed in the forward-looking statements as a result of various factors, including those discussed in Item 1A. “Risk Factors” and “Forward-Looking Statements.” We have acquired and initiated a number of businesses during the periods presented and addressed in this Management’s Discussion and Analysis of Financial Condition and Results of Operations. Our financial statements include the results of operations of those businesses from the date acquired or when they commenced operations. This Management’s Discussion and Analysis of Financial Condition and Results of Operations has been updated to reflect the revision of our financial statements for entities which have been treated as discontinued operations.
Overview
We are a diversified international transportation services company that operates automotive and commercial truck dealerships principally in the United States, Canada and Western Europe, and distributes commercial vehicles, diesel engines, gas engines, power systems and related parts and services principally in Australia and New Zealand. We employ more than 26,000 people worldwide.
In 2017, our business generated $21.4 billion in total revenue, which is comprised of approximately $19.8 billion from retail automotive dealerships, $1.0 billion from retail commercial truck dealerships and $0.5 billion from commercial vehicle distribution and other operations. We generated $3.2 billion in gross profit, which is comprised of $2.9 billion from retail automotive dealerships, $165.8 million from retail commercial truck dealerships and $131.9 million from commercial vehicle distribution and other operations.
Retail Automotive Dealership. We believe we are the second largest automotive retailer headquartered in the U.S. as measured by the $19.8 billion in total retail automotive dealership revenue we generated in 2017. As of December 31, 2017, we operated 343 retail automotive franchises, of which 155 franchises are located in the U.S. and 188 franchises are located outside of the U.S. The franchises outside the U.S. are located primarily in the U.K. In 2017, we retailed and wholesaled more than 618,900 vehicles. We are diversified geographically, with 59% of our total retail automotive dealership revenues in 2017 generated in the U.S. and Puerto Rico and 41% generated outside the U.S. We offer over 40 vehicle brands, with 70% of our retail automotive dealership revenue in 2017 generated from premium brands, such as Audi, BMW, Mercedes-Benz and Porsche. Each of our dealerships offers a wide selection of new and used vehicles for sale. In addition to selling new and used vehicles, we generate higher-margin revenue at each of our dealerships through maintenance and repair services and the sale and placement of third-party finance and insurance products, third-party extended service and maintenance contracts, and replacement and aftermarket automotive products.
In the first quarter of 2017, we acquired CarSense in the U.S. and CarShop in the U.K., both businesses representing stand-alone used vehicle dealerships, which we believe complement our existing franchised retail automotive dealership operations and provide scalable opportunities across our market areas. Our CarSense operations consist of five locations operating in the Philadelphia and Pittsburgh, Pennsylvania market areas, including southern New Jersey. Our CarShop operations consist of five retail locations and a vehicle preparation center operating principally throughout Southern England. In January 2018, we expanded our U.K. stand-alone used vehicle dealerships by acquiring The Car People, one of the U.K.’s leading retailers of used vehicles. The Car People has four retail locations operating across Northern England, which complements CarShop’s locations principally in Southern England.
Retail automotive dealerships represented 92.7% of our total revenues and 90.8% of our total gross profit in 2017.
Retail Commercial Truck Dealership. We operate a heavy and medium-duty truck dealership group known as Premier Truck Group (“PTG”) with locations in Texas, Oklahoma, Tennessee, Georgia, and Canada. As of December 31, 2017, PTG operated twenty locations, including fourteen full-service dealerships and six collision centers, offering primarily Freightliner and Western Star branded trucks. Four of these locations were acquired in April 2016 in the greater Toronto, Canada market area, and two of these locations were acquired in December 2016 in the Niagara Falls, Canada market area. PTG also offers a full range of used trucks available for sale as well as service and parts departments, providing a full range of maintenance and repair services.
34
This business represented 4.9% of our total revenues and 5.1% of our total gross profit in 2017.
Commercial Vehicle Distribution. We are the exclusive importer and distributor of Western Star heavy-duty trucks (a Daimler brand), MAN heavy and medium-duty trucks and buses (a VW Group brand), and Dennis Eagle refuse collection vehicles, together with associated parts, across Australia, New Zealand and portions of the Pacific. This business, known as Penske Commercial Vehicles Australia (“PCV Australia”), distributes commercial vehicles and parts to a network of more than 70 dealership locations, including eight company-owned retail commercial vehicle dealerships.
We are also a leading distributor of diesel and gas engines and power systems, principally representing MTU, Detroit Diesel, Mercedes-Benz Industrial, Allison Transmission and MTU Onsite Energy. This business, known as Penske Power Systems (“PPS”), offers products across the on- and off-highway markets in Australia, New Zealand and portions of the Pacific and supports full parts and aftersales service through a network of branches, field locations and dealers across the region. The on-highway portion of this business complements our PCV Australia distribution business, including integrated operations at retail locations selling PCV brands.
These businesses represented 2.4% of our total revenues and 4.1% of our total gross profit in 2017.
Penske Truck Leasing. We currently hold a 28.9% ownership interest in Penske Truck Leasing Co., L.P. (“PTL”), a leading provider of transportation services and supply chain management. PTL is capable of meeting customers’ needs across the supply chain with a broad product offering that includes full-service truck leasing, truck rental and contract maintenance, along with logistic services such as dedicated contract carriage, distribution center management, transportation management and lead logistics provider. On July 27, 2016, we acquired an additional 14.4% ownership interest in PTL from subsidiaries of GE Capital Global Holdings, LLC (collectively, “GE Capital”) for approximately $498.5 million in cash to bring our ownership interest to 23.4%. Prior to this acquisition, we held a 9.0% ownership interest in PTL. On September 7, 2017, we acquired an additional 5.5% ownership interest from GE Capital for approximately $239.1 million in cash. At the same time, affiliates of Mitsui & Co., Ltd. (“Mitsui”), our second largest shareholder, acquired an additional 10.0% ownership interest in PTL at the same valuation. PTL is currently owned 41.1% by Penske Corporation, 28.9% by us, and 30.0% by Mitsui. GE Capital no longer owns any ownership interests in PTL. We account for our investment in PTL under the equity method, and we therefore record our share of PTL’s earnings on our statements of income under the caption “Equity in earnings of affiliates,” which also includes the results of our other equity method investments.
Outlook
Please see the discussion provided under “Outlook” in Part I, Item 1 for a discussion of our outlook in our markets.
Operating Overview
Automotive and commercial truck dealerships represent the majority of our results of operations. New and used vehicle revenues include sales to retail customers and to leasing companies providing consumer leasing. We generate finance and insurance revenues from sales of third-party extended service contracts, sales of third-party insurance policies, commissions relating to the sale of finance and lease contracts to third parties, and the sales of certain other products. Service and parts revenues include fees paid by customers for repair, maintenance and collision services, and the sale of replacement parts and other aftermarket accessories, as well as warranty repairs that are reimbursed directly by various OEMs.
Our gross profit tends to vary with the mix of revenues we derive from the sale of new vehicles, used vehicles, finance and insurance products, and service and parts transactions. Our gross profit varies across product lines, with vehicle sales usually resulting in lower gross profit margins and our other revenues resulting in higher gross profit margins. Factors such as inventory and vehicle availability, customer demand, consumer confidence, unemployment, general economic conditions, seasonality, weather, credit availability, fuel prices and manufacturers’ advertising and incentives also impact the mix of our revenues, and therefore influence our gross profit margin.
35
The results of our commercial vehicle distribution business in Australia and New Zealand are principally driven by the number and types of products and vehicles ordered by our customers.
Aggregate revenue and gross profit increased $1,268.4 million, or 6.3%, and $255.9 million, or 8.6%, respectively, during 2017 compared to 2016. The increases are largely attributable to increases in used vehicle, finance and insurance, and service and parts revenue and gross profit from net dealership acquisitions.
As exchange rates fluctuate, our revenue and results of operations as reported in U.S. Dollars fluctuate. For example, if the British Pound were to weaken against the U.S. Dollar, our U.K. results of operations would translate into less U.S. Dollar reported results. The British Pound weakened against the U.S. Dollar during 2017 compared to 2016, which negatively impacted our reported results of operations. On June 23, 2016, the United Kingdom held a referendum in which a majority voted to exit the European Union (“Brexit vote”). The British Pound has weakened since the Brexit vote, with an average exchange rate of British Pounds to U.S. Dollars of 1.29 for 2017 compared to 1.36 in 2016, a decrease of 5.1%. Foreign currency average rate reductions decreased revenue and gross profit by $314.7 million and $39.6 million, respectively, in 2017. Foreign currency average rate reductions also reduced earnings per share from continuing operations by approximately $0.08 per share in 2017. Excluding the impact of foreign currency average rate reductions, revenue and gross profit increased 7.9% and 10.0%, respectively, in 2017.
Our selling expenses consist of advertising and compensation for sales personnel, including commissions and related bonuses. General and administrative expenses include compensation for administration, finance, legal and general management personnel, rent, insurance, utilities and other expenses. As the majority of our selling expenses are variable, and we believe a significant portion of our general and administrative expenses are subject to our control, we believe our expenses can be adjusted over time to reflect economic trends.
Floor plan interest expense relates to financing incurred in connection with the acquisition of new and used vehicle inventories that is secured by those vehicles. Other interest expense consists of interest charges on all of our interest-bearing debt, other than interest relating to floor plan financing, and includes interest relating to our retail commercial truck dealership and commercial vehicle distribution operations. The cost of our variable rate indebtedness is based on the prime rate, defined London Interbank Offered Rate (“LIBOR”), the Bank of England Base Rate, the Finance House Base Rate, the Euro Interbank Offered Rate, the Canadian Prime Rate, the Australian Bank Bill Swap Rate, or the New Zealand Bank Bill Benchmark Rate.
Equity in earnings of affiliates represents our share of the earnings from our investments in joint ventures and other non-consolidated investments, including PTL.
During the first quarter of 2015, we divested our car rental business that included Hertz car rental franchises in the Memphis, Tennessee market and certain markets throughout Indiana in light of our perceived inability to grow that business. The results of operations of our car rental business are included in discontinued operations for the year ended December 31, 2015.
The future success of our business is dependent upon, among other things, general economic and industry conditions; our ability to consummate and integrate acquisitions; the level of vehicle sales in the markets where we operate; our ability to increase sales of higher margin products, especially service and parts sales; our ability to realize returns on our significant capital investment in new and upgraded dealership facilities; the success of our distribution of commercial vehicles, engines, and power systems; and the return realized from our investments in various joint ventures and other non-consolidated investments. See Item 1A. “Risk Factors” and “Forward-Looking Statements” below.
Critical Accounting Policies and Estimates
The preparation of financial statements in accordance with accounting principles generally accepted in the United States of America requires the application of accounting policies that often involve making estimates and employing judgments. Such judgments influence the assets, liabilities, revenues and expenses recognized in our financial statements. Management, on an ongoing basis, reviews these estimates and assumptions. Management may determine that modifications in assumptions and estimates are required, which may result in a material change in our results of operations or financial position.
36
The following are the accounting policies applied in the preparation of our financial statements that management believes are most dependent upon the use of estimates and assumptions.
Revenue Recognition
Dealership Vehicle, Parts and Service Sales. We record revenue for vehicle sales when vehicles are delivered, which is when the transfer of title and risks and rewards of ownership are considered passed to the customer. We record revenue for service or repair work when the work is completed, and record parts sales when parts are delivered to our customers. Sales promotions that we offer to customers are accounted for as a reduction of revenues at the time of sale. Rebates and other incentives offered directly to us by manufacturers are recognized as a reduction of cost of sales. Reimbursements of qualified advertising expenses are treated as a reduction of selling, general and administrative expenses. The amounts received under certain manufacturer rebate and incentive programs are based on the attainment of program objectives, and such earnings are recognized either upon the sale of the vehicle for which the award was received, or upon attainment of the particular program goals if not associated with individual vehicles. Taxes collected from customers and remitted to governmental authorities are recorded on a net basis (excluded from revenue). During 2017, 2016, and 2015, we earned $693.9 million, $654.9 million, and $628.9 million, respectively, of rebates, incentives and reimbursements from manufacturers, of which $675.3 million, $638.2 million, and $611.7 million, respectively, was recorded as a reduction of cost of sales. The remaining $18.6 million, $16.7 million, and $17.2 million, was recorded as a reduction of selling, general and administrative expenses during 2017, 2016, and 2015, respectively.
Dealership Finance and Insurance Sales. Subsequent to the sale of a vehicle to a customer, we sell installment sale contracts to various financial institutions on a non-recourse basis (with specified exceptions) to mitigate the risk of default. We receive a commission from the lender equal to either the difference between the interest rate charged to the customer and the interest rate set by the financing institution or a flat fee. We also receive commissions for facilitating the sale of various products to customers, including guaranteed vehicle protection insurance, vehicle theft protection and extended service contracts. These commissions are recorded as revenue at the time the customer enters into the contract. In the case of finance contracts, a customer may prepay or fail to pay their contract, thereby terminating the contract. Customers may also terminate extended service contracts and other insurance products, which are fully paid at purchase, and become eligible for refunds of unused premiums. In these circumstances, a portion of the commissions we received may be charged back based on the terms of the contracts. The revenue we record relating to these transactions is net of an estimate of the amount of chargebacks we will be required to pay. Our estimate is based upon our historical experience with similar contracts, including the impact of refinance and default rates on retail finance contracts and cancellation rates on extended service contracts and other insurance products. Aggregate reserves relating to chargeback activity were $24.9 million and $23.5 million as of December 31, 2017 and 2016, respectively.
Commercial Vehicle Distribution. We record revenue from the distribution of vehicles, engines, and products when the goods are delivered, which is when the transfer of title and risks and rewards of ownership are considered passed to the customer. We record revenue for service or repair work when the work is completed, and record parts sales when parts are delivered to our customers. For our long-term power generation contracts, we record revenue as services are provided in accordance with contract milestones.
Impairment Testing
Other indefinite-lived intangible assets are assessed for impairment annually on October 1 and upon the occurrence of an indicator of impairment through a comparison of its carrying amount and estimated fair value. An indicator of impairment exists if the carrying value exceeds its estimated fair value and an impairment loss may be recognized up to that excess. The fair value is determined using a discounted cash flow approach, which includes assumptions about revenue and profitability growth, profit margins, and the cost of capital. We also evaluate in connection with the annual impairment testing whether events and circumstances continue to support our assessment that the other indefinite-lived intangible assets continue to have an indefinite life.
Goodwill impairment is assessed at the reporting unit level annually on October 1 and upon the occurrence of an indicator of impairment. Our operations are organized by management into operating segments by line of business and geography. We have determined that we have four reportable segments as defined in generally accepted accounting
37
principles for segment reporting: (i) Retail Automotive, consisting of our retail automotive dealership operations; (ii) Retail Commercial Truck, consisting of our retail commercial truck dealership operations in the U.S. and Canada; (iii) Other, consisting of our commercial vehicle and power systems distribution operations and other non-automotive consolidated operations; and (iv) Non-Automotive Investments, consisting of our equity method investments in non-automotive operations. We have determined that the dealerships in each of our operating segments within the Retail Automotive reportable segment are components that are aggregated into six reporting units for the purpose of goodwill impairment testing, as they (A) have similar economic characteristics (all are automotive dealerships having similar margins), (B) offer similar products and services (all sell new and/or used vehicles, service, parts and third-party finance and insurance products), (C) have similar target markets and customers (generally individuals), and (D) have similar distribution and marketing practices (all distribute products and services through dealership facilities that market to customers in similar fashions). The reporting units are Eastern, Central, and Western United States, CarSense, International, and CarShop. Our Retail Commercial Truck reportable segment has been determined to represent one operating segment and reporting unit. The goodwill included in our Other reportable segment relates primarily to our commercial vehicle distribution operating segment. There is no goodwill recorded in our Non-Automotive Investments reportable segment.
For our Retail Automotive, Retail Commercial Truck, and Other reporting units, we prepared a quantitative assessment of the carrying value of goodwill. We estimated the fair value of our reporting units using an “income” valuation approach. The “income” valuation approach estimates our enterprise value using a net present value model, which discounts projected free cash flows of our business using the weighted average cost of capital as the discount rate. In connection with this process, we also reconcile the estimated aggregate fair values of our reporting units to our market capitalization. We believe this reconciliation process is consistent with a market participant perspective. This consideration would also include a control premium that represents the estimated amount an investor would pay for our equity securities to obtain a controlling interest, and other significant assumptions including revenue and profitability growth, franchise profit margins, residual values and the cost of capital. We concluded that the fair value of each of these reporting units exceeded its carrying value.
Investments
We account for each of our investments under the equity method, pursuant to which we record our proportionate share of the investee’s income each period. The net book value of our investments was $1,256.6 million and $893.4 million as of December 31, 2017 and 2016, respectively, including $1,185.6 million and $823.8 million relating to PTL as of December 31, 2017 and 2016, respectively. In July 2016, we increased our ownership interest in PTL from 9.0% to 23.4% as a result of our acquisition of an additional 14.4% ownership interest, and in September 2017, we acquired an additional 5.5% ownership interest, as discussed previously. We currently hold a 28.9% ownership interest in PTL.
Investments for which there is not a liquid, actively traded market are reviewed periodically by management for indicators of impairment. If an indicator of impairment is identified, management estimates the fair value of the investment using a discounted cash flow approach, which includes assumptions relating to revenue and profitability growth, profit margins, residual values, and our cost of capital. Declines in investment values that are deemed to be other than temporary may result in an impairment charge reducing the investments’ carrying value to fair value.
Self-Insurance
We retain risk relating to certain of our general liability insurance, workers’ compensation insurance, vehicle physical damage insurance, property insurance, employment practices liability insurance, directors and officers insurance, and employee medical benefits in the U.S. As a result, we are likely to be responsible for a significant portion of the claims and losses incurred under these programs. The amount of risk we retain varies by program, and for certain exposures, we have pre-determined maximum loss limits for certain individual claims and/or insurance periods. Losses, if any, above the pre-determined loss limits are paid by third-party insurance carriers. Certain insurers have limited available property coverage in response to the natural catastrophes experienced in recent years. Our estimate of future losses is prepared by management using our historical loss experience and industry-based development factors. Aggregate reserves relating to retained risk were $30.3 million and $28.3 million as of December 31, 2017 and 2016, respectively.
38
Income Taxes
Tax regulations may require items to be included in our tax returns at different times than the items are reflected in our financial statements. Some of these differences are permanent, such as expenses that are not deductible on our tax return, and some are temporary differences, such as the timing of depreciation expense. Temporary differences create deferred tax assets and liabilities. Deferred tax assets generally represent items that will be used as a tax deduction or credit in our tax returns in future years which we have already recorded in our financial statements. Deferred tax liabilities generally represent deductions taken on our tax returns that have not yet been recognized as expense in our financial statements. We establish valuation allowances for our deferred tax assets if the amount of expected future taxable income is not likely to allow for the use of the deduction or credit.
On December 22, 2017, the President of the United States signed into law P.L. 115-97, commonly referred to as the U.S. Tax Cuts and Jobs Act (the “Act”). The Act modifies several provisions of the Internal Revenue Code related to corporations, including a permanent corporate income tax rate reduction from 35% to 21%, effective January 1, 2018. The Act also significantly changes international tax laws for tax years beginning after December 31, 2017 and requires a one-time mandatory deemed repatriation of all cumulative post-1986 foreign earnings and profits of a U.S. shareholder’s foreign subsidiaries, effective in 2017, the year of enactment.
Refer to the disclosures provided in Part II, Item 8, Note 16 of the Notes to our Consolidated Financial Statements for additional detail on our accounting for income taxes, including additional discussion on the enactment of the Act and the resulting impact on our 2017 financial statements.
Classification in Continuing and Discontinued Operations
We classify the results of our operations in our consolidated financial statements based on generally accepted accounting principles relating to discontinued operations, which requires judgments, including whether a business will be divested, the period required to complete the divestiture, the likelihood of changes to the divestiture plans, and whether the divestiture represents a strategic shift that has, or will have, a major impact on our operations. If we determine that a business should be either reclassified from continuing operations to discontinued operations or from discontinued operations to continuing operations, our consolidated financial statements for prior periods are revised to reflect such reclassification. Refer to the disclosures provided in Part II, Item 8, Note 4 of the Notes to our Consolidated Financial Statements for a detailed description of the factors we consider for classification in discontinued operations.
Recent Accounting Pronouncements
Please see the disclosures provided under “Recent Accounting Pronouncements” in Part II, Item 8, Note 1 of the Notes to our Consolidated Financial Statements set forth below which are incorporated by reference herein.
Results of Operations
The following tables present comparative financial data relating to our operating performance in the aggregate and on a “same-store” basis. Dealership results are included in same-store comparisons when we have consolidated the acquired entity during the entirety of both periods being compared. As an example, if a dealership were acquired on January 15, 2015, the results of the acquired entity would be included in annual same-store comparisons beginning with the year ended December 31, 2017 and in quarterly same-store comparisons beginning with the quarter ended June 30, 2016.
39
Retail Automotive Dealership New Vehicle Data
(In millions, except unit and per unit amounts)
|
|
|
|
|
|
|
|
|
2017 vs. 2016 |
|
|
|
|
|
|
|
|
2016 vs. 2015 |
|
||||||
|
New Vehicle Data |
|
2017 |
|
2016 |
|
Change |
|
% Change |
|
|
2016 |
|
2015 |
|
Change |
|
% Change |
|
||||||
|
New retail unit sales |
|
|
248,774 |
|
|
249,695 |
|
|
(921) |
|
(0.4) |
% |
|
|
249,695 |
|
|
233,524 |
|
|
16,171 |
|
6.9 |
% |
|
Same-store new retail unit sales |
|
|
231,458 |
|
|
241,680 |
|
|
(10,222) |
|
(4.2) |
% |
|
|
229,401 |
|
|
227,138 |
|
|
2,263 |
|
1.0 |
% |
|
New retail sales revenue |
|
$ |
9,678.5 |
|
$ |
9,547.1 |
|
$ |
131.4 |
|
1.4 |
% |
|
$ |
9,547.1 |
|
$ |
9,208.9 |
|
$ |
338.2 |
|
3.7 |
% |
|
Same-store new retail sales revenue |
|
$ |
8,980.1 |
|
$ |
9,272.5 |
|
$ |
(292.4) |
|
(3.2) |
% |
|
$ |
8,941.3 |
|
$ |
9,065.5 |
|
$ |
(124.2) |
|
(1.4) |
% |
|
New retail sales revenue per unit |
|
$ |
38,905 |
|
$ |
38,235 |
|
$ |
670 |
|
1.8 |
% |
|
$ |
38,235 |
|
$ |
39,434 |
|
$ |
(1,199) |
|
(3.0) |
% |
|
Same-store new retail sales revenue per unit |
|
$ |
38,798 |
|
$ |
38,367 |
|
$ |
431 |
|
1.1 |
% |
|
$ |
38,977 |
|
$ |
39,912 |
|
$ |
(935) |
|
(2.3) |
% |
|
Gross profit — new |
|
$ |
746.2 |
|
$ |
733.8 |
|
$ |
12.4 |
|
1.7 |
% |
|
$ |
733.8 |
|
$ |
706.9 |
|
$ |
26.9 |
|
3.8 |
% |
|
Same-store gross profit — new |
|
$ |
685.5 |
|
$ |
710.3 |
|
$ |
(24.8) |
|
(3.5) |
% |
|
$ |
662.9 |
|
$ |
685.9 |
|
$ |
(23.0) |
|
(3.4) |
% |
|
Average gross profit per new vehicle retailed |
|
$ |
2,999 |
|
$ |
2,939 |
|
$ |
60 |
|
2.0 |
% |
|
$ |
2,939 |
|
$ |
3,027 |
|
$ |
(88) |
|
(2.9) |
% |
|
Same-store average gross profit per new vehicle retailed |
|
$ |
2,962 |
|
$ |
2,939 |
|
$ |
23 |
|
0.8 |
% |
|
$ |
2,890 |
|
$ |
3,020 |
|
$ |
(130) |
|
(4.3) |
% |
|
Gross margin % — new |
|
|
7.7 |
% |
|
7.7 |
% |
|
— |
% |
— |
% |
|
|
7.7 |
% |
|
7.7 |
% |
|
— |
% |
— |
% |
|
Same-store gross margin % — new |
|
|
7.6 |
% |
|
7.7 |
% |
|
(0.1) |
% |
(1.3) |
% |
|
|
7.4 |
% |
|
7.6 |
% |
|
(0.2) |
% |
(2.6) |
% |
Units
Retail unit sales of new vehicles decreased from 2016 to 2017 due to a 10,222 unit, or 4.2%, decrease in same-store new retail unit sales, offset by a 9,301 unit increase from net dealership acquisitions. New units decreased 1.7% in the U.S. and increased 1.8% internationally. Same-store units decreased 3.3% in the U.S., primarily due to a decrease in premium and domestic brand sales. Same-store units decreased 5.8% internationally, primarily due to a decline in unit sales in Germany that offset the strength of unit sales in the U.K.
While new vehicle unit sales declined in 2017, our premium brand sales, particularly in the U.K., are being positively impacted by low levels of unemployment, strong credit availability, and vehicle innovation through the introduction of new models and evolving technology.
The increase from 2015 to 2016 is due to a 13,908 unit increase from net dealership acquisitions, coupled with a 2,263 unit, or 1.0%, increase in same-store new retail unit sales during the year. New units decreased 0.5% in the U.S. and increased 21.4% internationally. New units increased internationally primarily due to inclusion of our German automotive dealership joint venture which we began consolidating during the third quarter of 2015, as well as due to the strong performance of our U.K. business, which experienced a 7.4% increase in same-store new unit sales. The same-store unit decrease in the U.S. was driven primarily by an increased focus on improvements to gross profit, which negatively impacted unit sales. Overall, same-store units increased 7.4% internationally and decreased 2.1% in the U.S.
Revenues
New vehicle retail sales revenue increased from 2016 to 2017 due to a $423.8 million increase from net dealership acquisitions, offset by a $292.4 million, or 3.2%, decrease in same-store revenues. Excluding $158.8 million of negative foreign currency fluctuations, same-store new retail revenue decreased 1.4%. The same-store revenue decrease is due to a decrease in same-store new retail unit sales, which decreased revenue by $392.2 million, offset by the $431 per unit increase in comparative average selling prices per unit (offset by a $686 per unit decrease attributable to negative foreign currency fluctuations), which increased revenue by $99.8 million.
40
The increase from 2015 to 2016 is due to a $462.4 million increase from net dealership acquisitions, offset by a $124.2 million, or 1.4%, decrease in same-store revenues. Excluding $364.0 million of negative foreign currency fluctuations, same-store new retail revenue increased 2.6%. The same-store revenue decrease is due to the $935 per unit decrease in comparative average selling prices per unit (including a $1,586 per unit decrease attributable to negative foreign currency fluctuations), which decreased revenue by $212.4 million, offset by an increase in same-store new retail unit sales, which increased revenue by $88.2 million.
Gross Profit
Retail gross profit from new vehicle sales increased from 2016 to 2017 due to a $37.2 million increase from net dealership acquisitions, offset by a $24.8 million, or 3.5%, decrease in same-store gross profit during the year. Excluding $12.3 million of negative foreign currency fluctuations, same-store gross profit decreased 1.8%. The decrease in same-store gross profit is due to a decrease in same-store new retail unit sales, which decreased gross profit by $30.1 million, offset by a $23 per unit increase in the average gross profit per new vehicle retailed (offset by a $53 per unit decrease attributable to negative foreign currency fluctuations), which increased gross profit by $5.3 million.
The increase from 2015 to 2016 is due to a $49.9 million increase from net dealership acquisitions, offset by a $23.0 million, or 3.4%, decrease in same-store gross profit during the year. Excluding $30.3 million of negative foreign currency fluctuations, same-store gross profit increased 1.1%. The decrease in same-store gross profit is due to a $130 per unit decrease in the average gross profit per new vehicle retailed (including a $132 per unit decrease attributable to negative foreign currency fluctuations), which decreased gross profit by $29.5 million, offset by the increase in same-store new retail unit sales, which increased gross profit by $6.5 million.
Retail Automotive Dealership Used Vehicle Data
(In millions, except unit and per unit amounts)
|
|
|
|
|
|
|
|
|
2017 vs. 2016 |
|
|
|
|
|
|
|
|
2016 vs. 2015 |
|
||||||
|
Used Vehicle Data |
|
2017 |
|
2016 |
|
Change |
|
% Change |
|
|
2016 |
|
2015 |
|
Change |
|
% Change |
|
||||||
|
Used retail unit sales |
|
|
252,922 |
|
|
207,556 |
|
|
45,366 |
|
21.9 |
% |
|
|
207,556 |
|
|
198,459 |
|
|
9,097 |
|
4.6 |
% |
|
Same-store used retail unit sales |
|
|
201,283 |
|
|
202,463 |
|
|
(1,180) |
|
(0.6) |
% |
|
|
191,234 |
|
|
192,093 |
|
|
(859) |
|
(0.4) |
% |
|
Used retail sales revenue |
|
$ |
6,386.8 |
|
$ |
5,663.7 |
|
$ |
723.1 |
|
12.8 |
% |
|
$ |
5,663.7 |
|
$ |
5,425.5 |
|
$ |
238.2 |
|
4.4 |
% |
|
Same-store used retail sales revenue |
|
$ |
5,502.7 |
|
$ |
5,536.3 |
|
$ |
(33.6) |
|
(0.6) |
% |
|
$ |
5,267.0 |
|
$ |
5,295.7 |
|
$ |
(28.7) |
|
(0.5) |
% |
|
Used retail sales revenue per unit |
|
$ |
25,252 |
|
$ |
27,287 |
|
$ |
(2,035) |
|
(7.5) |
% |
|
$ |
27,287 |
|
$ |
27,338 |
|
$ |
(51) |
|
(0.2) |
% |
|
Same-store used retail sales revenue per unit |
|
$ |
27,338 |
|
$ |
27,345 |
|
$ |
(7) |
|
(0.0) |
% |
|
$ |
27,542 |
|
$ |
27,568 |
|
$ |
(26) |
|
(0.1) |
% |
|
Gross profit — used |
|
$ |
358.0 |
|
$ |
330.5 |
|
$ |
27.5 |
|
8.3 |
% |
|
$ |
330.5 |
|
$ |
328.3 |
|
$ |
2.2 |
|
0.7 |
% |
|
Same-store gross profit — used |
|
$ |
297.2 |
|
$ |
324.1 |
|
$ |
(26.9) |
|
(8.3) |
% |
|
$ |
310.2 |
|
$ |
325.9 |
|
$ |
(15.7) |
|
(4.8) |
% |
|
Average gross profit per used vehicle retailed |
|
$ |
1,415 |
|
$ |
1,592 |
|
$ |
(177) |
|
(11.1) |
% |
|
$ |
1,592 |
|
$ |
1,654 |
|
$ |
(62) |
|
(3.7) |
% |
|
Same-store average gross profit per used vehicle retailed |
|
$ |
1,476 |
|
$ |
1,601 |
|
$ |
(125) |
|
(7.8) |
% |
|
$ |
1,622 |
|
$ |
1,696 |
|
$ |
(74) |
|
(4.4) |
% |
|
Gross margin % — used |
|
|
5.6 |
% |
|
5.8 |
% |
|
(0.2) |
% |
(3.4) |
% |
|
|
5.8 |
% |
|
6.1 |
% |
|
(0.3) |
% |
(4.9) |
% |
|
Same-store gross margin % — used |
|
|
5.4 |
% |
|
5.9 |
% |
|
(0.5) |
% |
(8.5) |
% |
|
|
5.9 |
% |
|
6.2 |
% |
|
(0.3) |
% |
(4.8) |
% |
Units
Retail unit sales of used vehicles increased from 2016 to 2017 due to a 46,546 unit increase from net dealership acquisitions, offset by a 1,180 unit, or 0.6%, decrease in same-store retail unit sales. Used units increased 38.9% internationally and increased 9.9% in the U.S. These increases are primarily due to our 2017 acquisitions of the stand-alone used vehicle dealerships in the U.S. and the U.K., CarSense and CarShop, respectively. Same-store used units increased 1.7% internationally and decreased 2.1% in the U.S.
41
Overall, we believe our used vehicle sales are being positively impacted by our 2017 acquisitions of our stand-alone used vehicle dealerships and strength in the used vehicle market due to an increase in lease returns, providing customers with an additional supply of affordable late model, low mileage vehicles from which to choose.
The increase from 2015 to 2016 is due to a 9,956 unit increase from net dealership acquisitions, offset by an 859 unit, or 0.4%, decrease in same-store retail unit sales. Used units increased 14.7% internationally and decreased 1.5% in the U.S. Used units increased internationally primarily due to inclusion of our German automotive dealership joint venture which we began consolidating during the third quarter of 2015. Same-store units increased 3.4% internationally and decreased 2.6% in the U.S. The international same-store unit increase was driven primarily by an increase in premium brands internationally, while the same-store unit decrease in the U.S. was driven primarily by an increased focus on improvements to gross profit, which negatively impacted unit sales.
Revenues
Used vehicle retail sales revenue increased from 2016 to 2017 due to a $756.7 million increase from net dealership acquisitions, offset by a $33.6 million, or 0.6%, decrease in same-store revenues. Excluding $127.7 million of negative foreign currency fluctuations, same-store used retail revenue increased 1.7%. The same-store revenue decrease is due to the decrease in same-store used retail unit sales, which decreased revenue by $32.2 million, coupled with a $7 per unit decrease in comparative average selling prices (including a $634 per unit decrease attributable to negative foreign currency fluctuations), which decreased revenue by $1.4 million. Used retail sales revenue per unit was also negatively impacted by lower selling prices from our stand-alone used vehicle dealerships in the U.S. and the U.K., which reduced used retail sales revenue per unit by $2,046.
The increase from 2015 to 2016 is due to a $266.9 million increase from net dealership acquisitions, offset by a $28.7 million, or 0.5%, decrease in same-store revenues. Excluding $295.9 million of negative foreign currency fluctuations, same-store used retail revenue increased 5.0%. The same-store revenue decrease is due to the decrease in same-store used retail unit sales, which decreased revenue by $23.7 million, coupled with a $26 per unit decrease in comparative average selling prices (including a $1,548 per unit decrease attributable to negative foreign currency fluctuations), which decreased revenue by $5.0 million.
Gross Profit
Retail gross profit from used vehicle sales increased from 2016 to 2017 due to a $54.4 million increase from net dealership acquisitions, offset by a $26.9 million, or 8.3%, decrease in same-store gross profit. Excluding $6.8 million of negative foreign currency fluctuations, same-store gross profit decreased 6.2%. The decrease in same-store gross profit is due to a $125 per unit decrease in average gross profit per used vehicle retailed (including a $34 per unit decrease attributable to negative foreign currency fluctuations), which decreased gross profit by $25.1 million, coupled with the decrease in same-store used retail unit sales, which decreased gross profit by $1.8 million. Used average gross profit per unit was also negatively impacted by lower margins from our stand-alone used vehicle dealerships in the U.S. and the U.K., which reduced used average gross profit per unit by $53.
The increase from 2015 to 2016 is due to a $17.9 million increase from net dealership acquisitions, offset by a $15.7 million, or 4.8%, decrease in same-store gross profit. Excluding $14.1 million of negative foreign currency fluctuations, same-store gross profit decreased 0.5%. The decrease in same-store gross profit is due to a $74 per unit decrease in average gross profit per used vehicle retailed (including a $74 per unit decrease attributable to negative foreign currency fluctuations), which decreased gross profit by $14.2 million, coupled with the decrease in same-store used retail unit sales, which decreased gross profit by $1.5 million.
42
Retail Automotive Dealership Finance and Insurance Data
(In millions, except unit and per unit amounts)
|
|
|
|
|
|
|
|
|
2017 vs. 2016 |
|
|
|
|
|
|
|
|
2016 vs. 2015 |
|
||||||
|
Finance and Insurance Data |
|
2017 |
|
2016 |
|
Change |
|
% Change |
|
|
2016 |
|
2015 |
|
Change |
|
% Change |
|
||||||
|
Total retail unit sales |
|
|
501,696 |
|
|
457,251 |
|
|
44,445 |
|
9.7 |
% |
|
|
457,251 |
|
|
431,983 |
|
|
25,268 |
|
5.8 |
% |
|
Total same-store retail unit sales |
|
|
432,741 |
|
|
444,143 |
|
|
(11,402) |
|
(2.6) |
% |
|
|
420,635 |
|
|
419,231 |
|
|
1,404 |
|
0.3 |
% |
|
Finance and insurance revenue |
|
$ |
581.8 |
|
$ |
495.0 |
|
$ |
86.8 |
|
17.5 |
% |
|
$ |
495.0 |
|
$ |
478.3 |
|
$ |
16.7 |
|
3.5 |
% |
|
Same-store finance and insurance revenue |
|
$ |
508.3 |
|
$ |
484.5 |
|
$ |
23.8 |
|
4.9 |
% |
|
$ |
483.8 |
|
$ |
476.3 |
|
$ |
7.5 |
|
1.6 |
% |
|
Finance and insurance revenue per unit |
|
$ |
1,160 |
|
$ |
1,082 |
|
$ |
78 |
|
7.2 |
% |
|
$ |
1,082 |
|
$ |
1,107 |
|
$ |
(25) |
|
(2.3) |
% |
|
Same-store finance and insurance revenue per unit |
|
$ |
1,175 |
|
$ |
1,091 |
|
$ |
84 |
|
7.7 |
% |
|
$ |
1,150 |
|
$ |
1,136 |
|
$ |
14 |
|
1.2 |
% |
Finance and insurance revenue increased from 2016 to 2017 due to a $63.0 million increase from net dealership acquisitions, coupled with a $23.8 million, or 4.9%, increase in same-store revenues. Excluding $10.0 million of negative foreign currency fluctuations, same-store finance and insurance revenue increased 7.0%. The same-store revenue increase is due to an $84 per unit increase in comparative average selling prices per unit (offset by a $23 per unit decrease attributable to negative foreign currency fluctuations), which increased revenue by $36.3 million, offset by a decrease in same-store retail unit sales, which decreased revenue by $12.5 million. We believe the increase in same-store finance and insurance revenue per unit, particularly in the U.S., is primarily due to our efforts to increase finance and insurance revenue, which include adding resources to target underperforming locations and drive additional training, product penetration, and changes to product portfolios.
The increase from 2015 to 2016 is due to a $9.2 million increase from net dealership acquisitions, coupled with a $7.5 million, or 1.6%, increase in same-store revenues. Excluding $21.7 million of negative foreign currency fluctuations, same-store finance and insurance revenue increased 6.1%. The same-store revenue increase is due to an increase in comparative average selling prices per unit, which increased revenue by $5.9 million, coupled with the increase in same-store retail unit sales, which increased revenue by $1.6 million. Finance and insurance revenue per unit decreased due to a $97 per unit decrease internationally (including a $49 per unit decrease attributable to negative foreign currency fluctuations), as well as due to inclusion of our German automotive dealership joint venture which we began consolidating during the third quarter of 2015. This decrease is offset by an increase in finance and insurance revenue per unit in the U.S., which increased 2.4% to $1,150 per unit.
Retail Automotive Dealership Service and Parts Data
(In millions)
|
|
|
|
|
|
|
|
|
2017 vs. 2016 |
|
|
|
|
|
|
|
|
2016 vs. 2015 |
|
||||||
|
Service and Parts Data |
|
2017 |
|
2016 |
|
Change |
|
% Change |
|
|
2016 |
|
2015 |
|
Change |
|
% Change |
|
||||||
|
Service and parts revenue |
|
$ |
2,057.5 |
|
$ |
1,948.6 |
|
$ |
108.9 |
|
5.6 |
% |
|
$ |
1,948.6 |
|
$ |
1,830.7 |
|
$ |
117.9 |
|
6.4 |
% |
|
Same-store service and parts revenue |
|
$ |
1,950.5 |
|
$ |
1,919.0 |
|
$ |
31.5 |
|
1.6 |
% |
|
$ |
1,830.3 |
|
$ |
1,790.8 |
|
$ |
39.5 |
|
2.2 |
% |
|
Gross profit — service and parts |
|
$ |
1,219.7 |
|
$ |
1,129.7 |
|
$ |
90.0 |
|
8.0 |
% |
|
$ |
1,129.7 |
|
$ |
1,084.0 |
|
$ |
45.7 |
|
4.2 |
% |
|
Same-store service and parts gross profit |
|
$ |
1,148.1 |
|
$ |
1,112.1 |
|
$ |
36.0 |
|
3.2 |
% |
|
$ |
1,073.9 |
|
$ |
1,068.9 |
|
$ |
5.0 |
|
0.5 |
% |
|
Gross margin % — service and parts |
|
|
59.3 |
% |
|
58.0 |
% |
|
1.3 |
% |
2.2 |
% |
|
|
58.0 |
% |
|
59.2 |
% |
|
(1.2) |
% |
(2.0) |
% |
|
Same-store service and parts gross margin % |
|
|
58.9 |
% |
|
58.0 |
% |
|
0.9 |
% |
1.6 |
% |
|
|
58.7 |
% |
|
59.7 |
% |
|
(1.0) |
% |
(1.7) |
% |
Revenues
Service and parts revenue increased from 2016 to 2017, including a 4.2% increase in the U.S. and an 8.7% increase internationally. The overall increase in service and parts revenue is due to a $77.4 million increase from net dealership acquisitions, coupled with a $31.5 million, or 1.6%, increase in same-store revenues during the year. Excluding $22.2 million of negative foreign currency fluctuations, same-store service and parts revenue increased 2.8%. The increase in
43
same-store revenue is due to a $37.6 million, or 8.2%, increase in warranty revenue, and a $0.6 million, or 0.4%, increase in vehicle preparation and body shop revenue, offset by a $6.7 million, or 0.5%, decrease in customer pay revenue.
The increase from 2015 to 2016 is due to a $78.4 million increase from net dealership acquisitions, coupled with a $39.5 million, or 2.2%, increase in same-store revenues during the year. Excluding $59.4 million of negative foreign currency fluctuations, same-store service and parts revenue increased 5.5%. The increase in same-store revenue is due to a $26.9 million, or 2.2%, increase in customer pay revenue, a $10.2 million, or 2.3%, increase in warranty revenue, and a $2.4 million, or 1.7%, increase in vehicle preparation and body shop revenue.
Gross Profit
Service and parts gross profit increased from 2016 to 2017 due to a $54.0 million increase from net dealership acquisitions, coupled with a $36.0 million, or 3.2%, increase in same-store gross profit during the year. Excluding $14.4 million of negative foreign currency fluctuations, same-store service and parts gross profit increased 4.5%. The same-store gross profit increase is due to the increase in same-store revenues, which increased gross profit by $18.6 million, coupled with a 0.9% increase in same-store gross margin, which increased gross profit by $17.4 million. The same-store gross profit increase is due to a $25.8 million, or 11.0%, increase in warranty gross profit, a $6.6 million, or 1.1%, increase in customer pay gross profit, and a $3.6 million, or 1.3%, increase in vehicle preparation and body shop gross profit.
The increase from 2015 to 2016 is due to a $40.7 million increase from net dealership acquisitions, coupled with a $5.0 million, or 0.5%, increase in same-store gross profit. Excluding $36.1 million of negative foreign currency fluctuations, same-store service and parts gross profit increased 3.8%. The same-store gross profit increase is due to the increase in same-store revenues, which increased gross profit by $23.2 million, offset by a 1.0% decrease in same-store gross margin, which decreased gross profit by $18.2 million. The same-store gross profit increase is due to a $2.2 million, or 0.9%, increase in vehicle preparation and body shop gross profit, a $2.0 million, or 0.9%, increase in warranty gross profit, and a $0.8 million, or 0.1%, increase in customer pay gross profit.
44
Retail Commercial Truck Dealership Data
(In millions, except unit and per unit amounts)
Premier Truck Group generated $1,048.0 million of revenue during 2017 compared to $1,000.7 million of revenue during 2016, an increase of 4.7%, and generated $165.8 million of gross profit during 2017 compared to $142.9 million of gross profit during 2016, an increase of 16.0%.
Premier Truck Group generated $1,000.7 million of revenue during 2016 compared to $944.1 million of revenue during 2015, an increase of 6.0%, and generated $142.9 million of gross profit during 2016 compared to $147.0 million of gross profit during 2015, a decrease of 2.8%.
|
|
|
|
|
|
|
|
|
2017 vs. 2016 |
|
|
|
|
|
|
|
|
2016 vs. 2015 |
|
||||||
|
New Commercial Truck Data |
|
2017 |
|
2016 |
|
Change |
|
% Change |
|
|
2016 |
|
2015 |
|
Change |
|
% Change |
|
||||||
|
New retail unit sales |
|
|
5,824 |
|
|
6,079 |
|
|
(255) |
|
(4.2) |
% |
|
|
6,079 |
|
|
5,864 |
|
|
215 |
|
3.7 |
% |
|
Same-store new retail unit sales |
|
|
4,781 |
|
|
5,245 |
|
|
(464) |
|
(8.8) |
% |
|
|
2,445 |
|
|
3,763 |
|
|
(1,318) |
|
(35.0) |
% |
|
New retail sales revenue |
|
$ |
613.2 |
|
$ |
625.5 |
|
$ |
(12.3) |
|
(2.0) |
% |
|
$ |
625.5 |
|
$ |
572.5 |
|
$ |
53.0 |
|
9.3 |
% |
|
Same-store new retail sales revenue |
|
$ |
491.7 |
|
$ |
534.6 |
|
$ |
(42.9) |
|
(8.0) |
% |
|
$ |
274.2 |
|
$ |
397.0 |
|
$ |
(122.8) |
|
(30.9) |
% |
|
New retail sales revenue per unit |
|
$ |
105,286 |
|
$ |
102,892 |
|
$ |
2,394 |
|
2.3 |
% |
|
$ |
102,892 |
|
$ |
97,629 |
|
$ |
5,263 |
|
5.4 |
% |
|
Same-store new retail sales revenue per unit |
|
$ |
102,851 |
|
$ |
101,920 |
|
$ |
931 |
|
0.9 |
% |
|
$ |
112,163 |
|
$ |
105,515 |
|
$ |
6,648 |
|
6.3 |
% |
|
Gross profit — new |
|
$ |
27.1 |
|
$ |
23.1 |
|
$ |
4.0 |
|
17.3 |
% |
|
$ |
23.1 |
|
$ |
26.8 |
|
$ |
(3.7) |
|
(13.8) |
% |
|
Same-store gross profit — new |
|
$ |
22.1 |
|
$ |
20.7 |
|
$ |
1.4 |
|
6.8 |
% |
|
$ |
12.9 |
|
$ |
21.4 |
|
$ |
(8.5) |
|
(39.7) |
% |
|
Average gross profit per new truck retailed |
|
$ |
4,615 |
|
$ |
3,808 |
|
$ |
807 |
|
21.2 |
% |
|
$ |
3,808 |
|
$ |
4,576 |
|
$ |
(768) |
|
(16.8) |
% |
|
Same-store average gross profit per new truck retailed |
|
$ |
4,625 |
|
$ |
3,946 |
|
$ |
679 |
|
17.2 |
% |
|
$ |
5,268 |
|
$ |
5,672 |
|
$ |
(404) |
|
(7.1) |
% |
|
Gross margin % — new |
|
|
4.4 |
% |
|
3.7 |
% |
|
0.7 |
% |
18.9 |
% |
|
|
3.7 |
% |
|
4.7 |
% |
|
(1.0) |
% |
(21.3) |
% |
|
Same-store gross margin % — new |
|
|
4.5 |
% |
|
3.9 |
% |
|
0.6 |
% |
15.4 |
% |
|
|
4.7 |
% |
|
5.4 |
% |
|
(0.7) |
% |
(13.0) |
% |
Units
Retail unit sales of new trucks decreased from 2016 to 2017 primarily due to a 464 unit decrease in same-store retail unit sales, offset by a 209 increase from net dealership acquisitions. Same-store new truck units decreased 8.8% from 2016 to 2017, primarily due to decline in North American Class 8 heavy-duty truck sales throughout the majority of 2017; however, year over year improvements in the Class 8 market occurred in the later months of 2017, which moderated the decrease in our retail new unit sales in 2017.
The increase from 2015 to 2016 is primarily due to a 1,533 unit increase from net dealership acquisitions, offset by a 1,318 unit decrease in same-store retail unit sales. Same-store new truck units decreased 35.0% from 2015 to 2016, as the North American Class 8 heavy-duty truck market declined by 19.4% during 2016 compared to 2015, due in part to excess fleet capacity and softer freight demand.
Revenues
New commercial truck retail sales revenue decreased from 2016 to 2017 due to a $42.9 million decrease in same-store revenues, offset by a $30.6 million increase from net dealership acquisitions. The same-store revenue decrease is due to the decrease in same-store new retail unit sales, which decreased revenue by $47.3 million, offset by a $931 per unit increase in comparative average selling prices, which increased revenue by $4.4 million.
The increase from 2015 to 2016 is due to a $175.8 million increase from net dealership acquisitions, offset by a $122.8 million decrease in same-store revenues. The same-store revenue decrease is due to the decrease in same-store new retail unit sales, which decreased revenue by $139.1 million, offset by a $6,648 per unit increase in comparative average selling prices, which increased revenue by $16.3 million.
Gross Profit
New commercial truck retail gross profit increased from 2016 to 2017 due to a $2.6 million increase from net dealership acquisitions, coupled with a $1.4 million increase in same-store gross profit. The increase in same-store gross
45
profit is due to a $679 per unit increase in average gross profit per new truck retailed, which increased gross profit by $3.2 million, offset by a decrease in same-store new retail unit sales, which decreased gross profit by $1.8 million.
The decrease from 2015 to 2016 is due to an $8.5 million decrease in same-store gross profit, offset by a $4.8 million increase from net dealership acquisitions. The decrease in same-store gross profit is due to the decrease in same-store new retail unit sales, which decreased gross profit by $7.5 million, coupled with a $404 per unit decrease in average gross profit per new truck retailed, which decreased gross profit by $1.0 million.
|
|
|
|
|
|
|
|
|
2017 vs. 2016 |
|
|
|
|
|
|
|
|
2016 vs. 2015 |
|
||||||
|
Used Commercial Truck Data |
|
2017 |
|
2016 |
|
Change |
|
% Change |
|
|
2016 |
|
2015 |
|
Change |
|
% Change |
|
||||||
|
Used retail unit sales |
|
|
1,632 |
|
|
1,031 |
|
|
601 |
|
58.3 |
% |
|
|
1,031 |
|
|
1,113 |
|
|
(82) |
|
(7.4) |
% |
|
Same-store used retail unit sales |
|
|
1,426 |
|
|
993 |
|
|
433 |
|
43.6 |
% |
|
|
880 |
|
|
1,044 |
|
|
(164) |
|
(15.7) |
% |
|
Used retail sales revenue |
|
$ |
89.4 |
|
$ |
51.8 |
|
$ |
37.6 |
|
72.6 |
% |
|
$ |
51.8 |
|
$ |
58.7 |
|
$ |
(6.9) |
|
(11.8) |
% |
|
Same-store used retail sales revenue |
|
$ |
79.9 |
|
$ |
50.2 |
|
$ |
29.7 |
|
59.2 |
% |
|
$ |
44.4 |
|
$ |
55.4 |
|
$ |
(11.0) |
|
(19.9) |
% |
|
Used retail sales revenue per unit |
|
$ |
54,808 |
|
$ |
50,276 |
|
$ |
4,532 |
|
9.0 |
% |
|
$ |
50,276 |
|
$ |
52,775 |
|
$ |
(2,499) |
|
(4.7) |
% |
|
Same-store used retail sales revenue per unit |
|
$ |
56,031 |
|
$ |
50,581 |
|
$ |
5,450 |
|
10.8 |
% |
|
$ |
50,443 |
|
$ |
53,027 |
|
$ |
(2,584) |
|
(4.9) |
% |
|
Gross profit — used |
|
$ |
8.7 |
|
$ |
(1.7) |
|
$ |
10.4 |
|
611.8 |
% |
|
$ |
(1.7) |
|
$ |
5.4 |
|
$ |
(7.1) |
|
(131.5) |
% |
|
Same-store gross profit — used |
|
$ |
8.2 |
|
$ |
(1.8) |
|
$ |
10.0 |
|
555.6 |
% |
|
$ |
(0.7) |
|
$ |
5.2 |
|
$ |
(5.9) |
|
(113.5) |
% |
|
Average gross profit per used truck retailed |
|
$ |
5,317 |
|
$ |
(1,626) |
|
$ |
6,943 |
|
427.0 |
% |
|
$ |
(1,626) |
|
$ |
4,810 |
|
$ |
(6,436) |
|
(133.8) |
% |
|
Same-store average gross profit per used truck retailed |
|
$ |
5,732 |
|
$ |
(1,842) |
|
$ |
7,574 |
|
411.2 |
% |
|
$ |
(829) |
|
$ |
4,975 |
|
$ |
(5,804) |
|
(116.7) |
% |
|
Gross margin % — used |
|
|
9.7 |
% |
|
(3.3) |
% |
|
13.0 |
% |
393.9 |
% |
|
|
(3.3) |
% |
|
9.2 |
% |
|
(12.5) |
% |
(135.9) |
% |
|
Same-store gross margin % — used |
|
|
10.3 |
% |
|
(3.6) |
% |
|
13.9 |
% |
386.1 |
% |
|
|
(1.6) |
% |
|
9.4 |
% |
|
(11.0) |
% |
(117.0) |
% |
Units
Retail unit sales of used trucks increased from 2016 to 2017 due to a 433 unit increase in same-store retail unit sales, coupled with a 168 unit increase from net dealership acquisitions. The overall increase from 2016 to 2017 is primarily due to a more stable used truck pricing environment due in part to a reduction in excess capacity in the market and our ability to proactively manage our used truck inventory through the purchase and sale of more desirable trucks.
The decrease from 2015 to 2016 is due to a 164 unit decrease in same-store retail unit sales, offset by an 82 unit increase from net dealership acquisitions. The overall decrease from 2015 to 2016 is primarily due to softer freight demand and the resulting de-fleeting occurring within the industry, resulting in reduced demand, prices, and gross profit.
Revenues
Used commercial truck retail sales revenue increased from 2016 to 2017 due to a $29.7 million increase in same-store revenues, coupled with a $7.9 million increase from net dealership acquisitions. The same-store revenue increase is due to the increase in same-store used retail unit sales, which increased revenue by $24.3 million, coupled with a $5,450 per unit increase in comparative average selling prices, which increased revenue by $5.4 million.
The decrease from 2015 to 2016 is due to an $11.0 million decrease in same-store revenues, offset by a $4.1 million increase from net dealership acquisitions. The same-store revenue decrease is due to the decrease in same-store used retail unit sales, which decreased revenue by $8.7 million, coupled with a $2,584 per unit decrease in comparative average selling prices, which decreased revenue by $2.3 million.
Gross Profit
Used commercial truck retail gross profit increased from 2016 to 2017 due to a $10.0 million increase in same-store gross profit, coupled with a $0.4 million increase from net dealership acquisitions. The increase in same-store gross profit is due to a $7,574 per unit increase in average gross profit per used truck retailed, which increased gross profit by $7.5 million, coupled with the increase in same-store used retail unit sales, which increased gross profit by $2.5 million.
The decrease from 2015 to 2016 is due to a $5.9 million decrease in same-store gross profit, coupled with a $1.2 million decrease from net dealership acquisitions. The decrease in same-store gross profit is due to a $5,804 per unit
46
decrease in average gross profit per used truck retailed, which decreased gross profit by $5.1 million, coupled with the decrease in same-store used retail unit sales, which decreased gross profit by $0.8 million.
|
|
|
|
|
|
|
|
|
2017 vs. 2016 |
|
|
|
|
|
|
|
|
2016 vs. 2015 |
|
||||||
|
Service and Parts Data |
|
2017 |
|
2016 |
|
Change |
|
% Change |
|
|
2016 |
|
2015 |
|
Change |
|
% Change |
|
||||||
|
Service and parts revenue |
|
$ |
325.6 |
|
$ |
306.0 |
|
$ |
19.6 |
|
6.4 |
% |
|
$ |
306.0 |
|
$ |
286.0 |
|
$ |
20.0 |
|
7.0 |
% |
|
Same-store service and parts revenue |
|
$ |
283.3 |
|
$ |
279.0 |
|
$ |
4.3 |
|
1.5 |
% |
|
$ |
214.7 |
|
$ |
221.2 |
|
$ |
(6.5) |
|
(2.9) |
% |
|
Gross profit — service and parts |
|
$ |
121.4 |
|
$ |
113.2 |
|
$ |
8.2 |
|
7.2 |
% |
|
$ |
113.2 |
|
$ |
105.5 |
|
$ |
7.7 |
|
7.3 |
% |
|
Same-store service and parts gross profit |
|
$ |
107.3 |
|
$ |
104.6 |
|
$ |
2.7 |
|
2.6 |
% |
|
$ |
86.4 |
|
$ |
88.0 |
|
$ |
(1.6) |
|
(1.8) |
% |
|
Gross margin % — service and parts |
|
|
37.3 |
% |
|
37.0 |
% |
|
0.3 |
% |
0.8 |
% |
|
|
37.0 |
% |
|
36.9 |
% |
|
0.1 |
% |
0.3 |
% |
|
Same-store service and parts gross margin % |
|
|
37.9 |
% |
|
37.5 |
% |
|
0.4 |
% |
1.1 |
% |
|
|
40.2 |
% |
|
39.8 |
% |
|
0.4 |
% |
1.0 |
% |
Revenues
Service and parts revenue increased from 2016 to 2017 due to a $15.3 million increase from net dealership acquisitions, coupled with a $4.3 million increase in same-store revenues. Customer pay work represents approximately 86% of PTG’s 2017 service and parts revenue, largely due to the significant amount of retail sales of parts and accessories. The increase in same-store revenue is due to a $7.6 million, or 3.3%, increase in customer pay revenue, offset by a $2.0 million, or 5.6%, decrease in warranty revenue, and a $1.3 million, or 10.8%, decrease in body shop revenue. The increase in same-store service and parts revenue is largely due to an increase in parts sales.
The increase from 2015 to 2016 is due to a $26.5 million increase from net dealership acquisitions, offset by a $6.5 million decrease in same-store revenues. Customer pay work represents approximately 84% of PTG’s 2016 service and parts revenue, largely due to the significant amount of retail sales of parts and accessories. The decrease in same-store revenue is due to a $10.2 million, or 5.5%, decrease in customer pay revenue, offset by a $3.4 million, or 13.5%, increase in warranty revenue, and a $0.3 million, or 3.4%, increase in body shop revenue. The decrease in same-store service and parts revenue is largely due to a decline in parts sales.
Gross Profit
Service and parts gross profit increased from 2016 to 2017 due to a $5.5 million increase from net dealership acquisitions, coupled with a $2.7 million increase in same-store gross profit. The same-store gross profit increase is due to the increase in same-store revenues, which increased gross profit by $1.6 million, coupled with a 0.4% increase in gross margin, which increased gross profit by $1.1 million. The same-store gross profit increase is due to a $4.4 million, or 5.8%, increase in customer pay gross profit, offset by a $1.1 million, or 6.4%, decrease in warranty gross profit, and a $0.6 million, or 5.1%, decrease in body shop gross profit.
The increase from 2015 to 2016 is due to a $9.3 million increase from net dealership acquisitions, offset by a $1.6 million decrease in same-store gross profit. The same-store gross profit decrease is due to the decrease in same-store revenues, which decreased gross profit by $2.6 million, offset by a 0.4% increase in gross margin, which increased gross profit by $1.0 million. The same-store gross profit decrease is due to a $4.1 million, or 6.1%, decrease in customer pay gross profit, and a $0.3 million, or 3.2%, decrease in body shop gross profit, offset by a $2.8 million, or 25.2%, increase in warranty gross profit.
47
Commercial Vehicle Distribution Data
(In millions, except unit amounts)
Our commercial vehicle distribution business is comprised of our Penske Commercial Vehicles Australia business and our Penske Power Systems business. These businesses generated $511.0 million of revenue during 2017 compared to $428.8 million of revenue during 2016, an increase of 19.2%. Excluding $14.7 million of favorable foreign currency fluctuations, revenues increased 15.7%. These businesses generated $131.2 million of gross profit during 2017 compared to $115.6 million of gross profit during 2016, an increase of 13.5%. Excluding $3.9 million of favorable foreign currency fluctuations, gross profit increased 10.1%.
These businesses generated $428.8 million of revenue during 2016 compared to $431.5 million of revenue during 2015, a decrease of 0.6%. Excluding $3.1 million of negative foreign currency fluctuations, revenues increased 0.1%. These businesses generated $115.6 million of gross profit during 2016 compared to $110.0 million of gross profit during 2015, an increase of 5.1%. Excluding $0.8 million of negative foreign currency fluctuations, gross profit increased 5.8%.
|
|
|
|
|
|
|
|
|
2017 vs. 2016 |
|
|
|
|
|
|
|
|
2016 vs. 2015 |
|
||||||
|
Penske Commercial Vehicles Australia Data |
|
2017 |
|
2016 |
|
Change |
|
% Change |
|
|
2016 |
|
2015 |
|
Change |
|
% Change |
|
||||||
|
Vehicle and parts unit sales |
|
|
1,354 |
|
|
1,049 |
|
|
305 |
|
29.1 |
% |
|
|
1,049 |
|
|
1,243 |
|
|
(194) |
|
(15.6) |
% |
|
Sales revenue |
|
$ |
250.3 |
|
$ |
220.5 |
|
$ |
29.8 |
|
13.5 |
% |
|
$ |
220.5 |
|
$ |
233.6 |
|
$ |
(13.1) |
|
(5.6) |
% |
|
Gross profit |
|
$ |
41.5 |
|
$ |
35.5 |
|
$ |
6.0 |
|
16.9 |
% |
|
$ |
35.5 |
|
$ |
37.9 |
|
$ |
(2.4) |
|
(6.3) |
% |
The increase in revenue and gross profit of PCV Australia from 2016 to 2017 is primarily attributable to an overall improvement in market conditions, with an increase in the heavy-duty truck markets in Australia and New Zealand of 21.8% in 2017, as well as new business gained in military truck supply and service. In addition, the recent strengthening of the Australian Dollar versus the U.S. Dollar and British Pound, including the pricing impact on the products purchased by PCV Australia from these countries, has contributed to an improvement in gross margin.
The decrease in revenue and gross profit of PCV Australia from 2015 to 2016 is attributable principally to lower units distributed, which we believe is due to difficult macroeconomic conditions, the declining price of commodities, and the weakening of the Australian dollar versus the U.S. Dollar, including the impact on the products purchased by PCV Australia.
|
|
|
|
|
|
|
|
|
2017 vs. 2016 |
|
|
|
|
|
|
|
|
2016 vs. 2015 |
|
||||||
|
Penske Power Systems Data |
|
2017 |
|
2016 |
|
Change |
|
% Change |
|
|
2016 |
|
2015 |
|
Change |
|
% Change |
|
||||||
|
Sales revenue |
|
$ |
260.7 |
|
$ |
208.3 |
|
$ |
52.4 |
|
25.2 |
% |
|
$ |
208.3 |
|
$ |
197.9 |
|
$ |
10.4 |
|
5.3 |
% |
|
Gross profit |
|
$ |
89.7 |
|
$ |
80.1 |
|
$ |
9.6 |
|
12.0 |
% |
|
$ |
80.1 |
|
$ |
72.1 |
|
$ |
8.0 |
|
11.1 |
% |
The increase in revenue and gross profit of PPS from 2016 to 2017 is primarily attributable to continued new order growth when compared to the same period last year, as well as the addition of Western Star and MAN franchises at select branches, being appointed the sole franchisee for PCV Australia in several key markets, and improving economic conditions.
The increase in revenue and gross profit of PPS from 2015 to 2016 is primarily attributable to a change in mix of product related sales and continued new order growth, partially offset by a decline in service and parts sales.
48
Selling, General and Administrative
(In millions)
|
|
|
|
|
|
|
|
|
2017 vs. 2016 |
|
|
|
|
|
|
|
2016 vs. 2015 |
|
||||||
|
Selling, General and Administrative Data |
|
2017 |
|
2016 |
|
Change |
|
% Change |
|
2016 |
|
2015 |
|
Change |
|
% Change |
|
||||||
|
Personnel expense |
|
$ |
1,439.2 |
|
$ |
1,317.5 |
|
$ |
121.7 |
|
9.2 |
% |
$ |
1,317.5 |
|
$ |
1,278.7 |
|
$ |
38.8 |
|
3.0 |
% |
|
Advertising expense |
|
$ |
115.8 |
|
$ |
102.5 |
|
$ |
13.3 |
|
13.0 |
% |
$ |
102.5 |
|
$ |
101.0 |
|
$ |
1.5 |
|
1.5 |
% |
|
Rent & related expense |
|
$ |
323.9 |
|
$ |
291.2 |
|
$ |
32.7 |
|
11.2 |
% |
$ |
291.2 |
|
$ |
288.5 |
|
$ |
2.7 |
|
0.9 |
% |
|
Other expense |
|
$ |
637.1 |
|
$ |
590.8 |
|
$ |
46.3 |
|
7.8 |
% |
$ |
590.8 |
|
$ |
554.8 |
|
$ |
36.0 |
|
6.5 |
% |
|
Total SG&A expenses |
|
$ |
2,516.0 |
|
$ |
2,302.0 |
|
$ |
214.0 |
|
9.3 |
% |
$ |
2,302.0 |
|
$ |
2,223.0 |
|
$ |
79.0 |
|
3.6 |
% |
|
Same-store SG&A expenses |
|
$ |
2,284.4 |
|
$ |
2,237.0 |
|
$ |
47.4 |
|
2.1 |
% |
$ |
2,135.3 |
|
$ |
2,174.0 |
|
$ |
(38.7) |
|
(1.8) |
% |
|
|
|
|
|
|
|
|
|
|
|
|
|
|
|
|
|
|
|
|
|
|
|
|
|
|
Personnel expense as % of gross profit |
|
|
44.7 |
% |
|
44.4 |
% |
|
0.3 |
% |
0.7 |
% |
|
44.4 |
% |
|
44.6 |
% |
|
(0.2) |
% |
(0.4) |
% |
|
Advertising expense as % of gross profit |
|
|
3.6 |
% |
|
3.5 |
% |
|
0.1 |
% |
2.9 |
% |
|
3.5 |
% |
|
3.5 |
% |
|
— |
% |
— |
% |
|
Rent & related expense as % of gross profit |
|
|
10.0 |
% |
|
9.8 |
% |
|
0.2 |
% |
2.0 |
% |
|
9.8 |
% |
|
10.1 |
% |
|
(0.3) |
% |
(3.0) |
% |
|
Other expense as % of gross profit |
|
|
19.8 |
% |
|
19.9 |
% |
|
(0.1) |
% |
(0.5) |
% |
|
19.9 |
% |
|
19.3 |
% |
|
0.6 |
% |
3.1 |
% |
|
Total SG&A expenses as % of gross profit |
|
|
78.1 |
% |
|
77.6 |
% |
|
0.5 |
% |
0.6 |
% |
|
77.6 |
% |
|
77.5 |
% |
|
0.1 |
% |
0.1 |
% |
|
Same-store SG&A expenses as % of same-store gross profit |
|
|
77.9 |
% |
|
77.3 |
% |
|
0.6 |
% |
0.8 |
% |
|
77.1 |
% |
|
77.6 |
% |
|
(0.5) |
% |
(0.6) |
% |
Selling, general and administrative (“SG&A”) expenses increased from 2016 to 2017 due to a $166.6 million increase from net acquisitions, coupled with a $47.4 million, or 2.1%, increase in same-store SG&A. The increase in same-store SG&A is primarily due to an increase in same-store variable personnel expenses as a result of the 0.3% increase in same-store gross retail profit versus the prior year, offset by a $27.4 million decrease due to negative foreign currency fluctuations. Excluding the reduction related to foreign currency fluctuations, same-store SG&A increased 3.3%.
The increase from 2015 to 2016 is due to a $117.7 million increase from net acquisitions, offset by a $38.7 million, or 1.8%, decrease in same-store SG&A expenses. The decrease in same-store SG&A is primarily due to a decrease in same-store variable personnel expenses as a result of the 1.0% decrease in same-store retail gross profit versus the prior year, as well as an $81.8 million decrease due to negative foreign currency fluctuations. Excluding the reduction related to foreign currency fluctuations, same-store SG&A increased 2.0%.
SG&A expenses as a percentage of total revenue were 11.8%, 11.4% and 11.5% in 2017, 2016, and 2015, respectively, and as a percentage of gross profit were 78.1%, 77.6%, and 77.5%, in 2017, 2016, and 2015, respectively.
Depreciation
(In millions)
|
|
|
|
|
|
|
|
|
2017 vs. 2016 |
|
|
|
|
|
|
|
2016 vs. 2015 |
|
||||||
|
|
|
2017 |
|
2016 |
|
Change |
|
% Change |
|
2016 |
|
2015 |
|
Change |
|
% Change |
|
||||||
|
Depreciation |
|
$ |
95.1 |
|
$ |
89.7 |
|
$ |
5.4 |
|
6.0 |
% |
$ |
89.7 |
|
$ |
78.0 |
|
$ |
11.7 |
|
15.0 |
% |
The increase in depreciation from 2016 to 2017 is due to a $4.6 million increase from net acquisitions, coupled with a $0.8 million, or 0.9%, increase in same-store depreciation during the year.
The increase from 2015 to 2016 is due to a $7.4 million increase from net acquisitions, coupled with a $4.3 million, or 5.6%, increase in same-store depreciation during the year.
The overall increases are primarily related to our ongoing facility improvement and expansion programs.
49
Floor Plan Interest Expense
(In millions)
|
|
|
|
|
|
|
|
|
2017 vs. 2016 |
|
|
|
|
|
|
|
2016 vs. 2015 |
|
||||||
|
|
|
2017 |
|
2016 |
|
Change |
|
% Change |
|
2016 |
|
2015 |
|
Change |
|
% Change |
|
||||||
|
Floor plan interest expense |
|
$ |
63.4 |
|
$ |
50.9 |
|
$ |
12.5 |
|
24.6 |
% |
$ |
50.9 |
|
$ |
44.5 |
|
$ |
6.4 |
|
14.4 |
% |
The increase in floor plan interest expense from 2016 to 2017 is due to a $9.6 million, or 19.5%, increase in same-store floor plan interest expense, coupled with a $2.9 million increase from net dealership acquisitions.
The increase from 2015 to 2016 is due to a $3.2 million increase from net dealership acquisitions, coupled with a $3.2 million, or 7.4%, increase in same-store floor plan interest expense.
The overall increases are primarily due to increases in amounts outstanding under floor plan arrangements, due in part to increased levels of inventory, and increases in applicable rates.
Other Interest Expense
(In millions)
|
|
|
|
|
|
|
|
|
2017 vs. 2016 |
|
|
|
|
|
|
|
2016 vs. 2015 |
|
||||||
|
|
|
2017 |
|
2016 |
|
Change |
|
% Change |
|
2016 |
|
2015 |
|
Change |
|
% Change |
|
||||||
|
Other interest expense |
|
$ |
107.4 |
|
$ |
85.4 |
|
$ |
22.0 |
|
25.8 |
% |
$ |
85.4 |
|
$ |
69.4 |
|
$ |
16.0 |
|
23.1 |
% |
The increase in other interest expense from 2016 to 2017 is primarily due to the issuance of our $300.0 million 3.75% senior subordinated notes in August 2017, as well as an increase in outstanding revolver borrowings under the U.S. and U.K. credit agreements, and our Australia working capital and capital loan agreements, as well as due to increases in applicable rates.
The increase from 2015 to 2016 is primarily due to the issuance of our $500.0 million 5.50% senior subordinated notes in May 2016, as well as an increase in outstanding revolver borrowings under the U.S. and U.K. credit agreements and our Australia working capital loan agreement.
Equity in Earnings of Affiliates
(In millions)
|
|
|
|
|
|
|
|
|
2017 vs. 2016 |
|
|
|
|
|
|
|
2016 vs. 2015 |
|
||||||
|
|
|
2017 |
|
2016 |
|
Change |
|
% Change |
|
2016 |
|
2015 |
|
Change |
|
% Change |
|
||||||
|
Equity in earnings of affiliates |
|
$ |
107.6 |
|
$ |
69.5 |
|
$ |
38.1 |
|
54.8 |
% |
$ |
69.5 |
|
$ |
39.3 |
|
$ |
30.2 |
|
76.8 |
% |
The increase in equity in earnings of affiliates from 2016 to 2017 is primarily due to increases in our investment in PTL from 23.4% to 28.9% in September 2017 and from 9.0% to 23.4% in July 2016. Equity in earnings of affiliates from PTL increased by $40.0 million from 2016 to 2017. This increase was offset primarily by decreases in earnings from other non-automotive equity method investments, some of which were sold in 2017.
The increase from 2015 to 2016 is primarily due to an increase in our investment in PTL from 9.0% to 23.4% in July 2016. Equity in earnings of affiliates from PTL increased by $29.4 million from 2015 to 2016. The remaining increase is primarily due to an increase in earnings from our investment in Japan made during the first quarter of 2016.
50
Income Taxes
(In millions)
|
|
|
|
|
|
|
|
|
2017 vs. 2016 |
|
|
|
|
|
|
|
2016 vs. 2015 |
|
||||||
|
|
|
2017 |
|
2016 |
|
Change |
|
% Change |
|
2016 |
|
2015 |
|
Change |
|
% Change |
|
||||||
|
Income taxes |
|
$ |
(64.8) |
|
$ |
160.7 |
|
$ |
(225.5) |
|
(140.3) |
% |
$ |
160.7 |
|
$ |
158.0 |
|
$ |
2.7 |
|
1.7 |
% |
Income taxes decreased from 2016 to 2017 due to the enactment of the U.S. Tax Cuts and Jobs Act (the “Act”), which resulted in a net tax benefit of $243.4 million in 2017. The decrease in income taxes as a result of the Act is from the remeasurement of certain deferred tax assets and liabilities due to the corporate income tax rate reduction, partially offset by taxes on the accumulated earnings and profits from our international operations. The decrease from the net tax benefit was partially offset by a $40.1 million increase in our pre-tax income compared to the prior year.
The increase from 2015 to 2016 is primarily due to a $16.2 million increase in our pre-tax income compared to the prior year, partially offset by a decrease in our effective tax rate compared to the prior year. The decrease in our effective tax rate in 2016 is partially due to a decrease in income tax expense resulting from an elimination of $5.1 million of deferred tax liabilities related to our acquisition of the remaining ownership interests of Premier Truck Group during 2016.
Liquidity and Capital Resources
Our cash requirements are primarily for working capital, inventory financing, the acquisition of new businesses, the improvement and expansion of existing facilities, the purchase or construction of new facilities, debt service and repayments, dividends, and potential repurchases of our outstanding securities under the program discussed below. Historically, these cash requirements have been met through cash flow from operations, borrowings under our credit agreements and floor plan arrangements, the issuance of debt securities, sale-leaseback transactions, mortgages, and dividends and distributions from joint venture investments or the issuance of equity securities.
We have historically expanded our operations through organic growth and the acquisition of dealerships and other businesses. We believe that cash flow from operations, dividends and distributions from our joint venture investments, and our existing capital resources, including the liquidity provided by our credit agreements and floor plan financing arrangements, will be sufficient to fund our existing operations and current commitments for at least the next twelve months. In the event we pursue significant acquisitions or other expansion opportunities, pursue significant repurchases of our outstanding securities, or refinance or repay existing debt, we may need to raise additional capital either through the public or private issuance of equity or debt securities or through additional borrowings, which sources of funds may not necessarily be available on terms acceptable to us, if at all. In addition, our liquidity could be negatively impacted in the event we fail to comply with the covenants under our various financing and operating agreements or in the event our floor plan financing is withdrawn.
As of December 31, 2017, we had working capital of $26.1 million, including $45.7 million of cash, available to fund our operations and capital commitments. In addition, we had $528.0 million, £125.0 million ($168.9 million), and AU $50.0 million ($39.0 million) available for borrowing under our U.S. credit agreement, U.K. credit agreement, and Australian working capital loan agreement, respectively.
Securities Repurchases
From time to time, our Board of Directors has authorized securities repurchase programs pursuant to which we may, as market conditions warrant, purchase our outstanding common stock or debt on the open market, in privately negotiated transactions, via a tender offer, or through a pre-arranged trading plan. We have historically funded any such repurchases using cash flow from operations, borrowings under our U.S. credit facility, and borrowings under our U.S. floor plan arrangements. The decision to make repurchases will be based on factors such as the market price of the relevant security versus our view of its intrinsic value, the potential impact of such repurchases on our capital structure, and our consideration of any alternative uses of our capital, such as for acquisitions and strategic investments in our current businesses, in addition to any then-existing limits imposed by our finance agreements and securities trading policy. In October 2017, our Board of Directors increased the authority delegated to management to repurchase our outstanding securities to $200.0 million. Prior to the increase, we had $19.4 million in remaining authority. As of
51
December 31, 2017, we had $200.0 million in repurchase authorization remaining under the securities repurchase program. Refer to the disclosures provided in Part II, Item 8, Note 14 of the Notes to our Consolidated Financial Statements set forth below for a summary of shares repurchased under our securities repurchase program.
Dividends
We paid the following cash dividends on our common stock in 2016 and 2017:
Per Share Dividends
|
2016 |
|
|
|
|
|
|
|
|
|
First Quarter |
|
$ |
0.26 |
|
Second Quarter |
|
|
0.27 |
|
Third Quarter |
|
|
0.28 |
|
Fourth Quarter |
|
|
0.29 |
|
2017 |
|
|
|
|
|
|
|
|
|
First Quarter |
|
$ |
0.30 |
|
Second Quarter |
|
|
0.31 |
|
Third Quarter |
|
|
0.32 |
|
Fourth Quarter |
|
|
0.33 |
We also announced a cash dividend of $0.34 per share payable on March 1, 2018 to shareholders of record as of February 12, 2018. Future quarterly or other cash dividends will depend upon a variety of factors considered relevant by our Board of Directors, which may include our earnings, capital requirements, restrictions relating to any then-existing indebtedness, financial condition and other factors.
Vehicle Financing
We finance substantially all of the commercial vehicles we purchase for distribution, new vehicles for retail sale, and a portion of our used vehicle inventories for retail sale, under floor plan and other revolving arrangements with various lenders, including the captive finance companies associated with automotive manufacturers. In the U.S., the floor plan arrangements are due on demand; however, we have not historically been required to repay floor plan advances prior to the sale of the vehicles that have been financed. We typically make monthly interest payments on the amount financed. Outside of the U.S., substantially all of the floor plan arrangements are payable on demand or have an original maturity of 90 days or less, and we are generally required to repay floor plan advances at the earlier of the sale of the vehicles that have been financed or the stated maturity.
The agreements typically grant a security interest in substantially all of the assets of our dealership and distribution subsidiaries and, in the U.S., Australia and New Zealand, are guaranteed or partially guaranteed by us. Interest rates under the arrangements are variable and increase or decrease based on changes in the prime rate, defined LIBOR, the Finance House Base Rate, the Euro Interbank Offered Rate, the Canadian Prime Rate, the Australian Bank Bill Swap Rate, or the New Zealand Bank Bill Benchmark Rate. To date, we have not experienced any material limitation with respect to the amount or availability of financing from any institution providing us vehicle financing. We also receive non-refundable credits from certain of our vehicle manufacturers, which are treated as a reduction of cost of sales as vehicles are sold.
52
Long-Term Debt Obligations
As of December 31, 2017, we had the following long-term debt obligations outstanding:
|
|
|
December 31, |
|
|
(In millions) |
|
2017 |
|
|
U.S. credit agreement — revolving credit line |
|
$ |
172.0 |
|
U.K. credit agreement — revolving credit line |
|
|
47.3 |
|
U.K. credit agreement — overdraft line of credit |
|
|
— |
|
5.75% senior subordinated notes due 2022 |
|
|
545.9 |
|
5.375% senior subordinated notes due 2024 |
|
|
297.2 |
|
5.50% senior subordinated notes due 2026 |
|
|
494.4 |
|
3.75% senior subordinated notes due 2020 |
|
|
296.5 |
|
Australia capital loan agreement |
|
|
39.0 |
|
Australia working capital loan agreement |
|
|
— |
|
Mortgage facilities |
|
|
235.5 |
|
Other |
|
|
35.4 |
|
Total long-term debt |
|
$ |
2,163.2 |
As of December 31, 2017, we were in compliance with all covenants under our credit agreements, and we believe we will remain in compliance with such covenants for the next twelve months. Refer to the disclosures provided in Part II, Item 8, Note 9 of the Notes to our Consolidated Financial Statements set forth below for a detailed description of our long-term debt obligations.
Short-Term Borrowings
In 2017, we had four principal sources of short-term borrowings: the revolving portion of the U.S. credit agreement, the revolving portion of the U.K. credit agreement, our Australian working capital loan agreement and the floor plan agreements that we utilize to finance our vehicle inventories. We are also able to access availability under the floor plan agreements to fund our cash needs, including payments made relating to our higher interest rate revolving credit agreements.
During 2017, outstanding revolving commitments varied between $120.0 million and $532.0 million under the U.S. credit agreement, between £9.0 million and £140.0 million ($12.2 million and $189.2 million) under the U.K. credit agreement’s revolving credit line (excluding the overdraft facility), and between AU $0 million and AU $53.8 million ($0 million and $42.0 million) under the Australia working capital loan agreement. The amounts outstanding under our floor plan agreements varied based on the timing of the receipt and expenditure of cash in our operations, driven principally by the levels of our vehicle inventories.
PTL Dividends
We currently hold a 28.9% ownership interest in Penske Truck Leasing. As discussed previously, we increased our ownership interest in PTL during 2016 and 2017 by 14.4% and 5.5%, respectively. The PTL partnership agreement requires PTL, subject to applicable law and the terms of its credit agreements, to make quarterly distributions to the partners with respect to each fiscal year by no later than 45 days after the end of each of the first three quarters of the year and by April 15 of the following year. PTL’s principal debt agreements allow partner distributions only as long as they are not in default under that agreement and the amount they pay does not exceed 50% of its consolidated net income. During 2017, 2016, and 2015 we received $52.4 million, $21.7 million, and $13.8 million, respectively, of pro rata cash distributions relating to this investment. We currently expect to continue to receive future distributions from PTL quarterly, subject to its financial performance.
53
Operating Leases
We estimate the total rent obligations under our operating leases, including any extension periods we may exercise at our discretion and assuming constant consumer price indices, to be $5.1 billion. As of December 31, 2017, we were in compliance with all covenants under these leases, and we believe we will remain in compliance with such covenants for the next twelve months. Refer to the disclosures provided in Part II, Item 8, Note 11 of the Notes to our Consolidated Financial Statements set forth below for a detailed description of our operating leases.
Sale/Leaseback Arrangements
We have in the past and may in the future enter into sale-leaseback transactions to finance certain property acquisitions and capital expenditures, pursuant to which we sell property and/or leasehold improvements to third parties and agree to lease those assets back for a certain period of time. Such sales generate proceeds that vary from period to period.
Off-Balance Sheet Arrangements
Refer to the disclosures provided in Part II, Item 8, Note 11 of the Notes to our Consolidated Financial Statements set forth below for a detailed description of our off-balance sheet arrangements which include lease obligations and a limited parent guarantee related to our floor plan credit agreement with Mercedes Benz Financial Services Australia.
Cash Flows
Cash and cash equivalents increased by $21.7 million in 2017, decreased by $38.4 million in 2016, and increased by $26.1 million in 2015. The major components of these changes are discussed below.
Cash Flows from Continuing Operating Activities
Cash provided by continuing operating activities was $623.0 million, $371.3 million, and $397.8 million during 2017, 2016, and 2015, respectively. Cash flows from continuing operating activities includes net income, as adjusted for non-cash items and the effects of changes in working capital.
We finance substantially all of the commercial vehicles we purchase for distribution, new vehicles for retail sale, and a portion of our used vehicle inventories for retail sale, under floor plan and other revolving arrangements with various lenders, including the captive finance companies associated with automotive manufacturers. We retain the right to select which, if any, financing source to utilize in connection with the procurement of vehicle inventories. Many vehicle manufacturers provide vehicle financing for the dealers representing their brands; however, it is not a requirement that we utilize this financing. Historically, our floor plan finance source has been based on aggregate pricing considerations.
In accordance with generally accepted accounting principles relating to the statement of cash flows, we report all cash flows arising in connection with floor plan notes payable with the manufacturer of a particular new vehicle as an operating activity in our statement of cash flows, and all cash flows arising in connection with floor plan notes payable to a party other than the manufacturer of a particular new vehicle, all floor plan notes payable relating to pre-owned vehicles, and all floor plan notes payable related to our commercial vehicles in Australia and New Zealand, as a financing activity in our statement of cash flows. Currently, the majority of our non-trade vehicle financing is with other manufacturer captive lenders. To date, we have not experienced any material limitation with respect to the amount or availability of financing from any institution providing us vehicle financing.
We believe that changes in aggregate floor plan liabilities are typically linked to changes in vehicle inventory, and therefore, are an integral part of understanding changes in our working capital and operating cash flow. As a result, we
54
prepare the following reconciliation to highlight our operating cash flows with all changes in vehicle floor plan being classified as an operating activity for informational purposes:
|
|
|
Year Ended December 31, |
|||||||
|
(In millions) |
|
2017 |
|
2016 |
|
2015 |
|||
|
Net cash from continuing operating activities as reported |
|
$ |
623.0 |
|
$ |
371.3 |
|
$ |
397.8 |
|
Floor plan notes payable — non-trade as reported |
|
|
185.3 |
|
|
101.0 |
|
|
154.2 |
|
Net cash from continuing operating activities including all floor plan notes payable |
|
$ |
808.3 |
|
$ |
472.3 |
|
$ |
552.0 |
Cash Flows from Continuing Investing Activities
Cash used in continuing investing activities was $928.7 million, $836.7 million, and $351.7 million during 2017, 2016, and 2015, respectively. Cash flows from continuing investing activities consist primarily of cash used for capital expenditures, net expenditures for acquisitions and other investments, and proceeds from sale-leaseback transactions. Capital expenditures were $247.0 million, $203.1 million, and $199.5 million during 2017, 2016, and 2015, respectively. Capital expenditures relate primarily to improvements to our existing dealership facilities, the construction of new facilities, the acquisition of the property or buildings associated with existing leased facilities, and the acquisition of land for future development. We currently expect to finance our retail automotive segment and retail commercial truck segment capital expenditures with operating cash flows or borrowings under our U.S. or U.K. credit facilities. Cash used in acquisitions and other investments, net of cash acquired, was $449.7 million, $140.8 million, and $156.9 million during 2017, 2016, and 2015, respectively, and included cash used to repay sellers floor plan liabilities in such business acquisitions of $101.6 million, $62.2 million, and $60.3 million, respectively. Cash used to acquire additional ownership interests in PTL was $239.1 million and $498.5 million during 2017 and 2016, respectively. Proceeds from sale-leaseback transactions were $22.2 million during 2017.
Cash Flows from Continuing Financing Activities
Cash provided by continuing financing activities was $322.6 million and $433.0 million during 2017 and 2016, respectively, and cash used in continuing financing activities was $55.6 million during 2015. Cash flows from continuing financing activities include net borrowings or repayments of long-term debt, issuance of long-term debt, repurchases of common stock, net borrowings or repayments of floor plan notes payable non-trade, payment of debt issuance costs, and dividends.
We had net repayments of long-term debt of $26.0 million and $62.1 million during 2017 and 2015, respectively, and net borrowings of long-term debt of $122.9 million during 2016. We issued $300.0 million and $500.0 million of senior subordinated notes in 2017 and 2016, respectively, and paid $4.0 million and $6.7 million of debt issuance costs in conjunction with the issuance of the senior subordinated notes during 2017 and 2016, respectively. We paid $1.8 million of debt issuance costs in 2015 in conjunction with the changes made to our U.K. credit agreement during the year. We had net borrowings of floor plan notes payable non-trade of $185.3 million, $101.0 million, and $154.2 million during 2017, 2016, and 2015, respectively. In 2017, 2016, and 2015, we repurchased 0.4 million, 4.7 million, and 1.0 million shares of common stock for $18.5 million, $173.6 million, and $48.9 million, respectively. We also paid $108.4 million, $95.1 million, and $84.8 million of cash dividends to our stockholders during 2017, 2016, and 2015, respectively.
Cash Flows from Discontinued Operations
Cash flows relating to discontinued operations are not currently considered, nor are they expected to be, material to our liquidity or our capital resources. Management does not believe that there are any material past, present or upcoming cash transactions relating to discontinued operations.
Contractual Payment Obligations
The table below sets forth our best estimates as to the amounts and timing of future payments relating to our most significant contractual obligations as of December 31, 2017, excluding amounts related to entities classified as discontinued operations. The information in the table reflects future unconditional payments and is based upon, among other things, the terms of any relevant agreements. Future events, including acquisitions, divestitures, new or revised operating lease agreements, borrowings or repayments under our credit agreements and our floor plan arrangements, and
55
purchases or refinancing of our securities, could cause actual payments to differ significantly from these amounts. Potential payments noted above under “Off-Balance Sheet Arrangements” are excluded from this table.
|
|
|
|
|
|
Less than |
|
|
|
|
|
|
|
More than |
||
|
(In millions) |
|
Total |
|
1 year |
|
1 to 3 years |
|
3 to 5 years |
|
5 years |
|||||
|
Floor plan notes payable (A) |
|
$ |
3,761.8 |
|
$ |
3,761.8 |
|
$ |
— |
|
$ |
— |
|
$ |
— |
|
Long-term debt obligations |
|
|
2,163.2 |
|
|
72.8 |
|
|
545.8 |
|
|
613.0 |
|
|
931.6 |
|
Operating lease commitments |
|
|
5,120.9 |
|
|
237.4 |
|
|
462.2 |
|
|
445.1 |
|
|
3,976.2 |
|
Scheduled interest payments (B) |
|
|
609.1 |
|
|
97.0 |
|
|
192.1 |
|
|
165.5 |
|
|
154.5 |
|
Uncertain tax positions (C) |
|
|
3.5 |
|
|
— |
|
|
— |
|
|
3.5 |
|
|
— |
|
|
|
$ |
11,658.5 |
|
$ |
4,169.0 |
|
$ |
1,200.1 |
|
$ |
1,227.1 |
|
$ |
5,062.3 |
|
(A) |
Floor plan notes payable are revolving financing arrangements. Payments are generally made as required pursuant to the floor plan borrowing agreements discussed above under “Vehicle Financing.” |
|
(B) |
Estimates of future variable rate interest payments under floor plan notes payable and our credit agreements are excluded due to our inability to estimate changes in interest rates in the future. See “Vehicle Financing,” “U.S. Credit Agreement,” “U.K. Credit Agreement,” and “Australia Loan Agreements” in Part II, Item 8 of the Notes to our Consolidated Financial Statements set forth below for a discussion of such variable rates. |
|
(C) |
Due to the subjective nature of our uncertain tax positions, we are unable to make reasonably reliable estimates of the timing of payments arising in connection with the unrecognized tax benefits; however, as a result of the statute of limitations, we do not expect any of these payments to occur in more than 5 years. We have thus classified these as “3 to 5 years.” |
We expect that, other than for scheduled payments upon the maturity or termination dates of certain of our debt instruments, the amounts above will be funded through cash flows from operations or borrowings under our credit agreements. In the case of payments upon the maturity or termination dates of our debt instruments, we currently expect to be able to refinance such instruments in the normal course of business or otherwise fund them from cash flows from operations or borrowings under our credit agreements.
Related Party Transactions
Stockholders Agreement
Several of our directors and officers are affiliated with Penske Corporation or related entities. Roger S. Penske, our Chair of the Board and Chief Executive Officer, is also Chair of the Board and Chief Executive Officer of Penske Corporation, and through entities affiliated with Penske Corporation, our largest stockholder owning approximately 41% of our outstanding common stock. Mitsui & Co., Ltd. and Mitsui & Co. (USA), Inc. (collectively, “Mitsui”) own approximately 17% of our outstanding common stock. Mitsui, Penske Corporation and certain other affiliates of Penske Corporation are parties to a stockholders agreement pursuant to which the Penske affiliated companies agreed to vote their shares for up to two directors who are representatives of Mitsui. In turn, Mitsui agreed to vote their shares for up to fourteen directors voted for by the Penske affiliated companies. This agreement terminates in March 2024, upon the mutual consent of the parties, or when either party no longer owns any of our common stock.
Other Related Party Interests and Transactions
Robert Kurnick, Jr., our President and a director, is also the Vice Chair and a director of Penske Corporation. Bud Denker, our Executive Vice President, Human Resources, is also the President of Penske Corporation. Roger S. Penske, Jr., one of our directors, is the son of our chair and is also a director of Penske Corporation. Kanji Sasaki, one of our directors and officers, is also an employee of Mitsui & Co.
We sometimes pay to and/or receive fees from Penske Corporation, its subsidiaries, and its affiliates for services rendered in the ordinary course of business, or to reimburse payments made to third parties on each other’s behalf. These transactions are reviewed periodically by our Audit Committee and reflect the provider’s cost or an amount mutually agreed upon by both parties.
56
Penske Truck Leasing
On September 7, 2017, we acquired an additional 5.5% ownership interest in PTL from GE Capital for approximately $239.1 million in cash. At the same time, Mitsui, our second largest shareholder, acquired an additional 10.0% ownership interest in PTL at the same valuation. After the transaction, PTL is owned 41.1% by Penske Corporation, 28.9% by us, and 30.0% by Mitsui. GE Capital no longer owns any ownership interests in PTL.
In December 2017, we sold our 31% ownership interest in Penske Vehicle Services to PTL for a purchase price of $19.2 million.
We have also entered into other joint ventures with certain related parties as more fully discussed in Part II, Item 8, Note 12 of the Notes to our Consolidated Financial Statements set forth below.
Unit sales of motor vehicles, particularly new vehicles, have been cyclical historically, fluctuating with general economic cycles. During economic downturns, the automotive and truck retailing industry tends to experience periods of decline and recession similar to those experienced by the general economy. We believe that the industry is influenced by general economic conditions and particularly by consumer confidence, the level of personal discretionary spending, fuel prices, interest rates, and credit availability.
Seasonality
Dealership. Our business is modestly seasonal overall. Our U.S. operations generally experience higher volumes of vehicle sales in the second and third quarters of each year due in part to consumer buying trends and the introduction of new vehicle models. Also, vehicle demand, and to a lesser extent demand for service and parts, is generally lower during the winter months than in other seasons, particularly in regions of the U.S. where dealerships may be subject to severe winters. Our U.K. operations generally experience higher volumes of vehicle sales in the first and third quarters of each year, due primarily to vehicle registration practices in the U.K.
Commercial Vehicle Distribution. Our commercial vehicle distribution business generally experiences higher sales volumes during the second quarter of the year, which is primarily attributable to commercial vehicle customers completing annual capital expenditures before their fiscal year-end, which is typically June 30 in Australia.
Effects of Inflation
We believe that inflation rates over the last few years have not had a significant impact on revenues or profitability. We do not expect inflation to have any near-term material effects on the sale of our products and services; however, we cannot be sure there will be no such effect in the future. We finance substantially all of our inventory through various revolving floor plan arrangements with interest rates that vary based on various benchmarks. Such rates have historically increased during periods of increasing inflation.
Forward-Looking Statements
Certain statements and information set forth herein, as well as other written or oral statements made from time to time by us or by our authorized officers on our behalf, constitute “forward-looking statements” within the meaning of the Federal Private Securities Litigation Reform Act of 1995. Words such as “anticipate,” “believe,” “estimate,” “expect,” “intend,” “may,” “goal,” “plan,” “seek,” “project,” “continue,” “will,” “would,” and variations of such words and similar expressions are intended to identify such forward-looking statements. We intend for our forward-looking statements to be covered by the safe harbor provisions for forward-looking statements contained in the Private Securities Litigation Reform Act of 1995, and we set forth this statement in order to comply with such safe harbor provisions. You should note that our forward-looking statements speak only as of the date of this Annual Report on Form 10-K or when made and we undertake no duty or obligation to update or revise our forward-looking statements, whether as a result of new
57
information, future events, or otherwise. Forward-looking statements include, without limitation, statements with respect to:
|
· |
our future financial and operating performance; |
|
· |
future acquisitions and dispositions; |
|
· |
future potential capital expenditures and securities repurchases; |
|
· |
our ability to realize cost savings and synergies; |
|
· |
our ability to respond to economic cycles; |
|
· |
trends in the automotive retail industry and commercial vehicles industries and in the general economy in the various countries in which we operate; |
|
· |
our ability to access the remaining availability under our credit agreements; |
|
· |
our liquidity; |
|
· |
performance of joint ventures, including PTL; |
|
· |
future foreign exchange rates; |
|
· |
the outcome of various legal proceedings; |
|
· |
results of self-insurance plans; |
|
· |
trends affecting our future financial condition or results of operations; and |
|
· |
our business strategy. |
Forward-looking statements involve known and unknown risks and uncertainties and are not assurances of future performance. Actual results may differ materially from anticipated results due to a variety of factors, including the factors identified under “Item 1A. Risk Factors.” Important factors that could cause actual results to differ materially from our expectations include those mentioned in “Item 1A. Risk Factors” such as the following:
|
· |
our business and the automotive retail and commercial vehicles industries in general are susceptible to adverse economic conditions, including changes in interest rates, foreign exchange rates, customer demand, customer confidence, fuel prices, unemployment rates and credit availability; |
|
· |
the political and economic outcome of Brexit in the U.K.; |
|
· |
the number of new and used vehicles sold in our markets; |
|
· |
the effect on our businesses of new mobility technologies such as shared vehicle services, such as Uber and Lyft, and the eventual availability of driverless vehicles; |
|
· |
vehicle manufacturers exercise significant control over our operations, and we depend on them and the continuation of our franchise and distribution agreements in order to operate our business; |
|
· |
we depend on the success, popularity and availability of the brands we sell, and adverse conditions affecting one or more vehicle manufacturers, including the adverse impact on the vehicle and parts supply chain due to natural disasters or other disruptions that interrupt the supply of vehicles and parts to us, may negatively impact our revenues and profitability; |
58
|
· |
we are subject to the risk that a substantial number of our new or used inventory may be unavailable due to recall or other reasons; |
|
· |
the success of our commercial vehicle distribution operations and engine and power systems distribution operations depends upon continued availability of the vehicles, engines, power systems, and other parts we distribute, demand for those vehicles, engines, power systems, and parts, and general economic conditions in those markets; |
|
· |
a restructuring of any significant vehicle manufacturer or supplier; |
|
· |
our operations may be affected by severe weather, such as the recent hurricanes in Puerto Rico, Florida, and Texas, or other periodic business interruptions; |
|
· |
we have substantial risk of loss not covered by insurance; |
|
· |
we may not be able to satisfy our capital requirements for acquisitions, facility renovation projects, financing the purchase of our inventory, or refinancing of our debt when it becomes due; |
|
· |
our level of indebtedness may limit our ability to obtain financing generally and may require that a significant portion of our cash flow be used for debt service; |
|
· |
non-compliance with the financial ratios and other covenants under our credit agreements and operating leases; |
|
· |
higher interest rates may significantly increase our variable rate interest costs and, because many customers finance their vehicle purchases, decrease vehicle sales; |
|
· |
our operations outside of the U.S. subject our profitability to fluctuations relating to changes in foreign currency values, which have most recently occurred as a result of the June 2016 U.K. referendum for Brexit; |
|
· |
import product restrictions and foreign trade risks that may impair our ability to sell foreign vehicles profitably; |
|
· |
with respect to PTL, changes in the financial health of its customers, labor strikes or work stoppages by its employees, a reduction in PTL’s asset utilization rates, continued availability from truck manufacturers and suppliers of vehicles and parts for its fleet, changes in values of used trucks which affects PTL’s profitability on truck sales, compliance costs in regards to its trucking fleet and truck drivers, its ability to retain qualified drivers and technicians, conditions in the capital markets to assure PTL’s continued availability of capital to purchase trucks, the effect of changes in lease accounting rules on PTL customers’ purchase/lease decisions, and industry competition, each of which could impact distributions to us; |
|
· |
we are dependent on continued availability of our information technology systems; |
|
· |
if we lose key personnel, especially our Chief Executive Officer, or are unable to attract additional qualified personnel; |
|
· |
new or enhanced regulations relating to automobile dealerships including those that may be issued by the Consumer Finance Protection Bureau in the U.S. or the Financial Conduct Authority in the U.K. restricting automotive financing; |
|
· |
changes in tax, financial or regulatory rules or requirements; |
|
· |
we could be subject to legal and administrative proceedings which, if the outcomes are adverse to us, could have a material adverse effect on our business; |
|
· |
if state dealer laws in the U.S. are repealed or weakened, our automotive dealerships may be subject to increased competition and may be more susceptible to termination, non-renewal or renegotiation of their franchise agreements; |
59
|
· |
some of our directors and officers may have conflicts of interest with respect to certain related party transactions and other business interests; and |
|
· |
shares of our common stock eligible for future sale may cause the market price of our common stock to drop significantly, even if our business is doing well. |
We urge you to carefully consider these risk factors and further information under “Item 1A. Risk Factors” in evaluating all forward-looking statements regarding our business. Readers of this report are cautioned not to place undue reliance on the forward-looking statements contained in this report. All forward-looking statements attributable to us are qualified in their entirety by this cautionary statement. Except to the extent required by the federal securities laws and the Securities and Exchange Commission’s rules and regulations, we have no intention or obligation to update publicly any forward-looking statements whether as a result of new information, future events or otherwise.
Additional Information
Investors and others should note that we announce material financial information using our company website (www.penskeautomotive.com), our investor relations website (investors.penskeautomotive.com), SEC filings, press releases, public conference calls and webcasts. Information about Penske Automotive Group, its business, and its results of operations may also be announced by posts on the following social media channels from time to time:
|
· |
Penske Automotive Group’s Twitter feed (www.twitter.com/penskecarscorp) |
|
· |
Penske Automotive Group’s Facebook page (www.facebook.com/penskecars) |
|
· |
Penske Automotive Group’s Social website (www.penskesocial.com) |
The information that we post on these social media channels could be deemed to be material information. As a result, we encourage investors, the media, and others interested in Penske Automotive Group to review the information that we post on these social media channels. These channels may be updated from time to time on Penske Automotive Group’s investor relations website. The information on or accessible through our websites and social media channels is not incorporated by reference in this Annual Report on Form 10-K and our references to such content are intended to be inactive textual or oral references only.
Item 7A. Quantitative and Qualitative Disclosures About Market Risk
Interest Rates. We are exposed to market risk from changes in the interest rates on a significant portion of our outstanding debt. Outstanding revolving balances under our credit agreements bear interest at variable rates based on a margin over defined LIBOR, the Bank of England Base Rate, or the Australian Bank Bill Swap Rate. Based on the amount outstanding under these facilities as of December 31, 2017, a 100 basis point change in interest rates would result in an approximate $2.2 million change to our annual other interest expense. Similarly, amounts outstanding under floor plan financing arrangements bear interest at a variable rate based on a margin over the prime rate, defined LIBOR, the Finance House Base Rate, the Euro Interbank Offered Rate, the Canadian Prime Rate, the Australian Bank Bill Swap Rate, or the New Zealand Bank Bill Benchmark Rate.
Based on an average of the aggregate amounts outstanding under our floor plan financing arrangements subject to variable interest payments during the year ended December 31, 2017, a 100 basis point change in interest rates would result in an approximate $34.3 million change to our annual floor plan interest expense.
We evaluate our exposure to interest rate fluctuations and follow established policies and procedures to implement strategies designed to manage the amount of variable rate indebtedness outstanding at any point in time in an effort to mitigate the effect of interest rate fluctuations on our earnings and cash flows. These policies include:
|
· |
the maintenance of our overall debt portfolio with targeted fixed and variable rate components; |
|
· |
the use of authorized derivative instruments; |
|
· |
the prohibition of using derivatives for trading or other speculative purposes; and |
|
· |
the prohibition of highly leveraged derivatives or derivatives which we are unable to reliably value, or for which we are unable to obtain a market quotation. |
60
Interest rate fluctuations affect the fair market value of our fixed rate debt, mortgages, and certain seller financed promissory notes, but, with respect to such fixed rate debt instruments, do not impact our earnings or cash flows.
Foreign Currency Exchange Rates. As of December 31, 2017, we had consolidated operations in the U.K., Germany, Italy, Canada, Australia and New Zealand. In each of these markets, the local currency is the functional currency. In the event we change our intent with respect to the investment in any of our international operations, we would expect to implement strategies designed to manage those risks in an effort to mitigate the effect of foreign currency fluctuations on our earnings and cash flows. A ten percent change in average exchange rates versus the U.S. Dollar would have resulted in an approximate $890.0 million change to our revenues for the year ended December 31, 2017.
We purchase certain of our new vehicles, parts and other products from non-U.S. manufacturers. Although we purchase the majority of our inventories in the local functional currency, our business is subject to certain risks, including, but not limited to, differing economic conditions, changes in political climate, differing tax structures, other regulations and restrictions, and foreign exchange rate volatility which may influence such manufacturers’ ability to provide their products at competitive prices in the local jurisdictions. Our future results could be materially and adversely impacted by changes in these or other factors.
Item 8. Financial Statements and Supplementary Data
The consolidated financial statements listed in the accompanying Index to Consolidated Financial Statements are incorporated by reference into this Item 8.
Item 9. Changes in and Disagreements with Accountants on Accounting and Financial Disclosure
Deloitte & Touche LLP is our principal independent registered public accounting firm. In delivering its audit opinion, Deloitte & Touche LLP has historically relied on the opinions of KPMG LLP, principally in respect of our subsidiary which holds our U.K. operations. In an effort to achieve synergies associated with retaining only one auditing firm, our Audit Committee approved the dismissal of KPMG LLP on May 9, 2017 and Deloitte & Touche LLP is now our sole independent auditor, as previously disclosed.
The reports of KPMG LLP for the fiscal years ended December 31, 2016 and December 31, 2015 did not contain any adverse opinion or disclaimer of opinion, and were not qualified or modified as to uncertainty, audit scope or accounting principle. During our fiscal years ended December 31, 2016 and 2015 and through the subsequent date of dismissal (i) there were no disagreements (as that term is defined in Item 304(a)(1)(iv) of Regulation S-K and the related instructions) between us and KPMG LLP on any matter of accounting principles or practices, financial statement disclosure, or auditing scope or procedure, which, if not resolved to the satisfaction of KPMG LLP would have caused KPMG LLP to make reference to the subject matter of the disagreement in connection with its reports on our consolidated financial statements for such years, and (ii) there were no “reportable events” (as that term is defined in Item 304(a)(1)(v) of Regulation S-K).
Item 9A. Controls and Procedures
Under the supervision and with the participation of our management, including the principal executive and financial officers, we conducted an evaluation of the effectiveness of our disclosure controls and procedures (as such term is defined in Rules 13a-15(e) and 15d-15(e) under the Securities Exchange Act of 1934, as amended (the “Exchange Act”)), as of the end of the period covered by this report. Our disclosure controls and procedures are designed to ensure that information required to be disclosed by us in the reports we file under the Exchange Act is recorded, processed, summarized and reported within the time periods specified in the SEC’s rules and forms, and that such information is accumulated and communicated to management, including our principal executive and financial officers, to allow timely discussions regarding required disclosure.
Based upon this evaluation, our principal executive and financial officers concluded that our disclosure controls and procedures were effective as of the end of the period covered by this report. In addition, we maintain internal controls designed to provide us with the information required for accounting and financial reporting purposes. There were no
61
changes in our internal control over financial reporting that occurred during the most recent quarter that materially affected, or are reasonably likely to materially affect, our internal control over financial reporting.
Management’s and our auditor’s reports on our internal control over financial reporting are included with our financial statements filed as part of this Annual Report on Form 10-K.
Not applicable.
62
The information required by Items 10 through 14 is included in our definitive proxy statement under the captions “Election of Directors,” “Our Corporate Governance,” “Ratification of the Selection of our Independent Auditor,” “Advisory Vote on Executive Compensation,” “Executive Officers,” “Compensation Committee Report,” “Compensation Discussion and Analysis,” “Executive Compensation,” “Director Compensation,” “Security Ownership of Certain Beneficial Owners and Management,” and “Related Party Transactions.” Such information is incorporated herein by reference.
Securities Authorized for Issuance Under Equity Compensation Plans
The following table provides details regarding the shares of common stock issuable upon the exercise of outstanding options, warrants and rights granted under our equity compensation plans (including individual equity compensation arrangements) as of December 31, 2017. Our equity plan is described in more detail in Part II, Item 8, Note 13 of the Notes to our Consolidated Financial Statements appearing below in this report.
|
|
|
Number of securities to be issued upon exercise of outstanding options, warrants and rights |
|
|
Weighted average exercise price of outstanding options, warrants and rights |
|
Number of securities |
|
|
Plan Category |
|
(A) |
|
|
(B) |
|
(C) |
|
|
Equity compensation plans approved by security holders |
|
— |
|
$ |
— |
|
3,219,205 |
|
|
Equity compensation plans not approved by security holders |
|
— |
|
|
— |
|
— |
|
|
Total |
|
— |
|
$ |
— |
|
3,219,205 |
|
Item 15. Exhibits, Financial Statement Schedules
|
(1) |
Financial Statements |
The consolidated financial statements listed in the accompanying Index to Consolidated Financial Statements are filed as part of this Annual Report on Form 10-K.
|
(2) |
Financial Statement Schedule |
The Schedule II — Valuation and Qualifying Accounts following the Consolidated Financial Statements is filed as part of this Annual Report on Form 10-K.
|
(3) |
Exhibits |
The Exhibits listed below are filed as part of this Annual Report on Form 10-K.
None.
63
INDEX OF EXHIBITS
Each management contract or compensatory plan or arrangement is identified with an asterisk.
|
3.1 |
|
|
3.2 |
|
|
4.1.1 |
|
|
4.1.2 |
|
|
4.1.3 |
|
|
4.1.4 |
|
|
4.1.5 |
|
|
4.2.1 |
|
|
4.2.2 |
|
|
4.2.3 |
|
|
4.2.4 |
|
|
4.2.5 |
|
|
4.2.6 |
|
|
4.2.7 |
|
|
4.2.8 |
|
|
4.2.9 |
|
|
4.3.1 |
|
|
4.3.2 |
64
|
4.3.3 |
|
|
4.3.4 |
|
|
4.4 |
|
|
*10.1 |
|
|
*10.2 |
|
|
*10.3 |
|
|
*10.4 |
|
|
*10.5 |
|
|
*10.6 |
|
|
10.7.1 |
|
|
10.7.2 |
|
|
10.8 |
|
|
10.9 |
|
|
10.10 |
|
|
10.11.1 |
|
|
10.11.2 |
|
|
10.12 |
|
|
10.13 |
65
|
10.14 |
|
|
10.15 |
|
|
10.16 |
|
|
10.17 |
|
|
10.18 |
|
|
12 |
|
|
21 |
|
|
23.1 |
|
|
23.2 |
|
|
23.3 |
|
|
31.1 |
|
|
31.2 |
|
|
32 |
|
|
101.INS |
XBRL Instance Document. |
|
101.SCH |
XBRL Taxonomy Extension Schema. |
|
101.CAL |
XBRL Taxonomy Extension Calculation Linkbase. |
|
101.DEF |
XBRL Taxonomy Extension Definition Linkbase. |
|
101.LAB |
XBRL Taxonomy Extension Label Linkbase. |
|
101.PRE |
XBRL Taxonomy Extension Presentation Linkbase. |
*Compensatory plans or contracts
In accordance with Item 601(b)(4)(iii)(A) of Regulation S-K, copies of certain instruments defining the rights of holders of long-term debt of the Company or its subsidiaries are not filed herewith. We hereby agree to furnish a copy of any such instrument to the Commission upon request.
66
SIGNATURES
Pursuant to the requirements of Section 13 or 15(d) of the Securities Exchange Act of 1934, the registrant has duly caused this report to be signed on its behalf by the undersigned, thereunto duly authorized on February 22, 2018.
|
|
Penske Automotive Group, Inc. |
|
|
|
|
|
|
|
By: |
/s/ Roger S. Penske |
|
|
|
Roger S. Penske Chair of the Board and Chief Executive Officer |
Pursuant to the requirements of the Securities Exchange Act of 1934, this report has been signed below by the following persons on behalf of the registrant and in the capacities and on the dates indicated.
|
Signature |
|
Title |
|
Date |
|
|
|
|
|
|
|
|
|
/s/ Roger S. Penske |
|
Chair of the Board and |
|
February 22, 2018 |
|
|
Roger S. Penske |
|
Chief Executive Officer (Principal Executive Officer) |
|
|
|
|
|
|
|
|
|
|
|
/s/ J.D. Carlson |
|
Executive Vice President and Chief Financial Officer |
|
February 22, 2018 |
|
|
J.D. Carlson |
|
(Principal Financial and Accounting Officer) |
|
|
|
|
|
|
|
|
|
|
|
/s/ John D. Barr |
|
Director |
|
February 22, 2018 |
|
|
John D. Barr |
|
|
|
|
|
|
|
|
|
|
|
|
|
/s/ Lisa Davis |
|
Director |
|
February 22, 2018 |
|
|
Lisa Davis |
|
|
|
|
|
|
|
|
|
|
|
|
|
/s/ Michael R. Eisenson |
|
Director |
|
February 22, 2018 |
|
|
Michael R. Eisenson |
|
|
|
|
|
|
|
|
|
|
|
|
|
/s/ Robert H. Kurnick, Jr. |
|
Director |
|
February 22, 2018 |
|
|
Robert H. Kurnick, Jr. |
|
|
|
|
|
|
|
|
|
|
|
|
|
/s/ William J. Lovejoy |
|
Director |
|
February 22, 2018 |
|
|
William J. Lovejoy |
|
|
|
|
|
|
|
|
|
|
|
|
|
/s/ Kimberly J. McWaters |
|
Director |
|
February 22, 2018 |
|
|
Kimberly J. McWaters |
|
|
|
|
|
|
|
|
|
|
|
|
|
/s/ Lucio A. Noto |
|
Director |
|
February 22, 2018 |
|
|
Lucio A. Noto |
|
|
|
|
|
|
|
|
|
|
|
|
|
/s/ Roger S. Penske Jr. |
|
Director |
|
February 22, 2018 |
|
|
Roger S. Penske Jr. |
|
|
|
|
|
|
|
|
|
|
|
|
|
/s/ Sandra E. Pierce |
|
Director |
|
February 22, 2018 |
|
|
Sandra E. Pierce |
|
|
|
|
|
|
|
|
|
|
|
|
|
/s/ Kanji Sasaki |
|
Director |
|
February 22, 2018 |
|
|
Kanji Sasaki |
|
|
|
|
|
|
|
|
|
|
|
|
|
/s/ Greg C. Smith |
|
Director |
|
February 22, 2018 |
|
|
Greg C. Smith |
|
|
|
|
|
|
|
|
|
|
|
|
|
/s/ Ronald G. Steinhart |
|
Director |
|
February 22, 2018 |
|
|
Ronald G. Steinhart |
|
|
|
|
|
|
|
|
|
|
|
|
|
/s/ H. Brian Thompson |
|
Director |
|
February 22, 2018 |
|
|
H. Brian Thompson |
|
|
|
|
|
67
INDEX TO CONSOLIDATED FINANCIAL STATEMENTS
PENSKE AUTOMOTIVE GROUP, INC.
As of December 31, 2017 and 2016 and For the Years Ended
December 31, 2017, 2016 and 2015
|
Management Report on Internal Control Over Financial Reporting |
F-2 |
|
F-3 |
|
|
F-7 |
|
|
F-8 |
|
|
F-9 |
|
|
F-10 |
|
|
F-11 |
|
|
F-12 |
F-1
MANAGEMENT REPORT ON INTERNAL CONTROL OVER FINANCIAL REPORTING
The management of Penske Automotive Group, Inc. and subsidiaries (the “Company”) is responsible for establishing and maintaining adequate internal control over financial reporting. The Company’s internal control system was designed to provide reasonable assurance to the Company’s management and board of directors that the Company’s internal control over financial reporting provides reasonable assurance regarding the reliability of financial reporting and the preparation and presentation of financial statements for external purposes in accordance with accounting principles generally accepted in the United States of America.
All internal control systems, no matter how well designed, have inherent limitations. Therefore, even those systems determined to be effective can provide only reasonable assurance with respect to financial statement preparation and presentation.
Management assessed the effectiveness of the Company’s internal control over financial reporting as of December 31, 2017. In making this assessment, it used the criteria set forth by the Committee of Sponsoring Organizations of the Treadway Commission in Internal Control — Integrated Framework (2013). Based on our assessment we believe that, as of December 31, 2017, the Company’s internal control over financial reporting is effective based on those criteria.
The Company’s independent registered public accounting firm that audited the consolidated financial statements included in the Company’s Annual Report on Form 10-K has issued an audit report on the effectiveness of the Company’s internal control over financial reporting. This report appears on page F-3.
Penske Automotive Group, Inc.
February 22, 2018
F-2
REPORT OF INDEPENDENT REGISTERED PUBLIC ACCOUNTING FIRM
To the Stockholders and the Board of Directors of Penske Automotive Group, Inc.
Opinions on the Financial Statements and Internal Control Over Financial Reporting
We have audited the accompanying consolidated balance sheets of Penske Automotive Group, Inc. and subsidiaries (the “Company”) as of December 31, 2017 and 2016, and the related consolidated statements of income, comprehensive income, equity, and cash flows, for each of the three years in the period ended December 31, 2017, and the related notes and the schedule listed in the Index at Item 15 (collectively referred to as the “financial statements”). We also have audited the Company’s internal control over financial reporting as of December 31, 2017, based on criteria established in Internal Control — Integrated Framework (2013) issued by the Committee of Sponsoring Organizations of the Treadway Commission (COSO). In our opinion, based on our audits and the reports of the other auditors for 2016 and 2015, the financial statements referred to above present fairly, in all material respects, the financial position of the Company as of December 31, 2017 and 2016, and the results of its operations and its cash flows for each of the three years in the period ended December 31, 2017, in conformity with accounting principles generally accepted in the United States of America. Also, in our opinion, the Company maintained, in all material respects, effective internal control over financial reporting as of December 31, 2017, based on criteria established in Internal Control — Integrated Framework (2013) issued by COSO.
We did not audit the financial statements of Sytner Group Limited (a consolidated subsidiary) as of and for the year ended December 31, 2016, which statements reflect total assets constituting 21% of consolidated total assets as of December 31, 2016, and total revenues constituting 32% of consolidated total revenues for the year then ended. Those financial statements were audited by other auditors whose report has been furnished to us, and our opinion, insofar as it relates to the amounts included for Sytner Group Limited as of and for the year ended December 31, 2016, is based solely on the report of the other auditors. We also did not audit the financial statements of UAG UK Holdings Limited and subsidiaries (a consolidated subsidiary) for the year ended December 31, 2015, which statements reflect total revenues constituting 39% of consolidated total revenues for the year ended December 31, 2015. Those financial statements were audited by other auditors whose report has been furnished to us, and our opinion, insofar as it relates to the amounts included for UAG UK Holdings Limited and subsidiaries for the year ended December 31, 2015, is based solely on the report of the other auditors.
Basis for Opinions
The Company’s management is responsible for these financial statements, for maintaining effective internal control over financial reporting, and for its assessment of the effectiveness of internal control over financial reporting, included in the accompanying Management Report on Internal Control Over Financial Reporting. Our responsibility is to express an opinion on these financial statements and an opinion on the Company’s internal control over financial reporting based on our audits. We are a public accounting firm registered with the Public Company Accounting Oversight Board (United States) (PCAOB) and are required to be independent with respect to the Company in accordance with the U.S. federal securities laws and the applicable rules and regulations of the Securities and Exchange Commission and the PCAOB.
We conducted our audits in accordance with the standards of the PCAOB. Those standards require that we plan and perform the audits to obtain reasonable assurance about whether the financial statements are free of material misstatement, whether due to error or fraud, and whether effective internal control over financial reporting was maintained in all material respects.
Our audits of the financial statements included performing procedures to assess the risks of material misstatement of the financial statements, whether due to error or fraud, and performing procedures to respond to those risks. Such procedures included examining, on a test basis, evidence regarding the amounts and disclosures in the financial statements. Our audits also included evaluating the accounting principles used and significant estimates made by management, as well as evaluating the overall presentation of the financial statements. Our audit of internal control over financial reporting included obtaining an understanding of internal control over financial reporting, assessing the risk that a material weakness exists, and testing and evaluating the design and operating effectiveness of internal control
F-3
based on the assessed risk. Our audits also included performing such other procedures as we considered necessary in the circumstances. We believe that our audits provide a reasonable basis for our opinions.
Definition and Limitations of Internal Control Over Financial Reporting
A company’s internal control over financial reporting is a process designed to provide reasonable assurance regarding the reliability of financial reporting and the preparation of financial statements for external purposes in accordance with generally accepted accounting principles. A company’s internal control over financial reporting includes those policies and procedures that (1) pertain to the maintenance of records that, in reasonable detail, accurately and fairly reflect the transactions and dispositions of the assets of the company; (2) provide reasonable assurance that transactions are recorded as necessary to permit preparation of financial statements in accordance with generally accepted accounting principles, and that receipts and expenditures of the company are being made only in accordance with authorizations of management and directors of the company; and (3) provide reasonable assurance regarding prevention or timely detection of unauthorized acquisition, use, or disposition of the company’s assets that could have a material effect on the financial statements.
Because of its inherent limitations, internal control over financial reporting may not prevent or detect misstatements. Also, projections of any evaluation of effectiveness to future periods are subject to the risk that controls may become inadequate because of changes in conditions, or that the degree of compliance with the policies or procedures may deteriorate.
/s/ Deloitte & Touche LLP
Detroit, Michigan
February 22, 2018
We have served as the Company’s auditor since 1999.
F-4
REPORT OF INDEPENDENT REGISTERED PUBLIC ACCOUNTING FIRM
The Board of Directors and Shareholders
Sytner Group Limited
We have audited the consolidated balance sheet of Sytner Group Limited (“Sytner”) and subsidiaries (together the “Company”) as of December 31, 2016, and the related consolidated statements of income, comprehensive income, equity and cash flows for the year then ended. In connection with our audit of the consolidated financial statements, we also have audited the related financial statement schedule. These consolidated financial statements and financial statement schedule are the responsibility of Sytner’s management. Our responsibility is to express an opinion on these consolidated financial statements and the financial statement schedule based on our audit.
We conducted our audit in accordance with the standards of the Public Company Accounting Oversight Board (United States). Those standards require that we plan and perform the audit to obtain reasonable assurance about whether the financial statements are free of material misstatement. An audit includes examining, on a test basis, evidence supporting the amounts and disclosures in the financial statements. An audit also includes assessing the accounting principles used and significant estimates made by management, as well as evaluating the overall financial statement presentation. We believe that our audit provides a reasonable basis for our opinion.
In our opinion, the consolidated financial statements referred to above present fairly, in all material respects, the financial position of the Company as of December 31, 2016, and the results of its operations and its cash flows for the year then ended, in conformity with U.S. generally accepted accounting principles. In addition, in our opinion, the related financial statement schedule, when considered in relation to the basic consolidated financial statements taken as a whole, presents fairly, in all material respects, the information set forth therein.
/s/ KPMG LLP
Milton Keynes, United Kingdom
February 24, 2017
F-5
REPORT OF INDEPENDENT REGISTERED PUBLIC ACCOUNTING FIRM
The Board of Directors and Shareholders
UAG UK Holdings Limited
We have audited the consolidated statements of income, comprehensive income, equity and cash flows of UAG UK Holdings Limited (“UAG”) and subsidiaries (together the “Company”) for the year ended December 31, 2015. In connection with our audit of the consolidated financial statements, we also have audited the related financial statement schedule. These consolidated financial statements and financial statement schedule are the responsibility of UAG’s management. Our responsibility is to express an opinion on these consolidated financial statements and the financial statement schedule based on our audit.
We conducted our audit in accordance with the standards of the Public Company Accounting Oversight Board (United States). Those standards require that we plan and perform the audit to obtain reasonable assurance about whether the financial statements are free of material misstatement. An audit includes examining, on a test basis, evidence supporting the amounts and disclosures in the financial statements. An audit also includes assessing the accounting principles used and significant estimates made by management, as well as evaluating the overall financial statement presentation. We believe that our audit provides a reasonable basis for our opinion.
In our opinion, the consolidated financial statements referred to above present fairly, in all material respects, the results of operations and the cash flows of the Company for the year ended December 31, 2015, in conformity with U.S. generally accepted accounting principles. Also, in our opinion, the related financial statement schedule, when considered in relation to the basic consolidated financial statements taken as a whole, presents fairly, in all material respects, the information set forth therein.
/s/ KPMG LLP
Milton Keynes, United Kingdom
February 25, 2016
F-6
PENSKE AUTOMOTIVE GROUP, INC.
|
|
|
December 31, |
|
||||
|
|
|
2017 |
|
2016 |
|
||
|
|
|
(In millions, except share and |
|
||||
|
|
|
per share amounts) |
|
||||
|
ASSETS |
|
|
|
|
|
|
|
|
Cash and cash equivalents |
|
$ |
45.7 |
|
$ |
24.0 |
|
|
Accounts receivable, net of allowance for doubtful accounts of $5.5 and $4.5 |
|
|
954.9 |
|
|
879.0 |
|
|
Inventories |
|
|
3,944.1 |
|
|
3,408.2 |
|
|
Other current assets |
|
|
81.8 |
|
|
73.9 |
|
|
Assets held for sale |
|
|
— |
|
|
8.4 |
|
|
Total current assets |
|
|
5,026.5 |
|
|
4,393.5 |
|
|
Property and equipment, net |
|
|
2,108.6 |
|
|
1,806.5 |
|
|
Goodwill |
|
|
1,660.5 |
|
|
1,291.2 |
|
|
Other indefinite-lived intangible assets |
|
|
474.0 |
|
|
420.1 |
|
|
Equity method investments |
|
|
1,256.6 |
|
|
893.4 |
|
|
Other long-term assets |
|
|
14.4 |
|
|
28.3 |
|
|
Total assets |
|
$ |
10,540.6 |
|
$ |
8,833.0 |
|
|
LIABILITIES AND EQUITY |
|
|
|
|
|
|
|
|
Floor plan notes payable |
|
$ |
2,343.2 |
|
$ |
2,084.5 |
|
|
Floor plan notes payable — non-trade |
|
|
1,418.6 |
|
|
1,233.3 |
|
|
Accounts payable |
|
|
641.6 |
|
|
497.4 |
|
|
Accrued expenses |
|
|
523.5 |
|
|
360.0 |
|
|
Current portion of long-term debt |
|
|
72.8 |
|
|
48.3 |
|
|
Liabilities held for sale |
|
|
0.7 |
|
|
6.1 |
|
|
Total current liabilities |
|
|
5,000.4 |
|
|
4,229.6 |
|
|
Long-term debt |
|
|
2,090.4 |
|
|
1,828.8 |
|
|
Deferred tax liabilities |
|
|
481.5 |
|
|
564.6 |
|
|
Other long-term liabilities |
|
|
540.3 |
|
|
430.5 |
|
|
Total liabilities |
|
|
8,112.6 |
|
|
7,053.5 |
|
|
Commitments and contingent liabilities (Note 11) |
|
|
|
|
|
|
|
|
Equity |
|
|
|
|
|
|
|
|
Penske Automotive Group stockholders’ equity: |
|
|
|
|
|
|
|
|
Preferred Stock, $0.0001 par value; 100,000 shares authorized; none issued and outstanding |
|
|
— |
|
|
— |
|
|
Common Stock, $0.0001 par value, 240,000,000 shares authorized; 85,787,507 shares issued and outstanding at December 31, 2017; 85,214,345 shares issued and outstanding at December 31, 2016 |
|
|
— |
|
|
— |
|
|
Non-voting Common Stock, $0.0001 par value; 7,125,000 shares authorized; none issued and outstanding |
|
|
— |
|
|
— |
|
|
Class C Common Stock, $0.0001 par value; 20,000,000 shares authorized; none issued and outstanding |
|
|
— |
|
|
— |
|
|
Additional paid-in capital |
|
|
532.3 |
|
|
497.1 |
|
|
Retained earnings |
|
|
2,009.4 |
|
|
1,504.5 |
|
|
Accumulated other comprehensive income (loss) |
|
|
(146.5) |
|
|
(250.7) |
|
|
Total Penske Automotive Group stockholders’ equity |
|
|
2,395.2 |
|
|
1,750.9 |
|
|
Non-controlling interest |
|
|
32.8 |
|
|
28.6 |
|
|
Total equity |
|
|
2,428.0 |
|
|
1,779.5 |
|
|
Total liabilities and equity |
|
$ |
10,540.6 |
|
$ |
8,833.0 |
|
See Notes to Consolidated Financial Statements.
F-7
PENSKE AUTOMOTIVE GROUP, INC.
CONSOLIDATED STATEMENTS OF INCOME
|
|
|
Year Ended December 31, |
|
|||||||
|
|
|
2017 |
|
2016 |
|
2015 |
|
|||
|
|
|
(In millions, except share and per share amounts) |
|
|||||||
|
Revenue: |
|
|
|
|
|
|
|
|
|
|
|
Retail automotive dealership |
|
$ |
19,824.3 |
|
$ |
18,673.2 |
|
$ |
17,896.3 |
|
|
Retail commercial truck dealership |
|
|
1,048.0 |
|
|
1,000.7 |
|
|
944.1 |
|
|
Commercial vehicle distribution and other |
|
|
514.6 |
|
|
444.6 |
|
|
444.5 |
|
|
Total revenues |
|
|
21,386.9 |
|
|
20,118.5 |
|
|
19,284.9 |
|
|
Cost of sales: |
|
|
|
|
|
|
|
|
|
|
|
Retail automotive dealership |
|
|
16,899.5 |
|
|
15,968.4 |
|
|
15,288.3 |
|
|
Retail commercial truck dealership |
|
|
882.2 |
|
|
857.8 |
|
|
797.1 |
|
|
Commercial vehicle distribution and other |
|
|
382.7 |
|
|
325.7 |
|
|
332.0 |
|
|
Total cost of sales |
|
|
18,164.4 |
|
|
17,151.9 |
|
|
16,417.4 |
|
|
Gross profit |
|
|
3,222.5 |
|
|
2,966.6 |
|
|
2,867.5 |
|
|
Selling, general and administrative expenses |
|
|
2,516.0 |
|
|
2,302.0 |
|
|
2,223.0 |
|
|
Depreciation |
|
|
95.1 |
|
|
89.7 |
|
|
78.0 |
|
|
Operating income |
|
|
611.4 |
|
|
574.9 |
|
|
566.5 |
|
|
Floor plan interest expense |
|
|
(63.4) |
|
|
(50.9) |
|
|
(44.5) |
|
|
Other interest expense |
|
|
(107.4) |
|
|
(85.4) |
|
|
(69.4) |
|
|
Equity in earnings of affiliates |
|
|
107.6 |
|
|
69.5 |
|
|
39.3 |
|
|
Income from continuing operations before income taxes |
|
|
548.2 |
|
|
508.1 |
|
|
491.9 |
|
|
Income taxes |
|
|
64.8 |
|
|
(160.7) |
|
|
(158.0) |
|
|
Income from continuing operations |
|
|
613.0 |
|
|
347.4 |
|
|
333.9 |
|
|
Loss from discontinued operations, net of tax |
|
|
(0.2) |
|
|
(1.0) |
|
|
(3.5) |
|
|
Net income |
|
|
612.8 |
|
|
346.4 |
|
|
330.4 |
|
|
Less: (Loss) income attributable to non-controlling interests |
|
|
(0.5) |
|
|
3.5 |
|
|
4.3 |
|
|
Net income attributable to Penske Automotive Group common stockholders |
|
$ |
613.3 |
|
$ |
342.9 |
|
$ |
326.1 |
|
|
Basic earnings per share attributable to Penske Automotive Group common stockholders: |
|
|
|
|
|
|
|
|
|
|
|
Continuing operations |
|
$ |
7.14 |
|
$ |
4.00 |
|
$ |
3.67 |
|
|
Discontinued operations |
|
|
(0.00) |
|
|
(0.01) |
|
|
(0.04) |
|
|
Net income attributable to Penske Automotive Group common stockholders |
|
$ |
7.14 |
|
$ |
3.99 |
|
$ |
3.63 |
|
|
Shares used in determining basic earnings per share |
|
|
85,877,227 |
|
|
86,000,754 |
|
|
89,759,626 |
|
|
Diluted earnings per share attributable to Penske Automotive Group common stockholders: |
|
|
|
|
|
|
|
|
|
|
|
Continuing operations |
|
$ |
7.14 |
|
$ |
4.00 |
|
$ |
3.67 |
|
|
Discontinued operations |
|
|
(0.00) |
|
|
(0.01) |
|
|
(0.04) |
|
|
Net income attributable to Penske Automotive Group common stockholders |
|
$ |
7.14 |
|
$ |
3.99 |
|
$ |
3.63 |
|
|
Shares used in determining diluted earnings per share |
|
|
85,877,227 |
|
|
86,000,754 |
|
|
89,759,626 |
|
|
Amounts attributable to Penske Automotive Group common stockholders: |
|
|
|
|
|
|
|
|
|
|
|
Income from continuing operations |
|
$ |
613.0 |
|
$ |
347.4 |
|
$ |
333.9 |
|
|
Less: (Loss) income attributable to non-controlling interests |
|
|
(0.5) |
|
|
3.5 |
|
|
4.3 |
|
|
Income from continuing operations, net of tax |
|
|
613.5 |
|
|
343.9 |
|
|
329.6 |
|
|
Loss from discontinued operations, net of tax |
|
|
(0.2) |
|
|
(1.0) |
|
|
(3.5) |
|
|
Net income attributable to Penske Automotive Group common stockholders |
|
$ |
613.3 |
|
$ |
342.9 |
|
$ |
326.1 |
|
|
Cash dividends per share |
|
$ |
1.26 |
|
$ |
1.10 |
|
$ |
0.94 |
|
See Notes to Consolidated Financial Statements.
F-8
PENSKE AUTOMOTIVE GROUP, INC.
CONSOLIDATED STATEMENTS OF COMPREHENSIVE INCOME
|
|
|
Year Ended December 31, |
|
|||||||
|
|
|
2017 |
|
2016 |
|
2015 |
|
|||
|
|
|
(In millions) |
|
|||||||
|
Net income |
|
$ |
612.8 |
|
$ |
346.4 |
|
$ |
330.4 |
|
|
Other comprehensive income: |
|
|
|
|
|
|
|
|
|
|
|
Foreign currency translation adjustment |
|
|
99.2 |
|
|
(117.3) |
|
|
(62.9) |
|
|
Other adjustments to comprehensive income, net |
|
|
8.2 |
|
|
(11.7) |
|
|
(7.4) |
|
|
Other comprehensive income (loss), net of tax |
|
|
107.4 |
|
|
(129.0) |
|
|
(70.3) |
|
|
Comprehensive income |
|
|
720.2 |
|
|
217.4 |
|
|
260.1 |
|
|
Less: Comprehensive income attributable to non-controlling interests |
|
|
2.7 |
|
|
2.7 |
|
|
3.2 |
|
|
Comprehensive income attributable to Penske Automotive Group common stockholders |
|
$ |
717.5 |
|
$ |
214.7 |
|
$ |
256.9 |
|
See Notes to Consolidated Financial Statements.
F-9
PENSKE AUTOMOTIVE GROUP, INC.
CONSOLIDATED STATEMENTS OF CASH FLOWS
|
|
|
Year Ended December 31, |
|
|||||||
|
|
|
2017 |
|
2016 |
|
2015 |
|
|||
|
|
|
(In millions) |
|
|||||||
|
Operating Activities: |
|
|
|
|
|
|
|
|
|
|
|
Net income |
|
$ |
612.8 |
|
$ |
346.4 |
|
$ |
330.4 |
|
|
Adjustments to reconcile net income to net cash from continuing operating activities: |
|
|
|
|
|
|
|
|
|
|
|
Depreciation |
|
|
95.1 |
|
|
89.7 |
|
|
78.0 |
|
|
Earnings of equity method investments |
|
|
(68.9) |
|
|
(50.0) |
|
|
(28.0) |
|
|
Loss from discontinued operations, net of tax |
|
|
0.2 |
|
|
1.0 |
|
|
3.5 |
|
|
Deferred income taxes |
|
|
(108.7) |
|
|
162.2 |
|
|
44.6 |
|
|
Changes in operating assets and liabilities: |
|
|
|
|
|
|
|
|
|
|
|
Accounts receivable |
|
|
(73.1) |
|
|
(92.5) |
|
|
(23.5) |
|
|
Inventories |
|
|
(419.9) |
|
|
130.4 |
|
|
(428.4) |
|
|
Floor plan notes payable |
|
|
276.3 |
|
|
(162.8) |
|
|
360.8 |
|
|
Accounts payable and accrued expenses |
|
|
272.0 |
|
|
(17.8) |
|
|
66.0 |
|
|
Other |
|
|
37.2 |
|
|
(35.3) |
|
|
(5.6) |
|
|
Net cash provided by continuing operating activities |
|
|
623.0 |
|
|
371.3 |
|
|
397.8 |
|
|
Investing Activities: |
|
|
|
|
|
|
|
|
|
|
|
Purchase of equipment and improvements |
|
|
(247.0) |
|
|
(203.1) |
|
|
(199.5) |
|
|
Proceeds from sale-leaseback transactions |
|
|
22.2 |
|
|
— |
|
|
— |
|
|
Acquisition of additional ownership interest in Penske Truck Leasing |
|
|
(239.1) |
|
|
(498.5) |
|
|
— |
|
|
Acquisitions net, including repayment of sellers’ floor plan notes payable of $101.6, $62.2 and $60.3, respectively |
|
|
(449.7) |
|
|
(140.8) |
|
|
(156.9) |
|
|
Other |
|
|
(15.1) |
|
|
5.7 |
|
|
4.7 |
|
|
Net cash used in continuing investing activities |
|
|
(928.7) |
|
|
(836.7) |
|
|
(351.7) |
|
|
Financing Activities: |
|
|
|
|
|
|
|
|
|
|
|
Proceeds from borrowings under U.S. credit agreement revolving credit line |
|
|
2,040.0 |
|
|
1,476.5 |
|
|
1,420.4 |
|
|
Repayments under U.S. credit agreement revolving credit line |
|
|
(2,108.0) |
|
|
(1,396.5) |
|
|
(1,260.4) |
|
|
Repayments under U.S. credit agreement term loan |
|
|
— |
|
|
— |
|
|
(88.0) |
|
|
Repayment of U.S. commercial truck capital loan |
|
|
— |
|
|
— |
|
|
(60.5) |
|
|
Issuance of 3.75% senior subordinated notes |
|
|
300.0 |
|
|
— |
|
|
— |
|
|
Issuance of 5.50% senior subordinated notes |
|
|
— |
|
|
500.0 |
|
|
— |
|
|
Net borrowings (repayments) of other long-term debt |
|
|
42.0 |
|
|
42.9 |
|
|
(73.6) |
|
|
Net borrowings of floor plan notes payable — non-trade |
|
|
185.3 |
|
|
101.0 |
|
|
154.2 |
|
|
Payment of debt issuance costs |
|
|
(4.0) |
|
|
(6.7) |
|
|
(1.8) |
|
|
Repurchases of common stock |
|
|
(18.5) |
|
|
(173.6) |
|
|
(48.9) |
|
|
Dividends |
|
|
(108.4) |
|
|
(95.1) |
|
|
(84.8) |
|
|
Other |
|
|
(5.8) |
|
|
(15.5) |
|
|
(12.2) |
|
|
Net cash provided by (used in) continuing financing activities |
|
|
322.6 |
|
|
433.0 |
|
|
(55.6) |
|
|
Discontinued operations: |
|
|
|
|
|
|
|
|
|
|
|
Net cash provided by (used in) discontinued operating activities |
|
|
0.5 |
|
|
1.6 |
|
|
(5.5) |
|
|
Net cash provided by discontinued investing activities |
|
|
2.4 |
|
|
1.7 |
|
|
129.6 |
|
|
Net cash used in discontinued financing activities |
|
|
(0.2) |
|
|
(0.2) |
|
|
(87.1) |
|
|
Net cash provided by discontinued operations |
|
|
2.7 |
|
|
3.1 |
|
|
37.0 |
|
|
Effect of exchange rate changes on cash and cash equivalents |
|
|
2.1 |
|
|
(9.1) |
|
|
(1.4) |
|
|
Net change in cash and cash equivalents |
|
|
21.7 |
|
|
(38.4) |
|
|
26.1 |
|
|
Cash and cash equivalents, beginning of period |
|
|
24.0 |
|
|
62.4 |
|
|
36.3 |
|
|
Cash and cash equivalents, end of period |
|
$ |
45.7 |
|
$ |
24.0 |
|
$ |
62.4 |
|
|
Supplemental disclosures of cash flow information: |
|
|
|
|
|
|
|
|
|
|
|
Cash paid (received) for: |
|
|
|
|
|
|
|
|
|
|
|
Interest |
|
$ |
163.2 |
|
$ |
129.8 |
|
$ |
110.1 |
|
|
Income taxes |
|
|
(29.7) |
|
|
48.6 |
|
|
114.9 |
|
|
Seller financed/assumed debt |
|
|
0.8 |
|
|
— |
|
|
2.6 |
|
|
Non cash activities: |
|
|
|
|
|
|
|
|
|
|
|
Consideration transferred through common stock issuance |
|
$ |
32.4 |
|
$ |
— |
|
$ |
— |
|
|
Contingent consideration |
|
|
20.0 |
|
|
— |
|
|
— |
|
See Notes to Consolidated Financial Statements.
F-10
PENSKE AUTOMOTIVE GROUP, INC.
CONSOLIDATED STATEMENTS OF EQUITY
|
|
|
Voting and Non-voting |
|
|
|
|
|
|
|
|
|
|
|
|
|
|
|
|
|
|||||
|
|
|
Common Stock |
|
Additional |
|
|
|
Accumulated |
|
Total |
|
|
|
|
|
|
|
|||||||
|
|
|
Issued |
|
|
|
|
Paid-in |
|
Retained |
|
Other Comprehensive |
|
Penske Automotive Group |
|
Non-controlling |
|
Total |
|
||||||
|
|
|
Shares |
|
Amount |
|
Capital |
|
Earnings |
|
Income (Loss) |
|
Stockholders’ Equity |
|
Interest |
|
Equity |
|
|||||||
|
|
|
(Dollars in millions) |
|
|||||||||||||||||||||
|
Balance, January 1, 2015 |
|
90,244,840 |
|
$ |
— |
|
$ |
690.7 |
|
$ |
1,015.4 |
|
$ |
(53.3) |
|
$ |
1,652.8 |
|
$ |
28.4 |
|
$ |
1,681.2 |
|
|
Equity compensation |
|
290,580 |
|
|
— |
|
|
14.0 |
|
|
— |
|
|
— |
|
|
14.0 |
|
|
— |
|
|
14.0 |
|
|
Repurchases of common stock |
|
(1,010,696) |
|
|
— |
|
|
(48.9) |
|
|
— |
|
|
— |
|
|
(48.9) |
|
|
— |
|
|
(48.9) |
|
|
Dividends ($0.94 per share) |
|
— |
|
|
— |
|
|
— |
|
|
(84.8) |
|
|
— |
|
|
(84.8) |
|
|
— |
|
|
(84.8) |
|
|
Purchase of controlling interest |
|
— |
|
|
— |
|
|
— |
|
|
— |
|
|
— |
|
|
— |
|
|
22.5 |
|
|
22.5 |
|
|
Purchase of subsidiary shares from non-controlling interest |
|
— |
|
|
— |
|
|
— |
|
|
— |
|
|
— |
|
|
— |
|
|
(6.1) |
|
|
(6.1) |
|
|
Distributions to non-controlling interest |
|
— |
|
|
— |
|
|
— |
|
|
— |
|
|
— |
|
|
— |
|
|
(3.8) |
|
|
(3.8) |
|
|
Sale of subsidiary shares to non-controlling interest |
|
— |
|
|
— |
|
|
0.2 |
|
|
— |
|
|
— |
|
|
0.2 |
|
|
0.5 |
|
|
0.7 |
|
|
Foreign currency translation |
|
— |
|
|
— |
|
|
— |
|
|
— |
|
|
(61.8) |
|
|
(61.8) |
|
|
(1.1) |
|
|
(62.9) |
|
|
Other |
|
— |
|
|
— |
|
|
— |
|
|
— |
|
|
(7.4) |
|
|
(7.4) |
|
|
— |
|
|
(7.4) |
|
|
Net income |
|
— |
|
|
— |
|
|
— |
|
|
326.1 |
|
|
— |
|
|
326.1 |
|
|
4.3 |
|
|
330.4 |
|
|
Balance, December 31, 2015 |
|
89,524,724 |
|
|
— |
|
|
656.0 |
|
|
1,256.7 |
|
|
(122.5) |
|
|
1,790.2 |
|
|
44.7 |
|
|
1,834.9 |
|
|
Equity compensation |
|
346,663 |
|
|
— |
|
|
14.3 |
|
|
— |
|
|
— |
|
|
14.3 |
|
|
— |
|
|
14.3 |
|
|
Repurchases of common stock |
|
(4,657,042) |
|
|
— |
|
|
(173.6) |
|
|
— |
|
|
— |
|
|
(173.6) |
|
|
— |
|
|
(173.6) |
|
|
Dividends ($1.10 per share) |
|
— |
|
|
— |
|
|
— |
|
|
(95.1) |
|
|
— |
|
|
(95.1) |
|
|
— |
|
|
(95.1) |
|
|
Purchase of subsidiary shares from non-controlling interest |
|
— |
|
|
— |
|
|
(0.3) |
|
|
— |
|
|
— |
|
|
(0.3) |
|
|
(10.4) |
|
|
(10.7) |
|
|
Distributions to non-controlling interest |
|
— |
|
|
— |
|
|
— |
|
|
— |
|
|
— |
|
|
— |
|
|
(2.4) |
|
|
(2.4) |
|
|
Foreign currency translation |
|
— |
|
|
— |
|
|
— |
|
|
— |
|
|
(116.5) |
|
|
(116.5) |
|
|
(0.8) |
|
|
(117.3) |
|
|
Other |
|
— |
|
|
— |
|
|
0.7 |
|
|
— |
|
|
(11.7) |
|
|
(11.0) |
|
|
(6.0) |
|
|
(17.0) |
|
|
Net income |
|
— |
|
|
— |
|
|
— |
|
|
342.9 |
|
|
— |
|
|
342.9 |
|
|
3.5 |
|
|
346.4 |
|
|
Balance, December 31, 2016 |
|
85,214,345 |
|
|
— |
|
|
497.1 |
|
|
1,504.5 |
|
|
(250.7) |
|
|
1,750.9 |
|
|
28.6 |
|
|
1,779.5 |
|
|
Equity compensation |
|
343,385 |
|
|
— |
|
|
14.9 |
|
|
— |
|
|
— |
|
|
14.9 |
|
|
— |
|
|
14.9 |
|
|
Repurchases of common stock |
|
(435,710) |
|
|
— |
|
|
(18.5) |
|
|
— |
|
|
— |
|
|
(18.5) |
|
|
— |
|
|
(18.5) |
|
|
Issuance of common stock |
|
665,487 |
|
|
— |
|
|
32.4 |
|
|
— |
|
|
— |
|
|
32.4 |
|
|
— |
|
|
32.4 |
|
|
Dividends ($1.26 per share) |
|
— |
|
|
— |
|
|
— |
|
|
(108.4) |
|
|
— |
|
|
(108.4) |
|
|
— |
|
|
(108.4) |
|
|
Purchase of subsidiary shares from non-controlling interest |
|
— |
|
|
— |
|
|
(0.4) |
|
|
— |
|
|
— |
|
|
(0.4) |
|
|
(0.3) |
|
|
(0.7) |
|
|
Distributions to non-controlling interest |
|
— |
|
|
— |
|
|
— |
|
|
— |
|
|
— |
|
|
— |
|
|
(1.4) |
|
|
(1.4) |
|
|
Foreign currency translation |
|
— |
|
|
— |
|
|
— |
|
|
— |
|
|
96.0 |
|
|
96.0 |
|
|
3.2 |
|
|
99.2 |
|
|
Other |
|
— |
|
|
— |
|
|
6.8 |
|
|
— |
|
|
8.2 |
|
|
15.0 |
|
|
3.2 |
|
|
18.2 |
|
|
Net income |
|
— |
|
|
— |
|
|
— |
|
|
613.3 |
|
|
— |
|
|
613.3 |
|
|
(0.5) |
|
|
612.8 |
|
|
Balance, December 31, 2017 |
|
85,787,507 |
|
$ |
— |
|
$ |
532.3 |
|
$ |
2,009.4 |
|
$ |
(146.5) |
|
$ |
2,395.2 |
|
$ |
32.8 |
|
$ |
2,428.0 |
|
See Notes to Consolidated Financial Statements.
F-11
PENSKE AUTOMOTIVE GROUP, INC.
NOTES TO CONSOLIDATED FINANCIAL STATEMENTS
(In millions, except share and per share amounts)
1. Organization and Summary of Significant Accounting Policies
Unless the context otherwise requires, the use of the terms “PAG,” “we,” “us,” and “our” in these Notes to the Consolidated Financial Statements refers to Penske Automotive Group, Inc. and its consolidated subsidiaries.
Business Overview and Concentrations
We are a diversified international transportation services company that operates automotive and commercial truck dealerships principally in the United States, Canada and Western Europe, and distributes commercial vehicles, diesel engines, gas engines, power systems and related parts and services principally in Australia and New Zealand.
In 2017, our business generated $21.4 billion in total revenue, which is comprised of approximately $19.8 billion from retail automotive dealerships, $1.0 billion from retail commercial truck dealerships and $0.5 billion from commercial vehicle distribution and other operations.
Retail Automotive Dealership. We believe we are the second largest automotive retailer headquartered in the U.S. as measured by the $19.8 billion in total retail automotive dealership revenue we generated in 2017. As of December 31, 2017, we operated 343 retail automotive franchises, of which 155 franchises are located in the U.S. and 188 franchises are located outside of the U.S. The franchises outside the U.S. are located primarily in the U.K.
We are engaged in the sale of new and used motor vehicles and related products and services, including vehicle service, collision repair, and placement of finance and lease contracts, third-party insurance products and other aftermarket products. We operate dealerships under franchise agreements with a number of automotive manufacturers and distributors. In accordance with individual franchise agreements, each dealership is subject to certain rights and restrictions typical of the industry. The ability of the manufacturers to influence the operations of the dealerships, or the loss of a significant number of franchise agreements, could have a material impact on our results of operations, financial position and cash flows.
For the year ended December 31, 2017, Audi/Volkswagen/Porsche/Bentley franchises accounted for 24% of our total retail automotive dealership revenues, BMW/MINI franchises accounted for 23%, Toyota/Lexus franchises accounted for 13%, and Mercedes-Benz/Sprinter/smart accounted for 10%. No other manufacturers’ franchises accounted for more than 10% of our total retail automotive dealership revenues. At December 31, 2017 and 2016, we had receivables from manufacturers of $230.1 million and $196.5 million, respectively. In addition, a large portion of our contracts in transit, which are included in accounts receivable, are due from manufacturers’ captive finance companies.
During the year ended December 31, 2017, we acquired eight retail automotive franchises, were awarded five retail automotive franchises, and disposed of twenty-five retail automotive franchises. Of the retail automotive franchises acquired, two are located in New Jersey and represent the Jaguar and Land Rover brands, two are located in Arizona and represent the Mercedes-Benz and Sprinter brands, two are located in the U.K. and represent the BMW and MINI brands, and two are located in Germany and represent the Audi and Volkswagen brands. Of the franchises disposed of, nine represented franchises in Puerto Rico, five represented smart franchises in the U.S., and five represented BMW, MINI, and Lexus franchises in the U.K.
In the first quarter of 2017, we acquired CarSense in the U.S. and CarShop in the U.K., both businesses representing stand-alone used vehicle dealerships, which we believe complement our existing franchised retail automotive dealership operations and provide scalable opportunities across our market areas. Our CarSense operations consist of five locations operating in the Philadelphia and Pittsburgh, Pennsylvania market areas, including southern New Jersey. Our CarShop operations consist of five retail locations and a vehicle preparation center operating principally throughout Southern England. In January 2018, we expanded our U.K. stand-alone used vehicle dealerships by acquiring The Car People, one of the U.K.’s leading retailers of used vehicles. The Car People has four retail locations operating across Northern England, which complements CarShop’s locations principally in Southern England.
F-12
PENSKE AUTOMOTIVE GROUP, INC.
NOTES TO CONSOLIDATED FINANCIAL STATEMENTS (Continued)
(In millions, except share and per share amounts)
Retail Commercial Truck Dealership. We operate a heavy and medium-duty truck dealership group known as Premier Truck Group (“PTG”) with locations in Texas, Oklahoma, Tennessee, Georgia, and Canada. As of December 31, 2017, PTG operated twenty locations, including fourteen full-service dealerships and six collision centers, offering primarily Freightliner and Western Star branded trucks. Four of these locations were acquired in April 2016 in the greater Toronto, Canada market area, and two of these locations were acquired in December 2016 in the Niagara Falls, Canada market area. PTG also offers a full range of used trucks available for sale as well as service and parts departments, providing a full range of maintenance and repair services.
Commercial Vehicle Distribution. We are the exclusive importer and distributor of Western Star heavy-duty trucks (a Daimler brand), MAN heavy and medium-duty trucks and buses (a VW Group brand), and Dennis Eagle refuse collection vehicles, together with associated parts, across Australia, New Zealand and portions of the Pacific. This business, known as Penske Commercial Vehicles Australia (“PCV Australia”), distributes commercial vehicles and parts to a network of more than 70 dealership locations, including eight company-owned retail commercial vehicle dealerships.
We are also a leading distributor of diesel and gas engines and power systems, principally representing MTU, Detroit Diesel, Mercedes-Benz Industrial, Allison Transmission and MTU Onsite Energy. This business, known as Penske Power Systems (“PPS”), offers products across the on- and off-highway markets in Australia, New Zealand and portions of the Pacific and supports full parts and aftersales service through a network of branches, field locations and dealers across the region. The on-highway portion of this business complements our PCV Australia distribution business, including integrated operations at retail locations selling PCV brands.
Penske Truck Leasing. We currently hold a 28.9% ownership interest in Penske Truck Leasing Co., L.P. (“PTL”), a leading provider of transportation services and supply chain management. PTL is capable of meeting customers’ needs across the supply chain with a broad product offering that includes full-service truck leasing, truck rental and contract maintenance, along with logistic services such as dedicated contract carriage, distribution center management, transportation management and lead logistics provider. On July 27, 2016, we acquired an additional 14.4% ownership interest in PTL from subsidiaries of GE Capital Global Holdings, LLC (collectively, “GE Capital”) for approximately $498.5 million in cash to bring our ownership interest to 23.4%. Prior to this acquisition, we held a 9.0% ownership interest in PTL. On September 7, 2017, we acquired an additional 5.5% ownership interest from GE Capital for approximately $239.1 million in cash. At the same time, affiliates of Mitsui & Co., Ltd. (“Mitsui”), our second largest shareholder, acquired an additional 10.0% ownership interest in PTL at the same valuation. PTL is currently owned 41.1% by Penske Corporation, 28.9% by us, and 30.0% by Mitsui. GE Capital no longer owns any ownership interests in PTL. We account for our investment in PTL under the equity method, and we therefore record our share of PTL’s earnings on our statements of income under the caption “Equity in earnings of affiliates,” which also includes the results of our other equity method investments.
Basis of Presentation
The consolidated financial statements include all majority‑owned subsidiaries. Investments in affiliated companies, representing an ownership interest in the voting stock of the affiliate of between 20% and 50% or an investment in a limited partnership or a limited liability corporation for which our investment is more than minor, are stated at the cost of acquisition plus our equity in undistributed net earnings since acquisition. All intercompany accounts and transactions have been eliminated in consolidation.
The consolidated financial statements, including the comparative periods presented, have been adjusted for entities that have been treated as discontinued operations prior to adoption of ASU No. 2014-08 in accordance with generally accepted accounting principles.
F-13
PENSKE AUTOMOTIVE GROUP, INC.
NOTES TO CONSOLIDATED FINANCIAL STATEMENTS (Continued)
(In millions, except share and per share amounts)
Estimates
The preparation of financial statements in accordance with accounting principles generally accepted in the United States of America requires management to make estimates and assumptions that affect the reported amounts of assets and liabilities, the disclosure of contingent assets and liabilities at the date of the financial statements, and the reported amounts of revenues and expenses during the reporting period. Actual results could differ from those estimates. The accounts requiring the use of significant estimates include accounts receivable, inventories, income taxes, intangible assets, and certain reserves.
Cash and Cash Equivalents
Cash and cash equivalents include all highly‑liquid investments that have an original maturity of three months or less at the date of purchase.
Contracts in Transit
Contracts in transit represent receivables from unaffiliated finance companies relating to the sale of customers’ installment sales and lease contracts arising in connection with the sale of a vehicle by us. Contracts in transit, included in accounts receivable, net in our consolidated balance sheets, amounted to $356.1 million and $322.7 million as of December 31, 2017 and 2016, respectively.
Inventory Valuation
Inventories are stated at the lower of cost or net realizable value. Cost for new and used vehicle inventories includes acquisition, reconditioning, dealer installed accessories, and transportation expenses and is determined using the specific identification method. Inventories of dealership parts and accessories are accounted for using the “first‑in, first‑out” (“FIFO”) method of inventory accounting and the cost is based on factory list prices.
Property and Equipment
Property and equipment are recorded at cost and depreciated over estimated useful lives using the straight‑line method. Useful lives for purposes of computing depreciation for assets, other than leasehold improvements, range between 3 and 15 years. Leasehold improvements and equipment under capital lease are depreciated over the shorter of the term of the lease or the estimated useful life of the asset, not to exceed 40 years.
Expenditures relating to recurring repair and maintenance are expensed as incurred. Expenditures that increase the useful life or substantially increase the serviceability of an existing asset are capitalized. When equipment is sold or otherwise disposed of, the cost and related accumulated depreciation are removed from the balance sheet, with any resulting gain or loss being reflected in income.
Income Taxes
Tax regulations may require items to be included in our tax return at different times than when those items are reflected in our financial statements. Some of the differences are permanent, such as expenses that are not deductible on our tax return, and some are temporary differences, such as the timing of depreciation expense. Temporary differences create deferred tax assets and liabilities. Deferred tax assets generally represent items that will be used as a tax deduction or credit in our tax return in future years which we have already recorded in our financial statements. Deferred tax liabilities generally represent deductions taken on our tax return that have not yet been recognized as an expense in our financial statements. We establish valuation allowances for our deferred tax assets if the amount of expected future taxable income is not more likely than not to allow for the use of the deduction or credit.
F-14
PENSKE AUTOMOTIVE GROUP, INC.
NOTES TO CONSOLIDATED FINANCIAL STATEMENTS (Continued)
(In millions, except share and per share amounts)
Intangible Assets
Our principal intangible assets relate to our franchise agreements with vehicle manufacturers and distributors, which represent the estimated value of franchises acquired in business combinations, our distribution agreements with commercial vehicle manufacturers, which represent the estimated value of distribution rights acquired in business combinations, and goodwill, which represents the excess of cost over the fair value of tangible and identified intangible assets acquired in business combinations. We believe the franchise values of our automotive dealerships and the distribution agreements of our commercial vehicle distribution operations have an indefinite useful life based on the following:
|
· |
Automotive retailing and commercial vehicle distribution are mature industries and are based on franchise and distribution agreements with the vehicle manufacturers and distributors; |
|
· |
There are no known changes or events that would alter the automotive retailing franchise or commercial vehicle distribution environments; |
|
· |
Certain franchise agreement terms are indefinite; |
|
· |
Franchise and distribution agreements that have limited terms have historically been renewed by us without substantial cost; and |
|
· |
Our history shows that manufacturers and distributors have not terminated our franchise or distribution agreements. |
Impairment Testing
Other indefinite-lived intangible assets are assessed for impairment annually on October 1 and upon the occurrence of an indicator of impairment through a comparison of its carrying amount and estimated fair value. An indicator of impairment exists if the carrying value exceeds its estimated fair value and an impairment loss may be recognized up to that excess. The fair value is determined using a discounted cash flow approach, which includes assumptions about revenue and profitability growth, profit margins, and the cost of capital. We also evaluate in connection with the annual impairment testing whether events and circumstances continue to support our assessment that the other indefinite-lived intangible assets continue to have an indefinite life.
Goodwill impairment is assessed at the reporting unit level annually on October 1 and upon the occurrence of an indicator of impairment. Our operations are organized by management into operating segments by line of business and geography. We have determined that we have four reportable segments as defined in generally accepted accounting principles for segment reporting: (i) Retail Automotive, consisting of our retail automotive dealership operations; (ii) Retail Commercial Truck, consisting of our retail commercial truck dealership operations in the U.S. and Canada; (iii) Other, consisting of our commercial vehicle and power systems distribution operations and other non-automotive consolidated operations; and (iv) Non-Automotive Investments, consisting of our equity method investments in non-automotive operations. We have determined that the dealerships in each of our operating segments within the Retail Automotive reportable segment are components that are aggregated into six reporting units for the purpose of goodwill impairment testing, as they (A) have similar economic characteristics (all are automotive dealerships having similar margins), (B) offer similar products and services (all sell new and/or used vehicles, service, parts and third-party finance and insurance products), (C) have similar target markets and customers (generally individuals), and (D) have similar distribution and marketing practices (all distribute products and services through dealership facilities that market to customers in similar fashions). The reporting units are Eastern, Central, and Western United States, CarSense, International, and CarShop. Our Retail Commercial Truck reportable segment has been determined to represent one operating segment and reporting unit. The goodwill included in our Other reportable segment relates primarily to our commercial vehicle distribution operating segment. There is no goodwill recorded in our Non-Automotive Investments reportable segment.
F-15
PENSKE AUTOMOTIVE GROUP, INC.
NOTES TO CONSOLIDATED FINANCIAL STATEMENTS (Continued)
(In millions, except share and per share amounts)
For our Retail Automotive, Retail Commercial Truck, and Other reporting units, we prepared a quantitative assessment of the carrying value of goodwill. We estimated the fair value of our reporting units using an “income” valuation approach. The “income” valuation approach estimates our enterprise value using a net present value model, which discounts projected free cash flows of our business using the weighted average cost of capital as the discount rate. In connection with this process, we also reconcile the estimated aggregate fair values of our reporting units to our market capitalization. We believe this reconciliation process is consistent with a market participant perspective. This consideration would also include a control premium that represents the estimated amount an investor would pay for our equity securities to obtain a controlling interest, and other significant assumptions including revenue and profitability growth, franchise profit margins, residual values and the cost of capital. We concluded that the fair value of each of these reporting units exceeded its carrying value.
Investments
We account for each of our investments under the equity method, pursuant to which we record our proportionate share of the investee’s income each period. The net book value of our investments was $1,256.6 million and $893.4 million as of December 31, 2017 and 2016, respectively, including $1,185.6 million and $823.8 million relating to PTL as of December 31, 2017 and 2016, respectively. In July 2016, we increased our ownership interest in PTL from 9.0% to 23.4% as a result of our acquisition of an additional 14.4% ownership interest, and in September 2017, we acquired an additional 5.5% ownership interest, as discussed previously. We currently hold a 28.9% ownership interest in PTL.
Investments for which there is not a liquid, actively traded market are reviewed periodically by management for indicators of impairment. If an indicator of impairment is identified, management estimates the fair value of the investment using a discounted cash flow approach, which includes assumptions relating to revenue and profitability growth, profit margins, residual values, and our cost of capital. Declines in investment values that are deemed to be other than temporary may result in an impairment charge reducing the investments’ carrying value to fair value.
Foreign Currency Translation
For all of our non-U.S. operations, the functional currency is the local currency. The revenue and expense accounts of our non-U.S. operations are translated into U.S. dollars using the average exchange rates that prevailed during the period. Assets and liabilities of non-U.S. operations are translated into U.S. dollars using period end exchange rates. Cumulative translation adjustments relating to foreign functional currency assets and liabilities are recorded in accumulated other comprehensive income (loss), a separate component of equity.
Fair Value of Financial Instruments
Accounting standards define fair value as the price that would be received from selling an asset or paid to transfer a liability in the principal or most advantageous market for the asset or liability in an orderly transaction between market participants at the measurement date. Accounting standards establish a fair value hierarchy which requires an entity to maximize the use of observable inputs and minimize the use of unobservable inputs when measuring fair value and also establishes the following three levels of inputs that may be used to measure fair value:
|
Level 1 |
Quoted prices in active markets for identical assets or liabilities |
|
Level 2 |
Observable inputs other than Level 1 prices such as quoted prices for similar assets or liabilities; quoted market prices in markets that are not active; or model‑derived valuations or other inputs that are observable or can be corroborated by observable market data for substantially the full term of the assets or liabilities |
|
Level 3 |
Unobservable inputs that are supported by little or no market activity and that are significant to the fair value of the assets or liabilities |
F-16
PENSKE AUTOMOTIVE GROUP, INC.
NOTES TO CONSOLIDATED FINANCIAL STATEMENTS (Continued)
(In millions, except share and per share amounts)
Our financial instruments consist of cash and cash equivalents, debt, floor plan notes payable, and forward exchange contracts used to hedge future cash flows. Other than our fixed rate debt, the carrying amount of all significant financial instruments approximates fair value due either to length of maturity, the existence of variable interest rates that approximate prevailing market rates, or as a result of mark to market accounting.
Our fixed rate debt consists of amounts outstanding under our senior subordinated notes and mortgage facilities. We estimate the fair value of our senior unsecured notes using quoted prices for the identical liability (Level 2), and we estimate the fair value of our mortgage facilities using a present value technique based on our current market interest rates for similar types of financial instruments (Level 2). A summary of the carrying values and fair values of our 5.75% senior subordinated notes, 5.375% senior subordinated notes, 5.50% senior subordinated notes, 3.75% senior subordinated notes, and our fixed rate mortgage facilities are as follows:
|
|
|
December 31, 2017 |
|
December 31, 2016 |
|
||||||||
|
|
|
Carrying Value |
|
Fair Value |
|
Carrying Value |
|
Fair Value |
|
||||
|
5.75% senior subordinated notes due 2022 |
|
$ |
545.9 |
|
$ |
562.3 |
|
$ |
545.1 |
|
$ |
567.6 |
|
|
5.375% senior subordinated notes due 2024 |
|
|
297.2 |
|
|
300.2 |
|
|
296.8 |
|
|
293.0 |
|
|
5.50% senior subordinated notes due 2026 |
|
|
494.4 |
|
|
505.0 |
|
|
493.7 |
|
|
489.4 |
|
|
3.75% senior subordinated notes due 2020 |
|
|
296.5 |
|
|
301.7 |
|
|
— |
|
|
— |
|
|
Mortgage facilities |
|
|
235.5 |
|
|
233.4 |
|
|
199.9 |
|
|
195.6 |
|
Revenue Recognition
Dealership Vehicle, Parts and Service Sales
We record revenue for vehicle sales when vehicles are delivered, which is when the transfer of title and risks and rewards of ownership are considered passed to the customer. We record revenue for service or repair work when the work is completed, and record parts sales when parts are delivered to our customers. Sales promotions that we offer to customers are accounted for as a reduction of revenues at the time of sale. Rebates and other incentives offered directly to us by manufacturers are recognized as a reduction of cost of sales. Reimbursements of qualified advertising expenses are treated as a reduction of selling, general and administrative expenses. The amounts received under certain manufacturer rebate and incentive programs are based on the attainment of program objectives, and such earnings are recognized either upon the sale of the vehicle for which the award was received, or upon attainment of the particular program goals if not associated with individual vehicles. Taxes collected from customers and remitted to governmental authorities are recorded on a net basis (excluded from revenue).
Dealership Finance and Insurance Sales
Subsequent to the sale of a vehicle to a customer, we sell installment sale contracts to various financial institutions on a non‑recourse basis (with specified exceptions) to mitigate the risk of default. We receive a commission from the lender equal to either the difference between the interest rate charged to the customer and the interest rate set by the financing institution or a flat fee. We also receive commissions for facilitating the sale of various products to customers, including guaranteed vehicle protection insurance, vehicle theft protection and extended service contracts. These commissions are recorded as revenue at the time the customer enters into the contract. In the case of finance contracts, a customer may prepay or fail to pay their contract, thereby terminating the contract. Customers may also terminate extended service contracts and other insurance products, which are fully paid at purchase, and become eligible for refunds of unused premiums. In these circumstances, a portion of the commissions we received may be charged back based on the terms of the contracts. The revenue we record relating to these transactions is net of an estimate of the amount of chargebacks we will be required to pay. Our estimate is based upon our historical experience with similar contracts, including the impact of refinance and default rates on retail finance contracts and cancellation rates on extended service contracts and other
F-17
PENSKE AUTOMOTIVE GROUP, INC.
NOTES TO CONSOLIDATED FINANCIAL STATEMENTS (Continued)
(In millions, except share and per share amounts)
insurance products. Aggregate reserves relating to chargeback activity were $24.9 million and $23.5 million as of December 31, 2017 and 2016, respectively.
Commercial Vehicle Distribution
We record revenue from the distribution of vehicles, engines, and products when the goods are delivered, which is when the transfer of title and risks and rewards of ownership are considered passed to the customer. We record revenue for service or repair work when the work is completed, and record parts sales when parts are delivered to our customers. For our long-term power generation contracts, we record revenue as services are provided in accordance with contract milestones.
Defined Contribution Plans
We sponsor a number of defined contribution plans covering a significant majority of our employees. Our contributions to such plans are discretionary and are based on the level of compensation and contributions by plan participants. We incurred expenses of $16.8 million, $14.5 million, and $16.0 million relating to such plans during the years ended December 31, 2017, 2016, and 2015, respectively.
Advertising
Advertising costs are expensed as incurred or when such advertising takes place. We incurred net advertising costs of $115.8 million, $102.5 million, and $101.0 million during the years ended December 31, 2017, 2016, and 2015, respectively. Qualified advertising expenditures reimbursed by manufacturers, which are treated as a reduction of advertising expense, were $18.6 million, $16.6 million, and $17.2 million during the years ended December 31, 2017, 2016, and 2015, respectively.
Self-Insurance
We retain risk relating to certain of our general liability insurance, workers’ compensation insurance, vehicle physical damage insurance, property insurance, employment practices liability insurance, directors and officers insurance, and employee medical benefits in the U.S. As a result, we are likely to be responsible for a significant portion of the claims and losses incurred under these programs. The amount of risk we retain varies by program, and for certain exposures, we have pre‑determined maximum loss limits for certain individual claims and/or insurance periods. Losses, if any, above the pre‑determined loss limits are paid by third‑party insurance carriers. Certain insurers have limited available property coverage in response to the natural catastrophes experienced in recent years. Our estimate of future losses is prepared by management using our historical loss experience and industry‑based development factors. Aggregate reserves relating to retained risk were $30.3 million and $28.3 million as of December 31, 2017 and 2016, respectively.
F-18
PENSKE AUTOMOTIVE GROUP, INC.
NOTES TO CONSOLIDATED FINANCIAL STATEMENTS (Continued)
(In millions, except share and per share amounts)
Earnings Per Share
Basic earnings per share is computed using net income attributable to Penske Automotive Group common stockholders and the number of weighted average shares of voting common stock outstanding, including outstanding unvested restricted stock awards which contain rights to non-forfeitable dividends. Diluted earnings per share is computed using net income attributable to Penske Automotive Group common stockholders and the number of weighted average shares of voting common stock outstanding, adjusted for any dilutive effects.
A reconciliation of the number of shares used in the calculation of basic and diluted earnings per share for the years ended December 31, 2017, 2016, and 2015 follows:
|
|
|
Year Ended December 31, |
|
||||
|
|
|
2017 |
|
2016 |
|
2015 |
|
|
Weighted average number of common shares outstanding |
|
85,877,227 |
|
86,000,754 |
|
89,759,626 |
|
|
Effect of non-participatory equity compensation |
|
— |
|
— |
|
— |
|
|
Weighted average number of common shares outstanding, including effect of dilutive securities |
|
85,877,227 |
|
86,000,754 |
|
89,759,626 |
|
Hedging
Generally accepted accounting principles relating to derivative instruments and hedging activities require all derivatives, whether designated in hedging relationships or not, to be recorded on the balance sheet at fair value. These accounting principles also define requirements for designation and documentation of hedging relationships, as well as ongoing effectiveness assessments, which must be met in order to qualify for hedge accounting. For a derivative that does not qualify as a hedge, changes in fair value are recorded in earnings immediately. If the derivative is designated as a fair‑value hedge, the changes in the fair value of the derivative and the hedged item are recorded in earnings. If the derivative is designated as a cash‑flow hedge, effective changes in the fair value of the derivative are recorded in accumulated other comprehensive income (loss), a separate component of equity, and recorded in the income statement only when the hedged item affects earnings. Changes in the fair value of the derivative attributable to hedge ineffectiveness are recorded in earnings immediately.
Stock‑Based Compensation
Generally accepted accounting principles relating to share‑based payments require us to record compensation expense for all awards based on their grant‑date fair value. Our share‑based payments have generally been in the form of “non‑vested shares,” the fair value of which are measured as if they were vested and issued on the grant date.
Recent Accounting Pronouncements
Revenue Recognition
In May 2014, the Financial Accounting Standards Board (“FASB”) issued Accounting Standards Update (“ASU”) No. 2014-09, “Revenue from Contracts with Customers (Topic 606).” This ASU supersedes the revenue recognition requirements in ASC 605, “Revenue Recognition.” ASU No. 2014-09 will require an entity to recognize revenue when it transfers promised goods or services to customers using a five-step model that requires entities to exercise judgment when considering the terms of contracts with customers. In August 2015, the FASB issued ASU 2015-14 “Revenue from Contracts with Customers (Topic 606) — Deferral of the Effective Date” providing for a one-year deferral of the effective date of ASU 2014-09 and allowing for early adoption as of the original effective date. The FASB has since also issued additional ASUs containing various updates to Topic 606 which will all be adopted along with ASU 2014-09 (collectively, “the new revenue recognition standard,” “ASC 606”). For public companies, the new revenue recognition
F-19
PENSKE AUTOMOTIVE GROUP, INC.
NOTES TO CONSOLIDATED FINANCIAL STATEMENTS (Continued)
(In millions, except share and per share amounts)
standard is effective for financial statements issued for annual periods beginning after December 15, 2017, and interim periods within those annual periods. These ASUs can be adopted either retrospectively to each prior reporting period presented under the full retrospective approach, or as a cumulative-effect adjustment as of the date of adoption under the modified retrospective approach. We intend to adopt these ASUs on January 1, 2018 using the modified retrospective approach and will apply the adoption only to contracts not completed as of the date of adoption, with no restatement of comparative periods, and a cumulative-effect adjustment to retained earnings recognized as of the date of adoption.
As part of the adoption of ASC 606, we performed an assessment of the impact the new revenue recognition standard will have on our consolidated financial statements. Based on our assessment performed, we concluded that the adoption of the new revenue recognition standard will not have a material impact on our financial statements, as we expect the timing of our revenue recognition for most of our revenue streams to generally remain the same; however, we have identified certain revenue streams impacted by the new revenue recognition standard with resulting changes in our revenue recognition practices.
For our Retail Automotive and Retail Commercial Truck reportable segments, under legacy guidance we have recognized revenues at a point in time upon meeting relevant revenue recognition criteria. Under ASC 606, the timing of revenue recognition for our service and collision revenue stream will change, as we concluded the performance obligations for service and collision work are satisfied over time under the new revenue recognition standard. Although there is a change in timing of our revenue recognition for our service and parts revenue stream, the expected impact on our consolidated financial statements as a result of this change is not expected to be material. All other revenue streams for these businesses will continue to be recognized at a point in time, and our performance obligations and revenue recognition timing and practices will remain consistent with how revenues have been recorded under legacy guidance.
For our Other reportable segment consisting primarily of our businesses in Australia and New Zealand, Penske Commercial Vehicles Australia and Penske Power Systems, under legacy guidance we recognized revenues for vehicles, engines, parts, and services at a point in time upon meeting relevant revenue recognition criteria. For our long-term power generation contracts at Penske Power Systems, we recognized revenues using the percentage of completion method in accordance with contract milestones. Under ASC 606, the timing of revenue recognition for the service revenue stream for PCV Australia and PPS will change, as we concluded the performance obligations for service work are satisfied over time under the new revenue recognition standard. For revenues previously recognized using the percentage of completion method, these revenues will continue to be recognized as performance obligations are satisfied over time, consistent with the timing of recognition under legacy guidance, but will now be recognized in accordance with the new revenue recognition criteria utilizing the output method, which measures the value to the customer of the goods or services transferred to date relative to the remaining goods or services promised.
The expected impact on our consolidated financial statements as a result of the changes in revenue recognition practices described previously is not expected to be material. We estimate the adoption of the new revenue recognition standard will result in a net, after-tax cumulative effect adjustment to retained earnings of approximately $6.0 million as of January 1, 2018.
In addition to the changes in revenue recognition practices noted above, we are also required to enhance our disclosures on revenue recognition upon adoption beginning with interim periods in 2018. We also evaluated, documented, and have implemented required changes in internal controls that were deemed necessary as part of our adoption of the new revenue recognition standard. Although new controls have been implemented as a result of the adoption, such changes were not deemed material.
Inventory Measurement
In July 2015, the FASB issued ASU No. 2015-11, “Simplifying the Measurement of Inventory (Topic 330).” Under ASU 2015-11, inventory that is measured using the first-in, first-out (FIFO), specific identification, or average cost
F-20
PENSKE AUTOMOTIVE GROUP, INC.
NOTES TO CONSOLIDATED FINANCIAL STATEMENTS (Continued)
(In millions, except share and per share amounts)
methods should be measured at the lower of cost or net realizable value. This ASU does not impact inventory measurement under the last-in, first-out (LIFO) or retail inventory methods. For public companies, this ASU is effective for financial statements issued for annual periods beginning after December 15, 2016, and interim periods within those annual periods, with early adoption permitted. The amendments from this update are to be applied prospectively. We adopted this ASU prospectively on the effective date of January 1, 2017. The adoption of this accounting standard update has not had a material impact on our consolidated financial position, results of operations, and cash flows.
Income Taxes
In November 2015, the FASB issued ASU No. 2015-17, “Income Taxes (Topic 740) — Balance Sheet Classification of Deferred Taxes.” Under ASU 2015-17, entities are required to classify all deferred tax liabilities and assets as noncurrent in a classified statement of financial position. For public companies, this ASU is effective for financial statements issued for annual periods beginning after December 15, 2016, and interim periods within those annual periods, with early adoption permitted. The amendments from this update are to be applied either prospectively or retrospectively. We adopted this ASU retrospectively on the effective date of January 1, 2017. Amounts reclassified from “Other current assets” to “Deferred tax liabilities” were $28.7 million as of December 31, 2016. Other than the revised presentation of our consolidated balance sheets, the adoption of this accounting standard update has not had a material impact on our consolidated financial position, results of operations, and cash flows.
Accounting for Leases
In February 2016, the FASB issued ASU No. 2016-02, “Leases (Topic 842).” Under this new guidance, a company will now recognize most leases on its balance sheet as lease liabilities with corresponding right-of-use assets. For public companies, this ASU is effective for financial statements issued for annual periods beginning after December 15, 2018, and interim periods within those annual periods, with early adoption permitted. We intend to adopt this ASU on January 1, 2019. The amendments from this update are to be applied using a modified retrospective approach. The adoption of this ASU will result in a significant increase to our consolidated balance sheets for lease liabilities and right-of-use assets. We are currently evaluating the other impacts the adoption of this accounting standard update will have on our consolidated financial statements. We believe our current off-balance sheet leasing commitments are reflected in our credit rating.
Share-Based Payment Accounting
In March 2016, the FASB issued ASU No. 2016-09, “Compensation — Stock Compensation (Topic 718) — Improvement to Employee Share-Based Payment Accounting.” This ASU simplified several aspects of accounting for share-based payment transactions, including income tax consequences, classification of awards as either equity or liabilities, and classification on the statement of cash flows. For public companies, this ASU is effective for financial statements issued for annual periods beginning after December 15, 2016, and interim periods within those annual periods, with early adoption permitted. This ASU was adopted on the effective date of January 1, 2017. As part of the adoption of this ASU, we have elected to record forfeitures as they occur. The amendments to timing of recognition of excess tax benefits, minimum statutory withholding requirements, and forfeitures were adopted using a modified retrospective approach. The cumulative-effect adjustment to retained earnings as of January 1, 2017 was not material. Amendments related to cash flow presentation of employee taxes paid was adopted retrospectively, with $5.8 million and $6.3 million reclassified from operating activities to financing activities for the years ended December 31, 2016 and 2015, respectively. Amendments related to the recognition of excess tax benefits on the income statement and presentation of excess tax benefits on the statement of cash flows were adopted prospectively, and therefore, prior periods were not adjusted. The adoption of this accounting standard update has not had a material impact on our consolidated financial position, results of operations, and cash flows.
F-21
PENSKE AUTOMOTIVE GROUP, INC.
NOTES TO CONSOLIDATED FINANCIAL STATEMENTS (Continued)
(In millions, except share and per share amounts)
Classification of Certain Cash Receipts and Cash Payments
In August 2016, the FASB issued ASU No. 2016-15, “Statement of Cash Flows (Topic 230) — Classification of Certain Cash Receipts and Cash Payments.” This ASU provides new guidance on eight specific cash flow issues related to how such cash receipts and cash payments should be presented in a statement of cash flows. For public companies, this ASU is effective for financial statements issued for annual periods beginning after December 15, 2017, and interim periods within those annual periods, with early adoption permitted. The amendments from this update are to be applied retrospectively. We intend to adopt this ASU on January 1, 2018. We do not expect the adoption of this accounting standard update to have a material impact on our consolidated cash flows.
Reclassification of Certain Tax Effects from Accumulated Other Comprehensive Income
In February 2018, the FASB issued ASU No. 2018-02, “Income Statement — Reporting Comprehensive Income (Topic 220) — Reclassification of Certain Tax Effects from Accumulated Other Comprehensive Income.” This ASU allows for a reclassification from accumulated other comprehensive income to retained earnings for stranded tax effects resulting from the enactment of the U.S. Tax Cuts and Jobs Act (“the Act”). The update also requires entities to disclose whether or not they elected to reclassify the tax effects related to the Act as well as their accounting policy for releasing income tax effects from accumulated other comprehensive income. This ASU is effective for financial statements issued for annual periods beginning after December 15, 2018, and interim periods within those annual periods, with early adoption permitted. We are currently assessing whether we will adopt the optional guidance of this accounting standard update, as well as the potential impact on our consolidated financial statements.
2. Equity Method Investees
As of December 31, 2017, we had investments in the following companies that are accounted for under the equity method: the Nix Group (50%) operating automotive dealerships in Germany, Ibericar Keldinich SL (50%) operating automotive dealerships in Spain, the Nicole Group (49%) operating automotive dealerships in Japan, and Penske Commercial Leasing Australia (28%) which rents heavy-duty commercial vehicles in Australia. Investments in these entities amounted to $71.0 million at December 31, 2017. Investments in these entities, as well as National Powersport Auctions and Penske Vehicle Services (discussed below), amounted to $69.6 million at December 31, 2016.
In September 2016, we sold a 12% interest, and in September 2017 sold an additional 5% interest, in our Penske Commercial Leasing Australia joint venture to PTL and continue to account for this investment under the equity method under our current 28% ownership.
In May 2017, we sold our 7% interest in National Powersport Auctions. In December 2017, we sold our 31% interest in Penske Vehicle Services to PTL. The equity earnings associated with these investments are included within continuing operations under the caption “Equity in earnings of affiliates” for the years ended December 31, 2017, 2016 and 2015.
In September 2015, we sold our 50% interest in our Max Cycles non-automotive joint venture, which operated BMW motorcycle dealerships. In October 2015, our Penske-Wynn Ferrari/Maserati joint venture sold substantially all of its assets to a third party. The equity earnings associated with these investments are included within continuing operations under the caption “Equity in earnings of affiliates” for the year ended December 31, 2015.
In September 2015, we acquired an additional 10% interest in the Jacobs Group, which was previously accounted for under the equity method, resulting in us owning a 60% controlling interest in this joint venture; we therefore began consolidating this entity in our financial results in the year ended December 31, 2015. Additionally, during the first quarter of 2016, we acquired an additional 8% interest in the Jacobs Group and owned 68% of this joint venture as of
F-22
PENSKE AUTOMOTIVE GROUP, INC.
NOTES TO CONSOLIDATED FINANCIAL STATEMENTS (Continued)
(In millions, except share and per share amounts)
December 31, 2017. The equity earnings associated with this investment prior to consolidation were included within continuing operations under the caption “Equity in earnings of affiliates” through September 2015.
We also have a 28.9% ownership interest in PTL, a leading provider of transportation services and supply chain management. Our investment in PTL, which is accounted for under the equity method, amounted to $1,185.6 million and $823.8 million at December 31, 2017 and 2016, respectively. In July 2016, we increased our ownership interest in PTL from 9.0% to 23.4% as a result of our acquisition of an additional 14.4% ownership interest, and in September 2017, we acquired an additional 5.5% ownership interest, as discussed previously.
We recorded $107.6 million, $69.5 million, and $39.3 million during the years ended December 31, 2017, 2016, and 2015, respectively, on our statements of income under the caption “Equity in earnings of affiliates” related to earnings from our equity method investments.
The combined results of operations and financial position of our equity method investees as of December 31 for each of the years presented are summarized as follows:
Condensed income statement information:
|
|
|
Year Ended December 31, |
|
|||||||
|
|
|
2017 |
|
2016 |
|
2015 |
|
|||
|
Revenues |
|
$ |
7,680.8 |
|
$ |
7,397.2 |
|
$ |
6,770.3 |
|
|
Gross profit |
|
|
1,792.4 |
|
|
1,670.4 |
|
|
2,396.8 |
|
|
Net income |
|
|
416.1 |
|
|
411.5 |
|
|
398.5 |
|
Condensed balance sheet information:
|
|
|
December 31, |
|
||||
|
|
|
2017 |
|
2016 |
|
||
|
Current assets |
|
$ |
1,317.9 |
|
$ |
1,188.2 |
|
|
Noncurrent assets |
|
|
11,729.4 |
|
|
10,529.9 |
|
|
Total assets |
|
$ |
13,047.3 |
|
$ |
11,718.1 |
|
|
Current liabilities |
|
$ |
2,101.0 |
|
$ |
1,794.7 |
|
|
Noncurrent liabilities |
|
|
8,160.3 |
|
|
7,393.6 |
|
|
Equity |
|
|
2,786.0 |
|
|
2,529.8 |
|
|
Total liabilities and equity |
|
$ |
13,047.3 |
|
$ |
11,718.1 |
|
F-23
PENSKE AUTOMOTIVE GROUP, INC.
NOTES TO CONSOLIDATED FINANCIAL STATEMENTS (Continued)
(In millions, except share and per share amounts)
3. Business Combinations
During 2017, we acquired CarSense, a stand-alone specialty retailer of used vehicles in the U.S. representing five locations, acquired CarShop, a stand-alone specialty retailer of used vehicles in the U.K. representing five retail locations and a vehicle preparation center, and acquired eight retail automotive franchises. The companies acquired in 2017 generated $1,046.4 million of revenue and $37.1 million of pre-tax income from our date of acquisition through December 31, 2017. During 2016, we acquired twenty retail automotive franchises and seven retail commercial truck dealerships. Our financial statements include the results of operations of the acquired entities from the date of acquisition. The fair value of the assets acquired and liabilities assumed have been recorded in our consolidated financial statements, and may be subject to adjustment pending completion of final valuation. A summary of the aggregate consideration paid and the aggregate amounts of the assets acquired and liabilities assumed for the years ended December 31, 2017 and 2016 follows:
|
|
|
December 31, |
|
||||
|
|
|
2017 |
|
2016 |
|
||
|
Accounts receivable |
|
$ |
11.1 |
|
$ |
3.9 |
|
|
Inventory |
|
|
139.9 |
|
|
80.5 |
|
|
Other current assets |
|
|
2.9 |
|
|
0.1 |
|
|
Property and equipment |
|
|
21.8 |
|
|
16.4 |
|
|
Indefinite-lived intangibles |
|
|
365.6 |
|
|
51.1 |
|
|
Other noncurrent assets |
|
|
0.1 |
|
|
2.7 |
|
|
Current liabilities |
|
|
(33.6) |
|
|
(9.2) |
|
|
Noncurrent liabilities |
|
|
(1.9) |
|
|
(4.7) |
|
|
Total consideration |
|
$ |
505.9 |
|
$ |
140.8 |
|
|
Consideration transferred through common stock issuance |
|
|
(32.4) |
|
|
— |
|
|
Contingent consideration |
|
|
(20.0) |
|
|
— |
|
|
Seller financed/assumed debt |
|
|
(3.8) |
|
|
— |
|
|
Total cash used in acquisitions |
|
$ |
449.7 |
|
$ |
140.8 |
|
The following unaudited consolidated pro forma results of operations of PAG for the years ended December 31, 2017 and 2016 give effect to acquisitions consummated during 2017 and 2016 as if they had occurred on January 1, 2016:
|
|
|
Year Ended December 31, |
|
||||
|
|
|
2017 |
|
2016 |
|
||
|
Revenues |
|
$ |
21,548.1 |
|
$ |
21,766.5 |
|
|
Income from continuing operations |
|
|
617.0 |
|
|
370.7 |
|
|
Net income |
|
|
616.8 |
|
|
369.6 |
|
|
Income from continuing operations per diluted common share |
|
$ |
7.18 |
|
$ |
4.31 |
|
|
Net income per diluted common share |
|
$ |
7.18 |
|
$ |
4.30 |
|
4. Discontinued Operations and Divestitures
Assets Held for Sale and Discontinued Operations
We classify an entity as held for sale in the period in which all of the following criteria are met:
management, having the authority to approve the action, commits to a plan to sell the entity;
the entity is available for immediate sale in its present condition;
an active program to locate a buyer and other actions required to complete the plan to sell have been initiated;
F-24
PENSKE AUTOMOTIVE GROUP, INC.
NOTES TO CONSOLIDATED FINANCIAL STATEMENTS (Continued)
(In millions, except share and per share amounts)
the sale is probable and transfer is expected to be completed within one year;
the entity is being actively marketed for sale at a price that is reasonable in relation to its current fair value; and
actions required to complete the plan indicate that it is unlikely that significant changes to the plan will be made or that the plan will be withdrawn.
In April 2014, the FASB issued ASU No. 2014-08 that changed the definition of a discontinued operation to include only those disposals of components of an entity or components of an entity that are classified as held for sale that represent a strategic shift that has (or will have) a major effect on an entity’s operations and financial results. We adopted this accounting standard update effective January 1, 2015.
Prior to the adoption of ASU No. 2014-08, we accounted for dispositions as discontinued operations when it was evident that the operations and cash flows of an entity being disposed of would be eliminated from ongoing operations and we would not have any significant continuing involvement in its operations. The results of operations for those entities that were classified as discontinued operations prior to adoption of ASU No. 2014-08 are included in “Loss from discontinued operations” in the accompanying Consolidated Statements of Income for all periods presented and will continue to be reported within discontinued operations in the future. Beginning with disposals or entities classified as held for sale subsequent to January 1, 2015, only those that represent a strategic shift that has, or will have, a major impact on our operations and financial results will be included in discontinued operations.
We had no entities newly classified as held for sale in 2017, 2016, or 2015 that met the criteria to be classified as discontinued operations. As such, the combined financial information presented below represents only retail automotive dealerships and our car rental business that were classified as discontinued operations prior to adoption of ASU No. 2014-08:
|
|
|
Year Ended December 31, |
|
|||||||
|
|
|
2017 |
|
2016 |
|
2015 |
|
|||
|
Revenues |
|
$ |
2.1 |
|
$ |
24.8 |
|
$ |
75.8 |
|
|
Pre-tax loss |
|
|
(0.4) |
|
|
(1.7) |
|
|
(6.7) |
|
|
Pre-tax gain on disposal |
|
|
— |
|
|
— |
|
|
2.9 |
|
|
|
|
December 31, |
|
||||
|
|
|
2017 |
|
2016 |
|
||
|
Inventories |
|
$ |
— |
|
$ |
4.6 |
|
|
Other assets |
|
|
— |
|
|
3.8 |
|
|
Total assets |
|
$ |
— |
|
$ |
8.4 |
|
|
Floor plan notes payable (including non-trade) |
|
$ |
— |
|
$ |
4.8 |
|
|
Other liabilities |
|
|
0.7 |
|
|
1.3 |
|
|
Total liabilities |
|
$ |
0.7 |
|
$ |
6.1 |
|
Divestitures
In 2017, we disposed of twenty-five retail automotive franchises. The results of operations for one of the retail automotive franchises is included in discontinued operations for the years ended December 31, 2017, 2016, and 2015. The remaining twenty-four retail automotive franchises did not meet the criteria to be classified as held for sale and treated as discontinued operations; therefore, the results of operations for these businesses are included within continuing operations for the years ended December 31, 2017, 2016, and 2015.
F-25
PENSKE AUTOMOTIVE GROUP, INC.
NOTES TO CONSOLIDATED FINANCIAL STATEMENTS (Continued)
(In millions, except share and per share amounts)
In December 2016, we sold our 90% ownership interest in i.M. Branded, a provider of dealership graphics and millwork, which we previously consolidated in our financial statements. The results of operations for this business are included within continuing operations for the years ended December 31, 2016 and 2015, as this business did not meet the criteria to be classified as held for sale and treated as discontinued operations.
In February 2015, we divested our car rental business that included Hertz car rental franchises in the Memphis, Tennessee market and certain markets throughout Indiana. We received proceeds of $17.8 million from the sale, excluding sales of car rental vehicles. The results of operations of our car rental business are included in discontinued operations for the year ended December 31, 2015.
5. Inventories
Inventories consisted of the following:
|
|
|
December 31, |
|
||||
|
|
|
2017 |
|
2016 |
|
||
|
Retail automotive dealership new vehicles |
|
$ |
2,344.1 |
|
$ |
2,153.0 |
|
|
Retail automotive dealership used vehicles |
|
|
993.1 |
|
|
771.7 |
|
|
Retail automotive parts, accessories and other |
|
|
141.7 |
|
|
119.1 |
|
|
Retail commercial truck dealership vehicles and parts |
|
|
207.0 |
|
|
170.3 |
|
|
Commercial vehicle distribution vehicles, parts and engines |
|
|
258.2 |
|
|
194.1 |
|
|
Total inventories |
|
$ |
3,944.1 |
|
$ |
3,408.2 |
|
We receive credits from certain vehicle manufacturers that reduce cost of sales when the vehicles are sold. Such credits amounted to $55.4 million, $51.6 million, and $43.7 million during the years ended December 31, 2017, 2016, and 2015, respectively.
6. Property and Equipment
Property and equipment consisted of the following:
|
|
|
December 31, |
|
||||
|
|
|
2017 |
|
2016 |
|
||
|
Buildings and leasehold improvements |
|
$ |
1,633.3 |
|
$ |
1,438.4 |
|
|
Furniture, fixtures and equipment |
|
|
1,080.1 |
|
|
894.3 |
|
|
Total |
|
$ |
2,713.4 |
|
$ |
2,332.7 |
|
|
Less: Accumulated depreciation |
|
|
(604.8) |
|
|
(526.2) |
|
|
Property and equipment, net |
|
$ |
2,108.6 |
|
$ |
1,806.5 |
|
Approximately $27.8 million and $27.1 million of capitalized interest is included in buildings and leasehold improvements as of December 31, 2017 and 2016, respectively, and is being depreciated over the useful life of the related assets.
F-26
PENSKE AUTOMOTIVE GROUP, INC.
NOTES TO CONSOLIDATED FINANCIAL STATEMENTS (Continued)
(In millions, except share and per share amounts)
7. Intangible Assets
Following is a summary of the changes in the carrying amount of goodwill and other indefinite-lived intangible assets during the years ended December 31, 2017 and 2016, net of accumulated impairment losses recorded prior to December 31, 2012 of $606.3 million and $37.1 million, respectively:
|
|
|
|
|
|
Other Indefinite |
|
|
|
|
|
|
|
Lived Intangible |
|
|
|
|
Goodwill |
|
Assets |
||
|
Balance — December 31, 2015 |
|
$ |
1,323.1 |
|
$ |
408.0 |
|
Additions |
|
|
24.9 |
|
|
26.2 |
|
Disposals |
|
|
(1.7) |
|
|
(0.3) |
|
Foreign currency translation |
|
|
(55.1) |
|
|
(13.8) |
|
Balance — December 31, 2016 |
|
$ |
1,291.2 |
|
$ |
420.1 |
|
Additions |
|
|
324.8 |
|
|
40.8 |
|
Disposals |
|
|
(4.5) |
|
|
(1.7) |
|
Foreign currency translation |
|
|
49.0 |
|
|
14.8 |
|
Balance — December 31, 2017 |
|
$ |
1,660.5 |
|
$ |
474.0 |
Following is a summary of the changes in the carrying amount of goodwill by reportable segment during the years ended December 31, 2017 and 2016:
|
|
|
|
|
Retail |
|
|
|
|
|
|
||
|
|
|
Retail |
|
Commercial |
|
|
|
|
|
|
||
|
|
|
Automotive |
|
Truck |
|
Other |
|
Total |
||||
|
Balance — December 31, 2015 |
|
$ |
1,095.6 |
|
$ |
147.5 |
|
$ |
80.0 |
|
$ |
1,323.1 |
|
Additions |
|
|
9.8 |
|
|
15.1 |
|
|
— |
|
|
24.9 |
|
Disposals |
|
|
(0.2) |
|
|
— |
|
|
(1.5) |
|
|
(1.7) |
|
Foreign currency translation |
|
|
(55.0) |
|
|
(0.6) |
|
|
0.5 |
|
|
(55.1) |
|
Balance — December 31, 2016 |
|
$ |
1,050.2 |
|
$ |
162.0 |
|
$ |
79.0 |
|
$ |
1,291.2 |
|
Additions |
|
|
324.8 |
|
|
— |
|
|
— |
|
|
324.8 |
|
Disposals |
|
|
(4.5) |
|
|
— |
|
|
— |
|
|
(4.5) |
|
Foreign currency translation |
|
|
41.6 |
|
|
1.0 |
|
|
6.4 |
|
|
49.0 |
|
Balance — December 31, 2017 |
|
$ |
1,412.1 |
|
$ |
163.0 |
|
$ |
85.4 |
|
$ |
1,660.5 |
There is no goodwill recorded in our Non-Automotive Investments reportable segment.
We test for impairment of our intangible assets at least annually. We did not record any impairment charges relating to our intangible assets in 2017, 2016, or 2015.
8. Vehicle Financing
We finance substantially all of the commercial vehicles we purchase for distribution, new vehicles for retail sale, and a portion of our used vehicle inventories for retail sale, under floor plan and other revolving arrangements with various lenders, including the captive finance companies associated with automotive manufacturers. In the U.S., the floor plan arrangements are due on demand; however, we have not historically been required to repay floor plan advances prior to the sale of the vehicles that have been financed. We typically make monthly interest payments on the amount financed. Outside of the U.S., substantially all of the floor plan arrangements are payable on demand or have an original maturity of 90 days or less, and we are generally required to repay floor plan advances at the earlier of the sale of the vehicles that have been financed or the stated maturity.
F-27
PENSKE AUTOMOTIVE GROUP, INC.
NOTES TO CONSOLIDATED FINANCIAL STATEMENTS (Continued)
(In millions, except share and per share amounts)
The agreements typically grant a security interest in substantially all of the assets of our dealership and distribution subsidiaries and, in the U.S., Australia and New Zealand, are guaranteed or partially guaranteed by us. Interest rates under the arrangements are variable and increase or decrease based on changes in the prime rate, defined London Interbank Offered Rate (“LIBOR”), the Finance House Base Rate, the Euro Interbank Offered Rate, the Canadian Prime Rate, the Australian Bank Bill Swap Rate (“BBSW”), or the New Zealand Bank Bill Benchmark Rate. To date, we have not experienced any material limitation with respect to the amount or availability of financing from any institution providing us vehicle financing. We also receive non-refundable credits from certain of our vehicle manufacturers, which are treated as a reduction of cost of sales as vehicles are sold.
The weighted average interest rate on floor plan borrowings was 1.8%, 1.5%, and 1.5% for 2017, 2016, and 2015, respectively. We classify floor plan notes payable to a party other than the manufacturer of a particular new vehicle, and all floor plan notes payable relating to pre-owned vehicles, as “Floor plan notes payable — non-trade” on our consolidated balance sheets and classify related cash flows as a financing activity on our consolidated statements of cash flows.
9. Long‑Term Debt
Long‑term debt consisted of the following:
|
|
|
December 31, |
||||
|
|
|
2017 |
|
2016 |
||
|
U.S. credit agreement — revolving credit line |
|
$ |
172.0 |
|
$ |
240.0 |
|
U.K. credit agreement — revolving credit line |
|
|
47.3 |
|
|
48.1 |
|
U.K. credit agreement — overdraft line of credit |
|
|
— |
|
|
2.7 |
|
5.75% senior subordinated notes due 2022 |
|
|
545.9 |
|
|
545.1 |
|
5.375% senior subordinated notes due 2024 |
|
|
297.2 |
|
|
296.8 |
|
5.50% senior subordinated notes due 2026 |
|
|
494.4 |
|
|
493.7 |
|
3.75% senior subordinated notes due 2020 |
|
|
296.5 |
|
|
— |
|
Australia capital loan agreement |
|
|
39.0 |
|
|
— |
|
Australia working capital loan agreement |
|
|
— |
|
|
24.7 |
|
Mortgage facilities |
|
|
235.5 |
|
|
199.9 |
|
Other |
|
|
35.4 |
|
|
26.1 |
|
Total long-term debt |
|
$ |
2,163.2 |
|
$ |
1,877.1 |
|
Less: current portion |
|
|
(72.8) |
|
|
(48.3) |
|
Net long-term debt |
|
$ |
2,090.4 |
|
$ |
1,828.8 |
Scheduled maturities of long‑term debt for each of the next five years and thereafter are as follows:
|
2018 |
|
$ |
72.8 |
|
2019 |
|
|
58.8 |
|
2020 |
|
|
487.0 |
|
2021 |
|
|
36.9 |
|
2022 |
|
|
576.1 |
|
2023 and thereafter |
|
|
931.6 |
|
Total long-term debt reported |
|
$ |
2,163.2 |
F-28
PENSKE AUTOMOTIVE GROUP, INC.
NOTES TO CONSOLIDATED FINANCIAL STATEMENTS (Continued)
(In millions, except share and per share amounts)
U.S. Credit Agreement
Our U.S. credit agreement (the “U.S. credit agreement”) with Mercedes-Benz Financial Services USA LLC and Toyota Motor Credit Corporation provides for up to $700.0 million in revolving loans for working capital, acquisitions, capital expenditures, investments and other general corporate purposes, which includes $250.0 million in revolving loans solely for future U.S. acquisitions. The U.S. credit agreement provides for a maximum of $150.0 million of future borrowings for foreign acquisitions and expires on September 30, 2020, subject to its “evergreen” termination provisions. The revolving loans bear interest at LIBOR plus 2.00%, subject to an incremental 1.50% for uncollateralized borrowings in excess of a defined borrowing base.
The U.S. credit agreement is fully and unconditionally guaranteed on a joint and several basis by substantially all of our U.S. subsidiaries and contains a number of significant covenants that, among other things, restrict our ability to dispose of assets, incur additional indebtedness, repay other indebtedness, pay dividends, create liens on assets, make investments or acquisitions and engage in mergers or consolidations. We are also required to comply with specified financial and other tests and ratios, each as defined in the U.S. credit agreement including: a ratio of current assets to current liabilities, a fixed charge coverage ratio, a ratio of debt to stockholders’ equity and a ratio of debt to earnings before interest, taxes, depreciation and amortization (“EBITDA”). A breach of these requirements would give rise to certain remedies under the agreement, the most severe of which is the termination of the agreement and acceleration of the amounts owed.
The U.S. credit agreement also contains typical events of default, including change of control, non-payment of obligations and cross-defaults to our other material indebtedness. Substantially all of our U.S. assets are subject to security interests granted to the lenders under the U.S. credit agreement. As of December 31, 2017, we had $172.0 million of revolver borrowings outstanding under the U.S. credit agreement.
U.K. Credit Agreement
Our subsidiaries in the U.K. (the “U.K. subsidiaries”) are party to a £150.0 million revolving credit agreement with the Royal Bank of Scotland plc (RBS) and BMW Financial Services (GB) Limited, and an additional demand overdraft line of credit with RBS (collectively, the “U.K. credit agreement”) to be used for working capital, acquisitions, capital expenditures, investments and general corporate purposes. The loans mature on the termination date of the facility, which is December 19, 2019. The revolving loans bear interest between defined LIBOR plus 1.35% and defined LIBOR plus 3.0% and the demand overdraft line of credit bears interest at the Bank of England Base Rate plus 1.75%. As of December 31, 2017, outstanding loans under the U.K. credit agreement amounted to £35.0 million ($47.3 million).
The U.K. credit agreement is fully and unconditionally guaranteed on a joint and several basis by our U.K. subsidiaries, and contains a number of significant covenants that, among other things, restrict the ability of our U.K. subsidiaries to pay dividends, dispose of assets, incur additional indebtedness, repay other indebtedness, create liens on assets, make investments or acquisitions and engage in mergers or consolidations. In addition, our U.K. subsidiaries are required to comply with defined ratios and tests, including: a ratio of earnings before interest, taxes, amortization, and rental payments (“EBITAR”) to interest plus rental payments, a measurement of maximum capital expenditures, and a debt to EBITDA ratio. A breach of these requirements would give rise to certain remedies under the agreement, the most severe of which is the termination of the agreement and acceleration of any amounts owed.
The U.K. credit agreement also contains typical events of default, including change of control and non-payment of obligations and cross-defaults to other material indebtedness of our U.K. subsidiaries. Substantially all of our U.K. subsidiaries’ assets are subject to security interests granted to the lenders under the U.K. credit agreement.
F-29
PENSKE AUTOMOTIVE GROUP, INC.
NOTES TO CONSOLIDATED FINANCIAL STATEMENTS (Continued)
(In millions, except share and per share amounts)
3.75% Senior Subordinated Notes due 2020
In August 2017, we issued $300.0 million in aggregate principal amount of 3.75% Senior Subordinated Notes due 2020 (the “3.75% Notes”). Interest on the 3.75% Notes is payable semi-annually on February 15 and August 15 of each year. The 3.75% Notes mature on August 15, 2020, unless earlier redeemed or purchased by us. The 3.75% Notes are our unsecured senior subordinated obligations and are guaranteed on an unsecured senior subordinated basis by our 100% owned U.S. subsidiaries. The 3.75% Notes also contain customary negative covenants and events of default.
At any time, we may redeem the 3.75% Notes at a redemption price equal to 100% of the principal amount of the 3.75% Notes, plus an applicable make whole premium, and any accrued and unpaid interest. If we experience certain “change of control” events specified in the indenture, holders of the 3.75% Notes will have the option to require us to purchase for cash all or a portion of their notes at a price equal to 101% of the principal amount of the notes, plus accrued and unpaid interest. In addition, if we make certain asset sales and do not reinvest the proceeds thereof or use such proceeds to repay certain debt, we will be required to use the proceeds of such asset sales to make an offer to purchase the notes at a price equal to 100% of the principal amount of the notes, plus accrued and unpaid interest.
5.50% Senior Subordinated Notes due 2026
In May 2016, we issued $500.0 million in aggregate principal amount of 5.50% Senior Subordinated Notes due 2026 (the “5.50% Notes”). Interest on the 5.50% Notes is payable semi-annually on May 15 and November 15 of each year. The 5.50% Notes mature on May 15, 2026, unless earlier redeemed or purchased by us. The 5.50% Notes are our unsecured senior subordinated obligations and are guaranteed on an unsecured senior subordinated basis by our 100% owned U.S. subsidiaries. The 5.50% Notes also contain customary negative covenants and events of default.
Prior to May 15, 2021, we may redeem the 5.50% Notes at a redemption price equal to 100% of the principal amount of the 5.50% Notes, plus an applicable make whole premium, and any accrued and unpaid interest. On or after May 15, 2021, we may redeem the 5.50% Notes for cash at the redemption prices noted in the indenture, plus any accrued and unpaid interest. We may also redeem up to 40% of the 5.50% Notes using the proceeds of specified equity offerings at any time prior to May 15, 2019 at a price specified in the indenture. If we experience certain “change of control” events specified in the indenture, holders of the 5.50% Notes will have the option to require us to purchase for cash all or a portion of their notes at a price equal to 101% of the principal amount of the notes, plus accrued and unpaid interest. In addition, if we make certain asset sales and do not reinvest the proceeds thereof or use such proceeds to repay certain debt, we will be required to use the proceeds of such asset sales to make an offer to purchase the notes at a price equal to 100% of the principal amount of the notes, plus accrued and unpaid interest.
5.375% Senior Subordinated Notes due 2024
In November 2014, we issued $300.0 million in aggregate principal amount of 5.375% Senior Subordinated Notes due 2024 (the “5.375% Notes”). Interest on the 5.375% Notes is payable semi-annually on June 1 and December 1 of each year. The 5.375% Notes mature on December 1, 2024, unless earlier redeemed or purchased by us. The 5.375% Notes are our unsecured senior subordinated obligations and are guaranteed on an unsecured senior subordinated basis by our 100% owned U.S. subsidiaries. The 5.375% Notes also contain customary negative covenants and events of default.
Prior to December 1, 2019, we may redeem the 5.375% Notes at a redemption price equal to 100% of the principal amount of the 5.375% Notes, plus an applicable make whole premium, and any accrued and unpaid interest. On or after December 1, 2019, we may redeem the 5.375% Notes for cash at the redemption prices noted in the indenture, plus any accrued and unpaid interest. If we experience certain “change of control” events specified in the indenture, holders of the 5.375% Notes will have the option to require us to purchase for cash all or a portion of their notes at a price equal to 101% of the principal amount of the notes, plus accrued and unpaid interest. In addition, if we make certain asset sales
F-30
PENSKE AUTOMOTIVE GROUP, INC.
NOTES TO CONSOLIDATED FINANCIAL STATEMENTS (Continued)
(In millions, except share and per share amounts)
and do not reinvest the proceeds thereof or use such proceeds to repay certain debt, we will be required to use the proceeds of such asset sales to make an offer to purchase the notes at a price equal to 100% of the principal amount of the notes, plus accrued and unpaid interest.
5.75% Senior Subordinated Notes due 2022
In August 2012, we issued $550.0 million in aggregate principal amount of 5.75% Senior Subordinated Notes due 2022 (the “5.75% Notes”). Interest on the 5.75% Notes is payable semi‑annually on April 1 and October 1 of each year. The 5.75% Notes mature on October 1, 2022, unless earlier redeemed or purchased by us. The 5.75% Notes are our unsecured senior subordinated obligations and are guaranteed on an unsecured senior subordinated basis by our 100% owned U.S. subsidiaries. The 5.75% Notes also contain customary negative covenants and events of default.
We may redeem the 5.75% Notes for cash at the redemption prices noted in the indenture, plus any accrued and unpaid interest. If we experience certain “change of control” events specified in the indenture, holders of the 5.75% Notes will have the option to require us to purchase for cash all or a portion of their notes at a price equal to 101% of the principal amount of the notes, plus accrued and unpaid interest. In addition, if we make certain asset sales and do not reinvest the proceeds thereof or use such proceeds to repay certain debt, we will be required to use the proceeds of such asset sales to make an offer to purchase the notes at a price equal to 100% of the principal amount of the notes, plus accrued and unpaid interest.
Australia Loan Agreements
Penske Commercial Vehicles Australia and Penske Power Systems, were previously party to a working capital loan agreement with Mercedes-Benz Financial Services Australia Pty Ltd with a capacity of AU $50.5 million. This agreement provided the lender with a secured interest in all assets of our commercial vehicle distribution business and bore interest at the Australian BBSW 30-day Bill Rate plus 2.7%.
In December 2017, PCV Australia and PPS replaced the above agreement with two facilities with Volkswagen Financial Services Australia Pty Limited representing a five-year AU $50.0 million capital loan and a one-year AU $50.0 million working capital loan. Both facilities are subject to annual extensions. These agreements each provide the lender with a secured interest in all assets of our commercial vehicle distribution business. The loans bear interest at the Australian BBSW 30-day Bill Rate plus 3.0%. Irrespective of the term of the agreements, both agreements provide the lender with the ability to call the loans on 90 days’ notice. These facilities are also guaranteed by our U.S. parent company up to AU $50.0 million. As of December 31, 2017, we had AU $50.0 million ($39.0 million) outstanding under the capital loan agreement and no amounts outstanding under the working capital loan agreement.
Mortgage Facilities
We are party to several mortgages that bear interest at defined rates and require monthly principal and interest payments. These mortgage facilities also contain typical events of default, including non‑payment of obligations, cross‑defaults to our other material indebtedness, certain change of control events, and the loss or sale of certain franchises operated at the properties. Substantially all of the buildings and improvements on the properties financed pursuant to the mortgage facilities are subject to security interests granted to the lender. As of December 31, 2017, we owed $235.5 million of principal under our mortgage facilities.
10. Derivatives and Hedging
Penske Commercial Vehicles Australia and Penske Power Systems sell vehicles, engines, parts and other products purchased from manufacturers in the U.S., Germany, and the U.K. In order to protect against exchange rate movements, Penske Commercial Vehicles Australia and Penske Power Systems enter into foreign exchange forward contracts against
F-31
PENSKE AUTOMOTIVE GROUP, INC.
NOTES TO CONSOLIDATED FINANCIAL STATEMENTS (Continued)
(In millions, except share and per share amounts)
anticipated cash flows. The contracts are timed to mature when major shipments are scheduled to arrive in Australia and when receipt of payment from customers is expected. We classify our foreign exchange forward contracts as cash flow hedges and state them at fair value. We used Level 2 inputs to estimate the fair value of the foreign exchange forward contracts. The fair value of the contracts designated as hedging instruments was estimated to be an asset of $0.2 million and an asset of $0.3 million as of December 31, 2017 and 2016, respectively.
11. Commitments and Contingent Liabilities
We are involved in litigation which may relate to claims brought by governmental authorities, issues with customers, and employment related matters, including class action claims and purported class action claims. As of December 31, 2017, we were not party to any legal proceedings, including class action lawsuits that, individually or in the aggregate, are reasonably expected to have a material adverse effect on our results of operations, financial condition or cash flows. However, the results of these matters cannot be predicted with certainty, and an unfavorable resolution of one or more of these matters could have a material adverse effect on our results of operations, financial condition or cash flows.
We have historically structured our operations so as to minimize ownership of real property. As a result, we lease or sublease substantially all of our facilities. These leases are generally for a period between 5 and 20 years, and are typically structured to include renewal options at our election. We estimate the total rent obligations under these leases, including any extension periods we may exercise at our discretion and assuming constant consumer price indices, to be $5.1 billion. Pursuant to the leases for some of our larger facilities, we are required to comply with specified financial ratios, including a “rent coverage” ratio and a debt to EBITDA ratio, each as defined. For these leases, non‑compliance with the ratios may require us to post collateral in the form of a letter of credit. A breach of the other lease covenants gives rise to certain remedies by the landlord, the most severe of which include the termination of the applicable lease and acceleration of the total rent payments due under the lease.
Minimum future rental payments required under operating leases in effect as of December 31, 2017 are as follows:
|
2018 |
|
$ |
237.4 |
|
|
2019 |
|
|
232.9 |
|
|
2020 |
|
|
229.3 |
|
|
2021 |
|
|
225.5 |
|
|
2022 |
|
|
219.6 |
|
|
2023 and thereafter |
|
|
3,976.2 |
|
|
|
|
$ |
5,120.9 |
|
Rent expense for the years ended December 31, 2017, 2016, and 2015 amounted to $225.4 million, $206.6 million, and $201.8 million, respectively.
We have sold a number of dealerships to third parties and, as a condition to certain of those sales, remain liable for the lease payments relating to the properties on which those businesses operate in the event of non‑payment by the buyer. We are also party to lease agreements on properties that we no longer use in our retail operations that we have sublet to third parties. We rely on subtenants to pay the rent and maintain the property at these locations. In the event the subtenant does not perform as expected, we may not be able to recover amounts owed to us and we could be required to fulfill these obligations. We believe we have made appropriate reserves relating to these locations. The aggregate rent paid by the tenants on those properties in 2017 was approximately $20.6 million and, in aggregate, we currently guarantee or are otherwise liable for approximately $200.1 million of these lease payments, including lease payments during available renewal periods.
We currently hold a 28.9% ownership interest in PTL. Historically, affiliates of GE Capital (“GEC”) provided PTL with a majority of its financing, though PTL has refinanced all of its GEC indebtedness. As part of that refinancing, we
F-32
PENSKE AUTOMOTIVE GROUP, INC.
NOTES TO CONSOLIDATED FINANCIAL STATEMENTS (Continued)
(In millions, except share and per share amounts)
and the other PTL partners created a new company (“Holdings”), which, together with GEC, co-issued $700.0 million of 3.8% senior unsecured notes due 2019 (the “Holdings Bonds”). GEC agreed to be a co-obligor of the Holdings Bonds in order to achieve lower interest rates on the Holdings Bonds. As part of Mitsui’s purchase of its 20.0% ownership interest in PTL in March 2015, the ownership interest of GEC in Holdings was redeemed, Holdings was relieved of its obligations under the indenture for the Holdings Bonds, and Holdings became obligated to pay to GEC 50.1% of all interest and principal due under, and 100% of the expenses related to, the Holdings Bonds to the extent Holdings has cash in excess of a certain level of permitted working capital, subject to certain limitations. We agreed to indemnify GEC for 9.0% of any principal or interest that GEC is required to pay on these bonds and pay GEC an annual fee of approximately $0.95 million for acting as obligor. The maximum amount of our contingent obligations to GEC under this agreement was 9.0% of the required principal repayment due in 2019 and 9.0% of interest payments under the Holdings Bonds, plus fees and default interest, if any. On October 2, 2017, we elected to make a payment in full of our obligations under this agreement of $63.8 million and have no further obligations to make payments under this agreement.
Our floor plan credit agreement with Mercedes Benz Financial Services Australia (“MBA”) provides us revolving loans for the acquisition of commercial vehicles for distribution to our retail network. This facility includes a limited parent guarantee and a commitment to repurchase dealer vehicles in the event the dealer’s floor plan agreement with MBA is terminated.
We have $33.4 million of letters of credit outstanding as of December 31, 2017, and have posted $25.9 million of surety bonds in the ordinary course of business.
12. Related Party Transactions
We sometimes pay to and/or receive fees from Penske Corporation and its affiliates for services rendered in the normal course of business, or to reimburse payments made to third parties on each other’s behalf. These transactions are reviewed periodically by our Audit Committee and reflect the provider’s cost or an amount mutually agreed upon by both parties. During 2017, 2016, and 2015, Penske Corporation and its affiliates billed us $6.2 million, $6.9 million, and $6.7 million, respectively, and we billed Penske Corporation and its affiliates $159 thousand, $148 thousand, and $101 thousand, respectively, for such services. As of December 31, 2017 and 2016, we had $58 thousand and $98 thousand of receivables from, and $0.7 million and $0.8 million of payables to, Penske Corporation and its subsidiaries, respectively.
On September 7, 2017, we acquired an additional 5.5% ownership interest in PTL, a leading provider of transportation services and supply chain management, from GE Capital for approximately $239.1 million in cash. At the same time, Mitsui, our second largest shareholder, acquired an additional 10.0% ownership interest in PTL at the same valuation. After the transaction, PTL is owned 41.1% by Penske Corporation, 28.9% by us, and 30.0% by Mitsui. GE Capital no longer owns any ownership interests in PTL. In connection with this transaction, the PTL partners agreed to amend and restate the existing partnership agreement among the partners, which among other things, provides us with specified partner distribution and governance rights and restricts our ability to transfer our interests. We and Mitsui were granted additional governance rights as part of the transaction. In addition, the partnership now has a six member advisory committee (previously seven member) and we continue to be entitled to one of the six representatives. We continue to have the right to pro rata quarterly distributions equal to 50% of PTL’s consolidated net income and we expect to continue to realize significant cash tax savings.
We continue to be able to transfer our directly owned interests with the unanimous consent of the other partners, or if we provide the remaining partners with a right of first offer to acquire our interests, except that we may transfer up to 9.02% of our interest to Penske Corporation without complying with the right of first offer to the remaining partner. We and Penske Corporation have previously agreed that (1) in the event of any transfer by Penske Corporation of their partnership interests to a third party, we will be entitled to “tag-along” by transferring a pro rata amount of our
F-33
PENSKE AUTOMOTIVE GROUP, INC.
NOTES TO CONSOLIDATED FINANCIAL STATEMENTS (Continued)
(In millions, except share and per share amounts)
partnership interests on similar terms and conditions, and (2) Penske Corporation is entitled to a right of first refusal in the event of any transfer of our partnership interests, subject to the terms of the partnership agreement. Additionally, PTL has agreed to indemnify the general partner for any actions in connection with managing PTL, except those taken in bad faith or in violation of the partnership agreement.
The partnership agreement continues to allow Penske Corporation, beginning December 31, 2017, to give notice to require PTL to begin to effect an initial public offering of equity securities, subject to certain limitations, as soon as practicable after the first anniversary of the initial notice, and, beginning in 2025, we and Mitsui continue to have a similar right to require PTL to begin an initial public offering of equity securities, subject to certain limitations, as soon as reasonably practicable. The term of the partnership agreement was amended as part of the transaction to be indefinite.
In 2017, 2016, and 2015, we received $52.4 million, $21.7 million, and $13.8 million, respectively, from PTL in pro rata cash dividends. In 2014, we formed a venture with PTL, Penske Commercial Leasing Australia. This venture combines PTL’s fleet operations expertise with our market knowledge of commercial vehicles to rent heavy-duty commercial vehicles in Australia. This venture is accounted for as an equity method investment as discussed in Note 2.
In December 2017, we sold our 31% ownership interest in Penske Vehicle Services, an automotive fleet management company, to PTL for a purchase price of $19.2 million. We previously accounted for this venture as an equity method investment.
In September 2016, PTG completed the sale of certain assets to PTL, a related party. The assets sold consisted of approximately 300 vehicles, together with the associated full-service truck leasing and truck rental contracts with various PTG customers. PTL purchased these assets at fair value, which exceeded our carrying value for these assets, for a total purchase price of approximately $17.0 million.
Joint Venture Relationships
From time to time we enter into joint venture relationships in the ordinary course of business, pursuant to which we own and operate automotive dealerships together with other investors. We may also provide these dealerships with working capital and other debt financing at costs that are based on our incremental borrowing rate. As of December 31, 2017, our automotive joint venture relationships were as follows:
|
Location |
|
Dealerships |
|
Ownership Interest |
|
|
Fairfield, Connecticut |
|
Audi, Mercedes-Benz, Sprinter, Porsche |
|
80.00 |
% (A) (B) |
|
Greenwich, Connecticut |
|
Mercedes-Benz |
|
80.00 |
% (A) (B) |
|
Northern Italy |
|
BMW, MINI, Maserati, Porsche, Audi, Land Rover, Volvo |
|
84.00 |
% (B) |
|
Aachen, Germany |
|
Audi, Maserati, SEAT, Skoda, Volkswagen |
|
68.00 |
% (B) (D) |
|
Frankfurt, Germany |
|
Lexus, Toyota, Volkswagen |
|
50.00 |
% (C) |
|
Barcelona, Spain |
|
BMW, MINI |
|
50.00 |
% (C) |
|
Tokyo, Japan |
|
BMW, MINI, Rolls-Royce, Ferrari, ALPINA |
|
49.00 |
% (C) |
|
(a) |
An entity controlled by one of our directors, Lucio A. Noto, owns a 20% interest in this joint venture. |
|
(b) |
Entity is consolidated in our financial statements. |
|
(c) |
Entity is accounted for using the equity method of accounting. |
|
(d) |
In February 2018, we acquired an additional 7.4% ownership interest in this joint venture and now own 75.4%. |
Additionally, we are party to non-automotive joint ventures including our investments in Penske Commercial Leasing Australia (28%) and PTL (28.9%) that are accounted for under the equity method, as more fully discussed in Note 2.
F-34
PENSKE AUTOMOTIVE GROUP, INC.
NOTES TO CONSOLIDATED FINANCIAL STATEMENTS (Continued)
(In millions, except share and per share amounts)
13. Stock‑Based Compensation
Key employees, outside directors, consultants and advisors of PAG are eligible to receive stock‑based compensation pursuant to the terms of our 2015 Equity Incentive Plan (the “2015 Plan”). This plan allows for the issuance of shares for stock options, stock appreciation rights, restricted stock, restricted stock units, performance shares and other awards. The 2015 Plan is a five-year plan which allows for up to 4,000,000 awards of which 3,219,205 shares of common stock were available for grant as of December 31, 2017. Compensation expense related to our equity incentive plan was $16.0 million, $14.8 million, and $14.1 million during 2017, 2016, and 2015, respectively.
Restricted Stock
During 2017, 2016, and 2015, we granted 320,018, 316,486, and 295,148 shares, respectively, of restricted common stock and restricted stock units at no cost to participants under the plan. These awards provide the holder voting and dividend rights prior to vesting. The awards are subject to forfeiture and are non‑transferable, which restrictions generally lapse over a four year period from the grant date at a rate of 15%, 15%, 20% and 50% per year. We have determined that the grant date quoted market price of the underlying common stock is the appropriate measure of compensation cost. This cost is amortized as expense over the restriction period. As of December 31, 2017, there was $22.5 million of unrecognized compensation cost related to the restricted stock, which is expected to be recognized over the restricted period.
Presented below is a summary of the status of our restricted stock as of December 31, 2017 and 2016, and changes during the year ended December 31, 2017:
|
|
|
|
|
Weighted Average |
|
Aggregate |
|
||
|
|
|
Shares |
|
Grant Date Fair Value |
|
Intrinsic Value |
|
||
|
December 31, 2016 |
|
919,193 |
|
$ |
22.73 |
|
|
|
|
|
Granted |
|
320,018 |
|
|
51.60 |
|
|
|
|
|
Vested |
|
(328,253) |
|
|
47.06 |
|
|
|
|
|
Forfeited |
|
(11,484) |
|
|
44.57 |
|
|
|
|
|
December 31, 2017 |
|
899,474 |
|
$ |
46.59 |
|
$ |
43.0 |
|
14. Equity
A summary of shares repurchased under our securities repurchase program, and shares acquired, is as follows:
|
|
|
Year Ended December 31, |
|
|||||||
|
|
|
2017 |
|
2016 |
|
2015 |
|
|||
|
Shares repurchased (1) |
|
|
302,000 |
|
|
4,512,325 |
|
|
854,313 |
|
|
Aggregate purchase price |
|
$ |
12.7 |
|
$ |
167.9 |
|
$ |
40.9 |
|
|
Average purchase price per share |
|
$ |
41.95 |
|
$ |
37.21 |
|
$ |
47.86 |
|
|
|
|
|
|
|
|
|
|
|
|
|
|
Shares acquired (2) |
|
|
133,710 |
|
|
144,717 |
|
|
156,383 |
|
|
Aggregate purchase price |
|
$ |
5.8 |
|
$ |
5.7 |
|
$ |
8.0 |
|
|
Average purchase price per share |
|
$ |
43.28 |
|
$ |
39.47 |
|
$ |
51.05 |
|
|
(1) |
Shares were repurchased under our securities repurchase program. As of December 31, 2017, we had $200.0 million in repurchase authorization under the repurchase program. |
|
(2) |
Shares were acquired from employees in connection with a net share settlement feature of employee equity awards. |
F-35
PENSKE AUTOMOTIVE GROUP, INC.
NOTES TO CONSOLIDATED FINANCIAL STATEMENTS (Continued)
(In millions, except share and per share amounts)
15. Accumulated Other Comprehensive Income (Loss)
Changes in accumulated other comprehensive income (loss) by component and the reclassifications out of accumulated other comprehensive income (loss) during the years ended December 31, 2017, 2016, and 2015 attributable to Penske Automotive Group common stockholders follows:
|
|
|
|
|
|
|
|
|
Accumulated |
|
|
|
|
|
Foreign |
|
|
|
|
Other |
|
||
|
|
|
Currency |
|
|
|
|
Comprehensive |
|
||
|
|
|
Translation |
|
Other |
|
Income (Loss) |
|
|||
|
Balance at January 1, 2015 |
|
$ |
(51.7) |
|
$ |
(1.6) |
|
$ |
(53.3) |
|
|
Other comprehensive income before reclassifications |
|
|
(61.8) |
|
|
(7.4) |
|
|
(69.2) |
|
|
Amounts reclassified from accumulated other comprehensive income — net of tax provision of $0.0 |
|
|
— |
|
|
— |
|
|
— |
|
|
Net current-period other comprehensive income |
|
|
(61.8) |
|
|
(7.4) |
|
|
(69.2) |
|
|
Balance at December 31, 2015 |
|
$ |
(113.5) |
|
$ |
(9.0) |
|
$ |
(122.5) |
|
|
Other comprehensive income before reclassifications |
|
|
(116.5) |
|
|
(11.7) |
|
|
(128.2) |
|
|
Amounts reclassified from accumulated other comprehensive income — net of tax provision $0.0 |
|
|
— |
|
|
— |
|
|
— |
|
|
Net current-period other comprehensive income |
|
|
(116.5) |
|
|
(11.7) |
|
|
(128.2) |
|
|
Balance at December 31, 2016 |
|
$ |
(230.0) |
|
$ |
(20.7) |
|
$ |
(250.7) |
|
|
Other comprehensive income before reclassifications |
|
|
96.0 |
|
|
8.2 |
|
|
104.2 |
|
|
Amounts reclassified from accumulated other comprehensive income — net of tax provision of $0.0 |
|
|
— |
|
|
— |
|
|
— |
|
|
Net current-period other comprehensive income |
|
|
96.0 |
|
|
8.2 |
|
|
104.2 |
|
|
Balance at December 31, 2017 |
|
$ |
(134.0) |
|
$ |
(12.5) |
|
$ |
(146.5) |
|
16. Income Taxes
On December 22, 2017, the President of the United States signed into law P.L. 115-97, commonly referred to as the U.S. Tax Cuts and Jobs Act (the “Act”). The Act modifies several provisions of the Internal Revenue Code related to corporations, including a permanent corporate income tax rate reduction from 35% to 21%, effective January 1, 2018. The Act also significantly changes U.S. international tax laws for tax years beginning after December 31, 2017 and requires a one-time mandatory deemed repatriation of all cumulative post-1986 foreign earnings and profits of a U.S. shareholder’s foreign subsidiaries effective in 2017, the year of enactment.
As a result of the enacted legislation, we have assessed the impact of the changes to the U.S. income tax system, including but not limited to, adjustments to U.S. current and deferred taxes associated with the mandatory deemed repatriation of foreign undistributed earnings. We have estimated that our U.S. federal and state tax liability as a result of the transition tax on repatriation will be $54.8 million on a deemed repatriation of $992.7 million of foreign earnings and profits. The remeasurement of certain deferred tax assets and liabilities due to the corporate income tax rate reduction is estimated to provide an income tax benefit of $301.6 million. The total benefit recorded in 2017 as a result of the enactment of the Act was $243.4 million, consisting primarily of the deemed repatriation and revaluation of U.S. deferreds noted previously.
On December 22, 2017, Staff Accounting Bulletin No. 118 (“SAB 118”) was issued to address the application of U.S. GAAP in situations when a registrant does not have the necessary information available, prepared or analyzed (including computations) in reasonable detail to complete the accounting for certain income tax effects of the Act. SAB 118 provides a measurement period that should not extend beyond one year from the Act enactment date for companies to complete such income tax accounting under ASC 740. In accordance with SAB 118, we have analyzed and computed
F-36
PENSKE AUTOMOTIVE GROUP, INC.
NOTES TO CONSOLIDATED FINANCIAL STATEMENTS (Continued)
(In millions, except share and per share amounts)
the U.S. tax impact of the Act to the best of our ability with the information available at this time and consider our conclusions to be reasonable estimates. Additional information gathering and analysis will be required to refine our detailed computations. Any subsequent adjustments to our provisional estimates will be recorded to current tax expense in the quarter of 2018 when our analysis is considered final and complete.
We have considered and analyzed the applicability of any new international tax provisions of the Act effective for tax years after December 31, 2017. The global intangible low-taxed income (“GILTI”) provisions of the Act require a U.S. federal income tax return inclusion of annual foreign earnings in excess of a predetermined return on tangible assets of foreign corporations. FASB guidance released in relation to international tax provisions effective after December 31, 2017 considers multiple methods reasonable for income tax accounting purposes. We believe we will be subject to the GILTI provisions beginning in 2018 due to expense allocations required by the U.S. foreign tax credit rules. During the first quarter of 2018, we will adopt the method of accounting for GILTI inclusions as a period expense and therefore have not accrued any deferred taxes in relation to this provision in the 2017 consolidated financial statements.
Income from continuing operations before income taxes by geographic region was as follows:
|
|
|
Year Ended December 31, |
|
|||||||
|
|
|
2017 |
|
2016 |
|
2015 |
|
|||
|
U.S. |
|
$ |
375.4 |
|
$ |
316.7 |
|
$ |
309.4 |
|
|
Non-U.S. |
|
|
172.8 |
|
|
191.4 |
|
|
182.5 |
|
|
Income from continuing operations before income taxes |
|
$ |
548.2 |
|
$ |
508.1 |
|
$ |
491.9 |
|
Income taxes relating to income from continuing operations consisted of the following:
|
|
|
Year Ended December 31, |
|
|||||||
|
|
|
2017 |
|
2016 |
|
2015 |
|
|||
|
Current: |
|
|
|
|
|
|
|
|
|
|
|
Federal |
|
$ |
(3.5) |
|
$ |
(47.2) |
|
$ |
61.8 |
|
|
State and local |
|
|
4.2 |
|
|
4.7 |
|
|
11.5 |
|
|
Foreign |
|
|
43.2 |
|
|
41.0 |
|
|
40.1 |
|
|
Total current |
|
$ |
43.9 |
|
$ |
(1.5) |
|
$ |
113.4 |
|
|
Deferred: |
|
|
|
|
|
|
|
|
|
|
|
Federal |
|
|
(150.5) |
|
|
140.6 |
|
|
40.1 |
|
|
State and local |
|
|
47.2 |
|
|
22.3 |
|
|
8.4 |
|
|
Foreign |
|
|
(5.4) |
|
|
(0.7) |
|
|
(3.9) |
|
|
Total deferred |
|
$ |
(108.7) |
|
$ |
162.2 |
|
$ |
44.6 |
|
|
Income taxes |
|
$ |
(64.8) |
|
$ |
160.7 |
|
$ |
158.0 |
|
|
|
|
|
|
|
|
|
|
|
|
|
Income taxes relating to income from continuing operations varied from the U.S. federal statutory income tax rate due to the following:
|
|
|
Year Ended December 31, |
|
|||||||
|
|
|
2017 |
|
2016 |
|
2015 |
|
|||
|
Income taxes at federal statutory rate of 35% |
|
$ |
191.9 |
|
$ |
177.8 |
|
$ |
172.2 |
|
|
State and local income taxes, net of federal taxes |
|
|
13.7 |
|
|
14.7 |
|
|
13.3 |
|
|
Non-U.S. income taxed at other rates |
|
|
(25.2) |
|
|
(26.8) |
|
|
(27.4) |
|
|
Revaluation of U.S. deferreds |
|
|
(301.6) |
|
|
— |
|
|
— |
|
|
Deemed mandatory repatriation |
|
|
54.8 |
|
|
— |
|
|
— |
|
|
Other |
|
|
1.6 |
|
|
(5.0) |
|
|
(0.1) |
|
|
Income taxes |
|
$ |
(64.8) |
|
$ |
160.7 |
|
$ |
158.0 |
|
F-37
PENSKE AUTOMOTIVE GROUP, INC.
NOTES TO CONSOLIDATED FINANCIAL STATEMENTS (Continued)
(In millions, except share and per share amounts)
The components of deferred tax assets and liabilities as of December 31, 2017 and 2016 were as follows:
|
|
|
December 31, |
|
||||
|
|
|
2017 |
|
2016 |
|
||
|
Deferred Tax Assets |
|
|
|
|
|
|
|
|
Accrued liabilities |
|
$ |
53.6 |
|
$ |
71.4 |
|
|
Net operating loss and credit carryforwards |
|
|
131.0 |
|
|
32.4 |
|
|
Other |
|
|
24.0 |
|
|
18.7 |
|
|
Total deferred tax assets |
|
|
208.6 |
|
|
122.5 |
|
|
Valuation allowance |
|
|
(36.6) |
|
|
(17.2) |
|
|
Net deferred tax assets |
|
$ |
172.0 |
|
$ |
105.3 |
|
|
Deferred Tax Liabilities |
|
|
|
|
|
|
|
|
Depreciation and amortization |
|
|
(178.1) |
|
|
(210.9) |
|
|
Partnership investments |
|
|
(469.5) |
|
|
(448.1) |
|
|
Convertible notes |
|
|
(1.5) |
|
|
(5.0) |
|
|
Other |
|
|
(4.4) |
|
|
(5.9) |
|
|
Total deferred tax liabilities |
|
|
(653.5) |
|
|
(669.9) |
|
|
Net deferred tax liabilities |
|
$ |
(481.5) |
|
$ |
(564.6) |
|
As a result of the deemed mandatory repatriation provisions in the Act discussed previously, we included an estimated $992.7 million of undistributed earnings in income subject to U.S. tax at reduced tax rates. We are not permanently reinvested to the extent of these previously taxed earnings, which may be distributed in the future. As of December 31, 2017, we have not provided U.S. federal income taxes on a total temporary difference of $138.7 million related to the excess of financial reporting basis over tax basis in our non-U.S. subsidiaries, as it is our position that we are permanently reinvested for this basis difference. Our U.K. subsidiary remains permanently reinvested in its non-U.K. subsidiaries. Therefore, we have not recognized any additional deferred tax liabilities related to our investments in non-U.S. subsidiaries.
As of December 31, 2017, we have $504.7 million of state net operating loss carryforwards in the U.S. that expire at various dates beginning in 2018 through 2037, U.S. federal and state credit carryforwards of $7.8 million that will not expire, a U.S. foreign tax credit carryforward of $81.7 million that will expire in 2027, U.K. capital loss carryforwards of $5.1 million that will not expire, German net operating loss carryforwards of $27.0 million that will not expire, Australian net operating loss carryforwards of $15.3 million that will not expire, Canadian net operating loss carryforwards of $0.5 million that will not expire, New Zealand net operating loss carryforwards of $2.1 million that will not expire, and Italian net operating loss carryforwards of $0.1 million that will not expire. The Company generated $248.5 million of state net operating loss carryforwards in the U.S. in 2017.
A valuation allowance of $1.0 million has been recorded against the state net operating loss carryforwards in the U.S., a valuation allowance of $0.4 million has been recorded against the state credit carryforwards in the U.S., and a valuation allowance of $17.5 million has been recorded against the U.S. foreign tax credit carryforward as of December 31, 2017. A valuation allowance of $9.6 million has been recorded against German net operating losses and other deferred tax assets as of December 31, 2017. A valuation allowance of $8.1 million has been recorded against U.K. deferred tax assets related to buildings as of December 31, 2017.
F-38
PENSKE AUTOMOTIVE GROUP, INC.
NOTES TO CONSOLIDATED FINANCIAL STATEMENTS (Continued)
(In millions, except share and per share amounts)
Generally accepted accounting principles relating to uncertain income tax positions prescribe a minimum recognition threshold a tax position is required to meet before being recognized, and provides guidance on the derecognition, measurement, classification, and disclosure relating to income taxes. The movement in uncertain tax positions for the years ended December 31, 2017, 2016, and 2015 were as follows:
|
|
|
Year Ended December 31, |
|
|||||||
|
|
|
2017 |
|
2016 |
|
2015 |
|
|||
|
Uncertain tax positions — January 1 |
|
$ |
3.4 |
|
$ |
12.8 |
|
$ |
13.1 |
|
|
Gross increase — tax position in prior periods |
|
|
0.2 |
|
|
0.2 |
|
|
0.2 |
|
|
Gross decrease — tax position in prior periods |
|
|
(0.1) |
|
|
(0.3) |
|
|
— |
|
|
Gross increase — current period tax position |
|
|
— |
|
|
— |
|
|
— |
|
|
Settlements |
|
|
— |
|
|
(7.8) |
|
|
— |
|
|
Lapse in statute of limitations |
|
|
— |
|
|
— |
|
|
— |
|
|
Foreign exchange |
|
|
— |
|
|
(1.5) |
|
|
(0.5) |
|
|
Uncertain tax positions — December 31 |
|
$ |
3.5 |
|
$ |
3.4 |
|
$ |
12.8 |
|
We have elected to include interest and penalties in our income tax expense. The total interest and penalties included within uncertain tax positions at December 31, 2017 was $2.2 million. We do not expect a significant change to the amount of uncertain tax positions within the next twelve months. Our U.S. federal returns remain open to examination for 2014 through 2016 and various U.S. state jurisdictions are open for periods ranging from 2010 through 2016. The portion of the total amount of uncertain tax positions as of December 31, 2017 that would, if recognized, impact the effective tax rate was $3.5 million.
We have classified our tax reserves as a long‑term obligation on the basis that management does not expect to make payments relating to those reserves within the next twelve months.
As a result of our acquisition of the remaining ownership interests of Premier Truck Group in April 2016, bringing our total ownership interest to 100%, the partnership entity was liquidated, thereby yielding an adjustment to the tax basis of this investment. The result was an elimination of $5.1 million of deferred tax liabilities, which reduced income tax expense by the same amount in 2016.
17. Segment Information
Our operations are organized by management into operating segments by line of business and geography. We have determined that we have four reportable segments as defined in generally accepted accounting principles for segment reporting: (i) Retail Automotive, consisting of our retail automotive dealership operations; (ii) Retail Commercial Truck, consisting of our retail commercial truck dealership operations in the U.S. and Canada; (iii) Other, consisting of our commercial vehicle and power systems distribution operations and other non-automotive consolidated operations; and (iv) Non-Automotive Investments, consisting of our equity method investments in non-automotive operations. The Retail Automotive reportable segment includes all automotive dealerships and all departments relevant to the operation of the dealerships and our retail automotive joint ventures. The individual dealership operations included in the Retail Automotive reportable segment represent six operating segments: Eastern, Central, and Western United States, CarSense, International, and CarShop. These operating segments have been aggregated into one reportable segment as their operations (A) have similar economic characteristics (all are automotive dealerships having similar margins), (B) offer similar products and services (all sell new and/or used vehicles, service, parts and third-party finance and insurance products), (C) have similar target markets and customers (generally individuals) and (D) have similar distribution and marketing practices (all distribute products and services through dealership facilities that market to customers in similar fashions). The accounting policies of the segments are the same and are described in Note 1.
F-39
PENSKE AUTOMOTIVE GROUP, INC.
NOTES TO CONSOLIDATED FINANCIAL STATEMENTS (Continued)
(In millions, except share and per share amounts)
The following table summarizes revenues, floor plan interest expense, other interest expense, depreciation, equity in earnings of affiliates, and income (loss) from continuing operations before certain non‑recurring items and income taxes, which is the measure by which management allocates resources to its segments and which we refer to as adjusted segment income, for each of our reportable segments.
|
|
|
|
|
|
|
|
|
|
|
|
|
|
|
|
|
|
|||
|
|
|
Retail |
|
Retail Commercial |
|
|
|
|
Non-Automotive |
|
Intersegment |
|
|
|
|
||||
|
|
|
Automotive |
|
Truck |
|
Other |
|
Investments |
|
Elimination |
|
Total |
|
||||||
|
Revenues |
|
|
|
|
|
|
|
|
|
|
|
|
|
|
|
|
|
|
|
|
2017 |
|
$ |
19,824.3 |
|
$ |
1,048.0 |
|
$ |
514.6 |
|
$ |
— |
|
$ |
— |
|
$ |
21,386.9 |
|
|
2016 |
|
|
18,673.2 |
|
|
1,000.7 |
|
|
448.5 |
|
|
— |
|
|
(3.9) |
|
|
20,118.5 |
|
|
2015 |
|
|
17,896.3 |
|
|
944.1 |
|
|
446.4 |
|
|
— |
|
|
(1.9) |
|
|
19,284.9 |
|
|
Floor plan interest expense |
|
|
|
|
|
|
|
|
|
|
|
|
|
|
|
|
|
|
|
|
2017 |
|
$ |
59.4 |
|
$ |
2.7 |
|
$ |
1.3 |
|
$ |
— |
|
$ |
— |
|
$ |
63.4 |
|
|
2016 |
|
|
47.1 |
|
|
2.9 |
|
|
0.9 |
|
|
— |
|
|
— |
|
|
50.9 |
|
|
2015 |
|
|
41.3 |
|
|
2.0 |
|
|
1.2 |
|
|
— |
|
|
— |
|
|
44.5 |
|
|
Other interest expense |
|
|
|
|
|
|
|
|
|
|
|
|
|
|
|
|
|
|
|
|
2017 |
|
$ |
95.0 |
|
$ |
3.4 |
|
$ |
9.0 |
|
$ |
— |
|
$ |
— |
|
$ |
107.4 |
|
|
2016 |
|
|
74.8 |
|
|
4.1 |
|
|
6.5 |
|
|
— |
|
|
— |
|
|
85.4 |
|
|
2015 |
|
|
56.8 |
|
|
3.8 |
|
|
8.8 |
|
|
— |
|
|
— |
|
|
69.4 |
|
|
Depreciation |
|
|
|
|
|
|
|
|
|
|
|
|
|
|
|
|
|
|
|
|
2017 |
|
$ |
85.7 |
|
$ |
4.1 |
|
$ |
5.3 |
|
$ |
— |
|
$ |
— |
|
$ |
95.1 |
|
|
2016 |
|
|
81.7 |
|
|
3.2 |
|
|
4.8 |
|
|
— |
|
|
— |
|
|
89.7 |
|
|
2015 |
|
|
71.3 |
|
|
2.0 |
|
|
4.7 |
|
|
— |
|
|
— |
|
|
78.0 |
|
|
Equity in earnings of affiliates |
|
|
|
|
|
|
|
|
|
|
|
|
|
|
|
|
|
|
|
|
2017 |
|
$ |
4.6 |
|
$ |
— |
|
$ |
— |
|
$ |
103.0 |
|
$ |
— |
|
$ |
107.6 |
|
|
2016 |
|
|
4.9 |
|
|
— |
|
|
— |
|
|
64.6 |
|
|
— |
|
|
69.5 |
|
|
2015 |
|
|
4.4 |
|
|
— |
|
|
— |
|
|
34.9 |
|
|
— |
|
|
39.3 |
|
|
Adjusted segment income |
|
|
|
|
|
|
|
|
|
|
|
|
|
|
|
|
|
|
|
|
2017 |
|
$ |
397.2 |
|
$ |
38.4 |
|
$ |
9.6 |
|
$ |
103.0 |
|
$ |
— |
|
$ |
548.2 |
|
|
2016 |
|
|
412.9 |
|
|
26.2 |
|
|
4.4 |
|
|
64.6 |
|
|
— |
|
|
508.1 |
|
|
2015 |
|
|
420.4 |
|
|
35.4 |
|
|
1.2 |
|
|
34.9 |
|
|
— |
|
|
491.9 |
|
F-40
PENSKE AUTOMOTIVE GROUP, INC.
NOTES TO CONSOLIDATED FINANCIAL STATEMENTS (Continued)
(In millions, except share and per share amounts)
Total assets, equity method investments, and capital expenditures by reportable segment are as set forth in the table below:
|
|
|
|
|
|
|
|
|
|
|
|
|
|
|
||||||
|
|
|
Retail |
|
Retail Commercial |
|
|
|
Non-Automotive |
|
Intersegment |
|
|
|
||||||
|
|
|
Automotive |
|
Truck |
|
Other |
|
Investments |
|
Elimination |
|
Total |
|
||||||
|
Total assets |
|
|
|
|
|
|
|
|
|
|
|
|
|
|
|
|
|
|
|
|
2017 |
|
$ |
8,157.0 |
|
$ |
553.4 |
|
$ |
642.1 |
|
$ |
1,188.1 |
|
$ |
— |
|
$ |
10,540.6 |
|
|
2016 |
|
|
7,011.5 |
|
|
489.1 |
|
|
497.6 |
|
|
834.8 |
|
|
— |
|
|
8,833.0 |
|
|
Equity method investments |
|
|
|
|
|
|
|
|
|
|
|
|
|
|
|
|
|
|
|
|
2017 |
|
$ |
68.5 |
|
$ |
— |
|
$ |
— |
|
$ |
1,188.1 |
|
$ |
— |
|
$ |
1,256.6 |
|
|
2016 |
|
|
58.6 |
|
|
— |
|
|
— |
|
|
834.8 |
|
|
— |
|
|
893.4 |
|
|
Capital expenditures |
|
|
|
|
|
|
|
|
|
|
|
|
|
|
|
|
|
|
|
|
2017 |
|
$ |
237.8 |
|
$ |
6.4 |
|
$ |
2.8 |
|
$ |
— |
|
$ |
— |
|
$ |
247.0 |
|
|
2016 |
|
|
195.6 |
|
|
3.3 |
|
|
4.2 |
|
|
— |
|
|
— |
|
|
203.1 |
|
|
2015 |
|
|
187.7 |
|
|
4.5 |
|
|
7.3 |
|
|
— |
|
|
— |
|
|
199.5 |
|
The following table presents certain data by geographic area:
|
|
|
Year Ended December 31, |
|
|||||||
|
|
|
2017 |
|
2016 |
|
2015 |
|
|||
|
Revenue from external customers: |
|
|
|
|
|
|
|
|
|
|
|
U.S. |
|
$ |
12,487.2 |
|
$ |
12,005.9 |
|
$ |
11,806.9 |
|
|
Non-U.S. |
|
|
8,899.7 |
|
|
8,112.6 |
|
|
7,478.0 |
|
|
Total revenue from external customers |
|
$ |
21,386.9 |
|
$ |
20,118.5 |
|
$ |
19,284.9 |
|
|
Long-lived assets, net: |
|
|
|
|
|
|
|
|
|
|
|
U.S. |
|
$ |
2,268.1 |
|
$ |
1,847.3 |
|
|
|
|
|
Non-U.S. |
|
|
1,111.5 |
|
|
880.9 |
|
|
|
|
|
Total long-lived assets |
|
$ |
3,379.6 |
|
$ |
2,728.2 |
|
|
|
|
The Company’s non-U.S. operations are predominantly based in the U.K.
F-41
PENSKE AUTOMOTIVE GROUP, INC.
NOTES TO CONSOLIDATED FINANCIAL STATEMENTS (Continued)
(In millions, except share and per share amounts)
The following tables present our revenue from external customers by product type for our Retail Automotive and Retail Commercial Truck segments:
|
|
|
Year Ended December 31, |
|
|||||||
|
Retail Automotive Dealership Revenue |
|
2017 |
|
2016 |
|
2015 |
|
|||
|
New vehicle |
|
$ |
9,678.5 |
|
$ |
9,547.1 |
|
$ |
9,208.9 |
|
|
Used vehicle |
|
|
6,386.8 |
|
|
5,663.7 |
|
|
5,425.5 |
|
|
Finance and insurance, net |
|
|
581.8 |
|
|
495.0 |
|
|
478.3 |
|
|
Service and parts |
|
|
2,057.5 |
|
|
1,948.6 |
|
|
1,830.7 |
|
|
Fleet and wholesale |
|
|
1,119.7 |
|
|
1,018.8 |
|
|
952.9 |
|
|
Total retail automotive dealership revenue |
|
$ |
19,824.3 |
|
$ |
18,673.2 |
|
$ |
17,896.3 |
|
|
|
|
Year Ended December 31, |
|
|||||||
|
Retail Commercial Truck Dealership Revenue |
|
2017 |
|
2016 |
|
2015 |
|
|||
|
New truck |
|
$ |
613.2 |
|
$ |
625.5 |
|
$ |
572.5 |
|
|
Used truck |
|
|
89.4 |
|
|
51.8 |
|
|
58.7 |
|
|
Finance and insurance, net |
|
|
9.0 |
|
|
7.3 |
|
|
6.7 |
|
|
Service and parts |
|
|
325.6 |
|
|
306.0 |
|
|
286.0 |
|
|
Lease, rental and wholesale |
|
|
10.8 |
|
|
10.1 |
|
|
20.2 |
|
|
Total retail commercial truck dealership revenue |
|
$ |
1,048.0 |
|
$ |
1,000.7 |
|
$ |
944.1 |
|
18. Summary of Quarterly Financial Data (Unaudited)
|
|
|
First |
|
Second |
|
Third |
|
Fourth |
|
||||
|
|
|
Quarter |
|
Quarter |
|
Quarter |
|
Quarter |
|
||||
|
2017 (1)(2) |
|
|
|
|
|
|
|
|
|
|
|
|
|
|
Total revenues |
|
$ |
5,081.1 |
|
$ |
5,383.4 |
|
$ |
5,524.4 |
|
$ |
5,398.0 |
|
|
Gross profit |
|
|
774.3 |
|
|
817.3 |
|
|
822.6 |
|
|
808.3 |
|
|
Net income |
|
|
83.0 |
|
|
106.9 |
|
|
94.3 |
|
|
328.6 |
|
|
Net income attributable to Penske Automotive Group common stockholders |
|
|
82.6 |
|
|
106.2 |
|
|
94.4 |
|
|
330.1 |
|
|
Diluted earnings per share attributable to Penske Automotive Group common stockholders |
|
$ |
0.96 |
|
$ |
1.23 |
|
$ |
1.10 |
|
$ |
3.85 |
|
|
2016 (1)(2) |
|
|
|
|
|
|
|
|
|
|
|
|
|
|
Total revenues |
|
$ |
4,824.6 |
|
$ |
5,254.1 |
|
$ |
5,152.0 |
|
$ |
4,887.8 |
|
|
Gross profit |
|
|
723.8 |
|
|
771.3 |
|
|
744.2 |
|
|
727.3 |
|
|
Net income |
|
|
80.2 |
|
|
95.0 |
|
|
88.5 |
|
|
82.7 |
|
|
Net income attributable to Penske Automotive Group common stockholders |
|
|
79.3 |
|
|
93.5 |
|
|
87.5 |
|
|
82.6 |
|
|
Diluted earnings per share attributable to Penske Automotive Group common stockholders |
|
$ |
0.90 |
|
$ |
1.10 |
|
$ |
1.03 |
|
$ |
0.97 |
|
|
(1) |
As discussed in Note 4, we have treated the operations of certain entities as discontinued operations. The results for all periods have been restated to reflect such treatment. |
|
(2) |
Per share amounts are calculated independently for each of the quarters presented. The sum of the quarters may not equal the full year per share amounts due to rounding. |
F-42
PENSKE AUTOMOTIVE GROUP, INC.
NOTES TO CONSOLIDATED FINANCIAL STATEMENTS (Continued)
(In millions, except share and per share amounts)
19. Condensed Consolidating Financial Information
The following tables include condensed consolidating financial information as of December 31, 2017 and 2016 and for the years ended December 31, 2017, 2016, and 2015 for Penske Automotive Group, Inc. (as the issuer of the 5.75% Notes, the 5.375% Notes, the 5.50% Notes, and the 3.75% Notes), guarantor subsidiaries, and non-guarantor subsidiaries (primarily representing non-U.S. entities). Guarantor subsidiaries are directly or indirectly 100% owned by PAG, and the guarantees are full and unconditional, and joint and several. The guarantees may be released under certain circumstances upon resale, or transfer by us of the stock of the related guarantor or all or substantially all of the assets of the guarantor to a non-affiliate.
CONDENSED CONSOLIDATING BALANCE SHEET
December 31, 2017
|
|
|
|
|
|
|
|
|
Penske |
|
|
|
|
|
|
|
|
|
|
|
Total |
|
|
|
|
Automotive |
|
Guarantor |
|
Non-Guarantor |
|
||||
|
|
|
Company |
|
Eliminations |
|
Group |
|
Subsidiaries |
|
Subsidiaries |
|
|||||
|
Cash and cash equivalents |
|
$ |
45.7 |
|
$ |
— |
|
$ |
— |
|
$ |
14.8 |
|
$ |
30.9 |
|
|
Accounts receivable, net |
|
|
954.9 |
|
|
(463.6) |
|
|
463.6 |
|
|
523.8 |
|
|
431.1 |
|
|
Inventories |
|
|
3,944.1 |
|
|
— |
|
|
— |
|
|
1,935.0 |
|
|
2,009.1 |
|
|
Other current assets |
|
|
81.8 |
|
|
— |
|
|
7.3 |
|
|
16.8 |
|
|
57.7 |
|
|
Assets held for sale |
|
|
— |
|
|
— |
|
|
— |
|
|
— |
|
|
— |
|
|
Total current assets |
|
|
5,026.5 |
|
|
(463.6) |
|
|
470.9 |
|
|
2,490.4 |
|
|
2,528.8 |
|
|
Property and equipment, net |
|
|
2,108.6 |
|
|
— |
|
|
3.3 |
|
|
1,032.9 |
|
|
1,072.4 |
|
|
Intangible assets |
|
|
2,134.5 |
|
|
— |
|
|
— |
|
|
1,334.6 |
|
|
799.9 |
|
|
Equity method investments |
|
|
1,256.6 |
|
|
— |
|
|
1,186.9 |
|
|
— |
|
|
69.7 |
|
|
Other long-term assets |
|
|
14.4 |
|
|
(2,772.7) |
|
|
2,777.8 |
|
|
4.6 |
|
|
4.7 |
|
|
Total assets |
|
$ |
10,540.6 |
|
$ |
(3,236.3) |
|
$ |
4,438.9 |
|
$ |
4,862.5 |
|
$ |
4,475.5 |
|
|
Floor plan notes payable |
|
$ |
2,343.2 |
|
$ |
— |
|
$ |
— |
|
$ |
1,272.4 |
|
$ |
1,070.8 |
|
|
Floor plan notes payable — non-trade |
|
|
1,418.6 |
|
|
— |
|
|
196.6 |
|
|
601.9 |
|
|
620.1 |
|
|
Accounts payable |
|
|
641.6 |
|
|
— |
|
|
3.9 |
|
|
194.4 |
|
|
443.3 |
|
|
Accrued expenses |
|
|
523.5 |
|
|
(463.6) |
|
|
1.0 |
|
|
165.2 |
|
|
820.9 |
|
|
Current portion of long-term debt |
|
|
72.8 |
|
|
— |
|
|
— |
|
|
5.5 |
|
|
67.3 |
|
|
Liabilities held for sale |
|
|
0.7 |
|
|
— |
|
|
— |
|
|
0.7 |
|
|
— |
|
|
Total current liabilities |
|
|
5,000.4 |
|
|
(463.6) |
|
|
201.5 |
|
|
2,240.1 |
|
|
3,022.4 |
|
|
Long-term debt |
|
|
2,090.4 |
|
|
(150.2) |
|
|
1,809.4 |
|
|
191.6 |
|
|
239.6 |
|
|
Deferred tax liabilities |
|
|
481.5 |
|
|
— |
|
|
— |
|
|
480.1 |
|
|
1.4 |
|
|
Other long-term liabilities |
|
|
540.3 |
|
|
— |
|
|
— |
|
|
64.7 |
|
|
475.6 |
|
|
Total liabilities |
|
|
8,112.6 |
|
|
(613.8) |
|
|
2,010.9 |
|
|
2,976.5 |
|
|
3,739.0 |
|
|
Total equity |
|
|
2,428.0 |
|
|
(2,622.5) |
|
|
2,428.0 |
|
|
1,886.0 |
|
|
736.5 |
|
|
Total liabilities and equity |
|
$ |
10,540.6 |
|
$ |
(3,236.3) |
|
$ |
4,438.9 |
|
$ |
4,862.5 |
|
$ |
4,475.5 |
|
F-43
PENSKE AUTOMOTIVE GROUP, INC.
NOTES TO CONSOLIDATED FINANCIAL STATEMENTS (Continued)
(In millions, except share and per share amounts)
CONDENSED CONSOLIDATING BALANCE SHEET
December 31, 2016
|
|
|
|
|
|
|
|
|
Penske |
|
|
|
|
|
|
|
|
|
|
|
Total |
|
|
|
|
Automotive |
|
Guarantor |
|
Non-Guarantor |
|
||||
|
|
|
Company |
|
Eliminations |
|
Group |
|
Subsidiaries |
|
Subsidiaries |
|
|||||
|
Cash and cash equivalents |
|
$ |
24.0 |
|
$ |
— |
|
$ |
— |
|
$ |
9.4 |
|
$ |
14.6 |
|
|
Accounts receivable, net |
|
|
879.0 |
|
|
(447.0) |
|
|
447.0 |
|
|
483.6 |
|
|
395.4 |
|
|
Inventories |
|
|
3,408.2 |
|
|
— |
|
|
— |
|
|
1,830.5 |
|
|
1,577.7 |
|
|
Other current assets |
|
|
73.9 |
|
|
— |
|
|
14.3 |
|
|
14.6 |
|
|
45.0 |
|
|
Assets held for sale |
|
|
8.4 |
|
|
— |
|
|
— |
|
|
8.4 |
|
|
— |
|
|
Total current assets |
|
|
4,393.5 |
|
|
(447.0) |
|
|
461.3 |
|
|
2,346.5 |
|
|
2,032.7 |
|
|
Property and equipment, net |
|
|
1,806.5 |
|
|
— |
|
|
3.3 |
|
|
961.0 |
|
|
842.2 |
|
|
Intangible assets |
|
|
1,711.3 |
|
|
— |
|
|
— |
|
|
1,079.6 |
|
|
631.7 |
|
|
Equity method investments |
|
|
893.4 |
|
|
— |
|
|
833.7 |
|
|
— |
|
|
59.7 |
|
|
Other long-term assets |
|
|
28.3 |
|
|
(2,215.0) |
|
|
2,220.6 |
|
|
4.1 |
|
|
18.6 |
|
|
Total assets |
|
$ |
8,833.0 |
|
$ |
(2,662.0) |
|
$ |
3,518.9 |
|
$ |
4,391.2 |
|
$ |
3,584.9 |
|
|
Floor plan notes payable |
|
$ |
2,084.5 |
|
$ |
— |
|
$ |
— |
|
$ |
1,178.0 |
|
$ |
906.5 |
|
|
Floor plan notes payable — non-trade |
|
|
1,233.3 |
|
|
— |
|
|
156.0 |
|
|
623.2 |
|
|
454.1 |
|
|
Accounts payable |
|
|
497.4 |
|
|
— |
|
|
4.9 |
|
|
171.9 |
|
|
320.6 |
|
|
Accrued expenses |
|
|
360.0 |
|
|
(447.0) |
|
|
0.9 |
|
|
77.2 |
|
|
728.9 |
|
|
Current portion of long-term debt |
|
|
48.3 |
|
|
— |
|
|
— |
|
|
6.0 |
|
|
42.3 |
|
|
Liabilities held for sale |
|
|
6.1 |
|
|
— |
|
|
— |
|
|
6.1 |
|
|
— |
|
|
Total current liabilities |
|
|
4,229.6 |
|
|
(447.0) |
|
|
161.8 |
|
|
2,062.4 |
|
|
2,452.4 |
|
|
Long-term debt |
|
|
1,828.8 |
|
|
(175.8) |
|
|
1,577.6 |
|
|
186.0 |
|
|
241.0 |
|
|
Deferred tax liabilities |
|
|
564.6 |
|
|
— |
|
|
— |
|
|
560.9 |
|
|
3.7 |
|
|
Other long-term liabilities |
|
|
430.5 |
|
|
— |
|
|
— |
|
|
65.2 |
|
|
365.3 |
|
|
Total liabilities |
|
|
7,053.5 |
|
|
(622.8) |
|
|
1,739.4 |
|
|
2,874.5 |
|
|
3,062.4 |
|
|
Total equity |
|
|
1,779.5 |
|
|
(2,039.2) |
|
|
1,779.5 |
|
|
1,516.7 |
|
|
522.5 |
|
|
Total liabilities and equity |
|
$ |
8,833.0 |
|
$ |
(2,662.0) |
|
$ |
3,518.9 |
|
$ |
4,391.2 |
|
$ |
3,584.9 |
|
F-44
PENSKE AUTOMOTIVE GROUP, INC.
NOTES TO CONSOLIDATED FINANCIAL STATEMENTS (Continued)
(In millions, except share and per share amounts)
CONDENSED CONSOLIDATING STATEMENT OF INCOME
Year Ended December 31, 2017
|
|
|
|
|
|
|
|
|
Penske |
|
|
|
|
|
|
|
|
|
|
|
Total |
|
|
|
|
Automotive |
|
Guarantor |
|
Non-Guarantor |
|
||||
|
|
|
Company |
|
Eliminations |
|
Group |
|
Subsidiaries |
|
Subsidiaries |
|
|||||
|
Revenues |
|
$ |
21,386.9 |
|
$ |
— |
|
$ |
— |
|
$ |
11,825.9 |
|
$ |
9,561.0 |
|
|
Cost of sales |
|
|
18,164.4 |
|
|
— |
|
|
— |
|
|
9,945.0 |
|
|
8,219.4 |
|
|
Gross profit |
|
|
3,222.5 |
|
|
— |
|
|
— |
|
|
1,880.9 |
|
|
1,341.6 |
|
|
Selling, general and administrative expenses |
|
|
2,516.0 |
|
|
— |
|
|
24.5 |
|
|
1,393.3 |
|
|
1,098.2 |
|
|
Depreciation |
|
|
95.1 |
|
|
— |
|
|
1.6 |
|
|
53.1 |
|
|
40.4 |
|
|
Operating income |
|
|
611.4 |
|
|
— |
|
|
(26.1) |
|
|
434.5 |
|
|
203.0 |
|
|
Floor plan interest expense |
|
|
(63.4) |
|
|
— |
|
|
(4.9) |
|
|
(38.5) |
|
|
(20.0) |
|
|
Other interest expense |
|
|
(107.4) |
|
|
— |
|
|
(73.5) |
|
|
(8.9) |
|
|
(25.0) |
|
|
Equity in earnings of affiliates |
|
|
107.6 |
|
|
— |
|
|
102.8 |
|
|
— |
|
|
4.8 |
|
|
Equity in earnings of subsidiaries |
|
|
— |
|
|
(550.6) |
|
|
550.6 |
|
|
— |
|
|
— |
|
|
Income from continuing operations before income taxes |
|
|
548.2 |
|
|
(550.6) |
|
|
548.9 |
|
|
387.1 |
|
|
162.8 |
|
|
Income taxes |
|
|
64.8 |
|
|
(64.8) |
|
|
64.8 |
|
|
95.5 |
|
|
(30.7) |
|
|
Income from continuing operations |
|
|
613.0 |
|
|
(615.4) |
|
|
613.7 |
|
|
482.6 |
|
|
132.1 |
|
|
(Loss) income from discontinued operations, net of tax |
|
|
(0.2) |
|
|
0.2 |
|
|
(0.2) |
|
|
(0.2) |
|
|
— |
|
|
Net income |
|
|
612.8 |
|
|
(615.2) |
|
|
613.5 |
|
|
482.4 |
|
|
132.1 |
|
|
Other comprehensive income (loss), net of tax |
|
|
107.4 |
|
|
(97.5) |
|
|
107.4 |
|
|
— |
|
|
97.5 |
|
|
Comprehensive income |
|
|
720.2 |
|
|
(712.7) |
|
|
720.9 |
|
|
482.4 |
|
|
229.6 |
|
|
Less: Comprehensive income attributable to non-controlling interests |
|
|
2.7 |
|
|
(3.2) |
|
|
3.2 |
|
|
— |
|
|
2.7 |
|
|
Comprehensive income attributable to Penske Automotive Group common stockholders |
|
$ |
717.5 |
|
$ |
(709.5) |
|
$ |
717.7 |
|
$ |
482.4 |
|
$ |
226.9 |
|
F-45
PENSKE AUTOMOTIVE GROUP, INC.
NOTES TO CONSOLIDATED FINANCIAL STATEMENTS (Continued)
(In millions, except share and per share amounts)
CONDENSED CONSOLIDATING STATEMENT OF INCOME
Year Ended December 31, 2016
|
|
|
|
|
|
|
|
|
Penske |
|
|
|
|
|
|
|
|
|
|
|
Total |
|
|
|
|
Automotive |
|
Guarantor |
|
Non-Guarantor |
|
||||
|
|
|
Company |
|
Eliminations |
|
Group |
|
Subsidiaries |
|
Subsidiaries |
|
|||||
|
Revenues |
|
$ |
20,118.5 |
|
$ |
— |
|
$ |
— |
|
$ |
10,946.2 |
|
$ |
9,172.3 |
|
|
Cost of sales |
|
|
17,151.9 |
|
|
— |
|
|
— |
|
|
9,251.8 |
|
|
7,900.1 |
|
|
Gross profit |
|
|
2,966.6 |
|
|
— |
|
|
— |
|
|
1,694.4 |
|
|
1,272.2 |
|
|
Selling, general and administrative expenses |
|
|
2,302.0 |
|
|
— |
|
|
19.2 |
|
|
1,284.4 |
|
|
998.4 |
|
|
Depreciation |
|
|
89.7 |
|
|
— |
|
|
1.7 |
|
|
47.3 |
|
|
40.7 |
|
|
Operating income |
|
|
574.9 |
|
|
— |
|
|
(20.9) |
|
|
362.7 |
|
|
233.1 |
|
|
Floor plan interest expense |
|
|
(50.9) |
|
|
— |
|
|
(3.0) |
|
|
(29.1) |
|
|
(18.8) |
|
|
Other interest expense |
|
|
(85.4) |
|
|
— |
|
|
(59.2) |
|
|
(5.1) |
|
|
(21.1) |
|
|
Equity in earnings of affiliates |
|
|
69.5 |
|
|
— |
|
|
64.6 |
|
|
— |
|
|
4.9 |
|
|
Equity in earnings of subsidiaries |
|
|
— |
|
|
(523.3) |
|
|
523.3 |
|
|
— |
|
|
— |
|
|
Income from continuing operations before income taxes |
|
|
508.1 |
|
|
(523.3) |
|
|
504.8 |
|
|
328.5 |
|
|
198.1 |
|
|
Income taxes |
|
|
(160.7) |
|
|
166.6 |
|
|
(160.7) |
|
|
(124.4) |
|
|
(42.2) |
|
|
Income from continuing operations |
|
|
347.4 |
|
|
(356.7) |
|
|
344.1 |
|
|
204.1 |
|
|
155.9 |
|
|
(Loss) income from discontinued operations, net of tax |
|
|
(1.0) |
|
|
1.0 |
|
|
(1.0) |
|
|
(0.9) |
|
|
(0.1) |
|
|
Net income |
|
|
346.4 |
|
|
(355.7) |
|
|
343.1 |
|
|
203.2 |
|
|
155.8 |
|
|
Other comprehensive income (loss), net of tax |
|
|
(129.0) |
|
|
123.9 |
|
|
(129.0) |
|
|
— |
|
|
(123.9) |
|
|
Comprehensive income |
|
|
217.4 |
|
|
(231.8) |
|
|
214.1 |
|
|
203.2 |
|
|
31.9 |
|
|
Less: Comprehensive income attributable to non-controlling interests |
|
|
2.7 |
|
|
0.8 |
|
|
(0.8) |
|
|
— |
|
|
2.7 |
|
|
Comprehensive income attributable to Penske Automotive Group common stockholders |
|
$ |
214.7 |
|
$ |
(232.6) |
|
$ |
214.9 |
|
$ |
203.2 |
|
$ |
29.2 |
|
F-46
PENSKE AUTOMOTIVE GROUP, INC.
NOTES TO CONSOLIDATED FINANCIAL STATEMENTS (Continued)
(In millions, except share and per share amounts)
CONDENSED CONSOLIDATING STATEMENT OF INCOME
Year Ended December 31, 2015
|
|
|
|
|
|
|
|
|
Penske |
|
|
|
|
|
|
|
|
|
|
|
Total |
|
|
|
|
Automotive |
|
Guarantor |
|
Non-Guarantor |
|
||||
|
|
|
Company |
|
Eliminations |
|
Group |
|
Subsidiaries |
|
Subsidiaries |
|
|||||
|
Revenues |
|
$ |
19,284.9 |
|
$ |
— |
|
$ |
— |
|
$ |
10,152.4 |
|
$ |
9,132.5 |
|
|
Cost of sales |
|
|
16,417.4 |
|
|
— |
|
|
— |
|
|
8,582.4 |
|
|
7,835.0 |
|
|
Gross profit |
|
|
2,867.5 |
|
|
— |
|
|
— |
|
|
1,570.0 |
|
|
1,297.5 |
|
|
Selling, general and administrative expenses |
|
|
2,223.0 |
|
|
— |
|
|
23.6 |
|
|
1,193.0 |
|
|
1,006.4 |
|
|
Depreciation |
|
|
78.0 |
|
|
— |
|
|
1.6 |
|
|
42.0 |
|
|
34.4 |
|
|
Operating income |
|
|
566.5 |
|
|
— |
|
|
(25.2) |
|
|
335.0 |
|
|
256.7 |
|
|
Floor plan interest expense |
|
|
(44.5) |
|
|
— |
|
|
(2.8) |
|
|
(22.0) |
|
|
(19.7) |
|
|
Other interest expense |
|
|
(69.4) |
|
|
— |
|
|
(45.6) |
|
|
(5.3) |
|
|
(18.5) |
|
|
Equity in earnings of affiliates |
|
|
39.3 |
|
|
— |
|
|
34.8 |
|
|
— |
|
|
4.5 |
|
|
Equity in earnings of subsidiaries |
|
|
— |
|
|
(527.0) |
|
|
527.0 |
|
|
— |
|
|
— |
|
|
Income from continuing operations before income taxes |
|
|
491.9 |
|
|
(527.0) |
|
|
488.2 |
|
|
307.7 |
|
|
223.0 |
|
|
Income taxes |
|
|
(158.0) |
|
|
170.5 |
|
|
(158.0) |
|
|
(117.4) |
|
|
(53.1) |
|
|
Income from continuing operations |
|
|
333.9 |
|
|
(356.5) |
|
|
330.2 |
|
|
190.3 |
|
|
169.9 |
|
|
(Loss) income from discontinued operations, net of tax |
|
|
(3.5) |
|
|
4.0 |
|
|
(4.0) |
|
|
(1.4) |
|
|
(2.1) |
|
|
Net income |
|
|
330.4 |
|
|
(352.5) |
|
|
326.2 |
|
|
188.9 |
|
|
167.8 |
|
|
Other comprehensive income (loss), net of tax |
|
|
(70.3) |
|
|
62.9 |
|
|
(70.3) |
|
|
— |
|
|
(62.9) |
|
|
Comprehensive income |
|
|
260.1 |
|
|
(289.6) |
|
|
255.9 |
|
|
188.9 |
|
|
104.9 |
|
|
Less: Comprehensive income attributable to non-controlling interests |
|
|
3.2 |
|
|
1.1 |
|
|
(1.1) |
|
|
— |
|
|
3.2 |
|
|
Comprehensive income attributable to Penske Automotive Group common stockholders |
|
$ |
256.9 |
|
$ |
(290.7) |
|
$ |
257.0 |
|
$ |
188.9 |
|
$ |
101.7 |
|
F-47
PENSKE AUTOMOTIVE GROUP, INC.
NOTES TO CONSOLIDATED FINANCIAL STATEMENTS (Continued)
(In millions, except share and per share amounts)
CONDENSED CONSOLIDATING STATEMENT OF CASH FLOWS
Year Ended December 31, 2017
|
|
|
|
|
|
Penske |
|
|
|
|
|
|
|
|
|
|
|
Total |
|
Automotive |
|
Guarantor |
|
Non-Guarantor |
|
||||
|
|
|
Company |
|
Group |
|
Subsidiaries |
|
Subsidiaries |
|
||||
|
Net cash provided by (used in) continuing operating activities |
|
$ |
623.0 |
|
$ |
(46.8) |
|
$ |
643.3 |
|
$ |
26.5 |
|
|
Investing activities: |
|
|
|
|
|
|
|
|
|
|
|
|
|
|
Purchase of equipment and improvements |
|
|
(247.0) |
|
|
(3.2) |
|
|
(138.0) |
|
|
(105.8) |
|
|
Proceeds from sale-leaseback transactions |
|
|
22.2 |
|
|
— |
|
|
— |
|
|
22.2 |
|
|
Acquisition of additional ownership interest in Penske Truck Leasing |
|
|
(239.1) |
|
|
(239.1) |
|
|
— |
|
|
— |
|
|
Acquisitions, net |
|
|
(449.7) |
|
|
— |
|
|
(334.5) |
|
|
(115.2) |
|
|
Other |
|
|
(15.1) |
|
|
(40.0) |
|
|
9.0 |
|
|
15.9 |
|
|
Net cash used in continuing investing activities |
|
|
(928.7) |
|
|
(282.3) |
|
|
(463.5) |
|
|
(182.9) |
|
|
Financing activities: |
|
|
|
|
|
|
|
|
|
|
|
|
|
|
Issuance of 3.75% senior subordinated notes |
|
|
300.0 |
|
|
300.0 |
|
|
— |
|
|
— |
|
|
Net (repayments) borrowings of long-term debt |
|
|
(26.0) |
|
|
(68.0) |
|
|
6.4 |
|
|
35.6 |
|
|
Net borrowings of floor plan notes payable — non-trade |
|
|
185.3 |
|
|
40.6 |
|
|
4.8 |
|
|
139.9 |
|
|
Payment of debt issuance costs |
|
|
(4.0) |
|
|
(4.0) |
|
|
— |
|
|
— |
|
|
Repurchases of common stock |
|
|
(18.5) |
|
|
(18.5) |
|
|
— |
|
|
— |
|
|
Dividends |
|
|
(108.4) |
|
|
(108.4) |
|
|
— |
|
|
— |
|
|
Other |
|
|
(5.8) |
|
|
(5.8) |
|
|
— |
|
|
— |
|
|
Distributions from (to) parent |
|
|
— |
|
|
193.2 |
|
|
(188.3) |
|
|
(4.9) |
|
|
Net cash provided by (used in) continuing financing activities |
|
|
322.6 |
|
|
329.1 |
|
|
(177.1) |
|
|
170.6 |
|
|
Net cash provided by discontinued operations |
|
|
2.7 |
|
|
— |
|
|
2.7 |
|
|
— |
|
|
Effect of exchange rate changes on cash and cash equivalents |
|
|
2.1 |
|
|
— |
|
|
— |
|
|
2.1 |
|
|
Net change in cash and cash equivalents |
|
|
21.7 |
|
|
— |
|
|
5.4 |
|
|
16.3 |
|
|
Cash and cash equivalents, beginning of period |
|
|
24.0 |
|
|
— |
|
|
9.4 |
|
|
14.6 |
|
|
Cash and cash equivalents, end of period |
|
$ |
45.7 |
|
$ |
— |
|
$ |
14.8 |
|
$ |
30.9 |
|
F-48
PENSKE AUTOMOTIVE GROUP, INC.
NOTES TO CONSOLIDATED FINANCIAL STATEMENTS (Continued)
(In millions, except share and per share amounts)
CONDENSED CONSOLIDATING STATEMENT OF CASH FLOWS
Year Ended December 31, 2016
|
|
|
|
|
|
Penske |
|
|
|
|
|
|
|
|
|
|
|
Total |
|
Automotive |
|
Guarantor |
|
Non-Guarantor |
|
||||
|
|
|
Company |
|
Group |
|
Subsidiaries |
|
Subsidiaries |
|
||||
|
Net cash provided by (used in) continuing operating activities |
|
$ |
371.3 |
|
$ |
(31.6) |
|
$ |
52.1 |
|
$ |
350.8 |
|
|
Investing activities: |
|
|
|
|
|
|
|
|
|
|
|
|
|
|
Purchase of equipment and improvements |
|
|
(203.1) |
|
|
(1.0) |
|
|
(126.6) |
|
|
(75.5) |
|
|
Acquisition of additional ownership interest in Penske Truck Leasing |
|
|
(498.5) |
|
|
(498.5) |
|
|
— |
|
|
— |
|
|
Acquisitions, net |
|
|
(140.8) |
|
|
— |
|
|
— |
|
|
(140.8) |
|
|
Other |
|
|
5.7 |
|
|
— |
|
|
17.0 |
|
|
(11.3) |
|
|
Net cash used in continuing investing activities |
|
|
(836.7) |
|
|
(499.5) |
|
|
(109.6) |
|
|
(227.6) |
|
|
Financing activities: |
|
|
|
|
|
|
|
|
|
|
|
|
|
|
Issuance of 5.50% senior subordinated notes |
|
|
500.0 |
|
|
500.0 |
|
|
— |
|
|
— |
|
|
Net borrowings of long-term debt |
|
|
122.9 |
|
|
80.0 |
|
|
21.6 |
|
|
21.3 |
|
|
Net borrowings (repayments) of floor plan notes payable — non-trade |
|
|
101.0 |
|
|
1.3 |
|
|
270.8 |
|
|
(171.1) |
|
|
Payment of debt issuance costs |
|
|
(6.7) |
|
|
(6.7) |
|
|
— |
|
|
— |
|
|
Repurchases of common stock |
|
|
(173.6) |
|
|
(173.6) |
|
|
— |
|
|
— |
|
|
Dividends |
|
|
(95.1) |
|
|
(95.1) |
|
|
— |
|
|
— |
|
|
Other |
|
|
(15.5) |
|
|
(5.8) |
|
|
— |
|
|
(9.7) |
|
|
Distributions from (to) parent |
|
|
— |
|
|
231.0 |
|
|
(226.2) |
|
|
(4.8) |
|
|
Net cash provided by (used in) continuing financing activities |
|
|
433.0 |
|
|
531.1 |
|
|
66.2 |
|
|
(164.3) |
|
|
Net cash provided by discontinued operations |
|
|
3.1 |
|
|
— |
|
|
0.7 |
|
|
2.4 |
|
|
Effect of exchange rate changes on cash and cash equivalents |
|
|
(9.1) |
|
|
— |
|
|
— |
|
|
(9.1) |
|
|
Net change in cash and cash equivalents |
|
|
(38.4) |
|
|
— |
|
|
9.4 |
|
|
(47.8) |
|
|
Cash and cash equivalents, beginning of period |
|
|
62.4 |
|
|
— |
|
|
— |
|
|
62.4 |
|
|
Cash and cash equivalents, end of period |
|
$ |
24.0 |
|
$ |
— |
|
$ |
9.4 |
|
$ |
14.6 |
|
F-49
PENSKE AUTOMOTIVE GROUP, INC.
NOTES TO CONSOLIDATED FINANCIAL STATEMENTS (Continued)
(In millions, except share and per share amounts)
CONDENSED CONSOLIDATING STATEMENT OF CASH FLOWS
Year Ended December 31, 2015
|
|
|
|
|
|
Penske |
|
|
|
|
|
|
|
|
|
|
|
Total |
|
Automotive |
|
Guarantor |
|
Non-Guarantor |
|
||||
|
|
|
Company |
|
Group |
|
Subsidiaries |
|
Subsidiaries |
|
||||
|
Net cash provided by continuing operating activities |
|
$ |
397.8 |
|
$ |
1.4 |
|
$ |
230.3 |
|
$ |
166.1 |
|
|
Investing activities: |
|
|
|
|
|
|
|
|
|
|
|
|
|
|
Purchase of equipment and improvements |
|
|
(199.5) |
|
|
(1.3) |
|
|
(119.7) |
|
|
(78.5) |
|
|
Acquisitions, net |
|
|
(156.9) |
|
|
— |
|
|
(93.2) |
|
|
(63.7) |
|
|
Other |
|
|
4.7 |
|
|
— |
|
|
— |
|
|
4.7 |
|
|
Net cash used in continuing investing activities |
|
|
(351.7) |
|
|
(1.3) |
|
|
(212.9) |
|
|
(137.5) |
|
|
Financing activities: |
|
|
|
|
|
|
|
|
|
|
|
|
|
|
Net (repayments) borrowings of long-term debt |
|
|
(62.1) |
|
|
72.0 |
|
|
(4.9) |
|
|
(129.2) |
|
|
Net borrowings (repayments) of floor plan notes payable — non-trade |
|
|
154.2 |
|
|
67.9 |
|
|
(58.3) |
|
|
144.6 |
|
|
Payment of debt issuance costs |
|
|
(1.8) |
|
|
— |
|
|
— |
|
|
(1.8) |
|
|
Repurchases of common stock |
|
|
(48.9) |
|
|
(48.9) |
|
|
— |
|
|
— |
|
|
Dividends |
|
|
(84.8) |
|
|
(84.8) |
|
|
— |
|
|
— |
|
|
Other |
|
|
(12.2) |
|
|
(6.3) |
|
|
— |
|
|
(5.9) |
|
|
Distributions from (to) parent |
|
|
— |
|
|
— |
|
|
8.8 |
|
|
(8.8) |
|
|
Net cash used in continuing financing activities |
|
|
(55.6) |
|
|
(0.1) |
|
|
(54.4) |
|
|
(1.1) |
|
|
Net cash provided by discontinued operations |
|
|
37.0 |
|
|
— |
|
|
37.0 |
|
|
— |
|
|
Effect of exchange rate changes on cash and cash equivalents |
|
|
(1.4) |
|
|
— |
|
|
— |
|
|
(1.4) |
|
|
Net change in cash and cash equivalents |
|
|
26.1 |
|
|
— |
|
|
— |
|
|
26.1 |
|
|
Cash and cash equivalents, beginning of period |
|
|
36.3 |
|
|
— |
|
|
— |
|
|
36.3 |
|
|
Cash and cash equivalents, end of period |
|
$ |
62.4 |
|
$ |
— |
|
$ |
— |
|
$ |
62.4 |
|
F-50
Schedule II
PENSKE AUTOMOTIVE GROUP, INC.
VALUATION AND QUALIFYING ACCOUNTS
(In millions)
|
|
|
Balance at |
|
|
|
|
Deductions, |
|
Balance |
|
|||
|
|
|
Beginning |
|
|
|
|
Recoveries, |
|
at End |
|
|||
|
Description |
|
of Year |
|
Additions |
|
& Other |
|
of Year |
|
||||
|
Year Ended December 31, 2017 |
|
|
|
|
|
|
|
|
|
|
|
|
|
|
Allowance for doubtful accounts |
|
$ |
4.5 |
|
$ |
2.5 |
|
$ |
(1.5) |
|
$ |
5.5 |
|
|
Tax valuation allowance |
|
|
17.2 |
|
|
21.5 |
|
|
(2.1) |
|
|
36.6 |
|
|
Year Ended December 31, 2016 |
|
|
|
|
|
|
|
|
|
|
|
|
|
|
Allowance for doubtful accounts |
|
$ |
4.2 |
|
$ |
2.8 |
|
$ |
(2.5) |
|
$ |
4.5 |
|
|
Tax valuation allowance |
|
|
17.3 |
|
|
2.1 |
|
|
(2.2) |
|
|
17.2 |
|
|
Year Ended December 31, 2015 |
|
|
|
|
|
|
|
|
|
|
|
|
|
|
Allowance for doubtful accounts |
|
$ |
3.5 |
|
$ |
1.7 |
|
$ |
(1.0) |
|
$ |
4.2 |
|
|
Tax valuation allowance |
|
|
18.2 |
|
|
0.3 |
|
|
(1.2) |
|
|
17.3 |
|
F-51