Attached files
| file | filename |
|---|---|
| EX-32.1 - EX-32.1 - H&E Equipment Services, Inc. | hees-ex321_9.htm |
| EX-31.2 - EX-31.2 - H&E Equipment Services, Inc. | hees-ex312_10.htm |
| EX-31.1 - EX-31.1 - H&E Equipment Services, Inc. | hees-ex311_6.htm |
| EX-23.1 - EX-23.1 - H&E Equipment Services, Inc. | hees-ex231_7.htm |
| EX-21.1 - EX-21.1 - H&E Equipment Services, Inc. | hees-ex211_11.htm |
UNITED STATES
SECURITIES AND EXCHANGE COMMISSION
Washington, D. C. 20549
FORM 10-K
(Mark One)
|
☒ |
ANNUAL REPORT PURSUANT TO SECTION 13 OR 15(d) OF THE SECURITIES EXCHANGE ACT OF 1934 |
For the fiscal year ended December 31, 2017
or
|
☐ |
TRANSITION REPORT PURSUANT TO SECTION 13 OR 15(d) OF THE SECURITIES EXCHANGE ACT OF 1934 |
For the transition period from to
Commission file number 000-51759
H&E EQUIPMENT SERVICES, INC.
(Exact Name of Registrant as Specified in Its Charter)
|
Delaware |
|
81-0553291 |
|
(State or Other Jurisdiction of |
|
(IRS Employer |
|
|
|
|
|
7500 Pecue Lane, Baton Rouge, Louisiana 70809 |
|
(225) 298-5200 |
|
(Address of Principal Executive Offices, including Zip Code) |
|
(Registrant’s Telephone Number, Including Area Code) |
Securities registered pursuant to Section 12(b) of the Act:
|
Title of Each Class |
|
Name of Each Exchange on Which Registered |
|
Common Stock, par value $0.01 per share |
|
Nasdaq Global Market |
Securities registered pursuant to Section 12(g) of the Act: None
Indicate by check mark if the registrant is a well-known seasoned issuer, as defined in Rule 405 of the Securities Act. Yes ☒ No ☐
Indicate by check mark if the registrant is not required to file reports pursuant to Section 13 or Section 15(d) of the Act. Yes ☐ No ☒
Indicate by check mark whether the registrant (1) has filed all reports required to be filed by Sections 13 or 15(d) of the Securities Exchange Act of 1934 during the preceding 12 months (or for such shorter period that the registrant was required to file such reports), and (2) has been subject to such filing requirements for the past 90 days. Yes ☒ No ☐
Indicate by check mark whether the registrant has submitted electronically and posted on its corporate Web site, if any, every Interactive Data File required to be submitted and posted pursuant to Rule 405 of Regulation S-T (§ 232.405 of this chapter) during the preceding 12 months (or for such shorter period that the registrant was required to submit and post such files). Yes ☒ No ☐
Indicate by check mark if disclosure of delinquent filers pursuant to Item 405 of Regulation S-K (§229.405) is not contained herein, and will not be contained, to the best of the registrant’s knowledge, in definitive proxy or information statements incorporated by reference in Part III of this Form 10-K or any amendment to this Form 10-K. ☒
Indicate by check mark whether the registrant is a large accelerated filer, an accelerated filer, a non-accelerated filer or a smaller reporting company. See the definitions of “large accelerated filer,” “accelerated filer” and “smaller reporting company” in Rule 12b-2 of the Exchange Act (Check one):
|
Large Accelerated Filer |
|
☒ |
|
Accelerated Filer |
|
☐ |
|
|
|
|
|
|||
|
Non-Accelerated Filer |
|
☐ |
|
Smaller Reporting Company |
|
☐ |
Emerging Growth Company ☐
If an emerging growth company, indicate by check mark if the registrant has elected not to use the extended transition period for complying with any new or revised financial accounting standards provided pursuant to Section 13(a) of the Exchange Act. ☐
Indicate by check mark whether the registrant is a shell company (as defined in Rule 12b-2 of the Act). Yes ☐ No ☒
The aggregate market value of the common stock held by non-affiliates of the registrant was approximately $620,309,311 (computed by reference to the closing sale price of the registrant’s common stock on the Nasdaq Global Market on June 30, 2017, the last business day of the registrant’s most recently completed second fiscal quarter).
As of February 15, 2018, there were 35,658,355 shares of common stock, par value $0.01 per share, of the registrant outstanding.
DOCUMENTS INCORPORATED BY REFERENCE
Portions of the document listed below have been incorporated by reference into the indicated parts of this Form 10-K, as specified in the responses to the item numbers involved.
|
|
Part III |
The registrant’s definitive proxy statement, for use in connection with the Annual Meeting of Stockholders, to be filed within 120 days after the registrant’s fiscal year ended December 31, 2017. |
|
|
|
|
|
|
|
Item 1. |
|
|
4 |
|
|
Item 1A. |
|
|
10 |
|
|
Item 1B. |
|
|
20 |
|
|
Item 2. |
|
|
21 |
|
|
Item 3. |
|
|
22 |
|
|
Item 4. |
|
|
22 |
|
|
|
|
|
|
|
|
|
|
|
|
|
|
Item 5. |
|
|
23 |
|
|
Item 6. |
|
|
26 |
|
|
Item 7. |
|
Management’s Discussion and Analysis of Financial Condition and Results of Operations |
|
28 |
|
Item 7A. |
|
|
51 |
|
|
Item 8. |
|
|
52 |
|
|
Item 9. |
|
Changes in and Disagreements with Accountants on Accounting and Financial Disclosure |
|
87 |
|
Item 9A. |
|
|
88 |
|
|
Item 9B. |
|
|
91 |
|
|
|
|
|
|
|
|
|
|
|
|
|
|
Item 10. |
|
|
92 |
|
|
Item 11. |
|
|
92 |
|
|
Item 12. |
|
Security Ownership of Certain Beneficial Owners and Management and Related Stockholder Matters |
|
92 |
|
Item 13. |
|
Certain Relationships and Related Transactions, and Director Independence |
|
92 |
|
Item 14. |
|
|
92 |
|
|
|
|
|
|
|
|
|
|
|
|
|
|
Item 15. |
|
|
93 |
|
|
Item 16. |
|
|
96 |
|
|
|
98 |
|||
|
|
|
|
||
2
This Annual Report on Form 10-K contains forward-looking statements within the meaning of the federal securities laws. Statements that are not historical facts, including statements about our beliefs and expectations, are forward-looking statements. Forward-looking statements include statements preceded by, followed by or that include the words “may”, “could”, “would”, “should”, “believe”, “expect”, “anticipate”, “plan”, “estimate”, “target”, “project”, “intend”, “foresee” and similar expressions. These statements include, among others, statements regarding our expected business outlook, anticipated financial and operating results, our business strategy and means to implement the strategy, our objectives, the amount and timing of capital expenditures, the likelihood of our success in expanding our business, financing plans, budgets, working capital needs and sources of liquidity. By their nature, forward-looking statements involve risks and uncertainties because they relate to events and depend on circumstances that may or may not occur in the future. We believe that these risks and uncertainties include, but are not limited to, those described in the “Risk Factors” section of this Annual Report on Form 10-K. These factors should not be construed as exhaustive and should be read with the other cautionary statements in this Annual Report on Form 10-K.
Forward-looking statements are only predictions and are not guarantees of performance. These statements are based on our management’s beliefs and assumptions, which in turn are based on currently available information. Important assumptions relating to the forward-looking statements include, among others, assumptions regarding demand for our products, the expansion of product offerings geographically or through new marketing applications, the timing and cost of planned capital expenditures, competitive conditions and general economic conditions. These assumptions could prove inaccurate. Forward-looking statements also involve known and unknown risks and uncertainties, which could cause actual results to differ materially from those contained in any forward-looking statement. In addition, even if our actual results are consistent with the forward-looking statements contained in this Annual Report on Form 10-K, those results may not be indicative of results or developments in subsequent periods. Many of these factors are beyond our ability to control or predict. Such factors include, but are not limited to, the following:
|
|
• |
general economic conditions and construction and industrial activity in the markets where we operate in North America; |
|
|
• |
our ability to forecast trends in our business accurately, and the impact of economic downturns and economic uncertainty on the markets we serve; |
|
|
• |
the impact of conditions in the global credit and commodity markets and their effect on construction spending and the economy in general; |
|
|
• |
relationships with equipment suppliers; |
|
|
• |
increased maintenance and repair costs as we age our fleet and decreases in our equipment’s residual value; |
|
|
• |
our indebtedness; |
|
|
• |
risks associated with the expansion of our business and any potential acquisitions we may make, including any related capital expenditures, or our inability to consummate such acquisitions; |
|
|
• |
our possible inability to integrate any businesses we acquire; |
|
|
• |
competitive pressures; |
|
|
• |
security breaches and other disruptions in our information technology systems; |
|
|
• |
adverse weather events or natural disasters; |
|
|
• |
compliance with laws and regulations, including those relating to environmental matters, corporate governance matters and tax matters, as well as any future changes to such laws and regulations; and |
|
|
• |
other factors discussed under Item 1A - Risk Factors or elsewhere in this Annual Report on Form 10-K. |
Except as required by applicable law, including the securities laws of the United States and the rules and regulations of the Securities and Exchange Commission (“SEC”), we are under no obligation to publicly update or revise any forward-looking statements after we file this Annual Report on Form 10-K, whether as a result of any new information, future events or otherwise. Investors, potential investors and other readers are urged to consider the above mentioned factors carefully in evaluating the forward-looking statements and are cautioned not to place undue reliance on such forward-looking statements. Although we believe that the expectations reflected in the forward-looking statements are reasonable, we cannot guarantee future results or performance.
3
Our Company
We are one of the largest integrated equipment services companies in the United States focused on heavy construction and industrial equipment. We rent, sell and provide parts and services support for four core categories of specialized equipment: (1) hi-lift or aerial work platform equipment; (2) cranes; (3) earthmoving equipment; and (4) industrial lift trucks. We engage in five principal business activities in these equipment categories:
|
|
• |
equipment rentals; |
|
|
• |
new equipment sales; |
|
|
• |
used equipment sales; |
|
|
• |
parts sales; and |
|
|
• |
repair and maintenance services. |
By providing rental, sales, parts, repair and maintenance functions under one roof, we offer our customers a one-stop solution for their equipment needs. This full-service approach provides us with (1) multiple points of customer contact; (2) cross-selling opportunities among our rental, new and used equipment sales, parts sales and services operations; (3) an effective method to manage our rental fleet through efficient maintenance and profitable distribution of used equipment; and (4) a mix of business activities that enables us to operate effectively throughout economic cycles. We believe that the operating experience and extensive infrastructure we have developed throughout our history as an integrated equipment services company provide us with a competitive advantage over rental-focused companies and equipment distributors. In addition, our focus on four core categories of heavy construction and industrial equipment enables us to offer specialized knowledge and support to our customers.
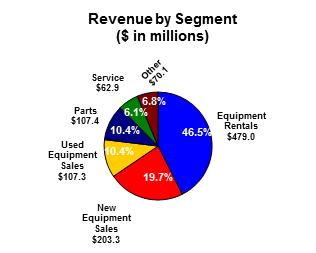
For the year ended December 31, 2017, we generated total revenues of approximately $1.03 billion. The pie charts below illustrate the breakdown of our revenues and gross profit for the year ended December 31, 2017 by business segment (see note 18 to our consolidated financial statements for further information regarding our business segments):

We have operated, through our predecessor companies, as an integrated equipment services company for approximately 57 years and have built an extensive infrastructure that as of February 15, 2018 includes 83 full-service facilities located throughout the West Coast, Intermountain, Southwest, Gulf Coast, Southeast and Mid-Atlantic regions of the United States. Our management, from the corporate level down to the branch store level, has extensive industry experience. We focus our rental and sales activities on, and organize our personnel principally by, our four core equipment categories. We believe this allows us to provide specialized equipment knowledge, improve the effectiveness of our rental and sales forces and strengthen our customer relationships. In addition, we operate our day-to-day business on a branch basis, which we believe allows us to more closely service our customers, fosters management accountability at local levels and strengthens our local and regional relationships.
4
Equipment Rentals. We rent our heavy construction and industrial equipment to our customers on a daily, weekly and monthly basis. We have a well-maintained rental fleet that, at December 31, 2017, consisted of approximately 31,387 pieces of equipment having an original acquisition cost (which we define as the cost originally paid to manufacturers or the original amount financed under operating leases) of approximately $1.4 billion and an average age of approximately 34.6 months. Our rental business creates cross-selling opportunities for us in sales and service support activities.
New Equipment Sales. We sell new heavy construction and industrial equipment in all four core equipment categories, and are a leading U.S. distributor for nationally recognized suppliers including JLG Industries, Gehl, Genie Industries (Terex), Komatsu, and Doosan/Bobcat. In addition, we are the world’s largest distributor of Grove and Manitowoc crane equipment. Our new equipment sales operation is a source of new customers for our parts sales and service support activities, as well as for used equipment sales.
Used Equipment Sales. We sell used equipment primarily from our rental fleet, as well as inventoried equipment that we acquire through trade-ins from our customers and selective purchases of high-quality used equipment. For the year ended December 31, 2017, approximately 89.7% of our used equipment sales revenues were derived from sales of rental fleet equipment. Used equipment sales, like new equipment sales, generate parts and services business for us.
Parts Sales. We sell new and used parts to customers and also provide parts to our own rental fleet. We maintain an extensive in-house parts inventory in order to provide timely parts and service support to our customers as well as to our own rental fleet. In addition, our parts operations enable us to maintain a high-quality rental fleet and provide additional product support to our end users.
Service Support. We provide maintenance and repair services for our customers’ owned equipment and to our own rental fleet. In addition to repair and maintenance on an as-needed or scheduled basis, we provide ongoing preventative maintenance services and warranty repairs for our customers. We devote significant resources to training our technical service employees and over time, we have built a full-scale services infrastructure that we believe would be difficult for companies without the requisite resources and lead time to effectively replicate.
In addition to our principal business activities mentioned above, we provide ancillary equipment support activities including transportation, hauling, parts shipping and loss damage waivers.
Industry Background
Although there has been some consolidation within the industry in recent years, including the acquisitions of Rental Services Corporation, NES Rentals and Neff Corporation by United Rentals, Inc. (“URI”), the U.S. construction equipment distribution industry remains highly fragmented and consists mainly of a small number of multi-location regional or national operators and a large number of relatively small, independent businesses serving discrete local markets. The industry is driven by a broad range of economic factors including total U.S. non-residential construction trends, construction machinery demand, demand for rental equipment and additional, region-specific factors. Construction equipment is largely distributed to end users through two channels: equipment rental companies and equipment dealers. Examples of equipment rental companies include URI, Sunbelt Rentals, and Hertz Equipment Rental. Examples of equipment dealers include Finning and Toromont. Unlike many of these companies, which principally focus on one channel of distribution, we operate substantially in both channels. As an integrated equipment services company, we rent, sell and provide parts and services support. Although many of the historically pure equipment rental companies also provide parts and service support to customers, their service offerings are typically limited and may prove difficult to expand due to the infrastructure, training and resources necessary to develop the breadth of offerings and depth of specialized equipment knowledge that our services and sales staff provides.
Our Competitive Strengths
Integrated Platform of Products and Services. We believe that our operating experience and the extensive infrastructure we have developed through years of operating as an integrated equipment services company provides us with a competitive advantage over rental-focused companies and equipment distributors. Key strengths of our integrated equipment services platform include:
|
|
• |
ability to strengthen customer relationships by providing a full-range of products and services; |
|
|
• |
purchasing power gained through purchases for our new equipment sales and rental operations; |
|
|
• |
high quality rental fleet supported by our strong product support capabilities; |
|
|
• |
established retail sales network resulting in profitable disposal of our used equipment; and |
|
|
• |
mix of business activities that enables us to effectively operate through economic cycles. |
5
Complementary, High Margin Parts and Services Operations. Our parts and services businesses allow us to maintain our rental fleet in excellent condition and to offer our customers high-quality rental equipment. Our after-market parts and services businesses together provide us with a high-margin revenue source that has proven to be relatively stable throughout a range of economic cycles.
High-Quality, Multipurpose Fleet. Our focus on four core types of heavy construction and industrial equipment allows us to better provide the specialized knowledge and support that our customers demand when renting and purchasing equipment. These four types of equipment are attractive because they have a long useful life, high residual value and generally strong industry demand.
Well-Developed Infrastructure. We have built an infrastructure that as of February 15, 2018 included a network of 83 full-service facilities in 22 states, and a workforce that included a highly-skilled group of approximately 494 service technicians and an aggregate of 271 sales people in our specialized rental and equipment sales forces. We believe that our well-developed infrastructure helps us to better serve large multi-regional customers than our historically rental-focused competitors and provides an advantage when competing for lucrative fleet and project management business as well as the ability to quickly capitalize on new opportunities.
Leading Distributor for Suppliers. We are a leading U.S. distributor for nationally-recognized equipment suppliers, including JLG Industries, Gehl, Genie Industries (Terex), Komatsu and Doosan/Bobcat. In addition, we are the world’s largest distributor of Grove and Manitowoc crane equipment. These relationships improve our ability to negotiate equipment acquisition pricing and allow us to purchase parts at wholesale costs.
Customized Information Technology Systems. Our information systems allow us to actively manage our business and our rental fleet. We have a customer relationship management system that provides our sales force with real-time access to customer and sales information. In addition, our enterprise resource planning system enhances our ability to provide more timely and meaningful information to manage our business.
Strong Customer Relationships. We have a diverse base of approximately 39,600 customers who we believe value our high level of service, knowledge and expertise. Our customer base includes a wide range of industrial and commercial companies, construction contractors, manufacturers, public utilities, municipalities, maintenance contractors and numerous and diverse other large industrial accounts. Our branches enable us to closely service local and regional customers, while our well-developed full-service infrastructure enables us to effectively service multi-regional and national accounts. We believe that our expansive presence and commitment to superior service at all levels of the organization is a key differentiator to many of our competitors. As a result, we spend a significant amount of time and resources to train all key personnel to be responsive and deliver high quality customer service and well-maintained equipment so that we can maintain and grow our customer relationships.
Experienced Management Team. Our senior management team is led by John M. Engquist, our Chief Executive Officer, who has approximately 43 years of industry experience. Our senior and regional managers have an average of approximately 25 years of industry experience. Our branch managers have extensive knowledge and industry experience as well.
Our Business Strategy
Our business strategy includes, among other things, leveraging our integrated business model, managing the life cycle of our rental equipment, further developing our parts and services operations and selectively entering new markets and pursuing acquisitions. However, the timing and extent to which we implement these various aspects of our strategy depend on a variety of factors, many of which are outside our control, such as general economic conditions and construction activity in the U.S.
Leverage Our Integrated Business Model. We intend to continue to actively leverage our integrated business model to offer a one-stop solution to our customers’ varied needs with respect to the four categories of heavy construction and industrial equipment on which we focus. We will continue to cross-sell our services to expand and deepen our customer relationships. We believe that our integrated equipment services model provides us with a strong platform for growth and enables us to effectively operate through economic cycles.
Managing the Life Cycle of Our Rental Equipment. We actively manage the size, quality, age and composition of our rental fleet, employing a “cradle through grave” approach. During the life of our rental equipment, we (1) aggressively negotiate on purchase price; (2) use our customized information technology systems to closely monitor and analyze, among other things, time utilization (equipment usage based on customer demand), rental rate trends and pricing optimization and equipment demand; (3) continuously adjust our fleet mix and pricing; (4) maintain fleet quality through regional quality control managers and our on-site parts and services support; and (5) dispose of rental equipment through our retail sales force. This allows us to purchase our rental equipment at competitive prices, optimally utilize our fleet, cost-effectively maintain our equipment quality and maximize the value of our equipment at the end of its useful life.
6
Make Selective Acquisitions. We intend to continue to evaluate and pursue, on an opportunistic basis, acquisitions which meet our selection criteria, including favorable financing terms, with the objective of increasing our revenues, improving our profitability, entering additional attractive markets and strengthening our competitive position. We are focused on identifying and acquiring rental companies to complement our existing business, broaden our geographic footprint, and increase our density in existing markets. Recently, on January 4, 2018, we announced the completion of our acquisition of Contractors Equipment Center (“CEC”), an equipment rental company serving the greater Denver, Colorado area with three branch locations, for approximately $124.0 million in cash. On January 29, 2018, we announced the entry into a definitive agreement to acquire Rental Inc., an equipment rental company with five branch locations in Alabama and Florida, for approximately $68.6 million in cash. This transaction is subject to customary closing conditions and is expected to close during the first quarter of 2018.
As of February 22, 2018, a preliminary allocation of the fair value of the existing purchase price of CEC had yet to be completed. Accordingly, disclosure of the allocation of the purchase price to the CEC balance sheet line items and the pro forma presentation reflecting the impact of the acquisition will be disclosed in subsequent SEC filings.
Grow Our Parts and Services Operations. Our strong parts and services operations are keystones of our integrated equipment services platform and together provide us with a relatively stable high-margin revenue source. Our parts and services operations help us develop strong, ongoing customer relationships, attract new customers and maintain a high quality rental fleet. We intend to further grow this product support side of our business and further penetrate our customer base.
Enter Carefully Selected New Markets. We intend to continue our strategy of selectively expanding our network to solidify our presence in attractive and contiguous regions where we operate. We look to add new locations in those markets that offer attractive growth opportunities, high or increasing levels of demand for construction and heavy equipment, and contiguity to our existing markets. Sixteen of our current 83 locations have opened or were acquired since January 1, 2015.
History
Through our predecessor companies, we have been in the equipment services business for approximately 57 years. H&E Equipment Services L.L.C. was formed in June 2002 through the combination of Head & Engquist Equipment, LLC (“Head & Engquist”), a wholly-owned subsidiary of Gulf Wide Industries, L.L.C. (“Gulf Wide”), and ICM Equipment Company L.L.C. (“ICM”). Head & Engquist, founded in 1961, and ICM, founded in 1971, were two leading regional, integrated equipment service companies operating in contiguous geographic markets. In the June 2002 transaction, Head & Engquist and ICM were merged with and into Gulf Wide, which was renamed H&E Equipment Services L.L.C. (“H&E LLC”). Prior to the combination, Head & Engquist operated 25 facilities in the Gulf Coast region, and ICM operated 16 facilities in the Intermountain region of the United States.
Prior to our initial public offering in February 2006, our business was conducted through H&E LLC. In connection with our initial public offering, we converted H&E LLC into H&E Equipment Services, Inc. In order to have an operating Delaware corporation as the issuer for our initial public offering, H&E Equipment Services, Inc. was formed as a Delaware corporation and wholly-owned subsidiary of H&E Holdings, and immediately prior to the closing of our initial public offering, on February 3, 2006, H&E LLC and H&E Holdings merged with and into us (H&E Equipment Services, Inc.), with us surviving the reincorporation merger as the operating company. Effective February 3, 2006, H&E LLC and H&E Holdings no longer existed under operation of law pursuant to the reincorporation merger.
We completed, effective as of February 28, 2006, the acquisition of all the outstanding capital stock of Eagle High Reach Equipment, Inc. (now known as H&E California Holding, Inc.) and all of the outstanding equity interests of its subsidiary, Eagle High Reach Equipment, LLC (now known as H&E Equipment Services (California), LLC) (collectively, “Eagle” or the “Eagle Acquisition”). Prior to the acquisition, Eagle was a privately-held construction and industrial equipment rental company serving the southern California construction and industrial markets out of four branch locations.
We completed, effective as of September 1, 2007, the acquisition of all of the outstanding capital stock of J.W. Burress, Incorporated (now known as H&E Equipment Services (Mid-Atlantic), Inc.) (“Burress” or the “Burress Acquisition”). Prior to the acquisition, Burress was a privately-held company operating primarily as a distributor in the construction and industrial equipment markets out of 12 locations in four states in the Mid-Atlantic region of the United States.
On January 1, 2018, we completed the acquisition of Contractors Equipment Center (“CEC”). Prior to the acquisition, CEC was a privately-held company focused on non-residential construction equipment rentals serving the greater Denver, Colorado area out of three branch locations.
7
We serve approximately 39,600 customers in the United States, primarily in the West Coast, Intermountain, Southwest, Gulf Coast, Southeast and Mid-Atlantic regions. Our customers include a wide range of industrial and commercial companies, construction contractors, manufacturers, public utilities, municipalities, maintenance contractors and numerous and diverse other large industrial accounts. They vary from small, single machine owners to large contractors and industrial and commercial companies who typically operate under equipment and maintenance budgets. Our branches enable us to closely service local and regional customers, while our well-developed full-service infrastructure enables us to effectively service multi-regional and national accounts. Our integrated strategy enables us to satisfy customer requirements and increase revenues from customers through cross-selling opportunities presented by the various products and services that we offer. As a result, our five reporting segments generally derive their revenue from the same customer base. In 2017, no single customer accounted for more than 1.0% of our total revenues, and no single customer accounted for more than 10% of our revenue on a segmented basis. Our top ten customers combined accounted for approximately 6.9% of our total revenues in 2017.
Sales and Marketing
We have two distinct, focused sales forces; one specializing in equipment rentals and one focused specifically on new and used equipment sales. We believe maintaining separate sales forces for equipment rental and equipment sales is important to our customer service, allowing us to effectively meet the demands of different types of customers.
Both our rental sales force and equipment sales force are divided into smaller, product focused teams which enhances the development of in-depth product application and technical expertise. To further develop knowledge and experience, we provide our sales forces with extensive training, including frequent factory and in-house training by manufacturer representatives regarding the operational features, operator safety training and maintenance of new equipment. This training is essential, as our sales personnel regularly call on customers’ job sites, often assisting customers in assessing their immediate and ongoing equipment needs. In addition, we have a commission-based compensation program for our sales forces.
We maintain a company-wide customer relationship management system. We believe that this comprehensive customer and sales management tool enhances our territory management program by increasing the productivity and efficiency of our sales representatives and branch managers as they are provided real-time access to sales and customer information.
We have developed strategies to identify target customers for our equipment services in all markets. These strategies allow our sales force to identify frequent rental users, function as advisors and problem solvers for our customers and accelerate the sales process in new operations.
While our specialized, well-trained sales force strengthens our customer relationships and fosters customer loyalty, we also promote our business through marketing and advertising, including industry publications, direct mail campaigns, television, the Yellow Pages and our Company website at www.he-equipment.com.
Suppliers
We purchase a significant amount of equipment from the same manufacturers with whom we have distribution agreements. We purchased approximately 42% of our new equipment and rental fleet from three manufacturers (Grove/Manitowoc, Komatsu, and Genie Industries (Terex)) during the year ended December 31, 2017. These relationships improve our ability to negotiate equipment acquisition pricing. We are also a leading U.S. distributor for nationally-recognized equipment suppliers including JLG Industries, Gehl, Genie Industries (Terex), Komatsu, Doosan/Bobcat and Grove/Manitowoc. As an authorized distributor for a wide range of suppliers, we are also able to provide our customers parts and services that in many cases are covered under the manufacturer’s warranty. While we believe that we have alternative sources of supply for the equipment we purchase in each of our principal product categories, termination of one or more of our relationships with any of our major suppliers of equipment could have a material adverse effect on our business, financial condition or results of operations if we were unable to obtain adequate or timely rental and sales equipment.
Information Technology Systems
We have specialized information systems that track (1) rental inventory utilization statistics; (2) maintenance and repair costs; (3) returns on investment for specific equipment types; and (4) detailed operational and financial information for each piece of equipment. These systems enable us to closely monitor our performance and actively manage our business, and include features that were custom designed to support our integrated services platform. The point-of-sale aspect of our systems enables us to link all of our facilities, permitting universal access to real-time data concerning equipment located at the individual facility locations and the rental status and maintenance history for each piece of equipment. In addition, our systems include, among other features, on-line contract
8
generation, automated billing, applicable sales tax computation and automated rental purchase option calculation. We customized our customer relationship management system to enable us to more effectively manage our sales territories and sales representatives’ activity. This customer relationship management system provides sales and customer information, available rental fleet and inventory information, a quote system and other organizational tools to assist our sales forces. We maintain an extensive customer database which allows us to monitor the status and maintenance history of our customers’ owned-equipment and enables us to more effectively provide parts and services to meet their needs. All of our critical systems run on servers and other equipment that is current technology and available from major suppliers and serviceable through existing maintenance agreements.
Seasonality
Although our business is not significantly impacted by seasonality, the demand for our rental equipment tends to be lower in the winter months. The level of equipment rental activities is directly related to commercial and industrial construction and maintenance activities. Therefore, equipment rental performance will be correlated to the levels of current construction activities. The severity of weather conditions can have a temporary impact on the level of construction activities.
Equipment sales cycles are also subject to some seasonality with the peak selling period occurring during the spring season and extending through the summer. Parts and services activities are less affected by changes in demand caused by seasonality.
Competition
The equipment industry is generally comprised of either pure rental equipment companies or manufacturer dealer/distributorship companies. We are an integrated equipment services company and rent, sell and provide parts and services support. Although there has been some consolidation within the equipment industry in recent years, including the recent acquisitions of Rental Services Corporation, NES Rentals and Neff Corporation by United Rentals, Inc., the equipment industry remains highly fragmented and consists mainly of a small number of multi-location regional or national operators and a large number of relatively small, independent businesses serving discrete local markets. Many of the markets in which we operate are served by numerous competitors, ranging from national and multi-regional equipment rental companies (for example, United Rentals, Sunbelt Rentals and Hertz Equipment Rental) or equipment dealers (for example, Finning and Toromont) to small, independent businesses with a limited number of locations.
We believe that participants in the equipment rental industry generally compete on the basis of availability, quality, reliability, delivery and price. In general, large operators enjoy substantial competitive advantages over small, independent rental businesses due to a distinct price advantage. Many rental equipment companies’ parts and services offerings are limited and may prove difficult to expand due to the training, infrastructure and management resources necessary to develop the breadth of service offerings and depth of knowledge our service technicians are able to provide. Some of our competitors have significantly greater financial, marketing and other resources than we do.
Traditionally, equipment manufacturers distributed their equipment and parts through a network of independent dealers with distribution agreements. As a result of consolidation and competition, both manufacturers and distributors sought to streamline their operations, improve their costs and gain market share. Our established, integrated infrastructure enables us to compete directly with our competitors on either a local, regional or national basis. We believe customers place greater emphasis on value-added services, teaming with equipment rental and sales companies who can meet all of their equipment, parts and services needs.
Environmental and Safety Regulations
Our facilities and operations are subject to comprehensive and frequently changing federal, state and local environmental and occupational health and safety laws. These laws regulate (1) the handling, storage, use and disposal of hazardous materials and wastes and, if any, the associated cleanup of properties affected by pollutants; (2) air quality (emissions); and (3) wastewater. We do not currently anticipate any material adverse effect on our business or financial condition or competitive position as a result of our efforts to comply with such requirements. Although we have made and will continue to make capital and other expenditures to comply with environmental requirements, we do not expect to incur material capital expenditures for environmental controls or compliance.
In the future, federal, state or local governments could enact new or more stringent laws or issue new or more stringent regulations concerning environmental and worker health and safety matters, or effect a change in their enforcement of existing laws or regulations, that could affect our operations. Also, in the future, contamination may be found to exist at our facilities or off-site locations where we have sent wastes. There can be no assurance that we, or various environmental regulatory agencies, will not discover previously unknown environmental non-compliance or contamination. We could be held liable for such newly-discovered non-compliance or contamination. It is possible that changes in environmental and worker health and safety laws or liabilities from newly-discovered non-compliance or contamination could have a material adverse effect on our business, financial condition and results of operations.
9
As of December 31, 2017, we had approximately 2,093 employees. Of these employees, 851 are salaried personnel and 1,242 are hourly personnel. Our employees perform the following functions: sales operations, parts operations, rental operations, technical services and office and administrative support. A collective bargaining agreement relating to two branch locations covers approximately 66 of our employees. We believe our relations with our employees are good, and we have never experienced a work stoppage.
Generally, the total number of employees does not significantly fluctuate throughout the year. However, acquisition activity or the opening of new branches may increase the number of our employees or fluctuations in the level of our business activity could require some staffing level adjustments in response to actual or anticipated customer demand.
Available Information
We file electronically with the SEC annual reports on Form 10-K, quarterly reports on Form 10-Q, current reports on Form 8-K and amendments to those reports filed or furnished pursuant to Section 13 or 15(d) of the Securities Exchange Act of 1934. The public may read and copy any materials we have filed with or furnished to the SEC at the SEC’s Public Reference Room at 100 F Street, N.E., Washington, D.C. 20549. The public may obtain information on the operation of the Public Reference Room by calling the SEC at 1-800-SEC-0330. The SEC maintains an Internet site (www.sec.gov) that contains reports, proxy and information statements, and other information regarding issuers that file electronically with the SEC. Copies of our annual report on Form 10-K, quarterly reports on Form 10-Q, current reports on Form 8-K, ownership reports for insiders and any amendments to these reports filed with or furnished to the SEC are available free of charge through our internet website (www.he-equipment.com) as soon as reasonably practicable after filing with the SEC. We use the Investor Relations section of our website as a means of disclosing material non-public information and for complying with our disclosure obligations under Regulation FD. Accordingly, investors should monitor the Investor Relations section of our website, in addition to following press releases, SEC filings and public conference calls and webcasts.
Additionally, we make available free of charge on our internet website:
|
|
• |
our Code of Conduct and Ethics; |
|
|
• |
the charter of our Corporate Governance and Nominating Committee; |
|
|
• |
the charter of our Compensation Committee; and |
|
|
• |
the charter of our Audit Committee. |
Investing in our securities involves a high degree of risk. You should consider carefully the following risk factors and the other information in this Annual Report on Form 10-K, including our consolidated financial statements and related notes, before making any investment decisions regarding our securities. If any of the following risks actually occur, our business, financial condition and operating results could be adversely affected. As a result, the trading price of our securities could decline and you may lose part or all of your investment.
Our business could be adversely affected by declines in construction and industrial activities, or a downturn in the economy in general, which could lead to decreased demand for equipment, depressed equipment rental rates and lower sales prices, resulting in a decline in our revenues, gross margins and operating results.
Our equipment is principally used in connection with construction and industrial activities. Consequently, a downturn in construction or industrial activities, or the economy in general, may lead to a decrease in the demand for equipment or depress rental rates and the sales prices for our equipment. Our business may also be negatively impacted, either temporarily or long-term, by:
|
|
• |
a reduction in spending levels by customers; |
|
|
• |
unfavorable credit markets affecting end-user access to capital; |
|
|
• |
adverse changes in federal, state and local government infrastructure spending; |
|
|
• |
an increase in the cost of construction materials; |
|
|
• |
adverse weather conditions or natural disasters which may affect a particular region; |
10
|
|
• |
terrorism or hostilities involving the United States. |
Weakness or deterioration in the non-residential construction and industrial sectors caused by these or other factors could have a material adverse effect on our financial position, results of operations and cash flows in the future and may also have a material adverse effect on residual values realized on the disposition of our rental fleet. For example, during fiscal years 2009 and 2010, the economic downturn and related economic uncertainty, combined with weakness in the construction industry and a decrease in industrial activity, resulted in a significant decrease in the demand for our new and used equipment and depressed equipment rental rates, which resulted in decreased revenues and lower gross margins realized on our equipment rentals and on the sale of our new and used inventory during those periods. More recently, the decline in oil prices and the related downturn in oil industry activities during fiscal years 2014, 2015 and 2016 have resulted in a significant decrease in our new equipment sales, primarily the sale of new cranes, due to lower demand. Although oil prices have subsequently stabilized and improved slightly, we believe the uncertainty regarding future oil prices continues to impact customer capital expenditure decisions.
The inability to forecast trends accurately may have an adverse impact on our business and financial condition.
An economic downturn or economic uncertainty makes it difficult for us to forecast trends, which may have an adverse impact on our business and financial condition. For example, the economic downturn of 2009 and 2010 — which included, among other things, significant reductions in available capital and liquidity from banks and other providers of credit, substantial reductions and/or fluctuations in equity and currency values worldwide and concerns that the worldwide economy may enter into a prolonged recessionary period — limited our ability, as well as the ability of our customers and our suppliers, to accurately forecast future product demand trends. More recently, declines in oil and natural gas prices, and uncertainty regarding future price levels, have negatively impacted the exploration, production and construction activity of our customers in those markets. Uncertainty regarding future equipment product demand could cause us to maintain excess equipment inventory and increase our equipment inventory carrying costs. Alternatively, this forecasting difficulty could cause a shortage of equipment for sale or rental that could result in an inability to satisfy demand for our products and a loss of market shares.
Unfavorable conditions or disruptions in the capital and credit markets may adversely impact business conditions and the availability of credit.
Disruptions in the global capital and credit markets as a result of an economic downturn, economic uncertainty, changing or increased regulation, reduced alternatives or failures of significant financial institutions could adversely affect our customers’ ability to access capital and could adversely affect our access to liquidity needed for business in the future. Additionally, unfavorable market conditions may depress demand for our products and services or make it difficult for our customers to obtain financing and credit on reasonable terms. Unfavorable market conditions also may cause more of our customers to be unable to meet their payment obligations to us, increasing delinquencies and credit losses. If we are unable to manage credit risk adequately, or if a large number of customers should have financial difficulties at the same time, our credit losses could increase above historical levels and our operating results would be adversely affected. Delinquencies and credit losses generally can be expected to increase during economic slowdowns or recessions. Moreover, our suppliers may be adversely impacted by unfavorable capital and credit markets, causing disruption or delay of product availability. These events could negatively impact our business, financial position, results of operations and cash flows.
Our substantial indebtedness could adversely affect our financial condition.
We have a significant amount of indebtedness outstanding. As of December 31, 2017, we had total outstanding indebtedness of approximately $951.5 million, consisting of the $950.0 million aggregate amounts outstanding under our senior unsecured notes and $1.5 million of capital lease obligations. As of February 15, 2018, we had borrowing availability under our senior credit facility (the “Credit Facility”) of $742.3 million, net of a $7.7 million outstanding letter of credit.
Our substantial indebtedness could have important consequences. For example, it could:
|
|
• |
increase our vulnerability to general adverse economic and industry conditions; |
|
|
• |
require us to dedicate a substantial portion of our cash flow from operations to payments on our indebtedness, thereby reducing the availability of our cash flow to fund working capital, capital expenditures and other general corporate purposes; |
|
|
• |
limit our flexibility in planning for, or reacting to, changes in our business and the industry in which we operate; |
|
|
• |
place us at a competitive disadvantage compared to our competitors that have less debt; and |
11
|
|
• |
limit our ability to obtain additional financing for working capital, capital expenditures, acquisitions or general corporate purposes. |
We expect to use cash flow from operations and borrowings under our Credit Facility to meet our current and future financial obligations, including funding our operations, debt service and capital expenditures. Our ability to make these payments depends on our future performance, which will be affected by financial, business, economic and other factors, many of which we cannot control. Our business may not generate sufficient cash flow from operations in the future, which could result in our being unable to repay indebtedness, or to fund other liquidity needs. If we do not have enough capital, we may be forced to reduce or delay our business activities and capital expenditures, sell assets, obtain additional debt or equity capital or restructure or refinance all or a portion of our debt, including the senior unsecured notes and our Credit Facility, on or before maturity. We cannot make any assurances that we will be able to accomplish any of these alternatives on terms acceptable to us, or at all. In addition, the terms of existing or future indebtedness, including the agreements governing the senior unsecured notes and the Credit Facility may limit our ability to pursue any of these alternatives.
We may not be able to generate sufficient cash to service all of our indebtedness and may be forced to take other actions to satisfy our obligations under our indebtedness, which may not be successful.
Our ability to make scheduled payments or to refinance our debt obligations depends on our financial and operating performance, which is subject to prevailing economic and competitive conditions and to certain financial, business and other factors beyond our control. We cannot make assurances that we will maintain a level of cash flows from operating activities sufficient to permit us to pay the principal, premium, if any, and interest on our indebtedness. In the absence of such operating results and resources, we could face substantial liquidity problems and might be required to dispose of material assets or operations to meet our debt service and other obligations. The Credit Facility and the indenture governing the senior unsecured notes restrict our ability to dispose of assets and use the proceeds from the disposition. We may not be able to consummate those dispositions or to obtain the proceeds which we could realize from such dispositions. Any proceeds we do receive from a disposition may not be adequate to meet any debt service obligations then due.
If our cash flows and capital resources are insufficient to fund our debt service obligations, we may be forced to reduce or delay capital expenditures, sells assets or operations, seek additional capital or restructure or refinance our indebtedness. We cannot assure you that we would be able to take any of these actions, that these actions would be successful and permit us to meet our scheduled debt service obligations or that these actions would be permitted under the terms of our existing or future debt agreements, including the Credit Facility or the indenture governing the senior unsecured notes.
If we cannot make scheduled payments on our debt, we will be in default and, as a result:
|
|
• |
our debt holders could declare all outstanding principal and interest to be due and payable; |
|
|
• |
the lenders under our credit facilities, including the Credit Facility, could terminate their commitments to lend us money and foreclose against the assets securing our borrowings; and |
|
|
• |
we could be forced into bankruptcy or liquidation. |
Despite current indebtedness levels, we may still be able to incur more indebtedness, which could further exacerbate the risks described above.
Under the terms of the agreements governing the Credit Facility and the senior unsecured notes, we and our subsidiaries may be able to incur substantial indebtedness in the future.
Additionally, our Credit Facility provides revolving commitments of up to $750.0 million in the aggregate. As of February 15, 2018, we had $742.3 million of availability under the Credit Facility, net of a $7.7 million outstanding letter of credit. If new debt is added to our current debt levels, the risks that we now face relating to our substantial indebtedness could intensify.
The agreements governing the Credit Facility and our senior unsecured notes restrict our business and our ability to engage in certain corporate and financial transactions.
The agreements governing the Credit Facility and the senior unsecured notes contain certain covenants that, among other things, restrict or limit our and our restricted subsidiaries’ ability to:
|
|
• |
incur more debt; |
|
|
• |
pay dividends and make distributions; |
12
|
|
• |
make investments; |
|
|
• |
repurchase stock; |
|
|
• |
create liens; |
|
|
• |
enter into transactions with affiliates; |
|
|
• |
enter into sale and lease-back transactions; |
|
|
• |
merge or consolidate; and |
|
|
• |
transfer and sell assets. |
Our ability to borrow under the Credit Facility depends upon compliance with the restrictions contained in the Credit Facility. Events beyond our control could affect our ability to meet these covenants. In addition, the Credit Facility requires us to meet certain financial conditions tests and availability thereunder is subject to borrowing base availability.
Events beyond our control can affect our ability to meet these financial conditions tests and to comply with other provisions governing the Credit Facility and the senior unsecured notes. Our failure to comply with obligations under the agreements governing the Credit Facility and the senior unsecured notes may result in an event of default under the agreements governing the Credit Facility and the senior unsecured notes, respectively. A default, if not cured or waived, may permit acceleration of this indebtedness and our other indebtedness. We may not be able to remedy these defaults. If our indebtedness is accelerated, we may not have sufficient funds available to pay the accelerated indebtedness and may not have the ability to refinance the accelerated indebtedness on terms favorable to us or at all.
Variable rate indebtedness subjects us to interest rate risk, which could cause our debt service obligations to increase significantly.
Borrowings under the Credit Facility are at variable rates of interest and expose us to interest rate risk. As such, our results of operations are sensitive to movements in interest rates. There are many economic factors outside our control that have in the past and may, in the future, impact rates of interest including publicly announced indices that underlie the interest obligations related to a certain portion of our debt. Factors that impact interest rates include governmental monetary policies, inflation, recession, changes in unemployment, the money supply, international disorder and instability in domestic and foreign financial markets. If interest rates increase, our debt service obligations on the variable rate indebtedness would increase even though the amount borrowed remained the same, and our results of operations would be adversely impacted. Such increases in interest rates could have a material adverse effect on our financial conditions and results of operations.
Our business could be hurt if we are unable to obtain additional capital as required, resulting in a decrease in our revenues and profitability. In addition, our inability to refinance our indebtedness on favorable terms, or at all, could materially and adversely affect our liquidity and our ongoing results of operations.
The cash that we generate from our business, together with cash that we may borrow under our Credit Facility, if available, may not be sufficient to fund our capital requirements. We may require additional financing to obtain capital for, among other purposes, purchasing equipment, completing acquisitions, establishing new locations and refinancing existing indebtedness. Any additional indebtedness that we incur will make us more vulnerable to economic downturns and limit our ability to withstand competitive pressures. Moreover, we may not be able to obtain additional capital on acceptable terms, if at all. If we are unable to obtain sufficient additional financing in the future, our business could be adversely affected by reducing our ability to increase revenues and profitability.
In addition, our ability to refinance indebtedness will depend in part on our operating and financial performance, which, in turn, is subject to prevailing economic conditions and to financial, business, legislative, regulatory and other factors beyond our control. In addition, prevailing interest rates or other factors at the time of refinancing could increase our interest expense. A refinancing of our indebtedness could also require us to comply with more onerous covenants and further restrict our business operations. Our inability to refinance our indebtedness or to do so upon attractive terms could materially and adversely affect our business, prospects, results of operations, financial condition and cash flows, and make us vulnerable to adverse industry and general economic conditions.
13
Our revenue and operating results may fluctuate, which could result in a decline in our profitability and make it more difficult for us to grow our business.
Our revenue and operating results have historically varied from quarter to quarter. Periods of decline could result in an overall decline in profitability and make it more difficult for us to make payments on our indebtedness and grow our business. We expect our quarterly results to continue to fluctuate in the future due to a number of factors, including:
|
|
• |
general economic conditions in the markets where we operate; |
|
|
• |
the cyclical nature of our customers’ business, particularly our construction customers and customers in the oil and gas industry; |
|
|
• |
seasonal sales and rental patterns of our construction customers, with sales and rental activity tending to be lower in the winter months; |
|
|
• |
changes in the size of our rental fleet and/or in the rate at which we sell our used equipment from the fleet; |
|
|
• |
an overcapacity of fleet in the equipment rental industry; |
|
|
• |
severe weather and seismic conditions temporarily affecting the regions where we operate; |
|
|
• |
changes in corporate spending for plants and facilities or changes in government spending for infrastructure projects; |
|
|
• |
changes in interest rates and related changes in our interest expense and our debt service obligations; |
|
|
• |
the possible need , from time to time, to record goodwill impairment charges or other write-offs or charges due to a variety of occurrences, such as the adoption of new accounting standards, the impairment of assets, rental location divestitures, dislocation in the equity and/or credit markets, consolidations or closings, restructurings, or the refinancing of existing indebtedness; |
|
|
• |
the effectiveness of integrating acquired businesses and new start-up locations; and |
|
|
• |
timing of acquisitions and new location openings and related costs. |
In addition, we incur various costs when integrating newly acquired businesses or opening new start-up locations, and the profitability of a new location is generally expected to be lower in the initial months of operation.
We may not be able to facilitate our growth strategy by identifying or completing transactions with attractive acquisition candidates, which could limit our revenues and profitability. Future acquisitions may result in significant transaction expenses and we may involve significant costs. We may experience integration and consolidation risks associated with future acquisitions.
An element of our growth strategy is to selectively pursue on an opportunistic basis acquisitions of additional businesses, in particular rental companies that complement our existing business and footprint, such as our recent acquisition of Contractors Equipment Center, LLC (“CEC”) in January 2018. The success of this element of our growth strategy depends, in part, on selecting strategic acquisition candidates at attractive prices. We cannot assure you that we will be able to identify attractive acquisition candidates or complete the acquisition of any identified candidates at favorable prices and upon advantageous terms and conditions, including financing alternatives. We expect to face competition for acquisition candidates, which may limit the number of acquisition opportunities and lead to higher acquisition costs. We may not have the financial resources necessary to consummate any acquisitions or the ability to obtain the necessary funds on satisfactory terms. Any future acquisitions may result in significant transaction expenses and risks associated with entering new markets. We may also be subject to claims by third parties related to the operations of these businesses prior to our acquisition and by sellers under the terms of our acquisition agreements.
We may not have sufficient management, financial and other resources to integrate and consolidate any future acquisitions. Any significant diversion of management’s attention or any major difficulties encountered in the integration of the businesses we acquire, including CEC, could have a material adverse effect on our business, financial condition or results of operations, which could decrease our profitability and make it more difficult for us to grow our business. Among other things, these integration risks could include:
|
|
• |
the loss of key employees; |
|
|
• |
the disruption of operations and business; |
|
|
• |
the retention of the existing clients and the retention or transition of customers and vendors; |
|
|
• |
the integration of corporate cultures and maintenance of employee morale; |
|
|
• |
inability to maintain and increase competitive presence; |
14
|
|
• |
possible inconsistencies in standards, control procedures and policies; |
|
|
• |
unexpected problems with costs, operations, personnel, technology and credit; |
|
|
• |
problems with the assimilation of new operations, sites or personnel, which could divert resources from our regular operations; and/or |
|
|
• |
potential unknown liabilities. |
Furthermore, general economic conditions or unfavorable global capital and credit markets could affect the timing and extent to which we successfully acquire or integrate new businesses, which could limit our revenues and profitability.
Fluctuations in the stock market, as well as general economic and market conditions, may impact the market price of our common stock.
The market price of our common stock has been and may continue to be subject to significant fluctuations in response to general economic changes and other factors including, but not limited to:
|
|
• |
variations in our quarterly operating results or results that vary from investor expectations; |
|
|
• |
changes in the strategy and actions taken by our competitors, including pricing changes; |
|
|
• |
securities analysts’ elections to discontinue coverage of our common stock, changes in financial estimates by analysts or a downgrade of our common stock or of our sector by analysts; |
|
|
• |
announcements by us or our competitors of significant contracts, acquisitions, strategic partnerships, joint ventures or capital commitments; |
|
|
• |
changes in the price of oil and other commodities; |
|
|
• |
investor perceptions of us and the equipment rental and distribution industry; and |
|
|
• |
national or regional catastrophes or circumstances and natural disasters, hostilities and acts of terrorism. |
Broad market and industry factors may materially reduce the market price of our common stock, regardless of or in a manner that is disproportionate to any related impact on our operating performance. As an example, in the latter half of 2014 the price of oil fell significantly and the price further declined and remained depressed throughout 2015 and 2016, compared to pre-2014 price levels. We believe that this prolonged decline in oil prices and its impact on oil related economic activities was a significant factor in the price decline of our stock during the same period, even though other industrial and construction activities that are also primary drivers of our business generally remained at or above historic levels. Although oil prices have subsequently stabilized and improved slightly, we believe the uncertainty regarding future oil prices has an impact on the price of our stock. In addition, the stock market historically has experienced price and volume fluctuations that often have been unrelated or disproportionate to the operating performance of companies. These fluctuations, as well as general economic and market conditions, including those listed above and others, may harm the market price of our common stock.
We are subject to competition, which may have a material adverse effect on our business by reducing our ability to increase or maintain revenues or profitability.
The equipment rental and retail distribution industries are highly competitive and the equipment rental industry is highly fragmented. Many of the markets in which we operate are served by numerous competitors, ranging from national and multi-regional equipment rental companies to small, independent businesses with a limited number of locations. We generally compete on the basis of availability, quality, reliability, delivery and price. Some of our competitors have significantly greater financial, marketing and other resources than we do, and may be able to reduce rental rates or sales prices. We may encounter increased competition from existing competitors or new market entrants in the future, which could have a material adverse effect on our business, financial condition and results of operations.
We may not be able to facilitate our growth strategy by identifying and opening attractive start-up locations, which could limit our revenues and profitability.
An element of our growth strategy is to selectively identify and implement start-up locations in order to add new customers. The success of this element of our growth strategy depends, in part, on identifying strategic start-up locations.
15
We also cannot assure you that we will be able to identify attractive start-up locations. Opening start-up locations may involve significant costs and limit our ability to expand our operations. Start-up locations may involve risks associated with entering new markets and we may face significant competition.
We may not have sufficient management, financial and other resources to successfully operate new locations. Any significant diversion of management’s attention or any major difficulties encountered in the locations that we open in the future could have a material adverse effect on our business, financial condition or results of operations, which could decrease our profitability and make it more difficult for us to grow our business. Furthermore, general economic conditions or unfavorable global capital and credit markets could affect the timing and extent to which we open new start-up locations, which could limit our revenues and profitability.
The continued payment of our quarterly dividend is subject to, among other things, the availability of funds and the discretion of our board of directors.
The payment of future dividends and the amount thereof is uncertain, at the sole discretion of our board of directors and considered by the board of directors each quarter. The payment of dividends is dependent upon, among other things, operating cash flow generated by our business, financial requirements for our operations, the execution of our growth strategy, the restrictions and covenants pursuant to our Credit Facility and senior unsecured notes, and the satisfaction of solvency tests imposed by the Delaware General Corporation Law and other applicable law for the declaration and payment of dividends.
We purchase a significant amount of our equipment from a limited number of manufacturers. Termination of one or more of our relationships with any of those manufacturers could have a material adverse effect on our business, as we may be unable to obtain adequate or timely rental and sales equipment.
We purchase most of our rental and sales equipment from leading, nationally-known original equipment manufacturers (“OEMs”). For the year ended December 31, 2017, we purchased approximately 42% of our rental and sales equipment from three manufacturers (Grove/Manitowoc, Komatsu, and Genie Industries (Terex)). Although we believe that we have alternative sources of supply for the rental and sales equipment we purchase in each of our core product categories, termination of one or more of our relationships with any of these major suppliers could have a material adverse effect on our business, financial condition or results of operations if we were unable to obtain adequate or timely rental and sales equipment.
Our suppliers of new equipment may appoint additional distributors, sell directly or unilaterally terminate our distribution agreements, which could have a material adverse effect on our business due to a reduction of, or inability to increase, our revenues.
We are a distributor of new equipment and parts supplied by leading, nationally-known OEMs. Under our distribution agreements with these OEMs, manufacturers retain the right to appoint additional dealers and sell directly to national accounts and government agencies. We have both written and oral distribution agreements with our new equipment suppliers. Under our oral agreements with the OEMs, we operate under our established course of dealing with the supplier and are subject to the applicable state law regarding such relationship. In most instances, the OEMs may appoint additional distributors, elect to sell to customers directly or unilaterally terminate their distribution agreements with us at any time without cause. Any such actions could have a material adverse effect on our business, financial condition and results of operations due to a reduction of, or an inability to increase, our revenues.
The cost of new equipment that we sell or purchase for use in our rental fleet may increase and therefore we may spend more for such equipment. In some cases, we may not be able to procure new equipment on a timely basis due to supplier constraints.
The cost of new equipment from manufacturers that we sell or purchase for use in our rental fleet may increase as a result of increased raw material costs, including increases in the cost of steel, which is a primary material used in most of the equipment we use, or due to increased regulatory requirements, such as those related to emissions. These increases could materially impact our financial condition or results of operations in future periods if we are not able to pass such cost increases through to our customers.
Our rental fleet is subject to residual value risk upon disposition.
The market value of any given piece of rental equipment could be less than its depreciated value at the time it is sold. The market value of used rental equipment depends on several factors, including:
|
|
• |
the market price for new equipment of a like kind; |
|
|
• |
wear and tear on the equipment relative to its age; |
|
|
• |
the time of year that it is sold (prices are generally higher during the construction season); |
|
|
• |
worldwide and domestic demands for used equipment; |
16
|
|
• |
general economic conditions. |
We include in operating income the difference between the sales price and the depreciated value of an item of equipment sold. Although for the year ended December 31, 2017, we sold used equipment from our rental fleet at an average selling price of approximately 149.6% of net book value, we cannot assure you that used equipment selling prices will not decline. Any significant decline in the selling prices for used equipment could have a material adverse effect on our business, financial condition, results of operations or cash flows.
We incur maintenance and repair costs associated with our rental fleet equipment that could have a material adverse effect on our business in the event these costs are greater than anticipated.
As our fleet of rental equipment ages, the cost of maintaining such equipment, if not replaced within a certain period of time, generally increases. Determining the optimal age for our rental fleet equipment is subjective and requires considerable estimates by management. We have made estimates regarding the relationship between the age of our rental fleet equipment, and the maintenance and repair costs, and the market value of used equipment. Our future operating results could be adversely affected because our maintenance and repair costs may be higher than estimated and market values of used equipment may fluctuate.
Security breaches and other disruptions in our information technology systems, including our customer relationship management system, could limit our capacity to effectively monitor and control our operations, compromise our or our customers’ and suppliers’ confidential information or otherwise adversely affect our operating results or business reputation.
Our information technology systems, some of which are managed by third parties, facilitate our ability to monitor and control our operations and adjust to changing market conditions, including processing, transmitting, storing, managing and supporting a variety of business processes, activities and information. Further, as we pursue our strategy to grow through acquisitions and to pursue new initiatives that improve our operations, we are also expanding and improving our information technologies, resulting in a larger technological presence and corresponding exposure to cybersecurity risk. Any disruption in any of these systems, including our customer management system, or the failure of any of these systems to operate as expected could, depending on the magnitude of the problem, adversely affect our operating results by limiting our capacity to effectively monitor and control our operations and adjust to changing market conditions.
Additionally, we collect and store sensitive data, including proprietary business information and the proprietary business information of our customers and suppliers, in data centers and on information technology networks, including cloud-based networks. The secure operation of these information technology networks and the processing and maintenance of this information is critical to our business operations and strategy. Despite security measures and business continuity plans, our information technology networks and infrastructure may be vulnerable to damage, disruptions or shutdowns due to attacks by cyber criminals or breaches due to employee error or malfeasance or other disruptions during the process of upgrading or replacing computer software or hardware, power outages, computer viruses, telecommunication or utility failures, terrorist acts or natural disasters or other catastrophic events. Further, the growing use and rapid evolution of technology, including mobile devices, has heightened the risk of unintentional data breaches or leaks. The occurrence of any of these events could compromise our networks, and the information stored there could be accessed, publicly disclosed, lost or stolen. In addition, as security threats continue to evolve we may need to invest additional resources to protect the security of our systems or to comply with privacy, data security, cybersecurity and data protection laws applicable to our business.
Any failure to effectively prevent, detect and/or recover from any such access, disclosure or other loss of information, or to comply with any such current or future law related thereto, could result in legal claims or proceedings, liability or regulatory penalties under laws protecting the privacy of personal information, disrupt operations, and damage our reputation, which could adversely affect our business.
Fluctuations in fuel costs or reduced supplies of fuel could harm our business.
We could be adversely affected by limitations on fuel supplies or significant increases in fuel prices that result in higher costs to us for transporting equipment from one branch to another branch or one region to another region. A significant or protracted disruption of fuel supplies could have an adverse effect on our financial condition and results of operations.
17
Hurricanes, other adverse weather events, national or regional catastrophes or natural disasters could negatively affect our local economies or disrupt our operations, which could have an adverse effect on our business or results of operations.
Our market areas in the Gulf Coast and Mid-Atlantic regions of the United States are susceptible to hurricanes. Such weather events can disrupt our operations, result in damage to our properties and negatively affect the local economies in which we operate. Future hurricanes could result in damage to certain of our facilities and the equipment located at such facilities, or equipment on rent with customers in those areas. In addition, climate change could lead to an increase in intensity or occurrence of hurricanes or other adverse weather events, including severe winter storms. Future occurrences of these events, as well as regional or national catastrophes or natural disasters, and their effects may adversely impact our business or results of operations.
We are dependent on key personnel. A loss of key personnel could have a material adverse effect on our business, which could result in a decline in our revenues and profitability.
Our senior and regional managers have an average of approximately 25 years of industry experience. Our branch managers have extensive knowledge and industry experience as well. Our success is dependent, in part, on the experience and skills of our management team. Competition for top management talent within our industry is generally significant. If we are unable to fill and keep filled all of our senior management positions, or if we lose the services of any key member of our senior management team and are unable to find a suitable replacement in a timely manner, we may be challenged to effectively manage our business and execute our strategy.
If we fail to maintain an effective system of internal controls, we may not be able to accurately report financial results or prevent fraud.
Effective internal controls are necessary to provide reliable financial reports and to assist in the effective prevention of fraud. Any inability to provide reliable financial reports or prevent fraud could harm our business. We must annually evaluate our internal procedures to satisfy the requirements of Section 404 of the Sarbanes-Oxley Act of 2002, which requires management and auditors to assess the effectiveness of our internal controls. If we fail to remedy or maintain the adequacy of our internal controls, as such standards are modified, supplemented or amended from time to time, we could be subject to regulatory scrutiny, civil or criminal penalties or stockholder litigation.
In addition, failure to maintain effective internal controls could result in financial statements that do not accurately reflect our financial condition or results of operations. There can be no assurance that we will be able to maintain a system of internal controls that fully complies with the requirements of the Sarbanes-Oxley Act of 2002 or that our management and independent registered public accounting firm will continue to conclude that our internal controls are effective.
We are exposed to various risks related to legal proceedings or claims that could adversely affect our operating results. The nature of our business exposes us to various liability claims, which may exceed the level of our insurance coverage resulting in us not being fully protected.
We are a party to lawsuits in the normal course of our business. Litigation in general can be expensive, lengthy and disruptive to normal business operations. Moreover, the results of complex legal proceedings are difficult to predict. Responding to lawsuits brought against us, or legal actions that we may initiate, can often be expensive and time-consuming. Unfavorable outcomes from these claims and/or lawsuits could adversely affect our business, results of operations, or financial condition, and we could incur substantial monetary liability and/or be required to change our business practices.
Our business exposes us to claims for personal injury, death or property damage resulting from the use of the equipment we rent or sell and from injuries caused in motor vehicle accidents in which our delivery and service personnel are involved and other employee related matters. Additionally, we could be subject to potential litigation associated with compliance with various laws and governmental regulations at the federal, state or local levels, such as those relating to the protection of persons with disabilities, employment, health, safety, security and other regulations under which we operate.
We carry comprehensive insurance, subject to deductibles, at levels we believe are sufficient to cover existing and future claims made during the respective policy periods. However, we may be exposed to multiple claims, and, as a result, we could incur significant out-of-pocket costs before reaching the deductible amount which could adversely affect our financial condition and results of operations. In addition, the cost of such insurance policies may increase significantly upon renewal of those policies as a result of general rate increases for the type of insurance we carry as well as our historical experience and experience in our industry. Although we have not experienced any material losses that were not covered by insurance, our existing or future claims may exceed the coverage level of our insurance, and such insurance may not continue to be available on economically reasonable terms, or at all. If we are required to pay significantly higher premiums for insurance, are not able to maintain insurance coverage at affordable rates or if
18
we must pay amounts in excess of claims covered by our insurance, we could experience higher costs that could adversely affect our financial condition and results of operations.
Our future operating results and financial position could be negatively affected by impairment charges to our goodwill or other long-lived assets.
When we acquire a business, we record goodwill as the excess of the consideration transferred plus the fair value of any non-controlling interest in the acquiree at the acquisition date over the fair values of the identifiable net assets acquired. At December 31, 2017, we had goodwill of approximately $31.2 million. In accordance with Financial Accounting Standards Board (“FASB”) Accounting Standards Codification (“ASC”) 350, Intangibles–Goodwill & Other (“ASC 350”), we test goodwill for impairment on October 1 of each year, and on an interim date if factors or indicators become apparent that would require an interim test.
If economic conditions deteriorate and result in significant declines in operating results and/or significant declines in our stock price, or if there are significant downward revisions in the present value of our estimated future cash flows, additional impairments to one or more reporting units could occur in future periods, and such impairments could be material. A downward revision in the present value of estimated future cash flows could be caused by a number of factors, including, among others, adverse changes in the business climate, negative industry or economic trends, decline in performance in our industry sector, or a decline in market multiples for competitors. Our estimates regarding future cash flows are inherently uncertain and changes in our underlying assumptions and the impact of market conditions on those assumptions could materially affect the determination of fair value and/or goodwill impairment. Future events and changing market conditions may impact our assumptions as to revenues, costs or other factors that may result in changes in our estimates of future cash flows. We can provide no assurance that a material impairment charge will not occur in a future period. Such a charge could negatively affect our results of operations and financial position. We will continue to monitor on an ongoing basis the recoverability of the carrying value of our goodwill and other long-lived assets (see “Critical Accounting Policies and Estimates” in Part II, Item 7).
Labor disputes could disrupt our ability to serve our customers and/or lead to higher labor costs.
As of December 31, 2017, we have approximately 66 employees in Utah, a significant territory in our geographic footprint, who are covered by a collective bargaining agreement and approximately 2,027 employees who are not represented by unions or covered by collective bargaining agreements. Various unions periodically seek to organize certain of our nonunion employees. Union organizing efforts or collective bargaining negotiations could potentially lead to work stoppages and/or slowdowns or strikes by certain of our employees, which could adversely affect our ability to serve our customers. Further, settlement of actual or threatened labor disputes or an increase in the number of our employees covered by collective bargaining agreements can have unknown effects on our labor costs, productivity and flexibility.
We have operations throughout the United States, which exposes us to multiple state and local regulations. Changes in applicable law, regulations or requirements, or our material failure to comply with any of them, can increase our costs and have other negative impacts on our business.
Our 83 branch locations in the United States are located in 22 different states, which exposes us to a host of different state and local regulations. These laws and requirements address multiple aspects of our operations, such as worker safety, consumer rights, privacy, employee benefits and more, and can often have different requirements in different jurisdictions. Changes in these requirements, or any material failure by our branches to comply with them, could increase our costs, affect our reputation, limit our business, drain management’s time and attention or otherwise, generally impact our operations in adverse ways.
We could be adversely affected by environmental and safety requirements, which could force us to increase significant capital and other operational costs and may subject us to unanticipated liabilities.
Our operations, like those of other companies engaged in similar businesses, require the handling, use, storage and disposal of certain regulated materials. As a result, we are subject to the requirements of federal, state and local environmental and occupational health and safety laws and regulations. We may not be in complete compliance with all such requirements at all times. We are subject to potentially significant civil or criminal fines or penalties if we fail to comply with any of these requirements. We have made and will continue to make capital and other expenditures in order to comply with these laws and regulations. However, the requirements of these laws and regulations are complex, change frequently, and could become more stringent in the future. It is possible that these requirements will change or that liabilities will arise in the future in a manner that could have a material adverse effect on our business, financial condition and results of operations.
Environmental laws also impose obligations and liability for the cleanup of properties affected by hazardous substance spills or releases. These liabilities can be imposed on the parties generating or disposing of such substances or the operator of the affected property, often without regard to whether the owner or operator knew of, or was responsible for, the presence of hazardous substances.
19
Accordingly, we may become liable, either contractually or by operation of law, for remediation costs even if a contaminated property is not currently owned or operated by us, or if the contamination was caused by third parties during or prior to our ownership or operation of the property. Given the nature of our operations (which involve the use of petroleum products, solvents and other hazardous substances for fueling and maintaining our equipment and vehicles), there can be no assurance that prior site assessments or investigations have identified all potential instances of soil or groundwater contamination. Future events, such as changes in existing laws or policies or their enforcement, or the discovery of currently unknown contamination, may give rise to additional remediation liabilities, which may be material.
Our business may be materially affected by changes to fiscal and tax policies. Negative or unexpected tax consequences could adversely affect our results of operations
The Tax Cuts and Jobs Act of 2017 (the “Act”) signed into law on December 22, 2017 results in significant changes to the U.S. Internal Revenue Code. Such changes include a reduction in the corporate tax rate (from 35% to 21%) and limitations on certain corporate deductions and credits, among other changes. As of December 31, 2017, we have not completed our accounting for all the tax effects of the Act. However, we have made a reasonable estimate of the effects of the Act on our existing deferred tax balances.
Our analysis of potential future impacts from the Act is ongoing. Certain of these changes could potentially impact the measurement of our tax balances as well as have a future negative impact on our business, as could any uncertainty in terms of the implementation and interpretation of the new changes. In addition, adverse changes in the underlying profitability and financial outlook of our operations or future changes in tax law could lead to changes in the value of tax assets or liabilities that we currently or in the future may hold, which could materially affect our results of operations.
None.
20
As of February 15, 2018, we had a network of 83 full-service facilities, serving approximately 39,600 customers across 22 states in the West Coast, Intermountain, Southwest, Gulf Coast, Southeast and Mid-Atlantic regions of the United States. In our facilities, we rent, display and sell equipment, including tools and supplies, and provide maintenance and basic repair work. Of the 83 total facilities, we own 11 of our locations and lease 72 locations. Our leases typically provide for varying terms and renewal options. The following table provides data on our locations and the number of multiple branch locations in each city is indicated by parentheses:
|
City/State |
|
Leased/Owned |
|
City/State |
|
Leased/Owned |
|
Alabama (2) |
|
|
|
Montana (2) |
|
|
|
Birmingham |
|
Leased |
|
Belgrade |
|
Leased |
|
Huntsville |
|
Leased |
|
Billings |
|
Leased |
|
Arizona (2) |
|
|
|
New Mexico (1) |
|
|
|
Phoenix |
|
Owned |
|
Albuquerque |
|
Leased |
|
Tucson |
|
Owned |
|
Nevada (2) |
|
|
|
Arkansas (2) |
|
|
|
Las Vegas |
|
Leased |
|
Little Rock |
|
Owned |
|
Reno |
|
Leased |
|
Springdale |
|
Owned |
|
North Carolina (5) |
|
|
|
California (8) |
|
|
|
Arden |
|
Leased |
|
Bakersfield |
|
Leased |
|
Durham |
|
Leased |
|
Benicia |
|
Leased |
|
Charlotte |
|
Leased |
|
Fontana |
|
Leased |
|
Raleigh |
|
Leased |
|
La Mirada |
|
Leased |
|
Winston-Salem |
|
Leased |
|
Sacramento |
|
Leased |
|
Oklahoma (2) |
|
|
|
San Diego |
|
Leased |
|
Oklahoma City |
|
Leased |
|
San Francisco |
|
Leased |
|
Tulsa |
|
Leased |
|
San Jose |
|
Leased |
|
South Carolina (3) |
|
|
|
Colorado (6) |
|
|
|
Charleston |
|
Leased |
|
Colorado Springs |
|
Leased |
|
Columbia |
|
Leased |
|
Commerce City |
|
Leased |
|
Greenville |
|
Leased |
|
Denver |
|
Owned |
|
Tennessee (3) |
|
|
|
Erie |
|
Leased |
|
Chattanooga |
|
Leased |
|
Fort Collins |
|
Leased |
|
Memphis |
|
Leased |
|
Greeley |
|
Leased |
|
Nashville |
|
Leased |
|
Florida (5) |
|
|
|
Texas (15) |
|
|
|
Fort Myers |
|
Leased |
|
Austin |
|
Leased |
|
Jacksonville |
|
Leased |
|
Beaumont |
|
Leased |
|
Orlando |
|
Leased |
|
Corpus Christi |
|
Leased |
|
Pompano Beach |
|
Leased |
|
Dallas(2) |
|
Leased(1) Owned(1) |
|
Tampa |
|
Leased |
|
Fort Worth |
|
Leased |
|
Georgia (3) |
|
|
|
Freeport |
|
Leased |
|
Atlanta |
|
Leased |
|
Houston(2) |
|
Leased(2) |
|
Savannah |
|
Leased |
|
Katy |
|
Leased |
|
Suwannee |
|
Leased |
|
Lubbock |
|
Leased |
|
Idaho (2) |
|
|
|
Mesquite |
|
Leased |
|
Boise |
|
Leased |
|
Midland |
|
Leased |
|
Coeur d’Alene |
|
Leased |
|
Pasadena |
|
Leased |
|
Louisiana (9) |
|
|
|
San Antonio |
|
Leased |
|
Alexandria |
|
Leased |
|
Utah (2) |
|
|
|
Baton Rouge |
|
Owned |
|
Salt Lake City |
|
Leased |
|
Belle Chasse |
|
Leased |
|
St. George |
|
Leased |
|
Kenner |
|
Owned |
|
Virginia (4) |
|
|
|
Lafayette |
|
Leased |
|
Ashland |
|
Owned |
|
Lake Charles |
|
Leased |
|
Norfolk |
|
Leased |
|
New Orleans |
|
Leased |
|
Roanoke |
|
Owned |
|
Shreveport(2) |
|
Leased(2) |
|
Warrenton |
|
Owned |
|
Maryland (2) |
|
|
|
Washington(2) |
|
|
|
Baltimore |
|
Leased |
|
Seattle |
|
Leased |
|
Forestville |
|
Leased |
|
Lynwood |
|
Leased |
|
Mississippi (1) |
|
|
|
|
|
|
|
Jackson |
|
Leased |
|
|
|
|
21
Each facility location has a branch manager who is responsible for day-to-day operations. In addition, branch operating facilities are typically staffed with approximately 10 to 100 people, who may include technicians, salespeople, rental operations staff and parts specialists. While facility offices are typically open five days a week, we provide 24 hour, seven day per week service.
Our corporate headquarters employs approximately 314 people. Our corporate headquarters facility is on 3.1 acres of company-owned land where we occupy a total of approximately 42,550 square feet.
From time to time, we are involved in various claims and legal actions arising in the ordinary course of our business. In the opinion of management, after consultation with legal counsel, the ultimate disposition of these various matters will not have a material adverse effect on the Company’s consolidated financial position, results of operations or liquidity.
Not applicable.
22
|
Item 5. |
Market for Registrant’s Common Equity, Related Stockholder Matters and Issuer Purchases of Equity Securities |
Market Information
Our common stock, par value $0.01 per share, trades on the Nasdaq Global Market (“Nasdaq”) under the symbol “HEES.” The following table sets forth, for the quarterly periods indicated, the high and low sales prices per share for our common stock as reported by Nasdaq for the years ended December 31, 2017 and 2016.
|
|
|
High |
|
|
Low |
|
||
|
Year ended December 31, 2017 |
|
|
|
|
|
|
|
|
|
First quarter |
|
$ |
27.54 |
|
|
$ |
21.30 |
|
|
Second quarter |
|
|
25.12 |
|
|
|
17.44 |
|
|
Third quarter |
|
|
30.21 |
|
|
|
19.27 |
|
|
Fourth quarter |
|
|
40.83 |
|
|
|
27.46 |
|
|
Year ended December 31, 2016 |
|
|
|
|
|
|
|
|
|
First quarter |
|
$ |
18.15 |
|
|
$ |
10.12 |
|
|
Second quarter |
|
|
20.83 |
|
|
|
16.72 |
|
|
Third quarter |
|
|
20.05 |
|
|
|
14.82 |
|
|
Fourth quarter |
|
|
24.29 |
|
|
|
12.72 |
|
Holders
As of December 31, 2017, there were 153 stockholders of record of our common stock. This does not include beneficial owners of our common stock whose stock is held in nominee or “street name”.
Dividends
During the years ended December 31, 2017 and 2016, the Company paid quarterly cash dividends totaling $1.10 per share in each year, or approximately $39.2 million and $39.1 million, respectively. The Company intends to continue to pay regular quarterly cash dividends; however, the declaration of any subsequent dividends is discretionary and will be subject to a final determination by the Board of Directors each quarter after its review of, among other things, business and market conditions.
Securities Authorized for Issuance Under Equity Compensation Plans
For certain information concerning securities authorized for issuance under our equity compensation plan, see Item 12 — Security Ownership of Certain Beneficial Owners and Management and Related Stockholder Matters.
23
The Performance Graph below compares the cumulative total stockholder return on H&E Equipment Services, Inc.’s common stock beginning on December 31, 2012 and for each subsequent quarter period end through and including December 31, 2017, with the cumulative returns of the Russell 2000 Index and an industry peer group selected by us. The peer group we selected is comprised of the following companies: United Rentals, Inc., Toromont Industries, Ltd., Finning International, Inc., and The Ashtead Group, PLC. In our Annual Reports on Form 10-K for the years ended December 31, 2013, 2014 and 2015, we included within our peer group, Hertz Global Holdings, which previously owned Herc Holdings Inc., the then parent company of Herc Rentals Inc., Hertz’s equipment rental business. On July 1, 2016, Herc Holdings Inc. was separated from Hertz Global Holdings, Inc. and became an independent, publicly-traded corporation. Accordingly, we have excluded Herc Holdings Inc. and Hertz Global Holdings, Inc. from our industry peer group in the five-year Performance Graph below.
The Performance Graph comparison assumes $100 was invested in our common stock and in each of the other indices described above on December 31, 2012. Dividend reinvestment has been assumed and returns have been weighted to reflect relative stock market capitalization. The stock performance shown on the graph below is not necessarily indicative of future price performance.
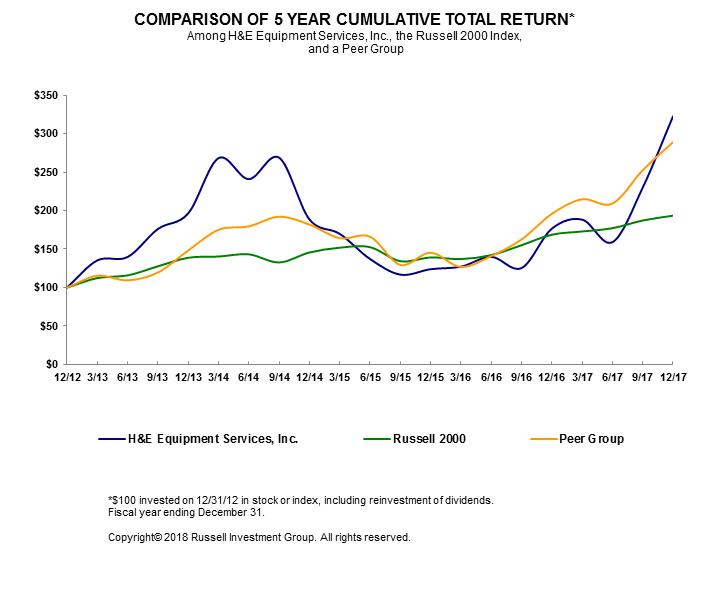
24
|
|
|
12/31/12 |
|
|
12/31/13 |
|
|
12/31/14 |
|
|
12/31/15 |
|
|
12/31/16 |
|
|
12/31/17 |
|
||||||
|
H&E Equipment Services, Inc. |
|
$ |
100.00 |
|
|
$ |
162.01 |
|
|
$ |
241.85 |
|
|
$ |
136.96 |
|
|
$ |
142.28 |
|
|
$ |
225.10 |
|
|
Russell 2000 Index |
|
|
100.00 |
|
|
|
123.69 |
|
|
|
140.49 |
|
|
|
144.50 |
|
|
|
150.83 |
|
|
|
182.80 |
|
|
Peer Group |
|
|
100.00 |
|
|
|
123.19 |
|
|
|
182.25 |
|
|
|
151.34 |
|
|
|
156.58 |
|
|
|
241.55 |
|
This stock performance information is “furnished” and shall not be deemed to be “soliciting material” or subject to Rule 14A of the Securities Exchange Act of 1934, as amended (the “Exchange Act”), shall not be deemed “filed” for purposes of Section 18 of the Exchange Act or otherwise subject to the liabilities of that section, and shall not be deemed incorporated by reference in any filing under the Securities Act of 1933, as amended, or the Exchange Act, whether made before or after the date of this Annual Report on Form 10-K and irrespective of any general incorporation by reference language in any such filing, except to the extent that we specifically incorporate this information by reference.
Issuer Purchases of Equity Securities
On October 12, 2017, 2,982 shares of non-vested stock that were issued in 2015 vested at $30.15 per share. The holder of those vested shares returned 966 shares of common stock to the Company during the quarter ended December 31, 2017 as payment for their withholding taxes. This resulted in an addition of 966 shares to treasury stock.
25
The following table sets forth our selected historical consolidated financial data as of the dates and for the periods indicated. The selected historical consolidated statement of income data and other financial data for the years ended December 31, 2017, 2016 and 2015 and balance sheet data as of December 31, 2017 and 2016 have been derived from our audited consolidated financial statements included elsewhere in this Annual Report on Form 10-K. The selected historical consolidated statement of income data and other financial data for the years ended December 31, 2014 and 2013 and balance sheet data as of December 31, 2015, 2014 and 2013 have been derived from our audited consolidated financial information not included herein. Our historical results are not necessarily indicative of future performance or results of operations. You should read the consolidated historical financial data together with our consolidated financial statements and related notes included in Item 8 of this Annual Report on Form 10-K and with Item 7—Management’s Discussion and Analysis of Financial Condition and Results of Operations.
|
|
|
For the Year Ended December 31, |
|
|||||||||||||||||
|
|
|
2017 |
|
|
2016 |
|
|
2015 |
|
|
2014 |
|
|
2013 |
|
|||||
|
|
|
(Amounts in thousands, except per share amounts) |
|
|||||||||||||||||
|
Statement of income data(1): |
|
|
|
|
|
|
|
|
|
|
|
|
|
|
|
|
|
|
|
|
|
Revenues: |
|
|
|
|
|
|
|
|
|
|
|
|
|
|
|
|
|
|
|
|
|
Equipment rentals |
|
$ |
479,016 |
|
|
$ |
445,227 |
|
|
$ |
443,024 |
|
|
$ |
404,110 |
|
|
$ |
338,935 |
|
|
New equipment sales |
|
|
203,301 |
|
|
|
196,688 |
|
|
|
238,172 |
|
|
|
328,036 |
|
|
|
294,768 |
|
|
Used equipment sales |
|
|
107,329 |
|
|
|
96,910 |
|
|
|
118,338 |
|
|
|
123,173 |
|
|
|
141,560 |
|
|
Parts sales |
|
|
107,384 |
|
|
|
109,147 |
|
|
|
111,133 |
|
|
|
113,732 |
|
|
|
103,174 |
|
|
Services revenues |
|
|
62,873 |
|
|
|
64,673 |
|
|
|
63,954 |
|
|
|
61,292 |
|
|
|
56,694 |
|
|
Other |
|
|
70,116 |
|
|
|
65,492 |
|
|
|
65,210 |
|
|
|
60,069 |
|
|
|
52,625 |
|
|
Total revenues |
|
|
1,030,019 |
|
|
|
978,137 |
|
|
|
1,039,831 |
|
|
|
1,090,412 |
|
|
|
987,756 |
|
|
Cost of revenues: |
|
|
|
|
|
|
|
|
|
|
|
|
|
|
|
|
|
|
|
|
|
Rental depreciation |
|
|
169,455 |
|
|
|
162,415 |
|
|
|
162,089 |
|
|
|
146,055 |
|
|
|
121,948 |
|
|
Rental expense |
|
|
77,706 |
|
|
|
71,694 |
|
|
|
71,950 |
|
|
|
61,916 |
|
|
|
55,338 |
|
|
New equipment sales |
|
|
180,702 |
|
|
|
175,556 |
|
|
|
212,235 |
|
|
|
289,526 |
|
|
|
262,887 |
|
|
Used equipment sales |
|
|
74,132 |
|
|
|
66,738 |
|
|
|
81,338 |
|
|
|
84,936 |
|
|
|
100,693 |
|
|
Parts sales |
|
|
77,713 |
|
|
|
78,966 |
|
|
|
80,830 |
|
|
|
81,106 |
|
|
|
74,241 |
|
|
Services revenues |
|
|
21,111 |
|
|
|
21,839 |
|
|
|
21,693 |
|
|
|
21,507 |
|
|
|
21,034 |
|
|
Other |
|
|
69,292 |
|
|
|
65,318 |
|
|
|
63,964 |
|
|
|
57,428 |
|
|
|
49,779 |
|
|
Total cost of revenues |
|
|
670,111 |
|
|
|
642,526 |
|
|
|
694,099 |
|
|
|
742,474 |
|
|
|
685,920 |
|
|
Gross profit: |
|
|
|
|
|
|
|
|
|
|
|
|
|
|
|
|
|
|
|
|
|
Equipment rentals |
|
|
231,855 |
|
|
|
211,118 |
|
|
|
208,985 |
|
|
|
196,139 |
|
|
|
161,649 |
|
|
New equipment sales |
|
|
22,599 |
|
|
|
21,132 |
|
|
|
25,937 |
|
|
|
38,510 |
|
|
|
31,881 |
|
|
Used equipment sales |
|
|
33,197 |
|
|
|
30,172 |
|
|
|
37,000 |
|
|
|
38,237 |
|
|
|
40,867 |
|
|
Parts sales |
|
|
29,671 |
|
|
|
30,181 |
|
|
|
30,303 |
|
|
|
32,626 |
|
|
|
28,933 |
|
|
Services revenues |
|
|
41,762 |
|
|
|
42,834 |
|
|
|
42,261 |
|
|
|
39,785 |
|
|
|
35,660 |
|
|
Other |
|
|
824 |
|
|
|
174 |
|
|
|
1,246 |
|
|
|
2,641 |
|
|
|
2,846 |
|
|
Total gross profit |
|
|
359,908 |
|
|
|
335,611 |
|
|
|
345,732 |
|
|
|
347,938 |
|
|
|
301,836 |
|
|
Selling, general and administrative expenses(2) |
|
|
232,784 |
|
|
|
228,129 |
|
|
|
220,226 |
|
|
|
206,480 |
|
|
|
189,062 |
|
|
Merger breakup fee proceeds, net of merger costs(3) |
|
|
5,782 |
|
|
|
— |
|
|
|
— |
|
|
|
— |
|
|
|
— |
|
|
Gain from sales of property and equipment, net |
|
|
5,009 |
|
|
|
3,285 |
|
|
|
2,737 |
|
|
|
2,286 |
|
|
|
2,549 |
|
|
Income from operations |
|
|
137,915 |
|
|
|
110,767 |
|
|
|
128,243 |
|
|
|
143,744 |
|
|
|
115,323 |
|
|
Other income (expense): |
|
|
|
|
|
|
|
|
|
|
|
|
|
|
|
|
|
|
|
|
|
Interest expense(4) |
|
|
(54,958 |
) |
|
|
(53,604 |
) |
|
|
(54,030 |
) |
|
|
(52,353 |
) |
|
|
(51,404 |
) |
|
Loss on early extinguishment of debt(5) |
|
|
(25,363 |
) |
|
|
— |
|
|
|
— |
|
|
|
— |
|
|
|
— |
|
|
Other, net |
|
|
1,750 |
|
|
|
1,867 |
|
|
|
1,463 |
|
|
|
1,293 |
|
|
|
1,228 |
|
|
Total other expense, net |
|
|
(78,571 |
) |
|
|
(51,737 |
) |
|
|
(52,567 |
) |
|
|
(51,060 |
) |
|
|
(50,176 |
) |
|
Income before income taxes |
|
|
59,344 |
|
|
|
59,030 |
|
|
|
75,676 |
|
|
|
92,684 |
|
|
|
65,147 |
|
|
Income tax provision (benefit)(6) |
|
|
(50,314 |
) |
|
|
21,858 |
|
|
|
31,371 |
|
|
|
37,545 |
|
|
|
21,007 |
|
|
Net income |
|
$ |
109,658 |
|
|
$ |
37,172 |
|
|
$ |
44,305 |
|
|
$ |
55,139 |
|
|
$ |
44,140 |
|
|
Net income per common share: |
|
|
|
|
|
|
|
|
|
|
|
|
|
|
|
|
|
|
|
|
|
Basic |
|
$ |
3.09 |
|
|
$ |
1.05 |
|
|
$ |
1.26 |
|
|
$ |
1.57 |
|
|
$ |
1.26 |
|
|
Diluted |
|
$ |
3.07 |
|
|
$ |
1.05 |
|
|
$ |
1.25 |
|
|
$ |
1.56 |
|
|
$ |
1.26 |
|
|
Weighted average common shares outstanding: |
|
|
|
|
|
|
|
|
|
|
|
|
|
|
|
|
|
|
|
|
|
Basic |
|
|
35,516 |
|
|
|
35,393 |
|
|
|
35,272 |
|
|
|
35,159 |
|
|
|
35,041 |
|
|
Diluted |
|
|
35,699 |
|
|
|
35,480 |
|
|
|
35,343 |
|
|
|
35,249 |
|
|
|
35,146 |
|
|
Dividends declared per common share outstanding |
|
$ |
1.10 |
|
|
$ |
1.10 |
|
|
$ |
1.05 |
|
|
$ |
0.50 |
|
|
$ |
— |
|
26
|
|
|
For the Year Ended December 31, |
|
|||||||||||||||||
|
|
|
2017 |
|
|
2016 |
|
|
2015 |
|
|
2014 |
|
|
2013 |
|
|||||
|
|
|
(Amounts in thousands) |
|
|||||||||||||||||
|
Other financial data: |
|
|
|
|
|
|
|
|
|
|
|
|
|
|
|
|
|
|
|
|
|
Depreciation and amortization(7) |
|
$ |
193,245 |
|
|
$ |
189,697 |
|
|
$ |
186,457 |
|
|
$ |
166,514 |
|
|
$ |
138,903 |
|
|
Statement of cash flows: |
|
|
|
|
|
|
|
|
|
|
|
|
|
|
|
|
|
|
|
|
|
Net cash provided by operating activities |
|
|
226,199 |
|
|
|
176,979 |
|
|
|
206,620 |
|
|
|
158,318 |
|
|
|
138,652 |
|
|
Net cash used in investing activities |
|
|
(153,075 |
) |
|
|
(114,410 |
) |
|
|
(101,759 |
) |
|
|
(296,643 |
) |
|
|
(179,590 |
) |
|
Net cash provided by (used in) financing activities |
|
|
85,071 |
|
|
|
(62,045 |
) |
|
|
(113,563 |
) |
|
|
136,579 |
|
|
|
49,651 |
|
|
|
|
As of December 31, |
|
|||||||||||||||||
|
|
|
2017 |
|
|
2016 |
|
|
2015 |
|
|
2014 |
|
|
2013 |
|
|||||
|
|
|
(Amounts in thousands) |
|
|||||||||||||||||
|
Balance sheet data: |
|
|
|
|
|
|
|
|
|
|
|
|
|
|
|
|
|
|
|
|
|
Cash |
|
$ |
165,878 |
|
|
$ |
7,683 |
|
|
$ |
7,159 |
|
|
$ |
15,861 |
|
|
$ |
17,607 |
|
|
Rental equipment, net |
|
|
904,824 |
|
|
|
893,816 |
|
|
|
893,393 |
|
|
|
889,706 |
|
|
|
688,710 |
|
|
Goodwill |
|
|
31,197 |
|
|
|
31,197 |
|
|
|
31,197 |
|
|
|
31,197 |
|
|
|
31,197 |
|
|
Deferred financing costs, net(8) |
|
|
3,772 |
|
|
|
1,964 |
|
|
|
2,777 |
|
|
|
2,850 |
|
|
|
2,638 |
|
|
Total assets(7) |
|
|
1,467,717 |
|
|
|
1,241,611 |
|
|
|
1,299,511 |
|
|
|
1,356,990 |
|
|
|
1,088,289 |
|
|
Total debt(7) |
|
|
945,574 |
|
|
|
792,057 |
|
|
|
814,070 |
|
|
|
888,918 |
|
|
|
731,233 |
|
|
Stockholders’ equity |
|
|
216,793 |
|
|
|
142,765 |
|
|
|
142,588 |
|
|
|
133,367 |
|
|
|
94,812 |
|
|
(1) |
See note 18 to the consolidated financial statements discussing segment information. |
|
(2) |
Stock-based compensation expense included in selling, general and administrative expenses for the years ended December 31, 2017, 2016, 2015, 2014 and 2013 totaled $3.5 million, $3.0 million, $2.7 million, $2.6 million and $2.6 million, respectively. |
|
(3) |
As more fully described in note 3 to the audited consolidated financial statements included herein, pursuant to the terms of our merger agreement with Neff Corporation, we received a $13.2 million breakup fee concurrently with Neff’s termination of the merger agreement. Related merger transaction fees totaled $6.5 million. Estimated merger transaction fees related to our acquisition of CEC totaled $0.8 million, resulting in net proceeds of approximately $5.8 million for the year ended December 31, 2017. |
|
(4) |
Interest expense for the periods presented is comprised of cash-pay interest (interest recorded on debt and other obligations requiring periodic cash payments) and non-cash pay interest (comprised of amortization of deferred financing costs and accretion (amortization) of note discount (premium)). |
|
(5) |
As more fully discussed in note 9 to the consolidated financial statements, we recorded in 2017 a one-time loss on the early extinguishment of debt in the three month period ended September 30, 2017 of approximately $25.4 million, reflecting payment of $12.8 million of tender premiums associated with our repurchase of the Old Notes and $10.5 million of premiums in accordance with the indenture governing the Old Notes to redeem the remaining untendered Old Notes, combined with the write off of approximately $2.0 million of unamortized deferred financing costs, related to the Old Notes. |
|
(6) |
On December 22, 2017, the Act was signed into law and as more fully discussed in note 12 to the consolidated financial statements, we recorded in the fourth quarter of 2017 a one-time decrease in income tax expense of $66.9 million. The decrease in income tax expense is the result of the re-measurement of our deferred tax assets and liabilities, resulting from the decrease in the corporate statutory federal income tax rate from 35% to 21% under the Act. |
|
(7) |
Excludes amortization of deferred financing costs and accretion (amortization) of note discount (premium), which are included in interest expense. |
|
(8) |
The line items for Total debt, Total assets, and Deferred financing costs, net, have been retrospectively adjusted for the 2015, 2014 and 2013 years to reflect the Company’s adoption of Accounting Standards Update No. 2015-03, Simplifying the Presentation of Debt Issuance Costs, which was adopted on January 1, 2016. Total debt represents the carrying amounts for the periods presented, under the Credit Facility, senior unsecured notes and capital leases. |
27
The following discussion summarizes the financial position of H&E Equipment Services, Inc. and its subsidiaries as of December 31, 2017, and its results of operations for the year ended December 31, 2017, and should be read in conjunction with the Selected Financial Data and our consolidated financial statements and the accompanying notes thereto included elsewhere in this Annual Report on Form 10-K. The following discussion contains, in addition to historical information, forward-looking statements that include risks and uncertainties (see discussion of “Forward-Looking Statements” included elsewhere in this Annual Report on Form 10-K). Our actual results may differ materially from those anticipated in these forward-looking statements as a result of certain factors, including those factors set forth under Item 1A—Risk Factors of this Annual Report on Form 10-K.
Background
As one of the largest integrated equipment services companies in the United States focused on heavy construction and industrial equipment, we rent, sell and provide parts and services support for four core categories of specialized equipment: (1) hi-lift or aerial work platform equipment; (2) cranes; (3) earthmoving equipment; and (4) industrial lift trucks. By providing equipment rental, sales, on-site parts, repair and maintenance functions under one roof, we are a one-stop provider for our customers’ varied equipment needs. This full service approach provides us with multiple points of customer contact, enables us to maintain a high quality rental fleet, as well as an effective distribution channel for fleet disposal and provides cross-selling opportunities among our new and used equipment sales, rental, parts sales and services operations.
As of February 15, 2018, we operated 83 full-service facilities throughout the Intermountain, Southwest, Gulf Coast, West Coast, Southeast and Mid-Atlantic regions of the United States. Our work force includes distinct, focused sales forces for our new and used equipment sales and rental operations, highly skilled service technicians, product specialists and regional managers. We focus our sales and rental activities on, and organize our personnel principally by, our four core equipment categories. We believe this allows us to provide specialized equipment knowledge, improve the effectiveness of our rental and sales force and strengthen our customer relationships. In addition, we have branch managers for each location who are responsible for managing their assets and financial results. We believe this fosters accountability in our business and strengthens our local and regional relationships.
Through our predecessor companies, we have been in the equipment services business for approximately 56 years. H&E Equipment Services L.L.C. (“H&E LLC”) was formed in June 2002 through the business combination of Head & Engquist Equipment, LLC (“Head & Engquist”), a wholly-owned subsidiary of Gulf Wide Industries, L.L.C. (“Gulf Wide”), and ICM Equipment Company L.L.C. (“ICM”). Head & Engquist, founded in 1961, and ICM, founded in 1971, were two leading regional, integrated equipment service companies operating in contiguous geographic markets. In the June 2002 transaction, Head & Engquist and ICM were merged with and into Gulf Wide, which was renamed H&E LLC. Prior to the combination, Head & Engquist operated 25 facilities in the Gulf Coast region, and ICM operated 16 facilities in the Intermountain region of the United States.
Prior to our initial public offering in February 2006, our business was conducted through H&E LLC. In connection with our initial public offering, we converted H&E LLC into H&E Equipment Services, Inc. In order to have an operating Delaware corporation as the issuer for our initial public offering, H&E Equipment Services, Inc. was formed as a Delaware corporation and wholly-owned subsidiary of H&E Holdings L.L.C. (“H&E Holdings”), and immediately prior to the closing of our initial public offering, on February 3, 2006, H&E LLC and H&E Holdings merged with and into H&E Equipment Services, Inc., which survived the reincorporation merger as the operating company. Effective February 3, 2006, H&E LLC and H&E Holdings no longer existed under operation of law pursuant to the reincorporation merger.
On January 4, 2018, we announced the completion, effective January 1, 2018, of our acquisition of Contractors Equipment Center, an equipment rental company serving the greater Denver, Colorado area with three branch locations.
Business Segments
We have five reportable segments because we derive our revenues from five principal business activities: (1) equipment rentals; (2) new equipment sales; (3) used equipment sales; (4) parts sales; and (5) repair and maintenance services. These segments are based upon how we allocate resources and assess performance. In addition, we also have non-segmented revenues and costs that relate to equipment support activities.
•Equipment Rentals. Our rental operation primarily rents our four core types of construction and industrial equipment. We have a well-maintained rental fleet and our own dedicated sales force, focused by equipment type. We actively manage the size, quality, age and composition of our rental fleet based on our analysis of key measures such as time utilization (which we analyze as equipment usage based on: (1) a percentage of original equipment cost, and (2) the number of rental equipment units available for rent), rental rate trends and targets, rental equipment dollar utilization and maintenance and repair costs, which we closely monitor. We maintain fleet quality through regional quality control managers and our parts and services operations.
28
•New Equipment Sales. Our new equipment sales operation sells new equipment in all of our four core product categories. We have a retail sales force focused by equipment type that is separate from our rental sales force. Manufacturer purchase terms and pricing are managed by our product specialists.
•Used Equipment Sales. Our used equipment sales are generated primarily from sales of used equipment from our rental fleet, as well as from sales of inventoried equipment that we acquire through trade-ins from our equipment customers and through selective purchases of high quality used equipment. Used equipment is sold by our dedicated retail sales force. Our used equipment sales are an effective way for us to manage the size and composition of our rental fleet and provide a profitable distribution channel for disposal of rental equipment.
•Parts Sales. Our parts business sells new and used parts for the equipment we sell and also provides parts to our own rental fleet. To a lesser degree, we also sell parts for equipment produced by manufacturers whose products we neither rent nor sell. In order to provide timely parts and services support to our customers as well as our own rental fleet, we maintain an extensive parts inventory.
•Services. Our services operation provides maintenance and repair services for our customers’ equipment and to our own rental fleet at our facilities as well as at our customers’ locations. As the authorized distributor for numerous equipment manufacturers, we are able to provide service to that equipment that will be covered under the manufacturer’s warranty.
Our non-segmented revenues and costs relate to equipment support activities that we provide, such as transportation, hauling, parts freight and damage waivers, and are not generally allocated to reportable segments.
You can read more about our business segments under Item 1—Business and in note 18 of the consolidated financial statements in this Annual Report on Form 10-K.
Revenue Sources
We generate all of our total revenues from our five business segments and our non-segmented equipment support activities. Equipment rentals and new equipment sales account for more than half of our total revenues. For the year ended December 31, 2017, approximately 46.5% of our total revenues were attributable to equipment rentals, 19.7% of our total revenues were attributable to new equipment sales, 10.4% were attributable to used equipment sales, 10.5% were attributable to parts sales, 6.1% were attributable to our services revenues and 6.8% were attributable to non-segmented other revenues.
The pie charts below illustrate a breakdown of our revenues and gross profit for the year ended December 31, 2017 by business segment (see note 18 to our consolidated financial statements for further information regarding our business segments):
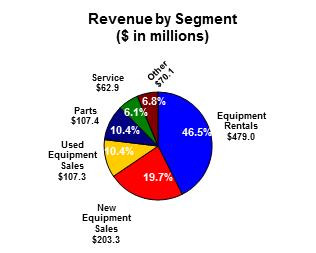
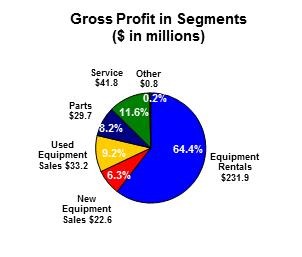
29
The equipment that we sell, rent and service is principally used in the construction industry, as well as by companies for commercial and industrial uses such as plant maintenance and turnarounds, as well as in the petrochemical and energy sectors. As a result, our total revenues are affected by several factors including, but not limited to, the demand for and availability of rental equipment, rental rates and other competitive factors, the demand for new and used equipment, the level of construction and industrial activities, spending levels by our customers, adverse weather conditions and general economic conditions. For a discussion of the impact of seasonality on our revenues, see “Seasonality” below.
Equipment Rentals. Our rental operation primarily rents our four core types of construction and industrial equipment. We have a well-maintained rental fleet and our own dedicated sales force, focused by equipment type. We actively manage the size, quality, age and composition of our rental fleet based on our analysis of key measures such as time utilization (which we analyze as equipment usage based on: (1) a percentage of original equipment cost, and (2) the number of rental equipment units available for rent), rental rate trends and targets, rental equipment dollar utilization and maintenance and repair costs, which we closely monitor. We maintain fleet quality through regional quality control managers and our parts and services operations. We recognize revenue from equipment rentals in the period earned, over the contract term, regardless of the timing of the billing to customers.
New Equipment Sales. We seek to optimize revenues from new equipment sales by selling equipment through a professional in-house retail sales force focused by product type. While sales of new equipment are impacted by the availability of equipment from the manufacturer, we believe our status as a leading distributor for some of our key suppliers improves our ability to obtain equipment. New equipment sales are an important component of our integrated model due to customer interaction and service contact and new equipment sales also lead to future parts and services revenues. We recognize revenue from the sale of new equipment at the time of delivery to, or pick-up by, the customer and when all obligations under the sales contract have been fulfilled and collectibility is reasonably assured.
Used Equipment Sales. We generate the majority of our used equipment sales revenues by selling equipment from our rental fleet. The remainder of our used equipment sales revenues comes from the sale of inventoried equipment that we acquire through trade-ins from our equipment customers and selective purchases of high-quality used equipment. Our policy is not to offer specified price trade-in arrangements on equipment for sale. Sales of our rental fleet equipment allow us to manage the size, quality, composition and age of our rental fleet, and provide us with a profitable distribution channel for the disposal of rental equipment. We recognize revenue for the sale of used equipment at the time of delivery to, or pick-up by, the customer and when all obligations under the sales contract have been fulfilled and collectibility is reasonably assured.
Parts Sales. We generate revenues from the sale of new and used parts for equipment that we rent or sell, as well as for other makes of equipment. Our product support sales representatives are instrumental in generating our parts revenues. They are product specialists and receive performance incentives for achieving certain sales levels. Most of our parts sales come from our extensive in-house parts inventory. Our parts sales provide us with a relatively stable revenue stream that is generally less sensitive to the economic cycles that tend to affect our rental and equipment sales operations. We recognize revenues from parts sales at the time of delivery to, or pick-up by, the customer and when all obligations under the sales contract have been fulfilled and collectibility is reasonably assured.
Services. We derive our services revenues from maintenance and repair services to customers for their owned equipment. In addition to repair and maintenance on an as-needed or scheduled basis, we also provide ongoing preventative maintenance services to industrial customers. Our after-market service provides a high-margin, relatively stable source of revenue through changing economic cycles. We recognize services revenues at the time services are rendered and collectibility is reasonably assured.
Our non-segmented other revenues relate to equipment support activities that we provide, such as transportation, hauling, parts freight and damage waivers, and are not generally allocated to reportable segments. We recognize non-segmented other revenues at the time of billing and after the related services have been provided.
Principal Costs and Expenses
Our largest expenses are the costs to purchase the new equipment we sell, the costs associated with the used equipment we sell, rental expenses, rental depreciation and costs associated with parts sales and services, all of which are included in cost of revenues. For the year period ended December 31, 2017, our total cost of revenues was approximately $670.1 million. Our operating expenses consist principally of selling, general and administrative expenses. For the year ended December 31, 2017, our selling, general and administrative expenses were $232.8 million. In addition, we have interest expense related to our debt instruments. Operating expenses and all other income and expense items below the gross profit line of our consolidated statements of income are not generally allocated to our reportable segments.
We are also subject to federal and state income taxes. Future income tax examinations by state and federal agencies could result in additional income tax expense based on probable outcomes of such matters.
30
Rental Depreciation. Depreciation of rental equipment represents the depreciation costs attributable to rental equipment. Estimated useful lives vary based upon type of equipment. Generally, we depreciate cranes and aerial work platforms over a ten year estimated useful life, earthmoving over a five year estimated useful life with a 25% salvage value, and industrial lift trucks over a seven year estimated useful life. Attachments and other smaller type equipment are depreciated over a three year estimated useful life. We periodically evaluate the appropriateness of remaining depreciable lives assigned to rental equipment.
Rental Expense. Rental expense represents the costs associated with rental equipment, including, among other things, the cost of servicing and maintaining our rental equipment, property taxes on our fleet and other miscellaneous costs of rental equipment.
New Equipment Sales. Cost of new equipment sold primarily consists of the equipment cost of the new equipment that is sold, net of any amount of credit given to the customer towards the equipment for trade-ins.
Used Equipment Sales. Cost of used equipment sold consists of the net book value of rental equipment for used equipment sold from our rental fleet, the equipment costs for used equipment we purchase for sale or the trade-in value of used equipment that we obtain from customers in equipment sales transactions.
Parts Sales. Cost of parts sales represents costs attributable to the sale of parts directly to customers.
Services Support. Cost of services revenues represents costs attributable to service provided for the maintenance and repair of customer-owned equipment and equipment then on-rent by customers.
Non-Segmented Other. These expenses include costs associated with providing transportation, hauling, parts freight, and damage waiver including, among other items, drivers’ wages, fuel costs, shipping costs, and our costs related to damage waiver policies.
Selling, General and Administrative Expenses:
Our selling, general and administrative (“SG&A”) expenses include sales and marketing expenses, payroll and related benefit costs, including stock compensation expense, insurance expenses, legal and professional fees, rent and other occupancy costs, property and other taxes, administrative overhead, depreciation associated with property and equipment (other than rental equipment) and amortization expense associated with intangible assets. These expenses are not generally allocated to our reportable segments.
Interest Expense:
Interest expense for the periods presented represents the interest on our outstanding debt instruments, including aggregate amounts outstanding under our revolving senior secured credit facility (the “Credit Facility”), senior unsecured notes due 2025 and our capital lease obligations, as well as our extinguished senior unsecured notes due 2022 (the “Old Notes”) for the periods during which such Old Notes were outstanding. Interest expense also includes interest on our outstanding manufacturer flooring plans payable which are used to finance inventory and rental equipment purchases. Non-cash interest expense related to the amortization cost of deferred financing costs and the accretion/amortization of note discount/premium are also included in interest expense.
Principal Cash Flows
We generate cash primarily from our operating activities and, historically, we have used cash flows from operating activities, manufacturer floor plan financings and available borrowings under the Credit Facility as the primary sources of funds to purchase inventory and to fund working capital and capital expenditures, growth and expansion opportunities (see also “Liquidity and Capital Resources” below). Our management of our working capital is closely tied to operating cash flows, as working capital can be significantly impacted by, among other things, our accounts receivable activities, the level of new and used equipment inventories, which may increase or decrease in response to current and expected demand, and the size and timing of our trade accounts payable payment cycles.
31
A substantial portion of our overall value is in our rental fleet equipment. The net book value of our rental equipment at December 31, 2017 was $904.8 million, or approximately 61.7% of our total assets. Our rental fleet as of December 31, 2017 consisted of 31,387 units having an original acquisition cost (which we define as the cost originally paid to manufacturers or the original amount financed under operating leases) of approximately $1.4 billion. As of December 31, 2017, our rental fleet composition was as follows (dollars in millions):
|
|
|
Units |
|
|
% of Total Units |
|
|
Original Acquisition Cost |
|
|
% of Original Acquisition Cost |
|
|
Average Age in Months |
|
|||||
|
Hi-Lift or Aerial Work Platforms |
|
|
22,052 |
|
|
|
70.3 |
% |
|
$ |
925.2 |
|
|
|
66.0 |
% |
|
|
37.4 |
|
|
Cranes |
|
|
285 |
|
|
|
0.9 |
% |
|
|
101.5 |
|
|
|
7.2 |
% |
|
|
52.7 |
|
|
Earthmoving |
|
|
3,213 |
|
|
|
10.2 |
% |
|
|
274.4 |
|
|
|
19.6 |
% |
|
|
25.0 |
|
|
Industrial Lift Trucks |
|
|
1,002 |
|
|
|
3.2 |
% |
|
|
31.5 |
|
|
|
2.2 |
% |
|
|
26.9 |
|
|
Other |
|
|
4,835 |
|
|
|
15.4 |
% |
|
|
69.9 |
|
|
|
5.0 |
% |
|
|
28.9 |
|
|
Total |
|
|
31,387 |
|
|
|
100.0 |
% |
|
$ |
1,402.5 |
|
|
|
100.0 |
% |
|
|
34.6 |
|
Determining the optimal age and mix for our rental fleet equipment is subjective and requires considerable estimates and judgments by management. We constantly evaluate the mix, age and quality of the equipment in our rental fleet in response to current economic and market conditions, competition and customer demand. The mix and age of our rental fleet, as well as our cash flows, are impacted by sales of equipment from the rental fleet, which are influenced by used equipment pricing at the retail and secondary auction market levels, and the capital expenditures to acquire new rental fleet equipment. In making equipment acquisition decisions, we evaluate current economic and market conditions, competition, manufacturers’ availability, pricing and return on investment over the estimated useful life of the specific equipment, among other things. As a result of our in-house service capabilities and extensive maintenance program, we believe our rental fleet is well-maintained.
The original acquisition cost of our gross rental fleet increased by approximately $68.9 million, or 5.2%, for the year ended December 31, 2017. The average age of our rental fleet equipment increased by approximately 1.6 months for the year ended December 31, 2017.
Our average rental rates for the year ended December 31, 2017 were approximately 0.2% higher than the year ended December 31, 2016 (see further discussion on rental rates in “Results of Operations” below).
The rental equipment mix among our four core product lines for the year ended December 31, 2017 was largely consistent with that of the prior year comparable period as a percentage of total units available for rent and as a percentage of original acquisition cost.
Principal External Factors that Affect our Businesses
We are subject to a number of external factors that may adversely affect our businesses. These factors, and other factors, are discussed below and under the heading “Forward-Looking Statements,” and in Item 1A—Risk Factors in this Annual Report on Form 10-K.
•Economic downturns. The demand for our products is dependent on the general economy, the stability of the global credit markets, the industries in which our customers operate or serve, and other factors. Downturns in the general economy or in the construction and manufacturing industries, as well as adverse credit market conditions, can cause demand for our products to materially decrease.
•Spending levels by customers. Rentals and sales of equipment to the construction industry and to industrial companies constitute a significant portion of our total revenues. As a result, we depend upon customers in these businesses and their ability and willingness to make capital expenditures to rent or buy specialized equipment. Accordingly, our business is impacted by fluctuations in customers’ spending levels on capital expenditures and by the availability of credit to those customers.
•Adverse weather. Adverse weather in a geographic region in which we operate may depress demand for equipment in that region. Our equipment is primarily used outdoors and, as a result, prolonged adverse weather conditions may prohibit our customers from continuing their work projects. Adverse weather also has a seasonal impact in parts of our Intermountain region, particularly in the winter months.
•Regional and Industry-Specific Activity and Trends. Expenditures by our customers may be impacted by the overall level of construction activity in the markets and regions in which they operate, the price of oil and other commodities and other
32
general economic trends impacting the industries in which our customers and end users operate. As our customers adjust their activity and spending levels in response to these external factors, our rentals and sales of equipment to those customers will be impacted. For example, high levels of industrial activity in our Gulf Coast and Intermountain regions have been a meaningful driver of recent growth in our revenues. However, the decline in oil and natural gas prices and the related downturn in oil industry activities during fiscal years 2014, 2015 and 2016 have resulted in a significant decrease in our new equipment sales, primarily the sale of new cranes, due to lower demand. Although oil prices have subsequently stabilized and improved slightly, we believe the uncertainty regarding future oil prices continues to impact customer capital expenditure decisions.
We believe that our integrated business tempers the effects of downturns in a particular segment. For a discussion of seasonality, see “Seasonality” on page 46 of this Annual Report on Form 10-K.
Critical Accounting Policies and Estimates
We prepare our consolidated financial statements in accordance with accounting principles generally accepted in the United States of America. The application of many accounting principles requires us to make assumptions, estimates and/or judgments that affect the reported amounts of assets, liabilities, revenues and expenses in our consolidated financial statements. We base our estimates and judgments on historical experience and other assumptions that we believe are reasonable under the circumstances. These assumptions, estimates and/or judgments, however, are often subjective and they and our actual results may change based on changing circumstances or changes in our analyses. If actual amounts are ultimately different from our estimates, the revisions are included in our results of operations for the period in which the actual amounts first become known. We believe the following critical accounting policies could potentially produce materially different results if we were to change underlying assumptions, estimates and/or judgments. See also note 2 to our consolidated financial statements for a summary of our significant accounting policies.
Revenue Recognition. Our revenue recognition policies vary by reporting segment. Pursuant to Topic 605 and other legacy industry-specific revenue recognition guidance, revenue generally is realized or realizable and earned when all of the following criteria are met: (1) persuasive evidence of an arrangement exists; (2) delivery has occurred or services have been rendered; (3) the seller’s price to the buyer is fixed or determinable; and (4) collectibility is reasonably assured. Revenue from the sale of new and used equipment and parts is recognized at the time of delivery to, or pick-up by, the customer and when all obligations under the sales contract have been fulfilled, risk of ownership has been transferred and collectibility is reasonably assured. Services revenue is recognized at the time the services are rendered. Other revenues consist primarily of billings to customers for rental equipment delivery and damage waiver charges and are generally recognized at the time the service has been provided.
We account for equipment that we rent as operating leases. Pursuant to Topic 840, we recognize revenue from equipment rentals in the period earned, regardless of the timing of the billing to customers. A rental contract includes rates for daily, weekly or monthly use, and rental revenue is earned on a daily basis as rental contracts remain outstanding. Because the rental contracts can extend across financial reporting periods, we record unbilled rental revenue and deferred rental revenue at the end of reporting periods so rental revenue earned is appropriately stated in the periods presented
See also the “Recent Accounting Pronouncements” discussion below on page 48 for new accounting revenue recognition guidance related to revenue from contracts with customers.
Allowance for Doubtful Accounts. We maintain an allowance for doubtful accounts that reflects our estimate of the amount of our receivables that we will be unable to collect. We develop our estimate of this allowance based on our historical experience with specific customers, our understanding of our current economic circumstances and our own judgment as to the likelihood of ultimate payment. Our largest exposure to doubtful accounts is in our rental operations. We perform credit evaluations of customers and establish credit limits based on reviews of our customers’ current credit information and payment histories. We believe our credit risk is somewhat mitigated by our geographically diverse customer base and our credit evaluation procedures. During the year, we write-off customer account balances when we have exhausted reasonable collection efforts and determined that the likelihood of collection is remote. Such write-offs are charged against our allowance for doubtful accounts. Bad debt expense as a percentage of total revenues for the years ended December 31, 2017, 2016 and 2015 were approximately 0.4%, 0.3% and 0.3%, respectively. The actual rate of future credit losses, however, may not be similar to past experience. Our estimate of doubtful accounts could change based on changing circumstances, including changes in the economy or in the particular circumstances of individual customers. Accordingly, we may be required to increase or decrease our allowance for doubtful accounts.
Useful Lives of Rental Equipment and Property and Equipment. We depreciate rental equipment and property and equipment over their estimated useful lives (generally three to ten years), after giving effect to an estimated salvage value ranging from 0% to 25% of cost. The useful life of rental equipment is determined based on our estimate of the period the asset will generate revenues, and the salvage value is determined based on our estimate of the minimum value we could realize from the asset after such period. We periodically review the assumptions utilized in computing rates of depreciation. We may be required to change these estimates based
33
on changes in our industry or other changing circumstances. If these estimates change in the future, we may be required to recognize increased or decreased depreciation expense for these assets.
The amount of depreciation expense we record is highly dependent upon the estimated useful lives and the salvage values assigned to each category of rental equipment. Generally, we assign estimated useful lives to our rental fleet ranging from a three-year life, five-year life with a 25% salvage value, seven-year life and a ten-year life. Depreciation expense on our rental fleet for the year ended December 31, 2017 was $169.5 million. For the year ended December 31, 2017, the estimated impact of a change in estimated useful lives for each category of equipment by two years was as follows:
|
|
|
Hi-Lift or Aerial Work Platforms |
|
|
Cranes |
|
|
Earth- moving |
|
|
Industrial Lift Trucks |
|
|
Other |
|
|
Total |
|
||||||
|
|
|
($ in millions) |
|
|||||||||||||||||||||
|
Impact of 2-year change in useful life on results of operations for the year ended December 31, 2017 |
|
|
|
|
|
|
|
|
|
|
|
|
|
|
|
|
|
|
|
|
|
|
|
|
|
Depreciation expense for the year ended December 31, 2017 |
|
$ |
90.4 |
|
|
$ |
12.1 |
|
|
$ |
49.0 |
|
|
$ |
4.7 |
|
|
$ |
13.3 |
|
|
$ |
169.5 |
|
|
Increase of 2 years in useful life |
|
|
73.0 |
|
|
|
9.2 |
|
|
|
30.1 |
|
|
|
3.4 |
|
|
|
14.0 |
|
|
|
129.7 |
|
|
Decrease of 2 years in useful life |
|
|
109.5 |
|
|
|
13.9 |
|
|
|
70.2 |
|
|
|
6.1 |
|
|
|
13.3 |
|
|
|
213.0 |
|
For purposes of the sensitivity analysis above, we elected not to decrease the useful lives of other equipment, which are primarily three-year estimated useful life assets; rather, we have held the depreciation expense constant at the actual amount of depreciation expense. We believe that decreasing the life of the other equipment by two years is an unreasonable estimate and would potentially lead to the decision to expense, rather than capitalize, a significant portion of the subject asset class. In general terms, a one-year increase in the estimated life across all classes of our rental equipment will give rise to an approximate decrease in our annual depreciation expense of approximately $19.9 million. Additionally, a one-year decrease in the estimated life across all classes of our rental equipment (with the exception of other equipment as discussed above) will give rise to an approximate increase in our annual depreciation expense of approximately $21.8 million.
Another significant assumption used in our calculation of depreciation expense is the estimated salvage value assigned to our earthmoving equipment. Based on our recent experience, we have used a 25% factor of the equipment’s original cost to estimate its salvage value. This factor is highly subjective and subject to change upon future actual results at the time we dispose of the equipment. A change of 5%, either increase or decrease, in the estimated salvage value would result in a change in our annual depreciation expense of approximately $2.8 million.
Purchase Price Allocation. We have made significant acquisitions in the past and we intend to make additional acquisitions in the future that meet our selection criteria that solidify our presence in the contiguous regions where we operate with an objective of increasing our revenues, improving our profitability, entering additional attractive markets and strengthening our competitive position. Pursuant to Financial Accounting Standards Board (“FASB”) Accounting Standards Codification (“ASC”) 350 (“ASC 350”), Intangibles-Goodwill and Other, we record as goodwill the excess of the consideration transferred plus the fair value of any non-controlling interest in the acquiree at the acquisition date over the fair values of the identifiable net assets acquired. Such fair market value assessments require judgments and estimates that can be affected by various factors over time, which may cause final amounts to differ materially from original estimates.
With the exception of goodwill, long-lived fixed assets generally represent the largest component of our acquisitions. Typically, the long-lived fixed assets that we acquire are primarily comprised of rental fleet equipment. Historically, virtually all of the rental equipment that we have acquired through business combinations have been classified as “To be Used,” rather than as “To be Sold.” Equipment that we acquire and classify as “To be Used” is recorded at fair value, as determined by replacement cost of such equipment. Any significant inventories of new and used equipment acquired in the transaction are valued at fair value.
In addition to long-lived fixed assets, we also acquire other assets and assume liabilities. These other assets and liabilities typically include, but are not limited to, parts inventory, accounts receivable, accounts payable and other working capital items. Because of their short-term nature, the fair values of these assets and liabilities generally approximate the carrying values reflected on the acquired entities balance sheets. However, when appropriate, we adjust these carrying values for factors such as collectibility and existence. The intangible assets that we have acquired generally consist primarily of the goodwill recognized. Depending upon the applicable purchase agreement and the particular facts and circumstances of the business acquired, we may identify other intangible assets, such as trade names or trademarks, non-compete agreements and customer-related intangibles (specifically, customer relationships). A trademark has a fair value equal to the present value of the royalty income attributable to it. The royalty income attributable to a trademark represents the hypothetical cost savings that are derived from owning the trademark instead of paying
34
royalties to license the trademark from another owner. When specifically negotiated by the parties in the applicable purchase agreements, we base the value of non-compete agreements on the amounts assigned to them in the purchase agreements as these amounts represent the amounts negotiated in an arm’s length transaction. When not negotiated by the parties in the applicable purchase agreements, the fair value of non-compete agreements is estimated based on an income approach since their values are representative of the current and future revenue and profit erosion protection they provide. Customer relationships are generally valued based on an excess earnings or income approach with consideration to projected cash flows. We use an independent third party valuation firm to assist us with estimating the fair values of our acquired intangible assets.
Goodwill. We have made acquisitions in the past that included the recognition of goodwill. Pursuant to ASC 350, goodwill is the excess of the consideration transferred plus the fair value of any non-controlling interest in the acquiree at the acquisition date over the fair values of the identifiable net assets acquired. We evaluate goodwill for impairment annually or more frequently if triggering events occur or other impairment indicators arise which might impair recoverability.
Application of the goodwill impairment test requires judgment, including: the identification of reporting units; assignment of assets and liabilities to reporting units; assignment of goodwill to reporting units; determination of the fair value of each reporting unit; and an assumption as to the form of the transaction in which the reporting unit would be acquired by a market participant (either a taxable or nontaxable transaction). Impairment of goodwill is evaluated at the reporting unit level. A reporting unit is defined as an operating segment (i.e., before aggregation or combination), or one level below an operating segment (i.e., a component). A component of an operating segment is a reporting unit if the component constitutes a business for which discrete financial information is available and segment management regularly reviews the operating results of that component. Pursuant to ASC 350 and ASC 280, Segment Reporting, and other relevant guidance, we have identified two components within our Rental operating segment (Equipment Rentals Component 1 and Equipment Rentals Component 2) and have determined that each of our other four operating segments (New Equipment, Used Equipment, Parts, and Service segments) represents a reporting unit, resulting in six total reporting units.
As of December 31, 2017, our goodwill was comprised of the following carrying values of three reporting units (amounts in thousands):
|
Reporting Unit |
|
Carrying Value at December 31, 2017 |
|
|
|
Equipment Rentals Component 2 |
|
$ |
18,700 |
|
|
Used Equipment Sales |
|
|
6,137 |
|
|
Parts Sales |
|
|
6,360 |
|
|
Total Goodwill |
|
$ |
31,197 |
|
ASC 350 allows entities to first use a qualitative approach to test goodwill for impairment. ASC 350 permits an entity to first perform a qualitative assessment to determine whether it is more likely than not (a likelihood of greater than 50%) that the fair value of a reporting unit is less than its carrying value. If it is concluded that this is the case, the currently prescribed two-step goodwill test must be performed. Otherwise, the two-step goodwill impairment test is not required. Considerable judgment is required by management in using the qualitative approach under ASC 350 to determine whether it is more likely than not that the fair value of a reporting unit is less than its carrying value. ASC 350 suggests that a qualitative assessment may become less relevant over time. In other words, the longer it has been since the last quantitative assessment, the more difficult it could be for a company to conclude that it is not more likely than not that the fair value of a reporting unit is less than its carrying amount. Our most recent quantitative assessment of goodwill impairment was as of October 1, 2016, whereby we bypassed the qualitative assessment for each reporting unit and proceeded directly to Step 1 of the goodwill impairment test. Our goodwill impairment testing as of that date indicated that there was no impairment among our reporting units as estimated fair values exceeded their respective carrying amounts.
During 2017, we performed, as of October 1, a qualitative assessment and determined that it is more likely than not that the fair value of each of our reporting units is not less than its carrying value and, therefore, did not perform the prescribed two-step goodwill impairment test. We considered various factors in performing the qualitative test, including macroeconomic conditions, industry and market considerations, the overall financial performance of our reporting units, the Company’s stock price and the excess amount or “cushion” between our reporting unit’s fair value and carrying value as indicated on our most recent quantitative assessment. Based upon improving macroeconomic conditions, positive trends within our industry and market and continuing positive operating results in comparison to prior periods and our internal forecasts, as well as consideration of the cushion between the reporting unit’s fair value and carrying value from our prior quantitative analysis in 2016 as described above, we determined that it is more likely than not that the fair value of our reporting units exceeds their respective carrying values at the October 1, 2017 valuation date and there was no goodwill impairment at October 1, 2017.
35
If the two-step goodwill test must be performed, we determine whether the fair value of our goodwill reporting units is greater than their carrying value. If the fair value of the reporting unit exceeds the carrying value of the net assets assigned to that reporting unit, goodwill is not impaired. However, if the fair value of a reporting unit is less than its carrying value, then the second step of the impairment test is performed to determine the implied fair value of goodwill. If the carrying value of a reporting unit’s goodwill exceeds its implied fair value, then we record an impairment loss for the excess amount. See also the “Recent Accounting Pronouncements discussion below on page 48 for new accounting guidance, which removes Step 2 of the goodwill impairment test.
For purposes of performing the first step of the impairment test described above, we estimate the fair value of our reporting units using a discounted cash flow analysis and/or by applying various market multiples. The principal factors used in the discounted cash flow analysis are our internal projected results of operations, weighted average cost of capital (“WACC”) and terminal value assumptions.
Our internal projected results of operations serve as key inputs for developing our cash flow projections for a planning period of twelve years. Beyond this period, we also determine an assumed long-term growth rate representing the expected rate at which a reporting unit’s earnings stream is expected to grow. These rates are used to calculate the terminal value of our reporting units and are added to the cash flows projected during the twelve year planning period. The WACC is an estimate of the overall after-tax rate of return required by equity and debt holders of a business enterprise and represents the expected cost of new capital likely to be used by market participants. The WACC is used to discount our combined future cash flows.
The inputs and variables used in determining the fair value of a reporting unit require management to make certain assumptions regarding the impact of operating and macroeconomic changes, as well as estimates of future cash flows. Our estimates regarding future cash flows are based on historical experience and projections of future operating performance, including revenues, margins and operating expenses. These estimates involve risk and are inherently uncertain. Changes in our estimates and assumptions could materially affect the determination of fair value and/or the amount of goodwill impairment to be recognized. However, we believe that our estimates and assumptions are reasonable and represent our most likely future operating results based upon current information available. Future deterioration in the macroeconomic environment, adverse changes within our industry, further deterioration in our common stock price, downward revisions to our projected cash flows based on new information, or other factors, some of which are beyond our ability to control, could result in a future impairment charge that could materially impact our future results of operations and financial position in the reporting period identified.
Long-lived Assets. Our long-lived assets principally consist of rental equipment and property and equipment. We review our long-lived assets for impairment whenever events or changes in circumstances indicate that the carrying amount of an asset may not be recoverable. In reviewing for impairment, the carrying value of such assets is compared to the estimated undiscounted future cash flows expected from the use of the assets and their eventual disposition. If such cash flows are not sufficient to support the asset’s recorded value, an impairment charge is recognized to reduce the carrying value of the asset to its estimated fair value. The determination of future cash flows as well as the estimated fair value of long-lived and intangible assets involves significant estimates and judgment on the part of management. Our estimates and assumptions may prove to be inaccurate due to factors such as changes in economic conditions, changes in our business prospects or other changing circumstances.
Inventories. We state our new and used equipment inventories at the lower of cost or net realizable value by specific identification. Parts and supplies are stated at the lower of the weighted average cost or net realizable value. We maintain allowances for damaged, slow-moving and unmarketable inventory to reflect the difference between the cost of the inventory and the estimated market value. Changes in product demand may affect the value of inventory on hand and may require higher inventory allowances. Uncertainties with respect to inventory valuation are inherent in the preparation of financial statements.
Reserves for Claims. We are exposed to various claims relating to our business, including those for which we provide self-insurance. Claims for which we self-insure up to specified retention limits include: (1) workers compensation claims; (2) general liability claims by third parties for injury or property damage caused by our equipment or personnel; (3) automobile liability claims; and (4) employee health insurance claims. These types of claims may take a substantial amount of time to resolve and, accordingly, the ultimate liability associated with a particular claim, including claims incurred but not reported as of a period-end reporting date, may not be known for an extended period of time. Our methodology for developing self-insurance reserves is based on management estimates and independent third party actuarial estimates. Our estimation process considers, among other matters, the cost of known claims over time, cost inflation and incurred but not reported claims. These estimates may change based on, among other things, changes in our claim history or receipt of additional information relevant to assessing the claims. Further, these estimates may prove to be inaccurate due to factors such as adverse judicial determinations or other claim settlements at higher than estimated amounts. Accordingly, we may be required to increase or decrease our reserve levels.
Income Taxes. The Company files a consolidated federal income tax return with its wholly-owned subsidiaries. The Company is a C-Corporation under the provisions of the Internal Revenue Code. We utilize the asset and liability approach to measure deferred tax assets and liabilities based on temporary differences existing at each balance sheet date using currently enacted tax rates in accordance
36
with ASC 740, Income Taxes (“ASC 740”). ASC 740 takes into account the differences between financial statement treatment and tax treatment of certain transactions. Deferred tax assets and liabilities are recognized for the future tax consequences attributable to differences between the financial statement carrying amounts of existing assets and liabilities and their respective tax bases. Deferred tax assets and liabilities are measured using enacted tax rates expected to apply to taxable income in the years in which those temporary differences are expected to be recovered or settled. The effect of a change in tax rate is recognized as income or expense in the period that includes the enactment date of that tax rate.
In accordance with ASC 740, the Company recognizes the effect of an income tax position only if it is more likely than not (a likelihood of greater than 50%) that such position will be sustained. Recognized income tax positions are measured at the largest amount that is greater than 50% likely of being realized. Changes in recognition or measurement are reflected in the period in which the change in judgment occurs. The Company recognizes both interest and penalties related to uncertain tax positions in net other income (expense).
Our deferred tax calculation requires management to make certain estimates about future operations. Deferred tax assets are reduced by a valuation allowance when, in the opinion of management, it is more likely than not that some portion or all of the deferred tax assets will not be realized.
Our U.S. federal tax returns for 2014 and subsequent years remain subject to examination by tax authorities. We are also subject to examination in various state jurisdictions for 2013 and subsequent years.
On December 22, 2017, the Tax Cuts and Jobs Act (the “Act”) was signed into law. Included in the Act is a reduction in the corporate statutory tax rate from 35% to 21%, effective for us on January 1, 2018. Under ASC 740, the effects of changes in tax rates and laws are recognized in the period in which the new legislation is enacted. In the case of US federal income taxes, the enactment date is the date the bill becomes law (i.e., upon presidential signature). As of December 31, 2017, we have not completed our accounting for all the tax effects of the enactment of the Act. However, with respect to this legislation, we recorded a one-time decrease in income tax expense of $66.9 million in the fourth quarter of 2017, due to a re-measurement of our deferred tax assets and liabilities resulting from the decrease in the corporate federal income tax rate from 35% to 21%.
Results of Operations
The tables included in the period-to-period comparisons below provide summaries of our revenues and gross profits for our business segments and non-segmented revenues for the years ended December 31, 2017, 2016 and 2015. The period-to-period comparisons of our financial results are not necessarily indicative of future results.
Year Ended December 31, 2017 Compared to the Year Ended December 31, 2016
Revenues.
|
|
|
For the Year Ended December 31, |
|
|
Total Dollar Increase |
|
|
Total Percentage Increase |
|
|||||||
|
|
|
2017 |
|
|
2016 |
|
|
(Decrease) |
|
|
(Decrease) |
|
||||
|
|
|
(in thousands, except percentages) |
|
|||||||||||||
|
Segment revenues: |
|
|
|
|
|
|
|
|
|
|
|
|
|
|
|
|
|
Equipment rentals |
|
$ |
479,016 |
|
|
$ |
445,227 |
|
|
$ |
33,789 |
|
|
|
7.6 |
% |
|
New equipment sales |
|
|
203,301 |
|
|
|
196,688 |
|
|
|
6,613 |
|
|
|
3.4 |
% |
|
Used equipment sales |
|
|
107,329 |
|
|
|
96,910 |
|
|
|
10,419 |
|
|
|
10.8 |
% |
|
Parts sales |
|
|
107,384 |
|
|
|
109,147 |
|
|
|
(1,763 |
) |
|
|
(1.6 |
)% |
|
Services revenues |
|
|
62,873 |
|
|
|
64,673 |
|
|
|
(1,800 |
) |
|
|
(2.8 |
)% |
|
Non-Segmented other revenues |
|
|
70,116 |
|
|
|
65,492 |
|
|
|
4,624 |
|
|
|
7.1 |
% |
|
Total revenues |
|
$ |
1,030,019 |
|
|
$ |
978,137 |
|
|
$ |
51,882 |
|
|
|
5.3 |
% |
Total Revenues. Our total revenues were $1.03 billion for the year ended December 31, 2017 compared to approximately $978.1 million for the year ended December 31, 2016, an increase of $51.9 million, or 5.3%. Revenues for our reportable segments and non-segmented other revenues are further discussed below.
Equipment Rental Revenues. Our revenues from equipment rentals for the year ended December 31, 2017 increased $33.8 million, or 7.6%, to $479.0 million from $445.2 million in 2016. Rental revenues from aerial work platform equipment increased $30.7 million and earthmoving equipment rental revenues increased $5.5 million, while rental revenues from other equipment and lift trucks increased $2.8 million and $0.5 million, respectively. Partially offsetting these increases in equipment rental revenues was a $5.7
37
million decrease in crane rental revenues. Our average rental rates for the year ended December 31, 2017 increased 0.2% compared to the year ended December 31, 2016.
Rental equipment dollar utilization (annual rental revenues divided by the average original rental fleet equipment costs) for the year ended December 31, 2017 increased 0.9% to 34.9% from 34.0% in 2016. The increase in comparative rental equipment dollar utilization was the result of an increase in rental equipment time utilization, combined with a 0.2% increase in average rental rates. Rental equipment time utilization as a percentage of original equipment cost was 72.1% for the year ended December 31, 2017 compared to approximately 69.7% for the year ended December 31, 2016, an increase of 2.4%. The increase in equipment rental time utilization based on original equipment cost is largely reflective of increased demand for rental equipment, especially aerial work platform equipment. Rental equipment time utilization based on the number of rental equipment units available for rent was 69.7% for the year ended December 31, 2017, compared to approximately 67.0% in the same period the prior year, an increase of 2.7%.
New Equipment Sales Revenues. Our new equipment sales for the year ended December 31, 2017 increased $6.6 million, or 3.4%, to $203.3 million from $196.7 million in 2016, as new crane sales increased $11.8 million. Sales of new other equipment increased $7.1 million and sales of new aerial work platform equipment increased $3.3 million. Partially offsetting these increases in new equipment sales were a $15.3 million decrease in new earthmoving equipment sales and a $0.3 million decrease in new lift truck sales.
Used Equipment Sales Revenues. Our used equipment sales increased $10.4 million, or 10.8%, to $107.3 million for the year ended December 31, 2017, from $96.9 million for the same period in 2016. Sales of used earthmoving equipment increased $5.4 million and sales of used cranes increased $3.1 million. Sales of used other equipment increased $1.2 million, while sales of used lift trucks and used aerial work platform equipment increased $0.5 million and $0.2 million, respectively.
Parts Sales Revenues. Our parts sales revenues decreased approximately $1.8 million, or 1.6%, to $107.4 million for the year ended December 31, 2017 from $109.1 million for the same period in 2016. The decrease in parts revenues was driven primarily by lower crane parts sales revenues.
Services Revenues. Our services revenues for the year ended December 31, 2017 decreased $1.8 million, or 2.8%, to $62.9 million from $64.7 million in the same period last year. The decrease in services revenues was due to lower crane services revenues and lower other equipment services revenues.
Non-Segmented Other Revenues. Our non-segmented other revenues consisted primarily of equipment support activities including transportation, hauling, parts freight and damage waiver charges. For the year ended December 31, 2017, our other revenues were $70.1 million, an increase of approximately $4.6 million, or 7.1%, from $65.5 million in 2016. The increase was primarily due to an increase in hauling revenues, fuel charges and damage waiver income associated with the increase in our equipment rental activity.
Gross Profit.
|
|
|
For the Year Ended December 31, |
|
|
Total Dollar Change Increase |
|
|
Total Percentage Change Increase |
|
|||||||
|
|
|
2017 |
|
|
2016 |
|
|
(Decrease) |
|
|
(Decrease) |
|
||||
|
|
|
(in thousands, except percentages) |
|
|||||||||||||
|
Segment Gross Profit: |
|
|
|
|
|
|
|
|
|
|
|
|
|
|
|
|
|
Equipment rentals |
|
$ |
231,855 |
|
|
$ |
211,118 |
|
|
$ |
20,737 |
|
|
|
9.8 |
% |
|
New equipment sales |
|
|
22,599 |
|
|
|
21,132 |
|
|
|
1,467 |
|
|
|
6.9 |
% |
|
Used equipment sales |
|
|
33,197 |
|
|
|
30,172 |
|
|
|
3,025 |
|
|
|
10.0 |
% |
|
Parts sales |
|
|
29,671 |
|
|
|
30,181 |
|
|
|
(510 |
) |
|
|
(1.7 |
)% |
|
Services revenues |
|
|
41,762 |
|
|
|
42,834 |
|
|
|
(1,072 |
) |
|
|
(2.5 |
)% |
|
Non-Segmented revenues |
|
|
824 |
|
|
|
174 |
|
|
|
650 |
|
|
|
373.6 |
% |
|
Total gross profit |
|
$ |
359,908 |
|
|
$ |
335,611 |
|
|
$ |
24,297 |
|
|
|
7.2 |
% |
Total Gross Profit. Our total gross profit was $359.9 million for the year ended December 31, 2017 compared to $335.6 million for the year ended December 31, 2016, an increase of $24.3 million, or 7.2%. Total gross profit margin for the year ended December 31, 2017 was approximately 34.9%, an increase of 0.6% from the 34.3% gross profit margin for the same period in 2016. Gross profit and gross margin for all reportable segments and non-segmented other revenues are further described below.
Equipment Rentals Gross Profit. Our gross profit from equipment rentals for the year ended December 31, 2017 increased $20.7 million, or 9.8%, to approximately $231.9 million from $211.1 million in 2016. The increase in equipment rentals gross profit was the
38
result of a $33.8 million increase in rental revenues for the year ended December 31, 2017, which was partially offset by a $7.l million increase in equipment rental depreciation expense and a $6.0 million increase in rental expenses. The increase in rental expenses is primarily due to higher repair costs and increased property taxes resulting from a larger rental fleet size. The increase in rental equipment depreciation expense is largely due also to a larger rental fleet size. Gross profit margin on equipment rentals for the year ended December 31, 2017 was approximately 48.4% compared to 47.4% for the same period in 2016, an increase of 1.0%. Depreciation expense was 35.4% of equipment rental revenues for the year ended December 31, 2017 compared to 36.5% for the same period in 2016, a decrease of 1.1%. As a percentage of equipment rental revenues, rental expenses were 16.2% for the year ended December 31, 2017 compared to approximately 16.1% for the same period last year, an increase of 0.1%.
New Equipment Sales Gross Profit. Our new equipment sales gross profit for the year ended December 31, 2017 increased $1.5 million, or 6.9%, to $22.6 million compared to $21.1 million for the same period in 2016 on an increase in total new equipment sales of $6.6 million. Gross profit margin on new equipment sales for the year ended December 31, 2017 was 11.1%, an increase of 0.4% from 10.7% in the same period in 2016, as a result of the mix of new equipment sold.
Used Equipment Sales Gross Profit. Our used equipment sales gross profit for the year ended December 31, 2017 increased $3.0 million, or 10.0%, to $33.2 million from $30.2 million in the same period in 2016 on an increase in used equipment sales of $10.4 million. Gross profit margin on used equipment sales for the year ended December 31, 2017 was 30.9%, down 0.2% from 31.1% for the same period last year, primarily as a result of the mix of used equipment sold. Our used equipment sales from the rental fleet, which comprised approximately 89.7% and 87.1% of our used equipment sales for the years ended December 31, 2017 and 2016, respectively, were approximately 149.6% and 152.4% of net book value for the years ended December 31, 2017 and 2016, respectively.
Parts Sales Gross Profit. For the year ended December 31, 2017, our parts sales revenue gross profit decreased $0.5 million, or 1.7%, to $29.7 million from $30.2 million for the same period in 2016 on a $1.8 million decrease in parts sales revenues. Gross profit margin on parts sales for the year ended December 31, 2017 was 27.6%, a decrease of 0.1% from 27.7% in the same period in 2016, as a result of the mix of parts sold.
Services Revenues Gross Profit. For the year ended December 31, 2017, our services revenues gross profit decreased approximately $1.1 million, or 2.5%, to $41.8 million from $42.8 million for the same period in 2016 on a $1.8 million decrease in services revenues. Gross profit margin on services revenues for the year ended December 31, 2017 was 66.4%, up 0.2% from 66.2% in the same period in 2016, as a result of services revenues mix.
Non-Segmented Other Revenues Gross Profit. Our non-segmented other revenues gross profit increased approximately $0.6 million to $0.8 million for the year ended December 31, 2017 from $0.2 million for the same period in 2016 on a $4.6 million increase in non-segmented other revenues. Gross margin for the year ended December 31, 2017 was 1.2% compared to a gross margin of 0.3% in the same period last year, an increase of 0.9%, primarily reflective of improved margins on hauling revenues compared to last year.
Selling, General and Administrative Expenses. SG&A expenses increased $4.7 million, or 2.0%, to $232.8 million for the year ended December 31, 2017 compared to $228.1 million for the year ended December 31, 2016. The increase in SG&A expenses was attributable to several factors. Employee salaries, wages, payroll taxes, employee benefit expenses and other employee costs increased approximately $7.6 million, primarily as a result of a larger workforce compared to the same period last year, an increase in incentive compensation associated with our increase in current year revenues, and higher employer health insurance costs. Facility costs increased $1.6 million, comprised primarily of additional rent expense related to new branches opened since the fourth quarter of last year. Bad debt expense increased $0.9 million, while supplies expense and other general corporate overhead expenses increased $0.5 million. Partially offsetting these increases was a $4.1 million decrease in depreciation and amortization expense due to lower software amortization costs. Legal, professional and other service fees decreased $1.1 million. General liability insurance costs decreased $0.7 million.
Branches opened since January 1, 2016 with less than twelve full months of comparable operations in 2016 and 2017 contributed $3.6 million to the increase in our SG&A for the year ended December 31, 2017.
As a percentage of total revenues, SG&A expenses were 22.6% for the year ended December 31, 2017, a decrease of 0.7% from 23.3% for the same period last year, primarily as a result of the increase in 2017 total revenues.
Other Income (Expense). For the year ended December 31, 2017, our net other expenses increased $26.8 million to $78.6 million, compared to $51.7 million in 2016. Included in Other Income (Expense) for the year ended December 31, 2017 is a $25.4 million loss on the early extinguishment of debt (see discussion immediately below regarding the issuance of the New Notes). Interest expense was $55.0 million for the year ended December 31, 2017 compared to $53.6 million for the year ended December 31, 2016, an increase of $1.4 million. The increase in interest expense is primarily related to the timing of the issuance of the New Notes in relation to the redemption of the Old Notes. Our New Notes were issued on August 24, 2017, while approximately $300.3 million of the Old
39
Notes remained outstanding until the September 25, 2017 redemption date. Miscellaneous other income was $1.8 million for the year ended December 31, 2017 compared to $1.9 million last year, a decrease of $0.1 million.
Loss on Early Extinguishment of Debt. As more fully described in note 9 to our consolidated financial statements included elsewhere in this Annual Report on Form 10-K, we recorded a one-time loss on the early extinguishment of debt in the year ended December 31, 2017 of approximately $25.4 million, reflecting payment of $12.8 million of tender premiums associated with our repurchase of the Old Notes and $10.5 million of premiums in accordance with the indenture governing the Old Notes to redeem the remaining untendered Old Notes, combined with the write off of approximately $2.0 million of unamortized note premium, unaccreted note discount and unamortized deferred financing costs, in each case, related to the Old Notes.
Merger Breakup Fee, net of Merger Costs. As more fully described in note 3 to our consolidated financial statements included elsewhere in this Annual Report on Form 10-K, pursuant to the terms of our terminated merger agreement with Neff Corporation (“Neff”), in August 2017 we received a $13.2 million breakup fee concurrently with Neff’s termination of the merger agreement. Merger fees related to the proposed Neff merger totaled $6.5 million and estimated merger fees for the year ended December 31, 2017 associated with our acquisition of CEC in January 2018 totaled $0.8 million, resulting in net breakup fees of approximately $5.8 million for the year ended December 31, 2017.
Income Taxes. We recorded an income tax benefit of approximately $50.3 million for the year ended December 31, 2017 compared to income tax expense of approximately $21.9 million for the year ended December 31, 2016. On December 22, 2017, the Act was signed into law. Under ASC 740, the effects of changes in tax rates and laws are recognized in the period in which the new legislation is enacted. With respect to U.S. federal income taxes, the enactment date is the date the bill becomes law (i.e. upon presidential signature). Therefore, we recorded in the fourth quarter of 2017 a one-time decrease in income tax expense of $66.9 million from the re-measurement of our deferred tax assets and liabilities resulting from the decrease in the corporate federal income tax rate from 35% to 21% under the Act.
Based on available evidence, both positive and negative, we believe it is more likely than not that our federal deferred tax assets at December 31, 2017 are fully realizable through future reversals of existing taxable temporary differences and future taxable income, and are not subject to any limitations. However, for the year ended December 31, 2017, we increased our valuation allowance by $0.5 million for certain state net operating losses that may not be utilized.
Year Ended December 31, 2016 Compared to the Year Ended December 31, 2015
Revenues.
|
|
|
For the Year Ended |
|
|
Total |
|
|
Total |
|
|||||||
|
|
|
December 31, |
|
|
Dollar |
|
|
Percentage |
|
|||||||
|
|
|
2016 |
|
|
2015 |
|
|
Increase (Decrease) |
|
|
Increase (Decrease) |
|
||||
|
|
|
(in thousands, except percentages) |
|
|||||||||||||
|
Segment revenues: |
|
|
|
|
|
|
|
|
|
|
|
|
|
|
|
|
|
Equipment rentals |
|
$ |
445,227 |
|
|
$ |
443,024 |
|
|
$ |
2,203 |
|
|
|
0.5 |
% |
|
New equipment sales |
|
|
196,688 |
|
|
|
238,172 |
|
|
|
(41,484 |
) |
|
|
(17.4 |
)% |
|
Used equipment sales |
|
|
96,910 |
|
|
|
118,338 |
|
|
|
(21,428 |
) |
|
|
(18.1 |
)% |
|
Parts sales |
|
|
109,147 |
|
|
|
111,133 |
|
|
|
(1,986 |
) |
|
|
(1.8 |
)% |
|
Services revenues |
|
|
64,673 |
|
|
|
63,954 |
|
|
|
719 |
|
|
|
1.1 |
% |
|
Non-Segmented other revenues |
|
|
65,492 |
|
|
|
65,210 |
|
|
|
282 |
|
|
|
0.4 |
% |
|
Total revenues |
|
$ |
978,137 |
|
|
$ |
1,039,831 |
|
|
$ |
(61,694 |
) |
|
|
(5.9 |
)% |
Total Revenues. Our total revenues were $978.1 million for the year ended December 31, 2016 compared to approximately $1.04 billion for the year ended December 31, 2015, a decrease of $61.7 million, or 5.9%. Revenues for our reportable segments and non-segmented other revenues are further discussed below.
Equipment Rental Revenues. Our revenues from equipment rentals for the year ended December 31, 2016 increased $2.2 million, or 0.5%, to $445.2 million from $443.0 million in 2015. Rental revenues from earthmoving equipment increased approximately $3.3 million, while rental revenues from aerial work platform equipment increased $3.1 million. Other equipment rentals revenues increased $2.5 million, while lift truck rental revenues increased $0.4 million. Partially offsetting these increases in equipment rental revenues was a $7.1 million decrease in crane rental revenues. Our average rental rates for the year ended December 31, 2016 decreased 0.6% compared to the year ended December 31, 2015.
40
Rental equipment dollar utilization (annual rental revenues divided by the average original rental fleet equipment costs) for the year ended December 31, 2016 decreased 0.6% to 34.0% from 34.6% in 2015. The decrease in comparative rental equipment dollar utilization was the result of a decrease in rental equipment time utilization, combined with a 0.6% decline in average rental rates. Rental equipment time utilization as a percentage of original equipment cost was 69.7% for the year ended December 31, 2016 compared to approximately 70.9% for the year ended December 31, 2015, a decrease of 1.2%. The decrease in equipment rental time utilization based on original equipment cost is largely reflective of multiple significant rain and flooding events in the Company’s Louisiana, Texas and Arkansas markets during 2016 combined with lower utilization in the Company’s oil and gas markets. Rental equipment time utilization based on the number of rental equipment units available for rent was 67.0% for the year ended December 31, 2016, compared to approximately 67.9% for year ended December 31, 2015, a decrease of 0.9%.
New Equipment Sales Revenues. Our new equipment sales for the year ended December 31, 2016 decreased $41.5 million, or 17.4%, to $196.7 million from $238.2 million in 2015 as new crane sales decreased $50.5 million. The decrease in new crane sales was due primarily to decreased demand for new cranes among the Company’s customers operating in the oil and gas markets. Sales of new other equipment decreased $5.2 million and sales of new aerial work platform equipment decreased $0.8 million. Partially offsetting these decreases in new equipment sales were a $14.7 million increase in new earthmoving equipment sales and a $0.3 million increase in new lift truck sales.
Used Equipment Sales Revenues. Our used equipment sales decreased $21.4 million, or 18.1%, to $96.9 million for the year ended December 31, 2016, from $118.3 million for the same period in 2015. Sales of used cranes decreased $14.3 million and sales of used aerial work platform equipment decreased $7.3 million. Used other equipment sales decreased $1.3 million and used earthmoving equipment sales decreased $0.1 million, respectively. Partially offsetting these decreases was an increase in sales of used lift trucks of $1.6 million. The overall decrease in used equipment sales is largely due to a decrease in sales of used equipment from the Company’s rental equipment fleet in 2016 compared to 2015.
Parts Sales Revenues. Our parts sales revenues decreased $2.0 million, or 1.8%, to $109.1 million for the year ended December 31, 2016 from $111.1 million for the same period in 2015. The decrease in parts revenues was driven primarily by lower crane and earthmoving parts sales revenues.
Services Revenues. Our services revenues for the year ended December 31, 2016 increased $0.7 million, or 1.1%, to $64.7 million from $64.0 million in 2015. The increase was primarily due to higher services revenue related to aerial work platform equipment and earthmoving equipment.
Non-Segmented Other Revenues. Our non-segmented other revenues consisted primarily of equipment support activities including transportation, hauling, parts freight and damage waiver charges. For the year ended December 31, 2016, our other revenues were $65.5 million, an increase of approximately $0.3 million, or 0.4%, from $65.2 million in 2015. The increase was primarily due to an increase in damage waiver income.
Gross Profit.
|
|
|
For the Year Ended |
|
|
|
|
|
|
Total |
|
||||||
|
|
|
December 31, |
|
|
Total Dollar |
|
|
Percentage |
|
|||||||
|
|
|
2016 |
|
|
2015 |
|
|
Change Increase (Decrease) |
|
|
Change Increase (Decrease) |
|
||||
|
|
|
(in thousands, except percentages) |
|
|||||||||||||
|
Segment Gross Profit: |
|
|
|
|
|
|
|
|
|
|
|
|
|
|
|
|
|
Equipment rentals |
|
$ |
211,118 |
|
|
$ |
208,985 |
|
|
$ |
2,133 |
|
|
|
1.0 |
% |
|
New equipment sales |
|
|
21,132 |
|
|
|
25,937 |
|
|
|
(4,805 |
) |
|
|
(18.5 |
)% |
|
Used equipment sales |
|
|
30,172 |
|
|
|
37,000 |
|
|
|
(6,828 |
) |
|
|
(18.5 |
)% |
|
Parts sales |
|
|
30,181 |
|
|
|
30,303 |
|
|
|
(122 |
) |
|
|
(0.4 |
)% |
|
Services revenues |
|
|
42,834 |
|
|
|
42,261 |
|
|
|
573 |
|
|
|
1.4 |
% |
|
Non-Segmented revenues |
|
|
174 |
|
|
|
1,246 |
|
|
|
(1,072 |
) |
|
|
(86.0 |
)% |
|
Total gross profit |
|
$ |
335,611 |
|
|
$ |
345,732 |
|
|
$ |
(10,121 |
) |
|
|
(2.9 |
)% |
Total Gross Profit. Our total gross profit was $335.6 million for the year ended December 31, 2016 compared to $345.7 million for the year ended December 31, 2015, a decrease of $10.1 million, or 2.9%. Total gross profit margin for the year ended December 31, 2016 was approximately 34.3%, an increase of 1.1% from the 33.2% gross profit margin for the same period in 2015. Gross profit and gross margin for all reportable segments and non-segmented other revenues are further described below.
41
Equipment Rentals Gross Profit. Our gross profit from equipment rentals for the year ended December 31, 2016 increased $2.1 million, or 1.0%, to $211.1 million from $209.0 million in 2015. The increase in equipment rentals gross profit was the result of a $2.2 million increase in rental revenues for the year ended December 31, 2016 and a $0.2 million decrease in rental expenses, which was partially offset by a $0.3 million increase in equipment rental depreciation expense. Gross profit margin on equipment rentals for the year ended December 31, 2016 was approximately 47.4% compared to 47.2% for the same period in 2015, an increase of 0.2%. Depreciation expense was 36.5% of equipment rental revenues for the year ended December 31, 2016 compared to 36.6% for the same period in 2015, a decrease of 0.1%. As a percentage of equipment rental revenues, rental expenses were 16.1% for the year ended December 31, 2016 compared to approximately 16.3% for the same period in 2015, a decrease of 0.2%.
New Equipment Sales Gross Profit. Our new equipment sales gross profit for the year ended December 31, 2016 decreased $4.8 million, or 18.5%, to $21.1 million compared to $25.9 million for the same period in 2015 on a decrease in total new equipment sales of $41.5 million. Gross profit margin on new equipment sales for the year ended December 31, 2016 was 10.7%, a decrease of 0.2% from 10.9% in the same period in 2015, as a result of the mix of new equipment sold.
Used Equipment Sales Gross Profit. Our used equipment sales gross profit for the year ended December 31, 2016 decreased $6.8 million, or 18.5%, to $30.2 million from $37.0 million in the same period in 2015 on a decrease in used equipment sales of $21.4 million. Gross profit margin on used equipment sales for the year ended December 31, 2016 was 31.1%, down 0.2% from 31.3% for the same period in 2015, primarily as a result of the mix of used equipment sold. Our used equipment sales from the rental fleet, which comprised approximately 87.1% and 84.1% of our used equipment sales for the years ended December 31, 2016 and 2015, respectively, were approximately 152.4% and 154.5% of net book value for the years ended December 31, 2016 and 2015, respectively.
Parts Sales Gross Profit. For the year ended December 31, 2016, our parts sales revenue gross profit decreased $0.1 million, or 0.4%, to $30.2 million from $30.3 million for the same period in 2015 on a $2.0 million decrease in parts sales revenues. Gross profit margin on parts sales for the year ended December 31, 2016 was 27.7%, an increase of 0.4% from 27.3% in the same period in 2015, as a result of improved crane parts margins.
Services Revenues Gross Profit. For the year ended December 31, 2016, our services revenues gross profit increased $0.6 million, or 1.4%, to $42.8 million from $42.3 million for the same period in 2015 on a $0.7 million increase in services revenues. Gross profit margin on services revenues for the year ended December 31, 2016 was 66.2%, up 0.1% from 66.1% in the same period in 2015.
Non-Segmented Other Revenues Gross Profit. Our non-segmented other revenues gross profit decreased $1.1 million, or 86.0%, to $0.2 million for the year ended December 31, 2016 from approximately $1.3 million for the same period in 2015 on a $0.3 million increase in non-segmented other revenues. Gross margin for the year ended December 31, 2016 was 0.3% compared to a gross margin of 1.9% in the same period in 2015, a decrease of 1.6%, primarily reflective of higher costs and lower margins on hauling revenues.
Selling, General and Administrative Expenses. SG&A expenses increased $7.9 million, or 3.6%, to $228.1 million for the year ended December 31, 2016 compared to $220.2 million for the year ended December 31, 2015. The increase in SG&A expenses was attributable to several factors. Employee salaries, wages, payroll taxes and related employee benefit expenses increased approximately $3.7 million, primarily as a result of a larger workforce compared to the same period in 2015 and higher employer health insurance costs. Facility costs increased $2.8 million, comprised primarily of additional rent expense related to new branches opened since the fourth quarter of 2015. Legal and other professional services increased $1.9 million and depreciation expense increased $1.0 million. Property taxes increased $0.7 million. Partially offsetting these increases was a $1.9 million decrease in employee education, training and related travel costs. Bad debt expense decreased $0.4 million. Of the $7.9 million increase in SG&A expenses, approximately $6.3 million was attributable to branches opened since December 31, 2014 with less than 12 full months of comparable operations in either or both of the years ended December 31, 2015 and 2016. As a percentage of total revenues, SG&A expenses were 23.3% for the year ended December 31, 2016, an increase of 2.1% from 21.2% for the same period in 2015, primarily as a result of the decrease in total revenues for the year ended December 31, 2016 (driven primarily by the decrease in new and used equipment sales revenues) combined with the increase in costs noted above.
Other Income (Expense). For the year ended December 31, 2016, our net other expenses decreased $0.8 million to $51.7 million compared to approximately $52.5 million for the same period in 2015. Interest expense was $53.6 million for the year ended December 31, 2016 compared to $54.0 million for the same period in 2015, a decrease of $0.4 million. The decrease in interest expense is due to lower average borrowings under the Company’s Senior Secured Credit Facility and lower average amounts outstanding on manufacturer flooring plans payable during the year ended December 31, 2016 compared to the same period in 2015. Miscellaneous other income was $1.9 million for the year ended December 31, 2016 compared to $1.5 million for the same period in 2015, an increase of $0.4 million.
42
Income Taxes. We recorded income tax expense of approximately $21.9 million for the year ended December 31, 2016 compared to income tax expense of approximately $31.4 million for the year ended December 31, 2015. Our effective income tax rate was approximately 37.0% for the year ended December 31, 2016 compared to 41.5% for the same period in 2015, a decrease of 4.5%. The decrease in our effective tax rate is primarily due to a decrease in our blended state income tax rate, realized in the fourth quarter of 2016, resulting from changes in apportionment factors and state statutory income tax rates. Based on available evidence, both positive and negative, we believe it is more likely than not that our federal deferred tax assets at December 31, 2016 are fully realizable through future reversals of existing taxable temporary differences and future taxable income, and are not subject to any limitations. For the year ended December 31, 2016, a valuation allowance of $0.2 million was created for certain state net operating losses expiring soon that may not be utilized.
Liquidity and Capital Resources
Cash Flow from Operating Activities. For the year ended December 31, 2017, the cash provided by our operating activities was $226.2 million. Our reported net income of $109.7 million, when adjusted for non-cash income and expense items, such as depreciation and amortization, (including net amortization (accretion) of note discount (premium)), deferred income taxes, provision for losses on accounts receivable, provision for inventory obsolescence, stock-based compensation expense and net gains on the sale of long-lived assets, provided positive cash flows of $249.8 million. These cash flows from operating activities were also positively impacted by a $50.3 increase in accounts payable and an $8.2 million increase in accrued expenses and other liabilities. Partially offsetting these positive cash flows were a $40.0 million increase in receivables, a $31.8 million increase in inventories, an $8.8 million decrease in manufacturing flooring plans payable and a $1.7 million increase in prepared expenses and other assets.
For the year ended December 31, 2016, the cash provided by our operating activities was $177.0 million. Our reported net income of $37.2 million, when adjusted for non-cash income and expense items, such as depreciation and amortization, (including net amortization (accretion) of note discount (premium)), deferred income taxes, provision for losses on accounts receivable, provision for inventory obsolescence, stock-based compensation expense and net gains on the sale of long-lived assets, provided positive cash flows of $223.7 million. These cash flows from operating activities were also positively impacted by a $4.2 million decrease in receivables, a $4.3 million decrease in inventories, a $2.5 million decrease in prepaid expenses and other assets and a $1.7 million increase in accrued expenses and other liabilities. Partially offsetting these positive cash flows were a $27.3 million decrease in accounts payable, a $31.7 million decrease in manufacturing flooring plans payable, and a $0.3 million decrease in deferred compensation.
Cash Flow from Investing Activities. For the year ended December 31, 2017, cash provided by our investing activities was exceeded by cash used in our investing activities, resulting in net cash used in our investing activities of approximately $153.1 million. This was a result of purchases of rental and non-rental equipment totaling $256.7 million, which was partially offset by proceeds from the sale of rental and non-rental equipment of approximately $103.6 million.
For the year ended December 31, 2016, cash provided by our investing activities was exceeded by cash used in our investing activities, resulting in net cash used in our investing activities of approximately $114.4 million. This was a result of purchases of rental and non-rental equipment totaling $202.6 million, which was partially offset by proceeds from the sale of rental and non-rental equipment of approximately $88.2 million.
Cash Flow from Financing Activities. For the year ended December 31, 2017, the cash provided by our financing activities was approximately $85.1 million. Dividends totaling approximately $39.2 million, or $1.10 per common share, were paid during the year period ended December 31, 2017. Net payments under the Credit Facility were $162.6 million. Payments on capital lease obligations were $0.2 million. Purchases of treasury stock were $0.8 million. In connection with the redemption of our Old Notes, we paid $653.3 million, representing aggregate principal payments of $630.0 million and tender and redemption premiums totaling approximately $23.3 million. In connection with the issuance of our New Notes and Add-on Notes, we received net proceeds of $958.5 million. Deferred financing costs paid in connection with the New Notes and Add-on Notes as well as the Credit Facility totaled $17.3 million.
For the year ended December 31, 2016, cash provided by our financing activities was exceeded by cash used in our financing activities, resulting in net cash used in our financing activities of $62.0 million. Net payments under the Credit Facility totaled $22.2 million. We paid quarterly dividends in 2016 totaling $39.1 million. We purchased approximately $0.6 million of treasury stock. Capital lease payments totaled $0.2 million.
Senior Unsecured Notes
On August 24, 2017, we completed an offering of $750 million aggregate principal amount of 5.6250% senior notes due 2025 (the “New Notes”) and the settlement of a cash tender offer (the “Tender Offer”) with respect to our 7% senior notes due 2022 (the “Old Notes”). Net proceeds, after deducting $10.3 million of estimated offering expenses, from the sale of the New Notes totaled approximately $739.7 million. We used a portion of the net proceeds from the sale of the New Notes to repurchase $329.7 million of aggregate principal amount of the Old Notes in early settlement of the Tender Offer, which the Company launched on August 17,
43
2017. Holders who tendered their Old Notes prior to the early tender deadline received $1,038.90 per $1,000 principal amount of Old Notes tendered, plus accrued and unpaid interest up to, but not including, the payment date of August 24, 2017. Effective as of August 24, 2017, we (i) provided notice of the redemption of all remaining Old Notes that were not validly tendered in the Tender Offer at the expiration time and (ii) satisfied and discharged the indenture governing the Old Notes in accordance with its terms. On September 25, 2017, we redeemed the remaining $300.3 million principal amount outstanding of the Old Notes at a redemption price equal to 103.50% of the principal amount thereof, plus accrued and unpaid interest up to, but not including, the date of redemption.
The New Notes were issued at par and require semiannual interest payments on March 1st and September 1st of each year, commencing on March 1, 2018. No principal payments are due until maturity (September 1, 2025).
The New Notes are redeemable, in whole or in part, at any time on or after September 1, 2020 at specified redemption prices plus accrued and unpaid interest to the date of redemption. We may redeem up to 40% of the aggregate principal amount of the New Notes before September 1, 2020 with the net cash proceeds from certain equity offerings. We may also redeem the New Notes prior to September 1, 2020 at a specified “make-whole” redemption price plus accrued and unpaid interest to the date of redemption.
The New Notes rank equally in right of payment to all of our existing and future senior indebtedness and rank senior to any of our subordinated indebtedness. The New Notes are unconditionally guaranteed on a senior unsecured basis by all of our current and future significant domestic restricted subsidiaries. In addition, the New Notes are effectively subordinated to all of our and the guarantors’ existing and future secured indebtedness, including the Credit Facility, to the extent of the assets securing such indebtedness, and are structurally subordinated to all of the liabilities and preferred stock of any of our subsidiaries that do not guarantee the New Notes.
If we experience a change of control, we will be required to offer to purchase the New Notes at a repurchase price equal to 101% of the principal amount, plus accrued and unpaid interest to the date of repurchase.
The indenture governing the New Notes contains certain covenants that, among other things, limit our ability and the ability of our restricted subsidiaries to: (i) incur additional indebtedness, assume a guarantee or issue preferred stock; (ii) pay dividends or make other equity distributions or payments to or affecting our subsidiaries; (iii) purchase or redeem our capital stock; (iv) make certain investments; (v) create liens; (vi) sell or dispose of assets or engage in mergers or consolidations; (vii) engage in certain transactions with subsidiaries or affiliates; (viii) enter into sale-leaseback transactions; and (ix) engage in certain business activities. Each of the covenants is subject to exceptions and qualifications. As of December 31, 2017, we were in compliance with these covenants.
On November 22, 2017, we closed on an offering of $200 million aggregate principal amount of 5.625% senior notes due 2025 (the “Add-on Notes”) in an unregistered offering through a private placement. The Add-on Notes were priced at 104.25% of the principal amount. Net proceeds from the offering of the Add-on Notes, including accrued interest from August 24, 2017 totaled approximately $209.2 million. The net proceeds of the offering, was used to repay indebtedness outstanding under the Company’s existing senior secured credit facility (the “Credit Facility”) and for the payment of fees and expenses related to the offering. The remainder of the net proceeds will be used for general corporate purposes and to fund potential acquisitions in connection with our ongoing strategy of acquiring rental companies to complement our existing business and footprint.
The Add-on Notes were issued as additional notes under an indenture dated as of August 24, 2017, pursuant to which we previously issued the New Notes as described above. The Add-on Notes have identical terms to, rank equally with and form a part of a single class of securities with the New Notes.
Pursuant to a registration rights agreement entered into between us, the guarantors of the New Notes and the initial purchasers of the New Notes, we agreed to make an offer to exchange (the “Exchange Offer”) the New Notes and guarantees for registered, publicly tradable notes and guarantees that have terms identical in all material respects to the New Notes (except that the exchange notes will not contain any transfer restrictions) within a certain period of time following the completion of the offering. On January 17, 2018, the Company filed a registration statement on Form S-4 with respect to an offer to exchange the New and Add-on Notes and guarantees for registered, publicly tradable notes and guarantees that have terms identical in all material respects to the New and Add-on Notes (except that the exchange notes do not contain any transfer restrictions). This exchange offer is expected to launch and close in the first quarter of 2018.
Senior Secured Credit Facility
We and our subsidiaries are parties to a $750.0 million Credit Facility with Wells Fargo Capital Finance, LLC (as successor to General Electric Capital Corporation) as administrative agent, and the lenders named therein.
On December 22, 2017, we amended, extended and restated the Credit Facility by entering into the Fifth Amended and Restated Credit Agreement (the “Amended and Restated Credit Agreement”) by and among the Company, Great Northern Equipment, Inc., H&E Equipment Services (California), LLC, the other credit parties named therein, the lenders named therein, Wells Fargo Capital
44
Finance, LLC, as administrative agent, the other credit parties named therein, the lenders named therein, and the joint lead arrangers, joint book runners, co-syndication agents and documentation agent named therein.
The Amended and Restated Credit Agreement, among other things, (i) extends the maturity date of the credit facility from May 21, 2019 to December 22, 2022, (ii) increases the commitments under the senior secured asset based revolver provided for therein from $602.5 million to $750 million, (iii) increases the uncommitted incremental revolving capacity from $150 million to $250 million, (iv) provides that the unused line fee margin will be either 0.375% or 0.25%, depending on the Average Revolver Usage (as defined in the Amended and Restated Credit Agreement) of the borrowers, (v) lowers the interest rate (a) in the case of base rate revolving loans, to the base rate plus an applicable margin of 0.50% to 1.00% depending on the Average Availability (as defined in the Amended and Restated Credit Agreement) and (b) in the case of LIBOR revolving loans, to LIBOR (as defined in the Amended and Restated Credit Agreement) plus an applicable margin of 1.50% to 2.00%, depending on the Average Availability, (vi) lowers the margin applicable to the letter of credit fee to between 1.50% and 2.00%, depending on the Average Availability, and (vii) permits, subject to certain conditions, an unlimited amount of Permitted Acquisitions, Restricted Payments and prepayments of Indebtedness (in each case, as defined in the Amended and Restated Credit Agreement).
The Amended and Restated Credit Agreement continues to provide for, among other things, a $30 million letter of credit sub-facility, and a guaranty by certain of the Company’s subsidiaries of the obligations under the credit facility. In addition, the credit facility remains secured by substantially all of the assets of the Company and certain of its subsidiaries.
At December 31, 2017, we had no borrowings under the credit facility and we could borrow up to $742.3 million and remain in compliance with the debt covenants under the Company’s credit facility. At February 15, 2018, we had $742.3 million of available borrowings under our Credit Facility, net of a $7.7 million outstanding letter of credit.
Cash Requirements Related to Operations
Our principal sources of liquidity have been from cash provided by operating activities and the sales of new, used and rental fleet equipment, proceeds from the issuance of debt, and borrowings available under the Credit Facility. Our principal uses of cash have been to fund operating activities and working capital (including new and used equipment inventories), purchases of rental fleet equipment and property and equipment, fund payments due under facility operating leases and manufacturer flooring plans payable, and to meet debt service requirements. In the future, we may pursue additional strategic acquisitions and seek to open new start-up locations. We anticipate that the above described uses will be the principal demands on our cash in the future.
The amount of our future capital expenditures will depend on a number of factors including general economic conditions and growth prospects. Our gross rental fleet capital expenditures for the year ended December 31, 2017 were approximately $244.7 million, including $10.5 million of non-cash transfers from new and used equipment to rental fleet inventory. Our gross property and equipment capital expenditures for the year ended December 31, 2017 were $22.5 million. In response to changing economic conditions, we believe we have the flexibility to modify our capital expenditures by adjusting them (either up or down) to match our actual performance.
To service our debt, we will require a significant amount of cash. Our ability to pay interest and principal on our indebtedness (including the New Notes and the Add-on Notes, the Credit Facility and our other indebtedness), will depend upon our future operating performance and the availability of borrowings under the Credit Facility and/or other debt and equity financing alternatives available to us, which will be affected by prevailing economic conditions and conditions in the global credit and capital markets, as well as financial, business and other factors, some of which are beyond our control. Based on our current level of operations and given the current state of the capital markets, we believe our cash flow from operations, available cash and available borrowings under the Credit Facility will be adequate to meet our future liquidity needs for the foreseeable future. As of February 15, 2018, we had $742.3 million of available borrowings under the Credit Facility, net of a $7.7 million outstanding letter of credit.
We cannot provide absolute assurance that our future cash flow from operating activities will be sufficient to meet our long-term obligations and commitments. If we are unable to generate sufficient cash flow from operating activities in the future to service our indebtedness and to meet our other commitments, we will be required to adopt one or more alternatives, such as refinancing or restructuring our indebtedness, selling material assets or operations or seeking to raise additional debt or equity capital. Given current economic and market conditions, including the significant disruptions in the global capital markets, we cannot assure investors that any of these actions could be effected on a timely basis or on satisfactory terms or at all, or that these actions would enable us to continue to satisfy our capital requirements. In addition, our existing debt agreements, including the Credit Facility and the indenture governing the New Notes and the Add-on Notes, as well as any future debt agreements, contain or may contain restrictive covenants, which may prohibit us from adopting any of these alternatives. Our failure to comply with these covenants could result in an event of default which, if not cured or waived, could result in the acceleration of all of our debt.
45
On each of February 15, 2017, May 22, 2017, August 21, 2017 and November 8, 2017, the Company announced a quarterly dividend of $0.275 per share to stockholders of record, which were paid on March 10, 2017, June 16 2017, September 11, 2017 and December 11, 2017, respectively, totaling approximately $39.2 million. On February 19, 2018, the Company announced a quarterly dividend of $0.275 per share to stockholders of record as of the close of business on February 27, 2018, which is to be paid on March 9, 2018.
The Company intends to continue to pay regular quarterly cash dividends; however, the declaration of any subsequent dividends is discretionary and will be subject to a final determination by the Board of Directors each quarter after its review of, among other things, business and market conditions.
Seasonality
Although we believe our business is not materially impacted by seasonality, the demand for our rental equipment tends to be lower in the winter months. The level of equipment rental activities is directly related to commercial and industrial construction and maintenance activities. Therefore, equipment rental performance will be correlated to the levels of current construction activities. The severity of weather conditions can have a temporary impact on the level of construction activities. Adverse weather has a seasonal impact in parts of the markets we serve, including our Intermountain region, particularly in the winter months.
Equipment sales cycles are also subject to some seasonality with the peak selling period during the spring season and extending through the summer. Parts and services activities are typically less affected by changes in demand caused by seasonality.
Certain Information Concerning Off-Balance Sheet Arrangements
An off-balance sheet arrangement is any transaction, agreement or other contractual arrangement involving an unconsolidated entity under which a company has (1) made guarantees, (2) a retained or a contingent interest in transferred assets, (3) an obligation under derivative instruments classified as equity or (4) any obligation arising out of a material variable interest in an unconsolidated entity that provides financing, liquidity, market risk or credit risk support to the Company, or that engages in leasing, hedging or research and development arrangements with the Company.
We have no off-balance sheet arrangements as described above. Further, we do not have any relationships with unconsolidated entities or financial partnerships, such as entities often referred to as structured finance or special purpose entities, which would have been established for the purpose of facilitating off-balance sheet arrangements or other contractually narrow or limited purposes. We are, therefore, not materially exposed to any financing, liquidity, market or credit risk that could arise if we had engaged in such relationships. We have also evaluated our relationships with related parties and determined that none of the related party interests represent variable interest entities pursuant to ASC 810, Consolidation.
In the normal course of our business activities, we may lease real estate, rental equipment and non-rental equipment under operating leases. See “Contractual and Commercial Commitments” below.
Contractual and Commercial Commitments
Our contractual obligations and commercial commitments principally include obligations associated with our outstanding indebtedness and interest payments as of December 31, 2017.
|
|
|
Payments Due by Year |
|
|||||||||||||||||
|
|
|
Total |
|
|
2018 |
|
|
2019-2020 |
|
|
2021-2022 |
|
|
Thereafter |
|
|||||
|
|
|
(Amounts in thousands) |
|
|||||||||||||||||
|
Senior unsecured notes payable |
|
$ |
950,000 |
|
|
$ |
— |
|
|
$ |
— |
|
|
$ |
— |
|
|
$ |
950,000 |
|
|
Interest payments on senior unsecured notes (1) |
|
|
428,539 |
|
|
|
50,023 |
|
|
|
106,875 |
|
|
|
106,875 |
|
|
|
164,766 |
|
|
Credit Facility |
|
|
— |
|
|
|
— |
|
|
|
— |
|
|
|
— |
|
|
|
— |
|
|
Interest payments on Credit Facility (1) |
|
|
13,849 |
|
|
|
2,783 |
|
|
|
5,567 |
|
|
|
5,499 |
|
|
|
— |
|
|
Capital lease obligations (including interest) (2) |
|
|
1,963 |
|
|
|
333 |
|
|
|
666 |
|
|
|
456 |
|
|
|
508 |
|
|
Operating leases (3) |
|
|
180,707 |
|
|
|
20,171 |
|
|
|
39,896 |
|
|
|
34,662 |
|
|
|
85,978 |
|
|
Other long-term obligations (4) |
|
|
22,001 |
|
|
|
11,344 |
|
|
|
10,657 |
|
|
|
— |
|
|
|
— |
|
|
Total contractual cash obligations (5) |
|
$ |
1,597,059 |
|
|
$ |
84,654 |
|
|
$ |
163,661 |
|
|
$ |
147,492 |
|
|
$ |
1,201,252 |
|
46
(1)At December 31, 2017, we had no outstanding borrowing under the Credit Facility. Amounts in the table above represent the unused commitment fee (based on borrowing availability). Fees on the Credit Facility assume no borrowings through the term of the Credit Facility.
(2)This includes capital leases for which the related liability has been recorded (including interest) at the present value of future minimum lease payments due under the leases.
(3)This includes total operating lease rental payments having initial or remaining non-cancelable lease terms longer than one year.
(4)Represents amounts due on manufacturer flooring plans payable, which are used to finance our purchases of inventory and rental equipment.
(5)We had an unrecognized tax benefit of approximately $0.1 million at December 31, 2017, which is not included in the table that relates to state income taxes and would require tax payments should the state taxing authorities determine and asses any tax liability with respect to the benefit.
As of December 31, 2017, we had a standby letter of credit issued under our Credit Facility totaling $7.7 million. On January 1, 2018, we renewed the letter of credit for $7.7 million for a one-year term, expiring on January 1, 2019.
Inflation
Although we cannot accurately anticipate the effect of inflation on our operations, we believe that inflation has not had for the three most recent fiscal years ended, and is not likely in the foreseeable future to have, a material impact on our results of operations.
Acquisitions and Start-up Facilities
We periodically engage in evaluations of potential acquisitions and start-up facilities. We intend to continue to evaluate and pursue, on an opportunistic basis, acquisitions which meet our selection criteria, and we are focused on identifying and acquiring rental companies to complement our existing business, broaden our geographic footprint, and increase our density in existing markets. Recently, on January 4, 2018, we announced the completion of our acquisition of Contractors Equipment Center, an equipment rental company serving the greater Denver, Colorado area with three branch locations, for approximately $124.0 million in cash. On January 29, 2018, we announced the entry into a definitive agreement to acquire Rental Inc., an equipment rental company with five branch locations in Alabama and Florida, for approximately $68.6 million in cash. This transaction is subject to customary closing conditions and is expected to close during the first quarter of 2018.
The success of our growth strategy depends, in part, on selecting strategic acquisition candidates at attractive prices and identifying strategic start-up locations. We expect to face competition for acquisition candidates, which may limit the number of acquisition opportunities and lead to higher acquisition costs. We may not have the financial resources necessary to consummate any acquisitions or to successfully open any new facilities in the future or the ability to obtain the necessary funds on satisfactory terms. For further information regarding our risks related to acquisitions, see Item 1A – Risk Factors of this Annual Report on Form 10-K.
47
Recent Accounting Pronouncements
In May 2014, the Financial Accounting Standards Board (“FASB”) issued Accounting Standards Update (“ASU”) No. 2014-09, Revenue from Contracts with Customers (Topic 606), which will supersede Accounting Standards Codification (“ASC”) Topic 605, Revenue Recognition, and other legacy industry-specific revenue recognition guidance. In August 2015, the FASB deferred the effective date of this new standard by one year. The FASB later issued ASU No. 2016-08, Revenue from Contracts with Customers (Topic 606) – Principal versus Agent Considerations, in March 2016, ASU No. 2016-10, Revenue from Contracts with Customers (Topic 606) – Identifying Performance Obligations and Licensing, in April 2016, ASU 2016-12, Revenue from Contracts with Customers (Topic 606) – Narrow-Scope Improvements and Practical Expedients, in May 2016, and ASU 2016-20, Technical Corrections and Improvements to Topic 606, Revenue from Contracts with Customers, in December 2016, all of which further clarified aspects of Topic 606.
Topic 606 clarifies the principles for revenue recognition. Topic 606 requires an entity to recognize revenue when it transfers promised goods or services to customers in an amount that reflects the consideration to which the entity expects to be entitled in exchange for those goods or services. In doing so, entities will need to use more judgment and make more estimates than under current guidance. These judgments and estimates may include identifying performance obligations in the contract, estimating the amount of variable consideration to include in the transaction price and allocating the transaction price to each separate performance obligation. Topic 606 also requires an entity to disclose sufficient qualitative and quantitative information surrounding the nature, amount, timing and uncertainty of revenue and cash flows arising from contracts with customers. Topic 606 permits the use of either a retrospective application to each prior period presented or retrospective application with the cumulative effect of initially applying Topic 606 at the date of adoption. Topic 606 will become effective for fiscal years, and interim periods within those fiscal years, beginning after December 15, 2017. We will adopt Topic 606 as of January 1, 2018 using a full retrospective application to each prior period presented. Below is our evaluation of the impact from the adoption of Topic 606.
Revenues from equipment rentals accounted for 46.5% of our total revenues for the year ended December 31, 2017. Based on our analysis of Topic 606, we have determined that the accounting for equipment rental revenues is outside the scope of Topic 606. Therefore, upon our adoption of the new revenue recognition guidance on January 1, 2018, we will recognize our revenues pursuant to two different accounting standards. Revenues from equipment rentals will continue to be accounted for pursuant to current lease accounting guidance until our adoption of the new lease accounting standard in 2019 (as further discussed below in the Topic 842 pending lease accounting guidance), while revenues from new and used equipment sales, parts and services revenues and other revenues will be subject to Topic 606 upon adoption and are further described below.
Sales of new and used equipment accounted for 30.2% of our total revenues for the year ended December 31, 2017. Parts and services revenues comprised 16.5% of our total revenues for the year ended December 31, 2017. The primary impact to these revenue streams from the adoption of Topic 606 will relate to the accounting treatment of shipping and handling revenues, some of which shipping and handling revenues we currently include in other revenues in our consolidated statements of income. Other revenues comprised approximately 6.8% of our total revenues for the year ended December 31, 2017.
Pursuant to Topic 606, shipping and handling activities that are performed before the customer obtains control of the good are not a separate promised service to the customer. Rather, shipping and handling activities fulfill an entity’s promise to transfer the good. While the timing of our revenue recognition related to our shipping and handling activities, such as hauling revenues related to new and used equipment sales, maintenance and repair services, as well as parts freight, will not change upon adoption of the new guidance, we believe that Topic 606 requires revenues related to shipping and handling activities to be treated as fulfillment activities when the customer obtains control of the good after the shipping and handling activities are performed. In such contract arrangements, shipping and handling revenues will be included and presented within our respective segmented revenues consolidated statement of income line items rather than in our non-segmented other revenues line item. Related shipping and handling costs included in the non-segmented other costs of revenues line item in our consolidated statements of income should likewise be conformed and presented within our respective segment costs of revenues line items.
While this change will only impact how our shipping and handling activities are presented within our revenues (and costs of revenues) line items within the consolidated statements of income and does not impact total revenues or total costs of revenues, this change will impact the calculated gross profit (and gross margin) for our segmented and non-segmented revenues in comparison to how we have historically calculated those measures. Shipping and handling type revenues included in other revenues were approximately $7.9 million for the year ended December 31, 2017, or approximately 0.7% of total revenues.
Implementing the above changes to our financial reporting processes will not result in a material change to our internal controls over financial reporting.
48
With respect to shipping and handling activities related to our equipment rental operations, we have determined that such hauling activities are a separate performance obligation as control passes to the customer when the rental equipment leaves our facility. Therefore, we will continue to account for our rental equipment hauling activities as a separate performance obligation, resulting in no change to our historical presentation of hauling activities in other revenues (and other costs of revenues) in our consolidated statements of income.
In February 2016, the FASB issued ASU 2016-02, Leases (Topic 842) (“ASU 2016-02”). The new standard is intended to provide enhanced transparency and comparability by requiring lessees to record right-of-use assets and corresponding lease liabilities on the balance sheet, with the exception of leases with a term of 12 months or less, which permits a lessee to make an accounting policy election by class of underlying asset not to recognize lease assets and liabilities. At inception, lessees must classify leases as either finance or operating based on five criteria. Balance sheet recognition of finance and operating leases is similar, but the pattern of expense recognition in the income statement, as well as the effect on the statement of cash flows, differs depending on the lease classification. Also, certain qualitative and quantitative disclosures are required to enable users of financial statements to assess the amount, timing and uncertainty of cash flows arising from leases. ASU 2016-02 is effective for fiscal years beginning after December 15, 2018, including interim periods within those fiscal years, and early adoption is permitted. We will adopt ASU 2016-02 as of January 1, 2019. The new standard requires the recognition and measurement of leases at the beginning of the earliest period presented using a modified retrospective approach, which includes a number of optional practical expedients that entities may elect to apply.
Our operating leases include the real estate where all but 11 of our 80 branch locations are located as of December 31, 2017. Additionally, the Company leases numerous types of non-rental equipment. Given the size of our lease portfolio, we expect that the new standard will have a material effect on our consolidated balance sheets as a result of recognizing new right-of-use assets and lease liabilities for our existing operating leases. We have begun accumulating the information related to these leases but have not completed our comprehensive analysis of those leases and are unable to quantify the impact to our consolidated financial statements at this time. We are also concurrently evaluating our internal processes and controls over financial reporting with respect to the impact that the new lease standard will have on our lease administration activities.
As mentioned in the Topic 606 discussion above, our equipment rental business involves rental agreements with customers whereby we are the lessor in the transaction and therefore, we believe that such transactions are subject to the lessor accounting guidance of Topic 842. While our evaluation of ASU 2016-02 is ongoing with respect to our equipment rental activities, we have tentatively concluded that no significant changes are expected to the accounting for our rental equipment revenues, as substantially all of our rental agreements with customers will continue to be treated as operating leases under the new standard. Accordingly, we do not expect material changes to our related rental agreement accounting processes or internal controls.
In June 2016, the FASB issued ASU 2016-13, “Financial Instruments - Credit Losses (Topic 326): Measurement of Credit Losses on Financial Instruments” (“ASU 2016-13”). This standard adds to U.S. GAAP an impairment model (known as the current expected credit loss (“CECL”) model) that is based on expected losses rather than incurred losses. Under the new guidance, an entity recognizes as an allowance its estimate of expected credit losses, which is intended to result in the more timely recognition of losses. Under the CECL model, entities will estimate credit losses over the entire contractual term of the instrument (considering estimated prepayments, but not expected extensions or modifications) from the date of initial recognition of the financial instrument. Measurement of expected credit losses are to be based on relevant forecasts that affect collectability. The scope of financial assets within the CECL methodology is broad and includes trade receivables from revenue transactions and certain off-balance sheet credit exposures. Different components of the guidance require modified retrospective or prospective adoption. ASU 2016-13 will be effective for us as of January 1, 2020. While our review is ongoing, we believe ASU 2016-13 will only have applicability to our trade accounts receivables. While we believe that our current methodology for estimating the allowance for doubtful accounts on our trade accounts receivables is reasonable, we have not concluded whether the application of the CECL model, when compared to our current methodology, will have a material impact to our allowance for doubtful accounts.
In August 2016, the FASB issued ASU 2016-15, “Classification of Certain Cash Receipts and Cash Payments”, which aims to eliminate the diversity in the presentation of certain cash receipts and cash payments presented and classified in the statement of cash flows. The guidance addresses the following specific cash flow issues: (1) debt prepayment or debt extinguishment costs, (2) settlement of zero-coupon debt instruments or other debt instruments with coupon interest rates that are insignificant in relation to the effective interest rate of the borrowing, (3) contingent consideration payments made after a business combination, (4) proceeds from the settlement of insurance claims, (5) proceeds from settlement of corporate-owned life insurance policies, including bank-owned life insurance policies, (6) distributions received from equity method investees, (7) beneficial interests in securitization transitions and (8) separately identifiable cash flows and application of predominance principle. The guidance will be effective for fiscal years and interim periods beginning after December 15, 2017. The guidance requires retrospective adoption. We expect to adopt this guidance when effective, and do not expect the guidance to have a significant impact on our consolidated financial statements.
In January 2017, the FASB issued ASU No. 2017-01, Business Combinations (Topic 805): Clarifying the Definition of a Business (“ASU 2017-01”). ASU 2017-01 clarifies the definition of a business when evaluating whether transactions should be accounted for
49
as acquisitions (or disposals) of assets or businesses. ASU 2017-01 is effective for annual reporting periods, and interim periods therein, beginning after December 15, 2017, and interim periods within those annual periods. Based upon our review of ASU 2017-01, the Company does not expect the adoption of this guidance to have a material impact on its consolidated financial statements.
In January 2017, the FASB issued ASU No. 2017-04, Intangibles—Goodwill and Other (Topic 350): Simplifying the Test for Goodwill Impairment (“ASU 2017-04”), which removes Step 2 of the goodwill impairment test. A goodwill impairment will now be determined by the amount by which a reporting unit’s carrying value exceeds its fair value, not to exceed the carrying amount of goodwill. ASU 2017-04 is effective for annual reporting periods, and interim periods therein, beginning after December 15, 2019, with early adoption permitted. Based upon our review of ASU 2017-04, we do not expect the guidance to have a material impact on our consolidated financial statements.
Recent Accounting Pronouncements Adopted in the First Quarter of 2017
In July 2015, the FASB issued ASU 2015-11, Inventory: Simplifying the Measurement of Inventory (“ASU 2015-11”). ASU 2015-11 provides guidance on simplifying the measurement of inventory. The previous standard measured inventory at lower of cost or market; where market could be replacement cost, net realizable value, or net realizable value less an approximately normal profit margin. ASU 2015-11 updated this guidance to measure inventory at the lower of cost or net realizable value; where net realizable value is considered to be the estimated selling price in the ordinary course of business, less reasonably predictable cost of completion, disposal and transportation. We adopted ASU 2015-11 on January 1, 2017 on a prospective basis. The adoption of ASU 2015-11 did not result in a material impact on our financial position, results of operations, or cash flows for the year ended December 31, 2017.
In March 2016, the FASB Issued ASU No. 2016-06, Derivatives and Hedging (Topic 815): Contingent Put and Call Options in Debt Instruments (“ASU 2016-06”). The amendments in ASU 2016-06 clarify what steps are required when assessing whether the economic characteristics and risks of call (put) options are clearly and closely related to the economic characteristics and risks of their debt hosts, which is one of the criteria for bifurcating an embedded derivative. ASU 2016-06 became effective for us on January 1, 2017 and did not have a material impact on our financial position, results of operations, or cash flows for the year ended December 31, 2017.
In March 2016, the FASB Issued ASU No. 2016-09, Compensation-Stock Compensation (Topic 718): Improvements to Employee Share-Based Payment Accounting (“ASU 2016-09”). The updated guidance changed how companies previously accounted for certain aspects of stock-based payment awards to employees, including the accounting for income taxes, forfeitures, and statutory tax withholding requirements, as well as classification of such awards in the statement of cash flows. ASU 2016-09 became effective for us on January 1, 2017. ASU 2016-09 requires that excess tax benefits and deficiencies resulting from the vesting or exercise of stock-based compensation awards to be recognized in the income statement on a prospective basis. Previously, these amounts were recognized in additional paid-in capital. Accordingly, excess tax benefits of approximately $0.1 million were recognized as a discrete item in our income tax expense in the three month period and year ended December 31, 2017. In addition, ASU 2016-09 requires excess tax benefits and deficiencies to be excluded from the assumed future proceeds in the calculation of diluted shares. This change did not have a material impact to the calculation of weighted average shares outstanding for the year ended December 31, 2017.
ASU 2016-09 eliminated the prior guidance requirement that allowed under certain circumstances the realization of excess tax benefits prior to recognition of those excess tax benefits. Under prior guidance, companies could not recognize excess tax benefits when an option was exercised or a share vested if the related tax deduction increased a net operating loss carryforward rather than reduced income taxes payable. ASU 2016-09 requires companies to apply this part of the guidance using a modified retrospective transition method and record a cumulative effect adjustment for previously unrecognized excess tax benefits. Accordingly, we recorded a cumulative effect adjustment to accumulated deficit as of January 1, 2017 of approximately $0.9 million for all excess tax benefits that had not been previously recognized because the related tax deduction had not reduced income taxes payable.
ASU 2016-09 also clarified that an entity should classify excess tax benefits along with other income tax cash flows as an operating activity in the statement of cash flows. This change eliminates the prior practice of grossing up the statement of cash flows for the effect of windfalls, i.e. reporting windfalls as outflows in operating activities and as inflows in financing activities. Under ASU 2016-09, the effect of windfalls will generally be reflected in net income from continuing operations under the indirect method. We have adopted this portion of the guidance on a retrospective basis. ASU 2016-09 also clarifies that employee taxes paid when an employer withholds shares of stock for tax withholding purposes be reported as financing activities in the consolidated statements of cash flows, which is how the Company has historically presented such activities in our statement of cash flows.
We have elected to continue to estimate the number of stock-based awards expected to vest, as permitted by ASU 2016-09, rather than electing to account for forfeitures as they occur. Additional amendments to the accounting for statutory withholding tax requirements had no impact on our consolidated financial statements.
50
Our earnings may be affected by changes in interest rates since interest expense on the Credit Facility is currently calculated based upon the index rate plus an applicable margin of 0.50% to 1.00%, depending on the leverage ratio, in the case of index rate revolving loans and LIBOR plus an applicable margin of 1.50% to 2.00%, depending on the leverage ratio, in the case of LIBOR revolving loans. At December 31, 2017, we had no borrowings outstanding under the credit facility At February 15, 2018, we had $742.3 million of available borrowings under the Credit Facility, net of a $7.7 million outstanding letter of credit. We did not have significant exposure to changing interest rates as of December 31, 2017 on the fixed-rate New Notes and Add-on Notes. Historically, we have not engaged in derivatives or other financial instruments for trading, speculative or hedging purposes, though we may do so from time to time if such instruments are available to us on acceptable terms and prevailing market conditions are accommodating.
51
Item 8.Financial Statements and Supplementary Data
Index to consolidated financial statements of H&E Equipment Services, Inc. and Subsidiaries
See note 17 to the consolidated financial statements for summarized quarterly financial data.
52
Report of Independent Registered Public Accounting Firm
Shareholders and Board of Directors
H&E Equipment Services, Inc.
Baton Rouge, Louisiana
Opinion on the Consolidated Financial Statements
We have audited the accompanying consolidated balance sheets of H&E Equipment Services, Inc. (the “Company”) and subsidiaries as of December 31, 2017 and 2016, the related consolidated statements of income, stockholders’ equity, and cash flows for each of the three years in the period ended December 31, 2017, and the related notes and schedule listed in Item 15(a)(2) of this annual report on Form 10-K (collectively referred to as the “consolidated financial statements”). In our opinion, the consolidated financial statements present fairly, in all material respects, the financial position of the Company and subsidiaries at December 31, 2017 and 2016, and the results of their operations and their cash flows for each of the three years in the period ended December 31, 2017, in conformity with accounting principles generally accepted in the United States of America.
We also have audited, in accordance with the standards of the Public Company Accounting Oversight Board (United States) (“PCAOB”), the Company's internal control over financial reporting as of December 31, 2017, based on criteria established in Internal Control – Integrated Framework (2013) issued by the Committee of Sponsoring Organizations of the Treadway Commission (“COSO”) and our report dated February 22, 2018 expressed an unqualified opinion thereon.
Basis for Opinion
These consolidated financial statements are the responsibility of the Company’s management. Our responsibility is to express an opinion on the Company’s consolidated financial statements based on our audits. We are a public accounting firm registered with the PCAOB and are required to be independent with respect to the Company in accordance with the U.S. federal securities laws and the applicable rules and regulations of the Securities and Exchange Commission and the PCAOB.
We conducted our audits in accordance with the standards of the PCAOB. Those standards require that we plan and perform the audit to obtain reasonable assurance about whether the consolidated financial statements are free of material misstatement, whether due to error or fraud.
Our audits included performing procedures to assess the risks of material misstatement of the consolidated financial statements, whether due to error or fraud, and performing procedures that respond to those risks. Such procedures included examining, on a test basis, evidence regarding the amounts and disclosures in the consolidated financial statements. Our audits also included evaluating the accounting principles used and significant estimates made by management, as well as evaluating the overall presentation of the consolidated financial statements. We believe that our audits provide a reasonable basis for our opinion.
/s/ BDO USA, LLP
We have served as the Company's auditor since 2004.
Dallas, Texas
February 22, 2018
|
|
|
|
|
|
|
|
53
H&E EQUIPMENT SERVICES, INC. AND SUBSIDIARIES
AS OF DECEMBER 31,
|
|
|
2017 |
|
|
2016 |
|
||
|
|
|
(Amounts in thousands, except share amounts) |
|
|||||
|
Assets |
|
|
|
|
|
|
|
|
|
Cash |
|
$ |
165,878 |
|
|
$ |
7,683 |
|
|
Receivables, net of allowance for doubtful accounts of $3,774 and $3,769, respectively |
|
|
176,081 |
|
|
|
140,037 |
|
|
Inventories, net of reserves for obsolescence of $947 and $900, respectively |
|
|
75,004 |
|
|
|
53,909 |
|
|
Prepaid expenses and other assets |
|
|
9,172 |
|
|
|
7,513 |
|
|
Rental equipment, net of accumulated depreciation of $495,940 and $437,522, respectively |
|
|
904,824 |
|
|
|
893,816 |
|
|
Property and equipment, net of accumulated depreciation and amortization of $131,500 and $118,812, respectively |
|
|
101,789 |
|
|
|
105,492 |
|
|
Deferred financing costs, net of accumulated amortization of $12,946 and $12,160, respectively |
|
|
3,772 |
|
|
|
1,964 |
|
|
Goodwill |
|
|
31,197 |
|
|
|
31,197 |
|
|
Total assets |
|
$ |
1,467,717 |
|
|
$ |
1,241,611 |
|
|
Liabilities and Stockholders’ Equity |
|
|
|
|
|
|
|
|
|
Liabilities: |
|
|
|
|
|
|
|
|
|
Amounts due on senior secured credit facility |
|
$ |
— |
|
|
$ |
162,642 |
|
|
Accounts payable |
|
|
89,781 |
|
|
|
39,432 |
|
|
Manufacturer flooring plans payable |
|
|
22,002 |
|
|
|
30,780 |
|
|
Accrued expenses payable and other liabilities |
|
|
65,095 |
|
|
|
56,833 |
|
|
Dividends payable |
|
|
150 |
|
|
|
67 |
|
|
Senior unsecured notes, net of unaccreted discount of $3,644 and $952 and deferred financing costs of $2,267 and $1,339, respectively |
|
|
944,088 |
|
|
|
627,711 |
|
|
Capital leases payable |
|
|
1,486 |
|
|
|
1,704 |
|
|
Deferred income taxes |
|
|
126,419 |
|
|
|
177,835 |
|
|
Deferred compensation payable |
|
|
1,903 |
|
|
|
1,842 |
|
|
Total liabilities |
|
|
1,250,924 |
|
|
|
1,098,846 |
|
|
Commitments and Contingencies (Note 13) |
|
|
|
|
|
|
|
|
|
Stockholders’ equity: |
|
|
|
|
|
|
|
|
|
Preferred stock, $0.01 par value, 25,000,000 shares authorized; no shares issued |
|
|
— |
|
|
|
— |
|
|
Common stock, $0.01 par value, 175,000,000 shares authorized; 39,623,773 and 39,496,759 shares issued at December 31, 2017 and 2016, respectively, and 35,646,585 and 35,554,491 shares outstanding at December 31, 2017 and 2016, respectively |
|
|
395 |
|
|
|
394 |
|
|
Additional paid-in capital |
|
|
227,070 |
|
|
|
223,544 |
|
|
Treasury stock at cost, 3,977,188 and 3,942,268 shares of common stock held at December 31, 2017 and 2016, respectively |
|
|
(61,749 |
) |
|
|
(60,966 |
) |
|
Retained earnings (accumulated deficit) |
|
|
51,077 |
|
|
|
(20,207 |
) |
|
Total stockholders’ equity |
|
|
216,793 |
|
|
|
142,765 |
|
|
Total liabilities and stockholders’ equity |
|
$ |
1,467,717 |
|
|
$ |
1,241,611 |
|
The accompanying notes are an integral part of these consolidated statements.
54
H&E EQUIPMENT SERVICES, INC. AND SUBSIDIARIES
CONSOLIDATED STATEMENTS OF INCOME
FOR THE YEARS ENDED DECEMBER 31,
|
|
|
2017 |
|
|
2016 |
|
|
2015 |
|
|||
|
|
|
(Amounts in thousands, except per share amounts) |
|
|||||||||
|
Revenues: |
|
|
|
|
|
|
|
|
|
|
|
|
|
Equipment rentals |
|
$ |
479,016 |
|
|
$ |
445,227 |
|
|
$ |
443,024 |
|
|
New equipment sales |
|
|
203,301 |
|
|
|
196,688 |
|
|
|
238,172 |
|
|
Used equipment sales |
|
|
107,329 |
|
|
|
96,910 |
|
|
|
118,338 |
|
|
Parts sales |
|
|
107,384 |
|
|
|
109,147 |
|
|
|
111,133 |
|
|
Services revenues |
|
|
62,873 |
|
|
|
64,673 |
|
|
|
63,954 |
|
|
Other |
|
|
70,116 |
|
|
|
65,492 |
|
|
|
65,210 |
|
|
Total revenues |
|
|
1,030,019 |
|
|
|
978,137 |
|
|
|
1,039,831 |
|
|
Cost of revenues: |
|
|
|
|
|
|
|
|
|
|
|
|
|
Rental depreciation |
|
|
169,455 |
|
|
|
162,415 |
|
|
|
162,089 |
|
|
Rental expense |
|
|
77,706 |
|
|
|
71,694 |
|
|
|
71,950 |
|
|
New equipment sales |
|
|
180,702 |
|
|
|
175,556 |
|
|
|
212,235 |
|
|
Used equipment sales |
|
|
74,132 |
|
|
|
66,738 |
|
|
|
81,338 |
|
|
Parts sales |
|
|
77,713 |
|
|
|
78,966 |
|
|
|
80,830 |
|
|
Services revenues |
|
|
21,111 |
|
|
|
21,839 |
|
|
|
21,693 |
|
|
Other |
|
|
69,292 |
|
|
|
65,318 |
|
|
|
63,964 |
|
|
Total cost of revenues |
|
|
670,111 |
|
|
|
642,526 |
|
|
|
694,099 |
|
|
Gross profit |
|
|
359,908 |
|
|
|
335,611 |
|
|
|
345,732 |
|
|
Selling, general and administrative expenses |
|
|
232,784 |
|
|
|
228,129 |
|
|
|
220,226 |
|
|
Merger breakup fee proceeds, net of merger costs |
|
|
5,782 |
|
|
|
— |
|
|
|
— |
|
|
Gain from sales of property and equipment, net |
|
|
5,009 |
|
|
|
3,285 |
|
|
|
2,737 |
|
|
Income from operations |
|
|
137,915 |
|
|
|
110,767 |
|
|
|
128,243 |
|
|
Other income (expense): |
|
|
|
|
|
|
|
|
|
|
|
|
|
Interest expense |
|
|
(54,958 |
) |
|
|
(53,604 |
) |
|
|
(54,030 |
) |
|
Loss on early extinguishment of debt |
|
|
(25,363 |
) |
|
|
— |
|
|
|
— |
|
|
Other, net |
|
|
1,750 |
|
|
|
1,867 |
|
|
|
1,463 |
|
|
Total other expense, net |
|
|
(78,571 |
) |
|
|
(51,737 |
) |
|
|
(52,567 |
) |
|
Income before provision (benefit) for income taxes |
|
|
59,344 |
|
|
|
59,030 |
|
|
|
75,676 |
|
|
Provision (benefit) for income taxes |
|
|
(50,314 |
) |
|
|
21,858 |
|
|
|
31,371 |
|
|
Net income |
|
$ |
109,658 |
|
|
$ |
37,172 |
|
|
$ |
44,305 |
|
|
Net income per common share: |
|
|
|
|
|
|
|
|
|
|
|
|
|
Basic |
|
$ |
3.09 |
|
|
$ |
1.05 |
|
|
$ |
1.26 |
|
|
Diluted |
|
$ |
3.07 |
|
|
$ |
1.05 |
|
|
$ |
1.25 |
|
|
Weighted average common shares outstanding: |
|
|
|
|
|
|
|
|
|
|
|
|
|
Basic |
|
|
35,516 |
|
|
|
35,393 |
|
|
|
35,272 |
|
|
Diluted |
|
|
35,699 |
|
|
|
35,480 |
|
|
|
35,343 |
|
|
Dividends declared per common share outstanding |
|
$ |
1.10 |
|
|
$ |
1.10 |
|
|
$ |
1.05 |
|
The accompanying notes are an integral part of these consolidated statements.
55
H&E EQUIPMENT SERVICES, INC. AND SUBSIDIARIES
CONSOLIDATED STATEMENTS OF STOCKHOLDERS’ EQUITY
FOR THE YEARS ENDED DECEMBER 31, 2017, 2016 AND 2015
(Amounts in thousands, except share amounts)
|
|
|
Common Stock |
|
|
|
|
|
|
|
|
|
|
|
|
|
|
|
|
|
|||||
|
|
|
Shares Issued |
|
|
Amount |
|
|
Additional Paid-in Capital |
|
|
Treasury Stock |
|
|
Retained Earnings (Accumulated Deficit) |
|
|
Total Stockholders’ Equity |
|
||||||
|
Balances at December 31, 2014 |
|
|
39,100,021 |
|
|
$ |
390 |
|
|
$ |
218,349 |
|
|
$ |
(59,935 |
) |
|
$ |
(25,437 |
) |
|
$ |
133,367 |
|
|
Stock-based compensation |
|
|
— |
|
|
|
— |
|
|
|
2,655 |
|
|
|
— |
|
|
|
— |
|
|
|
2,655 |
|
|
Cash dividends on common stock ($1.05 per share) |
|
|
— |
|
|
|
— |
|
|
|
— |
|
|
|
— |
|
|
|
(37,146 |
) |
|
|
(37,146 |
) |
|
Tax deficiency associated with stock-based awards |
|
|
— |
|
|
|
— |
|
|
|
(125 |
) |
|
|
— |
|
|
|
— |
|
|
|
(125 |
) |
|
Issuance of non-vested restricted common stock |
|
|
233,550 |
|
|
|
2 |
|
|
|
— |
|
|
|
— |
|
|
|
— |
|
|
|
2 |
|
|
Repurchases of 25,484 shares of restricted common stock |
|
|
— |
|
|
|
— |
|
|
|
— |
|
|
|
(470 |
) |
|
|
— |
|
|
|
(470 |
) |
|
Net income |
|
|
— |
|
|
|
— |
|
|
|
— |
|
|
|
— |
|
|
|
44,305 |
|
|
|
44,305 |
|
|
Balances at December 31, 2015 |
|
|
39,333,571 |
|
|
|
392 |
|
|
|
220,879 |
|
|
|
(60,405 |
) |
|
|
(18,278 |
) |
|
|
142,588 |
|
|
Stock-based compensation |
|
|
— |
|
|
|
— |
|
|
|
3,037 |
|
|
|
— |
|
|
|
— |
|
|
|
3,037 |
|
|
Cash dividends on common stock ($1.10 per share) |
|
|
— |
|
|
|
— |
|
|
|
— |
|
|
|
— |
|
|
|
(39,101 |
) |
|
|
(39,101 |
) |
|
Tax deficiency associated with stock-based awards |
|
|
— |
|
|
|
— |
|
|
|
(372 |
) |
|
|
— |
|
|
|
— |
|
|
|
(372 |
) |
|
Issuance of non-vested restricted common stock |
|
|
163,188 |
|
|
|
2 |
|
|
|
— |
|
|
|
— |
|
|
|
— |
|
|
|
2 |
|
|
Repurchases of 37,565 shares of restricted common stock |
|
|
— |
|
|
|
— |
|
|
|
— |
|
|
|
(561 |
) |
|
|
— |
|
|
|
(561 |
) |
|
Net income |
|
|
— |
|
|
|
— |
|
|
|
— |
|
|
|
— |
|
|
|
37,172 |
|
|
|
37,172 |
|
|
Balances at December 31, 2016 |
|
|
39,496,759 |
|
|
|
394 |
|
|
|
223,544 |
|
|
|
(60,966 |
) |
|
|
(20,207 |
) |
|
|
142,765 |
|
|
Cumulative effect adjustment for previously unrecognized excess tax benefits pursuant to the adoption of ASU 2016-09 (see note (2)) |
|
|
— |
|
|
|
— |
|
|
|
— |
|
|
|
— |
|
|
|
881 |
|
|
|
881 |
|
|
Stock-based compensation |
|
|
— |
|
|
|
— |
|
|
|
3,526 |
|
|
|
— |
|
|
|
— |
|
|
|
3,526 |
|
|
Cash dividends declared on common stock ($1.10 per share) |
|
|
— |
|
|
|
— |
|
|
|
— |
|
|
|
— |
|
|
|
(39,255 |
) |
|
|
(39,255 |
) |
|
Issuance of non-vested restricted common stock |
|
|
127,014 |
|
|
|
1 |
|
|
|
— |
|
|
|
— |
|
|
|
— |
|
|
|
1 |
|
|
Repurchases of 34,920 shares of restricted common stock |
|
|
— |
|
|
|
— |
|
|
|
— |
|
|
|
(783 |
) |
|
|
— |
|
|
|
(783 |
) |
|
Net income |
|
|
— |
|
|
|
— |
|
|
|
— |
|
|
|
— |
|
|
|
109,658 |
|
|
|
109,658 |
|
|
Balances at December 31, 2017 |
|
|
39,623,773 |
|
|
|
395 |
|
|
|
227,070 |
|
|
|
(61,749 |
) |
|
|
51,077 |
|
|
|
216,793 |
|
The accompanying notes are an integral part of these consolidated statements.
56
H&E EQUIPMENT SERVICES, INC. AND SUBSIDIARIES
CONSOLIDATED STATEMENTS OF CASH FLOWS
FOR THE YEARS ENDED DECEMBER 31,
|
|
|
2017 |
|
|
2016 |
|
|
2015 |
|
|||
|
|
|
(Amounts in thousands) |
|
|||||||||
|
Cash flows from operating activities: |
|
|
|
|
|
|
|
|
|
|
|
|
|
Net income |
|
$ |
109,658 |
|
|
$ |
37,172 |
|
|
$ |
44,305 |
|
|
Adjustments to reconcile net income to net cash provided by operating activities: |
|
|
|
|
|
|
|
|
|
|
|
|
|
Depreciation and amortization of property and equipment |
|
|
23,790 |
|
|
|
27,282 |
|
|
|
24,368 |
|
|
Depreciation of rental equipment |
|
|
169,455 |
|
|
|
162,415 |
|
|
|
162,089 |
|
|
Amortization of deferred financing costs |
|
|
1,046 |
|
|
|
1,052 |
|
|
|
1,036 |
|
|
Accretion of note discount, net of premium amortization |
|
|
274 |
|
|
|
168 |
|
|
|
168 |
|
|
Provision for losses on accounts receivable |
|
|
3,932 |
|
|
|
3,137 |
|
|
|
3,441 |
|
|
Provision for inventory obsolescence |
|
|
161 |
|
|
|
127 |
|
|
|
295 |
|
|
Change in deferred income taxes |
|
|
(50,535 |
) |
|
|
21,578 |
|
|
|
30,651 |
|
|
Stock-based compensation expense |
|
|
3,526 |
|
|
|
3,037 |
|
|
|
2,655 |
|
|
Loss on early extinguishment of debt |
|
|
25,363 |
|
|
|
— |
|
|
|
— |
|
|
Gain from sales of property and equipment, net |
|
|
(5,009 |
) |
|
|
(3,285 |
) |
|
|
(2,737 |
) |
|
Gain from sales of rental equipment, net |
|
|
(31,882 |
) |
|
|
(29,003 |
) |
|
|
(35,134 |
) |
|
Changes in operating assets and liabilities: |
|
|
|
|
|
|
|
|
|
|
|
|
|
Receivables |
|
|
(40,012 |
) |
|
|
4,154 |
|
|
|
13,566 |
|
|
Inventories |
|
|
(31,771 |
) |
|
|
4,267 |
|
|
|
(14,517 |
) |
|
Prepaid expenses and other assets |
|
|
(1,659 |
) |
|
|
2,541 |
|
|
|
(908 |
) |
|
Accounts payable |
|
|
50,349 |
|
|
|
(27,345 |
) |
|
|
13,436 |
|
|
Manufacturer flooring plans payable |
|
|
(8,778 |
) |
|
|
(31,653 |
) |
|
|
(31,167 |
) |
|
Accrued expenses payable and other liabilities |
|
|
8,230 |
|
|
|
1,667 |
|
|
|
(4,995 |
) |
|
Deferred compensation payable |
|
|
61 |
|
|
|
(332 |
) |
|
|
68 |
|
|
Net cash provided by operating activities |
|
|
226,199 |
|
|
|
176,979 |
|
|
|
206,620 |
|
|
Cash flows from investing activities: |
|
|
|
|
|
|
|
|
|
|
|
|
|
Purchases of property and equipment |
|
|
(22,515 |
) |
|
|
(22,895 |
) |
|
|
(26,797 |
) |
|
Purchases of rental equipment |
|
|
(234,209 |
) |
|
|
(179,709 |
) |
|
|
(178,772 |
) |
|
Proceeds from sales of property and equipment |
|
|
7,506 |
|
|
|
3,805 |
|
|
|
4,289 |
|
|
Proceeds from sales of rental equipment |
|
|
96,143 |
|
|
|
84,389 |
|
|
|
99,521 |
|
|
Net cash used in investing activities |
|
|
(153,075 |
) |
|
|
(114,410 |
) |
|
|
(101,759 |
) |
|
Cash flows from financing activities: |
|
|
|
|
|
|
|
|
|
|
|
|
|
Purchases of treasury stock |
|
|
(783 |
) |
|
|
(561 |
) |
|
|
(470 |
) |
|
Borrowings on senior secured credit facility |
|
|
1,193,544 |
|
|
|
966,146 |
|
|
|
982,961 |
|
|
Payments on senior secured credit facility |
|
|
(1,356,186 |
) |
|
|
(988,361 |
) |
|
|
(1,058,023 |
) |
|
Principal payments on senior unsecured notes due 2022 |
|
|
(630,000 |
) |
|
|
— |
|
|
|
— |
|
|
Costs paid to tender and redeem senior unsecured notes due 2022 |
|
|
(23,336 |
) |
|
|
— |
|
|
|
— |
|
|
Proceeds from issuance of senior unsecured notes due 2025 |
|
|
958,500 |
|
|
|
— |
|
|
|
— |
|
|
Payments of deferred financing costs |
|
|
(17,278 |
) |
|
|
— |
|
|
|
(725 |
) |
|
Dividend paid |
|
|
(39,172 |
) |
|
|
(39,066 |
) |
|
|
(37,114 |
) |
|
Payments of capital lease obligations |
|
|
(218 |
) |
|
|
(203 |
) |
|
|
(192 |
) |
|
Net cash provided by (used in) financing activities |
|
|
85,071 |
|
|
|
(62,045 |
) |
|
|
(113,563 |
) |
|
Net increase (decrease) in cash |
|
|
158,195 |
|
|
|
524 |
|
|
|
(8,702 |
) |
|
Cash, beginning of year |
|
|
7,683 |
|
|
|
7,159 |
|
|
|
15,861 |
|
|
Cash, end of year |
|
$ |
165,878 |
|
|
$ |
7,683 |
|
|
$ |
7,159 |
|
The accompanying notes are an integral part of these consolidated statements.
57
H&E EQUIPMENT SERVICES, INC. AND SUBSIDIARIES
CONSOLIDATED STATEMENTS OF CASH FLOWS (Continued)
FOR THE YEARS ENDED DECEMBER 31,
|
|
|
2017 |
|
|
2016 |
|
|
2015 |
|
|||
|
|
|
(Amounts in thousands) |
|
|||||||||
|
Supplemental schedule of non-cash investing and financing activities: |
|
|
|
|
|
|
|
|
|
|
|
|
|
Non-cash asset purchases: |
|
|
|
|
|
|
|
|
|
|
|
|
|
Assets transferred from new and used inventory to rental fleet |
|
$ |
10,515 |
|
|
$ |
38,515 |
|
|
$ |
51,391 |
|
|
Purchases of property and equipment included in accrued expenses payable and other liabilities |
|
$ |
(23 |
) |
|
$ |
(386 |
) |
|
$ |
— |
|
|
Supplemental disclosures of cash flow information: |
|
|
|
|
|
|
|
|
|
|
|
|
|
Cash paid during the year for: |
|
|
|
|
|
|
|
|
|
|
|
|
|
Interest |
|
$ |
49,546 |
|
|
$ |
52,494 |
|
|
$ |
52,803 |
|
|
Income taxes paid (refunds received), net |
|
$ |
478 |
|
|
$ |
177 |
|
|
$ |
(1,591 |
) |
58
H&E EQUIPMENT SERVICES, INC. AND SUBSIDIARIES
NOTES TO CONSOLIDATED FINANCIAL STATEMENTS
|
(1) |
Organization and Nature of Operations |
Organization
Prior to our initial public offering in February 2006, our business was conducted through H&E LLC. In connection with our initial public offering, we converted H&E LLC into H&E Equipment Services, Inc. In order to have an operating Delaware corporation as the issuer for our initial public offering, H&E Equipment Services, Inc. was formed as a Delaware corporation and wholly-owned subsidiary of H&E Holdings L.L.C. (“H&E Holdings”), and immediately prior to the closing of our initial public offering, on February 3, 2006, H&E LLC and H&E Holdings merged with and into H&E Equipment Services, Inc., which survived the reincorporation merger as the operating company. Effective February 3, 2006, H&E LLC and H&E Holdings no longer existed under operation of law pursuant to the reincorporation merger.
Nature of Operations
As one of the largest integrated equipment services companies in the United States focused on heavy construction and industrial equipment, we rent, sell and provide parts and services support for four core categories of specialized equipment: (1) hi-lift or aerial work platform equipment; (2) cranes; (3) earthmoving equipment; and (4) industrial lift trucks. By providing equipment rental, sales, on-site parts, repair and maintenance functions under one roof, we are a one-stop provider for our customers’ varied equipment needs. This full service approach provides us with multiple points of customer contact, enables us to maintain a high quality rental fleet, as well as an effective distribution channel for fleet disposal and provides cross‑selling opportunities among our new and used equipment sales, rental, parts sales and services operations.
|
(2) |
Summary of Significant Accounting Policies |
Principles of Consolidation and Basis of Presentation
Our consolidated financial statements include the financial position and results of operations of H&E Equipment Services, Inc. and its wholly-owned subsidiaries H&E Finance Corp., GNE Investments, Inc., Great Northern Equipment, Inc., H&E California Holding, Inc., H&E Equipment Services (California), LLC and H&E Equipment Services (Mid-Atlantic), Inc., collectively referred to herein as “we” or “us” or “our” or the “Company.”
All significant intercompany accounts and transactions have been eliminated in these consolidated financial statements. Business combinations are included in the consolidated financial statements from their respective dates of acquisition.
The nature of our business is such that short-term obligations are typically met by cash flows generated from long-term assets. Consequently, and consistent with industry practice, the accompanying consolidated balance sheets are presented on an unclassified basis.
Use of Estimates
We prepare our consolidated financial statements in accordance with accounting principles generally accepted in the United States of America, which requires management to use its judgment to make estimates and assumptions that affect the reported amounts of assets and liabilities and related disclosures at the date of the consolidated financial statements and the reported amounts of revenues and expenses during the reported period. These assumptions and estimates could have a material effect on our condensed consolidated financial statements. Actual results may differ materially from those estimates. We review our estimates on an ongoing basis based on information currently available, and changes in facts and circumstances may cause us to revise these estimates.
Revenue Recognition
As noted in the discussion below (see “Recent Accounting Pronouncements” below), we will adopt as of January 1, 2018, updated FASB revenue recognition guidance (Topic 606). Topic 606 is an update to Topic 605, which was the revenue recognition standard in effect for all periods during each of the three years ended December 31, 2017, 2016 and 2015. For each of these years, we recognized revenue in accordance with two different accounting standards: (1) Topic 605 and (2) Topic 840, which is the lease standard.
Pursuant to Topic 605, revenue generally is realized or realizable and earned when all of the following criteria are met: (1) persuasive evidence of an arrangement exists; (2) delivery has occurred or services have been rendered; (3) the seller’s price to the
59
buyer is fixed or determinable; and (4) collectibility is reasonably assured. Revenue from the sale of new and used equipment and parts is recognized at the time of delivery to, or pick-up by, the customer and when all obligations under the sales contract have been fulfilled, risk of ownership has been transferred and collectibility is reasonably assured. Services revenue is recognized at the time the services are rendered. Other revenues consist primarily of billings to customers for rental equipment delivery and damage waiver charges and are generally recognized at the time the service has been provided.
We account for equipment that we rent as operating leases. Pursuant to Topic 840, we recognize revenue from equipment rentals in the period earned, regardless of the timing of the billing to customers. A rental contract includes rates for daily, weekly or monthly use, and rental revenue is earned on a daily basis as rental contracts remain outstanding. Because the rental contracts can extend across financial reporting periods, we record unbilled rental revenue and deferred rental revenue at the end of reporting periods so rental revenue earned is appropriately stated in the periods presented.
Inventories
New and used equipment inventories are stated at the lower of cost or net realizable value, with cost determined by specific-identification. Inventories of parts and supplies are stated at the lower of the average cost or market. See also the “Recent Accounting Pronouncements” on page 48 for new accounting guidance related to measurement of inventories.
Long-lived Assets and Goodwill
Rental Equipment
The rental equipment we purchase is stated at cost and is depreciated over the estimated useful lives of the equipment using the straight-line method. Estimated useful lives vary based upon type of equipment. Generally, we depreciate cranes and aerial work platforms over a ten year estimated useful life, earthmoving equipment over a five year estimated useful life with a 25% salvage value, and industrial lift trucks over a seven year estimated useful life. Attachments and other smaller type equipment are depreciated generally over a three year estimated useful life. We periodically evaluate the appropriateness of remaining depreciable lives and any salvage value assigned to rental equipment.
Ordinary repair and maintenance costs and property taxes are charged to operations as incurred. However, expenditures for additions or improvements that significantly extend the useful life of the asset are capitalized in the period incurred. When rental equipment is sold or disposed of, the related cost and accumulated depreciation are removed from the respective accounts and any gains or losses are included in income. We receive individual offers for fleet on a continual basis, at which time we perform an analysis on whether or not to accept the offer. The rental equipment is not transferred to inventory under the held for sale model as the equipment is used to generate revenues until the equipment is sold.
Property and Equipment
Property and equipment are recorded at cost and are depreciated over the assets’ estimated useful lives using the straight-line method. Ordinary repair and maintenance costs are charged to operations as incurred. However, expenditures for additions or improvements that significantly extend the useful life of the asset are capitalized in the period incurred. At the time assets are sold or disposed of, the cost and accumulated depreciation are removed from their respective accounts and the related gains or losses are reflected in income.
We capitalize interest on qualified construction projects. Costs associated with internally developed software are accounted for in accordance with FASB ASC 350-40, Internal-Use Software (“ASC 350-40”), which provides guidance for the treatment of costs associated with computer software development and defines the types of costs to be capitalized and those to be expensed.
We periodically evaluate the appropriateness of remaining depreciable lives assigned to property and equipment. Leasehold improvements are amortized using the straight-line method over their estimated useful lives or the remaining term of the lease, whichever is shorter. Generally, we assign the following estimated useful lives to these categories:
|
Category |
|
Estimated Useful Life |
|
Transportation equipment |
|
5 years |
|
Buildings |
|
39 years |
|
Office equipment |
|
5 years |
|
Computer equipment |
|
3 years |
|
Machinery and equipment |
|
7 years |
60
In accordance with ASC 360, Property, Plant and Equipment (“ASC 360”), when events or changes in circumstances indicate that the carrying amount of our rental fleet and property and equipment might not be recoverable, the expected future undiscounted cash flows from the assets are estimated and compared with the carrying amount of the assets. If the sum of the estimated undiscounted cash flows is less than the carrying amount of the assets, an impairment loss is recorded. The impairment loss is measured by comparing the fair value of the assets with their carrying amounts. Fair value is determined based on discounted cash flows or appraised values, as appropriate. We did not record any impairment losses related to our rental equipment or property and equipment during 2017, 2016 or 2015.
Goodwill
We have made acquisitions in the past that included the recognition of goodwill, which was determined based upon previous accounting principles. Pursuant to ASC 350, Intangibles-Goodwill and Other (“ASC 350”), goodwill is recorded as the excess of the consideration transferred plus the fair value of any non-controlling interest in the acquiree at the acquisition date over the fair values of the identifiable net assets acquired.
We evaluate goodwill for impairment at least annually, or more frequently if triggering events occur or other impairment indicators arise which might impair recoverability. Impairment of goodwill is evaluated at the reporting unit level. A reporting unit is defined as an operating segment (i.e. before aggregation or combination), or one level below an operating segment (i.e. a component). A component of an operating segment is a reporting unit if the component constitutes a business for which discrete financial information is available and segment management regularly reviews the operating results of that component. We have identified two components within our Rental operating segment and have determined that each of our other operating segments (New, Used, Parts and Service) represent a reporting unit, resulting in six total reporting units.
ASC 350 allows entities to first use a qualitative approach to test goodwill for impairment. ASC 350 permits an entity to first perform a qualitative assessment to determine whether it is more likely than not (a likelihood of greater than 50%) that the fair value of a reporting unit is less than its carrying value. If it is concluded that this is the case, the currently prescribed two-step goodwill test must be performed. Otherwise, the two-step goodwill impairment test is not required. Considerable judgment is required by management in using the qualitative approach under ASC 350 to determine whether it is more likely than not that the fair value of a reporting unit is less than its carrying value. We performed a qualitative assessment as of October 1, 2017 and there was no goodwill impairment.
ASC 350 suggests that a qualitative assessment may become less relevant over time. In other words, the longer it has been since the last quantitative assessment, the more difficult it could be for a company to conclude that it is not more likely than not that the fair value of a reporting unit is less than its carrying amount. Our last quantitative assessment of goodwill impairment was as of October 1, 2016. Step 1 of that test determined that the fair values of the goodwill reporting units exceeded their respective carrying values and, therefore, Step 2 of the goodwill test was not required, as there was no goodwill impairment at October 1, 2016.
Closed Branch Facility Charges
We continuously monitor and identify branch facilities with revenues and operating margins that consistently fall below Company performance standards. Once identified, we continue to monitor these branches to determine if operating performance can be improved or if the performance is attributable to economic factors unique to the particular market with unfavorable long-term prospects. If necessary, branches with unfavorable long-term prospects are closed and the rental fleet and new and used equipment inventories are deployed to more profitable branches within our geographic footprint where demand is higher.
We closed one branch during each of the years ended December 31, 2017 and 2016 in markets where long-term prospects did not support continued operations. No branches were closed during 2015. Under ASC 420, Exit or Disposal Cost Obligations (“ASC 420”), exit costs include, but are not limited to, the following: (a) one-time termination benefits; (b) contract termination costs, including costs that will continue to be incurred under operating leases that have no future economic benefit; and (c) other associated costs. A liability for costs associated with an exit or disposal activity is recognized and measured at its fair value in the period in which the liability is incurred, except for one-time termination benefits that are incurred over time. Although we do not expect to incur material charges related to branch closures, additional charges are possible to the extent that actual future settlements differ from our estimates of such costs. Costs incurred for the one closed branch in 2017 and 2016 did not have a material impact on the Company’s consolidated financial statements. As of the date of this Annual Report on Form 10-K, the Company has not identified any other branch facilities with a more than likely probability of closing where the associated costs pursuant to ASC 420 are expected to be material.
61
Deferred Financing Costs and Initial Purchasers’ Discounts
Deferred financing costs include legal, accounting and other direct costs incurred in connection with the issuance and amendments thereto, of the Company’s debt. These costs are amortized over the terms of the related debt using the straight-line method which approximates amortization using the effective interest method.
Initial purchasers’ discount and bond premium is the differential between the price paid to an issuer for the new issue and the prices (below and above, respectively) at which the securities are initially offered to the investing public. The amortization expense of deferred financing costs and bond premium and accretion of initial purchasers’ discounts are included in interest expense as an overall cost of the related financings. Such costs are presented in the balance sheet as a direct deduction from the carrying value of the associated debt liability, consistent with the presentation of a debt discount.
Reserves for Claims
We are exposed to various claims relating to our business, including those for which we provide self-insurance. Claims for which we self-insure include: (1) workers compensation claims; (2) general liability claims by third parties for injury or property damage caused by our equipment or personnel; (3) automobile liability claims; and (4) employee health insurance claims. These types of claims may take a substantial amount of time to resolve and, accordingly, the ultimate liability associated with a particular claim, including claims incurred but not reported as of a period-end reporting date, may not be known for an extended period of time. Our methodology for developing self-insurance reserves is based on management estimates and independent third party actuarial estimates. Our estimation process considers, among other matters, the cost of known claims over time, cost inflation and incurred but not reported claims. These estimates may change based on, among other things, changes in our claim history or receipt of additional information relevant to assessing the claims. Further, these estimates may prove to be inaccurate due to factors such as adverse judicial determinations or other claim settlements at higher than estimated amounts. Accordingly, we may be required to increase or decrease our reserve levels. At December 31, 2017, our claims reserves related to workers compensation, general liability and automobile liability, which are included in “Accrued expenses and other liabilities” in our consolidated balance sheets, totaled $4.6 million and our health insurance reserves totaled $1.2 million. At December 31, 2016, our claims reserves related to workers compensation, general liability and automobile liability totaled $4.9 million and our health insurance reserves totaled $1.0 million.
Sales Taxes
We impose and collect significant amounts of sales taxes concurrent with our revenue-producing transactions with customers and remit those taxes to the various governmental agencies as prescribed by the taxing jurisdictions in which we operate. We present such taxes in our consolidated statements of income on a net basis.
Advertising
Advertising costs are expensed as incurred and totaled $0.5 million, $1.0 million and $1.8 million for the years ended December 31, 2017, 2016 and 2015, respectively.
Shipping and Handling Fees and Costs
Shipping and handling fees billed to customers are recorded as revenues while the related shipping and handling costs are included in other cost of revenues.See discussion of shipping and handling revenues in Recent Accounting Pronouncements below with respect to the new revenue recognition guidance effective January 1, 2018.
Income Taxes
The Company files a consolidated federal income tax return with its wholly-owned subsidiaries. The Company is a C-Corporation under the provisions of the Internal Revenue Code. We utilize the asset and liability approach to measure deferred tax assets and liabilities based on temporary differences existing at each balance sheet date using currently enacted tax rates in accordance with ASC 740. ASC 740 takes into account the differences between financial statement treatment and tax treatment of certain transactions. Deferred tax assets and liabilities are recognized for the future tax consequences attributable to differences between the financial statement carrying amounts of existing assets and liabilities and their respective tax bases. Deferred tax assets and liabilities are measured using enacted tax rates expected to apply to taxable income in the years in which those temporary differences are expected to be recovered or settled. The effect of a change in tax rate is recognized as income or expense in the period that includes the enactment date of that rate.
On December 22, 2017, the Tax Cuts and Jobs Act (the “Act”) was signed into law. Included in the Act is a reduction in the corporate statutory tax rate from 35% to 21%, effective for us on January 1, 2018. Under ASC 740, the effects of changes in tax rates
62
and laws are recognized in the period in which the new legislation is enacted. In the case of US federal income taxes, the enactment date is the date the bill becomes law (i.e., upon presidential signature). As of December 31, 2017, we have not completed our accounting for all the tax effects of the enactment of the Act. However, with respect to this legislation, we recorded a one-time decrease in income tax expense of $66.9 million in the fourth quarter of 2017, due to a re-measurement of our deferred tax assets and liabilities resulting from the decrease in the corporate federal income tax rate from 35% to 21%.
In accordance with ASC 740, the Company recognizes the effect of income tax positions only if those positions are more likely than not of being sustained. Recognized income tax provisions are measured at the largest amount that is greater than 50% likely of being realized. Changes in recognition or measurement are reflected in the period in which the change in judgment occurs. The Company recognizes both interest and penalties related to uncertain tax positions in net other income (expense).
Our deferred tax calculation requires management to make certain estimates about future operations. Deferred tax assets are reduced by a valuation allowance when, in the opinion of management, it is more likely than not that some portion or all of the deferred tax assets will not be realized.
Fair Value of Financial Instruments
Fair value is defined as the amount that would be received for selling an asset or paid to transfer a liability in an orderly transaction between market participants at the measurement date. The FASB fair value measurement guidance established a fair value hierarchy that prioritizes the inputs used to measure fair value. The three broad levels of the fair value hierarchy are as follows:
Level 1 – Quoted prices (unadjusted) in active markets for identical assets or liabilities
Level 2 – Quoted prices for similar assets and liabilities in active markets or inputs that are observable for the asset or liability, either directly or indirectly
Level 3 – Unobservable inputs for which little or no market data exists, therefore requiring a company to develop its own assumptions
The carrying value of financial instruments reported in the accompanying consolidated balance sheets for cash, accounts receivable, accounts payable and accrued expenses payable and other liabilities approximate fair value due to the immediate or short-term nature or maturity of these financial instruments. The fair value of our letter of credit is based on fees currently charged for similar agreements. The carrying amounts and fair values of our other financial instruments subject to fair value disclosures as of December 31, 2017 and 2016 are presented in the table below (amounts in thousands) and have been calculated based upon market quotes and present value calculations based on market rates.
|
|
|
December 31, 2017 |
|
|||||
|
|
|
Carrying Amount |
|
|
Fair Value |
|
||
|
Manufacturer flooring plans payable with interest computed at 4.50% (Level 3) |
|
$ |
22,002 |
|
|
$ |
18,737 |
|
|
Senior unsecured notes due 2025 with interest computed at 5.625% (Level 3) |
|
|
944,088 |
|
|
|
619,019 |
|
|
Capital leases payable with interest computed at 5.929% to 9.55% (Level 3) |
|
|
1,486 |
|
|
|
1,114 |
|
|
Letter of credit (Level 3) |
|
|
— |
|
|
|
116 |
|
|
|
|
December 31, 2016 |
|
|||||
|
|
|
Carrying Amount |
|
|
Fair Value |
|
||
|
Manufacturer flooring plans payable with interest computed at 5.25% (Level 3) |
|
$ |
30,780 |
|
|
$ |
26,780 |
|
|
Senior unsecured notes due 2022 with interest computed at 7.0% (Level 1) |
|
|
627,711 |
|
|
|
663,075 |
|
|
Capital leases payable with interest computed at 5.929% to 9.55% (Level 3) |
|
|
1,704 |
|
|
|
1,164 |
|
|
Letter of credit (Level 3) |
|
|
— |
|
|
|
155 |
|
63
At December 31, 2017, the fair value of our senior unsecured notes due 2025 was based on the present value of the notes based on our incremental borrowing rate as these notes were not available (registered) on a bond trading market as of December 31, 2017. At December 31, 2016, the fair value of our senior unsecured notes due 2022 were based on quoted bond trading market prices of those notes. During 2017 and 2016, there were no transfers of financial assets or liabilities in or out of Level 1, Level 2 or Level 3 of the fair value hierarchy.
Concentrations of Credit and Supplier Risk
Financial instruments that potentially subject the Company to concentrations of credit risk consist primarily of trade accounts receivable. Credit risk can be negatively impacted by adverse changes in the economy or by disruptions in the credit markets. However, we believe that credit risk with respect to trade accounts receivable is somewhat mitigated by our large number of geographically diverse customers and our credit evaluation procedures. Although generally no collateral is required, when feasible, mechanics’ liens are filed and personal guarantees are signed to protect the Company’s interests. We maintain reserves for potential losses.
We record trade accounts receivables at sales value and establish specific reserves for certain customer accounts identified as known collection problems due to insolvency, disputes or other collection issues. The amounts of the specific reserves estimated by management are based on the following assumptions and variables: the customer’s financial position, age of the customer’s receivables and changes in payment schedules. In addition to the specific reserves, management establishes a non-specific allowance for doubtful accounts by applying specific percentages to the different receivable aging categories (excluding the specifically reserved accounts). The percentage applied against the aging categories increases as the accounts become further past due. The allowance for doubtful accounts is charged with the write-off of uncollectible customer accounts.
We purchase a significant amount of equipment from the same manufacturers with whom we have distribution agreements. During the year ended December 31, 2017, we purchased approximately 42% from three manufacturers (Grove/Manitowoc, Komatsu, and Genie Industries (Terex)) providing our rental and sales equipment. We believe that while there are alternative sources of supply for the equipment we purchase in each of the principal product categories, termination of one or more of our relationships with any of our major suppliers of equipment could have a material adverse effect on our business, financial condition or results of operation if we were unable to obtain adequate or timely rental and sales equipment.
Income per Share
Income per common share for the year ended December 31, 2017, 2016 and 2015 are based on the weighted average number of common shares outstanding during the period. The effects of potentially dilutive securities that are anti-dilutive are not included in the computation of dilutive income per share. We include all common shares granted under our incentive compensation plan which remain unvested (“restricted common shares”) and contain non-forfeitable rights to dividends or dividend equivalents, whether paid or unpaid (“participating securities”), in the number of shares outstanding in our basic and diluted EPS calculations using the two-class method. All of our restricted common shares are currently participating securities.
Under the two-class method, earnings per common share are computed by dividing the sum of distributed earnings allocated to common shareholders and undistributed earnings allocated to common shareholders by the weighted average number of common shares outstanding for the period. In applying the two-class method, distributed and undistributed earnings are allocated to both common shares and restricted common shares based on the total weighted average shares outstanding during the period. The number of restricted common shares outstanding during the periods ended December 31, 2017, 2016 and 2015 were only 0.8%, 0.8% and 0.8% of total outstanding shares, respectively, and, consequently, were immaterial to the basic and diluted EPS calculations. Therefore, use of the two-class method had no impact on our basic and diluted EPS calculations as presented for the years ended December 31, 2017, 2016 and 2015.
64
The following table sets forth the computation of basic and diluted net income per common share for the years ended December 31, (amounts in thousands, except per share amounts):
|
|
|
2017 |
|
|
2016 |
|
|
2015 |
|
|||
|
Basic net income per share: |
|
|
|
|
|
|
|
|
|
|
|
|
|
Net income |
|
$ |
109,658 |
|
|
$ |
37,172 |
|
|
$ |
44,305 |
|
|
Weighted average number of common shares outstanding |
|
|
35,516 |
|
|
|
35,393 |
|
|
|
35,272 |
|
|
Net income per common share — basic |
|
$ |
3.09 |
|
|
$ |
1.05 |
|
|
$ |
1.26 |
|
|
Diluted net income per share: |
|
|
|
|
|
|
|
|
|
|
|
|
|
Net income |
|
$ |
109,658 |
|
|
$ |
37,172 |
|
|
$ |
44,305 |
|
|
Weighted average number of common shares outstanding |
|
|
35,516 |
|
|
|
35,393 |
|
|
|
35,272 |
|
|
Effect of dilutive securities: |
|
|
|
|
|
|
|
|
|
|
|
|
|
Effect of dilutive stock options |
|
|
— |
|
|
|
— |
|
|
|
14 |
|
|
Effect of dilutive non-vested stock |
|
|
183 |
|
|
|
87 |
|
|
|
57 |
|
|
Weighted average number of common shares outstanding — diluted |
|
|
35,699 |
|
|
|
35,480 |
|
|
|
35,343 |
|
|
Net income per common share — diluted |
|
$ |
3.07 |
|
|
$ |
1.05 |
|
|
$ |
1.25 |
|
|
Common shares excluded from the denominator as anti-dilutive: |
|
|
|
|
|
|
|
|
|
|
|
|
|
Stock options |
|
|
— |
|
|
|
4 |
|
|
|
14 |
|
|
Non-vested stock |
|
|
— |
|
|
|
3 |
|
|
|
8 |
|
Stock-Based Compensation
We adopted our 2006 Stock-Based Incentive Compensation Plan (as amended and restated from time to time, the “Prior Stock Plan”) and over the ten years prior to June 2016, we had been granting awards under our Prior Stock Plan. The Prior Stock Plan expired pursuant to its terms in June 2016, and the Company is no longer able to grant equity awards under the Prior Stock Plan. At our annual meeting of stockholders in May 2016, our stockholders approved our 2016 Stock-Based Incentive Compensation Plan (the “2016 Plan” and collectively with the Prior Stock Plan, the “Stock Plans”). To the extent that awards granted under the Prior Stock Plan are forfeited or otherwise terminate for any reason whatsoever without an actual distribution or issuance of shares, the plan limit will be increased by such number of shares. The Stock Plans are administered by the Compensation Committee of our Board of Directors, which selects persons eligible to receive awards and determines the number of shares and/or options subject to each award, the terms, conditions, performance measures, if any, and other provisions of the award. Under the Stock Incentive Plan, we may offer deferred shares or restricted shares of our common stock and grant options, including both incentive stock options and nonqualified stock options, to purchase shares of our common stock. Shares available for future stock-based payment awards under our Stock Incentive Plan were 1,844,301 shares of common stock as of December 31, 2017.
We account for our stock-based compensation plans using the fair value recognition provisions of Accounting Standards Codification 718, Stock Compensation (“ASC 718”). Under the provisions of ASC 718, stock-based compensation is measured at the grant date, based on the calculated fair value of the award, and is recognized as an expense over the requisite employee service period (generally the vesting period of the grant).
65
From time to time, we issue shares of non-vested stock typically with vesting terms of three years. The following table summarizes our non-vested stock activity for the years ended December 31, 2017 and 2016:
|
|
|
Number of Shares |
|
|
Weighted Average Grant Date Fair Value |
|
||
|
Non-vested stock at January 1, 2016 |
|
|
322,355 |
|
|
$ |
19.90 |
|
|
Granted |
|
|
227,532 |
|
|
$ |
17.39 |
|
|
Vested |
|
|
(136,765 |
) |
|
$ |
18.88 |
|
|
Forfeited |
|
|
(12,321 |
) |
|
$ |
18.83 |
|
|
Non-vested stock at December 31, 2016 |
|
|
400,801 |
|
|
$ |
18.86 |
|
|
Granted |
|
|
190,134 |
|
|
$ |
22.94 |
|
|
Vested |
|
|
(131,807 |
) |
|
$ |
21.85 |
|
|
Forfeited |
|
|
(13,164 |
) |
|
$ |
19.50 |
|
|
Non-vested stock at December 31, 2017 |
|
|
445,964 |
|
|
$ |
19.70 |
|
As of December 31, 2017, we had unrecognized compensation expense of approximately $4.8 million related to non-vested stock award payments that we expect to be recognized over a weighted average period of 2.0 years.
Stock Options
No stock options were granted during 2017, 2016 or 2015. At December 31, 2017, we had no unrecognized compensation expense related to prior stock option awards. No stock compensation expense was recognized in 2017, 2016 or 2015 related to stock options.
The following table represents stock option activity for the years ended December 31, 2017 and 2016:
|
|
|
Number of Shares |
|
|
Weighted Average Exercise Price(1) |
|
|
Weighted Average Contractual Life In Years |
|
|||
|
Outstanding options at January 1, 2016 |
|
|
51,000 |
|
|
$ |
17.80 |
|
|
1.5 |
|
|
|
Granted |
|
|
— |
|
|
|
— |
|
|
|
|
|
|
Exercised |
|
|
— |
|
|
|
— |
|
|
|
|
|
|
Canceled, forfeited or expired |
|
|
(46,500 |
) |
|
|
17.65 |
|
|
|
|
|
|
Outstanding options at December 31, 2016 |
|
|
4,500 |
|
|
$ |
19.27 |
|
|
|
0.5 |
|
|
Granted |
|
|
— |
|
|
|
— |
|
|
|
|
|
|
Exercised |
|
|
— |
|
|
|
— |
|
|
|
|
|
|
Canceled, forfeited or expired |
|
|
(4,500 |
) |
|
$ |
19.27 |
|
|
|
|
|
|
Outstanding options at December 31, 2017 |
|
|
— |
|
|
|
|
|
|
|
|
|
|
Options exercisable at December 31, 2017 |
|
|
— |
|
|
|
|
|
|
|
|
|
Purchases of Company Common Stock
Purchases of our common stock are accounted for as treasury stock in the accompanying consolidated balance sheets using the cost method. Repurchased stock is included in authorized shares, but is not included in shares outstanding.
66
We have determined in accordance with ASC 280, Segment Reporting (“ASC 280”) that we have five reportable segments. We derive our revenues from five principal business activities: (1) equipment rentals; (2) new equipment sales; (3) used equipment sales; (4) parts sales; and (5) repair and maintenance services. These segments are based upon how we allocate resources and assess performance. See note 18 to the consolidated financial statements regarding our segment information.
Recent Accounting Pronouncements
In May 2014, the Financial Accounting Standards Board (“FASB”) issued Accounting Standards Update (“ASU”) No. 2014-09, Revenue from Contracts with Customers (Topic 606), which will supersede Accounting Standards Codification (“ASC”) Topic 605, Revenue Recognition, and other legacy industry-specific revenue recognition guidance. In August 2015, the FASB deferred the effective date of this new standard by one year. The FASB later issued ASU No. 2016-08, Revenue from Contracts with Customers (Topic 606) – Principal versus Agent Considerations, in March 2016, ASU No. 2016-10, Revenue from Contracts with Customers (Topic 606) – Identifying Performance Obligations and Licensing, in April 2016, ASU 2016-12, Revenue from Contracts with Customers (Topic 606) – Narrow-Scope Improvements and Practical Expedients, in May 2016, and ASU 2016-20, Technical Corrections and Improvements to Topic 606, Revenue from Contracts with Customers, in December 2016, all of which further clarified aspects of Topic 606.
Topic 606 clarifies the principles for revenue recognition. Topic 606 requires an entity to recognize revenue when it transfers promised goods or services to customers in an amount that reflects the consideration to which the entity expects to be entitled in exchange for those goods or services. In doing so, entities will need to use more judgment and make more estimates than under current guidance. These judgments and estimates may include identifying performance obligations in the contract, estimating the amount of variable consideration to include in the transaction price and allocating the transaction price to each separate performance obligation. Topic 606 also requires an entity to disclose sufficient qualitative and quantitative information surrounding the nature, amount, timing and uncertainty of revenue and cash flows arising from contracts with customers. Topic 606 permits the use of either a retrospective application to each prior period presented or retrospective application with the cumulative effect of initially applying Topic 606 at the date of adoption. Topic 606 will become effective for fiscal years, and interim periods within those fiscal years, beginning after December 15, 2017. We will adopt Topic 606 as of January 1, 2018 using a full retrospective application to each prior period presented. Below is our evaluation of the impact from the adoption of Topic 606.
Revenues from equipment rentals accounted for 46.5% of our total revenues for the year ended December 31, 2017. Based on our analysis of Topic 606, we have determined that the accounting for equipment rental revenues is outside the scope of Topic 606. Therefore, upon our adoption of the new revenue recognition guidance on January 1, 2018, we will recognize our revenues pursuant to two different accounting standards. Revenues from equipment rentals will continue to be accounted for pursuant to current lease accounting guidance until our adoption of the new lease accounting standard in 2019 (as further discussed below in the Topic 842 pending lease accounting guidance), while revenues from new and used equipment sales, parts and services revenues and other revenues will be subject to Topic 606 upon adoption and are further described below.
Sales of new and used equipment accounted for 30.2% of our total revenues for the year ended December 31, 2017. Parts and services revenues comprised 16.5% of our total revenues for the year ended December 31, 2017. The primary impact to these revenue streams from the adoption of Topic 606 will relate to the accounting treatment of shipping and handling revenues, some of which shipping and handling revenues we currently include in other revenues in our consolidated statements of income. Other revenues comprised approximately 6.8% of our total revenues for the year ended December 31, 2017.
Pursuant to Topic 606, shipping and handling activities that are performed before the customer obtains control of the good are not a separate promised service to the customer. Rather, shipping and handling activities fulfill an entity’s promise to transfer the good. While the timing of our revenue recognition related to our shipping and handling activities, such as hauling revenues related to new and used equipment sales, maintenance and repair services, as well as parts freight, will not change upon adoption of the new guidance, we believe that Topic 606 requires revenues related to shipping and handling activities to be treated as fulfillment activities when the customer obtains control of the good after the shipping and handling activities are performed. In such contract arrangements, shipping and handling revenues will be included and presented within our respective segmented revenues consolidated statement of income line items rather than in our non-segmented other revenues line item. Related shipping and handling costs included in the non-segmented other costs of revenues line item in our consolidated statements of income should likewise be conformed and presented within our respective segment costs of revenues line items.
67
While this change will only impact how our shipping and handling activities are presented within our revenues (and costs of revenues) line items within the consolidated statements of income and does not impact total revenues or total costs of revenues, this change will impact our calculated gross profit (and gross margin) for our segmented and non-segmented revenues in comparison to how we have historically calculated those measures. Shipping and handling type revenues included in other revenues were approximately $7.9 million for the year ended December 31, 2017, or approximately 0.7% of total revenues.
Implementing the above changes to our financial reporting processes will not result in a material change to our internal controls over financial reporting.
With respect to shipping and handling activities related to our equipment rental operations, we have determined that such hauling activities are a separate performance obligation as control passes to the customer when the rental equipment leaves our facility. Therefore, we will continue to account for our rental equipment hauling activities as a separate performance obligation, resulting in no change to our historical presentation of hauling activities in other revenues (and other costs of revenues) in our consolidated statements of income.
In February 2016, the FASB issued ASU 2016-02, Leases (Topic 842) (“ASU 2016-02”). The new standard is intended to provide enhanced transparency and comparability by requiring lessees to record right-of-use assets and corresponding lease liabilities on the balance sheet, with the exception of leases with a term of 12 months or less, which permits a lessee to make an accounting policy election by class of underlying asset not to recognize lease assets and liabilities. At inception, lessees must classify leases as either finance or operating based on five criteria. Balance sheet recognition of finance and operating leases is similar, but the pattern of expense recognition in the income statement, as well as the effect on the statement of cash flows, differs depending on the lease classification. Also, certain qualitative and quantitative disclosures are required to enable users of financial statements to assess the amount, timing and uncertainty of cash flows arising from leases. ASU 2016-02 is effective for fiscal years beginning after December 15, 2018, including interim periods within those fiscal years, and early adoption is permitted. We will adopt ASU 2016-02 as of January 1, 2019. The new standard requires the recognition and measurement of leases at the beginning of the earliest period presented using a modified retrospective approach, which includes a number of optional practical expedients that entities may elect to apply.
Our operating leases include the real estate where all but 11 of our 80 branch locations are located as of December 31, 2017. Additionally, the Company leases numerous types of non-rental equipment. Given the size of our lease portfolio, we expect that the new standard will have a material effect on our consolidated balance sheets as a result of recognizing new right-of-use assets and lease liabilities for our existing operating leases. We have begun accumulating the information related to these leases but have not completed our comprehensive analysis of those leases and are unable to quantify the impact to our consolidated financial statements at this time. We are also concurrently evaluating our internal processes and controls over financial reporting with respect to the impact that the new lease standard will have on our lease administration activities.
As mentioned in the Topic 606 discussion above, our equipment rental business involves rental agreements with customers whereby we are the lessor in the transaction and therefore, we believe that such transactions are subject to the lessor accounting guidance of Topic 842. While our evaluation of ASU 2016-02 is ongoing with respect to our equipment rental activities, we have tentatively concluded that no significant changes are expected to the accounting for our rental equipment revenues, as substantially all of our rental agreements with customers will continue to be treated as operating leases under the new standard. Accordingly, we do not expect material changes to our related rental agreement accounting processes or internal controls.
In June 2016, the FASB issued ASU 2016-13, “Financial Instruments - Credit Losses (Topic 326): Measurement of Credit Losses on Financial Instruments” (“ASU 2016-13”). This standard adds to U.S. GAAP an impairment model (known as the current expected credit loss (“CECL”) model) that is based on expected losses rather than incurred losses. Under the new guidance, an entity recognizes as an allowance its estimate of expected credit losses, which is intended to result in the more timely recognition of losses. Under the CECL model, entities will estimate credit losses over the entire contractual term of the instrument (considering estimated prepayments, but not expected extensions or modifications) from the date of initial recognition of the financial instrument. Measurement of expected credit losses are to be based on relevant forecasts that affect collectability. The scope of financial assets within the CECL methodology is broad and includes trade receivables from revenue transactions and certain off-balance sheet credit exposures. Different components of the guidance require modified retrospective or prospective adoption. ASU 2016-13 will be effective for us as of January 1, 2020. While our review is ongoing, we believe ASU 2016-13 will only have applicability to our trade accounts receivables. While we believe that our current methodology for estimating the allowance for doubtful accounts on our trade accounts receivables is reasonable, we have not concluded whether the application of the CECL model, when compared to our current methodology, will have a material impact to our allowance for doubtful accounts.
In August 2016, the FASB issued ASU 2016-15, “Classification of Certain Cash Receipts and Cash Payments”, which aims to eliminate the diversity in the presentation of certain cash receipts and cash payments presented and classified in the statement of cash flows. The guidance addresses the following specific cash flow issues: (1) debt prepayment or debt extinguishment costs, (2)
68
settlement of zero-coupon debt instruments or other debt instruments with coupon interest rates that are insignificant in relation to the effective interest rate of the borrowing, (3) contingent consideration payments made after a business combination, (4) proceeds from the settlement of insurance claims, (5) proceeds from settlement of corporate-owned life insurance policies, including bank-owned life insurance policies, (6) distributions received from equity method investees, (7) beneficial interests in securitization transitions and (8) separately identifiable cash flows and application of predominance principle. The guidance will be effective for fiscal years and interim periods beginning after December 15, 2017. The guidance requires retrospective adoption. We expect to adopt this guidance when effective, and do not expect the guidance to have a significant impact on our consolidated financial statements.
In January 2017, the FASB issued ASU No. 2017-01, Business Combinations (Topic 805): Clarifying the Definition of a Business (“ASU 2017-01”). ASU 2017-01 clarifies the definition of a business when evaluating whether transactions should be accounted for as acquisitions (or disposals) of assets or businesses. ASU 2017-01 is effective for annual reporting periods, and interim periods therein, beginning after December 15, 2017, and interim periods within those annual periods. Based upon our review of ASU 2017-01, the Company does not expect the adoption of this guidance to have a material impact on its consolidated financial statements.
In January 2017, the FASB issued ASU No. 2017-04, Intangibles—Goodwill and Other (Topic 350): Simplifying the Test for Goodwill Impairment (“ASU 2017-04”), which removes Step 2 of the goodwill impairment test. A goodwill impairment will now be determined by the amount by which a reporting unit’s carrying value exceeds its fair value, not to exceed the carrying amount of goodwill. ASU 2017-04 is effective for annual reporting periods, and interim periods therein, beginning after December 15, 2019, with early adoption permitted. Based upon our review of ASU 2017-04, we do not expect the guidance to have a material impact on our consolidated financial statements.
Recent Accounting Pronouncements Adopted in the First Quarter of 2017
In July 2015, the FASB issued ASU 2015-11, Inventory: Simplifying the Measurement of Inventory (“ASU 2015-11”). ASU 2015-11 provides guidance on simplifying the measurement of inventory. The previous standard measured inventory at lower of cost or market; where market could be replacement cost, net realizable value, or net realizable value less an approximately normal profit margin. ASU 2015-11 updated this guidance to measure inventory at the lower of cost or net realizable value; where net realizable value is considered to be the estimated selling price in the ordinary course of business, less reasonably predictable cost of completion, disposal and transportation. We adopted ASU 2015-11 on January 1, 2017 on a prospective basis. The adoption of ASU 2015-11 did not result in a material impact on our financial position, results of operations, or cash flows for the year ended December 31, 2017.
In March 2016, the FASB Issued ASU No. 2016-06, Derivatives and Hedging (Topic 815): Contingent Put and Call Options in Debt Instruments (“ASU 2016-06”). The amendments in ASU 2016-06 clarify what steps are required when assessing whether the economic characteristics and risks of call (put) options are clearly and closely related to the economic characteristics and risks of their debt hosts, which is one of the criteria for bifurcating an embedded derivative. ASU 2016-06 became effective for us on January 1, 2017 and did not have a material impact on our financial position, results of operations, or cash flows for the year ended December 31, 2017.
In March 2016, the FASB Issued ASU No. 2016-09, Compensation-Stock Compensation (Topic 718): Improvements to Employee Share-Based Payment Accounting (“ASU 2016-09”). The updated guidance changed how companies previously accounted for certain aspects of stock-based payment awards to employees, including the accounting for income taxes, forfeitures, and statutory tax withholding requirements, as well as classification of such awards in the statement of cash flows. ASU 2016-09 became effective for us on January 1, 2017. ASU 2016-09 requires that excess tax benefits and deficiencies resulting from the vesting or exercise of stock-based compensation awards to be recognized in the income statement on a prospective basis. Previously, these amounts were recognized in additional paid-in capital. Accordingly, excess tax benefits of approximately $0.1 million were recognized as a discrete item in our income tax expense in the three month period and year ended December 31, 2017. In addition, ASU 2016-09 requires excess tax benefits and deficiencies to be excluded from the assumed future proceeds in the calculation of diluted shares. This change did not have a material impact to the calculation of weighted average shares outstanding for the year ended December 31, 2017.
ASU 2016-09 eliminates the prior guidance requirement that allowed under certain circumstances the realization of excess tax benefits prior to recognition of those excess tax benefits. Under prior guidance, companies could not recognize excess tax benefits when an option was exercised or a share vested if the related tax deduction increased a net operating loss carryforward rather than reduced income taxes payable. ASU 2016-09 requires companies to apply this part of the guidance using a modified retrospective transition method and record a cumulative effect adjustment for previously unrecognized excess tax benefits. Accordingly, we recorded a cumulative effect adjustment to accumulated deficit as of January 1, 2017 of approximately $0.9 million for all excess tax benefits that had not been previously recognized because the related tax deduction had not reduced income taxes payable.
ASU 2016-09 also clarifies that an entity should classify excess tax benefits along with other income tax cash flows as an operating activity in the statement of cash flows. This change eliminates the prior practice of grossing up the statement of cash flows for the
69
effect of windfalls, i.e. reporting windfalls as outflows in operating activities and as inflows in financing activities. Under ASU 2016-09, the effect of windfalls will generally be reflected in net income from continuing operations under the indirect method. We have adopted this portion of the guidance on a retrospective basis. ASU 2016-09 also clarifies that employee taxes paid when an employer withholds shares of stock for tax withholding purposes be reported as financing activities in the consolidated statements of cash flows, which is how the Company has historically presented such activities in our statement of cash flows.
(3) Acquisitions
On July 14, 2017, we and Neff Corporation (“Neff”) announced that we had entered into a definitive merger agreement under which we would acquire Neff by way of merger. The merger agreement was subject to customary closing conditions, and also included a “go-shop” period expiring on August 20, 2017, during which Neff could solicit alternative proposals to acquire Neff. On August 13, 2017, Neff notified us that it had determined that an acquisition proposal Neff had received constituted a “Superior Proposal” (as defined in the merger agreement) to acquire Neff and that Neff intended to terminate the merger agreement with us to enter into an agreement for such acquisition proposal, subject to our right to match the proposal under the merger agreement. On August 16, 2017, we announced that we had notified Neff that we did not intend to submit a revised proposal for the acquisition of Neff, , and on August 17, 2017, Neff terminated the merger agreement with us and immediately entered into a definitive agreement with United Rentals, Inc. (“URI”) under which United Rentals would acquire Neff.
Pursuant to the terms of the merger agreement between us and Neff, Neff paid us a termination fee to us of approximately $13.2 million concurrently with Neff’s termination of the merger agreement. We received the $13.2 million breakup fee on August 16, 2017. Total estimated transaction costs related to the proposed merger with Neff, including related financing costs, were approximately $6.7 million. Also included in this line item are estimated merger fees associated with the CEC acquisition of approximately $0.8 million.
The net breakup fee proceeds of $5.8 million are presented in our statements of income for the year ended December 31, 2017 in the line item, “Merger breakup fee proceeds, net of merger costs”.
As of February 22, 2018, a preliminary allocation of the fair value of the existing purchase price of CEC had yet to be completed. Accordingly, disclosure of the allocation of the purchase price to the CEC balance line items and the pro forma presentation reflecting the impact of the acquisition will be disclosed in subsequent filings.
|
(4) |
Receivables |
Receivables consisted of the following at December 31, (amounts in thousands):
|
|
|
2017 |
|
|
2016 |
|
||
|
Trade receivables |
|
$ |
172,522 |
|
|
$ |
137,470 |
|
|
Unbilled rental revenue |
|
|
6,291 |
|
|
|
5,384 |
|
|
Income tax receivables |
|
|
997 |
|
|
|
949 |
|
|
Other |
|
|
45 |
|
|
|
3 |
|
|
|
|
|
179,855 |
|
|
|
143,806 |
|
|
Less allowance for doubtful accounts |
|
|
(3,774 |
) |
|
|
(3,769 |
) |
|
Total receivables, net |
|
$ |
176,081 |
|
|
$ |
140,037 |
|
We charge off customer account balances when we have exhausted reasonable collection efforts and determined that the likelihood of collection is remote.
|
(5) |
Inventories |
Inventories consisted of the following at December 31, (amounts in thousands):
|
|
|
2017 |
|
|
2016 |
|
||
|
New equipment |
|
$ |
55,704 |
|
|
$ |
34,451 |
|
|
Used equipment |
|
|
2,421 |
|
|
|
3,461 |
|
|
Parts, supplies and other |
|
|
16,879 |
|
|
|
15,997 |
|
|
Total inventories, net |
|
$ |
75,004 |
|
|
$ |
53,909 |
|
70
The above amounts are presented net of reserves for inventory obsolescence at December 31, 2017 and 2016 totaling approximately $0.9 million and $0.9 million, respectively.
|
(6) |
Property and Equipment |
Net property and equipment consisted of the following at December 31, (amounts in thousands):
|
|
|
2017 |
|
|
2016 |
|
||
|
Land |
|
$ |
7,165 |
|
|
$ |
7,054 |
|
|
Transportation equipment |
|
|
93,550 |
|
|
|
89,168 |
|
|
Building and leasehold improvements |
|
|
55,523 |
|
|
|
53,967 |
|
|
Office and computer equipment |
|
|
53,256 |
|
|
|
51,971 |
|
|
Machinery and equipment |
|
|
15,983 |
|
|
|
15,179 |
|
|
Property under capital leases |
|
|
3,217 |
|
|
|
3,217 |
|
|
Construction in progress |
|
|
4,595 |
|
|
|
3,748 |
|
|
|
|
|
233,289 |
|
|
|
224,304 |
|
|
Less accumulated depreciation and amortization |
|
|
(131,500 |
) |
|
|
(118,812 |
) |
|
Total net property and equipment |
|
$ |
101,789 |
|
|
$ |
105,492 |
|
Total depreciation and amortization on property and equipment was $23.8 million, $27.3 million and $27.3 million for the years ended December 31, 2017, 2016 and 2015, respectively.
|
(7) |
Manufacturer Flooring Plans Payable |
Manufacturer flooring plans payable are financing arrangements for inventory and rental equipment. The interest cost incurred on the manufacturer flooring plans ranged from 0% to the prime rate (4.50% at December 31, 2017) plus an applicable margin at December 31, 2017. Certain manufacturer flooring plans provide for a one to twelve-month reduced interest rate term or a deferred payment period. We recognize interest expense based on the effective interest method. We make payments in accordance with the original terms of the financing agreements. However, we routinely sell equipment that is financed under manufacturer flooring plans prior to the original maturity date of the financing agreement. The related manufacturer flooring plan payable is then paid at the time the equipment being financed is sold. The manufacturer flooring plans payable are secured by the equipment being financed.
Maturities (based on original financing terms) of the manufacturer flooring plans payable as of December 31, 2017 for each of the next three years ending December 31 are as follows (amounts in thousands):
|
2018 |
|
$ |
11,345 |
|
|
2019 |
|
|
10,657 |
|
|
2020 |
|
|
— |
|
|
Thereafter |
|
|
— |
|
|
Total |
|
$ |
22,002 |
|
|
(8) |
Accrued Expenses Payable and Other Liabilities |
Accrued expenses payable and other liabilities consisted of the following at December 31, (amounts in thousands):
|
|
|
2017 |
|
|
2016 |
|
||
|
Payroll and related liabilities |
|
$ |
20,429 |
|
|
$ |
17,842 |
|
|
Sales, use and property taxes |
|
|
9,635 |
|
|
|
9,925 |
|
|
Accrued interest |
|
|
19,134 |
|
|
|
15,112 |
|
|
Accrued insurance |
|
|
4,211 |
|
|
|
4,227 |
|
|
Deferred revenue |
|
|
6,631 |
|
|
|
5,703 |
|
|
Other |
|
|
5,055 |
|
|
|
4,024 |
|
|
Total accrued expenses payable and other liabilities |
|
$ |
65,095 |
|
|
$ |
56,833 |
|
71
On August 24, 2017, we completed an offering of $750 million aggregate principal amount of 5.6250% senior notes due 2025 (the “New Notes”) and the settlement of a cash tender offer (the “Tender Offer”) with respect to our 7% senior notes due 2022 (the “Old Notes”). Net proceeds, after deducting $10.3 million of estimated offering expenses, from the sale of the New Notes totaled approximately $739.7 million. We used a portion of the net proceeds from the sale of the New Notes to repurchase $329.7 million of aggregate principal amount of the Old Notes in early settlement of the Tender Offer, which the Company launched on August 17, 2017. Holders who tendered their Old Notes prior to the early tender deadline received $1,038.90 per $1,000 principal amount of Old Notes tendered, plus accrued and unpaid interest up to, but not including, the payment date of August 24, 2017. Effective as of August 24, 2017, we (i) provided notice of the redemption of all remaining Old Notes that were not validly tendered in the Tender Offer at the expiration time and (ii) satisfied and discharged the indenture governing the Old Notes in accordance with its terms. On September 25, 2017, we redeemed the remaining $300.3 million principal amount outstanding of the Old Notes at a redemption price equal to 103.50% of the principal amount thereof, plus accrued and unpaid interest up to, but not including, the date of redemption.
The New Notes were issued at par and require semiannual interest payments on March 1st and September 1st of each year, commencing on March 1, 2018. No principal payments are due until maturity (September 1, 2025).
The New Notes are redeemable, in whole or in part, at any time on or after September 1, 2020 at specified redemption prices plus accrued and unpaid interest to the date of redemption. We may redeem up to 40% of the aggregate principal amount of the New Notes before September 1, 2020 with the net cash proceeds from certain equity offerings. We may also redeem the New Notes prior to September 1, 2020 at a specified “make-whole” redemption price plus accrued and unpaid interest to the date of redemption.
The New Notes rank equally in right of payment to all of our existing and future senior indebtedness and rank senior to any of our subordinated indebtedness. The New Notes are unconditionally guaranteed on a senior unsecured basis by all of our current and future significant domestic restricted subsidiaries. In addition, the New Notes are effectively subordinated to all of our and the guarantors’ existing and future secured indebtedness, including the Credit Facility, to the extent of the assets securing such indebtedness, and are structurally subordinated to all of the liabilities and preferred stock of any of our subsidiaries that do not guarantee the New Notes.
If we experience a change of control, we will be required to offer to purchase the New Notes at a repurchase price equal to 101% of the principal amount, plus accrued and unpaid interest to the date of repurchase.
The indenture governing the New Notes contains certain covenants that, among other things, limit our ability and the ability of our restricted subsidiaries to: (i) incur additional indebtedness, assume a guarantee or issue preferred stock; (ii) pay dividends or make other equity distributions or payments to or affecting our subsidiaries; (iii) purchase or redeem our capital stock; (iv) make certain investments; (v) create liens; (vi) sell or dispose of assets or engage in mergers or consolidations; (vii) engage in certain transactions with subsidiaries or affiliates; (viii) enter into sale-leaseback transactions; and (ix) engage in certain business activities. Each of the covenants is subject to exceptions and qualifications. As of December 31, 2017, we were in compliance with these covenants.
On November 22, 2017, we closed on an offering of $200 million aggregate principal amount of 5.625% senior notes due 2025 (the “Add-on Notes”) in an unregistered offering through a private placement. The Add-on Notes were priced at 104.25% of the principal amount. Net proceeds from the offering of the Add-on Notes, including accrued interest from August 24, 2017 totaled approximately $209.2 million. The net proceeds of the offering, was used to repay indebtedness outstanding under the Company’s existing senior secured credit facility (the “Credit Facility”) and for the payment of fees and expenses related to the offering. The remainder of the net proceeds will be used for general corporate purposes and to fund potential acquisitions in connection with our ongoing strategy of acquiring rental companies to complement our existing business and footprint.
The Add-on Notes were issued as additional notes under an indenture dated as of August 24, 2017, pursuant to which we previously issued the New Notes as described above. The Add-on Notes have identical terms to, rank equally with and form a part of a single class of securities with the New Notes.
Pursuant to a registration rights agreement entered into between us, the guarantors of the New Notes and the initial purchasers of the New Notes, we agreed to make an offer to exchange (the “Exchange Offer”) the New Notes and guarantees for registered, publicly tradable notes and guarantees that have terms identical in all material respects to the New Notes (except that the exchange notes will not contain any transfer restrictions) within a certain period of time following the completion of the offering. On January 17, 2018, the Company filed a registration statement on Form S-4 with respect to an offer to exchange the New and Add-on Notes and guarantees for registered, publicly tradable notes and guarantees that have terms identical in all material respects to the New and Add-on Notes (except that the exchange notes do not contain any transfer restrictions). This exchange offer closed on is expected to launch and close in the first quarter of 2018.
72
The following table reconciles our Senior Unsecured Notes to our Consolidated Balance Sheets (amounts in thousands):
|
Balance at December 31, 2015 |
|
$ |
627,306 |
|
|
Accretion of discount on Old Notes through December 31, 2016 |
|
|
1,055 |
|
|
Amortization of note premium on Old Notes through December 31, 2016 |
|
|
(887 |
) |
|
Amortization of deferred financing costs on Old Notes through December 31, 2016 |
|
|
237 |
|
|
Balance at December 31, 2016 |
|
$ |
627,711 |
|
|
Accretion of discount on Old Notes through August 24, 2017 |
|
|
683 |
|
|
Amortization of note premium on Old Notes through August 24, 2017 |
|
|
(574 |
) |
|
Amortization of deferred financing costs on Old Notes through August 24, 2017 |
|
|
153 |
|
|
Aggregate principal amount paid on Old Notes |
|
|
(630,000 |
) |
|
Writeoff of unaccreted discount on Old Notes |
|
|
5,294 |
|
|
Writeoff of unamortized premium on Old Notes |
|
|
(4,452 |
) |
|
Writeoff of deferred financing costs on Old Notes |
|
|
1,185 |
|
|
Aggregate principal amount issued on New Notes |
|
|
950,000 |
|
|
Notes discount and deferred transaction costs on New Notes |
|
|
(14,684 |
) |
|
Note premium on New Notes |
|
|
8,500 |
|
|
Accretion of discount on New Notes from August 24, 2017 through December 31, 2017 |
|
|
542 |
|
|
Amortization of note premium on New Notes from August 24, 2017 through December 31, 2017 |
|
|
(375 |
) |
|
Amortization of deferred financing costs on New Notes from August 24, 2017 through December 31, 2017 |
|
|
105 |
|
|
Balance at December 31, 2017 |
|
$ |
944,088 |
|
|
(10) |
Senior Secured Credit Facility |
We and our subsidiaries are parties to a $750.0 million Credit Facility with Wells Fargo Capital Finance, LLC (as successor to General Electric Capital Corporation) as administrative agent, and the lenders named therein.
On December 22, 2017, we amended, extended and restated the Credit Facility by entering into the Fifth Amended and Restated Credit Agreement (the “Amended and Restated Credit Agreement”) by and among the Company, Great Northern Equipment, Inc., H&E Equipment Services (California), LLC, the other credit parties named therein, the lenders named therein, Wells Fargo Capital Finance, LLC, as administrative agent, the other credit parties named therein, the lenders named therein, and the joint lead arrangers, joint book runners, co-syndication agents and documentation agent named therein.
The Amended and Restated Credit Agreement, among other things, (i) extends the maturity date of the credit facility from May 21, 2019 to December 22, 2022, (ii) increases the commitments under the senior secured asset based revolver provided for therein from $602.5 million to $750 million, (iii) increases the uncommitted incremental revolving capacity from $150 million to $250 million, (iv) provides that the unused line fee margin will be either 0.375% or 0.25%, depending on the Average Revolver Usage (as defined in the Amended and Restated Credit Agreement) of the borrowers, (v) lowers the interest rate (a) in the case of base rate revolving loans, to the base rate plus an applicable margin of 0.50% to 1.00% depending on the Average Availability (as defined in the Amended and Restated Credit Agreement) and (b) in the case of LIBOR revolving loans, to LIBOR (as defined in the Amended and Restated Credit Agreement) plus an applicable margin of 1.50% to 2.00%, depending on the Average Availability, (vi) lowers the margin applicable to the letter of credit fee to between 1.50% and 2.00%, depending on the Average Availability, and (vii) permits, subject to certain conditions, an unlimited amount of Permitted Acquisitions, Restricted Payments and prepayments of Indebtedness (in each case, as defined in the Amended and Restated Credit Agreement).
The Amended and Restated Credit Agreement continues to provide for, among other things, a $30 million letter of credit sub-facility, and a guaranty by certain of the Company’s subsidiaries of the obligations under the credit facility. In addition, the credit facility remains secured by substantially all of the assets of the Company and certain of its subsidiaries.
73
At December 31, 2017, we had no borrowings outstanding under the Credit Facility and could borrow up to $742.3 million and remain in compliance with the debt covenants under the Company’s credit facility. At February 15, 2018, we had $742.3 million of available borrowings under our Credit Facility, net of a $7.7 million outstanding letter of credit.
|
(11) |
Capital Lease Obligations |
As of December 31, 2017, we had two capital lease obligations, expiring in 2022 and 2029, respectively. Future minimum capital lease payments, in the aggregate, existing at December 31, 2017 for each of the next five years ending December 31 and thereafter are as follows (amounts in thousands):
|
2018 |
|
$ |
333 |
|
|
2019 |
|
|
333 |
|
|
2020 |
|
|
333 |
|
|
2021 |
|
|
333 |
|
|
2022 |
|
|
123 |
|
|
Thereafter |
|
|
507 |
|
|
Total minimum lease payments |
|
|
1,962 |
|
|
Less: amount representing interest |
|
|
(476 |
) |
|
Present value of minimum lease payments |
|
$ |
1,486 |
|
|
(12) |
Income Taxes |
On December 22, 2017, the Tax Cuts and Jobs Act (the “Act”) was signed into law. Among other changes, the Act reduced the corporate federal income tax rate from 35% to 21%. As a result of the rate change, we recorded a one-time decrease in income tax expense of $66.9 million from the re-measurement of our deferred tax assets and liabilities which is reflected in the tables below.
Our income tax provision (benefit) for the years ended December 31, 2017, 2016 and 2015, consists of the following (amounts in thousands):
|
|
|
Current |
|
|
Deferred |
|
|
Total |
|
|||
|
Year ended December 31, 2017: |
|
|
|
|
|
|
|
|
|
|
|
|
|
U.S. Federal |
|
$ |
— |
|
|
$ |
(54,241 |
) |
|
$ |
(54,241 |
) |
|
State |
|
|
220 |
|
|
|
3,707 |
|
|
|
3,927 |
|
|
|
|
$ |
220 |
|
|
$ |
(50,534 |
) |
|
$ |
(50,314 |
) |
|
Year ended December 31, 2016: |
|
|
|
|
|
|
|
|
|
|
|
|
|
U.S. Federal |
|
$ |
— |
|
|
$ |
21,516 |
|
|
$ |
21,516 |
|
|
State |
|
|
280 |
|
|
|
62 |
|
|
|
342 |
|
|
|
|
$ |
280 |
|
|
$ |
21,578 |
|
|
$ |
21,858 |
|
|
Year ended December 31, 2015: |
|
|
|
|
|
|
|
|
|
|
|
|
|
U.S. Federal |
|
$ |
85 |
|
|
$ |
25,206 |
|
|
$ |
25,291 |
|
|
State |
|
|
634 |
|
|
|
5,446 |
|
|
|
6,080 |
|
|
|
|
$ |
719 |
|
|
$ |
30,652 |
|
|
$ |
31,371 |
|
74
Significant components of our deferred income tax assets and liabilities as of December 31 are as follows (amounts in thousands):
|
|
|
2017 |
|
|
2016 |
|
||
|
Deferred tax assets: |
|
|
|
|
|
|
|
|
|
Accounts receivable |
|
$ |
929 |
|
|
$ |
1,415 |
|
|
Inventories |
|
|
239 |
|
|
|
347 |
|
|
Net operating losses |
|
|
18,165 |
|
|
|
25,117 |
|
|
AMT and tax credits |
|
|
3,565 |
|
|
|
3,522 |
|
|
Sec 263A costs |
|
|
544 |
|
|
|
599 |
|
|
Accrued liabilities |
|
|
2,767 |
|
|
|
4,238 |
|
|
Deferred compensation |
|
|
1,132 |
|
|
|
1,001 |
|
|
Accrued interest |
|
|
365 |
|
|
|
533 |
|
|
Stock-based compensation |
|
|
181 |
|
|
|
283 |
|
|
Goodwill and intangible assets |
|
|
— |
|
|
|
58 |
|
|
Other assets |
|
|
531 |
|
|
|
414 |
|
|
|
|
|
28,418 |
|
|
|
37,527 |
|
|
Valuation allowance |
|
|
(732 |
) |
|
|
(207 |
) |
|
|
|
|
27,686 |
|
|
|
37,320 |
|
|
Deferred tax liabilities: |
|
|
|
|
|
|
|
|
|
Property and equipment |
|
|
(152,235 |
) |
|
|
(213,537 |
) |
|
Investments |
|
|
(1,066 |
) |
|
|
(1,618 |
) |
|
Goodwill and intangible assets |
|
|
(804 |
) |
|
|
— |
|
|
|
|
|
(154,105 |
) |
|
|
(215,155 |
) |
|
Net deferred tax liabilities |
|
$ |
(126,419 |
) |
|
$ |
(177,835 |
) |
The reconciliation between income taxes computed using the statutory federal income tax rate of 35% to the actual income tax expense (benefit) is below for the years ended December 31 (amounts in thousands):
|
|
|
2017 |
|
|
2016 |
|
|
2015 |
|
|||
|
Computed tax at statutory rates |
|
$ |
20,770 |
|
|
$ |
20,660 |
|
|
$ |
26,487 |
|
|
Permanent items - other |
|
|
911 |
|
|
|
904 |
|
|
|
953 |
|
|
Permanent items - excess of tax deductible goodwill |
|
|
(2,130 |
) |
|
|
— |
|
|
|
— |
|
|
State income tax, net of federal tax effect |
|
|
2,563 |
|
|
|
2,115 |
|
|
|
3,892 |
|
|
Change in valuation allowance |
|
|
397 |
|
|
|
207 |
|
|
|
— |
|
|
Change in uncertain tax positions |
|
|
(5,960 |
) |
|
|
66 |
|
|
|
39 |
|
|
Other - change in deferred state rate |
|
|
— |
|
|
|
(2,094 |
) |
|
|
0 |
|
|
Impact of the Act federal rate change |
|
|
(66,865 |
) |
|
|
— |
|
|
|
— |
|
|
|
|
$ |
(50,314 |
) |
|
$ |
21,858 |
|
|
$ |
31,371 |
|
At December 31, 2017, we had available federal net operating loss carry forwards of approximately $83.4 million, which expire in varying amounts from 2030 through 2036. We also had federal alternative minimum tax credit carry forwards at December 31, 2017 of approximately $3.0 million which do not expire and $0.3 million general business credit carry forwards that expire in varying amounts from 2026 and 2036, and state income tax credits of $0.2 million that expire in varying amounts beginning in 2018. The federal and state net operating loss carryforwards in the income tax returns filed included unrecognized tax benefits taken in prior years. These net operating losses for which a deferred tax asset is recognized for financial statement purposes in accordance with ASC 740 are presented net of these unrecognized tax benefits.
Management has concluded that it is more likely than not that the federal deferred tax assets are fully realizable through future reversals of existing taxable temporary differences and future taxable income. Therefore, a valuation allowance is not required to reduce those deferred tax assets as of December 31, 2017. However, for the year ended December 31, 2017, we increased our valuation allowance by $0.4 million for certain state net operating losses expiring soon that may not be utilized.
75
A reconciliation of the beginning and ending balances of the total amounts of gross unrecognized tax benefits is as follows (in thousands):
|
|
|
2017 |
|
|
2016 |
|
||
|
Gross unrecognized tax benefits at January 1 |
|
$ |
6,119 |
|
|
$ |
6,035 |
|
|
Increases in tax positions taken in prior years |
|
|
22 |
|
|
|
26 |
|
|
Decreases in tax positions taken in prior years |
|
|
(22 |
) |
|
|
— |
|
|
Increases in tax positions taken in current year |
|
|
— |
|
|
|
105 |
|
|
Decreases for tax positions taken in current year |
|
|
— |
|
|
|
— |
|
|
Settlements with taxing authorities |
|
|
— |
|
|
|
— |
|
|
Lapse in statute of limitations |
|
|
(6,013 |
) |
|
|
(47 |
) |
|
Gross unrecognized tax benefits at December 31 |
|
$ |
106 |
|
|
$ |
6,119 |
|
The reserves established for the gross amount of unrecognized tax benefits as of December 31, 2017 includes approximately $0.1 million of net unrecognized tax benefits that, if recognized, would affect the effective income tax rate. The statute of limitations lapsed during 2017 for approximately $6.0 million of unrecognized tax benefits. We recognized a reduction of $5.9 million in income tax expense as a result. Consistent with our historical financial reporting, to the extent we incur interest income, interest expense, or penalties related to unrecognized income tax benefits, they are recorded in “Other net income or expense.” The amount of interest and penalties included in the table above are not material. We do not expect a material change in unrecognized tax benefits related to federal and state exposures will occur within the next twelve months.
Our U.S. federal tax returns for 2014 and subsequent years remain subject to examination by tax authorities. We are also subject to examination in various state jurisdictions for 2013 and subsequent years.
|
(13) |
Commitments and Contingencies |
Operating Leases
As of December 31, 2017, we lease certain real estate related to our branch facilities as well as certain office equipment under non-cancelable operating lease agreements expiring at various dates through 2033. Our real estate leases provide for varying terms, including customary renewal options and base rental escalation clauses, for which the related rent expense is accounted for on a straight-line basis during the terms of the respective leases. Additionally, certain real estate leases may require us to pay maintenance, insurance, taxes and other expenses in addition to the stated rental payments. Rent expense on property leases and equipment leases under non-cancelable operating lease agreements for the years ended December 31, 2017, 2016 and 2015 amounted to approximately $20.1 million, $18.3 million and $15.5 million, respectively.
Future minimum operating lease payments existing at December 31, 2017 for each of the next five years ending December 31 and thereafter are as follows (amounts in thousands):
|
2018 |
|
$ |
20,171 |
|
|
2019 |
|
|
20,517 |
|
|
2020 |
|
|
19,379 |
|
|
2021 |
|
|
18,107 |
|
|
2022 |
|
|
16,555 |
|
|
Thereafter |
|
|
85,978 |
|
|
|
|
$ |
180,707 |
|
Legal Matters
We are also involved in various claims and legal actions arising in the ordinary course of business. In the opinion of management, after consultation with legal counsel, the ultimate disposition of these various matters will not have a material adverse effect on the Company’s consolidated financial position, results of operations or liquidity.
76
The Company had outstanding letters of credit issued under its Credit Facility totaling $7.7 million as of December 31, 2017 and 2016, respectively. The 2017 letters of credit expired in January 2018 and were renewed under one combined letter of credit for $7.7 million for a one-year period expiring in January 2019.
|
(14) |
Employee Benefit Plan |
We offer substantially all of our employees’ participation in a qualified 401(k)/profit-sharing plan in which we match employee contributions up to predetermined limits for qualified employees as defined by the plan. For the years ended December 31, 2017, 2016 and 2015, we contributed to the plan, net of employee forfeitures, $2.2 million, $2.0 million and $2.2 million, respectively.
|
(15) |
Deferred Compensation Plans |
In 2001, we assumed, in a business combination, nonqualified employee deferred compensation plans under which certain employees had previously elected to defer a portion of their annual compensation. Upon assumption of the plans, the plans were amended to not allow further participant compensation deferrals. Compensation previously deferred under the plans is payable upon the termination, disability or death of the participants. At December 31, 2017, we have obligations remaining under one deferred compensation plan. All other plans have terminated pursuant to the provisions of each respective plan. The remaining plan accumulates interest each year at a bank’s prime rate in effect at the beginning of January of each year. This rate remains constant throughout the year. The effective rate for the 2017 calendar plan year was 3.75%. The aggregate deferred compensation payable at December 31, 2017 and December 31, 2016 was approximately $1.9 million and $1.8 million, respectively. Included in these amounts at December 31, 2017 and 2016 was accrued interest of $1.4 million and $1.4 million, respectively.
|
(16) |
Related Party Transactions |
John M. Engquist, our Chief Executive Officer, has a 50.0% ownership interest in T&J Partnership from which we leased our Shreveport, Louisiana facility. Mr. Engquist’s mother beneficially owns 50% of the entity. In 2015, we paid T&J Partnership a total of approximately $0.2 million in lease payments. T&J Partnership sold this property in November 2015 to an unrelated party, from whom we now lease the property.
Mr. Engquist has a 30.0% ownership interest in Perkins-McKenzie Insurance Agency, Inc. (“Perkins-McKenzie”), an insurance brokerage firm. Mr. Engquist’s mother and sister have a 12.0% and 6.0% interest, respectively, in Perkins-McKenzie. Perkins-McKenzie brokers a substantial portion of our commercial liability insurance. As the broker, Perkins-McKenzie receives from our insurance provider as a commission a portion of the premiums we pay to the insurance provider. Commissions paid to Perkins-McKenzie on our behalf as insurance broker totaled approximately $0.8 million, $0.9 million and $0.9 million for the years ended December 31, 2017, 2016 and 2015, respectively.
We purchase products and services from, and sell products and services to, B-C Equipment Sales, Inc., in which Mr. Engquist has a 50% ownership interest. In each of the years ended December 31, 2017, 2016 and 2015, our purchases totaled $0.4 million, $0.4 million and $0.2 million, respectively, and our sales to B-C Equipment Sales, Inc. totaled approximately $0.1 million, $0.1 million and $0.1 million, respectively.
|
(17) |
Summarized Quarterly Financial Data (Unaudited) |
The following is a summary of our unaudited quarterly financial results of operations for the years ended December 31, 2017 and 2016 (amounts in thousands, except per share amounts):
|
|
|
First Quarter |
|
|
Second Quarter |
|
|
Third Quarter |
|
|
Fourth Quarter |
|
||||
|
2017: |
|
|
|
|
|
|
|
|
|
|
|
|
|
|
|
|
|
Total revenues |
|
$ |
226,828 |
|
|
$ |
249,363 |
|
|
$ |
259,162 |
|
|
$ |
294,666 |
|
|
Income from operations(1) |
|
|
21,325 |
|
|
|
28,668 |
|
|
|
47,654 |
|
|
|
40,268 |
|
|
Income (loss) before provision (benefit) for income taxes(2) |
|
|
8,530 |
|
|
|
15,668 |
|
|
|
7,577 |
|
|
|
27,569 |
|
|
Net income (loss)(3) |
|
|
5,390 |
|
|
|
9,878 |
|
|
|
8,462 |
|
|
|
85,928 |
|
|
Basic net income (loss) per common share(4) |
|
|
0.15 |
|
|
|
0.28 |
|
|
|
0.24 |
|
|
|
2.41 |
|
|
Diluted net income (loss) per common share(4) |
|
|
0.15 |
|
|
|
0.28 |
|
|
|
0.24 |
|
|
|
2.40 |
|
77
|
|
|
First Quarter |
|
|
Second Quarter |
|
|
Third Quarter |
|
|
Fourth Quarter |
|
||||
|
2016: |
|
|
|
|
|
|
|
|
|
|
|
|
|
|
|
|
|
Total revenues |
|
$ |
247,010 |
|
|
$ |
242,095 |
|
|
$ |
244,686 |
|
|
$ |
244,346 |
|
|
Income from operations |
|
|
22,432 |
|
|
|
25,371 |
|
|
|
33,090 |
|
|
|
29,874 |
|
|
Income before provision for income taxes |
|
|
9,455 |
|
|
|
12,707 |
|
|
|
20,007 |
|
|
|
16,861 |
|
|
Net income |
|
|
5,574 |
|
|
|
7,503 |
|
|
|
11,665 |
|
|
|
12,430 |
|
|
Basic net income per common share(4) |
|
|
0.16 |
|
|
|
0.21 |
|
|
|
0.33 |
|
|
|
0.35 |
|
|
Diluted net income per common share(4) |
|
|
0.16 |
|
|
|
0.21 |
|
|
|
0.33 |
|
|
|
0.35 |
|
(1) Includes approximately $6.5 million and $5.8 million of merger breakup fee proceeds (net of merger costs) for the third and fourth quarters of 2017, respectively. See note 3 for further information.
(2) In addition to the amounts described in (1) above, the third and fourth quarters of 2017 includes a $25.4 million loss on the early extinguishment of debt. See note 9 for further information.
(3) During the fourth quarter of 2017 and as further described in note 12 above, we recorded a one-time decrease in income tax expense of approximately $66.9 million related to the impact from the enactment of the Act legislation.
(4) Because of the method used in calculating per share data, the summation of quarterly per share data may not necessarily total to the per share data computed for the entire year due to rounding.
|
(18) |
Segment Information |
We have identified five reportable segments: equipment rentals, new equipment sales, used equipment sales, parts sales and service revenues. These segments are based upon how management of the Company allocates resources and assesses performance. Non-segmented revenues and non-segmented costs relate to equipment support activities including transportation, hauling, parts freight and damage-waiver charges and are not allocated to the other reportable segments. There were no sales between segments for any of the periods presented. Selling, general, and administrative expenses as well as all other income and expense items below gross profit are not generally allocated to our reportable segments.
We do not compile discrete financial information by our segments other than the information presented below. The following table presents information about our reportable segments (amounts in thousands):
|
|
|
Years Ended December 31, |
|
|||||||||
|
|
|
2017 |
|
|
2016 |
|
|
2015 |
|
|||
|
Segment Revenues: |
|
|
|
|
|
|
|
|
|
|
|
|
|
Equipment rentals |
|
$ |
479,016 |
|
|
$ |
445,227 |
|
|
$ |
443,024 |
|
|
New equipment sales |
|
|
203,301 |
|
|
|
196,688 |
|
|
|
238,172 |
|
|
Used equipment sales |
|
|
107,329 |
|
|
|
96,910 |
|
|
|
118,338 |
|
|
Parts sales |
|
|
107,384 |
|
|
|
109,147 |
|
|
|
111,133 |
|
|
Services revenues |
|
|
62,873 |
|
|
|
64,673 |
|
|
|
63,954 |
|
|
Total segmented revenues |
|
|
959,903 |
|
|
|
912,645 |
|
|
|
974,621 |
|
|
Non-Segmented revenues |
|
|
70,116 |
|
|
|
65,492 |
|
|
|
65,210 |
|
|
Total revenues |
|
$ |
1,030,019 |
|
|
$ |
978,137 |
|
|
$ |
1,039,831 |
|
|
Segment Gross Profit: |
|
|
|
|
|
|
|
|
|
|
|
|
|
Equipment rentals |
|
$ |
231,855 |
|
|
$ |
211,118 |
|
|
$ |
208,985 |
|
|
New equipment sales |
|
|
22,599 |
|
|
|
21,132 |
|
|
|
25,937 |
|
|
Used equipment sales |
|
|
33,197 |
|
|
|
30,172 |
|
|
|
37,000 |
|
|
Parts sales |
|
|
29,671 |
|
|
|
30,181 |
|
|
|
30,303 |
|
|
Services revenues |
|
|
41,762 |
|
|
|
42,834 |
|
|
|
42,261 |
|
|
Total gross profit from segmented revenues |
|
|
359,084 |
|
|
|
335,437 |
|
|
|
344,486 |
|
|
Non-Segmented gross profit |
|
|
824 |
|
|
|
174 |
|
|
|
1,246 |
|
|
Total gross profit |
|
$ |
359,908 |
|
|
$ |
335,611 |
|
|
$ |
345,732 |
|
78
|
|
|
December 31, |
|
|||||
|
|
|
2017 |
|
|
2016 |
|
||
|
Segment identified assets: |
|
|
|
|
|
|
|
|
|
Equipment sales |
|
$ |
58,125 |
|
|
$ |
37,912 |
|
|
Equipment rentals |
|
|
904,824 |
|
|
|
893,816 |
|
|
Parts and service |
|
|
16,879 |
|
|
|
15,997 |
|
|
Total segment identified assets |
|
|
979,828 |
|
|
|
947,725 |
|
|
Non-Segmented identified assets |
|
|
487,889 |
|
|
|
293,886 |
|
|
Total assets |
|
$ |
1,467,717 |
|
|
$ |
1,241,611 |
|
The Company operates primarily in the United States and our sales to international customers for the years ended December 31, 2017, 2016 and 2015 were 0.4%, 0.4% and 0.6%, respectively, of total revenues for the periods presented. No one customer accounted for more than 10% of our revenues on an overall or segmented basis for any of the periods presented.
|
(19) |
Consolidating Financial Information of Guarantor Subsidiaries |
All of the indebtedness of H&E Equipment Services, Inc. is guaranteed by GNE Investments, Inc. and its wholly-owned subsidiary Great Northern Equipment, Inc., H&E Equipment Services (California), LLC, H&E California Holding, Inc., H&E Equipment Services (Mid-Atlantic), Inc. and H&E Finance Corp. The guarantor subsidiaries are all wholly-owned and the guarantees, made on a joint and several basis, are full and unconditional (subject to subordination provisions and subject to a standard limitation which provides that the maximum amount guaranteed by each guarantor will not exceed the maximum amount that can be guaranteed without making the guarantee void under fraudulent conveyance laws). There are no restrictions on H&E Equipment Services, Inc.’s ability to obtain funds from the guarantor subsidiaries by dividend or loan.
The consolidating financial statements of H&E Equipment Services, Inc. and its subsidiaries are included below. The financial statements for H&E Finance Corp. and Yellow Iron Merger Co. are not included within the consolidating financial statements because H&E Finance Corp. and Yellow Iron Merger Co. have no assets or operations.
79
CONDENSED CONSOLIDATING BALANCE SHEET
|
|
|
As of December 31, 2017 |
|
|||||||||||||
|
|
|
H&E Equipment Services |
|
|
Guarantor Subsidiaries |
|
|
Elimination |
|
|
Consolidated |
|
||||
|
|
|
(Amounts in thousands) |
|
|||||||||||||
|
Assets: |
|
|
|
|
|
|
|
|
|
|
|
|
|
|
|
|
|
Cash |
|
$ |
165,878 |
|
|
$ |
— |
|
|
$ |
— |
|
|
$ |
165,878 |
|
|
Receivables, net |
|
|
138,657 |
|
|
|
37,424 |
|
|
|
— |
|
|
|
176,081 |
|
|
Inventories, net |
|
|
63,828 |
|
|
|
11,176 |
|
|
|
— |
|
|
|
75,004 |
|
|
Prepaid expenses and other assets |
|
|
9,030 |
|
|
|
142 |
|
|
|
— |
|
|
|
9,172 |
|
|
Rental equipment, net |
|
|
760,972 |
|
|
|
143,852 |
|
|
|
— |
|
|
|
904,824 |
|
|
Property and equipment, net |
|
|
89,952 |
|
|
|
11,837 |
|
|
|
— |
|
|
|
101,789 |
|
|
Deferred financing costs, net |
|
|
3,772 |
|
|
|
— |
|
|
|
— |
|
|
|
3,772 |
|
|
Investment in guarantor subsidiaries |
|
|
222,217 |
|
|
|
— |
|
|
|
(222,217 |
) |
|
|
— |
|
|
Goodwill |
|
|
1,671 |
|
|
|
29,526 |
|
|
|
— |
|
|
|
31,197 |
|
|
Total assets |
|
$ |
1,455,977 |
|
|
$ |
233,957 |
|
|
$ |
(222,217 |
) |
|
$ |
1,467,717 |
|
|
Liabilities and Stockholders’ Equity: |
|
|
|
|
|
|
|
|
|
|
|
|
|
|
|
|
|
Amount due on senior secured credit facility |
|
$ |
- |
|
|
$ |
— |
|
|
$ |
— |
|
|
$ |
- |
|
|
Accounts payable |
|
|
78,811 |
|
|
|
10,970 |
|
|
|
— |
|
|
|
89,781 |
|
|
Manufacturer flooring plans payable |
|
|
20,300 |
|
|
|
1,702 |
|
|
|
— |
|
|
|
22,002 |
|
|
Accrued expenses payable and other liabilities |
|
|
67,466 |
|
|
|
(2,371 |
) |
|
|
— |
|
|
|
65,095 |
|
|
Dividends payable |
|
|
197 |
|
|
|
(47 |
) |
|
|
— |
|
|
|
150 |
|
|
Senior unsecured notes |
|
|
944,088 |
|
|
|
— |
|
|
|
— |
|
|
|
944,088 |
|
|
Capital leases payable |
|
|
— |
|
|
|
1,486 |
|
|
|
— |
|
|
|
1,486 |
|
|
Deferred income taxes |
|
|
126,419 |
|
|
|
— |
|
|
|
— |
|
|
|
126,419 |
|
|
Deferred compensation payable |
|
|
1,903 |
|
|
|
— |
|
|
|
— |
|
|
|
1,903 |
|
|
Total liabilities |
|
|
1,239,184 |
|
|
|
11,740 |
|
|
|
— |
|
|
|
1,250,924 |
|
|
Stockholders’ equity |
|
|
216,793 |
|
|
|
222,217 |
|
|
|
(222,217 |
) |
|
|
216,793 |
|
|
Total liabilities and stockholders’ equity |
|
$ |
1,455,977 |
|
|
$ |
233,957 |
|
|
$ |
(222,217 |
) |
|
$ |
1,467,717 |
|
80
CONDENSED CONSOLIDATING BALANCE SHEET
|
|
|
As of December 31, 2016 |
|
|||||||||||||
|
|
|
H&E Equipment Services |
|
|
Guarantor Subsidiaries |
|
|
Elimination |
|
|
Consolidated |
|
||||
|
|
|
(Amounts in thousands) |
|
|||||||||||||
|
Assets: |
|
|
|
|
|
|
|
|
|
|
|
|
|
|
|
|
|
Cash |
|
$ |
7,683 |
|
|
$ |
— |
|
|
$ |
— |
|
|
$ |
7,683 |
|
|
Receivables, net |
|
|
112,758 |
|
|
|
27,279 |
|
|
|
— |
|
|
|
140,037 |
|
|
Inventories, net |
|
|
49,509 |
|
|
|
4,400 |
|
|
|
— |
|
|
|
53,909 |
|
|
Prepaid expenses and other assets |
|
|
7,343 |
|
|
|
170 |
|
|
|
— |
|
|
|
7,513 |
|
|
Rental equipment, net |
|
|
743,759 |
|
|
|
150,057 |
|
|
|
— |
|
|
|
893,816 |
|
|
Property and equipment, net |
|
|
93,866 |
|
|
|
11,626 |
|
|
|
— |
|
|
|
105,492 |
|
|
Deferred financing costs, net |
|
|
1,964 |
|
|
|
— |
|
|
|
— |
|
|
|
1,964 |
|
|
Investment in guarantor subsidiaries |
|
|
220,209 |
|
|
|
— |
|
|
|
(220,209 |
) |
|
|
— |
|
|
Goodwill |
|
|
1,671 |
|
|
|
29,526 |
|
|
|
— |
|
|
|
31,197 |
|
|
Total assets |
|
$ |
1,238,762 |
|
|
$ |
223,058 |
|
|
$ |
(220,209 |
) |
|
$ |
1,241,611 |
|
|
Liabilities and Stockholders’ Equity: |
|
|
|
|
|
|
|
|
|
|
|
|
|
|
|
|
|
Amount due on senior secured credit facility |
|
$ |
162,642 |
|
|
$ |
— |
|
|
$ |
— |
|
|
$ |
162,642 |
|
|
Accounts payable |
|
|
36,188 |
|
|
|
3,244 |
|
|
|
— |
|
|
|
39,432 |
|
|
Manufacturer flooring plans payable |
|
|
30,899 |
|
|
|
(119 |
) |
|
|
— |
|
|
|
30,780 |
|
|
Accrued expenses payable and other liabilities |
|
|
58,774 |
|
|
|
(1,941 |
) |
|
|
— |
|
|
|
56,833 |
|
|
Dividends payable |
|
|
106 |
|
|
|
(39 |
) |
|
|
— |
|
|
|
67 |
|
|
Senior unsecured notes |
|
|
627,711 |
|
|
|
— |
|
|
|
— |
|
|
|
627,711 |
|
|
Capital leases payable |
|
|
— |
|
|
|
1,704 |
|
|
|
— |
|
|
|
1,704 |
|
|
Deferred income taxes |
|
|
177,835 |
|
|
|
— |
|
|
|
— |
|
|
|
177,835 |
|
|
Deferred compensation payable |
|
|
1,842 |
|
|
|
— |
|
|
|
— |
|
|
|
1,842 |
|
|
Total liabilities |
|
|
1,095,997 |
|
|
|
2,849 |
|
|
|
— |
|
|
|
1,098,846 |
|
|
Stockholders’ equity |
|
|
142,765 |
|
|
|
220,209 |
|
|
|
(220,209 |
) |
|
|
142,765 |
|
|
Total liabilities and stockholders’ equity |
|
$ |
1,238,762 |
|
|
$ |
223,058 |
|
|
$ |
(220,209 |
) |
|
$ |
1,241,611 |
|
81
CONDENSED CONSOLIDATING STATEMENT OF INCOME
|
|
|
Year Ended December 31, 2017 |
|
|||||||||||||
|
|
|
H&E Equipment Services |
|
|
Guarantor Subsidiaries |
|
|
Elimination |
|
|
Consolidated |
|
||||
|
|
|
(Amounts in thousands) |
|
|||||||||||||
|
Revenues: |
|
|
|
|
|
|
|
|
|
|
|
|
|
|
|
|
|
Equipment rentals |
|
$ |
395,275 |
|
|
$ |
83,741 |
|
|
$ |
— |
|
|
$ |
479,016 |
|
|
New equipment sales |
|
|
166,730 |
|
|
|
36,571 |
|
|
|
— |
|
|
|
203,301 |
|
|
Used equipment sales |
|
|
84,741 |
|
|
|
22,588 |
|
|
|
— |
|
|
|
107,329 |
|
|
Parts sales |
|
|
92,073 |
|
|
|
15,311 |
|
|
|
— |
|
|
|
107,384 |
|
|
Services revenues |
|
|
52,807 |
|
|
|
10,066 |
|
|
|
— |
|
|
|
62,873 |
|
|
Other |
|
|
57,405 |
|
|
|
12,711 |
|
|
|
— |
|
|
|
70,116 |
|
|
Total revenues |
|
|
849,031 |
|
|
|
180,988 |
|
|
|
— |
|
|
|
1,030,019 |
|
|
Cost of revenues: |
|
|
|
|
|
|
|
|
|
|
|
|
|
|
|
|
|
Rental depreciation |
|
|
140,489 |
|
|
|
28,966 |
|
|
|
— |
|
|
|
169,455 |
|
|
Rental expense |
|
|
64,598 |
|
|
|
13,108 |
|
|
|
— |
|
|
|
77,706 |
|
|
New equipment sales |
|
|
148,163 |
|
|
|
32,539 |
|
|
|
— |
|
|
|
180,702 |
|
|
Used equipment sales |
|
|
59,481 |
|
|
|
14,651 |
|
|
|
— |
|
|
|
74,132 |
|
|
Parts sales |
|
|
66,974 |
|
|
|
10,739 |
|
|
|
— |
|
|
|
77,713 |
|
|
Services revenues |
|
|
17,851 |
|
|
|
3,260 |
|
|
|
— |
|
|
|
21,111 |
|
|
Other |
|
|
56,696 |
|
|
|
12,596 |
|
|
|
— |
|
|
|
69,292 |
|
|
Total cost of revenues |
|
|
554,252 |
|
|
|
115,859 |
|
|
|
— |
|
|
|
670,111 |
|
|
Gross profit: |
|
|
|
|
|
|
|
|
|
|
|
|
|
|
|
|
|
Equipment rentals |
|
|
190,188 |
|
|
|
41,667 |
|
|
|
— |
|
|
|
231,855 |
|
|
New equipment sales |
|
|
18,567 |
|
|
|
4,032 |
|
|
|
— |
|
|
|
22,599 |
|
|
Used equipment sales |
|
|
25,260 |
|
|
|
7,937 |
|
|
|
— |
|
|
|
33,197 |
|
|
Parts sales |
|
|
25,099 |
|
|
|
4,572 |
|
|
|
— |
|
|
|
29,671 |
|
|
Services revenues |
|
|
34,956 |
|
|
|
6,806 |
|
|
|
|
|
|
|
41,762 |
|
|
Other |
|
|
709 |
|
|
|
115 |
|
|
|
— |
|
|
|
824 |
|
|
Gross profit |
|
|
294,779 |
|
|
|
65,129 |
|
|
|
— |
|
|
|
359,908 |
|
|
Selling, general and administrative expenses |
|
|
190,392 |
|
|
|
42,392 |
|
|
|
— |
|
|
|
232,784 |
|
|
Equity in earnings of guarantor subsidiaries |
|
|
16,136 |
|
|
|
— |
|
|
|
(16,136 |
) |
|
|
— |
|
|
Merger breakup fee proceeds, net of merger costs |
|
|
5,782 |
|
|
|
— |
|
|
|
|
|
|
|
5,782 |
|
|
Gain from sales of property and equipment, net |
|
|
2,435 |
|
|
|
2,574 |
|
|
|
— |
|
|
|
5,009 |
|
|
Income from operations |
|
|
128,740 |
|
|
|
25,311 |
|
|
|
(16,136 |
) |
|
|
137,915 |
|
|
Other income (expense): |
|
|
|
|
|
|
|
|
|
|
|
|
|
|
|
|
|
Interest expense |
|
|
(45,480 |
) |
|
|
(9,478 |
) |
|
|
— |
|
|
|
(54,958 |
) |
|
Loss on early extinguishment of debt |
|
|
(25,363 |
) |
|
|
— |
|
|
|
— |
|
|
|
(25,363 |
) |
|
Other, net |
|
|
1,447 |
|
|
|
303 |
|
|
|
— |
|
|
|
1,750 |
|
|
Total other expense, net |
|
|
(69,396 |
) |
|
|
(9,175 |
) |
|
|
- |
|
|
|
(78,571 |
) |
|
Income before benefit for income taxes |
|
|
59,344 |
|
|
|
16,136 |
|
|
|
(16,136 |
) |
|
|
59,344 |
|
|
Benefit for income taxes |
|
|
(50,314 |
) |
|
|
— |
|
|
|
— |
|
|
|
(50,314 |
) |
|
Net income |
|
$ |
109,658 |
|
|
$ |
16,136 |
|
|
$ |
(16,136 |
) |
|
$ |
109,658 |
|
82
CONDENSED CONSOLIDATING STATEMENT OF INCOME
|
|
|
Year Ended December 31, 2016 |
|
|||||||||||||
|
|
|
H&E Equipment Services |
|
|
Guarantor Subsidiaries |
|
|
Elimination |
|
|
Consolidated |
|
||||
|
|
|
(Amounts in thousands) |
|
|||||||||||||
|
Revenues: |
|
|
|
|
|
|
|
|
|
|
|
|
|
|
|
|
|
Equipment rentals |
|
$ |
364,654 |
|
|
$ |
80,573 |
|
|
$ |
— |
|
|
$ |
445,227 |
|
|
New equipment sales |
|
|
158,291 |
|
|
|
38,397 |
|
|
|
— |
|
|
|
196,688 |
|
|
Used equipment sales |
|
|
78,956 |
|
|
|
17,954 |
|
|
|
— |
|
|
|
96,910 |
|
|
Parts sales |
|
|
95,105 |
|
|
|
14,042 |
|
|
|
— |
|
|
|
109,147 |
|
|
Services revenues |
|
|
55,391 |
|
|
|
9,282 |
|
|
|
— |
|
|
|
64,673 |
|
|
Other |
|
|
53,276 |
|
|
|
12,216 |
|
|
|
— |
|
|
|
65,492 |
|
|
Total revenues |
|
|
805,673 |
|
|
|
172,464 |
|
|
|
— |
|
|
|
978,137 |
|
|
Cost of revenues: |
|
|
|
|
|
|
|
|
|
|
|
|
|
|
|
|
|
Rental depreciation |
|
|
134,484 |
|
|
|
27,931 |
|
|
|
— |
|
|
|
162,415 |
|
|
Rental expense |
|
|
59,263 |
|
|
|
12,431 |
|
|
|
— |
|
|
|
71,694 |
|
|
New equipment sales |
|
|
140,948 |
|
|
|
34,608 |
|
|
|
— |
|
|
|
175,556 |
|
|
Used equipment sales |
|
|
55,075 |
|
|
|
11,663 |
|
|
|
— |
|
|
|
66,738 |
|
|
Parts sales |
|
|
68,999 |
|
|
|
9,967 |
|
|
|
— |
|
|
|
78,966 |
|
|
Services revenues |
|
|
18,963 |
|
|
|
2,876 |
|
|
|
— |
|
|
|
21,839 |
|
|
Other |
|
|
52,861 |
|
|
|
12,457 |
|
|
|
— |
|
|
|
65,318 |
|
|
Total cost of revenues |
|
|
530,593 |
|
|
|
111,933 |
|
|
|
— |
|
|
|
642,526 |
|
|
Gross profit (loss): |
|
|
|
|
|
|
|
|
|
|
|
|
|
|
|
|
|
Equipment rentals |
|
|
170,907 |
|
|
|
40,211 |
|
|
|
— |
|
|
|
211,118 |
|
|
New equipment sales |
|
|
17,343 |
|
|
|
3,789 |
|
|
|
— |
|
|
|
21,132 |
|
|
Used equipment sales |
|
|
23,881 |
|
|
|
6,291 |
|
|
|
— |
|
|
|
30,172 |
|
|
Parts sales |
|
|
26,106 |
|
|
|
4,075 |
|
|
|
— |
|
|
|
30,181 |
|
|
Services revenues |
|
|
36,428 |
|
|
|
6,406 |
|
|
|
— |
|
|
|
42,834 |
|
|
Other |
|
|
415 |
|
|
|
(241 |
) |
|
|
— |
|
|
|
174 |
|
|
Gross profit |
|
|
275,080 |
|
|
|
60,531 |
|
|
|
— |
|
|
|
335,611 |
|
|
Selling, general and administrative expenses |
|
|
187,369 |
|
|
|
40,760 |
|
|
|
— |
|
|
|
228,129 |
|
|
Equity in earnings of guarantor subsidiaries |
|
|
11,416 |
|
|
|
— |
|
|
|
(11,416 |
) |
|
|
— |
|
|
Gain from sales of property and equipment, net |
|
|
2,789 |
|
|
|
496 |
|
|
|
— |
|
|
|
3,285 |
|
|
Income from operations |
|
|
101,916 |
|
|
|
20,267 |
|
|
|
(11,416 |
) |
|
|
110,767 |
|
|
Other income (expense): |
|
|
|
|
|
|
|
|
|
|
|
|
|
|
|
|
|
Interest expense |
|
|
(44,503 |
) |
|
|
(9,101 |
) |
|
|
— |
|
|
|
(53,604 |
) |
|
Other, net |
|
|
1,617 |
|
|
|
250 |
|
|
|
— |
|
|
|
1,867 |
|
|
Total other expense, net |
|
|
(42,886 |
) |
|
|
(8,851 |
) |
|
|
— |
|
|
|
(51,737 |
) |
|
Income before provision for income taxes |
|
|
59,030 |
|
|
|
11,416 |
|
|
|
(11,416 |
) |
|
|
59,030 |
|
|
Provision for income taxes |
|
|
21,858 |
|
|
|
— |
|
|
|
— |
|
|
|
21,858 |
|
|
Net income |
|
$ |
37,172 |
|
|
$ |
11,416 |
|
|
$ |
(11,416 |
) |
|
$ |
37,172 |
|
83
CONDENSED CONSOLIDATING STATEMENT OF INCOME
|
|
|
Year Ended December 31, 2015 |
|
|||||||||||||
|
|
|
H&E Equipment Services |
|
|
Guarantor Subsidiaries |
|
|
Elimination |
|
|
Consolidated |
|
||||
|
|
|
(Amounts in thousands) |
|
|||||||||||||
|
Revenues: |
|
|
|
|
|
|
|
|
|
|
|
|
|
|
|
|
|
Equipment rentals |
|
$ |
366,160 |
|
|
$ |
76,864 |
|
|
$ |
— |
|
|
$ |
443,024 |
|
|
New equipment sales |
|
|
213,476 |
|
|
|
24,696 |
|
|
|
— |
|
|
|
238,172 |
|
|
Used equipment sales |
|
|
96,114 |
|
|
|
22,224 |
|
|
|
— |
|
|
|
118,338 |
|
|
Parts sales |
|
|
96,743 |
|
|
|
14,390 |
|
|
|
— |
|
|
|
111,133 |
|
|
Services revenues |
|
|
54,483 |
|
|
|
9,471 |
|
|
|
— |
|
|
|
63,954 |
|
|
Other |
|
|
53,051 |
|
|
|
12,159 |
|
|
|
— |
|
|
|
65,210 |
|
|
Total revenues |
|
|
880,027 |
|
|
|
159,804 |
|
|
|
— |
|
|
|
1,039,831 |
|
|
Cost of revenues: |
|
|
|
|
|
|
|
|
|
|
|
|
|
|
|
|
|
Rental depreciation |
|
|
135,511 |
|
|
|
26,578 |
|
|
|
— |
|
|
|
162,089 |
|
|
Rental expense |
|
|
59,384 |
|
|
|
12,566 |
|
|
|
— |
|
|
|
71,950 |
|
|
New equipment sales |
|
|
190,013 |
|
|
|
22,222 |
|
|
|
— |
|
|
|
212,235 |
|
|
Used equipment sales |
|
|
66,888 |
|
|
|
14,450 |
|
|
|
— |
|
|
|
81,338 |
|
|
Parts sales |
|
|
70,555 |
|
|
|
10,275 |
|
|
|
— |
|
|
|
80,830 |
|
|
Services revenues |
|
|
18,689 |
|
|
|
3,004 |
|
|
|
— |
|
|
|
21,693 |
|
|
Other |
|
|
51,763 |
|
|
|
12,201 |
|
|
|
— |
|
|
|
63,964 |
|
|
Total cost of revenues |
|
|
592,803 |
|
|
|
101,296 |
|
|
|
— |
|
|
|
694,099 |
|
|
Gross profit (loss): |
|
|
|
|
|
|
|
|
|
|
|
|
|
|
|
|
|
Equipment rentals |
|
|
171,265 |
|
|
|
37,720 |
|
|
|
— |
|
|
|
208,985 |
|
|
New equipment sales |
|
|
23,463 |
|
|
|
2,474 |
|
|
|
— |
|
|
|
25,937 |
|
|
Used equipment sales |
|
|
29,226 |
|
|
|
7,774 |
|
|
|
— |
|
|
|
37,000 |
|
|
Parts sales |
|
|
26,188 |
|
|
|
4,115 |
|
|
|
— |
|
|
|
30,303 |
|
|
Services revenues |
|
|
35,794 |
|
|
|
6,467 |
|
|
|
— |
|
|
|
42,261 |
|
|
Other |
|
|
1,288 |
|
|
|
(42 |
) |
|
|
— |
|
|
|
1,246 |
|
|
Gross profit |
|
|
287,224 |
|
|
|
58,508 |
|
|
|
— |
|
|
|
345,732 |
|
|
Selling, general and administrative expenses |
|
|
183,235 |
|
|
|
36,991 |
|
|
|
— |
|
|
|
220,226 |
|
|
Equity in earnings of guarantor subsidiaries |
|
|
8,428 |
|
|
|
— |
|
|
|
(8,428 |
) |
|
|
— |
|
|
Gain from sales of property and equipment, net |
|
|
2,255 |
|
|
|
482 |
|
|
|
— |
|
|
|
2,737 |
|
|
Income from operations |
|
|
114,672 |
|
|
|
21,999 |
|
|
|
(8,428 |
) |
|
|
128,243 |
|
|
Other income (expense): |
|
|
|
|
|
|
|
|
|
|
|
|
|
|
|
|
|
Interest expense |
|
|
(40,303 |
) |
|
|
(13,727 |
) |
|
|
— |
|
|
|
(54,030 |
) |
|
Other, net |
|
|
1,307 |
|
|
|
156 |
|
|
|
— |
|
|
|
1,463 |
|
|
Total other expense, net |
|
|
(38,996 |
) |
|
|
(13,571 |
) |
|
|
— |
|
|
|
(52,567 |
) |
|
Income before provision for income taxes |
|
|
75,676 |
|
|
|
8,428 |
|
|
|
(8,428 |
) |
|
|
75,676 |
|
|
Provision for income taxes |
|
|
31,371 |
|
|
|
— |
|
|
|
— |
|
|
|
31,371 |
|
|
Net income |
|
$ |
44,305 |
|
|
$ |
8,428 |
|
|
$ |
(8,428 |
) |
|
$ |
44,305 |
|
84
CONDENSED CONSOLIDATING STATEMENT OF CASH FLOWS
|
|
|
Year Ended December 31, 2017 |
|
|||||||||||||
|
|
|
H&E Equipment Services |
|
|
Guarantor Subsidiaries |
|
|
Elimination |
|
|
Consolidated |
|
||||
|
|
|
(Amounts in thousands) |
|
|||||||||||||
|
Cash flows from operating activities: |
|
|
|
|
|
|
|
|
|
|
|
|
|
|
|
|
|
Net income |
|
$ |
109,658 |
|
|
$ |
16,136 |
|
|
$ |
(16,136 |
) |
|
$ |
109,658 |
|
|
Adjustments to reconcile net income to net cash provided by operating activities: |
|
|
|
|
|
|
|
|
|
|
|
|
|
|
|
|
|
Depreciation and amortization on property and equipment |
|
|
20,742 |
|
|
|
3,048 |
|
|
|
— |
|
|
|
23,790 |
|
|
Depreciation on rental equipment |
|
|
140,489 |
|
|
|
28,966 |
|
|
|
— |
|
|
|
169,455 |
|
|
Amortization of deferred financing costs |
|
|
1,046 |
|
|
|
— |
|
|
|
— |
|
|
|
1,046 |
|
|
Accretion of note discount, net of premium amortization |
|
|
274 |
|
|
|
— |
|
|
|
— |
|
|
|
274 |
|
|
Provision for losses on accounts receivable |
|
|
3,148 |
|
|
|
784 |
|
|
|
— |
|
|
|
3,932 |
|
|
Provision for inventory obsolescence |
|
|
161 |
|
|
|
— |
|
|
|
— |
|
|
|
161 |
|
|
Change in deferred income taxes |
|
|
(50,535 |
) |
|
|
— |
|
|
|
— |
|
|
|
(50,535 |
) |
|
Stock-based compensation expense |
|
|
3,526 |
|
|
|
— |
|
|
|
— |
|
|
|
3,526 |
|
|
Loss on early extinguishment of debt |
|
|
25,363 |
|
|
|
|
|
|
|
|
|
|
|
25,363 |
|
|
Gain from sales of property and equipment, net |
|
|
(2,435 |
) |
|
|
(2,574 |
) |
|
|
— |
|
|
|
(5,009 |
) |
|
Gain from sales of rental equipment, net |
|
|
(24,063 |
) |
|
|
(7,819 |
) |
|
|
— |
|
|
|
(31,882 |
) |
|
Equity in earnings of guarantor subsidiaries |
|
|
(16,136 |
) |
|
|
— |
|
|
|
16,136 |
|
|
|
— |
|
|
Changes in operating assets and liabilities: |
|
|
|
|
|
|
|
|
|
|
|
|
|
|
|
|
|
Receivables |
|
|
(29,083 |
) |
|
|
(10,929 |
) |
|
|
— |
|
|
|
(40,012 |
) |
|
Inventories |
|
|
(23,221 |
) |
|
|
(8,550 |
) |
|
|
— |
|
|
|
(31,771 |
) |
|
Prepaid expenses and other assets |
|
|
(1,687 |
) |
|
|
28 |
|
|
|
— |
|
|
|
(1,659 |
) |
|
Accounts payable |
|
|
42,623 |
|
|
|
7,726 |
|
|
|
— |
|
|
|
50,349 |
|
|
Manufacturer flooring plans payable |
|
|
(10,599 |
) |
|
|
1,821 |
|
|
|
— |
|
|
|
(8,778 |
) |
|
Accrued expenses payable and other liabilities |
|
|
8,660 |
|
|
|
(430 |
) |
|
|
— |
|
|
|
8,230 |
|
|
Deferred compensation payable |
|
|
61 |
|
|
|
— |
|
|
|
— |
|
|
|
61 |
|
|
Net cash provided by operating activities |
|
|
197,992 |
|
|
|
28,207 |
|
|
|
— |
|
|
|
226,199 |
|
|
Cash flows from investing activities: |
|
|
|
|
|
|
|
|
|
|
|
|
|
|
|
|
|
Purchases of property and equipment |
|
|
(17,852 |
) |
|
|
(4,663 |
) |
|
|
— |
|
|
|
(22,515 |
) |
|
Purchases of rental equipment |
|
|
(198,988 |
) |
|
|
(35,221 |
) |
|
|
— |
|
|
|
(234,209 |
) |
|
Proceeds from sales of property and equipment |
|
|
3,528 |
|
|
|
3,978 |
|
|
|
— |
|
|
|
7,506 |
|
|
Proceeds from sales of rental equipment |
|
|
74,090 |
|
|
|
22,053 |
|
|
|
— |
|
|
|
96,143 |
|
|
Investment in subsidiaries |
|
|
14,128 |
|
|
|
— |
|
|
|
(14,128 |
) |
|
|
— |
|
|
Net cash used in investing activities |
|
|
(125,094 |
) |
|
|
(13,853 |
) |
|
|
(14,128 |
) |
|
|
(153,075 |
) |
|
Cash flows from financing activities: |
|
|
|
|
|
|
|
|
|
|
|
|
|
|
|
|
|
Purchases of treasury stock |
|
|
(783 |
) |
|
|
— |
|
|
|
— |
|
|
|
(783 |
) |
|
Borrowings on senior secured credit facility |
|
|
1,193,544 |
|
|
|
— |
|
|
|
— |
|
|
|
1,193,544 |
|
|
Payments on senior secured credit facility |
|
|
(1,356,186 |
) |
|
|
— |
|
|
|
— |
|
|
|
(1,356,186 |
) |
|
Dividends paid |
|
|
(39,164 |
) |
|
|
(8 |
) |
|
|
— |
|
|
|
(39,172 |
) |
|
Principal payments on senior unsecured notes due 2022 |
|
|
(630,000 |
) |
|
|
— |
|
|
|
|
|
|
|
(630,000 |
) |
|
Costs paid to tender and redeem senior unsecured notes due 2022 |
|
|
(23,336 |
) |
|
|
— |
|
|
|
|
|
|
|
(23,336 |
) |
|
Proceeds from issuance of senior unsecured notes due 2025 |
|
|
958,500 |
|
|
|
— |
|
|
|
|
|
|
|
958,500 |
|
|
Payments of deferred financing costs |
|
|
(17,278 |
) |
|
|
— |
|
|
|
|
|
|
|
(17,278 |
) |
|
Payments of capital lease obligations |
|
|
— |
|
|
|
(218 |
) |
|
|
— |
|
|
|
(218 |
) |
|
Capital contributions |
|
|
— |
|
|
|
(14,128 |
) |
|
|
14,128 |
|
|
|
— |
|
|
Net cash provided by (used in) financing activities |
|
|
85,297 |
|
|
|
(14,354 |
) |
|
|
14,128 |
|
|
|
85,071 |
|
|
Net increase in cash |
|
|
158,195 |
|
|
|
— |
|
|
|
— |
|
|
|
158,195 |
|
|
Cash, beginning of year |
|
|
7,683 |
|
|
|
— |
|
|
|
— |
|
|
|
7,683 |
|
|
Cash, end of year |
|
$ |
165,878 |
|
|
$ |
— |
|
|
$ |
— |
|
|
$ |
165,878 |
|
85
CONDENSED CONSOLIDATING STATEMENT OF CASH FLOWS
|
|
|
Year Ended December 31, 2016 |
|
|||||||||||||
|
|
|
H&E Equipment Services |
|
|
Guarantor Subsidiaries |
|
|
Elimination |
|
|
Consolidated |
|
||||
|
|
|
(Amounts in thousands) |
|
|||||||||||||
|
Cash flows from operating activities: |
|
|
|
|
|
|
|
|
|
|
|
|
|
|
|
|
|
Net income |
|
$ |
37,172 |
|
|
$ |
11,416 |
|
|
$ |
(11,416 |
) |
|
$ |
37,172 |
|
|
Adjustments to reconcile net income to net cash provided by operating activities: |
|
|
|
|
|
|
|
|
|
|
|
|
|
|
|
|
|
Depreciation and amortization on property and equipment |
|
|
24,194 |
|
|
|
3,088 |
|
|
|
— |
|
|
|
27,282 |
|
|
Depreciation on rental equipment |
|
|
134,484 |
|
|
|
27,931 |
|
|
|
— |
|
|
|
162,415 |
|
|
Amortization of deferred financing costs |
|
|
1,052 |
|
|
|
— |
|
|
|
— |
|
|
|
1,052 |
|
|
Accretion of note discount, net of premium amortization |
|
|
168 |
|
|
|
— |
|
|
|
— |
|
|
|
168 |
|
|
Provision for losses on accounts receivable |
|
|
2,616 |
|
|
|
521 |
|
|
|
— |
|
|
|
3,137 |
|
|
Provision for inventory obsolescence |
|
|
127 |
|
|
|
— |
|
|
|
— |
|
|
|
127 |
|
|
Change in deferred income taxes |
|
|
21,578 |
|
|
|
— |
|
|
|
— |
|
|
|
21,578 |
|
|
Stock-based compensation expense |
|
|
3,037 |
|
|
|
— |
|
|
|
— |
|
|
|
3,037 |
|
|
Gain from sales of property and equipment, net |
|
|
(2,789 |
) |
|
|
(496 |
) |
|
|
— |
|
|
|
(3,285 |
) |
|
Gain from sales of rental equipment, net |
|
|
(22,780 |
) |
|
|
(6,223 |
) |
|
|
— |
|
|
|
(29,003 |
) |
|
Equity in earnings of guarantor subsidiaries |
|
|
(11,416 |
) |
|
|
— |
|
|
|
11,416 |
|
|
|
— |
|
|
Changes in operating assets and liabilities: |
|
|
|
|
|
|
|
|
|
|
|
|
|
|
|
|
|
Receivables |
|
|
8,783 |
|
|
|
(4,629 |
) |
|
|
— |
|
|
|
4,154 |
|
|
Inventories |
|
|
5,785 |
|
|
|
(1,518 |
) |
|
|
— |
|
|
|
4,267 |
|
|
Prepaid expenses and other assets |
|
|
2,566 |
|
|
|
(25 |
) |
|
|
— |
|
|
|
2,541 |
|
|
Accounts payable |
|
|
(27,771 |
) |
|
|
426 |
|
|
|
— |
|
|
|
(27,345 |
) |
|
Manufacturer flooring plans payable |
|
|
(31,534 |
) |
|
|
(119 |
) |
|
|
— |
|
|
|
(31,653 |
) |
|
Accrued expenses payable and other liabilities |
|
|
2,263 |
|
|
|
(596 |
) |
|
|
— |
|
|
|
1,667 |
|
|
Deferred compensation payable |
|
|
(332 |
) |
|
|
— |
|
|
|
— |
|
|
|
(332 |
) |
|
Net cash provided by operating activities |
|
|
147,203 |
|
|
|
29,776 |
|
|
|
— |
|
|
|
176,979 |
|
|
Cash flows from investing activities: |
|
|
|
|
|
|
|
|
|
|
|
|
|
|
|
|
|
Purchases of property and equipment |
|
|
(19,505 |
) |
|
|
(3,390 |
) |
|
|
— |
|
|
|
(22,895 |
) |
|
Purchases of rental equipment |
|
|
(138,562 |
) |
|
|
(41,147 |
) |
|
|
— |
|
|
|
(179,709 |
) |
|
Proceeds from sales of property and equipment |
|
|
3,190 |
|
|
|
615 |
|
|
|
— |
|
|
|
3,805 |
|
|
Proceeds from sales of rental equipment |
|
|
67,282 |
|
|
|
17,107 |
|
|
|
— |
|
|
|
84,389 |
|
|
Investment in subsidiaries |
|
|
2,749 |
|
|
|
— |
|
|
|
(2,749 |
) |
|
|
— |
|
|
Net cash used in investing activities |
|
|
(84,846 |
) |
|
|
(26,815 |
) |
|
|
(2,749 |
) |
|
|
(114,410 |
) |
|
Cash flows from financing activities: |
|
|
|
|
|
|
|
|
|
|
|
|
|
|
|
|
|
Purchases of treasury stock |
|
|
(561 |
) |
|
|
— |
|
|
|
— |
|
|
|
(561 |
) |
|
Borrowings on senior secured credit facility |
|
|
966,146 |
|
|
|
— |
|
|
|
— |
|
|
|
966,146 |
|
|
Payments on senior secured credit facility |
|
|
(988,361 |
) |
|
|
— |
|
|
|
— |
|
|
|
(988,361 |
) |
|
Dividends paid |
|
|
(39,057 |
) |
|
|
(9 |
) |
|
|
— |
|
|
|
(39,066 |
) |
|
Payments of deferred financing costs |
|
|
- |
|
|
|
— |
|
|
|
|
|
|
|
- |
|
|
Payments of capital lease obligations |
|
|
— |
|
|
|
(203 |
) |
|
|
— |
|
|
|
(203 |
) |
|
Capital contributions |
|
|
— |
|
|
|
(2,749 |
) |
|
|
2,749 |
|
|
|
— |
|
|
Net cash used in financing activities |
|
|
(61,833 |
) |
|
|
(2,961 |
) |
|
|
2,749 |
|
|
|
(62,045 |
) |
|
Net increase in cash |
|
|
524 |
|
|
|
— |
|
|
|
— |
|
|
|
524 |
|
|
Cash, beginning of year |
|
|
7,159 |
|
|
|
— |
|
|
|
— |
|
|
|
7,159 |
|
|
Cash, end of year |
|
$ |
7,683 |
|
|
$ |
— |
|
|
$ |
— |
|
|
$ |
7,683 |
|
86
CONDENSED CONSOLIDATING STATEMENT OF CASH FLOWS
|
|
|
Year Ended December 31, 2015 |
|
|||||||||||||
|
|
|
H&E Equipment Services |
|
|
Guarantor Subsidiaries |
|
|
Elimination |
|
|
Consolidated |
|
||||
|
|
|
(Amounts in thousands) |
|
|||||||||||||
|
Cash flows from operating activities: |
|
|
|
|
|
|
|
|
|
|
|
|
|
|
|
|
|
Net income |
|
$ |
44,305 |
|
|
$ |
8,428 |
|
|
$ |
(8,428 |
) |
|
$ |
44,305 |
|
|
Adjustments to reconcile net income to net cash provided by operating activities: |
|
|
|
|
|
|
|
|
|
|
|
|
|
|
|
|
|
Depreciation and amortization on property and equipment |
|
|
21,443 |
|
|
|
2,925 |
|
|
|
— |
|
|
|
24,368 |
|
|
Depreciation on rental equipment |
|
|
135,511 |
|
|
|
26,578 |
|
|
|
— |
|
|
|
162,089 |
|
|
Amortization of deferred financing costs |
|
|
1,036 |
|
|
|
— |
|
|
|
— |
|
|
|
1,036 |
|
|
Accretion of note discount, net of premium amortization |
|
|
168 |
|
|
|
— |
|
|
|
— |
|
|
|
168 |
|
|
Provision for losses on accounts receivable |
|
|
3,223 |
|
|
|
218 |
|
|
|
— |
|
|
|
3,441 |
|
|
Provision for inventory obsolescence |
|
|
295 |
|
|
|
— |
|
|
|
— |
|
|
|
295 |
|
|
Change in deferred income taxes |
|
|
30,651 |
|
|
|
— |
|
|
|
— |
|
|
|
30,651 |
|
|
Stock-based compensation expense |
|
|
2,655 |
|
|
|
— |
|
|
|
— |
|
|
|
2,655 |
|
|
Gain from sales of property and equipment, net |
|
|
(2,255 |
) |
|
|
(482 |
) |
|
|
— |
|
|
|
(2,737 |
) |
|
Gain from sales of rental equipment, net |
|
|
(27,732 |
) |
|
|
(7,402 |
) |
|
|
— |
|
|
|
(35,134 |
) |
|
Equity in earnings of guarantor subsidiaries |
|
|
(8,428 |
) |
|
|
— |
|
|
|
8,428 |
|
|
|
— |
|
|
Changes in operating assets and liabilities: |
|
|
|
|
|
|
|
|
|
|
|
|
|
|
|
|
|
Receivables |
|
|
9,817 |
|
|
|
3,749 |
|
|
|
— |
|
|
|
13,566 |
|
|
Inventories |
|
|
(12,168 |
) |
|
|
(2,349 |
) |
|
|
— |
|
|
|
(14,517 |
) |
|
Prepaid expenses and other assets |
|
|
(882 |
) |
|
|
(26 |
) |
|
|
— |
|
|
|
(908 |
) |
|
Accounts payable |
|
|
13,298 |
|
|
|
138 |
|
|
|
— |
|
|
|
13,436 |
|
|
Manufacturer flooring plans payable |
|
|
(31,167 |
) |
|
|
— |
|
|
|
— |
|
|
|
(31,167 |
) |
|
Accrued expenses payable and other liabilities |
|
|
(4,604 |
) |
|
|
(391 |
) |
|
|
— |
|
|
|
(4,995 |
) |
|
Deferred compensation payable |
|
|
68 |
|
|
|
— |
|
|
|
— |
|
|
|
68 |
|
|
Net cash provided by operating activities |
|
|
175,234 |
|
|
|
31,386 |
|
|
|
— |
|
|
|
206,620 |
|
|
Cash flows from investing activities: |
|
|
|
|
|
|
|
|
|
|
|
|
|
|
|
|
|
Purchases of property and equipment |
|
|
(23,989 |
) |
|
|
(2,808 |
) |
|
|
— |
|
|
|
(26,797 |
) |
|
Purchases of rental equipment |
|
|
(143,840 |
) |
|
|
(34,932 |
) |
|
|
— |
|
|
|
(178,772 |
) |
|
Proceeds from sales of property and equipment |
|
|
3,738 |
|
|
|
551 |
|
|
|
— |
|
|
|
4,289 |
|
|
Proceeds from sales of rental equipment |
|
|
80,093 |
|
|
|
19,428 |
|
|
|
— |
|
|
|
99,521 |
|
|
Investment in subsidiaries |
|
|
13,426 |
|
|
|
— |
|
|
|
(13,426 |
) |
|
|
— |
|
|
Net cash used in investing activities |
|
|
(70,572 |
) |
|
|
(17,761 |
) |
|
|
(13,426 |
) |
|
|
(101,759 |
) |
|
Cash flows from financing activities: |
|
|
|
|
|
|
|
|
|
|
|
|
|
|
|
|
|
Purchases of treasury stock |
|
|
(470 |
) |
|
|
— |
|
|
|
— |
|
|
|
(470 |
) |
|
Borrowing on senior secured credit facility |
|
|
982,961 |
|
|
|
— |
|
|
|
— |
|
|
|
982,961 |
|
|
Payments on senior secured credit facility |
|
|
(1,058,023 |
) |
|
|
— |
|
|
|
— |
|
|
|
(1,058,023 |
) |
|
Payments of deferred financing cost |
|
|
(725 |
) |
|
|
— |
|
|
|
— |
|
|
|
(725 |
) |
|
Dividends paid |
|
|
(37,107 |
) |
|
|
(7 |
) |
|
|
— |
|
|
|
(37,114 |
) |
|
Payments of capital lease obligations |
|
|
— |
|
|
|
(192 |
) |
|
|
— |
|
|
|
(192 |
) |
|
Capital contributions |
|
|
— |
|
|
|
(13,426 |
) |
|
|
13,426 |
|
|
|
- |
|
|
Net cash used in financing activities |
|
|
(113,364 |
) |
|
|
(13,625 |
) |
|
|
13,426 |
|
|
|
(113,563 |
) |
|
Net decrease in cash |
|
|
(8,702 |
) |
|
|
— |
|
|
|
— |
|
|
|
(8,702 |
) |
|
Cash, beginning of year |
|
|
15,861 |
|
|
|
— |
|
|
|
— |
|
|
|
15,861 |
|
|
Cash, end of year |
|
$ |
7,159 |
|
|
$ |
— |
|
|
$ |
— |
|
|
$ |
7,159 |
|
None.
87
Disclosure Controls and Procedures.
We maintain disclosure controls and procedures that are designed to ensure that information required to be disclosed in the reports that the Company files or furnishes under the Securities Exchange Act of 1934 is recorded, processed, summarized and reported within the time periods specified in the SEC’s rules and forms, and that such information is accumulated and communicated to the Company’s management, including its Chief Executive Officer and Chief Financial Officer, as appropriate, to allow timely decisions regarding required financial disclosure.
Our Chief Executive Officer and Chief Financial Officer (our principal executive officer and principal financial officer, respectively) have evaluated the effectiveness of our disclosure controls and procedures (as defined in Rule 13a-15(e) and 15d-15(e) promulgated under the Securities Exchange Act of 1934, as amended) as of the end of the period covered by this Annual Report on Form 10-K. Based on this evaluation, our principal executive officer and principal financial officer have concluded that, as of December 31, 2017, our current disclosure controls and procedures were effective.
The design of any system of control is based upon certain assumptions about the likelihood of future events, and there can be no assurance that any design will succeed in achieving its stated objectives under all future events, no matter how remote, or that the degree of compliance with the policies or procedures may not deteriorate. Because of its inherent limitations, disclosure controls and procedures may not prevent or detect all misstatements. Accordingly, even effective disclosure controls and procedures can only provide reasonable assurance of achieving their control objectives.
Changes in Internal Control Over Financial Reporting
There were no changes in the Company’s internal control over financial reporting (as defined in Exchange Act Rule 13a-15(f)) that occurred during the fourth quarter ended December 31, 2017 that have materially affected, or are reasonably likely to materially affect, the Company’s internal control over financial reporting.
88
Management’s Report on Internal Control Over Financial Reporting
The management of H&E Equipment Services, Inc. is responsible for establishing and maintaining adequate internal control over financial reporting, as such term is defined in Exchange Act Rules 13a-15(f) and 15d-15(f). Our internal control system was designed to provide reasonable assurance regarding the reliability of financial reporting and the preparation of financial statements for external purposes in accordance with U.S. generally accepted accounting principles.
All internal control systems, no matter how well designed, have inherent limitations. Therefore, even those systems determined to be effective can provide only reasonable assurance with respect to financial statement preparation and presentation. Any evaluation or projection of effectiveness to future periods is also subject to risk that controls may become inadequate due to changes in conditions, or that the degree of compliance with the policies and procedures may deteriorate.
Under the supervision and with the participation of management, including our Chief Executive Officer and Chief Financial Officer, we conducted an evaluation of the effectiveness of our internal control over financial reporting as of December 31, 2017, based on the framework in Internal Control – Integrated Framework (2013) issued by the Committee of Sponsoring Organizations of the Treadway Commission (“COSO”). Based on that evaluation, management concluded that, as of December 31, 2017, our internal control over financial reporting was effective based on these criteria.
The effectiveness of our internal control over financial reporting as of December 31, 2017, has been audited by BDO USA, LLP, an independent registered public accounting firm, as stated in their report, which is included herein.
|
Date: February 22, 2018 |
|
|
|
/s/ John M. Engquist |
|
John M. Engquist |
|
Chief Executive Officer |
|
|
|
/s/ Leslie S. Magee |
|
Leslie S. Magee |
|
Chief Financial Officer |
89
Report of Independent Registered Public Accounting Firm
Shareholders and Board of Directors
H&E Equipment Services, Inc.
Baton Rouge, Louisiana
Opinion on Internal Control over Financial Reporting
We have audited H&E Equipment Services, Inc. (the “Company’s”) internal control over financial reporting as of December 31, 2017, based on criteria established in Internal Control – Integrated Framework (2013) issued by the Committee of Sponsoring Organizations of the Treadway Commission (the “COSO criteria”). In our opinion, the Company maintained, in all material respects, effective internal control over financial reporting as of December 31, 2017, based on the COSO criteria.
We also have audited, in accordance with the standards of the Public Company Accounting Oversight Board (United States) (“PCAOB”), the consolidated balance sheets of the Company and subsidiaries as of December 31, 2017 and 2016, the related consolidated statements of income, stockholders’ equity, and cash flows for each of the three years in the period ended December 31, 2017, and the related notes and schedule, and our report dated February 22, 2018 expressed an unqualified opinion thereon.
Basis for Opinion
The Company’s management is responsible for maintaining effective internal control over financial reporting and for its assessment of the effectiveness of internal control over financial reporting, included in the accompanying Item 9A, Management’s Report on Internal Control over Financial Reporting. Our responsibility is to express an opinion on the Company’s internal control over financial reporting based on our audit. We are a public accounting firm registered with the PCAOB and are required to be independent with respect to the Company in accordance with U.S. federal securities laws and the applicable rules and regulations of the Securities and Exchange Commission and the PCAOB.
We conducted our audit of internal control over financial reporting in accordance with the standards of the PCAOB. Those standards require that we plan and perform the audit to obtain reasonable assurance about whether effective internal control over financial reporting was maintained in all material respects. Our audit included obtaining an understanding of internal control over financial reporting, assessing the risk that a material weakness exists, and testing and evaluating the design and operating effectiveness of internal control based on the assessed risk. Our audit also included performing such other procedures as we considered necessary in the circumstances. We believe that our audit provides a reasonable basis for our opinion.
Definition and Limitations of Internal Control over Financial Reporting
A company’s internal control over financial reporting is a process designed to provide reasonable assurance regarding the reliability of financial reporting and the preparation of financial statements for external purposes in accordance with generally accepted accounting principles. A company’s internal control over financial reporting includes those policies and procedures that (1) pertain to the maintenance of records that, in reasonable detail, accurately and fairly reflect the transactions and dispositions of the assets of the company; (2) provide reasonable assurance that transactions are recorded as necessary to permit preparation of financial statements in accordance with generally accepted accounting principles, and that receipts and expenditures of the company are being made only in accordance with authorizations of management and directors of the company; and (3) provide reasonable assurance regarding prevention or timely detection of unauthorized acquisition, use, or disposition of the company’s assets that could have a material effect on the financial statements.
Because of its inherent limitations, internal control over financial reporting may not prevent or detect misstatements. Also, projections of any evaluation of effectiveness to future periods are subject to the risk that controls may become inadequate because of changes in conditions, or that the degree of compliance with the policies or procedures may deteriorate.
/s/ BDO USA, LLP
Dallas, Texas
February 22, 2018
90
None.
91
The information required by this Item is incorporated herein by reference from the Company’s definitive proxy statement for use in connection with the 2018 Annual Meeting of Stockholders (the “Proxy Statement”) to be filed within 120 days after the end of the Company’s fiscal year ended December 31, 2017.
We have adopted a code of conduct that applies to our Chief Executive Officer and Chief Financial Officer. This code of conduct is available on the Company’s internet website at www.he-equipment.com. The information on our website is not a part of or incorporated by reference into this Annual Report on Form 10-K. If the Company makes any amendments to this code other than technical, administrative or other non-substantive amendments, or grants any waivers, including implicit waivers, from a provision of this code to the Company’s Chief Executive Officer or Chief Financial Officer, the Company will disclose the nature of the amendment or waiver, its effective date and to whom it applies by posting such information on the Company’s internet website at www.he-equipment.com.
The information required by this Item is incorporated herein by reference from the Proxy Statement.
|
Item 12. |
Security Ownership of Certain Beneficial Owners and Management and Related Stockholder Matters |
The information required by this Item is incorporated herein by reference from the Proxy Statement.
The information required by this Item is incorporated herein by reference from the Proxy Statement.
The information required by this Item is incorporated herein by reference from the Proxy Statement.
92
|
(a) |
Documents filed as part of this report: |
|
|
(1) |
Financial Statements |
The Company’s consolidated financial statements listed below have been filed as part of this report:
|
(2) |
Financial Statement Schedule for the years ended December 31, 2017, 2016 and 2015: |
All other schedules are omitted because they are not applicable or not required, or the information appears in the Company’s consolidated financial statements or notes thereto.
|
(3) |
Exhibits: The exhibits to this report are listed in the exhibit index below. |
|
(b) Description of exhibits |
93
|
2.1 |
|
|
|
|
|
|
|
2.2 |
|
|
|
|
|
|
|
2.3 |
|
|
|
|
|
|
|
2.4 |
|
|
|
|
|
|
|
3.1 |
|
|
|
|
|
|
|
3.2 |
|
|
|
|
|
|
|
3.3 |
|
|
|
|
|
|
|
3.4 |
|
|
|
|
|
|
|
3.5 |
|
|
|
|
|
|
|
3.6 |
|
|
|
|
|
|
|
3.7 |
|
|
|
|
|
|
|
3.8 |
|
|
|
|
|
|
|
3.9 |
|
|
|
|
|
|
|
3.10 |
|
|
|
|
|
|
|
3.11 |
|
|
|
|
|
|
|
3.12 |
|
|
|
|
|
|
|
3.13 |
|
|
|
|
|
|
94
|
|
||
|
|
|
|
|
3.15 |
|
|
|
|
|
|
|
3.16 |
|
|
|
|
|
|
|
3.17 |
|
|
|
|
|
|
|
3.18 |
|
|
|
|
|
|
|
4.1 |
|
|
|
|
|
|
|
4.2 |
|
|
|
|
|
|
|
4.3 |
|
|
|
|
|
|
|
4.4 |
|
|
|
|
|
|
|
4.5 |
|
|
|
|
|
|
|
4.6 |
|
|
|
|
|
|
|
4.7 |
|
|
|
|
|
|
|
10.1 |
|
|
|
|
|
|
|
10.2 |
|
|
|
|
|
|
|
10.3 |
|
|
|
|
|
|
95
|
|
||
|
|
|
|
|
10.5 |
|
|
|
|
|
|
|
10.6 |
|
|
|
|
|
|
|
10.7 |
|
|
|
|
|
|
|
|
|
|
|
10.8 |
|
|
|
|
|
|
|
10.9 |
|
|
|
|
|
|
|
10.10 |
|
|
|
|
|
|
|
18.1 |
|
|
|
|
|
|
|
21.1 |
|
|
|
|
|
|
|
23.1 |
|
|
|
|
|
|
|
31.1 |
|
Certification Pursuant to Section 302 of the Sarbanes-Oxley Act of 2002.* |
|
|
|
|
|
31.2 |
|
Certification Pursuant to Section 302 of the Sarbanes-Oxley Act of 2002.* |
|
|
|
|
|
32.1 |
|
|
|
|
|
|
|
101.INS |
|
XBRL Instance Document* |
|
|
|
|
|
101.SCH |
|
XBRL Taxonomy Extension Schema Document* |
|
|
|
|
|
101.CAL |
|
XBRL Taxonomy Extension Calculation Linkbase Document* |
|
|
|
|
|
101.DEF |
|
XBRL Taxonomy Extension Definition Linkbase Document* |
|
|
|
|
|
101.LAB |
|
XBRL Taxonomy Extension Label Linkbase Document* |
|
|
|
|
|
101.PRE |
|
XBRL Taxonomy Extension Presentation Linkbase Document* |
*Filed herewith
**Furnished herewith
†Management contract or compensatory plan or arrangement
None.
96
SCHEDULE II: VALUATION AND QUALIFYING ACCOUNTS
FOR THE YEARS ENDED DECEMBER 31, 2017, 2016 AND 2015
|
Description |
|
Balance at Beginning of Year |
|
|
Additions Charged to Costs and Expenses |
|
|
Deductions |
|
|
Balance at End of Year |
|
||||
|
Year Ended December 31, 2017 |
|
|
|
|
|
|
|
|
|
|
|
|
|
|
|
|
|
Allowance for doubtful accounts receivable |
|
$ |
3,769 |
|
|
$ |
3,932 |
|
|
$ |
(3,928 |
) |
|
$ |
3,773 |
|
|
Allowance for inventory obsolescence |
|
|
900 |
|
|
|
161 |
|
|
|
(114 |
) |
|
|
947 |
|
|
|
|
$ |
4,669 |
|
|
$ |
4,093 |
|
|
$ |
(4,042 |
) |
|
$ |
4,720 |
|
|
Year Ended December 31, 2016 |
|
|
|
|
|
|
|
|
|
|
|
|
|
|
|
|
|
Allowance for doubtful accounts receivable |
|
$ |
4,729 |
|
|
$ |
3,137 |
|
|
$ |
(4,097 |
) |
|
$ |
3,769 |
|
|
Allowance for inventory obsolescence |
|
|
934 |
|
|
|
127 |
|
|
|
(161 |
) |
|
|
900 |
|
|
|
|
$ |
5,663 |
|
|
$ |
3,264 |
|
|
$ |
(4,258 |
) |
|
$ |
4,669 |
|
|
Year Ended December 31, 2015 |
|
|
|
|
|
|
|
|
|
|
|
|
|
|
|
|
|
Allowance for doubtful accounts receivable |
|
$ |
3,288 |
|
|
$ |
3,441 |
|
|
$ |
(2,000 |
) |
|
$ |
4,729 |
|
|
Allowance for inventory obsolescence |
|
|
647 |
|
|
|
295 |
|
|
|
(8 |
) |
|
|
934 |
|
|
|
|
$ |
3,935 |
|
|
$ |
3,736 |
|
|
$ |
(2,008 |
) |
|
$ |
5,663 |
|
97
Pursuant to the requirements of Section 13 or 15(d) of the Securities Exchange Act of 1934, the Registrant has duly caused this report to be signed on its behalf by the undersigned, thereunto duly authorized, on February 22, 2018.
|
H&E EQUIPMENT SERVICES, INC. |
||
|
|
|
|
|
By: |
|
/s/ John M. Engquist |
|
|
|
John M. Engquist |
|
|
|
Its: Chief Executive Officer |
Pursuant to the requirements of the Securities Exchange Act of 1934, this report has been signed below by the following persons on behalf of the Registrant in the capacities and on the dates indicated.
|
Signature |
|
|
|
Capacity |
|
Date |
||
|
|
|
|
|
|
||||
|
By: |
|
/s/ John M. Engquist |
|
|
|
Chief Executive Officer and Director |
|
February 22, 2018 |
|
|
|
John M. Engquist |
|
|
|
(Principal Executive Officer) |
|
|
|
|
|
|
|
|
||||
|
By: |
|
/s/ Leslie S. Magee |
|
|
|
Chief Financial Officer |
|
February 22, 2018 |
|
|
|
Leslie S. Magee |
|
|
|
(Principal Financial and Accounting Officer) |
|
|
|
|
|
|
|
|
||||
|
By: |
|
/s/ Gary W. Bagley |
|
|
|
Chairman and Director |
|
February 22, 2018 |
|
|
|
Gary W. Bagley |
|
|
|
|
|
|
|
|
|
|
|
|
||||
|
By: |
|
/s/ Paul N. Arnold |
|
|
|
Director |
|
February 22, 2018 |
|
|
|
Paul N. Arnold |
|
|
|
|
|
|
|
|
|
|
|
|
||||
|
By: |
|
/s/ Bruce C. Bruckmann |
|
|
|
Director |
|
February 22, 2018 |
|
|
|
Bruce C. Bruckmann |
|
|
|
|
|
|
|
|
|
|
|
|
||||
|
By: |
|
/s/ Patrick L. Edsell |
|
|
|
Director |
|
February 22, 2018 |
|
|
|
Patrick L. Edsell |
|
|
|
|
|
|
|
|
|
|
|
|
||||
|
By: |
|
/s/ Thomas J. Galligan III |
|
|
|
Director |
|
February 22, 2018 |
|
|
|
Thomas J. Galligan III |
|
|
|
|
|
|
|
|
|
|
|
|
||||
|
By: |
|
/s/ Lawrence C. Karlson |
|
|
|
Director |
|
February 22, 2018 |
|
|
|
Lawrence C. Karlson |
|
|
|
|
|
|
|
|
|
|
|
|
||||
|
By: |
|
/s/ John T. Sawyer |
|
|
|
Director |
|
February 22, 2018 |
|
|
|
John T. Sawyer |
|
|
|
|
|
|
98