Attached files
| file | filename |
|---|---|
| EX-32.1 - EXHIBIT 32.1 - DIAMOND HILL INVESTMENT GROUP INC | dhil-20171231xexx321.htm |
| EX-31.2 - EXHIBIT 31.2 - DIAMOND HILL INVESTMENT GROUP INC | dhil-20171231xexx312.htm |
| EX-31.1 - EXHIBIT 31.1 - DIAMOND HILL INVESTMENT GROUP INC | dhil-20171231xexx311.htm |
| EX-23.1 - EXHIBIT 23.1 - DIAMOND HILL INVESTMENT GROUP INC | dhil-20171231xexx231.htm |
| EX-21.1 - EXHIBIT 21.1 - DIAMOND HILL INVESTMENT GROUP INC | dhil-20171231xexx211.htm |
United States
Securities and Exchange Commission
Washington, D.C. 20549
Form 10-K
ANNUAL REPORT PURSUANT TO SECTION 13 OR 15(d)
OF THE SECURITIES EXCHANGE ACT OF 1934
For the fiscal year ended December 31, 2017
Commission file number 000-24498

DIAMOND HILL INVESTMENT GROUP, INC.
(Exact name of registrant as specified in its charter)
Ohio | 65-0190407 | |
(State of incorporation) | (I.R.S. Employer Identification No.) | |
325 John H. McConnell Blvd., Suite 200, Columbus, Ohio 43215 | 43215 | |
(Address of principal executive offices) | (Zip Code) | |
Registrant's telephone number, including area code: (614) 255-3333
Securities registered pursuant to Section 12(b) of the Act:
Title of each class | Name of each exchange on which registered | |
Common shares, no par value | The NASDAQ Stock Market LLC | |
Securities registered pursuant to Section 12(g) of the Act: None
Indicate by check mark if the registrant is a well-known seasoned issuer, as defined in Rule 405 of the Securities Act. Yes ¨ No x
Indicate by check mark if the registrant is not required to file reports pursuant to Section 13 or Section 15(d) of the Act. Yes ¨ No x
Indicate by check mark whether the registrant (1) has filed all reports required to be filed by Section 13 or 15(d) of the Securities Exchange Act of 1934 during the preceding 12 months (or for such shorter period that the registrant was required to file such reports), and (2) has been subject to such filing requirements for the past 90 days. Yes x No ¨
Indicate by check mark whether the registrant has submitted electronically and posted on its corporate Web site, if any, every Interactive Data File required to be submitted and posted pursuant to Rule 405 of Regulation S-T (§ 232.405 of this chapter) during the preceding 12 months (or for such shorter period that the registrant was required to submit and post such files). Yes x No ¨
Indicate by check mark if disclosure of delinquent filers pursuant to Item 405 of Regulation S-K is not contained herein, and will not be contained, to the best of registrant’s knowledge, in definitive proxy or information statements incorporated by reference in Part III of this Form 10-K or any amendment to this Form 10-K x
Indicate by check mark whether the registrant is a large accelerated filer, an accelerated filer, a non-accelerated filer, a smaller reporting company, or an emerging growth company. See the definitions of “large accelerated filer,” “accelerated filer,” “smaller reporting company,” and "emerging growth company" in Rule 12b-2 of the Exchange Act.
Large accelerated filer | ¨ | Accelerated filer | x | |||
Non-accelerated filer | ¨ (Do not check if a smaller reporting company) | Smaller reporting company | ¨ | |||
Emerging growth company | ¨ | |||||
If an emerging growth company, indicate by check mark if the registrant has elected not to use the extended transition period for complying with any new or revised financial accounting standards provided pursuant to Section 13(a) of the Exchange Act. ¨
Indicate by check mark whether the registrant is a shell company (as defined in Rule 12b-2 of the Exchange Act). Yes ¨ No x
Aggregate market value of the registrant’s common shares (the only common equity of the registrant) held by non-affiliates of the registrant, based on the closing price of $199.40 on June 30, 2017 on the NASDAQ Global Select Market was $640,892,537. Calculation of holdings by non-affiliates is based upon the assumption, for these purposes only, that the registrant’s executive officers and directors are affiliates.
The number of shares outstanding of the issuer's common stock, as of February 22, 2018, is 3,488,752 shares.
Documents Incorporated by Reference
Portions of the registrant’s definitive proxy statement for the 2018 Annual Meeting of Shareholders to be filed pursuant to Regulation 14A under the Securities Exchange Act of 1934, as amended, are incorporated by reference into Part III of this report.
Diamond Hill Investment Group, Inc.
Form 10-K
For the Fiscal Year Ended December 31, 2017
Index
Required Information | Page |
2
PART I
Item 1. | Business |
Forward-Looking Statements
Throughout this Annual Report on Form 10-K, Diamond Hill Investment Group, Inc. (the "Company," "we," "us" and "our") may make forward-looking statements within the meaning of Section 27A of the Securities Act of 1933, as amended, and Section 21E of the Securities Exchange Act of 1934, as amended, relating to such matters as anticipated operating results, prospects and levels of assets under management, technological developments, economic trends (including interest rates and market volatility), expected transactions and similar matters. The words “believe,” “expect,” “anticipate,” “estimate,” “should,” “hope,” “seek,” “plan,” “intend” and similar expressions identify forward-looking statements that speak only as of the date thereof. While we believe that the assumptions underlying our forward-looking statements are reasonable, investors are cautioned that any of the assumptions could prove to be inaccurate and, accordingly, our actual results and experiences could differ materially from the anticipated results or other expectations expressed in our forward-looking statements. Factors that could cause such actual results or experiences to differ from results discussed in the forward-looking statements include, but are not limited to: the adverse effect from a decline in the securities markets; a decline in the performance of our products; changes in interest rates; changes in national and local economic and political conditions; the continuing economic uncertainty in various parts of the world; changes in government policy and regulation, including monetary policy; changes in our ability to attract or retain key employees; unforeseen costs and other effects related to legal proceedings or investigations of governmental and self-regulatory organizations; and other risks identified from time-to-time in other public documents on file with the U. S. Securities and Exchange Commission (“SEC”), including those discussed below in Item 1A. Throughout this Annual Report on Form 10-K, when we use the terms the “Company,” “management,” “we,” “us,” and “our,” we mean Diamond Hill Investment Group, Inc. and its subsidiaries.
Overview
The Company, an Ohio corporation organized in April 1990, derives its consolidated revenue and net income from investment advisory and fund administration services provided by its subsidiary, Diamond Hill Capital Management, Inc. (“DHCM”). DHCM is a registered investment adviser under the Investment Advisers Act of 1940. DHCM sponsors, distributes, and provides investment advisory and related services to clients through Diamond Hill Funds (the "Funds"), institutional accounts, an exchange traded fund, and private investment funds. In July of 2016, the Company sold two former wholly owned operating subsidiaries, Beacon Hill Fund Services, Inc. (“BHFS”) and BHIL Distributors, Inc. (“BHIL” and collectively "Beacon Hill"). Until its sale, Beacon Hill provided fund administration and statutory underwriting services.
The Company’s primary objective is to fulfill our fiduciary duty to our clients. Our secondary objective is to grow the intrinsic value of the Company in order to achieve an adequate long-term return for our shareholders.
Investment Advisory Activities
Clients
The Company provides investment advisory services to a broad range of clients, including corporations, mutual funds, retirement plans, public pension funds, endowments, foundations, financial institutions and high net worth individuals. We strive to expand our client base by attracting new clients and earning additional business from existing clients.
Investment Philosophy
We believe intrinsic value is independent of market price and that competitive long-term returns can be achieved by identifying meaningful differences between the two. We believe we can identify those market opportunities and deliver value through our shared commitment to an intrinsic value-based investment philosophy, long-term perspective, and disciplined approach to active investment management.
Investment Process
DHCM’s equity investment process begins with fundamental research focusing on estimating a company’s intrinsic value independent of its current stock price. Bottom-up analysis, which takes into consideration earnings, revenue growth, operating margins and other economic factors, is of primary importance in estimating the intrinsic value of an individual company. A five-year discounted cash flow analysis is the primary methodology we use to determine whether there is a discrepancy between the current market price and DHCM’s estimate of intrinsic value. To forecast the amount and timing of cash flows, our research analysts concentrate on the fundamental economic drivers of the business, including competitive positioning, quality of management, and balance sheet strength. Research analysts also evaluate each company within the context of sector and
3
industry secular trends. Key factors in analyzing sectors and industries include relative pricing power, ability to earn excess returns, long-term capital flow, and other fundamental factors.
DHCM also applies an intrinsic value philosophy and process to the analysis of fixed income securities. Our fixed income investment process is driven by security selection, sector allocation, yield curve positioning, and duration management in concert with the overall management of a high quality portfolio. We seek to generate excess return through the selection of undervalued securities and spread sectors that offer incremental yield and total return in comparison to a benchmark index. We believe that our team of industry specialists and their focus on the entire capital structure of a business often give us an information advantage over our peers.
DHCM believes that many investors’ short-term focus hinders their long-term results, which creates market inefficiencies and therefore opportunities. In addition, not all investors are valuation sensitive. We believe that we can exploit these market anomalies/inefficiencies by possessing a long-term investment temperament and practicing a consistent and repeatable intrinsic value-focused approach to investing.
Investment Advisory Fees
The Company’s principal source of revenue is investment advisory fee income earned from managing client accounts under investment advisory and sub-advisory agreements. The fees earned depend on the type of investment strategy, account size and servicing requirements. Revenues depend on the total value and composition of assets under management (“AUM”). Accordingly, net cash flows from clients, market fluctuations in client portfolios, and the composition of AUM impact our revenues and results of operations. We also have certain agreements which allow us to earn variable rate fees in the event that investment returns exceed targeted amounts during a measurement period.
Investment Strategies
The Company offers several traditional and alternative investment strategies, which are all based on the same intrinsic value philosophy. As of December 31, 2017, we offered the following representative investment strategies to our clients:
1. | Small Cap - Pursues long-term capital appreciation by investing in a portfolio of primarily small capitalization U.S. equity securities. |
2. | Small-Mid Cap - Pursues long-term capital appreciation by investing in a portfolio of primarily small and medium capitalization U.S. equity securities. |
3. | Mid Cap - Pursues long-term capital appreciation by investing in a portfolio of primarily medium capitalization U.S. equity securities. |
4. | Large Cap - Pursues long-term capital appreciation by investing in a portfolio of primarily large capitalization U.S. equity securities. |
5. | All Cap Select - Pursues long-term capital appreciation by investing in a concentrated portfolio of primarily U.S. equity securities across a broad range of market capitalizations. |
6. | Long-Short - Pursues long-term capital appreciation by investing long and selling short primarily U.S. equity securities across a broad range of market capitalizations. |
7. | Research Opportunities - Pursues long-term capital appreciation by investing long and selling short U.S. equity securities across a broad range of market capitalizations, as well as by investing up to 20% in international equity securities and up to 20% in fixed income securities. |
8. | Financial Long-Short - Pursues long-term capital appreciation by investing long and selling short primarily U.S. financial services equity securities across a broad range of market capitalizations. |
9. | Valuation-Weighted 500 - Pursues long-term capital appreciation by investing in large capitalization U.S. equity securities that seek to track the price and total return of the Diamond Hill Valuation-Weighted 500 Index. |
10. | Short Duration Total Return - Pursues maximization of total return consistent with the preservation of capital by investing in high, medium, and low-grade fixed income securities. |
11. | Core Bond - Pursues maximization of total return consistent with the preservation of capital by investing in a diversified portfolio of intermediate and long-term fixed income securities. |
12. | Corporate Credit - Pursues high current income, preservation of capital, and total return over a five-year time horizon by investing primarily in corporate bonds across the credit spectrum. |
13. | High Yield - Pursues high current income with the opportunity for capital appreciation by investing primarily in below-investment grade corporate bonds. |
4
As of January 1, 2018, the Company converted the Diamond Hill Global Fund, L.P. into the Diamond Hill Global Fund. The Diamond Hill Global Fund pursues long-term capital appreciation by investing in U.S. and foreign equity securities of any size, or from any country, including emerging markets.
Investment Results
The Company believes that one of the most important characteristics exhibited by the best investment firms is excellent investment returns for their clients over a long period of time. We are pleased that during our history as an investment advisory firm, we have delivered what we believe are strong long-term investment returns for our clients. Investment returns have been a key driver in the long-term success we have achieved in growing AUM.
Absolute returns for all of our investment strategies were positive in 2017, and as of December 31, 2017, the since-inception returns for nearly all of our strategies exceeded their respective benchmark returns. Our Mid Cap, Short Duration Total Return, Core Bond, and High Yield strategies have less than a five-year track record and, as always, we remain focused on a minimum of five-year periods to evaluate our results.
The following is a summary of the investment returns for each of our Funds as of December 31, 2017, relative to its respective passive benchmark.
As of December 31, 2017 | ||||||||||||||||
Inception | 1 Year | 3 Year | 5 Year | 10 Year | Since Inception | |||||||||||
Diamond Hill Small Cap Fund | 12/29/2000 | 10.95 | % | 7.02 | % | 12.48 | % | 8.45 | % | 11.02 | % | |||||
Russell 2000 Index | 14.65 | % | 9.96 | % | 14.12 | % | 8.71 | % | 8.47 | % | ||||||
Diamond Hill Small-Mid Cap Fund | 12/30/2005 | 8.63 | % | 9.16 | % | 14.61 | % | 10.43 | % | 9.46 | % | |||||
Russell 2500 Index | 16.81 | % | 10.07 | % | 14.33 | % | 9.22 | % | 9.10 | % | ||||||
Diamond Hill Mid Cap Fund | 12/31/2013 | 10.47 | % | 9.68 | % | NA | NA | 9.24 | % | |||||||
Russell Midcap Index | 18.52 | % | 9.58 | % | NA | NA | 10.48 | % | ||||||||
Diamond Hill Large Cap Fund | 6/29/2001 | 20.30 | % | 10.99 | % | 15.64 | % | 8.54 | % | 8.96 | % | |||||
Russell 1000 Index | 21.69 | % | 11.23 | % | 15.71 | % | 8.59 | % | 7.22 | % | ||||||
Diamond Hill All Cap Select Fund | 12/30/2005 | 20.33 | % | 9.25 | % | 16.00 | % | 8.61 | % | 8.84 | % | |||||
Russell 3000 Index | 21.13 | % | 11.12 | % | 15.58 | % | 8.60 | % | 8.88 | % | ||||||
Diamond Hill Long-Short Fund | 6/30/2000 | 5.99 | % | 4.93 | % | 8.89 | % | 4.55 | % | 6.93 | % | |||||
60% Russell 1000 Index / 40% ICE BofAML U.S. T-Bill 0-3 Mo Index | 12.92 | % | 6.88 | % | 9.39 | % | 5.52 | % | 4.36 | % | ||||||
Diamond Hill Research Opportunities Fund | 3/31/2009 | 13.34 | % | 5.77 | % | 10.99 | % | NA | 13.49 | % | ||||||
75% Russell 3000 Index / 25% ICE BofAML U.S. T-Bill 0-3 Mo Index | 15.74 | % | 8.44 | % | 11.65 | % | NA | 13.05 | % | |||||||
Diamond Hill Financial Long-Short Fund | 8/1/1997 | 11.90 | % | 8.41 | % | 13.66 | % | 5.42 | % | 7.79 | % | |||||
80% Russell 3000 Financials Index / 20% ICE BofAML U.S. T-Bill 0-3 Mo Index | 15.92 | % | 10.12 | % | 13.51 | % | 4.57 | % | 5.63 | % | ||||||
Diamond Hill Short Duration Total Return Fund | 7/5/2016 | 4.33 | % | NA | NA | NA | 3.76 | % | ||||||||
Bloomberg Barclays U.S. 1-3 Yr. Gov./Credit Index | 0.84 | % | NA | NA | NA | 0.26 | % | |||||||||
Diamond Hill Core Bond Fund | 7/5/2016 | 4.17 | % | NA | NA | NA | 1.29 | % | ||||||||
Bloomberg Barclays U.S. Aggregate Index | 3.54 | % | NA | NA | NA | 0.15 | % | |||||||||
Diamond Hill Corporate Credit Fund | 9/30/2002 | 7.87 | % | 7.10 | % | 5.78 | % | 7.07 | % | 7.28 | % | |||||
ICE BofAML U.S. Corporate & High Yield Index | 6.66 | % | 4.34 | % | 3.94 | % | 6.02 | % | 6.26 | % | ||||||
Diamond Hill High Yield Fund | 12/4/2014 | 10.36 | % | 8.25 | % | NA | NA | 8.17 | % | |||||||
ICE BofAML U.S. High Yield Index | 7.48 | % | 6.39 | % | NA | NA | 6.02 | % | ||||||||
________________________
- | Fund returns are Class I shares net of fees |
- | Index returns do not reflect any fees |
5
Assets Under Management
The following tables show AUM by product and investment objective, as well as net client cash flows, for the past five years ended December 31, 2017:
Assets Under Management As of December 31, | |||||||||||||||||||
(in millions) | 2017 | 2016 | 2015 | 2014 | 2013 | ||||||||||||||
Proprietary funds | $ | 15,974 | $ | 13,618 | $ | 11,505 | $ | 9,863 | $ | 7,600 | |||||||||
Sub-advised funds | 1,518 | 1,445 | 665 | 665 | 444 | ||||||||||||||
Institutional accounts | 4,825 | 4,318 | 4,671 | 5,128 | 4,142 | ||||||||||||||
Total AUM | $ | 22,317 | $ | 19,381 | $ | 16,841 | $ | 15,656 | $ | 12,186 | |||||||||
Assets Under Management by Investment Strategy As of December 31, | |||||||||||||||||||
(in millions) | 2017 | 2016 | 2015 | 2014 | 2013 | ||||||||||||||
Small Cap | $ | 1,525 | $ | 1,843 | $ | 1,703 | $ | 1,575 | $ | 1,402 | |||||||||
Small-Mid Cap | 3,528 | 3,329 | 2,070 | 1,279 | 780 | ||||||||||||||
Mid Cap | 130 | 59 | 18 | 16 | — | ||||||||||||||
Large Cap | 10,867 | 8,497 | 7,547 | 7,926 | 6,254 | ||||||||||||||
All Cap Select | 450 | 404 | 545 | 432 | 327 | ||||||||||||||
Long-Short | 4,980 | 4,613 | 4,597 | 4,179 | 3,213 | ||||||||||||||
Corporate bonds | 699 | 581 | 361 | 249 | 210 | ||||||||||||||
Core fixed income | 357 | 237 | — | — | — | ||||||||||||||
(Less: Investments in affiliated funds)(a) | (219 | ) | (182 | ) | — | — | — | ||||||||||||
Total AUM | $ | 22,317 | $ | 19,381 | $ | 16,841 | $ | 15,656 | $ | 12,186 | |||||||||
(a) Certain Diamond Hill Funds own shares of the Diamond Hill Short Duration Total Return Fund. The Company reduces its total AUM by these investments held in this affiliated fund.
Change in Assets Under Management For the Year Ended December 31, | |||||||||||||||||||
(in millions) | 2017 | 2016 | 2015 | 2014 | 2013 | ||||||||||||||
AUM at beginning of the year | $ | 19,381 | $ | 16,841 | $ | 15,656 | $ | 12,186 | $ | 9,429 | |||||||||
Net cash inflows (outflows) | |||||||||||||||||||
proprietary funds | 843 | 548 | 1,916 | 1,618 | 713 | ||||||||||||||
sub-advised funds | (164 | ) | 639 | (6 | ) | 166 | (758 | ) | |||||||||||
institutional accounts | (254 | ) | (1,023 | ) | (443 | ) | 478 | (263 | ) | ||||||||||
425 | 164 | 1,467 | 2,262 | (308 | ) | ||||||||||||||
Net market appreciation/(depreciation) and income | 2,511 | 2,376 | (282 | ) | 1,208 | 3,065 | |||||||||||||
Increase during the year | 2,936 | 2,540 | 1,185 | 3,470 | 2,757 | ||||||||||||||
AUM at end of the year | $ | 22,317 | $ | 19,381 | $ | 16,841 | $ | 15,656 | $ | 12,186 | |||||||||
Capacity
The Company’s primary goal is to fulfill our fiduciary duty to clients. We understand that our ability to retain and grow assets as a firm has been, and will be, driven primarily by delivering attractive long-term investment results to our clients. When we have determined that the size of any of our strategies hinders our ability to add value over a passive alternative, we have closed those strategies to new clients and we will continue to do so, which will impact our ability to grow AUM. We have prioritized, and will continue to prioritize, investment results over asset accumulation. Currently, the Long-Short, Small Cap, and Small-Mid Cap strategies are closed to new investors.
We estimate capacity of $25 - 35 billion for our existing equity strategies ($21.3 billion as of December 31, 2017) and capacity of at least $40 billion for our existing fixed income strategies ($1.0 billion as of December 31, 2017). Determining our AUM
6
capacity requires evaluating each of our investment strategies and estimating individual strategy capacity, given market capitalization and concentration constraints as well as investment objectives. Total firm capacity is not simply a sum of the individual strategies and is affected by overlap between strategies. With the development of new products or strategies, our firm level capacity could increase.
Distribution Channels
The Company’s investment advisory services are distributed through multiple channels. Our institutional sales efforts include building relationships with institutional consultants and also establishing direct relationships with institutional clients. Our sales efforts for the Funds include wholesaling to third-party financial intermediaries, including independent registered investment advisers, brokers, financial planners, and wealth advisers, who utilize the Funds in investment programs they construct for their clients.
AUM by Channel
Below is a summary of our AUM by distribution channel for the five years ended December 31, 2017:
AUM by Distribution Channel As of December 31, | |||||||||||||||||||
(in millions) | 2017 | 2016 | 2015 | 2014 | 2013 | ||||||||||||||
Proprietary funds: | |||||||||||||||||||
Registered investment advisers | $ | 4,010 | $ | 3,508 | $ | 2,723 | $ | 2,363 | $ | 1,678 | |||||||||
Independent broker/dealers | 3,581 | 2,922 | 2,329 | 1,862 | 1,400 | ||||||||||||||
Wirehouse broker/dealers | 2,660 | 2,011 | 1,963 | 1,760 | 1,261 | ||||||||||||||
Banks | 3,456 | 3,175 | 2,735 | 2,176 | 1,668 | ||||||||||||||
Defined contribution | 1,840 | 1,535 | 1,218 | 1,232 | 1,226 | ||||||||||||||
Other | 427 | 467 | 537 | 470 | 367 | ||||||||||||||
Total proprietary funds | 15,974 | 13,618 | 11,505 | 9,863 | 7,600 | ||||||||||||||
Sub-advised funds | 1,518 | 1,445 | 665 | 665 | 444 | ||||||||||||||
Institutional accounts: | |||||||||||||||||||
Institutional consultant | 2,357 | 2,074 | 2,370 | 2,681 | 1,965 | ||||||||||||||
Financial intermediary | 1,691 | 1,358 | 1,474 | 1,573 | 1,488 | ||||||||||||||
Direct | 777 | 886 | 827 | 874 | 689 | ||||||||||||||
Total institutional accounts | 4,825 | 4,318 | 4,671 | 5,128 | 4,142 | ||||||||||||||
Total AUM | $ | 22,317 | $ | 19,381 | $ | 16,841 | $ | 15,656 | $ | 12,186 | |||||||||
Growth Strategy
The Company’s growth strategy will remain focused on achieving excellent investment results in all our strategies and providing the highest level of client service. We will continue to focus on the development of distribution channels to enable us to offer our various investment strategies to a broad array of clients. We seek to continue to grow our AUM through our proprietary funds, institutional accounts, and sub-advised funds. We have a targeted strategic business plan to further penetrate our existing distribution channels. Our business development efforts are focused on expanding the institutional consultant channel and plan sponsor network on the institutional side, as well as our intermediary network on the fund side.
Fund Administration Activities
The Company provides fund administration services to the Funds. Fund administration services are broadly defined as portfolio and regulatory compliance, treasury and financial oversight, oversight of back-office service providers such as the custodian, fund accountant, and transfer agent, and general business management and governance of the mutual fund complex. Prior to the sale of Beacon Hill, the Company also provided fund administration services to other third party mutual fund companies and investment advisers.
7
Competition
Competition in the area of investment management is intense, and our competitors include investment management firms, broker-dealers, banks and insurance companies, some of whom offer various investment alternatives, including passive index strategies. Many competitors are better known than the Company, offer a broader range of investment products and have more offices, employees and business development representatives. We compete primarily on the basis of philosophy, performance and client service.
Regulation
The Company and our business are subject to various federal, state and foreign laws and regulations. As a matter of public policy, regulatory bodies are charged with safeguarding the integrity of the securities and other financial markets and with protecting the interests of participants in those markets, including investment advisory clients and shareholders of investment funds. Under these laws and regulations, agencies that regulate investment advisers have broad administrative powers, including the power to limit, restrict or prohibit an investment adviser from carrying on its business in the event the adviser fails to comply with such laws and regulations. Possible sanctions that may be imposed include civil and criminal liability, the suspension of individual employees, limitations on engaging in certain lines of business for specified periods of time, revocation of investment adviser, broker/dealer, and other registrations, censures and fines.
DHCM is registered with the SEC under the Investment Advisers Act of 1940 (the “Advisers Act”) and operates in a highly regulated environment. The Advisers Act imposes numerous obligations on registered investment advisers, including fiduciary duties, recordkeeping requirements, operational requirements and disclosure obligations. All Diamond Hill Funds are registered with the SEC under the Investment Company Act of 1940 and are required to make notice filings with all states where the Funds are offered for sale. Virtually all aspects of our investment advisory and fund administration business are subject to various federal and state laws and regulations.
To the extent that DHCM is a “fiduciary” under the Employee Retirement Income Security Act of 1974 (“ERISA”) with respect to benefit plan clients, it is subject to ERISA regulations. ERISA and applicable provisions of the Internal Revenue Code impose certain duties on persons who are fiduciaries, prohibit certain transactions involving ERISA plan clients, and provide monetary penalties for violations of these prohibitions. The U.S. Department of Labor, which administers ERISA, has been increasingly active in proposing and adopting regulations affecting the asset management industry.
The Company’s trading activities for client accounts are regulated under the Securities Exchange Act of 1934 (the “Exchange Act”), including laws governing trading on inside information, market manipulation and a broad number of trading requirements (e.g., volume limitations, reporting obligations) and market regulation policies in the United States.
The preceding descriptions of the regulatory and statutory provisions applicable to us are not complete and are qualified in their entirety by reference to their respective statutory or regulatory provisions. Failure to comply with these requirements could have a material adverse effect on our business.
Contractual Relationships with the Diamond Hill Funds
The Company is highly dependent on our contractual relationships with the Funds. In the event our advisory or administration agreements with the Funds are terminated, not renewed, or amended to reduce fees, we would be materially and adversely affected. We generated approximately 80%, 74% and 75% of our 2017, 2016 and 2015 revenues, respectively, from our advisory and administrative contracts with the Funds. We consider our relationship with the Funds and their board of trustees to be good, and have no reason to believe that these advisory or administration contracts will not be renewed in the future; however, there is no assurance that the Funds will choose to continue their relationships with the Company. Please see Item 1A for risk factors regarding this relationship.
Employees
As of December 31, 2017, the Company employed 118 full-time equivalent employees. As of December 31, 2016, the number of full-time equivalent employees was 112. We believe that our relationship with our employees is good. Our employee count has grown year-over-year and we expect that general trend to continue.
SEC Filings
The Company maintains an Internet website at www.diamond-hill.com. Our Annual Reports on Form 10-K, Quarterly Reports on Form 10-Q, XBRL instance documents, Current Reports on Form 8-K and amendments to those reports that we file or furnish pursuant to Section 13(a) or 15(d) of the Exchange Act, are made available free of charge, on or through our website, as soon as reasonably practicable after such material is electronically filed with, or furnished to, the SEC. The contents of our
8
website are not incorporated into, or otherwise made a part of, this Annual Report on Form 10-K. Our filings with the Commission may be read and copied at the Commission's Public Reference Room at 100F Street, NE, Washington, DC 20549. These filings are also available on the Commission's web-site at http://www.sec.gov free of charge.
ITEM 1A. | Risk Factors |
Our future results of operations, financial condition, and liquidity, and the market price of our common shares are subject to various risks, including those mentioned below and those that are discussed from time-to-time in our other periodic filings with the SEC. Investors should carefully consider these risks, along with the other information contained in this report, before making an investment decision regarding our common shares. There may be additional risks of which we are currently unaware, or which we currently consider immaterial. The occurrence of any of these risks could have a material adverse effect on our financial condition, results of operations, and liquidity, and the value of our common shares. Please see “Forward Looking Statements” within Item 1 of Part I of this Form 10-K. We assume no obligation to update any forward looking statements as a result of new information, future events or other factors.
Poor investment results of our products could affect our ability to attract new clients or reduce the amount of assets under management, potentially negatively impacting revenue and net income.
If we fail to deliver acceptable investment results for our clients, both in the short and long term, we will likely experience diminished investor interest and a decreased level of AUM. Adverse opinions of the funds we advise published by third parties, including rating agencies and industry analysts, could also decrease our AUM and our revenues.
Investment funds are assessed and rated by independent third parties, including rating agencies, industry analysts and publications. Investors can be influenced by such ratings. If any of the funds we advise receives an adverse report, it could negatively influence the amount of money invested into the fund and increase withdrawals from the fund reducing our AUM and our revenue.
Our success depends on our key personnel, and our financial performance could be negatively affected by the loss of their services.
Our success depends on highly skilled personnel, including portfolio managers, research analysts, and management, many of whom have specialized expertise and extensive experience in the investment management industry. Financial services professionals are in high demand, and we face significant competition for qualified employees. With the exception of R. H. Dillon, our Chairman and a portfolio manager, our employees do not have employment contracts and generally can terminate their employment at any time. We cannot assure that we will be able to retain or replace key personnel. In order to retain or replace our key personnel, we may be required to increase compensation, which would decrease net income. The loss of key personnel could damage our reputation and make it more difficult to retain and attract new employees and clients. A loss of client assets resulting from the departure of key personnel may materially decrease our revenues and net income.
Our AUM, which impacts revenue, is subject to significant fluctuations.
A large majority of our revenue is calculated as a percentage of AUM or is related to the general performance of the equity securities market. A decline in securities prices or in the sale of investment products, or an increase in fund redemptions, generally would reduce revenue and net income. Financial market declines would generally negatively impact the level of our AUM and consequently our revenue and net income. A recession or other economic or political events, both in the United States as well as globally, could also adversely impact our revenue, if such events led to a decreased demand for products, a higher redemption rate, or a decline in securities prices.
Our investment results and/or the growth in our AUM may be constrained if appropriate investment opportunities are not available or if we close certain of our portfolios to new investors.
Our ability to deliver strong investment results depends in large part on our ability to identify appropriate investment opportunities in which to invest client assets. If we are unable to identify sufficient investment opportunities for existing and new client assets on a timely basis, our investment results could be adversely affected. The risk that appropriate investment opportunities may be unavailable is influenced by a number of factors, including general market conditions, and is likely to increase if our AUM increases rapidly. In addition, if we determine that sufficient investment opportunities are not available for a portfolio strategy, or we believe that it is necessary in order to continue to produce attractive returns from a portfolio, we will consider closing the portfolio to new investors. As of December 31, 2017, we have closed three investment strategies to new investors. If we misjudge the point at which it would be optimal to close a portfolio, the investment results of the portfolio could be negatively impacted.
9
Our investment approach may underperform other investment approaches during certain market conditions.
Our investment strategies are best suited for investors with long-term investment horizons. Our investment strategies may not perform well during certain periods of time, including during periods when the market is more narrowly focused on growth-oriented stocks.
Additionally, since we apply the same intrinsic value investment process across all of our strategies, utilizing the same analyst team, and due to overlap in many of our investment strategies, we could have common positions and industry concentrations across many of our strategies at the same time. As such, factors leading one of our investment strategies to underperform may lead other strategies to underperform at the same time.
We are subject to substantial competition in all aspects of our business.
Our investment products compete against a number of investment products and services from:
•asset management firms;
•mutual fund companies;
•commercial banks and thrift institutions;
•insurance companies;
•exchange traded funds;
•hedge funds; and
•brokerage and investment banking firms.
Many of our competitors have substantially greater resources than we have and may operate in more markets or offer a broader range of products, including passively managed or “index” products. Some of these institutions operate in a different regulatory environment, which may give them certain competitive advantages in the investment products and portfolio structures that they offer. We compete with other providers of investment services primarily based upon our philosophy, performance and client service. Some institutions have a broad array of products and distribution channels that make it more difficult for us to compete with them. If current or potential customers decide to use one of our competitors, we could face a significant decline in market share, AUM, revenues, and net income. If we are required to lower our fees in order to remain competitive, our net income could be significantly reduced because some of our expenses are fixed, especially over shorter periods of time, and our expenses may not decrease in proportion to the decrease in revenues. Additionally, over the past several years, investors have generally shown a preference for passive investment products, such as index and exchange traded funds, over actively managed strategies. If this trend continues, our AUM may be negatively impacted.
Market and competitive pressures in recent years have created a trend towards lower management fees in the asset management industry and there can be no assurance that we will be able to maintain our current fee structure. As a result, a shift in our AUM from higher to lower fee generating clients and strategies would result in a decrease in profitability even if our AUM increases or remains unchanged.
The loss of access to or increased fees required by third-party distribution sources to market our portfolios and access our client base could adversely affect our results of operations.
Our ability to attract additional AUM is dependent on our relationship with third-party financial intermediaries. We compensate some of these intermediaries for access to investors and for various marketing services provided. These distribution sources and client bases may not continue to be accessible to us for reasonable terms, or at all. If such access is restricted or eliminated, it could have an adverse effect on our results of operations. Fees paid to financial intermediaries for investor access and marketing services have generally increased in recent years. If such fee increases continue, refusal to pay them could restrict our access to those client bases while paying them could adversely affect our profitability.
A significant portion of the Company’s revenues are based on contracts with the Funds that are subject to termination without cause and on short notice.
The Company is very dependent on our contractual relationships with the Funds. If our advisory or administration agreements with the Funds were terminated, not renewed, or amended to reduce fees, we would be materially and adversely affected. Generally, these agreements are terminable by either party upon 60 days written notice without penalty. The agreements are subject to annual approval by either (i) the board of trustees of the Funds or (ii) a vote of the majority of the outstanding voting securities of each Fund. The agreements automatically terminate in the event of their assignment by either the Company or the Fund. We generated approximately 80%, 74%, and 75% of our 2017, 2016 and 2015 revenues, respectively, from our advisory and administrative contracts with the Funds, including 29%, 17%, and 12% from the advisory contracts with the Diamond Hill Long-Short Fund, Large Cap Fund, and Small-Mid Cap Fund, respectively, during 2017. The loss of the Long-Short Fund,
10
Large Cap Fund, or Small-Mid Cap Fund contracts would have a material adverse effect on the Company. We consider our relationship with the Funds and their board of trustees to be good, and we have no reason to believe that these advisory or administration contracts will not be renewed in the future; however, there can be no assurance that the Funds will choose to continue their relationships with us.
Our investment income and asset levels may be negatively impacted by fluctuations in our investment portfolio.
We currently have a substantial portion of our assets invested in Company sponsored investments. All of these investments are subject to market risk and our non-operating investment income could be adversely affected by adverse market performance. Fluctuations in investment income are expected to occur in the future.
Changes in tax laws and unanticipated tax obligations could have an adverse impact on our financial condition, results of operations and cash flow.
We are subject to federal, state and local income taxes in the United States. Tax authorities may disagree with certain positions we have taken or implement changes in tax policy, which may result in the assessment of additional taxes. We regularly assess the appropriateness of our tax positions and reporting. We cannot provide assurance, however, that we will accurately predict the outcomes of audits, and the actual outcomes of these audits could be unfavorable.
Unauthorized disclosure of sensitive or confidential client or customer information, whether through a breach of our computer systems or otherwise, or other breaches in the security of our systems could severely harm our business.
As part of our business, we collect, process and transmit sensitive and confidential information about our clients and employees, as well as proprietary information about our business. We have policies and procedures pursuant to which we take numerous security measures to prevent cyber-attacks of various kinds as well as fraudulent and inadvertent activity by persons who have been granted access to such confidential information. Nevertheless, our systems, like all technology systems, remain vulnerable to unauthorized access, which can result in theft or corruption of information. In addition, we share information with third parties upon whom we rely for various functions. The systems of such third parties also are vulnerable to cyber threats. Attacks can come from unrelated third parties through the internet, from access to hardware removed from our premises or those of third parties or from employees acting intentionally or inadvertently.
Cyber incidents can involve deliberate attacks designed to corrupt our information systems and make them unusable by us to operate our business; thefts of information used by the perpetrators for gain in numerous ways; or inadvertent releases of information by employees or third parties with whom we do business.
Cyber-attacks that corrupt our information systems and make them unusable by us could impair our ability to advise our clients on investments to be made. Corruption of the systems of our third-party vendors could impact the Company to the same extent as corruption of our own systems. If information about our employees is intentionally stolen or inadvertently made public, that information could be used to commit identity theft, obtain credit in an employee's name or steal from an employee. If information about our business is obtained by unauthorized persons, whether through intentional attacks or inadvertent releases of information, it could be used to harm our competitive position.
Whether information is corrupted, stolen or inadvertently disclosed, and regardless of the nature of the information, whether it be proprietary information or personal information about clients or employees, the results could be multiple and materially harmful to us.
• | Our reputation could be harmed, resulting in the loss of clients, vendors and employees or making payments or concessions to such persons to maintain our relationships with them. The loss of key personnel or contracts with the Funds would be particularly harmful to our business. |
• | Our inability to operate our business fully, even if temporarily, and thus fulfill contracts with clients or vendors could result in terminations of contracts and loss of revenue. |
• | Harm suffered by clients or vendors whose contracts we have breached, or by clients, vendors or employees whose information is compromised, could result in costly litigation against us. |
• | Our need to focus attention on remediation of a cyber problem could take our attention away from the operation of our business, resulting in lost revenue. |
• | We could incur costs to repair systems made inoperable by a cyber-attack and to make changes to our systems to reduce future cyber threats. Those changes could include obtaining additional technologies as well as employing additional personnel and training employees. |
11
• | The interruption of our business or theft of proprietary information could harm our ability to compete. |
All of the above potential results of a cyber incident could have a material adverse effect on the Company's business, financial condition and results of operations.
Operational risks may disrupt our business, result in losses or limit our growth.
We are dependent on the capacity and reliability of the communications, information and technology systems supporting our operations, whether developed, owned and operated by the Company or by third parties. Operational risks such as trading or operational errors, interruption of our financial, accounting, trading, compliance and other data processing systems, the loss of data contained in the systems, or compromised systems due to cyber-attack, could result in a disruption of our business, liability to clients, regulatory intervention or reputational damage, and thus adversely affect our business.
Our business is subject to substantial governmental regulation, which can change frequently and may increase costs of compliance; reduce revenue; result in fines, penalties and lawsuits for noncompliance; and adversely affect our results of operations and financial condition.
Our business is subject to a variety of federal securities laws, including the Investment Advisers Act of 1940, the Investment Company Act of 1940, the Securities Exchange Act of 1934, the Sarbanes-Oxley Act of 2002, and the U.S. PATRIOT Act of 2001 and the Dodd-Frank Wall Street Reform and Consumer Protection Act. In addition, we are subject to significant regulation and oversight by the SEC. Changes in legal, regulatory, accounting, tax and compliance requirements could have a significant effect on our operations and results, including but not limited to increased expenses and reduced investor interest in certain funds and other investment products we offer. We continually monitor legislative, tax, regulatory, accounting, and compliance developments that could impact our business. We and our directors, officers and employees could be subject to lawsuits or regulatory proceedings for violations of such laws and regulations, which could result in the payment of fines or penalties and cause reputational harm to us. Such harm could negatively affect our financial condition and results of operations, as well as divert management's attention from operations.
We continue to seek to understand, evaluate and, when possible, manage and control these and other business risks.
Trading in our common shares is limited, which may adversely affect the time and the price at which you can sell your shares of the Company.
Although our common shares are listed on the NASDAQ Global Select Market, the shares are held by a relatively small number of shareholders, and trading in our common shares is not active. The spread between the bid and the asked prices is often wide. As a result, you may not be able to sell your shares on short notice, and the sale of a large number of shares at one time could temporarily depress the market price. In addition, certain shareholders, including certain directors and officers of the Company, own a significant number of shares. The sale of a large number of shares by any such individual could temporarily depress the market price.
ITEM 1B. | Unresolved Staff Comments |
None.
ITEM 2. | Properties |
The Company leases office space at one location in Columbus, Ohio.
The Company does not own any real estate or interests in real estate.
ITEM 3. | Legal Proceedings |
From time to time, the Company is party to ordinary routine litigation that is incidental to its business. There are currently no such matters pending that the Company believes could have a material adverse effect on its consolidated financial statements.
ITEM 4. | Mine Safety Disclosures |
Not applicable.
12
PART II
ITEM 5. | Market for Registrant’s Common Equity, Related Stockholder Matters and Issuer Purchases of Equity Securities |
The following performance graph compares the total shareholder return of an investment in our common shares to that of the Russell Microcap® Index, and to a peer group index of publicly traded asset management firms for the five-year period ended on December 31, 2017. The graph assumes that the value of the investment in our common shares and each index was $100 on December 31, 2012. Total return includes reinvestment of all dividends. The Russell Microcap® Index makes up less than 3% of the U.S. equity market and is a market-value-weighted index of the smallest 1,000 securities in the small-cap Russell 2000® Index plus the next 1,000 smallest securities. Peer Group returns are weighted by the market capitalization of each firm at the beginning of the measurement period. The historical information set forth below is not necessarily indicative of future performance. We do not make or endorse any predictions as to future stock performance.
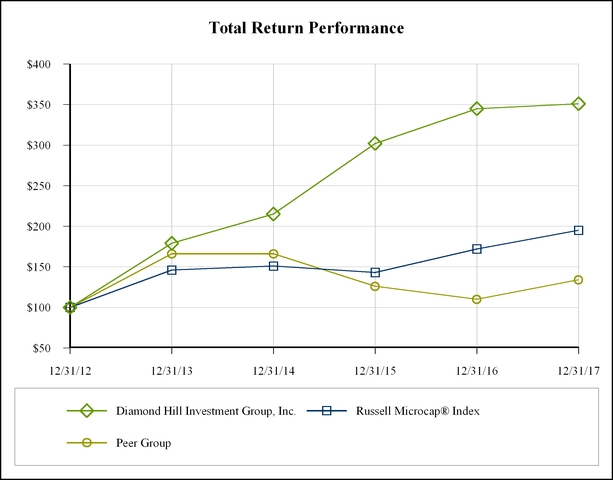
12/31/2012 | 12/31/2013 | 12/31/2014 | 12/31/2015 | 12/31/2016 | 12/31/2017 | Cumulative 5 Year Total Return | |||||||
Diamond Hill Investment Group, Inc. | $100 | $179 | $215 | $302 | $345 | $351 | 251 | % | |||||
Russell Microcap® Index | $100 | $146 | $151 | $143 | $172 | $195 | 95 | % | |||||
Peer Group* | $100 | $166 | $166 | $126 | $110 | $134 | 34 | % | |||||
* The Peer Group is based upon all asset managers with market cap of less than $5 billion excluding (i) firms whose primary business is hedge fund or private equity, and (ii) firms with multiple lines of business. The following companies are included in the Peer Group: Alliance Bernstein Holding L.P.; Cohen & Steers, Inc.; Federated Investors, Inc.; GAMCO Investors, Inc.; Hennessy Advisors, Inc.; Legg Mason, Inc.; Manning & Napier, Inc.; Pzena Investment Management, Inc.; Teton Advisors, Inc.; U.S. Global Investors, Inc.; Virtus Investment Partners, Inc.; Waddell & Reed Financial, Inc.; Wisdomtree Investments, Inc.; and Westwood Holdings Group, Inc.
13
The Company’s common shares trade on the NASDAQ Global Select Market under the symbol DHIL. The following table sets forth the high and low sales prices during each quarter of 2017 and 2016:
2017 | 2016 | ||||||||||||||||||||||
High Price | Low Price | Dividend Per Share | High Price | Low Price | Dividend Per Share | ||||||||||||||||||
Quarter ended: | |||||||||||||||||||||||
March 31 | $ | 210.95 | $ | 183.60 | $ | — | $ | 192.91 | $ | 154.21 | $ | — | |||||||||||
June 30 | $ | 207.40 | $ | 188.34 | $ | — | $ | 198.11 | $ | 167.00 | $ | — | |||||||||||
September 30 | $ | 214.66 | $ | 188.71 | $ | — | $ | 198.40 | $ | 179.71 | $ | — | |||||||||||
December 31 | $ | 217.83 | $ | 204.87 | $ | 7.00 | $ | 212.79 | $ | 172.30 | $ | 6.00 | |||||||||||
Due to the relatively low trading volume of our shares, bid/ask spreads can be wide at times and, therefore, quoted prices may not be indicative of the price a shareholder may receive in an actual transaction. During the years ended December 31, 2017 and 2016, approximately 2,697,958 and 2,360,037, respectively, of our common shares were traded. The dividends indicated above were special dividends. We have not paid regular quarterly dividends in the past, and have no present intention of paying regular quarterly dividends in the future. The approximate number of record holders of our common shares at December 31, 2017 was 212, although we believe that the number of beneficial owners of our common shares is substantially greater.
Purchases of Equity Securities by the Issuer and Affiliated Purchasers
The Company did not purchase any of our common shares through the repurchase program during the year ended December 31, 2017. The following table sets forth information regarding our repurchase program of our common shares and shares withheld for tax payments due upon vesting of employee restricted stock units and restricted stock awards which vested during the fourth quarter of fiscal year 2017:
Period | Total Number of Shares Purchased(a) | Average Price Paid Per Share | Total Number of Shares Purchased as part of Publicly Announced Plans or Programs | Maximum Number of Shares That May Yet Be Purchased Under the Plans or Programs(b) | ||||||||
October 1, 2017 through October 31, 2017 | 1,729 | $ | 212.35 | — | 318,433 | |||||||
November 1, 2017 through November 30, 2017 | — | $ | — | — | 318,433 | |||||||
December 1, 2017 through December 31, 2017 | 8,777 | $ | 206.10 | — | 318,433 | |||||||
Total | 10,506 | $ | 207.13 | — | 318,433 | |||||||
(a) | All of the 10,506 shares of the Company's common shares purchased during the quarter ended December 31, 2017 represented shares withheld for tax payments due upon the vesting of employee restricted stock units and restricted stock awards which vested during the quarter. |
(b) | The Company currently has a share repurchase program where the Board of Directors has authorized management to repurchase up to 350,000 of the Company's Common Shares in the open market and in private transactions in accordance with applicable securities laws. Our share repurchase program is not subject to an expiration date. |
We sold no equity securities of the Company during 2017 that were not registered under the Securities Act of 1933.
14
ITEM 6. | Selected Financial Data |
The following selected financial data should be read in conjunction with our Consolidated Financial Statements and related notes and Management’s Discussion and Analysis of Financial Condition and Results of Operations contained in this Annual Report on Form 10-K.
For the Years Ended December 31, | |||||||||||||||||||
(in thousands, except per share data) | 2017 | 2016 | 2015 | 2014 | 2013 | ||||||||||||||
Income Statement Data: | |||||||||||||||||||
Total revenues | $ | 145,202 | $ | 136,103 | $ | 124,426 | $ | 104,559 | $ | 81,432 | |||||||||
Compensation and related costs | 54,856 | 52,265 | 47,951 | 43,892 | 40,852 | ||||||||||||||
Other expenses | 23,345 | 20,769 | 17,755 | 13,207 | 9,898 | ||||||||||||||
Total expenses | 78,201 | 73,034 | 65,706 | 57,099 | 50,750 | ||||||||||||||
Net operating income | 67,001 | 63,069 | 58,720 | 47,460 | 30,682 | ||||||||||||||
Operating profit margin | 46 | % | 46 | % | 47 | % | 45 | % | 38 | % | |||||||||
Net income | 51,602 | 46,594 | 37,074 | 31,581 | 22,155 | ||||||||||||||
Net income attributable to common shareholders | 49,989 | 46,052 | 37,074 | 31,581 | 22,155 | ||||||||||||||
Per Share Information: | |||||||||||||||||||
Basic earnings | $ | 14.49 | $ | 13.52 | $ | 11.31 | $ | 9.88 | $ | 7.05 | |||||||||
Diluted earnings | 14.48 | 13.49 | 11.03 | 9.67 | 6.94 | ||||||||||||||
Cash dividend declared | 7.00 | 6.00 | 5.00 | 4.00 | 3.00 | ||||||||||||||
Weighted Average Shares Outstanding | |||||||||||||||||||
Basic | 3,449 | 3,407 | 3,278 | 3,196 | 3,142 | ||||||||||||||
Diluted | 3,452 | 3,413 | 3,360 | 3,266 | 3,194 | ||||||||||||||
At December 31, | |||||||||||||||||||
2017 | 2016 | 2015 | 2014 | 2013 | |||||||||||||||
Balance Sheet Data (in thousands): | |||||||||||||||||||
Total assets | $ | 250,388 | $ | 199,718 | $ | 145,187 | $ | 107,709 | $ | 75,353 | |||||||||
Long-term debt | — | — | — | — | — | ||||||||||||||
Shareholders equity | 172,444 | 139,224 | 105,314 | 74,319 | 44,943 | ||||||||||||||
Book value per share | $ | 49.69 | $ | 40.81 | $ | 30.84 | $ | 22.40 | $ | 13.80 | |||||||||
Assets Under Management (in millions) | $ | 22,317 | $ | 19,381 | $ | 16,841 | $ | 15,656 | $ | 12,186 | |||||||||
Net Client Inflows (Outflows) (in millions) | 425 | 164 | 1,467 | 2,262 | (308 | ) | |||||||||||||
ITEM 7. | Management’s Discussion and Analysis of Financial Condition and Results of Operations |
In this section, we discuss and analyze the consolidated results of operations for the past three fiscal years and other factors that may affect future financial performance. This discussion should be read in conjunction with our Consolidated Financial Statements, Notes to Consolidated Financial Statements, and Selected Financial Data contained in this Form 10-K.
Business Environment
U.S. equity markets were strong throughout 2017, with all major indices finishing the year at all-time highs. A major theme in 2017 was the performance of growth over value, a gap which continued to widen as the year went on. Investors placed a premium on growth, which propelled the Russell 1000 Growth Index to a significant outperformance compared to the Russell 1000 Value Index. This environment makes it more challenging for long-term intrinsic value managers like DHCM to outperform our respective benchmarks.
Additionally, the ongoing discussion around active versus passive management continued in 2017. We continue to believe that Diamond Hill strategies will outperform their respective passive benchmarks over a full market cycle, driven by a shared commitment to our intrinsic value-based investment philosophy, long-term perspective, disciplined approach, and alignment with our clients’ interests.
15
Assessing the impact of macroeconomic factors has been a more important part of estimating the long-term intrinsic value of companies in recent years; however, it is still just one of many factors that we consider. As always, bottom-up analysis is of primary importance in estimating the intrinsic value of an individual company, which includes both valuation and business fundamentals.
Low interest rates, high corporate profit margins, and steady economic growth with low inflation have continued to contribute to historically high stock valuations. Despite high valuations and extremely low volatility, we see no immediate signs of fundamental excess. Corporate tax reform is likely to boost earnings growth in the near term with most U.S. companies benefiting from a reduced tax burden. In addition, repatriation of cash held overseas and a more competitive tax regime may lead to increased levels of investment in the United States.
Given current valuation levels, we expect positive but below-average equity market returns over the next five years. Prospective returns are likely to be tempered by the combination of above-average price/earnings multiples applied to already very strong levels of corporate profit margins.
Spread levels in both the investment grade and high yield credit markets remain compressed as investors continue their search for yield. As such, we believe strong fundamental analysis and a focus on long-term company and collateral performance are the keys to security selection in our fixed income strategies.
We believe we can achieve better-than-market returns over the next five years through active portfolio management, and our primary focus is always on achieving value-added results for our clients. Our intrinsic value investment philosophy is shared by all of our portfolio managers and research analysts, allowing us to apply our investment discipline consistently across all strategies.
A large majority of our revenue is calculated as a percentage of AUM and is therefore impacted by the overall business and economic environment described above. Financial market declines or deterioration in the economic environment would generally negatively impact the level of our AUM, and consequently our revenue and net income.
Key Financial Performance Indicators
There are a variety of key performance indicators the Company monitors in order to evaluate our business results. The following table presents the results of certain key performance indicators over the past three fiscal years:
For the Years Ended December 31, | |||||||||||
2017 | 2016 | 2015 | |||||||||
Ending AUM (in millions) | $ | 22,317 | $ | 19,381 | $ | 16,841 | |||||
Average AUM (in millions) | 20,876 | 17,780 | 16,415 | ||||||||
Net cash inflows (in millions) | 425 | 164 | 1,467 | ||||||||
Total Revenue (in thousands) | 145,202 | 136,103 | 124,426 | ||||||||
Total Expenses (in thousands) | 78,201 | 73,034 | 65,706 | ||||||||
Average Advisory Fee Rate, excluding variable rate fees(a) | 0.64 | % | 0.64 | % | 0.66 | % | |||||
Operating Profit Margin | 46 | % | 46 | % | 47 | % | |||||
Operating Profit Margin, as adjusted(b) | 48 | % | 48 | % | 47 | % | |||||
(a) Average advisory fee rates, including variable rate fees, were 0.64%, 0.68% and 0.66% for past three fiscal years respectively.
(b) Operating profit margin, as adjusted is a non-GAAP performance measure. See Use of Supplemental Data as Non-GAAP Performance Measure section within this report.
Assets Under Management
Our revenue is derived primarily from investment advisory and administration fees. Investment advisory and administration fees paid to the Company are generally based on the value of the investment portfolios we manage and fluctuate with changes in the total value of the AUM. Substantially all of our AUM (95.4%) is valued based on readily available market quotations. AUM in our fixed income strategies (4.6%) is valued using evaluated prices from independent third-party providers. Fees are recognized in the period that the Company manages these assets.
Our revenues are highly dependent on both the value and composition of AUM. The following is a summary of our AUM by product, investment objective, and a roll-forward of the change in AUM for the years ended December 31, 2017, 2016, and 2015:
16
Assets Under Management As of December 31, | |||||||||||
(in millions) | 2017 | 2016 | 2015 | ||||||||
Proprietary funds | $ | 15,974 | $ | 13,618 | $ | 11,505 | |||||
Sub-advised funds | 1,518 | 1,445 | 665 | ||||||||
Institutional accounts | 4,825 | 4,318 | 4,671 | ||||||||
Total AUM | $ | 22,317 | $ | 19,381 | $ | 16,841 | |||||
Assets Under Management by Investment Strategy As of December 31, | |||||||||||
(in millions) | 2017 | 2016 | 2015 | ||||||||
Small Cap | $ | 1,525 | $ | 1,843 | $ | 1,703 | |||||
Small-Mid Cap | 3,528 | 3,329 | 2,070 | ||||||||
Mid Cap | 130 | 59 | 18 | ||||||||
Large Cap | 10,867 | 8,497 | 7,547 | ||||||||
All Cap Select | 450 | 404 | 545 | ||||||||
Long-Short | 4,980 | 4,613 | 4,597 | ||||||||
Corporate bonds | 699 | 581 | 361 | ||||||||
Core fixed income | 357 | 237 | — | ||||||||
(Less: Investments in affiliated funds) (a) | (219 | ) | (182 | ) | — | ||||||
Total AUM | $ | 22,317 | $ | 19,381 | $ | 16,841 | |||||
(a) Certain Diamond Hill Funds own shares of the Diamond Hill Short Duration Total Return Fund. The Company reduces its total AUM by these investments held in this affiliated fund.
Change in Assets Under Management For the Year Ended December 31, | |||||||||||
(in millions) | 2017 | 2016 | 2015 | ||||||||
AUM at beginning of the year | $ | 19,381 | $ | 16,841 | $ | 15,656 | |||||
Net cash inflows (outflows) | |||||||||||
proprietary funds | 843 | 548 | 1,916 | ||||||||
sub-advised funds | (164 | ) | 639 | (6 | ) | ||||||
institutional accounts | (254 | ) | (1,023 | ) | (443 | ) | |||||
425 | 164 | 1,467 | |||||||||
Net market appreciation (depreciation) and income | 2,511 | 2,376 | (282 | ) | |||||||
Increase during the year | 2,936 | 2,540 | 1,185 | ||||||||
AUM at end of the year | $ | 22,317 | $ | 19,381 | $ | 16,841 | |||||
17
Consolidated Results of Operations
The following is a discussion of our consolidated results of operations.
(in thousands, except per share amounts and percentages) | 2017 | 2016 | % Change | 2016 | 2015 | % Change | |||||||||||||
Total revenue | $ | 145,202 | $ | 136,103 | 7% | $ | 136,103 | $ | 124,426 | 9% | |||||||||
Net operating income | $ | 67,001 | $ | 63,069 | 6% | $ | 63,069 | $ | 58,720 | 7% | |||||||||
Net income attributable to common shareholders | $ | 49,989 | $ | 46,052 | 9% | $ | 46,052 | $ | 37,074 | 24% | |||||||||
Earnings per share attributable to common shareholders (Diluted) | $ | 14.48 | $ | 13.49 | 7% | $ | 13.49 | $ | 11.03 | 22% | |||||||||
Operating profit margin | 46 | % | 46 | % | NM | 46 | % | 47 | % | NM | |||||||||
Operating profit margin, as adjusted(a) | 48 | % | 48 | % | NM | 48 | % | 47 | % | NM | |||||||||
(a) Operating profit margin, as adjusted is a non-GAAP performance measure. See Use of Supplemental Data as Non-GAAP Performance Measure section within this report.
Year Ended December 31, 2017 compared with Year Ended December 31, 2016
The Company generated net income attributable to common shareholders of $50.0 million ($14.48 per diluted share) for the year ended December 31, 2017, compared with net income attributable to common shareholders of $46.1 million ($13.49 per diluted share) for the year ended December 31, 2016. Revenue increased $9.1 million period over period primarily due to a 17% increase in average AUM year over year, partially offset by $6.4 million in performance fees recognized on the early termination of a variable rate fee contract in 2016 compared to $0.2 million in 2017. Operating expenses year-over-year increased $5.2 million, primarily related to increases in compensation and related expenses and general and administrative expenses.
The Company recorded non-operating income of $14.0 million in 2017 due to market appreciation and dividend income from our investment portfolio compared to non-operating income of $10.2 million in 2016 due to $7.5 million in market appreciation and dividend income from our investment portfolio and a $2.7 million gain on the sale of Beacon Hill.
Income tax expense increased $2.7 million from 2016 to 2017 due to the overall increase in income before taxes. The Tax Cuts and Jobs Act was passed on December 22, 2017. Among other federal tax law changes, for taxable years beginning after December 31, 2017, the new law establishes a flat corporate income tax rate of 21% to replace our current rate of 35% and eliminates the corporate alternative minimum tax. In accordance with ASC 740, the Company has recorded tax expense of $3.6 million resulting from the re-measurement of the Company's net deferred tax assets as of December 31, 2017. This additional tax expense in the current year was partially offset by $2.4 million of excess tax benefits on restricted stock units and restricted stock awards and $0.4 million of tax benefits on dividends paid on restricted stock awards. The Company currently expects its full year 2018 effective income tax rate to range between 23 and 25 percent.
Operating profit margin was 46% for both 2017 and 2016. Operating profit margin, as adjusted, was 48% for both 2017 and 2016. See Use of Supplemental Data as Non-GAAP Performance Measure section within this report. We expect that our operating margin will fluctuate, sometimes substantially, from year to year based on various factors including revenues; investment results; employee performance; staffing levels; development of investment strategies, products, or channels; and industry comparisons.
18
Year Ended December 31, 2016 compared with Year Ended December 31, 2015
The Company generated net income attributable to common shareholders of $46.1 million ($13.49 per diluted share) for the year ended December 31, 2016, compared with net income attributable to common shareholders of $37.1 million ($11.03 per diluted share) for the year ended December 31, 2015. Revenue increased $11.7 million period over period primarily due to an 8% increase in average AUM year over year, as well as $6.4 million in variable rate fees earned upon the termination of a variable fee agreement in 2016 versus no variable rate fees realized in 2015. The revenue increase was partially offset by an increase in operating expenses of $7.3 million, primarily related to increases in compensation and related expenses, general and administrative expenses, and mutual fund administration expenses. The Company had $7.5 million in investment income due to market appreciation in 2016 compared to investment losses of $0.7 million in 2015. In addition, the Company recognized a $2.7 million gain on the sale of Beacon Hill during 2016. Income tax expense increased $5.8 million from 2015 to 2016 due to the overall increase in income before taxes.
Operating profit margin decreased to 46% for 2016 from 47% for 2015. Operating profit margin, as adjusted, increased to 48% for 2016 from 47% for 2015. See Use of Supplemental Data as Non-GAAP Performance Measure section within this report. We expect that our operating margin will fluctuate, sometimes substantially, from year to year based on various factors, including revenues; investment results; employee performance; staffing levels; development of investment strategies, products, or channels; and industry comparisons.
Revenue
(in thousands) | 2017 | 2016 | % Change | 2016 | 2015 | % Change | |||||||||||||
Investment advisory | $ | 132,689 | $ | 121,645 | 9% | $ | 121,645 | $ | 107,916 | 13% | |||||||||
Mutual fund administration, net | 12,513 | 14,458 | (13)% | 14,458 | 16,510 | (12)% | |||||||||||||
Total | 145,202 | 136,103 | 7% | 136,103 | 124,426 | 9% | |||||||||||||
Revenue for the Year Ended December 31, 2017 compared with Year Ended December 31, 2016
As a percent of total annual revenues for 2017 and 2016, investment advisory fees accounted for 91% and 89%, respectively, and mutual fund administration fees made up the remaining 9% and 11%, respectively.
Investment Advisory Fees. Investment advisory fees increased by $11.0 million, or 9%, from the year ended December 31, 2016 to the year ended December 31, 2017. Investment advisory fees are calculated as a percentage of the market value of client accounts at contractual fee rates, which vary by investment product. The increase in investment advisory fees was driven by an increase of 17% in average AUM year-over-year, partially offset by $6.4 million in performance fees recognized on the early termination of a variable rate fee contracts in 2016 compared to $0.2 million in 2017. The average advisory fee rate excluding variable rate fees in both 2017 and 2016 was 0.64%.
Mutual Fund Administration Fees. Mutual fund administration fees decreased $1.9 million, or 13%, from the year ended December 31, 2016 to the year ended December 31, 2017. Mutual fund administration fees include administration fees received from the Funds, which are calculated as a percentage of average Funds' AUM. Mutual fund administration fees for the year ended December 31, 2016 included Beacon Hill administration fees of $2.5 million, which were absent in 2017. Absent Beacon Hill revenue, mutual fund administration fees related to the Funds increased $0.6 million period over period. This increase is primarily driven by a 20% increase in average Funds' AUM from the year ended December 31, 2016 to the year ended December 31, 2017, partially offset by a decrease of two basis points in the net administration fee rate from 0.10% for the year ended December 31, 2016 to 0.08% for the year ended December 31, 2017. Effective June 1, 2017, the Company reduced the administration fee rate charged on all Fund assets by one basis point. The decrease in the net administration fee rate was due to the following fee reductions that occurred during the periods indicated:
Class A & C | Class I | Class Y | |
1/1/2016 - 7/31/2016 | 0.24% | 0.20% | 0.10% |
8/1/2016 - 12/31/2016 | 0.24% | 0.19% | 0.09% |
1/1/2017 - 5/31/2017 | 0.24% | 0.19% | 0.09% |
6/1/2017 - 12/31/2017 | 0.23% | 0.18% | 0.08% |
19
Effective February 28, 2018, the Company will reduce the administration fee rate across all share classes of the Funds. The following table summarizes the scheduled changes:
Fee Rate | AUM as of December 31, 2017 (in millions) | |||
Class A and C | 0.21% | $ | 2,797 | |
Class I | 0.17% | 10,443 | ||
Class Y | 0.05% | 2,825 | ||
Revenue for the Year Ended December 31, 2016 compared with Year Ended December 31, 2015
As a percent of total annual revenues for 2016 and 2015, investment advisory fees accounted for 89% and 87%, respectively, and mutual fund administration fees made up the remaining 11% and 13%, respectively.
Investment Advisory Fees. Investment advisory fees increased by $13.7 million, or 13%, from the year ended December 31, 2015 to the year ended December 31, 2016. Investment advisory fees are calculated as a percentage of the market value of client accounts at contractual fee rates that vary by investment product. The increase in investment advisory fees was driven by an increase of 8% in average AUM year over year and an increase of two basis points in the average advisory fee rate. The average advisory fee rate in 2016 and 2015 was 0.68% and 0.66%, respectively. The average advisory fee rate for 2016 included variable rate fees of $6.4 million earned upon the termination of a variable fee agreement during the fourth quarter. No variable rate fees were realized in 2015. The average advisory fee rate excluding variable rate fees in 2016 and 2015 was 0.64% and 0.66%, respectively. This decrease of two basis points in the advisory fee rate excluding variable rate fees from 2015 to 2016 was primarily due to a 0.05% reduction in the Large Cap Fund advisory fee effective January 1, 2016 and the closing of certain strategies with higher average fees to new investors. Effective April 30, 2016, the Diamond Hill Small-Mid Cap strategy was closed to new investors.
Mutual Fund Administration Fees. Mutual fund administration fees decreased by $2.1 million, or 12%, from the year ended December 31, 2015 to the year ended December 31, 2016. Mutual fund administration fees include administration fees received from the Funds, which are calculated as a percentage of average Funds' AUM, and all Beacon Hill fee revenue. The decrease in the mutual fund administration fee was primarily due to the sale of Beacon Hill effective July 31, 2016, resulting in five less months of Beacon Hill revenue recognized during 2016.
In addition, while the net mutual fund administration fee rate decreased two basis points from 0.12% for the year ended 2015 to 0.10% for the year ended 2016, the impact of this fee rate decrease was offset by a 15% increase in average Funds' AUM from $10.7 billion for the year ended 2015 to $12.3 billion for the year ended 2016. The decrease in the net administration fee rate was due to fee reductions that occurred during the period.
Expenses
(in thousands) | 2017 | 2016 | % Change | 2016 | 2015 | % Change | |||||||||||||
Compensation and related costs | $ | 54,856 | $ | 52,265 | 5% | $ | 52,265 | $ | 47,951 | 9% | |||||||||
General and administrative | 14,037 | 12,622 | 11% | 12,622 | 10,246 | 23% | |||||||||||||
Sales and marketing | 4,994 | 4,263 | 17% | 4,263 | 4,179 | 2% | |||||||||||||
Mutual fund administration | 4,313 | 3,884 | 11% | 3,884 | 3,330 | 17% | |||||||||||||
Total | 78,200 | 73,034 | 7% | 73,034 | 65,706 | 11% | |||||||||||||
20
Expenses for the Year Ended December 31, 2017 compared with Year Ended December 31, 2016
Compensation and Related Costs. Employee compensation and benefits increased by $2.6 million, or 5%, from the year ended December 31, 2016 to the year ended December 31, 2017, due to an increase of $2.8 million in incentive compensation during fiscal year 2017, an increase of $0.5 million in deferred compensation expense and an increase of $0.3 million in restricted stock expense. These increases were offset by a decrease of $1.0 million in salaries and related benefits due to the sale of Beacon Hill in 2016. Incentive compensation expense can fluctuate significantly period over period as we evaluate incentive compensation by reviewing investment performance, individual performance, Company performance and other factors.
General and Administrative. General and administrative expenses increased by $1.4 million, or 11%, from the year ended December 31, 2016 to the year ended December 31, 2017. This increase is primarily due to an increase in IT consulting expense of $0.7 million, primarily to enhance our enterprise data management and customer relationship management software, an increase in investment research expenses of $0.5 million, and an increase in depreciation expense of $0.2 million.
Sales and Marketing. Sales and marketing expenses increased by $0.7 million, or 17%, from the year ended December 31, 2016 to the year ended December 31, 2017. This increase was primarily due to additional payments made to third party intermediaries related to the sale of our proprietary funds. For the years ended December 31, 2017 and 2016, approximately 65% and 63% of sales and marketing expense is related to revenue sharing payments made to third party intermediaries.
Mutual Fund Administration. Mutual fund administration expenses increased by $0.4 million, or 11%, from the year ended December 31, 2016 to the year ended December 31, 2017. Mutual fund administration expenses consist of both variable and fixed expenses. The variable expenses are based on Fund AUM and the number of shareholder accounts. The increase was primarily due to the 20% increase in average Funds' AUM from the year ended 2016 to the year ended 2017.
Expenses for the Year Ended December 31, 2016 compared with Year Ended December 31, 2015
Compensation and Related Costs. Employee compensation and benefits increased by $4.3 million, or 9%, from the year ended December 31, 2015 to the year ended December 31, 2016, due to an increase of $1.7 million in salaries and related benefits due to an increase in staffing and merit increases and an increase of $0.5 million in incentive compensation during fiscal year 2016. Incentive compensation expense can fluctuate significantly period over period as we evaluate incentive compensation by reviewing investment performance, individual performance, Company performance and other factors. In addition, the Company recognized unrealized gains on deferred compensation investments, which increased deferred compensation expense by $1.8 million in 2016 compared to unrealized losses on deferred compensation investments, which decreased deferred compensation expense by $0.2 million in 2015.
General and Administrative. General and administrative expenses increased by $2.4 million, or 23%, from the year ended December 31, 2015 to the year ended December 31, 2016. This increase was due to a $1.4 million increase in charitable donations, a $0.4 million increase in research expenses to support our investment team, a $0.4 million increase in legal and other costs related to the sale of Beacon Hill, increased information technology expense of $0.1 million, and $0.1 million of additional depreciation expense year over year.
Sales and Marketing. Sales and marketing expenses increased by $0.1 million, or 2%, from the year ended December 31, 2015 to the year ended December 31, 2016. This increase was primarily due to additional payments made to third party intermediaries related to the sale of our proprietary funds.
Mutual Fund Administration. Mutual fund administration expenses increased by $0.6 million, or 17%, from the year ended December 31, 2015 to the year ended December 31, 2016. Mutual fund administration expenses consist of both variable and fixed expenses. The variable expenses are based on Fund AUM and the number of shareholder accounts. The increase was consistent with the 15% increase in average Funds' AUM from the year ended 2015 to the year ended 2016.
Liquidity and Capital Resources
Sources of Liquidity
Our current financial condition is highly liquid, with a significant amount of our assets comprised of cash and cash equivalents, investments and accounts receivable. The Company's main source of liquidity is cash flows from operating activities, which are generated from investment advisory and fund administration fees. Our investment portfolio is invested in readily marketable
21
securities, which provide for cash liquidity, if needed. Inflation is expected to have no material impact on our financial position. Cash and cash equivalents, accounts receivable, and investments represented approximately 94% and 92% of total assets as of December 31, 2017 and 2016 respectively. We believe these sources of liquidity, as well as our continuing cash flows from operating activities, will be sufficient to meet our current and future operating needs for at least the next 12 months.
Uses of Liquidity
In line with the Company’s primary objective to fulfill our fiduciary duty to clients and secondary objective to achieve an adequate long-term return for shareholders, we anticipate our main uses of cash will be operating expenses and seed capital to fund new and existing investment strategies.
The Board of Directors and management regularly review various factors to determine whether we have capital in excess of that required for the business and the appropriate use of any excess capital. The factors considered include our investment opportunities, capital needed for investment strategies, risks, and future dividend and capital gain tax rates. Evaluating management’s stewardship of capital for shareholders is a central part of our investment discipline that we practice for our clients. We hold ourselves to the same standard.
While 2017 was the tenth consecutive year that the Company has paid a special dividend, there can be no assurance that we will pay a dividend in the future. We have paid out special dividends totaling $71.00 per share from 2008 through 2017. These special dividends reduced shareholders’ equity by $211.9 million over the past ten years. The 2017, 2016, and 2015 special dividends reduced shareholders' equity by $24.3 million, $20.5 million, and $17.0 million, respectively.
Working Capital
As of December 31, 2017, the Company had working capital of approximately $162.5 million, compared to $126.0 million at December 31, 2016. Working capital includes cash, securities owned by common shareholders, prepaid expenses and current receivables, net of liabilities. On October 26, 2017, our Board of Directors declared a $7.00 per share dividend payable on December 11, 2017 to shareholders of record on December 1, 2017. The payment of the special cash dividend reduced our working capital balance by approximately $24.3 million. The Company has no debt, and we believe our available working capital is sufficient to cover current expenses and presently anticipated capital expenditures.
Below is a summary of securities owned by the Company as of December 31, 2017 and 2016.
As of December 31, | |||||||
2017 | 2016 | ||||||
Corporate Investments: | |||||||
Diamond Hill Core Bond Fund | $ | 30,529,852 | $ | 29,293,308 | |||
Diamond Hill Mid Cap Fund | 19,270,451 | 17,754,640 | |||||
Diamond Hill Research Opportunities Fund | 15,409,571 | 10,921,540 | |||||
Diamond Hill High Yield Fund | 14,200,885 | 6,210,304 | |||||
Diamond Hill Valuation-Weighted 500 ETF | 12,096,719 | 13,329,549 | |||||
Diamond Hill Global Fund, L.P. | 2,055,196 | 1,570,965 | |||||
Diamond Hill International Equity Fund, L.P. | 1,173,870 | — | |||||
Diamond Hill Short Duration Total Return Fund | — | 20,245 | |||||
Total Corporate Investments | 94,736,544 | 79,100,551 | |||||
Deferred Compensation Plan Investments in the Funds | 20,480,790 | 14,182,470 | |||||
Total investments held by DHCM | 115,217,334 | 93,283,021 | |||||
Redeemable noncontrolling interest in Consolidated Funds | 23,258,688 | 14,732,614 | |||||
Total Investment Portfolio | $ | 138,476,022 | $ | 108,015,635 | |||
Cash Flow Analysis
Cash Flows from Operating Activities
The Company’s cash flows from operating activities are calculated by adjusting net income to reflect other significant operating sources and uses of cash, certain significant non-cash items such as share-based compensation, and timing differences in the cash settlement of operating assets and liabilities.
22
For the year ended December 31, 2017, net cash provided by operating activities totaled $60.9 million. The changes in net cash provided by operating activities were primarily driven by net income of $51.6 million, the add back of share-based compensation of $8.6 million and depreciation of $0.9 million, and the effect of non-cash items and timing differences in the cash settlement of assets and liabilities of $5.4 million. These cash inflows were partially offset by the net change in trading securities held in our Consolidated Funds underlying investment portfolios of $5.5 million. Absent the operating cash flows of the Consolidated Funds, cash flow from operations would have been approximately $64.3 million (see "Supplemental Consolidated Cash Flow Statement" below). We expect that cash flows provided by operating activities will continue to serve as our primary source of working capital in the near future.
For the year ended December 31, 2016, net cash provided by operating activities totaled $20.1 million. The changes in net cash provided by operating activities were primarily driven by net income of $46.6 million and the add back of share-based compensation of $8.2 million and depreciation of $0.7 million and the effect of noncash items and timing differences in the cash settlement of assets and liabilities of $6.2 million. These cash inflows were significantly offset by the net change in trading securities held in our Consolidated Funds underlying investment portfolios of $41.7 million. Absent the operating cash flows of the Consolidated Funds, cash flow from operations would have been approximately $60.7 million.
For the year ended December 31, 2015, net cash provided by operating activities totaled $52.0 million. The changes in net cash provided by operating activities were primarily driven by net income of $37.1 million, the add back of share-based compensation of $8.6 million and depreciation of $0.6 million, and the effect of noncash items and timing differences in the cash settlement of assets and liabilities of $5.8 million.
Cash Flows from Investing Activities
The Company’s cash flows from investing activities consist primarily of purchases and redemptions in our investment portfolio, capital expenditures and proceeds from the sale of Beacon Hill.
Cash flows used in investing activities totaled $18.6 million for the year ended December 31, 2017. The Company purchased corporate investments of $21.0 million, inclusive of $3.9 million of corporate investments into our deferred compensation plans, and made $1.1 million of property and equipment purchases during the period. These cash outflows were partially offset by redemptions of corporate investments of $2.6 million and $1.0 million of proceeds from the scheduled collection of the promissory note received from the sale of Beacon Hill.
Cash flows used in investing activities totaled $5.7 million for the year ended December 31, 2016. The Company purchased corporate investments of $26.0 million, inclusive of $4.4 million of corporate investments into our deferred compensation plans. This cash outflow was partially offset by redemptions of corporate investments of $19.5 million and net proceeds received of $1.2 million from the sale of Beacon Hill. The Company also purchased $0.5 million of property and equipment.
Cash flows used in investing activities totaled $11.9 million for the year ended December 31, 2015. The Company purchased $22.1 million of corporate investments, inclusive of $4.3 million of purchases into our deferred compensation plans, during 2015. This cash outflow was partially offset by redemptions of corporate investments of $11.8 million. The Company also purchased $1.6 million of property and equipment related to our office space expansion.
Cash Flows from Financing Activities
The Company’s cash flows from financing activities consist primarily of the payment of special dividends, shares withheld related to employee tax withholding and distributions to or contributions from redeemable noncontrolling interest holders.
For the year ended December 31, 2017, net cash used by financing activities totaled $23.0 million, consisting of the payment of special dividends of $24.3 million and the value of shares withheld related to employee tax withholding of $5.0 million, partially offset by net subscriptions received from redeemable noncontrolling interest holders of $6.3 million.
For the year ended December 31, 2016, net cash used by financing activities totaled $14.6 million, consisting of the payment of special dividends of $20.5 million and the value of shares withheld related to employee tax withholding of $10.0 million, partially offset by net subscriptions received from redeemable noncontrolling interest holders of $9.6 million, excess income tax benefit from share-based compensation of $4.9 million, and income tax benefit from dividends paid on restricted stock of$1.4 million.
For the year ended December 31, 2015, net cash used by financing activities totaled $18.5 million, consisting of the payment of special dividends of $17.0 million and the value of shares withheld related to employee tax withholding of $4.3 million, partially offset by excess income tax benefit from share-based compensation of $2.5 million and the income tax benefit from dividends paid on restricted stock of $0.4 million.
23
Supplemental Consolidated Cash Flow Statement
On January 1, 2016, the Company implemented the new consolidation accounting guidance that resulted in the consolidation of the Company's exchange traded fund ("ETF") and the Diamond Hill Core Bond Fund, one of our individual mutual funds (collectively the "Consolidated Funds") in which we have controlling interests. Our consolidated balance sheet now reflects the investments and other assets and liabilities of the Consolidated Funds, as well as redeemable noncontrolling interests for the portion of the Consolidated Funds that are held by third party investors. Although we can redeem our net interest in the Consolidated Funds at any time, we cannot directly access or sell the assets held by the Consolidated Funds to obtain cash for general operations. Additionally, the assets of the Consolidated Funds are not available to general creditors.
The following table summarizes the condensed cash flows for the year ended December 31, 2017, that are attributable to Diamond Hill Investment Group, Inc. and to the Consolidated Funds, and the related eliminations required in preparing the consolidated statements.
Year Ended December 31, 2017 | |||||||||||||||
Cash flow attributable to Diamond Hill Investment Group, Inc. | Cash flow attributable to Consolidated Funds | Eliminations | As reported on the Consolidated Statement of Cash Flows | ||||||||||||
Cash flows from Operating Activities: | |||||||||||||||
Net Income | $ | 49,988,957 | $ | 5,665,511 | $ | (4,052,799 | ) | $ | 51,601,669 | ||||||
Adjustments to reconcile net income to net cash provided by operating activities: | |||||||||||||||
Depreciation | 888,197 | — | — | 888,197 | |||||||||||
Share-based compensation | 8,582,069 | — | — | 8,582,069 | |||||||||||
Net (gains)/losses on investments | (8,118,039 | ) | (5,665,511 | ) | 4,052,799 | (9,730,751 | ) | ||||||||
Net change in trading securities held by Consolidated Funds | — | (5,511,669 | ) | — | (5,511,669 | ) | |||||||||
Other changes in assets and liabilities | 12,912,965 | 2,177,279 | — | 15,090,244 | |||||||||||
Net cash provided by (used in) operating activities | 64,254,149 | (3,334,390 | ) | — | 60,919,759 | ||||||||||
Net cash used in investing activities | (15,485,455 | ) | — | (3,068,364 | ) | (18,553,819 | ) | ||||||||
Net cash provided by (used in) financing activities | (29,243,784 | ) | 3,221,712 | 3,068,364 | (22,953,708 | ) | |||||||||
Net change during the period | 19,524,910 | (112,678 | ) | — | 19,412,232 | ||||||||||
Cash and cash equivalents at beginning of year | 57,077,198 | 112,678 | — | 57,189,876 | |||||||||||
Cash and cash equivalents at end of year | $ | 76,602,108 | $ | — | $ | — | $ | 76,602,108 | |||||||
24
Selected Quarterly Information
Our unaudited quarterly results of operations for the years ended December 31, 2017 and 2016 are summarized below:
At or For the Quarter Ended | |||||||||||||||||||||||||||||||
2017 | 2016 | ||||||||||||||||||||||||||||||
(in thousands, except per share data) | 12/31 | 09/30 | 06/30 | 03/31 | 12/31 | 09/30 | 06/30 | 03/31 | |||||||||||||||||||||||
Assets under management (in millions) | $ | 22,317 | $ | 21,455 | $ | 20,924 | $ | 20,333 | $ | 19,381 | $ | 18,068 | $ | 17,584 | $ | 17,391 | |||||||||||||||
Total revenue(a) | 37,753 | 36,772 | 35,543 | 35,134 | 40,039 | 32,937 | 32,669 | 30,458 | |||||||||||||||||||||||
Total operating expenses | 19,443 | 19,884 | 19,576 | 19,298 | 20,512 | 17,799 | 17,970 | 16,753 | |||||||||||||||||||||||
Operating income | 18,310 | 16,888 | 15,967 | 15,836 | 19,527 | 15,138 | 14,699 | 13,705 | |||||||||||||||||||||||
Investment income, net | 4,439 | 2,768 | 3,025 | 3,786 | 2,522 | 3,555 | 693 | 747 | |||||||||||||||||||||||
Gain on sale of subsidiary | — | — | — | — | — | 2,676 | — | — | |||||||||||||||||||||||
Income before taxes | $ | 22,749 | $ | 19,656 | $ | 18,992 | $ | 19,622 | $ | 22,049 | $ | 21,369 | $ | 15,392 | $ | 14,452 | |||||||||||||||
Income tax expense(b) | $ | (10,398 | ) | $ | (6,498 | ) | $ | (6,025 | ) | $ | (6,496 | ) | $ | (8,171 | ) | $ | (7,700 | ) | $ | (5,625 | ) | $ | (5,172 | ) | |||||||
Net income | $ | 12,351 | $ | 13,158 | $ | 12,967 | $ | 13,126 | $ | 13,878 | $ | 13,669 | $ | 9,767 | $ | 9,280 | |||||||||||||||
Net income attributable to common shareholders | $ | 11,895 | $ | 12,699 | $ | 12,638 | $ | 12,757 | $ | 13,645 | $ | 13,427 | $ | 9,715 | $ | 9,265 | |||||||||||||||
Diluted EPS | $ | 3.43 | $ | 3.67 | $ | 3.66 | $ | 3.71 | $ | 3.99 | $ | 3.93 | $ | 2.84 | $ | 2.73 | |||||||||||||||
Diluted weighted shares outstanding | 3,471 | 3,461 | 3,449 | 3,435 | 3,422 | 3,420 | 3,415 | 3,393 | |||||||||||||||||||||||
(a) Total revenue in the fourth quarter of 2016 includes variable rate fees of $6.4 million earned upon the termination of a variable rate fee agreement.
(b) The Company’s fourth quarter income tax provision was $10.4 million (45.7% Effective Tax Rate) and reflected the impact of the Tax Act, including additional tax expense of $3.6 million resulting from the re-measurement of the Company's estimated net deferred tax asset as of December 31, 2017.
Contractual Obligations
The following table presents a summary of the Company’s future obligations under the terms of operating leases and lease commitments, other contractual purchase obligations, and deferred compensation obligations at December 31, 2017. Other purchase obligations include contractual amounts that will be due for the purchase of services to be used in our operations, such as mutual fund sub-administration and investment related research software. These obligations may be cancelable at earlier times than those indicated and, under certain conditions, may involve termination fees. Because these obligations are primarily of a normal recurring nature, we expect to fund them from future cash flows from operations. The deferred compensation obligations includes compensation that will be paid out in future years and which will be funded by the related deferred compensation investments currently held on our consolidated balance sheets (see Note 6). The information presented does not include operating expenses or capital expenditures that will be committed in the normal course of operations in 2018 and future years:
Payments Due by Period | |||||||||||||||||||||||||||
(in thousands) | Total | 2018 | 2019 | 2020 | 2021 | 2022 | Thereafter | ||||||||||||||||||||
Operating lease obligations | $ | 4,146 | $ | 586 | $ | 596 | $ | 624 | $ | 624 | $ | 624 | $ | 1,092 | |||||||||||||
Purchase obligations | 4,824 | 3,265 | 1,279 | 273 | 5 | 2 | — | ||||||||||||||||||||
Deferred compensation obligations | 20,480 | — | 1,793 | 3,171 | 2,215 | 2,701 | 10,600 | ||||||||||||||||||||
Total | $ | 29,450 | $ | 3,851 | $ | 3,668 | $ | 4,068 | $ | 2,844 | $ | 3,327 | $ | 11,692 | |||||||||||||
25
Use of Supplemental Data as Non-GAAP Performance Measures
As supplemental information, we are providing performance measures that are based on methodologies other than U.S. generally accepted accounting principles (“non-GAAP”). We believe the non-GAAP measures below are useful measures of our core business activities, are important metrics in estimating the value of an asset management business and may enable more appropriate comparison to our peers. These non-GAAP measures should not be a substitute for financial measures calculated in accordance with U.S. generally accepted accounting principles (“GAAP”) and may be calculated differently by other companies. The following schedule reconciles GAAP measures to non-GAAP measures for the years ended December 31, 2017, 2016, and 2015, respectively.
Year Ended December 31, | |||||||||||
(in thousands, except percentages and per share data) | 2017 | 2016 | 2015 | ||||||||
Total revenue | $ | 145,202 | $ | 136,103 | $ | 124,426 | |||||
Net operating income, GAAP basis | $ | 67,001 | $ | 63,069 | $ | 58,720 | |||||
Non-GAAP adjustments: | |||||||||||
Gains (losses) on deferred compensation plan investments, net(1) | 2,382 | 1,837 | (234 | ) | |||||||
Net operating income, as adjusted, non-GAAP basis(2) | 69,383 | 64,906 | 58,486 | ||||||||
Non-GAAP Adjustment: | |||||||||||
Tax provision on net operating income, as adjusted, non-GAAP basis(3) | (25,192 | ) | (23,626 | ) | (21,090 | ) | |||||
Net operating income, as adjusted, after tax, non-GAAP basis(4) | $ | 44,191 | $ | 41,280 | $ | 37,396 | |||||
Net operating income, as adjusted after tax per diluted share, non-GAAP basis(5) | $ | 12.80 | $ | 12.09 | $ | 11.13 | |||||
Diluted weighted average shares outstanding, GAAP basis | 3,452 | 3,413 | 3,360 | ||||||||
Operating profit margin, GAAP basis | 46 | % | 46 | % | 47 | % | |||||
Operating profit margin, as adjusted, non-GAAP basis(6) | 48 | % | 48 | % | 47 | % | |||||
(1) Gains (losses) on deferred compensation plan investments, net: The gain (loss) on deferred compensation plan investments which increases (decreases) deferred compensation expense included in operating income is removed from operating income in the calculation because it is offset by an equal amount in investment income (loss) below net operating income on the income statement, and thus has no impact on net income attributable to the Company.
(2) Net operating income, as adjusted: This non-GAAP measure was calculated by taking the Company’s net operating income adjusted to exclude the impact on compensation expense of gains and losses on investments in the deferred compensation plan.
(3) Tax provision on net operating income, as adjusted: This non-GAAP measure represents the tax provision excluding the impact of investment related activity and the sale of subsidiary and is calculated by applying the tax rate from the actual tax provision to net operating income, as adjusted.
(4) Net operating income, as adjusted, after tax: This non-GAAP measure was calculated by taking the net operating income, as adjusted less the tax provision on net operating income, as adjusted.
(5) Net operating income, as adjusted after tax per diluted share: This non-GAAP measure was calculated by dividing the net operating income, as adjusted after tax, by diluted weighted average shares outstanding.
(6) Operating profit margin, as adjusted: This non-GAAP measure was calculated by dividing the net operating income, as adjusted, by total revenue.
Off-Balance Sheet Arrangements
The Company has no off-balance sheet arrangements. We do not have any obligation under a guarantee contract, or a retained or contingent interest in assets or similar arrangement that serves as credit, liquidity or market risk support for such assets, or any other obligation, including a contingent obligation, under a contract that would be accounted for as a derivative instrument or arising out of a variable interest.
26
Critical Accounting Policies and Estimates
Consolidation. We consolidate all subsidiaries and certain investments in which we have a controlling interest. We are generally deemed to have a controlling interest when we own the majority of the voting interest of an entity or are deemed to be the primary beneficiary of a variable interest entity ("VIE"). VIEs are entities that lack sufficient equity to finance its activities or the equity holders do not have defined power to direct the activities of the entity normally associated with an equity investment. Our analysis to determine whether an entity is a VIE or a voting rights entity ("VRE") involves judgment and considers several factors, including an entity's legal organization, equity structure, the rights of the investment holders, our ownership interest in the entity, and our contractual involvement with the entity. We continually review and reconsider our VIE or VRE conclusions upon the occurrence of certain events, such as changes to our ownership interest, or amendments to contract documents. Our VIEs are primarily sponsored investment entities and our variable interest consists of our equity ownership in these entities. The Company concluded we are not the primary beneficiary of any of these VIEs as of December 31, 2017 as we lack the power to control these entities.
Provisions for Income Taxes. The objectives of accounting for income taxes are to recognize the amount of taxes payable or refundable for the current year and deferred tax liabilities and assets for the future tax consequences of events that have been recognized in an entity’s financial statements or tax returns. Judgment is required in assessing the future tax consequences of events that have been recognized in our financial statements or tax returns.
Revenue Recognition on Performance-Based Advisory Contracts. We have certain investment advisory contracts in which a portion of the fees are based on investment performance achieved in the respective client portfolio in excess of a specified hurdle rate. These fees are calculated based on client investment results over rolling five-year periods. The Company records variable performance fees at the end of the contract measurement period.
Revenue Recognition when Acting as an Agent vs. Principal. The Funds have selected and contractually engaged certain vendors to fulfill various services to benefit the Funds’ shareholders or to satisfy regulatory requirements of the Funds. These services include, among others, required fund shareholder mailings, registration services, and legal and audit services. DHCM, in fulfilling a portion of its role under the administration agreement with the Funds, acts as agent to pay these obligations of the Funds. Each vendor is independently responsible for fulfillment of the services it has been engaged to provide and negotiates fees and terms with the management and board of trustees of the Funds. The fee that the Funds pay to DHCM is reviewed annually by the Funds’ board of trustees and specifically takes into account the contractual expenses that DHCM pays on behalf of the Funds. As a result, DHCM is not involved in the delivery or pricing of these services and bears no risk related to these services. Revenue has been recorded net of these Fund expenses, as it is the appropriate accounting treatment for this agency relationship.
ITEM 7A. | Quantitative and Qualitative Disclosures About Market Risk |
The Company’s revenues and net income are based primarily on the value of AUM. Accordingly, declines in financial market values directly and negatively impact our investment advisory revenues and net income.
We invest in the Funds and our private investment funds, which are market risk sensitive financial instruments. These investments have inherent market risk in the form of price risk; that is, the potential future loss of value that would result from a decline in their fair value. Market prices fluctuate and the amount realized upon subsequent sale may differ significantly from the reported market value.
The table below summarizes our market risks as of December 31, 2017, and shows the effects of a hypothetical 10% increase and decrease in investments.
Fair Value as of December 31, 2017 | Fair Value Assuming a Hypothetical 10% Increase | Fair Value Assuming a Hypothetical 10% Decrease | |||||||||
Equity investments | $ | 73,704,312 | $ | 81,074,743 | $ | 66,333,881 | |||||
Fixed Income investments | 64,771,710 | 71,248,881 | 58,294,539 | ||||||||
Total | $ | 138,476,022 | $ | 152,323,624 | $ | 124,628,420 | |||||
27
ITEM 8. | Financial Statements and Supplementary Data |
Report of Independent Registered Public Accounting Firm
To the Shareholders and Board of Directors
Diamond Hill Investment Group, Inc.:
Opinion on the Consolidated Financial Statements
We have audited the accompanying consolidated balance sheets of Diamond Hill Investment Group, Inc. and subsidiaries (the “Company”) as of December 31, 2017 and 2016, the related consolidated statements of income, shareholders’ equity and redeemable noncontrolling interest, and cash flows for each of the years in the three‑year period ended December 31, 2017, and the related notes (collectively, the “consolidated financial statements”). In our opinion, the consolidated financial statements present fairly, in all material respects, the financial position of the Company as of December 31, 2017 and 2016, and the results of its operations and its cash flows for each of the years in the three‑year period ended December 31, 2017, in conformity with U.S. generally accepted accounting principles.
We also have audited, in accordance with the standards of the Public Company Accounting Oversight Board (United States) (“PCAOB”), the Company’s internal control over financial reporting as of December 31, 2017, based on criteria established in Internal Control - Integrated Framework (2013) issued by the Committee of Sponsoring Organizations of the Treadway Commission (COSO), and our report dated February 22, 2018 expressed an unqualified opinion on the effectiveness of the Company’s internal control over financial reporting.
Changes in Accounting Principles
As discussed in Note 2 to the consolidated financial statements, the Company changed its method of accounting for investments in investment funds in 2016 due to the adoption of ASU 2015-02 - Consolidation (Topic 810): Amendments to the Consolidation Analysis. As discussed in Note 8 to the consolidated financial statements, the Company changed its method of accounting for excess tax benefits or deficiencies from the vesting of stock awards in 2017 due to the adoption of ASU 2016-09 - Improvements to Employee Share-Based Payment Accounting.
Basis for Opinion
These consolidated financial statements are the responsibility of the Company’s management. Our responsibility is to express an opinion on these consolidated financial statements based on our audits. We are a public accounting firm registered with the PCAOB and are required to be independent with respect to the Company in accordance with the U.S. federal securities laws and the applicable rules and regulations of the Securities and Exchange Commission and the PCAOB.
We conducted our audits in accordance with the standards of the PCAOB. Those standards require that we plan and perform the audit to obtain reasonable assurance about whether the consolidated financial statements are free of material misstatement, whether due to error or fraud. Our audits included performing procedures to assess the risks of material misstatement of the consolidated financial statements, whether due to error or fraud, and performing procedures that respond to those risks. Such procedures included examining, on a test basis, evidence regarding the amounts and disclosures in the consolidated financial statements. Our audits also included evaluating the accounting principles used and significant estimates made by management, as well as evaluating the overall presentation of the consolidated financial statements. We believe that our audits provide a reasonable basis for our opinion.
/s/ KPMG LLP
We have served as the Company's auditor since 2012.
Columbus, Ohio
February 22, 2018
28
Report of Independent Registered Public Accounting Firm
To the Shareholders and Board of Directors
Diamond Hill Investment Group, Inc.:
Opinion on Internal Control Over Financial Reporting
We have audited Diamond Hill Investment Group, Inc.’s and subsidiaries’ (the “Company”) internal control over financial reporting as of December 31, 2017, based on criteria established in Internal Control - Integrated Framework (2013) issued by the Committee of Sponsoring Organizations of the Treadway Commission. In our opinion, the Company maintained, in all material respects, effective internal control over financial reporting as of December 31, 2017, based on criteria established in Internal Control - Integrated Framework (2013) issued by the Committee of Sponsoring Organizations of the Treadway Commission.
We also have audited, in accordance with the standards of the Public Company Accounting Oversight Board (United States) (“PCAOB”), the consolidated balance sheets of the Company as of December 31, 2017 and 2016, the related consolidated statements of income, shareholders’ equity, and cash flows for each of the years in the three-year period ended December 31, 2017, and the related notes (collectively, the consolidated financial statements), and our report dated February 22, 2018 expressed an unqualified opinion on those consolidated financial statements.
Basis for Opinion
The Company’s management is responsible for maintaining effective internal control over financial reporting and for its assessment of the effectiveness of internal control over financial reporting, included in the accompanying Management’s Annual Report on Internal Control over Financial Reporting appearing under Item 9A of the Company’s December 31, 2017 annual report on Form 10-K. Our responsibility is to express an opinion on the Company’s internal control over financial reporting based on our audit. We are a public accounting firm registered with the PCAOB and are required to be independent with respect to the Company in accordance with the U.S. federal securities laws and the applicable rules and regulations of the Securities and Exchange Commission and the PCAOB.
We conducted our audit in accordance with the standards of the PCAOB. Those standards require that we plan and perform the audit to obtain reasonable assurance about whether effective internal control over financial reporting was maintained in all material respects. Our audit of internal control over financial reporting included obtaining an understanding of internal control over financial reporting, assessing the risk that a material weakness exists, and testing and evaluating the design and operating effectiveness of internal control based on the assessed risk. Our audit also included performing such other procedures as we considered necessary in the circumstances. We believe that our audit provides a reasonable basis for our opinion.
Definition and Limitations of Internal Control Over Financial Reporting
A company’s internal control over financial reporting is a process designed to provide reasonable assurance regarding the reliability of financial reporting and the preparation of financial statements for external purposes in accordance with generally accepted accounting principles. A company’s internal control over financial reporting includes those policies and procedures that (1) pertain to the maintenance of records that, in reasonable detail, accurately and fairly reflect the transactions and dispositions of the assets of the company; (2) provide reasonable assurance that transactions are recorded as necessary to permit preparation of financial statements in accordance with generally accepted accounting principles, and that receipts and expenditures of the company are being made only in accordance with authorizations of management and directors of the company; and (3) provide reasonable assurance regarding prevention or timely detection of unauthorized acquisition, use, or disposition of the company’s assets that could have a material effect on the financial statements.
Because of its inherent limitations, internal control over financial reporting may not prevent or detect misstatements. Also, projections of any evaluation of effectiveness to future periods are subject to the risk that controls may become inadequate because of changes in conditions, or that the degree of compliance with the policies or procedures may deteriorate.
/s/ KPMG LLP
Columbus, Ohio
February 22, 2018
29
Diamond Hill Investment Group, Inc.
Consolidated Balance Sheets
December 31, | |||||||
2017 | 2016 | ||||||
ASSETS | |||||||
Cash and cash equivalents | $ | 76,602,108 | $ | 57,189,876 | |||
Investment portfolio | 138,476,022 | 108,015,635 | |||||
Accounts receivable | 19,220,279 | 18,605,209 | |||||
Prepaid expenses | 2,073,343 | 2,032,726 | |||||
Income taxes receivable | 4,114,962 | 1,111,890 | |||||
Property and equipment, net of depreciation | 4,057,901 | 4,025,758 | |||||
Deferred taxes | 5,843,704 | 8,736,767 | |||||
Total assets | $ | 250,388,319 | $ | 199,717,861 | |||
LIABILITIES AND SHAREHOLDERS’ EQUITY | |||||||
Liabilities | |||||||
Accounts payable and accrued expenses | $ | 11,890,403 | $ | 9,787,048 | |||
Accrued incentive compensation | 25,496,500 | 22,683,500 | |||||
Deferred compensation | 20,480,790 | 14,182,470 | |||||
Total liabilities | 57,867,693 | 46,653,018 | |||||
Redeemable noncontrolling interest | 20,076,806 | 13,840,688 | |||||
Permanent Shareholders’ Equity | |||||||
Common stock, no par value 7,000,000 shares authorized; 3,470,428 issued and outstanding at December 31, 2017 (inclusive of 191,900 unvested shares); 3,411,556 issued and outstanding at December 31, 2016 (inclusive of 201,800 unvested shares) | 118,209,111 | 109,293,803 | |||||
Preferred stock, undesignated, 1,000,000 shares authorized and unissued | — | — | |||||
Deferred equity compensation | (19,134,963 | ) | (17,728,106 | ) | |||
Retained Earnings | 73,369,672 | 47,658,458 | |||||
Total permanent shareholders’ equity | 172,443,820 | 139,224,155 | |||||
Total liabilities and shareholders’ equity | $ | 250,388,319 | $ | 199,717,861 | |||
Book value per share | $ | 49.69 | $ | 40.81 | |||
The accompanying notes are an integral part of these consolidated financial statements.
30
Diamond Hill Investment Group, Inc.
Consolidated Statements of Income
Year Ended December 31, | |||||||||||
2017 | 2016 | 2015 | |||||||||
REVENUES: | |||||||||||
Investment advisory | $ | 132,688,462 | $ | 121,645,149 | $ | 107,915,557 | |||||
Mutual fund administration, net | 12,513,267 | 14,457,926 | 16,510,429 | ||||||||
Total revenue | 145,201,729 | 136,103,075 | 124,425,986 | ||||||||
OPERATING EXPENSES: | |||||||||||
Compensation and related costs | 54,855,972 | 52,264,843 | 47,951,039 | ||||||||
General and administrative | 14,036,681 | 12,621,831 | 10,245,866 | ||||||||
Sales and marketing | 4,994,525 | 4,263,143 | 4,179,064 | ||||||||
Mutual fund administration | 4,313,185 | 3,884,655 | 3,330,265 | ||||||||
Total operating expenses | 78,200,363 | 73,034,472 | 65,706,234 | ||||||||
NET OPERATING INCOME | 67,001,366 | 63,068,603 | 58,719,752 | ||||||||
Investment income (loss), net | 14,017,593 | 7,517,398 | (736,590 | ) | |||||||
Gain on sale of subsidiary | — | 2,675,766 | — | ||||||||
INCOME BEFORE TAXES | 81,018,959 | 73,261,767 | 57,983,162 | ||||||||
Income tax expense | (29,417,290 | ) | (26,667,635 | ) | (20,908,665 | ) | |||||
NET INCOME | 51,601,669 | 46,594,132 | 37,074,497 | ||||||||
Less: Net income attributable to redeemable noncontrolling interest | (1,612,712 | ) | (542,209 | ) | — | ||||||
NET INCOME ATTRIBUTABLE TO COMMON SHAREHOLDERS | $ | 49,988,957 | $ | 46,051,923 | $ | 37,074,497 | |||||
Earnings per share attributable to common shareholders | |||||||||||
Basic | $ | 14.49 | $ | 13.52 | $ | 11.31 | |||||
Diluted | $ | 14.48 | $ | 13.49 | $ | 11.03 | |||||
Weighted average shares outstanding | |||||||||||
Basic | 3,448,824 | 3,407,408 | 3,277,920 | ||||||||
Diluted | 3,451,838 | 3,413,391 | 3,359,786 | ||||||||
The accompanying notes are an integral part of these consolidated financial statements.
31
Diamond Hill Investment Group, Inc.
Consolidated Statements of Shareholders’ Equity and Redeemable Noncontrolling Interest
Shares Outstanding | Common Stock | Deferred Equity Compensation | Retained Earnings | Total | Redeemable Noncontrolling Interest | |||||||||||||||||
Balance at January 1, 2015 | 3,317,728 | $ | 84,855,693 | $ | (12,566,133 | ) | $ | 2,029,664 | $ | 74,319,224 | $ | — | ||||||||||
Issuance of restricted stock grants | 92,050 | 13,907,286 | (13,907,286 | ) | — | — | — | |||||||||||||||
Amortization of restricted stock grants | — | — | 6,906,300 | — | 6,906,300 | — | ||||||||||||||||
Issuance of stock grants | 27,192 | 3,826,458 | — | — | 3,826,458 | — | ||||||||||||||||
Issuance of common stock related to 401k plan match | 9,336 | 1,645,434 | — | — | 1,645,434 | — | ||||||||||||||||
Tax benefit from dividend payments related to restricted stock grants | — | 376,394 | — | — | 376,394 | — | ||||||||||||||||
Net excess tax benefit from vested restricted stock grants | — | 2,521,273 | — | — | 2,521,273 | — | ||||||||||||||||
Shares withheld related to employee tax withholding | (28,468 | ) | (4,323,676 | ) | — | — | (4,323,676 | ) | — | |||||||||||||
Forfeiture of restricted stock grants | (3,500 | ) | (272,335 | ) | 272,335 | — | — | — | ||||||||||||||
Cash dividend paid of $5.00 per share | — | — | — | (17,031,890 | ) | (17,031,890 | ) | — | ||||||||||||||
Net income | — | — | — | 37,074,497 | 37,074,497 | — | ||||||||||||||||
Balance at December 31, 2015 | 3,414,338 | $ | 102,536,527 | $ | (19,294,784 | ) | $ | 22,072,271 | $ | 105,314,014 | $ | — | ||||||||||
Cumulative-effect adjustment from the adoption of ASU 2015-02 (Note 2) | — | — | — | — | — | 4,031,756 | ||||||||||||||||
Issuance of restricted stock grants | 35,900 | 7,504,564 | (7,504,564 | ) | — | — | — | |||||||||||||||
Amortization of restricted stock grants | — | — | 6,466,797 | — | 6,466,797 | — | ||||||||||||||||
Issuance of stock grants | 21,940 | 3,879,431 | — | — | 3,879,431 | — | ||||||||||||||||
Issuance of common stock related to 401k plan match | 9,466 | 1,738,287 | — | — | 1,738,287 | — | ||||||||||||||||
Tax benefit from dividend payments related to restricted stock grants | — | 1,372,996 | — | — | 1,372,996 | — | ||||||||||||||||
Net excess tax benefit from vested restricted stock grants | — | 4,895,907 | — | — | 4,895,907 | — | ||||||||||||||||
Shares withheld related to employee tax withholding | (53,018 | ) | (10,029,464 | ) | — | — | (10,029,464 | ) | — | |||||||||||||
Forfeiture of restricted stock grants | (17,070 | ) | (2,604,445 | ) | 2,604,445 | — | — | — | ||||||||||||||
Cash dividend paid of $6.00 per share | — | — | — | (20,465,736 | ) | (20,465,736 | ) | — | ||||||||||||||
Net income | — | — | — | 46,051,923 | 46,051,923 | 542,209 | ||||||||||||||||
Net subscriptions of consolidated funds | — | — | — | — | — | 9,266,723 | ||||||||||||||||
Balance at December 31, 2016 | 3,411,556 | $ | 109,293,803 | $ | (17,728,106 | ) | $ | 47,658,458 | $ | 139,224,155 | $ | 13,840,688 | ||||||||||
Issuance of restricted stock grants | 57,350 | 8,454,411 | (8,454,411 | ) | — | — | — | |||||||||||||||
Amortization of restricted stock grants | — | — | 6,871,284 | — | 6,871,284 | — | ||||||||||||||||
Issuance of stock grants | 19,219 | 3,892,424 | — | — | 3,892,424 | — | ||||||||||||||||
Issuance of common stock related to 401k plan match | 8,478 | 1,710,785 | — | — | 1,710,785 | — | ||||||||||||||||
Shares withheld related to employee tax withholding | (24,425 | ) | (4,966,042 | ) | — | — | (4,966,042 | ) | — | |||||||||||||
Forfeiture of restricted stock grants | (1,750 | ) | (176,270 | ) | 176,270 | — | — | — | ||||||||||||||
Cash dividend paid of $7.00 per share | — | — | — | (24,277,743 | ) | (24,277,743 | ) | — | ||||||||||||||
Net income | — | — | — | 49,988,957 | 49,988,957 | 1,612,712 | ||||||||||||||||
Net subscriptions of consolidated funds | — | — | — | — | — | 4,623,406 | ||||||||||||||||
Balance at December 31, 2017 | 3,470,428 | $ | 118,209,111 | $ | (19,134,963 | ) | $ | 73,369,672 | $ | 172,443,820 | $ | 20,076,806 | ||||||||||
The accompanying notes are an integral part of these consolidated financial statements.
32
Diamond Hill Investment Group, Inc.
Consolidated Statements of Cash Flows
Year Ended December 31, | |||||||||||
2017 | 2016 | 2015 | |||||||||
CASH FLOWS FROM OPERATING ACTIVITIES: | |||||||||||
Net Income | $ | 51,601,669 | $ | 46,594,132 | $ | 37,074,497 | |||||
Adjustments to reconcile net income to net cash provided by operating activities: | |||||||||||
Depreciation | 888,197 | 712,112 | 625,788 | ||||||||
Share-based compensation | 8,582,069 | 8,205,084 | 8,551,734 | ||||||||
Decrease (increase) in accounts receivable | (1,615,070 | ) | 486,491 | (2,065,156 | ) | ||||||
Change in current income taxes | (3,003,072 | ) | 6,559,150 | 316,910 | |||||||
Change in deferred income taxes | 2,893,063 | 469,312 | (3,547,087 | ) | |||||||
Gain on sale of subsidiary | — | (2,675,766 | ) | — | |||||||
Net (gains)/losses on investments | (9,730,751 | ) | (5,471,469 | ) | 1,860,360 | ||||||
Net change in trading securities held by Consolidated Funds | (5,511,669 | ) | (41,674,992 | ) | — | ||||||
Increase in accrued incentive compensation | 6,705,424 | 4,578,431 | 5,829,708 | ||||||||
Increase in deferred compensation | 6,298,320 | 3,945,727 | 4,557,979 | ||||||||
Excess income tax benefit from share-based compensation | — | (4,895,907 | ) | (2,521,273 | ) | ||||||
Income tax benefit from dividends paid on restricted stock | — | (1,372,996 | ) | (376,394 | ) | ||||||
Other changes in assets and liabilities | 3,811,579 | 4,612,437 | 1,724,253 | ||||||||
Net cash provided by operating activities | 60,919,759 | 20,071,746 | 52,031,319 | ||||||||
CASH FLOWS FROM INVESTING ACTIVITIES: | |||||||||||
Purchase of property and equipment | (1,106,520 | ) | (484,509 | ) | (1,550,857 | ) | |||||
Purchase of Company sponsored investments | (21,044,429 | ) | (25,953,000 | ) | (22,095,491 | ) | |||||
Proceeds from sale of Company sponsored investments | 2,597,130 | 19,543,607 | 11,770,565 | ||||||||
Proceeds from sale of subsidiary, net of cash disposed | 1,000,000 | 1,163,769 | — | ||||||||
Net cash used in investing activities | (18,553,819 | ) | (5,730,133 | ) | (11,875,783 | ) | |||||
CASH FLOWS FROM FINANCING ACTIVITIES: | |||||||||||
Value of shares withheld related to employee tax withholding | (4,966,042 | ) | (10,029,464 | ) | (4,323,676 | ) | |||||
Excess income tax benefit from share-based compensation | — | 4,895,907 | 2,521,273 | ||||||||
Income tax benefit from dividends paid on restricted stock | — | 1,372,996 | 376,394 | ||||||||
Payment of dividends | (24,277,743 | ) | (20,465,736 | ) | (17,031,890 | ) | |||||
Net subscriptions received from redeemable noncontrolling interest holders | 6,290,077 | 9,599,783 | — | ||||||||
Net cash used in financing activities | (22,953,708 | ) | (14,626,514 | ) | (18,457,899 | ) | |||||
CASH AND CASH EQUIVALENTS | |||||||||||
Net change during the year | 19,412,232 | (284,901 | ) | 21,697,637 | |||||||
At beginning of year | 57,189,876 | 57,474,777 | 35,777,140 | ||||||||
At end of year | $ | 76,602,108 | $ | 57,189,876 | $ | 57,474,777 | |||||
Supplemental cash flow information: | |||||||||||
Income taxes paid | $ | 29,527,299 | $ | 19,639,173 | $ | 24,138,841 | |||||
Supplemental disclosure of non-cash transactions: | |||||||||||
Charitable donation of corporate investments and property and equipment | 1,748,841 | 1,729,735 | 1,401,202 | ||||||||
Common stock issued as incentive compensation | 3,892,424 | 3,879,431 | 3,826,458 | ||||||||
Cumulative-effect adjustment from the adoption of ASU 2015-02 (Note 2) | — | 4,031,756 | — | ||||||||
Net redemptions of ETF Shares for marketable securities | (1,555,305 | ) | (244,200 | ) | — | ||||||
The accompanying notes are an integral part of these consolidated financial statements.
33
Diamond Hill Investment Group, Inc.
Notes to Consolidated Financial Statements
Note 1 Business and Organization
Diamond Hill Investment Group, Inc. (the “Company”), an Ohio corporation, derives its consolidated revenues and net income from investment advisory and fund administration services.
Diamond Hill Capital Management, Inc. (“DHCM”), an Ohio corporation, is a wholly owned subsidiary of the Company and a registered investment adviser. DHCM is the investment adviser to the Diamond Hill Funds (the “Funds”), a series of open-end mutual funds, private investment funds (“Private Funds”), an exchange traded fund ("ETF"), and other institutional accounts. In addition, DHCM is administrator for the Funds.
Beacon Hill Fund Services, Inc. (“BHFS”) and BHIL Distributors, Inc. (“BHIL”), collectively operated as "Beacon Hill," were operating subsidiaries of the Company. The Company sold Beacon Hill on July 31, 2016. Prior to the sale, Beacon Hill provided compliance, treasury, underwriting and other fund administration services to investment advisers and mutual funds. See Note 11.
Note 2 Significant Accounting Policies
Basis of Presentation
The accompanying Consolidated Financial Statements of the Company have been prepared pursuant to the rules and regulations of the U. S. Securities and Exchange Commission ("SEC") and in accordance with the instructions to Form 10-K. The Company believes that the disclosures contained herein are adequate to make the information presented not misleading.
These Consolidated Financial Statements reflect, in the opinion of the Company, all material adjustments (which include only normal recurring adjustments) necessary to fairly present the Company’s financial position as of December 31, 2017 and 2016, and results of operations for the years ended December 31, 2017, 2016 and 2015. The preparation of the Consolidated Financial Statements requires management to make estimates and judgments that affect the reported amounts of assets and liabilities and disclosure of contingent assets and liabilities at the date of the financial statements as well as the reported amounts of revenue and expense during the reporting period. Estimates have been prepared on the basis of the most current and best available information, but actual results could differ materially from those estimates.
Book value per share is computed by dividing total shareholders' equity by the number of shares issued and outstanding at the end of the measurement period.
Reclassification
Certain prior period amounts and disclosures may have been reclassified to conform to the current period's financial presentation.
Principles of Consolidation
The accompanying consolidated financial statements include the operations of the Company and its controlled subsidiaries. All inter-company transactions and balances have been eliminated in consolidation.
The Company holds certain investments in the Funds and the ETF for general corporate investment purposes, to provide seed capital for newly formed strategies or to add capital to existing strategies. The Funds are organized in a series fund structure in which there are multiple mutual funds within one Trust. The Trust is an open-end investment company registered under the Investment Company Act of 1940, as amended (the "1940 Act"). The ETF is an individual series of ETF Series Solutions which is also an open-end investment company registered under the 1940 Act. Each of the individual mutual funds and the ETF represent a separate share class of a legal entity organized under the Trust. As of January 1, 2016, the Company adopted ASU 2015-02 - Consolidation (Topic 810): Amendments to the Consolidation Analysis ("ASU 2015-02") and we have performed our analysis at the individual mutual fund and ETF level and have concluded the mutual funds and ETF are VREs. The Company has concluded that the mutual funds and the ETF are VREs because the structure of the investment product is such that the shareholders are deemed to have the power through voting rights to direct the activities that most significantly impact the entity's economic performance. To the extent material, these investment products are consolidated if Company ownership, directly or indirectly, represents a majority interest (greater than 50%). The Company records redeemable noncontrolling interests in consolidated investments for which the Company's ownership is less than 100%. The Company has consolidated the ETF and the Diamond Hill Core Bond Fund, one of our individual mutual funds (collectively the "Consolidated Funds") as our ownership was greater than 50% in each as of December 31, 2017 and 2016.
34
We adopted ASU 2015-02 utilizing the modified retrospective transition method and have recorded a cumulative-effect adjustment to equity of $4.0 million as of January 1, 2016. Prior to the adoption of ASU 2015-02, we performed our analysis at the Trust level and concluded we did not need to consolidate the Funds or the ETF as we owned less than 1% of the voting interest in the respective Trusts.
DHCM is the managing member of Diamond Hill General Partner, LLC (the “General Partner”), the general partner of Diamond Hill Investment Partners, L.P. (“DHIP”), Diamond Hill Global Fund, L.P. ("DHGF"), and Diamond Hill International Equity Fund, L.P. ("DHIEF"), each a limited partnership (collectively, the "Partnerships" or "LPs") whose underlying assets consist primarily of marketable securities.
DHCM is wholly owned by the Company and is consolidated by us. Further, DHCM through its control of the General Partner, has the power to direct each LP’s economic activities and the right to receive investment advisory fees that may be significant to the LPs.
The Company concluded we did not have a variable interest in DHIP as the fees paid to the General Partner are considered to contain customary terms and conditions as found in the market for similar products and the Company has no equity ownership in DHIP.
The Company concluded DHGF and DHIEF were VIEs as DHCM has disproportionately less voting interests than economic interests in each LP, given the limited partners have full power to remove the Company as the General Partner due to the existence of substantive kick-out rights. In addition, substantially all of the LPs' activities are conducted on behalf of the General Partner which has disproportionately few voting rights. The Company concluded we are not the primary beneficiary of DHGF or DHIEF as we lack the power to control the entities due to the existence of single-party kick-out rights where the limited partners have the unilateral ability to remove the General Partner without cause. DHCM’s investments in DHGF and DHIEF are reported as a component of the Company’s investment portfolio, valued at DHCM’s respective share of the net income or loss of each LP.
The LPs are not subject to lock-up periods and can be redeemed on demand. Gains and losses attributable to changes in the value of DHCM’s interests in the LPs are included in the Company’s reported investment income. The Company’s exposure to loss as a result of its involvement with the LPs is limited to the amount of its investments. DHCM is not obligated to provide, and has not provided, financial or other support to the LPs, other than its investments to date and its contractually provided investment advisory responsibilities. The Company has not provided liquidity arrangements, guarantees or other commitments to support the LPs’ operations, and the LPs’ creditors and interest holders have no recourse to the general credit of the Company.
Certain board members, officers and employees of the Company invest in the LPs and are not subject to a management fee or an incentive fee. These individuals receive no remuneration as a result of their personal investment in the LPs. The capital of the General Partner is not subject to a management fee or an incentive fee.
Redeemable Noncontrolling Interest
Redeemable noncontrolling interest represents third-party interests in the Consolidated Funds. This interest is redeemable at the option of the investors and therefore is not treated as permanent equity. Redeemable noncontrolling interest is remeasured at redemption value, which approximates the fair value each reporting period.
Segment Information
Management has determined that the Company operates in one business segment, providing investment management and administration services to mutual funds, institutional accounts, and private investment funds. Therefore, no disclosures relating to operating segments are presented in the annual financial statements.
Cash and Cash Equivalents
Cash and cash equivalents include demand deposits and money market mutual funds.
Accounts Receivable
Accounts receivable are recorded when they are due and are presented on the balance sheet net of any allowance for doubtful accounts. Accounts receivable are written off when they are determined to be uncollectible. Any allowance for doubtful accounts is estimated based on the Company’s historical losses, existing conditions in the industry, and the financial stability of
35
those individuals or entities that owe the receivable. No allowance for doubtful accounts was deemed necessary at December 31, 2017 or 2016. Accounts Receivable from the Funds were $11.6 million and $10.4 million as of December 31, 2017 and 2016, respectively.
Investments
Management determines the appropriate classification of its investments at the time of purchase and re-evaluates its determination at each reporting period.
Investments classified as trading represent investments in the Funds where the Company has neither control nor the ability to exercise significant influence, as well as securities held in the Consolidated Funds. These investments are measured at fair value based on quoted market prices. Unrealized gains and losses are recorded as investment income (loss) in the Company's consolidated statements of income.
Investments classified as equity method investments represent investments in which the Company owns between 20-50% of the outstanding voting interests in the entity or when it is determined that the Company is able to exercise significant influence but not control over the investments. When using the equity method, the Company recognizes its respective share of the investee's net income or loss for the period which is recorded as investment income (loss) in the Company's consolidated statements of income.
Fair Value Measurements
Accounting Standards Codification Topic 820, Fair Value Measurement ("ASC 820") specifies a hierarchy of valuation classifications based on whether the inputs to the valuation techniques used in each valuation classification are observable or unobservable. These classifications are summarized in the three broad levels listed below:
Level 1 - Unadjusted quoted prices for identical instruments in active markets.
Level 2 - Quoted prices for similar instruments in active markets; quoted prices for identical or similar instruments in markets that are not active; and model-driven valuations in which all significant inputs are observable.
Level 3 - Valuations derived from techniques in which significant inputs are unobservable.
Inputs used to measure fair value might fall in different levels of the fair value hierarchy, in which case the Company defaults to the lowest level input that is significant to the fair value measurement in its entirety. These levels are not necessarily an indication of the risk or liquidity associated with investments. The following table summarizes investments that are recognized in our consolidated balance sheet using fair value measurements (excludes investments classified as equity method investments) determined based upon the differing levels of inputs as of December 31, 2017 and 2016:
December 31, 2017 | Level 1 | Level 2 | Level 3 | Total | ||||||||
Cash equivalents | $ | 72,669,083 | $ | — | $ | — | $ | 72,669,083 | ||||
Trading Investments | ||||||||||||
Securities held in Consolidated Funds(a) | 24,618,578 | 41,271,922 | — | $ | 65,890,500 | |||||||
Company sponsored investments | 36,541,818 | — | — | $ | 36,541,818 | |||||||
December 31, 2016 | ||||||||||||
Cash equivalents | 47,717,187 | — | — | $ | 47,717,187 | |||||||
Trading Investments | ||||||||||||
Securities held in Consolidated Funds(a) | 19,835,458 | 37,520,013 | — | $ | 57,355,471 | |||||||
Company sponsored investments | 9,322,118 | — | — | $ | 9,322,118 | |||||||
(a) Of the equity interests in the Consolidated Funds as of December 31, 2017, $42.6 million were held directly by the Company and $23.3 million were held by noncontrolling shareholders. Of the equity interests in the Consolidated Funds as of December 31, 2016, $42.6 million were held directly by the Company and $14.7 million were held by noncontrolling shareholders.
36
Level 1 investments are all registered investment companies (mutual funds) or equity securities held in the Consolidated Funds and include, as of December 31, 2017 and 2016, $72.7 million and $47.7 million, respectively, of investments in money market mutual funds that the Company classifies as cash equivalents.
Level 2 investments are comprised of investments in debt securities held in the Consolidated Funds, which are valued by an independent pricing service using pricing techniques which take into account factors such as trading activity, readily available market quotations, yield, quality, coupon rate, maturity, type of issue, trading characteristics, call features, credit rates and other observable inputs.
The Company determines transfers between fair value hierarchy levels at the end of the reporting period. There were no transfers in or out of the levels during any of the years ended December 31, 2017, 2016, and 2015.
Changes in fair values on the investments are recorded in the Company's consolidated statements of income as investment income (loss), net.
Property and Equipment
Property and equipment, consisting of leasehold improvements, computer equipment, furniture and fixtures, are carried at cost less accumulated depreciation. Accumulated depreciation was $4.0 million and $3.3 million as of December 31, 2017 and 2016, respectively. Depreciation is calculated using the straight-line method over the estimated life of the assets.
Revenue Recognition – General
The Company earns substantially all of its revenue from investment advisory and fund administration services. Investment advisory and administration fees, generally calculated as a percentage of assets under management ("AUM"), are recorded as revenue as services are performed. In addition to fixed fees based on a percentage of AUM, certain client accounts also provide periodic variable rate fees. Total revenue from the Funds was $116.7 million, $100.8 million and $93.6 million for the years ended December 31, 2017, 2016 and 2015, respectively.
Revenue Recognition – Variable Rate Fees
The Company manages certain client accounts that provide for variable rate fees. These fees are calculated based on client investment results over rolling five-year periods. The Company records variable rate fees at the end of the contract measurement period. During the years ended December 31, 2017, 2016, and 2015, the Company recorded $0.2 million, $6.4 million, and $0.0 million, respectively, in variable rate fees upon the early termination of variable rate fee contracts.
The table below shows AUM subject to variable rate fees and the amount of variable rate fees that would be recognized based upon investment results as of December 31, 2017:
As of December 31, 2017 | |||||||
AUM subject to variable rate fees | Unearned variable rate fees | ||||||
Contractual Period Ends: | |||||||
Quarter Ended December 31, 2018 | $ | 105,909,958 | $ | 1,557,038 | |||
Quarter Ended September 30, 2019 | 36,046,820 | 548,700 | |||||
Quarter Ended March 31, 2020 | 12,655,485 | — | |||||
Quarter Ended September 30, 2021 | 280,124,936 | 2,524,606 | |||||
Total | $ | 434,737,199 | $ | 4,630,344 | |||
The contractual end dates highlight the time remaining until the variable rate fees are scheduled to be earned. The amount of variable rate fees that would be recognized based upon investments results as of December 31, 2017 will increase or decrease based on future client investment results through the contractual period end. There can be no assurance that the unearned amounts will ultimately be earned.
37
Revenue Recognition – Mutual Fund Administration
DHCM has an administrative and transfer agency services agreement with the Funds under which DHCM performs certain services for each Fund. These services include mutual fund administration, fund accounting, transfer agency and other related functions. For performing these services each Fund pays DHCM a fee, which is calculated using an annual rate times the average daily net assets of each respective share class.
The Funds have selected and contractually engaged certain vendors to fulfill various services to benefit the Funds’ shareholders or to satisfy regulatory requirements of the Funds. These services include, among others, required shareholder mailings, federal and state registrations, and legal and audit services. DHCM, in fulfilling a portion of its role under the administration agreement with the Funds, acts as agent to pay these obligations of the Funds. Each vendor is independently responsible for fulfillment of the services it has been engaged to provide and negotiates fees and terms with the management and board of trustees of the Funds. The fee that each Fund pays to DHCM is reviewed annually by the Funds’ board of trustees and specifically takes into account the contractual expenses that DHCM pays on behalf of the Funds. As a result, DHCM is not involved in the delivery or pricing of these services and bears no risk related to these services. Revenue has been recorded net of these Fund related expenses in accordance with FASB ASC 605-45, Revenue Recognition – Principal Agent Considerations. In addition, DHCM advances the upfront commissions which are paid to brokers who sell Class C shares of the Funds. These advances are capitalized and amortized over 12 months to correspond with the repayments DHCM receives from the principal underwriter to recoup this commission advancement.
Prior to the sale of Beacon Hill, the Company, through Beacon Hill, had underwriting and administrative service agreements with certain clients, including registered mutual funds. The fee arrangements varied from client to client based upon services provided and have been recorded as revenue under mutual fund administration on the Company's consolidated statements of income. Part of Beacon Hill’s role as underwriter was to act as an agent on behalf of its mutual fund clients to receive 12b-1/service fees and commission revenue and facilitate the payment of those fees and commissions to third parties who provide services to the funds and their shareholders. The majority of 12b-1/service fees were paid to independent third parties and the remainder were retained by the Company as a reimbursement of expenses the Company had incurred. The amounts of 12b-1/service fees and commissions were determined by each mutual fund client, and Beacon Hill bore no financial risk related to these services. As a result, 12b-1/service fees and commission revenue was recorded net of the expense payments to third parties, in accordance with the appropriate accounting treatment for this agency relationship.
Mutual fund administration gross and net revenue are summarized below:
Year Ended December 31, | |||||||||||
2017 | 2016 | 2015 | |||||||||
Mutual fund administration: | |||||||||||
DHCM Revenue, net of related expenses | |||||||||||
Administration revenue, gross | $ | 26,219,881 | $ | 26,664,635 | $ | 27,042,861 | |||||
12b-1/service fees and commission revenue received from fund clients | — | 6,360,400 | 11,087,978 | ||||||||
12b-1/service fees and commission expense payments to third parties | — | (5,660,430 | ) | (9,617,568 | ) | ||||||
Fund related expense | (13,748,445 | ) | (12,937,067 | ) | (12,031,353 | ) | |||||
Revenue, net of related expenses | 12,471,436 | 14,427,538 | 16,481,918 | ||||||||
DHCM C-Share financing: | |||||||||||
Broker commission advance repayments | 416,614 | 691,228 | 991,430 | ||||||||
Broker commission amortization | (374,783 | ) | (660,840 | ) | (962,919 | ) | |||||
Financing activity, net | 41,831 | 30,388 | 28,511 | ||||||||
Mutual fund administration revenue, net | $ | 12,513,267 | $ | 14,457,926 | $ | 16,510,429 | |||||
Mutual fund administrative net revenue from the Funds was $12.5 million, $11.9 million and $12.9 million for the years ended December 31, 2017, 2016 and 2015, respectively.
Income Taxes
The Company accounts for current and deferred income taxes through an asset and liability approach. Deferred tax assets are recognized for deductible temporary differences and deferred tax liabilities are recognized for taxable temporary differences.
38
Deferred tax assets are reduced by a valuation allowance when it is more likely than not that some portion or all of the deferred tax assets will not be realized. Deferred tax assets and liabilities are adjusted for the effects of changes in tax laws and rates on the date of enactment.
The Company is subject to examination by federal and applicable state and local jurisdictions for various tax periods. The Company’s income tax positions are based on research and interpretations of the income tax laws and rulings in each of the jurisdictions in which it does business. Due to the subjectivity of interpretations of laws and rulings in each jurisdiction, the differences and interplay in tax laws among those jurisdictions, as well as the inherent uncertainty in estimating the final resolution of complex tax audit matters, the Company’s estimates of income tax liabilities may differ from actual payments or assessments. The Company regularly assesses its position with regard to tax exposures and records liabilities for these uncertain tax positions and related interest and penalties, if any, according to the principles of FASB ASC 740, Income Taxes. As of December 31, 2017, the Company has not recorded any liability for uncertain tax positions. The Company records interest and penalties, if any, within income tax expense on the income statement. See Note 8.
Earnings Per Share
Basic earnings per share (“EPS”) excludes dilution and is computed by dividing net income by the weighted average number of common shares outstanding for the period, which includes participating securities. Diluted EPS reflects the potential dilution of EPS due to unvested restricted stock grants with forfeitable rights to dividends and restricted stock units. See Note 9.
Recently Issued Accounting Standards
In May 2014, the Financial Accounting Standards Board ("FASB") issued Accounting Standards Update ("ASU") 2014-09, "Revenue from Contracts with Customers", which supersedes existing accounting standards for revenue recognition and creates a single framework. ASU 2014-09 requires an entity to recognize the amount of revenue to which it expects to be entitled for the transfer of promised goods or services to customers. This standard also specifies the accounting for certain costs to obtain or fulfill a contract with a customer. This ASU will supersede much of the existing revenue recognition guidance in GAAP and is effective for fiscal years beginning after December 15, 2017, including interim periods within that reporting period, and requires either a retrospective or a modified retrospective approach to adoption. We will adopt the new ASU on its effective date, January 1, 2018, and expect to utilize the full retrospective approach. Our implementation efforts include a detailed review of revenue contracts within the scope of the guidance and evaluation of the impact on the Company's revenue recognition policies. While we are continuing to assess the potential impacts of the ASU on our financial position and results of operations, we believe that the adoption of this ASU will not have an impact on revenue recognition. While we have not identified changes in the timing of revenue recognition, we continue to evaluate the related disclosures.
In February 2016, the FASB issued ASU 2016-02, "Leases", which, among other things, requires lessees to recognize most leases on-balance sheet. This will increase lessees' reported assets and liabilities - in some cases significantly. Lessor accounting remains substantially similar to current GAAP. ASU 2016-02 supersedes Topic 840, Leases. ASU 2016-02 is effective for annual and interim periods in fiscal years beginning after December 15, 2018. ASU 2016-02 mandates a modified retrospective transition method for all entities. The Company is currently assessing the impact of this standard on its consolidated financial statements and related disclosures.
39
Note 3 Investment Portfolio
As of December 31, 2017, the Company held investments (excluding money market funds, which are included with cash and cash equivalents) worth $138.5 million. The following table summarizes the carrying value of these investments as of December 31, 2017 and 2016:
As of December 31, | |||||||
2017 | 2016 | ||||||
Trading investments: | |||||||
Securities held in Consolidated Funds(a) | $ | 65,890,500 | $ | 57,355,471 | |||
Company sponsored investments | 36,541,818 | 9,322,118 | |||||
Company sponsored equity method investments | 36,043,704 | 41,338,046 | |||||
Total Investment portfolio | $ | 138,476,022 | $ | 108,015,635 | |||
(a) Of the securities held in the Consolidated Funds as of December 31, 2017, $42.6 million were held directly by the Company and $23.3 million were held by noncontrolling shareholders. Of the securities held in the Consolidated Funds as of December 31, 2016, $42.6 million were held directly by the Company and $14.7 million were held by noncontrolling shareholders.
As of December 31, 2017, our equity method investees consisted of the Diamond Hill Research Opportunities Fund, the Diamond Hill High Yield Fund, DHGF and DHIEF, and our ownership percentages in these funds were 26%, 48%, 95%, and 30%, respectively. As of December 31, 2016, our equity method investees consisted of the Diamond Hill Mid Cap Fund, the Diamond Hill Research Opportunities Fund, the Diamond Hill High Yield Fund, and DHGF, and our ownership percentages in these funds were 33%, 27%, 20%, and 95%, respectively. The Company's equity method investments consist of cash, marketable equity securities and fixed income securities. The Company met the significant subsidiaries test for total equity method investments as of December 31, 2017 and is required to provide the summarized financial information for all equity method investments for all periods presented. The following table includes the condensed summary financial information from the Company's equity method investments as of December 31, 2017 and 2016 and for the years ended December 31, 2017, 2016 and 2015:
As of December 31, | |||||||||||
2017 | 2016 | ||||||||||
Total assets | $ | 144,118,745 | $ | 189,819,824 | |||||||
Total liabilities | 38,009,765 | 45,931,979 | |||||||||
Net assets | 106,108,980 | 143,887,845 | |||||||||
DHCM's portion of net assets | 36,043,704 | 41,338,046 | |||||||||
For the Year Ended December 31, | |||||||||||
2017 | 2016 | 2015 | |||||||||
Investment income | $ | 2,944,836 | $ | 3,272,972 | $ | 792,691 | |||||
Expenses | 1,176,896 | 1,409,896 | 5,506 | ||||||||
Net realized gains | 4,432,850 | 1,981,185 | 1,219,565 | ||||||||
Net change in unrealized appreciation (depreciation) | 5,613,627 | 10,458,073 | (1,879,047 | ) | |||||||
Net income | 11,814,417 | 14,302,334 | 127,703 | ||||||||
DHCM's portion of net income | 3,206,702 | 4,392,636 | 124,825 | ||||||||
Note 4 Line of Credit
The Company has an uncommitted Line of Credit Agreement (the "Credit Agreement") with a commercial bank that matures in December of 2018 and permits the Company to borrow up to $25.0 million. Borrowings under the Credit Agreement bear interest at a rate equal to LIBOR plus 1.50%. The Company has not borrowed under the Credit Agreement as of and for the years ended December 31, 2017 and 2016. No interest is payable on the unused portion of the Credit Agreement.
40
The proceeds of the Credit Agreement may be used by the Company and its subsidiaries for ongoing working capital needs, to seed new and existing investment strategies and other general corporate purposes. The line of credit agreement contains representations, warranties and covenants that are customary for agreements of this type.
Note 5 Capital Stock
Common Shares
The Company has only one class of securities outstanding, common shares, no par value per share.
Authorization of Preferred Shares
The Company’s Amended and Restated Articles of Incorporation authorize the issuance of 1,000,000 “blank check” preferred shares with such designations, rights and preferences as may be determined from time to time by the Company’s Board of Directors. The Board of Directors is authorized, without shareholder approval, to issue preferred stock with dividend, liquidation, conversion, voting, or other rights, which could adversely affect the voting or other rights of the holders of the common shares. There were no shares of preferred stock issued or outstanding at December 31, 2017 or 2016.
Note 6 Compensation Plans
Equity Incentive Plans
2014 Equity and Cash Incentive Plan
At the Company’s annual shareholder meeting on April 30, 2014, shareholders approved the 2014 Equity and Cash Incentive Plan (“2014 Plan”). The 2014 Plan is intended to facilitate the Company’s ability to attract and retain staff, provide additional incentive to employees and directors, and promote the success of the Company’s business. The 2014 Plan authorizes the issuance of 600,000 common shares of the Company in various forms of equity awards. The 2014 Plan also authorizes cash incentive awards. As of December 31, 2017, there were 355,726 common shares available for awards under the 2014 Plan. The 2014 Plan provides that the Board of Directors, or a committee appointed by the Board, may grant awards and otherwise administer the 2014 Plan. Restricted stock units and restricted stock grants issued under the 2014 Plan, which vest over time, are recorded as deferred compensation in the equity section of the balance sheet on the grant date and then recognized as compensation expense based on the grant date price over the vesting period of the respective grant. Stock grants issued under the 2014 Plan are recorded as compensation expense based on the grant date price.
2011 Equity and Cash Incentive Plan
There are no longer any common shares available for future awards under the 2011 Equity and Cash Incentive Plan (the "2011 Plan") , although awards under this plan remain issued and outstanding. Restricted stock grants issued under the 2011 Plan, which vest over time, were recorded as deferred compensation in the equity section of the balance sheet on the grant date and then recognized as compensation expense based on the grant date price over the vesting period of the respective grant. Stock grants issued under the 2011 Plan were recorded as compensation expense based on the grant date price.
Share-Based Payment Transactions
The Company issues restricted stock units and restricted stock awards (collectively, "Restricted Stock") under the 2014 Plan. Restricted stock units represent shares which may be issued in the future, whereas restricted stock awards represent common shares issued and outstanding upon grant subject to vesting restrictions. The following table represents a roll-forward of outstanding Restricted Stock and related activity during the years ended December 31, 2017 and 2016:
41
Shares | Weighted-Average Grant Date Price per Share | |||||
Outstanding Restricted Stock as of December 31, 2015 | 329,356 | $ | 108.46 | |||
Grants issued | 38,900 | 183.14 | ||||
Grants vested | (127,386 | ) | 83.50 | |||
Grants forfeited | (17,070 | ) | 143.69 | |||
Outstanding Restricted Stock as of December 31, 2016 | 223,800 | $ | 132.96 | |||
Grants issued | 41,350 | 204.46 | ||||
Grants vested | (65,500 | ) | 98.81 | |||
Grants forfeited | (1,750 | ) | 100.73 | |||
Outstanding Restricted Stock as of December 31, 2017 | 197,900 | $ | 165.60 | |||
Total deferred equity compensation related to unvested Restricted Stock grants was $19.1 million as of December 31, 2017. Compensation expense related to Restricted Stock grants is calculated based upon the fair market value of the common shares on the grant date. The Company's policy is to adjust compensation expense for forfeitures as they occur. The recognition of compensation expense related to deferred compensation over the remaining vesting periods is as follows:
2018 | 2019 | 2020 | 2021 | 2022 | Thereafter | Total | ||||||||||||||||||||
$ | 6,098,558 | $ | 5,362,104 | $ | 3,689,576 | $ | 2,209,739 | $ | 1,176,507 | $ | 598,479 | $ | 19,134,963 | |||||||||||||
Stock Grant Transactions
The following table represents stock issued as part of our incentive compensation program during the years ended December 31, 2017, 2016, and 2015:
Shares Issued | Grant Date Value | |||||
December 31, 2017 | 19,219 | $ | 3,892,424 | |||
December 31, 2016 | 21,940 | 3,879,431 | ||||
December 31, 2015 | 27,192 | 3,826,458 | ||||
401(k) Plan
The Company sponsors a 401(k) plan in which all employees are eligible to participate. Employees may contribute a portion of their compensation subject to certain limits based on federal tax laws. The Company makes matching contributions of common shares of the Company with a value equal to 200 percent of the first six percent of an employee’s compensation contributed to the plan. Employees become fully vested in the matching contributions after six plan years of employment. The following table summarizes the Company’s expenses attributable to the 401(k) plan during the years ended December 31, 2017, 2016 and 2015:
Shares Issued | Company Contribution | |||||
December 31, 2017 | 8,478 | $ | 1,710,785 | |||
December 31, 2016 | 9,466 | 1,738,287 | ||||
December 31, 2015 | 9,336 | 1,645,434 | ||||
42
Deferred Compensation Plans
The Company offers two deferred compensation plans, the Diamond Hill Fixed Term Deferred Compensation Plan and the Diamond Hill Variable Term Deferred Compensation Plan (collectively the “Plans”). Under the Plans, participants may elect to voluntarily defer, for a minimum of five years, certain incentive compensation, which the Company then contributes into the Plans. Each participant is responsible for designating investment options for assets they contribute, and the distribution paid to each participant reflects any gains or losses on the assets realized while in the Plans. Assets held in the Plans are included in the Company’s investment portfolio, and the associated obligation to participants is included in deferred compensation liability. Assets held in the Plans are recorded at fair value. Deferred compensation liability was $20.5 million and $14.2 million at December 31, 2017 and 2016, respectively.
Note 7 Operating Leases
The Company currently leases office space of approximately 37,829 square feet at one location. The following table summarizes the total lease and operating expenses for the years ended December 31, 2017, 2016 and 2015:
For the year ended December 31, | ||||||||||
2017 | 2016 | 2015 | ||||||||
$ | 936,008 | $ | 882,231 | $ | 928,440 | |||||
The approximate future minimum lease payments under the operating lease are as follows:
Future Minimum Lease Payments by Year | ||||||||||||||||||||||||||
Total | 2018 | 2019 | 2020 | 2021 | 2022 | Thereafter | ||||||||||||||||||||
$ | 4,146,694 | $ | 586,350 | $ | 595,807 | $ | 624,179 | $ | 624,179 | $ | 624,179 | $ | 1,092,000 | |||||||||||||
In addition to the above lease payments, the Company is also responsible for normal operating expenses of the property. Such annual operating expenses were approximately $0.4 million in each of 2017, 2016 and 2015.
Note 8 Income Taxes
The Tax Cuts and Jobs Act was passed on December 22, 2017. Among other federal tax law changes, for taxable years beginning after December 31, 2017, the new law establishes a flat corporate income tax rate of 21% to replace our current rate of 35% and eliminates the corporate alternative minimum tax. In accordance with FASB ASC 740, Income Taxes ("ASC 740"), the Company has recorded tax expense of $3.6 million resulting from the re-measurement of the Company's estimated net deferred tax assets as of December 31, 2017.
The following table represents the Company's provision for income taxes:
As of December 31, | |||||||||||
2017 | 2016 | 2015 | |||||||||
Current city income tax provision | $ | 1,463,669 | $ | 1,321,675 | $ | 1,245,285 | |||||
Current state income tax provision | 310,726 | 642,598 | 335,897 | ||||||||
Current federal income tax provision | 24,749,832 | 24,234,050 | 22,874,571 | ||||||||
Deferred federal income tax expense (benefit) | 2,893,063 | 469,312 | (3,547,088 | ) | |||||||
Provision for income taxes | $ | 29,417,290 | $ | 26,667,635 | $ | 20,908,665 | |||||
43
A reconciliation of income tax expense at the statutory federal rate to the Company’s income tax expense is as follows:
2017 | 2016 | 2015 | |||||||||
Income tax computed at statutory rate | $ | 28,356,636 | $ | 25,641,618 | $ | 20,294,107 | |||||
Benefit attributable to redeemable noncontrolling interests(a) | (564,449 | ) | (189,773 | ) | — | ||||||
City and state income taxes, net of federal benefit | 1,153,357 | 1,276,777 | 1,027,768 | ||||||||
Revaluation adjustment of net deferred tax assets | 3,557,039 | — | — | ||||||||
Excess tax benefits on vesting of Restricted Stock | (2,420,250 | ) | — | — | |||||||
Income tax benefit from dividends paid on Restricted Stock | (418,583 | ) | — | — | |||||||
Other | (246,460 | ) | (60,987 | ) | (413,210 | ) | |||||
Income tax expense | $ | 29,417,290 | $ | 26,667,635 | $ | 20,908,665 | |||||
(a) The provision for income taxes includes a benefit attributable to the fact that the Company's operations include the Consolidated Funds which are not subject to federal income taxes. Accordingly, a portion of the Company's earnings are not subject to corporate tax levels.
Net deferred tax assets consisted of the following at December 31, 2017 and 2016:
2017 | 2016 | ||||||
Stock-based compensation | $ | 2,868,719 | $ | 4,450,129 | |||
Accrued compensation | 5,795,204 | 7,355,744 | |||||
Unrealized gains | (2,260,673 | ) | (1,802,708 | ) | |||
Property and equipment | (467,127 | ) | (779,391 | ) | |||
Other assets and liabilities | (92,419 | ) | (487,007 | ) | |||
Net deferred tax assets | $ | 5,843,704 | $ | 8,736,767 | |||
The net temporary differences incurred to date will reverse in future periods as the Company generates taxable earnings. The Company believes it is more likely than not that the results of future operations will generate sufficient taxable income to realize the net deferred tax assets recorded. The Company records a valuation allowance when it is more likely than not that some portion or all of the deferred tax assets will not be realized. As of December 31, 2017, no valuation allowance was deemed necessary.
The Company implemented ASU 2016-09, "Improvements to Employee Share-Based Payment Accounting" on January 1,2017. Beginning January 1, 2017, any excess tax benefits or deficiencies from the vesting of stock awards are recognized through the income tax provision as opposed to common stock. For Restricted Stock, the Company receives an excess income tax benefit calculated as the tax effect of the difference between the fair market value of the stock at the time of grant and vesting. The Company also records income tax benefits from dividends paid on Restricted Stock. This change was required to be applied prospectively to all excess tax benefits and tax deficiencies after the date of adoption of the ASU. No adjustment is recorded for any windfall benefits previously recorded in common stock. In addition, all tax-related cash flows resulting from share based payments are now reported as operating activities in the statement of cash flows under the new guidance, rather than the prior requirement to present windfall tax benefits as an inflow from financing activities and an outflow from operating activities. The Company elected to adopt this change in cash flow presentation prospectively after the date of adoption of the ASU beginning January 1, 2017.
Prior to January 1, 2017, the Company's income taxes payable has been reduced by the tax benefits from equity incentive plan awards. These tax benefits were considered windfall tax benefits and were recognized as an increase to common stock. For Restricted Stock, the Company receives an excess income tax benefit calculated as the tax effect of the difference between the fair market value of the stock at the time of grant and vesting. The Company also records a tax benefit on dividends paid on Restricted Stock during the vesting period. The Company had net tax benefits from equity awards of $6.3 million, and $2.9 million, for the years ended December 31, 2016 and 2015, respectively.
ASC 740 prescribes a recognition threshold and measurement attribute for the financial statement recognition and measurement of a tax position taken or expected to be taken in a tax return and also provides guidance on derecognition, classification, interest and penalties, accounting in interim periods, disclosure and transition. The Company did not record an accrual for tax related uncertainties or unrecognized tax positions as of December 31, 2017. The Company does not expect a change to the reserve for uncertain tax positions within the next twelve months that would have a material impact on the consolidated financial statements.
44
The Company files a consolidated federal income tax return. It is the policy of the Company to allocate the consolidated tax provision to subsidiaries as if each subsidiary’s tax liability or benefit were determined on a separate company basis. As part of the consolidated group, subsidiaries transfer to the Company their current federal tax liabilities or assets. The Company also files income tax returns in all applicable state and local jurisdictions. The Company is subject to federal, state and local examinations by tax authorities for the tax years ended December 31, 2014 through 2017.
Note 9 Earnings Per Share
The Company’s common shares outstanding consist of all shares issued and outstanding, including unvested restricted shares. Basic and diluted EPS are calculated under the two-class method. Pursuant to the two-class method, the Company’s unvested Restricted Stock grants with nonforfeitable rights to dividends are considered participating securities. Dividends are paid on all common shares outstanding at the same rate. Accordingly, the Company has evaluated the impact of earnings per share of all participating securities under the two-class method, noting no impact on earnings per share. Restricted stock awards with forfeitable rights to dividends and restricted stock units are considered dilutive. The following table sets forth the computation for basic and diluted EPS and reconciliation between basic and diluted shares outstanding:
Year Ended December 31, | |||||||||||
2017 | 2016 | 2015 | |||||||||
Net Income | $ | 51,601,669 | $ | 46,594,132 | $ | 37,074,497 | |||||
Less: Net income attributable to redeemable noncontrolling interest | (1,612,712 | ) | (542,209 | ) | — | ||||||
Net income attributable to common shareholders | $ | 49,988,957 | $ | 46,051,923 | $ | 37,074,497 | |||||
Weighted average number of outstanding shares | 3,448,824 | 3,407,408 | 3,277,920 | ||||||||
Dilutive impact of restricted stock grants with forfeitable rights to dividends | — | — | 74,957 | ||||||||
Dilutive impact of restricted stock units | 3,014 | 5,983 | 6,909 | ||||||||
Weighted average number of outstanding shares - Diluted | 3,451,838 | 3,413,391 | 3,359,786 | ||||||||
Earnings per share attributable to common shareholders | |||||||||||
Basic | $ | 14.49 | $ | 13.52 | $ | 11.31 | |||||
Diluted | $ | 14.48 | $ | 13.49 | $ | 11.03 | |||||
Note 10 Commitments and Contingencies
The Company indemnifies its directors, officers and certain of its employees for certain liabilities that might arise from their performance of their duties to the Company. From time to time, the Company is involved in legal matters relating to claims arising in the ordinary course of business. There are currently no such matters pending that the Company believes could have a material adverse effect on its consolidated financial statements.
Additionally, in the normal course of business, the Company enters into agreements that contain a variety of representations and warranties and which provide general indemnifications. Certain agreements do not contain any limits on the Company’s liability and could involve future claims that may be made against the Company that have not yet occurred. Therefore, it is not possible to estimate the Company’s potential liability under these indemnities. Further, the Company maintains insurance policies that may provide coverage against certain claims under these indemnities.
Note 11 Sale of Beacon Hill
On June 15, 2016, the Company sold the entirety of Beacon Hill's business. The Company received $1.2 million in cash consideration, net of cash disposed, as well as contingent consideration with a fair value of $1.5 million in the form of a promissory note. The Company recorded a gain on sale of approximately $2.7 million during 2016. During 2017, the Company received $1.0 million of proceeds from the scheduled collection of the promissory note. The promissory note is included in accounts receivable on the consolidated balance sheets and the carrying value of the promissory note was $0.5 million and $1.5 million as of December 31, 2017 and 2016, respectively.
45
ITEM 9. | Changes In and Disagreements With Accountants on Accounting and Financial Disclosures |
None.
ITEM 9A. | Controls and Procedures |
Management, including the Chief Executive Officer and the Chief Financial Officer, has conducted an evaluation of the effectiveness of the Company’s disclosure controls and procedures (as defined in Rules 13a-15(e) or 15d-15(e) of the Exchange Act of 1934) as of the end of the period covered by this report (the “Evaluation Date”). Based on such evaluation, the Chief Executive Officer and the Chief Financial Officer have concluded that, as of the Evaluation Date, the Company’s disclosure controls and procedures are effective to ensure that the information required to be disclosed by the Company in the reports that it files or submits under the Exchange Act, is recorded, processed, summarized and reported within the time periods specified in the SEC’s rules and forms, and to ensure that the information required to be disclosed by the Company in the reports it files or submits under the Exchange Act is accumulated and communicated to the Company’s management, including the Chief Executive Officer and Chief Financial Officer, or persons performing similar functions, as appropriate to allow timely decisions regarding required disclosure.
There have been no changes in the Company’s internal control over financial reporting during the year ended December 31, 2017 that have materially affected, or are reasonably likely to materially affect, the Company’s internal control over financial reporting.
Management’s Annual Report on Internal Control Over Financial Reporting
Management of Diamond Hill Investment Group, Inc. (the “Company”) is responsible for establishing and maintaining adequate internal control over financial reporting, as defined in Rule 13a-15(f) and 15d-15(f) of the Exchange Act. The Company’s internal control over financial reporting is a process designed to provide reasonable assurance regarding the reliability of financial reporting and the preparation of its consolidated financial statements for external purposes in accordance with accounting principles generally accepted in the United States of America.
Because of its inherent limitations, internal control over financial reporting may not prevent or detect misstatements. Also, projections of any evaluation of effectiveness to future periods are subject to the risk that controls may become inadequate because of changes in conditions, or that the degree of compliance with the policies or procedures may deteriorate.
Under the supervision and with the participation of the Chief Executive Officer and the Chief Financial Officer, management assessed the effectiveness of the Company’s internal control over financial reporting as of December 31, 2017 based on criteria established in Internal Control - Integrated Framework (2013) issued by the Committee of Sponsoring Organizations of the Treadway Commission (COSO). Based on this assessment, management concluded that the Company’s internal control over financial reporting was effective as of December 31, 2017.
The Company’s independent registered public accounting firm, KPMG LLP, has audited the Company’s 2017 and 2016 consolidated financial statements included in this Annual Report on Form 10-K and the Company’s internal control over financial reporting as of December 31, 2017, and has issued its Report of Independent Registered Public Accounting Firm on Consolidated Financial Statements, which is included in this Annual Report on Form 10-K.
ITEM 9B. | Other Information |
None.
46
PART III
ITEM 10. | Directors, Executive Officers and Corporate Governance |
Information required by this Item 10 is incorporated herein by reference from the Company’s definitive proxy statement for its 2018 annual meeting of shareholders to be filed with the SEC pursuant to Regulation 14A of the Exchange Act (the “2018 Proxy Statement”), under the captions: “Section 16(a) Beneficial Ownership Reporting Compliance”, “Proposal 1 – Election of Directors”, “Proposal 1 – Election of Directors – The Board of Directors and Committees”, “Proposal 1 – Election of Directors – Corporate Governance”, and “Proposal 1 – Election of Directors – Executive Officers and Compensation Information”.
ITEM 11. | Executive Compensation |
Information required by this Item 11 is incorporated herein by reference from the Company’s 2018 Proxy Statement under the captions: “Proposal 1 – Election of Directors—The Board of Directors and Committees”, “Proposal 1 – Election of Directors – Corporate Governance”, “Proposal 1 – Election of Directors – Corporate Governance – Compensation Committee Interlocks and Insider Participation”, “Proposal 1 – Election of Directors – Executive Officers and Compensation Information”, and “Proposal 1 – Election of Directors – Compensation Committee Report”.
ITEM 12. | Security Ownership of Certain Beneficial Owners and Management and Related Stockholder Matters |
The following table sets forth certain information concerning our equity compensation plans at December 31, 2017:
Equity Compensation Plan Information
(a) | (b) | (c) | ||||||||
Plan category | Number of securities to be issued upon the exercise of outstanding options, warrants and rights | Weighted-average exercise price of outstanding options, warrants and rights | Number of securities remaining available for future issuance under equity compensation plans (excluding securities reflected in column (a) | |||||||
Equity compensation plans approved by security holders | — | $ | — | 355,726 | 1 | |||||
1 | This amount relates to common shares that may be issued under our 2014 Equity and Cash Incentive Plan. |
The other information required by this Item 12 is incorporated herein by reference from the Company’s 2018 Proxy Statement under the captions: “Security Ownership of Certain Beneficial Owners and Management” and “Proposal 1 – Election of Directors – Executive Officers and Compensation Information”.
ITEM 13. | Certain Relationships and Related Transactions, and Director Independence |
Information required by this Item 13 is incorporated herein by reference from the Company’s 2018 Proxy Statement under the caption: “Proposal 1 – Election of Directors – Director Independence” and “Proposal 1 – Election of Directors – Corporate Governance”.
ITEM 14. | Principal Accounting Fees and Services |
Information required by this Item 14 is incorporated herein by reference from the Company’s 2018 Proxy Statement under the caption: “Proposal 2 – Ratification of the Appointment of Independent Registered Public Accounting Firm”.
47
PART IV
ITEM 15. | Exhibits, Financial Statement Schedules |
(a) (1) | Financial Statements: See “Part II. Item 8, Financial Statements and Supplementary Data”. |
(2) | Financial Statement Schedules: All financial statement schedules for which provision is made in the applicable accounting regulations of the SEC are omitted because they are not required or the required information is included in the accompanying financial statements or notes thereto. |
(3) | Exhibits: |
3.1 | |
3.2 | |
3.3 | |
10.1 | |
10.2 | |
10.3* | |
10.4* | |
10.5* | |
10.6* | |
10.7* | |
10.8* | |
10.9* | |
10.10* | |
10.11* | |
10.12 | |
48
10.13 | |
14.1 | |
21.1 | |
23.1 | |
31.1 | |
31.2 | |
32.1 | |
101.ins | XBRL Instance Document. |
101.sch | XBRL Taxonomy Extension Schema Document. |
101.cal | XBRL Taxonomy Extension Calculation Linkbase Document. |
101.def | XBRL Taxonomy Extension Definition Linkbase Document. |
101.lab | XBRL Taxonomy Extension Label Linkbase Document. |
101.pre | XBRL Taxonomy Extension Presentation Linkbase Document. |
* | Denotes management contract or compensatory plan or arrangement. |
(b) | Exhibits: Reference is made to Item 15(a)(3) above. |
(c) | Financial Statement Schedules: None required. |
ITEM 16. | Form 10-K Summary |
None.
49
SIGNATURES
Pursuant to the requirements of Section 13 or 15(d) of the Securities Exchange Act of 1934, the registrant has duly caused this report to be signed on its behalf by the undersigned, thereunto duly authorized:
DIAMOND HILL INVESTMENT GROUP, INC. | |||
By: | /s/ Christopher M. Bingaman | ||
Christopher M. Bingaman, Chief Executive Officer | February 22, 2018 | ||
Pursuant to the requirements of the Securities Exchange Act of 1934, this report has been signed below by the following persons on behalf of the registrant and in the capacities and on the dates indicated.
Signature | Title | Date | ||
/s/ Christopher M. Bingaman | Chief Executive Officer and | February 22, 2018 | ||
Christopher M. Bingaman | President | |||
/s/ Thomas E. Line | Chief Financial Officer and | February 22, 2018 | ||
Thomas E. Line | Treasurer | |||
/s/ Jeffrey J. Cook | Controller | February 22, 2018 | ||
Jeffrey J. Cook | ||||
/s/ R. H. Dillon | Director | February 22, 2018 | ||
R. H. Dillon | ||||
/s/ James F. Laird | Director | February 22, 2018 | ||
James F. Laird | ||||
/s/ Randolph J. Fortener | Director | February 22, 2018 | ||
Randolph J. Fortener | ||||
/s/ Paul A. Reeder, III | Director | February 22, 2018 | ||
Paul A. Reeder, III | ||||
/s/ Bradley C. Shoup | Director | February 22, 2018 | ||
Bradley C. Shoup | ||||
/s/ Frances A. Skinner | Director | February 22, 2018 | ||
Frances A. Skinner | ||||
50