Attached files
| file | filename |
|---|---|
| EX-32.2 - EX-32.2 - AMETEK INC/ | d507265dex322.htm |
| EX-32.1 - EX-32.1 - AMETEK INC/ | d507265dex321.htm |
| EX-31.2 - EX-31.2 - AMETEK INC/ | d507265dex312.htm |
| EX-31.1 - EX-31.1 - AMETEK INC/ | d507265dex311.htm |
| EX-23 - EX-23 - AMETEK INC/ | d507265dex23.htm |
| EX-21 - EX-21 - AMETEK INC/ | d507265dex21.htm |
| EX-12 - EX-12 - AMETEK INC/ | d507265dex12.htm |
| EX-10.12 - EX-10.12 - AMETEK INC/ | d507265dex1012.htm |
Table of Contents
UNITED STATES
SECURITIES AND EXCHANGE COMMISSION
Washington, D.C. 20549
FORM 10-K
(Mark One)
| ☒ | ANNUAL REPORT PURSUANT TO SECTION 13 OR 15(d) OF THE SECURITIES EXCHANGE ACT OF 1934 |
For the fiscal year ended December 31, 2017
or
| ☐ | TRANSITION REPORT PURSUANT TO SECTION 13 OR 15(d) OF THE SECURITIES EXCHANGE ACT OF 1934 |
For the transition period from to
Commission File Number 1-12981
AMETEK, Inc.
(Exact name of registrant as specified in its charter)
| Delaware | 14-1682544 | |
| (State or other jurisdiction of incorporation or organization) | (I.R.S. Employer Identification No.) | |
| 1100 Cassatt Road Berwyn, Pennsylvania |
19312-1177 | |
| (Address of principal executive offices) | (Zip Code) | |
Registrant’s telephone number, including area code: (610) 647-2121
Securities registered pursuant to Section 12(b) of the Act:
| Title of each class |
Name of each exchange on which registered | |
| Common Stock, $0.01 Par Value (voting) |
New York Stock Exchange |
Securities registered pursuant to Section 12(g) of the Act:
None
(Title of Class)
Indicate by check mark if the registrant is a well-known seasoned issuer, as defined in Rule 405 of the Securities Act. Yes ☒ No ☐
Indicate by check mark if the registrant is not required to file reports pursuant to Section 13 or Section 15(d) of the Act. Yes ☐ No ☒
Indicate by check mark whether the registrant (1) has filed all reports required to be filed by Section 13 or 15(d) of the Securities Exchange Act of 1934 during the preceding 12 months (or for such shorter period that the registrant was required to file such reports), and (2) has been subject to such filing requirements for the past 90 days. Yes ☒ No ☐
Indicate by check mark whether the registrant has submitted electronically and posted on its corporate Web site, if any, every Interactive Data File required to be submitted and posted pursuant to Rule 405 of Regulation S-T (§232.405 of this chapter) during the preceding 12 months (or for such shorter period that the registrant was required to submit and post such files). Yes ☒ No ☐
Indicate by check mark if disclosure of delinquent filers pursuant to Item 405 of Regulation S-K (§229.405 of this chapter) is not contained herein, and will not be contained, to the best of registrant’s knowledge, in definitive proxy or information statements incorporated by reference in Part III of this Form 10-K or any amendment to this Form 10-K. ☒
Indicate by check mark whether the registrant is a large accelerated filer, an accelerated filer, a non-accelerated filer, smaller reporting company, or an emerging growth company. See the definitions of “large accelerated filer,” “accelerated filer,” “smaller reporting company,” and “emerging growth company” in Rule 12b-2 of the Exchange Act.
| Large accelerated filer ☒ |
Accelerated filer ☐ | Non-accelerated filer ☐ | Smaller reporting company ☐ | |||
| (Do not check if a smaller reporting company) | Emerging growth company ☐ |
If an emerging growth company, indicate by check mark if the registrant has elected not to use the extended transition period for complying with any new or revised financial accounting standards provided pursuant to Section 13(a) of the Exchange Act. ☐
Indicate by check mark whether the registrant is a shell company (as defined in Rule 12b-2 of the Act). Yes ☐ No ☒
The aggregate market value of the voting stock held by non-affiliates of the registrant was approximately $14.0 billion as of June 30, 2017, the last business day of the registrant’s most recently completed second fiscal quarter.
The number of shares of the registrant’s Common Stock outstanding as of January 31, 2018 was 231,334,609.
Documents Incorporated by Reference
Part III incorporates information by reference from the Proxy Statement for the Annual Meeting of Stockholders on May 8, 2018.
Table of Contents
2017 Form 10-K Annual Report
Table of Contents
1
Table of Contents
PART I
| Item 1. | Business |
General Development of Business
AMETEK, Inc. (“AMETEK” or the “Company”) is incorporated in Delaware. Its predecessor was originally incorporated in Delaware in 1930 under the name American Machine and Metals, Inc. AMETEK is a leading global manufacturer of electronic instruments and electromechanical devices with operations in North America, Europe, Asia and South America. AMETEK maintains its principal executive offices in suburban Philadelphia at 1100 Cassatt Road, Berwyn, Pennsylvania, 19312. Listed on the New York Stock Exchange (symbol: AME), the common stock of AMETEK is a component of the Standard and Poor’s 500 and the Russell 1000 Indices.
Website Access to Information
AMETEK’s annual report on Form 10-K, quarterly reports on Form 10-Q, current reports on Form 8-K and all amendments to those reports filed or furnished pursuant to Section 13(a) of the Securities Exchange Act of 1934 are made available free of charge on the Company’s website at www.ametek.com in the “Investors – Financial News and Information” section as soon as reasonably practicable after such material is electronically filed with, or furnished to, the U.S. Securities and Exchange Commission. AMETEK has posted free of charge on the investor information portion of its website its corporate governance guidelines, Board committee charters and codes of ethics. Those documents also are available in published form free of charge to any stockholder who requests them by writing to the Investor Relations Department at AMETEK, Inc., 1100 Cassatt Road, Berwyn, Pennsylvania, 19312.
Products and Services
AMETEK’s products are marketed and sold worldwide through two operating groups: Electronic Instruments (“EIG”) and Electromechanical (“EMG”). Electronic Instruments is a leader in the design and manufacture of advanced instruments for the process, power and industrial, and aerospace markets. Electromechanical is a differentiated supplier of precision motion control solutions, thermal management systems, specialty metals and electrical interconnects. Its end markets include aerospace and defense, medical, automation, mass transit and other industrial markets.
Competitive Strengths
Management believes AMETEK has significant competitive advantages that help strengthen and sustain its market positions. Those advantages include:
Significant Market Share. AMETEK maintains significant market share in a number of targeted niche markets through its ability to produce and deliver high-quality products at competitive prices. EIG has significant market positions in niche segments of the process, power and industrial, and aerospace markets. EMG holds significant positions in niche segments of the aerospace and defense, automation, medical and mass transit markets.
Technological and Development Capabilities. AMETEK believes it has certain technological advantages over its competitors that allow it to maintain its leading market positions. Historically, it has demonstrated an ability to develop innovative new products and solutions that anticipate customer needs. It has consistently added to its investment in research, development and engineering, and improved its new product development efforts with the adoption of Design for Six Sigma and Value Analysis/Value Engineering methodologies. These have improved the pace and quality of product innovation and resulted in the introduction of a steady stream of new products across all of AMETEK’s lines of business.
2
Table of Contents
Efficient and Low-Cost Manufacturing Operations. Through its Operational Excellence initiatives, AMETEK has established a lean manufacturing platform for its businesses. In its effort to achieve best-cost manufacturing, as of December 31, 2017, AMETEK had plants in Brazil, China, the Czech Republic, Malaysia, Mexico, and Serbia. These plants offer proximity to customers and provide opportunities for increasing international sales. Acquisitions also have allowed AMETEK to reduce costs and achieve operating synergies by consolidating operations, product lines and distribution channels, benefitting both of AMETEK’s operating groups.
Experienced Management Team. Another component of AMETEK’s success is the strength of its management team and that team’s commitment to improving Company performance. AMETEK senior management has extensive industry experience and an average of approximately 25 years of AMETEK service. The management team is focused on achieving results, building stockholder value and continually growing AMETEK. Individual performance is tied to financial results through Company-established stock ownership guidelines and equity incentive programs.
Business Strategy
AMETEK is committed to achieving earnings growth through the successful implementation of a Corporate Growth Plan. The goal of that plan is double-digit annual percentage growth in sales and earnings per share over the business cycle and a superior return on total capital. In addition, other financial initiatives have been or may be undertaken, including public and private debt or equity issuance, bank debt refinancing, local financing in certain foreign countries and share repurchases.
AMETEK’s Corporate Growth Plan consists of four key strategies:
Operational Excellence. Operational Excellence is AMETEK’s cornerstone strategy for accelerating growth, improving profit margins and strengthening its competitive position across its businesses. Operational Excellence focuses on initiatives to drive increased organic sales growth, improvements in operating efficiencies and sustainable practices. It emphasizes team building and a participative management culture. AMETEK’s Operational Excellence strategies include lean manufacturing, global sourcing, Design for Six Sigma, Value Engineering/Value Analysis and growth kaizens. Each plays an important role in improving efficiency, enhancing the pace and quality of innovation and driving profitable sales growth. Operational Excellence initiatives have yielded lower operating and administrative costs, shortened manufacturing cycle times, resulted in higher cash flow from operations and increased customer satisfaction. They also have played a key role in achieving synergies from newly acquired companies.
Strategic Acquisitions. Acquisitions are a key to achieving the goals of AMETEK’s Corporate Growth Plan. Since the beginning of 2013 through December 31, 2017, AMETEK has completed 18 acquisitions with annualized sales totaling over $1 billion, including three acquisitions in 2017 (see “Recent Acquisitions”). AMETEK targets companies that offer the right strategic, technical and cultural fit. It seeks to acquire businesses in adjacent markets with complementary products and technologies. It also looks for businesses that provide attractive growth opportunities, often in new and emerging markets. Through these and prior acquisitions, AMETEK’s management team has developed considerable skill in identifying, acquiring and integrating new businesses. As it has executed its acquisition strategy, AMETEK’s mix of businesses has shifted toward those that are more highly differentiated and, therefore, offer better opportunities for growth and profitability.
Global & Market Expansion. AMETEK has experienced strong growth outside the United States, reflecting an expanding international customer base, investments in our global infrastructure and the attractive growth potential of its businesses in overseas markets. While Europe remains its largest overseas market, AMETEK has pursued growth opportunities worldwide, especially in key emerging markets. It has grown sales in Latin America and Asia by strategically building, acquiring and expanding manufacturing
3
Table of Contents
facilities. AMETEK also has expanded its sales and service capabilities in China and enhanced its sales presence and engineering capabilities in India. Elsewhere in Asia and in the Middle East, it has expanded sales, service and technical support. Recently acquired businesses have further added to AMETEK’s international presence.
New Products. New products are essential to AMETEK’s long-term growth. As a result, AMETEK has maintained a consistent investment in new product development and engineering. In 2017, AMETEK added to its highly differentiated product portfolio with a range of new products across many of its businesses. They included:
| • | Creaform has teamed its SmartDENT 3D™ surface inspection software with its HandyPROBE Next 3D scanner to perform inspection and damage assessment of aircraft surfaces; |
| • | Dunkermotoren expanded its range of smart motors with external Ethercat electronics with the addition of its flagship BG95 brushless DC motor; |
| • | Technical Manufacturing Corporation (“TMC”) incorporated the latest vibration isolation technology into its UltraDamp™ system for highly sensitive equipment and SEM-Base® VI system for scanning electron microscopes; |
| • | Vision Research built upon its award-winning imaging technology in designing the Phantom® Flex4K-GS high-speed camera for scientific research, defense and aerospace applications; |
| • | Acquired in February 2017, Rauland-Borg Corporation’s (“Rauland”) Responder® 5 systems bring advanced communications, information exchange and intelligent workflow technology solutions to hospitals and healthcare facilities; |
| • | Reichert Technologies added to its leading position in vision testing and eye disease diagnosis with its ClearChart® 4 family of digital acuity systems; |
| • | Land Instruments introduced its Near Infrared Borescope non-contact thermal imager for the aluminum and glass processing industries; |
| • | CAMECA developed the first cryo-transfer local electrode atom probe helping researchers conduct breakthrough research into three-dimensional atomic analysis; |
| • | EDAX was granted a U.S. patent for the technology that underlies the software for its latest electron backscatter diffraction microanalysis instruments; |
| • | The ORTEC Detective X™, a handheld radioisotope identifier represents the gold standard for many of world’s leading homeland security and defense agencies; |
| • | Solidstate Controls designed its SlimLine uninterruptible power supply product line to meet the highly specialized needs of offshore oil and gas platforms; |
| • | Acquired in June 2017, MOCON, Inc. launched the AQUATRAN Model 3 system to measure the water vapor transmission rate of ultrahigh barrier materials; |
| • | The SPECTROPORT portable metals analyzer from SPECTRO Analytical Instruments offers advanced optical emission spectroscopy technology in an easy-to-use handheld device; and |
| • | Grabner Instruments’ MINISCAN IR VISION portable analyzer offers cutting-edge performance and speeds in delivering reliable and accurate analysis of diesel and jet fuels. |
4
Table of Contents
2017 OVERVIEW
Operating Performance
In 2017, the Company established records for orders, sales, operating income, net income, diluted earnings per share and operating cash flow. The strengthening global economic environment compared to 2016, contributions from recent acquisitions, and continued focus on and implementation of Operational Excellence initiatives, had a positive impact on 2017 results. See “Results of Operations” in Part II, Item 7 Management’s Discussion and Analysis of Financial Condition and Results of Operations for further details.
In 2017, AMETEK achieved sales of $4,300.2 million, an increase of 12.0% from 2016 due to 6% organic sales growth, with 5% organic sales growth in EIG and 8% organic sales growth in EMG, and a 6% increase from the 2017 and 2016 acquisitions. Diluted earnings per share for 2017 were $2.94, an increase of $0.75 or 34.2%, compared with $2.19 per diluted share in 2016.
On December 22, 2017, the U.S. enacted the Tax Cuts and Jobs Act (the “Act”). As a result, in the fourth quarter of 2017, the Company recorded a net benefit of $91.6 million in the consolidated statement of income as a component of Provision for income taxes. The Act had the effect of increasing 2017 diluted earnings per share by $0.39. See “Results of Operations” in Part II, Item 7 Management’s Discussion and Analysis of Financial Condition and Results of Operations and Note 8 to the Consolidated Financial Statements included in Part II, Item 8 of this Annual Report on Form 10-K for further details.
Recent Acquisitions
AMETEK spent $556.6 million in cash, net of cash acquired, to acquire three businesses in 2017.
In February 2017, AMETEK acquired Rauland, a global provider of enterprise clinical and education communications solutions for hospitals, healthcare systems and educational facilities. Rauland is part of EIG.
In June 2017, AMETEK acquired MOCON, a provider of laboratory and field gas analysis instrumentation to research laboratories, production facilities and quality control departments in food and beverage, pharmaceutical and industrial applications. MOCON is part of EIG.
In December 2017, AMETEK acquired Arizona Instrument LLC, a provider of differentiated, high-precision moisture and gas measurement instruments for use in the food, pharmaceutical and environmental markets. Arizona Instrument is part of EIG.
Financing
In the fourth quarter of 2017, the Company paid in full, at maturity, $270 million in aggregate principal amount of 6.20% private placement senior notes.
Financial Information About Reportable Segments, Foreign Operations and Export Sales
Information with respect to reportable segments and geographic areas is set forth in Note 15 to the Consolidated Financial Statements included in Part II, Item 8 of this Annual Report on Form 10-K.
AMETEK’s international sales increased 10.1% to $2,214.0 million in 2017. International sales represented 51.5% of consolidated net sales in 2017 compared with 52.4% in 2016. The increase in international sales was primarily driven by organic sales growth.
5
Table of Contents
Description of Business
Described below are the products and markets of each reportable segment:
EIG
EIG is a leader in the design and manufacture of advanced instruments for the process, power and industrial, and aerospace markets. Its growth is based on the four strategies outlined in AMETEK’s Corporate Growth Plan. In many instances, its products differ from or are technologically superior to its competitors’ products. It has achieved competitive advantage through continued investment in research, development and engineering to develop market-leading products and solutions that serve niche markets. It also has expanded its sales and service capabilities globally to serve its customers.
EIG is a leader in many of the specialized markets it serves. Products supplied to these markets include process control instruments for the oil and gas, petrochemical, pharmaceutical, semiconductor, automation, and food and beverage industries. It provides a growing range of instruments to the laboratory equipment, ultraprecision manufacturing, medical, and test and measurement markets. It is a leader in power quality monitoring and metering, uninterruptible power systems, programmable power equipment, electromagnetic compatibility (“EMC”) test equipment, sensors for gas turbines, dashboard instruments for heavy trucks and other vehicles, and instrumentation and controls for the food and beverage industries. It supplies the aerospace industry with aircraft and engine sensors, monitoring systems, power supplies, fuel and fluid measurement systems, and data acquisition systems.
In 2017, 52% of EIG’s net sales was to customers outside the United States. At December 31, 2017, EIG employed approximately 9,200 people, of whom approximately 1,200 were covered by collective bargaining agreements. At December 31, 2017, EIG had 86 operating facilities: 55 in the United States, nine in the United Kingdom, eight in Germany, three in Canada, two each in China, Denmark and France and one each in Argentina, Austria, Finland, Mexico and Switzerland. EIG also shares operating facilities with EMG in Brazil, China and Mexico.
Process and Analytical Instrumentation Markets and Products
Process and analytical instrumentation sales represented 69% of EIG’s 2017 net sales. These sales include process analyzers, emission monitors and spectrometers; elemental and surface analysis instruments; level, pressure and temperature sensors and transmitters; radiation measurement devices; level measurement devices; precision manufacturing systems; materials- and force-testing instruments; contact and non-contact metrology products; and clinical and educational communication solutions. Among the industries it serves are oil, gas and petrochemical refining; power generation; pharmaceutical manufacturing; medical and healthcare; water and waste treatment; natural gas distribution; and semiconductor manufacturing. Its instruments are used for precision measurement in a number of applications, including radiation detection, trace element and materials analysis, nanotechnology research, ultraprecise manufacturing, and test and measurement.
Acquired in June 2017, MOCON is a leading provider of detectors, instruments, systems and consulting services to research laboratories, production facilities, and quality control and safety departments in the medical, pharmaceutical, food and beverage, packaging, environmental, oil and gas and other industries worldwide. MOCON’s products and technologies complement the Company’s existing gas analysis instrumentation business and provides it with opportunities to expand into the growing food and pharmaceutical package testing market.
Acquired in February 2017, Rauland is a global provider of enterprise clinical and education communications solutions for hospitals, healthcare systems and educational facilities. Rauland provides the Company with attractive new growth opportunities within the medical technology market, strong growth opportunities in its core markets and incremental growth opportunities through acquisitions and international expansion.
6
Table of Contents
Acquired in July 2016, HS Foils develops patented silicon nitride window technology that significantly expands the limits of x-ray window performance and areas of application. HS Foils also has extensive expertise in silicon PIN diode and silicon drift detector manufacturing.
Acquired in July 2016, Nu Instruments offers a full suite of magnetic sector mass spectrometers used in advanced laboratory analysis across demanding research applications in the environmental and earth sciences, material characterization and nuclear isotope analysis. Nu Instruments’ customers include leading universities and research institutions, and technical manufacturing and materials analysis companies.
Power and Industrial Instrumentation Markets and Products
Power and industrial instrumentation sales represented 24% of EIG’s 2017 net sales. This business provides power monitoring and metering instruments, uninterruptible power supply systems and programmable power supplies used in a wide range of industrial settings. It is a leader in the design and manufacture of power measurement, quality monitoring and event recorders for use in power generation, transmission and distribution. It provides uninterruptible power supply systems, multifunction electric meters, annunciators, alarm monitoring systems and highly specialized communications equipment for smart grid applications. It also offers precision power supplies and power conditioning products, and electrical immunity and EMC test equipment.
Acquired in December 2017, Arizona Instrument is a provider of differentiated, high-precision moisture and gas measurement instruments for use in the food, pharmaceutical and environmental markets. Arizona Instrument complements the Company’s existing Brookfield Engineering Laboratories (“Brookfield”) viscosity measurement business. Its high-quality products support their customers’ increasingly complex production processes and more stringent environmental and safety standards.
Acquired in January 2016, Brookfield is the global leader in viscosity measurement instrumentation and offers a complete range of viscometers and rheometers, as well as instrumentation to analyze texture and powder flow. Its products are used primarily for quality control applications in a broad range of markets, including food and beverage, pharmaceuticals, oil and gas, paints, solvents, chemicals, coatings and packaging.
Acquired in January 2016, ESP/SurgeX is a leader in power protection, monitoring, and diagnostic solutions. ESP/SurgeX is the leading industry provider of on-site and remote power protection products used by industries to lower service costs and ensure reliable electric power to critical equipment. Its patented technology is widely used by the business equipment, imaging, audio visual, information technology, gaming and vending industries.
Aerospace Instrumentation Markets and Products
Aerospace instrumentation sales represented 7% of EIG’s 2017 net sales. AMETEK’s aerospace products are designed to customer specifications and manufactured to stringent operational and reliability requirements. These products include airborne data systems, turbine engine temperature measurement products, vibration-monitoring systems, cockpit instruments and displays, fuel and fluid measurement products, and sensors and switches. It serves all segments of the commercial and military aerospace market, including commercial airliners, business jets, regional aircraft and helicopters.
AMETEK operates in highly specialized aerospace market segments in which it has proven technological or manufacturing advantages versus its competition. Among its more significant competitive advantages is its 70-year-plus reputation as an established aerospace supplier. It has long-standing relationships with the world’s leading commercial and military aircraft, jet engine and original equipment manufacturers and aerospace system integrators. AMETEK also is a leading provider of spare part sales and repair and overhaul services to commercial aerospace.
7
Table of Contents
Customers
EIG is not dependent on any single customer such that the loss of that customer would have a material adverse effect on EIG’s operations. Approximately 6% of EIG’s 2017 net sales was made to its five largest customers.
EMG
EMG is a differentiated supplier of automation solutions, thermal management systems, specialty metals and electrical interconnects. EMG is a leader in many of the niche markets in which it competes. Products supplied to these markets include its highly engineered electrical connectors and electronics packaging used in aerospace and defense, medical, and industrial applications, as well as its advanced precision motion control products, which are used in a wide range of automation applications across the medical, semiconductor, aerospace, defense, and food and beverage industries.
EMG supplies high-purity powdered metals, strip and foil, specialty clad metals and metal matrix composites. Its blowers and heat exchangers provide electronic cooling and environmental control for the aerospace and defense industries. Its motors are widely used in commercial appliances, fitness equipment, food and beverage machines, hydraulic pumps and industrial blowers. Additionally, it operates a global network of aviation maintenance, repair and overhaul (“MRO”) facilities.
EMG designs and manufactures products that, in many instances, are significantly different from or technologically superior to competitors’ products. It has achieved competitive advantage through continued investment in research, development and engineering, efficiency improvements from operational excellence, acquisition synergies and improved supply chain management.
In 2017, 50% of EMG’s net sales was to customers outside the United States. At December 31, 2017, EMG employed approximately 7,400 people, of whom approximately 2,200 were covered by collective bargaining agreements. At December 31, 2017, EMG had 63 operating facilities: 36 in the United States, ten in the United Kingdom, three in China, two each in France, Germany, Italy, Mexico and Serbia and one each in Brazil, the Czech Republic, Malaysia and Taiwan.
Technical Motors and Systems Markets and Products
Technical motors and systems sales represented 65% of EMG’s 2017 net sales. Technical motors and systems primarily consist of precision motion control solutions, brushless motors, blowers and pumps, heat exchangers and other electromechanical systems. These products are used in aerospace and defense, semiconductor equipment, computer equipment, mass transit, medical equipment and power industries among others. Additionally, technical motors and systems includes floor care and specialty motors which are used in a wide range of products, such as household, commercial and personal care appliances, fitness equipment, food and beverage machines, lawn and garden equipment, material handling equipment, hydraulic pumps, industrial blowers, and other household and commercial floor care products.
EMG produces motor-blower systems and heat exchangers used in thermal management and other applications on a variety of military and commercial aircraft and military ground vehicles. In addition, EMG provides the commercial and military aerospace industry with third-party MRO services on a global basis with facilities in the United States, Europe and Asia.
Engineered Materials, Interconnects and Packaging Markets and Products
Engineered materials, interconnects and packaging sales represented 35% of EMG’s 2017 net sales. AMETEK is a leader in highly engineered electrical connectors and electronics packaging used to protect
8
Table of Contents
sensitive devices and mission-critical electronics. Its electrical connectors, terminals, headers and packaging are designed specifically for harsh environments and highly customized applications. In addition, AMETEK is an innovator and market leader in specialized metal powder, strip, wire and bonded products used in medical, aerospace and defense, telecommunications, automotive and general industrial applications.
Acquired in October 2016, Laserage Technology Corporation (“Laserage”) offers precision tube fabrication of minimally invasive surgical devices, stents and catheter-based delivery systems. Laserage’s expertise includes laser fabrication of flat stock and tube for medical devices and specialty catheters.
Customers
EMG is not dependent on any single customer such that the loss of that customer would have a material adverse effect on EMG’s operations. Approximately 9% of EMG’s 2017 net sales was made to its five largest customers.
Marketing
AMETEK’s marketing efforts generally are organized and carried out at the business unit level. EIG makes use of distributors and sales representatives to market its products along with a direct sales force for its more technically sophisticated products. Within aerospace, the specialized customer base of aircraft and jet engine manufacturers is served primarily by direct sales engineers. Given the technical nature of many of its products, as well as its significant worldwide market share, EMG conducts much of its domestic and international marketing activities through a direct sales force and makes some use of sales representatives and distributors, both in the United States and in other countries.
Competition
In general, AMETEK’s markets are highly competitive with competition based on technology, performance, quality, service and price.
In EIG’s markets, AMETEK believes it ranks as a leader in certain analytical measuring and control instruments, and power and industrial markets. It also is a major instrument and sensor supplier to commercial aviation. In process and analytical instruments, numerous companies compete in each market on the basis of product quality, performance and innovation. In power and industrial and in aerospace, AMETEK competes with a number of companies depending on the specific market segment.
EMG’s businesses compete with a number of companies in each of its markets. Competition is generally based on product innovation, performance and price. There also is competition from alternative materials and processes.
Availability of Raw Materials
AMETEK’s reportable segments obtain raw materials and supplies from a variety of sources and generally from more than one supplier. For EMG, however, certain items, including various base metals and certain steel components, are available from only a limited number of suppliers. AMETEK believes its sources and supplies of raw materials are adequate for its needs.
9
Table of Contents
Backlog and Seasonal Variations of Business
AMETEK’s backlog of unfilled orders by reportable segment was as follows at December 31:
| 2017 | 2016 | 2015 | ||||||||||
| (In millions) | ||||||||||||
| Electronic Instruments |
$ | 718.1 | $ | 587.0 | $ | 581.4 | ||||||
| Electromechanical |
678.0 | 569.5 | 566.4 | |||||||||
|
|
|
|
|
|
|
|||||||
| Total |
$ | 1,396.1 | $ | 1,156.5 | $ | 1,147.8 | ||||||
|
|
|
|
|
|
|
|||||||
Of the total backlog of unfilled orders at December 31, 2017, approximately 88% is expected to be shipped by December 31, 2018. The Company believes that neither its business as a whole, nor either of its reportable segments, is subject to significant seasonal variations, although certain individual operations experience some seasonal variability.
Research, Development and Engineering
AMETEK is committed to, and has consistently invested in, research, development and engineering activities to design and develop new and improved products and solutions. Research, development and engineering costs before customer reimbursement were $221.2 million in 2017 and $200.8 million in both 2016 and 2015, respectively. Customer reimbursements in 2017, 2016 and 2015 were $5.4 million, $7.2 million and $6.9 million, respectively. These amounts included research and development expenses of $130.4 million, $112.0 million and $116.3 million in 2017, 2016 and 2015, respectively. All such expenditures were directed toward the development of new products and solutions and the improvement of existing products and solutions.
Environmental Matters
Information with respect to environmental matters is set forth in Part II, Item 7 Management’s Discussion and Analysis of Financial Condition and Results of Operations section entitled “Environmental Matters” and in Note 13 to the Consolidated Financial Statements included in Part II, Item 8 of this Annual Report on Form 10-K.
Patents, Licenses and Trademarks
AMETEK owns numerous unexpired U.S. and foreign patents, including counterparts of its more important U.S. patents, in the major industrial countries of the world. It is a licensor or licensee under patent agreements of various types, and its products are marketed under various registered and unregistered U.S. and foreign trademarks and trade names. AMETEK, however, does not consider any single patent or trademark, or any group of them, essential either to its business as a whole or to either one of its reportable segments. The annual royalties received or paid under license agreements are not significant to either of its reportable segments or to AMETEK’s overall operations.
Employees
At December 31, 2017, AMETEK employed approximately 16,900 people at its EIG, EMG and corporate operations, of whom approximately 3,400 employees were covered by collective bargaining agreements. AMETEK has four collective bargaining agreements that expire in 2018, which cover fewer than 400 employees. It expects no material adverse effects from the pending labor contract negotiations.
Working Capital Practices
AMETEK does not have extraordinary working capital requirements in either of its reportable segments. Its customers generally are billed at normal trade terms that may include extended payment provisions. Inventories are closely controlled and maintained at levels related to production cycles and normal delivery requirements of customers.
10
Table of Contents
You should consider carefully the following risk factors and all other information contained in this Annual Report on Form 10-K and the documents we incorporate by reference in this Annual Report on Form 10-K. Any of the following risks could materially and adversely affect our business, financial condition, results of operations and cash flows.
A downturn in the economy generally or in the markets we serve could adversely affect our business.
A number of the industries in which we operate are cyclical in nature and therefore are affected by factors beyond our control. A downturn in the U.S. or global economy, and, in particular, in the aerospace and defense, oil and gas, process instrumentation or power markets could have an adverse effect on our business, financial condition and results of operations.
Our growth could suffer if the markets into which we sell our products and services decline, do not grow as anticipated or experience cyclicality.
Our growth depends in part on the growth of the markets which we serve and visibility into our markets is limited (particularly for markets into which we sell through distribution). Our quarterly sales and profits depend substantially on the volume and timing of orders received during the fiscal quarter, which are difficult to forecast. Any decline or lower than expected growth in our served markets could diminish demand for our products and services, which would adversely affect our financial statements. Certain of our businesses operate in industries that may experience periodic, cyclical downturns. In addition, in certain of our businesses, demand depends on customers’ capital spending budgets, as well as government funding policies, and matters of public policy and government budget dynamics, as well as product and economic cycles can affect the spending decisions of these entities. Demand for our products and services is also sensitive to changes in customer order patterns, which may be affected by announced price changes, changes in incentive programs, new product introductions and customer inventory levels. Any of these factors could adversely affect our growth and results of operations in any given period.
Our growth strategy includes strategic acquisitions. We may not be able to consummate future acquisitions or successfully integrate recent and future acquisitions.
A portion of our growth has been attributed to acquisitions of strategic businesses. Since the beginning of 2013, through December 31, 2017, we have completed 18 acquisitions. We plan to continue making strategic acquisitions to enhance our global market position and broaden our product offerings. Although we have been successful with our acquisition strategy in the past, our ability to successfully effectuate acquisitions will be dependent upon a number of factors, including:
| • | Our ability to identify acceptable acquisition candidates; |
| • | The impact of increased competition for acquisitions, which may increase acquisition costs and affect our ability to consummate acquisitions on favorable terms and may result in us assuming a greater portion of the seller’s liabilities; |
| • | Successfully integrating acquired businesses, including integrating the financial, technological and management processes, procedures and controls of the acquired businesses with those of our existing operations; |
| • | Adequate financing for acquisitions being available on terms acceptable to us; |
11
Table of Contents
| • | U.S. and foreign competition laws and regulations affecting our ability to make certain acquisitions; |
| • | Unexpected losses of key employees, customers and suppliers of acquired businesses; |
| • | Mitigating assumed, contingent and unknown liabilities; and |
| • | Challenges in managing the increased scope, geographic diversity and complexity of our operations. |
The process of integrating acquired businesses into our existing operations may result in unforeseen operating difficulties and may require additional financial resources and attention from management that would otherwise be available for the ongoing development or expansion of our existing operations. Furthermore, even if successfully integrated, the acquired business may not achieve the results we expected or produce expected benefits in the time frame planned. Failure to continue with our acquisition strategy and the successful integration of acquired businesses could have a material adverse effect on our business, financial condition, results of operations and cash flows.
The indemnification provisions of acquisition agreements by which we have acquired companies may not fully protect us and as a result we may face unexpected liabilities.
Certain of the acquisition agreements by which we have acquired companies require the former owners to indemnify us against certain liabilities related to the operation of the company before we acquired it. In most of these agreements, however, the liability of the former owners is limited and certain former owners may be unable to meet their indemnification responsibilities. We cannot assure you that these indemnification provisions will protect us fully or at all, and as a result we may face unexpected liabilities that adversely affect our financial statements.
We may not properly execute, or realize anticipated cost savings or benefits from, our Operational Excellence initiatives.
Our success is partly dependent upon properly executing and realizing cost savings or other benefits from our ongoing production and procurement initiatives. These initiatives are primarily designed to make the Company more efficient, which is necessary in the Company’s highly competitive industries. These initiatives are often complex, and a failure to implement them properly may, in addition to not meeting projected cost savings or benefits, adversely affect our business and operations.
Foreign and domestic economic, political, legal, compliance and business factors could negatively affect our international sales and operations.
International sales for 2017 and 2016 represented 51.5% and 52.4% of our consolidated net sales, respectively. As a result of our growth strategy, we anticipate that the percentage of sales outside the United States will increase in the future. Approximately half of our international sales are of products manufactured outside the United States. As of December 31, 2017, we have manufacturing operations in 17 countries outside the United States, with significant operations in China, the Czech Republic, Mexico and Serbia. A prolonged disruption of our ability to obtain a supply of goods from these countries or a change in the effective cost of these products could have a material adverse effect on our sales and operations. International sales and operations are subject to the customary risks of operating in an international environment, including:
| • | Imposition of trade or foreign exchange restrictions, including in the United States; |
| • | Overlap of different tax structures; |
| • | Unexpected changes in regulatory requirements, including in the United States; |
12
Table of Contents
| • | Trade protection measures, such as the imposition of or increase in tariffs and other trade barriers, including in the United States; |
| • | The difficulty and/or costs of designing and implementing an effective control environment across diverse regions and employee bases; |
| • | Restrictions on currency repatriation; |
| • | General economic conditions; |
| • | Unstable political situations; |
| • | Nationalization of assets; and |
| • | Compliance with a wide variety of international and U.S. laws and regulatory requirements. |
Furthermore, fluctuations in foreign currency exchange rates, including changes in the relative value of currencies in the countries where we operate, subject us to exchange rate exposure and may adversely affect our financial statements. For example, increased strength in the U.S. dollar will increase the effective price of our products sold overseas, which may adversely affect sales or require us to lower our prices. In addition, our consolidated financial statements are presented in U.S. dollars, and we must translate our assets, liabilities, sales and expenses into U.S. dollars for external reporting purposes. As a result, changes in the value of the U.S. dollar due to fluctuations in currency exchange rates or currency exchange controls may materially and negatively affect the value of these items in our consolidated financial statements, even if their value has not changed in their local currency.
Our international sales and operations may be adversely impacted by compliance with export laws.
We are required to comply with various import, export, export control and economic sanctions laws, which may affect our transactions with certain customers, business partners and other persons, including in certain cases dealings with or between our employees and subsidiaries. In certain circumstances, export control and economic sanctions regulations may prohibit the export of certain products, services and technologies and in other circumstances, we may be required to obtain an export license before exporting a controlled item. In addition, failure to comply with any of these regulations could result in civil and criminal, monetary and non-monetary penalties, disruptions to our business, limitations on our ability to import and export products and services and damage to our reputation.
Our reputation, ability to do business and financial statements may be impaired by improper conduct by any of our employees, agents or business partners.
We cannot provide assurance that our internal controls and compliance systems will always protect us from acts committed by employees, agents or business partners of ours (or of businesses we acquire or partner with) that would violate U.S. and/or non-U.S. laws, including the laws governing payments to government officials, bribery, fraud, kickbacks and false claims, pricing, sales and marketing practices, conflicts of interest, competition, export and import compliance, money laundering and data privacy. In particular, the U.S. Foreign Corrupt Practices Act, the U.K. Bribery Act and similar anti-bribery laws in other jurisdictions generally prohibit companies and their intermediaries from making improper payments to government officials for the purpose of obtaining or retaining business, and we operate in many parts of the world that have experienced governmental corruption to some degree. Any such improper actions or allegations of such acts could damage our reputation and subject us to civil or criminal investigations in the U.S. and in other jurisdictions and related shareholder lawsuits could lead to substantial civil and criminal, monetary and non-monetary penalties and could cause us to
13
Table of Contents
incur significant legal and investigatory fees. In addition, we rely on our suppliers to adhere to our supplier standards of conduct and material violations of such standards of conduct could occur that could have a material effect on our financial statements.
Any inability to hire, train and retain a sufficient number of skilled officers and other employees could impede our ability to compete successfully.
If we cannot hire, train and retain a sufficient number of qualified employees, we may not be able to effectively integrate acquired businesses and realize anticipated results from those businesses, manage our expanding international operations and otherwise profitably grow our business. Even if we do hire and retain a sufficient number of employees, the expense necessary to attract and motivate these officers and employees may adversely affect our results of operations.
If we are unable to develop new products on a timely basis, it could adversely affect our business and prospects.
We believe that our future success depends, in part, on our ability to develop, on a timely basis, technologically advanced products that meet or exceed appropriate industry standards. Although we believe we have certain technological and other advantages over our competitors, maintaining such advantages will require us to continue investing in research and development and sales and marketing. There can be no assurance that we will have sufficient resources to make such investments, that we will be able to make the technological advances necessary to maintain such competitive advantages or that we can recover major research and development expenses. We are not currently aware of any emerging standards or new products which could render our existing products obsolete, although there can be no assurance that this will not occur or that we will be able to develop and successfully market new products.
Our technology is important to our success and our failure to protect this technology could put us at a competitive disadvantage.
Many of our products rely on proprietary technology; therefore, we endeavor to protect our intellectual property rights through patents, copyrights, trade secrets, trademarks, confidentiality agreements and other contractual provisions. Despite our efforts to protect proprietary rights, unauthorized parties or competitors may copy or otherwise obtain and use our products or technology. In addition, our ability to protect and enforce our intellectual property rights may be limited in certain countries outside the U.S. Actions to enforce our rights may result in substantial costs and diversion of resources and we make no assurances that any such actions will be successful.
A shortage of, or price increases for, our raw materials could increase our operating costs.
While we manufacture certain parts and components used in our products, we require substantial amounts of raw materials and purchase some parts and components from suppliers. The availability and prices for raw materials, parts and components may be subject to curtailment or change due to, among other things, supplier’s allocation to other purchasers, interruptions in production by suppliers, changes in exchange rates and prevailing price levels. In addition, certain items, including base metals and certain steel components, are available only from a limited number of suppliers and are subject to commodity market fluctuations. Shortages in raw materials or price increases therefore could affect the prices we charge, our operating costs and our competitive position, which could adversely affect our business, financial condition, results of operations and cash flows.
Certain environmental risks may cause us to be liable for costs associated with hazardous or toxic substance clean-up which may adversely affect our financial condition.
Our businesses, operations and facilities are subject to a number of federal, state, local and foreign environmental and occupational health and safety laws and regulations concerning, among other things, air
14
Table of Contents
emissions, discharges to waters and the use, manufacturing, generation, handling, storage, transportation and disposal of hazardous substances and wastes. Environmental risks are inherent in many of our manufacturing operations. Certain laws provide that a current or previous owner or operator of property may be liable for the costs of investigating, removing and remediating hazardous materials at such property, regardless of whether the owner or operator knew of, or was responsible for, the presence of such hazardous materials. In addition, the Comprehensive Environmental Response, Compensation and Liability Act generally imposes joint and several liability for clean-up costs, without regard to fault, on parties contributing hazardous substances to sites designated for clean-up under the Act. We have been named a potentially responsible party at several sites, which are the subject of government-mandated clean-ups. As the result of our ownership and operation of facilities that use, manufacture, store, handle and dispose of various hazardous materials, we may incur substantial costs for investigation, removal, remediation and capital expenditures related to compliance with environmental laws. While it is not possible to precisely quantify the potential financial impact of pending environmental matters, based on our experience to date, we believe that the outcome of these matters is not likely to have a material adverse effect on our financial position or future results of operations. In addition, new laws and regulations, new classification of hazardous materials, stricter enforcement of existing laws and regulations, the discovery of previously unknown contamination or the imposition of new clean-up requirements could require us to incur costs or become the basis for new or increased liabilities that could have a material adverse effect on our business, financial condition and results of operations. There can be no assurance that future environmental liabilities will not occur or that environmental damages due to prior or present practices will not result in future liabilities.
We are subject to numerous governmental regulations, which may be burdensome or lead to significant costs.
Our operations are subject to numerous federal, state, local and foreign governmental laws and regulations. In addition, existing laws and regulations may be revised or reinterpreted and new laws and regulations, including with respect to climate change, may be adopted or become applicable to us or customers for our products. We cannot predict the form any such new laws or regulations will take or the impact any of these laws and regulations will have on our business or operations.
We are subject to a variety of litigation and other legal and regulatory proceedings in the course of our business that could adversely affect our financial statements.
We are subject to a variety of litigation and other legal and regulatory proceedings incidental to our business (or the business operations of previously owned entities), including claims for damages arising out of the use of products or services and claims relating to intellectual property matters, employment matters, tax matters, commercial disputes, competition and sales and trading practices, environmental matters, personal injury, insurance coverage and acquisition-related matters, as well as regulatory investigations or enforcement. These lawsuits may include claims for compensatory damages, punitive and consequential damages and/or injunctive relief. The defense of these lawsuits may divert our management’s attention, we may incur significant expenses in defending these lawsuits, and we may be required to pay damage awards or settlements or become subject to equitable remedies that could adversely affect our operations and financial statements. Moreover, any insurance or indemnification rights that we may have may be insufficient or unavailable to protect us against such losses. In addition, developments in proceedings in any given period may require us to adjust the loss contingency estimates that we have recorded in our financial statements, record estimates for liabilities or assets previously not susceptible of reasonable estimates or pay cash settlements or judgments. Any of these developments could adversely affect our financial statements in any particular period. We cannot assure you that our liabilities in connection with litigation and other legal and regulatory proceedings will not exceed our estimates or adversely affect our financial statements and reputation. However, based on our experience, current information and applicable law, we do not believe that any amounts we may be required to pay in connection with litigation and other legal and regulatory proceedings in excess of our reserves as of the date of this information statement will have a material effect on our financial statements.
15
Table of Contents
We operate in highly competitive industries, which may adversely affect our results of operations or ability to expand our business.
Our markets are highly competitive. We compete, domestically and internationally, with individual producers, as well as with vertically integrated manufacturers, some of which have resources greater than we do. The principal elements of competition for our products are product technology, quality, service, distribution and price. Although we believe EIG is a market leader, competition is strong and could intensify in the markets served by EIG. In the aerospace markets served by EIG, a limited number of companies compete on the basis of product quality, performance and innovation. EMG’s competition in specialty metal products stems from alternative materials and processes. Our competitors may develop new or improve existing products that are superior to our products or may adapt more readily to new technologies or changing requirements of our customers. There can be no assurance that our business will not be adversely affected by increased competition in the markets in which it operates or that our products will be able to compete successfully with those of our competitors.
Restrictions contained in our revolving credit facility and other debt agreements may limit our ability to incur additional indebtedness.
Our existing revolving credit facility and other debt agreements (each a “Debt Facility” and collectively, “Debt Facilities”) contain restrictive covenants, including restrictions on our ability to incur indebtedness. These restrictions could limit our ability to effectuate future acquisitions, limit our ability to pay dividends, limit our ability to make capital expenditures or restrict our financial flexibility. Our Debt Facilities contain covenants requiring us to achieve certain financial and operating results and maintain compliance with specified financial ratios. Our ability to meet the financial covenants or requirements in our Debt Facilities may be affected by events beyond our control, and we may not be able to satisfy such covenants and requirements. A breach of these covenants or our inability to comply with the financial ratios, tests or other restrictions contained in a Debt Facility could result in an event of default under one or more of our other Debt Facilities. Upon the occurrence of an event of default under a Debt Facility, and the expiration of any grace periods, the lenders could elect to declare all amounts outstanding under one or more of our other Debt Facilities, together with accrued interest, to be immediately due and payable. If this were to occur, our assets may not be sufficient to fully repay the amounts due under our Debt Facilities or our other indebtedness.
Our business and financial performance may be adversely affected by cybersecurity incidents, and other information technology and business disruptions.
Our facilities, supply chains, distribution systems, products and information technology systems may be impacted by natural or man-made disruptions, including cybersecurity attacks, other information technology attacks or failures, threats to physical security, armed conflict, as well as damaging weather or other acts of nature, pandemics or other public health crises. For example, our information technology systems may be damaged, disrupted or shut down due to attacks by computer hackers, computer viruses, cyberattacks or other security breach, employee error or malfeasance, power outages, hardware failures, telecommunications or utility failures, or other unforeseen events, and in any such circumstances our disaster recovery planning and security upgrade efforts may be ineffective or inadequate. A shutdown of, or inability to utilize, one or more of our facilities, our supply chain, our distribution system, our products or our information technology, telecommunications or other systems, could significantly disrupt our operations, delay production and shipments, our relationships and reputation with customers, suppliers, employees, stockholders and others, result in lost sales, result in the misappropriation or corruption of data, or result in legal exposure and large remediation or other expenses.
16
Table of Contents
Our goodwill and other intangible assets represent a substantial proportion of our total assets and the impairment of such substantial goodwill and intangible assets could have a negative impact on our financial condition and results of operations.
Our total assets include substantial amounts of intangible assets, primarily goodwill. At December 31, 2017, goodwill and other intangible assets, net of accumulated amortization, totaled $5,129.0 million or 66% of our total assets. The goodwill results from our acquisitions, representing the excess of cost over the fair value of the net tangible and other identifiable intangible assets we have acquired. At a minimum, we assess annually whether there has been impairment in the value of our intangible assets. If future operating performance at one or more of our reporting units were to fall significantly below current levels, we could record, under current applicable accounting rules, a non-cash charge to operating income for goodwill or other intangible asset impairment. Any determination requiring the impairment of a significant portion of goodwill or other intangible assets would negatively affect our financial condition and results of operations.
Item 1B. Unresolved Staff Comments
None.
17
Table of Contents
| Item 2. | Properties |
At December 31, 2017, the Company had 149 operating facilities in 25 states and 17 foreign countries. Of these facilities, 60 are owned by the Company and 89 are leased. The properties owned by the Company consist of approximately 724 acres, of which approximately 5.3 million square feet are under roof. Under lease is a total of approximately 3.3 million square feet. The leases expire over a range of years from 2018 to 2082, with renewal options for varying terms contained in many of the leases. The Company’s executive offices in Berwyn, Pennsylvania, occupy approximately 43,000 square feet under a lease that expires in September 2023.
The Company’s machinery and equipment, plants and offices are in satisfactory operating condition and are adequate for the uses to which they are put. The operating facilities of the Company by reportable segment were as follows at December 31, 2017:
| Number of Operating Facilities |
Square Feet Under Roof | |||||||||||||||
| Owned | Leased | Owned | Leased | |||||||||||||
| Electronic Instruments |
29 | 57 | 2,146,000 | 2,194,000 | ||||||||||||
| Electromechanical |
31 | 32 | 3,160,000 | 1,056,000 | ||||||||||||
|
|
|
|
|
|
|
|
|
|||||||||
| Total |
60 | 89 | 5,306,000 | 3,250,000 | ||||||||||||
|
|
|
|
|
|
|
|
|
|||||||||
| Item 3. | Legal Proceedings |
Please refer to “Environmental Matters” in Part II, Item 7 Management’s Discussion and Analysis of Financial Condition and Results of Operations and Note 13 to the Consolidated Financial Statements included in Part II, Item 8 of this Annual Report on Form 10-K for information regarding certain litigation matters.
The Company is subject to a variety of litigation and other legal and regulatory proceedings incidental to its business (or the business operations of previously owned entities), including claims for damages arising out of the use of the Company’s products or services and claims relating to intellectual property matters, employment matters, tax matters, commercial disputes, competition and sales and trading practices, environmental matters, personal injury, insurance coverage and acquisition-related matters, as well as regulatory investigations or enforcement. Based upon the Company’s experience, the Company does not believe that these proceedings and claims will have a material adverse effect on its results of operations, financial position or cash flows.
18
Table of Contents
PART II
| Item 5. | Market for Registrant’s Common Equity, Related Stockholder Matters and Issuer Purchases of Equity Securities |
The principal market on which the Company’s common stock is traded is the New York Stock Exchange and it is traded under the symbol “AME.” On January 31, 2018, there were approximately 1,900 holders of record of the Company’s common stock.
Market price and dividend information with respect to the Company’s common stock is set forth below. Future dividend payments by the Company will be dependent on future earnings, financial requirements, contractual provisions of debt agreements and other relevant factors.
Under its share repurchase program, the Company repurchased approximately 114,000 shares of its common stock for $6.9 million in 2017 and approximately 7,099,000 shares of its common stock for $336.1 million in 2016.
The high and low sales prices of the Company’s common stock on the New York Stock Exchange composite tape and the quarterly dividends per share paid on the common stock were:
| First Quarter |
Second Quarter |
Third Quarter |
Fourth Quarter |
|||||||||||||
| 2017 |
||||||||||||||||
| Dividends paid per share |
$ | 0.09 | $ | 0.09 | $ | 0.09 | $ | 0.09 | ||||||||
| Common stock trading range: |
||||||||||||||||
| High |
$ | 55.48 | $ | 62.89 | $ | 66.70 | $ | 73.06 | ||||||||
| Low |
$ | 48.55 | $ | 53.19 | $ | 60.50 | $ | 65.65 | ||||||||
| 2016 |
||||||||||||||||
| Dividends paid per share |
$ | 0.09 | $ | 0.09 | $ | 0.09 | $ | 0.09 | ||||||||
| Common stock trading range: |
||||||||||||||||
| High |
$ | 52.93 | $ | 52.61 | $ | 50.27 | $ | 51.26 | ||||||||
| Low |
$ | 42.82 | $ | 43.28 | $ | 43.30 | $ | 43.98 | ||||||||
Issuer Purchases of Equity Securities
The following table reflects purchases of AMETEK, Inc. common stock by the Company during the three months ended December 31, 2017:
| Period |
Total Number of Shares Purchased (1)(2) |
Average Price Paid per Share |
Total Number of Shares Purchased as Part of Publicly Announced Plan (2) |
Approximate Dollar Value of Shares that May Yet Be Purchased Under the Plan |
||||||||||||
| October 1, 2017 to October 31, 2017 |
1,647 | $ | 68.73 | 1,647 | $ | 368,751,020 | ||||||||||
| November 1, 2017 to November 30, 2017 |
345 | 68.42 | 345 | 368,727,415 | ||||||||||||
| December 1, 2017 to December 31, 2017 |
— | — | — | 368,727,415 | ||||||||||||
|
|
|
|
|
|||||||||||||
| Total |
1,992 | 68.68 | 1,992 | |||||||||||||
|
|
|
|
|
|
|
|||||||||||
| (1) | Represents shares surrendered to the Company to satisfy tax withholding obligations in connection with employees’ share-based compensation awards. |
| (2) | Consists of the number of shares purchased pursuant to the Company’s Board of Directors $400 million authorization for the repurchase of its common stock announced in November 2016. Such purchases may be effected from time to time in the open market or in private transactions, subject to market conditions and at management’s discretion. |
19
Table of Contents
Securities Authorized for Issuance Under Equity Compensation Plan Information
The following table sets forth information as of December 31, 2017 regarding all of the Company’s existing compensation plans pursuant to which equity securities are authorized for issuance to employees and nonemployee directors:
| Plan category |
Number of securities to be issued upon exercise of outstanding options, warrants and rights (a) |
Weighted average exercise price of outstanding options, warrants and rights (b) |
Number of securities remaining available for future issuance under equity compensation plans (excluding securities reflected in column (a)) (c) |
|||||||||
| Equity compensation plans approved by security holders |
5,582,803 | $ | 48.99 | 6,395,457 | ||||||||
| Equity compensation plans not approved by security holders |
— | — | — | |||||||||
|
|
|
|
|
|||||||||
| Total |
5,582,803 | 48.99 | 6,395,457 | |||||||||
|
|
|
|
|
|
|
|||||||
20
Table of Contents
Stock Performance Graph
The following graph and accompanying table compare the cumulative total stockholder return for AMETEK over the last five years ended December 31, 2017 with total returns for the same period for the Standard and Poor’s (“S&P”) 500 Index and Russell 1000 Index. AMETEK’s stock price is a component of both indices. The performance graph and table assume a $100 investment made on December 31, 2012 and reinvestment of all dividends. The stock performance shown on the graph below is based on historical data and is not necessarily indicative of future stock price performance.
COMPARISON OF FIVE-YEAR CUMULATIVE TOTAL RETURN
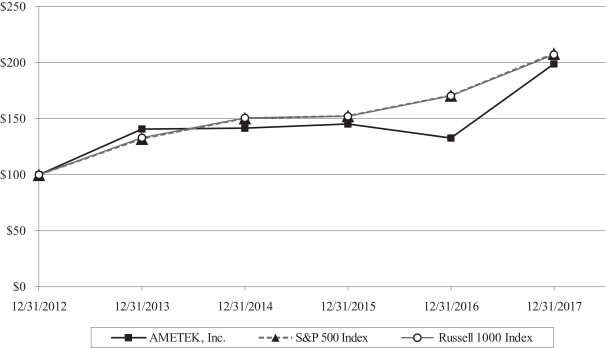
| December 31, | ||||||||||||||||||||||||
| 2012 | 2013 | 2014 | 2015 | 2016 | 2017 | |||||||||||||||||||
| AMETEK, Inc. |
$ | 100.00 | $ | 140.95 | $ | 141.73 | $ | 145.28 | $ | 132.75 | $ | 199.09 | ||||||||||||
| S&P 500 Index |
100.00 | 132.39 | 150.51 | 152.59 | 170.84 | 208.14 | ||||||||||||||||||
| Russell 1000 Index |
100.00 | 133.11 | 150.73 | 152.12 | 170.45 | 207.42 | ||||||||||||||||||
21
Table of Contents
| Item 6. | Selected Financial Data |
The following financial information for the five years ended December 31, 2017, has been derived from the Company’s consolidated financial statements. This information should be read in conjunction with Management’s Discussion and Analysis of Financial Condition and Results of Operations and the consolidated financial statements and related notes thereto included elsewhere in this Annual Report on Form 10-K.
| 2017 | 2016 | 2015 | 2014 | 2013 | ||||||||||||||||
| (In millions, except per share amounts) | ||||||||||||||||||||
| Consolidated Operating Results (Year Ended December 31): |
||||||||||||||||||||
| Net sales |
$ | 4,300.2 | $ | 3,840.1 | $ | 3,974.3 | $ | 4,022.0 | $ | 3,594.1 | ||||||||||
| Operating income |
$ | 915.1 | $ | 801.9 | $ | 907.7 | $ | 898.6 | $ | 815.1 | ||||||||||
| Interest expense |
$ | 98.0 | $ | 94.3 | $ | 91.8 | $ | 79.9 | $ | 73.6 | ||||||||||
| Net income |
$ | 681.5 | $ | 512.2 | $ | 590.9 | $ | 584.5 | $ | 517.0 | ||||||||||
| Earnings per share: |
||||||||||||||||||||
| Basic |
$ | 2.96 | $ | 2.20 | $ | 2.46 | $ | 2.39 | $ | 2.12 | ||||||||||
| Diluted |
$ | 2.94 | $ | 2.19 | $ | 2.45 | $ | 2.37 | $ | 2.10 | ||||||||||
| Dividends declared and paid per share |
$ | 0.36 | $ | 0.36 | $ | 0.36 | $ | 0.33 | $ | 0.24 | ||||||||||
| Weighted average common shares outstanding: |
||||||||||||||||||||
| Basic |
230.2 | 232.6 | 239.9 | 244.9 | 243.9 | |||||||||||||||
| Diluted |
231.8 | 233.7 | 241.6 | 247.1 | 246.1 | |||||||||||||||
| Performance Measures and Other Data: |
||||||||||||||||||||
| Operating income — Return on net sales |
21.3 | % | 20.9 | % | 22.8 | % | 22.3 | % | 22.7 | % | ||||||||||
|
— Return on average total assets |
12.3 | % | 11.7 | % | 13.9 | % | 14.6 | % | 14.7 | % | ||||||||||
| Net income — Return on average total capital |
11.6 | % | 9.5 | % | 11.6 | % | 12.3 | % | 12.1 | % | ||||||||||
|
— Return on average stockholders’ equity |
18.7 | % | 15.7 | % | 18.2 | % | 18.3 | % | 18.2 | % | ||||||||||
| EBITDA(1) |
$ | 1,076.0 | $ | 966.0 | $ | 1,046.9 | $ | 1,022.6 | $ | 916.3 | ||||||||||
| Ratio of EBITDA to interest expense(1) |
11.0x | 10.2x | 11.4x | 12.8x | 12.4x | |||||||||||||||
| Depreciation and amortization |
$ | 183.2 | $ | 179.7 | $ | 149.5 | $ | 138.6 | $ | 118.7 | ||||||||||
| Capital expenditures |
$ | 75.1 | $ | 63.3 | $ | 69.1 | $ | 71.3 | $ | 63.3 | ||||||||||
| Cash provided by operating activities |
$ | 833.3 | $ | 756.8 | $ | 672.5 | $ | 726.0 | $ | 660.7 | ||||||||||
| Free cash flow(2) |
$ | 758.2 | $ | 693.5 | $ | 603.4 | $ | 654.7 | $ | 597.4 | ||||||||||
| Consolidated Financial Position (At December 31): |
||||||||||||||||||||
| Current assets |
$ | 1,934.7 | $ | 1,928.2 | $ | 1,618.8 | $ | 1,577.6 | $ | 1,368.3 | ||||||||||
| Current liabilities |
$ | 1,138.7 | $ | 924.4 | $ | 1,024.0 | $ | 934.5 | $ | 872.7 | ||||||||||
| Property, plant and equipment, net |
$ | 493.3 | $ | 473.2 | $ | 484.5 | $ | 448.4 | $ | 402.8 | ||||||||||
| Total assets |
$ | 7,796.1 | $ | 7,100.7 | $ | 6,660.5 | $ | 6,415.9 | $ | 5,874.4 | ||||||||||
| Long-term debt, net |
$ | 1,866.2 | $ | 2,062.6 | $ | 1,553.1 | $ | 1,424.4 | $ | 1,140.1 | ||||||||||
| Total debt, net |
$ | 2,174.3 | $ | 2,341.6 | $ | 1,938.0 | $ | 1,709.0 | $ | 1,411.5 | ||||||||||
| Stockholders’ equity |
$ | 4,027.6 | $ | 3,256.5 | $ | 3,254.6 | $ | 3,239.6 | $ | 3,136.1 | ||||||||||
| Stockholders’ equity per share |
$ | 17.42 | $ | 14.20 | $ | 13.82 | $ | 13.42 | $ | 12.80 | ||||||||||
| Total debt as a percentage of capitalization |
35.1 | % | 41.8 | % | 37.3 | % | 34.5 | % | 31.0 | % | ||||||||||
| Net debt as a percentage of capitalization(3) |
27.5 | % | 33.3 | % | 32.4 | % | 29.1 | % | 26.3 | % | ||||||||||
See Notes to Selected Financial Data on the following page.
22
Table of Contents
Notes to Selected Financial Data
| (1) | EBITDA represents earnings before interest, income taxes, depreciation and amortization. EBITDA is presented because the Company is aware that it is used by rating agencies, securities analysts, investors and other parties in evaluating the Company. It should not be considered, however, as an alternative to operating income as an indicator of the Company’s operating performance or as an alternative to cash flows as a measure of the Company’s overall liquidity as presented in the Company’s consolidated financial statements. Furthermore, EBITDA measures shown for the Company may not be comparable to similarly titled measures used by other companies. The following table presents the reconciliation of net income reported in accordance with U.S. generally accepted accounting principles (“GAAP”) to EBITDA: |
| Year Ended December 31, | ||||||||||||||||||||
| 2017 | 2016 | 2015 | 2014 | 2013 | ||||||||||||||||
| (In millions) | ||||||||||||||||||||
| Net income |
$ | 681.5 | $ | 512.2 | $ | 590.9 | $ | 584.5 | $ | 517.0 | ||||||||||
|
|
|
|
|
|
|
|
|
|
|
|||||||||||
| Add (deduct): |
||||||||||||||||||||
| Interest expense |
98.0 | 94.3 | 91.8 | 79.9 | 73.6 | |||||||||||||||
| Interest income |
(2.0 | ) | (1.1 | ) | (0.8 | ) | (0.8 | ) | (0.8 | ) | ||||||||||
| Income taxes |
115.3 | 180.9 | 215.5 | 220.4 | 207.8 | |||||||||||||||
| Depreciation |
82.0 | 74.8 | 68.7 | 63.7 | 57.2 | |||||||||||||||
| Amortization |
101.2 | 104.9 | 80.8 | 74.9 | 61.5 | |||||||||||||||
|
|
|
|
|
|
|
|
|
|
|
|||||||||||
| Total adjustments |
394.5 | 453.8 | 456.0 | 438.1 | 399.3 | |||||||||||||||
|
|
|
|
|
|
|
|
|
|
|
|||||||||||
| EBITDA |
$ | 1,076.0 | $ | 966.0 | $ | 1,046.9 | $ | 1,022.6 | $ | 916.3 | ||||||||||
|
|
|
|
|
|
|
|
|
|
|
|||||||||||
| (2) | Free cash flow represents cash flow from operating activities less capital expenditures. Free cash flow is presented because the Company is aware that it is used by rating agencies, securities analysts, investors and other parties in evaluating the Company. (Also see note 1 above). The following table presents the reconciliation of cash flow from operating activities reported in accordance with U.S. GAAP to free cash flow: |
| Year Ended December 31, | ||||||||||||||||||||
| 2017 | 2016 | 2015 | 2014 | 2013 | ||||||||||||||||
| (In millions) | ||||||||||||||||||||
| Cash provided by operating activities |
$ | 833.3 | $ | 756.8 | $ | 672.5 | $ | 726.0 | $ | 660.7 | ||||||||||
| Deduct: Capital expenditures |
(75.1 | ) | (63.3 | ) | (69.1 | ) | (71.3 | ) | (63.3 | ) | ||||||||||
|
|
|
|
|
|
|
|
|
|
|
|||||||||||
| Free cash flow |
$ | 758.2 | $ | 693.5 | $ | 603.4 | $ | 654.7 | $ | 597.4 | ||||||||||
|
|
|
|
|
|
|
|
|
|
|
|||||||||||
| (3) | Net debt represents total debt, net minus cash and cash equivalents. Net debt is presented because the Company is aware that it is used by rating agencies, securities analysts, investors and other parties in evaluating the Company. (Also see note 1 above). The following table presents the reconciliation of total debt, net reported in accordance with U.S. GAAP to net debt: |
| December 31, | ||||||||||||||||||||
| 2017 | 2016 | 2015 | 2014 | 2013 | ||||||||||||||||
| (In millions) | ||||||||||||||||||||
| Total debt, net |
$ | 2,174.3 | $ | 2,341.6 | $ | 1,938.0 | $ | 1,709.0 | $ | 1,411.5 | ||||||||||
| Less: Cash and cash equivalents |
(646.3 | ) | (717.3 | ) | (381.0 | ) | (377.6 | ) | (295.2 | ) | ||||||||||
|
|
|
|
|
|
|
|
|
|
|
|||||||||||
| Net debt |
1,528.0 | 1,624.3 | 1,557.0 | 1,331.4 | 1,116.3 | |||||||||||||||
| Stockholders’ equity |
4,027.6 | 3,256.5 | 3,254.6 | 3,239.6 | 3,136.1 | |||||||||||||||
|
|
|
|
|
|
|
|
|
|
|
|||||||||||
| Capitalization (net debt plus stockholders’ equity) |
$ | 5,555.6 | $ | 4,880.8 | $ | 4,811.6 | $ | 4,571.0 | $ | 4,252.4 | ||||||||||
|
|
|
|
|
|
|
|
|
|
|
|||||||||||
| Net debt as a percentage of capitalization |
27.5 | % | 33.3 | % | 32.4 | % | 29.1 | % | 26.3 | % | ||||||||||
|
|
|
|
|
|
|
|
|
|
|
|||||||||||
23
Table of Contents
| Item 7. | Management’s Discussion and Analysis of Financial Condition and Results of Operations |
This report includes forward-looking statements based on the Company’s current assumptions, expectations and projections about future events. When used in this report, the words “believes,” “anticipates,” “may,” “expect,” “intend,” “estimate,” “project” and similar expressions are intended to identify forward-looking statements, although not all forward-looking statements contain such words. In this report, the Company discloses important factors that could cause actual results to differ materially from management’s expectations. For more information on these and other factors, see “Forward-Looking Information” herein.
The following Management’s Discussion and Analysis of Financial Condition and Results of Operations should be read in conjunction with “Item 1A. Risk Factors,” “Item 6. Selected Financial Data” and the consolidated financial statements and related notes included elsewhere in this Annual Report on Form 10-K.
Business Overview
AMETEK’s operations are affected by global, regional and industry economic factors. However, the Company’s strategic geographic and industry diversification, and its mix of products and services, have helped to mitigate the potential adverse impact of any unfavorable developments in any one industry or the economy of any single country on its consolidated operating results. In 2017, the Company established records for orders, sales, operating income, net income, diluted earnings per share and operating cash flow. The strengthening global economic environment compared to 2016, contributions from recent acquisitions, and continued focus on and implementation of Operational Excellence initiatives, had a positive impact on 2017 results. The Company also benefited from its strategic initiatives under AMETEK’s four key strategies: Operational Excellence, Strategic Acquisitions, Global & Market Expansion and New Products.
Highlights of 2017 were:
| • | Orders for 2017 were $4,539.8 million, an increase of $691.0 million or 18.0%, compared with $3,848.8 million in 2016. As a result, the Company’s backlog of unfilled orders at December 31, 2017 was a record $1,396.1 million. |
| • | Net sales for 2017 were $4,300.2 million, an increase of $460.1 million or 12.0%, compared with $3,840.1 million in 2016. The increase in net sales for 2017 was due to 6% organic sales growth, with 5% organic sales growth in the Electronic Instruments Group (“EIG”) and 8% organic sales growth in the Electromechanical Group (“EMG”), and a 6% increase from the 2017 and 2016 acquisitions. |
| • | Net income for 2017 was $681.5 million, an increase of $169.3 million or 33.1%, compared with $512.2 million in 2016. |
| • | Diluted earnings per share for 2017 were $2.94, an increase of $0.75 or 34.2%, compared with $2.19 per diluted share in 2016. |
| • | Cash flow provided by operating activities for 2017 was $833.3 million, an increase of $76.5 million or 10.1%, compared with $756.8 million in 2016. |
| • | During 2017, the Company spent $556.6 million in cash, net of cash acquired, to acquire three businesses: |
| • | In February 2017, acquired Rauland-Borg Corporation (“Rauland”), a global provider of enterprise clinical and education communications solutions for hospitals, healthcare systems and educational facilities; |
24
Table of Contents
| • | In June 2017, acquired MOCON, Inc., a provider of laboratory and field gas analysis instrumentation to research laboratories, production facilities and quality control departments in food and beverage, pharmaceutical and industrial applications; and |
| • | In December 2017, acquired Arizona Instrument LLC, a provider of differentiated, high-precision moisture and gas measurement instruments in food, pharmaceutical and environmental markets. |
| • | On December 22, 2017, the U.S. enacted the Tax Cuts and Jobs Act (the “Act”). As a result, in the fourth quarter of 2017, the Company recorded a net benefit of $91.6 million in the consolidated statement of income as a component of Provision for income taxes. The Act had the effect of increasing 2017 diluted earnings per share by $0.39. See below for further discussion. |
| • | During 2017, the Company recorded pre-tax realignment costs totaling $16.8 million. The realignment costs had the effect of reducing net income for 2017 by $13.0 million ($0.05 per diluted share). See below for further discussion. |
| • | In the fourth quarter of 2017, the Company paid in full, at maturity, $270 million in aggregate principal amount of 6.20% private placement senior notes. |
| • | The Company continued its emphasis on investment in research, development and engineering, spending $221.2 million in 2017 before customer reimbursement of $5.4 million. Sales from products introduced in the past three years were $1,042.9 million or 24.3% of net sales. |
Results of Operations
The following table sets forth net sales and income by reportable segment and on a consolidated basis:
| Year Ended December 31, | ||||||||||||
| 2017 | 2016 | 2015 | ||||||||||
| (In thousands) | ||||||||||||
| Net sales(1): |
||||||||||||
| Electronic Instruments |
$ | 2,690,554 | $ | 2,360,285 | $ | 2,417,192 | ||||||
| Electromechanical |
1,609,616 | 1,479,802 | 1,557,103 | |||||||||
|
|
|
|
|
|
|
|||||||
| Consolidated net sales |
$ | 4,300,170 | $ | 3,840,087 | $ | 3,974,295 | ||||||
|
|
|
|
|
|
|
|||||||
| Operating income and income before income taxes: |
||||||||||||
| Segment operating income(2): |
||||||||||||
| Electronic Instruments |
$ | 677,489 | $ | 577,717 | $ | 639,399 | ||||||
| Electromechanical |
310,875 | 277,873 | 318,098 | |||||||||
|
|
|
|
|
|
|
|||||||
| Total segment operating income |
988,364 | 855,590 | 957,497 | |||||||||
| Corporate administrative and other expenses |
(73,270 | ) | (53,693 | ) | (49,781 | ) | ||||||
|
|
|
|
|
|
|
|||||||
| Consolidated operating income |
915,094 | 801,897 | 907,716 | |||||||||
| Interest and other expenses, net |
(118,365 | ) | (108,794 | ) | (101,336 | ) | ||||||
|
|
|
|
|
|
|
|||||||
| Consolidated income before income taxes |
$ | 796,729 | $ | 693,103 | $ | 806,380 | ||||||
|
|
|
|
|
|
|
|||||||
| (1) | After elimination of intra- and intersegment sales, which are not significant in amount. |
| (2) | Segment operating income represents net sales less all direct costs and expenses (including certain administrative and other expenses) applicable to each segment, but does not include interest expense. |
25
Table of Contents
Results of Operations for the year ended December 31, 2017 compared with the year ended December 31, 2016
In 2017, the Company established records for orders, sales, operating income, net income, diluted earnings per share and operating cash flow. The continued strengthening global economic environment, contributions from the acquisitions completed in 2017 and the acquisitions of Laserage Technology Corporation (“Laserage”) in October 2016, HS Foils and Nu Instruments in July 2016, and Brookfield Engineering Laboratories (“Brookfield”) and ESP/SurgeX in January 2016, and continued focus on and implementation of Operational Excellence initiatives, including the 2017 and 2016 realignment actions (described further throughout the results of operations for the fourth quarter and year ended December 31, 2017), are expected to have a positive impact on the Company’s 2018 results.
Net sales for 2017 were $4,300.2 million, an increase of $460.1 million or 12.0%, compared with net sales of $3,840.1 million in 2016. The increase in net sales for 2017 was due to 6% organic sales growth and a 6% increase from acquisitions. Foreign currency translation was essentially flat period over period. EIG net sales were $2,690.6 million in 2017, an increase of 14.0%, compared with $2,360.3 million in 2016. EMG net sales were $1,609.6 million in 2017, an increase of 8.8%, compared with $1,479.8 million in 2016.
Total international sales for 2017 were $2,214.0 million or 51.5% of net sales, an increase of $203.3 million or 10.1%, compared with international sales of $2,010.7 million or 52.4% of net sales in 2016. The $203.3 million increase in international sales was primarily driven by organic sales growth. Both reportable segments of the Company maintain strong international sales presences in Europe and Asia. Export shipments from the United States, which are included in total international sales, were $1,142.3 million in 2017, an increase of $104.3 million or 10.1%, compared with $1,036.0 million in 2016. Export shipments increased primarily due to organic sales growth.
Orders for 2017 were $4,539.8 million, an increase of $691.0 million or 18.0%, compared with $3,848.8 million in 2016. The increase in orders for 2017 was due to 10% organic order growth, a 6% increase from acquisitions and favorable 2% effect of foreign currency translation. As a result, the Company’s backlog of unfilled orders at December 31, 2017 was a record $1,396.1 million, an increase of $239.6 million or 20.7%, compared with $1,156.5 million at December 31, 2016.
The Company recorded 2017 realignment costs totaling $16.8 million in the fourth quarter of 2017 (the “2017 realignment costs”). The 2017 realignment costs were composed of $3.0 million in severance costs for a reduction in workforce, $7.8 million of asset write-downs and $6.0 million in costs to withdraw from a multiemployer defined benefit pension plan. The 2017 realignment costs better position the Company’s long-term cost structure and included costs associated with the continued consolidation of the Company’s floor care and specialty motors businesses into its precision motion control businesses. The Company recorded 2016 realignment costs totaling $25.6 million in the fourth quarter of 2016 (the “2016 realignment costs”). The 2016 realignment costs primarily related to $19.3 million in severance costs for a reduction in workforce and $6.2 million of asset write-downs in response to the impact of a weak global economy on certain of the Company’s businesses, as well as the effects of a continued strong U.S. dollar. See Note 18 to the Consolidated Financial Statements included in Part II, Item 8 of this Annual Report on Form 10-K for further details. Also, in the fourth quarter of 2016, the Company recorded a $13.9 million non-cash impairment charge related to certain of the Company’s trade names.
26
Table of Contents
The 2017 and 2016 realignment costs and 2016 impairment charge were reported in the consolidated statement of income as follows (in millions):
| 2017 | 2016 | |||||||||||||||
| Three Months Ended December 31, |
Year Ended December 31, |
Three Months Ended December 31, |
Year Ended December 31, |
|||||||||||||
| Realignment costs |
$ | 16.8 | $ | 16.8 | $ | 24.0 | $ | 24.0 | ||||||||
| Impairment charge |
— | — | 13.9 | 13.9 | ||||||||||||
|
|
|
|
|
|
|
|
|
|||||||||
| Cost of sales |
16.8 | 16.8 | 37.9 | 37.9 | ||||||||||||
|
|
|
|
|
|
|
|
|
|||||||||
| Realignment costs |
— | — | 1.6 | 1.6 | ||||||||||||
| Impairment charge |
— | — | — | — | ||||||||||||
|
|
|
|
|
|
|
|
|
|||||||||
| Selling, general and administrative expenses |
— | — | 1.6 | 1.6 | ||||||||||||
|
|
|
|
|
|
|
|
|
|||||||||
| Realignment costs |
16.8 | 16.8 | 25.6 | 25.6 | ||||||||||||
| Impairment charge |
— | — | 13.9 | 13.9 | ||||||||||||
|
|
|
|
|
|
|
|
|
|||||||||
| Total reported in the consolidated statement of income |
$ | 16.8 | $ | 16.8 | $ | 39.5 | $ | 39.5 | ||||||||
|
|
|
|
|
|
|
|
|
|||||||||
The 2017 and 2016 realignment costs and 2016 impairment charge were reported in segment operating income as follows (in millions):
| 2017 | 2016 | |||||||||||||||
| Three Months Ended December 31, |
Year Ended December 31, |
Three Months Ended December 31, |
Year Ended December 31, |
|||||||||||||
| Realignment costs |
$ | 4.5 | $ | 4.5 | $ | 12.4 | $ | 12.4 | ||||||||
| Impairment charge |
— | — | 9.2 | 9.2 | ||||||||||||
|
|
|
|
|
|
|
|
|
|||||||||
| EIG |
4.5 | 4.5 | 21.6 | 21.6 | ||||||||||||
|
|
|
|
|
|
|
|
|
|||||||||
| Realignment costs |
12.3 | 12.3 | 11.6 | 11.6 | ||||||||||||
| Impairment charge |
— | — | 4.7 | 4.7 | ||||||||||||
|
|
|
|
|
|
|
|
|
|||||||||
| EMG |
12.3 | 12.3 | 16.3 | 16.3 | ||||||||||||
|
|
|
|
|
|
|
|
|
|||||||||
| Realignment costs |
16.8 | 16.8 | 24.0 | 24.0 | ||||||||||||
| Impairment charge |
— | — | 13.9 | 13.9 | ||||||||||||
|
|
|
|
|
|
|
|
|
|||||||||
| Total reported in segment operating income |
$ | 16.8 | $ | 16.8 | $ | 37.9 | $ | 37.9 | ||||||||
|
|
|
|
|
|
|
|
|
|||||||||
27
Table of Contents
The 2017 and 2016 realignment costs and 2016 impairment charge negatively impacted segment operating margins as follows (in basis points):
| 2017 | 2016 | |||||||||||||||
| Three Months Ended December 31, |
Year Ended December 31, |
Three Months Ended December 31, |
Year Ended December 31, |
|||||||||||||
| Realignment costs |
(60 | ) | (10 | ) | (200 | ) | (50 | ) | ||||||||
| Impairment charge |
— | — | (150 | ) | (40 | ) | ||||||||||
|
|
|
|
|
|
|
|
|
|||||||||
| EIG |
(60 | ) | (10 | ) | (350 | ) | (90 | ) | ||||||||
| Realignment costs |
(310 | ) | (80 | ) | (330 | ) | (80 | ) | ||||||||
| Impairment charge |
— | — | (130 | ) | (30 | ) | ||||||||||
|
|
|
|
|
|
|
|
|
|||||||||
| EMG |
(310 | ) | (80 | ) | (460 | ) | (110 | ) | ||||||||
| Realignment costs |
(150 | ) | (40 | ) | (250 | ) | (60 | ) | ||||||||
| Impairment charge |
— | — | (140 | ) | (40 | ) | ||||||||||
|
|
|
|
|
|
|
|
|
|||||||||
| Total impacting segment operating margins |
(150 | ) | (40 | ) | (390 | ) | (100 | ) | ||||||||
The expected annualized cash savings from the 2017 realignment costs is expected to be approximately $5 million and is expected to be fully realized in 2019.
Segment operating income for 2017 was $988.4 million, an increase of $132.8 million or 15.5%, compared with segment operating income of $855.6 million in 2016. The increase in segment operating income for 2017 resulted primarily from the increase in net sales noted above. Segment operating income, as a percentage of net sales, increased to 23.0% in 2017, compared with 22.3% in 2016. The increase in segment operating margins for 2017 resulted primarily from the net impact of the 2017 versus the 2016 realignment costs and 2016 impairment charge noted above. Segment operating income and segment operating margins for 2017 and 2016 included the impact of the realignment costs and 2016 impairment charge detailed in the tables above.
Cost of sales for 2017 was $2,851.4 million or 66.3% of net sales, an increase of $276.2 million or 10.7%, compared with $2,575.2 million or 67.1% of net sales for 2016. The cost of sales increase for 2017 was affected by the net sales increase noted above. Cost of sales for 2017 and 2016 included the impact of the realignment costs and 2016 impairment charge detailed in the tables above.
Selling, general and administrative (“SG&A”) expenses for 2017 were $533.6 million or 12.4% of net sales, an increase of $70.6 million or 15.2%, compared with $463.0 million or 12.1% of net sales in 2016. The increase in SG&A expenses for 2017 was primarily due to the increase in net sales noted above, a fourth quarter of 2017 $5.0 million charitable donation and a second quarter of 2017 $2.5 million equity-based compensation charge related to the accelerated vesting of restricted stock grants in association with the retirement of the Company’s Executive Chairman of the Board of Directors. For 2016, SG&A expenses included $1.6 million of realignment costs noted above.
Consolidated operating income was $915.1 million or 21.3% of net sales for 2017, an increase of $113.2 million or 14.1%, compared with $801.9 million or 20.9% of net sales in 2016.
Interest expense was $98.0 million for 2017, an increase of $3.7 million or 3.9%, compared with $94.3 million in 2016. The interest expense increase for 2017 was primarily due to the impact of private placement senior notes funded in the fourth quarter of 2016, partially offset by lower average borrowings under the Company’s revolving credit facility period over period.
Other expenses, net were $20.3 million for 2017, an increase of $5.8 million, compared with $14.5 million in 2016. The other expenses, net increase for 2017 was primarily due to higher environmental-related expenses.
28
Table of Contents
The effective tax rate for 2017 was 14.5%, compared with 26.1% in 2016. On December 22, 2017, the U.S. enacted the Tax Cuts and Jobs Act (the “Act”). The Act, which is also commonly referred to as “U.S. tax reform,” significantly changes U.S. corporate income tax laws by, among other things, reducing the U.S. corporate income tax rate to 21% starting in 2018 and creating a territorial tax system with a one-time mandatory tax on previously deferred foreign earnings of U.S. subsidiaries. As a result, in the fourth quarter of 2017, the Company recorded a net benefit of $91.6 million in the consolidated statement of income as a component of Provision for income taxes. The $91.6 million net benefit consisted of a $185.8 million benefit resulting from the remeasurement of the Company’s net deferred tax liabilities in the U.S. based on the new lower corporate income tax rate and a $94.2 million expense relating to the one-time mandatory tax on previously deferred earnings of certain non-U.S. subsidiaries that are owned either wholly or partially by a U.S. subsidiary of the Company. Also, included in the $94.2 million, the Company recorded additional deferred tax liabilities of $13.3 million related to state income and foreign withholding taxes expected to be incurred when the cash amounts related to the mandatory tax are ultimately repatriated to the U.S., offset by $1.0 million for a remeasurement of uncertain tax positions impacted by the mandatory tax inclusion.
Although the $91.6 million net benefit represents what the Company believes is a reasonable estimate of the impact of the income tax effects of the Act on the Company’s consolidated financial statements as of December 31, 2017, it should be considered provisional. As additional guidance from the U.S. Department of Treasury is provided, the Company may need to adjust the provisional amounts after it finalizes the 2017 U.S. tax return and is able to conclude whether any further adjustments are required to its U.S. portion of net deferred tax liability of $390.4 million as of December 31, 2017, as well as to the liability associated with the one-time mandatory tax. The currently recorded amounts include a variety of estimates of taxable earnings and profits, estimated taxable foreign cash balances, differences between U.S. generally accepted accounting principles (“GAAP”) and U.S. tax principles and interpretations of many aspects of the Act that may, if changed, impact the final amounts. Any adjustments to these provisional amounts will be reported as a component of Provision for income taxes in the reporting period in which any such adjustments are determined, which will be no later than the fourth quarter of 2018, and could result in significant impacts to the effective tax rate for the period. The Company is still evaluating the potential future impact of the global intangible low-taxed income (“GILTI”) section of the Act and has not provided any provisional deferred tax liability for it. Under U.S. GAAP, the Company is permitted to make an accounting policy election to either treat taxes due on future inclusions in the U.S. taxable income related to GILTI as a current period expense when incurred or to factor such amounts into the Company’s measurement of its deferred taxes. Due to the ongoing evaluation, the Company has not yet made the accounting policy decision. See Note 8 to the Consolidated Financial Statements included in Part II, Item 8 of this Annual Report on Form 10-K for further details.
The 2017 effective tax rate reflects $12.3 million of tax benefits related to share-based payment transactions in accordance with the January 1, 2017 adoption of the Financial Accounting Standards Board (“FASB”) Accounting Standards Update (“ASU”) No. 2016-09, Improvements to Employee Share-Based Payment Accounting (“ASU 2016-09”). See Notes 2 and 8 to the Consolidated Financial Statements included in Part II, Item 8 of this Annual Report on Form 10-K for further details.
The effective tax rates for 2017 and 2016 reflect the impact of foreign earnings, which are taxed at lower rates, tax benefits related to international and state tax planning initiatives and the release of uncertain tax position liabilities relating to certain statute expirations.
Net income for 2017 was $681.5 million, an increase of $169.3 million or 33.1%, compared with $512.2 million in 2016. The 2017 realignment costs reduced 2017 net income by $13.0 million and the net benefit related to the Act increased 2017 net income by $91.6 million. The 2016 realignment costs and the 2016 impairment charge reduced 2016 net income by $17.0 million and $8.6 million, respectively.
Diluted earnings per share for 2017 were $2.94, an increase of $0.75 or 34.2%, compared with $2.19 per diluted share in 2016. The 2017 realignment costs had the effect of reducing 2017 diluted earnings per share by
29
Table of Contents
$0.05 and the net benefit related to the Act had the effect of increasing 2017 diluted earnings per share by $0.39. The 2016 realignment costs and the 2016 impairment charge had the effect of reducing 2016 diluted earnings per share by $0.07 and $0.04, respectively.
Segment Results
EIG’s net sales totaled $2,690.6 million for 2017, an increase of $330.3 million or 14.0%, compared with $2,360.3 million in 2016. The net sales increase for 2017 was due to a 9% increase from the 2017 acquisitions of MOCON and Rauland and 2016 acquisitions of Nu Instruments, Brookfield and ESP/SurgeX, and 5% organic sales growth. Foreign currency translation was essentially flat period over period.
EIG’s operating income was $677.5 million for 2017, an increase of $99.8 million or 17.3%, compared with $577.7 million in 2016. The increase in EIG’s operating income for 2017 resulted primarily from the increase in net sales noted above. EIG’s operating margins were 25.2% of net sales for 2017, compared with 24.5% of net sales in 2016. The increase in EIG’s operating margins for 2017 resulted primarily from the net impact of the 2017 versus the 2016 realignment costs and 2016 impairment charge noted above. EIG’s operating income and operating margins for 2017 and 2016 included the impact of the realignment costs and 2016 impairment charge detailed in the tables above.
EMG’s net sales totaled $1,609.6 million for 2017, an increase of $129.8 million or 8.8%, compared with $1,479.8 million in 2016. The net sales increase for 2017 was due to 8% organic sales growth and a 1% increase from the 2016 acquisition of Laserage. Foreign currency translation was essentially flat period over period.
EMG’s operating income was $310.9 million for 2017, an increase of $33.0 million or 11.9%, compared with $277.9 million in 2016. EMG’s operating margins were 19.3% of net sales for 2017, compared with 18.8% of net sales in 2016. The increase in EMG’s operating income and operating margins for 2017 resulted primarily from the increase in net sales noted above, as well as the benefits of the Group’s Operational Excellence initiatives. EMG’s operating income and operating margins for 2017 and 2016 included the impact of the realignment costs and 2016 impairment charge detailed in the tables above.
Results of operations for the fourth quarter of 2017 compared with the fourth quarter of 2016
Net sales for the fourth quarter of 2017 were $1,143.1 million, an increase of $170.1 million or 17.5%, compared with net sales of $973.0 million for the fourth quarter of 2016. The increase in net sales for the fourth quarter of 2017 was due to 9% organic sales growth, a 6% increase from acquisitions and favorable 2% effect of foreign currency translation.
Segment operating income for the fourth quarter of 2017 was $253.0 million, an increase of $65.2 million or 34.7%, compared with segment operating income of $187.8 million for the fourth quarter of 2016. The increase in segment operating income for the fourth quarter of 2017 resulted primarily from the increase in net sales noted above. Segment operating income, as a percentage of net sales, increased to 22.1% for the fourth quarter of 2017, compared with 19.3% for the fourth quarter of 2016. The increase in segment operating margins for the fourth quarter of 2017 resulted primarily from the net impact of the 2017 versus the 2016 realignment costs and 2016 impairment charge noted above. Segment operating income and segment operating margins for the fourth quarter of 2017 and 2016 included the impact of the realignment costs and 2016 impairment charge detailed in the tables above.
Cost of sales for the fourth quarter of 2017 was $767.0 million or 67.1% of net sales, an increase of $85.9 million or 12.6%, compared with $681.1 million or 70.0% of net sales for the fourth quarter of 2016. The cost of sales increase for the fourth quarter of 2017 was affected by the net sales increase noted above. Cost of sales for the fourth quarter of 2017 and 2016 included the impact of the realignment costs and 2016 impairment charge detailed in the tables above.
30
Table of Contents
The effective tax rate for the fourth quarter of 2017 was (20.8)%, compared with 24.9% in the fourth quarter of 2016. In the fourth quarter of 2017, the Company recorded a net benefit of $91.6 million in the consolidated statement of income as a component of Provision for income taxes related to the Act. The $91.6 million net benefit consisted of a $185.8 million benefit resulting from the remeasurement of the Company’s net deferred tax liabilities in the U.S. based on the new lower corporate income tax rate and a $94.2 million expense primarily relating mostly to the one-time mandatory tax on previously deferred earnings of certain non-U.S. subsidiaries that are owned either wholly or partially by a U.S. subsidiary of the Company. The effective tax rates for 2017 and 2016 reflect the impact of foreign earnings, which are taxed at lower rates, tax benefits related to international and state tax planning initiatives and the release of uncertain tax position liabilities relating to certain statute expirations.
Net income for the fourth quarter of 2017 was $238.5 million, an increase of $129.4 million or 118.6%, compared with $109.1 million for the fourth quarter of 2016. The fourth quarter of 2017 realignment costs reduced the fourth quarter of 2017 net income by $13.0 million and the net benefit related to the Act increased fourth quarter of 2017 net income by $91.6 million. The fourth quarter of 2016 realignment costs and fourth quarter of 2016 impairment charge reduced the fourth quarter of 2016 net income by $17.0 million and $8.6 million, respectively.
Diluted earnings per share for the fourth quarter of 2017 were $1.03, an increase of $0.56 or 119.1%, compared with $0.47 per diluted share for the fourth quarter of 2016. The fourth quarter of 2017 realignment costs had the effect of reducing the fourth quarter of 2017 diluted earnings per share by $0.05 and the net benefit related to the Act had the effect of increasing the fourth quarter of 2017 diluted earnings per share by $0.39. The fourth quarter of 2016 realignment costs and fourth quarter of 2016 impairment charge had the effect of reducing the fourth quarter of 2016 diluted earnings per share by $0.07 and $0.04, respectively.
Segment Results
EIG’s net sales totaled $741.5 million for the fourth quarter of 2017, an increase of $125.5 million or 20.4%, compared with $616.0 million for the fourth quarter of 2016. The net sales increase for the fourth quarter of 2017 was due to a 10% increase from the 2017 acquisitions of MOCON and Rauland and 2016 acquisitions of Nu Instruments, Brookfield and ESP/SurgeX, 9% organic sales growth and favorable 2% effect of foreign currency translation.
EIG’s operating income was $191.1 million for the fourth quarter of 2017, an increase of $50.0 million or 35.4%, compared with $141.1 million for the fourth quarter of 2016. The increase in EIG’s operating income for the fourth quarter of 2017 resulted primarily from the increase in net sales noted above. EIG’s operating margins were 25.8% of net sales for the fourth quarter of 2017, compared with 22.9% of net sales for the fourth quarter of 2016. The increase in EIG’s operating margins for the fourth quarter of 2017 resulted primarily from the net impact of the 2017 versus the 2016 realignment costs and 2016 impairment charge noted above, as well as the benefits of the Group’s Operational Excellence initiatives. EIG’s operating income and operating margins for the fourth quarter of 2017 and 2016 included the impact of the realignment costs and 2016 impairment charge detailed in the tables above.
EMG’s net sales totaled $401.6 million for the fourth quarter of 2017, an increase of $44.7 million or 12.5%, compared with $356.9 million for the fourth quarter of 2016. The net sales increase for the fourth quarter of 2017 was due to 10% organic sales growth, a 1% increase from the 2016 acquisition of Laserage and favorable 2% effect of foreign currency translation.
EMG’s operating income was $61.9 million for the fourth quarter of 2017, an increase of $15.2 million or 32.5%, compared with $46.7 million for the fourth quarter of 2016. EMG’s operating margins were 15.4% of net sales for the fourth quarter of 2017, compared with 13.1% of net sales for the fourth quarter of 2016. The increase in EMG’s operating income and operating margins for the fourth quarter of 2017 resulted primarily from
31
Table of Contents
the increase in net sales noted above, as well as the benefits of the Group’s Operational Excellence initiatives. EMG’s operating income and operating margins for the fourth quarter of 2017 and 2016 included the impact of the realignment costs and 2016 impairment charge detailed in the tables above.
Results of Operations for the year ended December 31, 2016 compared with the year ended December 31, 2015
In 2016, the Company was impacted by a weak global economy and the effects of a continued strong U.S. dollar. Specifically, the Company experienced lower sales in its process businesses that have exposure to oil and gas markets and in its engineered materials, interconnects and packaging businesses that have exposure to metals markets. Contributions from the acquisitions completed in 2016 and the acquisitions of Surface Vision in July 2015 and Global Tubes in May 2015, as well as the Company’s Operational Excellence initiatives had a positive impact on 2016 results.
Net sales for 2016 were $3,840.1 million, a decrease of $134.2 million or 3.4%, compared with net sales of $3,974.3 million in 2015. EIG net sales were $2,360.3 million in 2016, a decrease of 2.4%, compared with $2,417.2 million in 2015. EMG net sales were $1,479.8 million in 2016, a decrease of 5.0%, compared with $1,557.1 million in 2015. The decrease in net sales for 2016 was due to a 7% organic sales decline and an unfavorable 1% effect of foreign currency translation, partially offset by a 4% increase from acquisitions.
Total international sales for 2016 were $2,010.7 million or 52.4% of net sales, a decrease of $44.0 million or 2.1%, compared with international sales of $2,054.7 million or 51.7% of net sales in 2015. The $44.0 million decrease in international sales was primarily driven by a weak global economy, as well as the foreign currency translation headwind noted above. Both reportable segments of the Company maintain strong international sales presences in Europe and Asia. Export shipments from the United States, which are included in total international sales, were $1,036.0 million in 2016, a decrease of $54.7 million or 5.0%, compared with $1,090.7 million in 2015. Export shipments decreased primarily due to a weak global economy, as well as the competitive impacts of a strong U.S. dollar.
Orders for 2016 were $3,848.8 million, a decrease of $75.9 million or 1.9%, compared with $3,924.7 million in 2015. The decrease in orders for 2016 was due to a 5% organic order decline resulting from a weak global economy noted above, partially offset by a 3% increase from acquisitions. As a result, the Company’s backlog of unfilled orders at December 31, 2016 was $1,156.5 million, an increase of $8.7 million or 0.8%, compared with $1,147.8 million at December 31, 2015.
The Company recorded $25.6 million of 2016 realignment costs in the fourth quarter of 2016. The 2016 realignment costs primarily related to $19.3 million in severance costs for a reduction in workforce and $6.2 million of asset write-downs in response to the impact of a weak global economy on certain of the Company’s businesses, as well as the effects of a continued strong U.S. dollar. The Company recorded 2015 realignment costs totaling $36.6 million, with $15.9 million recorded in the first quarter of 2015 and $20.7 million recorded in the fourth quarter of 2015 (the “2015 realignment costs”). The 2015 realignment costs primarily related to reductions in workforce in response to the impact of a weak global economy on certain of the Company’s businesses, as well as the effects of a continued strong U.S. dollar. See Note 18 to the Consolidated Financial Statements included in Part II, Item 8 of this Annual Report on Form 10-K for further details.
32
Table of Contents
The 2016 and 2015 realignment costs were reported in the consolidated statement of income as follows (in millions):
| 2016 | 2015 | |||||||||||||||||||
| Three Months Ended December 31, |
Year Ended December 31, |
Three Months Ended March 31, |
Three Months Ended December 31, |
Year Ended December 31, |
||||||||||||||||
| Cost of sales |
$ | 24.0 | $ | 24.0 | $ | 15.8 | $ | 20.0 | $ | 35.8 | ||||||||||
| Selling, general and administrative expenses |
1.6 | 1.6 | 0.1 | 0.7 | 0.8 | |||||||||||||||
|
|
|
|
|
|
|
|
|
|
|
|||||||||||
| Total |
$ | 25.6 | $ | 25.6 | $ | 15.9 | $ | 20.7 | $ | 36.6 | ||||||||||
|
|
|
|
|
|
|
|
|
|
|
|||||||||||
The 2016 and 2015 realignment costs were reported in segment operating income as follows (in millions):
| 2016 | 2015 | |||||||||||||||||||
| Three Months Ended December 31, |
Year Ended December 31, |
Three Months Ended March 31, |
Three Months Ended December 31, |
Year Ended December 31, |
||||||||||||||||
| EIG |
$ | 12.4 | $ | 12.4 | $ | 9.3 | $ | 9.3 | $ | 18.5 | ||||||||||
| EMG |
11.6 | 11.6 | 6.5 | 10.8 | 17.3 | |||||||||||||||
|
|
|
|
|
|
|
|
|
|
|
|||||||||||
| Total |
$ | 24.0 | $ | 24.0 | $ | 15.8 | $ | 20.0 | $ | 35.8 | ||||||||||
|
|
|
|
|
|
|
|
|
|
|
|||||||||||
The 2016 and 2015 realignment costs negatively impacted segment operating margins as follows (in basis points):
| 2016 | 2015 | |||||||||||||||
| Three Months Ended December 31, |
Year Ended December 31, |
Three Months Ended December 31, |
Year Ended December 31, |
|||||||||||||
| EIG |
(200 | ) | (50 | ) | (150 | ) | (70 | ) | ||||||||
| EMG |
(330 | ) | (80 | ) | (300 | ) | (110 | ) | ||||||||
| Total |
(250 | ) | (60 | ) | (200 | ) | (90 | ) | ||||||||
Segment operating income for 2016 was $855.6 million, a decrease of $101.9 million or 10.6%, compared with segment operating income of $957.5 million in 2015. Segment operating income, as a percentage of net sales, decreased to 22.3% in 2016, compared with 24.1% in 2015. The decrease in segment operating income and segment operating margins for 2016 resulted primarily from the decrease in net sales noted above and a $29.7 million increase in depreciation and amortization expense, which included a $13.9 million non-cash impairment charge related to certain of the Company’s trade names ($9.2 million impacted EIG and $4.7 million impacted EMG). The 2016 impairment charge negatively impacted segment operating margins by approximately 40 basis points. Segment operating income and segment operating margins for 2016 and 2015 included the impact of the realignment costs detailed in the tables above.
Cost of sales for 2016 was $2,575.2 million or 67.1% of net sales, a decrease of $42.8 million or 1.6%, compared with $2,618.0 million or 65.9% of net sales for 2015. The cost of sales decrease was primarily due to the net sales decrease noted above, partially offset by a $29.7 million increase in depreciation and amortization expense, which included a $13.9 million impairment charge noted above. Cost of sales for 2016 and 2015 included the impact of the realignment costs detailed in the tables above.
SG&A expenses for 2016 were $463.0 million or 12.1% of net sales, an increase of $14.4 million or 3.2%, compared with $448.6 million or 11.3% of net sales in 2015. For 2016 and 2015, SG&A expenses included $1.6 million and $0.8 million, respectively, of realignment costs noted above.
33
Table of Contents
Consolidated operating income was $801.9 million or 20.9% of net sales for 2016, a decrease of $105.8 million or 11.7%, compared with $907.7 million or 22.8% of net sales in 2015.
Interest expense was $94.3 million for 2016, an increase of $2.5 million or 2.7%, compared with $91.8 million in 2015. The interest expense increase for 2016 was primarily due to higher average borrowings to fund acquisitions and share repurchases.
The effective tax rate for 2016 was 26.1%, compared with 26.7% in 2015. The effective tax rates for 2016 and 2015 reflect the impact of foreign earnings, which are taxed at lower rates. The 2016 effective tax rate reflects tax benefits related to international and state tax planning initiatives and the release of uncertain tax position liabilities relating to certain statute expirations. The 2015 effective tax rate reflects the first quarter of 2015 release of uncertain tax position liabilities related to the conclusion of an advance thin capitalization agreement in the European Union, the second quarter of 2015 effective settlement of the U.S. research and development tax credit from the completion of an Internal Revenue Service examination for 2010 and 2011, and the third quarter of 2015 $7.5 million of tax benefits related to the closure of an international subsidiary. See Note 8 to the Consolidated Financial Statements included in Part II, Item 8 of this Annual Report on Form 10-K for further details.
Net income for 2016 was $512.2 million, a decrease of $78.7 million or 13.3%, compared with $590.9 million in 2015. The 2016 realignment costs and the 2016 impairment charge reduced 2016 net income by $17.0 million and $8.6 million, respectively. The 2015 realignment costs reduced 2015 net income by $24.7 million.
Diluted earnings per share for 2016 were $2.19, a decrease of $0.26 or 10.6%, compared with $2.45 per diluted share in 2015. The 2016 realignment costs and the 2016 impairment charge had the effect of reducing 2016 diluted earnings per share by $0.07 and $0.04, respectively. The 2015 realignment costs had the effect of reducing 2015 diluted earnings per share by $0.10.
Segment Results
EIG’s net sales totaled $2,360.3 million for 2016, a decrease of $56.9 million or 2.4%, compared with $2,417.2 million in 2015. The net sales decrease was due to a 7% organic sales decline, driven largely by the Company’s process businesses that have exposure to oil and gas markets, partially offset by a 5% increase from the 2016 acquisitions of Nu Instruments, Brookfield and ESP/SurgeX and 2015 acquisition of Surface Vision.
EIG’s operating income was $577.7 million for 2016, a decrease of $61.7 million or 9.6%, compared with $639.4 million in 2015. EIG’s operating margins were 24.5% of net sales for 2016, compared with 26.5% of net sales in 2015. The decrease in EIG operating income and operating margins for 2016 resulted primarily from the decrease in net sales noted above and a $20.5 million increase in depreciation and amortization expense, which included a $9.2 million impairment charge. The 2016 impairment charge negatively impacted EIG’s operating margins by approximately 40 basis points. EIG’s operating income and operating margins for 2016 and 2015 included the impact of the realignment costs detailed in the tables above.
EMG’s net sales totaled $1,479.8 million for 2016, a decrease of $77.3 million or 5.0%, compared with $1,557.1 million in 2015. The net sales decrease was due to a 6% organic sales decline, driven largely by weakness in the Company’s engineered materials, interconnects and packaging businesses, and an unfavorable 1% effect of foreign currency translation, partially offset by a 2% increase from the 2016 acquisition of Laserage and 2015 acquisition of Global Tubes.
EMG’s operating income was $277.9 million for 2016, a decrease of $40.2 million or 12.6%, compared with $318.1 million in 2015. EMG’s operating margins were 18.8% of net sales for 2016, compared with 20.4% of net sales in 2015. The decrease in EMG’s operating income and operating margins for 2016 resulted primarily from
34
Table of Contents
the decrease in net sales noted above and a $9.2 million increase in depreciation and amortization expense, which included a $4.7 million impairment charge. The 2016 impairment charge negatively impacted EMG’s operating margins by approximately 30 basis points. EMG’s operating income and operating margins for 2016 and 2015 included the impact of the realignment costs detailed in the tables above.
Results of operations for the fourth quarter of 2016 compared with the fourth quarter of 2015
Net sales for the fourth quarter of 2016 were $973.0 million, a decrease of $15.0 million or 1.5%, compared with net sales of $988.0 million for the fourth quarter of 2015. The decrease in net sales for the fourth quarter of 2016 was due to a 4% organic sales decline and an unfavorable 1% effect of foreign currency translation, partially offset by a 3% increase from acquisitions.
Segment operating income for the fourth quarter of 2016 was $187.8 million, a decrease of $34.0 million or 15.3%, compared with segment operating income of $221.8 million for the fourth quarter of 2015. Segment operating income, as a percentage of net sales, decreased to 19.3% for the fourth quarter of 2016, compared with 22.5% for the fourth quarter of 2015. The decrease in segment operating income and segment operating margins for the fourth quarter of 2016 resulted primarily from the decrease in net sales noted above and a $17.2 million increase in depreciation and amortization expense, which included a $13.9 million non-cash impairment charge related to certain of the Company’s trade names ($9.2 million impacted EIG and $4.7 million impacted EMG). The fourth quarter of 2016 impairment charge negatively impacted segment operating margins by approximately 140 basis points. Segment operating income and segment operating margins for the fourth quarter of 2016 and 2015 included the impact of the realignment costs detailed in the tables above.
Cost of sales for the fourth quarter of 2016 was $681.1 million or 70.0% of net sales, an increase of $14.8 million or 2.2%, compared with $666.3 million or 67.4% of net sales for the fourth quarter of 2015. The cost of sales increase and the corresponding increase in cost of sales as a percentage of sales were primarily due to the net sales decrease noted above and a $17.2 million increase in depreciation and amortization expense, which included the fourth quarter of 2016 impairment charge of $13.9 million noted above. Cost of sales for the fourth quarter of 2016 and 2015 included the impact of the realignment costs detailed in the tables above.
Net income for the fourth quarter of 2016 was $109.1 million, a decrease of $27.7 million or 20.2%, compared with $136.8 million for the fourth quarter of 2015. The fourth quarter of 2016 realignment costs and fourth quarter of 2016 impairment charge reduced the fourth quarter of 2016 net income by $17.0 million and $8.6 million, respectively. The fourth quarter of 2015 realignment costs reduced the fourth quarter of 2015 net income by $13.9 million.
Diluted earnings per share for the fourth quarter of 2016 were $0.47, a decrease of $0.10 or 17.5%, compared with $0.57 per diluted share for the fourth quarter of 2015. The fourth quarter of 2016 realignment costs and fourth quarter of 2016 impairment charge had the effect of reducing the fourth quarter of 2016 diluted earnings per share by $0.07 and $0.04, respectively. The fourth quarter of 2015 realignment costs had the effect of reducing the fourth quarter of 2015 diluted earnings per share by $0.06.
Segment Results
EIG’s net sales totaled $616.0 million for the fourth quarter of 2016, a decrease of $12.4 million or 2.0%, compared with $628.4 million for the fourth quarter of 2015. The net sales decrease was due to a 6% organic sales decline, driven largely by the Company’s process businesses with exposure to oil and gas markets, and an unfavorable 1% effect of foreign currency translation, partially offset by a 5% increase from the 2016 acquisitions of Nu Instruments, Brookfield and ESP/SurgeX.
EIG’s operating income was $141.1 million for the fourth quarter of 2016, a decrease of $20.6 million or 12.7%, compared with $161.7 million for the fourth quarter of 2015. EIG’s operating margins were 22.9% of net
35
Table of Contents
sales for the fourth quarter of 2016, compared with 25.7% of net sales for the fourth quarter of 2015. The decrease in EIG’s operating income and operating margins for the fourth quarter of 2016 resulted primarily from the decrease in net sales noted above and an $11.0 million increase in depreciation and amortization expense, which included a $9.2 million impairment charge. The fourth quarter of 2016 impairment charge negatively impacted EIG’s operating margins by approximately 150 basis points. EIG’s operating income and operating margins for the fourth quarter of 2016 and 2015 included the impact of the realignment costs detailed in the tables above.
EMG’s net sales totaled $356.9 million for the fourth quarter of 2016, a decrease of $2.7 million or 0.8%, compared with $359.6 million for the fourth quarter of 2015. The net sales decrease was due to an unfavorable 2% effect of foreign currency translation, partially offset by a 1% increase from the 2016 acquisition of Laserage. Organic sales were flat quarter over quarter.
EMG’s operating income was $46.7 million for the fourth quarter of 2016, a decrease of $13.5 million or 22.4%, compared with $60.2 million for the fourth quarter of 2015. EMG’s operating margins were 13.1% of net sales for the fourth quarter of 2016, compared with 16.7% of net sales for the fourth quarter of 2015. The decrease in EMG’s operating income and operating margins for the fourth quarter of 2016 resulted primarily from the decrease in net sales noted above and a $6.2 million increase in depreciation and amortization expense, which included a $4.7 million impairment charge. The fourth quarter of 2016 impairment charge negatively impacted EMG’s operating margins by approximately 130 basis points. EMG’s operating income and operating margins for the fourth quarter of 2016 and 2015 included the impact of the realignment costs detailed in the tables above.
Liquidity and Capital Resources
Cash provided by operating activities totaled $833.3 million in 2017, an increase of $76.5 million or 10.1%, compared with $756.8 million in 2016. The increase in cash provided by operating activities for 2017 was primarily due to higher net income and lower overall operating working capital levels driven by the Company’s continued focus on working capital management. Offsetting the increase in cash provided by operating activities was a $48.0 million increase in defined benefit pension plan contributions driven by a discretionary $50.1 million contribution to the Company’s defined benefit pension plans in the first quarter of 2017, with $40.0 million contributed to U.S. defined benefit pension plans and $10.1 million contributed to foreign defined benefit pension plans.
Free cash flow (cash flow provided by operating activities less capital expenditures) was $758.2 million in 2017, compared with $693.6 million in 2016. EBITDA (earnings before interest, income taxes, depreciation and amortization) was $1,076.0 million in 2017, compared with $966.0 million in 2016. Free cash flow and EBITDA are presented because the Company is aware that they are measures used by third parties in evaluating the Company. (See the “Notes to Selected Financial Data” included in Item 6 in this Annual Report on Form 10-K for a reconciliation of U.S. GAAP measures to comparable non-GAAP measures).
Cash used for investing activities totaled $625.8 million in 2017, compared with $452.4 million in 2016. In 2017, the Company paid $556.6 million, net of cash acquired, to acquire Arizona Instrument in December 2017, MOCON in June 2017 and Rauland in February 2017. In 2016, the Company paid $391.4 million, net of cash acquired, to acquire Laserage in October 2016, HS Foils and Nu Instruments in July 2016 and Brookfield and ESP/SurgeX in January 2016. Additions to property, plant and equipment totaled $75.1 million in 2017, compared with $63.3 million in 2016.
Cash used for financing activities totaled $329.2 million in 2017, compared with $57.1 million of cash provided by financing activities in 2016. At December 31, 2017, total debt, net was $2,174.3 million, compared with $2,341.6 million at December 31, 2016. In 2017, short-term borrowings decreased $9.6 million, compared with a decrease of $315.7 million in 2016. In 2017, long-term borrowings decreased $270.0 million, compared with an increase of $772.2 million in 2016.
36
Table of Contents
In the fourth quarter of 2017, the Company paid in full, at maturity, $270 million in aggregate principal amount of 6.20% private placement senior notes.
The Company along with certain of its foreign subsidiaries has an amended and restated credit agreement dated as of March 10, 2016 (the “Credit Agreement”). The Credit Agreement consists of a five-year revolving credit facility in an aggregate principal amount of $850 million with a final maturity date in March 2021. The revolving credit facility total borrowing capacity excludes an accordion feature that permits the Company to request up to an additional $300 million in revolving credit commitments at any time during the life of the Credit Agreement under certain conditions. Interest rates on outstanding borrowings under the revolving credit facility are at the applicable benchmark rate plus a negotiated spread or at the U.S. prime rate. The revolving credit facility provides the Company with additional financial flexibility to support its growth plans, including its acquisition strategy. At December 31, 2017, the Company had available borrowing capacity of $1,108.1 million under its revolving credit facility, including the $300 million accordion feature.
In the third quarter of 2018, $80 million of 6.35% senior notes and $160 million of 7.08% senior notes will mature and become payable. In the fourth quarter of 2018, $65 million of 7.18% senior notes will mature and become payable. The debt-to-capital ratio was 35.1% at December 31, 2017, compared with 41.8% at December 31, 2016. The net debt-to-capital ratio (total debt, net less cash and cash equivalents divided by the sum of net debt and stockholders’ equity) was 27.5% at December 31, 2017, compared with 33.3% at December 31, 2016. The net debt-to-capital ratio is presented because the Company is aware that this measure is used by third parties in evaluating the Company. (See the “Notes to Selected Financial Data” included in Item 6 in this Annual Report on Form 10-K for a reconciliation of U.S. GAAP measures to comparable non-GAAP measures).
In 2017, the Company repurchased approximately 114,000 shares of its common stock for $6.9 million, compared with $336.1 million used for repurchases of approximately 7,099,000 shares in 2016. At December 31, 2017, $368.7 million was available under the Company’s Board of Directors authorization for future share repurchases.
Additional financing activities for 2017 included cash dividends paid of $82.7 million, compared with $83.3 million in 2016. Proceeds from the exercise of employee stock options were $40.0 million in 2017, compared with $17.6 million in 2016.
As a result of all of the Company’s cash flow activities in 2017, cash and cash equivalents at December 31, 2017 totaled $646.3 million, compared with $717.3 million at December 31, 2016. At December 31, 2017, the Company had $569.4 million in cash outside the United States, compared with $481.6 million at December 31, 2016. The Company utilizes this cash to fund its international operations, as well as to acquire international businesses. The Company is in compliance with all covenants, including financial covenants, for all of its debt agreements. The Company believes it has sufficient cash-generating capabilities from domestic and unrestricted foreign sources, available credit facilities and access to long-term capital funds to enable it to meet its operating needs and contractual obligations in the foreseeable future.
Subsequent Events
In January 2018, the Company acquired FMH Aerospace for approximately $235 million in cash using available cash.
Effective February 1, 2018, the Company’s Board of Directors approved a 56% increase in the quarterly cash dividend on the Company’s common stock to $0.14 per common share from $0.09 per common share.
37
Table of Contents
The following table summarizes AMETEK’s contractual cash obligations and the effect such obligations are expected to have on the Company’s liquidity and cash flows in future years at December 31, 2017.
| Payments Due | ||||||||||||||||||||
| Contractual Obligations(1) |
Total | Less Than One Year |
One to Three Years |
Four to Five Years |
After Five Years |
|||||||||||||||
| (In millions) | ||||||||||||||||||||
| Long-term debt borrowings(2) |
$ | 2,174.9 | $ | 305.0 | $ | 208.2 | $ | 56.5 | $ | 1,605.2 | ||||||||||
| Capital lease(3) |
4.3 | 4.3 | — | — | — | |||||||||||||||
| Other indebtedness |
0.3 | 0.3 | — | — | — | |||||||||||||||
|
|
|
|
|
|
|
|
|
|
|
|||||||||||
| Total debt(4) |
2,179.5 | 309.6 | 208.2 | 56.5 | 1,605.2 | |||||||||||||||
| Interest on long-term fixed-rate debt |
465.0 | 71.8 | 104.7 | 88.6 | 199.9 | |||||||||||||||
| Noncancellable operating leases(5) |
187.3 | 39.0 | 56.7 | 38.0 | 53.6 | |||||||||||||||
| Purchase obligations(6) |
390.6 | 365.2 | 24.4 | 0.9 | 0.1 | |||||||||||||||
| Restructuring and other |
30.0 | 27.0 | 3.0 | — | — | |||||||||||||||
|
|
|
|
|
|
|
|
|
|
|
|||||||||||
| Total |
$ | 3,252.4 | $ | 812.6 | $ | 397.0 | $ | 184.0 | $ | 1,858.8 | ||||||||||
|
|
|
|
|
|
|
|
|
|
|
|||||||||||
| (1) | The liability for uncertain tax positions was not included in the table of contractual obligations as of December 31, 2017 because the timing of the settlements of these uncertain tax positions cannot be reasonably estimated at this time. See Note 8 to the Consolidated Financial Statements included in Part II, Item 8 of this Annual Report on Form 10-K for further details. |
| (2) | See Note 9 to the Consolidated Financial Statements included in Part II, Item 8 of this Annual Report on Form 10-K for further details. |
| (3) | Represents a capital lease for a building and land associated with the Cameca SAS acquisition. The lease has a term of 12 years, which began in July 2006, and is payable quarterly. |
| (4) | Excludes debt issuance costs of $5.2 million, of which $1.5 million is classified as current and $3.7 million is classified as long-term. See Note 9 to the Consolidated Financial Statements included in Part II, Item 8 of this Annual Report on Form 10-K for further details. |
| (5) | The leases expire over a range of years from 2018 to 2082 with renewal or purchase options, subject to various terms and conditions, contained in most of the leases. |
| (6) | Purchase obligations primarily consist of contractual commitments to purchase certain inventories at fixed prices. |
Other Commitments
The Company has standby letters of credit and surety bonds of $47.3 million related to performance and payment guarantees at December 31, 2017. Based on experience with these arrangements, the Company believes that any obligations that may arise will not be material to its financial position.
Critical Accounting Policies
The Company has identified its critical accounting policies as those accounting policies that can have a significant impact on the presentation of the Company’s financial condition and results of operations and that require the use of complex and subjective estimates based on the Company’s historical experience and management’s judgment. Because of the uncertainty inherent in such estimates, actual results may differ materially from the estimates used. The consolidated financial statements and related notes contain information that is pertinent to the Company’s accounting policies and to Management’s Discussion and Analysis. The information that follows represents additional specific disclosures about the Company’s accounting policies regarding risks, estimates, subjective decisions or assessments whereby materially different financial condition
and results of operations could have been reported had different assumptions been used or different conditions existed. Primary disclosure of the Company’s significant accounting policies is in Note 1 to the Consolidated Financial Statements included in Part II, Item 8 of this Annual Report on Form 10-K.
38
Table of Contents
| • | Revenue Recognition. The Company recognizes revenue on product sales in the period when the sales process is complete. This generally occurs when products are shipped to the customer in accordance with terms of an agreement of sale, under which title and risk of loss have been transferred, collectability is reasonably assured and pricing is fixed or determinable. For a small percentage of sales where title and risk of loss passes at point of delivery, the Company recognizes revenue upon delivery to the customer, assuming all other criteria for revenue recognition are met. The Company’s policy with respect to sales returns and allowances generally provides that the customer may not return products or be given allowances, except at the Company’s option. The Company has agreements with distributors that do not provide expanded rights of return for unsold products. The distributor purchases the product from the Company, at which time title and risk of loss transfers to the distributor. The Company does not offer substantial sales incentives and credits to its distributors other than volume discounts. The Company accounts for these sales incentives as a reduction of revenues when the sale is recognized in the consolidated statement of income. Accruals for sales returns, other allowances and estimated warranty costs are provided at the time revenue is recognized based on the Company’s historical experience. At December 31, 2017 and 2016, the accrual for future warranty obligations was $22.9 million and $22.0 million, respectively. The Company’s expense for warranty obligations was $16.0 million in both 2017 and 2016, and $14.8 million in 2015, respectively. The warranty periods for products sold vary among the Company’s operations, but generally do not exceed one year. The Company calculates its warranty expense provision based on its historical warranty experience and adjustments are made periodically to reflect actual warranty expenses. If actual future sales returns and allowances and warranty amounts are higher than the Company’s historical experience, additional accruals may be required. |
| • | Accounts Receivable. The Company maintains allowances for estimated losses resulting from the inability of specific customers to meet their financial obligations to the Company. A specific allowance for doubtful accounts is recorded against the amount due from these customers. For all other customers, the Company recognizes allowance for doubtful accounts based on the length of time specific receivables are past due based on its historical experience. If the financial condition of the Company’s customers were to deteriorate, resulting in their inability to make payments, additional allowances may be required. The allowance for doubtful accounts was $10.4 million and $10.3 million at December 31, 2017 and 2016, respectively. |
| • | Inventories. The Company uses the first-in, first-out (“FIFO”) method of accounting, which approximates current replacement cost, for approximately 84% of its inventories at December 31, 2017. The last-in, first-out (“LIFO”) method of accounting is used to determine cost for the remaining 16% of the Company’s inventory at December 31, 2017. For inventories where cost is determined by the LIFO method, the FIFO value would have been $22.9 million and $18.4 million higher than the LIFO value reported in the consolidated balance sheet at December 31, 2017 and 2016, respectively. The Company provides estimated inventory reserves for slow-moving and obsolete inventory based on current assessments about future demand, market conditions, customers who may be experiencing financial difficulties and related management initiatives. If these factors are less favorable than those projected by management, additional inventory reserves may be required. |
| • | Business Combinations. The Company allocates the purchase price of an acquired company, including when applicable, the acquisition date fair value of contingent consideration between tangible and intangible assets acquired and liabilities assumed from the acquired business based on their estimated fair values, with the residual of the purchase price recorded as goodwill. Third party appraisal firms and other consultants are engaged to assist management in determining the fair values of certain assets acquired and liabilities assumed. Estimating fair values requires significant judgments, estimates and assumptions, including but not limited to: discount rates, future cash flows and the economic lives of trade names, technology, customer relationships, property, plant and equipment, as well as income taxes. These estimates are based on historical experience and information obtained from the management of the acquired companies, and are inherently uncertain. |
39
Table of Contents
| • | Goodwill and Other Intangible Assets. Goodwill and other intangible assets with indefinite lives, primarily trademarks and trade names, are not amortized; rather, they are tested for impairment at least annually. For the purpose of the goodwill impairment test, the Company can elect to perform a qualitative analysis to determine if it is more likely than not that the fair values of its reporting units are less than the respective carrying values of those reporting units. The Company elected to bypass performing the qualitative screen and performed the first step quantitative analysis of the goodwill impairment test in the current year. The Company may elect to perform the qualitative analysis in future periods. The first step in the quantitative process is to compare the carrying amount of the reporting unit’s net assets to the fair value of the reporting unit. If the fair value exceeds the carrying value, no further evaluation is required and no impairment loss is recognized. An impairment charge would be recognized to the extent the carrying amount of goodwill exceeds the reporting unit fair value. |
The Company identifies its reporting units at the component level, which is one level below its operating segments. Generally, goodwill arises from acquisitions of specific operating companies and is assigned to the reporting unit in which a particular operating company resides. The Company’s reporting units are divisions that are one level below its operating segments and for which discrete financial information is prepared and regularly reviewed by segment management.
The Company principally relies on a discounted cash flow analysis to determine the fair value of each reporting unit, which considers forecasted cash flows discounted at an appropriate discount rate. The Company believes that market participants would use a discounted cash flow analysis to determine the fair value of its reporting units in a sale transaction. The annual goodwill impairment test requires the Company to make a number of assumptions and estimates concerning future levels of revenue growth, operating margins, depreciation, amortization and working capital requirements, which are based on the Company’s long-range plan and are considered level 3 inputs. The Company’s long-range plan is updated as part of its annual planning process and is reviewed and approved by management. The discount rate is an estimate of the overall after-tax rate of return required by a market participant whose weighted average cost of capital includes both equity and debt, including a risk premium. While the Company uses the best available information to prepare its cash flow and discount rate assumptions, actual future cash flows or market conditions could differ significantly resulting in future impairment charges related to recorded goodwill balances. While there are always changes in assumptions to reflect changing business and market conditions, the Company’s overall methodology and the population of assumptions used have remained unchanged. In order to evaluate the sensitivity of the goodwill impairment test to changes in the fair value calculations, the Company applied a hypothetical 10% decrease in fair values of each reporting unit. The 2017 results (expressed as a percentage of carrying value for the respective reporting unit) showed that, despite the hypothetical 10% decrease in fair value, the fair values of the Company’s reporting units still exceeded their respective carrying values by 20% to 670% for each of the Company’s reporting units.
The impairment test for indefinite-lived intangibles other than goodwill (primarily trademarks and trade names) consists of a comparison of the fair value of the indefinite-lived intangible asset to the carrying value of the asset as of the impairment testing date. The Company can elect to perform a qualitative analysis to determine if it is more likely than not that the fair values of its indefinite-lived intangible assets are less than the respective carrying values of those assets. The Company elected to bypass performing the qualitative screen. The Company may elect to perform the qualitative analysis in future periods. The Company estimates the fair value of its indefinite-lived intangibles using the relief from royalty method using level 3 inputs. The Company believes the relief from royalty method is a widely used valuation technique for such assets. The fair value derived from the relief from royalty method is measured as the discounted cash flow savings realized from owning such trademarks and trade names and not having to pay a royalty for their use.
The Company’s acquisitions have generally included a significant goodwill component and the Company expects to continue to make acquisitions. At December 31, 2017, goodwill and other indefinite-lived
40
Table of Contents
intangible assets totaled $3,724.6 million or 47.7% of the Company’s total assets. The Company completed its required annual impairment tests in the fourth quarter of 2017 and determined that the carrying values of the Company’s goodwill were not impaired.
Other intangible assets with finite lives are evaluated for impairment when events or changes in circumstances indicate the carrying value may not be recoverable. The carrying value of other intangible assets with finite lives is considered impaired when the total projected undiscounted cash flows from those assets are separately identifiable and are less than the carrying value. In that event, a loss is recognized based on the amount by which the carrying value exceeds the fair value of those assets. Fair value is determined primarily using present value techniques based on projected cash flows from the asset group.
| • | Pensions. The Company has U.S. and foreign defined benefit and defined contribution pension plans. The most significant elements in determining the Company’s pension income or expense are the assumed pension liability discount rate and the expected return on plan assets. The pension discount rate reflects the current interest rate at which the pension liabilities could be settled at the valuation date. At the end of each year, the Company determines the assumed discount rate to be used to discount plan liabilities. In estimating this rate for 2017, the Company considered rates of return on high-quality, fixed-income investments that have maturities consistent with the anticipated funding requirements of the plan. The discount rate used in determining the 2017 pension cost was 7.50% for U.S. defined benefit pension plans and 6.79% for foreign plans. The discount rate used for determining the funded status of the plans at December 31, 2017 and determining the 2018 defined benefit pension cost was 7.50% for U.S. plans and 6.79% for foreign plans. In estimating the U.S. and foreign discount rates, the Company’s actuaries developed a customized discount rate appropriate to the plans’ projected benefit cash flow based on yields derived from a database of long-term bonds at consistent maturity dates. The Company used an expected long-term rate of return on plan assets for 2017 of 7.50% for U.S. defined benefit pension plans and 6.79% for foreign plans. In 2018, the Company will use 7.50% for the U.S. plans and 6.64% for the foreign plans. The Company determines the expected long-term rate of return based primarily on its expectation of future returns for the pension plans’ investments. Additionally, the Company considers historical returns on comparable fixed-income and equity investments, and adjusts its estimate as deemed appropriate. The rate of compensation increase used in determining the 2017 pension income for the U.S. plans was 3.75% and was 2.50% for the foreign plans. The U.S. and foreign plans’ rate of compensation increase will remain unchanged in 2018. In both 2017 and 2016, the Company recognized consolidated pre-tax pension income of $4.3 million from its U.S. and foreign defined benefit pension plans. The Company estimates its 2018 U.S. and foreign defined benefit pension pre-tax income to be approximately $15 million. |
All unrecognized prior service costs, remaining transition obligations or assets and actuarial gains and losses have been recognized, net of tax effects, as a charge to accumulated other comprehensive income in stockholders’ equity and will be amortized as a component of net periodic pension cost. The Company uses a measurement date of December 31 (its fiscal year end) for its U.S. and foreign defined benefit plans.
To fund the plans, the Company made cash contributions to its defined benefit pension plans in 2017, which totaled $54.8 million, compared with $6.8 million in 2016. The Company anticipates making approximately $2 million to $6 million in cash contributions to its defined benefit pension plans in 2018.
| • | Income Taxes. The process of providing for income taxes and determining the related balance sheet accounts requires management to assess uncertainties, make judgments regarding outcomes and utilize estimates. The Company conducts a broad range of operations around the world and is therefore subject to complex tax regulations in numerous international taxing jurisdictions, resulting at times in tax audits, disputes and potential litigation, the outcome of which is uncertain. Management must make judgments currently about such uncertainties and determine estimates of the Company’s tax assets and liabilities. To |
41
Table of Contents
| the extent the final outcome differs, future adjustments to the Company’s tax assets and liabilities may be necessary. |
The Company assesses the realizability of its deferred tax assets, taking into consideration the Company’s forecast of future taxable income, available net operating loss carryforwards and available tax planning strategies that could be implemented to realize the deferred tax assets. Based on this assessment, management must evaluate the need for, and the amount of, valuation allowances against the Company’s deferred tax assets. To the extent facts and circumstances change in the future, adjustments to the valuation allowances may be required.
The Company assesses the uncertainty in its tax positions, by applying a minimum recognition threshold which a tax position is required to meet before a tax benefit is recognized in the financial statements. Once the minimum threshold is met, using a more likely than not standard, a series of probability estimates is made for each item to properly measure and record a tax benefit. The tax benefit recorded is generally equal to the highest probable outcome that is more than 50% likely to be realized after full disclosure and resolution of a tax examination. The underlying probabilities are determined based on the best available objective evidence such as recent tax audit outcomes, published guidance, external expert opinion, or by analogy to the outcome of similar issues in the past. There can be no assurance that these estimates will ultimately be realized given continuous changes in tax policy, legislation and audit practice. The Company recognizes interest and penalties accrued related to uncertain tax positions in income tax expense.
Recent Accounting Pronouncements
In May 2014, the FASB issued ASU No. 2014-09, Revenue from Contracts with Customers (“ASU 2014-09”) and modified the standard thereafter. The objective of ASU 2014-09 is to establish a single comprehensive model for entities to use in accounting for revenue arising from contracts with customers and will supersede most of the existing revenue recognition guidance. The core principle of ASU 2014-09 is that an entity recognizes revenue at the transfer of control of promised goods or services to customers in an amount that reflects the consideration to which the entity expects to be entitled in exchange for those goods or services. ASU 2014-09 applies to all contracts with customers except those that are within the scope of other topics in the FASB Accounting Standards Codification.
ASU 2014-09 is effective for interim and annual reporting periods beginning after December 15, 2017 and may be early adopted for interim and annual reporting periods beginning after December 15, 2016. The Company adopted ASU 2014-09 as of January 1, 2018. The guidance permits adoption by retrospectively applying the guidance to each prior reporting period presented (full retrospective method) or prospectively applying the guidance and providing additional disclosures comparing results to previous guidance, with the cumulative effect of initially applying the guidance recognized in beginning retained earnings at the date of initial application (modified retrospective method). The Company will use the modified retrospective method of adoption.
ASU 2014-09 will impact the Company’s revenue recognition procedures by requiring recognition of certain revenues to move from upon shipment or delivery to over-time. The recording of certain revenues over-time is not expected to have a material impact on the Company’s consolidated results of operations or financial position. Also, the Company has developed the additional expanded disclosures required. The Company has implemented the appropriate changes to its business processes to support recognition and disclosure under ASU 2014-09. The Company does not expect the adoption of ASU 2014-09 to have a material impact on its consolidated results of operations, financial position and cash flows.
In July 2015, the FASB issued ASU No. 2015-11, Simplifying the Measurement of Inventory (“ASU 2015-11”), which applies to inventory that is measured using FIFO or average cost. As prescribed in this update, an entity should measure inventory that is within scope at the lower of cost and net realizable value, which is the estimated selling prices in the ordinary course of business, less reasonably predictable costs of
42
Table of Contents
completion, disposal and transportation. Subsequent measurement is unchanged for inventory that is measured using LIFO. The Company prospectively adopted ASU 2015-11 effective January 1, 2017 and the adoption did not have a significant impact on the Company’s consolidated results of operations, financial position or cash flows.
In November 2015, the FASB issued ASU No. 2015-17, Balance Sheet Classification of Deferred Taxes (“ASU 2015-17”). ASU 2015-17 simplifies the presentation of deferred taxes by requiring deferred tax assets and liabilities be classified as noncurrent on the consolidated balance sheet. The Company prospectively adopted ASU 2015-17 effective January 1, 2017. Therefore, prior periods have not been adjusted to reflect this adoption. The adoption of ASU 2015-17 did not have a significant impact on the Company’s consolidated results of operations, financial position or cash flows.
In February 2016, the FASB issued ASU No. 2016-02, Leases (“ASU 2016-02”). The new standard establishes a right-of-use model that requires a lessee to record a right-of-use asset and a lease liability on the balance sheet for all leases with terms longer than twelve months. Leases will be classified as either finance or operating, with classification affecting the pattern of expense recognition in the income statement. ASU 2016-02 is effective for interim and annual reporting periods beginning after December 15, 2018 and early adoption is permitted. ASU 2016-02 includes transitional guidance, as currently issued, that calls for a modified retrospective approach. The FASB has recently proposed adding a transition option to the current guidance and it includes optional practical expedients for ease of transition. The Company has formed a steering committee to lead the Company’s implementation project. The Company has not determined the impact ASU 2016-02 may have on the Company’s consolidated results of operations, financial position, cash flows and financial statement disclosures, which could be significant to the Company’s financial position.
In March 2016, the FASB issued ASU 2016-09, Improvements to Employee Share-Based Payment Accounting. ASU 2016-09 includes changes to the accounting for share-based payment transactions, including the income tax consequences, classification of awards as either equity or liabilities and classification on the statement of cash flows. The Company prospectively adopted ASU 2016-09 effective January 1, 2017. For the year ended December 31, 2017, the Company recorded a tax benefit of $12.3 million within Provision for income taxes related to the tax effects of share-based payment transactions. Prior to adoption, this amount would have been recorded as a component of Capital in excess of par value. The adoption of this standard could create volatility in the Company’s effective tax rate going forward. The Company elected not to change its accounting policy with respect to the estimation of forfeitures. The Company no longer reclassifies the excess tax benefits from share-based payments from operating activities to financing activities in the consolidated statement of cash flows. For the year ended December 31, 2017, the Company excluded the excess tax benefits from the assumed proceeds available to repurchase shares in the computation of its diluted earnings per share and the related increase in the Company’s diluted weighted average common shares outstanding was not significant.
In January 2017, the FASB issued ASU No. 2017-01, Clarifying the Definition of a Business (“ASU 2017-01”). ASU 2017-01 provides a more robust framework to use in determining when a set of assets and activities is a business. ASU 2017-01 requires an entity to evaluate if substantially all of the fair value of the gross assets acquired is concentrated in a single identifiable asset or a group of similar identifiable assets; if so, the set of assets is not a business. ASU 2017-01 requires that, to be a business, the set must include, at a minimum, an input and a substantive process that together significantly contribute to the ability to create outputs. ASU 2017-01 is effective for interim and annual reporting periods beginning after December 15, 2017. ASU 2017-01 will be applied prospectively to any transactions occurring within the period of adoption. Early adoption is permitted, including for interim or annual periods in which the financial statements have not been issued or made available for issuance. The Company does not expect the adoption of ASU 2017-01 to have a significant impact on the Company’s consolidated results of operations, financial position, cash flows and financial statement disclosures.
In January 2017, the FASB issued ASU No. 2017-04, Simplifying the Test for Goodwill Impairment (“ASU 2017-04”). ASU 2017-04 eliminates the requirement to calculate the reporting unit fair value of goodwill
43
Table of Contents
(second step) to measure a goodwill impairment charge. Under the guidance, an impairment charge will be measured based on the excess of the reporting unit’s carrying amount over its fair value (first step). ASU 2017-04 is effective for interim and annual reporting periods beginning after December 15, 2019 and early adoption is permitted. The Company early adopted ASU 2017-04 effective January 1, 2017 and the adoption did not have a significant impact on the Company’s consolidated results of operations, financial position, cash flows and financial statement disclosures.
In March 2017, the FASB issued ASU No. 2017-07, Improving the Presentation of Net Periodic Pension Cost and Net Periodic Postretirement Benefit Cost (“ASU 2017-07”), which changes how employers that sponsor defined benefit pension and/or other postretirement benefit plans present the net periodic benefit cost in the income statement. ASU 2017-07 requires employers to present the service cost component of net periodic benefit cost in the same income statement line item as other employee compensation costs. All other components of the net periodic benefit cost will be presented outside of operating income. ASU 2017-07 is effective for interim and annual reporting periods beginning after December 15, 2017. The changes in presentation will be applied retrospectively when adopted. The Company expects restated 2017 Cost of sales to increase $11.5 million with an offsetting $11.5 million increase to Other operating income. The 2018 service cost included in operating income is expected to approximate 2017 service cost of $7.1 million. The Company does not expect the adoption of ASU 2017-07 to have a significant impact on the Company’s consolidated financial position, cash flows and financial statement disclosures.
In May 2017, the FASB issued ASU No. 2017-09, Scope of Modification Accounting (“ASU 2017-09”). ASU 2017-09 clarifies which changes to the terms or conditions of a share-based payment award require an entity to apply modification accounting. ASU 2017-09 is effective for interim and annual reporting periods beginning after December 15, 2017 and early adoption is permitted. The Company does not expect the adoption of ASU 2017-09 to have a significant impact on the Company’s consolidated results of operations, financial position or cash flows.
Internal Reinvestment
Capital Expenditures
Capital expenditures were $75.1 million or 1.7% of net sales in 2017, compared with $63.3 million or 1.6% of net sales in 2016. In 2017, approximately 55% of capital expenditures were for improvements to existing equipment or additional equipment to increase productivity and expand capacity. Capital expenditures in 2018 are expected to approximate 2% of net sales, with a continued emphasis on spending to improve productivity.
Research, Development and Engineering
The Company is committed to, and has consistently invested in, research, development and engineering activities to design and develop new and improved products and solutions. Research, development and engineering costs before customer reimbursement were $221.2 million in 2017 and $200.8 million in both 2016 and 2015. Customer reimbursements in 2017, 2016 and 2015 were $5.4 million, $7.2 million and $6.9 million, respectively. These amounts included research and development expenses of $130.4 million, $112.0 million and $116.3 million in 2017, 2016 and 2015, respectively. All such expenditures were directed toward the development of new products and solutions and the improvement of existing products and solutions.
Environmental Matters
Certain historic processes in the manufacture of products have resulted in environmentally hazardous waste by-products as defined by federal and state laws and regulations. The Company believes these waste products were handled in compliance with regulations existing at that time. At December 31, 2017, the Company is named a Potentially Responsible Party (“PRP”) at 13 non-AMETEK-owned former waste disposal or treatment sites (the “non-owned” sites). The Company is identified as a “de minimis” party in 12 of these sites based on the low
44
Table of Contents
volume of waste attributed to the Company relative to the amounts attributed to other named PRPs. In eight of these sites, the Company has reached a tentative agreement on the cost of the de minimis settlement to satisfy its obligation and is awaiting executed agreements. The tentatively agreed-to settlement amounts are fully reserved. In the other four sites, the Company is continuing to investigate the accuracy of the alleged volume attributed to the Company as estimated by the parties primarily responsible for remedial activity at the sites to establish an appropriate settlement amount. At the remaining site where the Company is a non-de minimis PRP, the Company is participating in the investigation and/or related required remediation as part of a PRP Group and reserves have been established sufficient to satisfy the Company’s expected obligations. The Company historically has resolved these issues within established reserve levels and reasonably expects this result will continue. In addition to these non-owned sites, the Company has an ongoing practice of providing reserves for probable remediation activities at certain of its current or previously owned manufacturing locations (the “owned” sites). For claims and proceedings against the Company with respect to other environmental matters, reserves are established once the Company has determined that a loss is probable and estimable. This estimate is refined as the Company moves through the various stages of investigation, risk assessment, feasibility study and corrective action processes. In certain instances, the Company has developed a range of estimates for such costs and has recorded a liability based on the best estimate. It is reasonably possible that the actual cost of remediation of the individual sites could vary from the current estimates and the amounts accrued in the consolidated financial statements; however, the amounts of such variances are not expected to result in a material change to the consolidated financial statements. In estimating the Company’s liability for remediation, the Company also considers the likely proportionate share of the anticipated remediation expense and the ability of the other PRPs to fulfill their obligations.
Total environmental reserves at December 31, 2017 and 2016 were $30.1 million and $28.4 million, respectively, for both non-owned and owned sites. In 2017, the Company recorded $7.7 million in reserves and the reserve increased $0.4 million due to foreign currency translation. Additionally, the Company spent $6.4 million on environmental matters in 2017. The Company’s reserves for environmental liabilities at December 31, 2017 and 2016 included reserves of $11.6 million and $12.4 million, respectively, for an owned site acquired in connection with the 2005 acquisition of HCC Industries (“HCC”). The Company is the designated performing party for the performance of remedial activities for one of several operating units making up a Superfund site in the San Gabriel Valley of California. The Company has obtained indemnifications and other financial assurances from the former owners of HCC related to the costs of the required remedial activities. At December 31, 2017, the Company had $12.0 million in receivables related to HCC for probable recoveries from third-party escrow funds and other committed third-party funds to support the required remediation. Also, the Company is indemnified by HCC’s former owners for approximately $19 million of additional costs.
The Company has agreements with other former owners of certain of its acquired businesses, as well as new owners of previously owned businesses. Under certain of the agreements, the former or new owners retained, or assumed and agreed to indemnify the Company against, certain environmental and other liabilities under certain circumstances. The Company and some of these other parties also carry insurance coverage for some environmental matters. To date, these parties have met their obligations in all material respects.
The Company believes it has established reserves for the environmental matters described above, which are sufficient to perform all known responsibilities under existing claims and consent orders. The Company has no reason to believe that other third parties would fail to perform their obligations in the future. In the opinion of management, based on presently available information and the Company’s historical experience related to such matters, an adequate provision for probable costs has been made and the ultimate cost resulting from these actions is not expected to materially affect the consolidated results of operations, financial position or cash flows of the Company.
The Company has been remediating groundwater contamination for several contaminants, including trichloroethylene (“TCE”), at a formerly owned site in El Cajon, California. Several lawsuits have been filed against the Company alleging damages resulting from the groundwater contamination, including property damages and personal injury, and seeking compensatory and punitive damages. Given the state of uncertainty inherent in these litigations, the Company does not believe it is possible to develop estimates of reasonably
45
Table of Contents
possible loss in regard to these matters. The Company believes that it has good and valid defenses to each of these claims and intends to defend them vigorously. The Company does not expect the outcome of these matters, either individually or in the aggregate, to materially affect the consolidated results of operations, financial position or cash flows of the Company.
Market Risk
The Company’s primary exposures to market risk are fluctuations in interest rates, foreign currency exchange rates and commodity prices, which could impact its financial condition and results of operations. The Company addresses its exposure to these risks through its normal operating and financing activities. The Company’s differentiated and global business activities help to reduce the impact that any particular market risk may have on its operating income as a whole.
The Company’s short-term debt carries variable interest rates and generally its long-term debt carries fixed rates. These financial instruments are more fully described in the Notes to the Consolidated Financial Statements included in Part II, Item 8 of this Annual Report on Form 10-K.
The foreign currencies to which the Company has the most significant exchange rate exposure are the Euro, the British pound, the Japanese yen, the Chinese renminbi, the Canadian dollar, the Mexican peso and the Swiss franc. Exposure to foreign currency rate fluctuation is modest, monitored, and when possible, mitigated through the use of local borrowings and occasional derivative financial instruments in the foreign currency affected. The effect of translating foreign subsidiaries’ balance sheets into U.S. dollars is included in other comprehensive income within stockholders’ equity. Foreign currency transactions have not had a significant effect on the operating results reported by the Company because revenues and costs associated with the revenues are generally transacted in the same foreign currencies.
The primary commodities to which the Company has market exposure are raw material purchases of nickel, aluminum, copper, steel, titanium and gold. Exposure to price changes in these commodities are generally mitigated through adjustments in selling prices of the ultimate product and purchase order pricing arrangements, although forward contracts are sometimes used to manage some of those exposures.
Based on a hypothetical ten percent adverse movement in interest rates, commodity prices or foreign currency exchange rates, the Company’s best estimate is that the potential losses in future earnings, fair value of risk-sensitive financial instruments and cash flows are not material, although the actual effects may differ materially from the hypothetical analysis.
Forward-Looking Information
Certain matters discussed in this Form 10-K are “forward-looking statements” as defined in the Private Securities Litigation Reform Act of 1995 (“PSLRA”), which involve risk and uncertainties that exist in the Company’s operations and business environment and can be affected by inaccurate assumptions, or by known or unknown risks and uncertainties. Many such factors will be important in determining the Company’s actual future results. The Company wishes to take advantage of the “safe harbor” provisions of the PSLRA by cautioning readers that numerous important factors, in some cases have caused, and in the future could cause, the Company’s actual results to differ materially from those expressed in any forward-looking statements made by, or on behalf of, the Company. Some, but not all, of the factors or uncertainties that could cause actual results to differ from present expectations are set forth above and under Item 1A. Risk Factors. The Company undertakes no obligation to publicly update any forward-looking statements, whether as a result of new information, subsequent events or otherwise, unless required by the securities laws to do so.
| Item 7A. | Quantitative and Qualitative Disclosures About Market Risk |
Information concerning market risk is set forth under the heading “Market Risk” in Management’s Discussion and Analysis of Financial Condition and Results of Operations herein.
46
Table of Contents
| Item 8. | Financial Statements and Supplementary Data |
Financial Statement Schedules (Item 15(a)(2))
Financial statement schedules have been omitted because either they are not applicable or the required information is included in the financial statements or the notes thereto.
47
Table of Contents
Management’s Responsibility for Financial Statements
Management has prepared and is responsible for the integrity of the consolidated financial statements and related information. The statements are prepared in conformity with U.S. generally accepted accounting principles consistently applied and include certain amounts based on management’s best estimates and judgments. Historical financial information elsewhere in this report is consistent with that in the financial statements.
In meeting its responsibility for the reliability of the financial information, management maintains a system of internal accounting and disclosure controls, including an internal audit program. The system of controls provides for appropriate division of responsibility and the application of written policies and procedures. That system, which undergoes continual reevaluation, is designed to provide reasonable assurance that assets are safeguarded and records are adequate for the preparation of reliable financial data.
Management is responsible for establishing and maintaining adequate internal control over financial reporting. AMETEK, Inc. maintains a system of internal controls that is designed to provide reasonable assurance as to the fair and reliable preparation and presentation of the consolidated financial statements; however, there are inherent limitations in the effectiveness of any system of internal controls.
Management recognizes its responsibility for conducting the Company’s activities according to the highest standards of personal and corporate conduct. That responsibility is characterized and reflected in a code of business conduct for all employees and in a financial code of ethics for the Chief Executive Officer and Senior Financial Officers, as well as in other key policy statements publicized throughout the Company.
The Audit Committee of the Board of Directors, which is composed solely of independent directors who are not employees of the Company, meets with the independent registered public accounting firm, the internal auditors and management to satisfy itself that each is properly discharging its responsibilities. The report of the Audit Committee is included in the Company’s Proxy Statement for the 2018 Annual Meeting of Stockholders. Both the independent registered public accounting firm and the internal auditors have direct access to the Audit Committee.
The Company’s independent registered public accounting firm, Ernst & Young LLP, is engaged to render an opinion as to whether management’s financial statements present fairly, in all material respects, the Company’s financial position and operating results. This report is included herein.
Management’s Report on Internal Control over Financial Reporting
Management of the Company is responsible for establishing and maintaining adequate internal control over financial reporting, as such term is defined in the Exchange Act Rules 13a-15(f) and 15d-15(f). Under the supervision and with the participation of our management, including our Chief Executive Officer and Chief Financial Officer, AMETEK, Inc. conducted an evaluation of the effectiveness of the Company’s internal control over financial reporting as of December 31, 2017 based on criteria established in Internal Control – Integrated Framework issued by the Committee of Sponsoring Organizations of the Treadway Commission (2013 framework). Based on that evaluation, our management concluded that the Company’s internal control over financial reporting was effective as of December 31, 2017.
The Company acquired Rauland-Borg Corporation (“Rauland”) in February 2017, MOCON, Inc. in June 2017 and Arizona Instrument LLC in December 2017. As permitted by the U.S. Securities and Exchange Commission staff interpretative guidance for newly acquired businesses, the Company excluded Rauland, MOCON and Arizona Instrument from management’s assessment of the effectiveness of the Company’s internal control over financial reporting as of December 31, 2017. In the aggregate, Rauland, MOCON and Arizona Instrument constituted 8.4% of total assets as of December 31, 2017 and 4.5% of net sales for the year then ended.
The Company’s internal control over financial reporting as of December 31, 2017 has been audited by Ernst & Young LLP, an independent registered public accounting firm, as stated in their report, which is included herein.
| /s/ DAVID A. ZAPICO |
/s/ WILLIAM J. BURKE | |
| Chairman of the Board and Chief Executive Officer |
Executive Vice President – Chief Financial Officer |
February 22, 2018
48
Table of Contents
REPORT OF INDEPENDENT REGISTERED PUBLIC ACCOUNTING FIRM
ON INTERNAL CONTROL OVER FINANCIAL REPORTING
To the Board of Directors and Stockholders of AMETEK, Inc.:
Opinion on Internal Control over Financial Reporting
We have audited AMETEK, Inc.’s internal control over financial reporting as of December 31, 2017, based on criteria established in Internal Control — Integrated Framework issued by the Committee of Sponsoring Organizations of the Treadway Commission (2013 framework) (the “COSO criteria”). In our opinion, AMETEK, Inc. (the “Company”) maintained, in all material respects, effective internal control over financial reporting as of December 31, 2017, based on the COSO criteria.
As indicated in the accompanying Management’s Report on Internal Control Over Financial Reporting, management’s assessment of and conclusion on the effectiveness of internal control over financial reporting did not include the internal controls of Rauland-Borg Corporation (“Rauland”), MOCON, Inc. and Arizona Instrument LLC, which are included in the 2017 consolidated financial statements of the Company and constituted 8.4% of total assets as of December 31, 2017 and 4.5% of net sales for the year then ended. Our audit of internal control over financial reporting of the Company also did not include an evaluation of the internal control over financial reporting of Rauland, MOCON and Arizona Instrument.
We also have audited, in accordance with the standards of the Public Company Accounting Oversight Board (United States) (“PCAOB”), the consolidated balance sheets of AMETEK, Inc. as of December 31, 2017 and 2016 and the related consolidated statements of income, comprehensive income, stockholders’ equity and cash flows for each of the three years in the period ended December 31, 2017 and the related notes and our report dated February 22, 2018 expressed an unqualified opinion thereon.
Basis for Opinion
The Company’s management is responsible for maintaining effective internal control over financial reporting and for its assessment of the effectiveness of internal control over financial reporting included in the accompanying Management’s Report on Internal Control Over Financial Reporting. Our responsibility is to express an opinion on the Company’s internal control over financial reporting based on our audit. We are a public accounting firm registered with the PCAOB and are required to be independent with respect to the Company in accordance with the U.S. federal securities laws and the applicable rules and regulations of the Securities and Exchange Commission and the PCAOB.
We conducted our audit in accordance with the standards of the PCAOB. Those standards require that we plan and perform the audit to obtain reasonable assurance about whether effective internal control over financial reporting was maintained in all material respects.
Our audit included obtaining an understanding of internal control over financial reporting, assessing the risk that a material weakness exists, testing and evaluating the design and operating effectiveness of internal control based on the assessed risk, and performing such other procedures as we considered necessary in the circumstances. We believe that our audit provides a reasonable basis for our opinion.
Definition and Limitations of Internal Control Over Financial Reporting
A company’s internal control over financial reporting is a process designed to provide reasonable assurance regarding the reliability of financial reporting and the preparation of financial statements for external purposes in accordance with generally accepted accounting principles. A company’s internal control over financial reporting includes those policies and procedures that (1) pertain to the maintenance of records that, in reasonable detail, accurately and fairly reflect the transactions and dispositions of the assets of the company; (2) provide reasonable assurance that transactions are recorded as necessary to permit preparation of financial statements in accordance with generally accepted accounting principles, and that receipts and expenditures of the company are being made only in accordance with authorizations of management and directors of the company; and (3) provide reasonable assurance regarding prevention or timely detection of unauthorized acquisition, use, or disposition of the company’s assets that could have a material effect on the financial statements.
Because of its inherent limitations, internal control over financial reporting may not prevent or detect misstatements. Also, projections of any evaluation of effectiveness to future periods are subject to the risk that controls may become inadequate because of changes in conditions, or that the degree of compliance with the policies or procedures may deteriorate.
/s/ ERNST & YOUNG LLP
Philadelphia, Pennsylvania
February 22, 2018
49
Table of Contents
REPORT OF INDEPENDENT REGISTERED PUBLIC ACCOUNTING FIRM
ON FINANCIAL STATEMENTS
To the Board of Directors and Stockholders of AMETEK, Inc.:
Opinion on the Financial Statements
We have audited the accompanying consolidated balance sheets of AMETEK, Inc. (the “Company”) as of December 31, 2017 and 2016, and the related consolidated statements of income, comprehensive income, stockholders’ equity and cash flows for each of the three years in the period ended December 31, 2017, and the related notes (collectively referred to as the “consolidated financial statements”). In our opinion, the consolidated financial statements present fairly, in all material respects, the financial position of the Company as of December 31, 2017 and 2016, and the results of its operations and its cash flows for each of the three years in the period ended December 31, 2017, in conformity with U.S. generally accepted accounting principles.
We also have audited, in accordance with the standards of the Public Company Accounting Oversight Board (United States) (“PCAOB”), AMETEK, Inc.’s internal control over financial reporting as of December 31, 2017, based on criteria established in Internal Control – Integrated Framework issued by the Committee of Sponsoring Organizations of the Treadway Commission (2013 framework) and our report dated February 22, 2018 expressed an unqualified opinion thereon.
Basis for Opinion
These financial statements are the responsibility of the Company’s management. Our responsibility is to express an opinion on the Company’s financial statements based on our audits. We are a public accounting firm registered with the PCAOB and are required to be independent with respect to the Company in accordance with the U.S. federal securities laws and the applicable rules and regulations of the Securities and Exchange Commission and the PCAOB.
We conducted our audits in accordance with the standards of the PCAOB. Those standards require that we plan and perform the audit to obtain reasonable assurance about whether the financial statements are free of material misstatement, whether due to error or fraud. Our audits included performing procedures to assess the risks of material misstatement of the financial statements, whether due to error or fraud, and performing procedures that respond to those risks. Such procedures include examining, on a test basis, evidence regarding the amounts and disclosures in the financial statements. Our audits also included evaluating the accounting principles used and significant estimates made by management, as well as evaluating the overall presentation of the financial statements. We believe that our audits provide a reasonable basis for our opinion.
/s/ ERNST & YOUNG LLP
We have served as the Company’s auditor since 1930.
Philadelphia, Pennsylvania
February 22, 2018
50
Table of Contents
Consolidated Statement of Income
(In thousands, except per share amounts)
| Year Ended December 31, | ||||||||||||
| 2017 | 2016 | 2015 | ||||||||||
| Net sales |
$ | 4,300,170 | $ | 3,840,087 | $ | 3,974,295 | ||||||
|
|
|
|
|
|
|
|||||||
| Operating expenses: |
||||||||||||
| Cost of sales |
2,851,431 | 2,575,220 | 2,617,987 | |||||||||
| Selling, general and administrative |
533,645 | 462,970 | 448,592 | |||||||||
|
|
|
|
|
|
|
|||||||
| Total operating expenses |
3,385,076 | 3,038,190 | 3,066,579 | |||||||||
|
|
|
|
|
|
|
|||||||
| Operating income |
915,094 | 801,897 | 907,716 | |||||||||
| Other expenses: |
||||||||||||
| Interest expense |
(98,029 | ) | (94,304 | ) | (91,795 | ) | ||||||
| Other, net |
(20,336 | ) | (14,490 | ) | (9,541 | ) | ||||||
|
|
|
|
|
|
|
|||||||
| Income before income taxes |
796,729 | 693,103 | 806,380 | |||||||||
| Provision for income taxes |
115,259 | 180,945 | 215,521 | |||||||||
|
|
|
|
|
|
|
|||||||
| Net income |
$ | 681,470 | $ | 512,158 | $ | 590,859 | ||||||
|
|
|
|
|
|
|
|||||||
| Basic earnings per share |
$ | 2.96 | $ | 2.20 | $ | 2.46 | ||||||
|
|
|
|
|
|
|
|||||||
| Diluted earnings per share |
$ | 2.94 | $ | 2.19 | $ | 2.45 | ||||||
|
|
|
|
|
|
|
|||||||
| Weighted average common shares outstanding: |
||||||||||||
| Basic shares |
230,229 | 232,593 | 239,906 | |||||||||
|
|
|
|
|
|
|
|||||||
| Diluted shares |
231,845 | 233,730 | 241,586 | |||||||||
|
|
|
|
|
|
|
|||||||
See accompanying notes.
51
Table of Contents
Consolidated Statement of Comprehensive Income
(In thousands)
| Year Ended December 31, | ||||||||||||
| 2017 | 2016 | 2015 | ||||||||||
| Net income |
$ | 681,470 | $ | 512,158 | $ | 590,859 | ||||||
|
|
|
|
|
|
|
|||||||
| Other comprehensive (loss) income: |
||||||||||||
| Amounts arising during the period — gains (losses), net of tax (expense) benefit: |
||||||||||||
| Foreign currency translation: |
||||||||||||
| Translation adjustments |
159,507 | (68,774 | ) | (67,245 | ) | |||||||
| Change in long-term intercompany notes |
36,320 | (7,597 | ) | (51,235 | ) | |||||||
| Net investment hedge instruments, net of tax of $41,178, $6,558 and $3,432 in 2017, 2016 and 2015, respectively |
(109,412 | ) | (12,179 | ) | (6,374 | ) | ||||||
| Defined benefit pension plans: |
||||||||||||
| Net actuarial gain (loss), net of tax of ($8,384), $17,450 and $12,870 in 2017, 2016 and 2015, respectively |
16,518 | (55,259 | ) | (21,002 | ) | |||||||
| Amortization of net actuarial loss, net of tax of ($4,680), ($2,090) and ($3,247) in 2017, 2016 and 2015, respectively |
9,910 | 6,618 | 6,137 | |||||||||
| Amortization of prior service costs, net of tax of $4, $25 and ($564) in 2017, 2016 and 2015, respectively |
(41 | ) | (79 | ) | 1,809 | |||||||
| Unrealized holding gain (loss) on available-for-sale securities: |
||||||||||||
| Unrealized gain (loss), net of tax of ($221), ($275) and $445 in 2017, 2016 and 2015, respectively |
411 | 512 | (827 | ) | ||||||||
|
|
|
|
|
|
|
|||||||
| Other comprehensive income (loss) |
113,213 | (136,758 | ) | (138,737 | ) | |||||||
|
|
|
|
|
|
|
|||||||
| Total comprehensive income |
$ | 794,683 | $ | 375,400 | $ | 452,122 | ||||||
|
|
|
|
|
|
|
|||||||
See accompanying notes.
52
Table of Contents
Consolidated Balance Sheet
(In thousands, except share amounts)
| December 31, | ||||||||
| 2017 | 2016 | |||||||
| ASSETS |
||||||||
| Current assets: |
||||||||
| Cash and cash equivalents |
$ | 646,300 | $ | 717,259 | ||||
| Receivables, net |
668,176 | 592,326 | ||||||
| Inventories, net |
540,504 | 492,104 | ||||||
| Deferred income taxes |
— | 50,004 | ||||||
| Other current assets |
79,675 | 76,497 | ||||||
|
|
|
|
|
|||||
| Total current assets |
1,934,655 | 1,928,190 | ||||||
| Property, plant and equipment, net |
493,296 | 473,230 | ||||||
| Goodwill |
3,115,619 | 2,818,950 | ||||||
| Other intangibles, net |
2,013,365 | 1,734,021 | ||||||
| Investments and other assets |
239,129 | 146,283 | ||||||
|
|
|
|
|
|||||
| Total assets |
$ | 7,796,064 | $ | 7,100,674 | ||||
|
|
|
|
|
|||||
| LIABILITIES AND STOCKHOLDERS’ EQUITY |
||||||||
| Current liabilities: |
||||||||
| Short-term borrowings and current portion of long-term debt, net |
$ | 308,123 | $ | 278,921 | ||||
| Accounts payable |
437,329 | 369,537 | ||||||
| Income taxes payable |
34,660 | 29,913 | ||||||
| Accrued liabilities |
358,551 | 246,070 | ||||||
|
|
|
|
|
|||||
| Total current liabilities |
1,138,663 | 924,441 | ||||||
| Long-term debt, net |
1,866,166 | 2,062,644 | ||||||
| Deferred income taxes |
512,526 | 621,776 | ||||||
| Other long-term liabilities |
251,076 | 235,300 | ||||||
|
|
|
|
|
|||||
| Total liabilities |
3,768,431 | 3,844,161 | ||||||
|
|
|
|
|
|||||
| Stockholders’ equity: |
||||||||
| Preferred stock, $0.01 par value; authorized 5,000,000 shares; none issued |
— | — | ||||||
| Common stock, $0.01 par value; authorized 800,000,000 shares; |
2,631 | 2,615 | ||||||
| Capital in excess of par value |
660,894 | 604,143 | ||||||
| Retained earnings |
5,002,419 | 4,403,683 | ||||||
| Accumulated other comprehensive loss |
(429,176 | ) | (542,389 | ) | ||||
| Treasury stock: 2017 – 31,754,106 shares; 2016 – 32,053,227 shares |
(1,209,135 | ) | (1,211,539 | ) | ||||
|
|
|
|
|
|||||
| Total stockholders’ equity |
4,027,633 | 3,256,513 | ||||||
|
|
|
|
|
|||||
| Total liabilities and stockholders’ equity |
$ | 7,796,064 | $ | 7,100,674 | ||||
|
|
|
|
|
|||||
See accompanying notes.
53
Table of Contents
Consolidated Statement of Stockholders’ Equity
(In thousands)
| Year Ended December 31, | ||||||||||||
| 2017 | 2016 | 2015 | ||||||||||
| Capital stock |
||||||||||||
| Preferred stock, $0.01 par value |
$ | — | $ | — | $ | — | ||||||
|
|
|
|
|
|
|
|||||||
| Common stock, $0.01 par value |
||||||||||||
| Balance at the beginning of the year |
2,615 | 2,608 | 2,589 | |||||||||
| Shares issued |
16 | 7 | 19 | |||||||||
|
|
|
|
|
|
|
|||||||
| Balance at the end of the year |
2,631 | 2,615 | 2,608 | |||||||||
|
|
|
|
|
|
|
|||||||
| Capital in excess of par value |
||||||||||||
| Balance at the beginning of the year |
604,143 | 568,286 | 491,750 | |||||||||
| Issuance of common stock under employee stock plans |
31,660 | 8,484 | 32,296 | |||||||||
| Share-based compensation costs |
25,091 | 22,030 | 23,762 | |||||||||
| Excess tax benefits from exercise of stock options |
— | 5,343 | 20,478 | |||||||||
|
|
|
|
|
|
|
|||||||
| Balance at the end of the year |
660,894 | 604,143 | 568,286 | |||||||||
|
|
|
|
|
|
|
|||||||
| Retained earnings |
||||||||||||
| Balance at the beginning of the year |
4,403,683 | 3,974,793 | 3,469,923 | |||||||||
| Net income |
681,470 | 512,158 | 590,859 | |||||||||
| Cash dividends paid |
(82,735 | ) | (83,267 | ) | (85,988 | ) | ||||||
| Other |
1 | (1 | ) | (1 | ) | |||||||
|
|
|
|
|
|
|
|||||||
| Balance at the end of the year |
5,002,419 | 4,403,683 | 3,974,793 | |||||||||
|
|
|
|
|
|
|
|||||||
| Accumulated other comprehensive (loss) income |
||||||||||||
| Foreign currency translation: |
||||||||||||
| Balance at the beginning of the year |
(338,324 | ) | (249,774 | ) | (124,920 | ) | ||||||
| Translation adjustments |
159,507 | (68,774 | ) | (67,245 | ) | |||||||
| Change in long-term intercompany notes |
36,320 | (7,597 | ) | (51,235 | ) | |||||||
| Net investment hedge instruments, net of tax of $41,178, $6,558 and $3,432 in 2017, 2016 and 2015, respectively |
(109,412 | ) | (12,179 | ) | (6,374 | ) | ||||||
|
|
|
|
|
|
|
|||||||
| Balance at the end of the year |
(251,909 | ) | (338,324 | ) | (249,774 | ) | ||||||
|
|
|
|
|
|
|
|||||||
| Defined benefit pension plans: |
||||||||||||
| Balance at the beginning of the year |
(203,758 | ) | (155,038 | ) | (141,982 | ) | ||||||
| Net actuarial gain (loss), net of tax of ($8,384), $17,450 and $12,870 in 2017, 2016 and 2015, respectively |
16,518 | (55,259 | ) | (21,002 | ) | |||||||
| Amortization of net actuarial loss, net of tax of ($4,680), ($2,090) and ($3,247) in 2017, 2016 and 2015, respectively |
9,910 | 6,618 | 6,137 | |||||||||
| Amortization of prior service costs, net of tax of $4, $25 and ($564) in 2017, 2016 and 2015, respectively |
(41 | ) | (79 | ) | 1,809 | |||||||
|
|
|
|
|
|
|
|||||||
| Balance at the end of the year |
(177,371 | ) | (203,758 | ) | (155,038 | ) | ||||||
|
|
|
|
|
|
|
|||||||
| Unrealized holding gain (loss) on available-for-sale securities: |
||||||||||||
| Balance at the beginning of the year |
(307 | ) | (819 | ) | 8 | |||||||
| Increase (decrease) during the year, net of tax |
411 | 512 | (827 | ) | ||||||||
|
|
|
|
|
|
|
|||||||
| Balance at the end of the year |
104 | (307 | ) | (819 | ) | |||||||
|
|
|
|
|
|
|
|||||||
| Accumulated other comprehensive loss at the end of the year |
(429,176 | ) | (542,389 | ) | (405,631 | ) | ||||||
|
|
|
|
|
|
|
|||||||
| Treasury stock |
||||||||||||
| Balance at the beginning of the year |
(1,211,539 | ) | (885,430 | ) | (457,807 | ) | ||||||
| Issuance of common stock under employee stock plans |
9,271 | 10,031 | 7,777 | |||||||||
| Purchase of treasury stock |
(6,867 | ) | (336,140 | ) | (435,400 | ) | ||||||
|
|
|
|
|
|
|
|||||||
| Balance at the end of the year |
(1,209,135 | ) | (1,211,539 | ) | (885,430 | ) | ||||||
|
|
|
|
|
|
|
|||||||
| Total stockholders’ equity |
$ | 4,027,633 | $ | 3,256,513 | $ | 3,254,626 | ||||||
|
|
|
|
|
|
|
|||||||
See accompanying notes.
54
Table of Contents
Consolidated Statement of Cash Flows
(In thousands)
| Year Ended December 31, | ||||||||||||
| 2017 | 2016 | 2015 | ||||||||||
| Cash provided by (used for): |
||||||||||||
| Operating activities: |
||||||||||||
| Net income |
$ | 681,470 | $ | 512,158 | $ | 590,859 | ||||||
| Adjustments to reconcile net income to total operating activities: |
||||||||||||
| Depreciation and amortization |
183,227 | 179,716 | 149,460 | |||||||||
| Deferred income taxes |
(91,205 | ) | (5,632 | ) | 6,458 | |||||||
| Share-based compensation expense |
25,091 | 22,030 | 23,762 | |||||||||
| Gain on sale of facilities |
(1,213 | ) | (743 | ) | — | |||||||
| Changes in assets and liabilities, net of acquisitions: |
||||||||||||
| (Increase) decrease in receivables |
(24,581 | ) | 14,773 | (6,995 | ) | |||||||
| (Increase) decrease in inventories and other current assets |
(6,087 | ) | 38,666 | (12,007 | ) | |||||||
| Increase (decrease) in payables, accruals and income taxes |
124,399 | 2,657 | (20,049 | ) | ||||||||
| Increase (decrease) in other long-term liabilities |
2,787 | (4,298 | ) | 255 | ||||||||
| Pension contribution |
(54,796 | ) | (6,775 | ) | (55,215 | ) | ||||||
| Other, net |
(5,833 | ) | 4,283 | (3,988 | ) | |||||||
|
|
|
|
|
|
|
|||||||
| Total operating activities |
833,259 | 756,835 | 672,540 | |||||||||
|
|
|
|
|
|
|
|||||||
| Investing activities: |
||||||||||||
| Additions to property, plant and equipment |
(75,074 | ) | (63,280 | ) | (69,083 | ) | ||||||
| Purchases of businesses, net of cash acquired |
(556,634 | ) | (391,419 | ) | (356,466 | ) | ||||||
| Proceeds from sale of facilities |
6,290 | 1,832 | 421 | |||||||||
| Other, net |
(399 | ) | 500 | (429 | ) | |||||||
|
|
|
|
|
|
|
|||||||
| Total investing activities |
(625,817 | ) | (452,367 | ) | (425,557 | ) | ||||||
|
|
|
|
|
|
|
|||||||
| Financing activities: |
||||||||||||
| Net change in short-term borrowings |
(9,616 | ) | (315,674 | ) | 226,761 | |||||||
| Proceeds from long-term borrowings |
— | 820,900 | 200,000 | |||||||||
| Repayments of long-term borrowings |
(270,000 | ) | (48,724 | ) | (182,007 | ) | ||||||
| Repurchases of common stock |
(6,867 | ) | (336,140 | ) | (435,400 | ) | ||||||
| Cash dividends paid |
(82,735 | ) | (83,267 | ) | (85,988 | ) | ||||||
| Excess tax benefits from share-based payments |
— | 5,343 | 20,478 | |||||||||
| Proceeds from employee stock plans and other, net |
40,047 | 14,616 | 39,192 | |||||||||
|
|
|
|
|
|
|
|||||||
| Total financing activities |
(329,171 | ) | 57,054 | (216,964 | ) | |||||||
|
|
|
|
|
|
|
|||||||
| Effect of exchange rate changes on cash and cash equivalents |
50,770 | (25,268 | ) | (26,629 | ) | |||||||
|
|
|
|
|
|
|
|||||||
| (Decrease) increase in cash and cash equivalents |
(70,959 | ) | 336,254 | 3,390 | ||||||||
| Cash and cash equivalents: |
||||||||||||
| Beginning of year |
717,259 | 381,005 | 377,615 | |||||||||
|
|
|
|
|
|
|
|||||||
| End of year |
$ | 646,300 | $ | 717,259 | $ | 381,005 | ||||||
|
|
|
|
|
|
|
|||||||
See accompanying notes.
55
Table of Contents
NOTES TO CONSOLIDATED FINANCIAL STATEMENTS
| 1. | Significant Accounting Policies |
Basis of Consolidation
The accompanying consolidated financial statements reflect the results of operations, financial position and cash flows of AMETEK, Inc. (the “Company”), and include the accounts of the Company and subsidiaries, after elimination of all intercompany transactions in the consolidation.
Use of Estimates
The preparation of financial statements in conformity with U.S. generally accepted accounting principles (“GAAP”) requires management to make estimates and assumptions that affect amounts reported in the financial statements and accompanying notes. Actual results could differ from those estimates and assumptions.
Cash Equivalents, Securities and Other Investments
All highly liquid investments with maturities of three months or less when purchased are considered cash equivalents. At December 31, 2017 and 2016, the Company’s investment in a fixed-income mutual fund (held by its captive insurance subsidiary) is classified as “available-for-sale.” The aggregate fair value of the fixed-income mutual fund at December 31, 2017 and 2016 was $8.1 million ($8.2 million cost basis) and $7.3 million ($8.0 million cost basis), respectively. The temporary unrealized gain or loss on the fixed-income mutual fund is recorded as a separate component of accumulated other comprehensive income (in stockholders’ equity), and is not significant. Certain of the Company’s other investments, which are not significant, are also accounted for by the equity method of accounting.
Accounts Receivable
The Company maintains allowances for estimated losses resulting from the inability of specific customers to meet their financial obligations to the Company. A specific allowance for doubtful accounts is recorded against the amount due from these customers. For all other customers, the Company recognizes allowance for doubtful accounts based on the length of time specific receivables are past due based on its historical experience. The allowance for doubtful accounts was $10.4 million and $10.3 million at December 31, 2017 and 2016, respectively. See Note 7.
Inventories
The Company uses the first-in, first-out (“FIFO”) method of accounting, which approximates current replacement cost, for approximately 84% of its inventories at December 31, 2017. The last-in, first-out (“LIFO”) method of accounting is used to determine cost for the remaining 16% of the Company’s inventory at December 31, 2017. For inventories where cost is determined by the LIFO method, the FIFO value would have been $22.9 million and $18.4 million higher than the LIFO value reported in the consolidated balance sheet at December 31, 2017 and 2016, respectively. The Company provides estimated inventory reserves for slow-moving and obsolete inventory based on current assessments about future demand, market conditions, customers who may be experiencing financial difficulties and related management initiatives. See Note 7.
Business Combinations
The Company allocates the purchase price of an acquired company, including when applicable, the acquisition date fair value of contingent consideration between tangible and intangible assets acquired and
56
Table of Contents
AMETEK, Inc.
NOTES TO CONSOLIDATED FINANCIAL STATEMENTS — (Continued)
liabilities assumed from the acquired business based on their estimated fair values, with the residual of the purchase price recorded as goodwill. The results of operations of the acquired business are included in the Company’s operating results from the date of acquisition. See Note 5.
Property, Plant and Equipment
Property, plant and equipment are stated at cost. Expenditures for additions to plant facilities, or that extend their useful lives, are capitalized. The cost of minor tools, jigs and dies, and maintenance and repairs is charged to expense as incurred. Depreciation of plant and equipment is calculated principally on a straight-line basis over the estimated useful lives of the related assets. The range of lives for depreciable assets is generally three to ten years for machinery and equipment, five to 27 years for leasehold improvements and 25 to 50 years for buildings. Depreciation expense was $82.0 million, $74.8 million and $68.7 million for the years ended December 31, 2017, 2016 and 2015, respectively. See Note 7.
Goodwill and Other Intangible Assets
Goodwill and other intangible assets with indefinite lives, primarily trademarks and trade names, are not amortized; rather, they are tested for impairment at least annually.
The Company identifies its reporting units at the component level, which is one level below its operating segments. Generally, goodwill arises from acquisitions of specific operating companies and is assigned to the reporting unit in which a particular operating company resides. The Company’s reporting units are divisions that are one level below its operating segments and for which discrete financial information is prepared and regularly reviewed by segment management.
The Company principally relies on a discounted cash flow analysis to determine the fair value of each reporting unit, which considers forecasted cash flows discounted at an appropriate discount rate. The Company believes that market participants would use a discounted cash flow analysis to determine the fair value of its reporting units in a sale transaction. The annual goodwill impairment test requires the Company to make a number of assumptions and estimates concerning future levels of revenue growth, operating margins, depreciation, amortization and working capital requirements, which are based on the Company’s long-range plan and are considered level 3 inputs. The Company’s long-range plan is updated as part of its annual planning process and is reviewed and approved by management. The discount rate is an estimate of the overall after-tax rate of return required by a market participant whose weighted average cost of capital includes both equity and debt, including a risk premium. While the Company uses the best available information to prepare its cash flow and discount rate assumptions, actual future cash flows or market conditions could differ significantly resulting in future impairment charges related to recorded goodwill balances.
The impairment test for indefinite-lived intangibles other than goodwill (primarily trademarks and trade names) consists of a comparison of the fair value of the indefinite-lived intangible asset to the carrying value of the asset as of the impairment testing date. The Company estimates the fair value of its indefinite-lived intangibles using the relief from royalty method using level 3 inputs. The fair value derived from the relief from royalty method is measured as the discounted cash flow savings realized from owning such trademarks and trade names and not having to pay a royalty for their use.
The Company completed its required annual impairment tests in the fourth quarter of 2017, 2016 and 2015 and determined that the carrying values of the Company’s goodwill were not impaired. The Company completed its required annual impairment tests in the fourth quarter of 2017 and 2015 and determined that the carrying values of the Company’s other intangible assets with indefinite lives were not impaired. The Company completed
57
Table of Contents
AMETEK, Inc.
NOTES TO CONSOLIDATED FINANCIAL STATEMENTS — (Continued)
its required annual impairment tests in the fourth quarter of 2016 and determined that the carrying values of certain of the Company’s trademarks and trade names with indefinite lives were impaired. During 2016, the Company recorded a $13.9 million non-cash impairment charge related to certain of the Company’s trade names.
Other intangible assets with finite lives are evaluated for impairment when events or changes in circumstances indicate the carrying value may not be recoverable. The carrying value of other intangible assets with finite lives is considered impaired when the total projected undiscounted cash flows from those assets are separately identifiable and are less than the carrying value. In that event, a loss is recognized based on the amount by which the carrying value exceeds the fair value of those assets. Fair value is determined primarily using present value techniques based on projected cash flows from the asset group.
Intangible assets, other than goodwill, with definite lives are amortized over their estimated useful lives. Patents and technology are being amortized over useful lives of five to 20 years, with a weighted average life of 16 years. Customer relationships are being amortized over a period of five to 20 years, with a weighted average life of 19 years. Miscellaneous other intangible assets are being amortized over a period of two to 20 years. On a quarterly basis, the Company evaluates the reasonableness of the estimated useful lives of these intangible assets. See Note 6.
Financial Instruments and Foreign Currency Translation
Assets and liabilities of foreign operations are translated using exchange rates in effect at the balance sheet date and their results of operations are translated using average exchange rates for the year. Certain transactions of the Company and its subsidiaries are denominated in currencies other than their functional currency. Exchange gains and losses from those transactions are included in operating results for the year.
The Company makes infrequent use of derivative financial instruments. Forward contracts are entered into from time to time to hedge specific firm commitments for certain inventory purchases, export sales, debt or foreign currency transactions, thereby minimizing the Company’s exposure to raw material commodity price or foreign currency fluctuation.
In instances where transactions are designated as hedges of an underlying item, the gains and losses on those transactions are included in accumulated other comprehensive income within stockholders’ equity to the extent they are effective as hedges. An evaluation of hedge effectiveness is performed by the Company on an ongoing basis and any changes in the hedge are made as appropriate. See Note 4.
Revenue Recognition
The Company recognizes revenue on product sales in the period when the sales process is complete. This generally occurs when products are shipped to the customer in accordance with terms of an agreement of sale, under which title and risk of loss have been transferred, collectability is reasonably assured and pricing is fixed or determinable. For a small percentage of sales where title and risk of loss passes at point of delivery, the Company recognizes revenue upon delivery to the customer, assuming all other criteria for revenue recognition are met. The Company’s policy, with respect to sales returns and allowances, generally provides that the customer may not return products or be given allowances, except at the Company’s option. The Company has agreements with distributors that do not provide expanded rights of return for unsold products. The distributor purchases the product from the Company, at which time title and risk of loss transfers to the distributor. The Company does not offer substantial sales incentives and credits to its distributors other than volume discounts. The Company accounts for these sales incentives as a reduction of revenues when the sale is recognized in the consolidated statement of income. Accruals for sales returns, other allowances and estimated warranty costs are
58
Table of Contents
AMETEK, Inc.
NOTES TO CONSOLIDATED FINANCIAL STATEMENTS — (Continued)
provided at the time revenue is recognized based on the Company’s historical experience. The warranty periods for products sold vary among the Company’s operations, but generally do not exceed one year. The Company calculates its warranty expense provision based on its historical warranty experience and adjustments are made periodically to reflect actual warranty expenses. See Note 12.
Research and Development
Research and development costs are included in Cost of sales as incurred and were $130.4 million in 2017, $112.0 million in 2016 and $116.3 million in 2015.
Shipping and Handling Costs
Shipping and handling costs are included in Cost of sales and were $53.1 million in 2017, $47.9 million in 2016 and $50.5 million in 2015.
Share-Based Compensation
The Company expenses the fair value of share-based awards made under its share-based plans in the consolidated financial statements over their requisite service period of the grants. See Note 10.
Income Taxes
The Company’s process of providing for income taxes and determining the related balance sheet accounts requires management to assess uncertainties, make judgments regarding outcomes and utilize estimates. The Company conducts a broad range of operations around the world and is therefore subject to complex tax regulations in numerous international taxing jurisdictions, resulting at times in tax audits, disputes and potential litigation, the outcome of which is uncertain. Management must make judgments currently about such uncertainties and determine estimates of the Company’s tax assets and liabilities. To the extent the final outcome differs, future adjustments to the Company’s tax assets and liabilities may be necessary. The Company recognizes interest and penalties accrued related to uncertain tax positions in income tax expense.
The Company assesses the realizability of its deferred tax assets, taking into consideration the Company’s forecast of future taxable income, available net operating loss carryforwards and available tax planning strategies that could be implemented to realize the deferred tax assets. Based on this assessment, management must evaluate the need for, and amount of, valuation allowances against the Company’s deferred tax assets. To the extent facts and circumstances change in the future, adjustments to the valuation allowances may be required. See Note 8.
Pensions
The Company has U.S. and foreign defined benefit and defined contribution pension plans. The most significant elements in determining the Company’s pension income or expense are the assumed pension liability discount rate and the expected return on plan assets. All unrecognized prior service costs, remaining transition obligations or assets and actuarial gains and losses have been recognized, net of tax effects, as a charge to accumulated other comprehensive income in stockholders’ equity and will be amortized as a component of net periodic pension cost. The Company uses a measurement date of December 31 (its fiscal year end) for its U.S. and foreign defined benefit plans. See Note 11.
59
Table of Contents
AMETEK, Inc.
NOTES TO CONSOLIDATED FINANCIAL STATEMENTS — (Continued)
Earnings Per Share
The calculation of basic earnings per share is based on the weighted average number of common shares considered outstanding during the periods. The calculation of diluted earnings per share reflects the effect of all potentially dilutive securities (principally outstanding stock options and restricted stock grants). The number of weighted average shares used in the calculation of basic earnings per share and diluted earnings per share was as follows for the years ended December 31:
| 2017 | 2016 | 2015 | ||||||||||
| (In thousands) | ||||||||||||
| Weighted average shares: |
||||||||||||
| Basic shares |
230,229 | 232,593 | 239,906 | |||||||||
| Equity-based compensation plans |
1,616 | 1,137 | 1,680 | |||||||||
|
|
|
|
|
|
|
|||||||
| Diluted shares |
231,845 | 233,730 | 241,586 | |||||||||
|
|
|
|
|
|
|
|||||||
| 2. | Recent Accounting Pronouncements |
In May 2014, the Financial Accounting Standards Board (“FASB”) issued Accounting Standards Update (“ASU”) No. 2014-09, Revenue from Contracts with Customers (“ASU 2014-09”) and modified the standard thereafter. The objective of ASU 2014-09 is to establish a single comprehensive model for entities to use in accounting for revenue arising from contracts with customers and will supersede most of the existing revenue recognition guidance. The core principle of ASU 2014-09 is that an entity recognizes revenue at the transfer of control of promised goods or services to customers in an amount that reflects the consideration to which the entity expects to be entitled in exchange for those goods or services. ASU 2014-09 applies to all contracts with customers except those that are within the scope of other topics in the FASB Accounting Standards Codification.
ASU 2014-09 is effective for interim and annual reporting periods beginning after December 15, 2017 and may be early adopted for interim and annual reporting periods beginning after December 15, 2016. The Company adopted ASU 2014-09 as of January 1, 2018. The guidance permits adoption by retrospectively applying the guidance to each prior reporting period presented (full retrospective method) or prospectively applying the guidance and providing additional disclosures comparing results to previous guidance, with the cumulative effect of initially applying the guidance recognized in beginning retained earnings at the date of initial application (modified retrospective method). The Company will use the modified retrospective method of adoption.
ASU 2014-09 will impact the Company’s revenue recognition procedures by requiring recognition of certain revenues to move from upon shipment or delivery to over-time. The recording of certain revenues over-time is not expected to have a material impact on the Company’s consolidated results of operations or financial position. Also, the Company has developed the additional expanded disclosures required. The Company has implemented the appropriate changes to its business processes to support recognition and disclosure under ASU 2014-09. The Company does not expect the adoption of ASU 2014-09 to have a material impact on its consolidated results of operations, financial position and cash flows.
In July 2015, the FASB issued ASU No. 2015-11, Simplifying the Measurement of Inventory (“ASU 2015-11”), which applies to inventory that is measured using FIFO or average cost. As prescribed in this update, an entity should measure inventory that is within scope at the lower of cost and net realizable value, which is the estimated selling prices in the ordinary course of business, less reasonably predictable costs of completion, disposal and transportation. Subsequent measurement is unchanged for inventory that is measured using LIFO. The Company prospectively adopted ASU 2015-11 effective January 1, 2017 and the adoption did
60
Table of Contents
AMETEK, Inc.
NOTES TO CONSOLIDATED FINANCIAL STATEMENTS — (Continued)
not have a significant impact on the Company’s consolidated results of operations, financial position or cash flows.
In November 2015, the FASB issued ASU No. 2015-17, Balance Sheet Classification of Deferred Taxes (“ASU 2015-17”). ASU 2015-17 simplifies the presentation of deferred taxes by requiring deferred tax assets and liabilities be classified as noncurrent on the consolidated balance sheet. The Company prospectively adopted ASU 2015-17 effective January 1, 2017. Therefore, prior periods have not been adjusted to reflect this adoption. The adoption of ASU 2015-17 did not have a significant impact on the Company’s consolidated results of operations, financial position or cash flows.
In February 2016, the FASB issued ASU No. 2016-02, Leases (“ASU 2016-02”). The new standard establishes a right-of-use model that requires a lessee to record a right-of-use asset and a lease liability on the balance sheet for all leases with terms longer than twelve months. Leases will be classified as either finance or operating, with classification affecting the pattern of expense recognition in the income statement. ASU 2016-02 is effective for interim and annual reporting periods beginning after December 15, 2018 and early adoption is permitted. ASU 2016-02 includes transitional guidance, as currently issued, that calls for a modified retrospective approach. The FASB has recently proposed adding a transition option to the current guidance and it includes optional practical expedients for ease of transition. The Company has formed a steering committee to lead the Company’s implementation project. The Company has not determined the impact ASU 2016-02 may have on the Company’s consolidated results of operations, financial position, cash flows and financial statement disclosures, which could be significant to the Company’s financial position.
In March 2016, the FASB issued ASU No. 2016-09, Improvements to Employee Share-Based Payment Accounting (“ASU 2016-09”). ASU 2016-09 includes changes to the accounting for share-based payment transactions, including the income tax consequences, classification of awards as either equity or liabilities and classification on the statement of cash flows. The Company prospectively adopted ASU 2016-09 effective January 1, 2017. For the year ended December 31, 2017, the Company recorded a tax benefit of $12.3 million within Provision for income taxes related to the tax effects of share-based payment transactions. Prior to adoption, this amount would have been recorded as a component of Capital in excess of par value. The adoption of this standard could create volatility in the Company’s effective tax rate going forward. The Company elected not to change its accounting policy with respect to the estimation of forfeitures. The Company no longer reclassifies the excess tax benefits from share-based payments from operating activities to financing activities in the consolidated statement of cash flows. For the year ended December 31, 2017, the Company excluded the excess tax benefits from the assumed proceeds available to repurchase shares in the computation of its diluted earnings per share and the related increase in the Company’s diluted weighted average common shares outstanding was not significant.
In January 2017, the FASB issued ASU No. 2017-01, Clarifying the Definition of a Business (“ASU 2017-01”). ASU 2017-01 provides a more robust framework to use in determining when a set of assets and activities is a business. ASU 2017-01 requires an entity to evaluate if substantially all of the fair value of the gross assets acquired is concentrated in a single identifiable asset or a group of similar identifiable assets; if so, the set of assets is not a business. ASU 2017-01 requires that, to be a business, the set must include, at a minimum, an input and a substantive process that together significantly contribute to the ability to create outputs. ASU 2017-01 is effective for interim and annual reporting periods beginning after December 15, 2017. ASU 2017-01 will be applied prospectively to any transactions occurring within the period of adoption. Early adoption is permitted, including for interim or annual periods in which the financial statements have not been issued or made available for issuance. The Company does not expect the adoption of ASU 2017-01 to have a significant impact on the Company’s consolidated results of operations, financial position, cash flows and financial statement disclosures.
61
Table of Contents
AMETEK, Inc.
NOTES TO CONSOLIDATED FINANCIAL STATEMENTS — (Continued)
In January 2017, the FASB issued ASU No. 2017-04, Simplifying the Test for Goodwill Impairment (“ASU 2017-04”). ASU 2017-04 eliminates the requirement to calculate the reporting unit fair value of goodwill (second step) to measure a goodwill impairment charge. Under the guidance, an impairment charge will be measured based on the excess of the reporting unit’s carrying amount over its fair value (first step). ASU 2017-04 is effective for interim and annual reporting periods beginning after December 15, 2019 and early adoption is permitted. The Company early adopted ASU 2017-04 effective January 1, 2017 and the adoption did not have a significant impact on the Company’s consolidated results of operations, financial position, cash flows and financial statement disclosures.
In March 2017, the FASB issued ASU No. 2017-07, Improving the Presentation of Net Periodic Pension Cost and Net Periodic Postretirement Benefit Cost (“ASU 2017-07”), which changes how employers that sponsor defined benefit pension and/or other postretirement benefit plans present the net periodic benefit cost in the income statement. ASU 2017-07 requires employers to present the service cost component of net periodic benefit cost in the same income statement line item as other employee compensation costs. All other components of the net periodic benefit cost will be presented outside of operating income. ASU 2017-07 is effective for interim and annual reporting periods beginning after December 15, 2017. The changes in presentation will be applied retrospectively when adopted. The Company expects restated 2017 Cost of sales to increase $11.5 million with an offsetting $11.5 million increase to Other operating income. The 2018 service cost included in operating income is expected to approximate 2017 service cost of $7.1 million. The Company does not expect the adoption of ASU 2017-07 to have a significant impact on the Company’s consolidated financial position, cash flows and financial statement disclosures.
In May 2017, the FASB issued ASU No. 2017-09, Scope of Modification Accounting (“ASU 2017-09”). ASU 2017-09 clarifies which changes to the terms or conditions of a share-based payment award require an entity to apply modification accounting. ASU 2017-09 is effective for interim and annual reporting periods beginning after December 15, 2017 and early adoption is permitted. The Company does not expect the adoption of ASU 2017-09 to have a significant impact on the Company’s consolidated results of operations, financial position or cash flows.
| 3. | Fair Value Measurements |
Fair value is defined as the exchange price that would be received for an asset or paid to transfer a liability (an exit price) in the principal or most advantageous market for the asset or liability in an orderly transaction between market participants on the measurement date. See Note 5 for discussion of acquisition date fair value of contingent payment liability.
The Company utilizes a valuation hierarchy for disclosure of the inputs to the valuations used to measure fair value. This hierarchy prioritizes the inputs into three broad levels as follows. Level 1 inputs are quoted prices (unadjusted) in active markets for identical assets or liabilities. Level 2 inputs are quoted prices for similar assets and liabilities in active markets or inputs that are observable for the asset or liability, either directly or indirectly through market corroboration, for substantially the full term of the financial instrument. Level 3 inputs are unobservable inputs based on the Company’s own assumptions used to measure assets and liabilities at fair value. A financial asset or liability’s classification within the hierarchy is determined based on the lowest level input that is significant to the fair value measurement.
62
Table of Contents
AMETEK, Inc.
NOTES TO CONSOLIDATED FINANCIAL STATEMENTS — (Continued)
The following table provides the Company’s assets that are measured at fair value on a recurring basis, consistent with the fair value hierarchy, at December 31:
| 2017 | 2016 | |||||||
| Fair Value | Fair Value | |||||||
| (In thousands) | ||||||||
| Fixed-income investments |
$ | 8,060 | $ | 7,317 | ||||
The fair value of fixed-income investments, which are valued as level 1 investments, was based on quoted market prices. The fixed-income investments are shown as a component of long-term assets on the consolidated balance sheet.
For the years ended December 31, 2017 and 2016, gains and losses on the investments noted above were not significant. No transfers between level 1 and level 2 investments occurred during the years ended December 31, 2017 and 2016.
Financial Instruments
Cash, cash equivalents and fixed-income investments are recorded at fair value at December 31, 2017 and 2016 in the accompanying consolidated balance sheet.
The following table provides the estimated fair values of the Company’s financial instrument liabilities, for which fair value is measured for disclosure purposes only, compared to the recorded amounts at December 31:
| 2017 | 2016 | |||||||||||||||
| Recorded Amount |
Fair Value | Recorded Amount |
Fair Value | |||||||||||||
| (In thousands) | ||||||||||||||||
| Long-term debt, net (including current portion) |
$ | (2,174,289 | ) | $ | (2,210,466 | ) | $ | (2,341,565 | ) | $ | (2,386,901 | ) | ||||
The fair value of short-term borrowings, net approximates the carrying value. Short-term borrowings, net are valued as level 2 liabilities as they are corroborated by observable market data. The Company’s long-term debt, net is all privately held with no public market for this debt, therefore, the fair value of long-term debt, net was computed based on comparable current market data for similar debt instruments and is considered to be a level 3 liability. See Note 9 for long-term debt principal amounts, interest rates and maturities.
Foreign Currency
At December 31, 2017, the Company had a Canadian dollar forward contract for a total notional value of 83.0 million Canadian dollars ($1.5 million fair value unrealized gain at December 31, 2017) outstanding. At December 31, 2016, the Company had no forward contracts outstanding. For the year ended December 31, 2017 and 2016, realized gains and losses on foreign currency forward contracts were not significant. The Company does not typically designate its foreign currency forward contracts as hedges.
| 4. | Hedging Activities |
The Company has designated certain foreign-currency-denominated long-term borrowings as hedges of the net investment in certain foreign operations. As of December 31, 2017 and 2016, these net investment hedges included British-pound- and Euro-denominated long-term debt. These borrowings were designed to create net investment hedges in each of the designated foreign subsidiaries. The Company designated the British-pound-
63
Table of Contents
AMETEK, Inc.
NOTES TO CONSOLIDATED FINANCIAL STATEMENTS — (Continued)
and Euro-denominated loans referred to above as hedging instruments to offset translation gains or losses on the net investment due to changes in the British pound and Euro exchange rates. These net investment hedges are evidenced by management’s contemporaneous documentation supporting the hedge designation. Any gain or loss on the hedging instruments (the debt) following hedge designation is reported in accumulated other comprehensive income in the same manner as the translation adjustment on the hedged investment based on changes in the spot rate, which is used to measure hedge effectiveness.
At December 31, 2017 and 2016, the Company had $412.4 million and $376.3 million, respectively, of British-pound-denominated loans, which were designated as a hedge against the net investment in British pound functional currency foreign subsidiaries. At December 31, 2017 and 2016, the Company had $601.0 million and $527.7 million, respectively, in Euro-denominated loans, which were designated as a hedge against the net investment in Euro functional currency foreign subsidiaries. As a result of the British-pound- and Euro-denominated loans being designated and 100% effective as net investment hedges, $109.4 million of pre-tax currency remeasurement losses and $50.0 million of pre-tax currency remeasurement gains have been included in the foreign currency translation component of other comprehensive income for the years ended December 31, 2017 and 2016, respectively.
| 5. | Acquisitions |
The Company spent $556.6 million in cash, net of cash acquired, to acquire Rauland-Borg Corporation (“Rauland”) in February 2017, MOCON, Inc. in June 2017 and Arizona Instrument LLC in December 2017. The Rauland acquisition includes a potential $30 million contingent payment due upon the achievement of certain milestones as described further below. Rauland is a global provider of enterprise clinical and education communications solutions for hospitals, healthcare systems and educational facilities. MOCON is a provider of laboratory and field gas analysis instrumentation to research laboratories, production facilities and quality control departments in food and beverage, pharmaceutical and industrial applications. Arizona Instrument is a provider of differentiated, high-precision moisture and gas measurement instruments in food, pharmaceutical and environmental markets. Rauland, MOCON and Arizona Instrument are part of AMETEK’s Electronic Instruments Group (“EIG”).
The following table represents the preliminary allocation of the aggregate purchase price for the net assets of the 2017 acquisitions based on their estimated fair values at acquisition (in millions):
| Property, plant and equipment |
$ | 19.1 | ||
| Goodwill |
225.6 | |||
| Other intangible assets |
340.7 | |||
| Long-term liabilities |
(10.9 | ) | ||
| Deferred income taxes |
(35.1 | ) | ||
| Net working capital and other(1) |
42.7 | |||
|
|
|
|||
| Total purchase price |
582.1 | |||
| Less: Acquisition date fair value of contingent payment liability |
(25.5 | ) | ||
|
|
|
|||
| Total cash paid |
$ | 556.6 | ||
|
|
|
| (1) | Includes $31.7 million in accounts receivable, whose fair value, contractual cash flows and expected cash flows are approximately equal. |
The amount allocated to goodwill is reflective of the benefits the Company expects to realize from the 2017 acquisitions as follows: Rauland provides the Company with attractive new growth opportunities within the
64
Table of Contents
AMETEK, Inc.
NOTES TO CONSOLIDATED FINANCIAL STATEMENTS — (Continued)
medical technology market, strong growth opportunities in its core markets and incremental growth opportunities through acquisitions and international expansion. MOCON’s products and technologies complement the Company’s existing gas analysis instrumentation business and provides it with opportunities to expand into the growing food and pharmaceutical package testing market. Arizona Instrument complements the Company’s existing Brookfield Engineering Laboratories (“Brookfield”) viscosity measurement business and provides it with opportunities to further grow its presence in the food, pharmaceutical and environmental markets. The Company expects approximately $89.2 million of the goodwill recorded relating to the 2017 acquisitions will be tax deductible in future years.
At December 31, 2017, the purchase price allocated to other intangible assets of $340.7 million consists of $72.9 million of indefinite-lived intangible trade names, which are not subject to amortization. The remaining $267.8 million of other intangible assets consists of 229.4 million customer relationships, which are being amortized over a period of 18 to 20 years, $0.8 million of trade names, which are being amortized over a period of 18 years and $37.6 million of purchased technology, which is being amortized over a period of ten to 18 years. Amortization expense for each of the next five years for the 2017 acquisitions is expected to approximate $15 million per year.
The Company is in the process of finalizing the measurement of certain tangible and intangible assets and liabilities for its December 2017 acquisition of Arizona Instrument, including inventory, goodwill and the accounting for income taxes. The Company is in the process of finalizing the accounting for income taxes for its June 2017 acquisition of MOCON.
The above mentioned contingent payment is based on Rauland achieving a certain cumulative revenue target over the period October 1, 2016 to September 30, 2018. If Rauland achieves the target, the $30 million contingent payment will be made; however, if the target is not achieved, no payment will be made. At the acquisition date, the estimated fair value of the contingent payment liability was $25.5 million, which was based on a probabilistic approach using level 3 inputs. At December 31, 2017, there was no change to the estimated fair value of the contingent payment liability.
The 2017 acquisitions had an immaterial impact on reported net sales, net income and diluted earnings per share for the year ended December 31, 2017. Had the 2017 acquisitions been made at the beginning of 2017 or 2016, unaudited pro forma net sales, net income and diluted earnings per share for the years ended December 31, 2017 and 2016, respectively, would not have been materially different than the amounts reported.
In 2016, the Company spent $391.4 million in cash, net of cash acquired, to acquire Brookfield and ESP/SurgeX in January 2016, HS Foils and Nu Instruments in July 2016 and Laserage Technology Corporation (“Laserage”) in October 2016. Brookfield is a manufacturer of viscometers and rheometers, as well as instrumentation to analyze texture and powder flow. ESP/SurgeX is a manufacturer of energy intelligence and power protection, monitoring and diagnostic solutions. HS Foils develops and manufactures key components used in radiation detectors including ultra-thin radiation windows, silicon drift detectors and x-ray filters. Nu Instruments is a provider of magnetic sector mass spectrometers used for elemental and isotope analysis. Laserage is a provider of laser fabrication services for the medical device market. Brookfield, ESP/SurgeX, HS Foils and Nu Instruments are part of EIG and Laserage is part of AMETEK’s Electromechanical Group (“EMG”).
In 2015, the Company spent $356.5 million in cash, net of cash acquired, to acquire Global Tubes in May 2015 and Surface Vision in July 2015. Global Tubes is a manufacturer of high-precision, small-diameter metal tubing. Surface Vision develops and manufactures software-enabled vision systems used to inspect surfaces of continuously processed materials for flaws and defects. Global Tubes is part of EMG and Surface Vision is part of EIG.
65
Table of Contents
AMETEK, Inc.
NOTES TO CONSOLIDATED FINANCIAL STATEMENTS — (Continued)
Acquisitions Subsequent to December 31, 2017
In January 2018, the Company acquired FMH Aerospace (“FMH”) for approximately $235 million in cash. FMH has estimated annual sales of approximately $50 million. FMH is a provider of complex, highly-engineered solutions for the aerospace, defense and space industries. FMH will join EMG.
| 6. | Goodwill and Other Intangible Assets |
The changes in the carrying amounts of goodwill by segment were as follows:
| EIG | EMG | Total | ||||||||||
| (In millions) | ||||||||||||
| Balance at December 31, 2015 |
$ | 1,678.2 | $ | 1,028.4 | $ | 2,706.6 | ||||||
| Goodwill acquired |
165.0 | 6.3 | 171.3 | |||||||||
| Purchase price allocation adjustments and other |
0.3 | (0.1 | ) | 0.2 | ||||||||
| Foreign currency translation adjustments |
(26.5 | ) | (32.6 | ) | (59.1 | ) | ||||||
|
|
|
|
|
|
|
|||||||
| Balance at December 31, 2016 |
1,817.0 | 1,002.0 | 2,819.0 | |||||||||
| Goodwill acquired |
225.6 | — | 225.6 | |||||||||
| Purchase price allocation adjustments and other |
0.5 | 0.6 | 1.1 | |||||||||
| Foreign currency translation adjustments |
33.9 | 36.0 | 69.9 | |||||||||
|
|
|
|
|
|
|
|||||||
| Balance at December 31, 2017 |
$ | 2,077.0 | $ | 1,038.6 | $ | 3,115.6 | ||||||
|
|
|
|
|
|
|
|||||||
Other intangible assets were as follows at December 31:
| 2017 | 2016 | |||||||
| (In thousands) | ||||||||
| Definite-lived intangible assets (subject to amortization): |
||||||||
| Patents |
$ | 52,548 | $ | 49,755 | ||||
| Purchased technology |
328,301 | 283,612 | ||||||
| Customer lists |
1,621,652 | 1,363,700 | ||||||
|
|
|
|
|
|||||
| 2,002,501 | 1,697,067 | |||||||
|
|
|
|
|
|||||
| Accumulated amortization: |
||||||||
| Patents |
(36,998 | ) | (34,927 | ) | ||||
| Purchased technology |
(110,298 | ) | (87,869 | ) | ||||
| Customer lists |
(450,814 | ) | (362,924 | ) | ||||
|
|
|
|
|
|||||
| (598,110 | ) | (485,720 | ) | |||||
|
|
|
|
|
|||||
| Net intangible assets subject to amortization |
1,404,391 | 1,211,347 | ||||||
|
|
|
|
|
|||||
| Indefinite-lived intangible assets (not subject to amortization): |
||||||||
| Trademarks and trade names |
608,974 | 536,574 | ||||||
| Impairment |
— | (13,900 | ) | |||||
|
|
|
|
|
|||||
| 608,974 | 522,674 | |||||||
|
|
|
|
|
|||||
| $ | 2,013,365 | $ | 1,734,021 | |||||
|
|
|
|
|
|||||
66
Table of Contents
AMETEK, Inc.
NOTES TO CONSOLIDATED FINANCIAL STATEMENTS — (Continued)
In the fourth quarter of 2016, the Company completed its required annual impairment tests and determined that the carrying values of certain of the Company’s trademarks and trade names with indefinite lives were impaired. During 2016, the Company recorded, in Cost of sales, a $13.9 million non-cash impairment charge related to certain of the Company’s trade names, of which $9.2 million impacted EIG and $4.7 million impacted EMG. See Note 1 for further descriptions of the Company’s impairment testing.
Amortization expense was $101.2 million, $104.9 million (including impairment of $13.9 million) and $80.8 million for the years ended December 31, 2017, 2016 and 2015, respectively. Amortization expense for each of the next five years is expected to approximate $105 million per year, not considering the impact of potential future acquisitions.
| 7. | Other Consolidated Balance Sheet Information |
| December 31, | ||||||||
| 2017 | 2016 | |||||||
| (In thousands) | ||||||||
| INVENTORIES, NET |
||||||||
| Finished goods and parts |
$ | 84,789 | $ | 75,827 | ||||
| Work in process |
107,362 | 101,484 | ||||||
| Raw materials and purchased parts |
348,353 | 314,793 | ||||||
|
|
|
|
|
|||||
| $ | 540,504 | $ | 492,104 | |||||
|
|
|
|
|
|||||
| PROPERTY, PLANT AND EQUIPMENT, NET |
||||||||
| Land |
$ | 42,851 | $ | 41,875 | ||||
| Buildings |
295,023 | 281,847 | ||||||
| Machinery and equipment |
923,394 | 840,725 | ||||||
|
|
|
|
|
|||||
| 1,261,268 | 1,164,447 | |||||||
| Less: Accumulated depreciation |
(767,972 | ) | (691,217 | ) | ||||
|
|
|
|
|
|||||
| $ | 493,296 | $ | 473,230 | |||||
|
|
|
|
|
|||||
| ACCRUED LIABILITIES |
||||||||
| Employee compensation and benefits |
$ | 151,435 | $ | 93,226 | ||||
| Product warranty obligation |
22,872 | 22,007 | ||||||
| Restructuring |
30,046 | 29,951 | ||||||
| Contingent purchase price |
25,500 | — | ||||||
| Other |
128,698 | 100,886 | ||||||
|
|
|
|
|
|||||
| $ | 358,551 | $ | 246,070 | |||||
|
|
|
|
|
|||||
| 2017 | 2016 | 2015 | ||||||||||
| (In thousands) | ||||||||||||
| ALLOWANCES FOR POSSIBLE LOSSES ON ACCOUNTS |
||||||||||||
| Balance at the beginning of the year |
$ | 10,257 | $ | 8,555 | $ | 10,446 | ||||||
| Additions charged to expense |
2,800 | 4,124 | 630 | |||||||||
| Write-offs |
(3,208 | ) | (2,304 | ) | (1,872 | ) | ||||||
| Foreign currency translation adjustments and other |
552 | (118 | ) | (649 | ) | |||||||
|
|
|
|
|
|
|
|||||||
| Balance at the end of the year |
$ | 10,401 | $ | 10,257 | $ | 8,555 | ||||||
|
|
|
|
|
|
|
|||||||
67
Table of Contents
AMETEK, Inc.
NOTES TO CONSOLIDATED FINANCIAL STATEMENTS — (Continued)
| 8. | Income Taxes |
The components of income before income taxes and the details of the provision for income taxes were as follows for the years ended December 31:
| 2017 | 2016 | 2015 | ||||||||||
| (In thousands) | ||||||||||||
| Income before income taxes: |
||||||||||||
| Domestic |
$ | 447,853 | $ | 397,215 | $ | 502,292 | ||||||
| Foreign |
348,876 | 295,888 | 304,088 | |||||||||
|
|
|
|
|
|
|
|||||||
| Total |
$ | 796,729 | $ | 693,103 | $ | 806,380 | ||||||
|
|
|
|
|
|
|
|||||||
| Provision for income taxes: |
||||||||||||
| Current: |
||||||||||||
| Federal |
$ | 127,874 | $ | 116,898 | $ | 130,996 | ||||||
| Foreign |
71,846 | 63,170 | 66,691 | |||||||||
| State |
6,744 | 6,509 | 11,376 | |||||||||
|
|
|
|
|
|
|
|||||||
| Total current |
206,464 | 186,577 | 209,063 | |||||||||
|
|
|
|
|
|
|
|||||||
| Deferred: |
||||||||||||
| Federal |
(97,465 | ) | 5,273 | 1,711 | ||||||||
| Foreign |
6,204 | (8,434 | ) | (3,611 | ) | |||||||
| State |
56 | (2,471 | ) | 8,358 | ||||||||
|
|
|
|
|
|
|
|||||||
| Total deferred |
(91,205 | ) | (5,632 | ) | 6,458 | |||||||
|
|
|
|
|
|
|
|||||||
| Total provision |
$ | 115,259 | $ | 180,945 | $ | 215,521 | ||||||
|
|
|
|
|
|
|
|||||||
68
Table of Contents
AMETEK, Inc.
NOTES TO CONSOLIDATED FINANCIAL STATEMENTS — (Continued)
Significant components of the deferred tax (asset) liability were as follows at December 31:
| 2017 | 2016 | |||||||
| (In thousands) | ||||||||
| Current deferred tax (asset) liability: |
||||||||
| Reserves not currently deductible |
$ | — | $ | (39,509 | ) | |||
| Share-based compensation |
— | (7,022 | ) | |||||
| Net operating loss carryforwards |
— | (2,072 | ) | |||||
| Other |
— | (1,041 | ) | |||||
|
|
|
|
|
|||||
| — | (49,644 | ) | ||||||
| Portion included in other current liabilities |
— | (360 | ) | |||||
|
|
|
|
|
|||||
| Gross current deferred tax asset |
— | (50,004 | ) | |||||
|
|
|
|
|
|||||
| Noncurrent deferred tax (asset) liability: |
||||||||
| Differences in basis of property and accelerated depreciation |
39,816 | 54,243 | ||||||
| Reserves not currently deductible |
(42,966 | ) | (28,808 | ) | ||||
| Pensions |
11,452 | 8,714 | ||||||
| Differences in basis of intangible assets and accelerated amortization |
455,690 | 603,577 | ||||||
| Net operating loss carryforwards |
(10,376 | ) | (8,399 | ) | ||||
| Share-based compensation |
(13,434 | ) | (13,707 | ) | ||||
| Foreign tax credit carryforwards |
— | (3,441 | ) | |||||
| Unremitted earnings |
84,356 | 4,481 | ||||||
| Other |
(23,176 | ) | (1,004 | ) | ||||
|
|
|
|
|
|||||
| 501,362 | 615,656 | |||||||
| Less: Valuation allowance |
3,100 | 2,046 | ||||||
|
|
|
|
|
|||||
| 504,462 | 617,702 | |||||||
| Portion included in noncurrent assets |
8,064 | 4,074 | ||||||
|
|
|
|
|
|||||
| Gross noncurrent deferred tax liability |
512,526 | 621,776 | ||||||
|
|
|
|
|
|||||
| Net deferred tax liability |
$ | 512,526 | $ | 571,772 | ||||
|
|
|
|
|
|||||
69
Table of Contents
AMETEK, Inc.
NOTES TO CONSOLIDATED FINANCIAL STATEMENTS — (Continued)
The Company’s effective tax rate reconciles to the U.S. Federal statutory rate as follows for the years ended December 31:
| 2017 | 2016 | 2015 | ||||||||||
| U.S. Federal statutory rate |
35.0 | % | 35.0 | % | 35.0 | % | ||||||
| State income taxes, net of federal income tax benefit |
0.4 | 0.4 | 1.2 | |||||||||
| Foreign operations, net |
(6.8 | ) | (7.1 | ) | (6.8 | ) | ||||||
| U.S. Manufacturing deduction and credits |
(2.2 | ) | (2.6 | ) | (2.4 | ) | ||||||
| Stock compensation |
(1.6 | ) | 0.2 | 0.1 | ||||||||
| Net deferred tax revaluation |
(23.3 | ) | — | — | ||||||||
| Deemed repatriation of foreign earnings |
11.8 | — | — | |||||||||
| Other |
1.2 | 0.2 | (0.4 | ) | ||||||||
|
|
|
|
|
|
|
|||||||
| Consolidated effective tax rate |
14.5 | % | 26.1 | % | 26.7 | % | ||||||
|
|
|
|
|
|
|
|||||||
On December 22, 2017, the U.S. enacted the Tax Cuts and Jobs Act (the “Act”). The Act, which is also commonly referred to as “U.S. tax reform,” significantly changes U.S. corporate income tax laws by, among other things, reducing the U.S. corporate income tax rate to 21% starting in 2018 and creating a territorial tax system with a one-time mandatory tax on previously deferred foreign earnings of U.S. subsidiaries. As a result, in the fourth quarter of 2017, the Company recorded a net benefit of $91.6 million in the consolidated statement of income as a component of Provision for income taxes. The $91.6 million net benefit consisted of a $185.8 million benefit resulting from the remeasurement of the Company’s net deferred tax liabilities in the U.S. based on the new lower corporate income tax rate and $94.2 million expense mostly relating to the one-time mandatory tax on previously deferred earnings of certain non-U.S. subsidiaries that are owned either wholly or partially by a U.S. subsidiary of the Company as discussed further below.
Although the $91.6 million net benefit represents what the Company believes is a reasonable estimate of the impact of the income tax effects of the Act on the Company’s consolidated financial statements as of December 31, 2017, it should be considered provisional. As additional guidance from the U.S. Department of Treasury is provided, the Company may need to adjust the provisional amounts after it finalizes the 2017 U.S. tax return and is able to conclude whether any further adjustments are required to its U.S. portion of net deferred tax liability of $390.4 million as of December 31, 2017, as well as to the liability associated with the one-time mandatory tax. The currently recorded amounts include a variety of estimates of taxable earnings and profits, estimated taxable foreign cash balances, differences between U.S. GAAP and U.S. tax principles and interpretations of many aspects of the Act that may, if changed, impact the final amounts. Any adjustments to these provisional amounts will be reported as a component of Provision for income taxes in the reporting period in which any such adjustments are determined, which will be no later than the fourth quarter of 2018. The Company is still evaluating the potential future impact of the global intangible low-taxed income (“GILTI”) section of the Act and has not provided any provisional deferred tax liability for it. Under U.S. GAAP, the Company is permitted to make an accounting policy election to either treat taxes due on future inclusions in the U.S. taxable income related to GILTI as a current period expense when incurred or to factor such amounts into the Company’s measurement of its deferred taxes. Due to the ongoing evaluation, the Company has not yet made the accounting policy decision.
The recently enacted Act mandated a one-time tax on previously deferred foreign earnings of U.S. subsidiaries. At December 31, 2017, included in the $94.2 million expense mentioned above, the Company recorded an expense of $81.9 million relating to the one-time mandatory tax. The Company is electing to pay the tax on an installment basis with $1.2 million recorded in current taxes payable, $13.2 million recorded in
70
Table of Contents
AMETEK, Inc.
NOTES TO CONSOLIDATED FINANCIAL STATEMENTS — (Continued)
noncurrent taxes payable and $67.5 million recorded as a deferred tax liability, which represents the portion relating to certain non-U.S. subsidiaries that have a fiscal year end in 2018 and is not yet payable. The Company intends to reinvest its earnings indefinitely in operations outside the United States except to the extent of $1.5 billion, which is deemed paid earnings under the mandatory tax provision of the Act. In addition, the Company has recorded an incremental $13.3 million in state income and foreign withholding taxes expected to be incurred when the cash amounts related to the mandatory tax are ultimately repatriated to the U.S., offset by $1.0 million for a remeasurement of uncertain tax positions impacted by the mandatory tax inclusion.
Due to the adoption of ASU 2015-17, the Company classified all deferred tax assets and liabilities as noncurrent on the consolidated balance sheet at December 31, 2017. The Company prospectively adopted ASU 2015-17 effective January 1, 2017. Therefore, prior periods have not been adjusted to reflect this adoption.
At December 31, 2016, U.S. and foreign deferred income taxes totaling $4.5 million were provided on undistributed earnings of certain non-U.S. subsidiaries that were not expected to be permanently reinvested in such companies. There was no provision for U.S. deferred income taxes for the undistributed earnings of certain other subsidiaries, which totaled approximately $1.1 billion at December 31, 2016.
At December 31, 2017, the Company had tax effected benefits of $10.4 million related to net operating loss carryforwards, which will be available to offset future income taxes payable, subject to certain annual or other limitations based on foreign and U.S. tax laws. This amount includes net operating loss carryforwards of $1.7 million for federal income tax purposes with no valuation allowance, $6.6 million for state income tax purposes with no valuation allowance and $2.2 million for foreign income tax purposes with a valuation allowance of $2.2 million. These net operating loss carryforwards, if not used, will expire between 2018 and 2037.
At December 31, 2017, the Company had tax effected benefits of $5.1 million related to tax credit carryforwards, which will be available to offset future income taxes payable, subject to certain annual or other limitations based on foreign and U.S. tax laws. This amount includes tax credit carryforwards of $0.6 million for federal income tax purposes with a valuation allowance of $0.6 million, $4.4 million for state income tax purposes with a valuation allowance of $0.3 million and $0.1 million for foreign income tax purposes with no valuation allowance. These tax credit carryforwards, if not used, will expire between 2018 and 2037.
The Company maintains a valuation allowance to reduce certain deferred tax assets to amounts that are more likely than not to be realized. This allowance primarily relates to the deferred tax assets established for foreign net operating loss carryforwards and tax credits. In 2017, the Company recorded an increase of $1.1 million in the valuation allowance primarily related to foreign net operating loss carryforwards that are not expected to be utilized.
At December 31, 2017, the Company had gross unrecognized tax benefits of $60.3 million, of which $51.7 million, if recognized, would impact the effective tax rate. At December 31, 2016, the Company had gross unrecognized tax benefits of $57.9 million, of which $48.5 million, if recognized, would impact the effective tax rate.
At December 31, 2017 and 2016, the Company reported $9.7 million and $8.9 million, respectively, related to interest and penalty exposure as accrued income tax expense in the consolidated balance sheet. During 2017, the Company recognized a net expense of $0.9 million, and during 2016 and 2015, the Company recognized a net benefit of $1.8 million and $0.4 million, respectively, for interest and penalties related to uncertain tax positions in the consolidated statement of income as a component of income tax expense.
71
Table of Contents
AMETEK, Inc.
NOTES TO CONSOLIDATED FINANCIAL STATEMENTS — (Continued)
Approximately 70% of the Company’s overall tax liability is incurred in the United States as measured prior to tax reform. The Company files income tax returns in various other state and foreign tax jurisdictions, in some cases for multiple legal entities per jurisdiction. Generally, the Company has open tax years subject to tax audit on average of between three and six years in these jurisdictions. At December 31, 2017, there were no tax years currently under examination by the Internal Revenue Service (“IRS”) related to the U.S. consolidated tax group, although a separate examination of a pre-acquisition net operating loss carryback is ongoing related to a recently acquired company for which no material liability is expected. The Company has not materially extended any other statutes of limitation for any significant location and has reviewed and accrued for, where necessary, tax liabilities for open periods including state and foreign jurisdictions that remain subject to examination. There have been no penalties asserted or imposed by the IRS related to substantial understatement of income, gross valuation misstatement or failure to disclose a listed or reportable transaction.
During 2017, the Company added $15.4 million of tax, interest and penalties to identified uncertain tax positions and reversed $12.1 million of tax and interest related to statute expirations. During 2016, the Company added $8.6 million of tax, interest and penalties related to identified uncertain tax positions and reversed $16.3 million of tax and interest related to statute expirations and settlement of prior uncertain positions.
The following is a reconciliation of the liability for uncertain tax positions at December 31:
| 2017 | 2016 | 2015 | ||||||||||
| (In millions) | ||||||||||||
| Balance at the beginning of the year |
$ | 57.9 | $ | 63.8 | $ | 71.7 | ||||||
| Additions for tax positions related to the current year |
10.0 | 5.5 | 8.8 | |||||||||
| Additions for tax positions of prior years |
3.1 | 1.5 | 1.3 | |||||||||
| Reductions for tax positions of prior years |
(2.8 | ) | (3.6 | ) | (7.1 | ) | ||||||
| Reductions related to settlements with taxing authorities |
— | (3.4 | ) | (8.3 | ) | |||||||
| Reductions due to statute expirations |
(7.9 | ) | (5.9 | ) | (2.6 | ) | ||||||
|
|
|
|
|
|
|
|||||||
| Balance at the end of the year |
$ | 60.3 | $ | 57.9 | $ | 63.8 | ||||||
|
|
|
|
|
|
|
|||||||
In 2017, the additions above primarily reflect the increase in tax liabilities for uncertain tax positions related to certain domestic and foreign issues, while the reductions above primarily relate to statute expirations. At December 31, 2017, tax, interest and penalties of $68.5 million were classified as a noncurrent liability. The net change in uncertain tax positions for the year ended December 31, 2017 resulted in an increase to income tax expense of $4.3 million.
72
Table of Contents
AMETEK, Inc.
NOTES TO CONSOLIDATED FINANCIAL STATEMENTS — (Continued)
| 9. | Debt |
Long-term debt, net consisted of the following at December 31:
| 2017 | 2016 | |||||||
| (In thousands) | ||||||||
| U.S. dollar 6.20% senior notes due December 2017 |
$ | — | $ | 270,000 | ||||
| U.S. dollar 6.35% senior notes due July 2018 |
80,000 | 80,000 | ||||||
| U.S. dollar 7.08% senior notes due September 2018 |
160,000 | 160,000 | ||||||
| U.S. dollar 7.18% senior notes due December 2018 |
65,000 | 65,000 | ||||||
| U.S. dollar 6.30% senior notes due December 2019 |
100,000 | 100,000 | ||||||
| U.S. dollar 3.73% senior notes due September 2024 |
300,000 | 300,000 | ||||||
| U.S. dollar 3.91% senior notes due June 2025 |
50,000 | 50,000 | ||||||
| U.S. dollar 3.96% senior notes due August 2025 |
100,000 | 100,000 | ||||||
| U.S. dollar 3.83% senior notes due September 2026 |
100,000 | 100,000 | ||||||
| U.S. dollar 3.98% senior notes due September 2029 |
100,000 | 100,000 | ||||||
| U.S. dollar 4.45% senior notes due August 2035 |
50,000 | 50,000 | ||||||
| British pound 4.68% senior note due September 2020 |
108,180 | 98,701 | ||||||
| British pound 2.59% senior note due November 2028 |
202,840 | 185,067 | ||||||
| British pound 2.70% senior note due November 2031 |
101,420 | 92,533 | ||||||
| Euro 1.34% senior notes due October 2026 |
360,620 | 316,643 | ||||||
| Euro 1.53% senior notes due October 2028 |
240,414 | 211,096 | ||||||
| Swiss franc 2.44% senior note due December 2021 |
56,452 | 54,150 | ||||||
| Revolving credit facility borrowings |
— | — | ||||||
| Other, principally foreign |
4,589 | 14,604 | ||||||
| Less: Debt issuance costs |
(5,226 | ) | (6,229 | ) | ||||
|
|
|
|
|
|||||
| Total debt, net |
2,174,289 | 2,341,565 | ||||||
| Less: Current portion, net |
(308,123 | ) | (278,921 | ) | ||||
|
|
|
|
|
|||||
| Total long-term debt, net |
$ | 1,866,166 | $ | 2,062,644 | ||||
|
|
|
|
|
|||||
Maturities of long-term debt borrowings outstanding at December 31, 2017 were as follows: $100.0 million in 2019; $108.2 million in 2020; $56.5 million in 2021; none in 2022; none in 2023; and $1,605.3 million in 2024 and thereafter.
In the fourth quarter of 2017, the Company paid in full, at maturity, $270 million in aggregate principal amount of 6.20% private placement senior notes.
In December 2007, the Company issued $270 million in aggregate principal amount of 6.20% private placement senior notes due December 2017 (paid in full, at maturity, as previously noted) and $100 million in aggregate principal amount of 6.30% private placement senior notes due December 2019. In July 2008, the Company issued $80 million in aggregate principal amount of 6.35% private placement senior notes due July 2018. In September 2008, the Company issued $160 million in aggregate principal amount of 7.08% private placement senior notes due September 2018. In December 2008, the Company issued $65 million in aggregate principal amount of 7.18% private placement senior notes due December 2018. In September 2014, the Company issued $300 million in aggregate principal amount of 3.73% senior notes due September 2024, $100 million in aggregate principal amount of 3.83% senior notes due September 2026 and $100 million in aggregate principal amount of 3.98% senior notes due September 2029. In June 2015, the Company issued $50 million in aggregate principal amount of 3.91% senior notes due June 2025. In August 2015, the Company issued $100 million in
73
Table of Contents
AMETEK, Inc.
NOTES TO CONSOLIDATED FINANCIAL STATEMENTS — (Continued)
aggregate principal amount of 3.96% senior notes due August 2025 and $50 million in aggregate principal amount of 4.45% senior notes due August 2035.
In September 2010, the Company issued an 80 million British pound ($108.2 million at December 31, 2017) 4.68% senior note due September 2020. In December 2011, the Company issued a 55 million Swiss franc ($56.5 million at December 31, 2017) 2.44% senior note due December 2021. In October 2016, the Company issued 300 million Euros ($360.6 million at December 31, 2017) in aggregate principal amount of 1.34% senior notes due October 2026 and 200 million Euros ($240.4 million at December 31, 2017) in aggregate principal amount of 1.53% senior notes due October 2028. In November 2016, the Company issued 150 million British pounds ($202.8 million at December 31, 2017) in aggregate principal amount of 2.59% senior notes due November 2028 and 75 million British pounds ($101.4 million at December 31, 2017) in aggregate principal amount of 2.70% senior notes due November 2031.
The Company along with certain of its foreign subsidiaries has an amended and restated credit agreement dated as of March 10, 2016 (the “Credit Agreement”). The Credit Agreement consists of a five-year revolving credit facility in an aggregate principal amount of $850 million with a final maturity date in March 2021. The revolving credit facility total borrowing capacity excludes an accordion feature that permits the Company to request up to an additional $300 million in revolving credit commitments at any time during the life of the Credit Agreement under certain conditions. The Credit Agreement places certain restrictions on allowable additional indebtedness. At December 31, 2017, the Company had available borrowing capacity of $1,108.1 million under its revolving credit facility, including the $300 million accordion feature.
Interest rates on outstanding borrowings under the revolving credit facility are at the applicable benchmark rate plus a negotiated spread or at the U.S. prime rate. At December 31, 2017 and 2016, the Company did not have any borrowings outstanding under the revolving credit facility. The weighted average interest rate on the revolving credit facility for the years ended December 31, 2017 and 2016 was 1.61% and 1.72%, respectively. The Company had outstanding letters of credit primarily under the revolving credit facility totaling $42.1 million and $33.2 million at December 31, 2017 and 2016, respectively.
The private placements, the senior notes and the revolving credit facility are subject to certain customary covenants, including financial covenants that, among other things, require the Company to maintain certain debt-to-EBITDA and interest coverage ratios. The Company was in compliance with all provisions of the debt arrangements at December 31, 2017.
Foreign subsidiaries of the Company had available credit facilities with local foreign lenders of $45.4 million and $43.7 million at December 31, 2017 and 2016, respectively. At December 31, 2017, foreign subsidiaries had debt borrowings outstanding totaling $4.6 million, all of which was reported in short-term borrowings and current portion of long-term debt, net. At December 31, 2016, foreign subsidiaries had debt borrowings outstanding totaling $14.6 million, including $3.8 million reported in long-term debt, net.
The weighted average interest rate on total debt borrowings outstanding at December 31, 2017 and 2016 was 4.2% and 4.4%, respectively.
| 10. | Share-Based Compensation |
Under the terms of the Company’s stockholder-approved share-based plans, incentive and non-qualified stock options and restricted stock have been, and may be, issued to the Company’s officers, management-level employees and members of its Board of Directors. Employee and non-employee director stock options generally vest at a rate of 25% per year, beginning one year from the date of the grant, and restricted stock generally has a
74
Table of Contents
AMETEK, Inc.
NOTES TO CONSOLIDATED FINANCIAL STATEMENTS — (Continued)
four-year cliff vesting. Stock options generally have a maximum contractual term of seven years. At December 31, 2017, 12.0 million shares of Company common stock were reserved for issuance under the Company’s share-based plans, including 5.6 million shares for stock options outstanding.
The Company issues previously unissued shares when stock options are exercised and shares are issued from treasury stock upon the award of restricted stock.
The Company measures and records compensation expense related to all stock awards by recognizing the grant date fair value of the awards over their requisite service periods in the financial statements. For grants under any of the Company’s plans that are subject to graded vesting over a service period, the Company recognizes expense on a straight-line basis over the requisite service period for the entire award.
Total share-based compensation expense was as follows for the years ended December 31:
| 2017 | 2016 | 2015 | ||||||||||
| (In thousands) | ||||||||||||
| Stock option expense |
$ | 9,895 | $ | 9,984 | $ | 10,955 | ||||||
| Restricted stock expense |
15,196 | 12,046 | 12,807 | |||||||||
|
|
|
|
|
|
|
|||||||
| Total pre-tax expense |
$ | 25,091 | $ | 22,030 | $ | 23,762 | ||||||
|
|
|
|
|
|
|
|||||||
Pre-tax share-based compensation expense is included in the consolidated statement of income in either Cost of sales or Selling, general and administrative expenses, depending on where the recipient’s cash compensation is reported. The year ended December 31, 2017 includes a second quarter of 2017 $2.5 million pre-tax charge in corporate administrative expenses related to the accelerated vesting of restricted stock grants in association with the retirement of the Company’s Executive Chairman of the Board of Directors.
The fair value of each stock option grant is estimated on the date of grant using a Black-Scholes-Merton option pricing model. The following weighted average assumptions were used in the Black-Scholes-Merton model to estimate the fair values of stock options granted during the years indicated:
| 2017 | 2016 | 2015 | ||||||||||
| Expected volatility |
18.0 | % | 21.8 | % | 22.3 | % | ||||||
| Expected term (years) |
5.0 | 5.0 | 5.0 | |||||||||
| Risk-free interest rate |
1.94 | % | 1.23 | % | 1.58 | % | ||||||
| Expected dividend yield |
0.60 | % | 0.77 | % | 0.69 | % | ||||||
| Black-Scholes-Merton fair value per stock option granted |
$ | 11.05 | $ | 9.14 | $ | 10.89 | ||||||
Expected volatility is based on the historical volatility of the Company’s stock over the stock options’ expected term. The Company used historical exercise data to estimate the stock options’ expected term, which represents the period of time that the stock options granted are expected to be outstanding. Management anticipates that the future stock option holding periods will be similar to the historical stock option holding periods. The risk-free interest rate for periods within the expected term of the stock option is based on the U.S. Treasury yield curve at the time of grant. Compensation expense recognized for all share-based awards is net of estimated forfeitures. The Company’s estimated forfeiture rates are based on its historical experience.
75
Table of Contents
AMETEK, Inc.
NOTES TO CONSOLIDATED FINANCIAL STATEMENTS — (Continued)
The following is a summary of the Company’s stock option activity and related information for the year ended December 31, 2017:
| Shares | Weighted Average Exercise Price |
Weighted Average Remaining Contractual Life |
Aggregate Intrinsic Value |
|||||||||||||
| (In thousands) | (Years) | (In millions) | ||||||||||||||
| Outstanding at the beginning of the year |
6,011 | $ | 42.25 | |||||||||||||
| Granted |
1,331 | 60.32 | ||||||||||||||
| Exercised |
(1,515 | ) | 31.62 | |||||||||||||
| Forfeited |
(237 | ) | 52.62 | |||||||||||||
| Expired |
(7 | ) | 52.10 | |||||||||||||
|
|
|
|||||||||||||||
| Outstanding at the end of the year |
5,583 | $ | 48.99 | 4.2 | $ | 131.1 | ||||||||||
|
|
|
|
|
|
|
|
|
|||||||||
| Exercisable at the end of the year |
2,884 | $ | 43.96 | 2.9 | $ | 82.2 | ||||||||||
|
|
|
|
|
|
|
|
|
|||||||||
The aggregate intrinsic value of stock options exercised during 2017, 2016 and 2015 was $41.3 million, $16.2 million and $62.3 million, respectively. The total fair value of stock options vested during 2017, 2016 and 2015 was $12.4 million, $10.8 million and $10.3 million, respectively.
The following is a summary of the Company’s nonvested stock option activity and related information for the year ended December 31, 2017:
| Shares | Weighted Average Grant Date Fair Value |
|||||||
| (In thousands) | ||||||||
| Nonvested stock options outstanding at the beginning of the year |
2,802 | $ | 10.15 | |||||
| Granted |
1,331 | 11.05 | ||||||
| Vested |
(1,197 | ) | 10.40 | |||||
| Forfeited |
(237 | ) | 10.35 | |||||
|
|
|
|||||||
| Nonvested stock options outstanding at the end of the year |
2,699 | $ | 10.47 | |||||
|
|
|
|
|
|||||
As of December 31, 2017, there was approximately $21 million of expected future pre-tax compensation expense related to the 2.7 million nonvested stock options outstanding, which is expected to be recognized over a weighted average period of approximately two years.
The fair value of restricted shares under the Company’s restricted stock arrangement is determined by the product of the number of shares granted and the grant date market price of the Company’s common stock. Upon the grant of restricted stock, the fair value of the restricted shares (unearned compensation) at the date of grant is charged as a reduction of capital in excess of par value in the Company’s consolidated balance sheet and is amortized to expense on a straight-line basis over the vesting period, which is the same as the calculated derived service period as determined on the grant date. Restricted stock grants are subject to accelerated vesting due to certain events, including doubling of the grant price of the Company’s common stock as of the close of business during any five consecutive trading days.
76
Table of Contents
AMETEK, Inc.
NOTES TO CONSOLIDATED FINANCIAL STATEMENTS — (Continued)
The following is a summary of the Company’s nonvested restricted stock activity and related information for the year ended December 31, 2017:
| Shares | Weighted Average Grant Date Fair Value |
|||||||
| (In thousands) | ||||||||
| Nonvested restricted stock outstanding at the beginning of the year |
1,019 | $ | 48.59 | |||||
| Granted |
340 | 60.35 | ||||||
| Vested |
(333 | ) | 47.42 | |||||
| Forfeited |
(94 | ) | 51.51 | |||||
|
|
|
|||||||
| Nonvested restricted stock outstanding at the end of the year |
932 | $ | 53.53 | |||||
|
|
|
|
|
|||||
The total fair value of restricted stock vested during 2017, 2016 and 2015 was $15.8 million, $11.1 million and $10.6 million, respectively. The weighted average fair value of restricted stock granted per share during 2017 and 2016 was $60.35 and $46.91, respectively. As of December 31, 2017, there was approximately $28 million of expected future pre-tax compensation expense related to the 0.9 million nonvested restricted shares outstanding, which is expected to be recognized over a weighted average period of less than two years.
| 11. | Retirement Plans and Other Postretirement Benefits |
Retirement and Pension Plans
The Company sponsors several retirement and pension plans covering eligible salaried and hourly employees. The plans generally provide benefits based on participants’ years of service and/or compensation. The following is a brief description of the Company’s retirement and pension plans.
The Company maintains contributory and noncontributory defined benefit pension plans. Benefits for eligible salaried and hourly employees under all defined benefit plans are funded through trusts established in conjunction with the plans. The Company’s funding policy with respect to its defined benefit plans is to contribute amounts that provide for benefits based on actuarial calculations and the applicable requirements of U.S. federal and local foreign laws. The Company estimates that it will make both required and discretionary cash contributions of approximately $2 million to $6 million to its worldwide defined benefit pension plans in 2018.
The Company uses a measurement date of December 31 (its fiscal year end) for its U.S. and foreign defined benefit pension plans.
The Company sponsors a 401(k) retirement and savings plan for eligible U.S. employees. Participants in the retirement and savings plan may contribute a specified portion of their compensation on a pre-tax basis, which varies by location. The Company matches employee contributions ranging from 20% to 100%, up to a maximum percentage ranging from 1% to 8% of eligible compensation or up to a maximum of $1,200 per participant in some locations.
The Company’s retirement and savings plan has a defined contribution retirement feature principally to cover U.S. salaried employees joining the Company after December 31, 1996. Under the retirement feature, the Company makes contributions for eligible employees based on a pre-established percentage of the covered employee’s salary subject to pre-established vesting. Employees of certain of the Company’s foreign operations participate in various local defined contribution plans.
77
Table of Contents
AMETEK, Inc.
NOTES TO CONSOLIDATED FINANCIAL STATEMENTS — (Continued)
The Company has nonqualified unfunded retirement plans for its Directors and certain retired employees. It also provides supplemental retirement benefits, through contractual arrangements and/or a Supplemental Executive Retirement Plan (“SERP”) covering certain current and former executives of the Company. These supplemental benefits are designed to compensate the executive for retirement benefits that would have been provided under the Company’s primary retirement plan, except for statutory limitations on compensation that must be taken into account under those plans. The projected benefit obligations of the SERP and the contracts will primarily be funded by a grant of shares of the Company’s common stock upon retirement or termination of the executive. The Company is providing for these obligations by charges to earnings over the applicable periods.
The following tables set forth the changes in net projected benefit obligation and the fair value of plan assets for the funded and unfunded defined benefit plans for the years ended December 31:
U.S. Defined Benefit Pension Plans:
| 2017 | 2016 | |||||||
| (In thousands) | ||||||||
| Change in projected benefit obligation: |
||||||||
| Net projected benefit obligation at the beginning of the year |
$ | 498,850 | $ | 472,477 | ||||
| Service cost |
3,538 | 3,488 | ||||||
| Interest cost |
20,693 | 22,153 | ||||||
| Actuarial losses |
26,922 | 29,681 | ||||||
| Gross benefits paid |
(29,627 | ) | (29,005 | ) | ||||
| Plan amendments |
— | 56 | ||||||
|
|
|
|
|
|||||
| Net projected benefit obligation at the end of the year |
$ | 520,376 | $ | 498,850 | ||||
|
|
|
|
|
|||||
| Change in plan assets: |
||||||||
| Fair value of plan assets at the beginning of the year |
$ | 517,073 | $ | 508,775 | ||||
| Actual return on plan assets |
92,058 | 36,414 | ||||||
| Employer contributions |
40,489 | 889 | ||||||
| Gross benefits paid |
(29,627 | ) | (29,005 | ) | ||||
|
|
|
|
|
|||||
| Fair value of plan assets at the end of the year |
$ | 619,993 | $ | 517,073 | ||||
|
|
|
|
|
|||||
78
Table of Contents
AMETEK, Inc.
NOTES TO CONSOLIDATED FINANCIAL STATEMENTS — (Continued)
Foreign Defined Benefit Pension Plans:
| 2017 | 2016 | |||||||
| (In thousands) | ||||||||
| Change in projected benefit obligation: |
||||||||
| Net projected benefit obligation at the beginning of the year |
$ | 258,297 | $ | 243,924 | ||||
| Service cost |
3,600 | 3,134 | ||||||
| Interest cost |
6,732 | 7,896 | ||||||
| Foreign currency translation adjustments |
26,457 | (39,910 | ) | |||||
| Employee contributions |
228 | 256 | ||||||
| Actuarial (gains) losses |
(1,563 | ) | 52,248 | |||||
| Expenses paid from assets |
(608 | ) | (770 | ) | ||||
| Gross benefits paid |
(8,964 | ) | (8,475 | ) | ||||
| Plan amendments |
(1 | ) | (6 | ) | ||||
|
|
|
|
|
|||||
| Net projected benefit obligation at the end of the year |
$ | 284,178 | $ | 258,297 | ||||
|
|
|
|
|
|||||
| Change in plan assets: |
||||||||
| Fair value of plan assets at the beginning of the year |
$ | 188,935 | $ | 213,296 | ||||
| Actual return on plan assets |
13,869 | 14,346 | ||||||
| Employer contributions |
14,307 | 5,886 | ||||||
| Employee contributions |
228 | 256 | ||||||
| Foreign currency translation adjustments |
19,201 | (35,604 | ) | |||||
| Expenses paid from assets |
(608 | ) | (770 | ) | ||||
| Gross benefits paid |
(8,964 | ) | (8,475 | ) | ||||
|
|
|
|
|
|||||
| Fair value of plan assets at the end of the year |
$ | 226,968 | $ | 188,935 | ||||
|
|
|
|
|
|||||
The accumulated benefit obligation consisted of the following at December 31:
U.S. Defined Benefit Pension Plans:
| 2017 | 2016 | |||||||
| (In thousands) | ||||||||
| Funded plans |
$ | 503,309 | $ | 480,249 | ||||
| Unfunded plans |
6,046 | 6,212 | ||||||
|
|
|
|
|
|||||
| Total |
$ | 509,355 | $ | 486,461 | ||||
|
|
|
|
|
|||||
Foreign Defined Benefit Pension Plans:
| 2017 | 2016 | |||||||
| (In thousands) | ||||||||
| Funded plans |
$ | 235,787 | $ | 213,877 | ||||
| Unfunded plans |
39,531 | 33,924 | ||||||
|
|
|
|
|
|||||
| Total |
$ | 275,318 | $ | 247,801 | ||||
|
|
|
|
|
|||||
79
Table of Contents
AMETEK, Inc.
NOTES TO CONSOLIDATED FINANCIAL STATEMENTS — (Continued)
Weighted average assumptions used to determine benefit obligations at December 31:
| 2017 | 2016 | |||||||
| U.S. Defined Benefit Pension Plans: |
||||||||
| Discount rate |
3.75 | % | 4.25 | % | ||||
| Rate of compensation increase (where applicable) |
3.75 | % | 3.75 | % | ||||
| Foreign Defined Benefit Pension Plans: |
||||||||
| Discount rate |
2.39 | % | 2.56 | % | ||||
| Rate of compensation increase (where applicable) |
2.50 | % | 2.50 | % | ||||
The following is a summary of the fair value of plan assets for U.S. plans at December 31:
| 2017 | 2016 | |||||||||||||||||||||||
| Asset Class |
Total | Level 1 | Level 2 | Total | Level 1 | Level 2 | ||||||||||||||||||
| (In thousands) | ||||||||||||||||||||||||
| Corporate debt instruments |
$ | 1,757 | $ | — | $ | 1,757 | $ | 2,662 | $ | — | $ | 2,662 | ||||||||||||
| Corporate debt instruments - Preferred |
12,574 | — | 12,574 | 8,880 | — | 8,880 | ||||||||||||||||||
| Corporate stocks - Common |
137,693 | 137,693 | — | 109,881 | 109,881 | — | ||||||||||||||||||
| Municipal bonds |
565 | — | 565 | 777 | — | 777 | ||||||||||||||||||
| Registered investment companies |
289,693 | 289,693 | — | 251,054 | 251,054 | — | ||||||||||||||||||
| U.S. Government securities |
246 | — | 246 | — | — | — | ||||||||||||||||||
|
|
|
|
|
|
|
|
|
|
|
|
|
|||||||||||||
| Total investments |
442,528 | 427,386 | 15,142 | 373,254 | 360,935 | 12,319 | ||||||||||||||||||
|
|
|
|
|
|
|
|
|
|
|
|
|
|||||||||||||
| Investments measured at net asset value |
177,465 | — | — | 143,819 | — | — | ||||||||||||||||||
|
|
|
|
|
|
|
|
|
|
|
|
|
|||||||||||||
| Total investments |
$ | 619,993 | $ | 427,386 | $ | 15,142 | $ | 517,073 | $ | 360,935 | $ | 12,319 | ||||||||||||
|
|
|
|
|
|
|
|
|
|
|
|
|
|||||||||||||
U.S. equity securities and global equity securities categorized as level 1 are traded on national and international exchanges and are valued at their closing prices on the last trading day of the year. For U.S. equity securities and global equity securities not traded on an active exchange, or if the closing price is not available, the trustee obtains indicative quotes from a pricing vendor, broker or investment manager. These securities are categorized as level 2 if the custodian obtains corroborated quotes from a pricing vendor. Additionally, some U.S. equity securities and global equity securities are public investment vehicles valued using the Net Asset Value (“NAV”) provided by the fund manager. The NAV is the total value of the fund divided by the number of shares outstanding.
Fixed income securities categorized as level 1 are traded on national and international exchanges and are valued at their closing prices on the last trading day of the year and categorized as level 2 if valued by the trustee using pricing models that use verifiable observable market data, bids provided by brokers or dealers or quoted prices of securities with similar characteristics.
The expected long-term rate of return on these plan assets was 7.50% in 2017 and 7.75% in 2016. Equity securities included 512,565 shares of AMETEK, Inc. common stock with a market value of $37.1 million (6.0% of total plan investment assets) at December 31, 2017 and 512,565 shares of AMETEK, Inc. common stock with a market value of $24.9 million (4.8% of total plan investment assets) at December 31, 2016.
The objectives of the Company’s U.S. defined benefit plans’ investment strategy are to maximize the plans’ funded status and minimize Company contributions and plan expense. Because the goal is to optimize returns
80
Table of Contents
AMETEK, Inc.
NOTES TO CONSOLIDATED FINANCIAL STATEMENTS — (Continued)
over the long term, an investment policy that favors equity holdings has been established. Since there may be periods of time where both equity and fixed-income markets provide poor returns, an allocation to alternative assets may be made to improve the overall portfolio’s diversification and return potential. The Company periodically reviews its asset allocation, taking into consideration plan liabilities, plan benefit payment streams and the investment strategy of the pension plans. The actual asset allocation is monitored frequently relative to the established targets and ranges and is rebalanced when necessary. The target allocations for the U.S. defined benefits plans are approximately 50% equity securities, 20% fixed-income securities and 30% other securities and/or cash.
The equity portfolio is diversified by market capitalization and style. The equity portfolio also includes international components.
The objective of the fixed-income portion of the pension assets is to provide interest rate sensitivity for a portion of the assets and to provide diversification. The fixed-income portfolio is diversified within certain quality and maturity guidelines in an attempt to minimize the adverse effects of interest rate fluctuations.
Other than for investments in alternative assets, certain investments are prohibited. Prohibited investments include venture capital, private placements, unregistered or restricted stock, margin trading, commodities, short selling and rights and warrants. Foreign currency futures, options and forward contracts may be used to manage foreign currency exposure.
The following is a summary of the fair value of plan assets for foreign defined benefit pension plans at December 31:
| 2017 | 2016 | |||||||||||||||
| Asset Class |
Total | Level 3 | Total | Level 3 | ||||||||||||
| (In thousands) | ||||||||||||||||
| Life insurance |
$ | 21,294 | $ | 21,294 | $ | 18,147 | $ | 18,147 | ||||||||
|
|
|
|
|
|
|
|
|
|||||||||
| Total investments |
21,294 | 21,294 | 18,147 | 18,147 | ||||||||||||
|
|
|
|
|
|
|
|
|
|||||||||
| Investments measured at net asset value |
205,674 | — | 170,788 | — | ||||||||||||
|
|
|
|
|
|
|
|
|
|||||||||
| Total investments |
$ | 226,968 | $ | 21,294 | $ | 188,935 | $ | 18,147 | ||||||||
|
|
|
|
|
|
|
|
|
|||||||||
Life insurance assets are considered level 3 investments as their values are determined by the sponsor using unobservable market data.
Alternative investments categorized as level 3 are valued based on unobservable inputs and cannot be corroborated using verifiable observable market data. Investments in level 3 funds are redeemable, however, cash reimbursement may be delayed or a portion held back until asset finalization.
81
Table of Contents
AMETEK, Inc.
NOTES TO CONSOLIDATED FINANCIAL STATEMENTS — (Continued)
The following is a summary of the changes in the fair value of the foreign plans’ level 3 investments (fair value determined using significant unobservable inputs):
| Life Insurance | ||||
| (In thousands) | ||||
| Balance, December 31, 2015 |
$ | 20,486 | ||
| Actual return on assets: |
||||
| Unrealized (losses) relating to instruments still held at the end of the year |
(2,339 | ) | ||
| Realized gains (losses) relating to assets sold during the year |
— | |||
| Purchases, sales, issuances and settlements, net |
— | |||
|
|
|
|||
| Balance, December 31, 2016 |
18,147 | |||
|
|
|
|||
| Actual return on assets: |
||||
| Unrealized gains relating to instruments still held at the end of the year |
3,147 | |||
| Realized gains (losses) relating to assets sold during the year |
— | |||
| Purchases, sales, issuances and settlements, net |
— | |||
|
|
|
|||
| Balance, December 31, 2017 |
$ | 21,294 | ||
|
|
|
|||
The objective of the Company’s foreign defined benefit plans’ investment strategy is to maximize the long-term rate of return on plan investments, subject to a reasonable level of risk. Liability studies are also performed on a regular basis to provide guidance in setting investment goals with an objective to balance risks against the current and future needs of the plans. The trustees consider the risk associated with the different asset classes, relative to the plans’ liabilities and how this can be affected by diversification, and the relative returns available on equities, fixed-income investments, real estate and cash. Also, the likely volatility of those returns and the cash flow requirements of the plans are considered. It is expected that equities will outperform fixed-income investments over the long term. However, the trustees recognize the fact that fixed-income investments may better match the liabilities for pensioners. Because of the relatively young active employee group covered by the plans and the immature nature of the plans, the trustees have chosen to adopt an asset allocation strategy more heavily weighted toward equity investments. This asset allocation strategy will be reviewed, from time to time, in view of changes in market conditions and in the plans’ liability profile. The target allocations for the foreign defined benefit plans are approximately 70% equity securities, 15% fixed-income securities and 15% other securities, insurance or cash.
The assumption for the expected return on plan assets was developed based on a review of historical investment returns for the investment categories for the defined benefit pension assets. This review also considered current capital market conditions and projected future investment returns. The estimates of future capital market returns by asset class are lower than the actual long-term historical returns. The current low interest rate environment influences this outlook. Therefore, the assumed rate of return for U.S. plans is 7.50% and 6.64% for foreign plans in 2018.
82
Table of Contents
AMETEK, Inc.
NOTES TO CONSOLIDATED FINANCIAL STATEMENTS — (Continued)
The projected benefit obligation, accumulated benefit obligation and fair value of plan assets for pension plans with a projected benefit obligation in excess of plan assets and pension plans with an accumulated benefit obligation in excess of plan assets were as follows at December 31:
U.S. Defined Benefit Pension Plans:
| Projected Benefit | Accumulated Benefit | |||||||||||||||
| Obligation Exceeds | Obligation Exceeds | |||||||||||||||
| Fair Value of Assets | Fair Value of Assets | |||||||||||||||
| 2017 | 2016 | 2017 | 2016 | |||||||||||||
| (In thousands) | ||||||||||||||||
| Benefit obligation |
$ | 6,046 | $ | 26,356 | $ | 6,046 | $ | 26,356 | ||||||||
| Fair value of plan assets |
— | 19,059 | — | 19,059 | ||||||||||||
Foreign Defined Benefit Pension Plans:
| Projected Benefit | Accumulated Benefit | |||||||||||||||
| Obligation Exceeds | Obligation Exceeds | |||||||||||||||
| Fair Value of Assets | Fair Value of Assets | |||||||||||||||
| 2017 | 2016 | 2017 | 2016 | |||||||||||||
| (In thousands) | ||||||||||||||||
| Benefit obligation |
$ | 186,756 | $ | 215,893 | $ | 180,779 | $ | 209,377 | ||||||||
| Fair value of plan assets |
127,170 | 146,480 | 127,170 | 146,480 | ||||||||||||
The following table provides the amounts recognized in the consolidated balance sheet at December 31:
| 2017 | 2016 | |||||||
| (In thousands) | ||||||||
| Funded status asset (liability): |
||||||||
| Fair value of plan assets |
$ | 846,961 | $ | 706,008 | ||||
| Projected benefit obligation |
(804,553 | ) | (757,147 | ) | ||||
|
|
|
|
|
|||||
| Funded status at the end of the year |
$ | 42,408 | $ | (51,139 | ) | |||
|
|
|
|
|
|||||
| Amounts recognized in the consolidated balance sheet consisted of: |
||||||||
| Noncurrent asset for pension benefits (other assets) |
$ | 108,039 | $ | 25,571 | ||||
| Current liabilities for pension benefits |
(1,901 | ) | (1,393 | ) | ||||
| Noncurrent liability for pension benefits |
(63,730 | ) | (75,317 | ) | ||||
|
|
|
|
|
|||||
| Net amount recognized at the end of the year |
$ | 42,408 | $ | (51,139 | ) | |||
|
|
|
|
|
|||||
The following table provides the amounts recognized in accumulated other comprehensive income, net of taxes, at December 31:
| Net amounts recognized: |
2017 | 2016 | ||||||
| (In thousands) | ||||||||
| Net actuarial loss |
$ | 178,466 | $ | 204,782 | ||||
| Prior service costs |
(1,102 | ) | (1,031 | ) | ||||
| Transition asset |
7 | 7 | ||||||
|
|
|
|
|
|||||
| Total recognized |
$ | 177,371 | $ | 203,758 | ||||
|
|
|
|
|
|||||
83
Table of Contents
AMETEK, Inc.
NOTES TO CONSOLIDATED FINANCIAL STATEMENTS — (Continued)
The following table provides the components of net periodic pension benefit expense (income) for the years ended December 31:
| 2017 | 2016 | 2015 | ||||||||||
| (In thousands) | ||||||||||||
| Defined benefit plans: |
||||||||||||
| Service cost |
$ | 7,138 | $ | 6,622 | $ | 7,000 | ||||||
| Interest cost |
27,424 | 30,049 | 28,670 | |||||||||
| Expected return on plan assets |
(53,442 | ) | (51,140 | ) | (54,819 | ) | ||||||
| Amortization of: |
||||||||||||
| Net actuarial loss |
14,591 | 10,224 | 9,383 | |||||||||
| Prior service costs |
(47 | ) | (52 | ) | (55 | ) | ||||||
| Transition asset |
1 | 1 | 1 | |||||||||
|
|
|
|
|
|
|
|||||||
| Total net periodic benefit income |
(4,335 | ) | (4,296 | ) | (9,820 | ) | ||||||
|
|
|
|
|
|
|
|||||||
| Other plans: |
||||||||||||
| Defined contribution plans |
24,280 | 23,881 | 22,750 | |||||||||
| Foreign plans and other |
5,866 | 5,694 | 4,800 | |||||||||
|
|
|
|
|
|
|
|||||||
| Total other plans |
30,146 | 29,575 | 27,550 | |||||||||
|
|
|
|
|
|
|
|||||||
| Total net pension expense |
$ | 25,811 | $ | 25,279 | $ | 17,730 | ||||||
|
|
|
|
|
|
|
|||||||
The total net periodic benefit expense (income) is included in Cost of sales in the consolidated statement of income. The estimated amount that will be amortized from accumulated other comprehensive income into net periodic pension benefit expense in 2018 for the net actuarial losses and prior service costs is expected to be approximately $12 million.
The following weighted average assumptions were used to determine the above net periodic pension benefit expense for the years ended December 31:
| 2017 | 2016 | 2015 | ||||||||||
| U.S. Defined Benefit Pension Plans: |
||||||||||||
| Discount rate |
4.25 | % | 4.80 | % | 4.20 | % | ||||||
| Expected return on plan assets |
7.50 | % | 7.75 | % | 7.75 | % | ||||||
| Rate of compensation increase (where applicable) |
3.75 | % | 3.75 | % | 3.75 | % | ||||||
| Foreign Defined Benefit Pension Plans: |
||||||||||||
| Discount rate |
2.56 | % | 3.62 | % | 3.44 | % | ||||||
| Expected return on plan assets |
6.79 | % | 6.95 | % | 6.92 | % | ||||||
| Rate of compensation increase (where applicable) |
2.50 | % | 2.88 | % | 2.88 | % | ||||||
Estimated Future Benefit Payments
The estimated future benefit payments for U.S. and foreign plans are as follows: 2018 - $39.8 million; 2019 - $40.2 million; 2020 - $41.2 million; 2021 - $41.9 million; 2022 - $42.5 million; 2023 to 2027 - $223.4 million. Future benefit payments primarily represent amounts to be paid from pension trust assets. Amounts included that are to be paid from the Company’s assets are not significant in any individual year.
84
Table of Contents
AMETEK, Inc.
NOTES TO CONSOLIDATED FINANCIAL STATEMENTS — (Continued)
Postretirement Plans and Postemployment Benefits
The Company provides limited postretirement benefits other than pensions for certain retirees and a small number of former employees. Benefits under these arrangements are not funded and are not significant.
The Company also provides limited postemployment benefits for certain former or inactive employees after employment but before retirement. Those benefits are not significant in amount.
The Company has a deferred compensation plan, which allows employees whose compensation exceeds the statutory IRS limit for retirement benefits to defer a portion of earned bonus compensation. The plan permits deferred amounts to be deemed invested in either, or a combination of, (a) an interest-bearing account, benefits from which are payable out of the general assets of the Company, or (b) the equivalent of a fund which invests in shares of the Company’s common stock on behalf of the employee. The amount deferred under the plan, including income earned, was $25.4 million and $25.2 million at December 31, 2017 and 2016, respectively. Administrative expense for the deferred compensation plan is borne by the Company and is not significant.
Multiemployer Defined Benefit Pension Plan
For the year ended December 31, 2017, the Company recorded $6.0 million in costs as a result of its decision to withdraw from a multiemployer pension plan serving a facility that is currently operating.
| 12. | Guarantees |
The Company does not provide significant guarantees on a routine basis. The Company primarily issues guarantees, stand-by letters of credit and surety bonds in the ordinary course of its business to provide financial or performance assurance to third parties on behalf of its consolidated subsidiaries to support or enhance the subsidiary’s stand-alone creditworthiness. The amounts subject to certain of these agreements vary depending on the covered contracts actually outstanding at any particular point in time. At December 31, 2017, the maximum amount of future payment obligations relative to these various guarantees was $82.8 million and the outstanding liability under certain of those guarantees was $0.3 million.
Indemnifications
In conjunction with certain acquisition and divestiture transactions, the Company may agree to make payments to compensate or indemnify other parties for possible future unfavorable financial consequences resulting from specified events (e.g., breaches of contract obligations or retention of previously existing environmental, tax or employee liabilities) whose terms range in duration and often are not explicitly defined. Where appropriate, the obligation for such indemnifications is recorded as a liability. Because the amount of these types of indemnifications generally is not specifically stated, the overall maximum amount of the obligation under such indemnifications cannot be reasonably estimated. Further, the Company indemnifies its directors and officers for claims against them in connection with their positions with the Company. Historically, any such costs incurred to settle claims related to these indemnifications have been minimal for the Company. The Company believes that future payments, if any, under all existing indemnification agreements would not have a material impact on its consolidated results of operations, financial position or cash flows.
Product Warranties
The Company provides limited warranties in connection with the sale of its products. The warranty periods for products sold vary among the Company’s operations, but generally do not exceed one year. The Company calculates its warranty expense provision based on its historical warranty experience and adjustments are made periodically to reflect actual warranty expenses.
85
Table of Contents
AMETEK, Inc.
NOTES TO CONSOLIDATED FINANCIAL STATEMENTS — (Continued)
Changes in the accrued product warranty obligation were as follows at December 31:
| 2017 | 2016 | 2015 | ||||||||||
| (In thousands) | ||||||||||||
| Balance at the beginning of the year |
$ | 22,007 | $ | 22,761 | $ | 29,764 | ||||||
| Accruals for warranties issued during the year |
15,951 | 16,046 | 14,817 | |||||||||
| Settlements made during the year |
(17,854 | ) | (17,732 | ) | (19,905 | ) | ||||||
| Warranty accruals related to acquired businesses and other during the year |
2,768 | 932 | (1,915 | ) | ||||||||
|
|
|
|
|
|
|
|||||||
| Balance at the end of the year |
$ | 22,872 | $ | 22,007 | $ | 22,761 | ||||||
|
|
|
|
|
|
|
|||||||
Product warranty obligations are reported as current liabilities in the consolidated balance sheet.
| 13. | Contingencies |
Asbestos Litigation
The Company (including its subsidiaries) has been named as a defendant in a number of asbestos-related lawsuits. Certain of these lawsuits relate to a business which was acquired by the Company and do not involve products which were manufactured or sold by the Company. In connection with these lawsuits, the seller of such business has agreed to indemnify the Company against these claims (the “Indemnified Claims”). The Indemnified Claims have been tendered to, and are being defended by, such seller. The seller has met its obligations, in all respects, and the Company does not have any reason to believe such party would fail to fulfill its obligations in the future. To date, no judgments have been rendered against the Company as a result of any asbestos-related lawsuit. The Company believes that it has good and valid defenses to each of these claims and intends to defend them vigorously.
Environmental Matters
Certain historic processes in the manufacture of products have resulted in environmentally hazardous waste by-products as defined by federal and state laws and regulations. At December 31, 2017, the Company is named a Potentially Responsible Party (“PRP”) at 13 non-AMETEK-owned former waste disposal or treatment sites (the “non-owned” sites). The Company is identified as a “de minimis” party in 12 of these sites based on the low volume of waste attributed to the Company relative to the amounts attributed to other named PRPs. In eight of these sites, the Company has reached a tentative agreement on the cost of the de minimis settlement to satisfy its obligation and is awaiting executed agreements. The tentatively agreed-to settlement amounts are fully reserved. In the other four sites, the Company is continuing to investigate the accuracy of the alleged volume attributed to the Company as estimated by the parties primarily responsible for remedial activity at the sites to establish an appropriate settlement amount. At the remaining site where the Company is a non-de minimis PRP, the Company is participating in the investigation and/or related required remediation as part of a PRP Group and reserves have been established sufficient to satisfy the Company’s expected obligations. The Company historically has resolved these issues within established reserve levels and reasonably expects this result will continue. In addition to these non-owned sites, the Company has an ongoing practice of providing reserves for probable remediation activities at certain of its current or previously owned manufacturing locations (the “owned” sites). For claims and proceedings against the Company with respect to other environmental matters, reserves are established once the Company has determined that a loss is probable and estimable. This estimate is refined as the Company moves through the various stages of investigation, risk assessment, feasibility study and corrective action processes. In certain instances, the Company has developed a range of estimates for such costs and has recorded a liability
86
Table of Contents
AMETEK, Inc.
NOTES TO CONSOLIDATED FINANCIAL STATEMENTS — (Continued)
based on the best estimate. It is reasonably possible that the actual cost of remediation of the individual sites could vary from the current estimates and the amounts accrued in the consolidated financial statements; however, the amounts of such variances are not expected to result in a material change to the consolidated financial statements. In estimating the Company’s liability for remediation, the Company also considers the likely proportionate share of the anticipated remediation expense and the ability of the other PRPs to fulfill their obligations.
Total environmental reserves at December 31, 2017 and 2016 were $30.1 million and $28.4 million, respectively, for both non-owned and owned sites. In 2017, the Company recorded $7.7 million in reserves and the reserve increased $0.4 million due to foreign currency translation. Additionally, the Company spent $6.4 million on environmental matters in 2017. The Company’s reserves for environmental liabilities at December 31, 2017 and 2016 included reserves of $11.6 million and $12.4 million, respectively, for an owned site acquired in connection with the 2005 acquisition of HCC Industries (“HCC”). The Company is the designated performing party for the performance of remedial activities for one of several operating units making up a Superfund site in the San Gabriel Valley of California. The Company has obtained indemnifications and other financial assurances from the former owners of HCC related to the costs of the required remedial activities. At December 31, 2017, the Company had $12.0 million in receivables related to HCC for probable recoveries from third-party escrow funds and other committed third-party funds to support the required remediation. Also, the Company is indemnified by HCC’s former owners for approximately $19 million of additional costs.
The Company has agreements with other former owners of certain of its acquired businesses, as well as new owners of previously owned businesses. Under certain of the agreements, the former or new owners retained, or assumed and agreed to indemnify the Company against, certain environmental and other liabilities under certain circumstances. The Company and some of these other parties also carry insurance coverage for some environmental matters. To date, these parties have met their obligations in all material respects.
The Company believes it has established reserves for the environmental matters described above, which are sufficient to perform all known responsibilities under existing claims and consent orders. The Company has no reason to believe that other third parties would fail to perform their obligations in the future. In the opinion of management, based on presently available information and the Company’s historical experience related to such matters, an adequate provision for probable costs has been made and the ultimate cost resulting from these actions is not expected to materially affect the consolidated results of operations, financial position or cash flows of the Company.
The Company has been remediating groundwater contamination for several contaminants, including trichloroethylene (“TCE”), at a formerly owned site in El Cajon, California. Several lawsuits have been filed against the Company alleging damages resulting from the groundwater contamination, including property damages and personal injury, and seeking compensatory and punitive damages. Given the state of uncertainty inherent in these litigations, the Company does not believe it is possible to develop estimates of reasonably possible loss in regard to these matters. The Company believes that it has good and valid defenses to each of these claims and intends to defend them vigorously. The Company does not expect the outcome of these matters, either individually or in the aggregate, to materially affect the consolidated results of operations, financial position or cash flows of the Company.
87
Table of Contents
AMETEK, Inc.
NOTES TO CONSOLIDATED FINANCIAL STATEMENTS — (Continued)
| 14. | Leases and Other Commitments |
Minimum aggregate rental commitments under noncancellable leases in effect at December 31, 2017 (principally for production and administrative facilities and equipment) amounted to $187.3 million, consisting of payments of $39.0 million in 2018, $31.6 million in 2019, $25.1 million in 2020, $21.2 million in 2021, $16.8 million in 2022 and $53.6 million thereafter. The leases expire over a range of years from 2018 to 2082, with renewal or purchase options, subject to various terms and conditions, contained in most of the leases. Rental expense was $49.7 million in 2017, $46.3 million in 2016 and $43.6 million in 2015.
As of December 31, 2017 and 2016, the Company had $390.6 million and $289.1 million, respectively, in purchase obligations outstanding, which primarily consisted of contractual commitments to purchase certain inventories at fixed prices.
| 15. | Reportable Segments and Geographic Areas Information |
Descriptive Information about Reportable Segments
The Company has two reportable segments, EIG and EMG. The Company’s operating segments are identified based on the existence of segment managers. Certain of the Company’s operating segments have been aggregated for segment reporting purposes primarily on the basis of product type, production processes, distribution methods and similarity of economic characteristics.
EIG manufactures advanced instruments for the process, power and industrial, and aerospace markets. It provides process and analytical instruments for the oil and gas, petrochemical, pharmaceutical, semiconductor, automation, and food and beverage industries. It provides instruments to the laboratory equipment, ultraprecision manufacturing, medical, and test and measurement markets. It makes power quality monitoring and metering devices, uninterruptible power supplies, programmable power equipment, electromagnetic compatibility test equipment and gas turbines sensors. It provides dashboard instruments for heavy trucks and other vehicles, as well as instrumentation and controls for the food and beverage industries. It supplies the aerospace industry with aircraft and engine sensors, monitoring systems, power supplies, fuel and fluid measurement systems, and data acquisition systems.
EMG is a differentiated supplier of automation solutions, thermal management systems, specialty metals and electrical interconnects. It manufactures highly engineered electrical connectors and electronic packaging used to protect sensitive electronic devices. It makes precision motion control products for data storage, medical devices, business equipment, automation and other applications. It supplies high-purity powdered metals, strip and foil, specialty clad metals and metal matrix composites. It manufactures motors used in commercial appliances, fitness equipment, food and beverage machines, hydraulic pumps and industrial blowers. It operates a global network of aviation maintenance, repair and overhaul facilities.
Measurement of Segment Results
Segment operating income represents net sales less all direct costs and expenses (including certain administrative and other expenses) applicable to each segment, but does not include interest expense. Net sales by segment are reported after elimination of intra- and intersegment sales and profits, which are insignificant in amount. Reported segment assets include allocations directly related to the segment’s operations. Corporate assets consist primarily of investments, prepaid pensions, insurance deposits and deferred taxes.
88
Table of Contents
AMETEK, Inc.
NOTES TO CONSOLIDATED FINANCIAL STATEMENTS — (Continued)
Reportable Segment Financial Information
| 2017 | 2016 | 2015 | ||||||||||
| (In thousands) | ||||||||||||
| Net sales(1): |
||||||||||||
| Electronic Instruments |
$ | 2,690,554 | $ | 2,360,285 | $ | 2,417,192 | ||||||
| Electromechanical |
1,609,616 | 1,479,802 | 1,557,103 | |||||||||
|
|
|
|
|
|
|
|||||||
| Consolidated net sales |
$ | 4,300,170 | $ | 3,840,087 | $ | 3,974,295 | ||||||
|
|
|
|
|
|
|
|||||||
| Operating income and income before income taxes: |
||||||||||||
| Segment operating income(2): |
||||||||||||
| Electronic Instruments |
$ | 677,489 | $ | 577,717 | $ | 639,399 | ||||||
| Electromechanical |
310,875 | 277,873 | 318,098 | |||||||||
|
|
|
|
|
|
|
|||||||
| Total segment operating income |
988,364 | 855,590 | 957,497 | |||||||||
| Corporate administrative and other expenses |
(73,270 | ) | (53,693 | ) | (49,781 | ) | ||||||
|
|
|
|
|
|
|
|||||||
| Consolidated operating income |
915,094 | 801,897 | 907,716 | |||||||||
| Interest and other expenses, net |
(118,365 | ) | (108,794 | ) | (101,336 | ) | ||||||
|
|
|
|
|
|
|
|||||||
| Consolidated income before income taxes |
$ | 796,729 | $ | 693,103 | $ | 806,380 | ||||||
|
|
|
|
|
|
|
|||||||
| Assets: |
||||||||||||
| Electronic Instruments |
$ | 4,803,575 | $ | 4,104,972 | ||||||||
| Electromechanical |
2,535,503 | 2,446,180 | ||||||||||
|
|
|
|
|
|||||||||
| Total segment assets |
7,339,078 | 6,551,152 | ||||||||||
| Corporate |
456,986 | 549,522 | ||||||||||
|
|
|
|
|
|||||||||
| Consolidated assets |
$ | 7,796,064 | $ | 7,100,674 | ||||||||
|
|
|
|
|
|||||||||
| Additions to property, plant and equipment(3): |
||||||||||||
| Electronic Instruments |
$ | 54,321 | $ | 45,091 | $ | 32,069 | ||||||
| Electromechanical |
36,829 | 39,340 | 88,369 | |||||||||
|
|
|
|
|
|
|
|||||||
| Total segment additions to property, plant and equipment |
91,150 | 84,431 | 120,438 | |||||||||
| Corporate |
3,002 | 1,914 | 2,121 | |||||||||
|
|
|
|
|
|
|
|||||||
| Consolidated additions to property, plant and equipment |
$ | 94,152 | $ | 86,345 | $ | 122,559 | ||||||
|
|
|
|
|
|
|
|||||||
| Depreciation and amortization: |
||||||||||||
| Electronic Instruments |
$ | 108,053 | $ | 104,284 | $ | 83,832 | ||||||
| Electromechanical |
73,222 | 73,767 | 64,539 | |||||||||
|
|
|
|
|
|
|
|||||||
| Total segment depreciation and amortization |
181,275 | 178,051 | 148,371 | |||||||||
| Corporate |
1,952 | 1,665 | 1,089 | |||||||||
|
|
|
|
|
|
|
|||||||
| Consolidated depreciation and amortization |
$ | 183,227 | $ | 179,716 | $ | 149,460 | ||||||
|
|
|
|
|
|
|
|||||||
| (1) | After elimination of intra- and intersegment sales, which are not significant in amount. |
| (2) | Segment operating income represents net sales less all direct costs and expenses (including certain administrative and other expenses) applicable to each segment, but does not include interest expense. |
| (3) | Includes $19.1 million in 2017, $23.1 million in 2016 and $53.4 million in 2015 from acquired businesses. |
89
Table of Contents
AMETEK, Inc.
NOTES TO CONSOLIDATED FINANCIAL STATEMENTS — (Continued)
Geographic Areas
Information about the Company’s operations in different geographic areas for the years ended December 31, 2017, 2016 and 2015 is shown below. Net sales were attributed to geographic areas based on the location of the customer. Accordingly, U.S. export sales are reported in international sales.
| 2017 | 2016 | 2015 | ||||||||||
| (In thousands) | ||||||||||||
| Net sales: |
||||||||||||
| United States |
$ | 2,086,180 | $ | 1,829,341 | $ | 1,919,611 | ||||||
|
|
|
|
|
|
|
|||||||
| International(1): |
||||||||||||
| United Kingdom |
186,534 | 188,700 | 201,192 | |||||||||
| European Union countries |
692,116 | 619,138 | 615,956 | |||||||||
| Asia |
879,426 | 785,868 | 789,435 | |||||||||
| Other foreign countries |
455,914 | 417,040 | 448,101 | |||||||||
|
|
|
|
|
|
|
|||||||
| Total international |
2,213,990 | 2,010,746 | 2,054,684 | |||||||||
|
|
|
|
|
|
|
|||||||
| Total consolidated |
$ | 4,300,170 | $ | 3,840,087 | $ | 3,974,295 | ||||||
|
|
|
|
|
|
|
|||||||
| Long-lived assets from continuing operations (excluding intangible assets): |
||||||||||||
| United States |
$ | 325,908 | $ | 322,743 | ||||||||
|
|
|
|
|
|||||||||
| International(2): |
||||||||||||
| United Kingdom |
62,643 | 59,208 | ||||||||||
| European Union countries |
65,204 | 58,368 | ||||||||||
| Asia |
12,073 | 12,204 | ||||||||||
| Other foreign countries |
27,468 | 20,707 | ||||||||||
|
|
|
|
|
|||||||||
| Total international |
167,388 | 150,487 | ||||||||||
|
|
|
|
|
|||||||||
| Total consolidated |
$ | 493,296 | $ | 473,230 | ||||||||
|
|
|
|
|
|||||||||
| (1) | Includes U.S. export sales of $1,142.3 million in 2017, $1,036.0 million in 2016 and $1,090.7 million in 2015. |
| (2) | Represents long-lived assets of foreign-based operations only. |
| 16. | Additional Consolidated Income Statement and Cash Flow Information |
Included in other income are interest and other investment income of $2.1 million, $1.2 million and $0.7 million for 2017, 2016 and 2015, respectively. Income taxes paid in 2017, 2016 and 2015 were $176.6 million, $180.8 million and $157.8 million, respectively. Cash paid for interest was $96.1 million, $91.8 million and $90.8 million in 2017, 2016 and 2015, respectively.
90
Table of Contents
AMETEK, Inc.
NOTES TO CONSOLIDATED FINANCIAL STATEMENTS — (Continued)
| 17. | Stockholders’ Equity |
In 2016, the Company repurchased approximately 7,099,000 shares of its common stock for $336.1 million in cash under its share repurchase authorization. On November 2, 2016, the Company’s Board of Directors approved an increase of $400 million in the authorization for the repurchase of the Company’s common stock. At December 31, 2016, $375.6 million was available under the Company’s Board of Directors authorization for future share repurchases. In 2017, the Company repurchased approximately 114,000 shares of its common stock for $6.9 million in cash under its share repurchase authorization. At December 31, 2017, $368.7 million was available under the Company’s Board of Directors authorization for future share repurchases.
At December 31, 2017, the Company held 31.8 million shares in its treasury at a cost of $1,209.1 million, compared with 32.1 million shares at a cost of $1,211.5 million at December 31, 2016. The number of shares outstanding at December 31, 2017 was 231.2 million shares, compared with 229.4 million shares at December 31, 2016.
The Company had a Shareholder Rights Plan, which expired in June 2017. Under the Plan, the Company’s Board of Directors declared a dividend of one Right for each share of Company common stock owned at the close of business on June 2, 2007, and authorized the issuance of one Right for each share of common stock of the Company issued between the Record Date and the Distribution Date. The Plan provided, under certain conditions involving acquisition of the Company’s common stock, that holders of Rights, except for the acquiring entity, would be entitled (i) to purchase shares of preferred stock at a specified exercise price, or (ii) to purchase shares of common stock of the Company, or the acquiring company, having a value of twice the Rights exercise price.
Subsequent Event
Effective February 1, 2018, the Company’s Board of Directors approved a 56% increase in the quarterly cash dividend on the Company’s common stock to $0.14 per common share from $0.09 per common share.
| 18. | Restructuring Charges |
During the fourth quarter of 2017, the Company recorded pre-tax restructuring charges totaling $10.8 million, which had the effect of reducing net income by $9.1 million. The restructuring charges were reported in the consolidated statement of income in Cost of sales. The restructuring charges were reported in segment operating income as follows: $4.5 million in EIG and $6.3 million in EMG. The restructuring actions were composed of $3.0 million in severance costs for a reduction in workforce and $7.8 million of asset write-downs to better position the Company’s long-term cost structure and included costs associated with the continued consolidation of the Company’s floor care and specialty motors businesses into its precision motion control businesses. The restructuring activities will be broadly implemented across the Company’s various businesses through the end of 2018, with most actions expected to be completed in 2019.
During the fourth quarter of 2016, the Company recorded pre-tax restructuring charges totaling $25.6 million, which had the effect of reducing net income by $17.0 million. The restructuring charges were reported in the consolidated statement of income as follows: $24.0 million in Cost of sales and $1.6 million in Selling, general and administrative expenses. The restructuring charges were reported in segment operating income as follows: $12.4 million in EIG, $11.6 million in EMG and $1.6 million in corporate administrative expenses. The restructuring actions primarily related to $19.3 million in severance costs for a reduction in workforce and $6.2 million of asset write-downs in response to the impact of a weak global economy on certain of the Company’s businesses and the effects of a continued strong U.S. dollar. The restructuring activities have been broadly implemented across the Company’s various businesses with most actions expected to be completed in 2018.
91
Table of Contents
AMETEK, Inc.
NOTES TO CONSOLIDATED FINANCIAL STATEMENTS — (Continued)
During the fourth quarter of 2015, the Company recorded pre-tax restructuring charges totaling $20.7 million, which had the effect of reducing net income by $13.9 million. The restructuring charges were reported in the consolidated statement of income as follows: $20.0 million in Cost of sales and $0.7 million in Selling, general and administrative expenses. The restructuring charges were reported in segment operating income as follows: $9.3 million in EIG, $10.8 million in EMG and $0.7 million in corporate administrative expenses. The restructuring actions primarily related to a reduction in workforce in response to the impact of a weak global economy on certain of the Company’s businesses and the effects of a continued strong U.S. dollar. The restructuring activities have been broadly implemented across the Company’s various businesses with all actions expected to be completed in 2018.
Accrued liabilities in the Company’s consolidated balance sheet included amounts related to the fourth quarters of 2017, 2016 and 2015 restructuring charges as follows (in millions):
| Fourth Quarter of 2017 Restructuring |
Fourth Quarter of 2016 Restructuring |
Fourth Quarter of 2015 Restructuring |
||||||||||
| Balance at December 31, 2015 |
$ | — | $ | — | $ | 19.3 | ||||||
| Pre-tax charges |
— | 25.6 | — | |||||||||
| Utilization |
— | (6.4 | ) | (9.2 | ) | |||||||
| Foreign currency translation adjustments and other |
— | — | (0.9 | ) | ||||||||
|
|
|
|
|
|
|
|||||||
| Balance at December 31, 2016 |
— | 19.2 | 9.2 | |||||||||
| Pre-tax charges |
10.8 | — | — | |||||||||
| Utilization |
(7.8 | ) | (6.4 | ) | (2.4 | ) | ||||||
| Foreign currency translation adjustments and other |
— | — | (0.1 | ) | ||||||||
|
|
|
|
|
|
|
|||||||
| Balance at December 31, 2017 |
$ | 3.0 | $ | 12.8 | $ | 6.7 | ||||||
|
|
|
|
|
|
|
|||||||
92
Table of Contents
AMETEK, Inc.
NOTES TO CONSOLIDATED FINANCIAL STATEMENTS — (Continued)
| 19. | Quarterly Financial Data (Unaudited) |
| First Quarter |
Second Quarter |
Third Quarter |
Fourth Quarter |
Total Year | ||||||||||||||||
| (In thousands, except per share amounts) | ||||||||||||||||||||
| 2017 |
||||||||||||||||||||
| Net sales |
$ | 1,007,682 | $ | 1,064,604 | $ | 1,084,799 | $ | 1,143,085 | $ | 4,300,170 | ||||||||||
| Operating income(1) |
$ | 220,298 | $ | 232,385 | $ | 232,831 | $ | 229,580 | $ | 915,094 | ||||||||||
| Net income(1)(2) |
$ | 138,926 | $ | 150,481 | $ | 153,531 | $ | 238,532 | $ | 681,470 | ||||||||||
| Basic earnings per share(1)(2)(3) |
$ | 0.61 | $ | 0.65 | $ | 0.67 | $ | 1.03 | $ | 2.96 | ||||||||||
| Diluted earnings per share(1)(2)(3) |
$ | 0.60 | $ | 0.65 | $ | 0.66 | $ | 1.03 | $ | 2.94 | ||||||||||
| Dividends paid per share |
$ | 0.09 | $ | 0.09 | $ | 0.09 | $ | 0.09 | $ | 0.36 | ||||||||||
| 2016 |
||||||||||||||||||||
| Net sales |
$ | 944,398 | $ | 977,706 | $ | 945,030 | $ | 972,953 | $ | 3,840,087 | ||||||||||
| Operating income(4)(5) |
$ | 208,523 | $ | 219,036 | $ | 201,116 | $ | 173,222 | $ | 801,897 | ||||||||||
| Net income(4)(5) |
$ | 134,170 | $ | 138,193 | $ | 130,687 | $ | 109,108 | $ | 512,158 | ||||||||||
| Basic earnings per share(3)(4)(5) |
$ | 0.57 | $ | 0.59 | $ | 0.56 | $ | 0.47 | $ | 2.20 | ||||||||||
| Diluted earnings per share(3)(4)(5) |
$ | 0.57 | $ | 0.59 | $ | 0.56 | $ | 0.47 | $ | 2.19 | ||||||||||
| Dividends paid per share |
$ | 0.09 | $ | 0.09 | $ | 0.09 | $ | 0.09 | $ | 0.36 | ||||||||||
| (1) | During 2017, the Company recorded pre-tax restructuring charges totaling $10.8 million, recorded in the fourth quarter of 2017. The restructuring charges had the effect of reducing net income for 2017 by $9.1 million. See Note 18. |
| (2) | During 2017, the Company recorded a net benefit of $91.6 million in the consolidated statement of income as a component of Provision for income taxes related to the Act. The net benefit related to the Act had the effect of increasing net income for 2017 by $91.6 million. See Note 8. |
| (3) | The sum of quarterly earnings per share may not equal total year earnings per share due to rounding of earnings per share amounts, and differences in weighted average shares and equivalent shares outstanding for each of the periods presented. |
| (4) | During 2016, the Company recorded pre-tax restructuring charges totaling $25.6 million, recorded in the fourth quarter of 2016. The restructuring charges had the effect of reducing net income for 2016 by $17.0 million. See Note 18. |
| (5) | During 2016, the Company recorded a $13.9 million non-cash impairment charge related to certain of the Company’s trade names. The impairment charge had the effect of reducing net income for 2016 by $8.6 million. See Note 6. |
93
Table of Contents
| Item 9. | Changes in and Disagreements With Accountants on Accounting and Financial Disclosure |
None.
| Item 9A. | Controls and Procedures |
Disclosure Controls and Procedures
The Company maintains a system of disclosure controls and procedures that is designed to provide reasonable assurance that information, which is required to be disclosed, is accumulated and communicated to management in a timely manner. Under the supervision and with the participation of our management, including the Company’s principal executive officer and principal financial officer, we have evaluated the effectiveness of our system of disclosure controls and procedures as required by Exchange Act Rule 13a-15(b) as of December 31, 2017. Based on that evaluation, the Company’s principal executive officer and principal financial officer concluded that the Company’s disclosure controls and procedures are effective at the reasonable assurance level.
Such evaluation did not identify any change in the Company’s internal control over financial reporting during the quarter ended December 31, 2017 that has materially affected, or is reasonably likely to materially affect, the Company’s internal control over financial reporting.
Internal Control over Financial Reporting
Management’s report on the Company’s internal controls over financial reporting is included in Part II, Item 8 of this Annual Report on Form 10-K. The report of the independent registered public accounting firm with respect to the effectiveness of internal control over financial reporting is included in Part II, Item 8 of this Annual Report on Form 10-K.
| Item 9B. | Other Information |
None.
PART III
| Item 10. | Directors, Executive Officers and Corporate Governance |
| a) | Directors of the Registrant. |
Information with respect to Directors of the Company is set forth under the heading “Election of Directors” in the Company’s Proxy Statement for the 2018 Annual Meeting of Stockholders and is incorporated herein by reference.
| b) | Executive Officers of the Registrant. |
Information with respect to executive officers of the Company is set forth under the heading “Executive Officers” in the Company’s Proxy Statement for the 2018 Annual Meeting of Stockholders and is incorporated herein by reference.
| c) | Section 16(a) Compliance. |
Information concerning compliance with Section 16(a) of the Securities Exchange Act of 1934 is set forth under the heading “Compliance with Section 16(a) of the Securities Exchange Act of 1934” in the Company’s Proxy Statement for the 2018 Annual Meeting of Stockholders and is incorporated herein by reference.
94
Table of Contents
| d) | Identification of the Audit Committee. |
Information concerning the audit committee of the Company is set forth under the heading “Committees of the Board” in the Company’s Proxy Statement for the 2018 Annual Meeting of Stockholders and is incorporated herein by reference.
| e) | Audit Committee Financial Expert. |
Information concerning the audit committee financial expert of the Company is set forth under the heading “Committees of the Board” in the Company’s Proxy Statement for the 2018 Annual Meeting of Stockholders and is incorporated herein by reference.
| f) | Corporate Governance/Nominating Committee. |
Information concerning any material changes to the way in which security holders may recommend nominees to the Company’s Board of Directors is set forth under the heading “Corporate Governance” in the Company’s Proxy Statement for the 2018 Annual Meeting of Stockholders and is incorporated herein by reference.
| g) | Code of Ethics for Chief Executive Officer and Senior Financial Officers. |
The Company has adopted a Code of Ethics for the principal executive officer, principal financial officer and principal accounting officer, which may be found on the Company’s website at www.ametek.com. Any amendments to the Code of Ethics or any grant of a waiver from the provisions of the Code of Ethics requiring disclosure under applicable U.S. Securities and Exchange Commission rules will be disclosed on the Company’s website.
| Item 11. | Executive Compensation |
Information regarding executive compensation, including the “Compensation Discussion and Analysis,” the “Report of the Compensation Committee,” “Compensation Tables” and “Potential Payments Upon Termination or Change of Control” is set forth under the heading “Executive Compensation” in the Company’s Proxy Statement for the 2018 Annual Meeting of Stockholders and is incorporated herein by reference.
| Item 12. | Security Ownership of Certain Beneficial Owners and Management and Related Stockholder Matters |
Information regarding security ownership of certain beneficial owners and management appearing under “Stock Ownership of Executive Officers and Directors” and “Beneficial Ownership of Principal Stockholders” in the Company’s Proxy Statement for the 2018 Annual Meeting of Stockholders is incorporated herein by reference.
| Item 13. | Certain Relationships and Related Transactions, and Director Independence |
Information appearing under “Certain Relationships and Related Transactions” and “Independence” in the Company’s Proxy Statement for the 2018 Annual Meeting of Stockholders is incorporated herein by reference.
| Item 14. | Principal Accounting Fees and Services |
Information appearing under “Ratification of Appointment of Independent Registered Public Accounting Firm” in the Company’s Proxy Statement for the 2018 Annual Meeting of Stockholders is incorporated herein by reference.
95
Table of Contents
PART IV
| Item 15. | Exhibits and Financial Statement Schedules |
(a)(1) Financial Statements:
Financial statements are shown in the Index to Financial Statements included in Part II, Item 8 of this Annual Report on Form 10-K.
(a)(2) Financial Statement Schedules:
Financial statement schedules have been omitted because either they are not applicable or the required information is included in the financial statements or the notes thereto.
(a)(3) Exhibits:
96
Table of Contents
97
Table of Contents
| † | Management contract or compensatory plan required to be filed pursuant to Item 601 of Regulation S-K. |
| * | Filed electronically herewith. |
98
Table of Contents
Pursuant to the requirements of Section 13 or 15(d) of the Securities Exchange Act of 1934, the registrant has duly caused this report to be signed on its behalf by the undersigned, thereunto duly authorized.
| AMETEK, Inc. | ||||||||
| By: |
/s/ DAVID A. ZAPICO | |||||||
| David A. Zapico | ||||||||
| Chief Executive Officer | ||||||||
| Date: February 22, 2018 |
||||||||
Pursuant to the requirements of the Securities Exchange Act of 1934, this report has been signed below by the following persons on behalf of the registrant and in the capacities and on the dates indicated.
| Signature |
Title |
Date | ||
| /s/ DAVID A. ZAPICO David A. Zapico |
Chairman of the Board of Directors and Chief Executive Officer (Principal Executive Officer) |
February 22, 2018 | ||
| /s/ WILLIAM J. BURKE William J. Burke |
Executive Vice President – Chief Financial Officer (Principal Financial Officer) |
February 22, 2018 | ||
| /s/ THOMAS M. MONTGOMERY Thomas M. Montgomery |
Senior Vice President – Comptroller (Principal Accounting Officer) |
February 22, 2018 | ||
| /s/ THOMAS A. AMATO Thomas A. Amato |
Director | February 22, 2018 | ||
| /s/ RUBY R. CHANDY Ruby R. Chandy |
Director | February 22, 2018 | ||
| /s/ ANTHONY J. CONTI Anthony J. Conti |
Director | February 22, 2018 | ||
| /s/ STEVEN W. KOHLHAGEN Steven W. Kohlhagen |
Director | February 22, 2018 | ||
| /s/ JAMES R. MALONE James R. Malone |
Director | February 22, 2018 | ||
| /s/ GRETCHEN W. MCCLAIN Gretchen W. McClain |
Director | February 22, 2018 | ||
| /s/ ELIZABETH R. VARET Elizabeth R. Varet |
Director | February 22, 2018 | ||
| /s/ DENNIS K. WILLIAMS Dennis K. Williams |
Director | February 22, 2018 | ||
99