Attached files
| file | filename |
|---|---|
| EX-32.2 - EXHIBIT 32.2 - Taylor Morrison Home Corp | tmhc-123117xex322q4.htm |
| EX-32.1 - EXHIBIT 32.1 - Taylor Morrison Home Corp | tmhc-123117xex321q4.htm |
| EX-31.2 - EXHIBIT 31.2 - Taylor Morrison Home Corp | tmhc-123117xex312q4.htm |
| EX-31.1 - EXHIBIT 31.1 - Taylor Morrison Home Corp | tmhc-123117xex311q4.htm |
| EX-23.1 - EXHIBIT 23.1 - Taylor Morrison Home Corp | tmhc-123117xex231q4.htm |
| EX-21.1 - EXHIBIT 21.1 - Taylor Morrison Home Corp | tmhc-123117xex211q4.htm |
| EX-10.9(D) - EXHIBIT 10.9(D) - Taylor Morrison Home Corp | taylormorrisonamendmentn.htm |
UNITED STATES
SECURITIES AND EXCHANGE COMMISSION
Washington, D.C. 20549
Form 10-K
ý | ANNUAL REPORT PURSUANT TO SECTION 13 OR 15(d) OF THE SECURITIES EXCHANGE ACT OF 1934 |
For the fiscal year ended December 31, 2017
or
¨ | TRANSITION REPORT PURSUANT TO SECTION 13 OR 15(d) OF THE SECURITIES EXCHANGE ACT OF 1934 |
For the transition period from to .
Commission File No. 001-35873
TAYLOR MORRISON HOME CORPORATION
(Exact name of registrant as specified in its charter)
Delaware | 90-0907433 | |
(State or other jurisdiction of incorporation or organization) | (I.R.S. Employer Identification No.) | |
4900 N. Scottsdale Road, Suite 2000, Scottsdale, Arizona 85251
(Address of principal executive offices) (Zip Code)
Registrant’s telephone number, including area code: (480) 840-8100
Securities Registered Pursuant to Section 12(b) of the Act:
Title of each class | Name of each exchange on which registered | |
Class A Common Stock, $0.00001 par value | New York Stock Exchange | |
Securities Registered Pursuant to Section 12(g) of the Act: None
Indicate by check mark if the registrant is a well-known seasoned issuer, as defined in Rule 405 of the Securities Act. Yes ¨ No ý
Indicate by check mark if the registrant is not required to file reports pursuant to Section 13 or Section 15(d) of the Act. Yes ¨ No ý
Indicate by check mark whether the registrant (1) has filed all reports required to be filed by Section 13 or 15(d) of the Securities Exchange Act of 1934 during the preceding 12 months (or for such shorter period that the registrant was required to file such reports), and (2) has been subject to such filing requirements for the past 90 days. Yes ý No ¨
Indicate by check mark whether the registrant has submitted electronically and posted on its corporate Web site, if any, every Interactive Data File required to be submitted and posted pursuant to Rule 405 of Regulation S-T during the preceding 12 months (or for such shorter period that the registrant was required to submit and post such files). Yes ý No ¨
Indicate by check mark if disclosure of delinquent filers pursuant to Item 405 of Regulation S-K is not contained herein, and will not be contained, to the best of registrant’s knowledge, in definitive proxy or information statements incorporated by reference in Part III of this Form 10-K or any amendment to this Form 10-K. ý
Indicate by check mark whether the registrant is a large accelerated filer, an accelerated filer, a non-accelerated filer, a smaller reporting company, or an emerging growth company. See the definitions of “large accelerated filer,” “accelerated filer,” “smaller reporting company,” and "emerging growth company" in Rule 12b-2 of the Exchange Act. (Check one):
Large accelerated filer | ý | Accelerated filer | ¨ |
Non-accelerated filer | ¨ | Smaller reporting company | ¨ |
Emerging growth company | ¨ | ||
If an emerging growth company, indicate by check mark if the registrant has elected not to use the extended transition period for complying with any new or revised financial accounting standards provided pursuant to Section 13(a) of the Exchange Act. ¨
Indicate by check mark whether the registrant is a shell company (as defined in Rule 12b-2 of the Exchange Act). Yes ¨ No ý
The aggregate market value of voting stock held by non-affiliates of the registrant on June 30, 2017 was $1,702,454,297, based on the closing sales price per share as reported by the New York Stock Exchange on such date.
Indicate the number of shares outstanding of each of the issuer’s classes of common stock, as of February 21, 2018 :
Class | Outstanding | ||
Class A Common Stock, $0.00001 par value | 111,232,162 | ||
Class B Common Stock, $0.00001 par value | 883,921 | ||
Documents Incorporated by Reference
Portions of Part III of this Form 10-K are incorporated by reference from the Registrant’s definitive proxy statement for its 2018 annual meeting of shareholders to be filed with the Securities and Exchange Commission no later than 120 days after the end of the Registrant’s fiscal year.
TAYLOR MORRISON HOME CORPORATION
FORM 10-K
FOR THE YEAR ENDED DECEMBER 31, 2017
TABLE OF CONTENTS
Page Number | ||
i
Available Information
Information about our company and communities is provided on our Internet websites at www.taylormorrison.com and www.darlinghomes.com (collectively, the “Taylor Morrison website”). The information contained on or accessible through the Taylor Morrison website is not considered part of this Annual Report on Form 10-K (“Annual Report”). Our periodic and current reports, including any amendments, filed or furnished pursuant to Section 13(a) or 15(d) of the Securities Exchange Act of 1934, as amended (the “Exchange Act”), are available, free of charge, on our Taylor Morrison website as soon as reasonably practicable after they are electronically filed with or furnished to the Securities and Exchange Commission (“SEC”). These filings are also available on the SEC’s website at www.sec.gov. In addition to our SEC filings, our corporate governance documents, including our Code of Conduct and Ethics and Corporate Governance Guidelines are available on the “Investor Relations” page of our Taylor Morrison website under “Corporate Governance.” To the extent required by the SEC's rules and regulations, we intend to post amendments to or waivers from, if any, provisions of our Code of Conduct and Ethics (to the extent applicable to our directors, principal executive officer, principal financial officer and principal accounting officer) at this location on the Taylor Morrison website. Our stockholders may also obtain these documents in paper format free of charge upon request made to our Investor Relations department.
In this Annual Report, unless the context requires otherwise, references to “the Company,” “we,” “us,” or “our” are to Taylor Morrison Home Corporation (“TMHC”) and its subsidiaries.
TMHC was incorporated in Delaware in November 2012. Our principal executive offices are located at 4900 N. Scottsdale Road, Suite 2000, Scottsdale, Arizona 85251 and the telephone number is (480) 840-8100.
Forward-Looking Statements
Certain information included in this Annual Report or in other materials we have filed or will file with the SEC (as well as information included in oral statements or other written statements made or to be made by us) contains or may contain forward-looking statements within the meaning of Section 27A of the Securities Act of 1933, as amended (the “Securities Act”), and Section 21E of the Exchange Act. You can identify these statements by the fact that they do not relate to matters of strictly historical or factual nature and generally discuss or relate to estimates or other expectations regarding future events. They contain words such as, but not limited to, “anticipate,” “estimate,” “expect,” “project,” “intend,” “plan,” “believe,” “may,” “can,” “could,” “might,” “should” and other words or phrases of similar meaning in connection with any discussion of our strategy or future operating or financial performance. As you read this Annual Report and other reports or public statements, you should understand that these statements are not guarantees of performance or results. They involve known and unknown risks, uncertainties and assumptions, including those described under the heading “Risk Factors” in Part I, Item 1A and elsewhere in this Annual Report. Although we believe that these forward-looking statements are based upon reasonable assumptions, you should be aware that many factors, including those described under the heading “Risk Factors” in Part I, Item 1A, and elsewhere in this Annual Report, could affect our actual financial results or results of operations and could cause actual results to differ materially from those in the forward-looking statements.
Forward-looking statements speak only as of the date they are made. We undertake no obligation to publicly update any forward-looking statements, whether as a result of new information, future events or otherwise, except as required by law. This discussion is provided as permitted by the Private Securities Litigation Reform Act of 1995, and all of our forward-looking statements are expressly qualified in their entirety by the cautionary statements contained or referenced in this section.
1
PART I
ITEM 1. BUSINESS
General Overview
We are one of the largest public homebuilders in the United States. We are also a land developer, with a portfolio of lifestyle and master-planned communities. We provide a diverse assortment of homes across a wide range of price points. We strive to appeal to a broad spectrum of customers in traditionally high growth markets, where we design, build and sell single-family detached and attached homes. We operate under the Taylor Morrison and Darling Homes brand names. We also provide financial services to customers through our wholly owned mortgage subsidiary, Taylor Morrison Home Funding, LLC (“TMHF”) and title insurance and closing settlement services through our title company, Inspired Title Services, LLC (“Inspired Title”).
We have operations in Arizona, California, Colorado, Florida, Georgia, Illinois, North Carolina and Texas. Our business is organized into multiple homebuilding operating components and a mortgage and title services component, which are managed as multiple reportable segments, as follows:
East | Atlanta, Charlotte, Chicago, Orlando, Raleigh, Southwest Florida, and Tampa | |
Central | Austin, Dallas and Houston (both include a Taylor Morrison division and a Darling Homes division) and Denver | |
West | Bay Area, Phoenix, Sacramento, and Southern California | |
Mortgage Operations | Taylor Morrison Home Funding (“TMHF”) and Inspired Title Services, LLC (“Inspired Title”) | |
Over the last several years we have grown organically and through various builder acquisitions, including our acquisition in April 2015 of JEH Homes, an Atlanta based homebuilder; our acquisition in July 2015 of three divisions of Orleans Homes in new markets within Charlotte, Chicago and Raleigh; and our acquisition in January 2016 of Acadia Homes in Atlanta. Each of these acquisitions represents our strategic approach in expanding our geographic footprint in new, high-growth markets.
Organizational Structure
As a result of the completion of our initial public offering (“IPO”) April 12, 2013 and a series of transactions pursuant to a Reorganization Agreement dated as of April 9, 2013, TMHC formed and became the owner and general partner of New TMM. New TMM was formed by a consortium of investors comprised of affiliates of TPG Global, LLC (the “TPG Entities” or “TPG”), investment funds managed by Oaktree Capital Management, L.P. (“Oaktree”) or their respective subsidiaries (together, the “Oaktree Entities”), and affiliates of JH Investments, Inc. (“JH” and together with the TPG Entities and Oaktree Entities, the “Principal Equityholders”).
Since January 2017, we have completed seven public offerings for an aggregate of 80.2 million shares of our Class A Common Stock, using all of the net proceeds therefrom to repurchase our Principal Equityholders' indirect interest in TMHC. In January 2018, we also purchased an additional 7.6 million shares of our Class B Common Stock from our Principal Equityholders. As a result of the series of offerings and repurchases, the Principal Equityholders ownership decreased to 31.1% at December 31, 2017 and to zero by January 31, 2018.
2017 Highlights and Recent Developments
Our financial and operational highlights for the year ended December 31, 2017 and recent developments subsequent to the year end are summarized below:
Financial
• | We generated $3.9 billion in total revenue and $3.8 billion in home closings revenue for the year ended December 31, 2017, an increase of 11% compared to the prior year's home closings revenue. |
• | Net income from continuing operations and diluted earnings per share for the year ended December 31, 2017 was $176.7 million and $1.47 compared to $206.6 million and $1.69 for the year ended December 31, 2016. |
2
• | Adjusting for the effects of the Tax Cuts and Jobs Act (“Tax Act”), enacted on December 22, 2017, net income from continuing operations for the year ended December 31, 2017 was $237.6 million or 15.0% higher than the prior year. Similarly, diluted earnings per share adjusted for tax reform effects in 2017 was $1.98 compared to $1.69 for the year ended December 31, 2016. See Note 13 - Income taxes for discussion regarding Tax Act effects. |
• | As a result of the Tax Act, we have recorded a non-cash provisional income tax expense of $57.4 million to account for the revaluation of our existing deferred tax assets due to the lower tax rate and we have recorded an estimated $3.6 million charge which may be payable over eight years related to the mandatory deemed repatriation of foreign earnings related to the sale of our Canadian operations in 2015. |
• | On January 26, 2018 we amended the maturity date of our $500 million Revolving Credit Facility from April 2019 to January 2022 allowing incremental financial flexibility. |
• | As of December 31, 2017, our total liquidity was $1.0 billion, including $573.9 million in cash. |
• | As of December 31, 2017 our net homebuilding debt to capitalization ratio of 25.8%. |
Operational
• | During 2017, our operations were located in eight states with 297 average active communities. |
• | We sold and closed nearly 12.0% and 9.0%, respectively, more homes during 2017 compared to 2016. |
• | Sales pace for the year ended December 31, 2017 was 2.4 compared to 2.0 for the year ended December 31, 2016. |
• | Average sales price of homes closed was $473,000 for the year ended December 31, 2017. |
• | We ended 2017 with $1.7 billion in sales order backlog. |
• | At December 31, 2017 we owned and controlled approximately 38,000 lots. |
• | For the last three consecutive years, we were awarded America’s Most Trusted Home Builder® by Lifestory Research. |
• | We were recognized and awarded as one of the Best Places to Work by Glassdoor. |
Business Strategy
Our long-term strategy is built on four pillars:
• | pursuing core locations; |
• | building distinctive communities; |
• | maintaining a cost-efficient culture; and |
• | appropriately balancing price with pace in the sale of our homes. |
We are committed to building authentic homes and communities that inspire and enhance the lives of our customers. Delivering on this involves thoughtful design and research to accommodate the needs of our various customers and the surrounding community. The Taylor Morrison difference begins by providing our customers with homes that are both conducive to their lifestyles and built to last, prioritizing our commitment for the long-term satisfaction of our homeowners. Our communities are generally “lifestyle” communities in core locations, which have various distinguishing attributes, including proximity to job centers, attractive school systems and a variety of local amenities in well-regarded submarkets.
Our dedication to service defines our customer experience and acknowledges homeowners’ suggestions to incorporate style, quality and sustainability into every community we develop. We offer a range of award-winning and innovative designs with a number of features such as single-story, ranch style living, split bedroom plans and first floor master bedroom suites to appeal to diverse buyer needs. We engage unaffiliated architectural firms and internal architectural resources to develop and augment existing plans in order to ensure that our homes reflect current and local consumer tastes. We engineer our homes for energy-efficiency and cost savings to reduce the impact on the environment. We serve all segments and generational groups through our quality products which attract entry-level, move-up, luxury and active adult buyers.
We acquire our land assets in core locations, focusing on the preferences of our buyers, building desirable communities, continually evaluating and analyzing overhead efficiency and optimizing profit by managing volume. In addition, we seek to maximize long-term shareholder value and operate our business to capitalize on market appreciation and mitigate risks from economic downturns as we recognize the cyclical nature of the housing market and home price volatility. We regularly assess our capital allocation strategy to drive shareholder return. We also take advantage of joint venture opportunities as they arise in order to secure prime assets, share risk and maximize returns.
We believe our extensive land position and pipeline have positioned us for strategic growth and increased profitability in an improving housing market. We execute this strategy by:
3
• | Maximizing our existing land supply through enhanced product offerings; |
• | Combining land acquisition and development expertise with homebuilding operations; |
• | Focusing product offerings on specific customer groups; |
• | Building aspirational homes for our customers and delivering superior customer service; |
• | Maintaining an efficient capital structure; |
• | Selectively pursuing acquisitions; and |
• | Employing and retaining a highly experienced management team with a strong operating track record. |
Land and Development Strategies
Community development includes the acquisition and development of communities, which may include obtaining significant planning and entitlement approvals and completing construction of off-site and on-site utilities and infrastructure. We generally operate as community developers, but in some communities we operate solely as merchant builders, in which case, we acquire fully planned and entitled lots and may construct on-site improvements.
In order to maximize our expected risk-adjusted return, the allocation of capital for land investment is performed at the corporate level with a disciplined approach to overall portfolio management. Our portfolio investment committee of senior executives meets on a regular basis. Annually, our operating divisions prepare a strategic plan for their respective geographies. Macro and micro indices, including but not limited to employment, housing starts, new home sales, re-sales and foreclosures, along with market related shifts in competition, land availability and consumer preferences, are carefully analyzed to determine our land and homebuilding strategy. Supply and demand are analyzed on a consumer segment and submarket basis to ensure land investment is targeted appropriately. Our long-term plan is compared on an ongoing basis to current conditions in the marketplace as they evolve and is adjusted to the extent necessary. Major development strategy decisions regarding community positioning are included in the decision making and underwriting process and are made in consultation with senior executives of our management team. Our land portfolio as of December 31, 2017 and 2016 is summarized below:
As of December 31, 2017 | ||||||||||||||||||||
Owned Lots | Controlled Lots | Owned and Controlled Lots | ||||||||||||||||||
Raw | Partially Developed | Finished | Long- Term Strategic Assets | Total | Total | Total | ||||||||||||||
East | 5,365 | 2,600 | 4,987 | — | 12,952 | 5,820 | 18,772 | |||||||||||||
Central | 2,140 | 1,237 | 3,748 | — | 7,125 | 4,602 | 11,727 | |||||||||||||
West | 198 | 1,974 | 2,909 | 763 | 5,844 | 1,469 | 7,313 | |||||||||||||
Total | 7,703 | 5,811 | 11,644 | 763 | 25,921 | 11,891 | 37,812 | |||||||||||||
As of December 31, 2016 | ||||||||||||||||||||
Owned Lots | Controlled Lots | Owned and Controlled Lots | ||||||||||||||||||
Raw | Partially Developed | Finished | Long- Term Strategic Assets | Total | Total | Total | ||||||||||||||
East | 3,319 | 5,707 | 4,296 | 293 | 13,615 | 5,164 | 18,779 | |||||||||||||
Central | 3,278 | 1,371 | 3,710 | — | 8,359 | 4,170 | 12,529 | |||||||||||||
West | 545 | 959 | 3,312 | 1,196 | 6,012 | 985 | 6,997 | |||||||||||||
Total | 7,142 | 8,037 | 11,318 | 1,489 | 27,986 | 10,319 | 38,305 | |||||||||||||
Raw land represents property that has not been developed and remains in its natural state. Partially developed represents land where the grading and horizontal development process has begun. Finished lots represent those lots which we have purchased
4
from third parties in addition to lots for which we have completed the horizontal development and are ready for the vertical or homebuilding construction. Long-term strategic assets are those lots where we are currently not performing any development.
In the land purchasing and/or joint venture configuration process, specific projects of interest are typically identified by the local divisional teams, including proposed ownership structure, environmental concerns, anticipated product segmentation, competitive environment and financial returns, and they are presented to our portfolio investment committee for review. Certain portfolio opportunities will often be sourced centrally and managed at the corporate level. We also determine whether continued spending on currently owned and controlled land is a well-timed and appropriate use of capital. Our portfolio investment strategy emphasizes expected profitability to reflect the risk and timing of returns, and the level of sales volume in new and existing markets.
The following is a summary of the status of our land positions:
(Dollars in thousands) | As of December 31, 2017 | As of December 31, 2016 | |||||||||||
Development Status | Owned Lots | Book Value of Land and Development | Owned Lots | Book Value of Land and Development | |||||||||
Raw land | 7,703 | $ | 338,642 | 7,142 | $ | 403,902 | |||||||
Partially developed | 5,811 | 543,200 | 8,037 | 501,496 | |||||||||
Finished lots | 11,644 | 1,314,243 | 11,318 | 1,336,709 | |||||||||
Long-term strategic assets | 763 | 10,730 | 1,489 | 16,182 | |||||||||
Total | 25,921 | $ | 2,206,815 | 27,986 | $ | 2,258,289 | |||||||
As of December 31, 2017 and 2016, the allocation of lots held in our land portfolio, by year acquired, is as follows:
Allocation of Lots in Land Portfolio, by Year Acquired | As of December 31, 2017 | As of December 31, 2016 | |||
Acquired in 2017 | 23 | % | — | % | |
Acquired in 2016 | 15 | % | 17 | % | |
Acquired in 2015 | 13 | % | 20 | % | |
Acquired in 2014 and earlier | 49 | % | 63 | % | |
Total | 100 | % | 100 | % | |
Homes in Inventory
We manage our inventory of homes under construction by selectively commencing construction to capture new home demand, while monitoring the number and aging of unsold homes.
5
The following is a summary of our homes in inventory by homebuilding reporting segment as of December 31, 2017 and December 31, 2016:
As of December 31, 2017 | As of December 31, 2016 | ||||||||||||||||||||||
Homes in Backlog | Models | Inventory to be Sold | Total | Homes in Backlog | Models | Inventory to be Sold | Total | ||||||||||||||||
East | 1,513 | 129 | 603 | 2,245 | 1,220 | 144 | 447 | 1,811 | |||||||||||||||
Central | 1,051 | 142 | 439 | 1,632 | 958 | 140 | 390 | 1,488 | |||||||||||||||
West | 932 | 119 | 391 | 1,442 | 953 | 128 | 349 | 1,430 | |||||||||||||||
Total | 3,496 | 390 | 1,433 | 5,319 | 3,131 | 412 | 1,186 | 4,729 | |||||||||||||||
We expect that during 2018 we will deliver substantially all homes in backlog at December 31, 2017. At December 31, 2017, inventory units to be sold included 222 completed units available for sale. On average at December 31, 2017, we had 4.8 inventory units per average active selling community and 0.75 completed inventory units per average active selling community to be sold. At December 31, 2016, inventory units to be sold included 238 completed units available for sale. On average at December 31, 2016, we had 3.8 inventory units per average active selling community and 0.77 completed inventory units per average active selling community.
Community Development
We create a complete concept for each community, beginning with an overall community layout and then determine the size, style and price range of the homes, the layout of the streets and positioning of the individual home sites. After necessary governmental and other approvals have been obtained, we improve the land by clearing and grading, installing roads, underground utility lines, staking out individual home sites and, in certain communities, erecting distinctive entrance structures and recreational amenities.
Each community has employees who perform superintendent, sales and customer service functions, in conjunction with a local management team to manage the overall project.
The life cycle of a community generally ranges from two to five years, commencing with the acquisition of land, continuing through the land development phase, and concluding with the sale, construction, and delivery of homes. Actual life cycle will vary based on the size of the community, the sales absorption rate, and whether we purchased the property as raw land or as developed lots.
The construction time for our homes varies from project to project depending on geographic region, the time of year, the size and complexity of construction, the governmental approval processes, local labor availability, availability of materials and supplies, weather, and other factors. On average, we complete the construction of a typical home in approximately six months.
Sources and Availability of Raw Materials
Based on local market practices, we either directly, or indirectly through our subcontractors, purchase drywall, cement, steel, lumber, insulation and the other building materials necessary to construct a home. While these materials are generally widely available from a variety of sources, from time to time we experience material shortages on a localized basis which can substantially increase the price for such materials and our construction process can be slowed. We generally have multiple sources for the materials we purchase and have not experienced significant delays due to unavailability of necessary materials.
Trades and Labor
Our construction, land and purchasing teams coordinate subcontracting services and supervise all aspects of construction work and quality control. We are a general contractor for all of our homebuilding projects. Subcontractors perform all home construction and land development, generally under fixed-price contracts. The availability of labor, specifically as it relates to qualified tradespeople, at reasonable prices can be challenging in some markets as the supply chain responds to uneven industry growth and other economic factors that affect the number of people in the workforce.
6
Procurement and Construction
We have a comprehensive procurement program that leverages our size and national presence to achieve efficiencies and cost savings. Our procurement objective is to maximize cost and process efficiencies on local, regional and national levels and to ensure consistent utilization of established contractual arrangements.
The regional and national vendor programs currently involve over 50 vendors and include highly reputable and well-established companies who supply us with lumber, appliances, HVAC systems, insulation, roofing, paint and lighting, among other materials. Through these relationships, we are able to realize savings on the costs of essential materials. Contracts are typically structured to include a blend of attractive upfront pricing and rebates and, in some cases, advantageous retroactive pricing in instances of contract renewals. In addition to cost advantages, these arrangements also help minimize the risk of construction delays during supply shortages, as we are often able to leverage our size to obtain our full allocation of required materials.
Warranty Program
Most of our divisions currently offer a limited warranty to cover various defects in workmanship or materials, including structural defects. Certain of our divisions provide longer term structural warranties through third-party warranty providers. We also currently provide third-party warranty coverage on homes where required by Federal Housing Administration (“FHA”) or Veterans Administration regulations. We evaluate our warranty offerings from time-to-time and, in the future, may offer the third-party longer term structural warranty in additional divisions and potentially across the Company.
Sales and Marketing
We are committed to continuously enhancing our customer experience including how we target and attract our consumers. Our marketing program calls for a balanced approach of corporate support and local expertise to attract potential homebuyers in a focused, efficient and cost-effective manner. Our corporate sales and marketing team provides a generalized marketing framework across our regional operations as well as sales training to our local teams. Our divisional sales and marketing teams utilize local media and marketing channels to deliver a unique message that is relevant to our consumer groups in each market.
Our goal is to identify the preferences of our customers and demographic groups and offer them innovative, high-quality homes that are efficient and profitable to build. We strive to maintain product and price level differentiation through market and customer research. We target a balance of regional market portfolios across a variety of demographics. We also use key indicators of market specific supply and demand characteristics to determine preferences of our customer base and to perform an optimal matching of consumer groups, product and community design, and specific location.
The central element of our marketing platform is our web presence at www.taylormorrison.com and www.darlinghomes.com (none of the information on or accessible through these websites is a part of this Annual Report). The main purpose of these websites is to direct potential customers to our sales team members in their community of interest. The websites also offer the ability of customers to evaluate floor plans, elevations, square footage, community amenities and geographic location. Customers are also able to use the websites to make inquiries and to receive a prompt response from one of our “Internet Home Consultants.” The websites are fully integrated with our CRM system. By analyzing the content of the CRM, we are able to focus our lead generation programs to deliver high-quality sales leads. With these leads we are better able to increase sale conversion rates and lower marketing costs. We believe the digital marketing strategy for our websites, which is continually reviewed and refined, provides high return on our investments. During 2017, we commissioned a full analysis of our websites. This included all stakeholders as well as consumer facing research designed to provide an industry leading digital presence in 2018 and beyond. Management anticipates implementation of our new sites to be complete by the end of 2018.
We selectively utilize print, radio and television for advertising purposes, including directional marketing, newspapers and billboards. We also directly notify local real estate agents and firms of any new community openings in order to use the existing real estate agent/broker channels in each market. Pricing for our homes is evaluated weekly based on an analysis of market conditions, competitive environment and supply and demand characteristics.
7
We use furnished model homes as a marketing tool to demonstrate the advantages of the designs, features and functionality of our homes. We generally employ or contract with interior and landscape designers who create attractive model homes that highlight the features and options available for the homes within our communities. Depending upon the number of homes to be built in the project and the product lines to be offered, we generally build between one and three model homes for each active selling community.
Our homes are sold by our commissioned employees who work from sales offices generally located within our model homes. Our goal is to ensure our sales force has extensive knowledge of our homes, including our energy efficient features, sales strategies, mortgage options and community dynamics. To achieve this goal, we have on-going training for our sales team and conduct regular meetings to keep them abreast of the latest promotions, options and sales techniques and discuss geographic competition. Our sales team members are licensed real estate agents where required by law and assist our customers in adding design features to their homes, which we believe appeal to local consumer preferences. Third-party brokers who sell our homes are generally paid a sales commission based on the price of the home. In some of our divisions, we contract with third-party design studios that specialize in assisting our homebuyers with options and upgrades to personalize their homes. Utilizing these third-party design studios allows us to manage our overhead and costs more efficiently. We may also offer various sales incentives, including price concessions, assistance with closing costs, and landscaping or interior upgrades. The use, types and amount of incentives depends largely on existing economic and local competitive market conditions.
Competition
The homebuilding business is highly competitive and fragmented. We compete with numerous homebuilders of varying sizes, ranging from local to national, some of which have greater sales and financial resources than us. Sales of existing homes, whether by a homeowner or by a financial institution that has acquired a home through a foreclosure, also provide competition. We compete primarily on the basis of location, design, quality, service, price and reputation.
In order to maximize our sales volumes, profitability and product strategy, we strive to understand our competition and their pricing, product and sales volume strategies and results. Competition among residential homebuilders of all sizes is based on a number of interrelated factors, including location, reputation, amenities, floor plans, design, quality and price. We believe that we compare favorably to other homebuilders in the markets in which we operate.
Seasonality
Our business is seasonal. We have historically experienced, and expect to continue to experience, variability in our results on a quarterly basis. We generally have more homes under construction, close more homes and have greater revenues and operating income in the third and fourth quarters of the year. Our results, therefore, may fluctuate significantly on a quarterly basis, and we must maintain sufficient liquidity to meet short-term operating requirements. Factors expected to contribute to these fluctuations include, but are not limited to:
• | the timing of the introduction and start of construction of new projects; |
• | the timing of sales; |
• | the timing of closings of homes, lots and parcels; |
• | the timing of receipt of regulatory approvals for development and construction; |
• | the condition of the real estate market and general economic conditions in the areas in which we operate; |
• | mix of homes closed; |
• | construction timetables; |
• | the cost and availability of materials and labor; and |
• | weather conditions in the markets in which we build. |
8
As a result of seasonal activity, our quarterly results of operations and financial position are not necessarily representative of a full fiscal year. To illustrate the seasonality in net homes sold, homes closed and home closings revenue, a summary of the quarterly financial data follows:
Three Months Ended, | Three Months Ended, | |||||||||||||||||||||||
2017 | 2016 | |||||||||||||||||||||||
March 31 | June 30 | September 30 | December 31 | March 31 | June 30 | September 30 | December 31 | |||||||||||||||||
Net homes sold | 29 | % | 28 | % | 21 | % | 22 | % | 24 | % | 27 | % | 26 | % | 23 | % | ||||||||
Home closings revenue | 20 | % | 23 | % | 23 | % | 34 | % | 18 | % | 24 | % | 24 | % | 34 | % | ||||||||
Income from continuing operations before income taxes | 15 | % | 22 | % | 22 | % | 41 | % | 12 | % | 22 | % | 28 | % | 38 | % | ||||||||
Net income from continuing operations | 20 | % | 32 | % | 31 | % | 17 | % | (1) | 13 | % | 22 | % | 28 | % | 37 | % | |||||||
(1)Includes effects of tax reform.
Mortgage Operations
TMHF provides a number of mortgage-related services to our customers through our mortgage lending operations. The strategic purpose of TMHF is:
• | to utilize mortgage finance as a sales tool in the purchase process to ensure a consistent customer experience and assist in maintaining production efficiency; and |
• | to control and analyze our backlog quality and to better manage projected closing and delivery dates for our customers. |
TMHF operates as an independent mortgage banker and conducts its business as a FHA Full Eagle lender. TMHF funds mortgage loans utilizing warehouse credit facilities. Revenue is earned through origination and processing fees combined with service release premiums earned in the secondary market once the loans are sold to investors. Typically, loans are sold and servicing is released within 15-20 business days.
TMHF competes with other mortgage lenders, including national, regional and local mortgage bankers and other financial institutions. TMHF utilizes a multi-investor correspondent platform which gives us increased flexibility when placing loans to meet our customers’ needs. TMHF has continued to expand and strengthen our correspondent relationships. This has created stability and consistency in our origination process and delivery.
Inspired Title operates as a title insurance agent under the title-only (examination) business model. Inspired Title searches and examines land title records, prepares title commitments and polices for homebuyers in our Florida, Georgia, North Carolina, South Carolina, and Texas markets, contracting with others (currently title insurance underwriters and attorneys) to perform the escrow closing functions. Inspired Title competes against other title underwriters and title/escrow agents that provide similar services.
Regulation, Environmental, Health and Safety Matters
Regulatory
We are subject to various local, state and federal statutes, ordinances, rules and regulations concerning zoning, building design, construction and similar matters, including local regulations that impose restrictive zoning and density requirements in order to limit the number of homes that can eventually be built within the boundaries of a particular property or locality. In a number of our markets, there has been an increase in state and local legislation requiring the dedication of land as open space. In addition, we are subject to various licensing, registration and filing requirements in connection with the construction, advertisement and sale of homes in our communities. The impact of these laws has been to increase our overall costs, and may delay the opening of communities or cause us to conclude that development of particular communities would not be economically feasible, even if any or all necessary governmental approvals are obtained. We also may be subject to periodic delays or may be precluded
9
entirely from developing communities due to building moratoriums in one or more of the areas in which we operate. Generally, such moratoriums relate to insufficient water, power, drainage or sewage facilities or inadequate road capacity.
In order to secure certain approvals in some areas, we may be required to provide affordable housing at below market sales prices. In addition, local and state governments have broad discretion regarding the imposition of development fees for projects under their jurisdictions, as well as requiring concessions or that the builder construct certain improvements to public places such as parks and streets or fund schools. The impact of these requirements on us depends on how the various state and local governments in the areas in which we engage, or intend to engage, in development implement their programs. To date, these restrictions have not had a material impact on us.
TMHF is subject to various state and federal statutes, rules and regulations, including those that relate to licensing, lending operations and other areas of mortgage origination and financing. The impact of those statutes, rules and regulations can increase our homebuyers’ cost of financing, increase our cost of doing business, as well as restrict our homebuyers’ access to some types of loans. Certain requirements provided for by the Dodd-Frank Wall Street Reform and Consumer Protection Act ("Dodd-Frank Act") have not yet been finalized or fully implemented. The effect of such provisions on our financial services business will depend on the rules that are ultimately enacted. The title and settlement services provided by Inspired Title are subject to various regulations, including regulation by state banking and insurance regulators.
In order for our homebuyers to finance their home purchases with FHA-insured, Veterans Administration-guaranteed or U.S. Department of Agriculture-guaranteed mortgages, we are required to build such homes in accordance with the regulatory requirements of those agencies.
Some states have statutory disclosure requirements or other pre-approval requirements or limitations governing the marketing and sale of new homes. These requirements vary widely from state to state.
Some states require us to be registered as a licensed contractor, a licensed real estate broker and in some markets our sales agents are additionally required to be registered as licensed real estate agents.
Environmental
We also are subject to a variety of local, state and federal statutes, ordinances, rules and regulations concerning protection of public health and the environment (collectively, “environmental laws”). For example, environmental laws may affect: how we manage stormwater runoff, wastewater discharges, and dust; how we develop or operate on properties on or affecting resources such as wetlands, endangered species, cultural resources, or areas subject to preservation laws; and how we address contamination. The particular environmental laws that apply to any given community vary greatly according to the location and environmental condition of the site and the present and former uses of the site. Complying with these environmental laws may result in delays, may cause us to incur substantial compliance and other costs, and/or may prohibit or severely restrict development in certain environmentally sensitive regions or areas. Noncompliance with environmental laws could result in fines and penalties, obligations to remediate, permit revocation, and other sanctions; and contamination or other environmental conditions at or in the vicinity of our developments could result in claims against us for personal injury, property damage, or other losses.
As part of the land acquisition due diligence process, we utilize environmental assessments to identify environmental conditions that may exist on potential acquisition properties. To date, environmental site assessments conducted at our properties have not revealed any environmental liability or compliance concerns that we believe would have a material adverse effect on our business, liquidity or results of operations, nor are we aware of any material environmental liability or concerns.
We manage compliance with environmental laws at the division level with assistance from the corporate and regional legal departments.
Health and Safety
We are committed to maintaining high standards in health and safety at all of our sites. We have a health and safety audit system that includes comprehensive twice-yearly independent third-party inspections of selected sites covering all aspects of health and safety. Key areas of focus are on site conditions meeting exacting health and safety standards, and on subcontractor
10
performance throughout our operating areas meeting or exceeding expectations. All of our team members must complete an assigned curriculum of online safety courses each year. These courses vary according to job responsibility. In addition, groups such as construction and field personnel are required to attend additional health and safety related training programs.
Information Technology
We have a centralized information technology organization with its core team located at our corporate headquarters in Scottsdale, augmented with field support technicians in key locations across the U.S. Our approach to information technology is to continuously simplify our information technology platform and consolidate and standardize applications. We believe a common application platform enables the sharing of ideas and rapid implementation of process improvements and best practices across the entire company. Our back-office operations use a fully integrated, industry recognized enterprise resource planning package. Marketing and field sales utilize a leading CRM solution that tracks leads and prospects from all sources and manages the customer communication process from lead creation through the buying process and beyond the post-warranty period. Field operations teams collaborate with our supply chain management to schedule and manage development and construction projects with a set of standard and widely used homebuilding industry solutions.
Intellectual Property
We own certain logos and trademarks that are important to our overall branding and sales strategy. Our consumer logos are designed to draw on our recognized homebuilding heritage while emphasizing a customer-centric focus.
Employees, Subcontractors and Consultants
As of December 31, 2017, we employed approximately 1,800 full-time equivalent persons. Of these, approximately 1,600 were engaged in corporate and homebuilding operations, and the remaining approximately 200 were engaged in mortgage and title services. As of December 31, 2017, we were not subject to collective bargaining agreements. We consider our employee relations to be good.
We act solely as a general contractor, and all construction operations are supervised by our project managers and field superintendents who manage third party subcontractors. We use independent consultants and contractors for some architectural, engineering, advertising and legal services, and we strive to maintain good relationships with our subcontractors and independent consultants and contractors.
ITEM 1A. RISK FACTORS
Risks related to our industry and our business
Our business is cyclical and is significantly affected by changes in general and local economic conditions.
Our business can be substantially affected by adverse changes in general economic or business conditions that are outside of our control, including changes in:
• | short- and long-term interest rates; |
• | the availability and cost of financing for homebuyers; |
• | federal and state income tax laws, including provisions for the deduction of mortgage interest or property tax payments; |
• | employment levels, job and personal income growth and household debt-to-income levels; |
• | consumer confidence generally and the confidence of potential homebuyers in particular; |
• | the ability of existing homeowners to sell their existing homes at prices that are acceptable to them; |
• | the U.S. and global financial system and credit markets, including stock market and credit market volatility; |
• | private and federal mortgage financing programs and federal and state regulation of lending practices; |
• | housing demand from population growth, household formations and demographic changes (including immigration levels and trends or other costs of home ownership in urban and suburban migration); |
• | demand from foreign buyers for our homes, which may fluctuate according to economic circumstances in foreign markets; |
• | the supply of available new or existing homes and other housing alternatives, such as apartments and other residential rental property; |
• | real estate taxes; |
11
• | energy prices; and |
• | the supply of developable land in our markets and in the United States generally. |
Adverse changes in these conditions may affect our business nationally or may be more prevalent or concentrated in particular regions or localities in which we operate. During the most recent economic downturn, unfavorable changes in many of the above factors negatively affected all of the markets we serve. Economic conditions in certain of our markets continue to be susceptible to fluctuations. For example, fluctuations in oil and gas prices have, in the past, created economic uncertainty, particularly in regions of Texas, such as the greater Houston area, where we have significant operations. Additionally, governmental action and legislation related to economic stimulus, taxation, spending levels and borrowing limits, immigration, as well as political debate, conflicts and compromises related to such actions, may negatively impact the financial markets and consumer confidence and spending, which could adversely impact the U.S. economy and the housing market. Any deterioration or significant uncertainty in economic or political conditions could have a material adverse effect on our business.
Inclement weather, natural disasters (such as earthquakes, hurricanes, tornadoes, floods, droughts, mudslides and wildfires) and other environmental conditions may delay the delivery of our homes, increase our costs or impact demand for our homes. In particular, we have operations in regions that, in 2017, were impacted by extreme weather conditions, including Hurricane Harvey and Hurricane Irma.
Furthermore, civil unrest or acts of terrorism, other acts of violence, threats to national security or a public health issue such as a major epidemic or pandemic in the United States or internationally may also have a negative effect on our business.
These adverse changes in economic and other conditions can cause demand and prices for our homes to diminish or cause us to take longer to build our homes and make it more costly for us to do so. We may not be able to recover these increased costs by raising prices because of weak market conditions and because the price of each home we sell is usually set several months before the home is delivered, as many customers sign their home purchase contracts before construction begins. The potential difficulties described above could impact our customers’ ability to obtain suitable financing and cause some homebuyers to cancel or refuse to honor their home purchase contracts altogether.
A slowdown or severe downturn in the housing market could have additional adverse effects on our operating results and financial condition.
During periods of industry downturn, housing markets across the United States may experience an oversupply of both new and resale home inventory, an increase in foreclosures, reduced levels of consumer demand for new homes, increased cancellation rates, aggressive price competition among homebuilders and increased incentives for home sales. The most recent industry downturn that began in 2008 significantly and adversely impacted those in the homebuilding industry, including us. In the event of a significant downturn we may experience a material reduction in revenues, margins, and cash flow.
Although the U.S. housing market continues to recover, we cannot predict the overall trajectory of the market. Some housing markets and submarkets have been stronger than others, and there continues to be variability in operating trends. We expect that such volatility will continue, whether or not the present housing recovery progresses, and that prevailing conditions in various housing markets and submarkets will continue to fluctuate. These fluctuations may be significant and unfavorable. In addition, while some of the many negative factors that contributed to the housing downturn have moderated, several remain, and they could return and/or intensify to inhibit any future improvement in housing market conditions in 2018 and beyond. Although we take steps to alleviate the impact of these conditions on our business, given the volatility in the homebuilding industry and global economic and political uncertainty, there can be no guarantee that steps taken by us will be effective.
If homebuyers are not able to obtain suitable financing, our results of operations may decline.
A substantial majority of our homebuyers finance their home purchases through lenders that provide mortgage financing. The availability of mortgage credit may fluctuate, including due to various regulatory changes and lower risk appetite by lenders with many lenders requiring increased levels of financial qualification, including lenders adhering to the currently applicable “Qualified Mortgage” requirements under the Dodd-Frank Act and ability to repay standard, and lending lower multiples of income. Investors and first-time homebuyers are generally more affected by the availability of financing than other potential homebuyers. A limited availability of home mortgage financing may adversely affect the volume of our home sales and the sales prices we achieve. It could also prevent or limit our ability to attract new customers, our existing customers’ ability to resell their home and/or our ability to fully realize our backlog, because our sales contracts generally include a financing contingency, which permits the customer to cancel its obligation in the event mortgage financing at prevailing interest rates, including financing arranged or provided by us, is unobtainable within the period specified in the contract.
The liquidity provided by government sponsored entities, such as Fannie Mae, Freddie Mac, Ginnie Mae, the FHA and Veterans Administration, to the mortgage industry has been very important to the housing market. If Fannie Mae and Freddie
12
Mac were dissolved, or if the federal government determined to stop providing liquidity support to the mortgage market, there would be a reduction in the availability of the financing provided by these institutions. Any such reduction would likely have an adverse effect on interest rates, mortgage availability and our sales of new homes.
FHA-insured mortgage loans generally have lower down-payment requirements and qualification standards compared to conventional guidelines and, as a result, the FHA continues to be a particularly important source for financing the sale of our homes. Lenders have taken and may continue to take a more conservative view of FHA guidelines causing significant tightening of borrower eligibility for approval. In January 2017, in response to a presidential executive order, the U.S. Department of Housing and Urban Development sent a letter to lenders, real estate brokers and closing agents suspending the 0.25 percentage point premium rate cut for FHA-backed loans. Further support reductions are expected on FHA-insured loans, including limitations on seller-paid closing costs and concessions. This or any other restriction or support reduction may negatively affect the availability or affordability of FHA financing, which could adversely affect our ability to sell homes.
In each of our markets, decreases in the availability of credit and increases in the cost of credit adversely affect the ability of homebuyers to obtain or service mortgage debt. Even if potential homebuyers do not themselves need mortgage financing, where potential homebuyers must sell their existing homes in order to buy a new home, increases in mortgage costs, lack of availability of mortgages and/or regulatory changes could prevent the buyers of our potential homebuyers’ existing homes from obtaining a mortgage, which would result in our potential customers’ inability to buy a new home. Similar risks apply to those buyers who are awaiting delivery of their homes and are currently in backlog. If our customers (or potential buyers of our customers’ existing homes) cannot obtain suitable financing, our sales and results of operations could be adversely affected.
Increases in interest rates, taxes (or changes in deductibility) or government fees could prevent potential customers from buying our homes and adversely affect our business or financial results.
Increases in interest rates as a result of changes to monetary policy could significantly increase the costs of owning a home or result in existing homeowners with low interest rates choosing to remain in their current homes rather than purchase a new home in a higher interest rate environment, which in turn would adversely impact demand for and sales prices of homes and the ability of potential customers to obtain financing and adversely affect our business, financial condition and operating results. While interest rates have been at historic lows, the Federal Reserve Board has recently been raising interest rates, and it is anticipated that interest rates will likely continue to increase over the next several years.
Significant expenses of owning a home, including mortgage interest and real estate taxes, generally are deductible expenses for an individual’s U.S. federal and, in some cases, state income taxes, subject to various limitations. Changes to income tax laws to eliminate, limit or substantially modify these income tax deductions, the after-tax cost of owning a new home would increase for many of our potential customers. The resulting loss or reduction of homeowner tax deductions without offsetting provisions or any other increase in any taxes affecting homeowners could adversely impact demand for and sales prices of new homes. The Tax Act generally limits, through the end of 2025, the annual deduction for real estate taxes and state and local income or sales taxes to $10,000. In addition, under the Tax Act, through the end of 2025 the deduction for mortgage interest for new home purchases will generally only be available with respect to acquisition indebtedness that does not exceed $750,000 (after 2025, the acquisition indebtedness threshold is scheduled to return to the $1.0 million limit that existed prior to the Tax Act). The impact of the Tax Act or further loss or reduction of these homeowner tax deductions without any offsetting legislation may result in an increase in the total cost of home ownership and make the purchase of a home less attractive to buyers. This could adversely impact demand for and sales prices of new homes, including ours.
Additionally, increases in property tax rates by local governmental authorities, as experienced in response to reduced federal and state funding, can adversely affect the ability of potential customers to obtain financing or their desire to purchase new homes. Fees imposed on developers to fund schools, open spaces, road improvements and/or provide low and moderate income housing, could increase our costs and have an adverse effect on our operations. In addition, increases in sales taxes could adversely affect our potential customers who may consider those costs in determining whether to make a new home purchase and decide, as a result, not to purchase one of our homes.
We are and will be affected by the recent tax legislation.
The Tax Act significantly amends the U.S. federal tax code and includes, among other provisions, (1) substantial limitations on the deductibility of state and local taxes by individuals and further limitations on mortgage interest deductions and (2) the migration from a worldwide system of taxation to a modified territorial system for corporations. Although we expect that, as a result of the reduction in the corporate tax rates from 35% to 21% and other changes to law, the Tax Act will be financially and cash flow beneficial to us. As part of the migration to a territorial system, the Tax Act imposes a one-time tax on post-1986 earnings and profits (“E&P”) of certain foreign subsidiaries to their 10% U.S. shareholders (regardless of whether such E&P is
13
distributed) at a rate of 15.5% for U.S. corporate shareholders to the extent E&P does not exceed the U.S. shareholder’s aggregate foreign cash position (as defined in the Tax Act) and 8% for E&P in excess of such cash position. The resulting tax may be payable over eight years. Because of the interest we hold in a partially-owned subsidiary Canadian corporation, we are subject to the tax on our share of the subsidiary Canadian corporation’s E&P as of November 2, 2017 or December 31, 2017 (whichever is greater). As a result, we have recorded an estimated $3.6 million charge related to the mandatory deemed repatriation of foreign earnings related to the sale of our Canadian business in 2015. This estimate is subject to change, however, and we are continuing to gather additional information to more precisely compute the amount of the tax that we will pay. Further, as a result of the reduction in the corporate tax rates, we have recorded a $57.4 million reduction in the value of our deferred tax assets.
If we experience shortages in labor supply, increased labor costs or labor disruptions, there could be delays or increased costs in developing our communities or building homes, which could adversely affect our operating results.
We require a qualified labor force to develop our communities and build our homes. Access to qualified labor may be affected by circumstances beyond our control, including:
• | work stoppages resulting from labor disputes; |
• | shortages of and competition for qualified trades people, such as carpenters, roofers, electricians and plumbers; |
• | changes in laws relating to union organizing activity; |
• | changes in immigration laws and policies and trends with respect to labor force migration; and |
• | increases in subcontractor and professional services costs. |
Labor shortages can be further exacerbated as demand for housing increases. Any of these circumstances could give rise to delays in the start or completion of, or could increase the cost of, developing one or more of our communities and building homes. For example, the homebuilding industry has been experiencing shortages of skilled labor and increased labor costs, including in several locations in which we operate, which has resulted in longer delivery times. We may not be able to recover increased costs by raising our home prices, because the price for each home is typically set months prior to its delivery pursuant to sales contracts with our homebuyers. In such circumstances, our operating results could be adversely affected. Additionally, market and competitive forces may also limit our ability to raise the sales prices of our homes.
Higher cancellation rates of existing agreements of sale may have an adverse effect on our business.
Our backlog represents sales contracts with our homebuyers for homes that have not yet been delivered. We have received a deposit from a homebuyer for each home reflected in our backlog and, generally, we have the right, subject to certain exceptions, to retain the deposit if the homebuyer fails to comply with his or her obligations under the sales contract, including as a result of state and local law, the homebuyer’s inability to sell his or her current home or the homebuyer’s inability to make additional deposits required prior to the closing date. In some situations, however, a homebuyer may cancel the agreement of sale and receive a complete or partial refund of the deposit.
If prices for new homes decline, if competitors increase their use of sales incentives, if interest rates increase, if the availability of mortgage financing diminishes, if current homeowners find it difficult to sell their current homes or if there is a downturn in local or regional economies or in the national economy, U.S. homebuyers may terminate their existing home purchase contracts with us in order to negotiate for a lower price or because they cannot, or will not, complete the purchase and our remedies generally do not extend beyond the retention of deposits as our liquidated damages.
In cases of cancellation, we remarket the home and retain any deposits we are permitted to retain. Nevertheless, the deposits may not cover the additional costs involved in remarketing the home, replacing or modifying installed options, reducing the sales price or increasing incentives on the completed home for greater marketability and carrying higher inventory. Further, depending on the stage of cancellation, a contract that is cancelled at the end of a phase may cause additional construction costs, roadway repairs or added nuisances to existing homeowners for the out of sequence construction or modification of the particular home. Significant numbers of cancellations could adversely affect our business, financial condition and results of operations.
The homebuilding and mortgage and title services industries are highly competitive and, if our competitors are more successful or offer better value to our customers, our business could decline.
We operate in a very competitive environment with competition from a number of other homebuilders in each market in which we operate. We compete with large national and regional homebuilding companies and with smaller local homebuilders for land, financing and related services, raw materials, skilled management, volume discounts, local REALTOR® and labor resources. We also compete with the resale, or “previously owned,” home market, as well as other housing alternatives such as
14
the rental housing market. Additionally, some of our competitors have longstanding relationships with subcontractors and suppliers in markets in which we operate and others may have significantly greater financial resources or lower costs than us. Competitive conditions in the homebuilding industry could make it difficult for us to acquire suitable land at acceptable prices, cause us to increase selling incentives and/or reduce or discount prices and/or result in an oversupply of homes for sale. These factors have adversely affected demand for our homes and our results of our operations in the past and could do so again in the future.
Additionally, our mortgage and title services businesses compete with other mortgage lenders and title companies, including national, regional and local mortgage banks and other financial institutions, some of which may be subject to fewer government regulations or, in the case of mortgage lenders, may have a greater range of products, greater access to capital or different lending criteria and may be able to offer more attractive financing to potential customers.
If we are unable to compete effectively in our homebuilding and mortgage and title services markets, our business could decline disproportionately to our competitors, and our results of operations and financial condition could be adversely affected.
Any increase in unemployment or underemployment may lead to an increase in the number of loan delinquencies and property repossessions and have an adverse impact on us.
In the United States, the unemployment rate was 4.1% as of January 2018, according to the U.S. Bureau of Labor Statistics (“BLS”). In addition, the labor force participation rate reported by the BLS has been declining, from 66.2% in January 2008 to 62.7% in January 2018, potentially reflecting an increased number of “discouraged workers” who have left the labor force. In addition, a substantial portion of new jobs created have been relatively low-wage jobs or part-time jobs. People who are not employed, are underemployed, who have left the labor force or are concerned about low wages or the loss of their jobs are less likely to purchase new homes, may be forced to try to sell the homes they own and may face difficulties in making required mortgage payments. Therefore, any increase in unemployment or underemployment may lead to an increase in the number of loan delinquencies and property repossessions and have an adverse impact on us both by reducing demand for the homes we build and by increasing the supply of homes for sale.
Inflation or deflation could adversely affect our business and financial results.
Inflation can adversely affect us by increasing costs of land, materials and labor. In the event of an increase in inflation, we may seek to increase the sales prices of homes in order to maintain satisfactory margins. However, an oversupply of homes relative to demand and home prices being set several months before homes are delivered may make any such increase difficult or impossible. In addition, inflation is often accompanied by higher interest rates, which historically has had a negative impact on housing demand, as well as increasing the interest rates we may need to pay for our own capital financing. In such an environment, we may not be able to raise home prices sufficiently to keep up with the rate of inflation, and our margins could decrease. Current or future efforts by the government to stimulate the economy may increase the risk of significant inflation and its adverse impact on our business or financial results.
Alternatively, a significant period of deflation could cause a decrease in overall spending and borrowing levels. This could lead to a further deterioration in economic conditions, including an increase in the rate of unemployment. Deflation could also cause the value of our inventories to decline or reduce the value of existing homes below the related mortgage loan balance, which could potentially increase the supply of existing homes and have a negative impact on our results of operations.
Furthermore, a material decline in oil and gas prices may increase the risk of significant deflation and its adverse impact on our business or financial results, as the economies of some of the markets in which we operate are impacted by the health of the energy industry. To the extent that energy prices are volatile or change significantly, the economies of certain of our markets, particularly in regions of Texas where we have significant operations, may be negatively impacted, which may adversely impact the financial position, results of operations and cash flows of our business. In addition, the cost of raw materials such as lumber, concrete and steel can be adversely affected by increases in various energy costs, resulting in a negative impact to our financial position, results of operations and cash flows of our business.
Our quarterly operating results may fluctuate because of the seasonal nature of our business and other factors.
Our quarterly operating results generally fluctuate by season as a result of a variety of factors such as:
• | timing of home deliveries and land sales; |
• | the changing composition and mix of our asset portfolio; and |
• | weather-related issues. |
15
Historically, a larger percentage of our home sale contracts have been entered into in the winter and spring. Weather-related problems, typically in the fall, late winter and early spring, may delay starts or closings and increase costs and thus reduce profitability. Seasonal natural disasters such as hurricanes, tornadoes, floods and wildfires could cause delays in the completion of, or increase the cost of, developing one or more of our communities, causing an adverse effect on our sales and revenues. For example, during the third quarter of 2017, our results of operations were affected by Hurricane Harvey and Hurricane Irma, which caused community closures and delays in deliveries and production.
In some cases, we may not be able to recapture increased costs by raising prices. In addition, deliveries may be staggered over different periods of the year and may be concentrated in particular quarters. Our quarterly operating results may fluctuate because of these factors. See Item 1 - Business - Seasonality.
An inability to obtain additional performance, payment and completion surety bonds and letters of credit could limit our future growth.
We are often required to provide performance, payment and completion and warranty/maintenance surety bonds or letters of credit to secure the completion of our construction contracts, development agreements and other arrangements. We believe we have obtained credit facilities to provide the required volume of performance, payment and completion and warranty maintenance surety bonds and letters of credit for our expected growth in the medium term; however, unexpected growth may require additional facilities. We may also be required to renew or amend our existing facilities. Our ability to obtain additional performance, payment and completion and warranty/maintenance surety bonds and letters of credit primarily depends on our credit rating, capitalization, working capital, past performance, management expertise and certain external factors, including the fluidity of the markets for such bonds. Performance, payment and completion and warranty/maintenance surety bond and letter of credit providers consider these factors in addition to our performance and claims record and provider-specific underwriting standards, which may change from time to time.
If our performance record or our providers’ requirements or policies change, if we cannot obtain the necessary renewals or amendments from our lenders, or if the market’s capacity to provide performance, payment and completion or warranty/maintenance bonds or letters of credit is not sufficient for any unexpected growth, we could be unable to obtain additional performance, payment and completion and warranty/maintenance surety bonds or letters of credit from other sources when required, which could have a material adverse effect on our business, financial condition and results of operations.
Homebuilding is subject to home warranty and construction defect claims in the ordinary course of business that can be significant.
As a homebuilder, we are subject to home warranty and construction defect claims arising in the ordinary course of business. There can be no assurance that any developments we undertake will be free from defects once completed. Construction defects may occur on projects and developments and may arise a significant period of time after completion. Defects arising on a development attributable to us may lead to significant contractual or other liabilities.
As a consequence, we maintain products and completed operations excess liability insurance, obtain indemnities and certificates of insurance from subcontractors generally covering claims related to damages resulting from faulty workmanship and materials and maintain warranty and other reserves for the homes we sell based on historical experience in our markets and our judgment of the risks associated with the types of homes built. Although we actively monitor our insurance reserves and coverage, because of the uncertainties inherent to these matters, we cannot provide assurance that our insurance coverage, our subcontractor's indemnity and warranty arrangements and our reserves together will be adequate to address all of our warranty and construction defect claims in the future. In addition, contractual indemnities with our subcontractors can be difficult to enforce. We may also be responsible for applicable self-insured retentions and some types of claims may not be covered by insurance or may exceed applicable coverage limits. Additionally, the coverage offered by and the availability of products and completed operations excess liability insurance for construction defects is currently limited and costly. This coverage may be further restricted or become more costly in the future.
In California we operate under an Owner Controlled Insurance Plan (“OCIP”) for general liability exposures of most subcontractors (excluding consultants), as a result of the inability of subcontractors to procure acceptable insurance coverage to meet our requirements. Under the OCIP, subcontractors are effectively insured by us. We have assigned risk retentions and bid deductions to our subcontractors based on their risk category. These deductions are used to fund future liabilities.
Unexpected expenditures attributable to defects or previously unknown sub-surface conditions arising on a development project may have a material adverse effect on our business, financial condition and operating results. In addition, severe or widespread incidents of defects giving rise to unexpected levels of expenditures, to the extent not covered by insurance or redress against subcontractors, may adversely affect our reputation, business, financial condition and operating results.
16
Our reliance on subcontractors can expose us to various liability risks.
We rely on subcontractors in order to perform the construction of our homes and, in many cases, to select and obtain raw materials. We are exposed to various risks as a result of our reliance on these subcontractors and their suppliers, including, as described above, the possibility of defects in our homes due to improper practices or materials used by such parties, which may require us to comply with our warranty obligations and/or bring a claim under an insurance policy. The subcontractors we rely on to perform the actual construction of our homes are also subject to a significant and evolving number of local, state and federal laws and regulations, including laws involving matters that are not within our control. If these subcontractors who construct our homes fail to comply with all applicable laws, we can suffer reputational damage and may be exposed to liability.
Subcontractors are independent of the homebuilders that contract with them under normal management practices and the terms of trade contracts and subcontracts within the homebuilding industry. We do not have the ability to control what these independent subcontractors pay to or the work rules they impose on their employees. However, various federal and state governmental agencies have sought, and may in the future seek, to hold contracting parties like us responsible for our subcontractors’ violations of wage and hour laws, or workers’ compensation, collective bargaining and/or other employment-related obligations related to subcontractors’ workforces. Governmental agency determinations or attempts by others to make us responsible for our subcontractors’ labor practices or obligations, whether under “joint employer” theories, specific state laws or regulations, such as under the California Labor Code, or otherwise, could create substantial adverse exposure for us in situations that are not within our control and could be material to our business, financial condition and results of operations.
Failure to manage land acquisitions, inventory and development and construction processes could result in significant cost overruns or errors in valuing sites.
We own and purchase a large number of sites each year and are therefore dependent on our ability to process a very large number of transactions (which include, among other things, evaluating the site purchase, designing the layout of the development, sourcing materials and subcontractors and managing contractual commitments) efficiently and accurately. Errors by employees, failure to comply with regulatory requirements and conduct of business rules, failings or inadequacies in internal control processes, equipment failures, natural disasters or the failure of external systems, including those of our suppliers or counterparties, could result in operational losses that could adversely affect our business, financial condition and operating results and our relationships with our customers.
In addition, we incur many costs even before we begin to build homes in a community. Depending on the stage of development of a land parcel when we acquire it, these may include: costs of preparing land, finishing and entitling lots, installing roads, sewers, water systems and other utilities, taxes and other costs related to ownership of the land on which we plan to build homes; constructing model homes; and promotional and marketing expenses to prepare for the opening of a new home community for sales. Moreover, local municipalities may impose development-related requirements resulting in additional costs. If the rate at which we sell and deliver homes slows or falls, or if our opening of new home communities for sales is delayed, we may incur additional costs, which would adversely affect our gross profit margins, and it will take a longer period of time for us to recover our costs, including those we incurred in acquiring and developing land.
In certain circumstances, a grant of entitlements or development agreement with respect to a particular parcel of land may include restrictions on the transfer of such entitlements to a buyer of such land, which may increase our exposure to decreases in the price of such entitled land by restricting our ability to sell it for its full entitled value. In addition, inventory carrying costs can be significant and can result in reduced margins or losses in a poorly performing community or market. Further, if we were required to record a significant inventory impairment, it could negatively affect our reported earnings per share and negatively impact the market perception of our business.
If land and lots are not available at competitive prices, our sales and results of operations could be adversely affected.
Our long-term profitability depends in large part on the price at which we are able to obtain suitable land and lots for the development of our communities. Increases in the price (or decreases in the availability) of suitable land and lots could adversely affect our profitability. Moreover, changes in the general availability of desirable land, geographical or topographical constraints, competition for available land and lots, limited availability of financing to acquire land and lots, zoning regulations that limit housing density, environmental requirements and other market conditions may hurt our ability to obtain land and lots for new communities at prices that will allow us to be profitable. If the supply of land and lots that are appropriate for development of our communities becomes more limited because of these factors, or for any other reason, the cost of land and lots could increase and the number of homes that we are able to build and sell could be reduced, which could adversely affect our results of operations and financial condition.
17
If the market value of our land inventory decreases, our results of operations could be adversely affected by impairments and write-downs.
The market value of our land and housing inventories depends on market conditions. We acquire land for expansion into new markets and for replacement of land inventory and expansion within our current markets, and there is often a significant lag time between when we acquire land for development and when we sell homes in our communities. This risk is exacerbated particularly with undeveloped and/or unentitled land.
There is an inherent risk that the value of the land owned by us may decline after purchase. The valuation of property is inherently subjective and based on the individual characteristics of each property. We may have acquired options on or bought and developed land at a cost we will not be able to recover fully or on which we cannot build and sell homes profitably. In addition, our deposits for lots controlled under option or similar contracts may be put at risk, and depressed land values may cause us to abandon and forfeit deposits on land option contracts and other similar contracts if we cannot satisfactorily renegotiate the purchase price of the subject land. Factors such as changes in regulatory requirements and applicable laws (including in relation to building regulations, taxation and planning), political conditions, the condition of financial markets, both local and national economic conditions, the financial condition of customers, potentially adverse tax changes, and interest and inflation rate fluctuations subject valuations to uncertainty. Moreover, all valuations are made on the basis of assumptions that may not prove to reflect economic or demographic reality. If housing demand decreases below what we anticipated when we acquired our inventory, our profitability may be adversely affected and we may not be able to recover our costs when we sell and build houses. In addition, we may incur charges against our earnings for inventory impairments if the value of our owned inventory, including land we decide to sell, is reduced or for land option contract abandonments if we choose not to exercise land option contracts or other similar contracts, and these charges may be substantial.
We regularly review the value of our land holdings and continue to review our holdings on a periodic basis. If material write-downs and impairments in the value of our inventory are required and, if in the future we are required to sell land or homes at a loss, our results of operations and financial condition would be adversely affected.
Government regulations and legal challenges may delay the start or completion of our communities, increase our expenses or limit our homebuilding or other activities, which could have a negative impact on our results of operations.
The approval of numerous governmental authorities must be obtained in connection with our development activities, and these governmental authorities often have broad discretion in exercising their approval authority. We incur substantial costs related to compliance with legal and regulatory requirements. Any increase in legal and regulatory requirements may cause us to incur substantial additional costs, or in some cases cause us to determine that a property is not feasible for development. Various local, state and federal statutes, ordinances, rules and regulations concerning building, health and safety, site and building design, environment, zoning, sales and similar matters apply to and/or affect the housing industry. In addition, our ability to obtain or renew permits or approvals and the continued effectiveness of permits already granted or approvals already obtained depends on factors beyond our control, such as changes in federal, state and local policies, rules and regulations and their interpretations and application. Furthermore, we are also subject to various fees and charges of government authorities designed to defray the cost of providing certain governmental services and improvements. For example, local and state governments have broad discretion regarding the imposition of development fees for projects under their jurisdictions, as well as requiring concessions or that the builder construct certain improvements to public places such as parks and streets or fund schools.
Municipalities may restrict or place moratoriums on the availability of utilities, such as water and sewer taps. If municipalities in which we operate take such actions, it could have an adverse effect on our business by causing delays, increasing our costs or limiting our ability to operate in those municipalities.
Certain states, cities and counties in which we operate have in the past approved, or approved for inclusion on their voting ballots, various “slow growth” or “no growth” initiatives and other ballot measures that could negatively impact the availability of land and building opportunities within those localities. These measures may reduce our ability to open new home communities and to build and sell homes in the affected markets, including with respect to land we may already own, and create additional costs and administration requirements, which in turn may harm our future sales, margins and earnings. A further expansion of these measures or the adoption of new slow-growth, no-growth or other similar programs could exacerbate such risks.
Governmental regulation affects not only construction activities but also sales activities, mortgage lending activities and other dealings with consumers. Further, government agencies routinely initiate audits, reviews or investigations of our business practices to ensure compliance with applicable laws and regulations, which can cause us to incur costs or create other disruptions in our business that can be significant. Further, we may experience delays and increased expenses as a result of legal challenges to our proposed communities, whether brought by governmental authorities or private parties.
18
Regulations regarding environmental matters and climate change may affect us by substantially increasing our costs and exposing us to potentially liability.
We are subject to various environmental laws and regulations, which may affect aspects of our operations such as how we manage stormwater runoff, wastewater discharges and dust; how we develop or operate on properties on or affecting resources such as wetlands, endangered species, cultural resources, or areas subject to preservation laws; and how we address contamination. Developers and homebuilders may become subject to more stringent requirements under such laws. For example, the U.S Environmental Protection Agency and U.S. Army Corps of Engineers have been engaged for years in rulemakings to clarify the scope of federally regulated wetlands, which included: a June 2015 rule many affected businesses contend impermissibly expanded the scope of such wetlands that was challenged in court, stayed, and remains in litigation; and a proposal in June 2017 to formally rescind the June 2015 rule and reinstate the rule scheme previously in place while the agencies initiate a new substantive rulemaking on the issue. It is unclear how these and related developments, including at the state or local level, ultimately may affect the scope of regulated wetlands where we operate. Although we cannot reliably predict the extent of any effect these developments regarding wetlands, or any other environmental requirements that may take effect may have on us, they could result in time-consuming and expensive compliance programs and in substantial expenditures, which could cause delays and increase our cost of operations. Our noncompliance with environmental laws could result in fines and penalties, obligations to remediate, permit revocations and other sanctions. Contamination or other environmental conditions at or in the vicinity of our developments could result in claims against us for personal injury, property damage, or other losses.
In addition, there is a variety of legislation being enacted, or considered for enactment, at the federal, state and local level relating to energy and climate change. This legislation relates to items such as carbon dioxide emissions control and building codes that impose energy efficiency standards. New building code requirements that impose stricter energy efficiency standards could significantly increase our cost to construct homes. As climate change concerns continue to grow, legislation and regulations of this nature are expected to continue and become more costly to comply with. In addition, it is possible that some form of expanded energy efficiency legislation may be passed by the U.S. Congress or federal agencies and certain state legislatures, which may, despite being phased in over time, significantly increase our costs of building homes and the sale price to our buyers and adversely affect our sales volumes. We may be required to apply for additional approvals or modify our existing approvals because of changes in local circumstances or applicable law. Energy-related initiatives affect a wide variety of companies throughout the United States and the world and, because our operations are heavily dependent on significant amounts of raw materials, such as lumber, steel and concrete, they could have an indirect adverse impact on our operations and profitability to the extent the manufacturers and suppliers of our materials are burdened with expensive cap and trade and similar energy related taxes and regulations.
Our mortgage operations are subject to risks, including risks associated with our ability to sell mortgages we originate and to claims on loans sold to third parties.
While we intend for the loans originated by TMHF, our mortgage operations business, to be sold on the secondary market, if TMHF is unable to sell loans into the secondary mortgage market or directly to large secondary market loan purchasers such as Fannie Mae and Freddie Mac, TMHF would bear the risk of being a long-term investor in these originated loans. Being required to hold loans on a long-term basis would subject us to credit risks associated with the borrowers to whom the loans are extended, would negatively affect our liquidity and could require us to use additional capital resources to finance the loans that TMHF is extending. In addition, although mortgage lenders under the mortgage warehouse facilities TMHF currently uses to finance our lending operations normally purchase our mortgages within approximately 20-30 days of origination, if such mortgage lenders default under these warehouse facilities TMHF would be required to fund the mortgages then in the pipeline. In such case, amounts available under our Revolving Credit Facility (as defined below) and cash from operations may not be sufficient to allow TMHF to provide financing required by our business during these times, and our ability to originate and sell mortgage loans at competitive prices could be limited, which could negatively affect our business. Further, an obligation to commit our own funds to long-term investments in mortgage loans could, among other things, delay the time when we recognize revenues from home sales on our statements of operations.
Our mortgage operations may also be responsible for losses associated with mortgage loans originated and sold to investors in the event of errors or omissions relating to certain representations and warranties made to secondary market purchasers that the loans sold meet certain requirements, including representations as to underwriting standards, the type of collateral, the existence of primary mortgage insurance and the validity of certain borrower representations in connection with the loan. Accordingly, mortgage investors could seek to have us buy back loans or compensate them for losses incurred on mortgages we have sold based on claims that we breached our limited representations or warranties. If, due to higher costs, reduced liquidity, residential consumer loan putback demands or internal or external reviews of its residential consumer mortgage loan
19
foreclosure processes, or other factors or business decisions, TMHF is unable to make loan products available to our homebuyers, our home sales and mortgage services results of operations may be adversely affected.
We enter into interest rate lock commitments (“IRLCs”) to originate residential mortgage loans held for sale, at specified interest rates and within a specified period of time (generally between 30 and 60 days), with customers who have applied for a loan and meet certain credit and underwriting criteria. These commitments expose us to market risk if interest rates change and the underlying loan is not economically hedged or committed to an investor. We also have exposure to credit loss in the event of contractual non-performance by our trading counterparties in derivative instruments that we use in our rate risk management activities. We aim to manage this credit risk by selecting only counterparties that we believe to be financially strong, spreading the risk among multiple counterparties, by placing contractual limits on the amount of unsecured credit extended to any single counterparty, and by entering into netting agreements with counterparties, as appropriate.
Our mortgage operations and title services businesses may be adversely affected by changes in governmental regulation.
Changes in governmental regulation with respect to mortgage lenders and title service providers could adversely affect the financial results of this portion of our business. Our mortgage operations are subject to numerous federal, state and local laws and regulations, including with respect to originating, processing, selling and servicing mortgage loans, which, among other things: prohibit discrimination and establish underwriting guidelines; provide for audits and inspections; require appraisals and/or credit reports on prospective borrowers and disclosure of certain information concerning credit and settlement costs; establish maximum loan amounts; prohibit predatory lending practices; and regulate the referral of business to affiliated entities. In addition, our title insurance operations are also subject to applicable insurance and banking laws and regulations.
The regulatory environment for mortgage lending is complex and ever changing and has led to an increase in the number of audits and investigations in the industry. In addition, there have been numerous changes and proposed changes in regulations affecting the financial services industry as a result of the housing downturn. For example, in July 2010, the Dodd-Frank Act was enacted. Among other things, this legislation provides for minimum standards for mortgages and lender practices in making mortgages, limitations on certain fees, retention of credit risk, prohibition of certain tying arrangements and remedies for borrowers in foreclosure proceedings. In January 2013, the Consumer Financial Protection Bureau proposed a number of new rules that became effective in January 2014, including but not limited to rules regarding the creation and definition of a “Qualified Mortgage,” rules for lender practices regarding assessing borrowers’ ability to repay and limitations on certain fees and incentive arrangements. In October 2015, the Consumer Financial Protection Bureau’s new Truth in Lending - Real Estate Settlement Procedures Act (TILA-RESPA) Integrated Disclosure Rule became effective. This rule implemented additional disclosure timeline requirements and fee tolerances. The effects of these rules could affect the availability and cost of mortgage credit, negatively impact closing timelines and the delivery of homes and adversely affect the costs and financial results of financial services and homebuilding companies. Other requirements provided for by the Dodd-Frank Act have not yet been finalized or implemented. The effect of provisions on our mortgage operations and title services businesses will depend on the rules that are ultimately enacted. Any such changes or new enactments could result in more stringent compliance standards, which could adversely affect our financial condition and results of operations and the market perception of our business. Additionally, if we are unable to originate mortgages for any reason going forward, our customers may experience significant mortgage loan funding issues, which could have a material impact on our homebuilding business and our consolidated financial statements.
The prices of our mortgages could be adversely affected if we lose any of our important commercial relationships.
We have longstanding relationships with members of the lender community from which our borrowers benefit. TMHF plans to continue with these relationships and use the correspondent lender platform as a part of its operational plan. If our relationship with any one or more of those banks deteriorates or if one or more of those banks decide to renegotiate or terminate existing agreements or otherwise exit the market, TMHF may be required to increase the price of our products, or modify the range of products TMHF offers, which could cause us to lose customers who may choose other providers based solely on price or fees, which could adversely affect our financial condition and results of operations.
We may not be able to use certain deferred tax assets, which may result in our having to pay substantial taxes.
We have significant deferred tax assets, including net operating losses that could be used to offset earnings and reduce the amount of taxes we are required to pay. Our ability to use net operating losses to offset earnings is dependent on a number of factors, including applicable rules relating to the permitted carry back period for offsetting certain net operating losses against prior period earnings and the timing and amount of future taxable income. If we are unable to use our net operating losses, we may have to record charges to reduce our deferred tax assets, which could have an adverse effect on our results of operations. In addition, as a result of the reduction in the corporate tax rates under the Tax Act, we experienced a $57.4 million reduction in
20
our deferred tax assets, and our deferred tax assets, net of deferred tax liabilities and valuation allowance, were $118.1 million as of December 31, 2017.
Raw materials and building supply shortages and price fluctuations could delay or increase the cost of home construction and adversely affect our operating results.
The homebuilding industry has, from time to time, experienced raw material shortages and been adversely affected by volatility in global commodity prices. In particular, shortages and fluctuations in the price of concrete, drywall, lumber or other important raw materials could result in delays in the start or completion of, or increase the cost of, developing one or more of our residential communities. Our lumber needs are particularly sensitive to shortages. In addition, the cost of petroleum products, which are used both to deliver our materials and to transport workers to our job sites, fluctuates and may be subject to increased volatility as a result of geopolitical events or accidents such as the Deepwater Horizon accident in the Gulf of Mexico. Increases in such costs could also result in higher prices for products utilizing petrochemicals. Environmental laws and regulations may also have a negative impact on the availability and price of certain raw materials such as lumber and concrete. These cost increases may have an adverse effect on our operating margin and results of operations. Additionally, we may be unable to pass increases in construction costs on to our customers who may have already entered into purchase contracts. Furthermore, any such cost increase may adversely affect the regional economies in which we operate and reduce demand for our homes.
We have significant operations in certain geographic areas, which subjects us to an increased risk of loss of revenue or decreases in the market value of our land and homes in these regions from factors which may affect any of these regions.
Our operations are concentrated in Arizona, California, Colorado, Florida, Georgia, Illinois, North Carolina and Texas. Some or all of these regions could be affected by:
• | severe weather; |
• | natural disasters; |
• | climate change; |
• | shortages in the availability or increased costs in obtaining land, equipment, labor or building supplies; |
• | unemployment; |
• | changes to the population growth rates and therefore the demand for homes in these regions; and |
• | changes in the regulatory and fiscal environment. |
Due to the concentrated nature of our operations, negative factors affecting one or a number of these geographic regions at the same time could result in a relatively greater impact on our results of operations than they might have on other companies that have a more diversified portfolio of operations. For example, we operate in a number of locations that were adversely impacted by severe weather conditions in 2017 and, as a result, our divisional operations in Houston and certain areas of Florida markets experienced closures, disruptions and delays. To the extent that regions in which our business is concentrated are impacted by an adverse event, we would be disproportionately affected compared to companies whose operations are less geographically concentrated.
The markets we operate in may also depend, to a degree, on certain sectors of the economy and any declines in those sectors may impact home sales and activities in that region. For example, to the extent the oil and gas industries, which can be very volatile, are negatively impacted by declining commodity prices, climate change, legislation or other factors, it could result in reduced employment, or other negative economic consequences, which in turn could adversely impact our home sales and activities, particularly in Texas. Similarly, slower rates of population growth or population declines in our key markets, especially as compared to the high population growth rates in prior years, could affect the demand for housing, causing home prices in these markets to fall, and adversely affect our business, financial condition and operating results.
We participate in certain unconsolidated joint ventures, including those where we do not have a controlling interest, where we may be adversely impacted by the failure of the unconsolidated joint venture or the other partners in the unconsolidated joint venture to fulfill their obligations.
We have investments in and commitments to certain unconsolidated joint ventures with related and unrelated strategic partners to acquire and develop land and, in some cases, build and deliver homes. To finance these activities, our unconsolidated joint ventures often obtain loans from third-party lenders that are secured by the unconsolidated joint venture’s assets. To the extent any of our joint ventures default on obligations secured by the assets of such joint venture, the assets could be forfeited to third-party lenders.
21
We have provided non-recourse carve-out guarantees to certain third-party lenders to our unconsolidated joint ventures (i.e., guarantees of losses suffered by the lender in the event that the borrowing entity or its equity owners engage in certain conduct, such as fraud, misappropriation of funds, unauthorized transfers of the financed property or equity interests in the borrowing entity, or the borrowing entity commences a voluntary bankruptcy case, or the borrowing entity violates environmental law, or hazardous materials are located on the property, or under other circumstances provided for in such guarantee or indemnity). In the future, we may provide other guarantees and indemnities to such lenders, including secured guarantees, in which case we may have increased liability in the event that a joint venture defaults on its obligations to a third party.
If the other partners in our unconsolidated joint ventures do not provide such cooperation or fulfill these obligations due to their financial condition, strategic business interests (which may be contrary to ours), or otherwise, we may be required to spend additional resources (including payments under the guarantees we have provided to the unconsolidated joint ventures’ lenders) or suffer losses, each of which could be significant. Moreover, our ability to recoup such expenditures and losses by exercising remedies against such partners may be limited due to the contractual terms of the joint venture agreement, potential legal defenses they may have, their respective financial condition and other circumstances. Furthermore, because we lack a controlling interest in our unconsolidated joint ventures we cannot exercise sole decision-making authority, which could create the potential risk of impasses on decisions and prevent the joint venture from taking actions that we believe may be in our best interests. In addition, as our relationships with our partners are contractual in nature and may be terminated or dissolved under the terms of the applicable joint venture agreements, including buy-sell provisions, we may not continue to own or operate the interests or assets underlying such relationship or may need to purchase additional interests or assets in the venture to continue ownership. In the event a joint venture is terminated or dissolved, we could also be exposed to lawsuits and legal costs.
Information technology failures and data security breaches could harm our business.
We use information technology and other computer resources to carry out important operational and marketing activities as well as maintain our business records, including information provided by our customers. Many of these resources are provided to us and/or maintained on our behalf by third-party service providers pursuant to agreements that specify certain security and service level standards. Our ability to conduct our business may be impaired if these resources are compromised, degraded, damaged or fail, whether due to a virus or other harmful circumstance, intentional penetration or disruption of our information technology resources by a third party, natural disaster, hardware or software corruption, failure or error (including a failure of security controls incorporated into or applied to such hardware or software), telecommunications system failure, service provider error or failure, intentional or unintentional personnel actions (including the failure to follow our security protocols), or lost connectivity to our networked resources. A significant and extended disruption in the functioning of these resources could impair our operations, damage our reputation and cause us to lose customers, sales and revenue.
In addition, breaches of our data security systems, including by cyber-attacks, could result in the unintended public disclosure or the misappropriation of our proprietary information or personal and confidential information, about our employees, consumers who view our homes, homebuyers, mortgage loan borrowers and business partners, requiring us to incur significant expense to address and resolve these kinds of issues. The release of confidential information may also lead to identity theft and related fraud, litigation or other proceedings against us by affected individuals and/or business partners and/or by regulators, and the outcome of such proceedings, which could include penalties or fines, could have a material and adverse effect on our reputation, business, financial condition and results of operations. Depending on its nature, a particular breach or series of breaches of our systems may result in the unauthorized use, appropriation or loss of confidential or proprietary information on a one-time or continuing basis, which may not be detected for a period of time. In addition, the costs of maintaining adequate protection against such threats, as they develop in the future (or as legal requirements related to data security increase) could be material.
We may incur a variety of costs to engage in future growth or expansion of our operations or acquisitions or disposals of businesses, and the anticipated benefits may never be realized.
As a part of our business strategy, we may make acquisitions, or significant investments in, and/or disposals of, businesses. Any future acquisitions, investments and/or disposals would be accompanied by risks such as:
• | difficulties in assimilating the operations and personnel of acquired companies or businesses; |
• | diversion of our management’s attention from ongoing business concerns; |
• | our potential inability to maximize our financial and strategic position through the successful incorporation or disposition of operations; |
• | maintenance of uniform standards, controls, procedures and policies; and |
• | impairment of existing relationships with employees, contractors, suppliers and customers as a result of the integration of new management personnel and cost-saving initiatives. |
22
Acquisitions can result in dilution to existing stockholders if we issue our common stock as consideration, or reduce our liquidity if we fund them with cash. In addition, acquisitions can expose us to valuation risks, including the risk of writing off goodwill or impairing inventory and other assets related to such acquisitions. The risk of goodwill and asset impairments will increase during a cyclical housing downturn when our profitability may decline.
We cannot guarantee that we will be able to successfully integrate any company or business that we might acquire in the future, and our failure to do so could harm our current business. In addition, we may not realize the anticipated benefits of these transactions and there may be other unanticipated or unidentified effects. While we would seek protection, for example, through warranties and indemnities in the case of acquisitions, significant liabilities may not be identified in due diligence or may come to light after the expiry of warranty or indemnity periods. Additionally, in the case of disposals, while we would seek to limit our ongoing exposure, for example, through liability caps and time limits on warranties and indemnities, some warranties and indemnities may give rise to unexpected and significant liabilities. Any claims arising in the future may adversely affect our business, financial condition and operating results. We may not able to manage the risks associated with these transactions and the effects of such transactions, which may materially and adversely affect our business, financial condition and operating results.
Dispositions have their own risks. For example, our disposition of Monarch in 2015 required the separation of our operations and personnel from those of Monarch, as well as our performance of certain related transition services. This required the allocation of management resources. Dispositions may also result in lost synergies that could negatively impact our balance sheet, income statement and cash flows.
We have defined benefit and defined contribution pension schemes to which we may be required to increase our contributions to fund deficits.
We provide retirement benefits for former and certain of our current employees through a number of defined benefit and defined contribution pension schemes. Certain of these plans are no longer available to new employees. As of December 31, 2017, we had an unfunded status of $8.1 million in our defined benefit pension plans. This deficit may increase, and we may be required to increase contributions to our plans in the future, which may materially and adversely affect our liquidity and financial condition.
A major health and safety incident relating to our business could be costly in terms of potential liabilities and reputational damage.
Building sites are inherently dangerous and pose certain inherent health and safety risks to construction workers and other persons on the site. Due to health and safety regulatory requirements and the number of projects we work on, health and safety performance is critical to the success of all areas of our business. Any failure in health and safety performance may result in penalties for non-compliance with relevant regulatory requirements, and a failure that results in a major or significant health and safety incident is likely to be costly in terms of potential liabilities incurred as a result. Such a failure could generate significant negative publicity and have a corresponding impact on our reputation, our relationships with relevant regulatory agencies or governmental authorities, and our ability to attract customers and employees, which in turn could have a material adverse effect on our business, financial condition and operating results.
Ownership, leasing or occupation of land and the use of hazardous materials carries potential environmental risks and liabilities.
We are subject to a variety of local, state and federal statutes, rules and regulations concerning land use and the protection of health and the environment, including those governing discharge of pollutants to water and air, stormwater run-off, the presence of and exposure to asbestos, the handling of hazardous materials and the cleanup of contaminated sites. Additionally, as a homebuilding business with a wide variety of historic homebuilding and construction activities, we could also be liable for future claims for damages as a result of the past or present use of hazardous materials, including building materials which in the future become known or are suspected to be hazardous. We may be liable for the costs of removal, investigation or remediation of hazardous or toxic substances located on, under or in a property currently or formerly owned, leased or occupied by us, whether or not we caused or knew of the pollution. The costs of any required removal, investigation or remediation of such substances or the costs of defending against environmental claims may be substantial, and insurance coverage for such claims may be limited or non-existent. The presence of such substances, or the failure to remediate such substances properly, may also adversely affect our ability to sell the land or to borrow using the land as security. Environmental impacts from historical activities have been identified at some of the projects we have developed in the past and additional projects may be located on land that may have been contaminated by previous use. Although we are not aware of any projects requiring material remediation activities by us as a result of historical contamination, no assurances can be given that material claims or liabilities
23
relating to such developments will not arise in the future, and such contamination or other environmental conditions at or in the vicinity of our developments could result in claims against us for personal injury, property damage or other losses.
The particular impact and requirements of environmental laws that apply to any given community vary greatly according to the community site, the site’s environmental conditions and the present and former use of the site. We expect that increasingly stringent requirements may be imposed on homebuilders in the future. In addition, violations of environmental laws and regulations can result in injunctions, civil penalties, remediation expenses and other costs. Further, some environmental laws impose strict liability, which means that we may be held liable for unlawful environmental conditions on property we own which we did not create.
We may face substantial damages or be enjoined from pursuing important activities as a result of existing or future litigation, arbitration or other claims.
We are involved in various litigation and legal claims in the normal course of our business operations, including actions brought on behalf of various classes of claimants.
We establish liabilities for legal claims and regulatory matters when such matters are both probable of occurring and any potential loss is reasonably estimable. We accrue for such matters based on the facts and circumstances specific to each matter and revise these estimates as the matters evolve. In such cases, there may exist an exposure to loss in excess of any amounts currently accrued. In view of the inherent difficulty of predicting the outcome of these legal and regulatory matters, we generally cannot predict the ultimate resolution, the related timing or any eventual loss. To the extent the liability arising from the ultimate resolution of any matter exceeds the estimates reflected in the recorded reserves relating to such matter, we could incur additional charges that could be significant. Unfavorable litigation, arbitration or claims could also generate negative publicity in various media outlets that could be detrimental to our reputation.
Negative publicity or poor relations with the residents of our communities could negatively impact sales, which could cause our revenues or results of operations to decline.
Unfavorable media related to our industry, company, brands, marketing, personnel, operations, business performance, or prospects may affect our stock price and the performance of our business, regardless of its accuracy or inaccuracy. Our success in maintaining, extending and expanding our brand image depends on our ability to adapt to a rapidly changing media environment. Adverse publicity or negative commentary on social media outlets, such as blogs, websites or newsletters, could hurt operating results, as consumers might avoid or protest brands that receive bad press or negative reviews. Furthermore, negative publicity can be disseminated rapidly through these channels and other digital platforms. Customers and other interested parties could act on such information without further investigation and without regard to its accuracy. Accordingly, we could suffer immediate harm without affording us an opportunity for redress or correction. Any such negative publicity may result in a decrease in our operating results.
In addition, we can be affected by poor relations with the residents of communities we develop because these residents sometimes look to us to resolve issues or disputes that may arise in connection with the operation or development of their communities. Efforts made by us to resolve these issues or disputes could be deemed unsatisfactory by the affected residents and subsequent actions by these residents could adversely affect sales or our reputation. In addition, we could decide or be required to make material expenditures related to the settlement of such issues or disputes or to modify our community development plans, which could adversely affect our results of operations.
Failure to recruit, retain and develop highly skilled, competent people at all levels may have a material adverse effect on our financial condition or our standard of service.
Our business involves complex operations and, therefore, demands a management team and employee workforce that is knowledgeable and expert in many areas necessary for our operations. Skilled and experienced employees, managers and executives working in the homebuilding and construction industries are highly sought after, and we compete with other companies across all industries to attract and retain such persons. Our performance and success are dependent, in part, upon key members of our management and personnel, and their loss or departure could be detrimental to our future success. Further, the process of attracting and retaining suitable replacements for key personnel whose services we may lose would result in transition costs and would divert the attention of other members of our senior management from our existing operations. Competition for the services of these individuals would be expected to increase as business conditions improve in the homebuilding and financial services industries or in the general economy. In addition, we do not maintain key person insurance in respect of any members of our senior management team. Our inability to attract and retain key personnel or any of our
24
members of management, or ensure that their experience and knowledge are not lost when they leave the business through retirement or otherwise, could adversely impact our business, financial condition and operating results.
In addition, the vast majority of our work carried out on site is performed by subcontractors. In addition, reduced levels of homebuilding in the United States have led to some skilled tradesmen leaving the industry to take jobs in other sectors. If subcontractors are not able to recruit sufficient numbers of skilled employees, our development and construction activities may suffer from delays and quality issues, which would also lead to reduced levels of customer satisfaction.
Utility and resource shortages or rate fluctuations could have an adverse effect on our operations.
Several of the markets in which we operate have historically been subject to utility and resource shortages, including significant changes to the availability of electricity and water. Shortages of utility resources and natural resources in our markets, particularly of water, may make it more difficult for us to obtain regulatory approval of new developments and have other adverse implications.
For example, certain areas in which we operate, particularly the Western United States, have experienced and continue to experience severe drought conditions. In response to these conditions, government officials often take a number of steps to preserve potable water supplies. To address the state’s mandate and their own available potable water supplies, local water agencies/suppliers could potentially: restrict, delay the issuance of, or proscribe new water connection permits for homes; increase the costs for securing such permits, either directly or by requiring participation in impact mitigation programs; adopt higher efficiency requirements for water-using appliances or fixtures; limit or ban the use of water for construction activities; impose requirements as to the types of allowed plant material or irrigation for outdoor landscaping that are more strict than state standards and less desired by consumers; and/or impose fines and penalties for noncompliance with any such measures. These local water agencies/suppliers could also increase rates and charges to residential users for the water they use, potentially increasing the cost of homeownership.
Any of the foregoing, individually or collectively, could adversely affect the regional economies in which we operate, which may limit, impair or delay our ability to acquire and develop land and/or build and deliver homes, increase our production costs or reduce demand for our homes, thereby negatively affecting our business and results of operations.
Constriction of the capital markets could limit our ability to access capital and increase our costs of capital.
We fund our operations from cash from operations, capital markets financings and borrowings under our Revolving Credit Facility and other loan facilities. Volatile economic conditions and the constriction of the capital markets could reduce the sources of liquidity available to us and increase our costs of capital. If the size or availability of our banking facilities is reduced in the future, or if we are unable to obtain new, or renew existing, facilities in the future on favorable terms or otherwise access the loan or capital markets, it would have an adverse effect on our liquidity and operations.
As of December 31, 2017, we had $204.9 million of debt maturing in the next 12 months. We believe we can meet this and our other capital requirements with our existing cash resources and future cash flows and, if required, other sources of financing that we anticipate will be available to us. However, we can provide no assurance that we will continue to be able to do so, particularly if industry or economic conditions deteriorate. The future effects on our business, liquidity and financial results of these conditions could be adverse, both in the ways described above and in other ways that we do not currently foresee.
Our substantial debt could adversely affect our business, financial condition or results of operations and prevent us from fulfilling our debt-related obligations.
We have a substantial amount of debt. As of December 31, 2017, the total principal amount of our debt (including $118.8 million of indebtedness of TMHF) was $1.5 billion. Our substantial debt could have important consequences for the holders of our common stock, including:
• | making it more difficult for us to satisfy our obligations with respect to our debt or to our trade or other creditors; |
• | increasing our vulnerability to adverse economic or industry conditions; |
• | limiting our ability to obtain additional financing to fund capital expenditures and land acquisitions, particularly when the availability of financing in the capital markets is limited; |
• | requiring us to pay higher interest rates upon refinancing or on our variable rate indebtedness if interest rates rise; |
• | requiring a substantial portion of our cash flows from operations and the proceeds of any capital markets offerings or loan borrowings for the payment of interest on our debt and reducing our ability to use our cash flows to fund working capital, capital expenditures, land acquisitions and general corporate requirements; |
25
• | limiting our flexibility in planning for, or reacting to, changes in our business and the industry in which we operate; and |
• | placing us at a competitive disadvantage to less leveraged competitors. |
We cannot assure you that our business will generate sufficient cash flow from operations or that future borrowings will be available to us through capital markets financings or under our Revolving Credit Facility or otherwise in an amount sufficient to enable us to pay our indebtedness, or to fund our other liquidity needs. We may need to refinance all or a portion of our indebtedness, on or before its maturity. We cannot assure you that we will be able to refinance any of our indebtedness on commercially reasonable terms or at all. In addition, we may incur additional indebtedness in order to finance our operations, to fund acquisitions, or to repay existing indebtedness. If we cannot service our indebtedness, we may have to take actions such as selling assets, seeking additional debt or equity or reducing or delaying capital expenditures, strategic acquisitions, investments and alliances. We cannot assure you that any such actions, if necessary, could be effected on commercially reasonable terms or at all, or on terms that would be advantageous to our stockholders or on terms that would not require us to breach the terms and conditions of our existing or future debt agreements.
Restrictive covenants in the indenture governing our 2021 Senior Notes and the agreements governing our Revolving Credit Facility and other indebtedness may restrict our ability to pursue our business strategies.
The indenture governing our 2021 Senior Notes (as defined below) and the agreement governing our Revolving Credit Facility limit our ability, and the terms of any future indebtedness may prohibit or limit our ability, among other things, to:
• | incur or guarantee additional indebtedness; |
• | make certain investments; |
• | repurchase equity or subordinated indebtedness; |
• | pay dividends or make distributions on our capital stock; |
• | sell assets, including capital stock of restricted subsidiaries; |
• | agree to restrictions on distributions, transfers or dividends affecting our restricted subsidiaries; |
• | consolidate, merge, sell or otherwise dispose of all or substantially all of our assets; |
• | enter into transactions with our affiliates; |
• | incur liens; and |
• | designate any of our subsidiaries as unrestricted subsidiaries. |
The agreement governing the Revolving Credit Facility contains certain “springing” financial covenants requiring TMM Holdings and its subsidiaries to comply with a maximum capitalization ratio and a minimum consolidated tangible net worth test. The agreement governing the Revolving Credit Facility also contains customary restrictive covenants, including limitations on incurrence of liens, the payment of dividends and other distributions, asset dispositions, investments, sale and leasebacks and limitations on debt payments and amendments. See Item 7 - Management’s Discussion and Analysis of Financial Condition and Results of Operations - Liquidity and Capital Resources in this Annual Report.
The restrictions contained in the indentures governing all of our Senior Notes and the agreement governing our Revolving Credit Facility could also limit our ability to plan for or react to market conditions, meet capital needs or make acquisitions or otherwise restrict our activities or business plans.
A breach of any of the restrictive covenants under the agreements governing our Revolving Credit Facility or any of our Senior Notes could allow for the acceleration of both the Revolving Credit Facility and the Senior Notes. If the indebtedness under our Revolving Credit Facility or the Senior Notes were to be accelerated, we cannot assure you that our assets would be sufficient to repay in full that indebtedness and our other indebtedness. See Item 7 - Management’s Discussion and Analysis of Financial Condition and Results of Operations - Liquidity and Capital Resources in this Annual Report.
We may require additional capital in the future and may not be able to secure adequate funds on terms acceptable to us.
The expansion and development of our business may require significant capital, which we may be unable to obtain, to fund our capital expenditures and operating expenses, including working capital needs. We may fail to generate sufficient cash flow from the sales of our homes and land or from other financing sources in order to meet our cash requirements. Further, our capital requirements may vary materially from those currently planned if, for example, our revenues do not reach, or our costs exceed, expected levels or we have to incur unforeseen capital expenditures to maintain our competitive position. If this is the case, we may require additional financing sooner than anticipated or we may have to delay or abandon some or all of our development and expansion plans or otherwise forego market opportunities.
26
To a large extent, our cash flow generation ability is subject to general economic, financial, competitive, legislative and regulatory factors and other factors that are beyond our control. We cannot assure you that our business will generate cash flow from operations in an amount sufficient to enable us to fund our liquidity needs. As a result, we may need to refinance all or a portion of our indebtedness, on or before its maturity, or obtain additional equity or debt financing. We cannot assure you that we will be able to do so on commercially reasonable terms, if at all. Any inability to generate sufficient cash flow, refinance our indebtedness or incur additional indebtedness on commercially reasonable terms could adversely affect our financial condition and could cause us to be unable to service our debt and may delay or prevent the expansion of our business.
Risks related to our structure and organization
TMHC’s only asset is its interest in TMM Holdings II Limited Partnership (“New TMM”) and, accordingly, it is dependent upon distributions from New TMM to pay dividends, if any, taxes and other expenses. New TMM is a holding company with no operations of its own and, in turn, relies on distributions from TMM Holdings and its operating subsidiaries.
TMHC is a holding company and has no assets other than its ownership, directly or indirectly, of New TMM Units. TMHC has no independent means of generating revenue. TMHC intends to cause New TMM to make distributions to its partners in an amount sufficient to cover all applicable taxes payable and dividends, if any, declared by TMHC. To the extent that TMHC needs funds, and New TMM is restricted from making such distributions under applicable law or regulation, or is otherwise unable to provide such funds, it could materially and adversely affect TMHC’s liquidity and financial condition. In addition, New TMM has no direct operations and derives all of its cash flow from TMM Holdings and its subsidiaries. Because the operations of TMHC’s business are conducted through subsidiaries of TMM Holdings, New TMM is dependent on those entities for dividends and other payments to generate the funds necessary to meet the financial obligations of New TMM. Legal and contractual restrictions in the agreements governing the Revolving Credit Facility, certain of the Senior Notes and other debt agreements governing current and future indebtedness of New TMM’s subsidiaries, as well as the financial condition and operating requirements of New TMM’s subsidiaries, may limit TMHC’s ability to obtain cash from New TMM’s subsidiaries. The earnings from, or other available assets of, New TMM’s subsidiaries may not be sufficient to pay dividends or make distributions or loans to TMHC to enable TMHC to pay any dividends on the Class A Common Stock, taxes and other expenses.
We are no longer a “controlled company” within the meaning of the corporate governance rules of the New York Stock Exchange, and we are subject to additional governance requirements under such rules.
A “controlled company” is a company of which more than 50% of the voting power for the election of directors is held by an individual, group or another company.
In May 2017, affiliates of TPG and Oaktree ceased to hold more than 50% of our voting power. As a result, we are subject to additional governance requirements under New York Stock Exchange rules, including the requirements to have (i) a majority of independent directors on our board of directors, (ii) a nominating and corporate governance committee that is composed entirely of independent directors, and (iii) a compensation committee that is composed entirely of independent directors. The New York Stock Exchange rules provide for phase-in periods for these requirements and we must be fully compliant with the new requirements prior to May 5, 2018.
During the transition period following our ceasing to be a “controlled company,” holders of our Class A Common Stock may not have the same protection afforded to stockholders of companies that are subject to all of the corporate governance requirements of the New York Stock Exchange and the ability of our independent directors to influence our business policies and affairs may be reduced.
Failure to maintain effective internal control over financial reporting could have an adverse effect on our business, operating results and the trading price of our securities.
As a public company we are required to document and test our internal control procedures to satisfy the requirements of Section 404 of the Sarbanes-Oxley Act and the related rules of the SEC, which require, among other things, our management to assess annually the effectiveness of our internal control over financial reporting and our independent registered public accounting firm to issue a report on our internal control over financial reporting. If our management is unable to certify the effectiveness of our internal controls or if our independent registered public accounting firm cannot render an opinion on management’s assessment and on the effectiveness of our internal control over financial reporting, or if material weaknesses in our internal controls are identified, it could lead to material misstatements in our financial statements, we may be unable to meet our disclosure obligations and investors could lose confidence in our reported financial information. Failure to comply
27
with Section 404 of the Sarbanes-Oxley Act could potentially subject us to sanctions or investigations by the SEC, the Financial Industry Regulatory Authority or other regulatory authorities.
Provisions in our charter and bylaws and provisions of Delaware law may delay or prevent our acquisition by a third party, which might diminish the value of our Class A Common Stock. Provisions in our debt agreements may also require an acquirer to refinance our outstanding indebtedness if a change of control occurs.
Our amended and restated certificate of incorporation and our bylaws contain certain provisions that may discourage, delay or prevent a change in our management or control over us that stockholders may consider favorable, including the following:
• | the division of our board of directors into three classes and the election of each class for three-year terms; |
• | the sole ability of the board of directors to fill a vacancy created by the expansion of the board of directors; |
• | advance notice requirements for stockholder proposals and director nominations; |
• | limitations on the ability of stockholders to call special meetings and to take action by written consent; |
• | in certain cases, the approval of holders of at least three-fourths of the shares entitled to vote generally on the making, alteration, amendment or repeal of our certificate of incorporation or bylaws will be required to adopt, amend or repeal our bylaws, or amend or repeal certain provisions of our certificate of incorporation; |
• | the required approval of holders of at least three-fourths of the shares entitled to vote at an election of the directors to remove directors, which removal may only be for cause; and |
• | the ability of our board of directors to designate the terms of and issue new series of preferred stock without stockholder approval, which could be used, among other things, to institute a rights plan that would have the effect of significantly diluting the stock ownership of a potential hostile acquirer, likely preventing acquisitions that have not been approved by our board of directors. |
Section 203 of the Delaware General Corporation Law may affect the ability of an “interested stockholder” to engage in certain business combinations for a period of three years following the time that the stockholder becomes an “interested stockholder.” We have elected in our amended and restated certificate of incorporation not to be subject to Section 203 of the Delaware General Corporation Law. Nevertheless, our amended and restated certificate of incorporation contains provisions that have the same effect as Section 203 of the Delaware General Corporation Law.
The existence of the foregoing provisions and anti-takeover measures could limit the price that investors might be willing to pay in the future for shares of our common stock. They could also deter potential acquirers of our company, thereby reducing the likelihood that you could receive a premium for your common stock in an acquisition.
Under our Revolving Credit Facility, a change of control would be an event of default, which would therefore require a third-party acquirer to obtain a facility to refinance any outstanding indebtedness under the Revolving Credit Facility. Under the indentures governing our Senior Notes, if a change of control were to occur, we would be required to make offers to repurchase the Senior Notes at prices equal to 101% of their respective principal amounts. These change of control provisions in our existing debt agreements may also delay or diminish the value of an acquisition by a third party.
Any of the above risks could have a material adverse effect on your investment in our Class A Common Stock and Senior Notes.
We indirectly own an interest in a controlled foreign corporation.
We own more than a 50% interest, measured by both vote and value, indirectly through New TMM and TMM Holdings, in a Canadian corporation. As a result, we expect that the Canadian corporation will be classified as a controlled foreign corporation (a “CFC”) for U.S. federal income tax purposes, and that we will be a “U.S. shareholder” of the Canadian corporation. Under U.S. federal income tax rules applicable to CFCs and their shareholders, in certain circumstances a U.S. shareholder of a CFC is required to include currently in its income its proportionate share of certain categories of the CFC’s current earnings and profits, regardless of whether any amounts are actually distributed by the CFC. As a result, there could be adverse tax consequences to us because the Canadian corporation is classified as a CFC.
28
ITEM 1B. UNRESOLVED STAFF COMMENTS
None.
ITEM 2. PROPERTIES
We lease office facilities for our homebuilding and mortgage operations. We lease our corporate headquarters, which is located in Scottsdale, Arizona. The lease on this facility covers a space of approximately 27,000 square feet and expires in April 2023. We have approximately 35 other leases for our other division offices and design centers. For information on land owned and controlled by us for use in our homebuilding activities, please refer to Item 1 — Business — Business Strategy — Land and Development Strategies.
ITEM 3. LEGAL PROCEEDINGS
We are involved in various litigation and legal claims in the normal course of our business operations, including actions brought on behalf of various classes of claimants. We are also subject to a variety of local, state, and federal laws and regulations related to land development activities, house construction standards, sales practices, mortgage lending operations, employment practices, and protection of the environment. As a result, we are subject to periodic examination or inquiry by various governmental agencies that administer these laws and regulations. We establish liabilities for legal claims and regulatory matters when such matters are both probable of occurring and any potential loss is reasonably estimable. We accrue for such matters based on the facts and circumstances specific to each matter and revise these estimates as the matters evolve. In such cases, there may exist an exposure to loss in excess of any amounts currently accrued. In view of the inherent difficulty of predicting the outcome of these legal and regulatory matters, we generally cannot predict the ultimate resolution of the pending matters, the related timing, or the eventual loss. While the outcome of such contingencies cannot be predicted with certainty, we do not believe that the resolution of such matters will have a material adverse impact on our results of operations, financial position, or cash flows. However, to the extent the liability arising from the ultimate resolution of any matter exceeds the estimates reflected in the recorded reserves relating to such matter, we could incur additional charges that could be significant.
ITEM 4. MINE SAFETY DISCLOSURES
Not applicable.
29
PART II
ITEM 5. MARKET FOR REGISTRANT’S COMMON EQUITY, RELATED STOCKHOLDER MATTERS AND ISSUER PURCHASES OF EQUITY SECURITIES
Market Information
The Company lists its Class A Common Stock on the New York Stock Exchange (NYSE) under the symbol “TMHC”. On February 21, 2018, the Company had one holder of record of our Class A Common Stock. This does not include the number of stockholders who hold shares in TMHC through banks, brokers, and other financial institutions. The following table sets forth for the quarters indicated the range of high and low closing sales prices for the Company’s Class A Common Stock:
Year Ended December 31, 2017 | |||||||||||||||
1st Quarter | 2nd Quarter | 3rd Quarter | 4th Quarter | ||||||||||||
High | $ | 22.05 | $ | 24.40 | $ | 24.57 | $ | 24.50 | |||||||
Low | 18.65 | 21.00 | 19.83 | 22.21 | |||||||||||
Year Ended December 31, 2016 | |||||||||||||||
1st Quarter | 2nd Quarter | 3rd Quarter | 4th Quarter | ||||||||||||
High | $ | 15.73 | $ | 16.04 | $ | 18.05 | $ | 20.98 | |||||||
Low | 11.30 | 13.54 | 14.65 | 16.57 | |||||||||||
The Company’s Class B Common Stock is not listed on a securities exchange. On February 21, 2018 the Company had 25 holders of our Class B Common Stock. For details on the Class B Common Stock see Note 14 — Stockholders’ Equity in the Notes to our Consolidated Financial Statements included in Item 8 of this Annual Report. See Note 23 - Subsequent Events for changes to ownership subsequent to December 31, 2017.
Stock Performance Graph
The following shall not be deemed “filed” for purposes of Section 18 of the Exchange Act, or incorporated by reference into any of our other filings under the Exchange Act or the Securities Act, except to the extent we specifically incorporate it by reference into such filing.
This chart compares the cumulative total return on our Class A Common Stock with that of the Standard & Poor’s 500 Composite Stock Index (the “S&P 500”) and the Standard & Poor’s Homebuilding Index (the “S&P Homebuilding Index”). The chart assumes $100.00 was invested at the close of market on April 10, 2013 (the date our Class A Common Stock began trading on the NYSE), in the Class A Common Stock of Taylor Morrison Home Corporation, the S&P 500 Index and the S&P Homebuilding Index, and assumes the reinvestment of any dividends. The stock price performance on the following graph is not necessarily indicative of future stock price performance.
30
Comparison of Cumulative Total Return Among TMHC, the S&P 500 and the S&P Homebuilding Index from April 10, 2013 to December 31, 2017
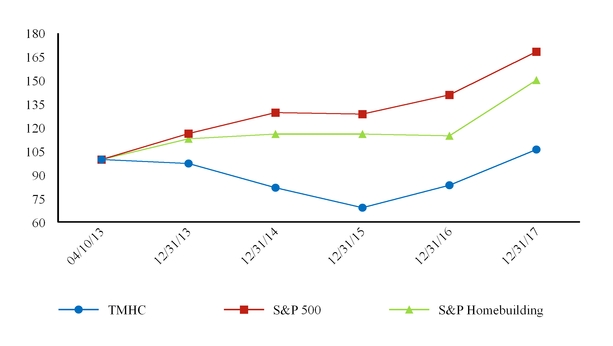
4/10/2013 | 12/31/2013 | 12/31/2014 | 12/31/2015 | 12/31/2016 | 12/31/2017 | ||||||||||||||||||
TMHC | $ | 100.00 | $ | 97.44 | $ | 81.99 | $ | 69.44 | $ | 83.59 | $ | 106.21 | |||||||||||
S&P 500 | 100.00 | 116.42 | 129.68 | 128.73 | 141.01 | 168.39 | |||||||||||||||||
S&P Homebuilding Index | 100.00 | 113.15 | 116.13 | 116.06 | 114.94 | 150.29 | |||||||||||||||||
Dividends
We currently anticipate that we will retain all available funds for use in the operation and expansion of our business, and do not anticipate paying any cash dividends in the foreseeable future or making distributions from New TMM to its limited partners (other than to TMHC to fund its operations). See Item 7 — Management’s Discussion and Analysis of Financial Condition and Results of Operations. TMHC has not previously declared or paid any cash dividends on its common stock.
Any future determination to declare and pay dividends will be made at the discretion of the Board of Directors of TMHC and will depend upon many factors, including statutory requirements, the covenants governing our Revolving Credit Facility and certain of our Senior Notes that limit our ability to pay dividends to stockholders and other factors the Board of Directors of TMHC deems relevant. For further information, see Item 7 — Management’s Discussion and Analysis of Financial Condition and Results of Operations — Liquidity and Capital Resources — Debt Instruments.
Issuer Purchases of Equity Securities
Our Board of Directors has authorized the repurchase of up to $100.0 million of the Company’s Class A Common Stock through December 31, 2018 in open market purchases, privately negotiated transactions or other transactions. The stock repurchase program is subject to prevailing market conditions and other considerations, including our liquidity, the terms of our debt instruments, statutory requirements, planned land investment and development spending, acquisition and other investment opportunities and ongoing capital requirements. During the three months ended December 31, 2017, there were no shares of Class A Common Stock repurchased by us or on our behalf.
ITEM 6. SELECTED FINANCIAL DATA
31
The following tables set forth selected consolidated financial and operating data at and for each of the five fiscal years ending December 31, 2017. It should be read in conjunction with the Consolidated Financial Statements and Notes thereto, included in Item 8 of this Annual Report and Management’s Discussion and Analysis of Financial Condition and Results of Operations included in Item 7 of this Annual Report.
Year Ended December 31, | |||||||||||||||||||
(Dollars in thousands, except per share amounts) | 2017 | 2016 | 2015 | 2014 | 2013 | ||||||||||||||
Statements of Operations Data: | |||||||||||||||||||
Total revenues | $ | 3,885,290 | $ | 3,550,029 | $ | 2,976,820 | $ | 2,708,432 | $ | 1,916,081 | |||||||||
Gross margin | 738,929 | 680,279 | 567,915 | 566,246 | 415,865 | ||||||||||||||
Income tax provision / (benefit) (1) | 179,006 | 107,643 | 90,001 | 76,395 | (23,810 | ) | |||||||||||||
Net income from continuing operations | 176,650 | 206,563 | 170,986 | 225,599 | 28,355 | ||||||||||||||
Income from discontinued operations – net of tax | — | — | 58,059 | 41,902 | 66,513 | ||||||||||||||
Net income before allocation to non-controlling interests | 176,650 | 206,563 | 229,045 | 267,501 | 94,868 | ||||||||||||||
Net (income) / loss attributable to non-controlling interests – joint ventures | (430 | ) | (1,294 | ) | (1,681 | ) | (1,648 | ) | 131 | ||||||||||
Net income before non-controlling interests – Principal Equityholders | 176,220 | 205,269 | 227,364 | 265,853 | 94,999 | ||||||||||||||
Net (income) / loss from continuing operations attributable to non-controlling interests – Principal Equityholders | (85,000 | ) | (152,653 | ) | (123,909 | ) | (163,790 | ) | 1,442 | ||||||||||
Net income from discontinued operations attributable to non-controlling interests – Principal Equityholders (2) | — | — | (42,406 | ) | (30,594 | ) | (51,021 | ) | |||||||||||
Net income available to Taylor Morrison Home Corporation | $ | 91,220 | $ | 52,616 | $ | 61,049 | $ | 71,469 | $ | 45,420 | |||||||||
Earnings per common share: | |||||||||||||||||||
Basic | |||||||||||||||||||
Income from continuing operations | $ | 1.47 | $ | 1.69 | $ | 1.38 | $ | 1.83 | $ | 0.91 | |||||||||
Discontinued operations – net of tax (2) | — | — | 0.47 | 0.34 | 0.47 | ||||||||||||||
Net income available to Taylor Morrison Home Corporation (1) | $ | 1.47 | $ | 1.69 | $ | 1.85 | $ | 2.17 | $ | 1.38 | |||||||||
Diluted | |||||||||||||||||||
Income from continuing operations | $ | 1.47 | $ | 1.69 | $ | 1.38 | $ | 1.83 | $ | 0.91 | |||||||||
Discontinued operations – net of tax (2) | — | — | 0.47 | 0.34 | 0.47 | ||||||||||||||
Net income available to Taylor Morrison Home Corporation (1) | $ | 1.47 | $ | 1.69 | $ | 1.85 | $ | 2.17 | $ | 1.38 | |||||||||
Weighted average number of shares of common stock: | |||||||||||||||||||
Basic | 62,061 | 31,084 | 33,063 | 32,937 | 32,840 | ||||||||||||||
Diluted | 120,915 | 120,832 | 122,384 | 122,313 | 122,319 | ||||||||||||||
(1) 2017 income tax provision and earnings per common share data include impacts of the Tax Act which is an aggregate of $61.0 million expense.
(2) See Note 5 to Notes to the Consolidated Financial Statements for information regarding our disposition of Monarch and our treatment of that segment as discontinued operations.
32
As of December 31, | |||||||||||||||||||
(Dollars in thousands) | 2017 | 2016 | 2015 | 2014 | 2013 | ||||||||||||||
Balance Sheet Data: | |||||||||||||||||||
Cash and cash equivalents (1) | $ | 573,925 | $ | 300,179 | $ | 126,188 | $ | 234,217 | $ | 193,518 | |||||||||
Real estate inventory | 2,959,236 | 3,017,219 | 3,126,787 | 2,518,321 | 2,012,580 | ||||||||||||||
Total assets | 4,325,893 | 4,220,926 | 4,122,447 | 4,111,798 | 3,419,285 | ||||||||||||||
Total debt | 1,498,062 | 1,586,533 | 1,668,425 | 1,715,791 | 1,238,457 | ||||||||||||||
Total stockholders’ equity | 2,346,545 | 2,160,202 | 1,972,677 | 1,777,161 | 1,544,901 | ||||||||||||||
Year Ended December 31, | |||||||||||||||||||
(Dollars in thousands) | 2017 | 2016 | 2015 | 2014 | 2013 | ||||||||||||||
Operating Data: | |||||||||||||||||||
Average active selling communities | 297 | 309 | 259 | 206 | 158 | ||||||||||||||
Net sales orders (units) | 8,397 | 7,504 | 6,681 | 5,728 | 5,018 | ||||||||||||||
Home closings (units) | 8,032 | 7,369 | 6,311 | 5,642 | 4,716 | ||||||||||||||
Average sales price of homes closed | $ | 473 | $ | 465 | $ | 458 | $ | 464 | $ | 394 | |||||||||
Backlog value at end of period | $ | 1,702,071 | $ | 1,531,910 | $ | 1,392,973 | $ | 1,099,767 | $ | 987,754 | |||||||||
Backlog units at end of period | 3,496 | 3,131 | 2,932 | 2,252 | 2,166 | ||||||||||||||
(1) Excludes restricted cash.
ITEM 7. MANAGEMENT’S DISCUSSION AND ANALYSIS OF FINANCIAL CONDITION AND RESULTS OF OPERATIONS
General Overview
Our principal business is residential homebuilding and the development of lifestyle communities with operations geographically focused in Arizona, California, Colorado, Florida, Georgia, Illinois, North Carolina, and Texas. We serve a wide array of consumer groups from coast to coast, including first time, move-up, luxury, and active adult buyers, building single family attached and detached homes. Our homebuilding company operates under our Taylor Morrison and Darling Homes brand names. We also have operations which provide mortgage services to customers through our wholly owned mortgage subsidiary, Taylor Morrison Home Funding (“TMHF”), and title services through our wholly owned title services subsidiary, Inspired Title Services, LLC (“Inspired Title”). Our business is organized into multiple homebuilding operating components, and a mortgage operations component, all of which are managed as four reportable segments: East, Central, West and Mortgage Operations, as follows:
East | Atlanta, Charlotte, Chicago, Orlando, Raleigh, Southwest Florida, and Tampa | |
Central | Austin, Dallas, Denver, and Houston | |
West | Bay Area, Phoenix, Sacramento, and Southern California | |
Mortgage Operations | TMHF and Inspired Title | |
During the quarter ended March 31, 2017, we realigned our homebuilding operating divisions within our existing segments based on geographic location and management's long term strategic plans, however our reporting segments remained unchanged. As a result, all historical periods presented in the segment information have been reclassified to give effect to this segment realignment.
2017 Highlights and Recent Developments
Our financial and operational highlights for the year ended December 31, 2017 and recent developments subsequent to the year end are summarized below:
• | Since January 2017, we have completed seven public offerings for an aggregate of 80.2 million shares of our Class A Common Stock, using all of the net proceeds therefrom to repurchase our Principal Equityholders' indirect interest in TMHC. In January 2018, we also purchased an additional 7.6 million shares of our Class B Common Stock from our Principal Equityholders. As a result of the series of offerings and repurchases, the Principal Equityholders ownership decreased to 31.1% at December 31, 2017 and to zero by January 31, 2018. |
33
• | We generated $3.9 billion in total revenue and $3.8 billion in home closings revenue for the year ended December 31, 2017, an increase of 11% compared to the prior year's home closings revenue. |
• | Net income from continuing operations and diluted earnings per share for the year ended December 31, 2017 was $176.7 million and $1.47 compared to $206.6 million and $1.69 for the year ended December 31, 2016. |
• | Adjusting for the effects of the Tax Act, enacted on December 22, 2017, net income from continuing operations for the year ended December 31, 2017 was $237.6 million or 15.0% higher than the prior year. Similarly, diluted earnings per share adjusted for tax reform effects in 2017 was $1.98 compared to $1.69 for the year ended December 31, 2016. See Note 13 - Income taxes for discussion regarding Tax Act effects. |
• | As a result of the Tax Act, we have recorded a non-cash provisional income tax expense of $57.4 million to account for the revaluation of our existing deferred tax assets due to the lower tax rate and we have recorded an estimated $3.6 million charge which may be payable over eight years related to the mandatory deemed repatriation of foreign earnings related to the sale of our Canadian operations in 2015. |
• | On January 26, 2018 we amended the maturity date of our $500 million Revolving Credit Facility from April 2019 to January 2022 allowing incremental financial flexibility. |
• | As of December 31, 2017, our total liquidity was $1.0 billion, including $573.9 million in cash. |
• | As of December 31, 2017 our net homebuilding debt to capitalization ratio of 25.8%. |
Operational
• | During 2017, our operations were located in eight states with 297 average active communities. |
• | We sold and closed nearly 12.0% and 9.0%, respectively, more homes during 2017 compared to 2016. |
• | Sales pace for the year ended December 31, 2017 was 2.4 compared to 2.0 for the year ended December 31, 2016. |
• | Average sales price of homes closed was $473,000 for the year ended December 31, 2017. |
• | We ended 2017 with $1.7 billion in sales order backlog. |
• | At December 31, 2017, we owned and controlled approximately 38,000 lots. |
• | For the last three consecutive years, we were awarded America’s Most Trusted Home Builder® by Lifestory Research. |
• | We were recognized and awarded as one of the Best Places to Work by Glassdoor. |
Industry Overview and Business Strategy
We believe the housing market is on a positive trajectory of recovery, driven by certain positive economic and demographic factors, including decreasing unemployment, strong home values, improving household balance sheets, declines in new and existing for-sale home inventory and low interest rates. While we were encouraged by certain positive and improved trends during 2017, several challenges still exist, such as lingering under employment concerns, stagnation in real wages and real or perceived personal wealth, national and global economic uncertainty and uncertainty around the interest rate environment. We are additionally challenged by shortages in the labor supply, specifically as it relates to qualified tradespeople, and volatility in energy prices. Nevertheless, we believe we are in an upward business cycle.
Our approach in allocating capital and managing our land portfolio has been to acquire assets that have attractive characteristics, including good access to schools, shopping, recreation and transportation facilities. In connection with our overall land inventory management process, our management team reviews these considerations, as well as other financial metrics, in order to decide the highest and best use of our capital.
We intend to maintain a consistent approach to land positioning within our regions, markets and communities in the foreseeable future in an effort to concentrate a greater amount of our land inventory in attractive areas. We also intend to continue to combine our land development expertise with our homebuilding operations to increase the flexibility of our business and to optimize our margin performance. From time to time, we may sell land in our communities if we believe it is best for our overall operations. We do not expect such sales to have a significant effect on our overall results, but they may impact our overall gross margins.
Factors Affecting Comparability of Results
The Management’s Discussion and Analysis of our Financial Condition and Results of Operations should be read in conjunction with our historical consolidated financial statements included elsewhere in this Annual Report. The primary factors that affect the comparability of our results of operations are the impacts of the Tax Act, our acquisitions, and disposal activities.
34
During 2017, tax legislation was enacted which made comprehensive reforms to the United States tax code, including a decrease to the corporate statutory tax rate from 35% to 21%, and a mandatory deemed repatriation tax of foreign earnings at a reduced rate, that may be payable over eight years. Our effective tax rate for the year ending December 31, 2017 includes one-time tax expense charges to account for the lower tax rate impact to our existing deferred tax assets and the mandatory deemed repatriation of foreign earnings related to the sale of our Canadian operations in 2015. In 2018, we expect to have a lower annual effective tax rate due to the reduction in the corporate statutory tax rate.
Disposal activities consist of the disposal of Monarch Corporation, our former Canadian business (“Monarch”), and gain on foreign currency hedge in January 2015, loss on extinguishment of debt and the acquisition of JEH Homes ("JEH") in the second quarter of 2015, the acquisition of three divisions of Orleans Homes ("Orleans") in the third quarter of 2015, and the acquisition of Acadia Homes ("Acadia") in January 2016. For all periods presented, the operating results of Monarch are included in discontinued operations and historical periods have been recast to show the effects of our segment realignment, which was effective December 31, 2015. In addition to the impact of the matters discussed in the Risk Factors listed in Item 1A of this Annual Report, our future results could differ materially from our historical results due to these changes.
Non-GAAP Measures
In addition to the results reported in accordance with accounting principles generally accepted in the United States (“GAAP”), we have provided information in this Annual Report relating to “as adjusted net income from continuing operations,” “as adjusted earnings per common share,” “as adjusted income tax provision,” “as adjusted effective tax rate,” and “net homebuilding debt to capitalization ratio.”
We calculate as adjusted net income from continuing operations from U.S. GAAP net income from continuing operations by adding the tax reform impact due to the revaluation of deferred assets and liabilities and mandatory deemed repatriation of foreign earnings. Such expenses only occurred for the year ended December 31, 2017 as a result of the Tax Act which was enacted on December 22, 2017. As adjusted earnings per common share utilizes the as adjusted net income from continuing operations measure within the numerator of the earnings per share calculation. As adjusted income tax provision and As adjusted effective tax rate reflect our income tax provision adjusted to exclude the impact of tax reform. We calculate net homebuilding debt to capitalization ratio by dividing (i) total debt, less unamortized debt issuance costs and mortgage warehouse borrowings, net of unrestricted cash and cash equivalents, by (ii) total capitalization (the sum of net homebuilding debt and total stockholders' equity). Management uses all of these non-GAAP measures to evaluate our operational and economic performance and to set targets for performance-based compensation on a consolidated basis to compare to prior years which did not include such significant tax reform. We also use the ratio of net homebuilding debt to capitalization as an indicator of overall leverage and to evaluate our performance against other companies in the homebuilding industry. We believe as adjusted net income from continuing operations, as adjusted earnings per common share, as adjusted income tax provision and as adjusted effective tax rate are relevant and useful to investors because they allow investors to evaluate the performance of our operations without the significant effect of the Tax Act. Because we use the ratio of net homebuilding debt to capitalization to evaluate our performance against other companies in the homebuilding industry, we believe this measure is also relevant and useful to investors for that reason. These measures are considered a non-GAAP financial measure and should be considered in addition to, rather than as a substitute for, the comparable U.S. GAAP financial measures as a measure of our operating performance.
Critical Accounting Policies
General
The discussion and analysis of our financial condition and results of operations is based upon our consolidated financial statements, which have been prepared in accordance with U.S. GAAP. The preparation of these financial statements requires management to make estimates and judgments that affect the reported amounts of assets and liabilities, revenue and expenses, and related disclosures of contingent assets and liabilities at the date of our financial statements. Actual results may differ from these estimates under different assumptions or conditions, impacting our reported results of operations and financial condition.
Certain accounting policies involve significant judgments and assumptions by management, which have a material impact on the carrying value of assets and liabilities and the recognition of income and expenses. The estimates and assumptions used by management are based on historical experience and other factors, which are believed to be reasonable under the circumstances. The significant accounting policies that management believes are the most critical to aid in fully understanding and evaluating our reported financial results are critical accounting policies and are described below.
Revenue Recognition
35
Home closings revenue is recorded using the completed-contract method of accounting at the time each home is delivered, title and possession are transferred to the buyer, we have no significant continuing involvement with the home, risk of loss has transferred, the buyer has demonstrated sufficient investment in the property, and the receivable, if any, from the homeowner or escrow agent is not subject to future subordination.
We typically grant our homebuyers certain sales incentives, including cash discounts, incentives on options included in the home, option upgrades, and seller-paid financing or closing costs. Incentives and discounts are accounted for as a reduction in the sales price of the home, and home closings revenue is shown net of discounts. We also receive rebates from certain vendors and these rebates are accounted for as a reduction to cost of home closings.
Land closings revenue is recognized when title is transferred to the buyer, we have no significant continuing involvement, the buyer has demonstrated sufficient investment in the property sold and the receivable, if any, from the buyer is not subject to future subordination. If the buyer has not made an adequate investment in the property, the profit on such sale is deferred until these conditions are met.
Mortgage Operations Revenue
Loan origination fees (including title fees, points, and closing costs) are recognized at the time the related real estate transactions are completed, usually upon the close of escrow. All of the loans TMHF originates are sold to third party investors within a short period of time (typically within 15-20 business days) on a non-recourse basis. Gains and losses from the sale of mortgages are recognized in accordance with ASC Topic 860-20, “Sales of Financial Assets.” Because TMHF does not have continuing involvement with the transferred assets, we derecognize the mortgage loans at time of sale, based on the difference between the selling price and carrying value of the related loans upon sale, recording a gain/loss on sale in the period of sale. Also, we enter into IRLCs to originate residential mortgage loans held for sale, at specified interest rates and within a specified period of time. These instruments meet the definition of a derivative and the realized and unrealized gain and loss from the IRLCs are included in mortgage operations revenue/expenses.
Real Estate Inventory Valuation and Costing
Inventory consists of raw land, land under development, homes under construction, completed homes, and model homes, which are stated at cost. In addition to direct carrying costs, we also capitalize interest, real estate taxes, and related development costs that benefit the entire community, such as field construction supervision and related direct overhead. Home construction costs are accumulated and charged to cost of sales at home closing using the specific identification method. Land acquisition, development, interest, real estate taxes and overhead are allocated to homes and units using the relative sales value method. These costs are capitalized to inventory from the point development begins to the point construction is completed. Changes in estimated costs to be incurred in a community are generally allocated to the remaining homes on a prospective basis. For those communities that have been temporarily closed or development has been discontinued, we do not allocate interest or other costs to the community’s inventory until activity resumes.
The life cycle of the community generally ranges from two to five years, commencing with the acquisition of unentitled or entitled land, continuing through the land development phase and concluding with the sale, construction and delivery of homes. Actual community lives will vary based on the size of the community, the sales absorption rate and whether we purchased the property as raw land or as finished lots.
We capitalize qualifying interest costs to inventory during the development and construction periods. Capitalized interest is charged to cost of sales when the related inventory is delivered or when the related inventory is charged to cost of sales.
We assess the recoverability of our land inventory in accordance with the provisions of Accounting Standards Codification (“ASC”) Topic 360, “Property, Plant, and Equipment.” We review our real estate inventory for indicators of impairment by community during each reporting period. If indicators of impairment are present for a community, we first perform an undiscounted cash flow analysis to determine if the carrying value of the assets in that community exceeds the undiscounted cash flows. Generally, if the carrying value of the assets exceeds their estimated undiscounted cash flows, then the assets are deemed to be impaired and are recorded at fair value as of the assessment date. Our determination of fair value is based on a discounted cash flow model which includes projections and estimates relating to sales prices, construction costs, sales pace, and other factors. Changes in these expectations may lead to a change in the outcome of our impairment analysis, and actual results may also differ from our assumptions.
Insurance Costs, Self-Insurance Reserves and Warranty Reserves
36
We have certain deductible amounts under our workers’ compensation, automobile and general liability insurance policies, and we record expense and liabilities for the estimated costs of potential claims for construction defects. We also generally require our sub-contractors and design professionals to indemnify us and provide evidence of insurance for liabilities arising from their work, subject to certain limitations. Beneva Indemnity Company (“Beneva”), one of our wholly owned subsidiaries, provides insurance coverage for construction defects discovered up to ten years following the closing of a home, premises operations risk and property coverage. We accrue for the expected costs associated with the deductibles and self-insured amounts under our various insurance policies based on historical claims, estimates for claims incurred but not reported, and potential for recovery of costs from insurance and other sources. The estimates are subject to significant variability due to various factors, such as claim settlement patterns, litigation trends and the length of time in which a construction defect claim might be made after the closing of a home.
We offer a limited warranty to cover various defects in workmanship or materials, including structural defects. We may also facilitate a longer warranty in certain markets or to comply with regulatory requirements. Warranty reserves are recorded as each home closes in an amount estimated to be adequate to cover expected future costs of materials and outside labor during warranty periods. Our warranty is not considered a separate deliverable in each sale arrangement, so it is accounted for in accordance with ASC Topic 450, “Contingencies.” In accordance with ASC 450, warranties that are not separately priced are generally accounted for by accruing the estimated costs to fulfill the warranty obligation. Thus, the warranty would not be considered a separate deliverable in the arrangement since it is not priced apart from the home. As a result, we accrue the estimated costs to fulfill the warranty obligation in accordance with ASC 450 at the time a home closes, as a component of cost of home closings.
Our reserves are based on factors that include an actuarial study for historical and anticipated claims, trends related to similar product types, number of home closings, and geographical areas. We also provide third-party warranty coverage on homes where required by Federal Housing Administration or Veterans Administration lenders. We regularly review the reasonableness and adequacy of our reserves and make adjustments to the balance of the preexisting reserves to reflect changes in trends and historical data as information becomes available. Self-insurance and warranty reserves are included in accrued expenses and other liabilities in the accompanying Consolidated Balance Sheets.
Investments in Unconsolidated Entities and Variable Interest Entities (VIEs)
We are involved in joint ventures with related and unrelated third parties for homebuilding and development activities. We use the equity method of accounting for entities over which we exercise significant influence but do not have a controlling interest over the operating and financial policies of the investee. For unconsolidated entities in which we function as the managing member, we have evaluated the rights held by our joint venture partners and determined that they have substantive participating rights that preclude the presumption of control. For joint ventures accounted for using the equity method, our share of net earnings or losses is included in equity in income of unconsolidated entities when earned and distributions are credited against its investment in the joint venture when received. These joint ventures are recorded in investments in unconsolidated entities on the Consolidated Balance Sheets.
In the ordinary course of business, we enter into land and lot option purchase contracts in order to procure land or lots for the construction of homes. Lot option contracts enable us to control significant lot positions with a minimal initial capital investment and substantially reduce the risks associated with land ownership and development. In accordance with ASC Topic 810, “Consolidation,” we have concluded that when we enter into an option or purchase agreement to acquire land or lots and pay a non-refundable deposit, a VIE may be created because we are deemed to have provided subordinated financial support that will absorb some or all of an entity’s expected losses if they occur. If we are the primary beneficiary of the VIE, we will consolidate the VIE in our Consolidated Financial Statements and reflect such assets and liabilities as real estate not owned under option agreements within our inventory balance in the accompanying Consolidated Balance Sheets.
Stock Based Compensation
We have issued stock options, performance based restricted stock units and non-performance based restricted stock units, which we account for in accordance with ASC Topic 718-10, “Compensation — Stock Compensation.” The fair value for stock options is measured and estimated on the date of grant using the Black-Scholes option pricing model and recognized evenly over the vesting period of the options. Performance-based restricted stock units are measured using the closing price on the date of grant and expensed using a probability of attainment calculation which determines the likelihood of achieving the performance targets. Non-performance-based restricted stock units are time based awards and measured using the closing price on the date of grant and are expensed over the vesting period on a straight-line basis.
37
Valuation of Deferred Tax Assets
We account for income taxes using the asset and liability method, which requires that deferred tax assets and liabilities be recognized based on future tax consequences of both temporary differences between the financial statement carrying amounts of existing assets and liabilities and their respective tax bases. Deferred tax assets and liabilities are measured using enacted tax rates expected to apply in the years in which the temporary differences are expected to be recovered or settled. The effect on deferred tax assets and liabilities of a change in tax rates is recognized in earnings in the period when the changes are enacted. As a result of the Tax Act enacted on December 22, 2017, we have recorded a material charge to earnings in the period ending December 31, 2017. See Note 13 - Income Taxes to the Consolidated Financial Statements for additional details.
In accordance with ASC Topic 740-10, “Income Taxes,” we evaluate our deferred tax assets by tax jurisdiction, including the benefit from net operating loss (“NOL”) carryforwards by tax jurisdiction, to determine if a valuation allowance is required. Companies must assess, using significant judgments, whether a valuation allowance should be established based on the consideration of all available evidence using a “more likely than not” standard with significant weight being given to evidence that can be objectively verified. This assessment considers, among other matters, the nature, frequency and severity of current and cumulative losses, forecasts of future profitability, the length of statutory carryforward periods, experience with operating losses and experience of utilizing tax credit carryforwards and tax planning alternatives.
38
Results of Operations
The following table sets forth our results of operations for the periods presented:
Year Ended December 31, | |||||||||||
(Dollars in thousands) | 2017 | 2016 | 2015 | ||||||||
Statements of Operations Data: | |||||||||||
Home closings revenue, net | $ | 3,799,061 | $ | 3,425,521 | $ | 2,889,968 | |||||
Land closings revenue | 17,093 | 64,553 | 43,770 | ||||||||
Mortgage operations revenue | 69,136 | 59,955 | 43,082 | ||||||||
Total revenues | $ | 3,885,290 | $ | 3,550,029 | $ | 2,976,820 | |||||
Cost of home closings | 3,092,704 | 2,801,739 | 2,358,823 | ||||||||
Cost of land closings | 12,005 | 35,912 | 24,546 | ||||||||
Mortgage operations expenses | 41,652 | 32,099 | 25,536 | ||||||||
Total cost of revenues | $ | 3,146,361 | $ | 2,869,750 | $ | 2,408,905 | |||||
Gross margin | 738,929 | 680,279 | 567,915 | ||||||||
Sales, commissions and other marketing costs | 259,663 | 239,556 | 198,676 | ||||||||
General and administrative expenses | 130,777 | 122,207 | 95,235 | ||||||||
Equity in income of unconsolidated entities | (8,846 | ) | (7,453 | ) | (1,759 | ) | |||||
Interest income, net | (577 | ) | (184 | ) | (192 | ) | |||||
Other expense, net | 2,256 | 11,947 | 11,634 | ||||||||
Loss on extinguishment of debt | — | — | 33,317 | ||||||||
Gain on foreign currency forward | — | — | (29,983 | ) | |||||||
Income from continuing operations before income taxes | $ | 355,656 | $ | 314,206 | $ | 260,987 | |||||
Income tax provision (1) | 179,006 | 107,643 | 90,001 | ||||||||
Net income from continuing operations | $ | 176,650 | $ | 206,563 | $ | 170,986 | |||||
Net income from discontinued operations | — | — | 58,059 | ||||||||
Net income before allocation to non-controlling interests | $ | 176,650 | $ | 206,563 | $ | 229,045 | |||||
Net income attributable to non-controlling interests – joint ventures | (430 | ) | (1,294 | ) | (1,681 | ) | |||||
Net income before non-controlling interests – Principal Equityholders | $ | 176,220 | $ | 205,269 | $ | 227,364 | |||||
Net income from continuing operations attributable to non-controlling interests – Principal Equityholders | (85,000 | ) | (152,653 | ) | (123,909 | ) | |||||
Net income from discontinued operations attributable to non-controlling interests – Principal Equityholders | — | — | (42,406 | ) | |||||||
Net income available to Taylor Morrison Home Corporation | $ | 91,220 | $ | 52,616 | $ | 61,049 | |||||
Home closings gross margin | 18.6 | % | 18.2 | % | 18.4 | % | |||||
Interest amortized to cost of home closings | $ | 94,859 | $ | 90,851 | $ | 83,163 | |||||
Average sales price per home closed | $ | 473 | $ | 465 | $ | 458 | |||||
Sales, commissions and other marketing costs as a percentage of home closings revenue, net | 6.8 | % | 7.0 | % | 6.9 | % | |||||
General and administrative expenses as a percentage of home closings revenue, net | 3.4 | % | 3.6 | % | 3.3 | % | |||||
Effective tax rate (1) | 50.3 | % | 34.3 | % | 34.5 | % | |||||
Earnings per common share (1) - | |||||||||||
Income from continuing operations - Basic (1) | $ | 1.47 | $ | 1.69 | $ | 1.38 | |||||
Income from continuing operations - Diluted (1) | $ | 1.47 | $ | 1.69 | $ | 1.38 | |||||
(1) 2017 income tax provision, effective tax rate and earnings per common share data include impacts of the Tax Act, which was an aggregate $61.0 million expense.
39
Non-GAAP Measures
The following table sets forth our results of operations as adjusted for the tax reform impact for the periods presented (See - “Non-GAAP Measures” above):
Year Ended December 31, | |||||||||||
2017 | 2016 | 2015 | |||||||||
Net income from continuing operations | $ | 176,650 | $ | 206,563 | $ | 170,986 | |||||
Tax reform impact due to the revaluation of deferred assets and liabilities | 57,425 | — | — | ||||||||
Tax reform impact due to the mandatory deemed repatriation of foreign earnings | 3,553 | — | — | ||||||||
As adjusted net income from continuing operations | $ | 237,628 | $ | 206,563 | $ | 170,986 | |||||
As adjusted earnings per common share - | |||||||||||
Income from continuing operations - Basic | $ | 1.98 | $ | 1.69 | $ | 1.38 | |||||
Income from continuing operations - Diluted | $ | 1.98 | $ | 1.69 | $ | 1.38 | |||||
The following table sets forth our effective tax rate as adjusted for the tax reform impact for the periods presented (See - “Non-GAAP Measures” above):
Year Ended December 31, | |||||||||||
(Dollars in thousands) | 2017 | 2016 | 2015 | ||||||||
Income tax provision | $ | 179,006 | $ | 107,643 | $ | 90,001 | |||||
Tax reform impact due to the revaluation of deferred assets and liabilities | (57,425 | ) | — | — | |||||||
Tax reform impact due to the mandatory deemed repatriation of foreign earnings | (3,553 | ) | — | — | |||||||
As adjusted income tax provision | $ | 118,028 | $ | 107,643 | $ | 90,001 | |||||
As adjusted effective tax rate | 33.2 | % | 34.3 | % | 34.5 | % | |||||
The following table sets forth a reconciliation of our net homebuilding debt to capitalization ratio (See - “Non-GAAP Measures” above):
(Dollars in thousands) | As of December 31, 2017 | ||
Total debt | $ | 1,498,062 | |
Unamortized debt issuance costs | 10,213 | ||
Less mortgage warehouse borrowings | 118,822 | ||
Total homebuilding debt | $ | 1,389,453 | |
Less cash and cash equivalents | 573,925 | ||
Net homebuilding debt | $ | 815,528 | |
Total equity | 2,346,545 | ||
Total capitalization | $ | 3,162,073 | |
Net homebuilding debt to capitalization ratio | 25.8 | % | |
40
Year Ended December 31, 2017 Compared to Year Ended December 31, 2016
Average Active Selling Communities
Year Ended December 31, | ||||||||
2017 | 2016 | Change | ||||||
East | 130 | 129 | 0.8 | % | ||||
Central | 117 | 117 | — | |||||
West | 50 | 63 | (20.6 | ) | ||||
Total | 297 | 309 | (3.9 | )% | ||||
Average active selling communities for the year ended December 31, 2017 decreased by 3.9% when compared to the same period in the prior year, primarily driven by the West region which experienced higher sales orders in the first half of 2017 resulting in an increase in the number of community close outs. The slight decrease in average active communities aligns with our focus for growth to be primarily driven by improving sales volume rather than only increasing average active communities.
Net Sales Orders
Year Ended December 31, (1) | ||||||||||||||||||||||||||||||
(Dollars in thousands ) | Net Homes Sold | Sales Value | Average Selling Price | |||||||||||||||||||||||||||
2017 | 2016 | Change | 2017 | 2016 | Change | 2017 | 2016 | Change | ||||||||||||||||||||||
East | 3,766 | 3,158 | 19.3 | % | $ | 1,470,063 | $ | 1,223,046 | 20.2 | % | $ | 390 | $ | 387 | 0.8 | % | ||||||||||||||
Central | 2,391 | 2,075 | 15.2 | 1,124,273 | 977,440 | 15.0 | 470 | 471 | (0.2 | ) | ||||||||||||||||||||
West | 2,240 | 2,271 | (1.4 | ) | 1,335,015 | 1,281,266 | 4.2 | 596 | 564 | 5.7 | ||||||||||||||||||||
Total | 8,397 | 7,504 | 11.9 | % | $ | 3,929,351 | $ | 3,481,752 | 12.9 | % | $ | 468 | $ | 464 | 0.9 | % | ||||||||||||||
(1) Net sales orders represent the number and dollar value of new sales contracts executed with customers, net of cancellations.
East:
The number of net homes sold and sales value of homes increased by 19.3% and 20.2%, respectively, in 2017 as compared to 2016. Product and geographic mix among all divisions within the region contributed to the overall increase in in net homes sold and sales value. Certain divisions experienced an increase in sales price along with an increase in net homes sold, while others maintained their sales price and increased the number of net homes sold.
Central:
The number of net homes sold and sales value of homes increased by 15.2% and 15.0%, respectively, in 2017 as compared to 2016. A significant portion of the increase in units and sales value is driven by our Houston market which has shown improvements from the past two years' soft economic environment, despite the impacts of Hurricane Harvey which occurred during the third quarter of 2017. Other markets within this region continue to strengthen their performance and contributed to the overall increase in units and dollars for the segment as well.
West:
The average selling price increased by 5.7% for the year ended December 31, 2017 as compared to the year ended December 31, 2016. The markets in this region are showing continued strength as evidenced by a 24.3% increase in sales pace. With our increased focus on turn times and our limited product availability as a result of the increase in the number of community close outs, the number of net homes sold decreased slightly compared to the prior year. The value of the net sales orders increased by 4.2% for the year ended December 31, 2017 compared to the same period in the prior year.
41
Sales Order Cancellations
Year Ended December 31, | |||||
Cancellation Rate (1) | |||||
2017 | 2016 | ||||
East | 10.5 | % | 12.1 | % | |
Central | 12.9 | 15.5 | |||
West | 12.3 | 13.7 | |||
Total Company | 11.7 | % | 13.6 | % | |
(1) Cancellation rate represents the number of canceled sales orders divided by gross sales orders.
Favorable market conditions coupled with increased demand for new housing has led to lower cancellation rates across all of our regions for the year ended December 31, 2017. In addition, our use of prequalification criteria through TMHF and robust earnest money deposits helped us manage our cancellation rate across the Company compared to the prior year.
Sales Order Backlog
As of December 31, | ||||||||||||||||||||||||||||||
(Dollars in thousands) | Sold Homes in Backlog (1) | Sales Value | Average Selling Price | |||||||||||||||||||||||||||
2017 | 2016 | Change | 2017 | 2016 | Change | 2017 | 2016 | Change | ||||||||||||||||||||||
East | 1,513 | 1,220 | 24.0 | % | $ | 634,949 | $ | 524,406 | 21.1 | % | $ | 420 | $ | 430 | (2.3 | )% | ||||||||||||||
Central | 1,051 | 958 | 9.7 | 532,583 | 494,243 | 7.8 | 507 | 516 | (1.7 | ) | ||||||||||||||||||||
West | 932 | 953 | (2.2 | ) | 534,539 | 513,261 | 4.1 | 574 | 539 | 6.5 | ||||||||||||||||||||
Total | 3,496 | 3,131 | 11.7 | % | $ | 1,702,071 | $ | 1,531,910 | 11.1 | % | $ | 487 | $ | 489 | (0.4 | )% | ||||||||||||||
(1) Sales order backlog represents homes under contract for which revenue has not yet been recognized at the end of the period (including homes sold but not yet started). Some of the contracts in our sales order backlog are subject to contingencies including mortgage loan approval and buyers selling their existing homes, which can result in future cancellations.
Total backlog units and total sales value increased by 11.7% and 11.1% at December 31, 2017 compared to December 31, 2016, respectively. The increase in backlog units and total sales value is primarily a result of the combination of increased sales orders and lower cancellation rates.
Home Closings Revenue
Year Ended December 31, | ||||||||||||||||||||||||||||||
(Dollars in thousands) | Homes Closed | Home Closings Revenue, Net | Average Selling Price | |||||||||||||||||||||||||||
2017 | 2016 | Change | 2017 | 2016 | Change | 2017 | 2016 | Change | ||||||||||||||||||||||
East | 3,473 | 2,902 | 19.7 | % | $ | 1,377,566 | $ | 1,119,334 | 23.1 | % | $ | 397 | $ | 386 | 2.8 | % | ||||||||||||||
Central | 2,298 | 2,286 | 0.5 | 1,102,189 | 1,099,780 | 0.2 | 480 | 481 | (0.2 | ) | ||||||||||||||||||||
West | 2,261 | 2,181 | 3.7 | 1,319,306 | 1,206,407 | 9.4 | 584 | 553 | 5.6 | |||||||||||||||||||||
Total | 8,032 | 7,369 | 9.0 | % | $ | 3,799,061 | $ | 3,425,521 | 10.9 | % | $ | 473 | $ | 465 | 1.7 | % | ||||||||||||||
East:
The number of homes closed and home closings revenue, net increased by 19.7% and 23.1%, respectively, for 2017 as compared to 2016. All markets within this region contributed to the increase in both units and dollars as a result of higher net sales in the first half of the year as compared to the same period in the prior year. Certain economic market improvements, as well as favorable homebuyer reception of our products and our communities, contributed to the increase in net home closings revenue.
Central:
The number of homes closed and home closings revenue, net remained relatively flat for the 2017 year as compared to the 2016 year primarily as a result of Hurricane Harvey, which affected the Houston market during the third quarter of 2017. As a result of the hurricane, some closings were pushed to future periods. Houston along with the other markets within the region
42
continue to strengthen as noted by the increase in net sales orders as discussed above, however we could see pressure on labor and material costs begin to have an impact on costs during 2018.
West:
The number of homes closed and home closings revenue, net increased by 3.7% and 9.4%, respectively, for the 2017 year as compared to the 2016 year. The increases are primarily driven by higher net sales in the first half of the year as compared to the same period in the prior year in our Phoenix and Northern California markets. The 5.6% increase in average selling price is also driven by the Phoenix and Northern California markets as a result of strong consumer demand within these areas.
Land Closings Revenue
Year Ended December 31, | |||||||||||
(Dollars in thousands) | 2017 | 2016 | Change | ||||||||
East | $ | 6,298 | $ | 21,043 | $ | (14,745 | ) | ||||
Central | 10,795 | 29,753 | (18,958 | ) | |||||||
West | — | 13,757 | (13,757 | ) | |||||||
Total | $ | 17,093 | $ | 64,553 | $ | (47,460 | ) | ||||
We generally purchase land and lots with the intent to build and sell homes. However, in some locations where we act as a developer, we occasionally purchase land that includes commercially zoned parcels or areas designated for school or government use, which we typically sell to commercial developers or municipalities, as applicable. We also sell residential lots or land parcels to manage our land and lot supply on larger tracts of land. Land and lot sales occur at various intervals and varying degrees of profitability. Therefore, the revenue and gross margin from land closings will fluctuate from period to period, depending on market opportunities. Land closings revenue was $17.1 million and $64.6 million, respectively, for the years ended December 31, 2017 and 2016. The prior year was significantly higher as we were able to capitalize on certain market conditions relative to our long-term strategic assets. The sales for the year ended December 31, 2016 represent legacy land that we held for either appreciation or tax purposes.
Segment Home Closings Gross Margins
East | Central | West | Total | ||||||||||||||||||||||||||||
For the Year Ended December 31, | |||||||||||||||||||||||||||||||
(Dollars in thousands) | 2017 | 2016 | 2017 | 2016 | 2017 | 2016 | 2017 | 2016 | |||||||||||||||||||||||
Home closings revenue, net | $ | 1,377,566 | $ | 1,119,334 | $ | 1,102,189 | $ | 1,099,780 | $ | 1,319,306 | $ | 1,206,407 | $ | 3,799,061 | $ | 3,425,521 | |||||||||||||||
Cost of home closings | 1,094,475 | 892,914 | 899,260 | 902,084 | 1,098,969 | 1,006,741 | 3,092,704 | 2,801,739 | |||||||||||||||||||||||
Home closings gross margin | 283,091 | 226,420 | 202,929 | 197,696 | 220,337 | 199,666 | 706,357 | 623,782 | |||||||||||||||||||||||
Home closings gross margin % | 20.6 | % | 20.2 | % | 18.4 | % | 18.0 | % | 16.7 | % | 16.6 | % | 18.6 | % | 18.2 | % | |||||||||||||||
East:
Home closings gross margin percentage increased to 20.6% from 20.2% for the year ended December 31, 2017 compared to the prior year, primarily as a result of product and geographic mix. All divisions in the East experienced an increase in the number of homes closed and several of our markets also experienced an increase in the average sales price, which led to an increase in home closings gross margin. However, certain markets within the region experienced an increase in land development cost which partially offset the increase in home closings revenue net, causing a moderate increase in home closings gross margin percent.
Central:
Home closings gross margin percentage increased to 18.4% from 18.0% for the year ended December 31, 2017 compared to the prior year. Several markets within the Central region experienced a decrease in construction costs and an increase in
43
rebates from our regional and national vendor program. The net decrease in costs of home closings partially contributed to the increase in home closings gross margin percentage. In addition, geographical mix within the region further contributed to the overall increase for 2017.
West:
Home closings gross margin percentage increased to 16.7% from 16.6% for the years ended December 31, 2017 compared to the prior year. Several markets within this region experienced an increase in the number of homes closed, average sales price, and homes closing revenue, net. During 2017, we experienced efficiencies from procurement and operational enhancements, which also contributed to the increase in home closings gross margin. However, we also experienced an increase in land development costs of the homes closed in 2017 compared to those closed in 2016, which partially offset our enhancements.
Mortgage Operations
Our Mortgage Operations segment provides mortgage lending through our subsidiary, TMHF, and title service through our subsidiary, Inspired Title. The following details the number of loans closed, net income per closed loan, the aggregate value, capture rate, and average FICO on our loans for the following periods:
Closed Loans | Profit per Closed Loan (1) | Aggregate Loan Volume (in millions) | Capture Rate | Average FICO | ||||||||||||
December 31, 2017 | 4,668 | $ | 5,919 | $ | 1,590.5 | 75 | % | 745 | ||||||||
December 31, 2016 | 4,435 | $ | 5,441 | $ | 1,492.5 | 80 | % | 743 | ||||||||
(1) Excludes hedging gain/loss
Our net income per closed loan, excluding the derivative asset, increased for the year ended December 31, 2017 compared to the same period in the prior year primarily due to the increase in the average loan amount which is a result of the increase in average selling price of homes closed.
Our mortgage capture rate represents the percentage of our homes sold to a home purchaser that utilized a mortgage and for which the borrower obtained such mortgage from TMHF or one of our preferred third party lenders. The decrease in our capture rate is primarily due to increased competition for new home mortgages.
Sales, Commissions and Other Marketing Costs
Sales commissions and other marketing costs, as a percentage of home closings revenue, decreased period over period to 6.8% from 7.0% for the years ended December 31, 2017 and 2016, respectively. This decrease is primarily driven by efficiencies we have achieved as a result of previous investments we have made in our sales and marketing functions. In addition, the prior year period had higher sales and marketing costs as a result of our acquired divisions and an increase in new communities which typically have incremental startup costs during their early stages.
General and Administrative Expenses
General and administrative expenses, as a percentage of home closings revenue, decreased period over period to 3.4% from 3.6% for the years ended December 31, 2017 and 2016, respectively. The decrease was attributable to increased home closings revenue in addition to gaining leverage on existing infrastructure to maintain stable operating costs.
Equity in Income of Unconsolidated Entities
Equity in income of unconsolidated entities was $8.8 million and $7.5 million for the years ended December 31, 2017 and 2016, respectively. The increase was primarily due to the number of active unconsolidated joint ventures and the timing of openings. We had six unconsolidated joint ventures which were open and active for the full year ended December 31, 2017. In the prior year, we had five unconsolidated joint ventures which were active all year with the sixth unconsolidated joint venture opening in the fourth quarter of 2016.
44
Interest Income, net
Interest income, net includes interest earned on cash balances offset by interest incurred but not capitalized on our long-term debt and other borrowings. Interest income, net for the years ended December 31, 2017 and 2016 was consistent.
Other Expense, net
Other expense, net for the year ended December 31, 2017 and 2016 was $2.3 million and $11.9 million, respectively. The prior year balance included higher accruals for contingent consideration relating to our acquisitions and pre-acquisition costs on abandoned land projects.
US Tax Reform
The Tax Act made comprehensive reforms to the United States tax code, including a decrease to the corporate statutory tax rate from 35% to 21%, and a one-time mandatory deemed repatriation tax of foreign earnings at a reduced rate that may be, payable over eight years.
The Tax Act has a material impact to our current financial statements and we expect the Tax Act will have a material impact to our future financial statements. For the quarter ended December 31, 2017, we have recorded an estimated income tax expense of $57.4 million to account for the lower tax rate impact to our existing deferred tax assets. In addition, we have recorded an estimated $3.6 million charge related to the mandatory deemed repatriation of foreign earnings related to the sale of our Canadian operations in 2015. We expect the Tax Act will have a favorable impact to tax expense and earnings per share beginning in 2018.
Income Tax Provision
Our effective tax rate was 50.3% and 34.3% for the years ended December 31, 2017 and December 31, 2016, respectively. The Tax Act made comprehensive reforms to the United States tax code, including a decrease to the corporate statutory tax rate from 35% to 21% and a one-time mandatory deemed repatriation of foreign earnings at a reduced tax rate that that may be payable over eight years.
In response to the Tax Act, the SEC issued Staff Accounting Bulletin No. 118 (SAB 118), which provides guidance on accounting for the impacts of the Tax Act. SAB 118 allows for the recording provisional amounts during a one year “measurement period” similar to that used when accounting for business combinations, if the Company has a reasonable estimate of the impact but the accounting is not yet complete. The measurement period is deemed to have ended in either one calendar year or when the Company has obtained, prepared and analyzed the information necessary to finalize its accounting for the impact of the Tax Act, whichever is earlier.
For the three months ended December 31, 2017, we have recorded a discrete net tax expense of $61 million related to impacts related to the Tax Act. The net expense includes our estimated $57.4 million expense related to the write-down of our existing deferred tax assets to reflect the newly enacted U.S. federal tax rate, in accordance with SAB 118. The provisional expense is the Company’s best estimate of the deferred tax asset write-down at this time. However, the estimate may be impacted by our calculation of additional adjustments made to federal temporary differences arising from a tax accounting method change filed with the IRS and the state tax effect of these additional adjustments.
The net expense related to the Tax Act recorded during the period ended December 31, 2017, also includes an estimated $3.6 million expense from the mandatory deemed repatriation of foreign earnings related to the sale of our Canadian business in 2015. The Tax Act imposes a mandatory deemed repatriation tax on post-1986 earnings and profits (“E&P”) of certain foreign subsidiaries to their 10% U.S. shareholders (regardless of whether such E&P is distributed) at a rate of 15.5% for U.S. corporate shareholders to the extent E&P does not exceed the U.S. shareholder’s aggregate foreign cash position (as defined in the Tax Act) and 8% for E&P in excess of such cash position. The resulting tax may be payable over eight years. The mandatory tax is partially offset by foreign tax credits generated by cash taxes that our Canadian subsidiaries previously paid. To determine the amount of the foreign repatriation tax, we determined, in addition to other factors, the amount of E&P of the subsidiaries, as well as the amount of non-U.S. income taxes paid on such earnings. The provisional expense is the Company’s best estimate of the foreign repatriation tax at this time, however it is subject to change in the future as we are continuing to gather additional information to more precisely compute the amount of the tax.
Our as adjusted effective tax rate excluding the impacts of the Tax Act was 33.2% and 34.3% for the years ended December 31, 2017 and December 31, 2016, respectively. Our effective rate for both years was affected by a number of
45
factors, the most significant of which included state income taxes, the establishment of reserves for uncertain tax positions, adjustments to state net operating losses, changes in valuation allowances, and preferential treatment of certain deductions and energy credits relating to homebuilding activities.
Net Income
Net income from continuing operations and earnings per diluted share for the year ended December 31, 2017 was $176.7 million and $1.47, respectively. As adjusted net income from continuing operations and as adjusted earnings per diluted share for the year ended December 31, 2017 was $237.6 million and $1.98, respectively. Net income from continuing operations and earnings per diluted share for the year ended December 31, 2016 was $206.6 million and $1.69, respectively. Adjusting for the tax reform impact, the increase in net income and earnings per share from the prior year is attributable to an increase in margin dollars as a result of the increase in both the number of homes closed and average selling price of homes closed.
Year Ended December 31, 2016 Compared to Year Ended December 31, 2015
Average Active Selling Communities
Year Ended December 31, | ||||||||
2016 | 2015 | Change | ||||||
East | 129 | 95 | 35.8 | % | ||||
Central | 117 | 106 | 10.4 | |||||
West | 63 | 58 | 8.6 | |||||
Total | 309 | 259 | 19.3 | % | ||||
Consolidated:
Average active selling communities increased 19.3%, primarily in the East region due to the acquisitions of JEH Homes (“JEH”) in April 2015 and three divisions of Orleans Homes (“Orleans”) in July 2015. In addition, we experienced community growth in existing divisions in our Central and West regions such as Houston, Austin and divisions within our California market. We also opened new communities and closed out existing communities throughout all of our legacy markets.
Net Sales Orders
Year Ended December 31, (1) | ||||||||||||||||||||||||||||||
(Dollars in thousands ) | Net Homes Sold | Sales Value | Average Selling Price | |||||||||||||||||||||||||||
2016 | 2015 | Change | 2016 | 2015 | Change | 2016 | 2015 | Change | ||||||||||||||||||||||
East | 3,158 | 2,154 | 46.6 | % | $ | 1,223,046 | $ | 805,982 | 51.7 | % | $ | 387 | $ | 374 | 3.5 | % | ||||||||||||||
Central | 2,075 | 2,267 | (8.5 | ) | 977,440 | 1,039,810 | (6.0 | ) | 471 | 459 | 2.6 | |||||||||||||||||||
West | 2,271 | 2,260 | 0.5 | 1,281,266 | 1,123,288 | 14.1 | 564 | 497 | 13.5 | |||||||||||||||||||||
Total | 7,504 | 6,681 | 12.3 | % | $ | 3,481,752 | $ | 2,969,080 | 17.3 | % | $ | 464 | $ | 444 | 4.5 | % | ||||||||||||||
(1) | Net sales orders represent the number and dollar value of new sales contracts executed with customers, net of cancellations. |
East:
The number of net homes sold and sales value of homes increased by 46.6% and 51.7%, respectively, primarily due to the acquisitions of JEH, Acadia Homes (“Acadia”) and Orleans, which contributed to the increase in communities. The change in the total sales value was a result of a higher number of units, primarily attributable to an increase in average active selling communities in the majority of our markets. In addition, the results for 2016 represent full period net sales orders from our acquired divisions, whereas the 2015 balances include data for the acquired divisions only for the periods since their respective acquisitions. The average selling price of net homes sold increased throughout the region for 2016 due to product mix.
Central:
46
The number of net homes sold and sales value of homes decreased by 8.5% and 6.0%, respectively, whereas the average selling price increased by 2.6%. Despite the decrease in the annual results for this region, we experienced fourth quarter improvements in 2016 in the Central region with increases in net sales orders and total sales value by 13.1% and 12.5%, respectively, when compared to the fourth quarter of 2015. While slower job growth and a decline in relocations to Houston compared to previous years impacted the year-over-year performance, the divisions in the Central region experienced increased average selling prices for 2016 as well as declining cancellation rates.
West:
The number of net homes sold remained relatively flat and sales value of homes increased by 14.1%, respectively, primarily due to an increase in average active selling communities in our California markets. The average selling price of net homes sold increased by 13.5% as a result of our performance in several of our markets in California and Phoenix which experienced price increases due to increased consumer demand.
Sales Order Cancellations
Year Ended December 31, | ||||||
Cancellation Rate (1) | ||||||
2016 | 2015 | |||||
East | 12.1 | % | 12.7 | % | ||
Central | 15.5 | 16.5 | ||||
West | 13.7 | 12.5 | ||||
Total Company | 13.6 | % | 13.9 | % | ||
(1) | Cancellation rate represents the number of canceled sales orders divided by gross sales orders. |
Our consolidated cancellation rate decreased to 13.6% from 13.9% year over year. The primary driver for the decrease in the cancellation rate is our Houston divisions which are normalizing after twelve months of elevated rates. In addition, our use of prequalification criteria through TMHF and robust earnest money deposits helped us manage our cancellation rate across the Company and increase our mortgage capture rate compared to the prior year.
Sales Order Backlog
As of December 31, | ||||||||||||||||||||||||||||||
(Dollars in thousands) | Sold Homes in Backlog (1) | Sales Value | Average Selling Price | |||||||||||||||||||||||||||
2016 | 2015 | Change | 2016 | 2015 | Change | 2016 | 2015 | Change | ||||||||||||||||||||||
East | 1,220 | 900 | 35.6 | % | $ | 524,406 | $ | 368,349 | 42.4 | % | $ | 430 | $ | 409 | 5.1 | % | ||||||||||||||
Central | 958 | 1,169 | (18.0 | ) | 494,243 | 590,177 | (16.3 | ) | 516 | 505 | 2.2 | |||||||||||||||||||
West | 953 | 863 | 10.4 | 513,261 | 434,447 | 18.1 | 539 | 503 | 7.2 | |||||||||||||||||||||
Total | 3,131 | 2,932 | 6.8 | % | $ | 1,531,910 | $ | 1,392,973 | 10.0 | % | $ | 489 | $ | 475 | 2.9 | % | ||||||||||||||
(1) Sales order backlog represents homes under contract for which revenue has not yet been recognized at the end of the period (including homes sold but not yet started). Some of the contracts in our sales order backlog are subject to contingencies including mortgage loan approval and buyers selling their existing homes, which can result in future cancellations.
Total backlog units and total sales value increased by 6.8% and 10.0% at 2016 year end as compared to the 2015 year end, respectively. The increase in backlog units is primarily as a result of the combination of increased sales orders and a decrease in our cancellation rate. The increase in total sales value is directionally consistent with the 2.9% increase in the average selling price which is a result of higher average selling prices for net sales orders.
47
Home Closings Revenue
Year Ended December 31, | ||||||||||||||||||||||||||||||
(Dollars in thousands) | Homes Closed | Home Closings Revenue, net | Average Selling Price | |||||||||||||||||||||||||||
2016 | 2015 | Change | 2016 | 2015 | Change | 2016 | 2015 | Change | ||||||||||||||||||||||
East | 2,902 | 2,121 | 36.8 | % | $ | 1,119,334 | $ | 833,327 | 34.3 | % | $ | 386 | $ | 393 | (1.8 | )% | ||||||||||||||
Central | 2,286 | 2,317 | (1.3 | ) | 1,099,780 | 1,082,459 | 1.6 | 481 | 467 | 3.0 | ||||||||||||||||||||
West | 2,181 | 1,873 | 16.4 | 1,206,407 | 974,182 | 23.8 | 553 | 520 | 6.3 | |||||||||||||||||||||
Total | 7,369 | 6,311 | 16.8 | % | $ | 3,425,521 | $ | 2,889,968 | 18.5 | % | $ | 465 | $ | 458 | 1.5 | % | ||||||||||||||
East:
The number of homes closed and home closings revenue, net increased by 36.8% and 34.3%, respectively, for the 2016 year as compared to the 2015 year primarily due to the current year results encompassing a full period of home closings from all of our acquired divisions, whereas 2015 included results only for JEH and the acquired divisions of Orleans for a partial year. Additionally, we organically grew our markets through community openings which resulted in increased homes closed. Certain economic market improvements, as well as favorable homebuyer reception of new products and new communities, contributed to the increase in net home closings revenue in 2016 compared to 2015. The average selling price decreased by 1.8% as a result of the newly acquired markets over the past year in Atlanta, Charlotte, Chicago, and Raleigh where average selling prices were lower than our legacy markets.
Central:
The number of homes closed decreased by 1.3% for the 2016 year as compared to the 2015 year primarily as a result of our Houston market. Higher price point homes in this market have been affected the most by oil industry economic factors in Texas in 2016. While the high price point homes were the most affected in home closings units, the majority of the markets within this region experienced price appreciation, which contributed to the region's 1.6% increase in home closings revenue, net in 2016 and a 3.0% increase in average selling price compared to 2015.
West:
The number of homes closed and home closings revenue, net increased by 16.4% and 23.8%, respectively for the 2016 year as compared to the 2015 year. The increase in units was primarily driven by our Phoenix market which continued to grow as a result of job growth and a lower cost of living when compared to other markets. Our Phoenix and California markets contributed to the increase in home closing revenue, net as a result of increased average selling price
Land Closings Revenue
Year Ended December 31, | |||||||||||
(Dollars in thousands) | 2016 | 2015 | Change | ||||||||
East | $ | 21,043 | $ | 9,374 | $ | 11,669 | |||||
Central | 29,753 | 17,739 | 12,014 | ||||||||
West | 13,757 | 16,657 | (2,900 | ) | |||||||
Total | $ | 64,553 | $ | 43,770 | $ | 20,783 | |||||
We generally purchase land and lots with the intent to build and sell homes. However, in some locations where we act as a developer, we occasionally purchase land that includes commercially zoned parcels or areas designated for school or government use, which we typically sell to commercial developers or municipalities, as applicable. We also sell residential lots or land parcels to manage our land and lot supply on larger tracts of land. Land and lot sales occur at various intervals and varying degrees of profitability. Therefore, the revenue and gross margin from land closings will fluctuate from period to period, depending on market opportunities. For the year ended December 31, 2016, land closings revenue increased by $20.8 million as we were able to capitalize on certain market conditions relative to our long-term strategic assets. The sales represent legacy land that we held for either appreciation or tax purposes. During 2016, the tax holding period for certain land assets expired, preserving certain tax benefits, thus resulting in our significant land sales.
Segment Home Closings Gross Margins
48
East | Central | West | Total | ||||||||||||||||||||||||||||
For the Year Ended December 31, | |||||||||||||||||||||||||||||||
(Dollars in thousands) | 2016 | 2015 | 2016 | 2015 | 2016 | 2015 | 2016 | 2015 | |||||||||||||||||||||||
Home closings revenue, net | $ | 1,119,334 | $ | 833,327 | $ | 1,099,780 | $ | 1,082,459 | $ | 1,206,407 | $ | 974,182 | $ | 3,425,521 | $ | 2,889,968 | |||||||||||||||
Cost of home closings | 892,914 | 655,237 | 902,084 | 886,821 | 1,006,741 | 816,765 | 2,801,739 | 2,358,823 | |||||||||||||||||||||||
Home closings gross margin | 226,420 | 178,090 | 197,696 | 195,638 | 199,666 | 157,417 | 623,782 | 531,145 | |||||||||||||||||||||||
Home closings gross margin % | 20.2 | % | 21.4 | % | 18.0 | % | 18.1 | % | 16.6 | % | 16.2 | % | 18.2 | % | 18.4 | % | |||||||||||||||
Consolidated:
Our consolidated home closings gross margin percentage for the year ended December 31, 2016 decreased to 18.2% from 18.4% compared to the prior year. Amortization of capitalized interest benefited our overall margins as we have experienced a decrease in our interest incurred from the redemption, in May 2015, of our 7.75% Senior Notes due 2020 (“the 2020 Notes”) and issuance, in April 2015, of our 5.875% Senior Notes due 2023. Partially offsetting this benefit, in 2016, we increased closings of aged finished inventory which negatively impacted margins as such homes typically have lower margins than to-be-built homes and a higher cost of capital due to longer carry times. Purchase accounting also negatively impacted our consolidated gross margin percentage in 2016 when compared to 2015.
East:
Home closings gross margin percentage decreased to 20.2% from 21.4% for the year ended December 31, 2016 compared to the prior year, primarily due to an overall shift in our product mix from our higher margin homes in our Florida divisions to our newly acquired divisions, which have slightly lower margin percentages. An impairment charge of approximately $3.5 million for the year ended December 31, 2016, in our Chicago division negatively impacted our home closings gross margin results. Furthermore, the effects of purchase accounting stemming from these business combinations has also negatively impacted home closings gross margin in this region.
Central:
Home closings gross margin percentage remained relatively consistent for the years ended December 31, 2017 and 2016. Despite the economic uncertainty regarding the oil industry, which occurred throughout 2016 and thereby negatively impacting the number of homes closed, the Central region maintained home closings gross margin percentage through sales price increases in markets other than Houston.
West:
Home closings gross margin percentage increased to 16.6% from 16.2% for the year ended December 31, 2016 compared to the prior year. The majority of the markets within this region experienced an increase in their margins through sales price increases to offset the increase in land, development and construction costs.
Mortgage Operations
Our Mortgage Operations segment provides mortgage lending through our subsidiary, TMHF, and title service through our subsidiary, Inspired Title. The following details the number of loans closed, net income per closed loan, the aggregate value, capture rate, and average FICO on our loans for the following periods:
Closed Loans | Profit per Closed Loan (1) | Aggregate Loan Volume (in millions) | Capture Rate | Average FICO | |||||||||||
December 31, 2016 | 4,435 | 5,441 | $ | 1,492.5 | 80 | % | 743 | ||||||||
December 31, 2015 | 3,675 | 5,360 | $ | 1,219.0 | 79 | % | 742 | ||||||||
49
(1) Excludes hedging gain/loss
Our net income per closed loan increased for the year ended December 31, 2016 compared to 2015 primarily due to increased margins as a result of improvements in the gain on sale of loans due to better investor pricing from our mandatory commitments model. In addition, 2015 was negatively impacted by an increase in overhead related to increasing our in-house underwriting platform in preparation for shifting to agency originations and additional regulation
Our mortgage capture rate represents the percentage of our homes sold to a home purchaser that utilized a mortgage and for which the borrower obtained such mortgage from TMHF or one of our preferred third party lenders.
Sales, Commissions and Other Marketing Costs
Sales commissions and other marketing costs, as a percentage of home closings revenue, increased slightly period over period to 7.0% from 6.9% for the years ended December 31, 2016 and 2015, respectively. This was primarily a result of our increase in the number of open communities in 2016. Our new communities typically have higher sales and marketing costs during their early stages of sales due to various start up costs.
General and Administrative Expenses
General and administrative expenses, as a percentage of home closings revenue, were 3.6% and 3.3% for the years ended December 31, 2016 and 2015, respectively. The increase was attributable to increased headcount and other investments we have made for future business optimization, as well as the acquisition we completed in 2016.
Equity in Income of Unconsolidated Entities
Equity in income of unconsolidated entities was $7.5 million and $1.8 million for the years ended December 31, 2016 and 2015, respectively. The change was primarily due to the timing of our unconsolidated joint venture openings. We had two additional unconsolidated joint ventures fully active during 2016 compared to the prior year.
Interest Income, net
Interest income, net includes interest earned on cash balances offset by interest incurred but not capitalized on our long-term debt and other borrowings. Interest income, net for the years ended December 31, 2016 and 2015 was consistent.
Other Expense, net
Other expense, net for the year ended December 31, 2016 and 2015 was $11.9 million and $11.6 million, respectively. The majority of the expense for both periods relates to earn-out activity, captive insurance claims costs, financing fees on our Revolving Credit Facility, and pre-acquisition costs on abandoned land projects.
Loss on Extinguishment of Debt
In May 2015, we redeemed the entire outstanding aggregate principal amount of our 2020 Senior Notes at a redemption price of 105.813% of their aggregate principal amount, plus accrued and unpaid interest thereon to, but not including, the date of the redemption. As a result of the redemption, we recorded a loss on extinguishment of debt of $33.3 million, which included the payment of the redemption premium and write-off of net unamortized deferred financing fees.
We had no such transactions for the year ended December 31, 2016.
Gain on Foreign Currency Forward
In December 2014, we entered into a derivative financial instrument in the form of a foreign currency forward. The derivative financial instrument hedged our exposure to the Canadian dollar in conjunction with the disposition of the Monarch business. The final settlement of the derivative financial instrument occurred on January 30, 2015, and a gain in the amount of $30.0 million was recorded in gain on foreign currency forward in the accompanying Consolidated Statements of Operations for the year ended December 31, 2015.
We had no such transactions for the year ended December 31, 2016.
Income Tax Provision
50
Our effective tax rate was 34.3% and 34.5% for the years ended December 31, 2016 and December 31, 2015, respectively. The effective rate for both years was affected by a number of factors, the most significant of which included state income taxes, the establishment of reserves for uncertain tax positions, changes in valuation allowances, and preferential treatment of certain deductions and energy credits relating to homebuilding activities.
Net Income
Net income from continuing operations and earnings per diluted share for the year ended December 31, 2016 was $206.6 million and $1.69, respectively. Net income from continuing operations and earnings per diluted share for the year ended December 31, 2015 was $171.0 million and $1.38. The increase in net income and earnings per share from the prior year is attributable to an increase in margin dollars as a result of the increase in both the number of homes closed and average selling price of homes closed.
Liquidity and Capital Resources
Liquidity
We finance our operations through the following:
• | Borrowings under our revolving credit facility; |
• | Our various series of senior notes; |
• | Mortgage warehouse facilities; |
• | Project-level financing (including non-recourse loans); |
• | Performance, payment and completion surety bonds, and letters of credit; and |
• | Cash generated from operations. |
We believe that we can fund our current and foreseeable liquidity needs for the next 12 months from:
• | Cash generated from operations; and |
• | Borrowings under our Revolving Credit Facility. |
We may also access the capital markets to obtain additional liquidity through debt and equity offerings on an opportunistic basis. Our principal uses of capital for the years ended December 31, 2017 and 2016 were homebuilding acquisitions, land purchases, lot development, home construction, operating expenses, payment of debt service, income taxes, investments in joint ventures, stock repurchases and the payment of various liabilities. In addition, net proceeds from our equity offerings during the year were used to repurchase our Principal Equityholders' indirect interest in TMHC. Cash flows for each of our communities depend on the status of the development cycle, and can differ substantially from reported earnings. Early stages of development or expansion require significant cash expenditures for land acquisitions, on and off-site development, construction of model homes, general landscaping and other amenities. Because these costs are a component of our inventory and are not recognized in our statement of operations until a home closes, we incur significant cash outflows prior to recognition of earnings.
The table below summarizes our total cash and liquidity as of the dates indicated:
As of December 31, | ||||||||
(Dollars in thousands) | 2017 | 2016 | ||||||
Total Cash, including Restricted Cash(1) | $ | 575,503 | $ | 301,812 | ||||
Total Revolving Credit Facility | 500,000 | 500,000 | ||||||
Letters of Credit Outstanding | (47,126 | ) | (31,903 | ) | ||||
Revolving Credit Facility Borrowings Outstanding | — | — | ||||||
Revolving Credit Facility Availability | 452,874 | 468,097 | ||||||
Total Liquidity | $ | 1,028,377 | $ | 769,909 | ||||
(1) In January 2018, we completed two additional equity offerings which included the purchase of 7.6 million shares of our Class B Common Stock from our Principal Equityholders for approximately $200.0 million.
Cash Flow Activities
51
Operating Cash Flow Activities
Our net cash provided by operating activities was $386.2 million for the year ended December 31, 2017 compared to $372.6 million provided by operating activities for the year ended December 31, 2016. The increase in cash provided by operating activities was primarily attributable to a decrease in mortgage loans held for sale as a result of selling more loans offset by a smaller decrease in real estate inventory year over year. The decreases in mortgage loans held for sale and real estate inventory were partially offset by lower net income before allocation to non-controlling interests for the year ended December 31, 2017 compared to the same period in the prior year.
Investing Cash Flow Activities
Net cash used in investing activities was $36.0 million for the year ended December 31, 2017 compared to net cash used in investing activities of $81.0 million for the year ended December 31, 2016. The primary driver of the change between periods was the 2016 acquisition of Acadia for $52.8 million.
Financing Cash Flow Activities
Net cash used in financing activities was $76.5 million for the year ended December 31, 2017 compared to cash used in financing activities of $117.3 million for the year ended December 31, 2016. The primary driver of the change between periods was the repayments on the Revolving Credit Facility in 2016. We did not have any borrowings or repayments on our Revolving Credit Facility in 2017.
Debt Instruments
Senior Notes:
The following table summarizes our outstanding senior unsecured notes (collectively, the “Senior Notes”), as of December 31, 2017.
(Dollars in thousands) | Date Issued | Principal Amount | Initial Offering Price | Interest Rate | Original Net Proceeds | Original Debt Issuance Cost | |||||||||||||
Senior Notes due 2021 | April 16, 2013 | 550,000 | 100.0 | % | 5.250 | % | 541,700 | 8,300 | |||||||||||
Senior Notes due 2023 | April 16, 2015 | 350,000 | 100.0 | % | 5.875 | % | 345,500 | 4,500 | |||||||||||
Senior Notes due 2024 | March 5, 2014 | 350,000 | 100.0 | % | 5.625 | % | 345,300 | 4,700 | |||||||||||
Total | $ | 1,250,000 | $ | 1,232,500 | $ | 17,500 | |||||||||||||
2021 Senior Notes
On April 16, 2013, we issued $550.0 million aggregate principal amount of 5.25% Senior Notes due 2021 (the “2021 Senior Notes”).
The 2021 Senior Notes mature on April 15, 2021. The 2021 Senior Notes are guaranteed by TMM Holdings, Taylor Morrison Holdings, Inc., Taylor Morrison Communities II, Inc. and their homebuilding subsidiaries (collectively, the “Guarantors”), which are all subsidiaries directly or indirectly of TMHC. The 2021 Senior Notes and the related guarantees are senior unsecured obligations and are not subject to registration rights. The indenture for the 2021 Senior Notes contains covenants that limit (i) the making of investments, (ii) the payment of dividends and the redemption of equity and junior debt, (iii) the incurrence of additional indebtedness, (iv) asset dispositions, (v) mergers and similar corporate transactions, (vi) the incurrence of liens, (vii) prohibitions on payments and asset transfers among the issuers and restricted subsidiaries and (viii) transactions with affiliates, among others. The indenture governing the 2021 Senior Notes contains customary events of default. If we do not apply the net cash proceeds of certain asset sales within specified deadlines, we will be required to offer to repurchase the 2021 Senior Notes at par (plus accrued and unpaid interest) with such proceeds. We are also required to offer to repurchase the 2021 Senior Notes at a price equal to 101% of their aggregate principal amount (plus accrued and unpaid interest) upon certain change of control events.
The 2021 Senior Notes are redeemable at scheduled redemption prices, currently at 102.625%, of their principal amount (plus accrued and unpaid interest).
There are no financial maintenance covenants for the 2021 Senior Notes.
52
2023 Senior Notes and Redemption of the 2020 Notes
On April 16, 2015, we issued $350.0 million aggregate principal amount of 5.875% Senior Notes due 2023 (the “2023 Senior Notes”). The 2023 Senior Notes and the related guarantees are senior unsecured obligations and are not subject to registration rights. The net proceeds of the offering, together with cash on hand, were used to redeem the entire remaining principal amount of the 2020 Notes on May 1, 2015, at a redemption price of 105.813% of their aggregate principal amount, plus accrued and unpaid interest thereon to, but not including, the date of redemption. As a result of the redemption of the 2020 Notes, we recorded a loss on extinguishment of debt of $33.3 million during the second quarter of 2015, which included the payment of the redemption premium and write-off of net unamortized deferred financing fees.
The 2023 Senior Notes mature on April 15, 2023. The 2023 Senior Notes are guaranteed by the same Guarantors that guarantee the 2021 Senior Notes. The indenture governing the 2023 Senior Notes contains covenants that limit our ability to incur debt secured by liens and enter into certain sale and leaseback transactions. The indenture governing the 2023 Senior Notes contains events of default that are similar to those contained in the indenture governing the 2021 Senior Notes. The change of control provisions in the indenture governing the 2023 Senior Notes are similar to those contained in the indenture governing the 2021 Senior Notes, but a credit rating downgrade must occur in connection with the change of control before the repurchase offer requirement is triggered for the 2023 Senior Notes.
Prior to January 15, 2023, the 2023 Senior Notes are redeemable at a price equal to 100% plus a “make-whole” premium for payments through January 15, 2023 (plus accrued and unpaid interest). Beginning January 15, 2023, the 2023 Senior Notes are redeemable at par (plus accrued and unpaid interest).
There are no financial maintenance covenants for the 2023 Senior Notes.
2024 Senior Notes
On March 5, 2014, we issued $350.0 million aggregate principal amount of 5.625% Senior Notes due 2024 (the “2024 Senior Notes”).
The 2024 Senior Notes mature on March 1, 2024. The 2024 Senior Notes are guaranteed by the same Guarantors that guarantee the 2021 and 2023 Senior Notes. The 2024 Senior Notes and the related guarantees are senior unsecured obligations and are not subject to registration rights. The indenture governing the 2024 Senior Notes contains covenants that limit our ability to incur debt secured by liens and enter into certain sale and leaseback transactions similar to the 2023 Senior Notes. The indenture governing the 2024 Senior Notes contains events of default that are similar to those contained in the indenture governing the 2021 and 2023 Senior Notes. The change of control provisions in the indenture governing the 2024 Senior Notes are similar to those contained in the indenture governing the 2023 Senior Notes.
Prior to December 1, 2023, the 2024 Senior Notes are redeemable at a price equal to 100% plus a “make-whole” premium for payments through December 1, 2023 (plus accrued and unpaid interest). Beginning on December 1, 2023, the 2024 Senior Notes are redeemable at par (plus accrued and unpaid interest).
There are no financial maintenance covenants for the 2024 Senior Notes.
TMHC Compared to TMM Holdings
TMM Holdings is a parent guarantor of certain of our debt facilities. The financial information of TMHC is substantially identical to the financial performance and operations of TMM Holdings except for certain costs associated with maintaining a public company status and Class A common stock, which are attributable to TMHC.
Revolving Credit Facility
At December 31, 2017, our $500.0 million Revolving Credit Facility was scheduled to mature on April 12, 2019. On January 26, 2018, we amended our Revolving Credit Facility to extend the maturity date from April 12, 2019 to January 26, 2022.
53
Other immaterial changes were also made to the structure of the Revolving Credit Facility. The Revolving Credit Facility is guaranteed by the same Guarantors that guarantee the 2021, 2023 and 2024 Senior Notes.
The Revolving Credit Facility contains certain “springing” financial covenants, requiring us and our subsidiaries to comply with a maximum debt to capitalization ratio of not more than 0.60 to 1.00 and a minimum consolidated tangible net worth level of at least $1.6 billion. The financial covenants would be in effect for any fiscal quarter during which any (a) loans under the Revolving Credit Facility are outstanding during the last day of such fiscal quarter or on more than five separate days during such fiscal quarter or (b) undrawn letters of credit (except to the extent cash collateralized) issued under the Revolving Credit Facility in an aggregate amount greater than $40.0 million or unreimbursed letters of credit issued under the Revolving Credit Facility are outstanding on the last day of such fiscal quarter or for more than five consecutive days during such fiscal quarter.
For purposes of determining compliance with the financial covenants for any fiscal quarter, the Revolving Credit Facility provides that we may exercise an equity cure by issuing certain permitted securities for cash or otherwise recording cash contributions to our capital that will, upon the contribution of such cash to the borrower, be included in the calculation of consolidated tangible net worth and consolidated total capitalization. The equity cure right is exercisable up to twice in any period of four consecutive fiscal quarters and up to five times overall.
The Revolving Credit Facility contains certain restrictive covenants including limitations on incurrence of liens, dividends and other distributions, asset dispositions and investments in entities that are not guarantors, limitations on prepayment of subordinated indebtedness and limitations on fundamental changes. The Revolving Credit Facility contains customary events of default, subject to applicable grace periods, including for nonpayment of principal, interest or other amounts, violation of covenants (including financial covenants, subject to the exercise of an equity cure), incorrectness of representations and warranties in any material respect, cross default and cross acceleration, bankruptcy, material monetary judgments, ERISA events with material adverse effect, actual or asserted invalidity of material guarantees and change of control. As of December 31, 2017 and 2016, we were in compliance with all of the covenants under the Revolving Credit Facility.
Mortgage Warehouse Borrowings
The following is a summary of our mortgage subsidiary warehouse borrowings:
(Dollars in thousands) | At December 31, 2017 | ||||||||||||
Facility | Amount Drawn | Facility Amount | Interest Rate | Expiration Date | Collateral (1) | ||||||||
Flagstar | $ | 12,990 | $ | 39,000 | LIBOR + 2.25% | 30 days written notice | Mortgage Loans | ||||||
Comerica | 41,447 | 85,000 | LIBOR + 2.25% | On Demand | Mortgage Loans | ||||||||
J.P. Morgan | 64,385 | 125,000 | LIBOR + 2.375% | September 24, 2018 | Mortgage Loans and Restricted Cash | ||||||||
Total | $ | 118,822 | $ | 249,000 | |||||||||
At December 31, 2016 | |||||||||||||
Facility | Amount Drawn | Facility Amount | Interest Rate | Expiration Date | Collateral (1) | ||||||||
Flagstar | $ | 37,093 | $ | 55,000 | LIBOR + 2.5% | 30 days written notice | Mortgage Loans | ||||||
Comerica | 57,875 | 85,000 | LIBOR + 2.25% | November 16, 2017 | Mortgage Loans | ||||||||
J.P. Morgan | 103,596 | 125,000 | LIBOR + 2.375% to 2.5% | September 26, 2017 | Mortgage Loans and Restricted Cash | ||||||||
Total | $ | 198,564 | $ | 265,000 | |||||||||
(1) | The mortgage warehouse borrowings outstanding as of December 31, 2017 and 2016, are collateralized by $187.0 million and $233.2 million, respectively, of mortgage loans held for sale, which comprise the balance of mortgage receivables, and $1.6 million and $1.6 million, respectively, of cash, which is restricted cash on our balance sheet. |
Loans Payable and Other Borrowings
54
Loans payable and other borrowings as of December 31, 2017 and 2016 consist of project-level debt due to various land sellers and seller financing notes from current and prior year acquisitions. Project-level debt is generally secured by the land that was acquired and the principal payments generally coincide with corresponding project lot sales or a principal reduction schedule. Loans payable bear interest at rates that ranged from 0% to 8% at December 31, 2017 and 2016. We impute interest for loans with no stated interest rates.
Letters of Credit, Surety Bonds and Financial Guarantees
The following table summarizes our letters of credit and surety bonds as of the dates indicated:
As of December 31, | |||||||
(Dollars in thousands) | 2017 | 2016 | |||||
Letters of credit (1) | $ | 47,126 | $ | 31,903 | |||
Surety bonds | 284,617 | 270,943 | |||||
Total outstanding letters of credit and surety bonds | $ | 331,743 | $ | 302,846 | |||
(1) As of December 31, 2017 and 2016, there was $200 million total capacity of letters of credit available under our Revolving Credit Facility.
Contractual Obligations as of December 31, 2017
(Dollars in thousands) | Payments Due by Period | ||||||||||||||||||
Totals | Less than 1 year | 1-3 years | 3-5 years | More than 5 years | |||||||||||||||
Operating lease obligations | $ | 27,912 | $ | 8,010 | $ | 10,542 | $ | 6,438 | $ | 2,922 | |||||||||
Unrecognized tax benefit obligations including interest and penalties | 6,882 | — | 6,882 | — | — | ||||||||||||||
Land purchase contracts and lot options | 405,256 | 169,811 | 181,295 | 35,994 | 18,156 | ||||||||||||||
Senior notes (1) | 1,250,000 | — | — | 550,000 | 700,000 | ||||||||||||||
Other debt outstanding (1) | 258,275 | 204,872 | 45,673 | 4,655 | 3,075 | ||||||||||||||
Estimated interest expense (2) | 415,166 | 76,252 | 139,664 | 138,437 | 60,813 | ||||||||||||||
Totals | $ | 2,363,491 | $ | 458,945 | $ | 384,056 | $ | 735,524 | $ | 784,966 | |||||||||
(1) | As of December 31, 2017 total debt outstanding included $550.0 million aggregate principal amount of 2021 Senior Notes, $350.0 million aggregate principal amount of 2023 Senior Notes, $350.0 million aggregate principal amount of 2024 Senior Notes, $118.8 million of mortgage borrowings by TMHF, no outstanding borrowings on the Revolving Credit Facility, and $139.5 million of loans and other borrowings. Scheduled maturities of certain loans and other borrowings as of December 31, 2017 reflect estimates of anticipated lot take-downs associated with such loans. |
(2) | Estimated interest expense amounts for debt outstanding at the respective contractual interest rates, the weighted average of which was 5.5% as of December 31, 2017. |
Off-Balance Sheet Arrangements as of December 31, 2017
Investments in Land Development and Homebuilding Joint Ventures or Unconsolidated Entities
We participate in strategic land development and homebuilding joint ventures with related and unrelated third parties. The use of these entities, in some instances, enables us to acquire land to which we could not otherwise obtain access, or
could not obtain access on terms that are as favorable. Our partners in these joint ventures historically have been land owners/developers, other homebuilders and financial or strategic partners. Joint ventures with land owners/developers have given us access to sites owned or controlled by our partners. Joint ventures with other homebuilders have provided us with the ability to bid jointly with our partners for large or expensive land parcels. Joint ventures with financial partners have allowed us to combine our homebuilding expertise with access to our partners’ capital. In certain of our unconsolidated joint ventures, we enter into loan agreements, whereby one of our subsidiaries will provide the lenders with customary guarantees, including completion, indemnity and environmental guarantees subject to usual non-recourse terms.
55
The following is a summary of investments in unconsolidated joint ventures:
As of December 31, | |||||||
(Dollars in thousands) | 2017 | 2016 | |||||
East | $ | 29,316 | $ | 25,923 | |||
Central | 32,874 | 30,146 | |||||
West | 126,559 | 98,625 | |||||
Mortgage Operations | 3,615 | 3,215 | |||||
Total | $ | 192,364 | $ | 157,909 | |||
Land Purchase and Land Option Contracts
We enter into land purchase and option contracts to procure land or lots for the construction of homes in the ordinary course of business. Lot option contracts enable us to control significant lot positions with a minimal capital investment and substantially reduce the risks associated with land ownership and development. As of December 31, 2017, we had outstanding land purchase and lot option contracts of $405.3 million for 5,037 lots. We are obligated to close the transaction under our land purchase contracts. However, our obligations with respect to the option contracts are generally limited to the forfeiture of the related non-refundable cash deposits and/or letters of credit provided to obtain the options.
ITEM 7A. QUANTITATIVE AND QUALITATIVE DISCLOSURES ABOUT MARKET RISK
Interest Rate Risk
Our operations are interest rate sensitive. We monitor our exposure to changes in interest rates and incur both fixed rate and variable rate debt. At December 31, 2017, 92.1% of our debt was fixed rate and 7.9% was variable rate. None of our market sensitive instruments were entered into for trading purposes. For fixed rate debt, changes in interest rates generally affect the fair value of the debt instrument, but not our earnings or cash flows. Conversely, for variable rate debt, changes in interest rates generally do not impact the fair value of the debt instrument but may affect our future earnings and cash flows, and may also impact our variable rate borrowing costs, which principally relate to any borrowings under our Revolving Credit Facility and to any borrowings by TMHF under its various warehouse facilities. As of December 31, 2017, we had no outstanding borrowings under our Revolving Credit Facility. We had $452.9 million of additional availability for borrowings and $152.9 million of additional availability for letters of credit (giving effect to $47.1 million of letters of credit outstanding as of such date). See Item 7 — Management’s Discussion and Analysis of Financial Conditions and Results of Operations — Liquidity and Capital Resources – Debt Instruments – Revolving Credit Facility. Our fixed rate debt is subject to a requirement that we offer to purchase the 2021 Senior Notes at par with certain proceeds of asset sales (to the extent not applied in accordance with the indenture governing such Senior Notes). We are also required to offer to purchase all of the outstanding Senior Notes at 101% of their aggregate principal amount upon the occurrence of specified change of control events. Other than in those circumstances, we do not have an obligation to prepay fixed rate debt prior to maturity and, as a result, we would not expect interest rate risk and changes in fair value to have a significant impact on our cash flows related to our fixed rate debt until such time as we are required to refinance, repurchase or repay such debt.
We are not materially exposed to interest rate risk associated with TMHF’s mortgage loan origination business, because at the time any loan is originated, TMHF has identified the investor who will agree to purchase the loan on the interest rate terms that are locked in with the borrower at the time the loan is originated.
The following table sets forth principal cash flows by scheduled maturity and effective weighted average interest rates and estimated fair value of our debt obligations as of December 31, 2017. The interest rate for our variable rate debt represents the interest rate on our borrowings under our Revolving Credit Facility and mortgage warehouse facilities. Because the mortgage warehouse facilities are effectively secured by certain mortgage loans held for sale which are typically sold within approximately 15-20 days, its outstanding balance is included as a variable rate maturity in the most current period presented.
56
Expected Maturity Date | Fair Value | ||||||||||||||||||||||||||||||
(Dollars in millions, except percentage data) | 2018 | 2019 | 2020 | 2021 | 2022 | Thereafter | Total | ||||||||||||||||||||||||
Fixed Rate Debt | $ | 86.1 | $ | 40.3 | $ | 5.3 | $ | 553.7 | $ | 1.0 | $ | 703.1 | $ | 1,389.5 | $ | 1,436.4 | |||||||||||||||
Weighted average interest rate (1) | 3.5 | % | 3.5 | % | 3.5 | % | 5.5 | % | 3.5 | % | 5.5 | % | 5.3 | % | — | % | |||||||||||||||
Variable rate debt (2) | $ | 118.8 | — | — | — | — | — | $ | 118.8 | $ | 118.8 | ||||||||||||||||||||
Average interest rate | 3.5 | % | — | % | — | % | — | % | — | % | — | % | 3.5 | % | — | % | |||||||||||||||
(1) | Represents the coupon rate of interest on the full principal amount of the debt. |
(2) | Based upon the amount of variable rate debt at December 31, 2017, and holding the variable rate debt balance constant, each 1% increase in interest rates would increase the interest incurred by us by approximately $1.2 million per year. |
ITEM 8. FINANCIAL STATEMENTS AND SUPPLEMENTARY DATA
TAYLOR MORRISON HOME CORPORATION
Page Number | |
Separate combined financial statements of our unconsolidated joint venture investments have been omitted because, if considered in the aggregate, they would not constitute a significant subsidiary as defined by Rule 3-09 of Regulation S-X.
57
REPORT OF INDEPENDENT REGISTERED PUBLIC ACCOUNTING FIRM
To the Stockholders and the Board of Directors of Taylor Morrison Home Corporation
Opinion on the Financial Statements
We have audited the accompanying consolidated balance sheets of Taylor Morrison Home Corporation and subsidiaries (the "Company") as of December 31, 2017 and 2016, the related consolidated statements of operations, comprehensive income, stockholders' equity, and cash flows, for each of the three years in the period ended December 31, 2017, and the related notes (collectively referred to as the "financial statements"). In our opinion, the financial statements present fairly, in all material respects, the financial position of the Company as of December 31, 2017 and 2016, and the results of its operations and its cash flows for each of the three years in the period ended December 31, 2017, in conformity with accounting principles generally accepted in the United States of America.
We have also audited, in accordance with the standards of the Public Company Accounting Oversight Board (United States) (PCAOB), the Company's internal control over financial reporting as of December 31, 2017, based on criteria established in Internal Control - Integrated Framework (2013) issued by the Committee of Sponsoring Organizations of the Treadway Commission and our report dated February 21, 2018, expressed an unqualified opinion on the Company's internal control over financial reporting.
Basis for Opinion
These financial statements are the responsibility of the Company's management. Our responsibility is to express an opinion on the Company's financial statements based on our audits. We are a public accounting firm registered with the PCAOB and are required to be independent with respect to the Company in accordance with the U.S. federal securities laws and the applicable rules and regulations of the Securities and Exchange Commission and the PCAOB.
We conducted our audits in accordance with the standards of the PCAOB. Those standards require that we plan and perform the audit to obtain reasonable assurance about whether the financial statements are free of material misstatement, whether due to error or fraud. Our audits included performing procedures to assess the risks of material misstatement of the financial statements, whether due to error or fraud, and performing procedures that respond to those risks. Such procedures included examining, on a test basis, evidence regarding the amounts and disclosures in the financial statements. Our audits also included evaluating the accounting principles used and significant estimates made by management, as well as evaluating the overall presentation of the financial statements. We believe that our audits provide a reasonable basis for our opinion.
/s/ DELOITTE & TOUCHE LLP
Phoenix, Arizona
February 21, 2018
We have served as the Company's auditor since 2011.
58
TAYLOR MORRISON HOME CORPORATION
CONSOLIDATED BALANCE SHEETS
(In thousands, except share amounts)
December 31, | |||||||
2017 | 2016 | ||||||
Assets | |||||||
Cash and cash equivalents | $ | 573,925 | $ | 300,179 | |||
Restricted cash | 1,578 | 1,633 | |||||
Total cash, cash equivalents, and restricted cash | 575,503 | 301,812 | |||||
Real estate inventory: | |||||||
Owned inventory | 2,956,709 | 3,010,967 | |||||
Real estate not owned under option agreements | 2,527 | 6,252 | |||||
Total real estate inventory | 2,959,236 | 3,017,219 | |||||
Land deposits | 49,768 | 37,233 | |||||
Mortgage loans held for sale | 187,038 | 233,184 | |||||
Derivative assets | 1,584 | 2,291 | |||||
Prepaid expenses and other assets, net | 72,334 | 73,425 | |||||
Other receivables, net | 94,488 | 115,246 | |||||
Investments in unconsolidated entities | 192,364 | 157,909 | |||||
Deferred tax assets, net | 118,138 | 206,634 | |||||
Property and equipment, net | 7,112 | 6,586 | |||||
Intangible assets, net | 2,130 | 3,189 | |||||
Goodwill | 66,198 | 66,198 | |||||
Total assets | $ | 4,325,893 | $ | 4,220,926 | |||
Liabilities | |||||||
Accounts payable | $ | 140,165 | $ | 136,636 | |||
Accrued expenses and other liabilities | 201,540 | 209,202 | |||||
Income taxes payable | 4,525 | 10,528 | |||||
Customer deposits | 132,529 | 111,573 | |||||
Senior notes, net | 1,239,787 | 1,237,484 | |||||
Loans payable and other borrowings | 139,453 | 150,485 | |||||
Revolving credit facility borrowings | — | — | |||||
Mortgage warehouse borrowings | 118,822 | 198,564 | |||||
Liabilities attributable to real estate not owned under option agreements | 2,527 | 6,252 | |||||
Total liabilities | 1,979,348 | 2,060,724 | |||||
COMMITMENTS AND CONTINGENCIES (Note 21) | |||||||
Stockholders’ Equity | |||||||
Class A common stock, $0.00001 par value, 400,000,000 shares authorized, 85,449,253 and 33,340,291 shares issued, 82,399,996 and 30,486,858 shares outstanding as of December 31, 2017 and December 31, 2016, respectively | 1 | — | |||||
Class B common stock, $0.00001 par value, 200,000,000 shares authorized, 37,179,616 and 88,942,052 shares issued and outstanding as of December 31, 2017 and December 31, 2016, respectively | — | 1 | |||||
Preferred stock, $0.00001 par value, 50,000,000 shares authorized, no shares issued and outstanding as of December 31, 2017 and December 31, 2016 | — | — | |||||
Additional paid-in capital | 1,341,873 | 384,709 | |||||
Treasury stock at cost; 3,049,257 and 2,853,433 shares as of December 31, 2017 and December 31, 2016, respectively | (47,622 | ) | (43,524 | ) | |||
Retained earnings | 319,833 | 228,613 | |||||
Accumulated other comprehensive loss | (17,968 | ) | (17,989 | ) | |||
Total stockholders’ equity attributable to Taylor Morrison Home Corporation | 1,596,117 | 551,810 | |||||
Non-controlling interests — joint ventures | 1,663 | 1,525 | |||||
Non-controlling interests — Principal Equityholders | 748,765 | 1,606,867 | |||||
Total stockholders’ equity | 2,346,545 | 2,160,202 | |||||
Total liabilities and stockholders’ equity | $ | 4,325,893 | $ | 4,220,926 | |||
59
See accompanying Notes to the Consolidated Financial Statements
60
TAYLOR MORRISON HOME CORPORATION
CONSOLIDATED STATEMENTS OF OPERATIONS
(In thousands, except per share amounts)
Year Ended December 31, | |||||||||||
2017 | 2016 | 2015 | |||||||||
Home closings revenue, net | $ | 3,799,061 | $ | 3,425,521 | $ | 2,889,968 | |||||
Land closings revenue | 17,093 | 64,553 | 43,770 | ||||||||
Mortgage operations revenue | 69,136 | 59,955 | 43,082 | ||||||||
Total revenues | 3,885,290 | 3,550,029 | 2,976,820 | ||||||||
Cost of home closings | 3,092,704 | 2,801,739 | 2,358,823 | ||||||||
Cost of land closings | 12,005 | 35,912 | 24,546 | ||||||||
Mortgage operations expenses | 41,652 | 32,099 | 25,536 | ||||||||
Total cost of revenues | 3,146,361 | 2,869,750 | 2,408,905 | ||||||||
Gross margin | 738,929 | 680,279 | 567,915 | ||||||||
Sales, commissions and other marketing costs | 259,663 | 239,556 | 198,676 | ||||||||
General and administrative expenses | 130,777 | 122,207 | 95,235 | ||||||||
Equity in income of unconsolidated entities | (8,846 | ) | (7,453 | ) | (1,759 | ) | |||||
Interest income, net | (577 | ) | (184 | ) | (192 | ) | |||||
Other expense, net | 2,256 | 11,947 | 11,634 | ||||||||
Loss on extinguishment of debt | — | — | 33,317 | ||||||||
Gain on foreign currency forward | — | — | (29,983 | ) | |||||||
Income from continuing operations before income taxes | 355,656 | 314,206 | 260,987 | ||||||||
Income tax provision | 179,006 | 107,643 | 90,001 | ||||||||
Net income from continuing operations | 176,650 | 206,563 | 170,986 | ||||||||
Discontinued operations: | |||||||||||
Transaction expenses from discontinued operations | — | — | (9,043 | ) | |||||||
Gain on sale of discontinued operations | — | — | 80,205 | ||||||||
Income tax expense from discontinued operations | — | — | (13,103 | ) | |||||||
Net income from discontinued operations | — | — | 58,059 | ||||||||
Net income before allocation to non-controlling interests | 176,650 | 206,563 | 229,045 | ||||||||
Net income attributable to non-controlling interests — joint ventures | (430 | ) | (1,294 | ) | (1,681 | ) | |||||
Net income before non-controlling interests — Principal Equityholders | 176,220 | 205,269 | 227,364 | ||||||||
Net income from continuing operations attributable to non-controlling interests — Principal Equityholders | (85,000 | ) | (152,653 | ) | (123,909 | ) | |||||
Net income from discontinued operations attributable to non-controlling interests — Principal Equityholders | — | — | (42,406 | ) | |||||||
Net income available to Taylor Morrison Home Corporation | $ | 91,220 | $ | 52,616 | $ | 61,049 | |||||
Earnings per common share — basic: | |||||||||||
Income from continuing operations | $ | 1.47 | $ | 1.69 | $ | 1.38 | |||||
Discontinued operations — net of tax | $ | — | $ | — | $ | 0.47 | |||||
Net income available to Taylor Morrison Home Corporation | $ | 1.47 | $ | 1.69 | $ | 1.85 | |||||
Earnings per common share — diluted: | |||||||||||
Income from continuing operations | $ | 1.47 | $ | 1.69 | $ | 1.38 | |||||
Discontinued operations — net of tax | $ | — | $ | — | $ | 0.47 | |||||
Net income available to Taylor Morrison Home Corporation | $ | 1.47 | $ | 1.69 | $ | 1.85 | |||||
Weighted average number of shares of common stock: | |||||||||||
Basic | 62,061 | 31,084 | 33,063 | ||||||||
Diluted | 120,915 | 120,832 | 122,384 | ||||||||
See accompanying Notes to the Consolidated Financial Statements
61
TAYLOR MORRISON HOME CORPORATION
CONSOLIDATED STATEMENTS OF COMPREHENSIVE INCOME
(In thousands)
Year Ended December 31, | |||||||||||
2017 | 2016 | 2015 | |||||||||
Income before non-controlling interests, net of tax | $ | 176,650 | $ | 206,563 | $ | 229,045 | |||||
Other comprehensive income/(loss), net of tax: | |||||||||||
Foreign currency translation adjustments, net of tax | — | — | (27,779 | ) | |||||||
Post-retirement benefits adjustments, net of tax | 21 | (244 | ) | 1,613 | |||||||
Other comprehensive income/(loss), net of tax | 21 | (244 | ) | (26,166 | ) | ||||||
Comprehensive income | 176,671 | 206,319 | 202,879 | ||||||||
Comprehensive income attributable to non-controlling interests — joint ventures | (430 | ) | (1,294 | ) | (1,681 | ) | |||||
Comprehensive income attributable to non-controlling interests — Principal Equityholders | (85,000 | ) | (152,401 | ) | (147,236 | ) | |||||
Comprehensive income available to Taylor Morrison Home Corporation | $ | 91,241 | $ | 52,624 | $ | 53,962 | |||||
See accompanying Notes to the Consolidated Financial Statements
62
TAYLOR MORRISON HOME CORPORATION
CONSOLIDATED STATEMENTS OF STOCKHOLDERS’ EQUITY
(In thousands, except share data)
Common Stock | ||||||||||||||||||||||||||||||||||||||||||||
Class A | Class B | Additional Paid-in Capital | Treasury Stock | Stockholders’ Equity | ||||||||||||||||||||||||||||||||||||||||
Shares | Amount | Shares | Amount | Amount | Shares | Amount | Retained Earnings | Accumulated Other Comprehensive (Loss) Income | Non-controlling Interest - Joint Venture | Non-controlling Interest - Principal Equityholders | Total Stockholders’ Equity | |||||||||||||||||||||||||||||||||
Balance — December 31, 2014 | 33,060,540 | — | 89,227,416 | 1 | 374,358 | — | — | 114,948 | (10,910 | ) | 6,528 | 1,292,236 | 1,777,161 | |||||||||||||||||||||||||||||||
Net income | — | — | — | — | — | — | — | 61,049 | — | 1,681 | 166,315 | 229,045 | ||||||||||||||||||||||||||||||||
Other comprehensive (loss) income | — | — | — | — | — | — | — | — | (7,087 | ) | — | (19,079 | ) | (26,166 | ) | |||||||||||||||||||||||||||||
Exchange of New TMM Units and corresponding number of Class B Common Stock | 87,055 | — | (87,055 | ) | — | — | — | — | — | — | — | — | — | |||||||||||||||||||||||||||||||
Cancellation of forfeited New TMM Units and corresponding number of Class B Common Stock | — | — | (31,792 | ) | — | — | — | — | — | — | — | — | — | |||||||||||||||||||||||||||||||
Issuance of restricted stock units, net of shares withheld for tax | 11,260 | — | — | — | — | — | — | — | — | — | — | — | ||||||||||||||||||||||||||||||||
Repurchase of Class A common stock | (934,434 | ) | — | — | — | — | 934,434 | (14,981 | ) | — | — | — | — | (14,981 | ) | |||||||||||||||||||||||||||||
Stock based compensation | — | — | — | — | 2,540 | — | — | — | — | — | 6,889 | 9,429 | ||||||||||||||||||||||||||||||||
Changes in non-controlling interest in consolidated joint ventures | — | — | — | — | — | — | — | — | — | (1,811 | ) | — | (1,811 | ) | ||||||||||||||||||||||||||||||
Balance — December 31, 2015 | 32,224,421 | — | 89,108,569 | 1 | 376,898 | 934,434 | (14,981 | ) | 175,997 | (17,997 | ) | 6,398 | 1,446,361 | 1,972,677 | ||||||||||||||||||||||||||||||
Net income | — | — | — | — | — | — | — | 52,616 | — | 1,294 | 152,653 | 206,563 | ||||||||||||||||||||||||||||||||
Other comprehensive (loss) income | — | — | — | — | — | — | — | — | 8 | — | (252 | ) | (244 | ) | ||||||||||||||||||||||||||||||
Exchange of New TMM Units and corresponding number of Class B Common Stock | 159,863 | — | (159,863 | ) | — | — | — | — | — | — | — | — | — | |||||||||||||||||||||||||||||||
Cancellation of forfeited New TMM Units and corresponding number of Class B Common Stock | — | — | (6,654 | ) | — | — | — | — | — | — | — | — | — | |||||||||||||||||||||||||||||||
Exercise of stock options | 7,786 | — | — | — | 146 | — | — | — | — | — | — | 146 | ||||||||||||||||||||||||||||||||
Issuance of restricted stock units, net of shares withheld for tax | 13,787 | — | — | — | — | — | — | — | — | — | — | — | ||||||||||||||||||||||||||||||||
Repurchase of common stock | (1,918,999 | ) | — | — | — | — | 1,918,999 | (28,543 | ) | — | — | — | — | (28,543 | ) | |||||||||||||||||||||||||||||
Stock based compensation | — | — | — | — | 2,807 | — | — | — | — | — | 8,105 | 10,912 | ||||||||||||||||||||||||||||||||
Changes in non-controlling interest in consolidated joint ventures | — | — | — | — | 4,858 | — | — | — | — | (6,167 | ) | — | (1,309 | ) | ||||||||||||||||||||||||||||||
Balance — December 31, 2016 | 30,486,858 | — | 88,942,052 | 1 | 384,709 | 2,853,433 | (43,524 | ) | 228,613 | (17,989 | ) | 1,525 | 1,606,867 | 2,160,202 | ||||||||||||||||||||||||||||||
Net income | — | — | — | — | — | — | — | 91,220 | — | 430 | 85,000 | 176,650 | ||||||||||||||||||||||||||||||||
Other comprehensive (loss) income | — | — | — | — | — | — | — | — | 21 | — | — | 21 | ||||||||||||||||||||||||||||||||
Exchange of New TMM Units and corresponding number of Class B Common Stock | 260,389 | — | (260,389 | ) | — | — | — | — | — | — | — | — | — | |||||||||||||||||||||||||||||||
63
Cancellation of forfeited New TMM Units and corresponding number of Class B Common Stock | — | — | (2,047 | ) | — | — | — | — | — | — | — | — | — | |||||||||||||||||||||||||||||||
Exercise of stock options | 288,808 | — | — | — | 5,235 | — | — | — | — | — | — | 5,235 | ||||||||||||||||||||||||||||||||
Issuance of restricted stock units, net of shares withheld for tax | 59,765 | — | — | — | (307 | ) | — | — | — | — | — | — | (307 | ) | ||||||||||||||||||||||||||||||
Repurchase of common stock | (195,824 | ) | — | — | — | — | 195,824 | (4,098 | ) | — | — | — | — | (4,098 | ) | |||||||||||||||||||||||||||||
Exchange of (repurchase) of B shares from secondary offerings | 51,500,000 | 1 | — | — | 946,430 | — | — | — | — | — | — | 946,431 | ||||||||||||||||||||||||||||||||
Repurchase of New TMM Units from principal equityholders | — | — | (51,500,000 | ) | (1 | ) | — | — | — | — | — | — | (948,883 | ) | (948,884 | ) | ||||||||||||||||||||||||||||
Stock based compensation | — | — | — | — | 5,806 | — | — | — | — | — | 5,781 | 11,587 | ||||||||||||||||||||||||||||||||
Changes in non-controlling interest in consolidated joint ventures | — | — | — | — | — | — | — | — | — | (292 | ) | — | (292 | ) | ||||||||||||||||||||||||||||||
Balance — December 31, 2017 | 82,399,996 | $ | 1 | 37,179,616 | $ | — | $ | 1,341,873 | 3,049,257 | $ | (47,622 | ) | $ | 319,833 | $ | (17,968 | ) | $ | 1,663 | $ | 748,765 | $ | 2,346,545 | |||||||||||||||||||||
See accompanying Notes to the Consolidated Financial Statements
64
TAYLOR MORRISON HOME CORPORATION
CONSOLIDATED STATEMENTS OF CASH FLOWS
(In thousands)
For the Year ended December 31, | |||||||||||
2017 | 2016 | 2015 | |||||||||
CASH FLOWS FROM OPERATING ACTIVITIES: | |||||||||||
Net income before allocation to non-controlling interests | $ | 176,650 | $ | 206,563 | $ | 229,045 | |||||
Adjustments to reconcile net income to net cash provided by (used in) operating activities: | |||||||||||
Equity in income of unconsolidated entities | (8,846 | ) | (7,453 | ) | (1,759 | ) | |||||
Stock compensation expense (1) | 11,587 | 10,912 | 7,891 | ||||||||
Loss on extinguishment of debt | — | — | 33,317 | ||||||||
Distributions of earnings from unconsolidated entities | 6,965 | 4,261 | 2,204 | ||||||||
Depreciation and amortization | 3,953 | 3,972 | 4,107 | ||||||||
Debt issuance costs amortization | 3,819 | 3,843 | 4,442 | ||||||||
Net income from discontinued operations | — | — | (58,059 | ) | |||||||
Gain on foreign currency forward | — | — | (29,983 | ) | |||||||
Contingent consideration | 736 | 3,838 | 4,200 | ||||||||
Deferred income taxes | 88,496 | 26,854 | 24,702 | ||||||||
Inventory impairments | — | 3,473 | — | ||||||||
Changes in operating assets and liabilities: | |||||||||||
Real estate inventory and land deposits | 41,723 | 166,343 | (424,607 | ) | |||||||
Mortgages held for sale, prepaid expenses and other assets | 67,186 | (21,052 | ) | (69,650 | ) | ||||||
Customer deposits | 20,956 | 18,791 | 19,961 | ||||||||
Accounts payable, accrued expenses and other liabilities | (20,989 | ) | (20,479 | ) | 2,996 | ||||||
Income taxes payable | (6,003 | ) | (27,264 | ) | (11,495 | ) | |||||
Net cash provided by (used in) operating activities | 386,233 | 372,602 | (262,688 | ) | |||||||
CASH FLOWS FROM INVESTING ACTIVITIES: | |||||||||||
Purchase of property and equipment | (3,421 | ) | (1,908 | ) | (4,298 | ) | |||||
Payments for business acquisitions | — | (52,819 | ) | (225,800 | ) | ||||||
Distribution from unconsolidated entities | 4,083 | 6,087 | 10,063 | ||||||||
Investments of capital into unconsolidated entities | (36,657 | ) | (32,357 | ) | (28,664 | ) | |||||
Proceeds from sale of discontinued operations | — | — | 268,853 | ||||||||
Proceeds from settlement of foreign currency forward, net | — | — | 29,983 | ||||||||
Net cash (used in) provided by investing activities | (35,995 | ) | (80,997 | ) | 50,137 | ||||||
CASH FLOWS FROM FINANCING ACTIVITIES: | |||||||||||
Increase in loans payable and other borrowings | 21,621 | 33,360 | 51,909 | ||||||||
Repayments of loans payable and other borrowings | (16,511 | ) | (17,935 | ) | (64,601 | ) | |||||
Borrowings on revolving credit facility | — | 255,000 | 480,000 | ||||||||
Payments on revolving credit facility | — | (370,000 | ) | (405,000 | ) | ||||||
Borrowings on mortgage warehouse | 838,172 | 1,200,449 | 910,516 | ||||||||
Repayment on mortgage warehouse | (917,914 | ) | (1,185,329 | ) | (887,822 | ) | |||||
Proceeds from the issuance of senior notes | — | — | 350,000 | ||||||||
Repayments on senior notes | — | — | (513,608 | ) | |||||||
Payment of deferred financing costs | — | — | (4,538 | ) | |||||||
Payment of contingent consideration | — | (3,100 | ) | (3,050 | ) | ||||||
Proceeds from stock option exercises | 5,235 | 146 | — | ||||||||
Proceeds from issuance of shares from secondary offerings | 1,111,806 | — | — | ||||||||
Repurchase of common stock, net | (4,098 | ) | (28,543 | ) | (15,000 | ) | |||||
Repurchase of shares from principal equity holders | (1,114,259 | ) | — | — | |||||||
Payment of taxes related to net share settlement of equity awards | (307 | ) | — | — | |||||||
Distributions to non-controlling interests of consolidated joint ventures, net | (292 | ) | (1,309 | ) | (1,811 | ) | |||||
Net cash used in financing activities | (76,547 | ) | (117,261 | ) | (103,005 | ) | |||||
EFFECT OF EXCHANGE RATE CHANGES ON CASH AND CASH EQUIVALENTS | — | — | (20,491 | ) | |||||||
65
NET INCREASE/(DECREASE) IN CASH AND CASH EQUIVALENTS | $ | 273,691 | $ | 174,344 | $ | (336,047 | ) | ||||
CASH, CASH EQUIVALENTS, AND RESTRICTED CASH — Beginning of period (2) | 301,812 | 127,468 | 463,515 | ||||||||
CASH, CASH EQUIVALENTS, AND RESTRICTED CASH — End of period | $ | 575,503 | $ | 301,812 | $ | 127,468 | |||||
SUPPLEMENTAL CASH FLOW INFORMATION: | |||||||||||
Income taxes paid, net | $ | (96,525 | ) | $ | (107,961 | ) | $ | (90,764 | ) | ||
SUPPLEMENTAL NON-CASH INVESTING AND FINANCING ACTIVITIES: | |||||||||||
Change in loans payable issued to sellers in connection with land purchase contracts | $ | 66,985 | $ | 63,075 | $ | 16,470 | |||||
Change in inventory not owned | $ | (3,725 | ) | $ | (1,669 | ) | $ | 1,223 | |||
Original accrual of contingent consideration for business combinations | $ | — | $ | 380 | $ | 3,200 | |||||
Non-cash portion of loss on debt extinguishment | $ | — | $ | — | $ | 5,102 | |||||
(1) Stock compensation expense shown here is exclusive of stock compensation expense related to discontinued operations.
(2) Cash and cash equivalents shown here include the cash of Monarch Corporation. For the year ended December 31, 2014, cash held at Monarch was $227,988.
See accompanying Notes to the Consolidated Financial Statements
66
TAYLOR MORRISON HOME CORPORATION
NOTES TO THE CONSOLIDATED FINANCIAL STATEMENTS
1. BUSINESS
Organization and Description of the Business — Taylor Morrison Home Corporation (referred to herein as “TMHC,” “we,” “our,” “the Company” and “us”), through its subsidiaries, owns and operates a residential homebuilding business and is a developer of lifestyle communities. As of December 31, 2017 we operated in Arizona, California, Colorado, Florida, Georgia, Illinois, North Carolina, and Texas. Our Company serves a wide array of consumer groups from coast to coast, including first time, move-up, luxury, and active adult. As of December 31, 2017, our homebuilding company operates under our Taylor Morrison and Darling Homes brand names. Our business is organized into multiple homebuilding operating components, and a mortgage operating component, all of which are managed as four reportable segments: East, Central, West, and Mortgage Operations. The communities in our homebuilding segments offer single family attached and detached homes. We are the general contractors for all real estate projects and retain subcontractors for home construction and site development. Our Mortgage Operations reportable segment provides financial services to customers through our wholly owned mortgage subsidiary, operating as Taylor Morrison Home Funding, LLC (“TMHF”), and title services through our wholly owned title services subsidiary, Inspired Title Service, LLC (“Inspired Title”).
During the quarter ended March 31, 2017, we realigned our homebuilding operating divisions within our existing segments based on geographic location and management's long term strategic plans, however our reporting segments remained unchanged. As a result, all historical periods presented in the segment information have been reclassified to give effect to this segment realignment. See Note 19 – Operating and Reporting Segments for further information.
On April 12, 2013, TMHC completed the initial public offering (the “IPO”) of its Class A common stock, par value $0.00001 per share (the “Class A Common Stock”). The shares of Class A Common Stock began trading on the New York Stock Exchange on April 10, 2013 under the ticker symbol “TMHC.” As a result of the completion of the IPO and a series of transactions pursuant to a Reorganization Agreement dated as of April 9, 2013 (the “Reorganization Transactions”), TMHC became the indirect parent of TMM Holdings Limited Partnership (“TMM Holdings”) (an entity formed by a consortium comprised of affiliates of TPG Global, LLC (the “TPG Entities” or “TPG”) , investment funds managed by Oaktree Capital Management, L.P. (“Oaktree”) or their respective subsidiaries (the “Oaktree Entities”), and affiliates of JH Investments, Inc. (the “JH Entities” and, together with the TPG Entities and Oaktree Entities, the “Principal Equityholders”) through the formation of TMM Holdings II Limited Partnership (“New TMM”). In the Reorganization Transactions, the TPG Entities and the Oaktree Entities each formed new holding vehicles to hold interests in New TMM (the “TPG Holding Vehicle” and the “Oaktree Holding Vehicle” respectively). As of December 31, 2017 and 2016, the Principal Equityholders owned 31.1% and 74.5%, respectively of the Company. JH Investments owned 0.0% following our public offering completed on February 6, 2017. See Note 14 - Stockholders' Equity for a discussion of the series of public offerings. See Note 23 - Subsequent Events for changes to this ownership subsequent to December 31, 2017.
2. SUMMARY OF SIGNIFICANT ACCOUNTING POLICIES
Basis of Presentation and Consolidation — The accompanying Consolidated Financial Statements have been prepared in accordance with generally accepted accounting principles in the United States (“GAAP”), include the accounts of TMHC and its consolidated subsidiaries, other entities where we have a controlling financial interest, and certain consolidated variable interest entities. Intercompany balances and transactions have been eliminated in consolidation.
Unless otherwise stated, amounts are shown in U.S. dollars. Assets and liabilities recorded in foreign currencies are translated at the exchange rate on the balance sheet date, and revenues and expenses are translated at average rates of exchange prevailing during the period. Translation adjustments resulting from this process are recorded to accumulated other comprehensive income (loss) in the accompanying Consolidated Balance Sheets, Statements of Stockholders’ Equity, and Consolidated Statements of Comprehensive Income.
Discontinued Operations — As a result of our decision in December 2014 to divest of Monarch Corporation (“Monarch”), our former Canadian operating segment, the operating results and financial position of the Monarch business are presented as discontinued operations for the year ended December 31, 2015. Refer to Note 5 – Discontinued Operations for further information regarding Monarch.
67
Non-controlling interests — In connection with the Reorganization Transactions consummated at the time of the Company's IPO, the Company became the sole owner of the general partner of New TMM. As the general partner of New TMM, the Company exercises exclusive and complete control over New TMM. Consequently, the Company consolidates New TMM and records a non-controlling interest in the Consolidated Balance Sheets for the economic interests in New TMM, that are directly or indirectly held by the Principal Equityholders or by members of management and the Board of Directors. Refer to Note 23 – Subsequent Events for discussion regarding Principal Equityholders ownership subsequent to December 31, 2017.
Joint Ventures — We consolidate certain joint ventures in accordance with Accounting Standards Codification (“ASC”) Topic 810, “Consolidation.” The income from the percentage of the joint venture not owned by us is presented as “Net income attributable to non-controlling interests - joint ventures” on the Consolidated Statements of Operations.
Reclassifications — Prior period amounts for cash, cash equivalents, and restricted cash on the Consolidated Statements of Cash Flows have been reclassified to conform with current period financial statement presentation as a result of adopting Accounting Standards Update (“ASU”) 2016-18, Statement of Cash Flows (Topic 230): Restricted Cash.
Business Combinations — Acquisitions are accounted for in accordance with ASC Topic 805-10, Business Combinations. In connection with our acquisitions, we determined we obtained control of a business and inputs, processes and outputs in exchange for cash and other consideration. All material assets and liabilities, including contingent consideration, were measured and recognized at fair value as of the date of the acquisition to reflect the purchase price paid, which resulted in goodwill for each transaction. Refer to Note 3 - Business Combinations for further information regarding the purchase price allocation and related acquisition accounting.
Use of Estimates — The preparation of financial statements in accordance with GAAP requires us to make estimates and assumptions that affect the amounts reported in the Consolidated Financial Statements and accompanying notes. Significant estimates include real estate development costs to complete, valuation of real estate, valuation of acquired assets, valuation of goodwill, valuation of equity awards, valuation allowance on deferred tax assets and reserves for warranty and self-insured risks. Actual results could differ from those estimates.
Concentration of Credit Risk — Financial instruments that potentially subject us to concentrations of credit risk are primarily cash and cash equivalents and mortgage borrowings. Cash and cash equivalents include amounts on deposit with financial institutions in the U.S. that are in excess of the Federal Deposit Insurance Corporation federally insured limits of up to $250,000. No losses have been experienced to date.
In addition, the Company is exposed to credit risk to the extent that mortgage and loan borrowers may fail to meet their contractual obligations. This risk is mitigated by collateralizing the mortgaged property or land that was sold to the buyer.
Cash and Cash Equivalents — Cash and cash equivalents consist of cash on hand, demand deposits with financial institutions, and investments with original maturities of 90 days or less. At December 31, 2017, the majority of our cash and cash equivalents were invested in both highly liquid and high-quality money market funds or on deposit with major financial institutions.
Restricted Cash — For both years ended December 31, 2017 and 2016, restricted cash consisted of cash pledged to collateralize mortgage credit lines.
Real Estate Inventory — Inventory consists of raw land, land under development, homes under construction, completed homes, and model homes, which are stated at cost. In addition to direct carrying costs, we also capitalize interest, real estate taxes, and related development costs that benefit the entire community, such as field construction supervision and related direct overhead. Home vertical construction costs are accumulated and charged to cost of sales at the time of home closing using the specific identification method. Land acquisition, development, interest, real estate taxes and overhead are allocated to homes and units using the relative sales value method. These costs are capitalized to inventory from the point development begins to the point construction is completed. Changes in estimated costs to be incurred in a community are generally allocated to the remaining lots on a prospective basis. For those communities that have been temporarily closed or development has been discontinued, we do not allocate interest or other costs to the community’s inventory until activity resumes. Such costs are expensed as incurred.
The life cycle of a typical community generally ranges from two to five years, commencing with the acquisition of unentitled or entitled land, continuing through the land development phase and concluding with the sale, construction and delivery of homes. Actual community duration will vary based on the size of the community, the sales absorption rate and whether we purchased the property as raw land or as finished lots.
68
We capitalize qualifying interest costs to inventory during the development and construction periods. Capitalized interest is charged to cost of sales when the related inventory is delivered or when the related inventory is charged to cost of sales.
We assess the recoverability of our inventory in accordance with the provisions of Accounting Standards Codification (“ASC”) Topic 360, “Property, Plant, and Equipment.” We review our real estate inventory for indicators of impairment by community during each reporting period. If indicators of impairment are present for a community, we first perform an undiscounted cash flow analysis to determine if the carrying value of the assets exceeds the undiscounted cash flows. Generally, if the carrying value of the assets exceeds their estimated undiscounted cash flows, then the assets are deemed to be impaired and are recorded at fair value as of the assessment date. Our determination of fair value is based on a discounted cash flow model which includes projections and estimates relating to sales prices, construction costs, sales pace, and other factors. Changes in these expectations may lead to a change in the outcome of our impairment analysis, and actual results may also differ from our assumptions. For the years ended December 31, 2017 and 2015 no impairment charges were recorded. During the year ended December 31, 2016, we recorded $3.5 million of impairment charges in Cost of home closings on the Consolidated Statement of Operations, for certain assets in our East reporting segment as a result of increases in development costs.
In certain cases, we may elect to cease development and/or marketing of an existing community if we believe the economic performance of the community would be maximized by deferring development for a period of time to allow for market conditions to improve. The decision may be based on financial and/or operational metrics as determined by us. If we decide to cease developing a project, we will evaluate the project for impairment and then cease future development and marketing activity until such a time when we believe that market conditions have improved and economic performance can be maximized. Our assessment of the carrying value of our assets typically includes subjective estimates of future performance, including the timing of when development will recommence, the type of product to be offered, and the margin to be realized. In the future, some of these inactive communities may be re-opened while others may be sold. As of December 31, 2017, we had two inactive projects with a carrying value of $10.7 million in the West segment. There are no inactive projects in our Central or East segments.
In the ordinary course of business, we enter into various specific performance agreements to acquire lots. Real estate not owned under these agreements is consolidated into real estate inventory with a corresponding liability in liabilities attributable to real estate not owned under option agreements in the Consolidated Balance Sheets.
Land Deposits — We provide deposits related to land options and land purchase contracts, which are capitalized when paid and classified as land deposits until the associated property is purchased. To the extent the deposits are non-refundable, they are charged to expense if the land acquisition process is terminated or no longer determined probable. We review the likelihood of the acquisition of contracted lots in conjunction with our periodic real estate inventory impairment analysis. Non-refundable deposits are recorded as a real estate inventory in the accompanying Consolidated Balance Sheets at the time the deposit is applied to the acquisition price of the land based on the terms of the underlying agreements.
Mortgage Loans Held for Sale — Mortgage loans held for sale consists of mortgages due from buyers of Taylor Morrison homes that are financed through our mortgage finance subsidiary, TMHF. Mortgage loans held for sale are carried at fair value, which is calculated using observable market information, including pricing from actual market transactions, investor commitment prices, or broker quotations. The fair value for mortgage loans held for sale covered by investor commitments is generally based on commitment prices. The fair value for mortgage loans held for sale not committed to be purchased by an investor is generally based on current delivery prices using best execution pricing.
Derivative Assets — We are exposed to interest rate risk for interest rate lock commitments (“IRLCs”) and mortgage loans held for sale originated until those loans are sold in the secondary market. The price risk related to changes in the fair value of IRLCs and mortgage loans held for sale not committed to be purchased by investors are subject to change primarily due to changes in market interest rates. We manage the interest rate and price risk associated with our outstanding IRLC's and mortgage loans held for sale not committed to be purchased by investors by entering into hedging instruments such as forward loan sales commitments and mandatory delivery commitments. We expect these instruments will experience changes in fair value inverse to changes in the fair value of the IRLCs and mortgage loans held for sale not committed to investors, thereby reducing earnings volatility. Best effort sale commitments are also executed for certain loans at the time the IRLC is locked with the borrower. The fair value of the best effort IRLC and mortgages receivable are valued using the commitment price to the investor. We take into account various factors and strategies in determining what portion of the IRLCs and mortgage loans held for sale to economically hedge. FASB ASC 815-25 Derivatives and Hedging, requires that all hedging instruments be recognized as assets or liabilities on the balance sheet at their fair value. We do not meet the criteria for hedge accounting, therefore, we account for these instruments as free-standing derivatives, with changes in fair value recognized in mortgage operations revenue/expenses on the statement of operations in the period in which they occur.
69
Prepaid Expenses and Other Assets, net — Prepaid expenses and other assets consist of the following:
As of December 31, | |||||||
(Dollars in thousands) | 2017 | 2016 | |||||
Prepaid expenses | $ | 53,439 | $ | 59,372 | |||
Other assets | 18,895 | 14,053 | |||||
Total prepaid expenses and other assets, net | $ | 72,334 | $ | 73,425 | |||
Prepaid expenses consist primarily of sales commissions, sales presentation centers and model home costs, such as design fees and furniture, and the unamortized issuance costs for the Revolving Credit Facility. Prepaid sales commissions are recorded on pre-closing sales activities, which are recognized on the ultimate closing of the units to which they relate. The model home and sales presentation centers costs are paid in advance and amortized over the life of the project on a per-unit basis, or a maximum of three years. Other assets consist primarily of various operating and escrow deposits, pre-acquisition costs and other deferred costs.
Other Receivables, net — Other receivables primarily consist of amounts expected to be recovered from various community development, municipality, and utility districts and utility deposits. Allowances are maintained for potential losses based on historical experience, present economic conditions, and other factors considered relevant. Allowances are recorded in other expense, net, when it becomes likely that some amount will not be collectible. Other receivables are written off when it is determined that collection efforts will no longer be pursued. Allowances at December 31, 2017 and 2016 were immaterial.
Investments in Consolidated and Unconsolidated Entities
Consolidated Joint Ventures and Option Agreements — In the ordinary course of business, we participate in strategic land development and homebuilding joint ventures with third parties. The use of these entities, in some instances, enables us to acquire land to which we could not otherwise obtain access, or could not obtain access on terms that are as favorable. Some of these ventures develop land for the sole use of the venture participants and others develop land for sale to the joint venture participants and to unrelated builders. In addition, we are involved with third parties who are involved in land development and homebuilding activities, including home sales. We review such contracts to determine whether they are a variable interest entity (“VIE”). In accordance with ASC Topic 810, “Consolidation,” for each VIE, we assess whether we are the primary beneficiary by first determining if we have the ability to control the activities of the VIE that most significantly affect its economic performance. Such activities include, but are not limited to, the ability to determine the budget and scope of land development work, if any; the ability to control financing decisions for the VIE; the ability to acquire additional land into the VIE or dispose of land in the VIE not under contract with us; and the ability to change or amend the existing option contract with the VIE. If we are not able to control such activities, we are not considered the primary beneficiary of the VIE. If we do have the ability to control such activities, we continue our analysis to determine if we are expected to absorb a potentially significant amount of the VIE’s losses or, if no party absorbs the majority of such losses, if we will potentially benefit from a significant amount of the VIE’s expected returns. For these entities in which we are expected to absorb the losses or benefits, we consolidate the results in the accompanying Consolidated Financial Statements.
Unconsolidated Joint Ventures — We use the equity method of accounting for entities over which we exercise significant influence but do not have a controlling interest over the operating and financial policies of the investee. For unconsolidated entities in which we function as the managing member, we have evaluated the rights held by our joint venture partners and determined that they have substantive participating rights that preclude the presumption of control. For joint ventures accounted for using the equity method, our share of net earnings or losses is included in equity in income of unconsolidated entities when earned and distributions are credited against our investment in the joint venture when received. Our share of the joint venture profit relating to lots we purchase from the joint ventures is deferred until homes are delivered by us and title passes to a third party. These joint ventures are recorded in investments in unconsolidated entities on the Consolidated Balance Sheets.
We evaluate our investments in unconsolidated entities for indicators of impairment semi-annually. A series of operating losses of an investee or other factors may indicate that a decrease in value of our investment in the unconsolidated entity has occurred which is other-than-temporary. The amount of impairment recognized is the excess of the investment’s carrying amount over its estimated fair value. Additionally, we consider various qualitative factors to determine if a decrease in the value of the investment is other-than-temporary. These factors include age of the venture, stage in its life cycle, intent and ability for us to recover our investment in the entity, financial condition and long-term prospects of the entity, short-term liquidity needs of the
70
unconsolidated entity, trends in the general economic environment of the land, entitlement status of the land held by the unconsolidated entity, overall projected returns on investment, defaults under contracts with third parties (including bank debt), recoverability of the investment through future cash flows and relationships with the other partners. If the Company believes that the decline in the fair value of the investment is temporary, then no impairment is recorded. We did not record any impairment charges for the years ended December 31, 2017, 2016 or 2015.
Income Taxes — We account for income taxes in accordance with ASC Topic 740, “Income Taxes.” Deferred tax assets and liabilities are recorded based on future tax consequences of temporary differences between the amounts reported for financial reporting purposes and the amounts deductible for income tax purposes, and are measured using enacted tax rates expected to apply in the years in which the temporary differences are expected to be recovered or settled. The effect on deferred tax assets and liabilities of a change in tax rates is recognized in earnings in the period when the changes are enacted. As a result of the Tax Cuts and Jobs Act (“Tax Act”) enacted on December 22, 2017, we have recorded a material charge to earnings in the period ending December 31, 2017. See Note 13 - Income Taxes for additional details.
We periodically assess our deferred tax assets, including the benefit from net operating losses, to determine if a valuation allowance is required. A valuation allowance is established when, based upon available evidence, it is more likely than not that all or a portion of the deferred tax assets will not be realized. Realization of the deferred tax assets is dependent upon, among other matters, taxable income in prior years available for carryback, estimates of future income, tax planning strategies, and reversal of existing temporary differences.
Property and Equipment, net — Property and equipment are recorded at cost, less accumulated depreciation. Depreciation is generally computed using the straight-line basis over the estimated useful lives of the assets as follows:
Buildings: 20 – 40 years
Building and leasehold improvements: 10 years or remaining life of building/lease term if less than 10 years
Information systems: over the term of the license
Furniture, fixtures and computer and equipment: 5 – 7 years
Model and sales office improvements: lesser of 3 years or the life of the community
Maintenance and repair costs are expensed as incurred.
Depreciation expense was $2.8 million, 2.9 million, and $3.3 million, respectively, for the years ended ended December 31, 2017, 2016, and 2015 . Depreciation expense is recorded in general and administrative expenses in the accompanying Consolidated Statements of Operations.
Intangible Assets, net — Intangible assets consist of tradenames, lot options contracts and land supplier relationships, and non-compete covenants. We sell our homes under the Taylor Morrison and Darling Homes trade names. The fair value of acquired intangible assets was determined using the income approach, and are amortized on a straight line basis from three to ten years.
Goodwill — The excess of the purchase price of a business acquisition over the net fair value of assets acquired and liabilities assumed is capitalized as goodwill in accordance with ASC Topic 350, “Intangibles — Goodwill and Other.”
ASC 350 requires that goodwill and intangible assets that do not have finite lives not be amortized, but rather assessed for impairment at least annually or more frequently if certain impairment indicators are present. We perform our annual impairment test during the fourth quarter or whenever impairment indicators are present. For the year ended December 31, 2017, there was no change in the amount of goodwill. For the year ended December 31, 2016 there were $8.5 million of additions to goodwill due to our acquisition of Acadia Homes. There was no impairment of goodwill for the years ended December 31, 2017, 2016, and 2015.
Insurance Costs, Self-Insurance Reserves and Warranty Reserves — We have certain deductible limits under our workers’ compensation, automobile, and general liability insurance policies, and we record expense and liabilities for the estimated costs of potential claims for construction defects. The excess liability limits are $50 million per occurrence, aggregated annually and applied in excess of automobile liability, employer’s liability under workers compensation and general liability policies. We also generally require our subcontractors and design professionals to indemnify us and provide evidence of insurance for liabilities arising from their work, subject to certain limitations. We are the parent of Beneva Indemnity Company (“Beneva”), which provides insurance coverage for construction defects discovered up to ten years following the close of a home, coverage for premise operations risk, and property coverage. We accrue for the expected costs associated with the deductibles and self-insured amounts under our various insurance policies based on historical claims, estimates for claims incurred but not reported, and potential for recovery of costs from insurance and other sources. The estimates are subject to significant variability due to
71
factors, such as claim settlement patterns, litigation trends, and the extended period of time in which a construction defect claim might be made after the closing of a home.
We offer warranties on homes that generally provide a limited warranty to cover various defects in workmanship or materials, including structural defects. Warranty reserves are established as homes close in an amount estimated to be adequate to cover expected costs of materials and outside labor during warranty periods. Our warranty is not considered a separate deliverable in the arrangement, therefore, it is accounted for in accordance with ASC Topic 450, “Contingencies,” which states that warranties that are not separately priced are generally accounted for by accruing the estimated costs to fulfill the warranty obligation. The amount of revenue related to the product is recognized in full upon the delivery if all other criteria for revenue recognition have been met. Thus, the warranty would not be considered a separate deliverable in the arrangement since it is not priced apart from the home. As a result, we accrue the estimated costs to fulfill the warranty obligation at the time a home closes, as a component of cost of home closings.
Our reserves are based on factors that include an actuarial study for structural, historical and anticipated claims, trends related to similar product types, number of home closings, and geographical areas. We also provide third-party warranty coverage on homes where required by Federal Housing Administration or Veterans Administration lenders. Reserves are recorded in accrued expenses and other liabilities on our Consolidated Balance Sheets.
Non-controlling Interests — Principal Equityholders — Immediately prior to our IPO, as part of the Reorganization Transactions, the existing holders of limited partnership interests of TMM Holdings exchanged their limited partnership interests for limited partnership interests of New TMM (“New TMM Units”). For each New TMM Unit received in the exchange, the holders of New TMM Units also received a corresponding number of shares of our Class B Common Stock (the “Class B Common Stock”). Our Class B Common Stock has voting rights but no economic rights. One share of Class B Common Stock, together with one New TMM Unit, is exchangeable into one share of our Class A Common Stock in accordance with the terms of the Exchange Agreement, dated as of April 9, 2013, among the Company, New TMM and the holders of Class B Common Stock and New TMM Units. See Note 23 - Subsequent Events for changes to ownership subsequent to December 31, 2017.
Stock Based Compensation — We have stock options, performance based restricted stock units and non-performance-based restricted stock units which we account for in accordance with ASC Topic 718-10, “Compensation — Stock Compensation.” The fair value for stock options is measured and estimated on the date of grant using the Black-Scholes option pricing model and recognized evenly over the vesting period of the options. Performance-based restricted stock units are measured using the closing price on the date of grant and expensed using a probability of attainment calculation which determines the likelihood of achieving the performance targets. Non-performance-based restricted stock units are time based awards and measured using the closing price on the date of grant and are expensed ratably over the vesting period on a straight-line basis.
Treasury Stock — We account for treasury stock in accordance with ASC Topic 505-30, “Equity - Treasury Stock.” Repurchased shares are reflected as a reduction in Stockholders' Equity and subsequent sale of repurchased shares are recognized as a change in Equity. When factored into our weighted average calculations for purposes of earnings per share, the number of repurchased shares is based on the trade date.
Revenue Recognition
Home closings revenue, net — Home closings revenue is recorded using the completed-contract method of accounting at the time each home is delivered, title and possession are transferred to the buyer, we have no significant continuing involvement with the home, risk of loss has transferred, the buyer has demonstrated sufficient investment in the property, and the receivable, if any, from the homeowner or escrow agent is not subject to future subordination.
We typically grant our homebuyers certain sales incentives, including cash discounts, incentives on options included in the home, option upgrades, and seller-paid financing or closing costs. Incentives and discounts are accounted for as a reduction in the sales price of the home and home closings revenue is shown net of discounts. For the years ended December 31, 2017, 2016 and 2015, discounts and incentives were $289.5 million, $250.5 million and $179.3 million, respectively. We also receive rebates from certain vendors and these rebates are accounted for as a reduction to cost of home closings.
Land closings revenue — Revenue from land sales is recognized when title is transferred to the buyer, there is no significant continuing involvement, and the buyer has demonstrated sufficient investment in the property sold. If the buyer has not made an adequate investment in the property, the profit on such sales is deferred until these conditions are met.
72
Mortgage operations revenue — Loan origination fees (including title fees, points, closing costs) are recognized at the time the related real estate transactions are completed, usually upon the close of escrow. All of the loans TMHF originates are sold to third party investors within a short period of time, on a non-recourse basis. Gains and losses from the sale of mortgages are recognized in accordance with ASC Topic 860-20, “Sales of Financial Assets.” Because TMHF does not have continuing involvement with the transferred assets, we derecognize the mortgage loans at time of sale, based on the difference between the selling price and carrying value of the related loans upon sale, recording a gain/loss on sale in the period of sale. Also included in mortgage operations revenue/expenses is the realized and unrealized gains and loss from hedging instruments.
Advertising Costs — We expense advertising costs as incurred. For each year ended December 31, 2017 and 2016, advertising costs were $30.9 million. For the year ended December 31, 2015 advertising costs were $30.1 million.
Recently Issued Accounting Pronouncements — In January 2017, the Financial Accounting Standards Board (“FASB”) issued ASU No. 2017-04, Intangibles - Goodwill and Other (Topic 350): Simplifying the Test for Goodwill Impairment (“ASU 2017-04”). ASU 2017-04 eliminates Step 2 from the goodwill impairment test. This change will allow an entity to avoid calculating the implied fair value of goodwill by assigning the fair value of a reporting unit to all of its assets and liabilities as if that reporting unit had been acquired in a business combination, thus reducing the cost and complexity of evaluating goodwill for impairment. This amendment will be effective for us in our fiscal year beginning January 1, 2020. We do not believe the adoption of ASU 2017-04 will have a material impact on our consolidated financial statements and disclosures.
In January 2017, the FASB issued ASU 2017-01, Business Combinations (Topic 805): Clarifying the Definition of a Business (“ASU 2017-01”). ASU 2017-01 provides clarification on the definition of a business by providing a screen to determine when a set of assets is not a business. The screen requires that when substantially all of the fair value of the gross assets acquired (or disposed of) is concentrated in a single identifiable asset or a group of similar identifiable assets, the set of assets is not a business. This screen is expected to reduce the number of transactions that need to be further evaluated. This amendment will be effective for us in our fiscal year beginning January 1, 2018. As ASU 2017-01 is not retroactive, we do not believe such guidance will have a significant impact on our consolidated financial statements and disclosures. Once adopted, we will evaluate the impact ASU 2017-01 will have on our consolidated financial statements and disclosures in the event of future acquisitions.
In February 2016, the FASB issued ASU No. 2016-02, Leases (Topic 842) (“ASU 2016-02”). ASU 2016-02 primarily impacts off-balance sheet operating leases and will require such leases, with the exception of short-term leases, to be recorded on the balance sheet. Lessor accounting is not significantly impacted by the new guidance, however certain updates were made to align lessee and lessor treatment. ASU 2016-02 will be effective for us in our fiscal year beginning January 1, 2019. We do not believe the adoption of ASU 2016-02 will have a material impact on our consolidated financial statements and disclosures.
In May 2014, the FASB issued ASU No. 2014-09, Revenue from Contracts with Customers (Topic 606) (“ASU 2014-09”), which provides guidance for revenue recognition. This ASU supersedes some cost guidance included in ASC Subtopic 605-35, Revenue Recognition-Construction-Type and Production-Type Contracts. The standard’s core principle is that an entity will recognize revenue when it transfers promised goods or services to customers in an amount that reflects the consideration to which an entity expects to be entitled in exchange for those goods or services. The following steps are to be applied to determine the proper revenue recognition: (1) identify the contract(s) with a customer; (2) identify the performance obligations in the contract; (3) determine the transaction price; (4) allocate the transaction price to the performance obligations in the contract; and (5) recognize revenue when (or as) the entity satisfies a performance obligation.
As a result of the adoption of ASU 2014-09, the timing and presentation of expenses related to certain sales offices and model homes will impact our financial statements. The majority of these costs were previously capitalized and presented within Prepaid expenses and other assets, net on the consolidated balance sheet and amortized through Sales, commissions and other marketing costs on the consolidated statement of operations. Beginning January 1, 2018, these costs will be allocated to Property and equipment, net on the consolidated balance sheet and will be depreciated through Sales, commissions and other marketing costs on the consolidated statement of operations. The balance of any unallocated capitalized marketing costs required to be expensed under ASU 2014-09 will be recorded to prior year retained earnings on our 2018 consolidated balance sheet. The adjustment in the first quarter of 2018 to our beginning balance of retained earnings is immaterial to our consolidated financial statements. In addition, beginning in January 2018, forfeited customer deposits that were previously included in Other expense, net, will now be reported as Home closings revenue, net in our consolidated statement of operations. The change in the presentation for certain sales office and model home costs as well as forfeited deposits as a result of the implementation of ASU 2014-09 will not be material to our consolidated financial statement and disclosures.
73
3. BUSINESS COMBINATIONS
On January 8, 2016, we acquired Acadia Homes, an Atlanta based homebuilder, for total consideration of $83.6 million (including $19.7 million of seller financing holdbacks and contingent consideration). We acquired JEH Homes, an Atlanta based homebuilder, on April 30, 2015 and the Charlotte, Raleigh and Chicago divisions of Orleans Homes on July 21, 2015 for combined total consideration of $233.7 million (including seller financing and contingent consideration). In accordance with ASC Topic 805, Business Combinations, all material assets and liabilities, including contingent consideration were measured and recognized at fair value as of the date of the acquisition to reflect the purchase price paid, which resulted in goodwill for each transaction.
We determined the estimated fair value of real estate inventory on a community-by-community basis primarily using the sales comparison and income approaches. The sales comparison approach was used for all inventory in process. The income approach derives a value using a discounted cash flow for income-producing real property. This approach was used exclusively for finished lots. The income approach using discounted cash flows was also used to value lot option contracts acquired. These estimated cash flows and ultimate valuation are significantly affected by the discount rate, estimates related to expected average selling prices and sales incentives, expected sales paces and cancellation rates, expected land development and construction timelines, and anticipated land development, construction, overhead costs and may vary significantly between communities.
2016 Acquisition
For Acadia Homes, the Company performed a final allocation of purchase price as of the acquisition date. The following is a summary of the fair value of assets acquired, liabilities assumed, and liabilities created:
(Dollars in thousands) | Acadia Homes | ||
Acquisition Date | January 8, 2016 | ||
Assets acquired | |||
Real estate inventory | $ | 76,152 | |
Land deposits | 984 | ||
Prepaid expenses and other assets | 816 | ||
Property and equipment | 204 | ||
Goodwill(1) | 8,500 | ||
Total assets | $ | 86,656 | |
Less liabilities assumed | |||
Accrued expenses and other liabilities | $ | 2,562 | |
Customer deposits | 463 | ||
Net assets acquired | $ | 83,631 | |
(1) Goodwill is fully deductible for tax purposes. The goodwill was allocated to our East homebuilding segment.
2015 Acquisitions
For JEH Homes and the divisions of Orleans Homes, the Company performed a final allocation of purchase price as of each acquisition date. The following is a summary of the fair value of assets acquired, liabilities assumed, and liabilities created:
74
(Dollars in thousands) | JEH Homes | Orleans Homes | Total | ||||||||
Acquisition Date | April 30, 2015 | July 21, 2015 | |||||||||
Assets acquired | |||||||||||
Real estate inventory | $ | 55,559 | $ | 140,602 | $ | 196,161 | |||||
Land deposits | — | 2,236 | 2,236 | ||||||||
Prepaid expenses and other assets | 1,301 | 2,436 | 3,737 | ||||||||
Property and equipment | 395 | 623 | 1,018 | ||||||||
Goodwill(1) | 9,125 | 25,198 | 34,323 | ||||||||
Total assets | $ | 66,380 | $ | 171,095 | $ | 237,475 | |||||
Less liabilities assumed | |||||||||||
Accrued expenses and other liabilities | $ | — | $ | 2,700 | $ | 2,700 | |||||
Customer deposits | — | 1,081 | 1,081 | ||||||||
Net assets acquired | $ | 66,380 | $ | 167,314 | $ | 233,694 | |||||
(1) Goodwill is fully deductible for tax purposes. The goodwill was allocated to our East homebuilding segment.
Unaudited Pro Forma Results of Business Combinations
The following unaudited pro forma information for the years presented include the combined results of operations of our acquisitions. Our acquisition of Acadia Homes is presented as if it had been completed on January 1, 2015. The pro forma presentation for our acquisitions of JEH Homes and the Charlotte, Chicago, and Raleigh divisions of Orleans Homes assumes both had been completed on January 1, 2014, however only the as adjusted for the year ended December 31, 2015 are presented. The pro forma results are presented for informational purposes only and do not purport to be indicative of the results of operations or future results that would have been achieved if the acquisitions had taken place one year prior to their respective acquisition years. The pro forma information combines the historical results of the Company with the historical results of each of our acquisitions for the periods presented.
The unaudited pro forma results for the years presented include adjustments to move transaction costs to the year prior to their acquisition. In addition, the unaudited pro forma results do not give effect to any synergies, operating efficiencies or other costs savings that may result from the acquisitions. Earnings per share utilizes net income from continuing operations and total weighted average Class A and Class B shares. The pro forma amounts are based on available information and certain assumptions that we believe are reasonable.
Pro forma presentation for the 2016 acquisition (1)
As Adjusted for the Year Ended December 31, | |||||||
(Dollars in thousands except per share data) | 2016 | 2015 | |||||
Pro forma total revenues | $ | 3,550,029 | $ | 3,054,664 | |||
Pro forma net income from continuing operations | $ | 207,304 | $ | 170,456 | |||
Pro forma earnings per share from continuing operations available to TMHC - Basic and Diluted | $ | 1.70 | $ | 1.39 | |||
(1) The pro forma results above only give effect to the Acadia acquisition.
Pro forma presentation for the 2015 acquisitions (1)
75
As Adjusted for the Year Ended December 31, | |||
(Dollars in thousands except per share data) | 2015 | ||
Pro forma total revenues | $ | 3,091,766 | |
Pro forma net income from continuing operations | $ | 181,122 | |
Pro forma earnings per share from continuing operations available to TMHC - Basic and Diluted | $ | 1.48 | |
(1) The pro forma results above only give effect to the acquisitions of JEH and divisions of Orleans Homes.
4. EARNINGS PER SHARE
Basic earnings per share is computed by dividing net income available to TMHC by the weighted average number of shares of Class A Common Stock outstanding during the period. Diluted earnings per share gives effect to the potential dilution that could occur if all shares of Class B Common Stock and their corresponding New TMM Units were exchanged for Class A Common Stock and if all outstanding equity awards to issue shares of Class A Common Stock were exercised or settled. See Note 23 - Subsequent Events for changes to this ownership subsequent to December 31, 2017.
The following is a summary of the components of basic and diluted earnings per share:
Year Ended December 31, | |||||||||||
(Dollars in thousands except per share data) | 2017 | 2016 | 2015 | ||||||||
Numerator: | |||||||||||
Net income available to TMHC – basic | $ | 91,220 | $ | 52,616 | $ | 61,049 | |||||
Income from discontinued operations, net of tax | — | — | 58,059 | ||||||||
Income from discontinued operations, net of tax attributable to non-controlling interest – Principal Equityholders | — | — | (42,406 | ) | |||||||
Net income from discontinued operations — basic | $ | — | $ | — | $ | 15,653 | |||||
Net income from continuing operations — basic | $ | 91,220 | $ | 52,616 | $ | 45,396 | |||||
Net income from continuing operations — basic | $ | 91,220 | $ | 52,616 | $ | 45,396 | |||||
Net income from continuing operations attributable to non-controlling interest – Principal Equityholders | 85,000 | 152,653 | 123,909 | ||||||||
Loss fully attributable to public holding company (1) | 6,681 | 211 | 261 | ||||||||
Net income from continuing operations — diluted | $ | 182,901 | $ | 205,480 | $ | 169,566 | |||||
Net income from discontinued operations — diluted | $ | — | $ | — | $ | 58,059 | |||||
Denominator: | |||||||||||
Weighted average shares — basic (Class A) | 62,061 | 31,084 | 33,063 | ||||||||
Weighted average shares — Principal Equityholders’ non-controlling interest (Class B) | 57,556 | 89,062 | 89,168 | ||||||||
Restricted stock units | 950 | 610 | 153 | ||||||||
Stock options | 348 | 76 | — | ||||||||
Weighted average shares — diluted | 120,915 | 120,832 | 122,384 | ||||||||
Earnings per common share — basic: | |||||||||||
Income from continuing operations | $ | 1.47 | $ | 1.69 | $ | 1.38 | |||||
Income from discontinued operations, net of tax | $ | — | $ | — | $ | 0.47 | |||||
Net income available to Taylor Morrison Home Corporation (2) | $ | 1.47 | $ | 1.69 | $ | 1.85 | |||||
Earnings per common share — diluted: | |||||||||||
Income from continuing operations | $ | 1.47 | $ | 1.69 | $ | 1.38 | |||||
Income from discontinued operations, net of tax | $ | — | $ | — | $ | 0.47 | |||||
Net income available to Taylor Morrison Home Corporation (2),(3) | $ | 1.47 | $ | 1.69 | $ | 1.85 | |||||
(1) 2017 amount represents amounts fully attributed to Class A Common Stock, including U.S. tax expense from the Company's indirect ownership of a Canadian subsidiary which became a controlled foreign corporation in 2017, the Tax Act impact due to the mandatory repatriation of foreign earnings, and other costs associated with maintaining a public company status.
(2) 2017 amounts include impacts of the Tax Act, which was an aggregate $61.0 million expense.
(3) Diluted net income produced an anti-dilutive effect, therefore basic and diluted earnings per common share are the same.
76
We excluded a total weighted average of 1,655,017, 1,565,879, and 1,535,441 stock options and restricted stock units (“RSUs”) from the calculation of earnings per share for the years ended December 31, 2017, 2016, and 2015, respectively.
The shares of Class B Common Stock have voting rights but do not have economic rights or rights to dividends or distribution on liquidation and therefore are not participating securities. Accordingly, Class B Common Stock is not included in basic earnings per share.
5. DISCONTINUED OPERATIONS
In connection with the sale of Monarch in January 2015, the operating results of the Monarch business are classified as discontinued operations – net of applicable taxes in the Consolidated Statements of Operations for all periods presented.
For the years ended December 31, 2017, 2016 , and 2015, we did not record any revenues or expenses related to the operations of Monarch. We closed on the sale on January 28, 2015 and the activity recorded in 2015 consists of post-closing transaction expenses, including administrative costs, legal fees, and stock based compensation charges. The gain on sale of discontinued operations was determined using the purchase price for Monarch, less related costs and tax. The components of discontinued operations were as follows:
Year Ended December 31, | ||||
(Dollars in thousands) | 2015 | |||
Revenues | $ | — | ||
Transaction expenses from discontinued operations | $ | (9,043 | ) | |
Gain on sale of discontinued operations | 80,205 | |||
Pre-tax income from discontinued operations | $ | 71,162 | ||
Provision for taxes | (13,103 | ) | ||
Income from discontinued operations, net of tax | $ | 58,059 | ||
There were no assets and liabilities of discontinued operations at December 31, 2017 or 2016.
6. REAL ESTATE INVENTORY AND LAND DEPOSITS
Inventory consists of the following:
As of December 31, | |||||||
(Dollars in thousands) | 2017 | 2016 | |||||
Real estate developed or under development | $ | 2,130,263 | $ | 2,074,651 | |||
Real estate held for development or held for sale (1) | 76,552 | 183,638 | |||||
Operating communities (2) | 659,398 | 650,036 | |||||
Capitalized interest | 90,496 | 102,642 | |||||
Total owned inventory | 2,956,709 | 3,010,967 | |||||
Real estate not owned under option contracts | 2,527 | 6,252 | |||||
Total real estate inventory | $ | 2,959,236 | $ | 3,017,219 | |||
(1) Real estate held for development or held for sale includes properties which are not in active production. This includes raw land recently purchased or awaiting entitlement, and long-term strategic assets.
(2) Operating communities consist of all vertical construction costs relating to homes in progress and completed homes for all active production of inventory.
The development status of our land inventory is as follows:
77
As of December 31, | |||||||||||||
(Dollars in thousands) | 2017 | 2016 | |||||||||||
Owned Lots | Book Value of Land and Development | Owned Lots | Book Value of Land and Development | ||||||||||
Raw | 7,703 | $ | 338,642 | 7,142 | $ | 403,902 | |||||||
Partially developed | 5,811 | 543,200 | 8,037 | 501,496 | |||||||||
Finished | 11,644 | 1,314,243 | 11,318 | 1,336,709 | |||||||||
Long-term strategic assets | 763 | 10,730 | 1,489 | 16,182 | |||||||||
Total | 25,921 | $ | 2,206,815 | 27,986 | $ | 2,258,289 | |||||||
Land Deposits — We provide deposits related to land options and land purchase contracts, which are capitalized when paid
and classified as land deposits until the associated property is purchased.
As of December 31, 2017 and 2016, we had the right to purchase approximately 5,037 and 7,583 lots under land option purchase contracts, respectively, which represents an aggregate purchase price of $405.3 million and $542.6 million as of December 31, 2017 and 2016, respectively. We do not have title to these properties, and the creditors generally have no recourse against the Company. As of December 31, 2017 and 2016, our exposure to loss related to our option contracts with third parties and unconsolidated entities consisted of non-refundable option deposits totaling $49.8 million and $37.2 million, respectively.
Capitalized Interest — Interest capitalized, incurred and amortized is as follows:
Year Ended December 31, | |||||||||||
(Dollars in thousands) | 2017 | 2016 | 2015 | ||||||||
Interest capitalized — beginning of period | $ | 102,642 | $ | 105,148 | $ | 94,880 | |||||
Interest incurred | 82,713 | 88,345 | 93,431 | ||||||||
Interest amortized to cost of home closings | (94,859 | ) | (90,851 | ) | (83,163 | ) | |||||
Interest capitalized — end of period | $ | 90,496 | $ | 102,642 | $ | 105,148 | |||||
7. INVESTMENTS IN UNCONSOLIDATED ENTITIES
We participate in a number of joint ventures with related and unrelated third parties, with ownership interests up to 50%. These entities are generally involved in real estate development, homebuilding and/or mortgage lending activities.
Summarized, unaudited combined financial information of unconsolidated entities that are accounted for by the equity method is as follows:
As of December 31, | |||||||
(Dollars in thousands) | 2017 | 2016 | |||||
Assets: | |||||||
Real estate inventory | $ | 627,841 | $ | 614,441 | |||
Other assets | 138,341 | 171,216 | |||||
Total assets | $ | 766,182 | $ | 785,657 | |||
Liabilities and owners’ equity: | |||||||
Debt | $ | 193,770 | $ | 277,934 | |||
Other liabilities | 27,556 | 22,603 | |||||
Total liabilities | $ | 221,326 | $ | 300,537 | |||
Owners’ equity: | |||||||
TMHC | 192,364 | 157,909 | |||||
Others | 352,492 | 327,211 | |||||
Total owners’ equity | 544,856 | 485,120 | |||||
Total liabilities and owners’ equity | $ | 766,182 | $ | 785,657 | |||
78
Year Ended December 31, | |||||||||||
(Dollars in thousands) | 2017 | 2016 | 2015 | ||||||||
Revenues | $ | 330,099 | $ | 143,834 | $ | 26,865 | |||||
Costs and expenses | (296,838 | ) | (118,240 | ) | (23,667 | ) | |||||
Income of unconsolidated entities | $ | 33,261 | $ | 25,594 | $ | 3,198 | |||||
TMHC's share in income of unconsolidated entities | $ | 8,846 | $ | 7,453 | $ | 1,759 | |||||
Distributions from unconsolidated entities | $ | 11,048 | $ | 10,348 | $ | 12,267 | |||||
8. INTANGIBLE ASSETS
At December 31, 2017, the gross carrying amount and accumulated amortization of intangible assets was $14.0 million and $11.9 million, respectively. At December 31, 2016, the gross carrying amount and accumulated amortization was $14.0 million and $10.8 million, respectively.
Amortization of intangible assets is recorded on a straight-line basis over the life of the asset. Amortization expense recorded during the years ended December 31, 2017, 2016, and 2015 was $1.1 million, $1.0 million, and $1.1 million for each year, respectively.
9. ACCRUED EXPENSES AND OTHER LIABILITIES
Accrued expenses and other liabilities consist of the following:
As of December 31, | |||||||
(Dollars in thousands) | 2017 | 2016 | |||||
Real estate development costs to complete | $ | 14,815 | $ | 15,156 | |||
Compensation and employee benefits | 72,352 | 63,802 | |||||
Self-insurance and warranty reserves | 51,010 | 50,550 | |||||
Interest payable | 17,125 | 17,233 | |||||
Property and sales taxes payable | 12,294 | 17,231 | |||||
Other accruals | 33,944 | 45,230 | |||||
Total accrued expenses and other liabilities | $ | 201,540 | $ | 209,202 | |||
Self Insurance and Warranty Reserves — We accrue for the expected costs associated with our limited warranty,
deductibles and self-insured amounts under our various insurance policies within Beneva Indemnity Company ("Beneva"), a
wholly owned subsidiary. A summary of the changes in our reserves are as follows:
Year Ended December 31, | |||||||||||
(Dollars in thousands) | 2017 | 2016 | 2015 | ||||||||
Reserve — beginning of period | $ | 50,550 | $ | 43,098 | $ | 44,595 | |||||
Additions to reserves | 27,561 | 26,571 | 19,681 | ||||||||
Costs and claims incurred | (25,698 | ) | (21,379 | ) | (26,506 | ) | |||||
Change in estimates to pre-existing reserves | (1,403 | ) | 2,260 | 5,328 | |||||||
Reserve — end of period | $ | 51,010 | $ | 50,550 | $ | 43,098 | |||||
10. DEBT
Total debt consists of the following:
79
As of December 31, | |||||||||||||||||||||||
2017 | 2016 | ||||||||||||||||||||||
(Dollars in thousands) | Principal | Unamortized Debt Issuance Costs | Carrying Value | Principal | Unamortized Debt Issuance Costs | Carrying Value | |||||||||||||||||
5.25% Senior Notes due 2021 | 550,000 | 3,892 | 546,108 | 550,000 | 5,089 | 544,911 | |||||||||||||||||
5.875% Senior Notes due 2023 | 350,000 | 3,002 | 346,998 | 350,000 | 3,569 | 346,431 | |||||||||||||||||
5.625% Senior Notes due 2024 | 350,000 | 3,319 | 346,681 | 350,000 | 3,858 | 346,142 | |||||||||||||||||
Senior Notes subtotal | 1,250,000 | 10,213 | 1,239,787 | 1,250,000 | 12,516 | 1,237,484 | |||||||||||||||||
Loans payable and other borrowings | 139,453 | — | 139,453 | 150,485 | — | 150,485 | |||||||||||||||||
Revolving Credit Facility (1),(2) | — | — | — | — | — | — | |||||||||||||||||
Mortgage warehouse borrowings | 118,822 | — | 118,822 | 198,564 | — | 198,564 | |||||||||||||||||
Total debt | $ | 1,508,275 | $ | 10,213 | $ | 1,498,062 | $ | 1,599,049 | $ | 12,516 | $ | 1,586,533 | |||||||||||
(1) The Revolving Credit Facility includes $2.0 million and $3.5 million of unamortized debt issuance costs as of December 31, 2017 and 2016, respectively, which is presented in prepaid expenses and other assets, net on the consolidated balance sheets.
(2) The Revolving Credit Facility was amended on January 26, 2018 to extend the maturity date from April 2019 to January 2022.
2021 Senior Notes
On April 16, 2013, we issued $550.0 million aggregate principal amount of 5.25% Senior Notes due 2021 (the “2021 Senior Notes”).
The 2021 Senior Notes mature on April 15, 2021. The 2021 Senior Notes are guaranteed by TMM Holdings, Taylor Morrison Holdings, Inc., Taylor Morrison Communities II, Inc. and their homebuilding subsidiaries (collectively, the “Guarantors”), which are all subsidiaries directly or indirectly of TMHC. The 2021 Senior Notes and the related guarantees are senior unsecured obligations and are not subject to registration rights. The indenture for the 2021 Senior Notes contains covenants that limit (i) the making of investments, (ii) the payment of dividends and the redemption of equity and junior debt, (iii) the incurrence of additional indebtedness, (iv) asset dispositions, (v) mergers and similar corporate transactions, (vi) the incurrence of liens, (vii) prohibitions on payments and asset transfers among the issuers and restricted subsidiaries and (viii) transactions with affiliates, among others. The indenture governing the 2021 Senior Notes contains customary events of default. If we do not apply the net cash proceeds of certain asset sales within specified deadlines, we will be required to offer to repurchase the 2021 Senior Notes at par (plus accrued and unpaid interest) with such proceeds. We are also required to offer to repurchase the 2021 Senior Notes at a price equal to 101% of their aggregate principal amount (plus accrued and unpaid interest) upon certain change of control events.
The 2021 Senior Notes are redeemable at scheduled redemption prices, currently at 102.625%, of their principal amount (plus accrued and unpaid interest).
There are no financial maintenance covenants for the 2021 Senior Notes.
2023 Senior Notes and Redemption of 2020 Senior Notes
On April 16, 2015, we issued $350.0 million aggregate principal amount of 5.875% Senior Notes due 2023 (the “2023 Senior Notes”). The 2023 Senior Notes and the related guarantees are senior unsecured obligations and are not subject to registration rights. The net proceeds of the offering, together with cash on hand, were used to redeem the entire remaining principal amount of our 7.75% Senior Notes due 2020 on May 1, 2015, at a redemption price of 105.813% of their aggregate principal amount, plus accrued and unpaid interest thereon to, but not including, the date of redemption. As a result of the redemption of the 2020 Senior Notes, we recorded a loss on extinguishment of debt of $33.3 million during the second quarter of 2015, which included the payment of the redemption premium and write-off of net unamortized deferred financing fees.
The 2023 Senior Notes mature on April 15, 2023. The 2023 Senior Notes are guaranteed by the same Guarantors that guarantee the 2021 Senior Notes. The indenture governing the 2023 Senior Notes contains covenants that limit our ability to incur debt secured by liens and enter into certain sale and leaseback transactions. The indenture governing the 2023 Senior Notes contains events of default that are similar to those contained in the indenture governing the 2021 Senior Notes. The change of control provisions in the indenture governing the 2023 Senior Notes are similar to those contained in the indenture governing the 2021
80
Senior Notes, but a credit rating downgrade must occur in connection with the change of control before the repurchase offer requirement is triggered for the 2023 Senior Notes.
Prior to January 15, 2023, the 2023 Senior Notes are redeemable at a price equal to 100% plus a “make-whole” premium for payments through January 15, 2023 (plus accrued and unpaid interest). Beginning January 15, 2023, the 2023 Senior Notes are redeemable at par (plus accrued and unpaid interest).
There are no financial maintenance covenants for the 2023 Senior Notes.
2024 Senior Notes
On March 5, 2014, we issued $350.0 million aggregate principal amount of 5.625% Senior Notes due 2024 (the “2024 Senior Notes”).
The 2024 Senior Notes mature on March 1, 2024. The 2024 Senior Notes are guaranteed by the same Guarantors that guarantee the 2021 and 2023 Senior Notes. The 2024 Senior Notes and the related guarantees are senior unsecured obligations and are not subject to registration rights. The indenture governing the 2024 Senior Notes contains covenants that limit our ability to incur debt secured by liens and enter into certain sale and leaseback transactions similar to the 2023 Senior Notes. The indenture governing the 2024 Senior Notes contains events of default that are similar to those contained in the indenture governing the 2021 and 2023 Senior Notes. The change of control provisions in the indenture governing the 2024 Senior Notes are similar to those contained in the indenture governing the 2023 Senior Notes.
Prior to December 1, 2023, the 2024 Senior Notes are redeemable at a price equal to 100% plus a “make-whole” premium for payments through December 1, 2023 (plus accrued and unpaid interest). Beginning on December 1, 2023, the 2024 Senior Notes are redeemable at par (plus accrued and unpaid interest).
There are no financial maintenance covenants for the 2024 Senior Notes.
Revolving Credit Facility
At December 31, 2017, our $500.0 million Revolving Credit Facility was scheduled to mature on April 12, 2019. On January 26, 2018 we amended our Revolving Credit Facility to extend the maturity date from April 12, 2019 to January 26, 2022. Other immaterial changes were also made to the structure of the Revolving Credit Facility. The Revolving Credit Facility is guaranteed by the same Guarantors that guarantee the 2021, 2023 and 2024 Senior Notes.
The Revolving Credit Facility contains certain “springing” financial covenants, requiring us and our subsidiaries to comply with a maximum debt to capitalization ratio of not more than 0.60 to 1.00 and a minimum consolidated tangible net worth level of at least $1.6 billion. The financial covenants would be in effect for any fiscal quarter during which any (a) loans under the Revolving Credit Facility are outstanding during the last day of such fiscal quarter or on more than five separate days during such fiscal quarter or (b) undrawn letters of credit (except to the extent cash collateralized) issued under the Revolving Credit Facility in an aggregate amount greater than $40.0 million or unreimbursed letters of credit issued under the Revolving Credit Facility are outstanding on the last day of such fiscal quarter or for more than five consecutive days during such fiscal quarter. For purposes of determining compliance with the financial covenants for any fiscal quarter, the Revolving Credit Facility provides that we may exercise an equity cure by issuing certain permitted securities for cash or otherwise recording cash contributions to our capital that will, upon the contribution of such cash to the borrower, be included in the calculation of consolidated tangible net worth and consolidated total capitalization. The equity cure right is exercisable up to twice in any period of four consecutive fiscal quarters and up to five times overall.
The Revolving Credit Facility contains certain restrictive covenants including limitations on incurrence of liens, dividends and other distributions, asset dispositions and investments in entities that are not guarantors, limitations on prepayment of subordinated indebtedness and limitations on fundamental changes. The Revolving Credit Facility contains customary events of default, subject to applicable grace periods, including for nonpayment of principal, interest or other amounts, violation of covenants (including financial covenants, subject to the exercise of an equity cure), incorrectness of representations and warranties in any material respect, cross default and cross acceleration, bankruptcy, material monetary judgments, ERISA events with material adverse effect, actual or asserted invalidity of material guarantees and change of control. As of December 31, 2017 and 2016, we were in compliance with all of the covenants under the Revolving Credit Facility.
81
Mortgage Warehouse Borrowings
The following is a summary of our mortgage subsidiary warehouse borrowings:
(Dollars in thousands) | At December 31, 2017 | ||||||||||||
Facility | Amount Drawn | Facility Amount | Interest Rate | Expiration Date | Collateral (1) | ||||||||
Flagstar | $ | 12,990 | $ | 39,000 | LIBOR + 2.25% | 30 days written notice | Mortgage Loans | ||||||
Comerica | 41,447 | 85,000 | LIBOR + 2.25% | On Demand | Mortgage Loans | ||||||||
J.P. Morgan | 64,385 | 125,000 | LIBOR + 2.375% | September 24, 2018 | Mortgage Loans and Restricted Cash | ||||||||
Total | $ | 118,822 | $ | 249,000 | |||||||||
At December 31, 2016 | |||||||||||||
Facility | Amount Drawn | Facility Amount | Interest Rate | Expiration Date | Collateral (1) | ||||||||
Flagstar | $ | 37,093 | $ | 55,000 | LIBOR + 2.5% | 30 days written notice | Mortgage Loans | ||||||
Comerica | 57,875 | 85,000 | LIBOR + 2.25% | November 16, 2017 | Mortgage Loans | ||||||||
J.P. Morgan | 103,596 | 125,000 | LIBOR + 2.375% to 2.5% | September 26, 2017 | Mortgage Loans and Restricted Cash | ||||||||
Total | $ | 198,564 | $ | 265,000 | |||||||||
(1) | The mortgage warehouse borrowings outstanding as of December 31, 2017 and 2016, are collateralized by 187.0 million and 233.2 million, respectively, of mortgage loans held for sale, which comprise the balance of mortgage receivables, and 1.6 million and 1.6 million, respectively, of cash, which is restricted cash on our balance sheet. |
Loans Payable and Other Borrowings
Loans payable and other borrowings as of December 31, 2017 and 2016 consist of project-level debt due to various land sellers and seller financing notes from current and prior year acquisitions. Project-level debt is generally secured by the land that was acquired and the principal payments generally coincide with corresponding project lot sales or a principal reduction schedule. Loans payable bear interest at rates that ranged from 0% to 8% at December 31, 2017 and 2016.
Future Minimum Principal Payments on Total Debt
Principal maturities of total debt for the year ended December 31, 2017 are as follows (in thousands):
Year Ended December 31, | |||
2018 | $ | 204,872 | |
2019 | 40,331 | ||
2020 | 5,343 | ||
2021 | 553,662 | ||
2022 | 993 | ||
Thereafter | 703,074 | ||
Total debt | $ | 1,508,275 | |
11. FOREIGN CURRENCY FORWARD
In December 2014, we entered into a derivative financial instrument in the form of a foreign currency forward. The derivative financial instrument hedged our exposure to the Canadian dollar in conjunction with the disposition of the Monarch business.
82
The aggregate notional amount of the foreign exchange derivative financial instrument was $471.2 million at December 31, 2014. At December 31, 2014 the fair value of the instrument was not material to our consolidated financial position or results of operations. The final settlement of the derivative financial instrument occurred on January 30, 2015 and a gain in the amount of $30.0 million was recorded to gain on foreign currency forward in the Consolidated Statements of Operations for the year ended December 31, 2015. There was no activity relating to foreign currency forwards for the years ended December 31, 2017 and 2016.
12. FAIR VALUE DISCLOSURES
We have adopted ASC Topic 820, “Fair Value Measurements” for valuation of financial instruments. ASC 820 provides a framework for measuring fair value under GAAP, expands disclosures about fair value measurements, and establishes a fair value hierarchy, which requires an entity to maximize the use of observable inputs and minimize the use of unobservable inputs when measuring fair value. The three levels of the fair value hierarchy are summarized as follows:
Level 1 — Fair value is based on quoted prices for identical assets or liabilities in active markets.
Level 2 — Fair value is determined using quoted prices for similar assets or liabilities in active markets or quoted prices for identical or similar assets or liabilities in markets that are not active or are directly or indirectly observable.
Level 3 — Fair value is determined using one or more significant inputs that are unobservable in active markets at the measurement date, such as a pricing model, discounted cash flow, or similar technique.
The fair value of our mortgage loans held for sale is derived from negotiated rates with partner lending institutions. The fair value of derivative assets includes interest rate lock commitments (“IRLCs”) and mortgage backed securities (“MBS”). The fair value of IRLCs is based on the value of the underlying mortgage loan, quoted MBS prices and the probability that the mortgage loan will fund within the terms of the IRLCs. We estimate the fair value of the forward sales commitments based on quoted MBS prices. The fair value of our mortgage warehouse borrowings, loans payable and other borrowings and the borrowings under our Revolving Credit Facility approximate carrying value due to their short term nature and variable interest rate terms. The fair value of our Senior Notes is derived from quoted market prices by independent dealers in markets that are not active. The fair value of the contingent consideration liability related to previous acquisitions was estimated using a Monte Carlo simulation model under the option pricing method. As the measurement of the contingent consideration is based primarily on significant inputs not observable in the market, it represents a Level 3 measurement. There were no changes to or transfers between the levels of the fair value hierarchy for any of our financial instruments as of December 31, 2017, when compared to December 31, 2016.
The carrying value and fair value of our financial instruments are as follows:
As of December 31, 2017 | As of December 31, 2016 | |||||||||||||||||
(Dollars in thousands) | Level in Fair Value Hierarchy | Carrying Value | Estimated Fair Value | Carrying Value | Estimated Fair Value | |||||||||||||
Description: | ||||||||||||||||||
Mortgage loans held for sale | 2 | $ | 187,038 | $ | 187,038 | $ | 233,184 | $ | 233,184 | |||||||||
Derivative assets, net | 2 | 1,352 | 1,352 | 2,291 | 2,291 | |||||||||||||
Mortgage borrowings | 2 | 118,822 | 118,822 | 198,564 | 198,564 | |||||||||||||
Loans payable and other borrowings | 2 | 139,453 | 139,453 | 150,485 | 150,485 | |||||||||||||
5.25% Senior Notes due 2021 (1) | 2 | 546,108 | 561,000 | 544,911 | 563,750 | |||||||||||||
5.875% Senior Notes due 2023 (1) | 2 | 346,998 | 369,705 | 346,431 | 355,250 | |||||||||||||
5.625% Senior Notes due 2024 (1) | 2 | 346,681 | 366,205 | 346,142 | 353,500 | |||||||||||||
Revolving Credit Facility (2) | 2 | — | — | — | — | |||||||||||||
Contingent consideration liability | 3 | 5,328 | 5,328 | 17,200 | 17,200 | |||||||||||||
(1) Carrying value for Senior Notes, as presented, includes unamortized debt issuance costs. Debt issuance costs are not factored into the fair value calculation for the Senior Notes.
(2) At December 31, 2017 and 2016, we had no borrowings outstanding on our Revolving Credit Facility.
83
Fair value measurements are used for inventories on a nonrecurring basis when events and circumstances indicate that their carrying value is not recoverable. The following table presents the fair value for our inventories measured at fair value on a nonrecurring basis:
(Dollars in thousands) | For the Year Ended December 31, | ||||
Description: | Level in Fair Value Hierarchy | 2016 | |||
Inventories | 3 | $ | 3,778 | ||
At December 31, 2017, the fair value for such inventories was not determined as there were no events and circumstances that indicated their carrying value was not recoverable.
13. INCOME TAXES
The provision for income taxes for the years ended December 31, 2017, 2016 and 2015 consisted of the following:
Year Ended December 31, | |||||||||||
(Dollars in thousands) | 2017 | 2016 | 2015 | ||||||||
Domestic | $ | 173,541 | $ | 98,125 | $ | 84,880 | |||||
Foreign | 5,465 | 9,518 | 5,121 | ||||||||
Total income tax provision | $ | 179,006 | $ | 107,643 | $ | 90,001 | |||||
Current: | |||||||||||
Federal | $ | 73,974 | $ | 64,298 | $ | 57,053 | |||||
State | 9,379 | 9,178 | 9,557 | ||||||||
Foreign | 7,169 | 7,213 | 5,545 | ||||||||
Current tax provision | $ | 90,522 | $ | 80,689 | $ | 72,155 | |||||
Deferred: | |||||||||||
Federal | $ | 95,243 | $ | 22,201 | $ | 16,406 | |||||
State | (5,055 | ) | 2,448 | 1,864 | |||||||
Foreign | (1,704 | ) | 2,305 | (424 | ) | ||||||
Deferred tax provision | $ | 88,484 | $ | 26,954 | $ | 17,846 | |||||
Total income tax provision | $ | 179,006 | $ | 107,643 | $ | 90,001 | |||||
The components of income before income taxes are as follows:
Year Ended December 31, | |||||||||||
(Dollars in thousands) | 2017 | 2016 | 2015 | ||||||||
Domestic | $ | 323,359 | $ | 282,207 | $ | 242,787 | |||||
Foreign | 32,297 | 31,999 | 18,200 | ||||||||
Income before income taxes | $ | 355,656 | $ | 314,206 | $ | 260,987 | |||||
A reconciliation of the provision for income taxes and the amount computed by applying the federal statutory income tax rate of 35% to income before provision for income taxes is as follows:
84
Year Ended December 31, | ||||||||
2017 | 2016 | 2015 | ||||||
Tax at federal statutory rate | 35.0 | % | 35.0 | % | 35.0 | % | ||
State income taxes (net of federal benefit) | 3.2 | 3.1 | 3.0 | |||||
Foreign income taxed below U.S. Rate | (0.8 | ) | (0.9 | ) | (0.5 | ) | ||
Valuation allowance | — | (0.6 | ) | (1.9 | ) | |||
Built in loss limitation | — | 0.3 | 1.6 | |||||
Uncertain tax positions | 1.1 | — | — | |||||
Non-controlling interest | — | (0.1 | ) | (0.2 | ) | |||
State net operating loss adjustment | (2.1 | ) | — | — | ||||
Deferred tax adjustments | (1.1 | ) | — | — | ||||
Disallowed compensation expense | 0.2 | 0.1 | 0.2 | |||||
Domestic Manufacturing Deduction | (2.1 | ) | (2.2 | ) | (3.1 | ) | ||
Other | (0.2 | ) | (0.4 | ) | 0.4 | |||
Tax reform legislation (1) | 17.1 | — | — | |||||
Effective Rate | 50.3 | % | 34.3 | % | 34.5 | % | ||
(1) On December 22, 2017, new legislation commonly known as the "Tax Cuts and Jobs Act" ("Tax Act"), was enacted. The Tax Act made comprehensive reforms to the United States tax code, including a decrease to the corporate statutory tax rate from 35% to 21%, and a one-time mandatory deemed repatriation tax of foreign earnings at a reduced rate, that may be payable over eight years.
In response to the Tax Act, SEC staff issued Staff Accounting Bulletin No. 118 (SAB 118), which provides guidance on accounting for the impacts of the Tax Act. SAB 118 allows for the recording provisional amounts during a one year “measurement period” similar to that used when accounting for business combinations, if the Company has a reasonable estimate of the impact but the accounting is not yet complete. The measurement period is deemed to have ended in either one calendar year or when the Company has obtained, prepared and analyzed the information necessary to finalize its accounting for the impact of the Tax Act, whichever is earlier.
For the quarter ended December 31, 2017, we have recorded a discrete net tax expense of $61.0 million related to impacts related to the Tax Act. The net expense includes a provisional estimate of $57.4 million, a 16.1% increase to the effective rate, related to the write-down of our existing deferred tax assets to reflect the newly enacted U.S. federal tax rate, in accordance with SAB 118. The provisional expense is the Company’s best estimate of the deferred tax asset write-down at this time, however it is subject to change in the future. The estimate may be impacted by our calculation of additional adjustments made to federal temporary differences arising from a tax accounting method change filed with the IRS and the state tax effect of these additional adjustments.
The net expense related to tax reform recorded during the period ended December 31, 2017, also includes a provisional estimate of $3.6 million, a 1% increase to the effective rate, from the mandatory deemed repatriation of foreign earnings related to the sale of our Canadian business in 2015. The Tax Act imposes a mandatory deemed repatriation tax on post-1986 foreign earnings and profits (“E&P”) of certain foreign subsidiaries to their 10% U.S. shareholders (regardless of whether such E&P is distributed) at a rate of 15.5% for U.S. corporate shareholders to the extent E&P does not exceed the U.S. shareholder’s aggregate foreign cash position (as defined in the Tax Act) and 8% for E&P in excess of such cash position. The resulting tax may be payable over eight years. The mandatory tax is partially offset by foreign tax credits generated by cash taxes that our Canadian subsidiaries previously paid to Canada. To determine the amount of the Transition Tax, we must determine, in addition to other factors, the amount of foreign repatriation tax of our Canadian subsidiaries, as well as the amount of non-U.S. income taxes paid on such earnings. The provisional expense is the Company’s best estimate of the foreign repatriation tax at this time, however it is subject to change in the future as we are continuing to gather additional information to more precisely compute the amount of the tax.
We own more than a 50% interest in a Canadian corporation. As a result, the Canadian corporation is classified as a controlled foreign corporation (a “CFC”) for U.S. federal income tax purposes. In certain circumstances a U.S. shareholder of a CFC is required to include currently in its income its proportionate share of certain categories of the CFC’s current earnings and profits, regardless of whether any amounts are actually distributed by the CFC.
Certain transactions between us and our Canadian subsidiaries creates interest income in Canada and the passive nature also subjects that income to current U.S. tax through a deemed dividend under Subpart F. As TMHC’s ownership interest continues
85
to increase, the deemed dividend also increases which will negatively impact the effective tax rate. The impact to the effective rate for 2017 as a result of Subpart F was approximately 1.1%.
We will continue to have Subpart F deemed dividends in the future and a negative impact to our effective rate, unless we effectively unwind our Canadian subsidiaries from our structure, which could also cause the incurrence of certain Canadian withholding taxes in the period of unwind.
At December 31, 2017 and 2016, we had a valuation allowance of $0.8 million and $0.5 million, respectively, against net deferred tax assets, which include the tax benefit from Canadian, U.S. federal, and state net operating loss (“NOL”) carryforwards and capital loss carryforwards. Federal NOL carryforwards may be used to offset future taxable income for 20 years and begin to expire in 2027. State NOL carryforwards may be used to offset future taxable income for a period of 20 years, and begin to expire in 2026. For the years ended December 31, 2017 and December 31, 2016, we recorded a net valuation allowance increase of $0.3 million and decrease of $2.1 million, respectively. The increase in the valuation allowance primarily related to a capital loss carryforward which is not expected to be realized. Our future deferred tax asset realization depends on sufficient taxable income in the carryforward periods under existing tax laws. State deferred tax assets include approximately $15.9 million and $10.4 million at December 31, 2017 and 2016, respectively, of tax benefits related to state NOL carryovers. The increase in state NOL carryovers between the years ending December 31, 2017 and 2016 was primarily the result of additional NOLs generated upon receiving a favorable ruling from the jurisdiction. On an ongoing basis, we will continue to review all available evidence to determine if and when we expect to realize our deferred tax assets and federal and state NOL carryovers.
As a result of the 2011 acquisition by our Principal Equityholders, we had an “ownership change” as defined by Section 382 of the Internal Revenue Code of 1986 as amended (the “IRC”). Section 382 of the IRC imposes certain limitations on our ability to utilize certain tax attributes and net unrealized built-in losses that existed as of July 13, 2011. The gross deferred tax asset includes amounts that are considered to be net unrealized built-in losses. To the extent these net unrealized losses were realized during the five-year period between July 13, 2011 and July 13, 2016, they were not deductible for federal income tax reporting purposes to the extent they exceeded our overall IRC Section 382 limitation. On July 13, 2016, the limitation on net unrealized built-in losses expired. Therefore, the remaining valuation allowance related to built-in losses was released during the period ended December 31, 2016.
We have certain tax attributes available to offset the impact of future income taxes. The components of net deferred tax assets and liabilities at December 31, 2017 and 2016, consisted of timing differences related to real estate inventory impairment, expense accruals and reserves, provisions for liabilities, and NOL carryforwards. We have approximately $135.8 million in available federal NOL carryforwards. Our deferred tax assets and deferred tax liabilities for the year ending December 31, 2017 are presented net of the adjustments for the effects of tax legislation enacted during the year as discussed above. A summary of these components for the years ending December 31, 2017 and 2016 is as follows:
Year Ended December 31, | ||||||||
(Dollars in thousands) | 2017 | 2016 | ||||||
Deferred tax assets: | ||||||||
Real estate inventory | $ | 47,114 | $ | 99,876 | ||||
Accruals and reserves | 12,872 | 27,519 | ||||||
Other | 14,440 | 23,692 | ||||||
Net operating losses | 44,446 | (1) | 62,181 | |||||
Total deferred tax assets | $ | 118,872 | $ | 213,268 | ||||
Deferred tax liabilities: | ||||||||
Real estate inventory, intangibles, other | (174 | ) | (2,621 | ) | ||||
Foreign exchange | 200 | (3,497 | ) | |||||
Valuation allowance | (760 | ) | (516 | ) | ||||
Total net deferred tax assets | $ | 118,138 | $ | 206,634 | ||||
(1) A portion of our net operating losses is limited by Section 382 of the IRC, stemming from the 2011 acquisition of the Company by our Principal Equityholders, as such acquisition was deemed a change in control as defined by Section 382.
We account for uncertain tax positions in accordance with ASC 740. ASC 740 requires a company to recognize the financial statement effect of a tax position when it is more likely than not based on the technical merits of the position that the position will be sustained upon examination. A tax position that meets the more-likely-than-not recognition threshold is measured to determine the amount of benefit to be recognized in the financial statements based upon the largest amount of benefit that is greater than 50% likely of being realized upon ultimate settlement with a taxing authority that has full knowledge of all
86
relevant information. Our inability to determine that a tax position meets the more-likely-than-not recognition threshold does not mean that the Internal Revenue Service (“IRS”) or any other taxing authority will disagree with the position that we have taken.
The following is a reconciliation of the total amounts of unrecognized tax benefits:
Year Ending December 31, | |||||||||||
(Dollars in thousands) | 2017 | 2016 | 2015 | ||||||||
Beginning of the period | $ | 7,773 | $ | 7,016 | $ | 2,353 | |||||
Increases of current year items | — | 18 | 5,217 | ||||||||
Increases of prior year items | 5,163 | 739 | — | ||||||||
Decreased for tax positions of prior years | — | — | (554 | ) | |||||||
End of the period | $ | 12,936 | $ | 7,773 | $ | 7,016 | |||||
The unrecognized tax benefits increased for the year ending December 31, 2017 due to an increase in prior year reserves related to certain state potential utilization limits on our NOL's. If the unrecognized tax benefits as of December 31, 2017 were to be recognized, approximately $10.3 million would impact the effective tax rate. The amount impacting the Company’s effective rate is calculated by adding accrued interest and penalties to the gross unrecognized tax benefit and subtracting the tax benefit associated with state taxes and interest. These amounts are included in income taxes payable and as a reduction to deferred tax assets in the accompanying Consolidated Balance Sheets at December 31, 2017 and December 31, 2016.
We recognized potential penalties and interest expense on our uncertain tax positions of $1.0 million, $0.4 million, and $0.3 million for the years ended December 31, 2017, 2016, and 2015 respectively, which are included in income tax provision in the accompanying Consolidated Statements of Operations and income taxes payable in the accompanying Consolidated Balance Sheets.
We are currently under examination by certain taxing authorities and anticipate finalizing these examinations during the next twelve months. The outcome of these examinations is not currently determinable. The statute of limitations for our major taxing jurisdictions remains open for examination for tax years 2013 through 2017.
14. STOCKHOLDERS’ EQUITY
Capital Stock
Holders of Class A Common Stock and Class B Common Stock are entitled to one vote for each share held on all matters submitted to stockholders for their vote or approval. The holders of Class A Common Stock and Class B Common Stock vote together as a single class on all matters submitted to stockholders for their vote or approval, except with respect to the amendment of certain provisions of the amended and restated Certificate of Incorporation that would alter or change the powers, preferences or special rights of the Class B Common Stock so as to affect them adversely. Such amendments must be approved by a majority of the votes entitled to be cast by the holders of the shares affected by the amendment, voting as a separate class, or as otherwise required by applicable law. The voting power of the outstanding Class B Common Stock (expressed as a percentage of the total voting power of all Common Stock) is equal to the percentage of partnership interests in New TMM not held directly or indirectly by TMHC.
For the year ended December 31, 2017, we completed multiple sales of our Class A Common Stock in registered public offerings. We used all of the net proceeds from these public offerings to purchase partnership units in New TMM, our direct subsidiary, along with shares of our Class B Common Stock, held by our Principal Equityholders. As a result of net proceeds being distributed to our Principal Equityholders, we adjusted Non-controlling interests - Principal Equityholders and Additional paid-in capital on the Consolidated Balance Sheets to reflect the change in ownership. The aggregate number of partnership units and corresponding shares of Class B Common Stock we purchased was equal to the number of shares of Class A Common Stock sold in the public offerings.
The following is a summary of the completed sales of our Class A Common Stock in registered public offerings.
87
(Shares presented in thousands) | ||||||
Closing date | Number of shares | Net purchase price per share | ||||
February 6, 2017 (1) | 11,500 | $ | 18.2875 | |||
March 27, 2017 | 10,000 | 20.7800 | ||||
May 5, 2017 | 10,000 | 23.1200 | ||||
June 27, 2017 | 10,000 | 23.3000 | ||||
November 13, 2017 | 10,000 | 22.9500 | ||||
(1) Following the close of this public offering, JH Investments no longer owned Class B common stock and therefore had 0.0% ownership interest.
The components and respective voting power of our outstanding Common Stock at December 31, 2017 were as follows (1):
Shares Outstanding | Percentage | ||||
Class A Common Stock | 82,399,996 | 68.9 | % | ||
Class B Common Stock | 37,179,616 | 31.1 | % | ||
Total | 119,579,612 | 100.0 | % | ||
(1) See Note 23 - Subsequent Events for changes to ownership subsequent to December 31, 2017.
Stock Repurchase Program
On September 18, 2017, our Board of Directors authorized an extension of the Company's stock repurchase program through December 31, 2018 and increased the amount available for repurchases under the program to a maximum total amount of $100.0 million of the Company’s Class A Common Stock in open market purchases, privately negotiated transactions or other transactions. The stock repurchase program is subject to prevailing market conditions and other considerations, including our liquidity, the terms of our debt instruments, statutory requirements, planned land investment and development spending, acquisition and other investment opportunities and ongoing capital requirements. During the year ended December 31, 2017 and 2016 there were an aggregate of 195,824 and 1,918,999 shares of Class A Common Stock repurchased for $4.1 million and $28.5 million, respectively. As of December 31, 2017, there was $95.9 million available to be used for repurchases.
15. STOCK BASED COMPENSATION
Equity-Based Compensation
In April 2013, we adopted the Taylor Morrison Home Corporation 2013 Omnibus Equity Award Plan (the "Plan"). The Plan was most recently amended and restated in May 2017. The Plan provides for the grant of stock options, RSUs and other equity awards based on our common stock. As of December 31, 2017 we had an aggregate of 2,827,967 shares of Class A Common Stock available for future grants under the Plan.
The following table provides information regarding the amount of Class A Common Stock available for future grants under the Plan:
Year Ended December 31, | ||||||||
2017 | 2016 | 2015 | ||||||
Balance, beginning | 4,130,264 | 5,992,621 | 6,439,532 | |||||
Grants | (1,441,640 | ) | (2,238,242 | ) | (847,194 | ) | ||
Forfeited/cancelled | 123,793 | 375,682 | 397,580 | |||||
Shares withheld for tax withholdings | 15,550 | 203 | 2,703 | |||||
Balance, ending | 2,827,967 | 4,130,264 | 5,992,621 | |||||
The following table provides information regarding the amount and components of stock-based compensation expense, which is included in general and administrative expenses in the accompanying Consolidated Statements of Operations:
88
(Dollars in thousands) | Year Ended December 31, | ||||||||||
2017 | 2016 | 2015 | |||||||||
Restricted stock units (RSUs) (1) | $ | 6,487 | $ | 6,101 | $ | 3,335 | |||||
Stock options | 4,504 | 3,717 | 4,416 | ||||||||
New TMM Units | 596 | 1,094 | 1,678 | ||||||||
Total stock compensation | $ | 11,587 | $ | 10,912 | $ | 9,429 | |||||
(1) | Includes compensation expense related to restricted stock units and performance restricted stock units. |
At December 31, 2017, 2016, and 2015, the aggregate unamortized value of all outstanding stock-based compensation awards was approximately $19.8 million, $18.8 million, and $15.2 million, respectively.
Stock Options — Options granted to employees vest and become exercisable ratably on the anniversary of the date of grant over four or five years. Options granted to members of the Board of Directors vest and become exercisable ratably on the first, second and third anniversary of the date of grant. Vesting of the options is subject to continued employment with TMHC or an affiliate, or continued service on the Board of Directors, through the applicable vesting dates and expires within ten years from the date of grant.
The following table summarizes stock option activity for the Plan for the year ended December 31, 2017:
Year Ended December 31, | ||||||||||||||||||||
2017 | 2016 | 2015 | ||||||||||||||||||
Number of Options | Weighted Average Exercise Price | Number of Options | Weighted Average Exercise Price | Number of Options | Weighted Average Exercise Price | |||||||||||||||
Outstanding, beginning | 2,431,347 | $ | 17.09 | 1,507,765 | $ | 21.07 | 1,325,029 | $ | 22.35 | |||||||||||
Granted | 792,054 | 19.06 | 1,146,643 | 11.61 | 400,258 | 18.78 | ||||||||||||||
Exercised | (288,808 | ) | 18.13 | (7,786 | ) | 18.73 | — | — | ||||||||||||
Cancelled/forfeited | (80,380 | ) | 18.64 | (215,275 | ) | 15.76 | (217,522 | ) | 24.62 | |||||||||||
Balance, ending | 2,854,213 | $ | 17.50 | 2,431,347 | $ | 17.09 | 1,507,765 | $ | 21.07 | |||||||||||
Options exercisable, at December 31, 2017 | 906,583 | $ | 19.62 | 633,059 | $ | 21.50 | 267,168 | $ | 21.98 | |||||||||||
As of December 31, | |||||||||||
(Dollars in thousands) | 2017 | 2016 | 2015 | ||||||||
Unamortized value of unvested stock options (net of estimated forfeitures) | $ | 6,749 | $ | 7,317 | $ | 8,135 | |||||
Weighted-average period (in years) that expense is expected to be recognized | 2.4 | 2.3 | 2.6 | ||||||||
Weighted-average remaining contractual life (in years) for options outstanding | 7.5 | 7.7 | 7.9 | ||||||||
Weighted-average remaining contractual life (in years) for options exercisable | 6.1 | 6.1 | 7.3 | ||||||||
The fair value of each option granted is estimated on the date of grant using the Black-Scholes option pricing model. Expected volatilities and expected term are based on the historical information of comparable publicly traded homebuilders. Due to the limited number and homogeneous nature of option holders, the expected term was evaluated using a single group. The risk-free rate is based on the U.S. Treasury yield curve for periods equivalent to the expected term of the options on the grant date. The fair value of stock option awards is recognized evenly over the vesting period of the options.
The following table summarizes the weighted-average assumptions and fair value used for stock options grants:
Year Ended December 31, | |||||
2017 | 2016 | 2015 | |||
Expected dividend yield | —% | —% | —% | ||
Expected volatility | 24.37% | 29.83% | 48.66% | ||
Risk-free interest rate | 2.12% | 1.35% | 1.27% | ||
Expected term (in years) | 6.25 | 6.25 | 4.50 | ||
Weighted average fair value of options granted during the period | $5.56 | $3.72 | $7.73 | ||
89
The following table provides information pertaining to the aggregate intrinsic value of options outstanding and exercisable at December 31, 2017, 2016, and 2015:
As of December 31, | |||||||||||
(Dollars in thousands) | 2017 | 2016 | 2015 | ||||||||
Aggregate intrinsic value of options outstanding | $ | 19,891 | $ | 8,054 | $ | — | |||||
Aggregate intrinsic value of options exercisable | $ | 4,400 | $ | 50 | $ | — | |||||
The aggregate intrinsic value is based on the market price of our Class A Common Stock on December 29, 2017, the last trading day in December 2017, which was $24.47, less the applicable exercise price of the underlying option. This
aggregate intrinsic value represents the amount that would have been realized if all the option holders had exercised their options on December 31, 2017.
Performance-Based Restricted Stock Units – In April 2013, awards of performance-based restricted stock units (“PRSUs”) were granted to certain senior management and members of the Board in connection with the IPO. As of December 31, 2015 the performance condition was not met, therefore all of the PRSUs granted subject to the performance condition were automatically forfeited without consideration and are of no further force or effect.
In 2016 and 2017, we issued PRSUs to certain employees of the Company. These awards will vest in full based on the achievement of certain performance goals over a three-year performance period, subject to the employee’s continued employment through the last date of the performance period and will be settled in shares of our Class A common stock. The number of shares that may be issued in settlement of the PRSUs to the award recipients may be greater or lesser than the target award amount depending on actual performance achieved as compared to the performance targets set forth in the awards.
The following table summarizes the activity of our PRSUs:
Year Ended December 31, | ||||||||
2017 | 2016 | 2015 | ||||||
Balance, beginning | 824,217 | 254,543 | 175,790 | |||||
Granted | 392,404 | 674,525 | 260,144 | |||||
Vested | — | — | (2,885 | ) | ||||
Forfeited | (25,881 | ) | (104,851 | ) | (178,506 | ) | ||
Balance, ending | 1,190,740 | 824,217 | 254,543 | |||||
Year Ended December 31, | |||||||||||
(Dollars in thousands): | 2017 | 2016 | 2015 | ||||||||
PRSU expense recognized during the year ended December 31 | $ | 3,257 | $ | 4,016 | $ | 2,405 | |||||
Unamortized value of PRSUs at December 31 | $ | 6,756 | $ | 6,390 | $ | 4,520 | |||||
Weighted-average period expense is expected to be recognized (in years) | 1.8 | 1.9 | 1.9 | ||||||||
Non-Performance-Based Restricted Stock Units — Our non-performance-based restricted stock units (“RSUs”) consist of shares of our Class A Common Stock that have been awarded to our employees and members of our Board of Directors. Vesting of RSUs is subject to continued employment with TMHC or an affiliate, or continued service on the Board of Directors, through the applicable vesting dates. Time-based RSUs granted to employees generally become vested with respect to 33% of the RSUs on the second, third, and fourth anniversaries of the grant date. Time-based RSUs granted to members of the Board of Directors will become fully vested on the first anniversary of the grant date.
90
The following tables summarize the activity of our RSUs:
Year Ended December 31, | ||||||||||||||||||||
2017 | 2016 | 2015 | ||||||||||||||||||
(Dollars in thousands except per share data): | Number of RSUs | Weighted Average Grant Date Fair Value | Number of RSUs | Weighted Average Grant Date Fair Value | Number of RSUs | Weighted Average Grant Date Fair Value | ||||||||||||||
Outstanding, beginning | 534,484 | $ | 14.01 | 186,753 | $ | 18.88 | 9,888 | $ | 22.25 | |||||||||||
Granted | 257,182 | 19.48 | 417,074 | 11.99 | 186,792 | 18.85 | ||||||||||||||
Vested | (75,315 | ) | 17.43 | (13,787 | ) | 19.66 | (8,375 | ) | 22.15 | |||||||||||
Forfeited | (17,532 | ) | 14.10 | (55,556 | ) | 13.83 | (1,552 | ) | 18.73 | |||||||||||
Balance, ending | 698,819 | $ | 15.65 | 534,484 | $ | 14.01 | 186,753 | $ | 18.88 | |||||||||||
Year Ended December 31, | |||||||||||
(Dollars in thousands): | 2017 | 2016 | 2015 | ||||||||
RSU expense recognized during the year ended December 31 | $ | 3,148 | $ | 2,086 | $ | 930 | |||||
Unamortized value of RSUs at December 31 | $ | 6,261 | $ | 4,666 | $ | 2,527 | |||||
Weighted-average period expense is expected to be recognized (in years) | 2.5 | 2.7 | 3.0 | ||||||||
The Plan permits us to withhold from the total number of shares that would otherwise be distributed to a recipient on vesting of an RSU, an amount equal to the number of shares having a fair value at the time of distribution equal to the applicable income tax withholdings due and remit the remaining RSU shares to the recipient. During the twelve months ended December 31, 2017 and 2016, a total of 15,550 and 203 shares, respectively, were withheld on net settlement for a de minimis amount.
Equity-Based Compensation Prior to the IPO
New TMM Units — Certain members of management and certain members of the Board of Directors were issued Class M partnership units in TMM Holdings. Those units were subject to both time and performance vesting conditions. In addition, TMM Holdings issued phantom Class M Units to certain employees who resided in Canada, which are treated as Class M Units for the purposes of this description and the financial statements. In connection with the sale of Monarch, all of the phantom Class M Units were settled pursuant to change in control provisions provided for in the award agreement. In the year ended December 31, 2015, we paid $1.4 million in settlement of these awards; however, there was no activity for the years ended December 31, 2017 and 2016.
Pursuant to the Reorganization Transactions, the time-vesting Class M Units in TMM Holdings were exchanged for New TMM Units with vesting terms substantially the same as the Class M Units surrendered for exchange. One New TMM Unit together with a corresponding share of Class B Common Stock is exchangeable for one share of Class A Common Stock. The shares of Class B Common Stock/New TMM Units outstanding as of December 31, 2017, 2016, and 2015 were as follows:
Year Ended December 31, | ||||||||||||||||||||
2017 | 2016 | 2015 | ||||||||||||||||||
Number of Awards | Weighted Average Grant Date Fair Value | Number of Awards | Weighted Average Grant Date Fair Value | Number of Awards | Weighted Average Grant Date Fair Value | |||||||||||||||
Outstanding, beginning | 1,146,357 | $ | 5.58 | 1,312,874 | $ | 5.45 | 1,431,721 | $ | 5.11 | |||||||||||
Exchanges (1) | (260,389 | ) | 6.72 | (159,863 | ) | 4.34 | (87,055 | ) | 3.88 | |||||||||||
Forfeited (2) | (2,047 | ) | 8.52 | (6,654 | ) | 8.63 | (31,792 | ) | 5.24 | |||||||||||
Balance, ending | 883,921 | $ | 5.24 | 1,146,357 | $ | 5.58 | 1,312,874 | $ | 5.45 | |||||||||||
Unvested New TMM Units included in ending balance (3) | — | $ | — | 80,178 | $ | 8.73 | 419,855 | $ | 5.85 | |||||||||||
(1) | Exchanges during the period represent the exchange of a vested New TMM Unit along with the corresponding share of Class B Common Stock for a newly issued share of Class A Common Stock. |
(2) | Awards forfeited during the period represent the unvested portion of New TMM Unit awards for employees who have terminated employment with the Company and for which the New TMM Unit and the corresponding Class B Share have been canceled. |
(3) | All New TMM units vested as of December 31, 2017. |
91
Year Ended December 31, | |||||||||||
(Dollars in thousands): | 2017 | 2016 | 2015 | ||||||||
Unamortized value of New TMM Units | $ | — | $ | 417 | $ | 1,568 | |||||
Weighted-average period expense is expected to be recognized (in years) | — | 0.6 | 0.8 | ||||||||
There are no unissued New TMM Unit awards remaining under the Class M Unit Plan and we do not intend to grant any future awards under the Class M Unit Plan.
16. RELATED-PARTY TRANSACTIONS
From time to time, we may engage in transactions with entities or persons that are affiliated with us or one or more of the Principal Equityholders. For the year ended December 31, 2017, we engaged in multiple equity offering transactions with our principal equityholders. Refer to Note 14-Stockholders' Equity and Note 23 - Subsequent Events for discussion regarding such transactions. In August 2017, we closed on the purchase 140 home lots in Tustin, California for a total purchase price of $30.0 million from Intracorp Companies, which is owned and controlled by a member of the Board of Directors. In October 2017, we also completed the purchase of 112 acres of land in South Carolina for $10.5 million. The land was purchased from IOTA Doby Bridge, LLC which is managed and partly owned by Gibralter Capital and Asset Management, LLC, a fund managed by one of our principal equityholders, Oaktree Capital.
For the year ended December 31, 2016, there were no transactions with affiliates.
In May 2015, one of our subsidiaries formed a joint venture, Pacific Point Development Partners LLC ("PPDP"), with affiliates of Oaktree Capital Management, L.P. and DMB Pacific Ventures to acquire and develop Pacifica San Juan, a coastal residential development in San Juan Capistrano, California. The acquisition of the Pacifica San Juan site from Lehman Brothers Holdings, Inc. occurred on May 19, 2015. Our subsidiary has made an initial capital investment of approximately $16.8 million in PPDP and is a minority capital partner and also the operating partner responsible for land development and homebuilding on the Pacifica San Juan site. In May 2015, PPDP entered into an approximately $257.9 million non-recourse construction and development loan with affiliates of Starwood Property Mortgage, L.L.C. as initial lender and administrative agent to finance development and home construction at the Pacifica San Juan site. In connection with entering into the loan agreement, one of our subsidiaries provided the lenders with customary guarantees, including completion, indemnity and environmental guidelines subject to usual non-recourse terms.
17. EMPLOYEE BENEFIT, RETIREMENT, AND DEFERRED COMPENSATION PLANS
We maintain a defined contribution plan pursuant to Section 401(k) of the IRC (“401(k) Plan”). Each eligible employee may elect to make before-tax contributions up to the current tax limits. We match 100% of employees’ voluntary contributions up to 1% of eligible compensation, and 50% for each dollar contributed between 1% and 6% of eligible compensation. We contributed $7.8 million, $3.7 million, and $3.0 million to the 401(k) Plan for the twelve months ended December 31, 2017, 2016, and 2015, respectively.
The Taylor Woodrow (USA) U.K. Supplementary Pension Plan is an unfunded, nonqualified pension plan for several individuals who transferred from the Company’s U.K. related companies to the employment of Taylor Woodrow on or before October 1, 1995. The recorded obligations represent benefits accrued by these individuals for service with Taylor Woodrow prior to the employees’ participation in the U.S. pension plan minus any benefit accrued in any other pension-type benefit plans sponsored by or contributed to a Taylor Woodrow Group-related company for the period of service prior to participation in the U.S. plan. In accordance with the plan document, the participants are entitled to a fixed monthly pension and a fixed survivor benefit after the age of 65. We had $1.6 million accrued at December 31, 2017 and 2016, for obligations under this plan. These obligations are recorded in accrued expenses and other liabilities on the accompanying Consolidated Balance Sheets.
We also maintain the Taylor Morrison Cash Balance Pension Plan (the “U.S. Cash Balance Plan”). This is a consolidated defined benefit plan arising from the 2007 merger of the parent companies of Taylor Woodrow Holdings (USA), Inc. and Morrison Homes, Inc. All full-time employees were eligible to participate in this plan. The contribution percentage is based on participant’s age and ranges from 2% to 4% of eligible compensation, plus 1% of eligible compensation over the social security wage base. For the year ended December 31, 2017, we had no contributions to the plan. For the years ended December 31, 2016 and 2015, we contributed $0.8 million and $0.9 million, respectively, to the plan. At December 31, 2017 and 2016, the unfunded status of the plan was $8.1 million and $8.3 million, respectively. These obligations are recorded in accrued expenses and other liabilities on the accompanying Consolidated Balance Sheets. Effective December 31, 2010, the U.S. Cash Balance
92
Plan was amended to freeze participation so that no new or reemployed employees may become participants and to freeze all future benefit accruals to existing participants.
The changes in the total benefit obligation and in the fair value of assets and the funded status of the U.S. Cash Balance Plan are as follows:
Year Ended December 31, | |||||||
(Dollars in thousands) | 2017 | 2016 | |||||
Change in benefit obligations: | |||||||
Benefit obligation — beginning of period | $ | 32,384 | $ | 32,172 | |||
Interest on liabilities | 1,245 | 1,289 | |||||
Benefits paid | (1,772 | ) | (1,139 | ) | |||
Actuarial loss | 2,321 | 62 | |||||
Benefit obligation — end of period | $ | 34,178 | $ | 32,384 | |||
Change in fair value of plan assets: | |||||||
Fair value of plan assets — beginning of period | 24,117 | 22,910 | |||||
Return on plan assets | 3,720 | 1,558 | |||||
Employer contributions | — | 788 | |||||
Benefits paid | (1,773 | ) | (1,139 | ) | |||
Fair value of plan assets — end of period | $ | 26,064 | $ | 24,117 | |||
Unfunded status — end of period | $ | 8,114 | $ | 8,267 | |||
The significant weighted-average assumptions adopted in measuring the benefit obligations and net periodic pension costs are as follows:
Year Ended December 31, | ||||||||
2017 | 2016 | 2015 | ||||||
Discount rate: | ||||||||
Net periodic pension cost | 3.97 | % | 4.15 | % | 3.84 | % | ||
Pension obligation | 3.42 | 3.97 | 4.15 | |||||
Expected return on plan assets | 6.00 | 6.00 | 7.00 | |||||
The overall expected long-term rate of return on plan assets assumption is determined based on the plan’s targeted allocation among asset classes and the weighted-average expected return of each class. The expected return of each class is determined based on the current yields on inflation-indexed bonds, current forecasts of inflation, and long-term historical real returns.
Components of net periodic pension cost of the U.S. Cash Balance Plan are as follows:
Year Ended December 31, | |||||||||||
(Dollars in thousands) | 2017 | 2016 | 2015 | ||||||||
Interest cost | $ | 1,245 | $ | 1,289 | $ | 1,290 | |||||
Amortization of net actuarial loss | 147 | 132 | 134 | ||||||||
Expected return on plan assets | (1,377 | ) | (1,342 | ) | (1,630 | ) | |||||
Net settlement loss | — | — | — | ||||||||
Net periodic pension cost | $ | 15 | $ | 79 | $ | (206 | ) | ||||
Accumulated other comprehensive loss of $7.6 million and $7.8 million as of December 31, 2017 and 2016, respectively, has not yet been recognized as a component of net periodic pension cost. Net settlement losses are included in general and administrative expenses in the accompanying Consolidated Statements of Operations for the year ended December 31, 2017. We expect approximately $0.1 million of the amounts in accumulated other comprehensive loss will be recognized into net periodic pension cost during the year ending December 31, 2018.
93
The estimated future benefit payments in the next five years and the five years thereafter in aggregate are as follows (dollars in thousands):
Year Ending December 31, | Benefit Payments | ||
2018 | $ | 1,468 | |
2019 | 1,254 | ||
2020 | 1,339 | ||
2021 | 1,427 | ||
2022 | 1,382 | ||
2023–2027 | $ | 8,905 | |
We do not expect to contribute to the U.S. Cash Balance Plan in the year ending December 31, 2018. The fair value of the U.S. Cash Balance Plan’s assets by asset categories is as follows:
(Dollars in thousands) | Fair Value Measurements at December 31, 2017 | ||||||||||||||
Asset Category | Level 1 | Level 2 | Level 3 | Total | |||||||||||
Fixed-income securities | $ | 12,250 | $ | — | $ | — | $ | 12,250 | |||||||
U.S. equity securities | 9,122 | — | — | 9,122 | |||||||||||
International equity securities | 3,128 | — | — | 3,128 | |||||||||||
Cash | 1,043 | — | — | 1,043 | |||||||||||
Other | 521 | — | — | 521 | |||||||||||
Total | $ | 26,064 | $ | — | $ | — | $ | 26,064 | |||||||
(Dollars in thousands) | Fair Value Measurements at December 31, 2016 | ||||||||||||||
Asset Category | Level 1 | Level 2 | Level 3 | Total | |||||||||||
Fixed-income securities | $ | 11,625 | $ | — | $ | — | $ | 11,625 | |||||||
U.S. equity securities | 8,731 | — | — | 8,731 | |||||||||||
International equity securities | 2,822 | — | — | 2,822 | |||||||||||
Cash | 409 | — | — | 409 | |||||||||||
Other | 530 | — | — | 530 | |||||||||||
Total | $ | 24,117 | $ | — | $ | — | $ | 24,117 | |||||||
We believe the U.S. Cash Balance Plan’s assets are invested in a manner consistent with generally accepted standards of fiduciary responsibility. Taylor Morrison’s primary investment objective is to build and maintain the plan’s assets through employer contributions and investment returns to satisfy legal requirements and benefit payment requirements when due. Because of the long-term nature of the plan’s obligations, Taylor Morrison has the following goals in managing the plan: long-term (i.e., five years and more) performance objectives, maintenance of cash reserves sufficient to pay benefits, and achievement of the highest long-term rate of return practicable without taking excessive risk that could jeopardize the plan’s funding policy or subject us to undue funding volatility. The investment portfolio contains a diversified blend of equity, fixed-income securities, and cash, though allocation will favor equity investments in order to reach the U.S. Cash Balance Plan’s stated objectives. One of the U.S. Cash Balance Plan’s investment criteria is that over a complete market cycle, each of the investment funds should typically rank in the upper half of the universe of all active investment funds in the same asset class with similar investment objectives. Investments in commodities, private placements, or letter stock are not permitted. The equity securities are diversified across U.S. and international stocks, as well as growth and value. Investment performance is measured and monitored on an ongoing basis through quarterly portfolio reviews and annual reviews relative to the objectives and guidelines of the plan.
94
The range of target allocation percentages of plan assets of the U.S. Cash Balance Plan is as follows:
Minimum | Maximum | Target | ||||||
U.S. equity securities | 33 | % | 43 | % | 38 | % | ||
International equity securities | 7 | 17 | 12 | |||||
Fixed-income securities | 40 | 50 | 45 | |||||
Other | — | 10 | 5 | |||||
100 | % | |||||||
18. ACCUMULATED OTHER COMPREHENSIVE INCOME
The table below provides the components of accumulated other comprehensive income (loss):
Year Ended December 31, 2017 | |||||||||||||||
(Dollars in thousands) | Total Post- Retirement Benefits Adjustments | Foreign Currency Translation Adjustments | Non-controlling Interest in Principal Equityholders | Total | |||||||||||
Balance, beginning of period | $ | 2,061 | $ | (79,927 | ) | $ | 59,877 | $ | (17,989 | ) | |||||
Other comprehensive loss before reclassifications | 21 | — | — | 21 | |||||||||||
Other comprehensive income net of tax | $ | 21 | $ | — | $ | — | $ | 21 | |||||||
Gross amounts reclassified within accumulated other comprehensive income | — | 34,722 | (34,722 | ) | — | ||||||||||
Balance, end of period | $ | 2,082 | $ | (45,205 | ) | $ | 25,155 | $ | (17,968 | ) | |||||
Year Ended December 31, 2016 | |||||||||||||||
(Dollars in thousands) | Total Post- Retirement Benefits Adjustments | Foreign Currency Translation Adjustments | Non-controlling Interest in Principal Equityholders | Total | |||||||||||
Balance, beginning of period | $ | 2,305 | $ | (79,927 | ) | $ | 59,625 | $ | (17,997 | ) | |||||
Other comprehensive loss before reclassifications | (244 | ) | (244 | ) | |||||||||||
Other comprehensive loss net of tax | $ | (244 | ) | $ | — | $ | — | $ | (244 | ) | |||||
Gross amounts reclassified within accumulated other comprehensive income | — | — | 252 | 252 | |||||||||||
Balance, end of period | $ | 2,061 | $ | (79,927 | ) | $ | 59,877 | $ | (17,989 | ) | |||||
Year Ended December 31, 2015 | |||||||||||||||
(Dollars in thousands) | Total Post- Retirement Benefits Adjustments | Foreign Currency Translation Adjustments | Non-controlling Interest in Principal Equityholders | Total | |||||||||||
Balance, beginning of period | $ | 692 | $ | (52,148 | ) | $ | 40,546 | $ | (10,910 | ) | |||||
Other comprehensive loss before reclassifications | (335 | ) | (27,779 | ) | — | (28,114 | ) | ||||||||
Gross amounts reclassified from accumulated other comprehensive loss | 1,488 | — | — | 1,488 | |||||||||||
Foreign currency translation | 518 | — | — | 518 | |||||||||||
Income tax expense | (58 | ) | — | — | (58 | ) | |||||||||
Other comprehensive income/(loss) net of tax | $ | 1,613 | $ | (27,779 | ) | $ | — | $ | (26,166 | ) | |||||
Gross amounts reclassified within accumulated other comprehensive income | — | — | 19,079 | 19,079 | |||||||||||
Balance, end of period | $ | 2,305 | $ | (79,927 | ) | $ | 59,625 | $ | (17,997 | ) | |||||
Reclassifications for the amortization of the employee retirement plans are included in selling, general and administrative expense in the accompanying Consolidated Statements of Operations.
19. OPERATING AND REPORTING SEGMENTS
95
We have multiple homebuilding operating components which are engaged in the business of acquiring and developing land, constructing homes, marketing and selling those homes, and providing warranty and customer service. We aggregate our homebuilding operating components into reporting segments, East, Central, and West, based on similar long-term economic characteristics. We also have a mortgage and title services reporting segment. We have no inter-segment sales as all sales are to external customers.
During the quarter ended March 31, 2017, we realigned our homebuilding operating divisions within our existing segments
based on geographic location and management's long term strategic plans. As a result, all historical periods presented in the
segment information have been reclassified to give effect to this segment realignment.
Our reporting segments are as follows:
East | Atlanta, Charlotte, Chicago, Orlando, Raleigh, Southwest Florida, and Tampa | |
Central | Austin, Dallas, Denver and Houston | |
West | Bay Area, Phoenix, Sacramento, and Southern California | |
Mortgage Operations | Taylor Morrison Home Funding (TMHF) and Inspired Title | |
Operating results for each segment may not be indicative of the results for such segment had it been an independent, stand-alone entity. Segment information is as follows:
Year Ended December 31, 2017 | |||||||||||||||||||||||
(Dollars in thousands) | East | Central | West | Mortgage Operations | Corporate and Unallocated | Total | |||||||||||||||||
Total revenues | $ | 1,383,864 | $ | 1,112,984 | $ | 1,319,306 | $ | 69,136 | $ | — | $ | 3,885,290 | |||||||||||
Gross margin | $ | 284,722 | $ | 206,386 | $ | 220,337 | $ | 27,484 | $ | — | $ | 738,929 | |||||||||||
Selling, general and administrative expense | (122,218 | ) | (105,945 | ) | (79,223 | ) | — | (83,054 | ) | (390,440 | ) | ||||||||||||
Equity in income of unconsolidated entities | 213 | 1,246 | 1,422 | 5,965 | — | 8,846 | |||||||||||||||||
Interest and other (expense)/income, net | (314 | ) | 360 | (190 | ) | — | (1,535 | ) | (1,679 | ) | |||||||||||||
Income from continuing operations before income taxes | $ | 162,403 | $ | 102,047 | $ | 142,346 | $ | 33,449 | $ | (84,589 | ) | $ | 355,656 | ||||||||||
Year Ended December 31, 2016 | |||||||||||||||||||||||
(Dollars in thousands) | East | Central | West | Mortgage Operations | Corporate and Unallocated | Total | |||||||||||||||||
Total revenues | $ | 1,140,377 | $ | 1,129,533 | $ | 1,220,164 | $ | 59,955 | $ | — | $ | 3,550,029 | |||||||||||
Gross margin | $ | 239,550 | $ | 205,574 | $ | 207,299 | $ | 27,856 | $ | — | $ | 680,279 | |||||||||||
Selling, general and administrative expense | (107,792 | ) | (102,544 | ) | (77,147 | ) | — | (74,280 | ) | (361,763 | ) | ||||||||||||
Equity in income of unconsolidated entities | 440 | 430 | 2,322 | 4,261 | — | 7,453 | |||||||||||||||||
Interest and other (expense)/income, net | (6,988 | ) | (2,404 | ) | (419 | ) | — | (1,952 | ) | (11,763 | ) | ||||||||||||
Income from continuing operations before income taxes | $ | 125,210 | $ | 101,056 | $ | 132,055 | $ | 32,117 | $ | (76,232 | ) | $ | 314,206 | ||||||||||
96
Year Ended December 31, 2015 | |||||||||||||||||||||||
(Dollars in thousands) | East | Central | West | Mortgage Operations | Corporate and Unallocated | Total | |||||||||||||||||
Revenue | $ | 842,701 | $ | 1,100,198 | $ | 990,839 | $ | 43,082 | $ | — | $ | 2,976,820 | |||||||||||
Gross margin | $ | 179,938 | $ | 201,973 | $ | 168,458 | $ | 17,546 | $ | — | $ | 567,915 | |||||||||||
Selling, general and administrative expense | (76,430 | ) | (92,031 | ) | (62,296 | ) | — | (63,154 | ) | (293,911 | ) | ||||||||||||
Equity in income of unconsolidated entities | 241 | 150 | (836 | ) | 2,204 | — | 1,759 | ||||||||||||||||
Interest and other (expense)/income, net | (3,343 | ) | (13,888 | ) | (334 | ) | — | 6,123 | (11,442 | ) | |||||||||||||
Loss on extinguishment of debt | — | — | — | — | (33,317 | ) | (33,317 | ) | |||||||||||||||
Gain of foreign currency forward | — | — | — | — | 29,983 | 29,983 | |||||||||||||||||
Income from continuing operations before income taxes | $ | 100,406 | $ | 96,204 | $ | 104,992 | $ | 19,750 | $ | (60,365 | ) | $ | 260,987 | ||||||||||
As of December 31, 2017 | ||||||||||||||||||||||||
(Dollars in thousands) | East | Central | West | Mortgage Operations | Corporate and Unallocated | Total | ||||||||||||||||||
Real estate inventory and land deposits | $ | 1,150,918 | $ | 818,431 | $ | 1,039,655 | $ | — | $ | — | $ | 3,009,004 | ||||||||||||
Investments in unconsolidated entities | 29,316 | 32,874 | 126,559 | 3,615 | — | 192,364 | ||||||||||||||||||
Other assets | 85,753 | 124,593 | 53,492 | 225,641 | 635,046 | 1,124,525 | ||||||||||||||||||
Total assets | $ | 1,265,987 | $ | 975,898 | $ | 1,219,706 | $ | 229,256 | $ | 635,046 | $ | 4,325,893 | ||||||||||||
As of December 31, 2016 | ||||||||||||||||||||||||
(Dollars in thousands) | East | Central | West | Mortgage Operations | Corporate and Unallocated | Total | ||||||||||||||||||
Real estate inventory and land deposits | $ | 1,110,339 | $ | 829,355 | $ | 1,114,758 | $ | — | $ | — | $ | 3,054,452 | ||||||||||||
Investments in unconsolidated entities | 25,923 | 30,146 | 98,625 | 3,215 | — | 157,909 | ||||||||||||||||||
Other assets | 80,320 | 139,383 | 43,304 | 269,131 | 476,427 | 1,008,565 | ||||||||||||||||||
Total assets | $ | 1,216,582 | $ | 998,884 | $ | 1,256,687 | $ | 272,346 | $ | 476,427 | $ | 4,220,926 | ||||||||||||
As of December 31, 2015 | ||||||||||||||||||||||||
(Dollars in thousands) | East | Central | West | Mortgage Operations | Corporate and Unallocated | Total | ||||||||||||||||||
Real estate inventory and land deposits | $ | 958,057 | $ | 864,871 | $ | 1,337,972 | $ | — | $ | — | $ | 3,160,900 | ||||||||||||
Investments in unconsolidated entities | 24,098 | 28,834 | 72,644 | 2,872 | — | 128,448 | ||||||||||||||||||
Other assets | 61,272 | 166,146 | 63,970 | 237,430 | 304,281 | 833,099 | ||||||||||||||||||
Total assets | $ | 1,043,427 | $ | 1,059,851 | $ | 1,474,586 | $ | 240,302 | $ | 304,281 | $ | 4,122,447 | ||||||||||||
20. SELECTED QUARTERLY FINANCIAL DATA (UNAUDITED)
Quarterly results are as follows(1):
(Dollars in thousands except per share data) | First Quarter 2017 | Second Quarter 2017 | Third Quarter 2017 | Fourth Quarter 2017 | |||||||||||
Total revenues | $ | 769,090 | $ | 908,494 | $ | 908,027 | $ | 1,299,679 | |||||||
Gross margin | 141,693 | 171,420 | 171,318 | 254,498 | |||||||||||
Income from continuing operations before income taxes | 54,474 | 78,406 | 78,975 | 143,801 | |||||||||||
Net income before allocation to non-controlling interests (2) | 35,601 | 55,930 | 54,693 | 30,426 | |||||||||||
Net income available to Taylor Morrison Home Corporation(2) | 11,476 | 27,401 | 32,876 | 19,966 | |||||||||||
Basic and diluted earnings per share(2) | $ | 0.30 | $ | 0.46 | $ | 0.45 | $ | 0.26 | |||||||
97
(Dollars in thousands except per share data) | First Quarter 2016 | Second Quarter 2016 | Third Quarter 2016 | Fourth Quarter 2016 | |||||||||||
Total revenues | $ | 645,329 | $ | 854,316 | $ | 853,417 | $ | 1,196,967 | |||||||
Gross margin | 118,641 | 159,752 | 178,854 | 223,032 | |||||||||||
Income from continuing operations before income taxes | 38,991 | 67,768 | 90,391 | 117,056 | |||||||||||
Net income before allocation to non-controlling interests | 26,104 | 45,664 | 58,684 | 76,111 | |||||||||||
Net income available to Taylor Morrison Home Corporation | 6,813 | 11,685 | 14,837 | 19,281 | |||||||||||
Basic and diluted earnings per share | $ | 0.21 | $ | 0.37 | $ | 0.49 | $ | 0.63 | |||||||
(1) The sum of the individual quarterly amounts may not agree to the annual amounts included in the accompanying consolidated statements of operations due to rounding.
(2) 2017 amounts include impacts of the Tax Act, which was an aggregate $61.0 million expense.
21. COMMITMENTS AND CONTINGENCIES
Letters of Credit and Surety Bonds — We are committed, under various letters of credit and surety bonds, to perform certain development and construction activities and provide certain guarantees in the normal course of business. Outstanding letters of credit and surety bonds under these arrangements totaled $331.7 million and $302.8 million as of December 31, 2017 and 2016, respectively. Although significant development and construction activities have been completed related to these site improvements, the bonds are generally not released until all development and construction activities are completed. We do not believe that it is probable that any outstanding bonds as of December 31, 2017 will be drawn upon.
Purchase Commitments — We are subject to the usual obligations associated with entering into contracts (including option contracts) for the purchase, development, and sale of real estate in the routine conduct of its business. We have a number of land purchase option contracts, generally through cash deposits, for the right to purchase land or lots at a future point in time with predetermined terms. We do not have title to the property and the creditors generally have no recourse. Our obligations with respect to the option contracts are generally limited to the forfeiture of the related non-refundable cash deposits. At December 31, 2017 and 2016, we had the right to purchase approximately 5,037 and 7,583 lots under land option and land purchase contracts, respectively, which represents an aggregate purchase price of $405.3 million and $542.6 million at December 31, 2017 and 2016, respectively. At December 31, 2017 and 2016, we had $49.8 million and $37.2 million in land deposits related to land options and land purchase contracts, respectively.
Legal Proceedings — We are involved in various litigation and legal claims in the normal course of business, including actions brought on behalf of various classes of claimants. We are also subject to a variety of local, state, and federal laws and regulations related to land development activities, house construction standards, sales practices, mortgage lending
operations, employment practices, and protection of the environment. As a result, we are subject to periodic examination or inquiry by various governmental agencies that administer these laws and regulations.
We establish liabilities for legal claims and regulatory matters when such matters are both probable of occurring and any potential loss can be reasonably estimated. At December 31, 2017 and 2016, our legal accruals were $2.3 million and $4.4 million, respectively. We accrue for such matters based on the facts and circumstances specific to each matter and revise these estimates as the matters evolve. In such cases, there may exist an exposure to loss in excess of any amounts currently accrued. Predicting the ultimate resolution of the pending matters, the related timing, or the eventual loss associated with these matters is inherently difficult. Accordingly, the liability arising from the ultimate resolution of any matter may exceed the estimate reflected in the recorded reserves relating to such matter. While the outcome of such contingencies cannot be predicted with certainty, we do not believe that the resolution of such matters will have a material adverse impact on our results of operations, financial position, or cash flows.
Operating Leases — We lease office facilities and certain equipment under operating lease agreements. In most cases, we expect that, in the normal course of business, leases that expire will be renewed or replaced by other leases. Approximate future minimum payments under the non-cancelable leases in effect at December 31, 2017, are as follows (in thousands):
98
Years Ending December 31, | Lease Payments | ||
2018 | $ | 8,010 | |
2019 | 6,198 | ||
2020 | 4,344 | ||
2021 | 3,784 | ||
2022 | 2,654 | ||
Thereafter | 2,922 | ||
Total | $ | 27,912 | |
Rent expense under non-cancelable operating leases for the year ended December 31, 2017, 2016 and 2015, was $5.7 million, $5.3 million and $4.4 million, respectively, and is included in general and administrative expenses in the accompanying Consolidated Statements of Operations.
99
22. MORTGAGE HEDGING ACTIVITIES
We enter into IRLCs to originate residential mortgage loans held for sale, at specified interest rates and within a specified period of time (generally between 30 and 60 days), with customers who have applied for a loan and meet certain credit and underwriting criteria. These IRLCs meet the definition of a derivative and are reflected on the balance sheet at fair value with changes in fair value recognized in mortgage operations revenue/expenses on the statement of operations and other comprehensive income. Unrealized gains and losses on the IRLCs, reflected as derivative assets, are measured based on the fair value of the underlying mortgage loan, quoted Agency MBS prices, estimates of the fair value of the mortgage servicing rights (“MSRs”) and the probability that the mortgage loan will fund within the terms of the IRLC, net of commission expense and broker fees. The fair value of the forward loan sales commitment and mandatory delivery commitments being used to hedge the IRLCs and mortgage loans held for sale not committed to be purchased by investors are based on quoted Agency MBS prices.
The following summarizes derivative instrument assets (liabilities) as of the periods presented:
As of | ||||||||||||||||
December 31, 2017 | December 31, 2016 | |||||||||||||||
(Dollars in thousands) | Fair Value | Notional Amount | Fair Value | Notional Amount | ||||||||||||
IRLCs | $ | 1,584 | $ | 73,817 | $ | 1,987 | $ | 61,655 | ||||||||
MBSs | (232 | ) | 118,078 | 304 | 97,000 | |||||||||||
Total | $ | 1,352 | $ | 2,291 | ||||||||||||
Total commitments to originate loans approximated $80.0 million and $96.0 million for the years ended December 31, 2017 and 2016. This amount represents the commitments to originate loans for both best efforts and mandatory loans that have been locked and approved by underwriting. The notional amounts in the table above includes mandatory and best effort loans, that have been locked and approved by underwriting.
We have exposure to credit loss in the event of contractual non-performance by our trading counterparties in derivative instruments that we use in our rate risk management activities. We manage this credit risk by selecting only counterparties that we believe to be financially strong, spreading the risk among multiple counterparties, by placing contractual limits on the amount of unsecured credit extended to any single counterparty, and by entering into netting agreements with counterparties, as appropriate. Commitments to originate loans do not necessarily reflect future cash requirements as some commitments are expected to expire without being drawn upon.
23. SUBSEQUENT EVENTS
On January 11, 2018 we completed the sale of 11.0 million shares of our Class A common stock in a registered public offering at a net purchase price per share of $26.05. On January 17, 2018, we completed additional sale of 19.2 million shares of Class A common stock in a registered public offering at a net purchase per share of $27.14. The shares consisted of 17.7 million shares of Class A common stock offered by the Company and 1.5 million shares offered directly by our Principal Equityholder, TPG. We used all of the net proceeds from both public offerings to purchase partnership units in New TMM, our direct subsidiary, along with shares of our Class B common stock, held by our Principal Equityholders. The aggregate number partnership units and corresponding shares of Class B common stock we purchased was equal to the number of shares of Class A common stock sold in the public offering.
In addition, in a series of transactions following each public offering the Company purchased 3.8 million shares of Class B common stock directly from our Principal Equityholders on both January 11, 2018 and January 17, 2018 for an aggregate total of 7.6 million shares.
Immediately following the consummation of the January 17, 2018 offering, net use of proceeds, and additional purchase of Class B common stock our ownership was:
100
Shares Outstanding | Percentage | ||||
Class A Common Stock | 111,130,561 | 99.2 | % | ||
Class B Common Stock | 883,921 | 0.8 | % | ||
Total | 112,014,482 | 100.0 | % | ||
Subsequent to these transactions, neither TPG or Oaktree have any remaining investment. The remaining 0.8% of Class B Common Stock is held by certain current and former members of management.
On January 26, 2018, we amended the maturity date of our $500 million Revolving Credit Facility from April 12, 2019 to January 26, 2022. Other immaterial changes were also made to the structure of the Revolving Credit Facility.
ITEM 9. CHANGES IN AND DISAGREEMENTS WITH ACCOUNTANTS ON ACCOUNTING AND FINANCIAL DISCLOSURE
None.
ITEM 9A. CONTROLS AND PROCEDURES
Disclosure Controls and Procedures
As of the end of the period covered by this 2017 Form 10-K, we carried out an evaluation, under the supervision and with the participation of our principal executive officer, principal financial officer and principal accounting officer, of the effectiveness of the design and operation of our disclosure controls and procedures (as such term is defined in Rules 13a-15(e) and 15d-15(e) under the Exchange Act). Based on this evaluation, our principal executive officer, principal financial officer and principal accounting officer concluded that our disclosure controls and procedures were effective in alerting them in a timely manner to material information required to be disclosed in our periodic reports filed with the SEC.
Internal Control over Financial Reporting
(a) Management’s Annual Report on Internal Control over Financial Reporting
Management is responsible for the preparation and fair presentation of the consolidated financial statements included in this annual report. The consolidated financial statements have been prepared in conformity with U.S. generally accepted accounting principles and reflect management’s judgments and estimates concerning events and transactions that are accounted for or disclosed.
Management is also responsible for establishing and maintaining adequate internal control over financial reporting, as such term is defined in Exchange Act Rule 13a-15(f). Management recognizes that there are inherent limitations in the effectiveness of any internal control and effective internal control over financial reporting can provide only reasonable assurance with respect to financial statement preparation. Additionally, because of changes in conditions, the effectiveness of internal control over financial reporting may vary over time.
In order to ensure that the Company’s internal control over financial reporting is effective, management regularly assesses such controls and did so most recently for its financial reporting as of December 31, 2017. Management’s assessment was based on criteria for effective internal control over financial reporting described in Internal Control – Integrated Framework issued by the Committee of Sponsoring Organizations of the Treadway Commission (2013 Framework). Based on this assessment, management concluded that the Company's internal control over financial reporting was effective as of December 31, 2017.
Deloitte & Touche LLP, the independent registered public accounting firm that audited the Company’s consolidated financial statements included in this annual report, has issued its report on the effectiveness of the Company’s internal control over financial reporting as of December 31, 2017.
(b) Report of Independent Registered Public Accounting Firm
To the Stockholders and the Board of Directors of Taylor Morrison Home Corporation
101
Opinion on Internal Control over Financial Reporting
We have audited the internal control over financial reporting of Taylor Morrison Home Corporation and subsidiaries (the “Company”) as of December 31, 2017, based on criteria established in Internal Control - Integrated Framework (2013) issued by the Committee of Sponsoring Organizations of the Treadway Commission (COSO). In our opinion, the Company maintained, in all material respects, effective internal control over financial reporting as of December 31, 2017, based on criteria established in Internal Control - Integrated Framework (2013) issued by COSO.
We have also audited, in accordance with the standards of the Public Company Accounting Oversight Board (United States) (PCAOB), the consolidated financial statements as of and for the year ended December 31, 2017, of the Company and our report dated February 21, 2018, expressed an unqualified opinion on those financial statements.
Basis for Opinion
The Company’s management is responsible for maintaining effective internal control over financial reporting and for its assessment of the effectiveness of internal control over financial reporting, included in the accompanying Management’s Annual Report on Internal Control over Financial Reporting. Our responsibility is to express an opinion on the Company’s internal control over financial reporting based on our audit. We are a public accounting firm registered with the PCAOB and are required to be independent with respect to the Company in accordance with the U.S. federal securities laws and the applicable rules and regulations of the Securities and Exchange Commission and the PCAOB.
We conducted our audit in accordance with the standards of the PCAOB. Those standards require that we plan and perform the audit to obtain reasonable assurance about whether effective internal control over financial reporting was maintained in all material respects. Our audit included obtaining an understanding of internal control over financial reporting, assessing the risk that a material weakness exists, testing and evaluating the design and operating effectiveness of internal control based on the assessed risk, and performing such other procedures as we considered necessary in the circumstances. We believe that our audit provides a reasonable basis for our opinion.
Definition and Limitations of Internal Control over Financial Reporting
A company’s internal control over financial reporting is a process designed to provide reasonable assurance regarding the reliability of financial reporting and the preparation of financial statements for external purposes in accordance with generally accepted accounting principles. A company’s internal control over financial reporting includes those policies and procedures that (1) pertain to the maintenance of records that, in reasonable detail, accurately and fairly reflect the transactions and dispositions of the assets of the company; (2) provide reasonable assurance that transactions are recorded as necessary to permit preparation of financial statements in accordance with generally accepted accounting principles, and that receipts and expenditures of the company are being made only in accordance with authorizations of management and directors of the company; and (3) provide reasonable assurance regarding prevention or timely detection of unauthorized acquisition, use, or disposition of the company’s assets that could have a material effect on the financial statements.
Because of its inherent limitations, internal control over financial reporting may not prevent or detect misstatements. Also, projections of any evaluation of effectiveness to future periods are subject to the risk that controls may become inadequate because of changes in conditions, or that the degree of compliance with the policies or procedures may deteriorate.
/s/ DELOITTE & TOUCHE LLP
Phoenix, Arizona
February 21, 2018
(c) Changes in Internal Control over Financial Reporting
There has been no change in our internal control over financial reporting during the quarter ended December 31, 2017 that has materially affected, or is reasonably likely to materially affect, our internal control over financial reporting.
ITEM 9B. OTHER INFORMATION
None
102
PART III
ITEM 10. DIRECTORS, EXECUTIVE OFFICERS AND CORPORATE GOVERNANCE
The information required by Items 401, 405, 406 and 407(c)(3), (d)(4) and (d)(5) of Regulation S-K will be set forth in our 2018 Annual Meeting Proxy Statement, which will be filed with the Securities and Exchange Commission not later than 120 days after December 31, 2017 (the “Proxy Statement”). For the limited purpose of providing the information necessary to comply with this Item 10, the Proxy Statement is incorporated herein by this reference. All references to the Proxy Statement in this Part III are exclusive of the information set forth under the captions “Compensation Committee Report” and “Audit Committee Report.”
ITEM 11. EXECUTIVE COMPENSATION
The information required by Items 402 and 407(e)(4) and (e)(5) of Regulation S-K will be set forth in the Proxy Statement. For the limited purpose of providing the information necessary to comply with this Item 11, the Proxy Statement is incorporated herein by this reference.
ITEM 12. SECURITY OWNERSHIP OF CERTAIN BENEFICIAL OWNERS AND MANAGEMENT AND RELATED STOCKHOLDER MATTERS
Securities Authorized for Issuance under Equity Compensation Plans
Equity Compensation Plan Information
The following table provides information with respect to the Taylor Morrison Home Corporation 2013 Omnibus Equity Award Plan as amended and restated as of May 31, 2017, (the “Equity Plan”) under which our equity securities are authorized for issuance as of December 31, 2017.
Plan Category | Number of securities to be issued upon exercise of outstanding options, warrants and rights (a) | Weighted-average exercise price of outstanding options, warrants and rights (b) | Number of securities remaining available for future issuance under equity compensation plans (excluding securities reflected in column (a)) (c) | ||||||||
Equity compensation plans approved by security holders(1) | 4,743,772 | (2) | $ | 17.09 | (3) | 4,130,264 | (4) | ||||
Equity compensation plans not approved by security holders | — | — | — | ||||||||
(1) | Equity compensation plans approved by security holders covers the Equity Plan. The Equity Plan is currently our only compensation plan pursuant to which our equity is awarded. This figure does not include the 883,921 New TMM Units (and the corresponding shares of our Class B Common Stock) that can be exchanged on a one-for-one basis for shares of our Class A Common Stock. The New TMM Units were issued pursuant to the TMM Holdings II Limited Partnership 2013 Common Unit Plan and were not made pursuant to any equity compensation plan. |
(2) | Column (a) includes 1,889,559 shares of our Class A Common Stock underlying outstanding time-based vesting and performance-based vesting restricted stock units (“RSUs”), outstanding deferred stock units (“DSUs”). Amount assumes achievement of the maximum level of performance in respect of RSUs that are subject to performance-based vesting conditions. Because there is no exercise price associated with RSUs and DSUs, such equity awards are not include in the weighted-average exercise price calculation in column (b). |
(3) | The weighted average exercise price in column (b) relates only to outstanding stock options. The calculation of the weighted average exercise price does not include outstanding equity awards that are received for no consideration and does not include shares of Class A Common Stock credited to the deferred compensation accounts of certain non-employee directors at fair market value in lieu compensation at the election of such directors. |
(4) | A total of 14,178,459 shares of our Class A Common Stock have been authorized for issuance pursuant to the terms of the Equity Plan. |
The information required by Item 403 of Regulation S-K will be set forth in the Proxy Statement. For the limited purpose of providing the information necessary to comply with this Item 12, the Proxy Statement is incorporated herein by this reference.
ITEM 13. CERTAIN RELATIONSHIPS AND RELATED TRANSACTIONS, AND DIRECTOR INDEPENDENCE
The information required by Items 404 and 407(a) of Regulation S-K will be set forth in the Proxy Statement. For the limited purpose of providing the information necessary to comply with this Item 13, the Proxy Statement is incorporated herein by this reference.
ITEM 14. PRINCIPAL ACCOUNTING FEES AND SERVICES
103
This information required by Item 9(e) of Schedule 14A will be set forth in the Proxy Statement. For the limited purpose of providing the information necessary to comply with this Item 14, the Proxy Statement is incorporated herein by this reference.
ITEM 15. EXHIBITS AND FINANCIAL STATEMENT SCHEDULES
Exhibit No. | Description | |
104
105
106
101.INS | XBRL Instance Document. | |
101.SCH | XBRL Taxonomy Extension Schema Document. | |
101.CAL | XBRL Taxonomy Extension Calculation Linkbase Document. | |
101.DEF | XBRL Taxonomy Extension Definition Linkbase Document. | |
101.LAB | XBRL Taxonomy Extension Label Linkbase Document. | |
101.PRE | XBRL Taxonomy Extension Presentation Linkbase Document. | |
* Filed herewith.
† Management contract or compensatory plan in which directors and/or executive officers are eligible to participate.
The agreements and other documents filed as exhibits to this report are not intended to provide factual information or other disclosure other than with respect to the terms of the agreements or other documents themselves, and you should not rely on them for that purpose. In particular, any representations and warranties made by us in these agreements or other documents were made solely within the specific context of the relevant agreement or document and may not describe the actual state of affairs as of the date they were made or at any other time.
ITEM 16. FORM 10-K SUMMARY
Not applicable.
SIGNATURES
Pursuant to the requirements of the Securities Exchange Act of 1934, the Registrant has duly caused this Annual Report to be signed on its behalf by the undersigned thereunto duly authorized.
107
TAYLOR MORRISON HOME CORPORATION | ||||
Registrant | ||||
DATE: February 21, 2018 | ||||
/s/ Sheryl D. Palmer | ||||
Sheryl D. Palmer | ||||
Chairman of the Board of Directors and Chief Executive Officer (Principal Executive Officer) | ||||
/s/ C. David Cone | ||||
C. David Cone | ||||
Executive Vice President and Chief Financial Officer (Principal Financial Officer) | ||||
/s/ Joseph Terracciano | ||||
Joseph Terracciano | ||||
Chief Accounting Officer (Principal Accounting Officer) | ||||
KNOW ALL MEN BY THESE PRESENTS, that each person whose signature appears below constitutes and appoints Sheryl D. Palmer, C. David Cone and Darrell C. Sherman, and each of them, his or her true and lawful attorneys-in-fact and agents, with full power of substitution and re-substitution, for him or her and in his or her name, place and stead, in any and all capacities, to sign any and all amendments to this Annual Report on Form 10-K, and to file the same, with all exhibits thereto and other documents in connection therewith the Securities and Exchange Commission, granting unto said attorneys-in-fact and agents, and each of them, full power and authority to do and perform each and every act and thing requisite and necessary to be done in and about the premises, as fully and to all intents and purposes as he or she might or could do in person hereby ratifying and confirming all that said attorneys-in-fact and agents, or his or her substitute or substitutes, may lawfully do or cause to be done by virtue hereof.
Pursuant to the requirements of the Securities and Exchange Act of 1934, this report has been signed below by the following persons on behalf of the Registrant and in the capacities and on the dates indicated.
108
Signature | Title | Date | ||
/s/ James Henry | Director | February 21, 2018 | ||
James Henry | ||||
/s/ Peter Lane | Director | February 21, 2018 | ||
Peter Lane | ||||
/s/ David Merritt | Director | February 21, 2018 | ||
David Merritt | ||||
/s/ Anne L. Mariucci | Director | February 21, 2018 | ||
Anne L. Mariucci | ||||
109
EXHIBIT INDEX
Exhibit No. | Description | |
2.1 | Share Purchase Agreement, dated December 11, 2014, by and among Monarch Parent Inc., TMM Holdings Limited Partnership, 2444991 Ontario Inc. and Mattamy Group Corporation (included as Exhibit 2.1 to Taylor Morrison Home Corporation’s Current Report on Form 8-K, filed on December 16, 2014, and incorporated herein by reference). | |
3.1 | Amended and Restated Certificate of Incorporation (included as Exhibit 3.1 to Taylor Morrison Home Corporation’s Current Report on Form 8-K, filed on April 15, 2013, and incorporated herein by reference). | |
3.2 | Amended and Restated By-laws (included as Exhibit 3.2 to Taylor Morrison Home Corporation’s Current Report on Form 8-K, filed on April 15, 2013, and incorporated herein by reference). | |
4.1 | Indenture, dated as of March 5, 2014, relating to Taylor Morrison Communities, Inc.’s and Monarch Communities Inc.’s 5.625% Senior Notes due 2024, by and among Taylor Morrison Communities, Inc., Monarch Communities Inc., the guarantors party thereto and Wells Fargo Bank, National Association (included as Exhibit 4.1 to Taylor Morrison Home Corporation’s Quarterly Report on Form 10-Q for the quarter ended March 31, 2014, filed on May 7, 2014, and incorporated herein by reference). | |
4.2 | Indenture, dated as of April 16, 2013, relating to Taylor Morrison Communities, Inc.’s and Monarch Communities Inc.’s 5.25% Senior Notes due 2021, by and among Taylor Morrison Communities, Inc., Monarch Communities Inc., the guarantors party thereto and Wells Fargo Bank, National Association (included as Exhibit 4.1 to Taylor Morrison Home Corporation’s Quarterly Report on Form 10-Q for the quarter ended June 30, 2013, filed on August 14, 2013, and in incorporated herein by reference). | |
4.3 | Indenture, dated as of April 16, 2015, relating to Taylor Morrison Communities, Inc.’s and Taylor Morrison Holdings II, Inc.'s 5.875% Senior Notes due 2023, by and among Taylor Morrison Communities, Inc., the guarantors party thereto and Wells Fargo Bank, National Association (included as Exhibit 4.1 to Taylor Morrison Home Corporation’s Quarterly Report on Form 10-Q for the quarter ended March 31, 2015, filed May 7, 2015, and incorporated herein by reference). | |
4.4 | Specimen Class A Common Stock Certificate of Taylor Morrison Home Corporation (included as Exhibit 4.2 to Amendment No. 3 to Taylor Morrison Home Corporation’s Registration Statement on Form S-1, filed on April 4, 2013, and incorporated herein by reference). | |
10.1 | Registration Rights Agreement, dated as of April 9, 2013, by and among Taylor Morrison Home Corporation and the other parties named therein (included as Exhibit 10.1 to Taylor Morrison Home Corporation’s Current Report on Form 8-K, filed on April 15, 2013, and incorporated herein by reference). | |
10.2 | Amended and Restated Agreement of Exempted Limited Partnership of TMM Holdings II Limited Partnership, dated as of April 9, 2013 (included as Exhibit 10.2 to Taylor Morrison Home Corporation’s Current Report on Form 8-K, filed on April 15, 2013, and incorporated herein by reference). | |
10.3 | Exchange Agreement, dated as of April 9, 2013, by and among Taylor Morrison Home Corporation and the other parties named therein (included as Exhibit 10.3 to Taylor Morrison Home Corporation’s Current Report on Form 8-K, filed on April 15, 2013, and incorporated herein by reference). | |
10.4 | Stockholders Agreement, dated as of April 9, 2013, by and among Taylor Morrison Home Corporation and the other parties named therein (included as Exhibit 10.4 to Taylor Morrison Home Corporation’s Current Report on Form 8-K, filed on April 15, 2013, and incorporated herein by reference). | |
10.4(a) | Amendment No. 1, dated as of March 6, 2014, to the Stockholders Agreement, dated as of April 9, 2013, by and among Taylor Morrison Home Corporation, TPG TMM Holdings II, L.P, OCM TMM Holdings II, L.P and JHI Holding Limited Partnership (included as Exhibit 10.1 to Taylor Morrison Home Corporation’s Current Report on Form 8-K, filed on March 7, 2014, and incorporated herein by reference). | |
10.5 | Put/Call Agreement, dated as of April 9, 2013, by and among Taylor Morrison Home Corporation and TPG TMM Holdings II, L.P. and OCM TMM Holdings II, L.P (included as Exhibit 10.5 to Taylor Morrison Home Corporation’s Current Report on Form 8-K, filed on April 15, 2013, and incorporated herein by reference). | |
10.6 | Reorganization Agreement, dated as of April 9, 2013, by and among Taylor Morrison Home Corporation and the other parties named therein (included as Exhibit 10.6 to Taylor Morrison Home Corporation’s Current Report on Form 8-K, filed on April 15, 2013, and incorporated herein by reference). | |
10.7 | U.S. Parent Governance Agreement, dated as of April 9, 2013, by and among Taylor Morrison Home Corporation, Taylor Morrison Holdings, Inc. and the other parties named therein (included as Exhibit 10.7 to Taylor Morrison Home Corporation’s Current Report on Form 8-K, filed on April 15, 2013, and incorporated herein by reference). | |
110
10.8 | Canadian Parent Governance Agreement, dated as of April 9, 2013, by and among Taylor Morrison Home Corporation, Monarch Communities Inc. (n/k/a Taylor Morrison Holdings II, Inc.) and the other parties named therein (included as Exhibit 10.8 to Taylor Morrison Home Corporation’s Current Report on Form 8-K, filed on April 15, 2013, and incorporated herein by reference). | |
10.9 | Credit Agreement, dated as of July 13, 2011, among Taylor Morrison Communities, Inc., Monarch Corporation, TMM Holdings Limited Partnership, Monarch Communities Inc., Monarch Parent Inc., Taylor Morrison Holdings, Inc., Taylor Morrison Finance, Inc., the lenders party thereto and Credit Suisse AG, as administrative agent (included as Exhibit 10.1 to Amendment No. 2 to Taylor Morrison Home Corporation’s Registration Statement on Form S-1, filed on February 13, 2013, and incorporated herein by reference). | |
10.9(a) | Amendment Agreement, dated as of April 12, 2013, to the Credit Agreement dated as of July 13, 2011 (as amended and restated as of April 13, 2012 and as thereafter amended as of August 15, 2012 and December 27, 2012), among Taylor Morrison Communities Inc., Monarch Corporation, TMM Holdings Limited Partnership and the other parties named therein (included as Exhibit 10.9 to Taylor Morrison Home Corporation’s Current Report on Form 8-K, filed on April 15, 2013, and incorporated herein by reference). | |
10.9(b) | Amendment No. 1, dated as of January 15, 2014, to the Second Amended and Restated Credit Agreement, dated as of July 13, 2011 (as amended and restated as of April 13, 2012, thereafter amended as of August 15, 2012 and December 27, 2012 and as further amended and restated as of April 12, 2013), by and among Taylor Morrison Communities, Inc., Monarch Corporation, TMM Holdings Limited Partnership, Monarch Communities Inc., Monarch Parent Inc., Taylor Morrison Holdings, Inc., Taylor Morrison Finance, Inc., the lenders party thereto and Credit Suisse AG, as administrative agent for the lenders (included as Exhibit 10.1 to Taylor Morrison Home Corporation’s Current Report on Form 8-K, filed on January 17, 2014, and incorporated herein by reference). | |
10.9(c) | Amendment No. 3, dated as of April 24, 2015, to the Second Amended and Restated Credit Agreement, dated as of July 13, 2011 (as amended and restated as of April 13, 2012, thereafter amended as of August 15, 2012 and December 27, 2012, as further amended and restated as of April 12, 2013 and thereafter amended as of January 15, 2014 and December 22, 2014), by and among Taylor Morrison Communities, Inc., TMM Holdings Limited Partnership, Taylor Morrison Holdings II, Inc., Taylor Morrison Communities II, Inc., Taylor Morrison Holdings, Inc., Taylor Morrison Finance, Inc., the lenders party thereto and Credit Suisse AG, as administrative agent for the lenders (included as Exhibit 10.2 to Taylor Morrison Home Corporation’s Quarterly Report on Form 10-Q for the quarter ended March 31, 2015, filed on May 7, 2015, and incorporated herein by reference). | |
10.9(d)* | Amendment No. 5, dated as of January 26, 2018, to the Second Amended and Restated Credit Agreement, dated as of July 13, 2011 (as amended and restated as of April 13, 2012, thereafter amended as of August 15, 2012 and December 27, 2012, as further amended and restated as of April 12, 2013 and thereafter amended as of January 15, 2014, December 22, 2014 and April 24, 2015), by and among Taylor Morrison Communities, Inc., TMM Holdings Limited Partnership, Taylor Morrison Holdings II, Inc., Taylor Morrison Communities II, Inc., Taylor Morrison Holdings, Inc., Taylor Morrison Finance, Inc., the lenders party thereto and Credit Suisse AG, as administrative agent for the lenders. | |
10.10 | Form of Indemnification Agreement (included as Exhibit 10.4 to Amendment No. 5 to Taylor Morrison Home Corporation’s Registration Statement on Form S-1, filed on April 4, 2013, and incorporated herein by reference). | |
10.11† | Taylor Morrison Home Corporation 2013 Omnibus Equity Award Plan (Amended and Restated as of May 25, 2016) (included as Appendix A of the Company’s definitive Proxy Statement on Schedule 14A filed on April 12, 2016, and incorporated herein by reference). | |
10.12† | Form of Employee Nonqualified Option Award Agreement for use with the Taylor Morrison Home Corporation 2013 Omnibus Equity Award Plan (Amended and Restated as of May 25, 2016) (included as Exhibit 10.15 to Amendment No. 5 to Taylor Morrison Home Corporation’s Registration Statement on Form S-1, filed on April 4, 2013, and incorporated herein by reference). | |
10.13† | Taylor Morrison Long-Term Cash Incentive Plan (included as Exhibit 10.18 to Amendment No. 5 to Taylor Morrison Home Corporation’s Registration Statement on Form S-1, filed on April 4, 2013, and incorporated herein by reference). | |
10.14† | Form of Restricted Stock Unit Agreement for use with the Taylor Morrison Home Corporation 2013 Omnibus Equity Award Plan (included as Exhibit 10.16 to Amendment No. 5 to Taylor Morrison Home Corporation’s Registration Statement on Form S-1, filed on April 4, 2013, and incorporated herein by reference). | |
10.15† | Form of Class B Common Stock Subscription Agreement with Taylor Morrison Home Corporation (included as Exhibit 10.17 to Amendment No. 5 to Taylor Morrison Home Corporation’s Registration Statement on Form S-1, filed on April 4, 2013, and incorporated herein by reference). | |
10.16† | TMM Holdings II Limited Partnership 2013 Common Unit Plan (included as Exhibit 10.23 to Amendment No. 5 to Taylor Morrison Home Corporation’s Registration Statement on Form S-1, filed on April 4, 2013, and incorporated herein by reference). | |
10.17† | Employment Agreement, dated as of July 13, 2011, between Taylor Morrison, Inc. and Sheryl D. Palmer (included as Exhibit 10.7 to Amendment No. 3 to Taylor Morrison Home Corporation’s Registration Statement on Form S-1, filed on March 6, 2013, and incorporated herein by reference). | |
111
10.17(a)† | First Amendment to Employment Agreement, dated May 17, 2012, between Taylor Morrison, Inc. and Sheryl D. Palmer (included as Exhibit 10.8 to Amendment No. 3 to Taylor Morrison Home Corporation’s Registration Statement on Form S-1, filed on March 6, 2013, and incorporated herein by reference). | |
10.17(b) | Second Amendment to Employment Agreement, dated February 26, 2016, between Taylor Morrison, Inc. and Sheryl D. Palmer (included as Exhibit 10.1 to Taylor Morrison Home Corporation’s Quarterly Report on Form 10-Q for the quarter ended March 31, 2016, filed on May 4, 2016, and incorporated herein by reference). | |
10.18† | Employment Agreement, dated as of January 1, 2013, between Taylor Morrison, Inc. and C. David Cone (included as Exhibit 10.9 to Amendment No. 3 to Taylor Morrison Home Corporation’s Registration Statement on Form S-1, filed on March 6, 2013, and incorporated herein by reference). | |
10.18(a)† | First Amendment to Employment Agreement, dated February 26, 2016, between Taylor Morrison, Inc. and C. David Cone (included as Exhibit 10.2 to Taylor Morrison Home Corporation’s Quarterly Report on Form 10-Q for the quarter ended March 31, 2016, filed on May 4, 2016, and incorporated herein by reference). | |
10.19† | Employment Agreement, dated as of December 28, 2012, between Taylor Morrison, Inc. and Darrell C. Sherman (included as Exhibit 10.3 to Taylor Morrison Home Corporation’s Quarterly Report on Form 10-Q for the quarter ended March 31, 2015, filed on May 7, 2015, and incorporated herein by reference). | |
10.19(a)† | Second Amendment to Employment Agreement, dated February 26, 2016, between Taylor Morrison, Inc. and Darrell C. Sherman (included as Exhibit 10.3 to Taylor Morrison Home Corporation’s Quarterly Report on Form 10-Q for the quarter ended March 31, 2016, filed on May 4, 2016, and incorporated herein by reference). | |
10.20† | Form of Restrictive Covenants Agreement with Taylor Morrison, Inc. (included as Exhibit 10.12 to Amendment No. 3 to Taylor Morrison Home Corporation's Registration Statement on Form S-1, filed on March 6, 2013, and incorporated herein by reference. | |
10.21† | 2015 Non-Employee Director Deferred Compensation Plan (included as Exhibit 10.4 to Taylor Morrison Home Corporation’s Quarterly Report on Form 10-Q for the quarter ended March 31, 2015, filed on May 7, 2015, and incorporated herein by reference). | |
10.21(a)† | Form of Deferred Stock Unit Award Agreement (included as Exhibit 10.5 to Taylor Morrison Home Corporation’s Quarterly Report on Form 10-Q for the quarter ended March 31, 2015, filed on May 7, 2015, and incorporated herein by reference). | |
10.22 | Amendment dated as of March 15, 2015 to the Amended and Restated Agreement of Exempted Limited Partnership of TMM Holdings II Limited Partnership of TMM Holdings II Limited Partnership (included as Exhibit 10.1 to Taylor Morrison Home Corporation’s Quarterly Report on Form 10-Q for the quarter ended March 31, 2015, filed on May 7, 2015, and incorporated herein by reference). | |
10.23† | Form of Employee Nonqualified Option Award Agreement for use with the 2013 Taylor Morrison Home Corporation Omnibus Equity Award Plan (Amended and Restated as of May 25, 2016) for grants made in 2015 and thereafter (included as Exhibit 10.1 to Taylor Morrison Home Corporation’s Quarterly Report on Form 10-Q for the quarter ended June 30, 2015, filed on August 5, 2015, and incorporated herein by reference). | |
10.24† | Form of Restricted Stock Unit Agreement for use with the 2013 Taylor Morrison Home Corporation Omnibus Equity Award Plan (Amended and Restated as of May 25, 2016) for grants made in 2015 and thereafter (included as Exhibit 10.2 to Taylor Morrison Home Corporation’s Quarterly Report on Form 10-Q for the quarter ended June 30, 2015, filed on August 5, 2015, and incorporated herein by reference). | |
10.25† | Form of Performance-Based Restricted Stock Unit Agreement for use with the 2013 Taylor Morrison Home Corporation Omnibus Equity Award Plan (Amended and Restated as of May 25, 2016) for grants made in 2015 and thereafter (included as Exhibit 10.3 to Taylor Morrison Home Corporation’s Quarterly Report on Form 10-Q for the quarter ended June 30, 2015, filed on August 5, 2015, and incorporated herein by reference). | |
10.26 | Purchase Agreement, dated as of January 31, 2017, by and among Taylor Morrison Home Corporation, TMM Holdings II Limited Partnership and certain sellers named in Schedule I thereto (included as Exhibit 10.1 to Taylor Morrison Home Corporation’s Current Report on Form 8-K, filed on February 6, 2017, and incorporated herein by reference). | |
10.27 | Purchase Agreement, dated as of March 22, 2017, by and among Taylor Morrison Home Corporation and certain sellers named in Schedule I thereto (included as Exhibit 10.1 to Taylor Morrison Home Corporation’s Current Report on Form 8-K, filed on March 27, 2017, and incorporated herein by reference). | |
10.28 | Purchase Agreement, dated as of May 1, 2017, by and among Taylor Morrison Home Corporation and certain sellers named in Schedule I thereto (included as Exhibit 10.1 to Taylor Morrison Home Corporation’s Current Report on Form 8-K, filed on May 5, 2017, and incorporated herein by reference). | |
10.29 | Purchase Agreement, dated as of June 21, 2017, by and among Taylor Morrison Home Corporation and certain sellers named in Schedule I thereto (included as Exhibit 10.1 to Taylor Morrison Home Corporation’s Current Report on Form 8-K, filed on June 27, 2017, and incorporated herein by reference). | |
112
10.30 | Purchase Agreement, dated as of November 8, 2017, by and among Taylor Morrison Home Corporation and certain sellers named in Schedule I thereto (included as Exhibit 10.1 to Taylor Morrison Home Corporation’s Current Report on Form 8-K, filed on November 13, 2017, and incorporated herein by reference). | |
10.31 | Purchase Agreement, dated as of January 3, 2018, by and among Taylor Morrison Home Corporation and certain sellers named in Schedule I thereto (included as Exhibit 10.1 to Taylor Morrison Home Corporation’s Current Report on Form 8-K, filed on January 8, 2018, and incorporated herein by reference). | |
10.32 | Purchase Agreement, dated as of January 3, 2018, by and among Taylor Morrison Home Corporation and certain sellers named in Schedule I thereto (included as Exhibit 10.2 to Taylor Morrison Home Corporation’s Current Report on Form 8-K, filed on January 8, 2018, and incorporated herein by reference). | |
10.33 | Purchase Agreement, dated as of January 11, 2018, by and among Taylor Morrison Home Corporation and certain sellers named in Schedule I thereto (included as Exhibit 10.1 to Taylor Morrison Home Corporation’s Current Report on Form 8-K, filed on January 17, 2018, and incorporated herein by reference). | |
10.34 | Purchase Agreement, dated as of January 11, 2018, by and among Taylor Morrison Home Corporation and certain sellers named in Schedule I thereto (included as Exhibit 10.2 to Taylor Morrison Home Corporation’s Current Report on Form 8-K, filed on January 17, 2018, and incorporated herein by reference). | |
10.35 | Second Amendment to the Amended and Restated Agreement of Exempted Limited Partnership of TMM Holdings II Limited Partnership, dated January 11, 2018 (included as Exhibit 10.3 to Taylor Morrison Home Corporation’s Current Report on Form 8-K, filed on January 17, 2018, and incorporated herein by reference). | |
21.1* | Subsidiaries of Taylor Morrison Home Corporation | |
23.1* | Consent of Deloitte & Touche LLP | |
24.1* | Power of Attorney (included on signature page) | |
31.1* | Certification of Sheryl D. Palmer, Chief Executive Officer, pursuant to Section 302 of the Sarbanes–Oxley Act of 2002. | |
31.2* | Certification of C. David Cone, Chief Financial Officer, pursuant to Section 302 of the Sarbanes–Oxley Act of 2002. | |
32.1* | Certification of Sheryl D. Palmer, Chief Executive Officer, pursuant to Section 906 of the Sarbanes–Oxley Act of 2002. | |
32.2* | Certification of C. David Cone, Chief Financial Officer, pursuant to Section 906 of the Sarbanes–Oxley Act of 2002. | |
101.INS | XBRL Instance Document. | |
101.SCH | XBRL Taxonomy Extension Schema Document. | |
101.CAL | XBRL Taxonomy Extension Calculation Linkbase Document. | |
101.DEF | XBRL Taxonomy Extension Definition Linkbase Document. | |
101.LAB | XBRL Taxonomy Extension Label Linkbase Document. | |
101.PRE | XBRL Taxonomy Extension Presentation Linkbase Document. | |
* | Filed herewith. |
+ | Management contract or compensatory plan in which directors and/or executive officers are eligible to participate. |
The agreements and other documents filed as exhibits to this report are not intended to provide factual information or other disclosure other than with respect to the terms of the agreements or other documents themselves, and you should not rely on them for that purpose. In particular, any representations and warranties made by us in these agreements or other documents were made solely within the specific context of the relevant agreement or document and may not describe the actual state of affairs as of the date they were made or at any other time.
113