Attached files
| file | filename |
|---|---|
| EX-99.1 - EXHIBIT 99.1 - MARTIN MIDSTREAM PARTNERS L.P. | exhibit991pressrelease2-21.htm |
| 8-K - 8-K - MARTIN MIDSTREAM PARTNERS L.P. | a8kanalystpresentation.htm |

2018 Financial guidance &
Operational overview
February 21
www.martinmidstream.com
Exhibit 99.2

2
MARTIN MIDSTREAM PARTNERS L.P.
Agenda
Opening remarks &
introductions
2018 guidance
Bank amendment
Question & answer
Operational overview
Bob Bondurant, Executive Vice President & Chief Financial Officer
Joe McCreery, Vice President of Finance & Head of Investor Relations
Joe McCreery, Vice President of Finance & Head of Investor Relations
Bob Bondurant, Executive Vice President & Chief Financial Officer
Joe McCreery, Vice President of Finance & Head of Investor Relations
Listening Audience
Closing remarks Bob Bondurant, Executive Vice President & Chief Financial Officer
Additional Partnership Representatives: Ruben Martin, President & Chief Executive Officer
David Cannon, Director of Financial Reporting
Danny Cavin, Director of Financial Planning & Analysis

3
This presentation includes certain non-GAAP financial measures such as EBITDA and Adjusted EBITDA. These non-
GAAP financial measures are not meant to be considered in isolation or as a substitute for results prepared in
accordance with accounting principles generally accepted in the United States (GAAP). A reconciliation of non-
GAAP financial measures included in this presentation to the most directly comparable financial measures calculated
and presented in accordance with GAAP is set forth in the Appendix of this presentation or on our web site at
www.martinmidstream.com
MMLP’s management believes that these non-GAAP financial measures may provide useful information to investors
regarding MMLP’s financial condition and results of operations as they provide another measure of the profitability
and ability to service its debt and are considered important measures by financial analysts covering MMLP and its
peers.
MARTIN MIDSTREAM PARTNERS L.P.
Use of Non-GAAP Financial Measures

4
MARTIN MIDSTREAM PARTNERS L.P.
Forward Looking Statements
Statements included that are not historical facts (including any statements concerning plans and objectives of
management for future operations or economic performance or assumptions or forecasts related thereto), are
forward-looking statements. These statements can be identified by the use of forward-looking terminology including
“forecast,” “may,” “believe,” “will,” “expect,” “anticipate,” “estimate,” “continue,” or other similar words. These
statements discuss future expectations, contain projections of results of operations or of financial condition or state
other “forward-looking” information. We and our representatives may from time to time make other oral or written
statements that are also forward-looking statements.
These forward-looking statements are based upon management’s current plans, expectations, estimates,
assumptions and beliefs concerning future events impacting us and therefore involve a number of risks and
uncertainties. We caution that forward-looking statements are not guarantees and that actual results could differ
materially from those expressed or implied in the forward-looking statements.
Because these forward-looking statements involve risks and uncertainties, actual results could differ materially from
those expressed or implied by these forward-looking statements for a number of important reasons. A discussion of
these factors, including risks and uncertainties, is set forth in Martin Midstream Partners L.P.’s annual and quarterly
reports filed from time to time with the Securities and Exchange Commission. Martin Midstream Partners L.P.
expressly disclaims any intention or obligation to revise or update any forward-looking statements whether as a
result of new information, future events, or otherwise.

5
M A R T I N M I D S T R E A M P A R T N E R S L . P .
2018 GUIDANCE

6
• NASDAQ Listed: MMLP
• Formed October 31, 2002
• MMLP is a publicly traded, diversified master limited
partnership with operations including:
Natural Gas Services
Terminalling & Storage
Sulfur Services
Marine Transportation
• MMLP Trading Summary (1)
• Unit Price: $16.05
• Units Outstanding 38.5 million
• Market Cap: $618 million
• Quarterly Distribution: $0.50/$2.00 annualized
• Current Yield: 12.5%
(1) As of February 20, 2018
MARTIN MIDSTREAM PARTNERS L.P.
Partnership Overview
($171.8 million before $15.6 million unallocated SG&A
and other non-operating income)
$156.2 million Adjusted
EBITDA

7
Natural Gas Services
$69.7
Sulfur Services
$34.5
Marine Transportation
$8.5
Terminalling & Storage
$58.8
($171.5 million before $15.4 million unallocated SG&A
and other non-operating income)
$156.1 million Adjusted
EBITDA
$ millions
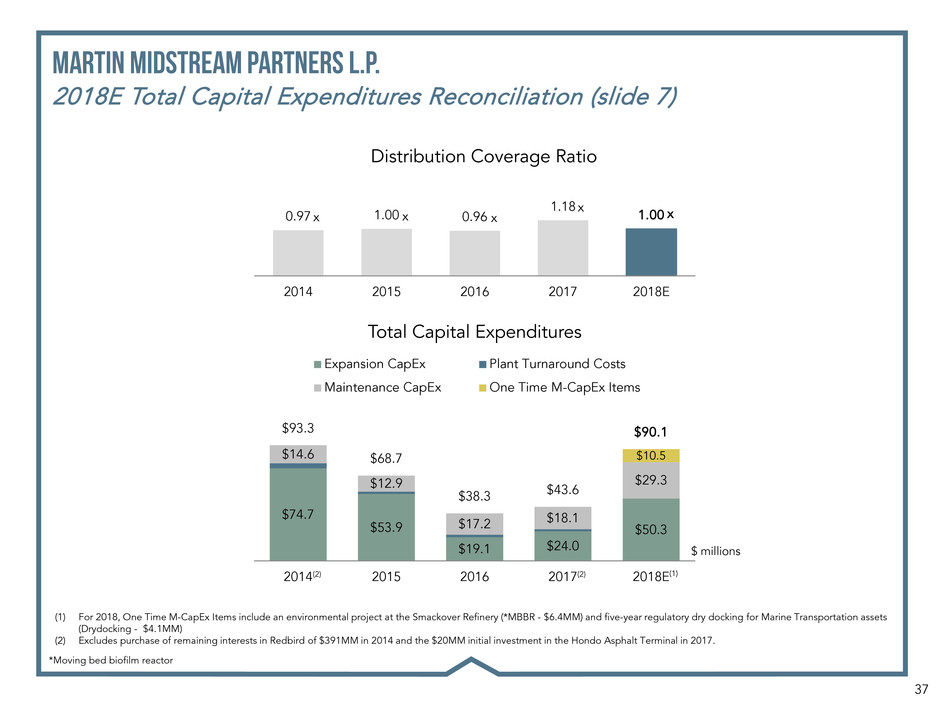
Maintenance Capital Expenditures projected to be $27.5 to $30.0 million*
MARTIN MIDSTREAM PARTNERS L.P.
2018E Guidance by Segment UPDATE
*See slide 37 of the Appendix for a historical comparison of Maintenance CapEx

8
Natural Gas
Services
Terminalling
& Storage
Sulfur
Services
Marine
Transportation
SG&A
Interest
Expense
2018E
Net income (loss) $42.5 $22.4 $23.0 $1.4 $(16.0) $(52.7) $20.6
Interest expense add back -- -- -- -- -- $52.7 $52.7
Depreciation and amortization $25.1 $36.4 $11.5 $7.1 -- -- $80.1
Distributions from unconsolidated entities $8.4 -- -- -- -- -- $8.4
Equity in earnings of unconsolidated entities $(6.3) -- -- -- -- -- $(6.3)
Unit-based compensation -- -- -- -- -- -- --
Income tax expense -- -- -- -- $0.6 -- $0.6
Adjusted EBITDA $69.7 $58.8 $34.5 $8.5 $(15.4) $0.0 $156.1
MARTIN MIDSTREAM PARTNERS L.P.
2018E Adjusted EBITDA Guidance Reconciliation
Natural Gas Services 1Q18E 2Q18E 3Q18E 4Q18E 2018E
Cardinal $9.7 $8.6 $6.4 $6.3 $31.0
Butane $9.1 $1.3 $1.5 $14.2 $26.1
WTLPG $1.5 $1.6 $2.5 $2.9 $8.5
NGLs $0.4 $0.4 $0.4 $0.3 $1.5
Propane $1.2 $0.2 $0.2 $1.0 $2.6
Total NGS $21.9 $12.1 $11.0 $24.7 $69.7
Terminalling &
Storage
1Q18E 2Q18E 3Q18E 4Q18E 2018E
Marine Shore-Based
Terminals
$3.1 $3.1 $3.1 $3.1 $12.4
Martin Lubricants $2.9 $3.2 $3.0 $2.4 $11.5
Smackover Refinery $4.8 $5.1 $5.0 $5.0 $19.9
Specialty Terminals $2.3 $2.5 $2.6 $2.8 $10.2
Hondo Asphalt $1.2 $1.2 $1.2 $1.2 $4.8
Total T&S $14.3 $15.1 $14.9 $14.5 $58.8
Sulfur Services 1Q18E 2Q18E 3Q18E 4Q18E 2018E
Fertilizer $6.8 $6.1 $4.9 $3.6 $21.4
Molten Sulfur $1.6 $1.5 $1.5 $1.5 $6.1
Sulfur Prilling $1.6 $1.8 $1.8 $1.8 $7.0
Total Sulfur Services $10.0 $9.4 $8.2 $6.9 $34.5
Marine
Transportation
1Q18E 2Q18E 3Q18E 4Q18E 2018E
Inland $1.8 $2.5 $2.5 $2.6 $9.4
Offshore $0.8 $0.9 $0.9 $0.9 $3.5
Marine USG&A $(1.1) $(1.1) $(1.1) $(1.1) $(4.4)
Total Marine $1.5 $2.3 $2.3 $2.4 $8.5
Unallocated SG&A $(3.8) $(3.8) $(3.9) $(3.9) $(15.4)
Total Adjusted EBITDA $43.9 $35.1 $32.5 $44.6 $156.1
$ millions

9
Natural Gas Services
• Fee-based, multi-year natural gas storage contracts (weighted average
life approximately 3.0 years as of December 31, 2017)
• Fee-based, regulated common carrier tariffs (WTLPG)
• Margin-based, wholesale NGLs
Terminalling & Storage
• Fee-based contracts for traditional storage assets – Specialty and Marine
Shore-Based Terminals (with minimum volume commitments)
• Fee-based, long-term tolling agreement for Smackover Refinery (with
guaranteed minimum volume)
• Margin-based, lubricants contracts/revenue
Sulfur Services
• Fee-based, multi-year “take-or-pay” contracts for prilling assets
• Fee-based molten sulfur transportation and handling contract
• Margin-based fertilizer contracts/revenue
Marine Transportation
• Fee-based, day-rate contracts
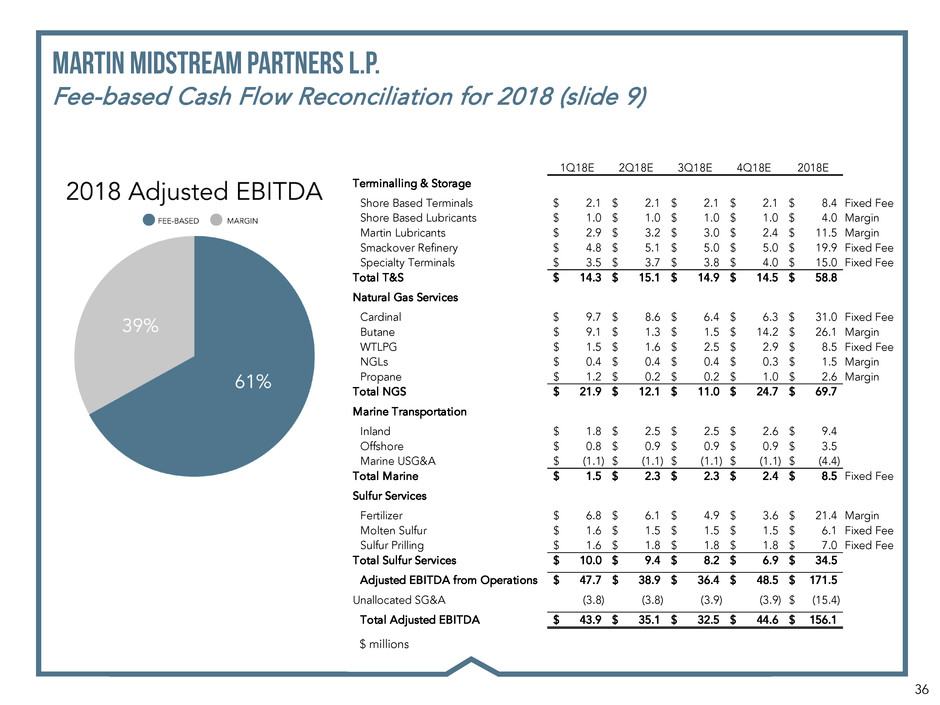
*See slide 36 of the Appendix for reconciliation of Fee-based vs. Margin-based cash flows by segment
MARTIN MIDSTREAM PARTNERS L.P.
Strong Fee-Based Contract Mix
*

M A R T I N M I D S T R E A M P A R T N E R S L . P .
Bank amendment
11
MARTIN MIDSTREAM PARTNERS L.P.
Bank Amendment - Situation Overview & Objectives
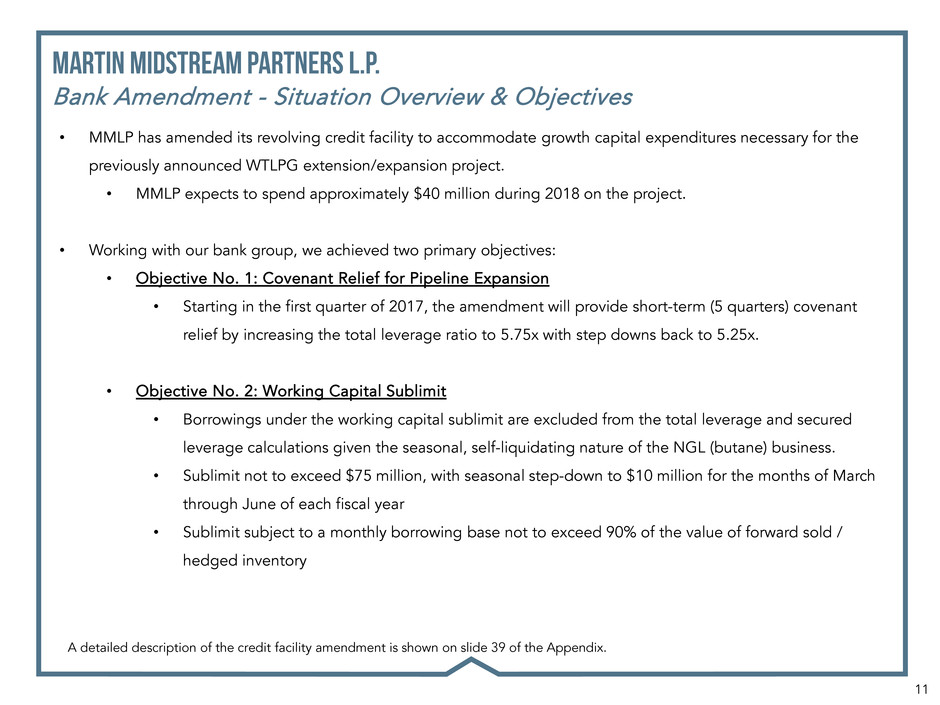
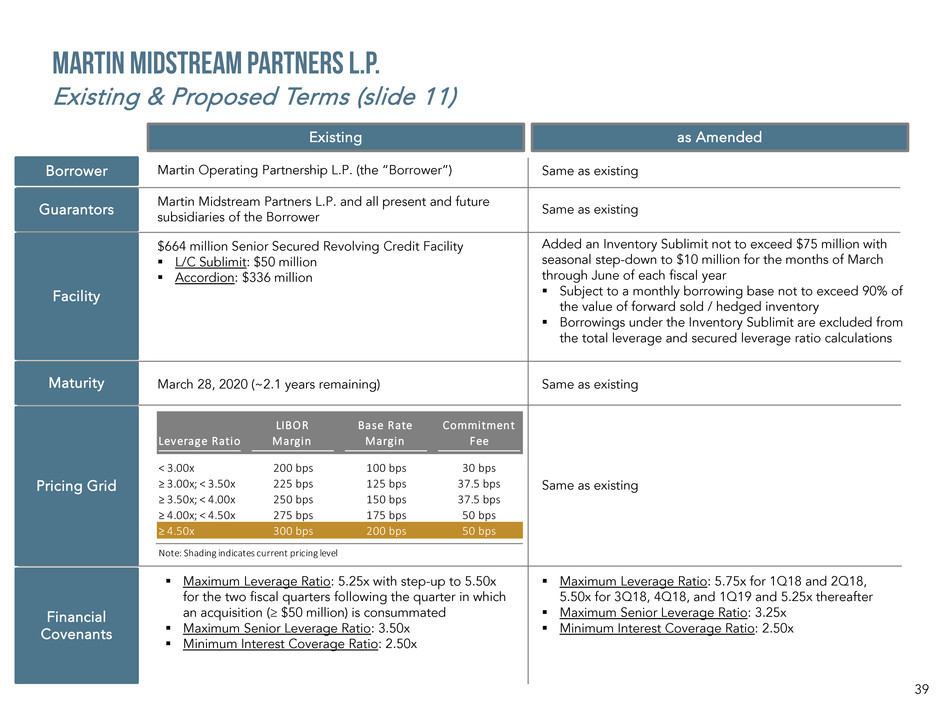
• MMLP has amended its revolving credit facility to accommodate growth capital expenditures necessary for the
previously announced WTLPG extension/expansion project.
• MMLP expects to spend approximately $40 million during 2018 on the project.
• Working with our bank group, we achieved two primary objectives:
• Objective No. 1: Covenant Relief for Pipeline Expansion
• Starting in the first quarter of 2017, the amendment will provide short-term (5 quarters) covenant
relief by increasing the total leverage ratio to 5.75x with step downs back to 5.25x.
• Objective No. 2: Working Capital Sublimit
• Borrowings under the working capital sublimit are excluded from the total leverage and secured
leverage calculations given the seasonal, self-liquidating nature of the NGL (butane) business.
• Sublimit not to exceed $75 million, with seasonal step-down to $10 million for the months of March
through June of each fiscal year
• Sublimit subject to a monthly borrowing base not to exceed 90% of the value of forward sold /
hedged inventory
A detailed description of the credit facility amendment is shown on slide 39 of the Appendix.

M A R T I N M I D S T R E A M P A R T N E R S L . P .
OPERATIONAL
OVERVIEW

13
• Cardinal Gas Storage operates approximately 50 billion cubic feet of natural gas storage capacity across four
facilities throughout northern Louisiana and Mississippi.
• MMLP distributes NGLs purchased primarily from refineries and natural gas processors. The Partnership stores and
transports NGLs for delivery to refineries, industrial NGL users and wholesale delivery to propane retailers.
• MMLP owns an NGL pipeline which spans approximately 200 miles from Kilgore, Texas to Beaumont, Texas. MMLP
also owns and operates approximately 2.4 million barrels of underground storage capacity for NGLs.
• MMLP owns a 20% non-operating interest in WTLPG. WTLPG owns an approximate 2,300 mile common carrier
pipeline system that transports NGLs from New Mexico and Texas to Mont Belvieu, Texas for fractionation.
Key
Assets
2017
Adj. EBITDA
2018E
Adj. EBITDA
Cardinal $39.4 $31.0
Butane $28.1 $26.1
WTLPG $5.3 $8.5
NGLs $0.9 $1.5
Propane $2.1 $2.6
Total NGS $75.8 $69.7
$ millions
MARTIN MIDSTREAM PARTNERS L.P.
Natural Gas Services Overview

14
• Firm contracted model (90%) for natural gas
storage with interruptible service upside
• Long-term contracts – Cardinal’s weighted
average contract life of approximately 3.0 years
protects against significant cash flow deterioration
in the near term
• Potential storage demand drivers:
• LNG exports
• Natural gas exports to Mexico
• Increasing industrial and petrochemical use
• Coal-fired power conversions to natural gas
• Increased volatility – Due to demand drivers
above, natural gas price volatility should enhance
the value of storage assets
Type
Working Gas
Capacity (bcf)
Currently
Contracted Years
Arcadia Salt Dome 16.0 97% 2.2
Cadeville
Depleted
Reservoir
17.0 100% 5.4
Perryville Salt Dome 12.7 67% 1.7
Monroe
Depleted
Reservoir
7.4 95% 2.6
Source 10-K, December 31, 2017
Firm Contracted/Fee-Based Storage Model Cardinal Contract Summary
MARTIN MIDSTREAM PARTNERS L.P. – natural gas services
Cardinal Gas Storage
(1) Cardinal wholly-owned since August 2014
(2) Reflective of the results from 2017 open season and original Perryville contracts maturing 6/30/18
$15.8
$44.3
$42.0
$39.4
$31.0
2014 2015 2016 2017 2018E
Cardinal Gas Storage Adjusted EBITDA
( 1 ) ( 2 )

15
Arcadia Gas Storage
• Salt dome facility (Arcadia, Louisiana) – 16.0 bcf
Perryville Gas Storage
• Salt dome facility (Delhi, Louisiana) – 12.7 bcf
Cadeville Gas Storage
• Depleted reservoir facility (Monroe, Louisiana) – 17.0 bcf
Monroe Gas Storage
• Depleted reservoir facility (Amory, Mississippi) – 7.4 bcf
MARTIN MIDSTREAM PARTNERS L.P. – natural gas storage
Cardinal Gas Storage Asset Overview
Monroe
Gas Storage
Site

16
• Refineries adjust the vapor pressure of gasoline
to meet seasonal EPA standards and are allowed
to blend butane into the gasoline pool during
winter months.
• MMLP owns and leases a network of
underground storage facilities in Louisiana and
Mississippi.
• MMLP has rail and truck transloading capabilities
at its Arcadia, Louisiana facility.
• Further assists refineries in balancing butane
offtake during non-blending seasons
Butane Optimization
MARTIN MIDSTREAM PARTNERS L.P. – natural gas services
Butane Optimization
$15.7
$19.9
$23.5
$28.1
$26.1
2014 2015 2016 2017 2018E
Butane Adjusted EBITDA

17
• The WTLPG system is approximately 2,300 miles of Y-grade pipeline from Eastern New Mexico to Mt. Belvieu, Texas.
• MMLP owns a 20% non-operating interest in WTLPG (OKE is owner/operator of remaining 80%).
• Nameplate capacity of approximately 240 MBbls/day; 2017 volumes were approximately 190 MBbls/day
• Connection into Cajun Sibon pipeline provides delivery alternative to Mt. Belvieu, Texas.
• Moves west to east/southeast across multiple producing regions:
• Permian Basin
• Barnett Shale
• East Texas/Cotton Valley
• Planned expansion into Delaware Basin on-line 3Q 2018
• Railroad Commission of Texas tariff dispute and adjudication process is ongoing. (1)
System Map
MARTIN MIDSTREAM PARTNERS L.P. – natural gas services
West Texas LPG Pipeline (WTLPG)
$4.3
$11.2
$7.5
$5.3
$8.5
2014 2015 2016 2017 2018E
WTLPG Adjusted EBITDA
(1) See slide 38 in Appendix for detailed timeline of RRC tariff case
18
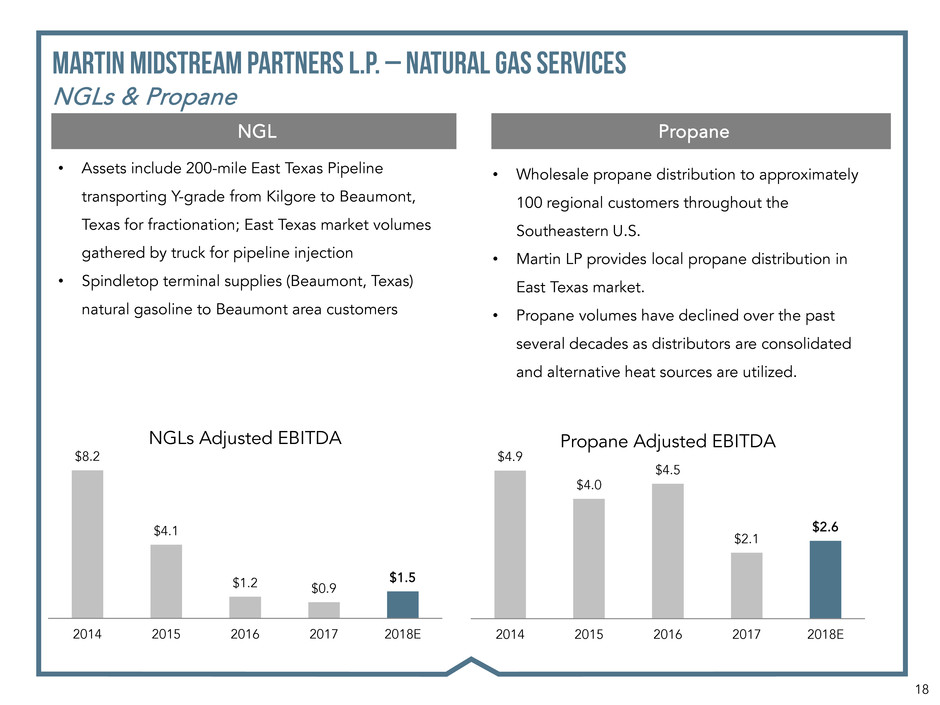
• Assets include 200-mile East Texas Pipeline
transporting Y-grade from Kilgore to Beaumont,
Texas for fractionation; East Texas market volumes
gathered by truck for pipeline injection
• Spindletop terminal supplies (Beaumont, Texas)
natural gasoline to Beaumont area customers
• Wholesale propane distribution to approximately
100 regional customers throughout the
Southeastern U.S.
• Martin LP provides local propane distribution in
East Texas market.
• Propane volumes have declined over the past
several decades as distributors are consolidated
and alternative heat sources are utilized.
Propane NGL
MARTIN MIDSTREAM PARTNERS L.P. – natural gas services
NGLs & Propane
$8.2
$4.1
$1.2 $0.9
$1.5
2014 2015 2016 2017 2018E
NGLs Adjusted EBITDA
$4.9
$4.0
$4.5
$2.1
$2.6
2014 2015 2016 2017 2018E
Propane Adjusted EBITDA
19
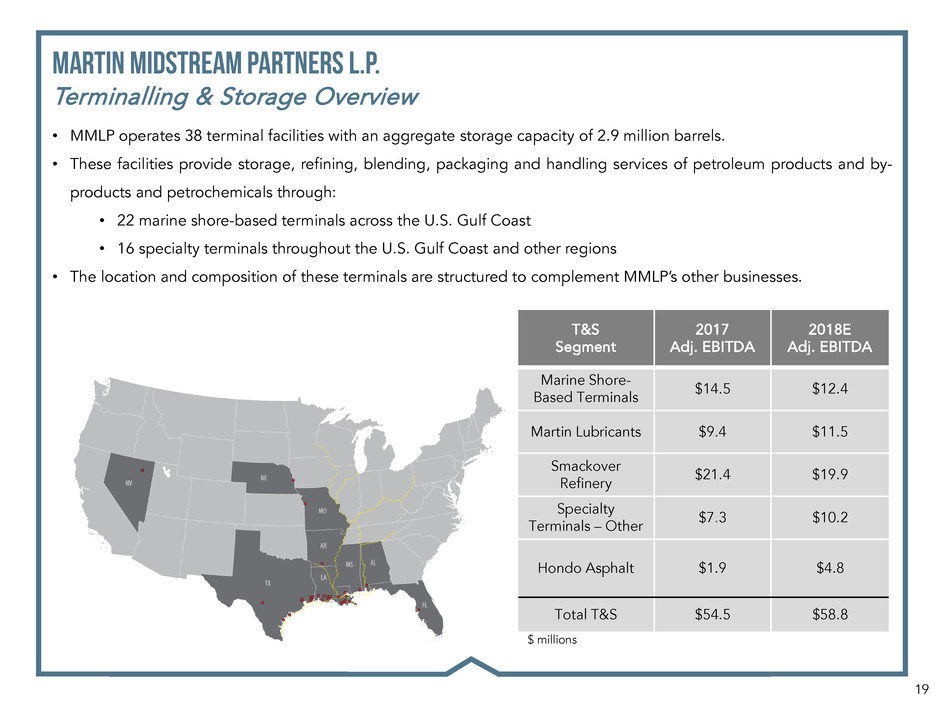
• MMLP operates 38 terminal facilities with an aggregate storage capacity of 2.9 million barrels.
• These facilities provide storage, refining, blending, packaging and handling services of petroleum products and by-
products and petrochemicals through:
• 22 marine shore-based terminals across the U.S. Gulf Coast
• 16 specialty terminals throughout the U.S. Gulf Coast and other regions
• The location and composition of these terminals are structured to complement MMLP’s other businesses.
T&S
Segment
2017
Adj. EBITDA
2018E
Adj. EBITDA
Marine Shore-
Based Terminals
$14.5 $12.4
Martin Lubricants $9.4 $11.5
Smackover
Refinery
$21.4 $19.9
Specialty
Terminals – Other
$7.3 $10.2
Hondo Asphalt $1.9 $4.8
Total T&S $54.5 $58.8
$ millions
MARTIN MIDSTREAM PARTNERS L.P.
Terminalling & Storage Overview

20
Gulf Coast Fuel and Lubricant Distribution Network
• 22 terminals along the Gulf Coast from Theodore,
Alabama to Corpus Christi, Texas
• Terminalling assets utilized by Martin Energy Services
(MRMC) to facilitate the distribution and marketing of
fuel and lubricants to oil and gas exploration and
production companies, oilfield service companies,
marine transportation companies and offshore
construction companies
• Additional logistical support services provided:
• Storage and handling of tubular goods
• Loading and unloading bulk materials
• Providing facilities and equipment to store and
mix drilling fluids
• Fee-based contract structure provides stable cash
flow.
• Annual MVC contract with MRMC guaranteeing
minimum fuel throughput
MARTIN MIDSTREAM PARTNERS L.P. – Terminalling & Storage
Marine Shore-Based Terminals
$15.3 $16.9 $15.1
$10.1 $8.4
$3.0
$2.6
$3.3
$4.4
$4.0
$18.3 $19.5 $18.4
$14.5
$12.4
2014 2015 2016 2017 2018
Marine Shore-Based Terminals
Adjusted EBITDA
Marine Shore-Based Terminals Ship Channel Lubricants

21
Lubricant Blending & Packaging
• Specialty lubricant product blending and packaging
assets located within MMLP’s Smackover Refinery in
Smackover, Arkansas include:
• 235,000 sq. ft. warehouse
• 3.9 million gallons bulk storage
• MMLP purchases base oils to blend and package
branded and private label lubricants for agricultural
and industrial applications.
Grease
• Commercial and industrial grease processing and
packaging assets located in Kansas City, Missouri
and Houston, Texas include:
• 75,000 sq. ft. warehouse
• 0.2 million gallons bulk storage
Lubricant Packaging Facility, Smackover, Arkansas
MARTIN MIDSTREAM PARTNERS L.P. – terminalling & storage
Martin Lubricants
$8.2 $8.5 $8.7
$9.4
$11.5
2014 2015 2016 2017 2018E
Martin Lubricants Adjusted EBITDA

22
Specialized Naphthenic Refinery
• 7,700 bpd capacity naphthenic lube refinery located
in Smackover, Arkansas
• Specialized facility processes crude oil into finished
products including naphthenic lubricants, distillates
and asphalt
• Naphthenic lubricants have customized non-
paraffinic industrial uses including:
• Transformer oils
• Rubber extenders
• Base oil for lubricants
• Fee-based contract structure provides stable cash flow.
• Long-term tolling agreement with MRMC
eliminates commodity exposure and working
capital requirements
MARTIN MIDSTREAM PARTNERS L.P. – terminalling & storage
Smackover Refinery
Smackover Refinery, Smackover, Arkansas
$11.3
$15.4
$20.4 $21.4 $19.9
2014 2015 2016 2017 2018E
Smackover Refinery Adjusted EBITDA

23
Hondo Asphalt Terminal, Hondo, Texas
Specialty Terminals Overview
• Network of 14 terminals which facilitate the movement
of petroleum products and by-products and
petrochemicals from oil refiners and natural gas
processing facilities
• Specialized capabilities include the ability to store and
handle products with a wide range of temperature
requirements (-30° to +400°F) and receives products
transported by vessel, barge, rail or truck
• Products handled include:
• Anhydrous ammonia (temp requirement: -30°F)
• Asphalt (temp requirement: up to 400°F)
• Crude oil
• Fuel oil
• Molten sulfur (temp requirement: 270°F)
• Sulfuric acid
• Other assorted petroleum products and by-
products
MARTIN MIDSTREAM PARTNERS L.P. – terminalling & storage
Specialty Terminals
(1)Represents Specialty Terminals cash flow from ongoing operations
(2)Represents partial year 2017 (asset purchased February 22, 2018) and full year 2018 operations
from Hondo Asphalt Terminal
$5.3
$6.8
$10.4
$7.3
$10.2
$1.9 (2)
$4.8 (2)
2014 2015 2016 2017 2018E
Specialty Terminals Adjusted EBITDA (1)
$9.2
$15.0
24
Expertise In “Hard to Handle” Product and By-Product Logistics
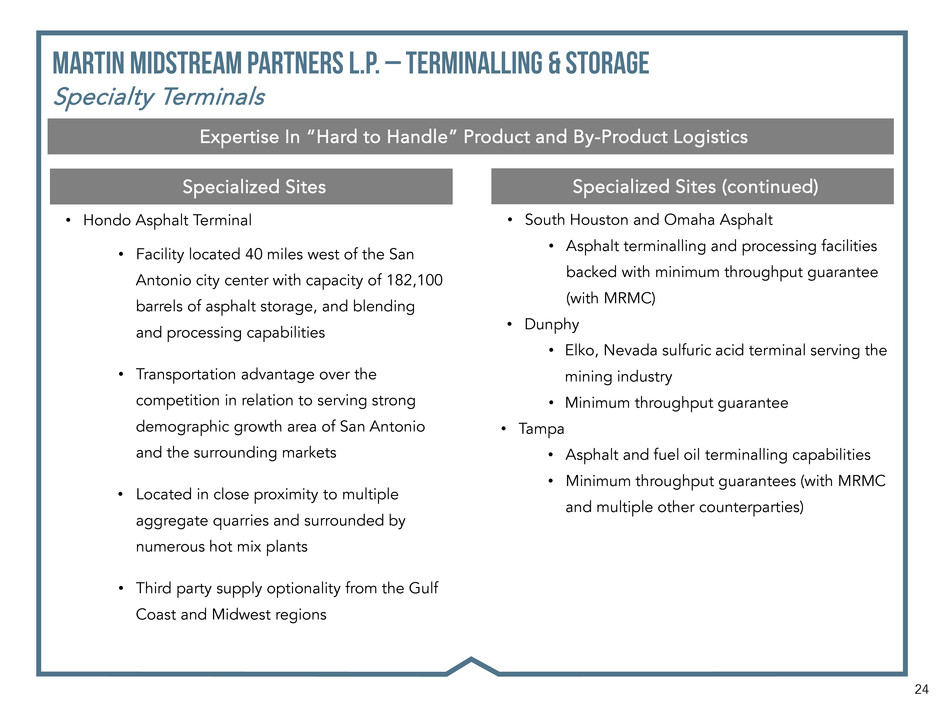
• South Houston and Omaha Asphalt
• Asphalt terminalling and processing facilities
backed with minimum throughput guarantee
(with MRMC)
• Dunphy
• Elko, Nevada sulfuric acid terminal serving the
mining industry
• Minimum throughput guarantee
• Tampa
• Asphalt and fuel oil terminalling capabilities
• Minimum throughput guarantees (with MRMC
and multiple other counterparties)
• Hondo Asphalt Terminal
• Facility located 40 miles west of the San
Antonio city center with capacity of 182,100
barrels of asphalt storage, and blending
and processing capabilities
• Transportation advantage over the
competition in relation to serving strong
demographic growth area of San Antonio
and the surrounding markets
• Located in close proximity to multiple
aggregate quarries and surrounded by
numerous hot mix plants
• Third party supply optionality from the Gulf
Coast and Midwest regions
Specialized Sites (continued) Specialized Sites
MARTIN MIDSTREAM PARTNERS L.P. – terminalling & Storage
Specialty Terminals

25
Expertise In “Hard to Handle” Product and By-Product Logistics
• Beaumont Neches
• Multi-service terminal
• Sulfur offtake and gathering point for Texas
and Louisiana refiners
• Deep water and barge dock access
• Serviced by 3 rail lines (BNSF, KCS, UP)
• Dry bulk shiploader – 20,000 tons/day
• Additional 96 acres available for expansion
• Beaumont Spindletop
• Natural gasoline terminal providing feedstock
to petrochemical manufacturer
• Beaumont Stanolind
• Multi-product handling facility including:
• Molten sulfur
• Asphalt/Fuel oil
• Sulfuric acid
Specialized Sites (continued)
MARTIN MIDSTREAM PARTNERS L.P. – terminalling & Storage
Specialty Terminals
Dunphy Sulfuric Acid Terminal, Elko, Nevada

26
• Molten sulfur, a refinery by-product is aggregated, stored and prilled through MMLP’s integrated value chain
systems along the U.S. Gulf Coast and Northern California region.
• MMLP manufactures and markets sulfur-based fertilizers and related sulfur products (sulfuric acid) to wholesale
fertilizer distributors and industrial users.
• MMLP has the necessary assets and expertise to handle the unique requirements for transportation and storage of
molten sulfur.
• By managing sulfur offtake, MMLP assists refineries in balancing production runs.
Sulfur Services
Segment
2017
Adj.
EBITDA
2018E
Adj.
EBITDA
Fertilizer $19.6 $21.4
Molten Sulfur $6.9 $6.1
Sulfur Prilling $7.5 $7.0
Total Sulfur
Services
$34.0 $34.5
$ millions
MARTIN MIDSTREAM PARTNERS L.P.
Sulfur Services Overview

27
• Provides transportation, processing and marketing services necessary to move product from producer to consumer
• Intermodal transportation offers multiple fee opportunities for MMLP
MARTIN MIDSTREAM PARTNERS L.P. – sulfur services
Integrated Sulfur Value Chain

28
• MMLP manufactures and markets sulfur-based
fertilizers and related sulfur products for
agricultural and industrial use from manufacturing
plants in Texas and Illinois.
• Typical customers include large distributors that
own or control local retail and wholesale
distribution outlets.
Fertilizer Overview
• The single largest factor influencing fertilizer demand
in the U.S. is corn acres planted.
• Global population growth is expected to further
increase demand for corn from the U.S. (food/fuel-
ethanol).
• 90.2 million corn acres were planted in 2017; current
USDA estimate for 2018 is 91.0 million acres
Supply/Demand
MARTIN MIDSTREAM PARTNERS L.P. – sulfur services
Fertilizer
$16.2
$19.5
$21.7
$19.6
$21.4
2014 2015 2016 2017 2018E
Fertilizer Adjusted EBITDA

29
• Sulfur production is driven by refinery utilization
and demand for refined products.
• Refiners require security of by-product offtake
Supply Demand
• Demand for sulfur is primarily driven by fertilizer
and sulfuric acid demand both of which are
correlated with global industrial and agricultural
economic drivers.
Handling and Transportation Agreement
• MMLP transports molten sulfur from U.S. Gulf Coast refineries to the Tampa market for fertilizer production.
MARTIN MIDSTREAM PARTNERS L.P. – sulfur services
Molten Sulfur
$8.7
$9.8
$6.7 $6.9 $6.1
2014 2015 2016 2017 2018E
Molten Sulfur Adjusted EBITDA

30
Terminal Location Production
Capacity
Products Stored
Neches Beaumont,
Texas
5,500 metric
tons/day
Molten, prilled &
granulated sulfur
Stockton Stockton,
California
1,000 metric
tons/day
Molten & prilled
sulfur
• Refiners pay MMLP minimum reservation fees, plus
additional operating fees for prilling services
• Contracts consist of 3 to 5 year service agreements
with evergreen provisions – long-term customer
relationships
Prilling Agreements
• Security of sulfur/by-product offtake is critical to
operational stability of all refiners
• Prilled sulfur enables large scale transportation
for exportation on dry bulk vessels
• At Beaumont, Texas the export option provides
pricing leverage for Gulf Coast refiners selling
sulfur into the domestic market.
• At Stockton, California export is the primary
option for disposal of residual sulfur production
from Northern California refineries.
Supply/Demand
MARTIN MIDSTREAM PARTNERS L.P. – sulfur services
Prilled Sulfur
$8.9
$6.7 $6.7
$7.5
$7.0
2014 2015 2016 2017 2018E
Sulfur Prilling Adjusted EBITDA

31
• MMLP utilizes inland and offshore tows to provide marine transportation of petroleum products and by-products.
• MMLP’s marine transportation business operates coastwise along the Gulf of Mexico, East Coast and on the U.S.
inland waterway system, primarily between domestic ports along the Gulf of Mexico, Intracoastal Waterway, the
Mississippi River system and the Tennessee-Tombigbee Waterway system.
Marine
Transportation
Segment
2017
Adj. EBITDA
2018E
Adj. EBITDA
Inland $9.2 $9.4
Offshore $2.9 $3.5
Marine SG&A $(4.6) $(4.4)
Total Marine $7.5 $8.5
$ millions
MARTIN MIDSTREAM PARTNERS L.P.
Marine Transportation Overview

32
• 33 inland marine tank barges
• 18 inland push-boats
• 1 offshore tug and barge unit
• Ability to handle specialty products (asphalt, fuel
oil, gasoline, sulfur and other bulk liquids), which
complements MMLP’s Specialty Terminals
• Marine Transportation contracts with other MMLP
segments, MRMC, major and independent oil gas
refiners and select international and domestic
trading companies.
• Fee-based day-rate contracts
Marine Transportation
MARTIN MIDSTREAM PARTNERS L.P. – marine transportation
Assets

33
Current Environment
• Weak day-rates continue even as utilization has improved
• Contract tenor trending toward short term and spot market
• Asset rationalization continues with $5.4 million in assets currently held for sale
• Fleet reduction of 13 units (4 boats/9 barges) in last 24 months has significantly reduced operating expenses
MARTIN MIDSTREAM PARTNERS L.P. – marine transportation
Inland & Offshore
$3.3
$7.3
$3.0 $2.9
$3.5
2014 2015 2016 2017 2018E
Offshore Marine Adjusted EBITDA
$21.6
$16.3
$9.6 $9.2 $9.4
2014 2015 2016 2017 2018E
Inland Marine Adjusted EBITDA

M A R T I N M I D S T R E A M P A R T N E R S L . P .
APPENDIX

35
12/31/2016 12/31/2017
DEBT
Revolving Credit Facility Due March 2020 $443.0 $445.0
Senior Secured Debt $443.0 $445.0
Senior Notes Due February 2021 $373.8 $373.8
Total Debt $816.8 $818.8
EQUITY
Partners’ Capital $312.0 $298.2
Total Capitalization $1,128.8 $1,117.0
Market Capitalization $650.6 $538.2
Enterprise Value $1,467.4 $1,357.0
CREDIT METRICS
Revolver Capacity $664.4 $664.4
Availability $221.4 $219.4
Adjusted EBITDA per lender compliance (1) $166.4(2) $160.3
Senior Debt/Adjusted EBITDA 2.66x 2.78x
Total Debt/Adjusted EBITDA 4.91x 5.11x
Debt/Cap 72.4% 73.3%
(1) Adjusted EBITDA per lender compliance certificates
(2) Per lender compliance adjusted for divestiture of Corpus Christi terminal assets
MARTIN MIDSTREAM PARTNERS L.P.
Capitalization
$ millions
36
MARTIN MIDSTREAM PARTNERS L.P.
Fee-based Cash Flow Reconciliation for 2018 (slide 9)
1Q18E 2Q18E 3Q18E 4Q18E 2018E
Terminalling & Storage
Shore Based Terminals 2.1$ 2.1$ 2.1$ 2.1$ 8.4$ Fixed Fee
Shore Based Lubricants 1.0$ 1.0$ 1.0$ 1.0$ 4.0$ Margin
Martin Lubricants 2.9$ 3.2$ 3.0$ 2.4$ 11.5$ Margin
Smackover Refinery 4.8$ 5.1$ 5.0$ 5.0$ 19.9$ Fixed Fee
Specialty Terminals 3.5$ 3.7$ 3.8$ 4.0$ 15.0$ Fixed Fee
Total T&S 14.3$ 15.1$ 14.9$ 14.5$ 58.8$
Natural Gas Services
Cardinal 9.7$ 8.6$ 6.4$ 6.3$ 31.0$ Fixed Fee
Butane 9.1$ 1.3$ 1.5$ 14.2$ 26.1$ Margin
WTLPG 1.5$ 1.6$ 2.5$ 2.9$ 8.5$ Fixed Fee
NGLs 0.4$ 0.4$ 0.4$ 0.3$ 1.5$ Margin
Propane 1.2$ 0.2$ 0.2$ 1.0$ 2.6$ Margin
Total NGS 21.9$ 12.1$ 11.0$ 24.7$ 69.7$
Marine Transportation
Inland 1.8$ 2.5$ 2.5$ 2.6$ 9.4$
Offshore 0.8$ 0.9$ 0.9$ 0.9$ 3.5$
Marine USG&A (1.1)$ (1.1)$ (1.1)$ (1.1)$ (4.4)$
Total Marine 1.5$ 2.3$ 2.3$ 2.4$ 8.5$ Fixed Fee
Sulfur Services
Fertilizer 6.8$ 6.1$ 4.9$ 3.6$ 21.4$ Margin
Molten Sulfur 1.6$ 1.5$ 1.5$ 1.5$ 6.1$ Fixed Fee
Sulfur Prilling 1.6$ 1.8$ 1.8$ 1.8$ 7.0$ Fixed Fee
Total Sulfur Services 10.0$ 9.4$ 8.2$ 6.9$ 34.5$
Adjusted EBITDA from Operations 47.7$ 38.9$ 36.4$ 48.5$ 171.5$
Unallocated SG&A (3.8) (3.8) (3.9) (3.9) (15.4)$
Total Adjusted EBITDA 43.9$ 35.1$ 32.5$ 44.6$ 156.1$
$ millions
37
0.97 1.00 0.96
1.18
1.00
2014 2015 2016 2017 2018E
Distribution Coverage Ratio
x x x
x x
MARTIN MIDSTREAM PARTNERS L.P.
2018E Total Capital Expenditures Reconciliation (slide 7)
(1) For 2018, One Time M-CapEx Items include an environmental project at the Smackover Refinery (*MBBR - $6.4MM) and five-year regulatory dry docking for Marine Transportation assets
(Drydocking - $4.1MM)
(2) Excludes purchase of remaining interests in Redbird of $391MM in 2014 and the $20MM initial investment in the Hondo Asphalt Terminal in 2017.
*Moving bed biofilm reactor
$ millions
(1)
$74.7
$53.9
$19.1 $24.0
$50.3
$14.6
$12.9
$17.2 $18.1
$29.3
$10.5
$93.3
$68.7
$38.3 $43.6
$90.1
2014 2015 2016 2017 2018E
Total Capital Expenditures
Expansion CapEx Plant Turnaround Costs
Maintenance CapEx One Time M-CapEx Items
(2) (2)

38
MARTIN MIDSTREAM PARTNERS L.P.
West Texas LPG Pipeline Rate Update (slide 17)
• Certain shippers filed complaints with the Texas RRC (Railroad Commission of Texas) challenging the increased rates
WTLPG (West Texas LPG Pipeline) implemented effective July 1, 2015.
• On March 8, 2016, contrary to the recommendation of the administrative law judge, the RRC issued an order
directing that WTLPG charge the rates that were in effect prior to July 1, 2015.
• A hearing on the merits of the complaints was held before a hearings examiner during the week of March 27, 2017.
• The hearings examiner subsequently issued a Proposal for Decision on September 29, 2017. This Proposal for
Decision was favorable to WTLPG and found that a competitive market exists both geographically and functionally.
• On December 5, 2017, this matter was delayed until the next RRC meeting on January 23, 2018 as one of the
commissioners requested more time to read the case.
• At the January meeting, Commissioner Ryan Sitton strongly agreed with the findings of the hearings examiner that
a competitive market exists and acknowledged that the case should be dismissed. Despite such findings, the other
two commissioners requested a new (further) market study to be developed for the limited purpose of considering
additional relevant evidence regarding competition—nearly 22 months after the RRC’s initial ruling.
• On January 31, 2018, WTLPG filed a Motion for Reconsideration asking that the Commission revert back to the
previous findings of the hearings examiner, or at a minimum, the Commission consider interim rate relief.
• Our Motion for Reconsideration is on the agenda for February 27, 2018.
39
Borrower Martin Operating Partnership L.P. (the “Borrower”)
Guarantors
Martin Midstream Partners L.P. and all present and future
subsidiaries of the Borrower
Facility
$664 million Senior Secured Revolving Credit Facility
L/C Sublimit: $50 million
Accordion: $336 million
Maturity March 28, 2020 (~2.1 years remaining)
Financial
Covenants
Pricing Grid
Leverage Ratio
LIBO R
Margin
Base Rate
Margin
Commitment
Fee
< 3.00x 200 bps 100 bps 30 bps
≥ 3.00x; < 3.50x 225 bps 125 bps 37.5 bps
≥ 3.50x; < 4.00x 250 bps 150 bps 37.5 bps
≥ 4.00x; < 4.50x 275 bps 175 bps 50 bps
≥ 4.50x 300 bps 200 bps 50 bps
Note: Shading indicates current pricing level
Added an Inventory Sublimit not to exceed $75 million with
seasonal step-down to $10 million for the months of March
through June of each fiscal year
Subject to a monthly borrowing base not to exceed 90% of
the value of forward sold / hedged inventory
Borrowings under the Inventory Sublimit are excluded from
the total leverage and secured leverage ratio calculations
Same as existing
Same as existing
Same as existing
Same as existing
Maximum Leverage Ratio: 5.25x with step-up to 5.50x
for the two fiscal quarters following the quarter in which
an acquisition (≥ $50 million) is consummated
Maximum Senior Leverage Ratio: 3.50x
Minimum Interest Coverage Ratio: 2.50x
Maximum Leverage Ratio: 5.75x for 1Q18 and 2Q18,
5.50x for 3Q18, 4Q18, and 1Q19 and 5.25x thereafter
Maximum Senior Leverage Ratio: 3.25x
Minimum Interest Coverage Ratio: 2.50x
Existing as Amended
MARTIN MIDSTREAM PARTNERS L.P.
Existing & Proposed Terms (slide 11)

40
Natural Gas
Services
Terminalling
& Storage
Sulfur
Services
Marine
Transportation
SG&A
Interest
Expense
2017
Actual
Net income (loss) $53.5 $3.3 $25.9 $(1.2) $(16.6) $(47.8) $17.1
Interest expense add back -- -- -- -- -- $47.8 $47.8
Depreciation and amortization $24.9 $45.2 $8.1 $7.0 -- -- $85.2
(Gain) loss on sale of property, plant and
equipment
$0.1 $(0.8) -- $0.1 -- -- $(0.6)
Impairment of long lived assets -- $0.6 -- $1.6 -- -- $2.2
Non-cash hurricane contingency accrual -- $0.7 -- -- -- -- $0.7
Asset retirement obligation accrual -- $5.5 -- -- -- -- $5.5
Unrealized mark-to-market on commodity
derivatives
$(3.8) -- -- -- -- -- $(3.8)
Distributions from unconsolidated entities $5.4 -- -- -- -- -- $5.4
Equity in earnings of unconsolidated entities $(4.3) -- -- -- -- -- $(4.3)
Unit-based compensation -- -- -- -- $0.7 -- $0.7
Income tax expense -- -- -- -- $0.3 -- $0.3
Adjusted EBITDA $75.8 $54.5 $34.0 $7.5 $(15.6) $0.0 $156.2
MARTIN MIDSTREAM PARTNERS L.P.
2017 Adjusted EBITDA and GAAP Reconciliation
$ millions

41
Natural Gas
Services
Terminalling
& Storage
Sulfur
Services
Marine
Transportation
SG&A
Interest
Expense
2016
Actual
Net income (loss) $43.1 $44.1 $26.8 $(19.8) $(16.4) $(46.1) $31.7
Interest expense add back -- -- -- -- -- $46.1 $46.1
Depreciation and amortization $28.1 $45.5 $8.0 $10.5 -- -- $92.1
(Gain) loss on sale of property, plant and
equipment
$0.1 $(35.4) $0.3 $1.6 -- -- $(33.4)
Impairment of goodwill -- -- -- $4.1 -- -- $4.1
Impairment of long lived assets -- $15.3 -- $11.7 -- -- $27.0
Unrealized mark-to-market on commodity
derivatives
$4.6 -- -- -- -- -- $4.6
Distributions from unconsolidated entities $7.5 -- -- -- -- -- $7.5
Equity in earnings of unconsolidated entities $(4.7) -- -- -- -- -- $(4.7)
Unit-based compensation -- -- -- -- $0.9 -- $0.9
Income tax expense -- -- -- -- $0.7 -- $0.7
Adjusted EBITDA $78.7 $69.5 $35.1 $8.1 $(14.8) $0.0 $176.6
MARTIN MIDSTREAM PARTNERS L.P.
2016 Adjusted EBITDA and GAAP Reconciliation
$ millions

42
Natural Gas
Services
Terminalling
& Storage
Sulfur
Services
Marine
Transportation
SG&A
Interest
Expense
2015
Actual
Income (loss) from continuing operations $47.6 $18.8 $27.1 $4.6 $(17.6) $(43.3) $37.2
Interest expense add back -- -- -- -- -- $43.3 $43.3
Depreciation and amortization $34.1 $38.7 $8.5 $11.0 -- -- $92.3
Loss on sale of property, plant and equipment $0.3 $0.5 $0.4 $1.0 -- -- $2.2
Impairment of long lived assets -- $9.3 -- $1.3 -- -- $10.6
Unrealized mark-to-market on commodity
derivatives
$(0.7) -- -- -- -- -- $(0.7)
Distributions from unconsolidated entities $11.2 -- -- -- -- -- $11.2
Equity in earnings of unconsolidated entities $(9.0) -- -- -- -- -- $(9.0)
Gain on retirement of senior unsecured notes -- -- -- -- $(1.2) -- $(1.2)
Unit-based compensation -- -- -- -- $1.4 -- $1.4
Income tax expense -- -- -- -- $1.0 -- $1.0
Adjusted EBITDA $83.5 $67.3 $36.0 $17.9 $(16.4) $0.0 $188.3
MARTIN MIDSTREAM PARTNERS L.P.
2015 Adjusted EBITDA and GAAP Reconciliation
$ millions

43
Natural Gas
Services
Terminalling
& Storage
Sulfur
Services
Marine
Transportation
SG&A
Interest
Expense
2014
Actual
Income (loss) from continuing operations $36.1 $27.0 $25.7 $3.2 $(56.2) $(42.2) $(6.4)
Interest expense add back -- -- -- -- -- $42.2 $42.2
Depreciation and amortization $13.1 $37.6 $8.2 $9.9 -- -- $68.8
Loss on sale of property, plant and equipment -- $0.1 -- $1.4 -- -- $1.5
Impairment of long lived assets -- -- -- $3.5 -- -- $3.5
Unrealized mark-to-market on commodity
derivatives
$0.8 -- -- -- -- -- $0.8
Distributions from unconsolidated entities $4.3 -- -- -- -- -- $4.3
Equity in earnings of unconsolidated entities $(5.5) -- -- -- -- -- $(5.5)
Debt prepayment premium -- -- -- -- $7.8 $7.8
Reduction in fair value of investment in Cardinal
due to the purchase of the controlling interest
-- -- -- -- $30.1 $30.1
Unit-based compensation -- -- -- -- $0.8 -- $0.8
Income tax expense -- -- -- -- $1.1 -- $1.1
Adjusted EBITDA $48.8 $64.7 $33.9 $18.0 $(16.4) $0.0 $149.0
MARTIN MIDSTREAM PARTNERS L.P.
2014 Adjusted EBITDA and GAAP Reconciliation
$ millions

4200 B STONE ROAD
KILGORE, TEXAS 75662
877-256-6644
WWW.MARTINMIDSTREAM.COM
IR@MARTINMLP.COM
